40 Alber t Road, South Melbour ne: Designing for Sustainable Outcomes - A Review of Design...
12
May 2007 • Cas 45 • Page The BEDP Environment Design Guide is published by The Royal Australian Institute of Architects 40 Albert Road, South Melbourne: Designing for Sustainable Outcomes – A Review of Design Strategies, Building Performance and Users’ Perspectives Leena Thomas and Monica Vandenberg 40 Albert Road, a refurbished 80’s building, was the first building in Australia to achieve a 6-Star Green Star rating and 5 Star NABERS water rating. Since re-opening in 2006 numerous awards have been won. Fifteen months after the refurbishment, Leena omas and Monica Vandenberg provide an in-depth review of the design process, building design, environmental performance and building occupants’ experience. .0 Project Outline .. Project Details Owner 40 Albert Road Commercial Pty Ltd Consultants Architect SJB Architects Interior Design SJB Interiors Builder Construction Engineering Project Manager Lascorp Development Group Services Engineer Connell Mott MacDonald ESD Consultant Energy Conservation Systems (ECS) Structural Engineer Connell Mott MacDonald Acoustic Engineer Heggies Australia Quantity Surveyor Rider Hunt Cost at Completion A$ 4.5 million for modifications to base building A$ 1.62 million for integrated fitout. Year of Completion 2005 Building Type 5 levels of offices over a basement car park Building Area 1215m² Design Ratings: Green Star Office Design: 6 Star ABGR Commitment Agreement: 5 Star Post Occupancy Ratings: NABERS Office Water: 5 Star Awards Inside – Australian Design Review, Idea06 Awards (2006) Australia Property Institute (API) Awards (2006) Victorian Division Banksia Environmental Award Category 1 – Built Environment award (2006) e Royal Australian Institute of Architects, Victorian Architecture Awards 2006, for Best Sustainable Architecture United Nations Association of Australia, World Environment Day Awards 2006, Green Building Award City of Port Phillip Design & Development Awards, 2005, Best Contribution to Sustainable Development – Large Scale. Figure . Albert Street Facade The solid side walls require natural light to enter from front and rear facades.
-
Upload
independent -
Category
Documents
-
view
1 -
download
0
Transcript of 40 Alber t Road, South Melbour ne: Designing for Sustainable Outcomes - A Review of Design...
B E D P E n v i r o n m E n t D E s i g n g u i D E May 2007 • Cas 45 • Page �
The BEDP Environment Design Guide is published by The Royal Australian Institute of Architects
40 Alber t Road, South Melbourne:
Designing for Sustainable Outcomes –A Review of Design Strategies, Building Performance and Users’ PerspectivesLeena Thomas and Monica Vandenberg40 Albert Road, a refurbished 80’s building, was the first building in Australia to achieve a 6-Star Green Star rating and 5 Star NABERS water rating. Since re-opening in 2006 numerous awards have been won. Fifteen months after the refurbishment, Leena Thomas and Monica Vandenberg provide an in-depth review of the design process, building design, environmental performance and building occupants’ experience.
�.0 Project Outline
�.�. Project Details Owner40 Albert Road Commercial Pty Ltd
Consultants
ArchitectSJB Architects
Interior DesignSJB Interiors
BuilderConstruction Engineering
Project ManagerLascorp Development Group
Services EngineerConnell Mott MacDonald
ESD ConsultantEnergy Conservation Systems (ECS)
Structural EngineerConnell Mott MacDonald
Acoustic EngineerHeggies Australia
Quantity SurveyorRider Hunt
Cost at CompletionA$ 4.5 million for modifications to base buildingA$ 1.62 million for integrated fitout.
Year of Completion2005
Building Type5 levels of offices over a basement car park
Building Area1215m²
Design Ratings:Green Star Office Design: 6 StarABGR Commitment Agreement: 5 Star
Post Occupancy Ratings:NABERS Office Water: 5 Star
Awards Inside – Australian Design Review, Idea06 Awards (2006)Australia Property Institute (API) Awards (2006) Victorian DivisionBanksia Environmental Award Category 1 – Built Environment award (2006)The Royal Australian Institute of Architects, Victorian Architecture Awards 2006, for Best Sustainable ArchitectureUnited Nations Association of Australia, World Environment Day Awards 2006, Green Building AwardCity of Port Phillip Design & Development Awards, 2005, Best Contribution to Sustainable Development – Large Scale.
Figure �. Albert Street Facade the solid side walls require natural light to enter from front and rear facades.
Page 2 • Cas 45 • May 2007 B E D P E n v i r o n m E n t D E s i g n g u i D E
�.2 Project Brief and Design Process The development of many green buildings in Australia often begins with a ‘clean slate’, if not with the ‘luxury’ of a green field site. However 40 Albert Road presents an interesting example of an integrated sustainable design of an existing building. The building, procured by Szencorp Pty Ltd, was to be redeveloped with the express intent “to be the leading/greenest building within a conventional office concept”. The client group’s own business interest in sustainable development meant that the building was to provide flagship office accommodation for their subsidiaries, and serve to test and showcase new ideas that have the potential to be marketed commercially. The design team, assembled together by the client, was selected based on past working relationships, trust and experience. Team members stressed the importance of the collaborative approach that was established, as well as the value of client commitment and consistent leadership. This commitment was considered necessary not only to ensure that sustainability was a key driver of the design brief, but also in ensuring the green agenda was supported and followed through the processes of design development, value engineering, decision making and implementation. Through a process of consultation between the client and design team, key environmental objectives were articulated in the brief. (SJB 2006) were to:• Minimise indoor climate problems, energy
consumption and environmental impact.• Maximise sustainability.• Produce imaginative and optimised daylight use,
making the most of external views.• Control noise and pollution while protecting
from wind and weather.• Produce an economically viable and structurally
suitable envelope with a comfortable internal acoustic.
• Create desirable internal and external aesthetics, complying with building regulations and fire protection, smoke exhaust and other statutory requirements.
• Optimise whole-life costs.
�.3 Goals and TargetsFrom the outset the ultimate goals for 40 Albert Road were independence from mains water and grid energy, and zero greenhouse emissions. There was also a strong commitment to monitoring the building’s ongoing environmental performance to ensure transparency of building outcomes, as well as the ability to capture key learnings from the experience and feed these forward into other projects.The initial brief for the design team focused on performance measures and carbon neutrality. This included a design target for a 6 Star Green Star¹ Office Design Rating and a commitment to post occupancy assessment rating using NABERS Office², which included a Commitment Agreement for a 5 Star ABGR³ energy rating. In addition, the design set out with the immediate objective of generating one-third of the building’s energy needs on-site and achieving an 82% reduction in water use over the industry average.
�.4 Location and Climate The building at 40 Albert Road is located in an infill site in South Melbourne, surrounded by medium to large scale office buildings.Melbourne is known for having a temperate climate that is frequently pushed to extremes. The mean maximum temperature in winter (June-August) is 14.5°C. While the mean maximum temperature in summer is 25.5°C, the city experiences temperatures in excess of 32-35°C for at least 10% of summer days (December, January and February) and a diurnal temperature range of 10-11 degrees. A state-wide drought over a number of years has meant that water use and re-use has become a significant issue. The dense configuration of surrounding buildings and the limited facade exposure mean that prevailing winds have limited impact on the building.
2.0 Building Design
2.� Existing Building FabricThe existing building was typical of much of the mediocre medium rise office accommodation of the 70’s and 80’s in the area. The building presented a number of challenges;
¹ Green Star developed by the Green Building Council of Australia uses information from the building design and process to rate the environmental potential (design intent) of buildings. Assessment Credits are provided under the categories: Management, Indoor Environmental Quality, Energy, Transport, Water, Materials, Land Use and Ecology, Pollution, and Innovation. Performance at 6 Star (75+ pts) denotes World Leader performance while 5 Star (60–74 pts) and 4 Star (45–59 pts) and denotes Australian Excellence and Best Practice respectively.
² National Australian Building Environmental Rating Scheme or NABERS Office is a post occupancy environmental rating system for office premises that currently encompasses Energy and Water ratings.
³ Australian Building Greenhouse Rating (ABGR) scheme is the energy component of NABERS OFFICE. ABGR has separate protocols for Commitment Agreement (by simulation) at design stage as well as Performance Rating (energy monitoring) for post occupancy assessment. It is also cross referenced for ‘Energy’ aspects within the Green Star rating tools above. A 5 star ABGR rating (equal to or less than 170 kg CO2/m
2/annum for Melbourne) represents the current top building energy rating for greenhouse gas emissions in Australia.
B E D P E n v i r o n m E n t D E s i g n g u i D E May 2007 • Cas 45 • Page 3
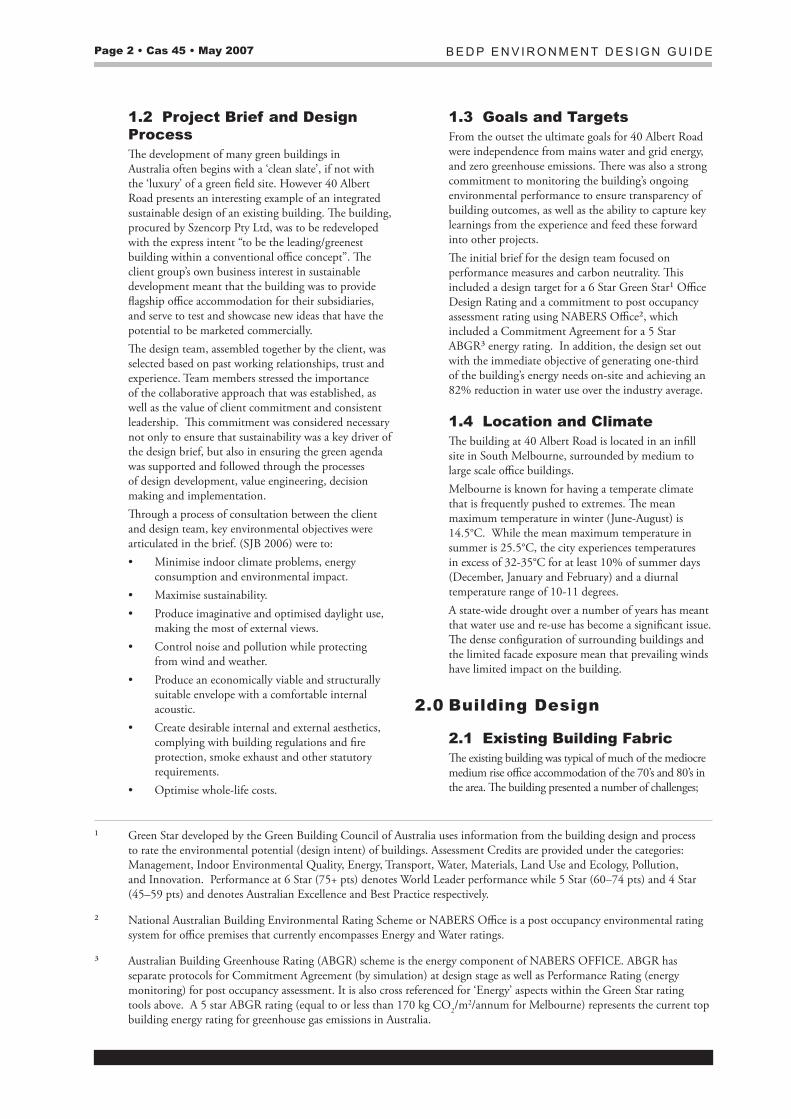
with a narrow 10m wide floor plate, windowless party walls on its long facades (north and south), service core comprising male and female toilets, two isolated escape stairs and a lift on its northern boundary. Coupled with limited opportunity for daylight and views, the east and west facades offered the additional challenge of solar control. Uninsulated external walls and roof, and single glazing throughout the building were sources of unwanted heat loss and gain. Suspended 2.7m high ceilings locked away the thermal mass potential of the concrete floors slabs. The structural bracing was provided by the rigid connections of the reinforced concrete structure between the floor plates and the long, north and south precast walls. This allowed for architectural interventions to the service core and lifts without undue stress on structural integrity. Pre-design assessments of the building estimated a 1 Star performance under Green Star, and 2.5 Star performance under ABGR. 40 Albert Road was considered by the design team as a building that ‘had little worth retaining in terms of aesthetics and performance.’
2.2 Design Approach and Key Architectural Interventions Rather than developing a visibly ‘green’ aesthetic with iconic features, the final design for 40 Albert Road strives for the seamless integration of a number of sustainable strategies. To this end, various initiatives were rigorously assessed in terms of their relative ESD benefits, (including the impact on both Green Star and ABGR ratings), functionality and costs. Early in the process a number of explorative concepts were investigated, but abandoned due to prohibitive cost. This included a modular ESD pod located at
the west end of the site that could house services and the circulation core, and provide a skeletal framework for plug-in technologies. Other strategies such as the introduction of displacement ventilation to the office floors, and the use of a double skinned eastern facade with integrated shading, were superseded for their relatively small benefit over alternatives in terms of energy (ABGR) ratings. Key design interventions that emerged from a collaborative decision making process consisted of: • Removing the east stairwell (made possible under
new Building Code of Australia guidelines) which increased usable floor space close to the eastern facade.
• Creating a light well within the remaining stairwell, by introducing a skylight, open-riser stairs, and internal glazing into adjoining office areas on each floor.
• Increasing transparency to the eastern facade by replacing the existing concrete facade with full height glazing.
• Incorporating high performance Low-E4 double glazing throughout, to maximise light transmission and minimise solar heat gain.
• Installing a perforated mesh screen to shade the eastern facade and create a contemporary, distinctive appearance.
• Removing suspended ceilings where possible, to expose the existing concrete slab with permanent steel formwork to underside.
• Creating external amenity spaces for staff both at roof level on the eastern end, and over the enclosed car park at Level 2.
Plant
Office
Office
Office
Office
Car park Foyer Alb
ert R
oad
Lane
way
Car park
Roof terrace
Terrace
Terrace
Figure 2. Longitudinal Cross Section
4 Pilkington Eclipse Advantage Evergreen Reflective Low-E Outer Lite 6mm, 12mm air gap, Clear Float Glass Inner Lite 6mm – Visible transmittance 0.44, Shading Coefficient 0.34, and U Value 1.9 W/m².K
Page 4 • Cas 45 • May 2007 B E D P E n v i r o n m E n t D E s i g n g u i D E
2.3 Interior ConceptThe building is designed to accommodate 54 staff. The alignment of interior fit-out with overarching ESD principles is essential to ensure full realisation of the building’s environmental goals. To ensure maximum access to natural light and views, two circulation spines were introduced through the length of the floors to connect the open plan offices at either end of the building, and cellular offices that needed acoustic isolation and privacy were placed in between these corridors in the middle of the plan. The light well provides a sense of openness and natural light, particularly to the upper levels of the building. A brightly coloured art work to the light well wall
introduces a welcome splash of colour in what is otherwise a rather subdued office interior.
2.4 Materials The reuse of existing structure and provision of flexible shell and core delivers a reduced impact on land use and ecology. In addition, the building includes a fully integrated fit-out with materials and finishes carefully chosen to minimise environmental impact and improve indoor air quality. The insulation, carpets, adhesives, sealants and paints used have low-VOC (volatile organic compound) content, and low-VOC emission. E-zero MDF boards were used for joinery, wall-panelling and carcass
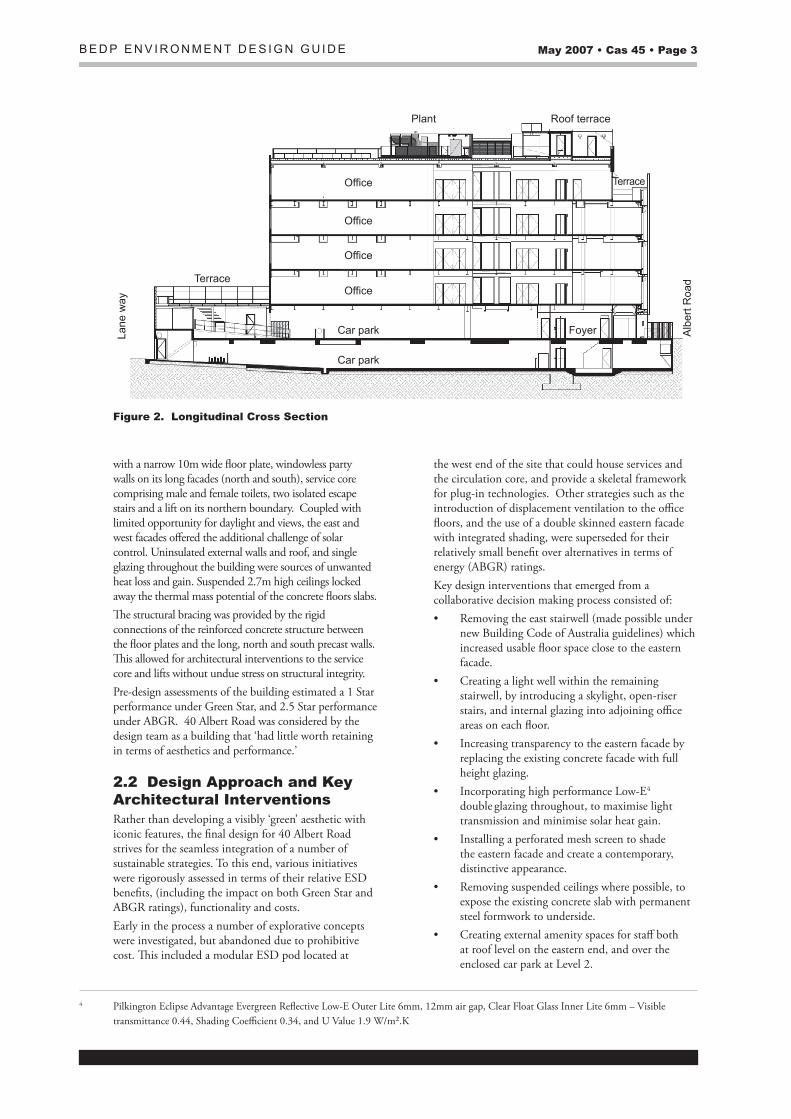
Figure 3. Staff facilities shown for Level 3 Plasterboard bulkheads band A/C ducts and structure together, exposing the thermal mass of the slab above.
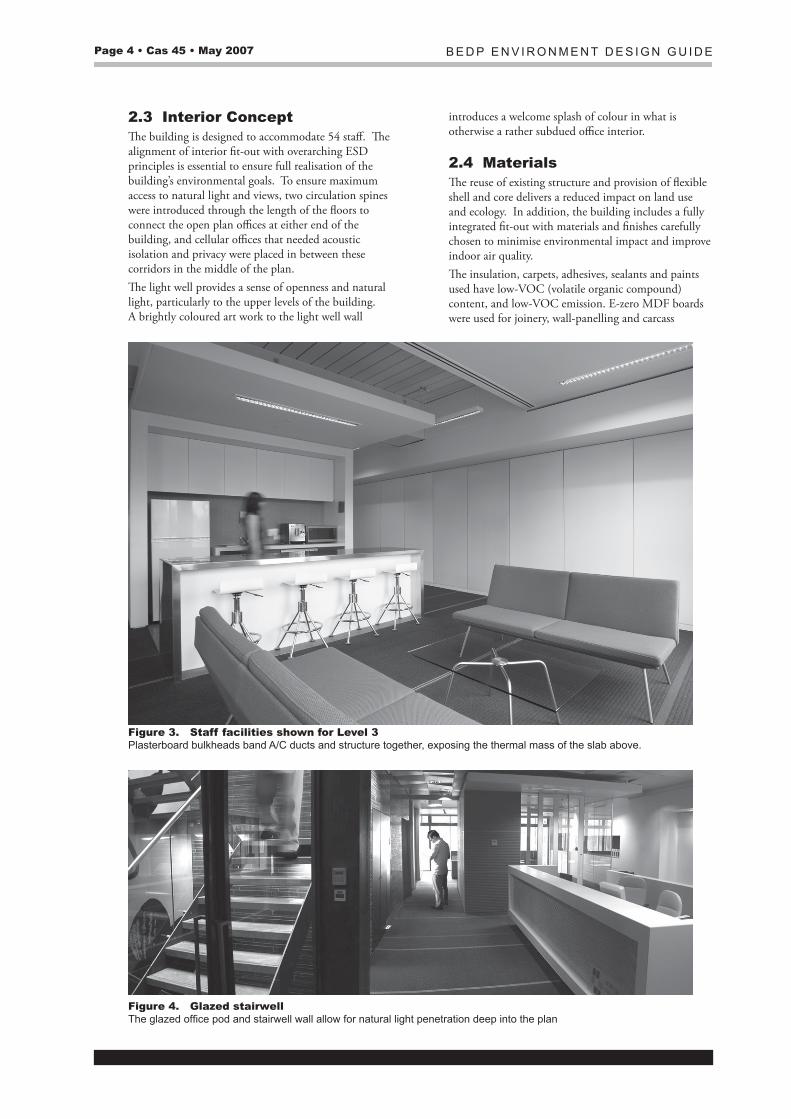
Figure 4. Glazed stairwell The glazed office pod and stairwell wall allow for natural light penetration deep into the plan
B E D P E n v i r o n m E n t D E s i g n g u i D E May 2007 • Cas 45 • Page 5
construction. Walls and ceilings were insulated with low embodied energy wool batts and/or minimum 65% recycled content polyester batts. Forest Stewardship Council certified timber was used for external timber deck areas and some internal flooring to the reception area, and selected tables were made from reclaimed timbers. Timber veneers, where used, are reconstituted, man-made veneers. Pressed wood-pulp panels in the reception and office areas create a distinctive wall feature. The steel grid suspension system in the ceiling uses 25% post-industrial recycled content. The ceiling treatment at the central zone of each floor uses aluminium panels that have a minimum of 90% post-industrial recycled content. Further use of aluminium (known for its high embodied energy) is reduced through the specification of timber framed sliding doors, steel fixing angles and steel sliding door tracks. Furniture upholstery with high recycled fibre content, or non-chromium leather was selected. PVC use is minimised throughout the building. Polyester film, as opposed to vinyl, is used on glass panels (for graphics and privacy), and desk-tops use resin desk-tops. Natural stone tiling is used in public areas, and synthetic rubber flooring used in kitchenettes.
2.5 Environmental Control In addition to the high performance glazing on the east and west facades and the creation of a light well, skylights were introduced to the central zone of the top floor. While the eastern facade is substantially shaded by large trees, incidental solar gain heat load on the western windows has been reported to result in localised problems of overheating and glare. An external shading system for the western facade is currently being investigated. Notwithstanding the interventions to bring daylight into the space, most of the office space relies on the energy efficient lighting system. This comprises predominantly single linear T5 fluorescent fittings with specular, low-brightness louvres, and high-frequency, dimmable, DSI electronic ballasts, designed to minimize glare and power density.
The office spaces at 40 Albert Road are designed to operate within a temperature range of 19-25°C during occupied hours. A finely tuned Building Management System (BMS) controls a mixed mode of operation that combines natural ventilation when ambient conditions permit, and a HVAC system when heating or cooling is required. Natural ventilation is achieved by admitting air in through operable windows located at both facades of the building, and using the stack effect in the open-riser stairwell to draw the air across the office, and exit it through louvres at roof level. The system is also employed at night in summer and mid-season to provide ‘night cooling’. Cold night air (10-12°C cooler than daytime maximum) is used to purge the interior and the concrete in the ceiling, which then serves to stabilize internal temperatures during the day. The HVAC system comprised of a Variable Refrigerant Volume (VRV), 3-pipe gas heat pump system, consisting of two outdoor compressor units, and twenty one indoor fan coil units. The system uses R407C, a zero ozone depletion refrigerant. The outside units are powered by natural gas engines used for the first time in Australia. Fresh air is delivered to the offices via an outside air fan coupled with a dehumidifier unit that filters and dehumidifies the air.Internal Fan Coil Units (FCU) in the open plan office areas are conveniently integrated with the structural beams overhead, and deliver conditioned air to the space via linear diffusers, which minimise localised draughts. An innovative Managed Lighting System (MLS) consisting of motion sensors positioned around the building, detect occupancy. The MLS is used to provide switching and dimming controls to the lighting system, as well as to interface with the BMS, which switches fan coil units off when an area becomes vacant.
2.6 Water ManagementStrategies include water efficient taps with flow restrictors, dual flush toilets, efficient showerheads and dishwashers that are now becoming standard in most
Mains supply(100 kL/annum)
Flushing of toilets(70 kL/annum)
Greywater – showers and women’s basins(12 kL/annum)
Other basins, sinks and dishwashers(65.6 kL/annum)
Fuel cell (1.344 kL/annum)
Rain water(37 kL/annum)
Mains top up of tanks(21 kL/annum)
Tanks
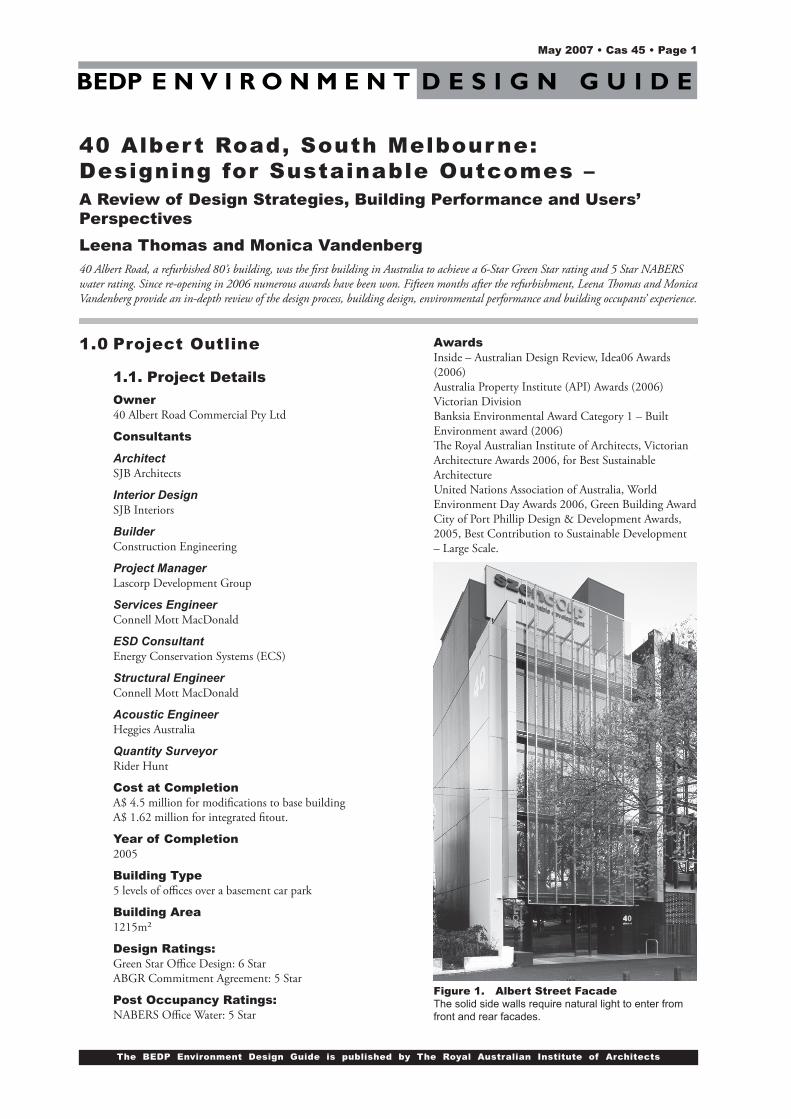
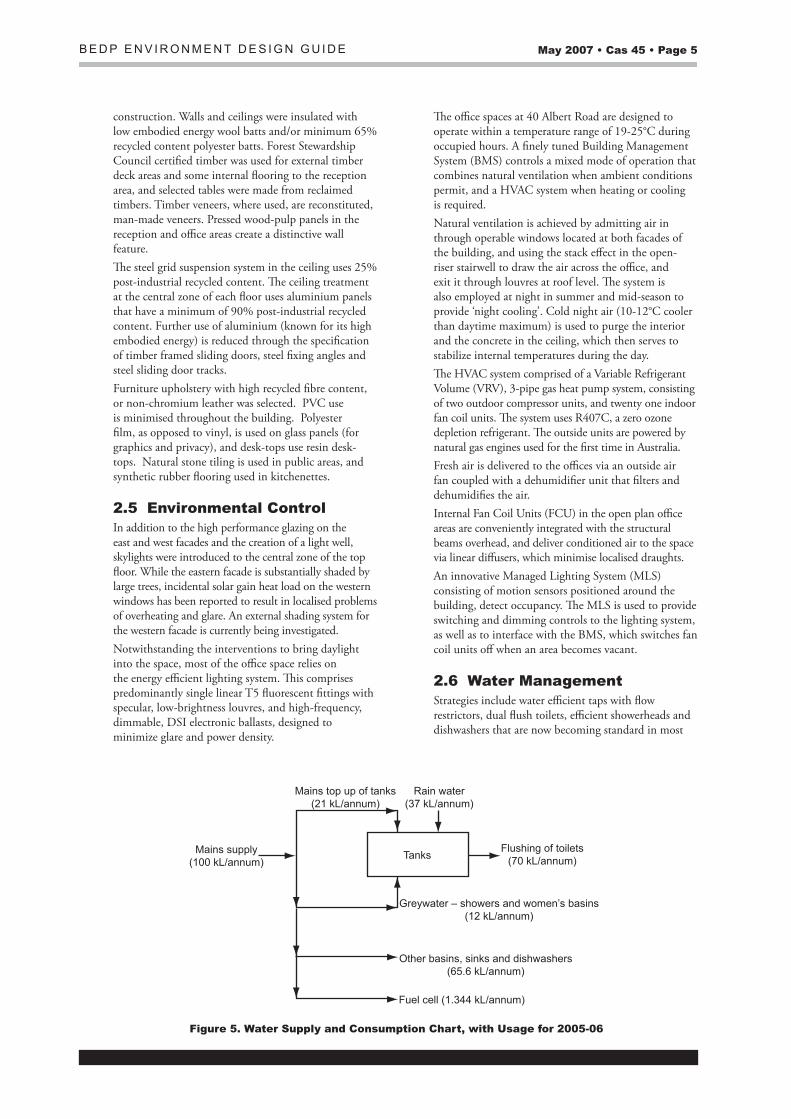
Figure 5. Water Supply and Consumption Chart, with Usage for 2005-06
Page 6 • Cas 45 • May 2007 B E D P E n v i r o n m E n t D E s i g n g u i D E
contemporary workplaces. As well, features such as rain water harvesting, waterless urinals and a proprietary grey water recycling system has been used. The building achieved maximum Green Star credits in this category. The water supply and consumption chart for the building is shown in Figure 5.
2.7 Waste ManagementAs well as the waste minimisation strategies in the selection of materials discussed above, a Waste Management Plan was instituted during construction to ensure maximum recycling of materials removed as part of the demolition process. The design incorporated specific waste separation bins (paper, organic, commingled and landfill) in a central location on each floor, along with a dedicated space in the basement for sorting and storing waste for removal.
2.8 Energy Resourcing Electricity from renewable resources has been purchased for the building through Climate Friendly. Under the terms of the ABGR Commitment Agreement, the building was committed to achieving 5 Star Energy Rating without including green power or carbon offsets purchased. In addition, given the domination of brown-coal fired grid supply that is built to meet peak demand, attempts were made to reduce the dependence on the electricity grid at these times. Three approaches are adopted.
2.8.� Building Design and ManagementThe climate responsive, energy efficiency and environmental control strategies integrated in the building fabric and management system described above form the critical foundation for reducing energy demand.
2.8.2 Integration of Renewable Energy
Solar Hot Water The hot water system is designed to use the combined input of a gas-boosted Apricus solar hot water system and waste heat recovery from a fuel cell when in operation.
Photovoltaics A BP Solar 4.8 kWp Fixed Polycrystalline Solar Photovoltaic Array is located over 45m² of the roof and an RWE Schott Solar 1.152 kWp Fixed Amorphous Solar Photovoltaic Array is integrated as the pergola shading the roof top barbecue area and plant.
2.8.3 Inclusion of Innovative Technologies
Combined Heat and Power Fuel CellFuel cells are noted for their efficiency over coal fired turbines. A pre-commercial Micro Combined Heat and Power (CHP) Solid Oxide Fuel Cell (SOFC) unit designed for demonstration and trial purposes, has been installed on the roof to augment the generation of electrical power and heat. The unit catalytically cracks natural gas rather than burning it, and was intended to provide 1kW of electricity and 1kW of heat towards domestic hot water requirements.
The electrical energy generated by the fuel cell and the two photovoltaic systems is designed to be fed into the main electrical switchboard via grid connect inverters. The electricity generated on-site also has the potential to be exported to the electrical grid during periods of low demand.
Natural Gas Powered Air Conditioning Units Given that air conditioning demand is at its highest when network resources are most constrained and electricity is most expensive, natural gas fired heat pumps have been trialled in this project for the first time in Australia.
2.9 Building ManagementA building facilities manager is responsible for managing the relationships between the building, its systems and its occupants. A computer-based Building Management System (BMS) forms the core of the day-to-day management. Crucial to the success of any such system, is careful planning and programming of the BMS interface controlling the various mechanical and lighting systems, and proactive commissioning, monitoring and fine-tuning of the system during its daily operation. The BMS, linked to a weather station on the roof, is used to control all aspects of the mechanical systems, including operating modes, air control strategies, ventilation, car park exhaust, and to monitor thermal, energy and plant performance. Extensive metering is undertaken to aid monitoring and verification of long-term performance. The integrated sensor and management system (MLS) developed by ECS (one of the client group of companies) for lighting, HVAC and security control is one of the inclusions in the building that serves to maximize energy efficiency by ensuring systems shut down in unoccupied areas. The high level of involvement of the occupants, many of whom were engaged in the design, implementation and/or commissioning phases, has assisted the efficient running of the building. In addition to informal feedback, a post occupancy evaluation was undertaken at the end of the first year of occupancy to benchmark performance and elicit feedback.
2.�0 Transport Energy UseThe building is located close to public transport, and bicycle storage, showers and lockers are provided for the occupants at the ground floor and basement levels in addition to visitor bicycle parking at the entrance.Carbon credits are purchased to offset all transport energy used in the building.
3.0 Post Occupancy EvaluationA key theme from design through to occupancy and beyond has been that the building’s ongoing performance would be transparent and accountable. A detailed analysis of the building’s performance to date was undertaken by Szencorp itself. The report (ECS, 2006) detailed the results of performance measurement in the three key areas of energy, water and transport.
B E D P E n v i r o n m E n t D E s i g n g u i D E May 2007 • Cas 45 • Page 7
Pre refurbishment performance Design goal Achieved
Design rating green star 1 star (estimate) 6 star 6 starEnergy performance rating nABErs Energy (ABgr)
2.5 star (estimate)
5 star
Awaiting certified Rating6
Water consumptionPercentage reduction over industry average not known 82% 90% nABErs Water tool not available at
the time of design5 star
On site energy generation as a percentage of total energy consumption nil 33% 7.5%
Waste Percentage of waste by volume diverted from landfill not known 80% 82% Occupant evaluationBus satisfaction index as a percentile of Australian benchmark dataset
30th percentile no targets set 91st percentile
Bus Comfort index as a percentile of Australian benchmark dataset
84th percentile no targets set 94th percentile
Bus summary index as a percentile of Australian benchmark dataset
71st percentile no targets set 94th percentile
Perceived productivity -3.12% no targets set +10%
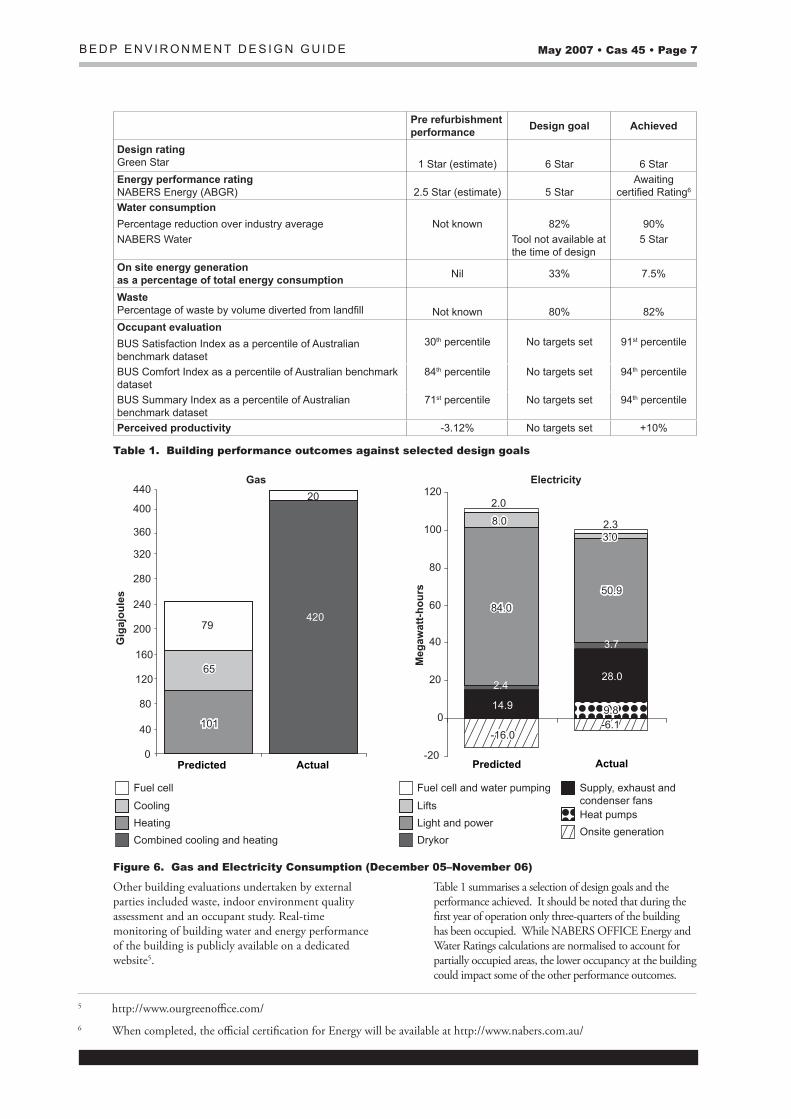
Table �. Building performance outcomes against selected design goals
Predicted Actual0
40
80
120
160
200
240
280
320
360
400
440
Predicted Actual
9.814.9
28.02.4
3.7
84.050.9
8.03.02.3
2.0
-20
0
20
40
60
80
100
12020
Gig
ajou
les
Meg
awat
t-hou
rs
79
65
101
420
Fuel cell
CoolingHeatingCombined cooling and heating
Fuel cell and water pumping
LiftsLight and powerDrykor
Supply, exhaust and condenser fansHeat pumpsOnsite generation
-16.0-6.1
Gas Electricity
Figure 6. Gas and Electricity Consumption (December 05–November 06)
Other building evaluations undertaken by external parties included waste, indoor environment quality assessment and an occupant study. Real-time monitoring of building water and energy performance of the building is publicly available on a dedicated website5.
Table 1 summarises a selection of design goals and the performance achieved. It should be noted that during the first year of operation only three-quarters of the building has been occupied. While NABERS OFFICE Energy and Water Ratings calculations are normalised to account for partially occupied areas, the lower occupancy at the building could impact some of the other performance outcomes.
5 http://www.ourgreenoffice.com/6 When completed, the official certification for Energy will be available at http://www.nabers.com.au/
Page 8 • Cas 45 • May 2007 B E D P E n v i r o n m E n t D E s i g n g u i D E
0
50
100
150
200
250
kg C
O2/
m²/a
nnum
4
4.2
4.4
4.6
4.8
5
5.2
5.4
Star
s
Normalised Emissions (kg CO2/m²/annum)Forecast Normalised Emissions (kg CO2/m²/annum)
ABGR [Stars]Forecast ABGR [Stars]
12-05 01-06 02-06 03-06 04-06 05-06 06-06 07-06 08-06 09-06 10-06 11-06 12-06 01-07 02-07 03-07 04-07 05-07 06-08 07-07 08-07 09-07 10-07 11-07 12-07
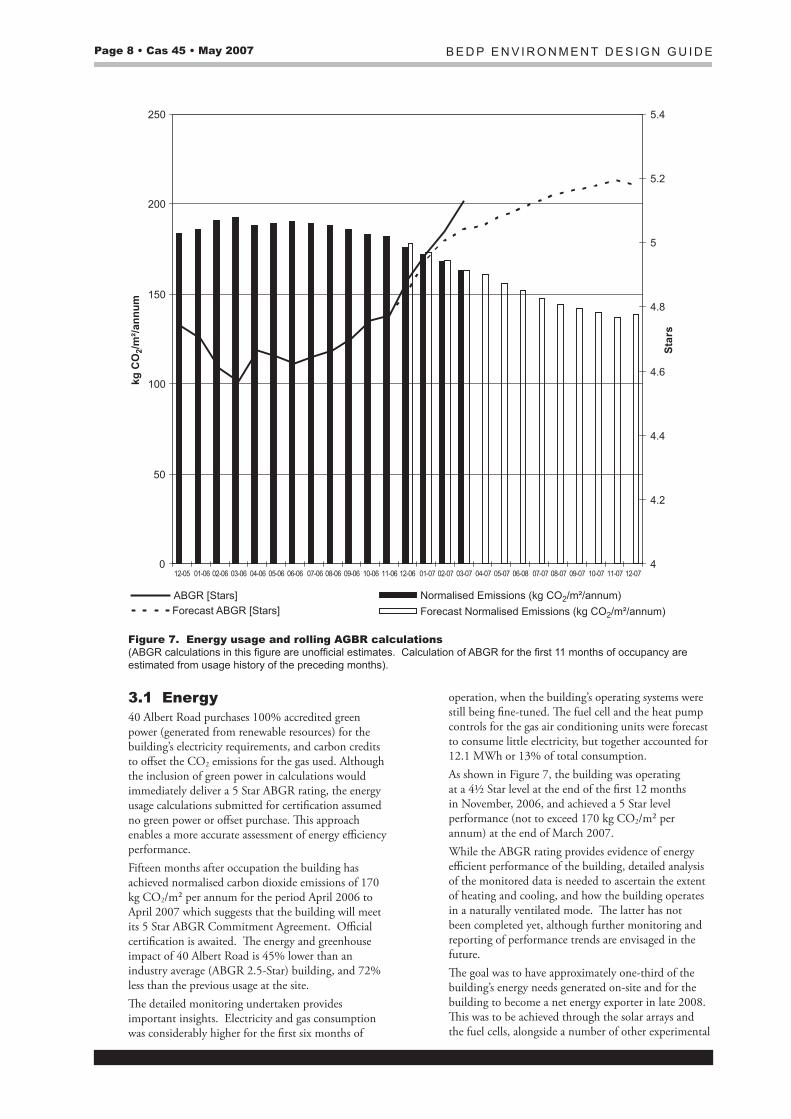
Figure 7. Energy usage and rolling AGBR calculations (ABGR calculations in this figure are unofficial estimates. Calculation of ABGR for the first 11 months of occupancy are estimated from usage history of the preceding months).
3.� Energy 40 Albert Road purchases 100% accredited green power (generated from renewable resources) for the building’s electricity requirements, and carbon credits to offset the CO2 emissions for the gas used. Although the inclusion of green power in calculations would immediately deliver a 5 Star ABGR rating, the energy usage calculations submitted for certification assumed no green power or offset purchase. This approach enables a more accurate assessment of energy efficiency performance. Fifteen months after occupation the building has achieved normalised carbon dioxide emissions of 170 kg CO2/m² per annum for the period April 2006 to April 2007 which suggests that the building will meet its 5 Star ABGR Commitment Agreement. Official certification is awaited. The energy and greenhouse impact of 40 Albert Road is 45% lower than an industry average (ABGR 2.5-Star) building, and 72% less than the previous usage at the site. The detailed monitoring undertaken provides important insights. Electricity and gas consumption was considerably higher for the first six months of
operation, when the building’s operating systems were still being fine-tuned. The fuel cell and the heat pump controls for the gas air conditioning units were forecast to consume little electricity, but together accounted for 12.1 MWh or 13% of total consumption. As shown in Figure 7, the building was operating at a 4½ Star level at the end of the first 12 months in November, 2006, and achieved a 5 Star level performance (not to exceed 170 kg CO2/m² per annum) at the end of March 2007. While the ABGR rating provides evidence of energy efficient performance of the building, detailed analysis of the monitored data is needed to ascertain the extent of heating and cooling, and how the building operates in a naturally ventilated mode. The latter has not been completed yet, although further monitoring and reporting of performance trends are envisaged in the future. The goal was to have approximately one-third of the building’s energy needs generated on-site and for the building to become a net energy exporter in late 2008. This was to be achieved through the solar arrays and the fuel cells, alongside a number of other experimental
B E D P E n v i r o n m E n t D E s i g n g u i D E May 2007 • Cas 45 • Page 9
technologies. These experimental technologies could not be implemented as they were not market ready at the time of construction.The fuel cell is still in its commissioning phase, consuming gas but with limited electrical energy generated (400W net). Although the polycrystalline solar arrays were not performing as well as predicted in the initial stages, they have met the design specification ratings over a 12 month period. Consequently, 40 Albert Road is generating only 6MWh or 7.5% of the 83MWh annual energy consumption needs. The preference for exporting energy to the grid has been constrained by commercial limitations. For example the cost involved in conducting the required stability studies7 is high, and may make a small scale project such as 40 Albert Road commercially unfeasible. Research into alternative energy generation options continues.
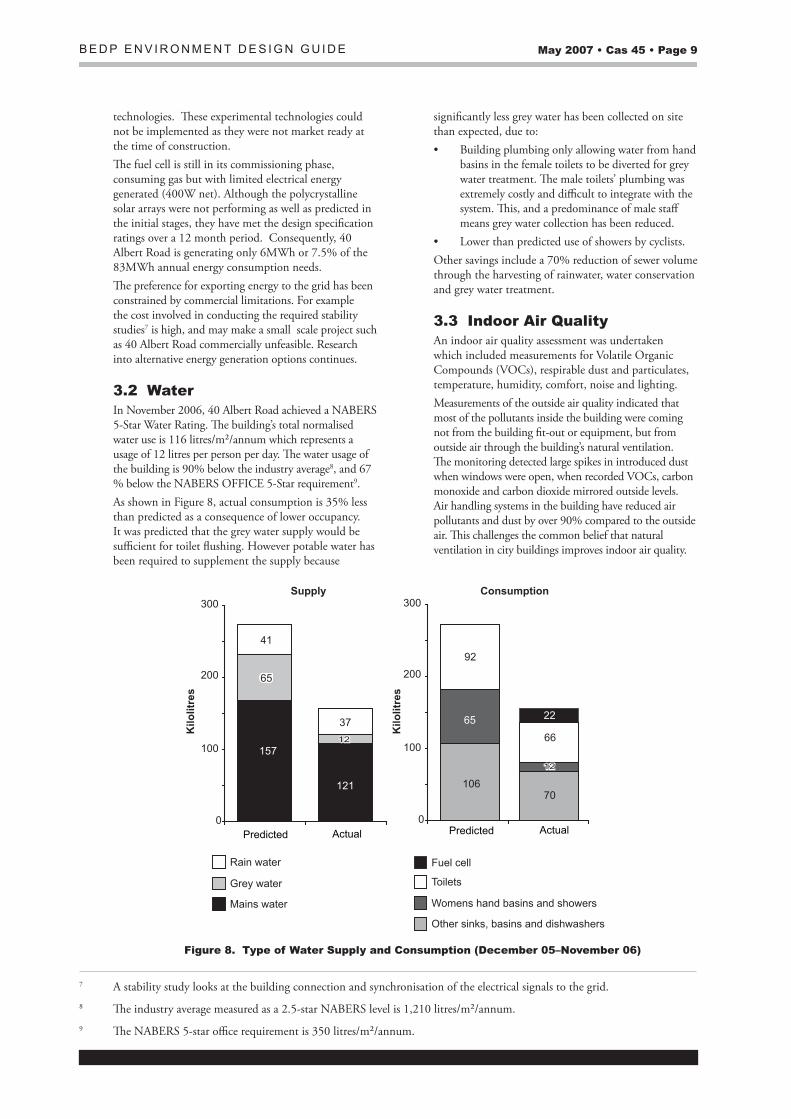
3.2 WaterIn November 2006, 40 Albert Road achieved a NABERS 5-Star Water Rating. The building’s total normalised water use is 116 litres/m²/annum which represents a usage of 12 litres per person per day. The water usage of the building is 90% below the industry average8, and 67 % below the NABERS OFFICE 5-Star requirement9.As shown in Figure 8, actual consumption is 35% less than predicted as a consequence of lower occupancy. It was predicted that the grey water supply would be sufficient for toilet flushing. However potable water has been required to supplement the supply because
significantly less grey water has been collected on site than expected, due to:• Building plumbing only allowing water from hand
basins in the female toilets to be diverted for grey water treatment. The male toilets’ plumbing was extremely costly and difficult to integrate with the system. This, and a predominance of male staff means grey water collection has been reduced.
• Lower than predicted use of showers by cyclists.Other savings include a 70% reduction of sewer volume through the harvesting of rainwater, water conservation and grey water treatment.
3.3 Indoor Air QualityAn indoor air quality assessment was undertaken which included measurements for Volatile Organic Compounds (VOCs), respirable dust and particulates, temperature, humidity, comfort, noise and lighting. Measurements of the outside air quality indicated that most of the pollutants inside the building were coming not from the building fit-out or equipment, but from outside air through the building’s natural ventilation. The monitoring detected large spikes in introduced dust when windows were open, when recorded VOCs, carbon monoxide and carbon dioxide mirrored outside levels. Air handling systems in the building have reduced air pollutants and dust by over 90% compared to the outside air. This challenges the common belief that natural ventilation in city buildings improves indoor air quality.
121
37
0
100
200
300
Predicted Actual Predicted Actual0
100
200
300
106
65
92
70
66
22
157
41
65
12
12
Kilo
litre
s
Kilo
litre
s
Rain water
Grey water
Mains water
Toilets
Womens hand basins and showers
Other sinks, basins and dishwashers
Fuel cell
Supply Consumption
Figure 8. Type of Water Supply and Consumption (December 05–November 06)
7 A stability study looks at the building connection and synchronisation of the electrical signals to the grid. 8 The industry average measured as a 2.5-star NABERS level is 1,210 litres/m²/annum.9 The NABERS 5-star office requirement is 350 litres/m²/annum.
Page �0 • Cas 45 • May 2007 B E D P E n v i r o n m E n t D E s i g n g u i D E
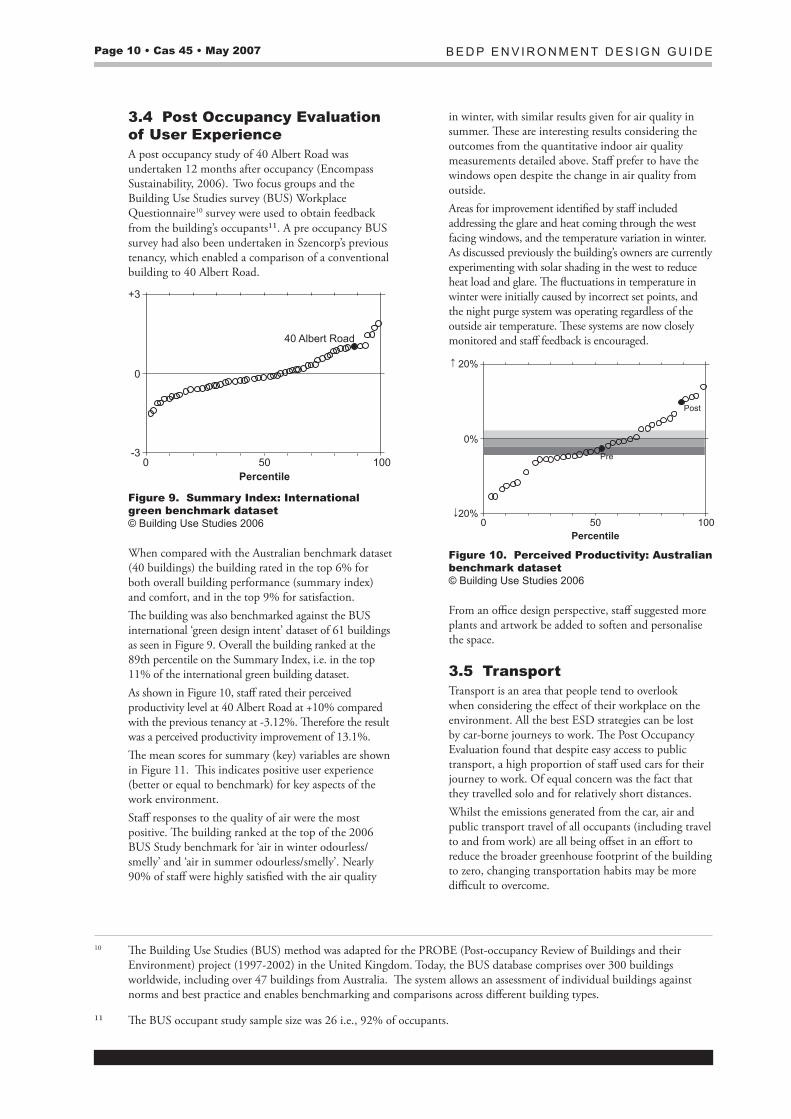
3.4 Post Occupancy Evaluation of User ExperienceA post occupancy study of 40 Albert Road was undertaken 12 months after occupancy (Encompass Sustainability, 2006). Two focus groups and the Building Use Studies survey (BUS) Workplace Questionnaire10 survey were used to obtain feedback from the building’s occupants¹¹. A pre occupancy BUS survey had also been undertaken in Szencorp’s previous tenancy, which enabled a comparison of a conventional building to 40 Albert Road.
+3
0
-30 50 100
Percentile
40 Albert Road
Figure 9. Summary Index: International green benchmark dataset © Building use studies 2006
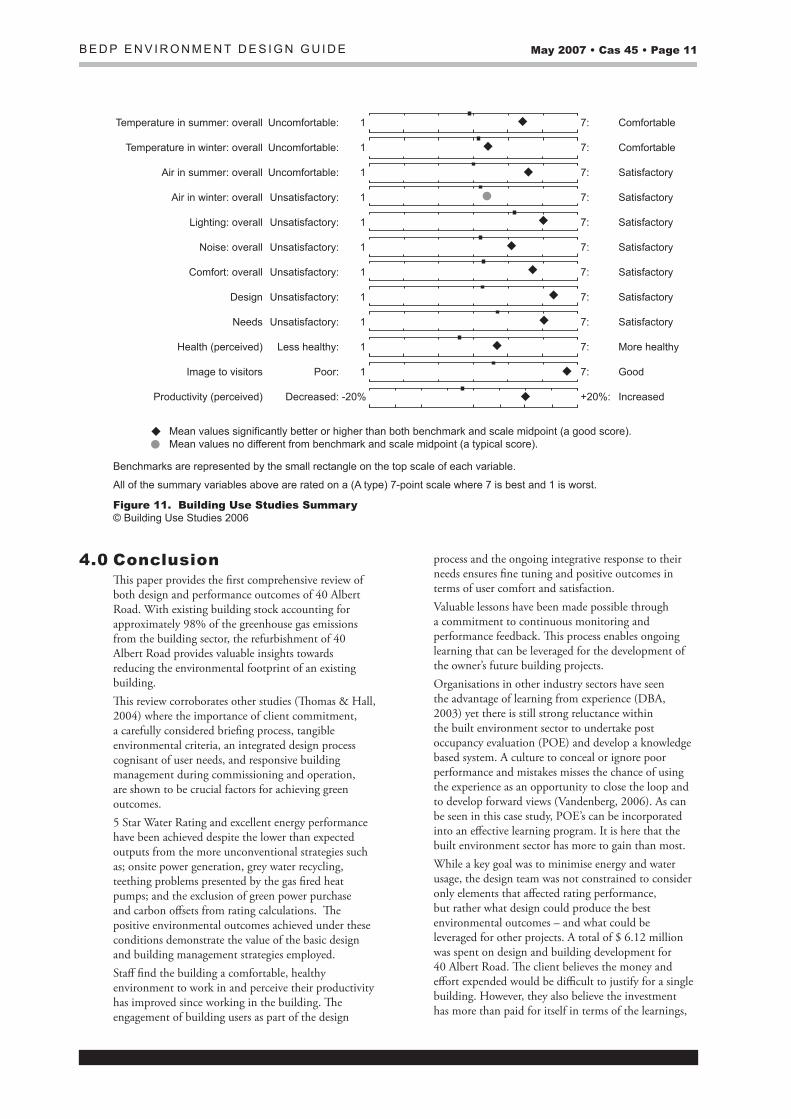
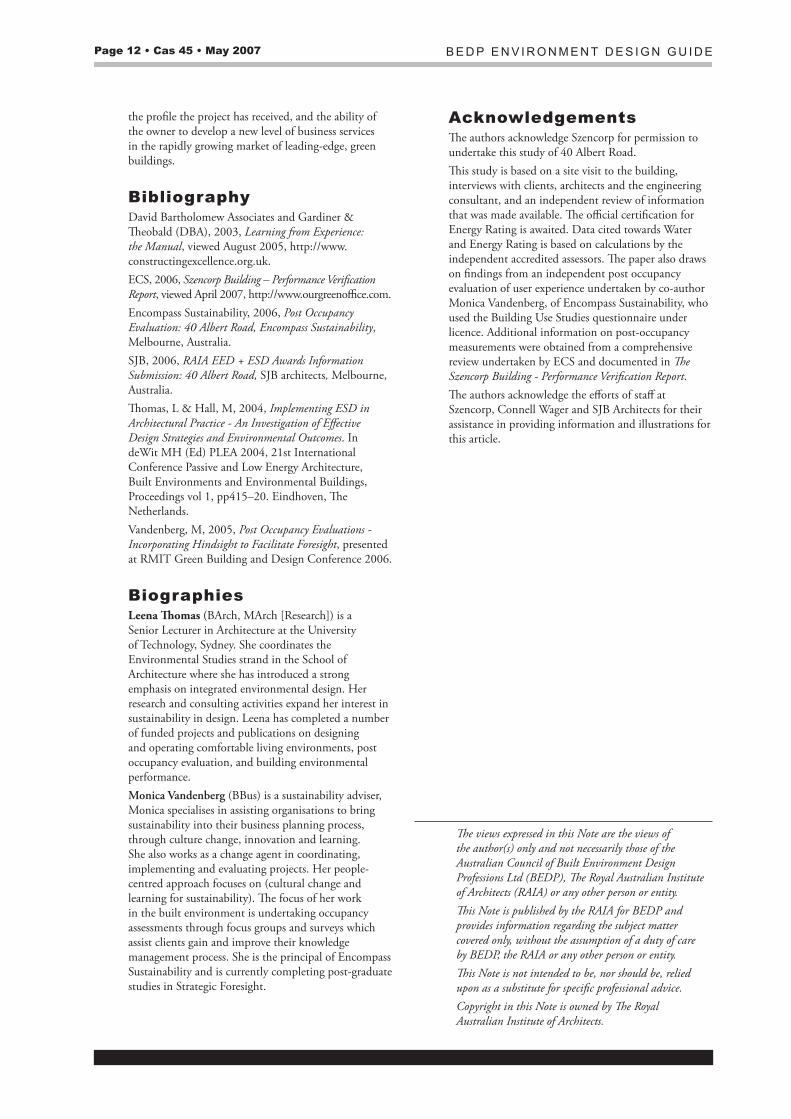
When compared with the Australian benchmark dataset (40 buildings) the building rated in the top 6% for both overall building performance (summary index) and comfort, and in the top 9% for satisfaction.The building was also benchmarked against the BUS international ‘green design intent’ dataset of 61 buildings as seen in Figure 9. Overall the building ranked at the 89th percentile on the Summary Index, i.e. in the top 11% of the international green building dataset. As shown in Figure 10, staff rated their perceived productivity level at 40 Albert Road at +10% compared with the previous tenancy at -3.12%. Therefore the result was a perceived productivity improvement of 13.1%. The mean scores for summary (key) variables are shown in Figure 11. This indicates positive user experience (better or equal to benchmark) for key aspects of the work environment.Staff responses to the quality of air were the most positive. The building ranked at the top of the 2006 BUS Study benchmark for ‘air in winter odourless/smelly’ and ‘air in summer odourless/smelly’. Nearly 90% of staff were highly satisfied with the air quality
in winter, with similar results given for air quality in summer. These are interesting results considering the outcomes from the quantitative indoor air quality measurements detailed above. Staff prefer to have the windows open despite the change in air quality from outside.Areas for improvement identified by staff included addressing the glare and heat coming through the west facing windows, and the temperature variation in winter. As discussed previously the building’s owners are currently experimenting with solar shading in the west to reduce heat load and glare. The fluctuations in temperature in winter were initially caused by incorrect set points, and the night purge system was operating regardless of the outside air temperature. These systems are now closely monitored and staff feedback is encouraged.
↑ 20%
0%
↓20%0 50 100
Percentile
Post
Pre
Figure �0. Perceived Productivity: Australian benchmark dataset © Building use studies 2006
From an office design perspective, staff suggested more plants and artwork be added to soften and personalise the space.
3.5 TransportTransport is an area that people tend to overlook when considering the effect of their workplace on the environment. All the best ESD strategies can be lost by car-borne journeys to work. The Post Occupancy Evaluation found that despite easy access to public transport, a high proportion of staff used cars for their journey to work. Of equal concern was the fact that they travelled solo and for relatively short distances. Whilst the emissions generated from the car, air and public transport travel of all occupants (including travel to and from work) are all being offset in an effort to reduce the broader greenhouse footprint of the building to zero, changing transportation habits may be more difficult to overcome.
10 The Building Use Studies (BUS) method was adapted for the PROBE (Post-occupancy Review of Buildings and their Environment) project (1997-2002) in the United Kingdom. Today, the BUS database comprises over 300 buildings worldwide, including over 47 buildings from Australia. The system allows an assessment of individual buildings against norms and best practice and enables benchmarking and comparisons across different building types.
¹¹ The BUS occupant study sample size was 26 i.e., 92% of occupants.
B E D P E n v i r o n m E n t D E s i g n g u i D E May 2007 • Cas 45 • Page ��
Temperature in summer: overall Uncomfortable: 1
Temperature in winter: overall Uncomfortable: 1
Air in summer: overall Uncomfortable: 1
Air in winter: overall Unsatisfactory: 1
Lighting: overall Unsatisfactory: 1
Noise: overall Unsatisfactory: 1
Comfort: overall Unsatisfactory: 1
Design Unsatisfactory: 1
Needs Unsatisfactory: 1
Health (perceived) Less healthy: 1
Image to visitors Poor: 1
Productivity (perceived) Decreased: -20%
7: Comfortable
7: Comfortable
7: Satisfactory
7: Satisfactory
7: Satisfactory
7: Satisfactory
7: Satisfactory
7: Satisfactory
7: Satisfactory
7: More healthy
7: Good
+20%: Increased
Mean values significantly better or higher than both benchmark and scale midpoint (a good score). Mean values no different from benchmark and scale midpoint (a typical score).
Benchmarks are represented by the small rectangle on the top scale of each variable.
All of the summary variables above are rated on a (A type) 7-point scale where 7 is best and 1 is worst.
Figure ��. Building Use Studies Summary © Building use studies 2006
4.0 ConclusionThis paper provides the first comprehensive review of both design and performance outcomes of 40 Albert Road. With existing building stock accounting for approximately 98% of the greenhouse gas emissions from the building sector, the refurbishment of 40 Albert Road provides valuable insights towards reducing the environmental footprint of an existing building.This review corroborates other studies (Thomas & Hall, 2004) where the importance of client commitment, a carefully considered briefing process, tangible environmental criteria, an integrated design process cognisant of user needs, and responsive building management during commissioning and operation, are shown to be crucial factors for achieving green outcomes. 5 Star Water Rating and excellent energy performance have been achieved despite the lower than expected outputs from the more unconventional strategies such as; onsite power generation, grey water recycling, teething problems presented by the gas fired heat pumps; and the exclusion of green power purchase and carbon offsets from rating calculations. The positive environmental outcomes achieved under these conditions demonstrate the value of the basic design and building management strategies employed. Staff find the building a comfortable, healthy environment to work in and perceive their productivity has improved since working in the building. The engagement of building users as part of the design
process and the ongoing integrative response to their needs ensures fine tuning and positive outcomes in terms of user comfort and satisfaction.Valuable lessons have been made possible through a commitment to continuous monitoring and performance feedback. This process enables ongoing learning that can be leveraged for the development of the owner’s future building projects. Organisations in other industry sectors have seen the advantage of learning from experience (DBA, 2003) yet there is still strong reluctance within the built environment sector to undertake post occupancy evaluation (POE) and develop a knowledge based system. A culture to conceal or ignore poor performance and mistakes misses the chance of using the experience as an opportunity to close the loop and to develop forward views (Vandenberg, 2006). As can be seen in this case study, POE’s can be incorporated into an effective learning program. It is here that the built environment sector has more to gain than most.While a key goal was to minimise energy and water usage, the design team was not constrained to consider only elements that affected rating performance, but rather what design could produce the best environmental outcomes – and what could be leveraged for other projects. A total of $ 6.12 million was spent on design and building development for 40 Albert Road. The client believes the money and effort expended would be difficult to justify for a single building. However, they also believe the investment has more than paid for itself in terms of the learnings,
Page �2 • Cas 45 • May 2007 B E D P E n v i r o n m E n t D E s i g n g u i D E
the profile the project has received, and the ability of the owner to develop a new level of business services in the rapidly growing market of leading-edge, green buildings.
BibliographyDavid Bartholomew Associates and Gardiner & Theobald (DBA), 2003, Learning from Experience: the Manual, viewed August 2005, http://www.constructingexcellence.org.uk. ECS, 2006, Szencorp Building – Performance Verification Report, viewed April 2007, http://www.ourgreenoffice.com.Encompass Sustainability, 2006, Post Occupancy Evaluation: 40 Albert Road, Encompass Sustainability, Melbourne, Australia.SJB, 2006, RAIA EED + ESD Awards Information Submission: 40 Albert Road, SJB architects, Melbourne, Australia. Thomas, L & Hall, M, 2004, Implementing ESD in Architectural Practice - An Investigation of Effective Design Strategies and Environmental Outcomes. In deWit MH (Ed) PLEA 2004, 21st International Conference Passive and Low Energy Architecture, Built Environments and Environmental Buildings, Proceedings vol 1, pp415–20. Eindhoven, The Netherlands.Vandenberg, M, 2005, Post Occupancy Evaluations - Incorporating Hindsight to Facilitate Foresight, presented at RMIT Green Building and Design Conference 2006.
BiographiesLeena Thomas (BArch, MArch [Research]) is a Senior Lecturer in Architecture at the University of Technology, Sydney. She coordinates the Environmental Studies strand in the School of Architecture where she has introduced a strong emphasis on integrated environmental design. Her research and consulting activities expand her interest in sustainability in design. Leena has completed a number of funded projects and publications on designing and operating comfortable living environments, post occupancy evaluation, and building environmental performance.Monica Vandenberg (BBus) is a sustainability adviser, Monica specialises in assisting organisations to bring sustainability into their business planning process, through culture change, innovation and learning. She also works as a change agent in coordinating, implementing and evaluating projects. Her people-centred approach focuses on (cultural change and learning for sustainability). The focus of her work in the built environment is undertaking occupancy assessments through focus groups and surveys which assist clients gain and improve their knowledge management process. She is the principal of Encompass Sustainability and is currently completing post-graduate studies in Strategic Foresight.
AcknowledgementsThe authors acknowledge Szencorp for permission to undertake this study of 40 Albert Road. This study is based on a site visit to the building, interviews with clients, architects and the engineering consultant, and an independent review of information that was made available. The official certification for Energy Rating is awaited. Data cited towards Water and Energy Rating is based on calculations by the independent accredited assessors. The paper also draws on findings from an independent post occupancy evaluation of user experience undertaken by co-author Monica Vandenberg, of Encompass Sustainability, who used the Building Use Studies questionnaire under licence. Additional information on post-occupancy measurements were obtained from a comprehensive review undertaken by ECS and documented in The Szencorp Building - Performance Verification Report.The authors acknowledge the efforts of staff at Szencorp, Connell Wager and SJB Architects for their assistance in providing information and illustrations for this article.
The views expressed in this Note are the views of the author(s) only and not necessarily those of the Australian Council of Built Environment Design Professions Ltd (BEDP), The Royal Australian Institute of Architects (RAIA) or any other person or entity.This Note is published by the RAIA for BEDP and provides information regarding the subject matter covered only, without the assumption of a duty of care by BEDP, the RAIA or any other person or entity.This Note is not intended to be, nor should be, relied upon as a substitute for specific professional advice.Copyright in this Note is owned by The Royal Australian Institute of Architects.