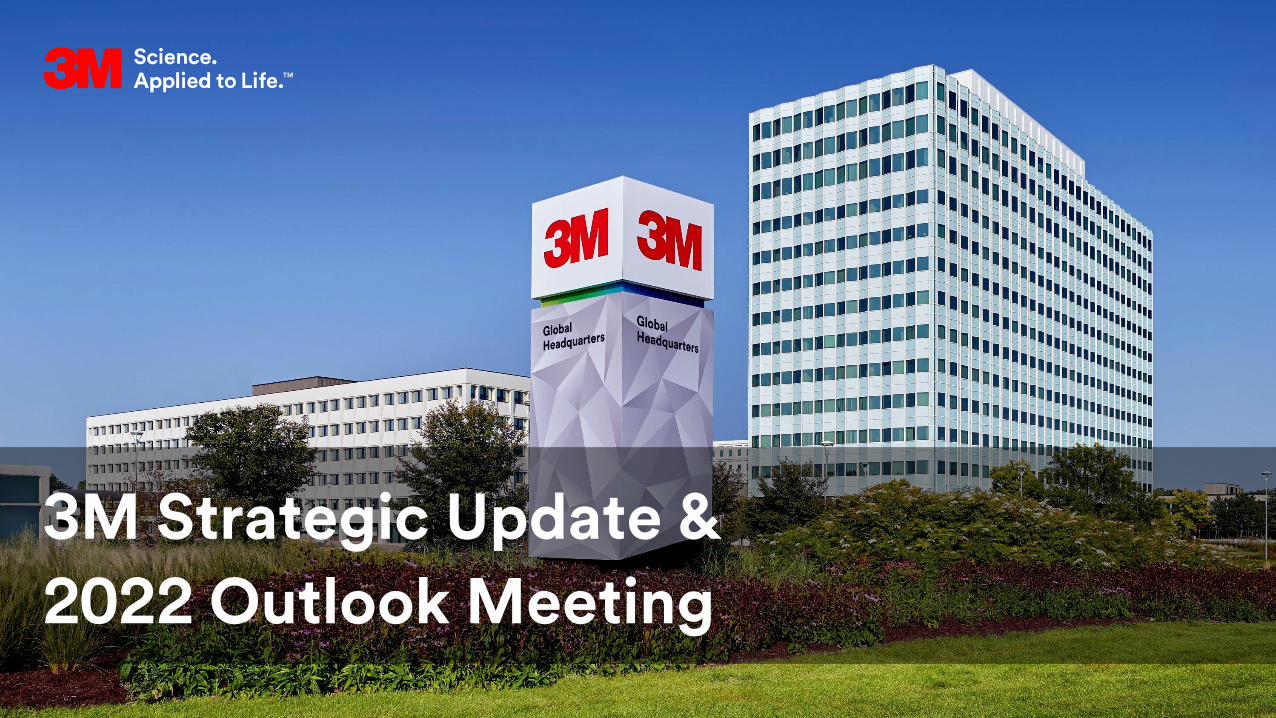
3M Strategic Update & 2022 Outlook Meeting
94
1 3M Strategic Update & 2022 Outlook Meeting
-
Upload
khangminh22 -
Category
Documents
-
view
0 -
download
0
Transcript of 3M Strategic Update & 2022 Outlook Meeting
1
3M Strategic Update &
2022 Outlook Meeting
2
3M Strategic Update & 2022 Outlook Meeting
WelcomeBruce Jermeland | Senior Vice President, Investor Relations

33M Strategic Update & 2022 Outlook Meeting – February 14, 2022. All rights reserved.
Welcome
Forward looking statement
Note on non-GAAP financial measures
This presentation contains forward-looking information about 3M's financial results and estimates and business prospects that involve substantial risks anduncertainties. You can identify these statements by the use of words such as "anticipate," "estimate," "expect," "aim," "project," "intend," "plan," "believe," "will,""should," "could," "target," "forecast" and other words and terms of similar meaning in connection with any discussion of future operating or financial performanceor business plans or prospects. Among the factors that could cause actual results to differ materially are the following: (1) worldwide economic, political,regulatory, international trade and other external conditions and other factors beyond the Company's control, including natural and other disasters or climatechange affecting the operations of the Company or its customers and suppliers; (2) risks related to public health crises such as the global pandemic associated withthe coronavirus (COVID-19); (3) foreign currency exchange rates and fluctuations in those rates; (4) liabilities related to certain fluorochemicals, including lawsuitsconcerning various PFAS-related products and chemistries, and claims and governmental regulatory proceedings and inquiries related to PFAS in a variety ofjurisdictions; (5) legal proceedings, including significant developments that could occur in the legal and regulatory proceedings described in the Company's AnnualReport on Form 10-K for the year ended Dec. 31, 2021, and any subsequent quarterly reports on Form 10-Q (the “Reports”); (6) competitive conditions andcustomer preferences; (7) the timing and market acceptance of new product offerings; (8) the availability and cost of purchased components, compounds, rawmaterials, and energy (including oil and natural gas and their derivatives) and labor due to shortages, increased demand and wages, logistics, supply chaininterruptions or manufacturing site disruption (including those caused by natural and other disasters and other events such as government actions); (9)unanticipated problems or delays with the phased implementation of a global enterprise resource planning (ERP) system, or security breaches and other disruptionsto the Company's information technology infrastructure; (10) the impact of acquisitions, strategic alliances, divestitures and other unusual events resulting fromportfolio management actions and other evolving business strategies, and possible organizational restructuring; (11) operational execution, including scenarioswhere the Company generates fewer productivity improvements than estimated; (12) financial market risks that may affect the Company’s funding obligationsunder defined benefit pension and postretirement plans; (13) the Company's credit ratings and its cost of capital; and (14) tax-related external conditions, includingchanges in tax rates, laws or regulations. Changes in such assumptions or factors could produce significantly different results. A further description of these factorsis located in the Reports under "Cautionary Note Concerning Factors That May Affect Future Results" and "Risk Factors" in Part I, Items 1 and 1A (Annual Report)and in Part I, Item 2 and Part II, Item 1A (Quarterly Reports), as updated by applicable Current Reports on Form 8-K. The information contained in this presentationis as of the date indicated. The Company assumes no obligation to update any forward-looking statements contained in this presentation as a result of newinformation or future events or developments.
The accompanying presentations refer to certain non-GAAP financial measures. These non-GAAP measures are not in accordance with, nor are they a substitute for, GAAP measures. Reconciliations of these non-GAAP financial measures to the most directly comparable GAAP financial measures can be found in the Appendix to this "Welcome" presentation.

43M Strategic Update & 2022 Outlook Meeting – February 14, 2022. All rights reserved.
Welcome
Today’s agenda
Welcome Bruce Jermeland, Senior Vice President
The Power of 3M Mike Roman, Chairman and CEO
Research & Development John Banovetz, Chief Technology Officer
Consumer Jeff Lavers, Group President
Health Care Mojdeh Poul, Group President
Safety & Industrial Mike Vale, Group President
Transportation & Electronics Ashish Khandpur, Group President
Finance & Transformation Monish Patolawala, Chief Financial & Transformation Officer
Break
Q&A
Adjourn

53M Strategic Update & 2022 Outlook Meeting – February 14, 2022. All rights reserved.
Appendix
63M Strategic Update & 2022 Outlook Meeting – February 14, 2022. All rights reserved.
Appendix
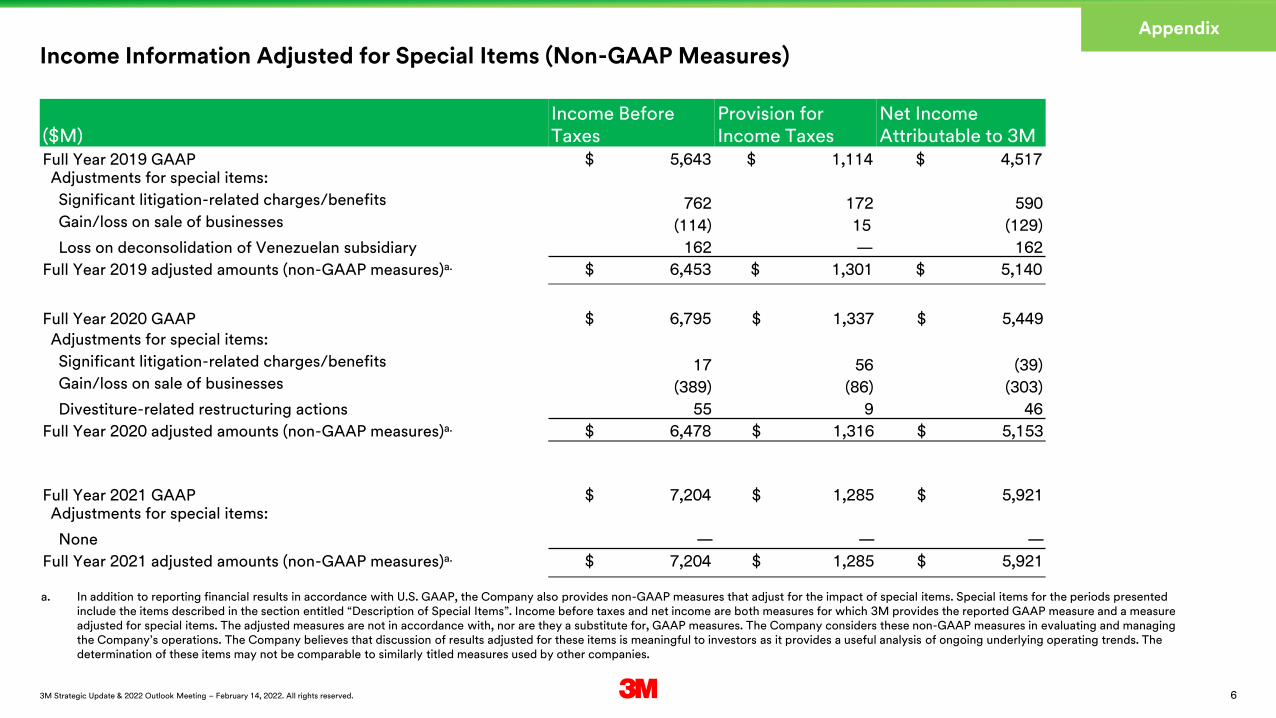
($M)Income Before Taxes
Provision for Income Taxes
Net Income Attributable to 3M
Full Year 2019 GAAP $ 5,643 $ 1,114 $ 4,517Adjustments for special items:
Significant litigation-related charges/benefits 762 172 590Gain/loss on sale of businesses (114) 15 (129)
Loss on deconsolidation of Venezuelan subsidiary 162 — 162
Full Year 2019 adjusted amounts (non-GAAP measures)a. $ 6,453 $ 1,301 $ 5,140
Full Year 2020 GAAP $ 6,795 $ 1,337 $ 5,449
Adjustments for special items:
Significant litigation-related charges/benefits 17 56 (39)Gain/loss on sale of businesses (389) (86) (303)
Divestiture-related restructuring actions 55 9 46
Full Year 2020 adjusted amounts (non-GAAP measures)a. $ 6,478 $ 1,316 $ 5,153
Full Year 2021 GAAP $ 7,204 $ 1,285 $ 5,921Adjustments for special items:
None — — —
Full Year 2021 adjusted amounts (non-GAAP measures)a. $ 7,204 $ 1,285 $ 5,921
a. In addition to reporting financial results in accordance with U.S. GAAP, the Company also provides non-GAAP measures that adjust for the impact of special items. Special items for the periods presented include the items described in the section entitled “Description of Special Items”. Income before taxes and net income are both measures for which 3M provides the reported GAAP measure and a measure adjusted for special items. The adjusted measures are not in accordance with, nor are they a substitute for, GAAP measures. The Company considers these non-GAAP measures in evaluating and managing the Company’s operations. The Company believes that discussion of results adjusted for these items is meaningful to investors as it provides a useful analysis of ongoing underlying operating trends. The determination of these items may not be comparable to similarly titled measures used by other companies.
Income Information Adjusted for Special Items (Non-GAAP Measures)

73M Strategic Update & 2022 Outlook Meeting – February 14, 2022. All rights reserved.
Appendix
Free Cash Flow, Free Cash Flow Conversion, Adjusted Free Cash Flow and Adjusted Free Cash Flow Conversion (Non-GAAP Measures)
Years ended December 31 ($M) 2019 2020 2021Major GAAP Cash Flow Categories
Net cash provided by (used in) operating activities $ 7,070 $ 8,113 $ 7,454Net cash provided by (used in) investing activities (6,444) (580) (1,317)Net cash provided by (used in) financing activities (1,124) (5,300) (6,145)
Free Cash Flow (non-GAAP measure) Years ended December 31 ($M, except 2022E in $B)
2019 2020 2021 2022E
Net cash provided by (used in) operating activities $ 7,070 $ 8,113 $ 7,454 $7.3 to $7.9 Purchases of property, plant and equipment (1,699) (1,501) (1,603) ($1.7 to $2.0)
Free cash flowb. 5,371 6,612 5,851 $5.3 to $6.2 Net income attributable to 3M 4,517 5,449 5,921 $5.9 to $6.2 Free cash flow conversionb.
119 % 121 % 99 % 90% to 100%
Adjusted Free Cash Flow (non-GAAP measure) Years ended December 31 ($M)
2019 2020 2021
Net cash provided by (used in) operating activities $ 7,070 $ 8,113 $ 7,454Purchases of property, plant and equipment (1,699) (1,501) (1,603)
Free cash flowb. 5,371 6,612 5,851Adjustments for special items:
Significant litigation-related after-tax payment impacts 267 79 39TCJA transition tax payment — 33 77
Divestiture-related restructuring after-tax payment impacts 60 12 6Adjusted free cash flowc.
5,698 6,736 5,973Adjusted net income attributable to 3Ma.
5,140 5,153 5,921Adjusted free cash flow conversionc.
111 % 131 % 101 %

83M Strategic Update & 2022 Outlook Meeting – February 14, 2022. All rights reserved.
Appendix
Free Cash Flow, Free Cash Flow Conversion, Adjusted Free Cash Flow and Adjusted Free Cash Flow Conversion (non-GAAP measures)
b. Free cash flow and free cash flow conversion are not defined under U.S. generally accepted accounting principles (GAAP). Therefore, they should not be considered a substitute for income or cash flow data prepared in accordance with U.S. GAAP and may not be comparable to similarly titled measures used by other companies. The Company defines free cash flow as net cash provided by operating activities less purchases of property, plant and equipment. It should not be inferred that the entire free cash flow amount is available for discretionary expenditures. The Company defines free cash flow conversion as free cash flow divided by net income attributable to 3M. The Company believes free cash flow and free cash flow conversion are meaningful to investors as they function as useful measures of performance and the Company uses these measures as an indication of the strength of the company and its ability to generate cash.
c. Adjusted free cash flow and adjusted free cash flow conversion are not defined under U.S. GAAP. Therefore, they should not be considered a substitute for income or cash flow data prepared in accordance with U.S. GAAP and may not be comparable to similarly titled measures used by other companies. The Company defines adjusted free cash flow as net cash provided by operating activities, adjusted for special items, less purchases of property, plant and equipment. Cash payments associated with special items in the determination of adjusted free cash flow are reflected net of applicable tax using the U.S. statutory corporate tax rate during the period of payment. It should not be inferred that the entire adjusted free cash flow amount is available for discretionary expenditures. The Company defines adjusted free cash flow conversion as adjusted free cash flow divided by net income attributable to 3M, adjusted for special items. Special items for the periods presented include the items described in section entitled “Description of Special Items”. The Company believes adjusted free cash flow and adjusted free cash flow conversion are meaningful to investors as they are useful measures of performance and the Company uses these measures as an indication of the strength of the company and its ability to generate cash.

93M Strategic Update & 2022 Outlook Meeting – February 14, 2022. All rights reserved.
Appendix
Net Debt (Non-GAAP Measure)
($M)December 31,
2019December 31,
2020December 31,
2021Total debt $ 20,313 $ 18,795 $ 17,363Less: Cash, cash equivalents and marketable securities 2,494 5,068 4,792
Net debtd. $ 17,819 $ 13,727 $ 12,571
d. Net debt is not defined under U.S. GAAP and may not be computed the same as similarly titled measures used by other companies. The Company defines net debt as total debt less the total of cash, cash equivalents and current and long-term marketable securities. 3M believes net debt is meaningful to investors as 3M considers net debt and its components to be an important indicator of liquidity and a guiding measure of capital structure strategy.

103M Strategic Update & 2022 Outlook Meeting – February 14, 2022. All rights reserved.
Appendix
Description of Special Items
In addition to reporting financial results in accordance with U.S. GAAP, the Company also provides various non-GAAP measures that incorporate adjustments for the impacts of special items. Special items incorporated in the preparation of these non-GAAP measures for the periods presented include the items described below:
Significant litigation-related charges/benefits:
• In 2020, 3M recorded a net pre-tax charge of $17 million ($13 million after tax) related to PFAS (certain perfluorinated compounds) matters. The charge was more than offset by a reduction in tax expense of $52 million related to resolution of tax treatment with authorities regarding the previously disclosed 2018 agreement reached with the State of Minnesota that resolved the Natural Resources Damages lawsuit. These items, in aggregate, resulted in a $39 million after-tax benefit. In 2021 and 2020, 3M made payments of approximately $49 million and $100 million, respectively, related to significant litigation-related matters.
• In 2019, the Company recorded significant litigation-related charges of $762 million ($590 million after tax) related to PFAS matters ($449 million pre-tax) and coal mine dust respirator mask lawsuits ($313 million pre-tax). In 2019, 3M made payments of approximately $338 million related to significant litigation-related matters.
Gain/loss on sale of businesses:
• In 2020, 3M recorded a pre-tax gain of $2 million ($1 million loss after tax) related to the sale of its advanced ballistic-protection business and recognition of certain contingent consideration and a pre-tax gain of $387 million ($304 million after tax) related to the sale of its drug delivery business.
• In 2019, 3M recorded a gain related to the sale of certain oral care technology comprising a business in addition to reflecting an earnout on a previous divestiture, which together resulted in a net gain of $8 million ($7 million after tax). In 2019, as a result of a “held for sale” tax benefit related to the legal entities associated with the pending divestiture of the Company’s gas and flame detection business, 3M recorded an after-tax gain of $43 million. In 2019, 3M also recorded a gain related to the divestiture of the Company’s gas and flame detection business and an immaterial impact as a result of measuring a disposal group at the lower of its carrying amount or fair value less cost to sell, which in aggregate resulted in a pre-tax gain of $106 million ($79 million after tax).

113M Strategic Update & 2022 Outlook Meeting – February 14, 2022. All rights reserved.
Appendix
Description of Special Items
Divestiture-related restructuring actions:
• In 2021, 3M made payments of approximately $8 million associated with divestiture-related restructuring actions.• In 2020, following the divestiture of substantially all of the drug delivery business management approved and committed to undertake certain restructuring
actions addressing corporate functional costs and manufacturing footprint across 3M in relation to the magnitude of amounts previously allocated/burdened to the divested business. As a result, 3M recorded a pre-tax charge of $55 million ($46 million after tax) and made a subsequent immaterial adjustment thereto. In 2020, 3M made payments of approximately $14 million associated with these restructuring actions.
• In 2019, 3M made payments of approximately $76 million associated with restructuring charges taken in 2018 related to addressing corporate functional costs following the 2018 Communication Markets Division divestiture.
Enactment/measurement period adjustments related to the Tax Cuts and Jobs Act (TCJA):
• In 2021 and 2020, 3M made payments of approximately $77 million and $33 million, respectively, related to the transition tax expense incurred as a result of the 2017 enactment of the TCJA.
Loss on deconsolidation of Venezuelan subsidiary:
• In 2019, 3M recorded a pre-tax charge of $162 million related to the deconsolidation of the Company’s Venezuelan subsidiary.

3M Strategic Update & 2022 Outlook Meeting
Driven by Purpose, Delivering PerformanceMike Roman | Chairman and CEO

133M Strategic Update & 2022 Outlook Meeting – February 14, 2022. All rights reserved.
Delivered strong performance in 2021
Growth above macro
• Organic strategies• Portfolio management
Capital allocation
• Research & Development• CapEx
Consistent value & returns
• Actions to deliver margin and cash flow
Operational excellence
• Changes to drive COGS, service and cash
9% organic growth in 2021
$3.6B invested in R&D
and CapEx in 2021
$6B of adjusted free
cash flow with an adjusted conversion rate of 101%
Annual pre-tax savings of
$180M (productivity
actions)
Refer to Appendix in "Welcome" presentation for definition and calculation of adjusted free cash flow and adjusted free cash flow conversion.

143M Strategic Update & 2022 Outlook Meeting – February 14, 2022. All rights reserved.
Unlock the power of people, ideas, and
science to reimagine what’s possible
C o n n e c t i n g p u r p o s e t o p e r f o r m a n c e
153M Strategic Update & 2022 Outlook Meeting – February 14, 2022. All rights reserved.
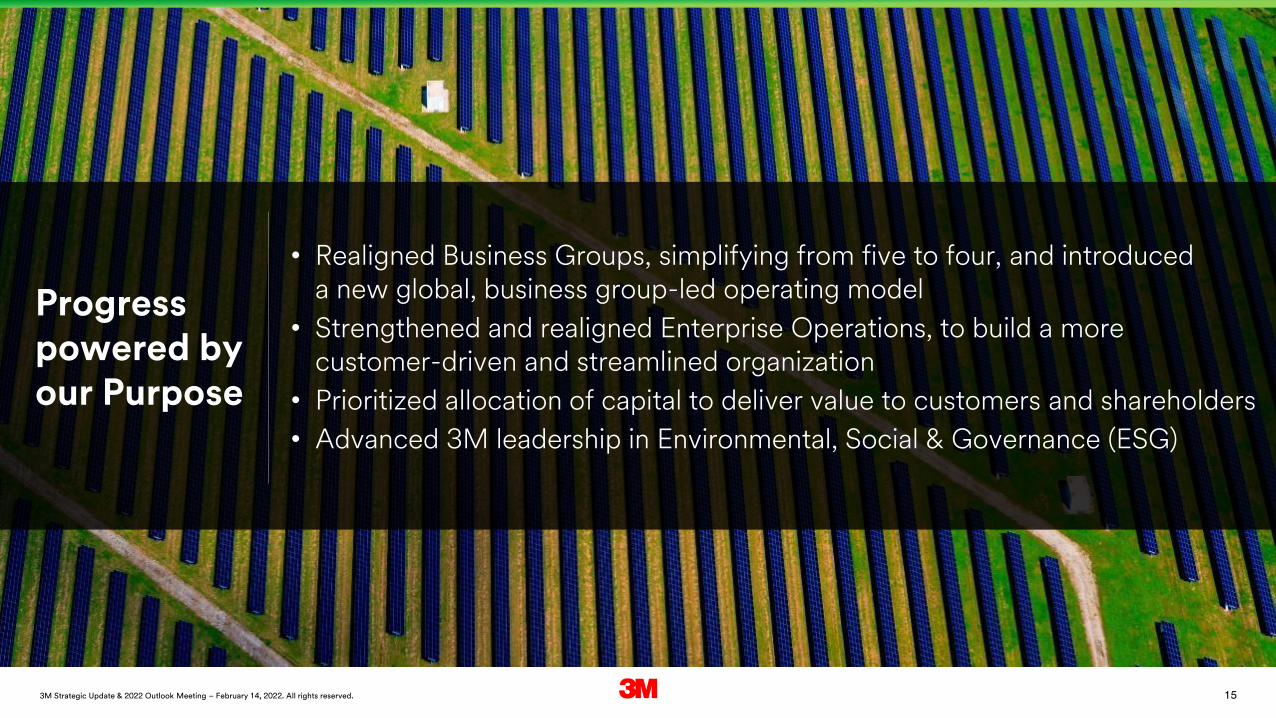
Progress powered by our Purpose
• Realigned Business Groups, simplifying from five to four, and introduced a new global, business group-led operating model
• Strengthened and realigned Enterprise Operations, to build a more customer-driven and streamlined organization
• Prioritized allocation of capital to deliver value to customers and shareholders
• Advanced 3M leadership in Environmental, Social & Governance (ESG)

163M Strategic Update & 2022 Outlook Meeting – February 14, 2022. All rights reserved.
Realigned businesses to customers and go-to market model
From:
• Health Care• Safety & Graphics• Industrial• Electronics & Energy• Consumer
To:
• Health Care• Safety & Industrial• Transportation & Electronics• Consumer

173M Strategic Update & 2022 Outlook Meeting – February 14, 2022. All rights reserved.
Stronger, realigned Enterprise Operations driving end-to-end value
• Aligning manufacturing, supply chain, and customer experience
• Leveraging knowledge globally• Empowering our people• Improving customer net promoter score• Enabling more powerful innovation
Outcomes:
Driving improvements in service, COGS, and cash
Anticipated annual pre-tax savings of $250M (productivity actions)

183M Strategic Update & 2022 Outlook Meeting – February 14, 2022. All rights reserved.
Prioritizing capital allocation to deliver for customers and shareholders
Acquisitions
Divestitures
Shifting to more attractive, high growth markets:
• Acelity• M*Modal
Realigning our portfolio to deliver focus:
• Food safety• Drug delivery• Communications markets
Supported by active portfolio management
Organic Growth
Share repurchases
Dividend
Mergers & Acquisitions

193M Strategic Update & 2022 Outlook Meeting – February 14, 2022. All rights reserved.
Planning to invest $1 billion over 20 years
A c c e l e r a t i n g o u r e n v i r o n m e n t a l c o m m i t m e n t s
2022
10% water reduction
2023
Install purification technology at largest water-using locations
2024
Returning higher quality water to the environment after use in operations
2025
20% water reduction
Reduce dependence on virgin fossil-based plastic by 125M lbs.
2030
25% water reduction at our facilities
50% carbon reduction
2040
80% carbon reduction
2050
Carbon neutral
203M Strategic Update & 2022 Outlook Meeting – February 14, 2022. All rights reserved.
1
2
3
4
5
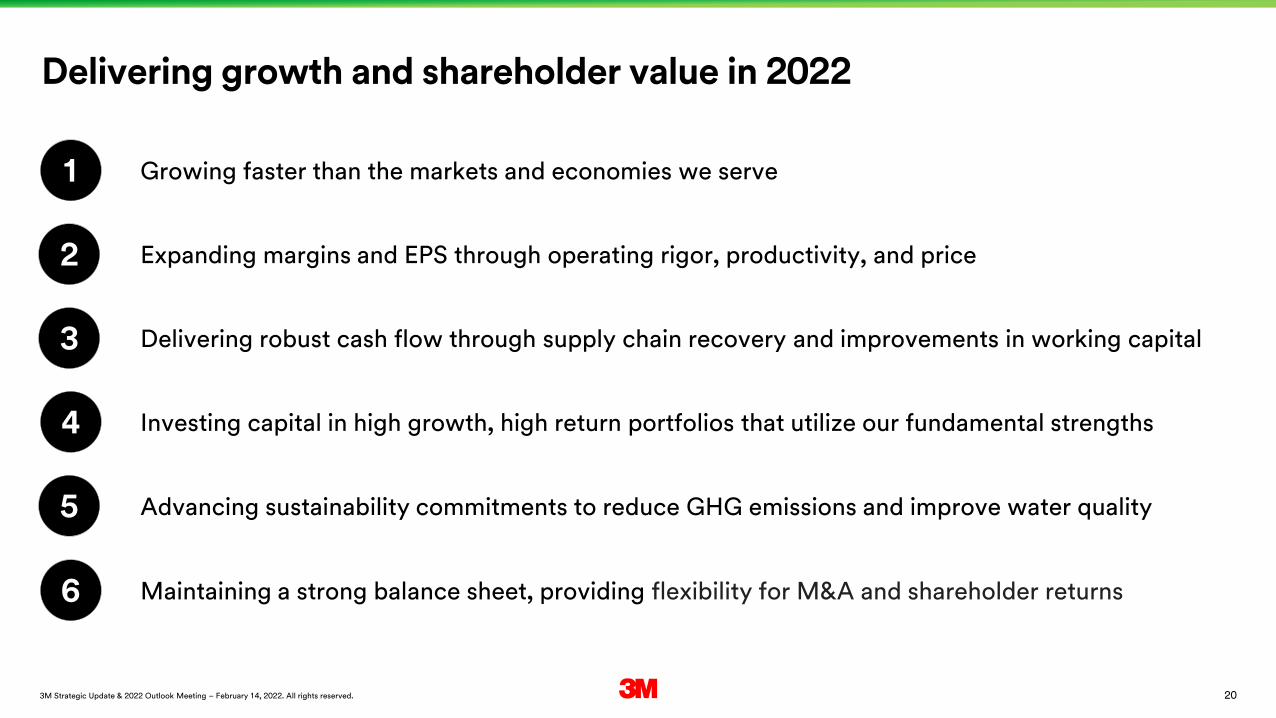
Growing faster than the markets and economies we serve
Expanding margins and EPS through operating rigor, productivity, and price
Delivering robust cash flow through supply chain recovery and improvements in working capital
Investing capital in high growth, high return portfolios that utilize our fundamental strengths
Advancing sustainability commitments to reduce GHG emissions and improve water quality
Maintaining a strong balance sheet, providing flexibility for M&A and shareholder returns6
Delivering growth and shareholder value in 2022

213M Strategic Update & 2022 Outlook Meeting – February 14, 2022. All rights reserved.
Organic sales growth
2% to 5%
Earnings per share
$10.15 to $10.65
Free cash flowconversion
90% to 100%
2022 planning estimates
Refer to Appendix in "Welcome" presentation for definition and calculation of free cash flow conversion.
Estimates include forecasted headwind from disposable respirators on growth (2%) and EPS ($0.45)

223M Strategic Update & 2022 Outlook Meeting – February 14, 2022. All rights reserved.
Powered by market-leading businesses
Bu i l t to g row in a t t rac t i ve end markets
$12.0B2021 sales
$9.3B2021 sales
$8.6B2021 sales
$5.5B2021 sales
ConsumerSafety & Industrial Transportation & Electronics Health Care
Information reflects Q1 2022 segment reporting changes. See 8-K dated February 11, 2022.

233M Strategic Update & 2022 Outlook Meeting – February 14, 2022. All rights reserved.
Seasoned leadership team with deep, diverse expertise
John BanovetzEVP, Chief Technology Officer and Environmental Responsibility
Karina ChavezSVP, Chief Strategy Officer
Zoe DicksonEVP, Chief HR Officer
Peter GibbonsGroup President, Enterprise Operations
Eric HammesEVP, Chief Country Governance and Services Officer
Ashish KhandpurGroup President, Transportation and Electronics
Jeffrey LaversGroup President, Consumer
Mark MurphyEVP, Chief Information and Digital Officer
Monish PatolawalaEVP, Chief Financial and Transformation Officer
Mojdeh PoulGroup President, Health Care
Kevin RhodesEVP, Chief Legal Affairs Officer
Michael ValeGroup President, Safety and Industrial

243M Strategic Update & 2022 Outlook Meeting – February 14, 2022. All rights reserved.
Our strategic priorities:
1
Portfolio management
2
Transforming 3M operating model
3
Growth through innovation
4
People and culture

253M Strategic Update & 2022 Outlook Meeting – February 14, 2022. All rights reserved.
Repositioning to higher growth markets where we can create differentiated value by utilizing our fundamental strengths:
ReallocatePrioritize and deploy capital andresources to most attractive opportunities
DivestDrive fit and focus while unlocking value for customers and shareholders
Optimize business modelsMaximizing value across our portfolio
InvestInvest organically in attractive, growing market segments
AcquireReposition portfolio to attractive markets to leverage the 3M Operating Model
263M Strategic Update & 2022 Outlook Meeting – February 14, 2022. All rights reserved.
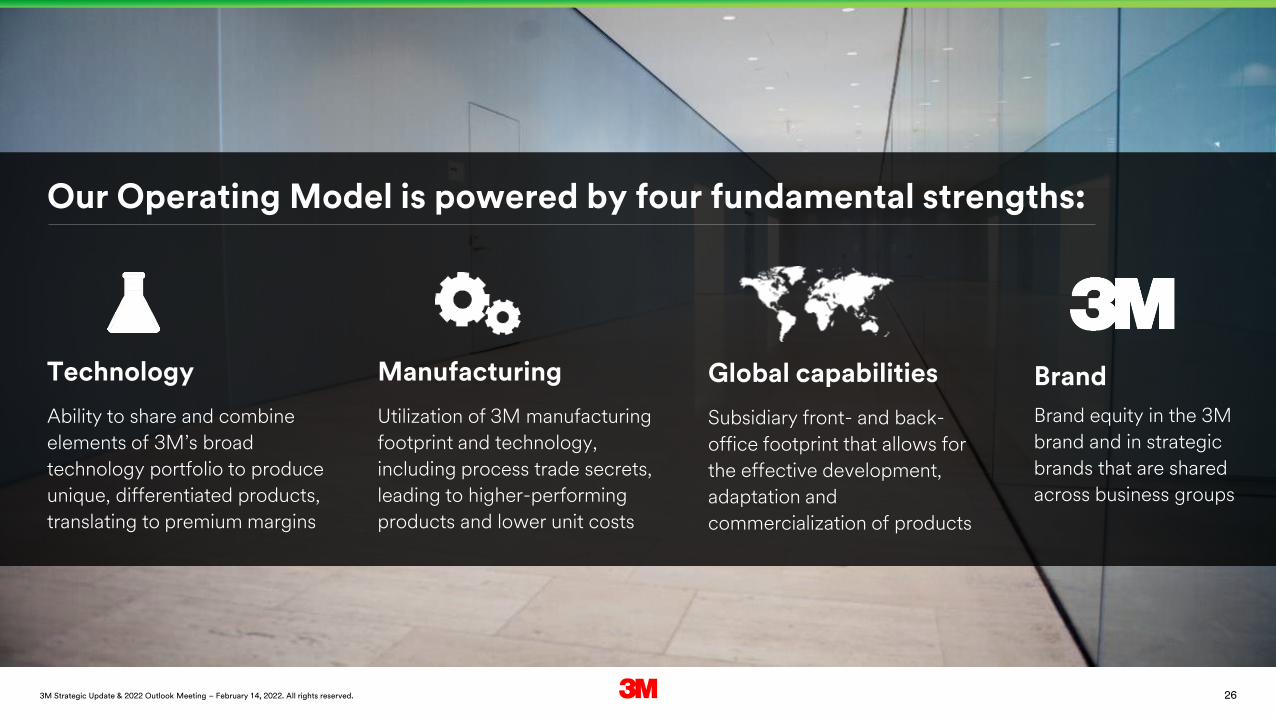
Our Operating Model is powered by four fundamental strengths:
Brand
Brand equity in the 3M
brand and in strategic
brands that are shared
across business groups
Global capabilities
Subsidiary front- and back-
office footprint that allows for
the effective development,
adaptation and
commercialization of products
Manufacturing
Utilization of 3M manufacturing
footprint and technology,
including process trade secrets,
leading to higher-performing
products and lower unit costs
Technology
Ability to share and combine
elements of 3M’s broad
technology portfolio to produce
unique, differentiated products,
translating to premium margins
273M Strategic Update & 2022 Outlook Meeting – February 14, 2022. All rights reserved.
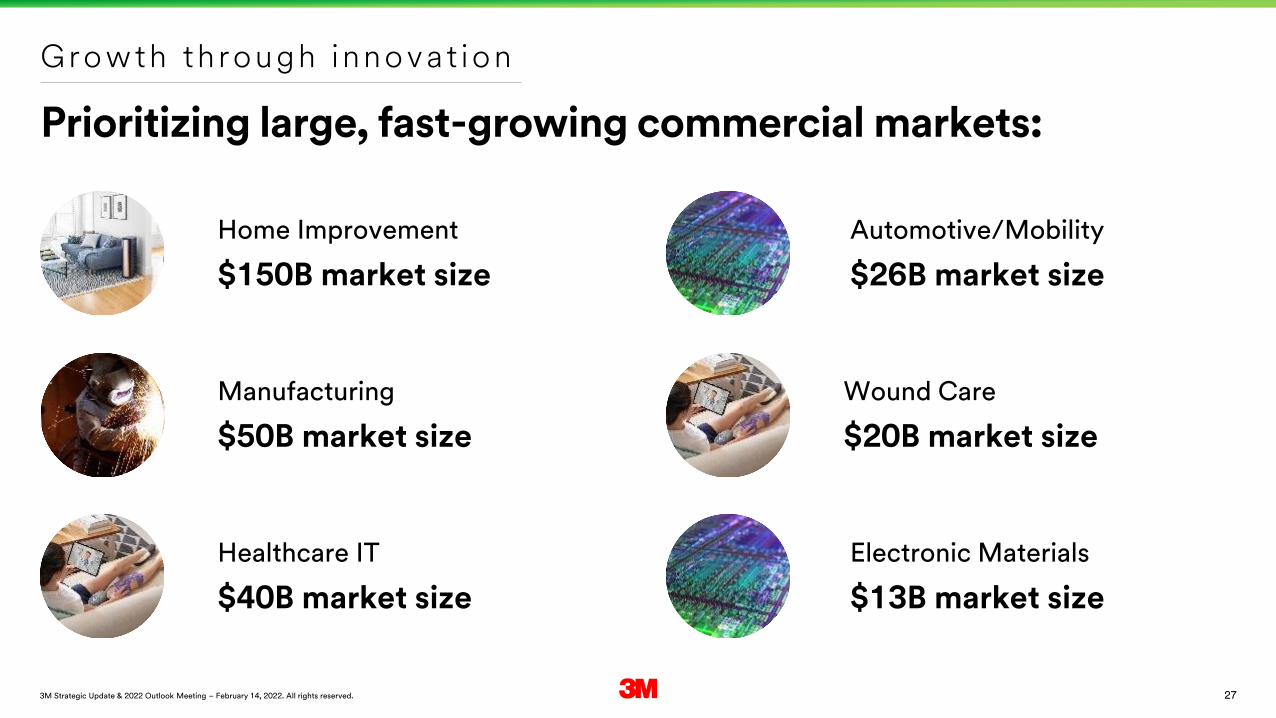
Prioritizing large, fast-growing commercial markets:
Growth th rough innovat ion
Home Improvement
$150B market size
Manufacturing
$50B market size
Healthcare IT
$40B market size
Automotive/Mobility
$26B market size
Wound Care
$20B market size
Electronic Materials
$13B market size

283M Strategic Update & 2022 Outlook Meeting – February 14, 2022. All rights reserved.
Advancing the digitization of 3M
Digital EnterpriseImprove corporate functional efficiency
Digital CustomerDigital customer intimacy and seamless customer experience
Digital OperationsDigital process and data expertise to reduce cost and improve effectiveness
Digital ProductsNew digital business models on top of existing product and service

293M Strategic Update & 2022 Outlook Meeting – February 14, 2022. All rights reserved.
Powering inclusion and committing to a more diverse and equitable future
• Advancing equity commitments in each business group
• Combining the best of virtual & in-person work, introducing ‘Work Your Way’
• Investing $50 million in our communities, with a focus on expanding STEM education
• Doubling the number of employees from underrepresented groups
E n a b l i n g o u r p e o p l e t o b e a t t h e i r b e s t

303M Strategic Update & 2022 Outlook Meeting – February 14, 2022. All rights reserved.
The world is changing, and we’re leading the change
Supply chain disruptions impacting global operations
We’re taking actions to drive improvements in service, COGS, and cash flow
Increasing litigation impacting many industries
We will vigorously defend our legal positions based on our values and our science
Pandemic raising the world’s expectations of companies
We’re fighting the pandemic from all angles, and for all stakeholders
313M Strategic Update & 2022 Outlook Meeting – February 14, 2022. All rights reserved.
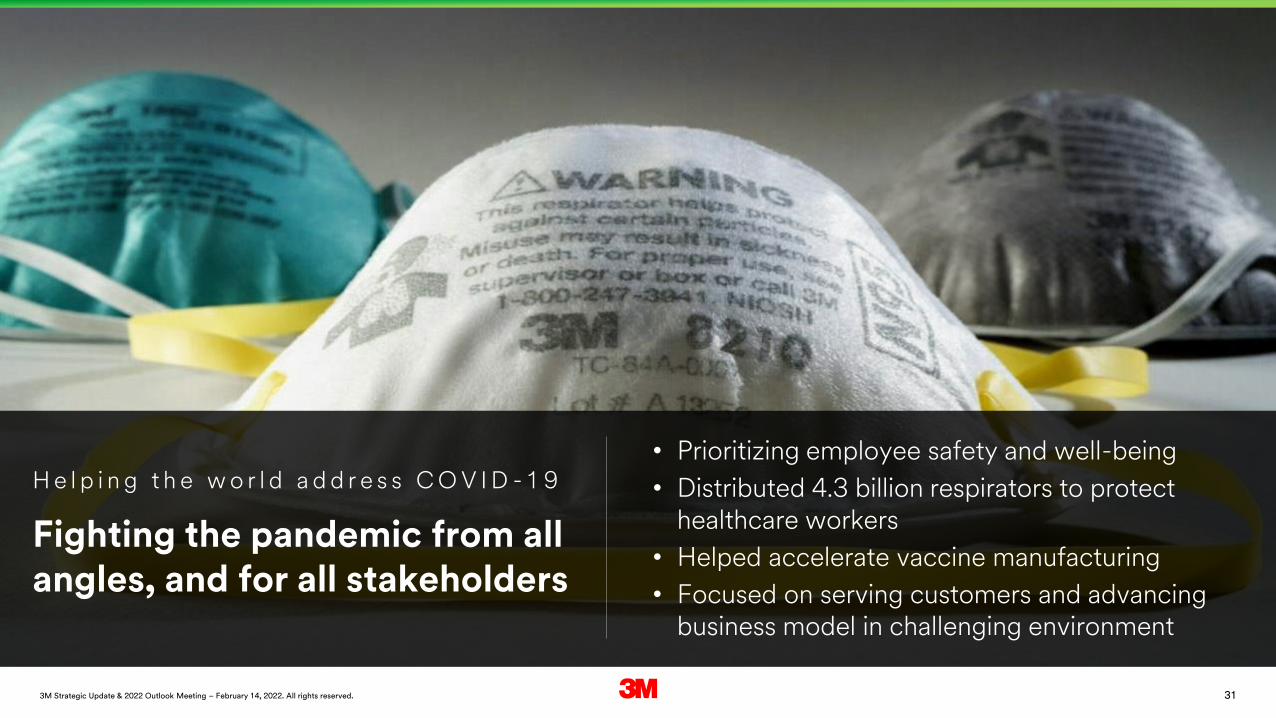
H e l p i n g t h e w o r l d a d d r e s s C O V I D - 1 9
Fighting the pandemic from all angles, and for all stakeholders
• Prioritizing employee safety and well-being
• Distributed 4.3 billion respirators to protect healthcare workers
• Helped accelerate vaccine manufacturing
• Focused on serving customers and advancing business model in challenging environment

323M Strategic Update & 2022 Outlook Meeting – February 14, 2022. All rights reserved.
Our commitments
Growth through innovationGrow above macro
Proactive portfolio managementIncrease value to customers and shareholders
Operational excellenceDeliver on financial commitments
Lead in sustainability as a manufacturerAchieve ESG goals through science

3M Strategic Update & 2022 Outlook Meeting
Research & DevelopmentJohn Banovetz, Chief Technology Officer & Environmental Stewardship

343M Strategic Update & 2022 Outlook Meeting – February 14, 2022. All rights reserved.
Research & Development
R & D
A p p l y i n g t e c h n o l o g y t o m e e t c u s t o m e r n e e d s
T h e A p p l i c a t i o n o f S c i e n c e & E n g i n e e r i n g
Technology Development
T h e A p p l i c a t i o n o f T e c h n o l o g y
Product Development
• Technology platforms• Science and engineering capabilities• Corporate Research Lab
• Product platforms• Market trends, customer insights• Product development labs
Integrated innovation model

353M Strategic Update & 2022 Outlook Meeting – February 14, 2022. All rights reserved.
Research & Development
Targeted investment Customer focus Technology for the future
• Flex within and across businesses
• Growth, maintenance and ESG
• R&D spend 5% - 6% of sales
• R&D concentrated close to the customer in the businesses
• Globally connected laboratories
• Future technologies linked to market opportunities
• Broad-based external perspective
Leveraging the power of technology
R&D inves tment
363M Strategic Update & 2022 Outlook Meeting – February 14, 2022. All rights reserved.
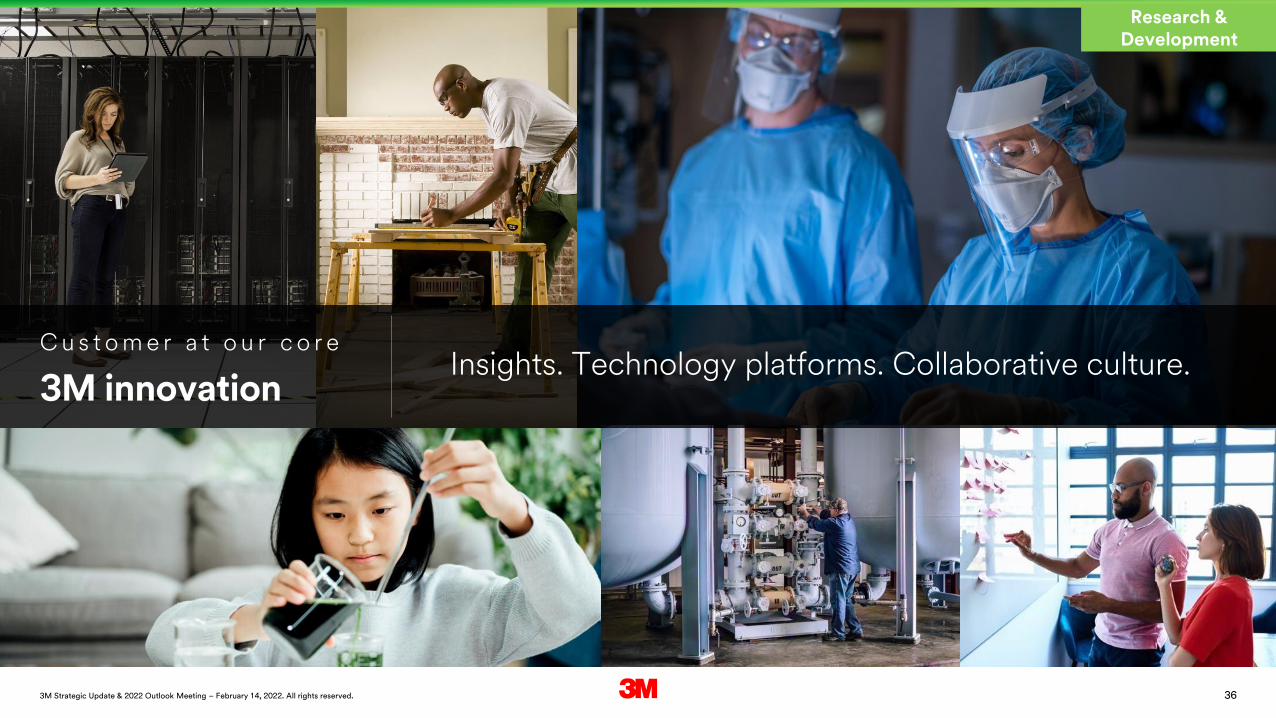
Research & Development
3M innovation
C u s t o m e r a t o u r c o r eInsights. Technology platforms. Collaborative culture.
373M Strategic Update & 2022 Outlook Meeting – February 14, 2022. All rights reserved.
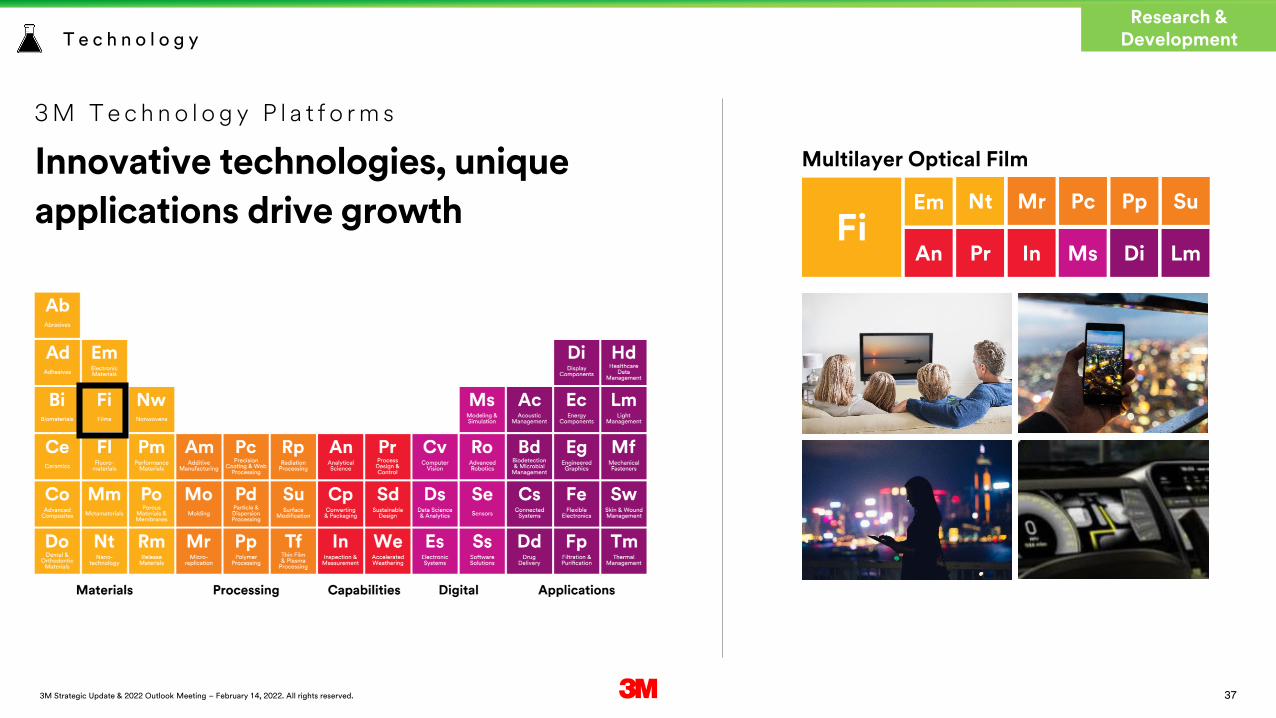
T e c h n o l o g y
3 M T e c h n o l o g y P l a t f o r m s
Innovative technologies, unique
applications drive growth Fi
Research & Development
Mr PcNt
Di LmIn
Em
An Pr
Multilayer Optical Film
Pp Su
Ms

383M Strategic Update & 2022 Outlook Meeting – February 14, 2022. All rights reserved.
Research & Development
Targeting growth above
macro in attractive markets
I n v e s t i n g f o r g r o w t h
Home Improvement$150B market size
Automotive/Mobility$26B market size
Manufacturing$50B market size
Wound Care$20B market size
Healthcare IT$40B market size
Electronic Materials$13B market size

393M Strategic Update & 2022 Outlook Meeting – February 14, 2022. All rights reserved.
Research & Development
Increasing the pace of innovation with our customers
D i g i t a l l y e n a b l e d p r o d u c t s p e c - i n a n d v i r t u a l m a t e r i a l d e v e l o p m e n t
• 3M creates Material Data Card (MDC) for existing or potential product
• Customer creates and tests digital prototypes in their digital twin
• Customer request → manufacturing in as little as three months
403M Strategic Update & 2022 Outlook Meeting – February 14, 2022. All rights reserved.
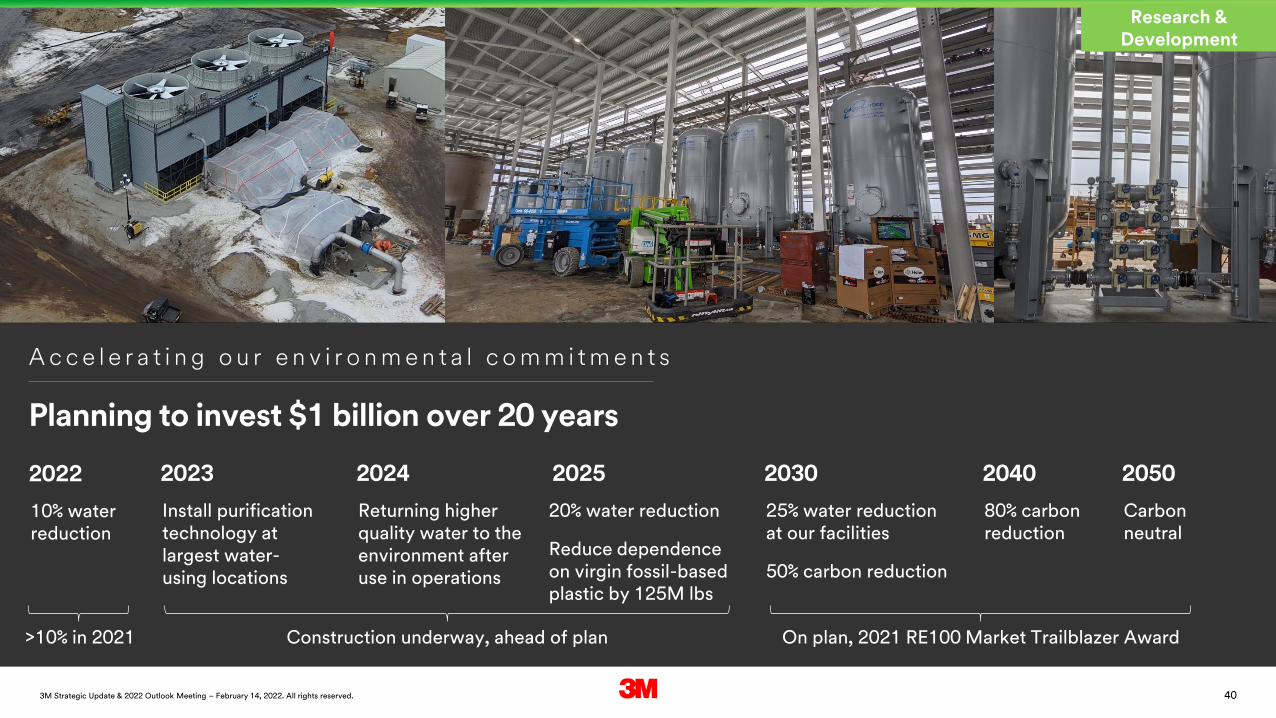
Research & Development
Planning to invest $1 billion over 20 years
A c c e l e r a t i n g o u r e n v i r o n m e n t a l c o m m i t m e n t s
2022
10% water reduction
2023
Install purification technology at largest water-using locations
2024
Returning higher quality water to the environment after use in operations
2025
20% water reduction
Reduce dependence on virgin fossil-based plastic by 125M lbs
2030
25% water reduction at our facilities
50% carbon reduction
2040
80% carbon reduction
2050
Carbon neutral
>10% in 2021 Construction underway, ahead of plan On plan, 2021 RE100 Market Trailblazer Award

413M Strategic Update & 2022 Outlook Meeting – February 14, 2022. All rights reserved.
Research & Development
Sustainability embedded in our products and operations
E n a b l i n g t h e f u t u r e w i t h m a t e r i a l s
• We make chemicals to use in our materials
• We sell products that solve customer needs
• We use a science-based approach rooted in sustainability to guide our choices and actions
• We develop and partner to evaluate and deploy state of the art controls and mitigation
• Global chemical management policy and governance
• Product reformulations and portfolio actions
• Continuous improvement in operations
• Environmental stewardship goals
• Sustainability value commitments in every new product
Product safety compliance and stewardship policyChemicals management policy

423M Strategic Update & 2022 Outlook Meeting – February 14, 2022. All rights reserved.
Research & Development
• Advanced robotics
• Hydrogen economy
• Optical metamaterials
• Additive manufacturing
• Modeling and simulation
• Biological technology
Investing for growth in the future
Advanc ing our i nnovat ion mode l
Optical metamaterials

3M Strategic Update & 2022 Outlook Meeting
Bringing 3M to the hearts and minds of consumers
Jeff Lavers, Consumer Group President

443M Strategic Update & 2022 Outlook Meeting – February 14, 2022. All rights reserved.
Consumer
2021 sales
$5.5BCategory-leading consumer portfolio growing above macro enabled by:
• Strong consumer insight in market segments growing faster than GDP
• Iconic, global and category-defining brands with leading positions
• Leveraging 3M technology, manufacturing strengths and global presence
$5.5BSales
Home Improvement46%
Stationery & Office24%
Consumer Health & Safety11%
Home Care19%
Information reflects Q1 2022 segment reporting changes. See 8-K dated February 11, 2022.

453M Strategic Update & 2022 Outlook Meeting – February 14, 2022. All rights reserved.
Consumer
Our winning formula:
Aligned to:
Growing consumer needs
1
Defined by:
Differentiated 3M technology
2
Strengthened by:
World-class 3M manufacturing
3
Accelerated by:
3M’s global operating model
4
Built for:
e-Commerce and digital
5
Home Improvement$150B market
Consumer safety & well-being$70B market
Package protection & shipping$3B market
Appearance auto care$2B market
Winning in priority consumer markets growing faster than GDP:

463M Strategic Update & 2022 Outlook Meeting – February 14, 2022. All rights reserved.
Consumer
Command™Empowering consumers to personalize their space without doing harm
Global Sales Growth2019-21 CAGR 20%
“Own the wall” platform growth sustained by proven playbook, continuous reinvention and ample runway
Accelerated by
3M’s global operating model
Built for
e-Commerce and digital
Aligned to
Growing consumer needs
Strengthened by
World-class 3M manufacturing
Defined by
Differentiated 3M technology
Holiday
Home
School

473M Strategic Update & 2022 Outlook Meeting – February 14, 2022. All rights reserved.
Consumer
Filtrete™Empowering people to take control of the air they breathe
Global Sales Growth2019-21 CAGR 14%
“Own the air” platform accelerated by increasing air awareness globally along with organic growth investments
Accelerated by
3M’s global operating model
Built for
e-Commerce and digital
Aligned to
Growing consumer needs
Strengthened by
World-class 3M manufacturing
Defined by
Differentiated 3M technology
Allergies and Asthma
Global Pandemic
Healthier Homes
Environmental Triggers

483M Strategic Update & 2022 Outlook Meeting – February 14, 2022. All rights reserved.
Consumer
Essential elements to drive our business
Consumer-first mindset
• Insights-driven innovation and platform expansion
• Household penetration
• Prioritizing online growth and digital-based demand generation
Advancing sustainability
• Build sustainable platforms in package protection, household cleaning, air quality and more
• Reduce dependence on virgin fossil plastic by 125 million pounds by 2025
• Move toward 100% recyclable or reusable packaging

49
Consumer
Organic sales growth
Low to mid-single digit
3M Strategic Update & 2022 Outlook Meeting – February 14, 2022. All rights reserved.
Achieving above-market growth
• Strengthening our position in attractive consumer markets
• Prioritize investments and resources into our top brands and platforms
Winning with our retail partners and consumers
• Elevate service and key account category management capabilities
• Exceed consumer expectations by delivering superior innovation, sustainability and brand experiences
Focusing on profitability and scale
• Leverage sales growth and drive portfolio prioritization
• Accelerate investments to increase both capacity and automation
Delivering on 2022 commitments

50
3M Strategic Update & 2022 Outlook Meeting
Enabling better, smarter, safer healthcareMojdeh Poul, Health Care Group President

513M Strategic Update & 2022 Outlook Meeting – February 14, 2022. All rights reserved.
Health Care
2021 sales
$8.6BAdvancing healthcare delivery, quality, and outcomes
• Trusted brands and proven category leadership
• Breadth and depth of technology platforms
• Global clinical and education expertise
$8.6BSales
Health Information Systems14%
Medical Solutions54%
Oral Care17%
Separation & Purification Sciences11%
Food Safety4%
Information reflects Q1 2022 segment reporting changes. See 8-K dated February 11, 2022.
523M Strategic Update & 2022 Outlook Meeting – February 14, 2022. All rights reserved.
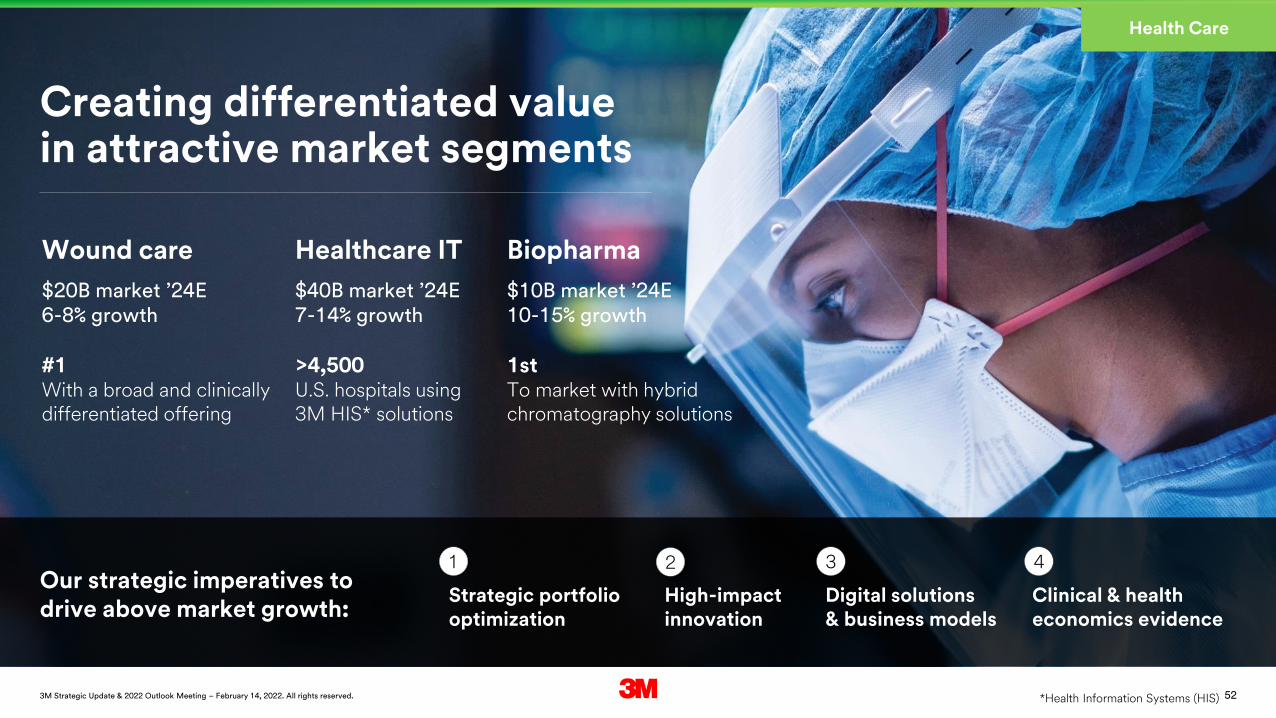
Health Care
Creating differentiated value in attractive market segments
Wound care
$20B market ’24E6-8% growth
#1With a broad and clinically differentiated offering
Healthcare IT
$40B market ’24E7-14% growth
>4,500U.S. hospitals using 3M HIS* solutions
Biopharma
$10B market ’24E10-15% growth
1stTo market with hybrid chromatography solutions
Our strategic imperatives to drive above market growth:
Strategic portfoliooptimization
High-impact innovation
Digital solutions & business models
Clinical & health economics evidence
1 2 3 4
*Health Information Systems (HIS)

533M Strategic Update & 2022 Outlook Meeting – February 14, 2022. All rights reserved.
Health Care
Creating sustainable long-term growthBy optimizing our portfolio through organic growth acceleration, acquisitions and divestitures
1Strategic portfolio optimization
Organic Growth Acceleration
Deploy capital and resources to priority portfolios
Acquisitions: Acelity and M*Modal
Reposition portfolio towards on-trend growth segments
Divestitures: Drug Delivery Systems and Food Safety
Create value for customers, shareholders, and employees
543M Strategic Update & 2022 Outlook Meeting – February 14, 2022. All rights reserved.
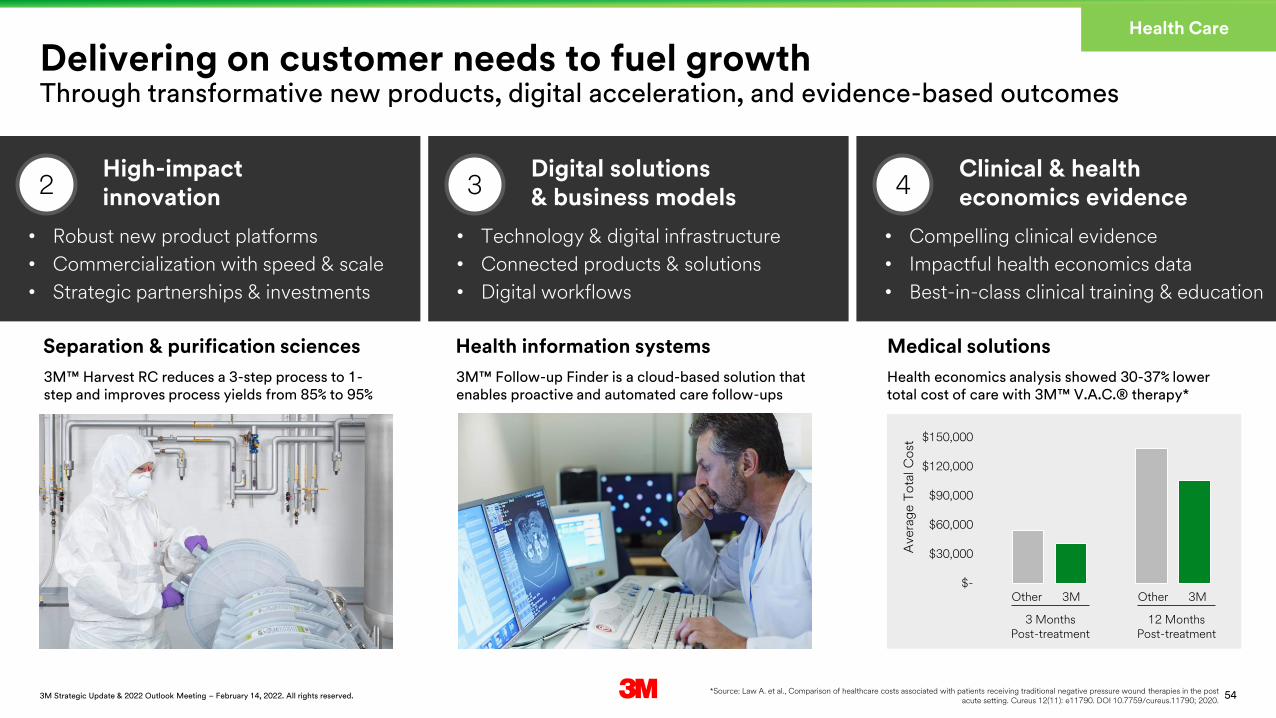
$-
$30,000
$60,000
$90,000
$120,000
$150,000
Ave
rag
e T
ota
l Co
st
3 MonthsPost-treatment
12 MonthsPost-treatment
Health Care
Delivering on customer needs to fuel growthThrough transformative new products, digital acceleration, and evidence-based outcomes
*Source: Law A. et al., Comparison of healthcare costs associated with patients receiving traditional negative pressure wound therapies in the post acute setting. Cureus 12(11): e11790. DOI 10.7759/cureus.11790; 2020.
• Robust new product platforms
• Commercialization with speed & scale
• Strategic partnerships & investments
• Technology & digital infrastructure
• Connected products & solutions
• Digital workflows
• Compelling clinical evidence
• Impactful health economics data
• Best-in-class clinical training & education
Separation & purification sciences
3M™ Harvest RC reduces a 3-step process to 1-step and improves process yields from 85% to 95%
Health information systems
3M™ Follow-up Finder is a cloud-based solution that enables proactive and automated care follow-ups
Medical solutions
Health economics analysis showed 30-37% lower total cost of care with 3M™ V.A.C.® therapy*
2High-impact innovation 3
Digital solutions & business models 4
Clinical & health economics evidence
Other 3M Other 3M

553M Strategic Update & 2022 Outlook Meeting – February 14, 2022. All rights reserved.
Health Care
Building an industry-leading wound care businessTreating more than 10 million wounds globally
Retrospective study in WOUNDS* Prevena™ Therapy PROMISES RCT**
143%Increase in patient adherence(Hours of use per day)
*Source: KCI, National iOn PROGRESS Remote Therapy Monitoring Dashboard, Datameer/RTM_Final_TDE_Tableau, (May 2019-April 2020)**Randomized controlled trial. Griffin, L, Am J of Manag Care, in press; Higuera, C, et al. Journal of Arthroplasty 2021
iOn PROGRESS™ Remote Therapy Monitoring is a first to market system 3M™ Prevena™ therapy reduces risk of surgical site complications
25%Lower cost of wound care
4xLess likely to have a complication with 3M™ Prevena™ therapy
3xLess likely to be readmitted with 3M™ Prevena™ therapy
Brand3M™ Cavilon™
Prevent
Brand3M™ Kerracel™
Prepare
Brand3M™ Tegaderm™
Protect
Brand3M™ V.A.C.®
Activate
Brand3M™ Prevena™
Close

56
Unwavering commitment to our customers
• Deliver unparalleled end-to-end customer experience
• Develop clinical and economic evidence to support improved outcomes
• Partner to advance health equity in our communities
Market-leading growth and innovation
• Deploy capital to high growth opportunities
• Intensify investment in digital, data analytics, and commercial capabilities
• Drive penetration in prioritized geographies
Focus on profitability
• Drive portfolio mix optimization
• Execute continuous improvement initiatives
• Leverage technology to transform business models
Health Care
Organic sales growth
Mid-single digit
Delivering on 2022 commitments
3M Strategic Update & 2022 Outlook Meeting – February 14, 2022. All rights reserved.

57
3M Strategic Update & 2022 Outlook Meeting
Transforming how work gets doneMichael G. Vale, Ph.D. | Safety & Industrial Group President
583M Strategic Update & 2022 Outlook Meeting – February 14, 2022. All rights reserved.
Safety & Industrial
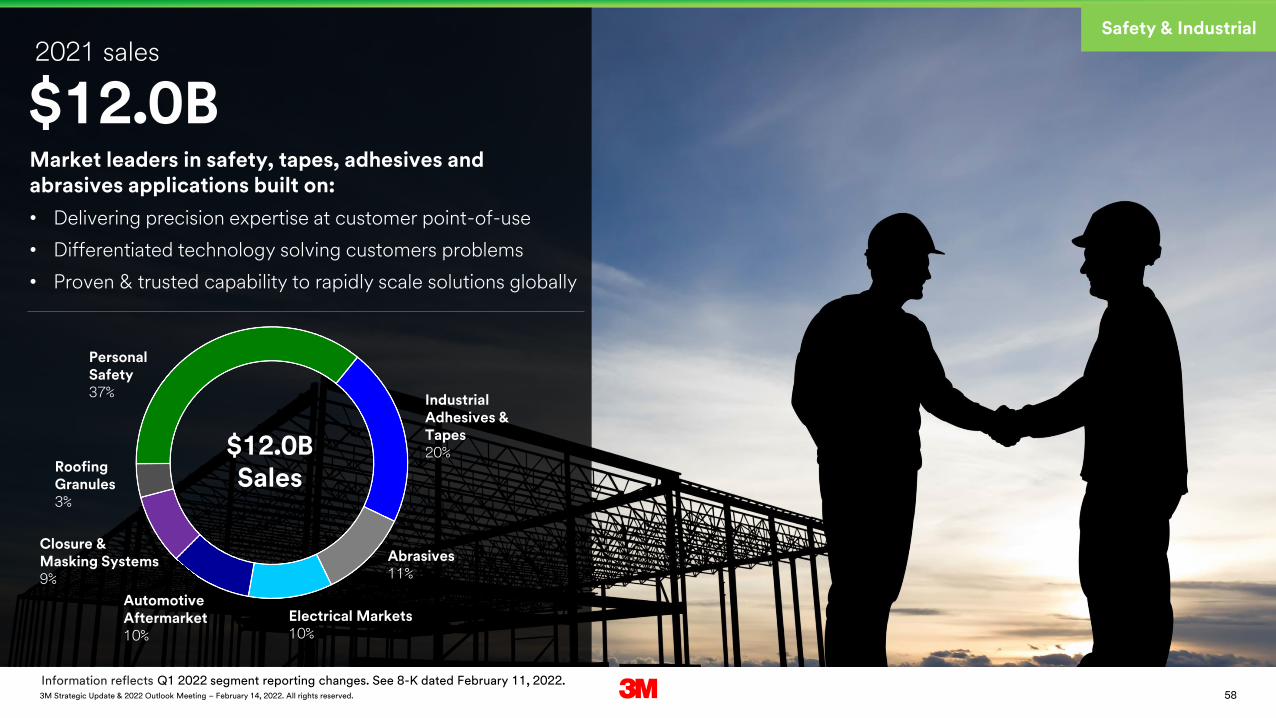
2021 sales
$12.0B
Automotive Aftermarket10%
Closure & Masking Systems9%
Industrial Adhesives & Tapes20%
Abrasives11%
Roofing Granules3%
Personal Safety37%
$12.0BSales
Electrical Markets10%
Market leaders in safety, tapes, adhesives and abrasives applications built on:
• Delivering precision expertise at customer point-of-use
• Differentiated technology solving customers problems
• Proven & trusted capability to rapidly scale solutions globally
Information reflects Q1 2022 segment reporting changes. See 8-K dated February 11, 2022.

593M Strategic Update & 2022 Outlook Meeting – February 14, 2022. All rights reserved.
Safety & Industrial
Driving the 3M strategic imperatives to lead within our markets
Global IPI 3.5% (2021-2024 CAGR)
Investing to create and drive innovation to commercial scale
1
Continuously optimizing our diverse Portfolio
2
Transforming our businesses at the speed of our markets and customers
3
Advancing the power of our people and strengthening the overall culture
4
Leading in the industrial foundation of the global economy
Manufacturing
$50B market ‘24E3-5% growth rate
• General Industrial• Utilities and Power generation• Metals and Metal Fabrication• Auto & Transportation
Construction
$10B market ‘24E2-5% growth rate
• Non-residential• Residential
Specific Markets
$15B market ‘24E3-5% growth rate
• Vehicle Maintenance• Public Safety
603M Strategic Update & 2022 Outlook Meeting – February 14, 2022. All rights reserved.
Safety & Industrial
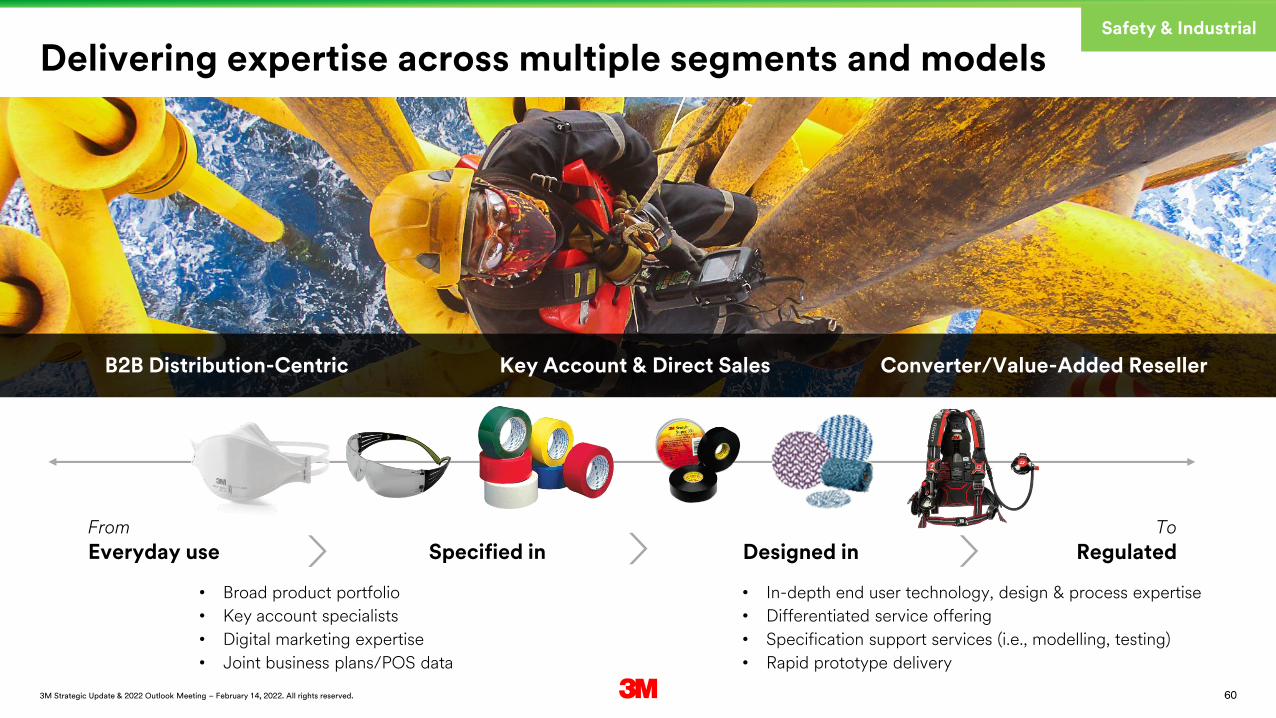
Delivering expertise across multiple segments and models
B2B Distribution-Centric Key Account & Direct Sales Converter/Value-Added Reseller
Everyday use Specified in Designed in Regulated
• In-depth end user technology, design & process expertise
• Differentiated service offering
• Specification support services (i.e., modelling, testing)
• Rapid prototype delivery
• Broad product portfolio
• Key account specialists
• Digital marketing expertise
• Joint business plans/POS data
From To

613M Strategic Update & 2022 Outlook Meeting – February 14, 2022. All rights reserved.
Safety & Industrial
Win in the coreContinuously rejuvenate portfolios for share gain & penetration
Segments growing at ~3%
Build the futureNew platforms centered on large future growth areas
Segments growing at 10%+
Sustainability platforms
• Low / Zero VOC Tapes• Liquid paint efficiency • Curbside Recyclable Packaging• Smog-reducing Granules
Advancing leading platforms
• Next Gen SCBA• Fall Protection• Low-cure Stress Adhesives• Paint Application System• Mesh Abrasives & Dust Extractors
Digital platforms
• Robotics & Automation• Automated Dispensing• Connected Bodyshop• Grid Modernization
Emerging segments
• EV Thermal & Bonding• Wearable e-Bonding• E-commerce• Fulfillment solutions
Differentiated technology that solves critical customer problems

623M Strategic Update & 2022 Outlook Meeting – February 14, 2022. All rights reserved.
Safety & Industrial
Commercializing digital platformsIntegrating data capture and analytics with material product platforms
Connected Bodyshop Grid Modernization Robotics & Automation
Building end-to-end connectivity to improve shop productivity & profitability
Integrating real-time sensing capability to improve grid health and evolution
Material removal solutions integrating abrasives, hardware and software
• Inventory management
• Material auto replenishment
• Claims & Compliance integration
• Robust and locatable connections
• Fault response and prevention
• Renewable technology expansion
• Labor productivity & flexibility
• Increased workplace safety
• Repeatable, high-quality results

63
Safety & Industrial
Organic sales growth
Flat to low-single digit
Delivering on 2022 commitments
3M Strategic Update & 2022 Outlook Meeting – February 14, 2022. All rights reserved.
Driving growth at the macro
• Increasing impact of new products in priority segments
• Shifting customer demand through expertise delivery
• Managing respirator demand changes
Expanding profitability
• Accelerating the high margin core of the portfolio
• Continued price execution in dynamic conditions
• Lean Six Sigma focus on plant productivity and yield
Continuing to focus on future growth platforms
• Disciplined focus on portfolio management and capital allocation
• Increase investment into acceleration trends in our key markets
• Advancing the organization – diverse, digital & global


65
Transportation & Electronics
3M Strategic Update & 2022 Outlook Meeting – February 14, 2022. All rights reserved.
Information reflects Q1 2022 segment reporting changes. See 8-K dated February 11, 2022.

66
Transportation & Electronics
3M Strategic Update & 2022 Outlook Meeting – February 14, 2022. All rights reserved. Addressable market sizes based on 3M estimates for 2022; growth rates for 2020-25 shown

67
Expanding our addressable market in automotiveTransportation & Electronics
3M Strategic Update & 2022 Outlook Meeting – February 14, 2022. All rights reserved. Addressable market sizes based on 3M estimates for 2022; growth rates for 2020-25 shown

68
Building new growth platforms in automotiveTransportation & Electronics
3M Strategic Update & 2022 Outlook Meeting – February 14, 2022. All rights reserved.

69
Creating differentiated solutions in large markets
3M Strategic Update & 2022 Outlook Meeting – February 14, 2022. All rights reserved.
Transportation & Electronics
70
Transportation & Electronics
3M Strategic Update & 2022 Outlook Meeting – February 14, 2022. All rights reserved.
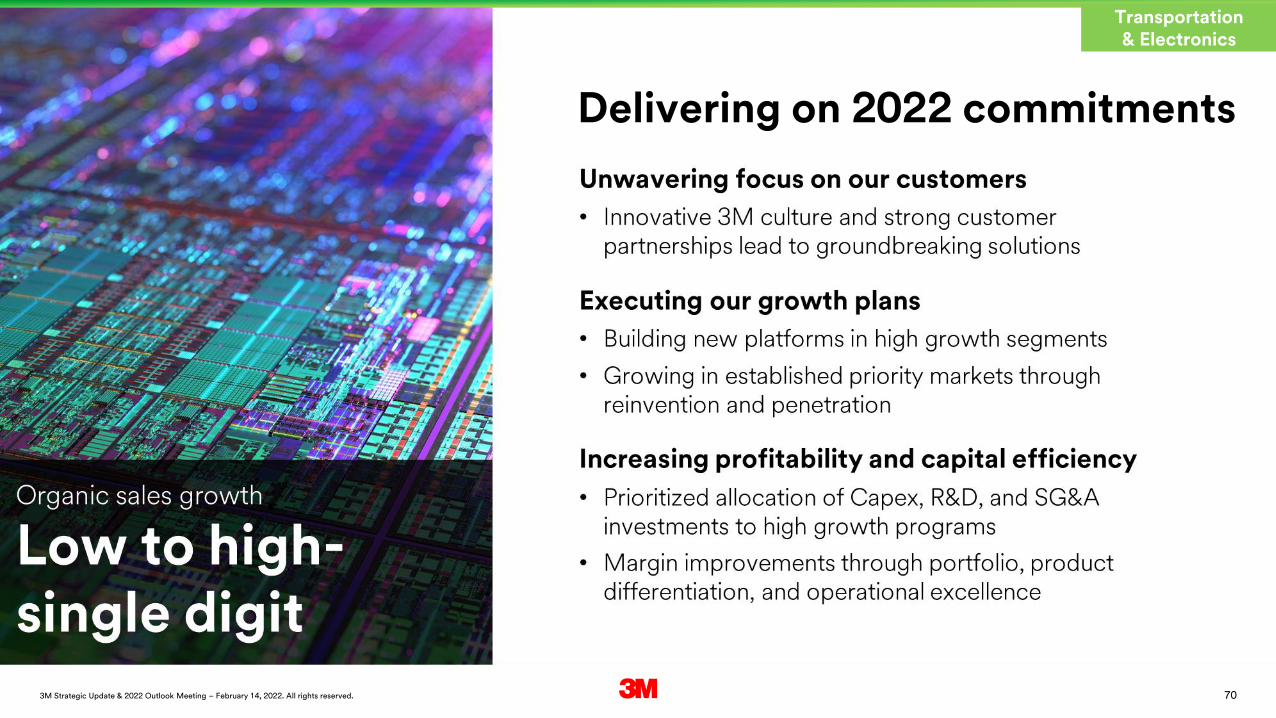
Delivering on 2022 commitments

71
3M Strategic Update & 2022 Outlook Meeting
Finance & TransformationMonish Patolawala | Executive Vice President, Chief Financial & Transformation Officer

723M Strategic Update & 2022 Outlook Meeting – February 14, 2022. All rights reserved.
Overview
• Growth above macro
• Margin expansion
• Strong cash flows
Performance principles Capital allocation Digital thread
Drive profitable growth
• Portfolio management
• Investing in growth, productivity and sustainability
• Shareholder returns
Prioritizegrowth
• Customer
• Products
• Ops + enterprise
Powered by data & data analytics
Operating principles:
Dailymanagement
Data democratization
Transparency Accountability
3M operating framework:
1
2
3
4
5
6
7

733M Strategic Update & 2022 Outlook Meeting – February 14, 2022. All rights reserved.
Performance Principles
Driving operating performance through daily management, powered by data & data analytics
Objective Metric Q1 Q2 Q3 Q4 CY
Objective#1
Metric#1
PY X% X% X% X% X%
Est. X% X% X% X% X%
Act. X% X% X% X% X%
Objective#2
Metric#2
PY $X $X $X $X $X
Est. $X $X $X $X $X
Act. $X $X $X $X $X
Objective#3
Metric#3
PY $X $X $X $X $X
Est. $X $X $X $X $X
Act. $X $X $X $X $X
Objective#4
Metric#4
PY X% X% X% X% X%
Est. X% X% X% X% X%
Act. X% X% X% X% X%
Objective#5
Metric#5
PY X% X% X% X% X%
Est. X% X% X% X% X%
Act. X% X% X% X% X%
• Track performance of all objectives and metrics focused on 10 key metrics:
• Safety
• Customer experience, fulfillment
• Revenue growth
• Productivity
• Operating income
• Working capital efficiency
• Capex
• Accelerating impact on ESG
• Free cash flow
• Reviewed systematically and often: Daily, weekly, monthly and quarterly with data-driven operating mechanisms
• Embrace “reds” to focus on root cause analysis and drive improvement

743M Strategic Update & 2022 Outlook Meeting – February 14, 2022. All rights reserved.
Performance Principles
Objective Metric Q1 Q2 Q3 Q4
Execute pricing actions to offset raw material and logistics headwinds
Net Price / raw material and logistics
$ Impact
2020 + + + +
2021E flat flat flat flat
2021 Act. - - - +
Leveraging daily management to accelerate price in 2021 to offset significant raw material and logistics inflation
• Identified trends in early 2021 signaling significant raw material and logistics headwinds
• Recognized that planned price would not offset raw material and logistics headwinds
• Executed pricing actions across all Business Groups
• Drove actions in Sourcing to minimize raw material and logistics risks (e.g., dual sourcing efforts and claw back actions for commodity feedstocks)
• Delivered positive net price / raw material and logistics in Q4 2021
Driving team engagement to enhance governance and operating rhythm enhancement:
• Business Group led to drive consistency across products and regions
• Establishing pricing control towers in each Business Group to improve governance
• Reducing cycle time to implement price changes
• Improving global alignment & standardized timing of price actions
Enhancing reporting tools, data & workflow to improve:
• Modeling of price realization
• Reporting on price changes & deviated pricing
• Elasticity analysis
• Visibility & modeling of inflationary pressures

753M Strategic Update & 2022 Outlook Meeting – February 14, 2022. All rights reserved.
Performance Principles
Driving profitable growth
Growth above macro
Protect the core and invest in the future
• Providing customer solutions• Investing in key market trends• Investing in key growth portfolios• Differentiated investing by business based on “right to win”
• Volume• Factory yield and efficiency• Strategic sourcing• Lean operations: nimble and agile structure• Prioritized funding despite legal headwinds• Proactive restructuring
Margin expansion
Operating leverage powered by data & data analytics
Strong cash flows
Strong balance sheet
• Proactive inventory management• Demand planning; “pull” vs. “push”• Daily focus on collections; billing efficiency• Terms expansion with vendors
1
2
3

763M Strategic Update & 2022 Outlook Meeting – February 14, 2022. All rights reserved.
Performance Principles
Performance Principles
1G r o w t h a b o v e m a c r o
Creating differentiated value in attractive segments with market growth ranging from GDP+ to mid-teens
Safety & Industrial• Personal safety• Connected bodyshop• Grid modernization• Robotics and automation
Transportation & Electronics• Automotive/mobility• Electronic materials• Semiconductor• Graphic and architectural films
Health Care• Wound care• Healthcare IT• Biopharma filtration
Consumer• Home improvement• Consumer safety & well-being• Package protection & shipping• Appearance auto care

773M Strategic Update & 2022 Outlook Meeting – February 14, 2022. All rights reserved.
Performance Principles
Add
Add
Less
Less
2M a r g i n e x p a n s i o n
Targeting 30% to 40% operating leverage
Operating leverage
Volume
Factory efficiency/strategic sourcing
Lean operations (SG&A)
Investing in growth, productivity & sustainability
Legal/other headwinds

78
Accelerating growth in graphics through portfolio optimization
Performance Principles
Difficulties meeting demand in vehicle personalization & commercial fleet due to pandemic-related logistics & supply chain constraints
Challenge
Results
↑~20%Top-line growth
↓~10%SKUs reduced
↑~20%Car wrap output
Simplifying value streams for Consumer product displays
~$20M ↓~50% ↑~40%Gross margin benefit Reduced portfolio
complexityFaster display
delivery
Over ~95% of Consumer product displays at key accounts were customized, resulting in long & complex value streams
Challenge
Results
↑~10%Yield & productivity Reduction in
set-up time
↓~30%
3M Strategic Update & 2022 Outlook Meeting – February 14, 2022. All rights reserved.
• Optimized Graphics portfolio and improved long-term supply chain health in Nevada, MO site (primary source of supply)
• Leveraged Integrated Business Planning (IBP)
• Qualified dual/alternate material sources
• Discontinued low performing SKUs
• Drove faster production wheel through prioritization & continuous improvement
Solution
• Mapped current state of value stream to identify improvements
• Drove standardization to reduce customization while still meeting key account requirements
• Utilized common system for consistency and to drive increased governance across divisions
• Implemented workflow automation
• Significantly streamlined set-ups
Solution
2M a r g i n e x p a n s i o n
Improving margins via portfolio & value stream simplification
793M Strategic Update & 2022 Outlook Meeting – February 14, 2022. All rights reserved.
Performance Principles
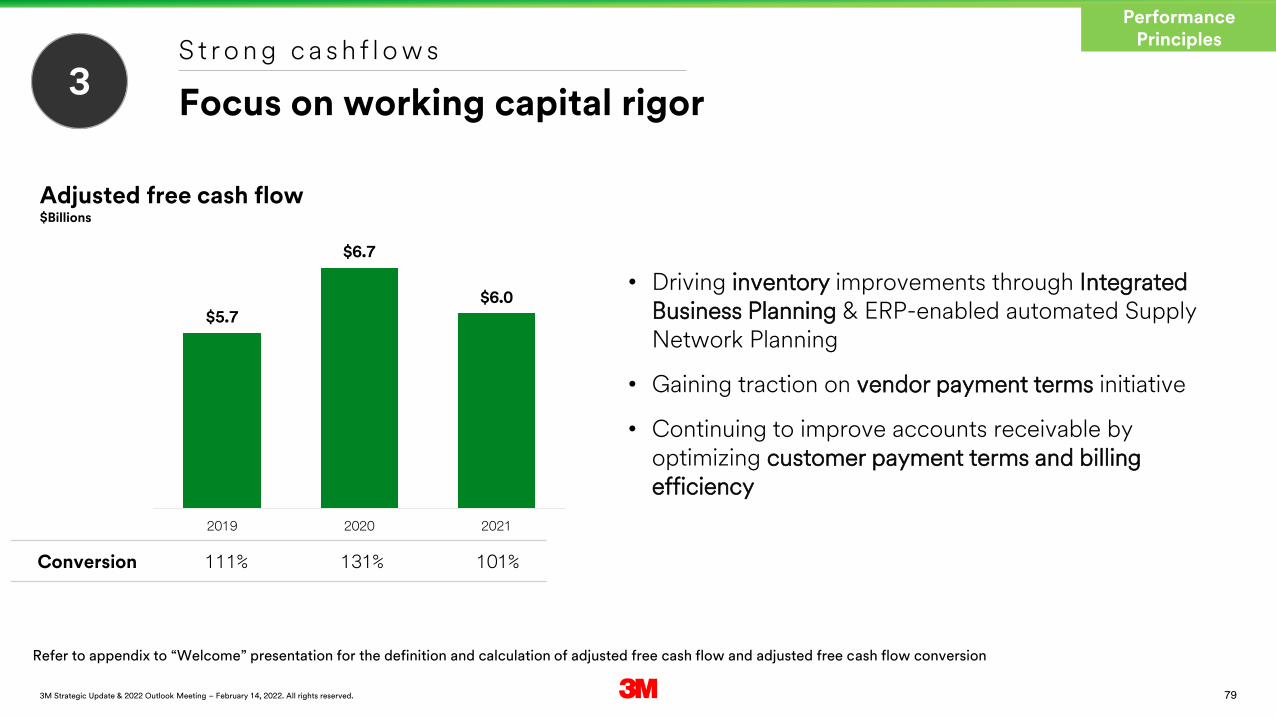
• Driving inventory improvements through IntegratedBusiness Planning & ERP-enabled automated Supply Network Planning
• Gaining traction on vendor payment terms initiative
• Continuing to improve accounts receivable by optimizing customer payment terms and billing efficiency
Adjusted free cash flow$Billions
3S t r o n g c a s h f l o w s
Focus on working capital rigor
$5.7
$6.7
$6.0
2019 2020 2021
Conversion 111% 131% 101%
Refer to appendix to “Welcome” presentation for the definition and calculation of adjusted free cash flow and adjusted free cash flow conversion

803M Strategic Update & 2022 Outlook Meeting – February 14, 2022. All rights reserved.
Performance Principles
Strong balance sheet is a strategic asset
$17.8
$13.7 $12.6
2019 2020 2021
Net debt$Billions
Refer to appendix to “Welcome” presentation for the definition and calculation of net debt
• Net debt reduction driven by strong cash flow
• Proactive early debt redemption
• Reliable market access and lower borrowing costs through economic cycles
• Staggered debt maturity schedule with no significant liquidity call on capital in any year
• Maintaining strong capital structure while preserving capital allocation flexibility

813M Strategic Update & 2022 Outlook Meeting – February 14, 2022. All rights reserved.
Capital Allocation
Balanced capital allocation plan
Uses of cashSources of cash
Cash flow from operations(Excl. R&D investment)
~$9B to $10B
Cash and marketable securities at YE 2021
~$5B
Total~$14B to $15B
+
=
Highest priorityR&D
5% to 6% of sales
+Capex
$1.7B to $2.0B
M&AAttractive targets that
leverage 3M’s strengths
Dividends~$3.4B for 2022
Share repurchases
Organic growth
823M Strategic Update & 2022 Outlook Meeting – February 14, 2022. All rights reserved.
Capital Allocation
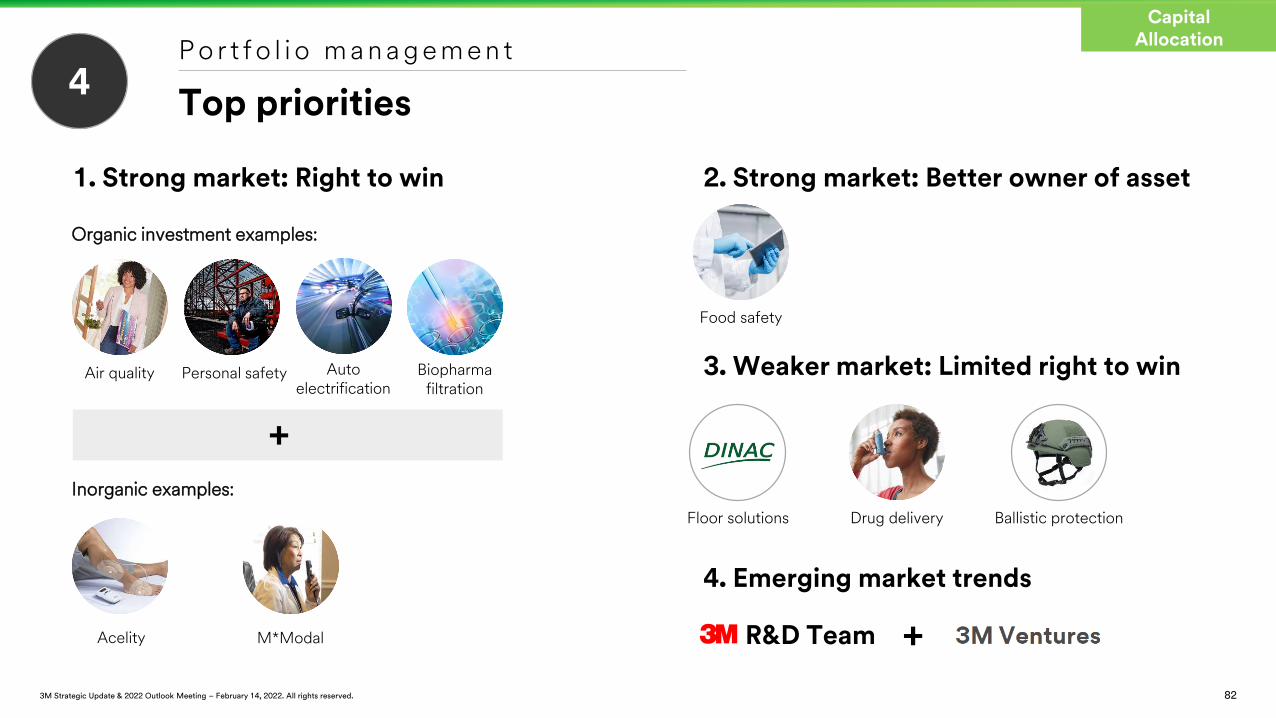
1. Strong market: Right to win 2. Strong market: Better owner of asset
Air quality Personal safety Biopharma filtration
Auto electrification
Organic investment examples:
Inorganic examples:
Acelity M*Modal
+
Food safety
3. Weaker market: Limited right to win
Floor solutions Drug delivery Ballistic protection
4. Emerging market trends
R&D Team +
4P o r t f o l i o m a n a g e m e n t
Top priorities

833M Strategic Update & 2022 Outlook Meeting – February 14, 2022. All rights reserved.
Capital Allocation
5I n v e s t i n g i n g r o w t h , p r o d u c t i v i t y a n d s u s t a i n a b i l i t y
Prioritizing deployment to drive growth
Deployment propertiesOrganic investments
~$4B 2022 Capex/R&D Market trends
• Investing in key market trends: Biopharma Filtration, Auto Electrification, Semiconductor, Wound Care, Home Improvement, and more
ESG
• Delivering on ESG commitments and focusing on customer sustainability goals and infrastructure needs
• Investing $1 billion over 20 years to accelerate air and water stewardship
Digital
• Deployment of disruptive technologies and digitizing supply chain for improved insights and performance
• Enterprise Resource Planning deployment expected completion by end of 2024
Growth
Sustainability
Renewal

843M Strategic Update & 2022 Outlook Meeting – February 14, 2022. All rights reserved.
Capital Allocation
Growth capital ESG investments Renewal capital
Prioritizing investments in key growth vectors across all Business Groups
Advancing water stewardship, carbon emission goals and EHS compliance
Funding prioritized manufacturing process and infrastructure needs
Increasing converting capacity for Zeta PlusTM
Encapsulated Filter Capsules in biopharma filtration at the Columbia (MO) site to increase throughput 2X in order to meet anticipated double-digit demand increases
Investing in projects to reduce water usage, install purification technology at largest water-using locations and return higher quality water to the environment after usage
Renew and upgrade equipment supporting CobanTM medical products in Brookings (SD) site to increase capacity and automate packaging
Organic capital allocation5

853M Strategic Update & 2022 Outlook Meeting – February 14, 2022. All rights reserved.
Capital Allocation
$3.3 $3.4 $3.4
$1.4
$0.4
$2.2
2019 2020 2021
$4.7
$3.8
$5.6$Billions
6S h a r e h o l d e r r e t u r n s
Returned ~$14B to shareholders since 2019

863M Strategic Update & 2022 Outlook Meeting – February 14, 2022. All rights reserved.
Digital Thread
3M digital transformation strategic pillars
Growing our presence globally in digital marketplaces.
Strengthening our connection to customers with digitally enabled content and a pathway to purchase.
Transforming our enterprise in the cloud to horizontally connect the organization, driving new insights and opportunities in both front and back-office processes.
Continuing to invest in next generation cybersecuritycapabilities to protect our company and assets.
Integrating digital technologies into our products and services to create new solutions, platforms and offerings.
Leveraging digital science withour world class material science to address the world’s greatest challenges.
Driving improved yields, efficiency, and quality through connected factories, analytics and machine learning.
Continued automation and optimization of our supply chain through robotic automation and analytics.
Digital Customer Digital Product Digital Operations Digital Enterprise
Powered by data & analytics
7

873M Strategic Update & 2022 Outlook Meeting – February 14, 2022. All rights reserved.
DigitalThread
Digital at 3M
Oral Care reimagined Connected manufacturingOmnichannel commerce
Challenge: Deliver a seamless, integrated experience for our customers online and in person
Challenge: Improve the complicated, manual composite restoration process and improve patient experiences
Challenge: Customer demand for N95 Respirator production required transformational efficiency gains to support front-line healthcare worker requirements
Solution: Accelerate digital commerce growth 20%while lowering cost to serve 60% through expanded digital content, automation and integration providing accurate, real-time product info, price and availability
Solution: 3M FiltekTM Matrix is a first to market custom 3-step digital workflow and restorative solution for the dentist to perform composite restorations. 3M FiltekTM Matrix brings together our leading material science with digital science to transform patient smiles
Solution: Deployed a digital twin of the respirator production line enabling a 15% increase in production
7

883M Strategic Update & 2022 Outlook Meeting – February 14, 2022. All rights reserved.
Outlook
2022 outlook

893M Strategic Update & 2022 Outlook Meeting – February 14, 2022. All rights reserved.
Outlook
Macro backdrop
Near-term Longer-term
Strong macro environment
Supply chain constraints
Semiconductor shortage
Raw materials & logistics pressure
Declining COVID impacts
Supply chain improvement
Channel inventory normalization
Increased attention to ESG
Strong end-markets

903M Strategic Update & 2022 Outlook Meeting – February 14, 2022. All rights reserved.
Outlook
O r g a n i c g r o w t h o u t l o o k b y B u s i n e s s G r o u p
Total company organic sales growth outlook of 2% to 5%; includes ~(2%) impact from disposable respirator decline
Safety & IndustrialFlat to low-single digit organic growth
ConsumerLow to mid-single digit organic growth
Transportation & ElectronicsLow to high-single digit organic growth
Health CareMid-single digit organic growth
Organic sales growth contributors:
• Targeting growth above macro despite fluid and uneven external macro environment
• Most key end-markets projected to be strong
• Accelerating decline in disposable respirator demand impacting overall company organic growth by ~(2%)
• Continued strong semiconductor demand, however, supply chain constraints persist; industry forecast: auto HSD; electronics MSD
• Healthcare elective procedure volumes to pre-pandemic levels by Q4 2022; oral care procedures near pre-pandemic levels
• Continued strength in home improvement; improving office and stationery demand

913M Strategic Update & 2022 Outlook Meeting – February 14, 2022. All rights reserved.
Outlook
2022 planning estimates
Strategic messages:• Continue to drive sequential improvement in operating performance throughout 2022
• End-markets expected to be strong; improving healthcare elective procedure volumes, and growth in automotive and electronics as semiconductor chips supply progresses
• Global supply chain challenges expected to remain at least through 1H 2022
• Selling price expected to offset raw material/logistics inflation
• Driving operating leverage of ~30% through daily management and operating rigor while investing in growth, productivity and sustainability and offsetting legal-related matters
• Strong free cash flow conversion as we continue progress on driving working capital conversion intensity, partially offset by higher capex, U.S. taxes due to legislative change requiring capitalization of R&D expenses and higher cash compensation
• Maintaining strong capital structure and financial flexibility
Note: Above guidance does not reflect the impact of pending divestiture of Food Safety business via Reverse Morris Trust (RMT) transaction with NEOGENRefer to appendix to “Welcome” presentation for the definition and calculation of free cash flow conversion
Organic sales growth2% to 5%
Earnings per share$10.15 to $10.65
Free cash flow conversion90% to 100%
Key assumptions:
• IPI & GDP: ~4%; expecting continued strong end-market demand trends
• Forecasted decline in COVID-related respirator demand impacting organic sales by ~(2%), margins by ~(70) bps and EPS by ~($0.45)
• FX impact on reported sales: ~(1%) headwind
• Raw material/logistics: estimated headwind of $350M to $450M year-on-year
• Non-op: neutral (pension/OPEB headwind offset by lower net interest)
• Tax rate: 18.5% to 19.5%
• Capex: $1.7B to $2.0B
923M Strategic Update & 2022 Outlook Meeting – February 14, 2022. All rights reserved.
Outlook
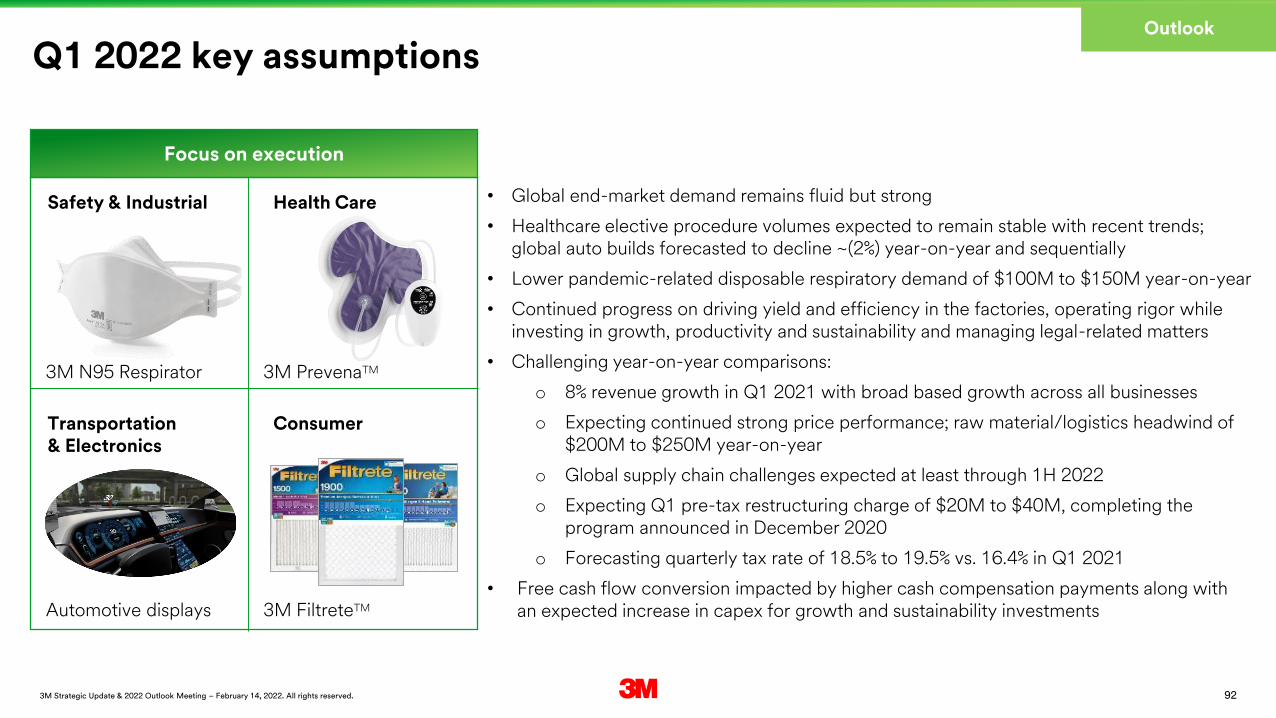
Q1 2022 key assumptions
Focus on execution
• Global end-market demand remains fluid but strong
• Healthcare elective procedure volumes expected to remain stable with recent trends; global auto builds forecasted to decline ~(2%) year-on-year and sequentially
• Lower pandemic-related disposable respiratory demand of $100M to $150M year-on-year
• Continued progress on driving yield and efficiency in the factories, operating rigor while investing in growth, productivity and sustainability and managing legal-related matters
• Challenging year-on-year comparisons:
o 8% revenue growth in Q1 2021 with broad based growth across all businesses
o Expecting continued strong price performance; raw material/logistics headwind of $200M to $250M year-on-year
o Global supply chain challenges expected at least through 1H 2022
o Expecting Q1 pre-tax restructuring charge of $20M to $40M, completing the program announced in December 2020
o Forecasting quarterly tax rate of 18.5% to 19.5% vs. 16.4% in Q1 2021
• Free cash flow conversion impacted by higher cash compensation payments along with an expected increase in capex for growth and sustainability investments
Safety & Industrial
Transportation & Electronics
Consumer
Health Care
3M N95 Respirator
Automotive displays
3M PrevenaTM
3M FiltreteTM

933M Strategic Update & 2022 Outlook Meeting – February 14, 2022. All rights reserved.
Summary
• Growing faster than the markets and economies we serve
• Expanding margins and EPS through operating rigor, productivity, and price
• Delivering robust cash flow through supply chain recovery and improvements in working capital
• Investing capital in high growth, high return portfolios that utilize our fundamental strengths
• Advancing sustainability commitments to reduce GHG emissions and improve water quality
• Maintaining a strong balance sheet, providing flexibility for M&A and shareholder returns
T h e P o w e r o f 3 M
Focused on long term growth trajectory