SICK Product Catalog "Industrial Safety Systems" - RR Floody
134 J PROD n\JNOV MANAG 1985;3: 134- 144
New Industrial Product Performance: The Effects of Market Characteristics and Strategy*
Eunsang Yoon and Gary L. Lilien
There's no need to state again the complexity ofthe problem of achieving high pe$ormance in the new product process. What we do need is a framework to help sort out the complexity, and that is what Eun- sang Yoon and Gary Lilien provide in this article. They first dzferentiate between original and refor- mulated new products. Then they examine how pat- terns of R&D and marketing activities determine short and long-run success.
"This study was funded by the Institute for the Study of Business Mar- kets at The Pennsylvania State University, by the Novaction Company, and by the Center for Research in Management Science of ESSEC, France.
Introduction
The long-term health of many organizations is tied to their ability to innovate-to provide existing and new customers with a continuing stream of new products and services. Under modern conditions of competition, it is becoming increasingly hazardous not to innovate. The firm that does not maintain a program of managed innovations can quickly find itself behind competition.
Although innovation is important, it is risky and costly. Booz, Allen & Hamilton [3] estimate that al- most half of the resources spent on new products are allocated to products that are never successful in the market. They also report that of over 13,000 new prod- ucts of 700 U. S. manufacturers, approximately one- third have not been successful. A survey of 148 com- panies by Hopkins [17] indicates that only half of the companies have achieved successful performance in two-thirds or more of their new industrial products. In a study of 122 industrial product innovations, Cooper [8] reports that for every 100 products that are fully devel- oped, only 60 become commercial successes.
There are good reasons to believe that successful new product development will be even harder in the future. These factors include the shortage of new prod- uct ideas, the fragmentation of markets, increasing governmental restriction, capital shortages, and shorter product life cycles.
Thus, management is faced with a dilemma: It must develop new products to survive, yet the odds are weighted against their success. The recognition of this situation is instrumental in stimulating managements'
Q 1985 Elsevier Science Publishing C o . . Inc. 52 Vanderbiit Ave., New York, NY 10017
NEW PRODUCT PERFORMANCE J PROD INNOV MANAG 1985;3:134-144
135
BIOGRAPHICAL SKETCH
Eunsana Yoon is Assistant Professor of Marketing at Auburn University. He received his Ph.D. from Pennsylvania State University in March of 1984 and served as a research associ- ate for the Institute for the Study of Business Markets at Penn State f r m June 1984 to June 1985. His research interests include new product planning, business marketing, and man- agement science applications in marketing. Gan, L. Lilien is Research Professor of Management Science and Research Director of the Institute for the Study of Busi- ness Markets at Pennsylvania State University. He pre- viously taught at the Sloan School of Management at MIT. He holds a BS, and MS, and a DES from Columbia School of Engineering. He has published widely in the areas of new product planning, business marketing, and management sci- ence in marketing. He is co-author of two books, Market Planning for New Industrial Products (Wiley , 1980) and Marketing Decision Making: A Model Building Approach (Harper and Row, 1983). He was Departmental Editor, Mar- keting, for Management Science, serves on the editorial board of the Journal ofMarketing, and is Editor-in-Chief of the journal Interfaces.
l'he authors are very grateful to Jean-Marie Choffray for his contribution to this research. They would also like to thank C. Merle Crawford, Robert R. Rothberg, and anonymous reviewers for their useful comments on a previous draft of this paper.
strategic concern and academic research on new prod- uct innovation. In a study of 125 firms, Crawford [ 121 found that managements are increasingly recognizing that a new product R&D and marketing strategy should be explicit and central elements of corporate strategy. Empirical research has suggested the reasons for new product success and failure, and what separates suc- cesses from failure [6 , 7, 11, 13, 17, 21, 221. For normative purposes, key dimensions of new product strategy were identified [12], and scenarios for suc- cessful innovation were also suggested [4]. But rela- tively few empirical investigations have focused on testing the relationships between a f inds new product R&D/marketing/launch strategy and the new industrial product performance [ 1, 6, 91.
In the next section, we suggest a conceptual model of industrial new product performance, based on find- ings from recent innovation research. We then test sev- eral hypotheses and develop implications for new prod- uct market introduction strategies. Because of the
nature of the sample and data collection, we consider this to be an exploratory study.
A Model of Innovation Performance
Our investigation centers around a set of research hy- potheses derived from the conceptual model on new product performance in Exhibit 1. The model indicates the interactions between R&D and marketing invest- ments, between short-term and long-term perfor- mance, and between innovation and marketing rivalry in the market. The model also suggests that product type/innovation strategy is related to R&D/marketing programs and the market environment, and that R&D/marketing decisions, market characteristics, and product type/innovation strategy all influence new product sales performance. This conceptual model of new product innovation performance is an extension of the new product R&D diffusion model, suggested by Yoon and Lilien [23] in developing a new product launch-time decision framework. It is also based on the results of empirical research on the determinants of new industrial product performance [ 1, 6, 101. From the conceptual model, the following hypotheses have been selected for their normative value: each has important implications for new industrial product market intro- duction strategy.
Our discussion below will focus on two general classes of new products that we will call "original" and "reformulated" products. These are defined as follows:
OriginaE new products (ORNP's). ORNP's are technological breakthroughs, often relying on technologies never before used in the industry. They are referred to elsewhere [3] as "new prod- uct lines" and "new to the world" products.
Reformulated new products (RFNP's). R W ' s are product line extensions or modifications. Here, the innovating firm modifies physical prod- uct characteristics. Such modifications reduce costs or enlarge the range of possible usage. They are referred to in other contexts as "cost reduc- tions, " "improvements, " and "additions ' ' [3].

136 J PROD INNOV MANAG 1985;3:134-144
E. YOON AND G. L. LILlEN
Exhibit 1. A Model of Innovation Performance
R8D and Sales Market
Marketing Decis~ons Performance Character~st~cs
Product Type and Innovation Strategy Objective
Investment
I I I I
Our research hypotheses, below, focus on many key correspond, roughly, to Cooper's [lo] "high budget, differences bet ween these general classes of products. diverse strategy' ' and "low budget, conservative strat-
egy, " respectively.
Hypothesis I ( H I )
ORNP's and RFNP's are heterogeneous in key strate- gic aspects of their R&D and marketing activities.
Comment 1. This hypothesis is a dichotomous ver- sion of the empirical finding that the degree of newness is one of the most important factors affecting a new product's success/failure 17, 14, 161. In particular, we expect that ORNP's will provide the means for business line expansion for firms looking for diversification, whereas RFNP's will provide the mechanism for fims looking for product line expansion. These categories
New Product Market Launch (Timing) Growth
I I I I I I I Long-Term I
Performance (e.g., ROI or
Marketing Growth into a Marketing Product Group)
Investment Rivalry
1
- Diversification __._------- - Original
t
Short-Term Performance (e-g., First Year Sales, Market Share or Profit)
mothes is 2 fH2)
The initial sales performance of a new product innova- tion is closely associated with the product's com- petitive marketing program strength and market characteristics, including the stage of the product life cycle and market structure.
Comment 2. Empirical studies show that new product success depends directly on product/market variables, including (1) the degree of newness and mar- keting efficiency, (2) the vulnerability of existing
lnnovat~on
Rivalry
I I I I
NEW PRODUCT PERFORMANCE J PROD INNOV MANAG 137 1985:3:134-144
brands, (3) the long- term attractiveness of the product market, and (4) the ease of distribution access and other The Data Base profitlsales-growthlshare relationships 17, 161. The re- lationship between market concentration and the suc- cess of a new product has been one of the logical deriva-
In 1980, the Center for Research in Management Sci- tives of oligopoly theory [IS]. But in some empirical
ence at ESSEC, in conjunction with The French Min- studies, the inverse relationship between the market istry of Industry and the Novaction C ~ m p a n y , ~ launch- share of a new product and concentration was not sup-
ported [ 191. ed a project to provide the basis for studying new indus- trial product innovation patterns.
The products studied represent a convenience sam- ple from a list of 500 industrial firms registered in France, drawn randomly from a national directory in
Hypothesis 3 (H3)
The initial sales performance (operationalized as mar- ket share after 1 year) of a new product is related to the timing of the product launch, with initial success relat- ed to launch delay via a bell-shaped curve.
Comment 3. A premature entry may risk pushing an underdeveloped product into the marketplace, with possible negative feedback from customers and poor initial performance. On the other hand, potential sales will be sacrificed if entry is delayed too long, and poor initial sales will result as well. Kalish and Lilien 1181 studied this issue for a government demonstration pro- gram for photovoltaics. Yoon and Lilien 1231 also de- veloped a launch-timing decision model based on the
proportion to the importance of top priority sectors for French national policy. Firrns were contacted in a two- step procedure. They were selected after a telephone interview, checking whether they had introduced a new product in the last 5 years. Next, selected firms were contacted sequentially and asked to participate in the study, after receiving a statement of the project objec- tives. The acceptance rate was 83%, and the final sam- ple size was 112 products of 52 firms. Data were col- lected by personal interview, requiring about 3 man- days per product. Although these products were devel- oped mainly by French companies, most were mar- keted in several major industrial countries, including the United States.
The following data were collected for this project for each product studied.
proposition that underlying controllable dimensions determining the performance of a new product innova- R & D process. Cost structure, financing, dura- tion can be grouped as R&D efficiency and marketing tion, methods of product evaluation, types of pro- efficiency. tection, etc.
Market introduction strategy. Basis for decision, success or failure, evaluation criteria, initial mar-
Hypothesis 4 (H44)
A new product must gain rapid market acceptance and achieve a satisfactory market share within a short peri- od of time if it is to become a market leader. If a new product does not realize a significant market share quickly (within a year or so), then its chance of becom- ing a leader is slim.
Comment 4. This hypothesis suggests that the des- tiny of a new industrial product is determined in the first few years following its introduction into the market [5]. Most new product-planning models, designed to fore- cast and diagnose short-term new product performance before and after test marketing, explicitly or implicitly accept this proposition [ 2 ] .
keting mix, etc.
* Marketpenetration. Sales of the new product and its prime competitors, market structure, changes in the marketing mix, etc.
Other data included managerial judgments about how the new product performs relative to competition, information on the objectives set for the new product,
'ESSEC is Ecole Superieure des Sciences Economiques et Commercial- es.
2Novaction Company, a leading European consulting firm and a mem- ber of the Institute for the Study of Business Markets at the Pennsylvania State University, provided access to these data for this research.
J PROD INNOV MANAG 1985;3:134-144
Exhibit 2. Major Industrial Sectors Represented in the Data Base
Number of Percent Industrial sector new products of total
Electronics, electrical equipment, scientific instrumentation 43 38
Chemistry, biochemistry 17 15 Construction, earth moving 15 14 Transport, services 11 10 Metal processing, metallurgy 10 9 Food, agriculture 9 8 Miscellaneous 7 6
Total 112 100
the way these objectives evolved over time, and how they were achieved.
We have reproduced the distribution of the sample across industrial sectors in Exhibit 2. The electronics and scientific instrumentation area is well represented, reflecting both national policy emphasis and the high level of innovation in this sector. The miscellaneous sector includes a heterogeneous set of new industrial products, ranging from computer software to tank engines.
Analysis Results
H I : Comparison between Original and Reformulated Products
Of the 112 products in the data base, 100 had suffi- ciently complete data for the items under test. Of these, 41 items are ORNP's and 52 items are RFNP's. We performed a (two-tailed) t-test of two group means, along with an equal variance test between ORNP's and RFNP's, to test for strategic differences between these groups. The complete details of that comparison are available elsewhere [24], and those results can be sum- marized as follows: compared with reformulated new industrial products, original new industrial products
1. are more diversification orientedlless expansion oriented;
2. have higher R&D cost for basic research and lower R&D cost for prototype development;
3. are in markets where potential buyers show lower satisfaction with existing products;
4, are developed by firms with higher production ex- pertise/lower marketing expertise;
5. have higher degree of innovativenessllower market competition;
6. are in an earlier stage of the product life cycle, smaller number of competitorsllower market con- centration ratio;
7. use more direct sellinglinfrequently use a high price strategy.
Note that these results describe the circumstances and strategies of products of these two types. There are many differences. To the extent that these differences reflect the sound judgment of successful decision makers, the results may be used normatively as guides for successful launch strategies 1201. For example, a fiim will have a higher chance of success with an origi- nal new industrial product when the firm has a strategic plan to expand its business line, has the capability to invest for basic research, and has high expertise in pro- duction. It will also have an improved chance for suc- cess if the target market is less satisfied with existing products, is less competitive, and is in an earlier stage of the product life cycle.
H2: Short-Term Performance: First-Year Market Share
Hypothesis 2 deals with short-term performance of new industrial products. The results of H1 showed that ORNP's and RFNP's are quite dissimilar. Therefore, we study them separately below.
We use analysis of variance as the mechanism here, where the criterion (dependent) variable is first-year market share. That variable is then related to indepen- dent variables,3 as shown in Exhibit 3. In Exhibit 3A, we see that for ORNP's, 86% of the variation in the first-year market share is explained by five categorical variables and their interactions.
Four market situation variables are important in ex- plaining the initial market share achievement of an original new industrial product: the relative competit-
3The heavily skewed distribution of the independent variables led us to transform them into 0-1 dichotomous variables to stabilize the analysis.

NEW PRODUCT PERFORMANCE J PROD INNOV MANAG 139 1985;3: 134-144
Exhibit 3. ANOVA Results on First-Year Market Share
First-year market share (dependent variable)
A. O W Modela Source df ANOVA SS F value p > F
Mode1 8 28592.2 14.35 0.0001
DCRCM 1 8996.5 36.12 0.0001 LFCLA 1 6091.0 24.45 0.0001 GRWTH 1 4906.0 19.70 0.0003 BLCOM 1 3857.8 15.49 0.0001 MEF2 1 1991.1 7.99 0.0112
MEF2"GRWTH 1 1070.9 4.30 0.0527 MEF2 *LFCLA 1 865.9 3.48 0.0786 MEF2*DGRCM 1 813.0 3.26 0.0876
Error 18 4483.4
Total 26 33075.6
*Mean square (model) = 3574.0; mean square (error) = 249.1; R square = 0.864.
B. R F W W e l a Source df ANOVA SS F value p > F
Model 10 16766.0 11.86 0.0001
ATS 1 5516.7 40.86 0.0001 MEF3 1 3212.6 23.79 0.0001 OBJEX 1 3063.0 21.67 0.0001 BLCOM 1 709.4 5.25 0.0310 DGRCM 1 462.2 3.42 0.0766
MElF3 * OB JEX 1 2209.5 16.36 0.0005 DGRCM*LFCLA 4 1592.6 2.82 0.0467
Error 25 3534.2
Total 35 20300.2
aMean square (model) = 1676.6; mean square (error) = 141.4; R square = 0.826.
Variable Definitions: (DGRCM) Relative degree of competi- tiveness of the market, compared with the other markets: 1 indi- cates strong or average; 2 indicates weak. (LFCLA) Stage of product life cycle at the product's market launch time: 1 indicates introductory stage; 2 indicates growth stage. (GRWTH) Market growth rate in the existing market (more or less than 10%). (BLCOM) Number of competitors before market launch (more or less than 5%). (MEF2) The average of the scores of the marketing efficiency of advertising (MEFAD) and of distribution-support- ing advertising (MEFDA); both were scaled over ranges from 1 to 7 (much less or much more efficient, respectively; broken at scale-median). (MEF3) The average of the scores of the market- ing effiiency of advertising (MEFAD), distribution-supporting advertising (MEFDA) , and distribution effort (MEFDI) . All three were scaled over a range from 1 (much more efficient) to 7 (much less efficient). (OBJEX) Degree of importance of the strategic objective-to expand the product group: 1 indicates most impor- tant; 4 iadicates least important. (ATS) Potential buyers' satisfac- tion with the service level of existing products: 1 indicates com- pletely satisfied; 2 indicates totally dissatisfied.
iveness level of the market (DGRCM), the stage in the product life cycle (LFCLA), market growth rate (GR- WTH), and the number of competitors (BLCOM).
First-year market share is higher when
the degree of competitiveness in the market is low,
the product-class life cycle is in the introductory stage;
the market growth rate is low;
the number of competitors is small.
The level of relative efficiency of the firm's market- ing strategy influences the new product's performance level not only directly but also by interacting with mar- ket condition variables, such as degree of com- petitiveness of the market, stage of the product life cycle, and market growth rate.
Higher marketing efficiency, such as in advertising, leads to better market share performance. Its influence is particularly important when
the market growth rate is lower;
the product-class life cycle is in the introductory stage;
the degree of competitiveness in the market is lower.
An important implication of these results is that be- cause the success of the original new industrial product depends heavily on uncuntrullable market variables, the selection of the market opportunity, as well as the product itself, is critical to the success of ORNP's.
In Exhibit 3B for RFNP's, 83% of the variation in the first-year market share is explained by seven cate- gorical variables and their interactions.
The potential buyer's attitude toward existing prod- ucts (ATS), the marketing efficiency level of the inno- vating firm (MEF), the strategic objective of product line expansion (OBJEX), the number of competitors in the market (BLCOM) , and the competitiveness level of the market (DGRCM) are important in explaining the initial market share performance of a reformulated new

140 J PROD WNOV MANAG 1985;3:134-144
E. YOON AND G . L. LILJEN
industrial product. First-year market share is higher when
* potential buyers' satisfaction with the "service" level of existing products is lower;
marketing efficiency in advertising and distribu- tion is perceived to be higher;
a strategic objective for the reformulated new product is for expansion of the product group;
* the number of competitors in the market is small;
the competitiveness level of the market is low.
The marketing efficiency level influences the new product's performance level not only directly but also through interaction with the strategic objective: expan-
Exhibit 4. The Determinants of First-Year Market Share for Original and Reformulated New Industrial Products
sion of the product group. The effect of marketing effi- ciency on market share performance is higher when the expansion of the product group is an important objec- tive for the new product.
The stage in the product life cycle has a negative effect on first-year performance, particularly in a strongly competitive market.
In summary, those variables related to market poten- tial and structure are critical for explaining short-term performance for ORNP's, whereas those variables re- lated to the level of customer satisfaction with the exist- ing products and the strategy-product type fit are partic- ularly critical for RFNP's. The relative marketing efficiency of the innovating firm for the new product diffusion are important for the new product's initial market share performance, both for ORNP's and RENP' s . Among marketing instruments, advertising was found to be an important factor for ORNP's, whereas distribution effort is important for RFNP's. The structure of these relationships is summarized in Exhibit 4.
: important in both ORNP's and RFNP's
: important particularly for ORNP's
. - - - -- - - - - : important part~cularly for RFNP's
NEW PRODUCT PERFORMANCE J PROD INNOV MANAG 141 1985:3:134-144
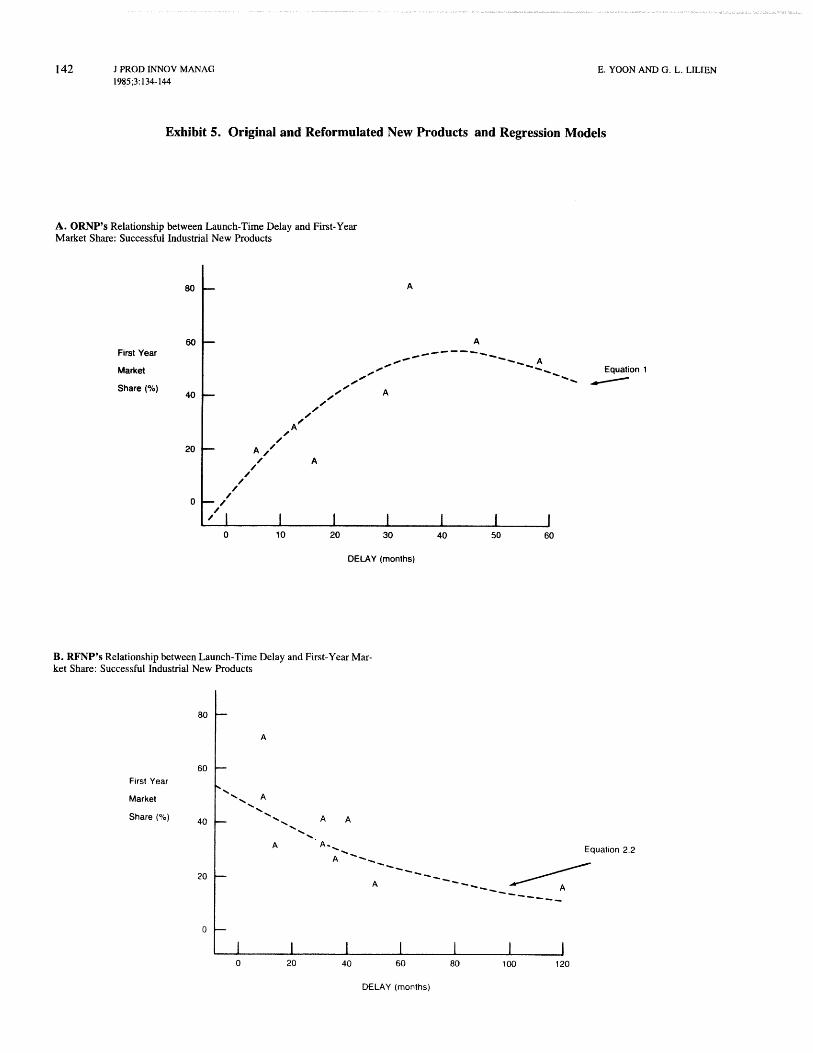
H3: Launch-Time Delay and Initial Market Share H4: Long-Tetm Perj'ormance: Growth into a Product Group
Here, we investigate the hypothesis that the initial sales performance of a new product is related to the timing of the product launch: for example, the sales performance increases up to a certain point and decreases thereafter with respect to a delay of launch time 118, 231. We analyze the market share of the new product during the first launch year and relate it to the time lag between the decision to develop the product and the introduction of the new product into the marketplace. We only include a small subset of the data base here, however, noting that (1) the new product items that realized 100% mar- ket share are not appropriate for our analysis because they are monopoly items, and (2) many product items that realized low levels of initial market share, not more than lo%, say, were generally unsuccessful (H2) and are inappropriate for our analysis.
To test this hypothesis on a homogenous data base, we separated the data into original and reformulated
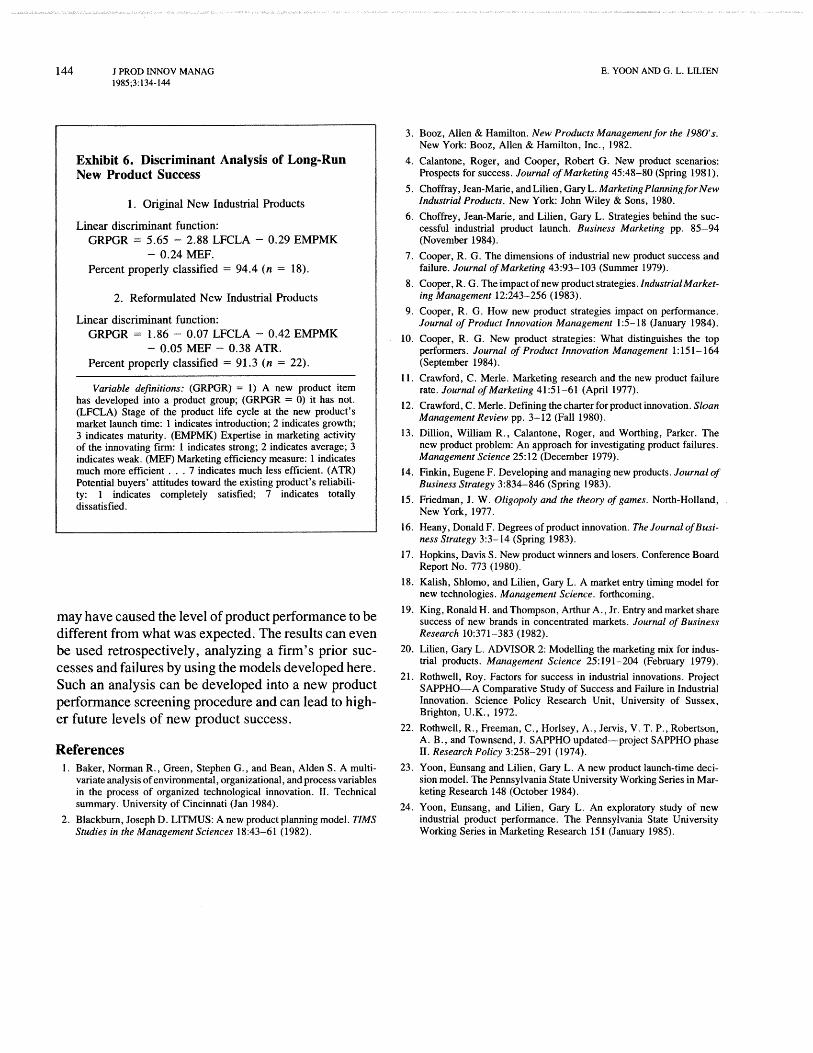
In studying short-term performance, we used analysis of variance because the dependent variable, first-year market share, was a continuous variable. For long-term performance, we used a dichotomous variable- whether or not the product developed into a product group-as the measure of success. Our analytical plan, then, is to use discriminant analysis to identify charac- teristics that distinguish between those products that do (and do not) develop into a product group.
In Exhibit 6, we again run separate analysis for ORNP's and RFNP's. We see that the following factors are important in determining the long-run success of a (reformulated or original) new industrial product inno- vation (measured in terms of whether it grows into a product group):
the degree of expertise in marketing activity;
successful new products where, to be successful, a product had to both achieve an initial market share of at the marketing effectiveness for the new product
least 10% and grow irito a product group in the long diffusion; run.
In Exhibit 5A, fist-year market share of the suc- the stage of product life cycle.
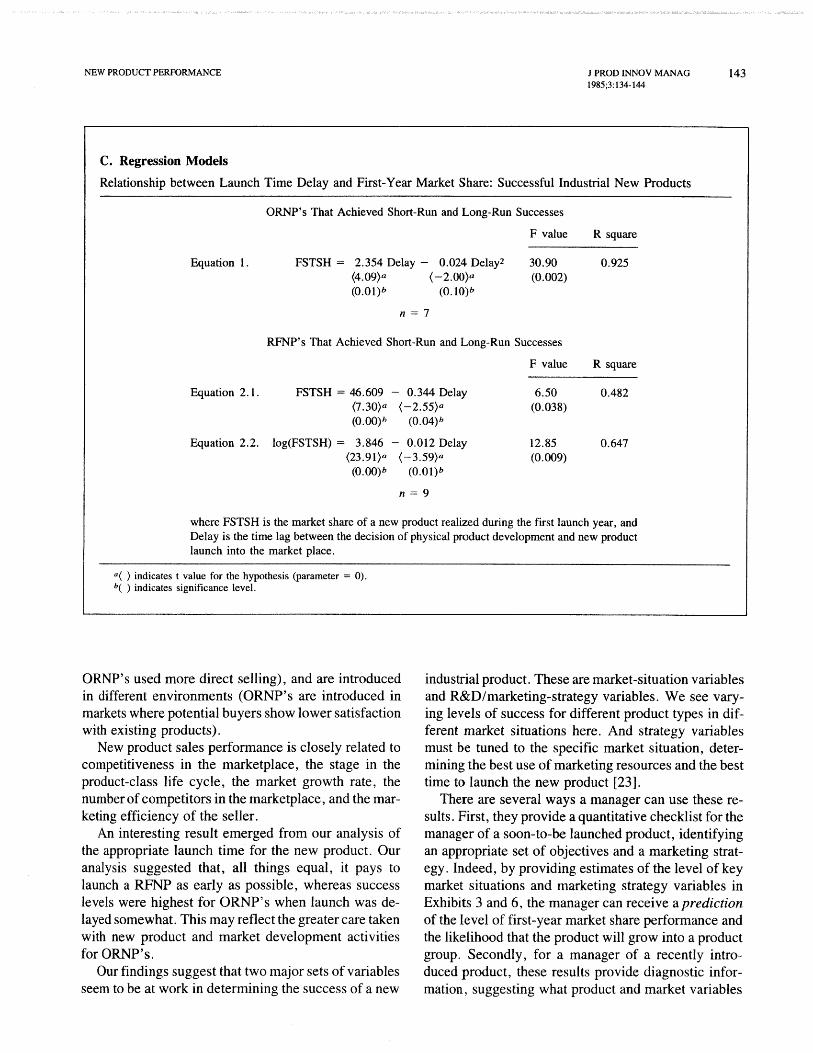
cessful original new products shows an increasing trend at first, but a decreasing trend later, as the launch time is delayed. This curving trend is statistically tested in Exhibit 5C, Equation 1 , by fitting a quadratic function. The regression analysis shows that the first-year market share of (successful) ORNP's is explained by a quad- ratic function of launch-time delay. On the other hand, first-year market share of (successful) RFNP's monoto- nically decreases with launch-time delay, as shown in Exhibit 5B. This down-sloping trend is statistically tested in Exhibit 5G, Equation 2, through linear and log-linear functions.
This analysis leads us to conclude that H3 is partially
Potential buyers' satisfaction level with existing prod- ucts is also important for the long-run performance of a reformulated product.
Finally, we investigated the relationship between short-term and long-term success. We found a signifi- cant, positive correlation between the chance for a product to grow into a product group and first-year market share. (Spearman's rho = 0.24 for ORNP's and 0.21 for RFNP's.) This suggests that, as expected, short-run success is a positive determinant or predictor of long-run success.
supported by a limited (and expost) data base of new industrial products; for (successful) ORNP's, first-year market share increases with delay of launch time up to a Conclusions and Implications certain point and decreases thereafter. For RFNP's, however, we found that initial market share perfor- mance decreases with delay of new product launch time. This contrast between ORNP's and RFNP's may This research has focused on the development of a con- reflect differences in product-market situations: in par- ceptual model of the determinants of new industrial ticular, the market is relatively better developed for product success and has derived several testable hy- RFNP's than for ORNP's; the longer an incremental potheses from that model. When comparing ORNP's innovation takes to get to market, the greater its risk of with RFNP's, we found that these product types had failure due to changing market conditions, competitive different objectives (e .g . , ORNP's are more diversifi- response, or further technological advances. cation oriented), different marketing programs (e . g . ,
142 J PROD INNOV MANAG 1985;3:134-144
E. YOON AND G. L. LEDEN
Exhibit 5. Original and Reformulated New Products and Regression Models
A. ORNP's Relationship between Launch-Time Delay and First-Year Market Share: Successful Industrial New Products
60 First Year
Market
Share (%) 40
DELAY (months)
B. RFNP's Relationship between Launch-Time Delay and First-Year Mar- ket Share: Successful Industrial New Products
Ftrst Year
Market
Share (%I 4o
Equation 1
/
I A A - .. Equation 2.2
0 20 40 60 80 100 120
DELAY (months)
NEW PRODUCT PERFORMANCE J PROD INNOV MANAG 143 1985;3:134-144
C. Regression Models
Relationship between Launch Time Delay and First-Year Market Share: Successful Industrial New Products
ORNP's That Achieved Short-Run and Long-Run Successes
F value R square
Equation 1. FSTSH = 2.354 Delay - 0.024 Delay2 30.90 0.925 (4.09)a (-2.00)~ (0.002) (0.01)b (0.1O)b
n = 7
RFNP's That Achieved Short-Run and Long-Run Successes
F value R square
Equation 2.1. FSTSH = 46.609 - 0.344 Delay 6.50 0.482 (7.30)~ (-2.55)~ (0.038) (0.00)b (0.04)b
Equation 2.2. log(FSTSH) = 3.846 - 0.012 Delay 12.85 0.647 (23.91)~ (-3.59)~ (0.009) (0.00)b (0.01)b
n = 9
where FSTSH is the market share of a new product realized during the first launch year, and Delay is the time lag between the decision of physical product development and new product launch into the market place.
a( ) indicates t value for the hypothesis (parameter = 0). b( ) indicates significance level.
I
ORNP's used more direct in different environments markets where potential bu with existing products).
selling), and are introduced (ORNP's are introduced in iyers show lower satisfaction
New product sales performance is closely related to competitiveness in the marketplace, the stage in the product-class life cycle, the market growth rate, the number of competitors in the marketplace, and the mar- keting efficiency of the seller.
An interesting result emerged from our analysis of the appropriate launch time for the new product. Our analysis suggested that, all things equal, it pays to launch a RFNP as early as possible, whereas success levels were highest for ORNP's when launch was de- layed somewhat. This may reflect the greater care taken with new product and market development activities for ORNP's .
Our findings suggest that two major sets of variables seem to be at work in determining the success of a new
industrial product. These are market-situation variables and R&D/marketing-strategy variables. We see vary- ing levels of success for different product types in dif- ferent market situations here. And strategy variables must be tuned to the specific market situation, deter- mining the best use of marketing resources and the best time to launch the new product 1231.
There are several ways a manager can use these re- sults. First, they provide a quantitative checklist for the manager of a soon-to-be launched product, identifying an appropriate set of objectives and a marketing strat- egy. Indeed, by providing estimates of the level of key market situations and marketing strategy variables in Exhibits 3 and 6, the manager can receive a prediction of the level of first-year market share performance and the likelihood that the product will grow into a product group. Secondly, for a manager of a recently intro- duced product, these results provide diagnostic infor- mation, suggesting what product and market variables
144 J PROD INNOV MANAG 1985;3: 134-144
Exhibit 6. Discriminant Analysis of Long-Run New Product Success
1 . Original New Industrial Products
Linear discriminant function: GRPGR = 5.65 - 2.88 LFCLA - 0.29 EMPMK
- 0.24 MEF. Percent properly classified = 94.4 (n = 18).
2. Reformulated New Industrial Products
Linear discriminant function: GRPGR = 1.86 - 0.07 LFCLA - 0.42 EMPMK
- 0.05 MEF - 0.38 ATR. Percent properly classified = 91.3 (n = 22).
Variable definitions: (GRPGR) = 1) A new product item has developed into a product group; (GRPGR = 0) it has not. (LFCLA) Stage of the product life cycle at the new product's market launch time: 1 indicates introduction; 2 indicates growth; 3 indicates maturity. (EMPMK) Expertise in marketing activity of the innovating firm: 1 indicates strong; 2 indicates average; 3 indicates weak. (MEF) Marketing efficiency measure: 1 indicates much more efficient . . . 7 indicates much less efficient. (ATR) Potential buyers' attitudes toward the existing product's reliabili- ty: 1 indicates completely satisfied; 7 indicates totally dissatisfied.
may have caused the level of product performance to be different from what was expected. The results can even be used retrospectively, analyzing a firm's prior suc- cesses and failures by using the models developed here. Such an analysis can be developed into a new product performance screening procedure and can lead to high- er future levels of new product success,
References 1. Baker, Norman R., Green, Stephen G., and Bean, Alden S. A multi-
variate analysis of environmental, organizational, and process variables in the process of organized technological innovation. 11. Technical summary. University of Cincinnati (Jan 1984).
2. Blackburn, Joseph D. LITMUS: A new product planning model. T I M Studies in the Management Sciences 18:43-61 (1982).
3. Booz, Allen & Hamilton. New Products Management for the 1980's. New York: Booz, Allen & Hamilton, Inc., 1982.
4. Calantone, Roger, and Cooper, Robert G. New product scenarios: Prospects for success. Journal of Marketing 45:48-80 (Spring 198 1).
5. Choffray , Jean-Marie, and Lilien, Gary L. Marketing Plaming for New Industrial Products. New York: John Wiley & Sons, 1980.
6. Choffrey, Jean-Marie, and Lilien, Gary L. Strategies behind the suc- cessful industrial product launch. Business Marketing pp. 85-94 (November 1984).
7. Cooper, R. G. The dimensions of industrial new product success and failure. Journal of Marketing 43:93- 103 (Summer 1979).
8. Cooper, R. G. The impact of new product strategies. IndustriaEMarket- ing Management 12:243-256 (1983).
9. Cooper, R. G. How new product strategies impact on performance. Journal of Product Innovation Management 1 :5- 18 (January 1984).
10. Cooper, R. G. New product strategies: What distinguishes the top performers. Journal of Product Innovation Management 1 : 15 1 - 164 (September 1984).
11. Crawford, C. Merle. Marketing research and the new product failure rate. Journal of Marketing 41 51-61 (April 1977).
12. Crawford, C. Merle. Defining the charter for product innovation. Sloan Management Review pp. 3- 12 (Fall 1980).
13. Dillion, William R., Calantone, Roger, and Worthing, Parker. The new product problem: An approach for investigating product failures. Management Science 25: 12 (December 1979).
14. Finkin, Eugene F. Developing and managing new products. Journal of Business Strategy 3:834-846 (Spring 1983).
15. Friedman, J. W. Oligopoly and the theory of games. North-Holland, New York, 1977.
16. Heany, Donald F. Degrees of product innovation. The Journal of Busi- ness Strategy 3:3- 14 (Spring 1983).
17. Hopkins, Davis S. New product winners and losers. Conference Board Report No. 773 (1980).
18. Kalish, Shlomo, and Lilien, Gary L. A market entry timing model for new technologies. Management Science. forthcoming.
19. King, Ronald H. and Thompson, Arthur A., Jr. Entry and market share success of new brands in concentrated markets. Journal of Business Research 10:371-383 (1982).
20. Lilien, Gary L. ADVISOR 2: Modelling the marketing mix for indus- trial products. Management Science 2.5: 191-204 (February 1979).
2 1. Rothwell, Roy. Factors for success in industrial innovations. Project SAPPHO-A Comparative Study of Success and Failure in Industrial Innovation. Science Policy Research Unit, University of Sussex, Brighton, U.K., 1972.
22. Rothwell, R., Freeman, C., Horlsey, A., Jervis, V. T, P., Robertson, A. B., and Townsend, J. SAPPHO updated-project SAPPHO phase 11. Research Policy 3:258-291 (1974).
23. Yoon, Eunsang and Lilien, Gary L. A new product launch-time deci- sion model. The Pennsylvania State University Working Series in Mar- keting Research 148 (October 1984).
24. Yoon, Eunsang, and Lilien, Gary L. An exploratory study of new industrial product performance. The Pennsylvania State University Working Series in Marketing Research 151 (January 1985).
Copyright © 2022 FDOKUMEN