337 + 1A. ,.FA, E z - European Commission
350
-
Upload
khangminh22 -
Category
Documents
-
view
3 -
download
0
Transcript of 337 + 1A. ,.FA, E z - European Commission
Cl i ent : Furopean Commission - DG E=nvi ronment
Subject : Option for coastal information systems
Doc. t itle : Progress Report
Document no . " 2 1 807-REL-T002 . 1
D istr i bution l i st : fi l e 2 1 807
rev.
0
1
2
3
date
1 8 . 04 . 1 1
27 . 05 . 1 1
issued for
Comments
Approva l
pa es prepared checked
337 + 1A . ZM , CC , FA , ER BA
337 + 1A. , .FA , E z
approved
ME
vwc
Thetis S . P ,A . - . . . .castel l o 2737/f, 30 1 22 VeneziaTe ! . +39 04 1 240 6 1 1 1Fax +39 04 1 52 1 0292
www.theti s . it.... ...:i ;:7. .. . . . .;vc:.;:7;;i;;,,7;;]::=;; . . . . .." I ¢ . \ , ..
� , ,. .....,,",i: :- .... ....i / ,". . . . . . . .. . . 's , .) . , ".
i /" ; ') il,, li N)"\ i
IEMAS
21807-REL-T002.1 page 2/337
Table of contents
1 Introduction ....................................................................................................................... 5
1.1 Project objective and expected results ................................................................... 5
1.2 Project structure ..................................................................................................... 6
1.3 Objective and structure of the report ...................................................................... 8
2 Methodology ..................................................................................................................... 9
2.1 General overview of existing coastal information systems..................................... 9
2.2 In-depth description of selected coastal information systems .............................. 13
3 Overview analysis: European illustrative cases ............................................................. 16
3.1 HELCOM Map and Data Service ......................................................................... 23
3.2 Lounaispaikka Map Service ................................................................................. 28
3.3 Integrated Atlas of the State of the Coast in the South-Eastern Baltic ................ 33
3.4 Rewal CIS ............................................................................................................. 37
3.5 Coastal Information System Oder Estuary ........................................................... 40
3.6 GeoSeaPortal ....................................................................................................... 46
3.7 Coastal Information System supporting Fish Farming in Denmark ...................... 50
3.8 NOKIS - North Sea and Baltic Sea Coastal Information System ......................... 54
3.9 Limfjorden Coastal Information System ............................................................... 57
3.10 The Trilateral Wadden Sea Cooperation web-site ............................................... 61
3.11 ScheldeMonitor web portal ................................................................................... 65
3.12 North Sea Atlas .................................................................................................... 71
3.13 WATLAS - Wadden Sea Atlas and the Wadden Sea Portal ................................ 75
3.14 KustAtlas - Belgian Coastal Atlas ......................................................................... 80
3.15 MAREANO - Marine Area Database for Norwegian coastal and marine
regions .................................................................................................................. 86
3.16 CAMRA - UK Coastal and Marine Resource Atlas .............................................. 90
3.17 MIDA - The Marine Irish Digital Atlas ................................................................... 94
3.18 Channel Coast Observatory Coastal Information System.................................. 100
3.19 Dorset Explorer - Dorset Coastal Explorer ......................................................... 103
3.20 Cork Harbour Geographic Information System .................................................. 108
3.21 GEOIDD-Litto ..................................................................................................... 113
3.22 GÉOBretagne ..................................................................................................... 117
3.23 Aquitaine Coast Observatory Coastal Information System ................................ 122
21807-REL-T002.1 page 3/337
3.24 RIA FORMOSA Coastal Information System ..................................................... 126
3.25 MEGASIG – Monitoring and Environmental management of the
Guardiana Estuary Salt Marshes ....................................................................... 130
3.26 REDIAM - Environmental Information Network of Andalusia ............................. 134
3.27 Spatial Data Infrastructure of Balearic Islands ................................................... 139
3.28 IDEC-LITORAL ................................................................................................... 144
3.29 Thau Lagoon Coastal Information System ......................................................... 148
3.30 CRIGE PACA Spatial Data Infrastructure .......................................................... 152
3.31 SICoast Information System ............................................................................... 158
3.32 CMGIZC Web-GIS .............................................................................................. 163
3.33 Web GIS Coast of the Campania Region .......................................................... 168
3.34 Coastal and marine information system of Emilia Romagna Region ................. 171
3.35 CISs of Venice Lagoon ....................................................................................... 177
3.36 Gulf of Gera Coastal Information System .......................................................... 189
3.37 Bulgarian Black Sea Coastal Atlas ..................................................................... 193
3.38 Akçakoca Costal Information System ................................................................. 197
3.39 Odessa Coastal Information System .................................................................. 200
4 Overview analysis: Extra-European illustrative cases .................................................. 203
4.1 MORIS - Massachusetts Ocean Resource Information System ........................ 204
4.2 Mapping and Planning Portal of the Mid-Atlantic Regional Council on
the Ocean ........................................................................................................... 208
4.3 Virginia Coastal Geospatial and Educational Mapping System ......................... 213
4.4 Oregon Coastal Atlas ......................................................................................... 218
4.5 Australian on-line Coastal Information ............................................................... 222
5 In-depth analysis of selected CIS ................................................................................. 227
5.1 Rationale ............................................................................................................ 227
5.2 HELCOM Map and Data Service ....................................................................... 230
5.3 Coastal Information System Oder Estuary ......................................................... 242
5.4 North Sea Atlas .................................................................................................. 252
5.5 KustAtlas – Belgian Coastal Atlas ...................................................................... 258
5.6 MIDA – The Marine Irish Digital Atlas ................................................................ 267
5.7 Dorset Coastal Explorer ..................................................................................... 276
5.8 Cork Harbour Geographic Information System .................................................. 282
5.9 GEOIDD-Litto ..................................................................................................... 287
21807-REL-T002.1 page 4/337
5.10 REDIAM - Environmental Information Network of Andalusia ............................. 295
5.11 CRIGE PACA Spatial Data Infrastructure .......................................................... 307
5.12 Coastal and marine information system of Emilia Romagna Region ................. 318
5.13 GIS tools of the Information Service of the Venice Water Authority .................. 328
Annex 1

21807-REL-T002.1 page 5/337
1 Introduction
1.1 Project objective and expected results
Gathering and proper structuring of relevant data, transparent and ready available information
to decision makers and stakeholders, adequate communication to citizens, information shar-
ing, effective and concrete use of data and information in policy and decision making are all
key elements to support and implement integrated planning and management of coastal
zones. In relation to ICZM, EC Communication COM(2007)308 highlights that “While the
methodology to assess the spatial impacts of EU policies has progressed, the gaps in data
and the lack of effective information-sharing systems are still a barrier to its more widespread and pro-active use in decision making processes”.
In this perspective the project generally aims to contribute to the implementation of the above
issues within the implementation, development and use of coastal information systems, thus
contributing to the diffusion of tools resulting in being actually useful and concretely used in
integrated coastal planning and management. To pursue this overall goal, the project foresees
the identification and assessment of policy requirements for coastal information systems that
will be potentially part of the follow-up proposal to the EU-ICZM Recommendation
(2002/413/EC). Indeed, the project focuses on the role that coastal information systems can
play in concretely supporting the implementation of ICZM processes at various scales (local to
regional and cross-border cooperation). Therefore the project concern is mainly on operational
systems rather than on experimental or research initiatives. It may also include tools that are
at an advanced stage of development (pilot or pre-operational systems) or other ones that are
particularly relevant for innovation for examples in terms of functionalities, technological plat-
forms or contents. The above overall aim can be detailed in the following specific project ob-
jectives:
Provide a general overview of illustrative examples of existing costal information sys-
tems in order to contribute to depict a general understanding of the characteristics and
level of use of available systems. This overview also aim to identify the more interest-
ing systems to be in-depth analysed;
Analyse in details the selected costal information systems. The in-depth analysis ena-
ble to clearly understand the strength and weakness of existing systems and identify
the elements to be further improved or those totally lacking;
Develop key structuring requirements for ICZM supporting information systems, on the
basis of the results obtained by pursuing the previous described goals. Identified re-
quirements shall be: (i) relevant at the EU level, (ii) the most remarkable ones in sup-
porting the development of costal information systems related to ICZM, (iii) concrete
and operational in order to result in being really useful, (iv) ambitious and innovative to
introduce new steps in the development of costal information systems and in their use
in the ICZM process;
21807-REL-T002.1 page 6/337
Assess the positive and negative impacts of the policy requirements (options) to iden-
tify the conditions that can contribute to the improvement of coastal information sys-
tem and those than can impede the process;
Organise the involvement and participation of different typologies of key stakeholders
(coastal managers, planners, decision-makers at various level, specialised users, etc.)
in various steps of the project, in order to benefit from their expertise and experience.
The main expected result is a key set of properly identified, assessed and validated policy re-
quirements for coastal information systems. These requirements will support the further exten-
sion, improvement and innovation of ICZM related information systems with the aim to con-
cretely support the ICZM implementation at the EU level and in the EU member states. The
project expected results also include:
A general overview of existing coastal information system around Europe;
An understanding of existing strengths, weaknesses, obstacles, added-values, bottle-
necks related to the present development and implementation of costal information
systems;
An understating of the key factors supporting or limiting ICZM-related information sys-
tems;
A full understanding of the role of coastal information system in the concrete support
to the implementation of the various ICZM steps.
1.2 Project structure
The project is organised in four principal tasks, including three technical ones and one task
dealing with project management, technical coordination and final reporting. Each task is
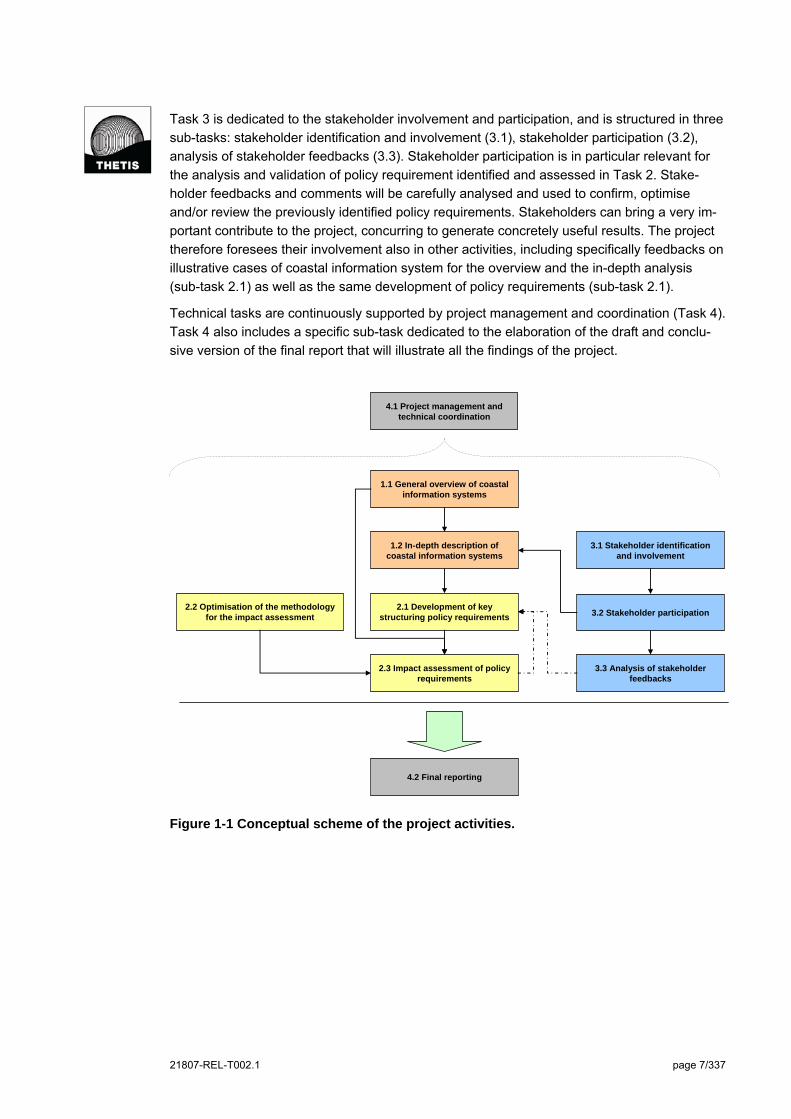
structured in sub-tasks as briefly described below. Figure 1-1 illustrates the conceptual
scheme of the project activities, as well as the mutual interrelations among the same. Sub-
tasks belonging to the same task are identified by a specific colour: Task 1 – orange, Task 2 –
yellow, Task 3 – light blue, and Task 4 – grey.
The first task of the project is dedicated to the analysis of the illustrative cases of existing
coastal information systems. As highlighted in the previous section, the focus is on operational
systems, in case including some innovative, pre-operational or pilot systems, whose analysis
can provide remarkable information for the other project activities. Task 1 is divided in two
sub-tasks. The first one (1.1) aims to depict a general overview of the existing information sys-
tems supporting ICZM and has enabled to select the most representative ones to be in-depth
analysed by the second sub-task (1.2).
The results of Task 1 constitute the basis for the implementation of Task 2 “Definition of the
policy requirements and assessment”. This task is divided in three sub-tasks. The first one
(2.1) is dedicated to develop key structuring policy requirements for ICZM supporting infor-
mation systems. The same policy requirements are assessed in sub-task 2.3 in terms of im-
pact evaluation, according to the methodology optimised in sub-task 2.2. The impact assess-
ment activity will likely determine the need to partly review and optimised the policy require-
ments defined in sub-task 2.1.
21807-REL-T002.1 page 7/337
Task 3 is dedicated to the stakeholder involvement and participation, and is structured in three
sub-tasks: stakeholder identification and involvement (3.1), stakeholder participation (3.2),
analysis of stakeholder feedbacks (3.3). Stakeholder participation is in particular relevant for
the analysis and validation of policy requirement identified and assessed in Task 2. Stake-
holder feedbacks and comments will be carefully analysed and used to confirm, optimise
and/or review the previously identified policy requirements. Stakeholders can bring a very im-
portant contribute to the project, concurring to generate concretely useful results. The project
therefore foresees their involvement also in other activities, including specifically feedbacks on
illustrative cases of coastal information system for the overview and the in-depth analysis
(sub-task 2.1) as well as the same development of policy requirements (sub-task 2.1).
Technical tasks are continuously supported by project management and coordination (Task 4).
Task 4 also includes a specific sub-task dedicated to the elaboration of the draft and conclu-
sive version of the final report that will illustrate all the findings of the project.
1.1 General overview of coastal information systems
1.2 In-depth description of coastal information systems
2.1 Development of key structuring policy requirements
2.3 Impact assessment of policy requirements
2.2 Optimisation of the methodology for the impact assessment
3.1 Stakeholder identification and involvement
3.2 Stakeholder participation
3.3 Analysis of stakeholder feedbacks
4.2 Final reporting
4.1 Project management and technical coordination
Figure 1-1 Conceptual scheme of the project activities.
21807-REL-T002.1 page 8/337
1.3 Objective and structure of the report
This progress report illustrates the results of the Task 1 activities of the project and in particu-
lar of the overview analysis (sub-task 1.1) and in-depth analysis (sub-task 1.2) of illustrative
case of coastal information systems. Besides the present introduction describing the overall
project objectives and structure, the report includes other four chapters.
Chapter 2 deals the description of the methodology adopted in Task 1 and the two included
sub-tasks. Results of the overview analysis are described in chapter 3 that includes the de-
scription of forty illustrative cases of European coastal information systems. This set will be
slightly increased by including few more illustrative cases, the most interesting ones indicated
by stakeholders involved in the project, in particular through the e-mail consultation. Indeed
one of those coastal information systems has been already included in the set of analysed
CISs; this is the case of the ScheldeMonitor web portal that was indicated by various stake-
holders. Information on existing CISs is complemented by the description of five advanced ex-
tra-European illustrative cases (chapter 4). Finally, Chapter 5 includes the detailed description
of twelve illustrative cases, as well as the rationale behind their selection form the original set
considered by the overview analysis.
21807-REL-T002.1 page 9/337
2 Methodology
The description of Task 1 methodology is sub-divided in two parts, respectively concerning
sub-task 1.1 “General overview of existing information systems and sub-task 1.2 “In-depth de-
scription of selected coastal information systems”.
2.1 General overview of existing coastal information sys-tems
Sub-task 1.1 aims to depict a general overview of the characteristics of illustrative cases of
operative coastal information systems. The project gives much relevance on the concrete and
practical effects of the use of information system within the ICZM process. Therefore, the fo-
cus is on operational system, i.e. information systems that are already used to support coastal
planning and management. However, the overview may also include some pre-operational,
pilot or innovative systems, whenever these can provide particularly relevant information for
the following tasks of the project and in particular for the definition of policy requirements. This
is for example the case of not-yet operational systems that can make available some innova-
tive functionalities or procedures resulting in being particularly useful in relation to CIS/ICZM
key issues. The term coastal information system (CIS) refers to a wide variety of system typol-
ogies, including among the others: web-site, web-portal, web-GIS, web-atlas, off-line GIS, in-
dicators web viewers, spatial data infrastructure, map and data service, mixed systems, etc.
The methodological approach has included scan of various types of information sources, i.e.:
EU funded and co-funded projects related to ICZM and/or coastal information systems, in
particular considering INTERREG projects or other EC programmes aiming to the devel-
opment of operative tools and procedures (such as MAREMED, COASTANCE, BALCICA,
ASTRA, SUSTAIN, IMCORE, TIDE, SUSCOD, C-SCOPE, BLAST PROJECT,
PLANCOAST, BALTSEAPLAN, BALTICMASTER, COASTALPRACTICE, COREPOINT,
SAFECOAST, MESSINA, DEDUCE, COASTMAN, BALTICGREENBELT, COPRANET,
BEACHMED, ENVIFACILITATE, etc.);
Main research projects co-financed by EU (FP6 and FP7 principally) related to ICZM
and/or coastal information system (such as ENCORA, MICORE, SPICOSA, PEGASO,
THESEUS, CONSCIENCE, DITTY, etc.);
Other projects directly commissioned by the European Commission such as EUROSION
and in particular OURCOAST, dealing with an overview and analysis of ICZM best prac-
tices in Europe;
Relevant non-EU initiatives, i.e. illustrative examples from United States and other coun-
tries such as Australia;
Scientific literature;

21807-REL-T002.1 page 10/337
Other information available on Internet about implemented and used coastal information
system; particular attention has been given to available on-line CIS and to international
network (ICAN, EUCC network, BALTIC LAGOON network, PAP/RAC network,
ANCORIM, etc);
Other internet sources, including among the others web-sites of: Regional Sea Commis-
sions, other International Organisations (such as the European Environmental Agency),
and Regional Administrative Authorities.
The overview analysis therefore describes a number of illustrative examples of coastal infor-
mation systems in order to depict their main characteristics, in particular in relation to their use
within the ICZM process. The analysis has attempted to consider a set of illustrative examples
representative of the various EU coastal states, different geographical coverage (regional, na-
tional, sub-national, local), different coastal systems (e.g. coastal lagoon, estuary, highly ur-
banised coastal areas, high-value natural coastal areas, regional sea, etc.). Due to relevance
given by the project to operational systems actually supporting ICZM, a higher number of illus-
trative cases actually refers to the local and the sub-national scale (see introductive section of
chapter 3), where ICZM processes are mainly concretely implemented. Each coastal infor-
mation system is described by means of an analytical table. Structure and contents of the
summary table is reported below.
1 General Information
1a Name Name and/or acronym of the analysed CIS
1b Description Short description of the CIS
1c Operating entity Name of the entity (institution, public authority, private entity, or any other typology) that is responsible for the operation of the CIS
1d Management structure
Structure, within the operating entity, that is responsible for the management of the CIS
1e Contacts Web-site, e-mail and/or address
1f Typology Operational (used or ready to be used), pre-operational (tested to be developed in a ready to be used-system) or pilot system (partly developed and tested)
2 Operational context and information content
2a ICZM dimensions Does the information included in the CIS address one or more ICZM dimension: territory, environment, economy, society, gov-ernance?
2b ICZM sectors
List of considered information sectors, including for example: driv-ers of coastal processes (e.g. hydrodynamic, tides, geomorpholo-gy, climate change, etc.), human activities (fishery, tourism, ener-gy production, industry, agriculture, port activity, transportation, urbanisation, nature protection, recreational use, etc.), impacts on the coastal system, coastal vulnerability, measures for coastal ad-aptation, etc.
21807-REL-T002.1 page 11/337
2c Integration Does the CIS provide any integration among the identified sec-tors/dimensions, e.g. by means of integrated indicators or maps?
2d Spatial scale
Operating scale(s) of the CIS; European, regional (e.g. Mediterra-nean Sea, Baltic Sea, Black Sea. North-east Atlantic Ocean), na-tional, sub-national, local and specification of the considered coastal area/s. e.g. Local scale – Lagoon of Venice and its drain-age basin
2e Flexibility
Has the CIS been developed in order to be applied only to a spe-cific coastal territory (e.g. the Lagoon of Venice) or as a tool that can be applied to various similar coastal contexts (e.g. coastal la-goons in general)?
3 ICZM functionalities
3a Knowledge related functionalities
Does the CIS provide knowledge functionalities supporting the ICZM process? i.e.:
Integration among information dimensions and/or sec-tors supporting integrated assessment;
Availability of spatial information, i.e. not only maps but proper GIS data on the coastal system (dynamic map-ping vs static mapping);
Operation at different spatial scales;
Multi-time data and information;
Inclusion of relevant ICZM indicators1;
Inclusion of functionalities or maps related to assess-ment of coastal vulnerability to climate change;
Inclusion of ICZM best-practices database;
Others
3b Process related func-tionalities
Does the CIS provide process functionalities supporting the ICZM process? i.e.:
Problem understanding (e.g. definition of impacts, risk and vulnerability) and structuring (i.e. conceptual model-ling of problems);
Stakeholder involvement and participation;
Vision building and scenario development;
Assessment of alternatives in planning and/or man-agement;
Monitoring and evaluation;
Adaptive planning and management;
Others
1 Considered ICZM indicators are the 27 ones defined by the Deduce project (http://www.deduce.eu/index.html) and the work performed by the Working Group on Indicators and Data.
21807-REL-T002.1 page 12/337
4 Users
4a User typology
List of target users, including the following possible ones: Poli-cy-makers, Decision-makers, Coastal planners and/or manag-ers, Specialised and expert users, Representative of private sectors (e.g. industrial or energy companies); Civil society (i.e. general users, NGOs or any other representative of the civil so-ciety that are interested in being informed on and/or participat-ing in ICZM)
5 Use of the system
5a Accessibility
Access to the CIS:
Free access on-line (access allowed to all users with or without password) to the complete CIS;
Free access on line (access allowed to all users with or without password) to part of the CIS;
Restricted access on-line (e.g. access allowed only to restricted users such as researchers);
Only off-line access.
5b User-friendliness
Expert judgment on the user-friendliness of the system: low, medium, high. The expert judgment of user-friendliness will be evaluated through the analysis of available interface in case of on-line access or available documentations in case of off-line access to the CIS.
5c Interactiveness
Availability of Web 2.0 tools or other e-participation tools (e.g. on-line forum, blogs, video-sharing, chat, interactive web-GIS) enabling a high level of interaction between external users and the CIS.
5d Data access
Availability of functionalities enabling direct access to data, in particular:
Availability of downloadable data;
Availability of downloadable maps;
Availability of downloadable spatial data (GIS layer);
Meta-data provision.
6 Technological characteristics
6a Used technology Typology of the used technological platform: (i) open source, (ii) licensed software, (iii) mixed solution, (iv) other (non-IT).
6b Integration with other tools
Is the CIS integrated with tools providing specific functionalities managed/operated by the same or other entities? Including the following possible ones: models (e.g. morphological, environ-mental or hydrological models), relational database, Decision Support System, others.
21807-REL-T002.1 page 13/337
6c Integration with other CIS
Is the analysed CIS connected/integrated with other CISs? A specific CIS may be part of a network of costal information sys-tems sharing the same general structure and enabling mutual interchange of data.
6d Interoperability
Expert judgment on the basis of above information or specific information provided on this issue: low, medium, high.
Interoperability is intended as the possibility for spatial data sets to be combined, and for services to interact, without repetitive manual intervention, in such a way that the result is coherent and the added value of the data sets and services is enhance
7 Cost/resources
7a Resources If possible, investment cost (where available); costs and human resources to operate the systems (estimates, where available)
Available information varies significantly; most advanced and well-known coastal information
systems are described in details while information on less popular ones (that however may be
relevant for the implementation of the ICZM process, in particular at the local level) may be
less available. Some systems are totally accessible on line, while others only partially or not at
all. The description of coastal information systems considered in the overview analysis varies
consequently. Contents of analytical tables actually depends on information availability; for
some illustrative cases available information have been not sufficient to describe some of the
characteristics addressed by the analytical tables. In such case these specific fields (rather
few) remain blank.
2.2 In-depth description of selected coastal information sys-tems
Out of the overview analysis a subset of coastal information systems was selected for an in-
depth description. Selection was based on the qualitative analysis of all CISs characteristics
highlighted by the general overview (except those related to the general description of the
CIS), in particular focusing on those information of the analytical table strictly related to the
ICZM implementation, as described in section 5.1 illustrating the rationale of the selection pro-
cedure. In order to be sure that interesting coastal information systems were not left out of the
choice, a review of the results of the expert judgment was also done. Relevant examples of
coastal information systems, in particular those considering a multitude of coastal sectors,
and/or having a wide set of ICZM knowledge and process related functionalities, have been be
anyway taken into account for the following in-depth description. The review of the expert
judgment analysis aimed also to ensure the selection of a set of systems representative of dif-
ferent coastal management contexts and application scales (regional, national, sub-national
and local).
21807-REL-T002.1 page 14/337
Selected systems were then described in details. The analysis investigated the following top-
ics and sub-topics. Some of them represent further specification of issues addressed in the
overview analysis, while others are new ones:
General Information
Name and acronym of the CIS;
Description;
Operating entity;
Contacts;
Typology.
Operational context and information content
Further description of the CIS information content (i.e. addressed ICZM dimensions
and sectors) and the integration among different information typologies;
Metadata management and availability;
Data and information providers (e.g. universities, other research institution, statistics
institutions, environmental agencies, cartographic institutions or agencies, etc.);
Scalability and flexibility of the system.
Technological characteristics
Used technology;
Integration with other tools (e.g. models, relational database, decision support sys-
tems, etc.);
Integration with other coastal information systems;
Interoperability.
ICZM related functionalities
Detailed description of ICZM knowledge related functionalities identified by the over-
view analysis, including: integration among dimensions and/or sectors supporting in-
tegrated assessment; availability of spatial information, i.e. not only maps but proper
GIS data on the coastal system (dynamic mapping vs. static mapping); operation at
different spatial scales; multi-time data and information; inclusion of relevant ICZM in-
dicators; inclusion of functionalities or maps related to assessment of coastal vulnera-
bility to climate change; inclusion of ICZM best-practices database; others;
Detailed description of ICZM process related functionalities identified by the overview
analysis: problem understanding (e.g. definition of impacts, risk and vulnerability) and
structuring (i.e. conceptual modelling of problems); stakeholder involvement and par-
ticipation; vision building and scenario development; assessment of alternatives in
planning and/or management; monitoring and evaluation; adaptive planning and man-
agement; others;
21807-REL-T002.1 page 15/337
Availability of summary information that can directly support the ICZM process, includ-
ing: indicators (specifically ICZM ones), integrated maps (e.g. composite impact on
the coastal system, coastal risk, costal vulnerability, integrated coastal zone planning,
marine spatial planning), graphs, summary reports, fact sheets, etc..
System development and management
CIS developer;
Description of difficulties encountered in developing the system, such as for example:
obstacles related to data acquisition and integration (e.g. heterogeneity of data format,
lack of metadata, etc.), obstacles in institutional cooperation, budget limitation, techno-
logical problems, etc.;
Costs related to the system development;
Description of management modalities, including: (i) structure and roles (e.g. system
management, data management, data check and validation, data publication, interac-
tion with external users, etc.) of the specific entities (e.g. a specific department of the
public administration) responsible for the CIS management, (ii) data and software up-
dating;
Cost related to system management, human resources;
Users’ description, including: multiple/single users, user levels and relative privileges,
user typologies, access modalities, management of user access.
Experience with the implementation
Description of the actual use of the CIS, such as for example management of coastal
data, data sharing, communication, coastal monitoring, coastal planning and man-
agement, etc.;
Effective support to ICZM; the analysis will indicate whether the CIS is actually used
within an on-going ICZM process and in case will describe the directly supported
steps: investigation, analysis, assessment, issue prioritisation, planning, management,
monitoring and reviewing.
Conclusive remarks
Conclusive remark on the actual or potential efficacy of the system in supporting the
implementation of the ICZM process; i.e. Does the system provide appropriate infor-
mation and/or functionalities to support the implementation of ICZM in an adaptive
management framework?
Benefits and usefulness of the system.
Information for the in-depth analysis was acquired by means of desk and “field” research. Field
research consisted in remote interviews (e-mail, telephone and/or skype interview) and/or
meetings for direct interview with representative of the CIS operating entity (see Annex I).
21807-REL-T002.1 page 16/337
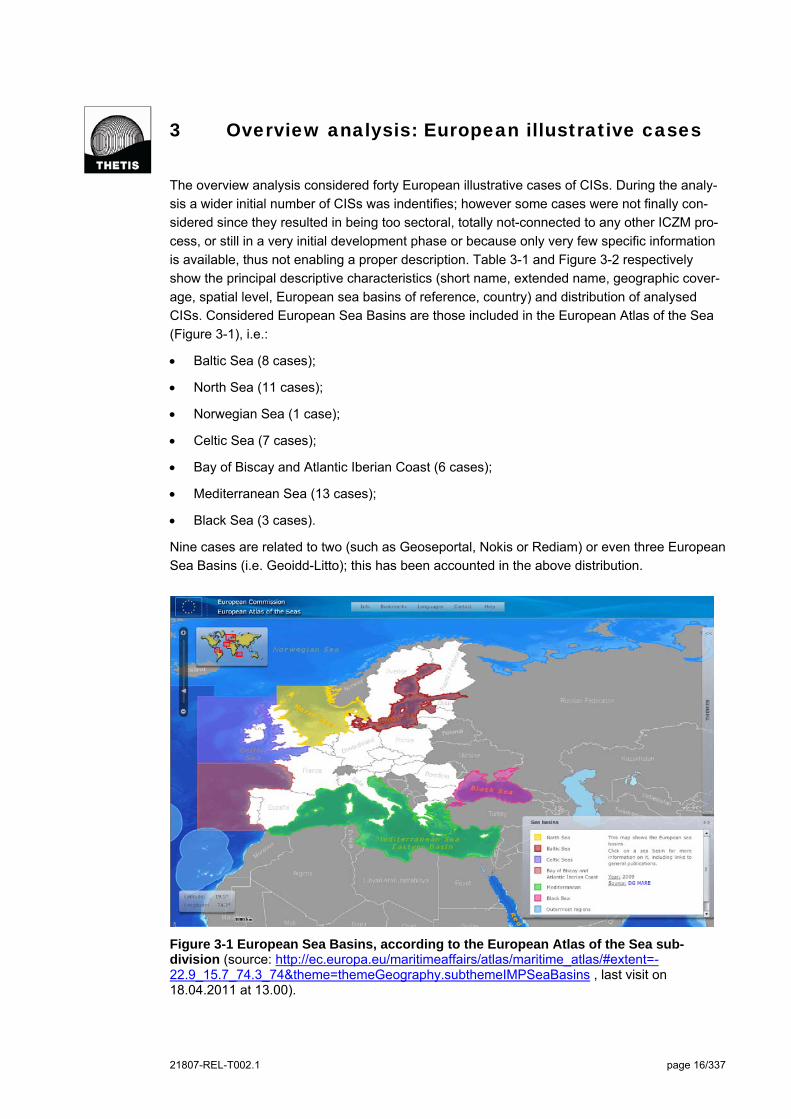
3 Overview analysis: European illustrative cases
The overview analysis considered forty European illustrative cases of CISs. During the analy-
sis a wider initial number of CISs was indentifies; however some cases were not finally con-
sidered since they resulted in being too sectoral, totally not-connected to any other ICZM pro-
cess, or still in a very initial development phase or because only very few specific information
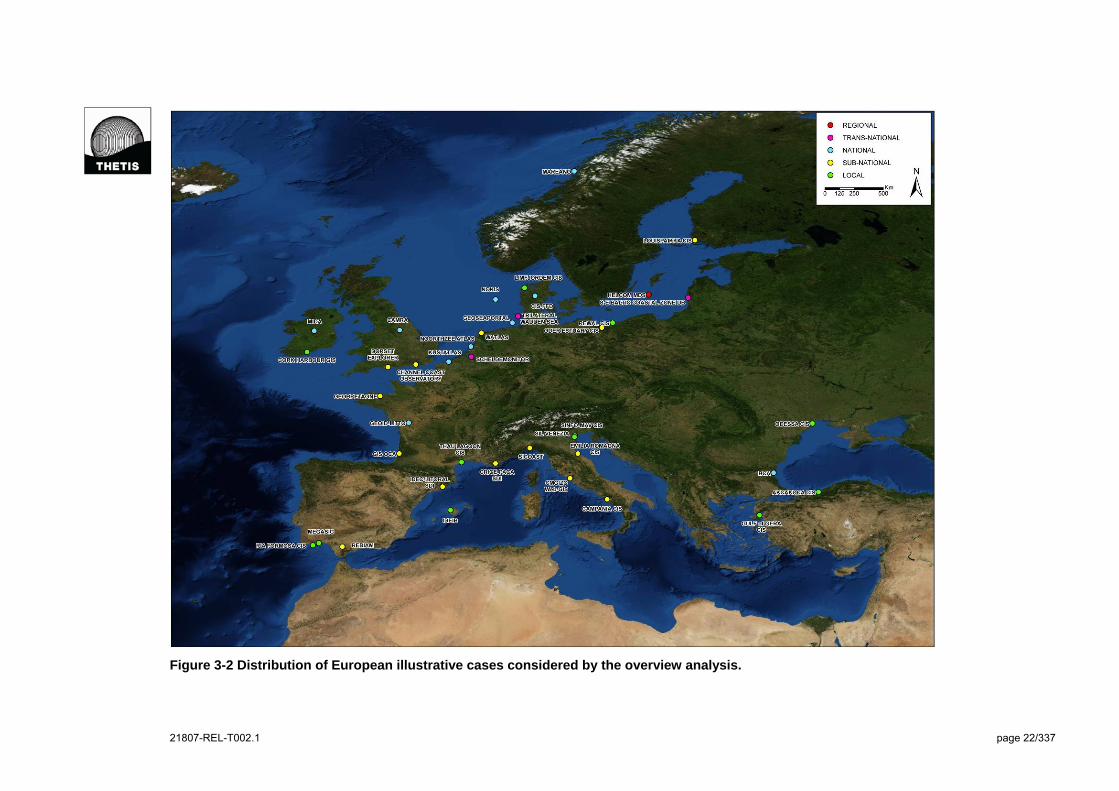
is available, thus not enabling a proper description. Table 3-1 and Figure 3-2 respectively
show the principal descriptive characteristics (short name, extended name, geographic cover-
age, spatial level, European sea basins of reference, country) and distribution of analysed
CISs. Considered European Sea Basins are those included in the European Atlas of the Sea
(Figure 3-1), i.e.:
Baltic Sea (8 cases);
North Sea (11 cases);
Norwegian Sea (1 case);
Celtic Sea (7 cases);
Bay of Biscay and Atlantic Iberian Coast (6 cases);
Mediterranean Sea (13 cases);
Black Sea (3 cases).
Nine cases are related to two (such as Geoseportal, Nokis or Rediam) or even three European
Sea Basins (i.e. Geoidd-Litto); this has been accounted in the above distribution.
Figure 3-1 European Sea Basins, according to the European Atlas of the Sea sub-division (source: http://ec.europa.eu/maritimeaffairs/atlas/maritime_atlas/#extent=-22.9_15.7_74.3_74&theme=themeGeography.subthemeIMPSeaBasins , last visit on 18.04.2011 at 13.00).
21807-REL-T002.1 page 17/337
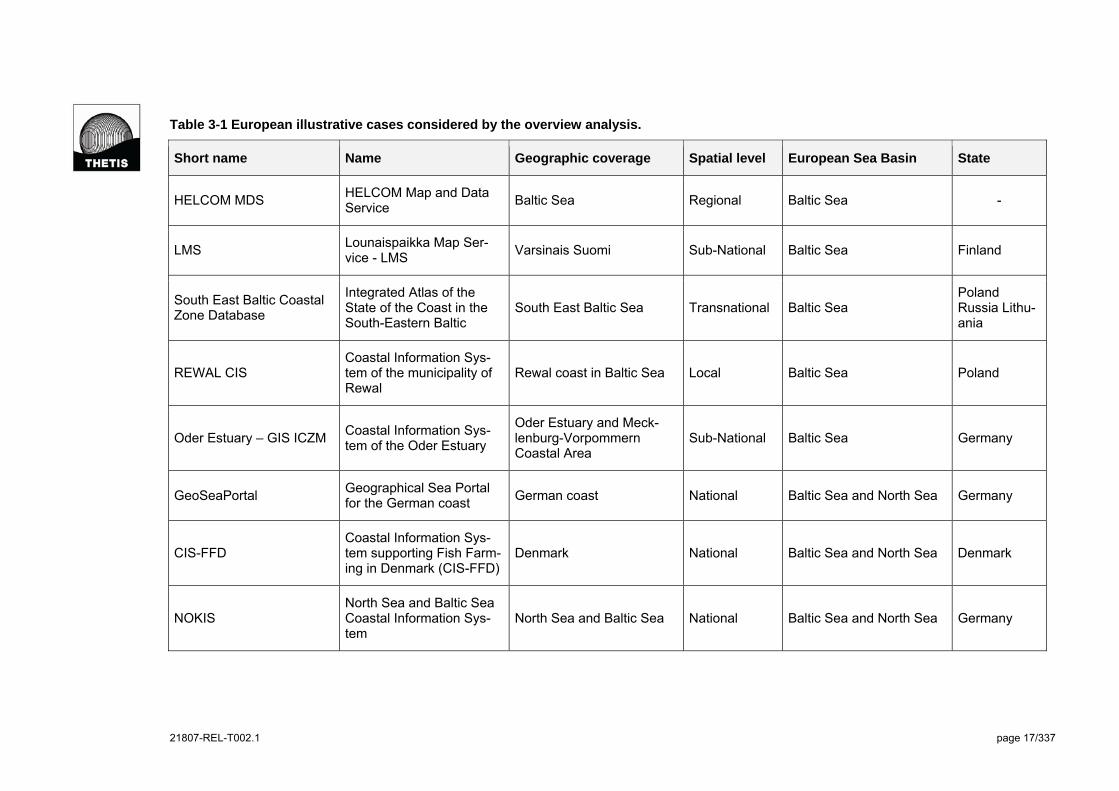
Table 3-1 European illustrative cases considered by the overview analysis.
Short name Name Geographic coverage Spatial level European Sea Basin State
HELCOM MDS HELCOM Map and Data Service
Baltic Sea Regional Baltic Sea -
LMS Lounaispaikka Map Ser-vice - LMS
Varsinais Suomi Sub-National Baltic Sea Finland
South East Baltic Coastal Zone Database
Integrated Atlas of the State of the Coast in the South-Eastern Baltic
South East Baltic Sea Transnational Baltic Sea Poland Russia Lithu-ania
REWAL CIS Coastal Information Sys-tem of the municipality of Rewal
Rewal coast in Baltic Sea Local Baltic Sea Poland
Oder Estuary – GIS ICZM Coastal Information Sys-tem of the Oder Estuary
Oder Estuary and Meck-lenburg-Vorpommern Coastal Area
Sub-National Baltic Sea Germany
GeoSeaPortal Geographical Sea Portal for the German coast
German coast National Baltic Sea and North Sea Germany
CIS-FFD Coastal Information Sys-tem supporting Fish Farm-ing in Denmark (CIS-FFD)
Denmark National Baltic Sea and North Sea Denmark
NOKIS North Sea and Baltic Sea Coastal Information Sys-tem
North Sea and Baltic Sea National Baltic Sea and North Sea Germany

21807-REL-T002.1 page 18/337
Short name Name Geographic coverage Spatial level European Sea Basin State
LIMFJORDEN CIS Limfjorden Coastal Infor-mation System
Limfjorden Local North Sea Denmark
The Trilateral Wadden Sea Cooperation web-site
The Trilateral Wadden Sea Cooperation web-site
Wadden Sea (The Nether-lands, Denmark and Ger-many)
Transnational North Sea Netherlands, Denmark and Germany
ScheldeMonitor web portal ScheldeMonitor web portal Dutch and Belgian Transnational North Sea Belgium-Netherlands
North Sea Atlas North Sea Atlas (Noord Zee Atlas)
North Sea Dutch coastal area
National North Sea Netherlands
WATLAS WATLAS (Wadden Sea Atlas) and the Wadden Sea Portal
Dutch Wadden Sea Sub-National North Sea Netherlands
KUSTATLAS KustAtlas - Belgian Coastal Atlas
Belgium coast National North Sea Belgium
MAREANO Marine Area Database for Norwegian coastal and marine regions
Norwegian coast National North Sea and Norwegian Sea
Norway
CAMRA UK Coastal and Marine Resource Atlas (CAMRA).
United Kingdom National North Sea and Celtic Sea Great Britain
MIDA The Marine Irish Digital Atlas
Ireland coast National Celtic Sea Ireland

21807-REL-T002.1 page 19/337
Short name Name Geographic coverage Spatial level European Sea Basin State
CCO-CIS Channel Coast Observato-ry Coastal Information System
Southern England Coast (English Channel)
Sub-National Celtic Sea Great Britain
DORSET EXPLORER Dorset Explorer and Dor-set Coastal Explorer
Dorset coast Sub-National Celtic Sea Great Britain
CORK HARBOUR GIS Cork Harbour Geographic Information System
Cork harbour Local Celtic Sea Ireland
GEOIDD-LITTO Geography and indicators related to coastal sustain-able development
French Coastal Area National Celtic Sea, Bay of Biscay and Atlantic Iberian Coast and Mediterranean Sea
France
GÉOBretagne GÉOBretagne Bretagne coast Sub-National Celtic Sea and Bay of Bis-cay and Atlantic Iberian Coast
France
OCA-CIS Aquitaine Coast Observa-tory Coastal Information System
Aquitania coast Sub-National Bay of Biscay and Atlantic Iberian Coast
France
RIA FORMOSA CIS Ria Formosa Coastal In-formation System
Ria Formosa Local Bay of Biscay and Atlantic Iberian Coast
Portugal
MEGASIG
Monitoring and Environ-mental management of the Guardiana Estuary Salt Marshes
Guadiana Estuary Local Bay of Biscay and Atlantic Iberian Coast
Portugal and Spain
21807-REL-T002.1 page 20/337
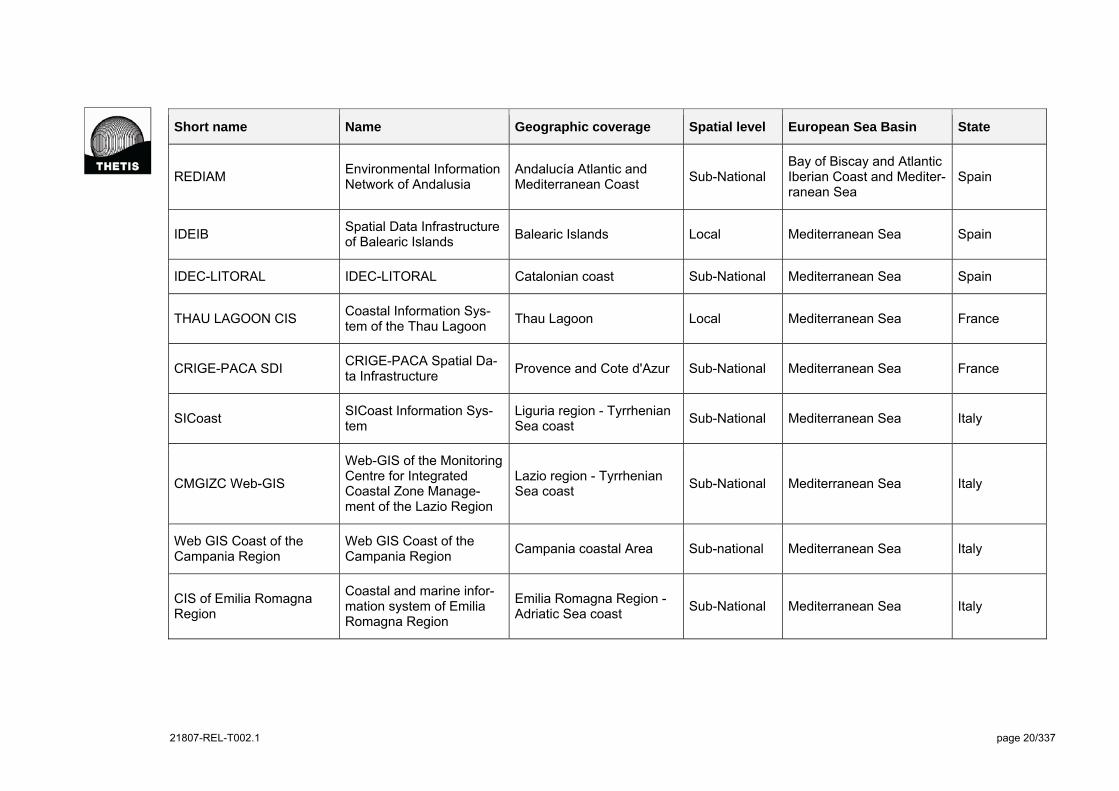
Short name Name Geographic coverage Spatial level European Sea Basin State
REDIAM Environmental Information Network of Andalusia
Andalucía Atlantic and Mediterranean Coast
Sub-National Bay of Biscay and Atlantic Iberian Coast and Mediter-ranean Sea
Spain
IDEIB Spatial Data Infrastructure of Balearic Islands
Balearic Islands Local Mediterranean Sea Spain
IDEC-LITORAL IDEC-LITORAL Catalonian coast Sub-National Mediterranean Sea Spain
THAU LAGOON CIS Coastal Information Sys-tem of the Thau Lagoon
Thau Lagoon Local Mediterranean Sea France
CRIGE-PACA SDI CRIGE-PACA Spatial Da-ta Infrastructure
Provence and Cote d'Azur Sub-National Mediterranean Sea France
SICoast SICoast Information Sys-tem
Liguria region - Tyrrhenian Sea coast
Sub-National Mediterranean Sea Italy
CMGIZC Web-GIS
Web-GIS of the Monitoring Centre for Integrated Coastal Zone Manage-ment of the Lazio Region
Lazio region - Tyrrhenian Sea coast
Sub-National Mediterranean Sea Italy
Web GIS Coast of the Campania Region
Web GIS Coast of the Campania Region
Campania coastal Area Sub-national Mediterranean Sea Italy
CIS of Emilia Romagna Region
Coastal and marine infor-mation system of Emilia Romagna Region
Emilia Romagna Region - Adriatic Sea coast
Sub-National Mediterranean Sea Italy
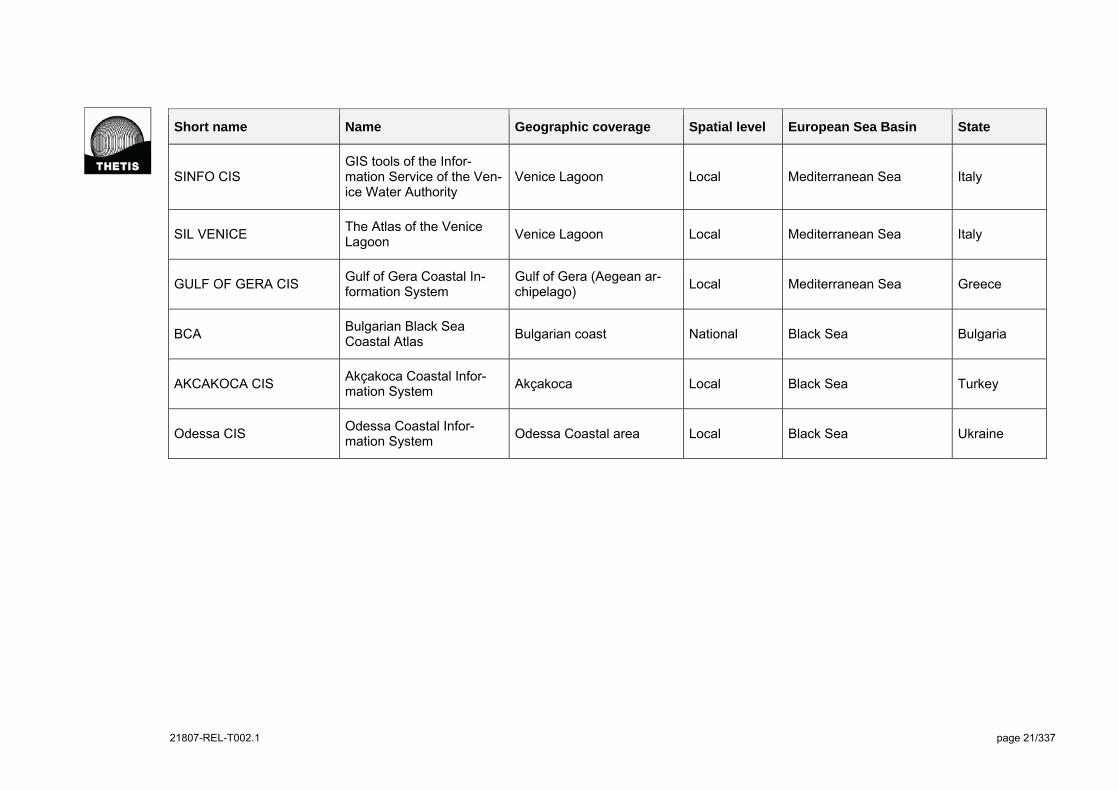
21807-REL-T002.1 page 21/337
Short name Name Geographic coverage Spatial level European Sea Basin State
SINFO CIS GIS tools of the Infor-mation Service of the Ven-ice Water Authority
Venice Lagoon Local Mediterranean Sea Italy
SIL VENICE The Atlas of the Venice Lagoon
Venice Lagoon Local Mediterranean Sea Italy
GULF OF GERA CIS Gulf of Gera Coastal In-formation System
Gulf of Gera (Aegean ar-chipelago)
Local Mediterranean Sea Greece
BCA Bulgarian Black Sea Coastal Atlas
Bulgarian coast National Black Sea Bulgaria
AKCAKOCA CIS Akçakoca Coastal Infor-mation System
Akçakoca Local Black Sea Turkey
Odessa CIS Odessa Coastal Infor-mation System
Odessa Coastal area Local Black Sea Ukraine
21807-REL-T002.1 page 22/337
Figure 3-2 Distribution of European illustrative cases considered by the overview analysis.
21807-REL-T002.1 page 23/337
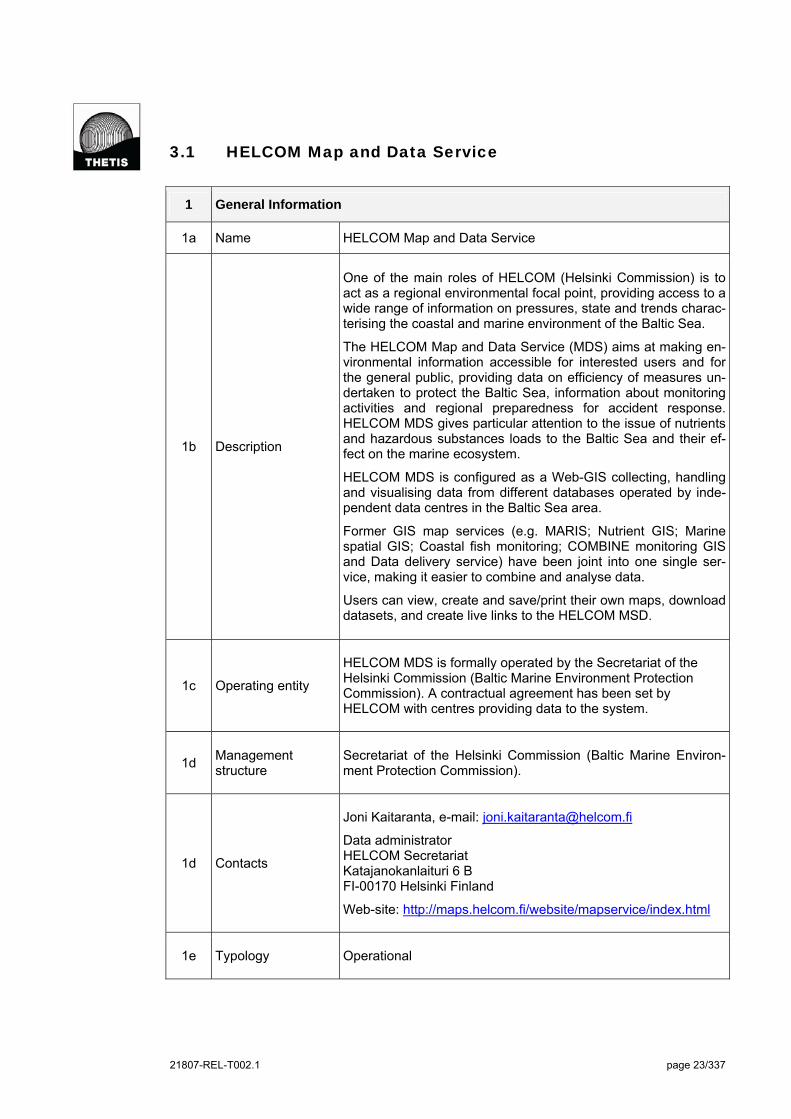
3.1 HELCOM Map and Data Service
1 General Information
1a Name HELCOM Map and Data Service
1b Description
One of the main roles of HELCOM (Helsinki Commission) is to act as a regional environmental focal point, providing access to a wide range of information on pressures, state and trends charac-terising the coastal and marine environment of the Baltic Sea.
The HELCOM Map and Data Service (MDS) aims at making en-vironmental information accessible for interested users and for the general public, providing data on efficiency of measures un-dertaken to protect the Baltic Sea, information about monitoring activities and regional preparedness for accident response. HELCOM MDS gives particular attention to the issue of nutrients and hazardous substances loads to the Baltic Sea and their ef-fect on the marine ecosystem.
HELCOM MDS is configured as a Web-GIS collecting, handling and visualising data from different databases operated by inde-pendent data centres in the Baltic Sea area.
Former GIS map services (e.g. MARIS; Nutrient GIS; Marine spatial GIS; Coastal fish monitoring; COMBINE monitoring GIS and Data delivery service) have been joint into one single ser-vice, making it easier to combine and analyse data.
Users can view, create and save/print their own maps, download datasets, and create live links to the HELCOM MSD.
1c Operating entity
HELCOM MDS is formally operated by the Secretariat of the Helsinki Commission (Baltic Marine Environment Protection Commission). A contractual agreement has been set by HELCOM with centres providing data to the system.
1d Management structure
Secretariat of the Helsinki Commission (Baltic Marine Environ-ment Protection Commission).
1d Contacts
Joni Kaitaranta, e-mail: [email protected]
Data administrator HELCOM Secretariat Katajanokanlaituri 6 B FI-00170 Helsinki Finland
Web-site: http://maps.helcom.fi/website/mapservice/index.html
1e Typology Operational
21807-REL-T002.1 page 24/337
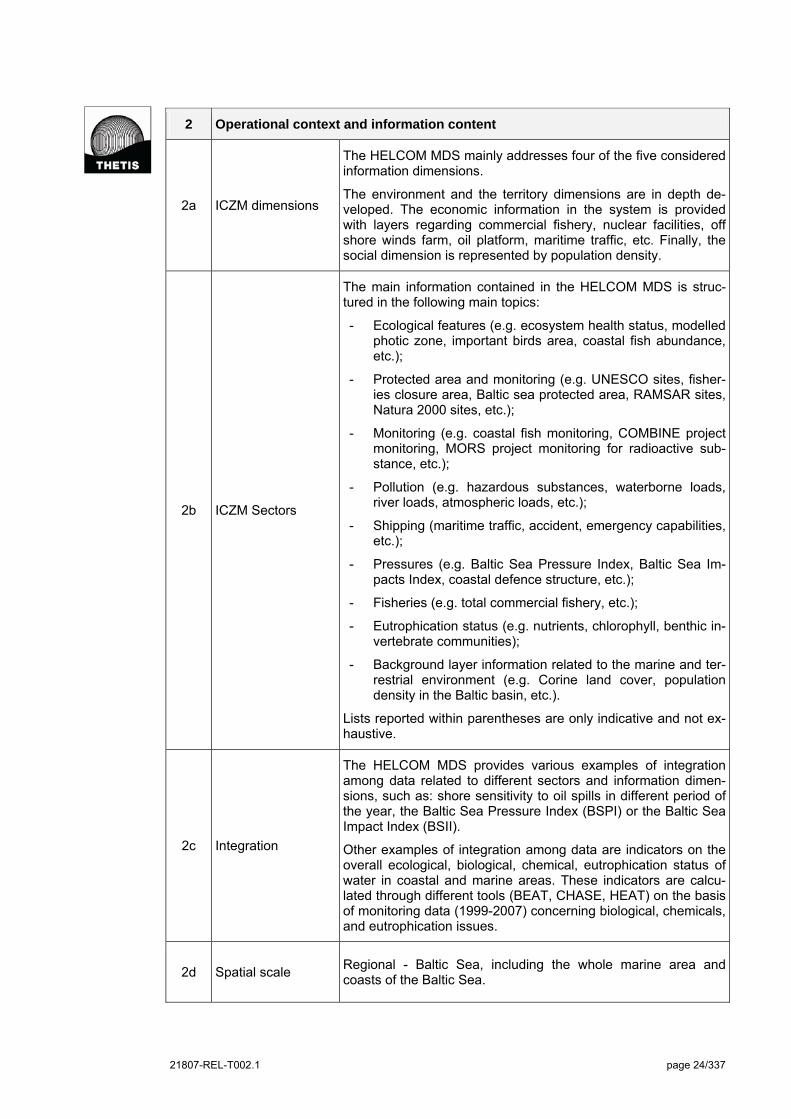
2 Operational context and information content
2a ICZM dimensions
The HELCOM MDS mainly addresses four of the five considered information dimensions.
The environment and the territory dimensions are in depth de-veloped. The economic information in the system is provided with layers regarding commercial fishery, nuclear facilities, off shore winds farm, oil platform, maritime traffic, etc. Finally, the social dimension is represented by population density.
2b ICZM Sectors
The main information contained in the HELCOM MDS is struc-tured in the following main topics:
- Ecological features (e.g. ecosystem health status, modelled photic zone, important birds area, coastal fish abundance, etc.);
- Protected area and monitoring (e.g. UNESCO sites, fisher-ies closure area, Baltic sea protected area, RAMSAR sites, Natura 2000 sites, etc.);
- Monitoring (e.g. coastal fish monitoring, COMBINE project monitoring, MORS project monitoring for radioactive sub-stance, etc.);
- Pollution (e.g. hazardous substances, waterborne loads, river loads, atmospheric loads, etc.);
- Shipping (maritime traffic, accident, emergency capabilities, etc.);
- Pressures (e.g. Baltic Sea Pressure Index, Baltic Sea Im-pacts Index, coastal defence structure, etc.);
- Fisheries (e.g. total commercial fishery, etc.);
- Eutrophication status (e.g. nutrients, chlorophyll, benthic in-vertebrate communities);
- Background layer information related to the marine and ter-restrial environment (e.g. Corine land cover, population density in the Baltic basin, etc.).
Lists reported within parentheses are only indicative and not ex-haustive.
2c Integration
The HELCOM MDS provides various examples of integration among data related to different sectors and information dimen-sions, such as: shore sensitivity to oil spills in different period of the year, the Baltic Sea Pressure Index (BSPI) or the Baltic Sea Impact Index (BSII).
Other examples of integration among data are indicators on the overall ecological, biological, chemical, eutrophication status of water in coastal and marine areas. These indicators are calcu-lated through different tools (BEAT, CHASE, HEAT) on the basis of monitoring data (1999-2007) concerning biological, chemicals, and eutrophication issues.
2d Spatial scale Regional - Baltic Sea, including the whole marine area and coasts of the Baltic Sea.

21807-REL-T002.1 page 25/337
The system can operate at different scales: from the Regional Sea one to local scales.
2e Flexibility HELCOM MDS is specifically developed to address Baltic Sea specificities.
3 ICZM functionalities
3a Knowledge related functionalities
HELCOM MDS provides some of the knowledge related func-tionalities considered by the analysis; specifically:
- Integration among different information sectors (see point 2c);
- Availability of spatial data; the system allows the download of GIS layers in shape file format;
- Operation at the different spatial scale; some of the availa-ble spatial data can be re-scaled according to the consid-ered spatial extent; thus enabling to visualize more details at a higher scales;
- Some of the information provided match some of the ICZM indicators, such as for example amount of pollution, con-centration of nutrients, volume of port traffic, area of sea protected by statutory designation.
3b Process related functionalities
HELCOM MDS provides a high variety of data on the marine and costal system organised in an articulated structure; it can there-fore support problem understanding and structuring in the Baltic Sea.
More in general the system is intended to provide knowledge-based support to the activities of the Helsinki Commission relat-ed to the integrated planning and management of the marine and coastal environment of the Baltic Sea. Indeed, HELCOM MDS acting as data integrator is one of the fundamental infor-mation systems for the Baltic Sea management at the Regional Sea level.
4 Users
4a User typology
List of target users, including the following ones:
- Decision-makers, at the Regional Sea level;
- Coastal planners and/or managers, at the Regional Sea level;
- Specialised and expert users;
- Civil society, for awareness and communication issues re-lated to the sustainable use of the Baltic Sea;
- Others: teachers and students for education programmes.
21807-REL-T002.1 page 26/337
5 Use of the system
5a Accessibility Free access on-line to all contents and functionalities.
5b User-friendliness
Highly user-friendly
HELCOM MDS is provided with customised interfaces that are rather simple to be used. Moreover use of the system is support-ed by a detailed and simply usable “User Manual” and a FAQ (frequently asked questions) section that provides ready infor-mation on main questions related to the use of system. All the system interfaces and metadata sheets are in English.
5c Interactiveness HELCOM MDS includes a feedback tool to send suggestions in order to improve system’s functionalities and contents.
5d Data access
The system enables the download of the great part of spatial da-ta and also provides functionalities for the direct connection to the HELCOM GIS-Server via Web Map Service (WMS) interface.
Finally, HELCOM MDS allows the easy access to detailed and clear metadata (metadata sheets) for all the available layers.
6 Technological characteristics
6a Used technology ESRI ArcGis Server 9.3.1 and Flex (licensed software).
6b Integration with other tools
HELCOM MDS is configured as a Web-GIS collecting (via WMS) handling and visualising data from different GIS databases oper-ated by independent data centres in the Baltic Sea area. The adopted solution enables to directly link the above GIS data-bases to the HELCOM MDS platform that is used to visualise this information in an integrate way. Management and update of single databases are ensured by the relative data managers and providers.
The site of the Helsinki Commission provides links to other rele-vant - for the Baltic Sea – web-sites for database and map ser-vices related to the activities of the same Commission, whose data are at least partially viewable through and integrated within the HELCOM MDS. These are
- COMBINE monitoring data, downloadable from ICES Oceanographic database and viewable and downloadable in the ICES EcoSystemData map service (http://ecosystemdata.ices.dk/map/index.aspx);
- HELCOM MORS; database of the MORS project dealing with monitoring of radioactive substances in water, sedi-ments, and biota downloaded via International Atomic En-ergy Agency's Marine Information System (http://maris.iaea.org). In the HELCOM MDS only monitor-ing stations, not data, are shown;
- Data and metadata produced by the EU funded project BALANCE (Baltic Sea Management – Nature Conservation and Sustainable Development of the Ecosystem through Spatial Planning, http://www.helcom.fi/GIS/BalanceData/en_GB/main/). Part

21807-REL-T002.1 page 27/337
of the BALANCE datasets can be visualized and download-ed in the HELCOM Map and Data Service.
HELCOM Baltic Sea Protected Area (BSPA) database, contain-ing a wide range of information on protected areas of this Re-gional Sea, hosted in the HELCOM website (http://bspa.helcom.fi/), is completely disjointed from HELCOM MDS.
6c Integration with other CIS
In the case of HELCOM this issue is strictly connected with and therefore addressed in point 6b.
6d Interoperability
High.
Most of the dataset included in the HELCOM MDS are availablevia WMS. The HELCOM MDS provides Open Geospatial Con-sortium compliant Web Map Services (WMS) so that the user can access available layers directly from its own client. This guarantees a high interoperability of the system.
Metadata are structured and described according to the standard ISO 19115, being therefore complying with the INSPIRE Di-rective.
7 Cost/Resources
7a Resources 3 persons full time from 2009 for CIS implementation. 4 persons for system management.
Web-site consultation:
http://www.helcom.fi/GIS/en_GB/HelcomGIS/; last visit on 07/02/2011 at 10.38.
http://maps.helcom.fi/website/mapservice/index.html; last visit on 07/02/2011 at
10.40.
MARIS: Maritime Accident Response Information System:
http://www.ymparisto.fi/default.asp?node=13181&lan=en; last visit on
07/02/2011 at 13.00.
http://gis.ekoi.lt/gis/index.php; last visit on 18/02/2011 at 10.00.
http://www.hnit-baltic.lt/; HNIT-Baltic Geoinfoservisas, last visit on 18/02/2011 at
10.00.
21807-REL-T002.1 page 28/337
3.2 Lounaispaikka Map Service
1 General Information
1a Name Lounaispaikka Map Service (LMS)
1b Description
The ENVIFACILITATE Life project has supported the improvement of a regional Geographic Information (GI) network in the South-Western Region of Finland, called Lounaispaikka. The network is a good example of benefits that may be generated by the collabora-tion of regional actors in the GI field. Key players of the Loun-aispaikka are the: Regional Council, National Land Survey of Fin-land, Geological Survey of Finland, Finnish Environment Institute, Game and fisheries research Institute, Provincial Museum of South-West of Finland and National Board of Antiquities.
Lounaispaikka Map Service (LMS) is one of the results of the col-laborative effort provided by the above network. LMS is a freely In-ternet accessible map service, enabling to share and visualise spa-tial data and metadata provided by the network member organisa-tions (over 120 datasets) for the South-Western Region of Finland. It is based on a distributed architecture and Web Map Service (WMS).
LMS has been in particular created to support the easy access to spatial information of the South-Western Region of Finland. It com-bines a vast collection of spatial information contents into a single and easy to use map interface, in particular dedicated to public administrations and planning experts.
1c Operating entity The secretariat of Lounaispaikka Map Service is located in the Re-gional Council of South-West Finland
1d Management struc-ture
Secretariat of Lounaispaikka Map Service, Regional Council of South-West Finland
1e Contacts
Savola Kaisa, e-mail: [email protected]
Paikkatietoyhteistyön koordinaattori GI samarbetskoordinator Coordinator for GI Co-operation Ratapihankatu 36 20101 Turku
Web-site: www.lounaispaikka.fi
1f Typology Operational
2 Operational context and information content
2a ICZM dimensions
The LMS addresses all the five considered ICZM dimensions. The five dimensions are more or less equally addressed by the LMS that therefore make available a wide information base.
Governance information for example includes maps related to re-gional and local master plans, also related to the coastal area.

21807-REL-T002.1 page 29/337
2b ICZM Sectors
Over 120 datasets are included in the LMS. The following main sectors are covered by LMS:
- Aerial photographs;
- Topographic map;
- Natural aspects (e.g. nature conservation areas, spawning ar-eas, traditional rural biotopes, etc.)
- Administrative boundary;
- Geological information and surface and water system (e.g. geological map, soil map, elevation, drainage basins);
- Land and water use;
- Weather and climate data from fixed stations;
- Transport and traffic information (e.g. railroad network and ter-restrial viability);
- Harbour and commercial traffics line;
- Cable network for the communication;
- Military infrastructure and areas;
- Regional plan and local master plans;
- Social data (e.g. population density);
- Services (e.g. public services in Turku, accessibility of public schools and hospitals, recreation)
- Cultural heritage (built heritage, archaeological sites, historical maps);
- Energy production.
2c Integration The service does not appear to provide examples of integration among different information and sectors
2d Spatial scale
Sub-National Scale - South-Western Region of Finland.
Data contained in the LMS are related to the land component of the coastal and marine system.
2d Flexibility The LMS has been developed in order to be applied specifically to the South-Western Region of Finland. The Lounaispaikka network can support the dissemination of the LMS experience.
3 ICZM functionalities
3a Knowledge related functionalities
LMS provides some of the knowledge related functionalities con-sidered by the analysis, specifically:
- Availability of spatial information; LMS does not allow to di-rectly download data (spatial data may be visualised). Howev-er it provides a very good knowledge about a wide number of data sources, thus supporting data acquisition from direct pro-viders;
- Operation at the different spatial scale; some of the available spatial data can be re-scaled according to the considered spa-tial extent; thus enabling to visualize more details at a higher

21807-REL-T002.1 page 30/337
scales.
3b Process related functionalities
LMS includes a high number and a wide variety of spatial infor-mation; these are organised according to a two level tree struc-tures. LMS structure is well articulated and complete, thus enabling the users to easily find data and information. Thus LMS is well-shaped for problem understanding and structuring.
LMS support data sharing among different regional actors, thus proving a wide set of data for regional planning. In this perspective, it is important to mention that the LMS developing process has in-volved stakeholders in order to address usability problems of the provided data.
4 Users
4a User typology LMS combines a vast collection of spatial information contents into a single and easy to use map interface, mainly dedicated to public authorities and planning experts.
5 Use of the system
5a Accessibility Lounaispaikka is a map service with free access on-line.
5b User-friendliness
High/Medium user friendly.
The easy to use service interface takes into account the needs of both Geographic Information (GI) professionals and every day us-ers with no prior GI knowledge. Intuitive operation of the system. Help on-line documentation could be further improved.
Currently the only used language for all the LMS is the Finnish. In-going implementation includes the development of the English ver-sion of the LMS.
5c Interactiveness
LMS is totally accessible on-line, although only enabling interactive data visualisation. The service does not directly provide e-participation tools, except for a simple feedback tool used by the users to provide suggestions in order to improve the functionality of the system.
However, the Lounaispaikka network strongly supports cooperation and interaction; in particular it provides an Internet forum bringing regional professionals together to discuss issues related to geo-graphic information.
5d Data access
Only metadata consultation is currently available from the LMS. Spatial data cannot be downloaded; however LMS provides com-plete information on data sources, thus supporting data request to original data providers.
6 Technological characteristics
6a Used technology
The LMS is based on open source technologies (MAP SERVER and GEOSERVER and other). Previously the system was devel-oped using ESRI software, but during the last two years the system was converted to open source.
6b Integration with LMS is connected with the University of Turku Spatial Data
21807-REL-T002.1 page 31/337
other tools Achieve. This share the metadata search functionality with the LMS service.
6c Integration with other CIS
The standardised Web Map Service (WMS) interface enables the map application to import geographic data directly from the data providers. For example the LMS includes WMS layers from Nation-al Land Survey of Finland, Finnish Meteorological Institute and Ge-ological Survey of Finland etc.
The use of WMS interfaces guarantee that the information are con-stantly up-to-date.
6d Interoperability
High.
LMS is based on a distributed architecture and Web Map Service (WMS) interfaces that provide spatial from multiple servers to the same map layout.
WMS interfaces guarantee that the information is up-to-date and the system respects the INSPIRE Directive. Also the metadata aim to be organised complying standards of the INSPIRE directive.
7 Cost/Resources
7a Resources
LMS is supported by the Regional Council of South-West Finland, University of Turku, Southwest Finland Regional Environment Cen-tre, Yrkehögskolan Sydväst, Turku School of Economics, Åbo Akademi and Turku University of Applied Sciences.
The development of the system involved a full-time project planner for two years who was in charge of the service renewal and did most of the work related on map service development. In addition, two software developers were hired full-time for a couple of months.
At the moment, operation activities involve only one person dealing with the general coordination of the network. However, the need to involve a full-time person specifically dealing with the map service implementation and update has been highlighted by Kaisa (mail sent on the 28.03.2011)
21807-REL-T002.1 page 32/337
Information sources for the overview analysis of Lounaispaikka Map Service:
Antti Vasanen, 2006. Presentation titled: “Lessons learnt on distributed viewing services
Lounaispaikka Map Service and ICZM Map Viewer of the ENVIFACILITATE”. GI-ENVI
Workshop Turku 6 October 2006;
Toivonen T. and Kalliola R., 2006. Building networks and services for geographical infor-
mation: Lessons learnt in the ENVIFACILITATE project. UTULCC Publications Vol. 12.
University of Turku Laboratory of Computer Cartography 2006.
Tolvanen, H. & R. Kalliola (2008). A structured approach to geographical information in
coastal research and management. Ocean & Coastal Management 51: 6, 485–494.
Kalliola R. and Laurila L., 2009. Contributing Coastal Zone Management by GIS analyses
– The case of Finnish marine Zone. Journal of Coastal Research SI 56 – 1233-1236.
Kaisa Savola, 2011. Information provided by mail on the 28.03.2011 at 14.20, CET time.
Web-site consultation:
http://utu-lcc.utu.fi/; last visit on 9/03/2011 at 16.50;
http://www.lounaispaikka.fi/; last visit on 9/03/2011 at 16.00;
http://envifacilitate.utu.fi/; last visit on 18/03/2011 at 11.00.

21807-REL-T002.1 page 33/337
3.3 Integrated Atlas of the State of the Coast in the South-Eastern Baltic
1 General Information
1a Name Integrated Atlas of the State of the Coast in the South-Eastern Bal-tic
1b Description
The main aim of the “Sustainable Development Indicators for ICZM in the South-Eastern Baltic - SID4SEB” project was to follow and implement the main strategy of the European Parliament and the Council concerning adopted recommendations for the Inte-grated Coastal Zone Management in the South-Eastern Baltic.
The Integrated Atlas of evaluated coastal and marine indicators, set up through GIS tools, is the main result of the project achieve-ments. It covers the Baltic coast of three neighbouring countries: Poland, Russia (Kaliningrad region) and Lithuania. The report of the state of the coast and the related database, accessible from the main web site of the project, show the (static) maps and graphics for each of the 27 indicators (and all related parameters) defined by the Deduce project.
The project web-site also includes a description of the adopted methodology for each developed indicator and the final recom-mendation identified by the project.
1c Operating entity
The project involved the following three partners:
- Maritime Institute in Gdansk (Poland);
- Atlantic Branch of P.P. Shirshov Institute of Oceanology of the Russian Academy of Sciences in Kaliningrad (Russia);
- Coastal Research and Planning Institute at Klaipėda Univer-sity (Lithuania).
1d Management structure
The work has been jointly produced by the 3 partners mentioned at the point 1c
1e Contacts
Contacts:
Klaipėda University; [email protected], tel. +370 46398848
Maritime Institute in Gdansk; [email protected], tel. +48 583013718
Atlantic Branch of Institute of Oceanology, Russian Academy of Sciences in Kaliningrad: chuboris@;ioran.baltnet.ru, tel. +7 (4012) 451574.
Web site: http://corpi.ku.lt/~SDI-4-SEB/index.html
1f Typology Operational
21807-REL-T002.1 page 34/337
2 Operational context and information content
2a ICZM dimensions Including the complete list of the 27 ICZM indicators identified by the Deduce project, the Atlas addresses all the ICZM dimen-sions: territory, environment, economy, society and governance.
2b ICZM Sectors
Data and various information typologies (static maps and/or graphics) area provided for the following 27 indicators.
- Demand for property at the coast
- Area of built-up land
- Development on ‘brownfield’ land
- Demand for road travel at the coast
- Pressure for coastal and marine recreation
- Land take by intensive agriculture
- Amount of semi-natural habitat
- Area of land and sea protected by statutory designations
- Effective management of designated sites
- Changes to significant coastal and marine habitats and species
- Loss of cultural distinctiveness
- Patterns of employment
- Volume of port traffic
- Intensity of tourism
- Sustainable tourism
- Bathing water quality
- Amount of coastal and marine litter
- Amount of nutrients in coastal waters
- Amount of oil pollution
- Degree of social inclusion
- Household prosperity
- Number of second homes
- Fish stocks and fish landings
- Water consumption
- Sea level rise and extreme weather conditions
- Coastal erosion and accretion
- Natural and human assets at risk from flooding
2c Integration
ICZM indicators are in some cases developed through the inte-gration of different information. This is for example the case of the indicators related to flooding risk, including maps on the number of people living in ‘at risk’ area for flooding and the pro-tected areas within the river flood risk zone.
21807-REL-T002.1 page 35/337
2d Spatial scale Transitional scale – Baltic coast of Poland, Russia and Lithuania
2d Flexibility The system has been developed in order to be applied specifi-cally to the selected area of the Baltic Sea
3 ICZM functionalities
3a Knowledge related functionalities
The Atlas is specifically designed and developed on the basis of the 27 ICZM indicators. These provide other ICZM knowledge related functionalities:
- Integration among sectors (see point 2c) for the computa-tion of some of the indicators;
- Multi-time data and information are available for some indi-cators in the form of graphs.
The Atlas does not contains information specifically referring to coastal vulnerability to climate change; however it includes some maps and graphics about sea level rise and storming in the study area.
3b Process related functionalities
The Atlas provides a high variety of data on the marine and cos-tal system organised in an articulated and easy to use structure.
The “State of the coast report”, available in 4 languages (Eng-lish, Lithuanian, Romanian and Polish) is composed of 27 chap-ters, correspondent to the 27 ICZM indicators. Every chapter in-cludes extended texts, images and graphs describing the main results of each monitored indicator, reporting several information such as data sources, results, implication for planning, further needed work. A key message is also provided, summarizing the main achieved results.
This information can support various phases on an ICZM pro-cess addressing the South-Eastern Baltic, in particular in relation to planning, monitoring and adaptive management in general.
It is also important to stress that the Atlas is the results of a trans-national cooperation among three Baltic States, thus stet-ting the basis for a further cooperation in the management of this specific area.
4 Users
4a User typology
A wide typology of target users is expected, since the results of the project achievements have been presented to the public, re-gional, central and local authorities, associations and research organizations trough publications, conferences and meetings. Target users possibly include:
- Decision makers;
- Coastal managers/coastal planners
- Civil society

21807-REL-T002.1 page 36/337
5 Use of the system
5a Accessibility All indicators, and related maps and graphics, are freely acces-sible on-line
5b User-friendliness
Highly user friendly
Maps and graphs can be quickly visualised. Wide explanation on the use and the meaning of each indicator is provided in the methodology section.
The system is available in English.
5c Interactiveness No specific e-participation tools are provided
5d Data access
The Atlas enables to save (as image) only static maps and graphs. Data used to derive the indicators are not available in Internet.
Metadata related to each indictor are included in deception sheet accessible trough the methodology section. This sheet includes information on: indicator objective, parameters used to calculate the indicator, spatial and temporal coverage, data sources, methodology, modality used to present the data, adding value to the data, information on aggregation and disaggregation, notes.
6 Technological characteristics
6a Used technology Not-applicable
6b Integration with oth-er tools
No specific integration with other tools
6c Integration with oth-er CIS
No specific integration with other CIS
6d Interoperability
Not-applicable in relation to the INSPIRE Directive
The Atlas fully meets the requirements of the Deduce Project in relation to the ICZM indicators.
7 Costs/resources
6a Resource
Web-site consultation:
http://corpi.ku.lt/~SDI-4-SEB/index.html, last visit on 24/02/2011 at 09.50
21807-REL-T002.1 page 37/337
3.4 Rewal CIS
1 General Information
1a Name Rewal CIS
1b Description
Rewal CIS was developed within the MESSINA Project (Manag-ing European Shoreline and Sharing Information on Nearshore Areas, part funded by the INTERREG III C West Zone pro-gramme) aiming at implementing the European recommenda-tions for the design of dedicated Geographical Information Sys-tems for the coastal areas developed within the EUROSION EC project.
Rewal CIS mainly focuses on erosion problems and on the relat-ed hazards of a long term near-shore investment in the Rewal area in Poland, and in particular in the Trzęsacz village. The main aim is to monitor past and future cliff erosion, thus providing elaborated scenarios (for the next 1000 years) and maps to coastal authorities and local government and supporting local spatial planning. Urban sprawl and massive tourism (for the ar-chaeological ruins of village of Trzesacz) issues were also con-sidered, completing a socio-economic assessment of the area.
Many datasets (including spatial layers and related attributes) were collected for Rewal area. The data reaching back even to year 1933 consisted of archival and present raster and vector maps, pictures, high resolution space images, coefficients of erosion rate and future investment plans up to 2015. All data were organized in one coordinate system with the use of ArcGIS software and presented in a way to enable display and analysis.
1c Operating entity
Rewal municipal authority
The CIS was developed by the University of Szczecin (Poland) in collaboration with the same Rewal municipality.
1d Management struc-ture
Rewal municipal authority in collaboration with the Laboratory of Remote Sensing and Marine Cartography of the University of Szczecin (Poland)
1e Contacts
Kazimierz Furmanczyk; email: [email protected] University of Szczecin (Poland)
Szakowsky Igor; e-mail: [email protected] University of Szczecin (Poland)
Web-site of the MESSINA Project: http://www.interreg-messina.org
1f Typology Operational
21807-REL-T002.1 page 38/337
2 Operational context and information content
2a ICZM dimensions The CIS mainly focus on tow of the five considered ICZM dimen-sion, in particular the territory and social-economic ones.
2b ICZM Sectors
Main relevant data included in the Rewal CIS are:
- Satellite data and aerial photographs;
- Cadastral/land parcelling data;
- Topographic database;
- 3D digital terrain model;
- Local development and strategy;
- Socio-economic data.
2c Integration No specific integrated data among different information is directly provided within the system
2d Spatial scale
Local – Rewal coastal area.
Rewal municipality is located along the Western Pomeranian coast
2d Flexibility
Rewal CIS was developed according to recommendations for the design of dedicated Geographical Information Systems for coastal areas defined within the EUROSION EC project.
Furthermore, its design and development was based on a previ-ous experience implemented in the neighboured city of Dziwnow, focused on topography and socioeconomic aspects of this city.
3 ICZM functionalities
3a Knowledge related functionalities
In relation to ICZM knowledge related functionalities, the CIS pro-vides multi-time information especially concerning the erosion process, assessed through comparison of rectified air photo-graphs dated 1951, 1973 and 1996.
No other functionalities are provided.
3b Process related functionalities
The CIS was specifically developed to address the current and future erosion risk of the Rewal coastal area within an ICZM per-spective, in particular considering effects on the archaeological ruins of village of Trzesacz and related tourism activity.
In this perspective, Rewal CIS provides data and functionalities supporting scenario development and assessment of planning al-ternatives. Taking into account the past erosion rate the CIS was used to elaborate future erosion scenarios related to two planning alternatives for the archaeological ruins of village of Trzesacz:
- Cliff protection through different systems;
- No specific coastal protection and move existing ruins of Trzesacz to a not affected place.
The main CIS output were coastal risk maps for the next 20, 50, 100 years for the two different proposed scenarios.
The CIS does not provide specific tools and functionalities for the
21807-REL-T002.1 page 39/337
stakeholder participation. However, the design and the develop-ment to the CIS involved the municipality since the early begin-ning. The CIS was also used as a demonstrative tool, informing local stakeholders on coastal problems related to erosion.
4 Users
4a User typology
As alternatives are analyzed in coastal planning and their effects on coastal erosion are evaluated, the main target users can be:
Decision-makers;
Coastal planners and/or managers.
Given the tourist attraction of the site, general public can also be interested in the CIS data.
5 Use of the system
5a Accessibility Only off-line access
5b User-friendliness
5c Interactiveness No specific e-participation tools are provided
5d Data access At the moment, the access of the system is restricted only to off-line users; thus no data and metadata are provided to free ac-cess.
6 Technological characteristics
6a Used technology The CIS was developed with ArcGIS - ESRI software
6b Integration with other tools
The system makes use of a buffering tool, in order to calculate the shoreline changes, based on coefficients of erosion rate. A Model Builder module was also developed to automate the time-consuming analysis of scenario generation (Szakowski and Ben-edyczak, 2007).
6c Integration with other CIS
No specific integration with other CIS
6d Interoperability
7 Cost/resources
7a Resources
Information sources for the overview analysis of Rewal CIS:
MESSINA practical guide, 2006. Integrating the shoreline into spatial policies.
MESSINA Newsletter issue 5 - December 2006.
Szakowski, I. and Benedyczak, R., 2007. Developing coastal erosion effects scenarios
near Trzęsacz village in next 100 years with the use of geoinformatics. Annals of Geo-
matics T. 5, z. 1, s. 105-111, bibliogr. 8 poz. Paper in Polish, abstract in English.
21807-REL-T002.1 page 40/337
3.5 Coastal Information System Oder Estuary 1 General Information
1a Name Coastal Information System Oder Estuary – GIS ICZM
1b Description
The Coastal Information System (CIS) Oder Estuary is a Web-portal collecting scientific information (data, projects results, pub-lications, etc.) about the Oder Estuary Region. The CIS Oder Es-tuary is part of the ICZM-Oder project “Research for an Integrated Coastal Zone Management in the German Oder Estuary Region”, fully described in the Web portal ad this specific address: http://www.ikzm-oder.de/en/projekt-ikzm-oder.html. The ICZM-ODER project has been dealing mainly with the following key top-ics:
- Dialogues and regional participation;
- Internet supported tools for ICZM (e.g. the CIS Oder Estu-ary);
- Spatially integrated regional ICZM;
- Coastal waters in transition (climate change);
- National strategy, training and international integration.
Within the above framework, the CIS Oder Estuary mainly aims to:
- serve as a container for data information, project results, publications etc.;
- give access to this data and information to a broad public;
- support integrated management and planning processes;
- serve as a transferable model for other regions. The aim was to develop a system, that is spatially expandable and transferable to other regions;
- establish a German-Polish dialogue concerning coastal are-as;
- set up concrete tools in order to build a basis for a sustaina-ble development for the Oder estuary.
The CIS Oder Estuary Web portal provides access to a Web GIS tool, called GIS-ICZM, in the same web portal. The GIS ICZM al-lows free access to regional spatial information. The system in-cludes multi-disciplinary spatial data related to a cross-border (German-Polish) coastal and marine area, i.e. the Oder Estuary and the part of the wider Mecklenburg-Vorpommern German re-gion.
More in general, the Oder Estuary region has been included in numerous project dealing with ICZM and related aspects, such as:
- LOICZ-IGBP (Land Ocean Interactions in the Coastal Zone);
- Indicator programme of UNESCO-IOC (Intergovernmental Oceanographic Commission);

21807-REL-T002.1 page 41/337
- Integrated Coastal Area - River Basin Management (ICARM)” of UNEP (United Nations Environment Pro-gramme);
- EU FP6 SPICOSA project (Science and Policy Integration for Coastal Systems Assessment)
- INTEREG IIIB ASTRA project "Developing Policies & Adap-tation Strategies to Climate Change in the Baltic Sea Re-gion“.
Information and results of these projects are included in the CIS Oder Estuary web portal. In particular some of the results are in-cluded in the GIS-ICZM tool (e.g. those generated by the ASTRA project).
1c Operating entity EUCC Germany; German branch of the Coastal & Marine Union
1d Management structure
EUCC Germany; German branch of the Coastal & Marine Union
1e Contacts
Nardine Stybel, e-mail: [email protected]; [email protected]
EUCC Germany
Baltic Sea Research Institute/Institut für Ostseeforschung Warnemünde (IOW) Seestr 15
CIS Oder Estuary web portal: http://www.ikzm-oder.de/en/startseite.html
1f Typology Operational
2 Operational context and information content
2a ICZM dimensions
The GIS-ICZM addresses four of the five considered ICZM di-mension: territory (e.g. in relation to geographic descriptors, ad-ministrative boundaries, infrastructure, coastal protection, etc.), environment (biological reserve, water pollution, results of the eu-trophication model, harmful substance in fish and mussels), social and economic dimensions (church, hospital, museum, tourism fa-cilitates, pipeline, wind-farm and traffic features).
2b ICZM Sectors
The GIS-ICZM contains a wide variety and as high number of spatial information; main addressed information sectors are:
- Bathymetry;
- Sediment characteristics;
- Shoreline typology and coastal structures (dune, dike, moles etc.);
- Coastal protection;
- Flooding zones according to different levels of flood risk;
- Biological aspects (benthic species, feeding area for birds, fish species);
- Biological reserves (national protected areas and interna-tional reserves, etc.);

21807-REL-T002.1 page 42/337
- Seasonal sensitivity to oil spills for the coast and for the ma-rine area;
- Coastal water typology according to the Water Framework Directive;
- Water eutrophication (i.e. concentration of nitrate and phos-phate);
- Results of the eutrophication model in different years;
- Water and sediment chemical pollution;
- Harmful substance in fish and mussels;
- Naval and terrestrial traffic features;
- Tourism facilities;
- Civil features (Church, hospital, museum etc.);
- Offshore wind farm;
- Pipes and cables;
- Administrative boundaries;
- Mining area; i.e. areas for the extraction of sediments.
2c Integration
The GIS ICZM provides some good examples of integrated anal-ysis, including in particular layers related to:
- Flooding zones according to four different levels of flood risk;
- Sensitivity of the coastal and marine areas to oil spills, de-termined by the Precaution Pollution Control (VPS) Model.
2d Spatial scale Sub-National – Oder estuary and coastal-zone of the Mecklen-burg-Vorpommern Region.
2d Flexibility
The Web Portal (CIS Oder Estuary) may be considered as a high-ly flexible tool. Its structure can be replicated in similar context. Indeed, one of the objective of the CIS Oder Estuary is to develop a system spatially expandable and potentially transferable to oth-er regions.
The GIS-ICZM has been developed in order to be mainly applied to Oder Estuary area.
3 ICZM functionalities
3a Knowledge related functionalities
Analysis of the ICZM knowledge related functionalities specifically focuses on GIS-ICZM, that includes many of the considered func-tionalities:
- GIS-ICZM provides good examples of integrated infor-mation, such as those described in 2c;
- Operation at the different spatial scale. Some of the availa-ble spatial data can be re-scaled according to the consid-ered spatial extent; thus enabling to visualize more details at a higher scales For example the information regarding the coastal ship traffic can be scaled until the very local scale.
- GIS-ICZM includes multi-disciplinary spatial data related to a cross-border (German-Polish) coastal and marine area, thus
21807-REL-T002.1 page 43/337
contributing to support the German-Polish dialogue and co-operation on ICZM;
- Inclusion of functionalities or maps related to assessment of coastal vulnerability to climate change. Oder Estuary was in-cluded in the ASTRA project as a case study, whose results (flood risk assessment) are included in the GIS-ICZM.
3b Process related functionalities
Analysis of the ICZM process related functionalities mainly focus-es on GIS-ICZM, that includes some of the considered functionali-ties:
- The GIS-ICZM includes a high number and a wide variety of spatial information; these are organised according to a two level tree structures. The structure can support research of information useful for problem understanding;
- The GIS-ICZM tool is constantly used to support the various phases of the Oder ICZM process and related projects (in-cluding EU funded ones). The development of the whole Web portal was strongly supported by several institutions and administrations, providing a demand driven implementa-tion of the system;
- Support to the German-Polish dialogue and cross-border cooperation on ICZM; indeed many layers refer to a cross-border area;
- Besides being a Web-GIS, the GIS-ICZM does not specifi-cally include tools supporting stakeholder participation. However the portal provides an E-learning Platform “ICZM-D Lerner”. This is a freely accessible web-based learning sys-tem consisting of on-line study, information and teaching modules that is a useful tool for the participation and dissem-ination of the information.
4 Users
4a User typology The system is addressed to local and regional authorities, scien-tists, Polish and German actors and citizens (also including stu-dents and teachers).
5 Use of the system
5a Accessibility
Free access on-line to all of the CIS Oder Estuary and the GIS-ICZM.
Many sections of the CIS Oder Estuary and of the Web-GIS are available in three languages: Polish, German and English.
5b User-friendliness
Both the web-portal and GIS-ICZM are highly user-friendly.
The system is available in three languages: German, Polish and English.
5c Interactiveness
Besides being a Web-GIS, the GIS-ICZM does not specifically in-clude tools supporting stakeholder e-participation. However the portal provides an E-learning Platform “ICZM-D Lerner”. This is a freely accessible web-based learning system consisting of on-line study, information and teaching modules that is a useful tool for

21807-REL-T002.1 page 44/337
the participation and dissemination of the information.
5d Data access Only metadata are completely available from this GIS-ICZM through the Metadata Management System (MMS).
6 Technological characteristics
6a Used technology
A first release of the GIS ICZM was developed through ESRI technology.
Use of a licensed software was than perceived as a limitation, mainly for economic reasons. In a second step it was therefore decided to abandon the ERSI technology and adopt an open source software. In particular the system now is developed with the UMN MAP SERVER. The UMN MAP SERVER is an Open Source platform for publishing spatial data and interactive map-ping applications to the web. This second development has been achieved in collaboration with the University of Rostock.
6b Integration with other tools
The GIS ICZM is not directly integrated with other tools. However it includes outcome of an eutrophication model related to various years.
6c Integration with other CIS
The GIS ICZM of the Oder Estuary is linked (however not directly) to the GIS ICZM M-V, containing data about the coastal area of the whole federal state of Mecklenburg - Vorpommern (M-V). The GIS-ICZM M-V acts as an umbrella system for the GIS ICZM of the Oder Estuary, also aiming to establish a connection to the systems of neighbouring regions: i.e. the federal state Schleswig-Holstein and those in Denmark and Poland.
6d Interoperability
High.
ISO 19115 is the core of the metadata standard of INSPIRE. The ISO 19115 standard was chosen as the GIS ICZM metadata standard. More in general the Web-GIS refers to INSPIRE Di-rective.
7 Cost/Resources
7a Resources
The whole project ICZM Oder started in May 2004 with a budget of 2 million of Euros for the first 3 years period. It was supported by the Federal Ministry of Education and Research Germany (BMBF). After this successful first three years period (2004-2007), the project was being renewed for other three years (2007-2010).
Between 2004 and 2008, the realisation of the CIS Oder Estuary Web Portal was funded with about € 425,000 provided BMBF, part of phase I and II of the ICZM Oder project. The cost of the implementation of the Web-GIS is about € 365,000.

21807-REL-T002.1 page 45/337
Information sources for the overview analysis of GIS ICZM-Oder:
Körfer A., 2008. COPRANET (Coastal Practice Network) – Case study: Integrated
Coastal Zone Management in the Oder (Odra) Estuary Region.
Schernewski G., Bock S., Janßen H., Löser N. and Hmielorz A. (2007): Regional Climate
Change and coasts: A case study on perception, information, dissemination and educa-
tion, In: W. Leal Filho, F. Manke & P. Schmidt-Thomé (eds.) (2007): Information, Com-
munication and Education on Climate Change – European Perspectives, Umweltbildung,
Umweltkommunikation und Nachhaltigkeit, Vol. 26, Peter Lang GmbH, Frankfurt am
Main.
Schuldt B. and Borgwardt K., 2007. Integrative Werkzeuge im IKZM-Oder. Coastal devel-
opment: The Oder estuary and beyond Coastline Reports 8 (2007), ISSN 0928-2734,
ISBN 978-3-9811839-0-0 S. 163 – 170.
Thamm R., Bock S. and Schernewski G., 2010. Regional Information Systems and
Coastal Databases for ICZM in Germany – are they efficient and informative? Coastal
development: The Oder estuary and beyond Coastline Reports 8 (2007), ISSN 0928-
2734, ISBN 978-3-9811839-0-0 S. 151 – 161.
Web-site consultation:
http://ww.ikzm-oder.de/en/startseite.html; last visit on 08/03/2011 at 10.00;
http://ec.europa.eu/ourcoast/index.cfm?menuID=9&articleID=202; last visit on 08/03/2011
at 11.00;
http://balticlagoons.net/?p=291; last visit on 08/03/2011 at 10.30.
21807-REL-T002.1 page 46/337
3.6 GeoSeaPortal
1 General Information
1a Name GeoSeaPortal
1b Description
GeoSeaPortal is a marine geo-information portal of the German Federal Marine and Hydrographic Agency (BSH), for marine and coastal protection, navigation safety, offshore industry and inte-grated marine spatial planning. It provides an unique access point to the currently available hydro-oceanographic and geographic data from the BSH. The BSH is also currently developing a central Spa-tial Data Infrastructure (SDI-BSH); within this SDI the GeoSeaPor-tal represents a tool allowing to search scientific information using a meta-information system and showing Web-GIS interactive maps. The SDI-BSH will be an important contribute, for marine data, to the national spatial data base (NGDB) and the national spatial data infrastructure (GDI-DE), encouraging sharing and exchanging terri-torial data in Germany, also in the perspective of the European INSPIRE Directive.
GeoSeaPortal displays data on the Map-Viewer, through WMS ser-vices, from several BSH information systems including:
- NAUTHIS, Nautical hydrographic Information System of BSH, offering aid to the commercial navigation, showing e.g. wrecks, obstruction to navigation, seaward limits, hydrography etc.
- CONTIS, Continental Shelf Research Information System, a marine database of BSH on the several (current and planned) uses of the sea
- GVU, a BSH database on water pollution in the German area and the exclusive economic zone;
- MARNET, about BSH environmental monitoring network; - SGE, Shelf Geo Explorer, about BSH geodata on sediment
distribution, thickness, structure of the seabed etc. - MUDAB, German data base for marine data, a joint project
between BSH and the Federal Environmental Agency (UBA), displaying physical and chemical parameters for water and sediment, as well as radiochemical data of seawater.
An overview of the contents of these Web Map Services and the relative URL are provided by the GeoSeaPortal website. The web-site provides also:
- an overview of the ongoing Spatial Data Infrastructure (SDI -BSH) initiative;
- An user manual for the use of GeoSeaPortal (German only); - The access to the Metadata Portal (to search data and
metadata through keywords or spatial selection), and to the Map-viewer, enabling to visualize, customize, save and print maps.
1c Operating entity German Federal Maritime and Hydrographic Agency (BSH)
1d Management German Federal Maritime and Hydrographic Agency (BSH)

21807-REL-T002.1 page 47/337
structure
1d Contacts
Johannes Melles, e-mail: [email protected] (specialist is-sues).
Jöerg Gerdes, e-mail: [email protected] (technological issues)
GeoSeaPortal site: http://www.bsh.de/de/Meeresdaten/Geodaten/index.jsp
1e Typology Operational
2 Operational context and information content
2a ICZM dimensions
The system (in particular through the Map-Viewer component) mainly addresses four of the five ICZM dimensions: territory (e.g. administrative boundaries, nature/ecological reserve) environment (e.g. monitoring network, pollution data, geological data), economy (e.g. exclusive economic zone, fishery zone, exploitation of re-sources) and governance dimension (in particular in relation to deti-laed information on maritime zoning).
2b ICZM Sectors
The information content of GeoSeaPortal is structured in the follow-ing themes, each of them includes several layers:
- Bathymetry and coastline - Administration limits - Energy related information (e.g. platforms, pipeline, offshore
wind farms) - Marine Environmental monitoring network - Hydrography - Navigational aids (e.g. buoys, lights, radio radar, etc.) - Rocks wrecks and related obstruction to navigation and other
uses; - Seawards limits, including spatial data on maritime zoning; - Skin of the Earth (dredged areas, depth areas, land areas,
berthing, pontoons…) - Topography - Remote sensing Sea Surface Temperature - Sea Surface Temperature analysis - Prediction model water current, level, salinity and tempera-
ture; - Palaeographic structures; - Seabed sediments - Subsurface sediments - Seabed survey
- Sediment contamination (HCB, PCB, metals)
- Water contamination (metals, nutrients, PAHs, PCB, pesti-cides).
The above listed information is all relative to the marine area. No information on land is currently available in GeoSeaPortal.
However the GeoSeaPortal structure enables to integrate in the Map Viewer any spatial data available through a WMS connection. In particular the Map Viewer already enables to show spatial data

21807-REL-T002.1 page 48/337
of integrated CIS (see point 6c).
2c Integration No specific integrated information among different data is directly provided within the system
2d Spatial scale National - German marine area
2e Flexibility GeoSeaPortal has been specifically developed in order to be ap-plied to German marine and coastal area.
3 ICZM functionalities
3a Knowledge relat-ed functionalities
GeoSeaPortal provides some of the knowledge related functionali-ties:
- Although spatial layers can not be directly downloaded, the system is designed to share them through Web Map Service (WMS). All relative url are provided by GeoSeaPortal;
- Operation at the different spatial scale; some of the available spatial data can be re-scaled according to the considered spa-tial extent; thus enabling to visualize more details at a higher scales, e.g. bathymetry, etc.
3b Process related functionalities
The system does not currently provides specific ICZM process re-lated functionalities.
4 Users
4a User typology
Potential users are:
- Marine planners and/or managers; actually the system pro-vides useful information (such as spatial data on maritime zoning and uses of the marine spaces)
- Private sector (e.g. industry/energy companies), as for infor-mation regarding petroleum platforms, offshore wind farms;
- Specialised/expert users, since original data can be access through WMS connection. These users can be also particular-ly interested spatial data resulting form modelling activities (e.g. modelling of current, water level, temperature, salinity).
5 Use of the system
5a Accessibility
Data related to the sectors described in point 2b are all freely ac-cessible on-line through the Web-GIS component.
The system also includes a restricted area dedicated to authorised users.
5b User-friendliness
Highly/Medium user friendly
Some components of the web-portal are highly user friendly. This is case of the Metadata Portal that quickly and easily enables to search for metadata and spatial data, also enabling visualization of the latter through a direct integration with the Web-GIS component.
Some other components can be further improved in terms of user-friendliness; such as in the case of the Web-GIS for which for ex-ample the spatial data loading is not totally intuitive.

21807-REL-T002.1 page 49/337
User manual is available in German. The web-portal is in German, including some parts in English
5c Interactiveness The system does not currently include e-participation tools and functionalities
5d Data access
All spatial data are accessible by Web Map Services. The Web-GIS enables users to export and print maps.
The system includes a component (Metadata Portal) specifically dedicated to metadata management. This enables to search for and show complete metadata (complying with the ISO 19139 standard.) for each layer. In most of the cases direct link to the specific data web-site is also provided
6 Technological characteristics
6a Used technology
6b Integration with other tools
Through WMS application, Geoseaportal displays data from sever-al information systems managed by BSH (see 1b). GeoSeaPortal is also integrated with BSH remote sensing activities, operating since 1990 with an own facility for the real-time reception and immediate processing of high resolution data from meteorological US satel-lites.
Finally, as part of oceanographic services, BSH manage a model to simulate the present and future hydrodynamic behaviour of the North Sea and Baltic. GeoSeaPortal is integrated with this tool, dis-playing data on modelled oceanic currents, sea level height, water temperature and salinity.
6c Integration with other CIS
Through WMS, GeoSeaPortal is directly integrated to the following systems:
- HELCOM map and data service, providing data for the whole Baltic Regional Sea;
- GRID-Arendal system, collaborating centre of the United Na-tions Environment Programme (UNEP), established by the Government of Norway as a Norwegian Foundation, to com-municate environmental information to policy-makers and fa-cilitate environmental decision-making for change;
- Geography network, geographic data provided by ESRI
6d Interoperability
High
Metadata are compliant with the ISO 19139 international standard, related to the INSPIRE Directive. Interoperability is properly man-aged through WMS.
7 Costs/Resources
7a Resources
Sources:
Web-site: http://www.bsh.de/de/Meeresdaten/Geodaten/index.jsp; last visit on 01/04/2011 at
13.00.
21807-REL-T002.1 page 50/337
3.7 Coastal Information System supporting Fish Farming in Denmark
1 General Information
1a Name Coastal Information System supporting Fish Farming in Denmark (CIS-FFD) – (Placering af havbrug i Danmark).
1b Description
Coastal Information System supporting Fish Farming in Denmark (CIS-FFD) is a Web-GIS tool specifically aiming to provide data and functionalities for the planning and management of fish aquaculture in the Denmark coastal areas. This CIS provides a comprehensive overview of all the regulatory constraints, environmental and territo-rial act on Danish territorial waters. In this perspective this CIS in-cludes a wide variety of data related to the Danish coastal area which may be relevant for other purposes related to ICZM, too.
Danish government aims to promote fish production through sus-tainable marine fish farming in Denmark. In this perspective, in 2001 it established an Aquaculture Committee to deal with the sus-tainable development of this economic activity. The Committee es-tablished working groups dealing with specific aspects; one of them was in charge to address the scientific basis for the proper zoning of new marine fish farming sites in Denmark.
This activity produced a series of GIS information that are presently collected in and made available by the Web-GIS. This tool in cur-rently updated and its information may be useful for fish farmers (for example to set a new or expand an existing fish aquaculture site) or for local authorities dealing with fish farming regulation and licens-ing. The Web-GIS in particular includes spatial information enablingidentifying areas that are not suitable (due to environmental condi-tions) or not usable (e.g. coastal and marine protected areas) for fish farming, thus providing data for a proper site identification.
1c Operating entity DTU Aqua – National Institute of Aquatic Resources Technical University of Denmark (DTU)
1d Management structure
National Institute of Aquatic Resources
Section for Coastal Ecology - DTU Aqua
1e Contacts
Suzanne Rindom, e-mail: [email protected]
Communications Officer National Institute of Aquatic Resources Section for Coastal Ecology DTU Aqua - Technical University of Denmark Charlottenlund Slot Jægersborg Allé 1 2920 Charlottenlund
Denmark Web-GIS: http://gis.dfu.min.dk/website/Havbrug/viewer.htm
1f Typology Operational
21807-REL-T002.1 page 51/337
2 Operational context and information content
2a ICZM dimensions
The Web-GIS addresses more ICZM dimension: territory (e.g. ma-rine protected areas, Ramsar Site, etc.), economy (pipeline, corridor for the navigation, mining for beach nourishment, etc.) and envi-ronment (e.g. chemical and physics characteristics of the sea water, such as temperature and salinity). The governance dimension is al-so considered in this CIS; besides including some background in-formation (licensed area to be used for sand excavation), the CIS also contains a specific layer representing the results of the plan-ning effort, i.e. classification of licensable reservation for the loca-tion of marine fish farming in Denmark. Indeed this CIS has been used as an important tool in the planning process.
2b ICZM Sectors
GIS layers are organised in three categories:
- Constraints for fish farming development due to other uses, e.g.: areas already used for fish farming, safety zone for mari-time transportation and underwater cables and pipelines, min-ing zones, freshwater areas, safety zone around oil platforms, hazard zones (e.g. due to the presence of mines on the sea bottom);
- Constrains to fish farming development due to regulation, e.g.: Nature 2000 areas, Ramsar site, other high-values areas, mili-tary areas, areas of biological relevance, areas under other specific regulations, etc.
- Territorial and environmental information useful for the identifi-cation of suitable areas for fish farming development, related to: proximity of existing fish farming sites, proximity to dumping sites, proximity to wastewater discharges, water depth, water salinity and temperature, wave height and hydrodynamic, tidal characteristics.
2c Integration
This Web-GIS supports the integrated assessment of the Danish marine coastal area, providing a common platform to integrate spa-tial and environmental information, aiming to identify the most suit-able area for fish farming in the Exclusive Economic Zone of Den-mark. Final results of the assessment (map of the areas with total or partial or any restriction to fish farming) are included in the CIS.
2d Spatial scale
National Scale – Sea and coastal zone in Denmark.
Basically, the analysis was conducted for (and the Web-GIS refers to) the entire Exclusive Economic Zone (EEZ) of Denmark.
2d Flexibility
The Web-GIS been developed in order to be applied to the specific marine coastal territory of Denmark. Even if it has been specifically developed to identify area suitable for fish farming and to support related licensing procedures, the CIS provides data useful for other aspects related to ICZM.
The Web-GIS structure is very similar to the one used to implement the Limfjorden Coastal Information System.
21807-REL-T002.1 page 52/337
3 ICZM functionalities
3a Knowledge related functionalities
The Web-GIS supports the integrated assessment of territorial and environmental information of the Danish EEZ, in particular enabling to identify and map those areas that are suitable (totally or partially) for fish farming.
3b Process related functionalities
This Web-GIS provides a conceptual model for problems related to fish farming in the marine areas of Denmark.
It therefore clearly supports problem understanding and structuring. Although the CIS is focusing on sector aspects (fish farming), there is clear intention to evaluate interrelations and conflicts with other human activities (e.g. navigation, sediment dredging, port activity, nature protection, environmental quality preservation, recreation ac-tivities) in an ICZM perspective.
4 Users
4a User typology Users of the system are mainly coastal planners and/or managers dealing with fish farming regulation as well as representative of the private sector (fishermen and fish farmers).
5 Use of the system
5a Accessibility Free access on-line to the complete Web-GIS.
5b User-friendliness
Medium.
The use of the web-GIS on-line is rather simple and user-friendly, however a specific help on-line documentation is not available. TheWeb-GIS is available only in Danish language.
5c Interactiveness No specific e-participation tools are available.
5d Data access
The Web-GIS does not enable to download spatial data, while it provides the possibility to print simply customized maps.
Metadata description is available for each layer; however metadata do not fulfil the INSPIRE Directive requirements.
6 Technological characteristics
6a Used technology The Web-GIS is developed with ArcIMS server (ESRI licensed software).
6b Integration with other tools
No specific integration with other tools
6c Integration with other CIS
The Web-GIS is not directly integrated with other coastal infor-mation systems. However, the DTU Aqua (National Institute of Aquatic Resources) provides link to other GIS on related arguments from the same Web-page from which the Limfjorden CIS can be ac-cessed. These are:
- “Blåmuslinger”: GIS containing information regarding the productivity of mussels in the Danish territorial water.
21807-REL-T002.1 page 53/337
- “Limfjorden”: Web-GIS tool specifically aiming to provide data and functionalities for the planning and management of mussel farming and fishing activities in the Limfjord area.
6d Interoperability
Low.
There is no compliance with the INSPIRE DIRECTIVE and with the standard of the collected metadata (ISO 19115).
7 Cost/Resources
7a Resources
Web-site consultation:
http://www.praesten.dtu.dk/Inst/AQUA/Om_DTU_Aqua/Afdelinger/Faglige_stottefunkti
oner/GIS.aspx; last visit on 01/03/2011 at 14.00.
http://gis.dfu.min.dk/website/Havbrug/viewer.htm; last visit on 01/03/2011 at 16.00.
21807-REL-T002.1 page 54/337
3.8 NOKIS - North Sea and Baltic Sea Coastal Information System
NOKIS web site (www.nokis.org) has not been active during the implementation of the over-
view analysis since it is undergoing significant further development. The current description is
therefore based on available literature. Due to the unavailability of the on-line system the de-
scription of NOKIS is partial; the new development could significantly change the contents of
this description. For these reasons, a full analytical sheet is not provided for the NOKIS sys-
tem.
NOKIS was a joint project of KFKI (German Coastal Engineering Research Council) and BAW
(Federal Waterways and Research Institute) with the main objective to establish a metadata
information system for the North Sea and Baltic Sea coastal regions (Kazakos, 2004). The
project NOKIS (2002-2004) is now finished but its activity is continuing and widening within
NOKIS ++ , “Information Infrastructures for the North Sea and Baltic Sea Coast as Contribu-
tion to Integrated Coastal Zone Management" (2004-2008), focusing on the integration of dif-
ferent data sources from participants all over the coast. NOKIS and NOKIS ++ are both funded by the German Federal Ministry of Education and Research.
The initial motivation for the project NOKIS was the lack of an infrastructure for the exchange
of geodata across administrative boundaries between the German Wadden sea national parks
and other governmental administrations (e.g. water management and administration of water-
ways and navigation) on the federal and state levels. Today, around 20 partners from admin-
istration, research and industry are cooperating within NOKIS.
The geographical area involved in the NOKIS system includes the German coast of North Sea
and Baltic Sea, as shown in Figure 3-3. It includes the National Park of Schleswig-Holstein,
Wadden Sea, with 440,000 ha and 400 km coast.

21807-REL-T002.1 page 55/337
Met. Sat. 9
(c) Google Earth, 2007
120 km
Tönning
Met. Sat. 9
(c) Google Earth, 2007(c) Google Earth, 2007
120 km120 km120 km
TönningTönning
Figure 3-3 Geographical coverage of NOKIS (Kohlus and Heidmann, 2007).
The platform offers information about the German coastal zone including abstracts of coastal
journals, completed and on-going research projects, and it provides a number of recent project
reports. The database is bi-lingual (German and English) to ensure international accessibility.
Project partners from a variety of research institutions and state agencies cooperated in
NOKIS. As a result, the central metadata repository includes documentation about a wide
range of data types commonly used. Examples include GIS data from the national park offic-
es, containing monitoring results from the German Wadden Sea as well as extensive time se-
ries from tidal gauges which are maintained by coastal protection authorities on state level
(Heidmann et al., 2008).
Metadata, “data about data”, supply standardised basic information about data records like
documents, maps or series of measurements, making easier data searching, exchanging and
processing. The NOKIS metadata model is fully compliant with the standards for geoinfor-
mation of the International Organization for Standardization (ISO), guaranteeing sufficient me-
ta information available for documentation and intelligent search methods. The most important
standard for NOKIS (Heidmann et al., 2008) are ISO 19115 (Geographic information –
Metadata), ISO 19136 (Geographic information – Geography Markup Language) and ISO
19139 (Geographic information - Metadata - XML schema).
The overall architecture of the NOKIS system consists mainly of local metadata bases and a
central server located at BAW. Original data remain on local, while metadata, generated local-
ly, are then uploaded to the central NOKIS metadata server. Any proprietary information is fil-
tered out during this replication process (Lehfeldt & Heidmann, 2002). The NOKIS multi-lingual
Editor is the central tool for the generation and maintenance of metadata records, allowing the
user in creating valid ISO 19115/19119 metadata. There are no license fees since NOKIS is
21807-REL-T002.1 page 56/337
based on open source software, and each declared partner is granted the right of use for the
metadata editor.
Furthermore NOKIS makes available different services, including (Heidmann et al., 2008):
An OGC Catalogue Services, holding information about the data, about data access ser-
vices, and about the services available for visualization and analysis. The catalogue ser-
vices provide standard-compliant metadata to serve higher level metadata information
systems in Germany, like Geoportal.Bund of the GDI-DE, PortalU for environmental infor-
mation and in the future INSPIRE.
A Coastal Gazetteer, to support users in retrieving spatial information. It stores complete
place names (many places may have more than one name, either because it changed
with the time or because of different languages) and geometries for the coastal zone al-
lowing users with options to run spatial queries not only defining a spatial extent but also
entering geographical search terms. They are checked against the gazetteer vocabulary
and all existing geometries. The NOKIS gazetteer also covers the temporal variability of
geometries and names, which is normally not included in conventional gazetteers but
which is of special interest for the tidal flats along the German coast.
A Data Access Service, to provide ways to access the information itself and not only to
metadata;
Visualization services, focusing on the visualization of time series and field data, which is
not or only insufficiently covered by the OGC services, as for example vector field data
(e.g. wind fields or current fields) and vector point data (e.g. wind direction and speed at a
certain point).
Information sources for the overview analysis of Atlas of Nokis:
Lehfeldt, R., Heidmann, C., "NOKIS - a metadata information system for German coastal
regions of the North Sea and Baltic Sea", Proc. Hydroinformatics 2002, Cardiff, Vol. 2,
(2002), pp 1506-1512.
Heidmann,C., Sellerhoff, F., Lehfeldt, R., Valikov, A., Kazakos, W., 2008. Providing Ac-
cess to Environmental Data in a SOA in NOKIS. Environmental Informatics and Industrial
Ecology. The NOKIS project has been completed. All data are now available in the follow-
ing portals: Proceedings of 22 nd international conference on informatics for environmen-
tal protection.
W. Kazakos, W., 2004. Metadata in Coastal Areas – Perspectives and Experiences. In: G.
Schernewski & N. Löser (eds.): Managing the Baltic Sea. Coastline Reports 2, ISSN 0928-
2734 S. 245 – 250.
Kohlus, J., and Heidman, C., 2007. Nokis. North and Baltic Sea Information-System In-
formation Infrastructure for the North and Baltic Sea. Enviroinfo2007. Warsaw, Sept 12-
14, 2007.

21807-REL-T002.1 page 57/337
3.9 Limfjorden Coastal Information System
1 General Information
1a Name Limfjorden Coastal Information System
1b Description
Limfjorden Coastal Information System is a Web-GIS tool specifical-ly aiming to provide data and functionalities for the planning and management of mussel farming and fishing activities in the Limfjord area. In this perspective the CIS includes a wide variety of data re-lated to the coastal area which may be relevant for other purposes related to ICZM, too.
With a coastline of 1.000 km the Limfjord is the largest fjord in Denmark. The fjord is strongly impacted by intensive mussel (blue mussels and flat oyster) commercial fishery. National policy aims to support the sustainable use of Limfjord’s natural resources, in par-ticular improving the sustainable production of cultured mussels in balance with the extensive fishery of blue mussels and flat oysters.
In order to ensure an efficient procedure of the preparation and evaluation of applications for culturing licenses, a production area classification was conducted involving central and local authorities and organisations. The production areas were classified in areas not available for mussel production (e.g. harbours, polluted areas), areas with restrictions for certain forms for mussel production (e.g. national and international nature protected areas, navigation corri-dors, areas of recreational interests), and areas without any re-strictions. Furthermore, the stocks of blue mussels and flat oyster were mapped in order to identify important fishing grounds. Through the GIS analysis fishing grounds for trawling of herring and sprat were identified, too.
Limfjord has also been included as case-study in the European funded SPICOSA project (Science and Policy Integration for COastal System Assessment).
1c Operating entity National Institute of Aquatic Resources Section for Coastal Ecology - DTU Aqua
1d Management structure
National Institute of Aquatic Resources Section for Coastal Ecology - DTU Aqua
1e Contacts
Per Dolmer, e-mail: [email protected] Kerstin Geitner, e-mail: [email protected] National Institute of Aquatic Resources Section for Coastal Ecology DTU Aqua - Technical University of Denmark Charlottenlund Slot Jægersborg Allé 1 2920 Charlottenlund Denmark Web-GIS: http://gis.dfu.min.dk/website/Limfjord/viewer.htm
1f Typology Operational

21807-REL-T002.1 page 58/337
2 Operational context and information content
2a ICZM dimensions
The CIS addresses more ICZM dimension: territory (marine pro-tected areas, bathing beaches and areas close to summer houses), economy (pipeline, corridor for the navigation) and environment (polluted areas). The governance dimension is also considered in this CIS; besides including some background information (licensed area to be used for sand excavation), the CIS also contains a spe-cific layer representing the results of the planning effort, i.e. classifi-cation of licensable productive areas according to total, partial or any restriction to mussel production. Indeed this CIS has been used as an important tool in the planning process.
2b ICZM Sectors
GIS layers are organised in three categories:
- Areas not available to mussel production: Harbours, Depots of dredged sediments, Streams polluted with discharged water, Local polluted areas, Pipes and cables;
- Areas available for some forms of mussel production: Areas regulated by international nature protection directives (Habitat, Ramsar, Bird Directives); Areas regulated by national nature protection directives; Mussel fishing areas; Areas with eel grass and macroalgae; Areas included in monitoring pro-gramme of macroalgae; Areas with stone reefs; Areas close to summerhouses; Areas close to bathing beaches; Navigational corridors; Areas for the extraction of sediments;
- Areas with fishing grounds: Blue mussels; Flat oyster; Her-ring/sprat
2c Integration
The CIS supports the integrated assessment of the Limfjorden area, providing a common platform to integrate various spatial and envi-ronmental information, aiming to identify the most suitable are for the sustainable production of cultured mussels in balance with the extensive fishery. Final results of the assessment (map of the areas with total, partial or any restriction to mussel farming) are included in the CIS.
2d Spatial scale Local scale – Limfjorden fjord in the North-West of Denmark.
2d Flexibility
The CIS been developed in order to be applied to the specific coastal territory of Limfjorden. Even if it has been specifically devel-oped to identify area suitable for mussel farming and to support re-lated licensing procedures, the CIS provides data useful for other aspects related to ICZM.
3 ICZM functionalities
3a Knowledge related functionalities
The CIS supports the integrated assessment of territorial and envi-ronmental information of the Limfjorden area, in particular enabling to identify and map those are that are suitable (totally or partially) for mussel farming and the areas that are important for fishing activ-ities.
3b Process related functionalities
This CIS provides a conceptual model of problems related to mus-sel farming and fishing in the Limfjorden area. It therefore clearly supports problem understanding and structuring. Although the CIS
21807-REL-T002.1 page 59/337
is focusing on sector aspects (mussel farming and fishing), there is clear intention to evaluate interrelations and conflicts with other hu-man activities (e.g. navigation, sediment dredging, port activity, na-ture protection, environmental quality preservation, recreation activi-ties) in an ICZM perspective. The tool has been actually used in the planning process, also involving mussel farmers and authorities (Dolmer and Geitner, 2004).
4 Users
4a User typology Users of the system are mainly coastal planners and/or managers dealing with the mussel production regulation as well as representa-tive of the private sector (fishermen and mussel farmers).
5 Use of the system
5a Accessibility Free access on-line (access allowed to all users with or without password) to the complete CIS.
5b User-friendliness The use of the web-GIS on-line is rather simple and user-friendly, however a specific help on-line documentation is not available. The web-GIS is available only in Danish language.
5c Interactiveness No specific e-participation tools are available.
5d Data access
The does not enable to download spatial data, while it provides the possibility to print simply customized maps.
Metadata description is available for each layer; however metadata do not fulfil the INSPIRE Directive requirements.
6 Technological characteristics
6a Used technology The CIS is developed with ArcIMS server (ESRI licensed software).
6b Integration with other tools
No specific integration with other tools
6c Integration with other CIS
The Limfjorden CIS is not directly integrated with other coastal in-formation systems. However, the Danish Institute for Fisheries Re-search (Denmark Fiskeriundersøgelser - DFU) provides link to other GIS on related arguments from the same Web-page from which the Limfjorden CIS can be accessed. These are:
- “Blåmuslinger”: GIS containing information regarding the productivity of mussels in the Danish territorial water.
- “Placering af havbrug”: GIS including information on aquacul-ture activities in the Danish territorial water. This CIS provides a comprehensive overview of all the regulatory constraints, environmental and territorial act on Danish territorial waters.
6d Interoperability Low.
There is no compliance with the INSPIRE DIRECTIVE and with the standard of the collected metadata (ISO 19115).
7 Cost/Resources
7a Resources
21807-REL-T002.1 page 60/337
Information sources for the overview analysis of Limfjord Coastal Information System:
Dolmer P. and Geitner K., 2004. Integrated Coastal Zone Management of cultures and
fishery of mussels in Limfjorden, Denmark. In journal: ICES C.M. 2004/ (ISSN: ) , vol: V:07,
pages: 1-9, 2004. Type: Full conference paper publ. in journal. Presented at: ICES Council
Meeting, 2004.
Dolmer P. and Geitner K., 2007. Integrated Coastal Zone Management of cultures and
fishery of mussels in Limfjorden, Denmark. part of: Abstracts from Nordic Workshop on Ma-
rine Spatial Planning. 6.- 8. June, Copenhagen, Denmark.
Web-site consultation:
Http://www.praesten.dtu.dk/Inst/AQUA/Om_DTU_Aqua/Afdelinger/Faglige_stottefunkti
oner/GIS.aspx; last visit on 01/03/2011 at 14.00.
http://gis.dfu.min.dk/website/Limfjord/viewer.htm; last visit on 01/03/2011 at 16.00.
21807-REL-T002.1 page 61/337
3.10 The Trilateral Wadden Sea Cooperation web-site
1 General Information
1a Name The Trilateral Wadden Sea Cooperation web-site
1b Description
The Trilateral Wadden Sea Cooperation (TWSC) web-site is maintained by the Common Wadden Sea Secretariat (CWSS) to enhance public access to information about the Wadden Sea Ar-ea and its protection.
Since 1978, the responsible ministries of the Netherlands (Minis-ter of Agriculture, Nature and Food Quality), Denmark (Minister of the Environment) and Germany (Federal Minister for the Envi-ronment, Nature Conservation and Nuclear Safety) have been working together on the protection and conservation of the Wad-den Sea covering management, monitoring and research, as well as political matters. Thus they established the Trilateral Wadden Sea Cooperation that was built upon a Joint Declaration on the Protection of the Wadden Sea adopted in 1982. The challenge of the Trilateral Wadden Sea Cooperation (TWSC) is to implement ecosystem management of the Wadden Sea Area by applying and integrating relevant EU Directives, as set out in point 6 of the Schiermonnikoog Declaration (2005).
The TWSC web-site is structured in the following sections:
- “Trilateral Cooperation” provides information on the history of the cooperation, the reference area, the organizational structure, the structured of the CWSS and the international collaboration;
- “News/Service” provides link to the CWSS e-mail Newslet-ter, and other communication and training services;
- “Management” provides direct access to specific information regarding different topics. In particular this section allows the download of the Wadden Sea Plan 2010. Within this section is also possible to access information regarding the Wadden Sea World Heritage, the NATURA 2000 Wadden Sea zones, the Shipping and the Particularly Sensitive Sea Area (PSSA), Coastal Protection and Sea Level Rise (CPSL) and the Eutrophication Criteria.
- “Trilateral Monitoring and Assessment Program (TMAP),” provides all the information generated by this monitoring program. This in particular is related to twelve main topics; for each of them TMAP section provides static maps, docu-ments and/or graphic (no spatial layers). The same section also includes all the information (documents) contained in the Quality Status Report published in December 2009.
TWSC site does not include on-line mapping viewers or tools.
The same web-site also includes a direct link to the Wadden Sea Forum (WSFM; http://www.waddensea-forum.org/). This forum is an independent platform of stakeholders from Denmark, Germany and The Netherlands aiming to contribute to an advanced and
21807-REL-T002.1 page 62/337
sustainable development of the trilateral Wadden Sea Region. The WSF was established in 2002 and consists of representa-tives of the following main sectors: agriculture, energy, fisheries, industry and harbour, nature protection, tourism, as well as local and regional governments. National governments are represented as observers.
1c Operating entity Common Wadden Sea Secretariat (CWSS)
1d Management structure
Common Wadden Sea Secretariat (CWSS)
1d Contacts
Dr. Harald Marencic, e-mail: [email protected] e-mail: [email protected] Common Wadden Sea Secretariat Virchowstr. 1 D 26382 Wilhelmshaven Germany Web-site: http://www.waddensea-secretariat.org/index.html
1e Typology Operational
2 Operational context and information content
2a ICZM dimensions
TWSC web-site mainly addresses three of the five considered in-formation dimensions. The environment and the territory dimen-sions are in depth developed and made available in the TMAP section (in the forms of documents, maps and/or graphs).
The web-site also provides other documental information through its various section. In this perspective it is important to highlight the planning documents (governance dimension) provide by the “Management” section, in particular including the Trilateral Wad-den Sea Plan 2010.
2b ICZM Sectors
TMAP section includes documents, static maps and/or graphics related the following twelve topics:
- Physical environment; - Habitats and maps; - Climate and sea level rise; - Hazardous substances; - Eutrophication; - Alien species; - Estuaries; - Salt marshes; - Tidal area; - Dunes; - Fish; - Birds; - Marine mammals.

21807-REL-T002.1 page 63/337
2c Integration
Some of the information contained in the web-site has been pro-duced by integrating different data typologies. An example is the Map of the Particularly Sensitive Sea Area (PSSA); identifying ar-eas needing special protection due to their ecological, socio-economic or scientific relevance and due to their vulnerability to maritime activities.
2d Spatial scale Transnational – Wadden Sea, including the relative Danish, Ger-man and Dutch components.
2e Flexibility TWSC web-site was specifically developed to deal with the inter-national cooperation in the Wadden Sea integrated planning and management.
3 ICZM functionalities
3a Knowledge relat-ed functionalities
Two knowledge related functionalities are provided by the TWSC web-site:
- Integration among different information sectors (see point 2c);- Inclusion of a specific TMAP thematic section related to cli-
mate change impacts on the Wadden Sea (only documents are made available).
It is important to stress again that TWSC web-site does not pro-vide any interactive mapping functionality and therefore spatial data.
3b Process related functionalities
TWSC web-site provides some of the ICZM process related func-tionalities considered by the analysis; specifically:
- It supports problem understanding and structuring by provid-ing structured and easy-to-use information on various territo-rial and environmental topics relevant for the Wadden Sea management;
- It includes a direct link to the Wadden Sea Forum (WSF –see: http://www.waddensea-forum.org/), thus supporting stakeholder involvement and participation.
- It supports monitoring and evaluation of planning processes; information included in the TMAP section (result of the TMAP project) is used to assess the implementation of the measures set out in the Wadden Sea Plan 2010 (WSP-2010).
- It fully supports cooperation among the three Wadden Sea countries the joint management of this complex marine and coastal system. Indeed, the web-portal itself was designed and development within the cooperative framework.
4 Users
4a User typology
Information is mainly provided in terms of documents including static maps and/or graphics. These can be directly used in the planning and management process. Main target users therefore are: - Decision-makers; - Coastal planners and/or managers;
The same information can be also very useful for communication purposes, thus involving the civil society user typology.
21807-REL-T002.1 page 64/337
5 Use of the system
5a Accessibility Free access on-line to all the TWSC web-site contents and func-tionalities.
5b User-friendliness
Highly user-friendly.
Logic structure in themes and sub-themes is particularly helpful. Searching and visualising tools support the use of the system.The system is available in English.
5c Interactiveness
TWSC web-site does not directly include e-participation tools. However, two initiatives are worth to be mentioned: - The web-site includes a direct link to the Wadden Sea Fo-
rum (WSF – see: http://www.waddensea-forum.org/). This forum is an independent platform of stakeholders from Den-mark, Germany and The Netherlands aiming to contribute to an advanced and sustainable development of the trilateral Wadden Sea Region;
- The International Wadden Sea School (IWSS); an educa-tional programme for school classes from the Wadden Sea countries, in particular aiming to transfer the trans-boundary approach to the management of the Wadden Sea to the young generations.
5d Data access
No alphanumeric and spatial data are directly provided by the web-site. Data and information are available only within docu-ments.
Data can be anyhow requested through a registration form.
6 Technological characteristics
6a Used technology TWSC-CIS is a web-site developed with “html” languages and standards.
6b Integration with other tools
No specific integration with other tools
6c Integration with other CIS
No specific integration with other CIS
6d Interoperability Not applicable
7 Cost/resources
7a Resources
Web-site consultation:
http://www.waddensea-secretariat.org; last visit on 11/04/2011 at 10.30;
http://www.waddensea-forum.org/; last visit on 11/04/2011 at 11.30;
http://www.lancewadplan.org/; last visit on 11/04/2011 at 12.30.
21807-REL-T002.1 page 65/337
3.11 ScheldeMonitor web portal
1 General Information
1a Name ScheldeMonitor web portal
1b Description
The ScheldeMonitor is a web-portal providing information, data and indicators concerning the Scheldt Estuary area, including part of the Belgian and Dutch territory.
Flanders and Netherlands formalised their cooperation on the sustainable management of the Schlede estuary by the December 21, 2005 Treaty. The Flemish-Dutch Scheldt Commission (VNSC) is the instrument for the implementation of common objectives re-lated to sustainable policy and management, in particular focusing on: security against floods, optimal accessibility of the Scheldt ports and maintenance of a healthy and dynamic estuary ecosys-tem. The first ScheldeMonitor project started on December 2003 (before the implementation of the Treaty and the creation of VNSC Commission); the related web-portal has been continuous-ly innovated and updated. In 2010 ScheldeMonitor knew an evolu-tion from Scheldt information system to portal of information, data and indicators on research and monitoring of the Scheldt estuary. Currently the fourth phase of project is under going, in particular aiming to improve support of the web-portal to the integrated mon-itoring and ICZM in general of the Scheldt Estuary.
In particular the ScheldeMonitor web-portal contains a great num-ber of publications, datasets, links and maps related to this estu-ary. The web portal offers three different options to explore and search for the various typology of information included in the same system:
- Information; this section enables to search for different in-formation (metadata) related to various typology of elements: persons, institutes, publications, journals, projects, events, datasets, maps, urls. Information can be searched through simple and advance queries based on key words. For some element this option also enables to access to the searched element (for example a map or a dataset);
- Data portal: this second option gives access to a wide variety of information collected in the web portal and provided by dif-ferent sources and in different formats (parameters, data sources, map layers, figures, dataset and publications). Se-lection is performed through a window menu; results of the selection can be than visualised (for each information a metadata description is also made available) and download-ed (for a great part of the information). Georeferred infor-mation can be spatially showed through a Web-GIS compo-nent, either on a cartographic base or on Google maps.
- Indicators: The list of the available indicators (17) is reported in section 2b. The indicators for the Scheldt Estuary are framed within the ‘Target 2030’ of the Long Term Vision (LTV) for the Scheldt Estuary. These indicators can serve as
21807-REL-T002.1 page 66/337
a tool for the exploration, planning, implementation and anal-ysis of policies and are also useful as a link between scien-tific research and policy.
In addiction the research can be refine by selecting a specific theme among the following available ones: shipping, safety, hy-drodynamics, morphodynamics, physical characteristics and bio-chemistry, habitat diversity, ecology and diversity, fisheries, socio-economical system, administration and law, recreation and tour-ism.
The user can also start the research by selecting on of the availa-ble theme; in such case, the user can directly access:
- the list of the metadata and the data document related to the chosen theme;
- the data-portal and its web-GIS application with the list of all data (including spatial ones) related with to the chosen theme;
- the list of the indicators related to the chosen theme.
1c Operating entity
The development of the ScheldeMonitor web-portal was funded by the Executive Secretariat of Flemish-Dutch Scheldt Commis-sion (in Dutch: Vlaams Nederlandse Schelde Commissie) (VNSC). The Flemish and Dutch governments have drawn up a new work-ing structure for their joint research and monitoring program, in-volving: - The Flemish Ministry of Mobility and Public Works, Depart-
ment of Mobility and Public Works, Maritime Access Division;- The Dutch Ministry of Infrastructure and the Environment,
Rijkswaterstaat, Centre for Water Management Water ser-vice.
The representative of the contractor is the Flanders Marine Insti-tute (VLIZ).
1d Management structure
Flanders Marine Institute (VLIZ)
1d Contacts
Klaas Deneudt, e-mail: [email protected]
Vlaams Instituut voor de Zee VLIZ - InnovOcean site Wandelaarkaai 7 8400 Oostende Belgium
ScheldeMonitor Web-Portal: http://www.scheldemonitor.org/home.php
1e Typology Operational
2 Operational context and information content
2a ICZM dimensions
The ScheldeMonitor Web-Portal mainly addresses all the five considered information dimensions. The environment and the ter-ritory dimension are in depth developed. The economic infor-mation in the system is provided with layers regarding tourism, recreation, fisheries, shipping and port development. The social
21807-REL-T002.1 page 67/337
dimension is addressed by the specific socio-economic theme. Governance is related to the administration and law theme. The five dimensions are also considered by the 17 indicators system.
2b ICZM Sectors
Information (of different typology) that can be accessed through the “data” options are structured in and related to the following themes and sub-themes:
- Shipping: navigation channel, harbour development, nautical management, inland shipping, ocean shipping, recreation, risk;
- Safety: history, flooding, risks, future; - Hydrodynamics: water balance, water level and tide, waves,
current; - Morphodynamics: sand extraction, dredging and dumping,
geomorphology, ecotopes and physiotopes; - Physical characteristics and biochemistry: physical parame-
ters, water quality, sediment quality, air quality, pollution, light climate;
- Habitat diversity: ecotopes and physiotopes, nature devel-opment, habitats and nature areas;
- Ecology and diversity: vegetation, plankton, benthos, fish, birds, mammals, amphibian, macrophytes, ecological func-tioning;
- Fisheries; - Socio-economical system; - Administration and law; - Recreation and tourism.
The 17 indicators included in the system are (some of them can be related to various themes):
- Shipping (socio-economic importance of ports, nautical management, soil interfering activities and environmental ef-fects of ports and shipping);
- Safety (safety against flooding and protection and develop-ment of natural areas);
- Hydrodynamics (morphology and dynamics in the estuary); - Morphodynamics (oil interfering activities, morphology and
dynamics in the estuary); - Physical characteristic and biochemistry (surface water
quality, environmental effects of ports and shipping, loads of pollutant substances);
- Habitat diversity (status of species and habitats, protection and development of natural areas and opportunities for na-ture);
- Ecology and Diversity (status of species and habitats, threats to biodiversity and opportunities for nature);
- Fisheries (Fisheries pressure); - Socio-economical system (population pressure, socio-
economic importance of residential tourism, fisheries, socie-tal response and co-operation and use of the instrument 'in-dicators for the Scheldt estuary');
- Recreation and tourism (opportunities for recreation on water and land and socio-economic importance of residential tour-ism).
21807-REL-T002.1 page 68/337
2c Integration
The system provides various information data can be considered as results of an integrated analysis. There are for example various data and information (including maps) related risk, including flood-ing. Furthermore the system includes 17 indicators that in most of the cases are the results of an integrated evaluation of different data (see point 2b).
2d Spatial scale Transnational scale – Schelde Estuary zone, including the Dutch and Belgium areas.
2e Flexibility ScheldeMonitor web-portal was specifically developed to address the coastal and the estuary zone of the Schelde river between the Flanders and the Dutch Regions.
3 ICZM functionalities
3a Knowledge related functionalities
ScheldeMonitor web-portal provides many of the knowledge relat-ed functionalities considered by the analysis, specifically:
- Integration among different information sectors (see point 2c);
- Full availability of data and information; the system allows the availability of a wide variety of information typology (pa-rameters, data sources, map layers, figures, dataset and publications). Many information (including spatial) can be downloaded.
- Operation at the different spatial scale; some of the available spatial data can be re-scaled according to the consideredspatial extent; thus enabling to visualize more details at a higher scales;
- Availability of multi-time data, for example in the case of spa-tial data, multi-time maps are provided for the geomorpho-logic features of the territory (7 different time step from the 1936 to 2004);
- Inclusion of ICZM indicators; the web-portal includes 17 indi-cators related to various themes which are particularly rele-vant in supporting ICZM steps. The indicator functionality is rather advanced. The specific indicator window makes avail-able: key message related to the indicator, summary sheet, technical sheets on measures used to calculate the indicator, links to data suppliers, link to the data portal enabling to view the data correlated to the specific considered indicator. The indicator summary appears to be particularly useful to sup-port policy and decision making.
3b Process related functionalities
Schelde Monitor Web-portal provides relevant illustrative and in-novative examples of ICZM process related functionalities consid-ered by the analysis, specifically:
- ScheldeMonitor provides a wide support to problem under-standing and structuring. It contains a wide variety of infor-mation and a high number of data. All are structured accord-ing to theme and sub-themes, thus already providing a con-ceptual structure of the many data and information available. The portal enables users to search for data and information
21807-REL-T002.1 page 69/337
through intuitive and user friendly functionalities.
- Many of the information can properly support planning and management phases of the ICZM process. This is particular-ly evident for the indicators, which represent a synthetic in-formation very useful in supporting policy and decision mak-ing.
- Indicators can be particularly relevant in supporting progress towards defined targets, and specifically the Target 2030 of the Long Term Vision (LTV); thus they can properly support adaptive management. In this perspective it is interesting to highlight that the set also includes an indicator specifically dealing with the use of the indicators instruments by target users.
- Stakeholder involvement and participation; the ScheldeMoni-tor web portal includes the “e-room” tool. This is a virtual pro-ject-space that offers an online environment where minutes, reports, calendars can be kept and shared with others users within the Research and Monitoring of the Scheldt-estuary (O&M) project. A calendar is used to show a clear overview of planned meetings and workshops. Login and password are needed to gain access to the e-room. Furthermore, An email with new literature, datasets, projects and confer-ences, is transmitted bimonthly.
- ScheldeMonitor fully supports cooperation among authorities of two different member states in the joint management of the complex Schlede Estuary system. Indeed, the web-portalitself was designed and development within the cooperative framework.
4 Users
4a User typology
The broad nature of the Schelde Monitor CIS is intended for any-one who may be interested in estuary and marine information in this zone. For this reason potential users are:
- Decision-makers;
- Coastal planners and/or managers;
- Specialised and expert users.
- Civil society.
The various information typologies included in the web-portal have different user targets. Indicators are for example very rele-vant for policy and decision making as well as for communication. Raw spatial and numeric data can support activities of experts, including researches. Maps may be more useful for coastal plan-ners and managers.
5 Use of the system
5a Accessibility
Free access on-line to all the system described in this sheet. Some parts of the site are protected and can be accessed only with login and password. Accounts are granted to certain groups within the scope of specific projects (MONEOS, VNSC, ...).
21807-REL-T002.1 page 70/337
5b User-friendliness
Highly user-friendly.
The web-portal offers a wide variety of information and search-ing/visualising tools. Notwithstanding this complexity user-friendliness is particularly evident and use of the web-portal is very intuitive, also thanks to an ergonomic optimisation of the tools. Logic structure in themes and sub-themes is particularly helpful.
Many parts of the system are available in two languages: Dutch and English.
5c Interactiveness
Interactivity with the system is particularly high. In particular the web-portal provides three main tools:
- Feedback; Schelde Monitor includes a feedback tool to send suggestions in order to improve system’s functionalities and contents;
- E-service; used by the users to subscribe to a bimonthly e-mail newsletter on literature, datasets, projects and confer-ences related to the Schelde Estuary;
- E-room; this is a virtual project-space that offers an online environment where minutes, reports, calendars can be kept and shared with others users.
5d Data access
A great part of data (including spatial ones) and other information typologies can be downloaded. Documents and information on the 17 indicators are accessible and downloadable to all users.
Metadata sheet are available for alphanumeric and spatial data.
6 Technological characteristics
6a Used technology ScheldeMonitor web portal is a web-site developed with “php” languages and standards.
6b Integration with oth-er tools
ScheldeMonitor web-portal includes different tools mutually inte-grated, in particular: the information tool, the data portal and the indicator tool.
6c Integration with oth-er CIS
The system is alimented with data and information supplied by various data providers.
6d Interoperability
7 Cost/resources
7a Resources
Web-site consultation
http://www.scheldemonitor.org/home.php; last visit on 03/04/2011 at 10.30.
21807-REL-T002.1 page 71/337
3.12 North Sea Atlas
1 General Information
1a Name North Sea Atlas (NoordZeeAtlas in Dutch)
1b Description
The North Sea Atlas is a Web-GIS on the marine environment of the Dutch North Sea; the Atlas includes information on coastal water but no specific data on the coastal territory. Provided spatial data refer to physical and environmental characteristics, use of the sea, policy and management issues related to the considered area of the North Sea. The Atlas is also available in printed form. Maps have been regularly published since 2004.
The Atlas has been developed to support the activity of the North Sea Interdepartmental Consultation Directorate (IDON), a coopera-tive board of 10 ministries, specifically dealing with integrated as-pects of the Dutch North Sea management.
1c Operating entity North Sea Office
1d Management structure
North Sea Office
1e Contacts
Ad Stolk, e-mail: [email protected], [email protected] Ministry of Infrastructure and Environment North Sea Directorate P.O. Box 5807 2280 HV Rijswijk - The Netherlands
Web-GIS: http://www.noordzeeatlas.nl/en/nzaEn.html
Web-Site: http://www.noordzeeatlas.nl/en/index.html
1f Typology Operational
2 Operational context and information content
2a ICZM dimensions
The Nord Sea Atlas includes information related to four of the five considered ICZM dimensions: territory (e.g. 3 and 12 miles nautical limits, protected areas, bathymetry), environment (e.g., characteris-tics of biological systems in various environmental matrixes such as sediment and marine water, pollutant concentrations) and economy (locations of offshore wind-farms, marine traffic). Governance is also properly addressed; a specific section of the Atlas deals with –information related to “Policy and management of the Dutch North Sea”.
2b ICZM Sectors
Main sectors covered by the Atlas are:
- Physical geography, e.g.: depth on the Dutch Continental Shelf, geomorphology, sediment physical characteristics, seasonal current regimes, wind speed, tide, etc.;
- Characteristics of biological systems;
21807-REL-T002.1 page 72/337
- National monitoring stations for sea water and sediment;
- Chemical concentration of pollutants in sediment and in sea wa-ter;
- Integrated information on erosion and transportation of the sus-pended matter in the Dutch North Sea;
- Different use of the marine area, including: archaeological zones, division of the Dutch Continental Shelf, pollution reports on Dutch Continental Shelf, sand and shell extraction, dumping sites of dredged material, submarine cables, platforms and pipelines, traffic separation scheme, military use;
- Policy and management of the Dutch North Sea: national com-petence areas in the North Sea, maritime zoning of the Dutch North Sea (statutory administrative zones), map of the spatial policy document PKB “key planning decision”, protected sites according to the EU Birds and Habitats Directive, drainage ba-sins according to the Water Framework Directive, map showing elements related to mining uses, seabed protection area.
2c Integration
The Atlas gives much relevance to aspects related to planning and management of the Duct North Sea Atlas, also including results of integrated analysis.
This is the case of the map of the spatial policy document PKB “key planning decision”. PKB defines the objective for the spatial policy of the Dutch North Sea: to enhance the economic significance of the North Sea, and to conserve and develop internationally important ecological and landscape values. Another example of integrated analysis is provided by the map showing elements relevant of the mining uses of the sea and related regulation.
2d Spatial scale
National Scale – Dutch North Sea
The Atlas focuses on the marine area and does not include infor-mation on the coastal territory. For some layers, information is avail-able for a larger portion of the North Sea.
2d Flexibility The system has been developed in order to be applied specifically to the zone of Dutch Sea.
3 ICZM functionalities
3a Knowledge relat-ed functionalities
Nord Sea Atlas provides some of the knowledge related functionali-ties considered by the analysis; specifically:
- Integration among different information sectors (see point 2c);
- Availability of spatial data; the Atlas enables direct connection of users thought ESRI Arc Explorer (free software) that allows the visualisation of selected layers on a client computer;
- Inside the Atlas there are different multi-time data and infor-mation, such as concentration of pollutants in the sea sediment.
3b Process related functionalities
The Atlas specifically focuses on the Dutch marine area; in a strict sense it does not provide specific support to ICZM. However, the At-las is specifically developed to support the activity of the North Sea Interdepartmental Consultation Directorate (IDON) in the perspective
21807-REL-T002.1 page 73/337
of Maritime Spatial Planning (MSP) and Integrated Maritime Policy (IMP), with evident connection to the ICZM issues. In this perspec-tive, the Atlas in particular provides support to assessment of alterna-tives in marine planning and management.
4 Users
4a User typology
The Atlas is specifically oriented to users dealing with marine plan-ning and management, therefore including:
- Decision-makers, at the national level;
- Coastal planners and/or managers, at the national and regional level.
5 Use of the system
5a Accessibility
The North Sea Atlas can be accessed in two different ways:
- Through Web.-GIS interfaces and functionalities;
- Direct connection of users thought ESRI Arc Explorer (free software) that allows the visualisation of selected layers on a client computer;
5b User-friendliness
Medium user-friendly.
The Atlas is built around an interactive map very easy to browse, which allows anyone to visualize provided maps and layers. Descrip-tion of information contained in each maps (group of layers) is not always totally explanatory.
The system is available in English.
5c Interactiveness No specific e-participation tools are provided.
5d Data access
The Atlas does not allow to download spatial data; however it ena-bles direct connection of users thought ESRI Arc Explorer (free soft-ware) that allows the visualisation of selected layers on a client com-puter. Pre-defined static maps available in the Atlas and customised maps can be exported and print.
Metadata are in general provided for the pre-defined maps (groups of layers) included in the Atlas. However, they are not available for the specific layers.
6 Technological characteristics
6a Used technology ESRI ArcSDE (licensed software).
6b Integration with other tools
No specific integration with other tools
6c Integration with other CIS
The Nord Sea Atlas is included in the European Atlas of the Seas. http://ec.europa.eu/maritimeaffairs/atlas/index_en.htm), together with the other following CISs:
- MAGIC (United Kingdom);
- De Kust Atlas (Belgium);

21807-REL-T002.1 page 74/337
- The Atlas of the Venice Lagoon (Italy);
- Coastal Atlas of Andalusia (SIGLA)
- Cross Channel Atlas.
6d Interoperability
Medium
Data in the system are freely accessible by a client computer through ArcExplorer / ArcExplorerWeb applications and IMS-server connec-tions. Direct download of spatial data from the Atlas in not available.
ISO 19115 compliant metadata are available in ESRI sheet format only for some layers. A metadata catalogue is not available, while some additional description is provided for every static map.
7 Cost/Resources
7a Resources About 8 persons are involved in the Atlas management
Web-site consultation:
- http://www.noordzeeatlas.nl/en/index.html; last visit on 19/03/2011 at 12.00.
21807-REL-T002.1 page 75/337
3.13 WATLAS - Wadden Sea Atlas and the Wadden Sea Portal
1 General Information
1a Name WATLAS (Wadden Sea Atlas) and the Wadden Sea Portal
1b Description
Watlas is a web-atlas collecting data of the Dutch Wadden-Sea region. Watlas includes interactive thematic maps on topics (e.g. tourism, fisheries, mining, landscape, etc.) relevant for the man-agement of the Wadden Sea. By selecting one of the topic users visualise a pre-defined map including various pre-selected layers that can be further customised. One of the viewable layer enables to recall and visualise photos of the Wadden Sea environment.
Layers and maps included in the web-atlas are provided by vari-ous bodies dealing with the management of the Wadden Sea, and mainly by the Rijkswaterstaat - Directorate Northern Nether-lands (part of the Dutch Ministry of Transport, Public Works and Water Management) and the related National Institute for Coastal and Marine Management (RIKZ).
Watlas has been developed within the InterWad project involving four Dutch ministries: LNV (agriculture, nature management and fisheries), V&W (transport, public works and water management), EZ (economic affairs) and VROM (housing, spatial planning and the environment). InterWad is a project that has developed and manages the Wadden Sea Portal (http://www.waddenzee.nl/) also including the Watlas web atlas. In general, the Wadden Sea Por-tal collects and disseminates news, facts, documents and infor-mation on knowledge, policy, management and use of the Dutch Wadden Sea. Besides Watlas, the Wadden Sea Portal provides other tools that can implement the above goals, specifically: the Wadden barometer, the encyclopaedia and the Geoportal.
Watlas is interfaced with the “Wadden barometer” web-tool (http://www.waddenzee.nl/waddenbarometer.html). The Wadden barometer provides information related to different themes in terms of indicators, qualitative trends and description of process-es. Addressed themes are: nature, water environment, climate, social economic, energy and minerals, tourism, safety and coastal protection. Each theme includes more specific sub-themes. For some of them the barometer provides a direct access to Watlas, thus enabling to visualise the layers associated to the selected sub-theme.
The encyclopaedia, accessible by the Wadden Sea Portal, pro-vides basic information (documents) about the history, landscape, culture and human activities of the Wadden Sea area. There are different possibilities for searching a document:
- Through keyword search in the "Quick search" functionality made available by the encyclopaedia;
- Clicking the desired keyword in the "Aquabrowser" tool pro-vided by the encyclopaedia;
- Using "Watlas" to perform a map-search; Watlas is therefore

21807-REL-T002.1 page 76/337
directly interfaced with the encyclopaedia tool;
The Geoportal application (accessible form the Wadden Sea Por-tal home-page) is used to share and make available spatial data and metadata related to the Wadden Sea. Search can be done through key words and/or a map viewer enabling to select an ar-ea of interest. For the selected information:
- Metadata are showed thought an extended and detailed metadata sheet;
- Data can be downloaded as spatial layers;
- Spatial data can be visualised through Interwad OGC ser-vices using a WMS connection.
1c Operating entity
Watlas was developed within the InterWad project involving four Dutch ministries: LNV (agriculture, nature management and fish-eries), V&W (transport, public works and water management), EZ (economic affairs) and VROM (housing, spatial planning and the environment).
The web-atlas (and in general the web-site on the Wadden Sea) is still maintained by the InterWad team, whose office is based in Leeuwarden within the “House for the Wadden Sea”.
1d Management struc-ture
InterWad team, based in Leeuwarden.
1d Contacts
Piet Feddema; e-mail:
[email protected]; [email protected]
Kantoorlocatie InterWad, RCW en Waddenacademie:
Huis voor de Wadden
Ruiterskwartier 121 A
8911 BS Leeuwarden
Web-site: http://www.waddenzee.nl/
Watlas: http://mapserver521.waddenzee.nl
1e Typology Operational
2 Operational context and information content
2a ICZM dimensions
Watlas includes information related to three of the five considered ICZM dimensions: territory (e.g. protected areas, landscape), en-vironment (e.g. bathymetry, topography, water quality) and econ-omy (locations of offshore wind-farms, tourism, mining).
2b ICZM Sectors
Watlas enable to quickly visualise the following thematic maps:
- Topography and bathymetry;
- Water quality monitoring stations;
- Hydrography;
- Landscape;
- Natural features;
21807-REL-T002.1 page 77/337
- Protected areas;
- Human activities (e.g. fishery, transportation, wind-farm, tourism and recreational activities);
- Energy production and mining;
- Military zone.
Each thematic map contains some pre-selected layers that how-ever can be customised by the users. Each layer is described by a synthetic metadata sheet.
2c Integration No specific integration among information is directly provided
2d Spatial scale Sub-National – Dutch area of the Wadden Sea.
2e Flexibility Watlas has been developed in order to be applied to the specific area of the Wadden Sea.
3 ICZM functionalities
3a Knowledge related functionalities
Various ICZM knowledge related functionalities are provided by the Wadden Sea Portal in general, including Watlas and the other previously described tools.
Watlas supports the operation at different spatial scale. Available spatial data can be re-scaled according to the considered spatial extent, thus enabling to visualize more details with a higher scale. This is particularly evident for topography and bathymetry data.
Watlas is interfaced with the “Wadden barometer” web-tool. The Wadden barometer provides information related to different themes in terms of indicators, qualitative trends and description of processes. Addressed themes are: nature, water environment, climate, social economic, energy and minerals, tourism, safety and coastal protection. Each theme includes more specific sub-themes. For some of them the barometer provides a direct access to Watlas, thus enabling to visualise the layers associated to the selected sub-theme. Even if the Wadden barometer does not specifically refer to the ICZM indicators, it appears to be a good tool providing synthetic information for communication and man-agement objectives.
The encyclopaedia tool can be also very useful to quickly search documents related to the knowledge and management of the Wadden Sea area.
Spatial data can be downloaded through the Geoportal applica-tion that also provides detailed metadata description.
3b Process related functionalities
Watlas does not include specific ICZM process related functionali-ties. However, it contains a wide and articulated set of maps and layers. Furthermore, the general Wadden Sea Portal provides other tools (Wadden barometer and encyclopaedia) that together with the Watlas information can properly support the ICZM pro-cess in its various phases.
The Wadden Sea Portal managed by the InterWad project team provides an e-forum space to the users. The forum can be used
21807-REL-T002.1 page 78/337
to provide comments, opinions and suggestions regarding the fu-ture improvement of the web-site and the related tools. To join the forum, users must previously register.
4 Users
4a User typology
Watlas is mainly acting as maps and data viewer, integrated with the barometer and the encyclopaedia tool providing other synthet-ic data. Target users appear to mainly be policy and decision makers rather than coastal professionals and expert users. Civil society in general is also included as possible target user of the atlas.
Coastal professionals and experts can be more interest in the use of the Geoportal tool that makes available spatial data and metadata.
5 Use of the system
5a Accessibility Free access on-line to all the Watlas contents and functionalities, as well as to all the other Wadden Sea Portal’s tools.
5b User-friendliness
Highly user-friendly.
Watlas is built around an interactive map very easy to browse, which allows anyone to identify, visualize and query datasets rel-evant to their interest. Use of the Wadden barometer and the en-cyclopaedia is also very intuitive. Use of the Geoportal is more complex since this tool is mainly addressed to expert users.
Watlas is a bi-lingual system, available in Dutch and English.
5c Interactiveness
The Wadden Sea Portal managed by the InterWad project team provides an e-forum space to the users. The forum can be used to provide comments, opinions and suggestions regarding the future improvement of the web-site and the related tools. To join the fo-rum, users must previously register.
5d Data access
Static maps visualised through Watlas can be exported in different customized format such as png and gif. All layers included in the atlas are described through metadata.
All spatial data can be downloaded through the Geoportal applica-tion that also provides a detailed description of metadata.
6 Technological characteristics
6a Used technology
Watlas was developed using the UMN Mapserver Technologies (open source technology).
The Geoportal is based on the Open Source application “GeoNetwork” and is strictly related to standards and require-ments of the INSPIRE Directive.
6b Integration with other tools
Watlas is directly interfaced with the “Wadden barometer” web-tool (http://www.waddenzee.nl/waddenbarometer.html). The Wadden barometer provides information related to different themes in terms of indicators, qualitative trends and description of
21807-REL-T002.1 page 79/337
processes. Addressed themes are: nature, water environment, climate, social economic, energy and minerals, tourism, safety and coastal protection. Each theme includes more specific sub-themes. For some of them the barometer provides a direct access to Watlas, thus enabling to visualise the layers associated to the selected sub-theme.
Watlas is also directly interfaced with the encyclopaedia tool, de-scribed in point 1b.
6c Integration with oth-er CIS
No specific integration with other CIS
6d Interoperability
High.
The use of standard protocols for data management (according to INSPIRE Directive) guarantees a high interoperability of the sys-tem. Metadata are managed through a specific application (Geo-portal) in compliance with INSPIRE protocols and requirements. All spatial data are freely available and can be downloaded through the same application.
7 Cost/resources
7a Resources
In the 2002, the initial development cost of the Wadden Sea Por-tal was 35.000 €.
Management costs for the whole CIS (Wadden Sea Portal) is 375.000 € per year (including resources for 3.3 full time equiva-lent per year – fte/year).
Management costs for Watlas (web atlas) include in the Wadden Sea Portal is: resources for 0.2 fte/year and 10.000 €/y of external technical costs.
Web-site consultation
- http://mapserver521.waddenzee.nl; last visit on 18/03/2011 at 12.00.
- http://www.waddenzee.nl; lat visit on 18/03/2011 at 12.00.
- Piet Feddema, 2011. Information provided by mail on the 02.05.2011 at 09.33, CET
time.
21807-REL-T002.1 page 80/337
3.14 KustAtlas - Belgian Coastal Atlas
1 General Information
1a Name KustAtlas - Belgian Coastal Atlas
1b Description
The Belgian Coastal Atlas is an initiative of the Belgium Coordina-tion Centre on ICZM. It was firstly published in 2004 as a book, triggered by the reporting obligations to the European Commission about the state of the Belgian coasts related to the ICZM Recom-mendations (2002/413/EC). From the beginning, main aim was to present a general and synthesised overview of the main character-istics of the Belgian coast in relation to ICZM.
The many requests for maps encouraged the developers to launch a web-based atlas in 2005. The Belgian Coastal Atlas is presently a digital atlas which contains information and maps on different coastal aspects. It provides online access to unique maps (static maps) which are downloadable as pdf documents; underlying data related to the maps are available in excel format. The Atlas is structured in 12 main sectors (chapters); each chapter is related to specific ICZM indicators. Other sustainability indicators are also provided by a link to the “Sustainability barometer” website. To im-prove communication functionalities, the atlas is presently availa-ble in four languages: Dutch, English, France and German.
Following the initial book perspective, the on-line system mainly aims to provide an easily accessible, simple, user-friendly atlas to users, as well as to make available readily usable maps on Bel-gian coasts. Maps have been produced using data mostly provid-ed by the public authorities and their administrations.
The Belgian Coastal Atlas currently offers partially limited possibili-ties for interactivity. The ICZM Coordination Centre is working to move from static version of the web atlas to an interactive data-driven atlas, where sustainability indicators for the coasts will again play a prominent role. The final product will be a policy sup-porting tool supporting the ICZM process for a wide range of us-ers.
1c Operating entity
The Belgium Coordination Centre on Integrated Coastal Zone Management.
The development involved the collaboration with three private partners: Aquaterra, Five to Nine and Magenta.
1d Management struc-ture
The Belgium Coordination Centre on Integrated Coastal Zone Management is responsible for the atlas management.
1d Contacts
Kathy Belpaeme, e-mail: [email protected]
The Belgium Coordination Centre on Integrated Coastal Zone Management in Belgium Ghent, BELGIUM
21807-REL-T002.1 page 81/337
Web-site of the atlas: http://www.kustatlas.be/en/; Web-site of the Belgium Coordination Centre on ICZM: http://www.kustbeheer.be
1e Typology Operational
2 Operational context and information content
2a ICZM dimensions
The Atlas contains data related to all the five considered ICZM dimensions: territory, environment, economy, society and govern-ance (e.g. in relation to the latter, the Atlas includes maps and in-formation on spatial planning and policy priorities for the coasts, as well as on use of the sea).
2b ICZM Sectors
The Atlas is structured in 12 main sectors (chapters):
- Spatial setting; - Physical environment; - Spatial structure; - Use of the sea; - Environment and nature; - Tourism and recreation; - Industry and business; - Fishery and agriculture; - Culture and heritage; - Living near the sea; - Coastal defence - Integrated coastal zone management
Each chapter contains data, maps and descriptive information re-lated to various items. Moreover, each chapter is related to the relevant ICZM indicators.
2c Integration
The KustAtlas includes numerous examples of integrated infor-mation, in particular in relation to 27 ICZM indicators and the sus-tainability indicators of the “Sustainability barometer”; some ex-amples are: percentage of Natura 2000 sites in Favourable Con-servation Status according to Habitat and Bird EC Directives; Flooding risk maps (population at risk, area of protected sites and value of economic assets at risks). Integrated maps are also provided, merging multiple information in the same map (e.g. multifunctional use of the sea, coastal evolu-tion and defence, etc.).
2d Spatial scale
National – The atlas mainly focuses on the Belgian coast.
However the transnational level is also approached by the Atlas; the ICZM indicators, monitored within the SAIL project (Schéma d'Aménagement Intégré du Littoral) cover the wider area of the Southern North Sea (Essex –UK; Kent – UK, Nord-Pas De Calais - France, West Flanders - Belgium and Zeeland -the Nether-lands).
2e Flexibility
KustAtlas was specifically designed to deal with the coastal area of Belgium. However, the Atlas served as an example to develop similar tools in Vietnam and Spain (Catalonia) (see http://ec.europa.eu/ourcoast/index.cfm?menuID=9&articleID=168).

21807-REL-T002.1 page 82/337
3 ICZM functionalities
3a Knowledge related functionalities
Several knowledge related functionalities, supporting ICZM pro-cess are available in the KustAtlas:
- Integration among different information sectors (see point 2c);
- Availability of some spatial information; shape file are availa-ble only for a limited number of layers;
- Multi-time data information, provided by every sustainability indicator and by several chapters of the Atlas (e.g. physical environment, fishery and agriculture, coastal defence);
- Inclusion of all 27 ICZM indicators identified by the Deduce project; the indicators were developed , by the SAIL project (Schéma d'Aménagement Intégré du Littoral), a partnership of regional and local authorities, maritime organisations, and coastal and marine agencies, working together for the sus-tainable development of the Southern North Sea tidal area(http://www.vliz.be/projects/SAIL/db.php);
- Inclusion of 21 sustainability indicators, through a link to the so called sustainability barometer (http://www.vliz.be/projects/indicatoren/, Dutch only). It allows to gain an overview of the current state and the trend of sev-eral sustainability indicators of the coast, identifying also pos-sible signals for coastal policy adjustment or harmonisation. A trend is given for each indicator stating whether the latter is positive, negative or neutral. The data are presented as graphs and tables but not with geographically explicit spatial referencing.
3b Process related functionalities
The articulated structure of Kustatlas, organised in different the-matic chapters and providing a high variety of data, extended text, graphs and factsheets can support problem understanding and structuring for the Belgian coast area.
Definition of trend for each sustainability indicator further helps problem understanding, assessing whether the coast is moving towards or away from sustainability, supporting coastal managers and decision-makers.
Including to wide set of indicators (ICZM and sustainability ones) and relative temporal trends, the KustAtlas can support the defini-tion of possible scenarios for the future evolution of the coastal ar-ea.
4 Users
4a User typology
The target KustAtlas audience includes:
- general public, for the wide and easily understandable infor-mation content;
- coastal planners and managers, especially for the information about plans and policies;
- policy makers and decision makers, especially for the ICZM and sustainability indicators.
21807-REL-T002.1 page 83/337
Scientific users (e.g. universities, research institutes), administra-tions and supporting services and schools, also demonstrated their interest in the Atlas, through the frequent requests for addi-tional information and maps.
In particular the integrated map on the multi-functional use of the sea has been requested many times by different user typologies, also including administrations and research institutions ( Belpaeme and Maelfait, 2011).
5 Use of the system
5a Accessibility
Free access on-line to all the Atlas.
All data contained in the atlas are freely available; data are mostly provided by public authorities and their administrators. No licens-ing or data release issues apply. Illustrations, pictures, maps and texts of this atlas can be used subject to prior written permission of the copyright owners and an express mention of the source.
5b User-friendliness
Highly user friendly.
The user interface is very simple and it presents an intuitive use. The multi-language (French, Dutch, German and English) func-tionality helps users from different countries.
5c Interactiveness
No specific e-participation tools are provided by the KustAtlas.
Feedback process, by means of questionnaires for user satisfac-tion, was created.
The ICZM Coordination Centre is working to move from a static version of the web atlas to an interactive data-driven atlas. The fi-nal product will be a policy supporting tool supporting the ICZM process for a wide range of users.
5d Data access
All maps are downloadable in “*.pdf” format. Some data are down-loadable also in excel format. Availability of downloadable spatial data is provided only for some cases.
The Atlas does not include specific metadata information struc-tured according to a shared standard. However, metadata descrip-tive sheets are available for the maps and indicators contained in the Atlas.
6 Technological characteristics
6a Used technology The system uses the Apache web-server and the MSSQL rela-tional database. The web-site is set up in php/html and flash ap-plications and action-scripts were used for the interactive maps.
6b Integration with other tools
The system is linked to the sustainability indicator database de-veloped by the same Coordination Centre for ICZM.
ICZM indicators are directly incorporated in the KustAtlas; how-ever these were developed by the SAIL project for a wider area, i.e. Southern North Sea (Essex –UK; Kent – UK, Nord-Pas De Calais - France, West Flanders - Belgium and Zeeland -the Netherlands). Direct integration is therefore set between the KustAtlas and the ICZM indicator web-site (SAIL project web-
21807-REL-T002.1 page 84/337
site).
6c Integration with other CIS
The KustAltas will be further developed within the C-Scope pro-ject that also foresees the further improvement of the Dorset Ex-plorer and in particular the development of the Dorset Coastal Explorer. However KustAtlas and Dorset Coastal Explorer are dif-ferent tools, with different aims and different target users: the first one is mainly a communication tool designed as a portal site to wider audience; the second one is mainly a planning tool, de-signed for stakeholders and planners.
KustAtlas is a member of the International Coastal Atlas Network (ICAN).
6d Interoperability
Low (not properly applicable).
At the moment the Atlas is a collection of static maps with limited possibilities to analyze, compare and integrate the different infor-mation contents.
Future implementation of the Atlas includes the development of a functionality enabling to import GIS format maps within the Google Earth software.
7 Cost/Resources
7a Resources
Cost for the development of the printed atlas: €46,381. Cost for the development of the on-line atlas: Development on-line ver-sion: €25,073, Development/translation German and French ver-sion: € 5,855. The cost of updating the atlas is not known.
The book and the online version of the Belgian Coastal Atlas were financed by the project partners of the Coordination Centre: the province of West-Flanders and the two main Flemish coastal administrations, and by European structural funds within the ob-jective 2 program for the Belgian coast.
21807-REL-T002.1 page 85/337
Information sources for the overview analysis of KustAtlas:
Belpaeme K. and Maelfait H., 2011. Chapter 10: “Belgium”. In Wrigth D., Dwyer E.,
Cummins V.[eds.], 2011. Coastal informatics: Web Atlas Design and Implementation.
Information science reference, Hershey, New York. pp. 156-164.
Clive G. (2008). Making the Coast Visible: an indicators-based approach to measur-
ing the sustainable development of coastal areas. Bruges: Schéma d’Aménagement
Intégré du Littoral.
Belpaeme K., 2009. Presentation: “User analysis of the Belgian coastal atlas and fu-
ture user needs”. Presented in the: ICAN Workshop, 17 November 2009, Trieste.
Maelfait H. and Belpaeme K., 2010. The Belgian Coastal Atlas: moving from the clas-
sic static atlas to an interactive data-driven atlas.
Web-site consultation:
http://ec.europa.eu/ourcoast/index.cfm?menuID=9&articleID=168; last visit on
22/03/2010 at 11.00.
www.kustbeheer.be; last visit on 24/02/2011 at 12.00.
http://www.cscope.eu; last visit on 24/02/2011 at 12.30.
21807-REL-T002.1 page 86/337
3.15 MAREANO - Marine Area Database for Norwegian coastal and marine regions
1 General Information
1a Name MAREANO (Marine Area Database for Norwegian coastal and ma-rine regions)
1b Description
MAREANO is a Web-portal collecting and distributing data provided by various institutions and organisations. MAREANO includes a rel-evant Web-GIS component used to share maps on depth and to-pography, sediment composition as well as seabed biodiversity, habitats, biotopes and pollution of Norwegian marine coastal and offshore regions.
The main aim of MAREANO is to provide a tool giving direct access to reliable knowledge to industry, authorities, researchers and the general public. For examples, MAREANO may provide data and in-formation related to the questions such as:
- How is the seascape of the Norwegian continental shelf?
- What does the seabed consist of?
- How is the biodiversity distributed on the seabed?
- How are habitats and biotopes distributed on the seabed?
- What is the relationship between the physical environment, bi-odiversity and biological resources?
- How are contaminants stored in sediments?
In this way MAREANO aims to contribute a better knowledge base for managing human activities in the Norwegian coastal and off-shore area, such as fishing, oil and gas exploitation.
1c Operating entity
MAREANO is coordinated by the Institute of Marine Research, in collaboration with the Geological Survey of Norway and the Norwe-gian Hydrographic Service. The three programme partners are members of the Executive Group that acts as the MAREANO’s op-erational management team. Many other institutions and organisa-tions are involved in the programme supporting the MAREANO tool.
1d Management struc-ture
The MAREANO Executive Group made by the Institute of Marine Research, the Geological Survey of Norway and the Norwegian Hy-drographic Service
1e Contacts
Ole Arve Misund, e-mail: [email protected] Head of the Executive Group - Institute of Marine Research (IMR) Kjell Bakkeplass, [email protected] GIS - Institute of Marine Research (IMR) Web site: http://www.mareano.no/english/index.html General contact: [email protected]
1f Typology Operational

21807-REL-T002.1 page 87/337
2 Operational context and information content
2a ICZM dimensions
Environmental information on sea and coastal region are in depth developed. Some economic information is included in the system in relation to industrial activities. No specific social and governance data are provided.
2b ICZM Sectors
Main spatial information included in MAREANO are related to:
- Hydrodynamic characteristics;
- Protected areas, such for example protected coral areas;
- Landscapes and land forms;
- Marine habitats, including distribution of benthic fauna, com-munities, biological diversity and production;
- Detailed bathymetry;
- Sediments physical characteristics;
- Pollution in the sediment;
- Industrial activities, such as maps of pipelines, offshore plat-forms, aquaculture sites.
MAREANO data refers specific to the marine environment and do not include information on the coastal area.
2c Integration No specific integration among information is directly provided
2d Spatial scale National – Norwegian marine coastal and off-shore area
2e Flexibility MAREANO is specifically developed for the Norwegian marine area
3 ICZM functionalities
3a Knowledge related functionalities
MAREANO is a marine oriented tool that however is also useful in supporting ICZM and related MSP aspects. MAREANO data can support integrated assessment of environmental and economic re-lated information, in particular in relation to the sustainable man-agement of the Norwegian marine resources.
Other knowledge related functionalities include operation at the dif-ferent spatial scale; some of the available spatial data can be re-scaled according to the considered spatial extent; thus enabling to visualize more details at higher scales.
3b Process related functionalities
Strictly speaking, MAREANO does not provide specific ICZM pro-cess related functionalities.
However, the same MAREANO web-site stresses the relevance of the tool in supporting sustainable planning and management. “MAREANO will fill knowledge gaps related to seabed conditions and biodiversity defined in The Integrated Management Plan for the Marine Environment of the Barents Sea and the Sea Areas off the Lofoten Islands presented by the Government in 2006. The Plan is due to be revised in 2010, and MAREANO will contribute to a better knowledge base for managing human activities such as fishing and oil and gas exploitation. Priority mapping areas for this phase are located along the shelf break and on the continental shelf in the

21807-REL-T002.1 page 88/337
western part of the mapping area. In the Management Plan, these areas are regarded as being especially ecologically important and vulnerable”.
4 Users
4a User typology The main aim of MAREANO is to give users from the authorities, research. Industry and the general public direct access to reliable scientifically-based knowledge.
5 Use of the system
5a Accessibility Free access on-line to all information. Spatial data can be only vis-ualized and not directly downloaded.
5b User-friendliness
Highly user-friendly
MAREANO is provided with customised interfaces that enables easy browsing and access to data. MAREANO is available both in Norwegian and English.
5c Interactiveness No specific e-participation tools are provided.
5d Data access
A detailed metadata sheet - also identifying the relative data provid-er – can be visualised for all the layers contained in the MAREANO system.
The MAREANO’s users of public sector users will be able to view or download data through Norway Digital, the national geo-referenced data infrastructure. Other users will be able to access data through the agencies responsible for the individual data sets, for example obtain sea depth data from the Norwegian Hydrographical Service, geological data from the Geological Survey of Norway and data on biology from the Institute of Marine Research.
6 Technological characteristics
6a Used technology
6b Integration with other tools
No specific integration with other tools
6c Integration with other CIS
MAREANO is a Web-portal collecting and distributing data provided by various institutions and organisations. In particular the Web-GIS is linked via WMS to databases of the following governmental agencies (all participating to the MAREANO programme):
- NGU: Geological Survey of Norway
- IMR: Institute of Marine Research
- NHS: Norwegian Hydrographic Service
- DIRNAT: Norwegian directorate for mature Management
- IBCAO: International Bathymetric Chart of the Arctic Ocean
6d Interoperability Most of the dataset included in the MAREANO system are available via WMS, ensuring high interoperability in data sharing.
21807-REL-T002.1 page 89/337
7 Cost/Resources
7a Resources No specific information is available on resources needed to imple-ment and manage the Web tool.
Information sources for the overview analysis of MAREANO:
Thorsnes T., 2009: MAREANO – An introduction. Norwegian Journal of Geology. Vol.
89, pp. 3. Trondheim 2009. ISSN 029-196X.
Web-site consultation
http://www.mareano.no/kart/viewer.php?language=en last visit on 09/02/2011 at
15.00.
http://www.statkart.no last visit on 09/02/2011 at 15.15.
http://www.ngu.no last visit on 09/02/2011 at 15.30.
http://www.imr.no/ (Institute of Marine Research) last visit on 02/09/2011 at 16.15.
http://www.sjokart.no/eng/Norwegian_Mapping_Authority/ (the Norwegian Mapping
Authority) last visit on 02/09/2011 at 16.30.
21807-REL-T002.1 page 90/337
3.16 CAMRA - UK Coastal and Marine Resource Atlas
1 General Information
1a Name UK Coastal and Marine Resource Atlas (CAMRA).
1b Description
The UK Coastal and Marine Resource Atlas is a tool for maritime contingency planning and response, and was commissioned in recognition of the need to update the 1990 Government and In-dustry sponsored coastal sensitivity maps produced by the Na-ture Conservancy Council.
The atlas contains environmental and other resource datasets covering the Great Britain coastline and marine areas of the UK Continental Shelf. The Atlas is designed as a GIS web based tool to access a wide range of information on coastal and marine re-sources, in particular aiming to support assessment and man-agement emergency incidents such as an oil spill.
In particular, the Atlas provides a flexible resource for national oil spill planning and management, facilitating:
- Seamless multi agency, operational response;
- Audit and contingency planning, consistent with the UK Na-tional Contingency Plan (NCP);
- Clean-up management;
- Damage assessment, compensation, responsibilities;
- Provide information on sensitive resources of the UK coast-line and its seas to all stakeholders;
- Assist in identification of protection and clean-up priorities.
The Atlas is currently hosted in the web-site of the Multi-Agency Geographic Information for the Countryside (MAGIC) system.
1c Operating entity Maritime and Coastguard Agency (MCA)
1d Management structure
Maritime and Coastguard Agency (MCA)
1d Contacts
Kevin Colcomb, e-mail: [email protected] Maritime and Coastguard Agency Counter Pollution and Response Branch Maritime and Coastguard Agency Bay 1/09, Spring Place 105 Commercial Road Southampton SO15 1EG, UK Web-site: http://www.mcga.gov.uk/ MAGIC web-site: http://magic.defra.gov.uk/projectsummary.htm CAMRA is currently hosted in the web-site of the Multi-Agency Geographic Information for the Countryside (MAGIC) system.
1e Typology Operational

21807-REL-T002.1 page 91/337
2 Operational context and information content
2a ICZM dimensions
The Coastal and Marine Resource Atlas focus include information related to three of the five considered ICZM dimensions: territory (e.g. 3 and 12 miles nautical limit, oil and gas infrastructure), en-vironment (e.g. bathymetry, coastal habitats, sand dunes, salt marsh, locations of cetaceans and seals, seabirds nesting counts, bathing waters) and economy (locations of offshore wind-farms, aquaculture sites, nuclear power station).
2b ICZM Sectors
Main sectors included in the Atlas are:
- Physical environment;
- Coastal habitats;
- Biology;
- Management;
- Conservation;
- Environmental Monitoring;
- Infrastructure in the sea;
- Natural resources;
- Fisheries, aquaculture and agriculture;
- Sensitivity to oil spills
2c Integration
CAMRA is specifically developed to support oil spill management that requires integration of different information typologies. In par-ticular the Atlas includes maps identifying vulnerable areas to oil spills for sea bird populations and fish habitats.
2d Spatial scale
National – coastal area of Great Britain
The system can operate at different spatial scales, from the Na-tional to the Sub-national one.
2e Flexibility The system has been developed in order to be applied specifical-ly to the coastal zone of United Kingdom (presently it does not include Northern Ireland).
3 ICZM functionalities
3a Knowledge related functionalities
CAMRA provides some of the knowledge related functionalities considered by the analysis; specifically:
- Examples of integration among different information sectors (see point 2c);
- Operation at the different spatial scale; some of the available spatial data can be re-scaled according to the considered spatial extent; thus enabling to visualize more details at a higher scales. This is for example the case of data on inter-tidal substrate characteristics;
- Multi-time data for a limited number of informative layers; this is specifically the case of maps of oil spill vulnerability for birds and fish.

21807-REL-T002.1 page 92/337
3b Process related func-tionalities
The Atlas is not specifically related to an ICZM process. However it is strictly related to an operational use in coastal planning and management, in particular concerning oil spill vulnerability and risk.
In this perspective, it is important to stress that the Atlas is direct-ly used and managed by and operative organisation, i.e. the Mari-time and Coastguard Agency.
4 Users
4a User typology
The digital atlas is primarily a tool aimed at supporting govern-ment agencies involved in environmental planning and in particu-lar in oil spill contingency planning and response.
The Atlas contains a wide and complete set of information on the coastal area; therefore as a secondary function it can be of use to experts working in the area of coastal and marine environmental management in the private, public and voluntary sectors.
5 Use of the system
5a Accessibility Free access on-line to the entire Atlas (only visualisation).
5b User-friendliness
Medium.
The selection and visualisation of the data is not direct, but re-quires different steps (at least two). The system is available in English.
5c Interactiveness No specific e-participation tools are provided.
5d Data access
Direct download is possible only for some layers, while others may be requested to the related data providers. Furthermore, static maps visualised through the web-GIS can be exported in pdf format.
Complete metadata and link to the data provider’s website are available for each layer. The metadata comply the ISO 19115 standards.
6 Technological characteristics
6a Used technology The data storage is in local system with a SQL Server and the in-terface is made with ESRI ArcSDE (licensed software).
6b Integration with other tools
No specific integration with other tools
6c Integration with other CIS
The Coastal and Marine Resource Atlas is part of the Multi-Agency Geographic Information for the Countryside (MAGIC), that provide data related to the whole UK territory (not only coastal zones).
MAGIC - and the integrated CAMRA – is included in the Europe-an Atlas of the Seas. http://ec.europa.eu/maritimeaffairs/atlas/index_en.htm), together with the other following CISs:
21807-REL-T002.1 page 93/337
- MAGIC (United Kingdom);
- De Kust Atlas (Belgium);
- De NoordZee Atlas (Netherlands);
- The Atlas of the Venice Lagoon (Italy);
- Coastal Atlas of Andalusia (SIGLA)
- Cross Channel Atlas.
6d Interoperability
High.
MAGIC is part of a distributed network of geographic information systems called SPIRE - Shared Spatial Information Services. SPIRE is a Defra initiative aiming to improve the quality and ac-cessibility of geographic information not only within Defra but also across its executive agencies and non-departmental public bod-ies.
SPIRE programme has implemented a central store for geo-graphic information to facilitate data sharing within the Defra net-work of organisations. This allows data to be managed once for multiple uses. SPIRE programme has put in place various mech-anisms to provide access to this data including a portal and web map service for Defra network desktop GIS users.
7 Cost/resources
7a Resources
The Atlas is the product of a project managed and collaboratively funded by: the Maritime and Coast Guard Agency (MCA), DEFRA (Department for Environment, Food and Rural Affairs), the Scot-tish Executive (SE), Scottish Natural Heritage (SNH), the Energy Institute (EI), JNCC, the Environment Agency (EA), English Na-ture (EN; now Natural England), the Department of Trade and In-dustry (DTI), the Hampshire County Council (HCC), Essex Coun-ty Council (ECC), Kent County Council (KCC) and the British Ge-ological Survey (BGS).
No specific information is available on cost and resources. Inter-active maps included in the whole MAGIS are monthly updated. The web site reports the detailed description of any provided modification and update; as a very rough estimation about 20 MAGIC layers are monthly updated.
Information sources for the overview analysis of CAMRA:
DEFRA, 2006. Coastal and Marine Resource Atlas. Final Report. Downloadable from:
http://magic.defra.gov.uk/Me1302_4030_FRP.pdf
Green D. 2011. Chapter 13 “United Kingdom”. In Wrigth D., Dwyer E., Cummins
V.[eds.], 2011. Coastal informatics: Web Atlas Design and Implementation. Infor-
mation science reference, Hershey, New York, pp. 192-213.
Web-site consultation:
http://magic.defra.gov.uk/projectsummary.htm; last visit on 03/03/2011 at 12.00.

21807-REL-T002.1 page 94/337
3.17 MIDA - The Marine Irish Digital Atlas
1 General Information
1a Name The Marine Irish Digital Atlas (MIDA)
1b Description
The Marine Irish Digital Atlas (MIDA) is a web tool built in a web-GIS environment, where people interested in coastal and marine information for Ireland can visualize and identify pertinent geospa-tial datasets and determine where to acquire them. The atlas, which is being constantly updated, currently displays more than 140 layers from over 35 coastal and marine organizations both within Ireland and abroad. It also features an “InfoPort” which is a repository of text, imagery, links to spatial data sources and addi-tional reference material for a wide range of coastal and marine topics.
Specific objectives of the MIDA Atlas are to:
- Develop a web site for presentation of geo-referenced ma-rine datasets of environmental importance;
- Provide greater accessibility to data and information in the form of a web enabled, customised GIS;
- Provide flexibility of use by providing a range of tools that al-low users to select, overlay and compare geospatial layers;
- Enable users to identify sources of data, information and ex-pertise on the marine environment;
- Encourage a greater appreciation of Ireland's coastal re-gions by incorporating educational and informational materi-als based on multi-media technology.
The MIDA team has been active in the creation of the Internation-al Coastal Atlas Network (ICAN).
1c Operating entity
MIDA has been developed by the Coastal and Marine Research Centre (CMRC) of University College Cork , in partnership with the Centre for Coastal and Marine Research, University of Ulster, Coleraine, Northern Ireland.
Funders of the Atlas are:
- Ireland’s Higher Education Authority under the National De-velopment Plan PRTLI III Programme (development funds);
- Environment and Heritage Service, Northern Ireland (North-ern Ireland data and partnership);
- Coastal and Marine Research Centre, University College Cork.
1d Management structure
Coastal and Marine Research Centre, University College Cork
1d Contacts Ned Dwyer, e-mail: [email protected] or [email protected] Coastal and Marine Research Centre University College Cork
21807-REL-T002.1 page 95/337
Naval Base, Haulbowline Cobh, County Cork, Ireland
Web-site: http://mida.ucc.ie/pages/atlas/atlas.php
1e Typology Operational
2 Operational context and information content
2a ICZM dimensions
The Atlas mainly addresses four of the five considered infor-mation dimensions.
The environment and the territory dimension are in depth devel-oped. The economic information in the system is provided with a great variety of layers regarding tourism, recreation, fisheries, aq-uaculture, agriculture and coastal and marine industry. Govern-ance information integrated in the system mainly refers to rural areas targeted for investment, current exploration authorizations and license blocks given by the Petroleum Affairs Division.
2b ICZM Sectors
Data/cartographic information included in MIDA are about the fol-lowing topics:
- Physical environment; - Coastal habitats; - Biology; - Management; - Human impact; - Conservation; - Environmental monitoring; - Infrastructure; - Industry; - Culture and heritage; - Natural resources; - Fisheries, aquaculture agriculture; - Tourism and recreation.
2c Integration
No specific integrated data among different information is directly provided within the system.
However the system enables to quickly display thematic maps for pre-defined and selectable sub-regions, through a “Zoom to” tool, accessible from the homepage. These maps are good examples of integrated maps, showing in the same view all the layers avail-able in MIDA related to the selected specific theme (e.g. tourism and recreation, fishing, climatology, etc.).
2d Spatial scale National – Irish coasts.
2e Flexibility
The MIDA, together with the Oregon Coastal Atlas, served as a catalyst in the establishment of the International Coastal Atlas Network (ICAN).
The partners involved in the development of the respective atlas-es organized and co-chaired the initial and subsequent ICAN workshops. The current operational version of the MIDA was launched at the first ICAN workshop held in Cork in July 2006 (O’

21807-REL-T002.1 page 96/337
Dea et al., 2007). MIDA was chosen as one of the atlases for the Semantic Interoperability Demonstrator. On-going enhancement and improvement of the Demonstrator keep MIDA at the forefront of technical development within ICAN. For example for the Tuni-sian Atlas it is suggested to use the “MIDA Engine” model.
3 ICZM functionalities
3a Knowledge related functionalities
MIDA provides some of the knowledge related functionalities con-sidered by the analysis; specifically:
- Integrated maps (see 2c); - Inclusion of some ICZM indicators (coastal erosion, indica-
tion of areas of land and seas protected by statutory desig-nations, sea level rise, pressure for marine and coastal rec-reations, quality of bathing waters);
- Availability of spatial data; some (about 85) of the 140 layers are downloadable in shape-files format. Others cannot be di-rectly downloaded due to confidentiality reasons defined by owners generating the data;
- Inclusion of data on sea level rise and erosion trends in dif-ferent coastal areas of Ireland, potentially useful for coastal vulnerability assessment to climate change impacts.
3b Process related functionalities
MIDA’s structure is well articulated and complete, thus enabling users to easily find data and information and relate the same to specific issues. Thus MIDA is well-shaped for problem under-standing and structuring, as well as coastal management and planning at the national level. Indeed, the user statistics that the atlas is constantly visited attesting to its relevance and usefulness (Dwyer et al., 2011).
Concerning stakeholder involvement and participation, MIDA is totally accessible on-line and moreover stimulates users to share their own data through the MIDA tool.
4 Users
4a User typology
The broad nature of the atlas is intended for anyone who may be interested in Irish coastal and marine information. For this reason potential users are:
- Policy-makers; - Decision-makers; - Coastal planners and/or managers; - Specialised and expert users. - Representative of private sectors (e.g. industrial or energy
companies); - Civil society; - Students.
5 Use of the system
5a Accessibility Free access on-line to all the MIDA Atlas contents and function-alities.
21807-REL-T002.1 page 97/337
5b User-friendliness
Highly user-friendly.
The MIDA Atlas is built around an interactive map very easy to browse, which allows anyone to identify, visualize and query those datasets relevant to their interest. Data search is also clearly supported by the articulated structure used to organisethe same. The Info-Port services provide a tree-structure to quickly browse the available information. The system is available in English.
5c Interactiveness
MIDA enables, and actually invites, users to provide their own spatial data and make use of MIDA functionalities to share thisinformation. Quality check is done before the data publication.
Implementation of Web Map Service (WMS) and potentially Web Feature Service (WFS) / Web Coverage Service (WCS) to di-rectly share information will be investigated in the possible fur-ther development of the MIDA Atlas; thus improving interactive functionalities of MIDA.
The MIDA web-site highlights the importance of establishing a continuous confrontation with users and data providers, aiming to acquire input for both the development and management phase. In particular, efforts to receive input from a broad range of stakeholders have included meetings with key coastal and marine data holders and users (representative of the various us-er groups listed in point 4a). The direction of atlas development and data acquisition is influenced by feedback received at these meetings in order to develop a resource that is useful and inter-esting to everyone.
5d Data access
Direct access to:
- More than 50% (85 on 140) spatial layers, that are directly downloadable; others cannot be directly downloaded due to confidentiality reasons defined by owners generating the data;
- Metadata for all MIDA layers.
6 Technological characteristics
6a Used technology
The system uses Apache Web Server, UMN Map Sever, and PostgreS Database. Metadata is stored in database in order to optimize data management, permit efficient searching, and facili-tate catalogue sharing. The Atlas is developed with Map Server technology (free and open source software).
6b Integration with other tools
MIDA is not integrated with tools providing specific functionalities managed/operated by entities other than the Coastal and Marine Resources Centre of the Cork University.
6c Integration with other CIS
MIDA atlas is a member of the International Coastal Atlas Net-work (ICAN). Moreover, It is a node of the Irish Spatial Data Ex-change (ISDE, http://www.isde.ie) and shares metadata across its distributed network.

21807-REL-T002.1 page 98/337
MIDA is included in the European Atlas of the Seas (http://ec.europa.eu/maritimeaffairs/atlas/index_en.htm), togeth-er with the other following CISs:
- MAGIC (United Kingdom); - De KustAtlas (Belgium); - De NoordZee Atlas (Netherlands); - The Atlas of the Venice Lagoon (Italy); - Coastal Atlas of Andalusia (SIGLA) - Cross Channel Atlas.
The MIDA Atlas displays data layers from numerous coastal and marine organizations both within Ireland and abroad, thus providing a single resource for finding and viewing data on Irish coastal and marine environment. Currently, the atlas is not dy-namically WMS supported.
6d Interoperability
High.
In 2002 the Irish government began developing the Irish Spatial Data Infrastructure (ISDI; McCormack 2004). The development of the ISDI is closely involved with the larger INSPIRE initiative for developing a European Spatial Data Infrastructure. ISO 19115 is the core of the metadata standard of the ISDI and INSPIRE, therefore the approaches taken in this project are in line with these future infrastructures (McCormack 2003).
The ISO 19115 standard was chosen as the MIDA’s metadata standard because many key organisations handling spatial data in Ireland (e.g., Marine Institute, Environmental Protection Agen-cy with the Water Framework Directive, The Department of the Environment with the ISDI) have adopted or are in the process to adopt it.
7 Cost/resources
7a Resources
This MIDA development project began in September 2002 and then it was funded for 3 years by the Higher Education Authority (HEA) under the National Development Plan's PRTLI 3 pro-gramme. Additional funding is being received from the Environ-ment and Heritage Service, Northern Ireland.
The management of MIDA currently involves one full time staff and four part time resources.
Ned Dwyer is the MIDA manager.. Kathrin Kopke is the data manager; she is the coordinator of the acquisition and of prepa-ration of new layers as well as updating the atlas. The others provide technical support, contributing to the database design and programming and creating, editing and preparing various GIS layers as well as completing metadata records.

21807-REL-T002.1 page 99/337
Information sources for the overview analysis of MIDA:
Dwyer E., Kopke K., Cummins V., O’Dea L., Dunne D., 2011. Chapter 7: “Ireland”. In
Wrigth D., Dwyer E., Cummins V.[eds.], 2011. Coastal informatics: Web Atlas Design
and Implementation. Information science reference, Hershey, New York, pp. 105-130.
Wright D.J., Dwyer N, Kopke K., O’Dea L., 2010. Report of International Coastal Atlas
Network Workshop: Formalizing the network, engaging the Mediterranean. 16-20 No-
vember 2009, UNESCO International Centre for Theoretical Physics, Trieste, Italy.
O’Dea L, Cummins V, Wright D. J., Dwyer E., Ameztoy I., 2007. Report on coastal
mapping and informatics Trans-Atlantic Workshop: Potentials and limitations of
coastal web atlases. University College Cork, Ireland.
Dwyer N., O’Dea L., Cummins V., Arévalo J., Perales D., Coutel K., 2005. Data Col-
lection Experience with the Marine Irish Digital Atlas. Proceeding on “GIS Ireland Con-
ference, Dublin, October 2005.
O’Dea L., 2004. Improving access to coastal information: metadata in the Marine Irish
Digital Atlas. Paper presented at ECO-IMAGINE Opening Conference, 13-15 May
2004, Seville, Spain.
O’Dea L., Cummins V., Dwyer N., 2004. Developing an informational Web Portal for
coastal data in Ireland: data issues in the Marine Irish Digital Atlas. Oceanology Inter-
national 2004's; GIS in the Marine and Coastal Environment Conference, London.
Dwyer E., O’Dea L., Cummins V., 2004. The Marine Irish Digital Atlas: providing geo-
spatial information to a wide audience. Littoral 2004, 20-22 September 2004, Aber-
deen, Scotland, UK.
Web-site consultation:
http://mida.ucc.ie/pages/atlas/atlas.php; last visit on 08/02/2011 at 10.30
21807-REL-T002.1 page 100/337
3.18 Channel Coast Observatory Coastal Information System
1 General Information
1a Name Channel Coast Observatory Coastal Information System (CCO-CIS)
1b Description
The Channel Coastal Observatory is the data management centre for the Regional Coastal Monitoring Programme and is hosted by the New Forest District Council, in partnership with the University of Southampton and the National Oceanography Centre in Southampton.
The Channel Coast Observatory provides Web-based interfaces to browse tow on-line integrated tools: a Data Catalog and a Map Viewer. The two tools enable users to query, visualise and down-load a wide range of marine and coastal data on the UK south coast and the English Channel, including: coastal GIS data (such as Digital Terrain Models, monitoring data, or sediment distribu-tion maps), aerial photography, reports.
1c Operating entity Channel Coastal Observatory - National Oceanography Centre
1d Management struc-ture
Channel Coastal Observatory - National Oceanography Centre
1e Contacts
Channel Coastal Observatory - National Oceanography Centre University of Southampton Waterfront Campus, European Way Southampton SO14 3ZH, United Kingdom Tel: +44 (0)23 8059 8467 Fax: +44 (0)2380 596320 Email: [email protected] Web-site: http://www.channelcoast.org/
1f Typology Operational
2 Operational context and information content
2a ICZM dimensions The CIS contains very detailed data related to territory and partly environment. No data are provided for economic, social and gov-ernance dimensions.
2b ICZM Sectors
Main spatial data included in the Channel Coast Observatory CIS are: - Remotely sensed data - Aerial photography - Colour Infrared aerial photography - Topographic and bathymetry data - LIDAR data - Hydrographic data - Sediment distribution data - Cliff line
21807-REL-T002.1 page 101/337
- Waves data - Waves and tides real-time data
2c Integration No specific integration among information is directly provided
2d Spatial scale Sub-National – Coastal area in southern England along the Eng-lish Channel
2d Flexibility Channel Coast Observatory Coastal information System hasn’t been developed in order to apply to other coastal territory.
3 ICZM functionalities
3a Knowledge related functionalities
CCO CIS strongly support the operation at different spatial scale. Available spatial data can be re-scaled according to the consid-ered spatial extent, thus enabling to visualize more details at a higher scales. This is particularly evident for aerial photography and bathymetry data.
Other knowledge related functionalities include:
- Possibility to query and download a consistent sub-set of spatial information and other data typologies;
- Availability of multi-time data, such as in the case of waves and tidal historical data;
- Integrated data query; data can be queried according to both spatial and alphanumeric criteria in an integrated way.
Above functions can easily support extraction of data and their use by external users for sector analysis related to ICZM.
3b Process related functionalities
Primary goal the Channel Coast Observatory CIS is to share and make easily available marine and coastal data. In this perspec-tive, it is not directly linked to an ICZM process; it can provide in-formation and data to be used in ICZM at the regional scale, such as for example for the assessment of coastal erosion problems.
4 Users
4a User typology
The system is mainly dedicated to expert users. Information con-tained in the system is mainly scientific data and documentation that require a high level of expertise on hydrodynamic and mor-phological coastal processes.
5 Use of the system
5a Accessibility
Free access on-line to the whole system. After a free registration, all data (numeric, spatial, maps and report) can be visualised. Great part of them can also be downloaded.
The introductive web-page includes a clear explanation of the conditions of use of the data.
5b User-friendliness
High.
The system is very user friendly and the web interface includes an explanatory help file. The system is available in English.
21807-REL-T002.1 page 102/337
5c Interactiveness No specific e-participation tools are provided. Users can provide feedbacks on usability of the system.
5d Data access
The CIS provide functionalities for the free download of great part of data and reports. A 300 Mb limit is set for one downloading section.
All data (numeric and spatial) are provided with metadata infor-mation (particularly detailed) that can be visualised and down-loaded. The metadata formats comply with ISO standards.
6 Technological characteristics
6a Used technology MapServer technology (Open source)
6b Integration with other tools
No specific integration with other tools
6c Integration with other CIS
No specific integration with other CIS
6d Interoperability
High.
The use of standard protocols for data management (according to INSPIRE Directive and a freely downloadable data policy) guar-antees a high interoperability of the system. The metadata for-mats comply with ISO standards.
7 Cost/Resources
7a Resources
Information sources for the overview analysis of Channel Coast Observatory Coastal Infor-
mation System:
Green D. 2011. Chapter 13 “United Kingdom”. In Wrigth D., Dwyer E., Cummins
V.[eds.], 2011. Coastal informatics: Web Atlas Design and Implementation. Infor-
mation science reference, Hershey, New York, pp. 192-213.Web-site consultation
Web-site consultation
http://www.channelcoast.org/; last visit on 14/02/2011 at 15.50.
21807-REL-T002.1 page 103/337
3.19 Dorset Explorer - Dorset Coastal Explorer
1 General Information
1a Name Dorset Explorer - Dorset Coastal Explorer
1b Description
Dorset Explorer is a web-GIS allowing users to visualize of layers re-lated to the Dorset Region in the South of England. Spatial information is not only related to the coastal area, but more in general to the whole Dorset territory. The system is also particularly interesting since pro-vides some innovative functionalities for data query and investigation, also enabling to re-call information related to local planning. Dorset Explorer development is strictly related to the activities of the Dorset Coast Forum that has been at the forefront of Integrated Coastal Zone Management (ICZM) since 1995. The Dorset Coast Fo-rum is an established Strategic Coastal Partnership made up of over 220 public, private and voluntary member organisations. The Dorset Coast Forum covers from Lyme Regis to Christchurch out to 12 nauti-cal miles. Its primary objective is to encourage co-operation and dia-logue between all the different stakeholders of the coast in the Dorset area. C-SCOPE Interreg (Cross Border 2 Seas Programme) project, cur-rently under going, is providing funds for the further evolution of the Dorset Explorer. This description is mainly related to the version of the Dorset Explorer available through the C-SCOPE web-site (http://www.cscope.eu/en/). However, the system is under evolution and will in particular include ICZM and sustainability indicators in order to fully support scientific-based decision making. Indicators to be im-plemented will be defined accordingly to the experience acquired by the ICZM Coordination Centre in Belgium (see Kust Atlas description), partner of the C-SCOPE project. The tool should be finalised by the end of 2011. C-SCOPE will also develop a framework for integrating terrestrial and marine management planning, involving the development of a pilot Marine Spatial Plan for a selected area of the Dorset coast. This expe-rience will contribute in supporting integration between ICZM and MSP policies and tools, hopefully to be transferred in the Web-GIS compo-nent as well. Finally, C-SCOPE will provide a series of hi-tech interactive coastal information points (or Coastal explorer access points) to improve stakeholders’ engagement. A detailed description of the new system that will be developed is con-tained in Chapter 5, under the section Dorset Coastal Explorer.
1c Operating entity
Dorset Coast Forum The Dorset Coast Forum team is hosted by Dorset County Council and funded by: Weymouth and Portland Borough Council, Borough of Poole, Environment Agency, Natural England, Wessex Water, Dorset Wildlife Trust, Dorset County Council, West Dorset District Council
1d Management structure
Dorset Coast Forum
21807-REL-T002.1 page 104/337
1e Contacts
James Feaver; e-mail: [email protected]
Dorset Coast Forum Marine and Coastal GIS Officer c/o Dorset County Council County Hall, Dorchester – Dorset - DT1 1XJ United Kingdom
Web: http://www.cscope.eu/en/
1f Typology Pre-operational; a consistent part of the system is under improvement
2 Operational context and information content
2a ICZM dimensions
The Dorset Explorer mainly addresses four of the five ICZM dimension providing a lot of related information. Considered dimensions are: terri-tory (e.g. general geographic descriptors, marine natural area, land-scape, area of outstanding natural beauty, and heritage coast natural areas), society (e.g. population data census, schools location, hospital locations, etc.), economy (e.g. mineral areas, waste and landfill site, land use policies, etc.) and governance (e.g. 2002 Adopted Local Plan, specific information on local planning, etc). The environmental dimension is also considered, even if it is relatively much less ad-dressed by the Dorset Explorer
2b ICZM Sectors
Dorset Explorer includes a complex and wide series of data, main re-lated to:
- Base map (DTM and historical aerial photos);
- Dorset Digital Terrain Model (DTM);
- Aerial Photography
- Highways network;
- Traffic sensitivity;
- 2002 Adopted Local Plan, showing among the others: landscape and conservation, ancient monument, area of great landscape value (AGLV), area of outstanding natural beauty (AONB), nature conservation/reserve, parks and gardens of special historic inter-est, Sites of Nature Conservation Interest (SNCI). etc;
- Recreational activities
- Land Use Policies, including data on: car parking, community use, employment, environmental improvement, housing, main ur-ban area, schools, etc.;
- Water protection (i.e. pollution control reed bed);
- Landscape, such as: registered common land, open access land, dedicated access land, heritage coast, character areas, natural areas, marine natural areas, green belt, world heritage site;
- Administrative boundaries;
- Population census;
- Community, including: libraries, ambulance station, police es-tates, fire stations, pharmacies, etc.
- Historic environment (monuments, protected wreck sites, war graves, conservation areas etc.).
21807-REL-T002.1 page 105/337
2c Integration
No specific integration among information is directly provided at the moment.
The Dorset Coastal Explorer, is currently under development within the C-SCOPE project.
2d Spatial scale Sub national scale – Dorset region and its coastal marine zone
2d Flexibility The Dorset Explorer has been developed in order to be applied to the specific coastal territory of the Dorset region
3 ICZM functionalities
3a Knowledge related functionalities
Dorset Explorer currently provides some of the knowledge relatedfunctionalities considered by the analysis; specifically:
- Operation at the different spatial scale; some of the available spatial data can be re-scaled according to the considered spatial extent; thus enabling to visualize more details at higher scales;
- Availability multi time data: The aerial photos are available for dif-ferent periods (2002-2005-2009).
ICZM knowledge related functionalities will be significantly expanded in the new Dorset Coastal Explorer tool that will include ICZM and sus-tainability indicators to properly support scientifically-based decision making.
3b Process related functionalities
Dorset Explorer development and future implementation is strictly re-lated to the objectives and activities of the Dorset Coast Forum, whose principal aim is to encourage co-operation and dialogue within the ICZM process. Web-GIS and other web-tools can support this objec-tive.
Dorset Explorer already supports and includes some ICZM process related functionalities (partly also innovative). In particular:
- The Local Plan Policy Report tool enables to re-call (through an hyperlink function) and visualise a report with all relevant policies, documents or other information about a selected area;
- It is possible to generate short reports describing the selected features (areas) of some layers, such as: natural area, marine natural areas, monuments or other important areas. Report is ac-tivated through an hyperlink function. These information may be useful in supporting some of the ICZM related aspects (such as for example communication and awareness raising).
ICZM process related functionalities will be relevantly improved by the C-SCOPE project, in particular through:
- A framework for integrating terrestrial and marine management planning, involving the development a pilot Marine Spatial Plan for a selected area of the Dorset coast. This experience will con-tribute in supporting integration between ICZM and MSP policies and tools;
- A series of hi-tech interactive coastal information points (or Coastal explorer access points) to improve stakeholders’ en-gagement. These access point will permit to highlight features such as marinas, beaches and “Codes of Practice” for safe and sustainable use of the coast.

21807-REL-T002.1 page 106/337
4 Users
4a User typology
One of the main goal of Dorset Explorer is disseminating information and related services and makes them accessible to ensure data shar-ing. The system may be therefore useful for a wide range of users’ ty-pology, i.e. all ICZM stakeholders.
5 Use of the system
5a Accessibility Free access on-line (access allowed to all users without password) to all the information and functionalities provided by the system
5b User-friendliness
Highly user-friendly. The system is very easy to use. It also provides clear explanation of all the functionalities included in the interactive screen through specific help pages. The system is available in English.
5c Interactiveness
No specific e-participation tools are available. Dorset Explorer enables users to provide suggestions to improve the functionality of the sys-tem. This can be done through a specific feedback form. Also in this case, C-SCOPE will improve interactiveness. In particular a series of hi-tech interactive coastal information points (or Coastal explorer access points) to improve stakeholders’ engagement will be designed and realised.
5d Data access
Dorset Explorer only provides the possibility to export customised maps in pdf format. Spatial data can not be downloaded. Few information is available on the viewable maps; in particular leg-ends and metadata are not provided.
6 Technological characteristics
6a Used technology
Dorset Explorer 2.5 has been developed with MapInfo and MapXtreme technologies. A technological upgrade of the system is also under development to-wards a more flexible platform.
6b Integration with other tools
The system is integrated with the web sites providing information to generate reports on local policies and descriptive information of the selected areas, through the tools described in 3b.
6c Integration with other CIS
No specific integration with other CIS. The development of the Dorset Coastal Explorer is part of the C-SCOPE project that also foresees the further improvement of the Bel-gian Kust Atlas (involving the ICZM Coordination Centre of Belgium). However KustAtlas and Dorset Coastal Explorer are different tools, with different aims and different target users: the first one is mainly a communication tool designed as a portal site to wider audience; the second one is mainly a planning tool, designed for stakeholders and planners.
6d Interoperability
7 Cost/Resources
7a Resources One person at Dorset coast Forum managing data and 5 persons for the tool development and maintenance, including base mapping data.
21807-REL-T002.1 page 107/337
Web-site consultation:
Web-site: http://www.dorsetforyou.com last visit on 17/02/2011 at 12.30
Web-site: http://195.49.180.76/dorsetexplorer/?version=edlp last visit on 17/02/2011 at
12.30
Web-site: http://www.cscope.eu last visit on 17/02/2011 at 12.45.
21807-REL-T002.1 page 108/337
3.20 Cork Harbour Geographic Information System
1 General Information
1a Name Cork Harbour Geographic Information System
1b Description
The Cork Harbour Geographic Information System has been de-veloped within the Interreg COREPOINT (COastal REsearch and POlicy INTegration) project (2004-2008).
One of the main goals of the Corepoint project was to bridge the gap between research institutions and local authorities dealing with ICZM. The project intended to properly use scientific experi-ence and resources to provide improved information for planners responsible for local coastal areas as part of an ICZM approach. The project selected Cork Harbour as one of the site for the de-velopment of GIS tools supporting the ICZM process.
Cork Harbour initiative focused on coastal and vulnerability, habi-tat loss, tourism pressures and development options for the Brownfield area (Corepoint, 2005). Inside the COREPOINT activi-ty, the final outcome of the Cork Harbour ICZM related initiative was the development and publication of an Integrated Manage-ment Strategy for Cork Harbour in 2008. The strategy was the re-sult of a cooperative effort jointly done by local authorities and ac-ademic experts.
Cork Harbour initiative also included the development of a GISproviding support to the above ICZM processes. In particular with-in this GIS, the Coastal and Marine Resources Centre (CMRC) of the Cork University developed a GIS section (called “Coastal In-ventory”) providing a comprehensive database of shoreline fea-tures, aiming to support the monitoring, management, develop-ment and conservation of coastal, estuarine and riparian habitats. The Coastal Inventory enables to generate maps, reports and sta-tistics that can be used by planners, managers, and regulators in decisions making on the coastal area.
Cork Harbour and the related GIS were also analysed by the EU FP7 SPICOSA project (2009-2011) aiming in general to develop a self-evolving and operational research approach framework for the assessment of policy options for the sustainable management of coastal zone systems.
At the moment funding for the support and the implementation of the Integrated Management Strategy and hence the development of the GIS, are allocated through a new INTERREG project called IMCORE.
1c Operating entity
The Planning Policy Unit (PPU) of Cork County Council and the Coastal and Marine Resources Centre (CMRC) of Cork University are the IMCORE project partners. They also operate the Secretar-iat function.
One of the main functions of the Secretariat is to manage the stakeholder contact database for the Forum and maintain the
21807-REL-T002.1 page 109/337
http://www.corkharbour.ie/ website, which will be a focal point for information on relevant activities.
1d Management struc-ture
The Coastal and Marine Resources Centre of the Cork University
1e Contacts
Cathal O’ Mahony, [email protected]
Coastal Inventory Team Coastal and Marine Resources Centre University College Cork Naval Base, Haulbowline Cobh, County Cork, Ireland
web-site: http://cmrc.ucc.ie/CI/index.htm
1f Typology Operational
2 Operational context and information content
2a ICZM dimensions
The GIS mainly addresses four of the five considered information dimensions: environmental (e.g. shoreline, river), territorial (land use manmade shoreline, roads) society (e.g. residential struc-tures, marinas, water safety training, diving) and economic (in-dustrial area, tourism activities).
2b ICZM Sectors
The Coastal Harbour GIS includes the following main spatial lay-ers:
- Shoreline type (e.g. revetments, sea walls, beaches, docks, rocky shores);
- Shoreline features (e.g. jetties, piers, pontoon, steps, lad-ders);
- Shoreline vulnerability (e.g. state of repair, conditions, ero-sion);
- Land use (e.g. agriculture, industry, residential, amenity).
- Administrative boundaries;
- Population density;
- Tourism structures (marinas, diving, charter companies, sail-ings clubs).
2c Integration
Inside the Cork Harbour GIS there is a customized feature called “The Coastal Inventory”. This is a comprehensive database of shoreline features, aiming to support the monitoring, manage-ment, development and conservation of coastal, estuarine and riparian habitats.
2d Spatial scale
Local - Cork Harbour area.
Cork Harbour area is a large natural harbour on the southern coast of Ireland. It is a complex estuarine coastal system with a water body surface area of approximately 100 km2. Some parts of the area are also densely populated, indeed about 65% of County Cork’s population lives in close proximity to the coast.
21807-REL-T002.1 page 110/337
2d Flexibility
The Cork Harbour GIS was created following the line of develop-ment set out in the report "Guidelines for Implementing Local In-formation Systems at the Coast" developed within the COREPOINT project (COREPOINT: Stojanovic et al., 2007).
The Guidelines were developed on the basis of the experience on local ICZM processes of six COREPOINT partners (Essex Estuar-ies, Sefton Coast, Severn Estuary, Fal Estuary, and Cork Har-bour) and results of the engagement and participation of over 100 local stakeholders.
3 ICZM functionalities
3a Knowledge related functionalities
Cork Harbour GIS provides some of the knowledge related func-tionalities considered by the analysis, specifically: - Integrated maps (see 2c); - Availability of multi-time data: multi-time data are for exam-
ple available for the shoreline position.
3b Process related functionalities
The Cork Harbour GIS was developed in order to specifically support the local ICZM experience. Within the COREPOINT pro-ject, the ICZM experience focused on the first three (of the five) steps identified for the Cork Harbour area: (i) Issue identification and assessment, (ii) Programme preparation, (iii) Formal adopting and funding. These activities finally led to led to the publication of an Integrated Management Strategy for Cork Harbour in 2008.
The process that underpinned the development of this Strategy document involved a leadership and facilitation role by the local COREPOINT project partners, communication with stakeholders through the Cork Harbour Forum, the organisation of two stake-holder workshops, and consultation with a Strategic Advisory Group (SAG, currently named Harbour Management Focus Group).
The implementation of the ICZM Strategy (forth step of the pro-cess) is currently on-progress and involve the design and publica-tion of an ICZM Action Plan (2008-2011). The Action Plan is year-ly delivered and subsequently reviewed taking into consideration the interactive nature of ICZM and the need to ensure a flexible process to deal with emerging and changing priorities.
The Cork Harbour GIS has therefore provided data and function-alities supporting various aspects of the ICZM experience, includ-ing: problem understanding and structuring, Assessment of alter-natives in planning and management, monitoring and evaluation, adaptive planning and management. Furthermore, through the IMCORE project, specific research is undertaken to examine the use of scenarios to support the planning process for climate change and ultimately benefit local coastal communities.
4 Users
4a User typology
Users of the Cork Harbour GIS are mainly coastal planners, man-agers, and regulators (i.e. decision makers’ level).
Future activities foresee the development of web-GIS that will be made available to all potential users (see http://www.corkharbour.ie/pages/gis.htm).
21807-REL-T002.1 page 111/337
5 Use of the system
5a Accessibility At the moment, the access of the system is restricted only to off-line users.
5b User-friendliness
5c Interactiveness
No specific e-participation tools are currently available within the Cork Harbour GIS. However the GIS has been used in supporting the wide participatory approach and activities underpinning the ICZM process (i.e. Cork Harbour Forum, Harbour Management Focus Group, Cork Harbour News, thematic workshops, Working Groups, etc.).
Next steps foresee the development of a web-GIS tool that will further enhance interactiveness.
5d Data access No data and metadata are directly accessible on line at the mo-ment. The web-GIS development will enable direct access to part of the GIS information.
6 Technological characteristics
6a Used technology The GIS is developed with ESRI software technology (licensed software).
6b Integration with oth-er tools
The GIS includes the “Coastal Inventory” (developed and operat-ed by CMRC), a comprehensive database of shoreline features,aiming to support the monitoring, management, development and conservation of coastal, estuarine and riparian habitats.
6c Integration with oth-er CIS
No integration with other CIS.
6d Interoperability
7 Cost/Resources
7a Resources Initial funding to develop the system was provided by the Interreg IIIB COREPOINT project. The Interreg IVB IMCORE project has provided funding for the further implementation phase.
21807-REL-T002.1 page 112/337
Information sources for the overview analysis of the Cork Harbour Geographic Information
System:
COREPOINT, 2008., Cummins V., Griffin P., Gault J., O’Mahony C., and O’Suilleabhain
D. (Editors). Cork Harbour Integrated Management Strategy: 2008. COREPOINT:
Coastal Research and Policy Integration, EU INTERREG IIIB Project. pp.35. [Online].
Available: http://www.corkharbour.ie.
Carlisle M.A., Green D.R., and Ritchie W., 8Eds) 2008. Corepoint Expert Couples and
case studies: Description of physical, ecological, and socio-economic context and of ar-
ea-specific Corepoint activities. University of Aberdeen, pp92.
Cummins V., Gault J., O’Mahony C., Köpke K., Griffin P., Walsh E. and O’Suilleabhain
D., 2008. Establishing Information Needs for Planning and Assessment of Recreation Ac-
tivity in the Coastal Environment: A Case Study from Cork Harbour, Ireland. Proceedings
of the International Pluridisciplinary Conference - The Littoral: Challenge, Dialogue, Ac-
tion. 16th-18th January, Lille, France.
COREPOINT: Stojanovic T.A. (2007) Guidelines for Implementing Local Information Sys-
tems at the Coast. COREPOINT and Cardiff University, Cardiff. Available online at:
http://crc67.ucc.ie/corepoint/wp46.
Kopke K., 2006. Applying GIS to Coastal Management in Cork Harbour: the Corepoint
experience. Proceeding to the Thematic Conference: “THE WATERFRONT
MANAGEMENT AND GI”. Genoa (IT), 14th-18thNovember 2006.
Web-site consultation:
http://cmrc.ucc.ie/CI/index.htm; last visit on 23/02/2011 at 10.30.
http://www.corkharbour.ie/; last visit on 24/02/2011 at 15.00.
http://imcore.eu/; last visit on 04/03/2011 time 16.50.
http://corepoint.ucc.ie/; last visit on 04/03/2011 time 17.50.
http://ec.europa.eu/environment/iczm/ourcoast.htm, last visit on 23/02/2011 at 10.00.

21807-REL-T002.1 page 113/337
3.21 GEOIDD-Litto
1 General Information
1a Name GEOIDD-Litto
1b Description
GEOIDD-Litto (Geographie et indicateurs du développement dura-ble sur le littoral – geography and indicators related to coastal sus-tainable development) is a web cartographical tool that allows to access a high number of geographic and statistical information, both for land and sea, along the French coast and overseas de-partments (Guadeloupe, Martinique, Guyane, Reunion).
GEOIDD-Litto responds to one of the main objectives of the French Observatoire du Littoral, in particular related to:
- Organise and share information and data on the coastal sys-tem;
- Improve the vertical and horizontal information flow among dif-ferent administrations dealing with coastal management is-sues;
- Contribute to the discussion on the standardization of proto-cols for collecting, processing and sharing data.
The system consists of two separated main tools, with two different web-interfaces:
- A statistical data tool, related to social, economic and envi-ronmental statistic indicators. The tool also allows to map the selected data (up to two indicators can be jointly mapped) at the municipality level. The same tool enables to download se-lected data.
- A geographic data tool, enabling the visualisation of various land and marine spatial information.
GEOIDD-Litto allows users to print maps, to extract statistical data, to build images in different formats (jpeg, png, pdf), to build “portrait of territories” (summary reports with tables and charts), to map own statistical data and to map geographical data from other tools (trough web-service protocol like WMS - Web Map Service).
1c Operating entity
The operating entity is the Observatoire du Littoral (French coastal observatory)
The Observatoire du Littoral includes, as part of an agreement: the Ministry of Ecology, Sustainable Development, Transportations and Housing; the Inter-ministerial Delegation for Territorial Planning; and the General Secretariat of the Sea.
1d Management structure
Observatoire du Littoral
1e Contacts Sébastien Colas; e-mail: [email protected]
Observatoire du littoral
21807-REL-T002.1 page 114/337
Ministère de l’Ecologie, du Développement durable, des Transports et du Logement
Web site of GEOIDD Litto: http://www.littoral.ifen.fr/Cartographie.6.0.html
1f Typology Operational
2 Operational context and information content
2a ICZM dimensions
The CIS addresses all the ICZM dimensions considered by the analysis: territory (e.g. for general geographic descriptors, land and sea uses, marine protected areas), environment (specifically related to nature and biodiversity), economy (e.g. employment, tourism, use of the sea), society (e.g. housing), governance (e.g. urban planning in coastal areas).
2b ICZM Sectors
Information content is structured in the following thematic issues, for each of them the availability of geographical data and/or statisti-cal data interface is indicated:
- land use - geographical and statistical data tool; - water - geographical and statistical data tool; - nature and biodiversity - geographical and statistical data tool; - administrative boundaries - geographical data tool; - transports routes - geographical data tool; - zoning and uses of the sea - geographical data tool; - coastal morphology - geographical data tool; - natural risks – statistical data tool; - agriculture – statistical data tool; - tourism – statistical data tool; - population housing – statistical data tool; - employing – statistical data tool; - urban planning – statistical data tool.
2c Integration The statistical data tool enables to generate maps combining the visualisation of two indicators, thus providing partially integrated in-formation.
2d Spatial scale
National scale – France and overseas departments.
The system can operate at different scales: from the national to the local one.
2d Flexibility GEOIDD-Litto has been specifically developed for the French coastal area
3 ICZM functionalities
3a Knowledge related functionalities
Several knowledge functionalities, supporting ICZM process are available:
- Integration among different information sectors (see point 2c); this is provide by the statistical data tool, although limited to the combined visualisation of two indicators;
- The CIS allows interactive mapping, but proper GIS data are not downloadable;
21807-REL-T002.1 page 115/337
- Operation at the different spatial scale; some of the available spatial data can be re-scaled according to the considered spa-tial extent; thus enabling to visualize more details at a higher scales. This functionality is supported by the geographical da-ta tool;
- For some layers, mainly for socio-economic and territorial da-ta, multi-time information is available (e.g. land use, unem-ployment rate);
- The CIS include some ICZM indicators, such as for example area of built up land, protected areas, land take by intensive agriculture, sectoral employment. A specific tools is provided to deal with indicators related functionalities (statistical data tool).
3b Process related functionalities
GEOIDD-Litto provides a high variety of data related to different ICZM sectors and dimensions and therefore can properly support the problem understanding process. Information is provided by the two tools in different formats maps and/or indicators.
The statistical data tool is particularly relevant to support problem understanding and decision making in general. Indeed, it allows not only to map and download data and metadata related to selected statistics, but also to generate customized “portraits” on a specific spatial selection. “Portraits” are short report including summary ta-bles and charts.
4 Users
4a User typology
Taking in to account the Observatoire mission and the information content of the CIS, the target users can be mainly identified as:
- Decision makers, in particular since summary information are provided by the system (e.g. indicators and statistics);
- Coastal planners and/or managers, for the information related to territory (use of land and sea) and coastal plans;
- Civil society, interested in being informed on and/or participat-ing in ICZM: the geo-information typology provided by the sys-tem are easily understandable from non expert users
5 Use of the system
5a Accessibility Free access on-line without password to the complete CIS
5b User-friendliness
Highly user-friendly
Intuitive operation of the system, for both available tools (geograph-ical data tool and statistical data tool). Animated tutorial are availa-ble to help the user. The system in available only in French.
5c Interactiveness No specific e-participation tools appear to be available. However, the system is totally accessible on-line.
5d Data access
Data can be downloaded from the statistical data tool, in excel for-mat. Spatial data (GIS layer) can not be downloaded from the geo-graphic data tool.
21807-REL-T002.1 page 116/337
Maps can be displayed and printed and the project can be saved in a specific url.
Finally, GEOIDD-Litto allows the easy access to detailed and clear metadata (metadata sheets) for all the available layers.
6 Technological characteristics
6a Used technology Flash technology; database working with PHP and MySQL tech-nologies
6b Integration with other tools
No specific integration between the GEOIDD-Litto system and oth-er tools.
The website of the Observatoire du littoral enables to access a specific thematic section containing structured information (graphs, factsheets, excel data) on several statistical indicators useful for the sustainable development of the coast.
The system collects most of the statistical and geographical data available in France. Integration with other tools is provided in the “useful links” page, where several links area available, including:
- Geolittoral, an additional tool managed by the CETE Norman-dy Centre Directorate General of Planning, Housing and Na-ture that provides large scale data including free coastal or-thoimagery;
- Bosco webpage, observation base for coastal monitoring im-plemented jointly by the BRGM (French geological survey) and CETMEF (Maritime and River Technical Studies Centre), containing shoreline metadata from different sources.
- Territorial observatory, governmental web site providing inter-active mapping and download of hundreds of environmental, social and economic data.
Observatory of the Aquitaine coast, decision support tool for the management and development of the Aquitaine coast.
6c Integration with other CIS
In the case of GEOIDD-Litto this issue is strictly connected with and therefore addressed in point 6b.
6d Interoperability
High
The system has been developed following the INSPIRE and MOTIIVE standards, guaranteeing high interoperability. The geo-graphical data tool provides full interoperability with other data pro-viders’ spatial information through OGC - WMS application.
7 Cost/Resources
7a Resources About € 45.000 for the first version of GEOIDD-Litto. (2006). Addi-tional cost of about € 50 000 for the tool currently online (2009).
Web-site consultation:
http://www.littoral.ifen.fr/Cartographie.6.0.html.; last visit on 03/24/2011 at 12.30.
21807-REL-T002.1 page 117/337
3.22 GÉOBretagne
1 General Information
1a Name GÉOBretagne
1b Description
GÉOBretagne is an Internet platform (Spatial Data Infrastructure – SDI) for the exchange and consultation of geographical information, born from the desire of sharing and publishing geographical infor-mation useful for the knowledge and the development of the territo-ry of Bretagne. The GÉOBretagne web-site includes a Web-GIS with spatial data referring to the whole Bretagne Region, also in-cluding its coast. In particular the Web-GIS, among many others, contains data specifically related to the Breton littorals.
GÉOBretagne has been developed within a project part of the Con-tract-Project State-Region (CPER) 2007-2013 in Bretagne, signed in April 12, 2007, aiming at strengthening the competitiveness of Bretagne region by improving data accessibility. GÉOBretagne also aims to disseminate information for the public in compliance with the INSPIRE Directive. GÉOBretagne initiative involves a wide partnership of public bodies that are interested in sharing and ex-changing data, and wish to undertake a process of sharing and pooling of data and transparency to the citizen. Partnership in-cludes: state departments, local authorities, public institutions, planning agencies, etc.
GÉOBretagne organisation is articulated in the following main structures:
- A steering committee coordinated by the Bretagne Region and Prefecture of the Bretagne Region;
- A technical committee led by the secretariat GÉOBretagne;
- Thematic groups: repositories of base data (cadastral data, road and addressing, aerial orthophotos and digital elevation model);
- Cataloguing
- Energy
- Littoral
- Hiking and nature activities,
- Telecoms
- Urbanism.
The GÉOBretagne web interface provides two main tools to ac-cess, view and use the geographical information:
- A map viewer (Web-GIS), to display data and customise own maps, also through Web Map Service (WMS). Pre-defined maps can also be directly visualised by the users through the Cartographie function.
21807-REL-T002.1 page 118/337
- A data catalogue, to search and download data and metadata on the Bretagne Region. The catalogue is used to share and make available spatial data and metadata related to the Bre-tagne Region. Search can be done through key words and/or a map viewer enabling to select an area of interest. For the selected information: (i)Metadata are showed thought an ex-tended and detailed metadata sheet (ii) data can be down-loaded (for some of them), (iii) spatial data can be visualised through the map viewer or Google.
GÉOBretagne also provides a functionality to search for documents
1c Operating entity GÉOBretagne secretary – Operation and management involves all the various committees (with different roles) of the GÉOBretagne initiative
1d Management structure
GÉOBretagne secretary – Operation and management involves all the various committees (with different roles) of the GÉOBretagne initiative
1e Contacts E-mail contacts; [email protected]; [email protected] GÉOBretagne web-site: http://www.geobretagne.fr/
1f Typology Operational
2 Operational context and information content
2a ICZM dimensions
The more developed ICZM dimensions are those related to territory (e.g. land use and natural parks/protected areas) and the socio-economic (e.g. transports, school, economic activities) issues. The other two dimensions – i.e. governance (e.g. natural park planning). and environment (e.g. bathing water quality) – are partly covered.
2b ICZM Sectors
Spatial data accessible through the map viewer can be selected and visualise by the Geo-catalogue tool. This in particular enables to organise spatial data according to different structures, including the one related to the INSPIRE Directive. According to the default structure data are organised in the following themes:
- Economic activities - Agriculture - Water - School - Cadastral data - Housing - Transport - Administrative boundaries - Littoral - Architectonic, cultural and urban heritage - Natural Park planning - Natural , technological and sanitary risks - Urbanism - Digital economy - Energy - Public facilities
21807-REL-T002.1 page 119/337
All theme are split in specific layers; the Littoral thematic includes a high number of spatial data concerning coastal issues(e.g. marine parks, natural reserves, landing points, hotels/camping, coastal land use, access to the sea). Other data can be visualised on the map viewer through the OGC service enabling to select one of the pre-define WMS connection (e.g. BRGM – geology or BRGM – risk) or specifying an url ad-dress.
2c Integration Examples of integrated information are maps related to the as-sessment of the natural and technological risks for the addressed territory.
2d Spatial scale Sub-National scale - Bretagne (France)
2d Flexibility The system has been developed in order to be applied specifically to the Bretagne territory.
3 ICZM functionalities
3a Knowledge related functionalities
GÉOBretagne provides some of the knowledge related functionali-ties considered by the analysis; specifically:
- Integration among different information sectors (see point 2c), including some integrated maps related to natural and tech-nological risks;
- Availability of spatial data; GÉOBretagne actually aims to support data sharing and dissemination to public users. Data (including geographical ones) and metadata are shared through the Catalogue functionality;
- Support experiences and best practices exchange in relation to data management and geographic information in general
3b Process related functionalities
GÉOBretagne provides a high variety of data related to different information sectors and dimensions and therefore can properly support problem understanding. Spatial data are organised ac-cording to an articulated structure (various possible structures are proposed) that can support user in the elaboration of conceptual models of the territory.
4 Users
4a User typology
Data exchange with public stakeholders of the region is one of the main objective of GÉOBretagne. Public stakeholders are therefore the main target user typology for GÉOBretagne.
Coastal professionals and experts can be more interest in the use of the Catalogue tool that makes available spatial data and metadata.
Civil society is also a target user, since one of the specific GÉOBretagne aim is to diffuse information and data to citizens.
5 Use of the system
5a Accessibility Free access on-line to great part of the system. GÉOBretagne part-ners have the possibility to access further information and function-alities through login and password.
21807-REL-T002.1 page 120/337
5b User-friendliness
Highly/Medium user-friendly
Use of the map viewer is easy and intuitive. Use of the catalogue requires more expertise and is less simply, mainly addressing expert users. Help user guides are also available. The web site and the documentation resource are in French language only.
5c Interactiveness No specific e-participation tools are provided by GÉOBretagne
5d Data access
A great part of spatial data can be downloaded through the Cata-logue functionality that also provides a detailed description of metadata. Public bodies of the Britain Region that are members of the GÉOBretagne partnership have access to wider information and can download all spatial data.
Map viewer does not enable the user to directly download data. Maps can be however printed from this interface. Map viewer pro-vides detailed metadata for all available spatial layers.
Users can also customise maps provided importing spatial data through Web Map Service (WMS). WMS service also provides the possibility to visualise and use data share by GÉOBretagne from a client application, for example using the freely available GAIA soft-ware.
6 Technological characteristics
6a Used technology
GÉOBretagne map viewer was developed using the GeOrchestra open source software.
The Geoportal is based on the Open Source application “GeoNet-work” and is strictly related to standards and requirements of the INSPIRE Directive.
6b Integration with other tools
The Map-viewer and the catalogue are directly interrelated. Spatial layers included in the catalogue can be for example selected and viewed through the map-viewer.
6c Integration with other CIS
The map viewer (Web-GIS) enables to display data and customise own maps through Web Map Service (WMS), thus establishing a dynamic connection to any geographic dataset accessible through WMS.
6d Interoperability
High.
GÉOBretagne is equipped to meet the regulatory requirements of the INSPIRE Directive:
- It is compliant with metadata standards ISO 19115 and ISO 19139;
- it uses a server architecture OGC WMS, thus properly support-ing data exchange and interoperability;
- Spatial data are organised according to INSPIRE structure.
7 Costs/Resources
7a Resources GÉOBretagne project received a total funding of 3 M € for 2007-
2013

21807-REL-T002.1 page 121/337
Information sources for the overview analysis of GÉOBretagne:
Direction régionale de l’Equipement Bretagne, 2009. Le SIG littoral en Bretagne. Volet
littoral de la plateforme GéoBretagne®.
Web-site consultation
http://www.geobretagne.fr/ Last visit on 12/04/2011 at 12.25.
21807-REL-T002.1 page 122/337
3.23 Aquitaine Coast Observatory Coastal Information System
1 General Information
1a Name Observatoire de la Côte Aquitaine Coastal Information System (OCA-CIS) – (Aquitaine Coast Observatory Coastal Information System)
1b Description
The Aquitaine Coast Observatory is a regional partnership whose main aim is to provide coastal stakeholders with information, exper-tise and tools supporting decision making and management, within the ICZM context. The partnership, initiated in 2000, involve: the European Union; the French State; the Aquitaine Region; the De-partmental Councils of the Gironde, Landes and Pyrénées-Atlantiques; the Inter-communal Syndicate of the Arcachon Basin, the Geological and Mining Research Bureau, and the National For-estry Office. The Aquitaine Coast Observatory is the first European experiment to manage coastal erosion on a regional scale.
The OCA-CIS is one of the main initiatives implemented by the Ob-servatory; this GIS-based tool archive, standardize and disseminate data and metadata related to integrate coastal zone management. The CIS also includes a Web-GIS component, making available a sub-set of the whole CIS data.
The main actors of the Aquitaine Coast Observatory, the Aquitaine Region has developed other ICZM related tools, such as:
- A tool for regional governance and general coastal manage-ment; the Aquitaine Coast Public Interest Group, which in-volves all of Aquitaine's coastal management industry andaims to establish a sustainable development plan for 2007-2020;
- A pluri-disciplinary network of knowledge; the Réseau de Re-cherche Littoral Aquitaine (RRLA), (Aquitaine Coastline Re-search Network), associating multiple scientific organizations working in the coastal management sector.
The Aquitaine Region is also involved in ICZM related projects, such as the Atlantic Region’s Coastal Pollution Control (ARCOPOL – aiming to create a Regional network to combat pollution from coastal navigation) and the Atlantic Network for Coastal Risk Man-agement (ANCORIM – aiming to create an operational network uniting European experts in coastal risk management).
1c Operating entity Aquitaine Coast Observatory (Observatoire de la Côte Aquitaine)
1d Management structure
Aquitaine Coast Observatory (Observatoire de la Côte Aquitaine)
1e Contacts
Bérengère Papion; e-mail : [email protected]
Web-site of the Aquitaine Coast Observatory: http://littoral.aquitaine.fr/
21807-REL-T002.1 page 123/337
1f Typology Operational
2 Operational context and information content
2a ICZM dimensions OCA-CIS address three ICZM dimension: territory, environment (e.g. flora, fauna and environmental quality) and society (e.g. popu-lation).
2b ICZM Sectors
OCA-CIS data are related to the following major topics:
- Coastline, aerial photos and satellite images;
- Coastal hazards,
- Costal facilities,
- Fauna and flora;
- Geodesy, geology, geomorphology, hydrogeology;
- Monitoring instrumentation;
- Oceanography;
- Environmental quality;
- Protected areas;
- Beach nourishment interventions;
- Corine land cover;
- Population density.
Only some of the data included in the OCA-CIS are made availa-ble by the Web-GIS.
2c Integration
The OCA-CIS provide some examples of integrated analysis, in-cluding information on: coastal hazards and vulnerability of the coast to the erosion. These information are currently not available through the Web-GIS component.
2d Spatial scale
Sub-National scale – Coast of the Aquitaine Region.
The Atlantic shoreline of Aquitania Region stretches over more than 270 kilometres from the mouth of the Gironde Estuary to that of La Bidassoa in the south.
2d Flexibility Specifically focusing on the Aquitaine Region coastal area.
3 ICZM functionalities
3a Knowledge relat-ed functionalities
OCA-CIS provides some of the knowledge related functionalities considered by the analysis, specifically:
- Integration among different information, such in the case of coastal hazards and vulnerability of the coast to the erosion;
- Operation at the different spatial scale; some of the spatial da-ta available in the Web-GIS can be re-scaled according to the considered spatial extent; thus enabling to visualize more de-tails at a higher scales;
- Availability of multi-time data; for example coastline layers are available for about 8 years (1938-2009), thus enabling to as-sess coastline evolution in time.
21807-REL-T002.1 page 124/337
3b Process related functionalities
The system does not specifically include ICZM process related functionalities; however it aims to support the Aquitaine Coast Ob-servatory activity in providing coastal stakeholders with information, expertise and tools for decision making and management, within the ICZM context.
4 Users
4a User typology
Potential users mainly those addressed by the Aquitaine Coast Ob-servatory, i.e.:
- Decision makers, in particular at the regional level;
- Coastal planners and managers, both at the regional and local level.
5 Use of the system
5a Accessibility The access to the entire OCA-CIS is restricted to Aquitaine Coast Observatory members and allowed users. Part of the information isfreely accessible through the Web-GIS component.
5b User-friendliness
High (for the Web-GIS component)
Access to thematic maps is rather intuitive; user guide and other information are available (in France). The system is available in French.
5c Interactiveness
OCA-CIS includes a Web-GIS component; however not specific e-participation tools are provided.
The Aquitaine Coast Observatory distributes a newsletter generally dealing with its on activities; this is currently drafted by the Ocean Association in Bordeaux (http://www.ocean.asso.fr).
5d Data access
The web-GIS does not allow downloading data and metadata. The Web-GIS provides a function to export (In pdf format) and print cus-tomized maps.
No metadata are provided by the Web-GIS. Metadata are fully de-veloped for the off-line version.
6 Technological characteristics
6a Used technology OCA-CIS is developed with the ESRI-ArcGIS software (licensed software), Data are stored as relational database, to easily extract the desired information.
6b Integration with other tools
No specific integration with other tools
6c Integration with other CIS
No specific integration with other CIS
6d Interoperability
High.
The catalogue tool of metadata used by the Observatory for the OCA-CIS is GeoNetwork (http://adullact.net/projects/geocatalogue/).
21807-REL-T002.1 page 125/337
This free software has been developed by the Bureau de Re-cherches Géologiques et Minières (BRGM – Office of Geological and Mining Research) and is based on the ISO 19115 international standard relating to spatial data, and the ISO 19139 standard on XML metadata, in agreement with the European INSPIRE directive. It allows search capabilities, visualization, capture, print, import and export of metadata in XML format.
Metadata are not available for the Web-GIS component.
7 Cost/Resources
7a Resources The Aquitaine Coast Observatory is co-financed by the European Union.
Information sources for the overview analysis of Aquitaine Coast Observatory Coastal Infor-
mation System:
- Florence BOUTEAU, 2009. Data and Indicators in relation with coastal zones in Aqui-
taine. Presentation shown at “A day for cartographic system to manage coastal zone:
Coastal and maritime data: a common heritage, a capital to be shared, a challenge for
innovation in Europe”, Bruxells, 10/12/2009.
Web-site consultation:
- http://littoral.aquitaine.fr/spip.php?page=cartographie; last visit on 18/02/2011 at
11.00.
- http://littoral.aquitaine.fr/; last visit on 18/02/2011 at 12.00.
http://www.crpm.org/index.php?act=6,1,2,167; last visit on 18/2/2011 at 11.00.

21807-REL-T002.1 page 126/337
3.24 RIA FORMOSA Coastal Information System
1 General Information
1a Name RIA FORMOSA Coastal Information System
1b Description
The Ria Formosa CIS was developed within the Ditty Project (2003-2005) - Development of an Information Technology Tool for the Management of European Southern Lagoons under the influence of river basin runoff (funded by the Fifth Framework Program, Energy, Environment and Sustainable Development). The general objective of the Ditty Project was the development of information technology tools integrating databases, geographical information systems (GIS), mathematical models and DSS (Decision Support Systems) to sup-port the management of southern European coastal lagoons and ad-jacent watersheds, within the spirit of the Water Framework Di-rective.
Ria Formosa coastal lagoon area was included as one of the test site of the project. Specific aim of the Rio Formosa case study was the implementation of a CIS able to integrate environmental and socio-economic information about the Ria Formosa lagoon and the area covering the river network draining into the lagoon. The CIS is sup-posed to be a two-way interface between spatial information and var-ious mathematical models of the watershed and Ria Formosa.
The developed tools aimed to support the sustainable development of the considered area and management of its natural resources. In-deed, there are many conflicting interests over the management of this important coastal lagoon area, including: fishing, tourism, aqua-culture, salt production, harbour activities, urban development and environmental conservation (i.e. the area include the Ria Formosa Natural Park). Furthermore, several institutions, such as the Natural Park Authority, Municipalities, the Portuguese Navy, just to mention a few, are involved in decision-making over several sectors relevant for the area.
1c Operating entity
The system was developed by the Fernando Pessoa University and the National Research Institute for Fisheries and Sea Research (IPIMAR).
Currently, the GIS component of the system is operated by the Ria Formosa Natural Park (RFNP) that has been identified as the final end-user of the system. The GIS tool is also used by the Fernando Pessoa University for its research activities on the Ria Formosa area.
1d Management structure
Ria Formosa Natural Park (RFNP) and Fernando Pessoa University
1d Contacts Pedro Duarte, e-mail: [email protected]
University Fernando Pessoa
1e Typology Operational
21807-REL-T002.1 page 127/337
2 Operational context and information content
2a ICZM dimensions In the CIS all the five ICZM dimensions are addressed: territory, envi-ronment, economy, society and governance.
2b ICZM Sectors
The main information topics included in the CIS are summarised as follow:
- Physical environment: elevation and bathymetry, oceanogra-phy, physical geology, landscape, land-use, hydrogeology, hy-drography, geology, types and use of soils, forest fires;
- Coastal management: Natura 2000 network, ecologic national reserve, administrative boundary, protected areas, manage-ment of the territory, vulnerable zones dune re-qualification;
- Biological features: bird census, flora and fauna;
- Socio-economical activities: demography, farming occupation, cultural values, building and accommodation, agriculture, cycle ways, clam farms, fish farm, harbour and nautical activities, rec-reational activities, salt extraction, waste treatment plants;
- Planning: municipal plans, POOC - Plan of the management of the seashore
2c Integration
The Ria Formosa CIS appears to include a wide variety of infor-mation, including some examples of integration among different data typologies, such information related to vulnerable zones and coastal risks.
2d Spatial scale
Local – Ria Formosa Lagoon and river network draining into the Ria Formosa Lagoon.
Ria Formosa is a shallow meso-tidal lagoon located in the south of Portugal in the Algarve Coast. The lagoon has several channels and a large intertidal area, which corresponds roughly to 50% of the total area (about 105 km2), mostly covered by sand, muddy sand-flats and salt marshes. Indeed the lagoon system is over-nourished by the sea and river sediments.
2e Flexibility
The methodological approach used to implement the Ria Formosa CIS was also used in the case of other two case studies of the Ditty project; the Thau Lagoon (France) and the Gera Gulf area (Greece). Ria Formosa CIS can be therefore considered as party flexible and exportable to other similar areas, with the necessary customisation.
3 ICZM functionalities
3a Knowledge related functionalities
Little information is available to properly describe this specific field.
Ria Formosa CIS is specifically developed to support the integrated assessment of different information typologies related to all the five considered dimensions. The tool also provides some example of in-tegrated layers, such as those related to coastal vulnerability and risk.
3b Process related functionalities
The CIS provides high variety of data related to many typologies and therefore may properly support the problem understanding and struc-turing phases.
21807-REL-T002.1 page 128/337
The CIS is made of a GIS component and a two integrated mathe-matical models. The soil and water assessment tool enables to simu-late land drainage to the coastal ecosystem, providing forcing condi-tions to the second model, EcoDynamo that simulates hydrodynamic and biogeochemical processes. Furthermore, within the Ditty project the models were coupled with a Decision Support System (DSS); the whole set of tools was therefore used to assess various management options of the Ria Formosa area. In particular, the considered sce-narios included various dredging operations and changes in bivalve cultivation practices. A key aspect of the approach was the proper inclusion of the economic aspects of the various options, including for example the economic revenue of shellfish estimated yield. Rio Formosa CIS therefore provides functionalities related to: scenario development and assessment of alternatives, considering both envi-ronmental and economic aspects.
The CIS seems to not include specific functionalities related to stakeholder involvement and participation. However, its development and implementation foresaw the early involvement of the end-user (RNFP) and the organisation of special information events (e.g. in-ternational workshops).
4 Users
4a User typology
The system is specifically designed to support the scientifically-based management of the Ria Formosa area, also including ad-vanced modelling tools. Indeed, main users are expert users, coastal planners and coastal managers. In particular the final "end-user" of the CIS is the Ria Formosa Natural Park Authority.
5 Use of the system
5a Accessibility Off-line access.
5b User-friendliness
5c Interactiveness No specific e-participation tools appear to be available.
5d Data access No data and metadata are directly accessible on line at the moment.
6 Technological characteristics
6a Used technology The GIS is developed with ESRI (ArcGis 8.3) technology (licensed software).
6b Integration with other tools
Besides the GIS component, the CIS also includes two integrated mathematical models. The soil and water assessment tool enables to simulate land drainage to the coastal ecosystem, providing forcing conditions to the second model, EcoDynamo that simulates hydrody-namic and biogeochemical processes. Furthermore, within the Ditty project the models were coupled with a Decision Support System (DSS), in particularly used for scenario building and assessment of management alternatives.
6c Integration with other CIS
No integration with other CIS
21807-REL-T002.1 page 129/337
6d Interoperability
7 Cost/Resources
7a Resources
The budget allocated to the Portuguese partners involved in the Ditty project was about € 247,000. There were approximately 10 re-searchers working in the development of the tools over a period of three years. No specific data are available for operation coasts.
Information sources for the overview analysis of Ria Formosa CIS:
Duarte P., Azevedo B. and Pereira A., 2005. Hydrodynamic Modelling of Ria Formosa
(South of Portugal) with EcoDynamo. DITTY PROJECT (Development of an information
technology tool for management of Southern European lagoons under the influence of
river-basin runoff - EESD: EVK3-CT-2002-00084).
Duarte P., Azevedo B., Ribeiro C., Pereira A., Falcão M., Serpa D., Bandeira R and Reia
J., 2006. Scenario Analysis in Ria Formosa with EcoDynamo. DITTY PROJECT (Devel-
opment of an information technology tool for the management of Southern European la-
goons under the influence of river-basin runoff - EESD Project EVK3-CT-2002-00084).
Duarte P., Azevedo B., Ribeiro C., Pereira A., Falcão M., Serpa D., Bandeira R and Reia
J., 2006. Hydrodynamic Modelling of Ria Formosa (South Coast of Portugal) with EcoDy-
namo. Document developed within the “Ditty Project”. (EESD Project EVK3-CT-2002-
00084).
Falcão M., Fonseca L., Serpa D., Matias D., Joaquim S., Duarte P., Pereira A., Martins C.
and Guerreiro M.J., 2003. Development of an Information Technology Tool for the Man-
agement of European Southern Lagoons under the influence of river-basin runoff. EVK3-
CT-20022-00084 (DITTY Project). Deliverable D3: Synthesis Report (September 2003)
Ria Formosa.
Pereira A. and Duarte P., 2002. Development of an information technology tool for the
management of the Southern European Lagoons under the influence of the river basin
runoff. DSS application. CEMAS – Centre for modelling and Analysis of Environmental
System. University Fernando Pessoa, Porto, Portugal.
Roudriges A., Carvalho A., Reia J., Azevedo B., Martins C., Duarte P.,Serpa D. and
Falcão M., 2005. A Geographical Information System for Ria Formosa. Downloadable at:
https://bdigital.ufp.pt/dspace/bitstream/10284/828/3/riaformosa.pdf
Web-site consultation:
http://ec.europa.eu/ourcoast/index.cfm?menuID=9&articleID=125; last visit on 18/02/2011
at 14.00.
http://cemas.ufp.pt/; last visit on 14/03/2011 at 9.00.
http://www.algarve-portal.com/en/country/landscapes/ria_formosa/; last visit on
14/03/2011 at 10.00.
http://www2.ufp.pt/~pduarte/; last visit on 14/03/2011 at 11.00.
21807-REL-T002.1 page 130/337
3.25 MEGASIG – Monitoring and Environmental management of the Guardiana Estuary Salt Marshes
1 General Information
1a Name MEGASIG – Monitoring and Environmental management of the Guardiana Estuary Salt Marshes
1b Description
MEGASIG is an European INTERREG IIIA project that was de-veloped under the framework of the cross-border cooperation between the Centre of Marine and Environmental Research (CIMA) of the University of Algarve-Portugal (proponent institu-tion), the Department of Geology of the University of Huelva- Spain and the Institute of Natural Resources and Agrobiology of Seville-Spain.
Guardiana River is one of the most important rivers in the Iberi-an peninsula, with a total length of 730 km; 200 km are the natu-ral southern border between Spain and Portugal. The Guadiana estuary area is managed by 5 municipalities (2 Portuguese and 3 Spanish ones) and two Authorities (one Spanish and one Por-tuguese) dealing with the management of two natural protected areas. Part of the estuary zone – not included in the protected areas - supports economic activities such as salt production, aquaculture, fishing, and tourism. The area is also very im-portant for its ecological value. MEGASIG project enabled to develop a GIS and a web-GIS application for the environmental monitoring and sustainable management of the Guardiana es-tuary. The project gave also much importance to improve public awareness to the area’s value.
1c Operating entity Centre of Marine and Environment Research of the University of Algarve
1d Management structureCentre of Marine and Environment Research of the University of Algarve
1e Contacts
Carlos Loureiro; e-mail: [email protected]
Centre of Marine and Environment Research of the University of Algarve Campus de Gambelas, 8005-139 Faro
1f Typology
Operational
The system is not on-line anymore at the original site www.megasig.org
2 Operational context and information content
2a ICZM dimensions Environmental and the territorial information are well-developed in the CIS. The territory is also exhaustively explored with a
21807-REL-T002.1 page 131/337
large collection of historical maps, surveys and satellite imagery photographs. Very few information are available for the other dimensions, such as those related to communication networks.
2b ICZM Sectors
Main spatial data included in MEGASIG are:
- Geographical and administrative boundaries
- Topography and bathymetry
- Geology and geomorphology
- Present and palaeo digital terrain model
- Coastline evolution
- Historical mapping
- Aerial photography and Satellite imagery
- Land use
- Agriculture and forestry
- Climate parameters
- Bio-monitoring
- Water chemical quality
- Sediment quality
- Sampling sites
- Vegetation and habitat mapping
- Nature 2000 sites
- Communication networks
2c Integration No specific integration among information is directly provided.
2d Spatial scale Local – Estuary of the Guadiana River
2d Flexibility The system has been developed in order to be applied specifi-cally to Guadiana Estuary.
3 ICZM functionalities
3a Knowledge related functionalities
No specific ICZM knowledge related functionalities are directly provided. However, the CIS includes a rich set of environmental and physical information that may properly support integrated analysis for the management of the estuary, in particular in rela-tion to geomorphologic aspects.
Furthermore, many information sectors include multi-time data. Time series are for example available for historical maps, coast-line evolution, aerial photography and satellite imagery, thus enabling comparative analysis and interpretation of historical geomorphologic and biological phenomena.
3b Process related func-tionalities
MEGASIG supports problem understanding, in particular rela-tion to the geomorphologic and biological evolution of the
21807-REL-T002.1 page 132/337
Guardiana rivers estuary.
Among the considered ICZM process related functionalities, MEGASIG gave importance to tools for on-line participation. Multimedia informative and didactical application for environ-mental education were designed and developed. These pre-sented three qualitative levels of information according to the knowledge level of the potential user. Tools were mainly cus-tomized for schools and NGO’s and were available in three lan-guages (Spanish, Portuguese and English). As for the CIS, those tools appear to not be on-line anymore.
4 Users
4a User typology
MEGASIG project identified the following target user of the CIS:
- Local municipalities
- Administrative Authorities of two natural protected areas
- Regional authorities
- Environmental NGO’S
- School and civil society.
5 Use of the system
5a Accessibility
MEGASIG included an important Web-GIS component and oth-er on-line education and communication tools. However, these are not on-line anymore at the original web-site www.megasig.org
5b User-friendliness The system is not on-line anymore, thus user-friendliness can not be evaluated. The system is available in Portuguese, Span-ish and English.
5c Interactiveness
5d Data access
6 Technological characteristics
6a Used technology The GIS application was developed with the ESRI ArcGIS (li-censed) software. Web-GIS component was developed using the ESRI ArcIMS software
6b Integration with other tools
The original design of the CIS foresaw the integration of the off-line GIS with a Web-GIS component and multimedia informative and didactical application
6c Integration with other CIS No specific integration with other CIS
6d Interoperability High.
21807-REL-T002.1 page 133/337
The system was developed respecting EU INSPIRE initiative guidelines for a spatial information infrastructure (see document downloadable at www.gisig.it/eco-imagine/esri_questionari/04-Nice/Carlos_esri.pdf)
7 Cost/Resources
7a Resources
Information sources for the overview analysis of MEGASIG:
Loureiro, C.; Albardeiro, L.; Boski, T. (2006). Planning for sea-level rise in coastal envi-
ronments – uncertainties of the physical responses of estuarine areas to climate
change. ECO-IMAGINE Thematic Conference "Challenges of building coastal
knowledge and geographic information". Marie Curie Conferences and Training Cours-
es. GISIG & ICCOPS. University College of Cork. 68-71.
Web-site consultation
http://www.gisig.it/eco-imagine/abstract/Borsisti/Posters_Nice/Loureiro.htm; last visit on
08/02/2011 at 16.00.
http://www.gisig.it/eco-imagine/; last visit on 08/02/2011 at 16.00.
www.gisig.it/eco-imagine/esri_questionari/04-Nice/Carlos_esri.pdf; last visit on
08/02/2011 at 17.00.

21807-REL-T002.1 page 134/337
3.26 REDIAM - Environmental Information Network of Andalu-sia
1 General Information
1a Name Environmental Information Network of Andalusia (Red de Infor-mación Ambiental de Andalucía - REDIAM)
1b Description
REDIAM is a web-oriented system designed for the integration of the information on the Andalusia environment generated by all types of producers of environmental information centres in the Au-tonomous Community. The system is composed by integrated dif-ferent subsystems. These major subsystems refer to topics whose importance and interest deserve special attention:
- Biodiversity
- Geodiversity
- Climate
- Waters
- Wetlands
- Urban environment
- Coastal and marine environment
REDIAM is explicitly designed for information, communication and participation purposes, and is also used as tool for ICZM (in par-ticular the subsystem on coastal and marine environment) by the technicians and decision-makers of the Andalucía Government.
1c Operating entity Andalusian Autonomous Government (Junta de Andalucía), Minis-try of the Environment of Andalusia (Consejeria de Medio Ambi-ente - CMA)
1d Management structure
Ministry of the Environment of Andalusia (Consejeria de Medio Ambiente - CMA). Technical management is commissioned to Egmasa, in-house company of CMA.
1e Contacts
Address for information requests
A/A Directora General de Desarrollo Sostenible e Información Ambiental, Consejería de Medio Ambiente, Dirección General de Desarrollo Sostenible e Información Ambiental, Avda Manuel Siu-rot, nº 50, 41013 – Sevilla.
E-mail for questions and suggestions: [email protected]
E-mail for information and data requests: [email protected]
Specific contact: José Enrique Frieyro at Egmasa (email: [email protected]), in charge of technical development and management of the Coastal and marine environment subsystem.

21807-REL-T002.1 page 135/337
REDIAM Web-site http://www.juntadeandalucia.es/medioambiente/site/web/rediam/
1f Typology Operational
2 Operational context and information content
2a ICZM dimensions
REDIAM addresses all the five ICZM dimension considered by the analysis. The environment dimension is particularly developed. REDIAM also includes information related to territory, economic and social aspects. The governance information is partly covered, in particular in relation to environmental planning features.
2b ICZM Sectors
REDIAM Catalog is composed by the following main information typologies:
- Territory characterisation (topographic information, ortho-photos and ortho-imagery);
- Geographical references (reference systems, geographical grids, toponyms);
- Administrative units;
- Natural resources (biodiversity, geodiversity, climate, water, landscape);
- Environmental quality (atmosphere, water, soil, waste, forest ecosystems);
- Risk (natural hazards, accidents and natural disasters);
- Natural heritage (protected natural areas, public forests, trails, public facilities);
- Areas of special interest (urban environment, coastal and ma-rine environment);
- Environmental planning (natural areas planning, forest plans, water plans);
- Land use (land use, forest resources, mineral resources, wa-ter resources, transport and mobility, hunting, etc.);
- Environmental protection facilities;
- Demography and health.
2c Integration
REDIAM is designed as an easy and flexible data provider that al-lows any user to make further data elaboration, but also provides thematic map viewers integrating different layers and tools, the-matic map web services and downloadable static maps. Examples of integrated information provided by REDIAM are those related to natural and technological risks, such as: fire, flooding, erosion and desertification risks.
2d Spatial scale Sub-national – whole Andalusia territory, including Andalusia coastal area
2e Flexibility The system has been developed in order to be applied specifically to the Andalusian territory.
21807-REL-T002.1 page 136/337
3 ICZM functionalities
3a Knowledge relat-ed functionalities
The Coastal and marine environment subsystem, explicitly aimed to support the Andalusian ICZM, is composed of information gath-ered by the SIGLA project and several other specific studies, such as diagnostics of Coastal sustainability plan developed by the Min-istry of Environment, the information on Management plans for natural resources of the coastal parks, maps by the Spanish Insti-tute of Oceanography (ESPACE project), and other results of pro-jects related to the costs developed by various research centres.
This information is gradually expanding and complementing the existing basic information (coastal physiography, characterization of the coastline, bathymetry, land use, sea level, waves, winds, streams, reservoirs, water quality, fisheries, artificial reefs , etc.).
3b Process related functionalities
REDIAM provides functionalities supporting problem understand-ing (such as the coastal vulnerability index), and functionalities for stakeholders involvement and participation.
At present a new specific web GIS tool for ICZM is going to be in-tegrated in the REDIAM, strongly enhancing process related func-tionalities, by means of:
- 2D, hybrid and 3D map viewer integrating territorial infor-mation and dedicated coastal analysis and characterization, that will facilitate problem understanding;
- flooding areas simulator based on defined sea level rise, use-ful for vision building, scenario development and adaptive planning;
- tools to analyse and compare multi-time data, supporting coastal evolution monitoring and evaluation.
4 Users
4a User typology
REDIAM represents a further step from the Ministry of the Envi-ronment of Andalusia towards environmental data standardisation and sharing, aiming to make available to all stakeholders involved in the production and use of environmental information (technician management, members, general public) a web tool of information allowing interaction and participation in the creation and en-hancement of environmental information about Andalusia.
Centres or institutions can become members of the REDIAM net-work through collaboration agreements, sharing common envi-ronmental data bases, technical criteria for information gathering and classification, software to manage such information.
5 Use of the system
5a Accessibility
Free access on-line (from the home page) to the environmental data catalog, thematic information packages, web map services, general and thematic map viewers and information request ser-vices.
Personnel of Andalusian Autonomous Government can access REDIAM information also via intranet with different user types priv-ileges (basically normal user and technical manager)
21807-REL-T002.1 page 137/337
5b User-friendliness
Highly user-friendly.
The web page structure allows a very easy and flexible information search and download. Map viewers use common and intuitive web GIS functionalities and icons. REDIAM is available in Spanish and English.
5c Interactiveness
E-mail for questions and suggestions and additional information and data request services (like the “Citizen’s post-box”, on-line re-quest forms with digital sign, direct e-mail to system managers) are available.
5d Data access
From REDIAM web page these main services are available:
- environmental data catalog
- thematic information packages (including *.pdf documents with detailed description, spatial information in shapefile and GML format, metadata in *.xml format)
- web map services (WMS and Google format)
- general and thematic map viewers
- additional information and data request services
6 Technological characteristics
6a Used technology
The system has been developed using the following software technology:
- ESRI (for Geo-DB and spatial data standardising)
- Oracle (for alphanumeric and metadata storage)
- MapServer (for web-GIS development)
- OGC (for spatial data services)
6b Integration with other tools
REDIAM makes up the Regional Focal Point of Andalucía for the European Information and Observation Network about the Envi-ronment (EIONET) and is the specialized node in Environmental Information within the Spatial Data Infrastructures of Andalusia (In-frastructura de Datos Espaciales de Andalucia - IDEAndalucia)
Map viewers can link WMS maps provided by other entities.
6c Integration with other CIS
The information gathered by SIGLA project has been integrated in the subsystem “Coastal and marine environment” of REDIAM
6d Interoperability
High
The use of standard protocols for data management (INSPIRE Di-rective for spatial data, EUROSTAT standards for statistics, SEIS for methodologies) and downloadable data formats that don’t need license (in particular OGC) guarantees a high interoperability of the system.
7 Cost/Resources
7a Resources Number of involved persons: about 50 in Egmasa and about 10 in CMA.

21807-REL-T002.1 page 138/337
Information sources for the overview analysis of REDIAM:
Guisado E. and Malvarez G.C. 2009. Multiple scale morpho-dynamic mapping: meth-
odological considerations and application for the coastal atlas of Andalusia. Journal of
Coastal Research. 1513-1517.
Wright D.J., Dwyer N, Kopke K., O’Dea L., 2010. Report of International Coastal Atlas
Network Workshop: Formalizing the network, engaging the Mediterranean. 16-20 No-
vember 2009, UNESCO International Centre for Theoretical Physics, Trieste, Italy.
Iglesias-Campos A., Malvarez-Garcia G., Ojeda-Zuiar J. and Moreira-Madueno J.M.,
2011. Chapter 15: “Spain”. In Wrigth D., Dwyer E., Cummins V.[eds.], 2011. Coastal
informatics: Web Atlas Design and Implementation. Information science reference,
Hershey, New York, pp. 105-130.
Web-site consultation:
http://www.juntadeandalucia.es/medioambiente/site/web/rediam/; last visit on
7/02/2011 at 14.30.
http://www.ideandalucia.es/index.php/en/nodes/node-rediam; last visit on 7/02/2011 at
15.15.
http://ec.europa.eu/ourcoast/index.cfm?menuID=6&articleID=1; last visit on 7/02/2011
at 15.15.

21807-REL-T002.1 page 139/337
3.27 Spatial Data Infrastructure of Balearic Islands
1 General Information
1a Name Spatial Data Infrastructure of Balearic Islands (IDEIB)
1b Description
The Directorate General of Land of the Balearic Island, with the support of the Department of Technology and Communications is developing IDEIB (Infraestructura de Dades Espacials de les Illes Balears – Spatial Data Infrastructure of the Balearic Island) and the related map-viewer. This activity is implemented within the framework of the European Directive INSPIRE and IDEE (Infraestructura de Dades Espacials de España).
IDEIB is currently under construction; related information are provided by the on-line web-site (http://www.ideib.cat/) describ-ing technologies, policies, standards and human resources that will be used to create the Infraestructura de Datos Espaciales (IDE), in which the archipelago’s geographical data will be pub-lished.
IDEIB already provides a complete map-viewer (Web-GIS), to-tally accessible on-line, that is the specific objective of this de-scription. IDEIB site also includes a Catalogue enabling the us-ers to search and visualise metadata of spatial data on the ba-sis of key words. Metadata description also provides url ad-dresses for the WMS connection.
1c Operating entity Directorate General of Land of the Balearic Island Govern of the Balearic Island
1d Management struc-ture
Serveis d'Informació Territorial de les Illes Balears (SITIBSA)
SITIBSA is a public enterprise of the Government of the Balear-ic Islands operating on geographic information and systems.
1d Contacts
Alexandre Rosselló, e-mail: [email protected]
13b, 1er 07002 PALMA DE MALLORCA
On-line map-viewer: http://ideib.caib.es/visualitzador/visor.jsp
1e Typology Operational. The SDI system in currently under development.
2 Operational context and information content
2a ICZM dimensions The map-viewer of the IDEIB addresses all the five ICZM di-mensions. A detailed list of the cartographic information is listed in the section 2b.
2b ICZM Sectors Cartographic information included in the map-viewer of the IDEIB are listed below:
- Basics images (e.g. Ortho-photos in different years - 2008,
21807-REL-T002.1 page 140/337
2006, 2002, 1965, image from satellite, urban photos, etc.);
- Topographic maps in different years (2008, 2006, 2002, 1995);
- DEM (2002, 2006);
- Cadastre and propriety;
- Administrative boundary (e.g. municipalities, census sec-tion etc.);
- Limits and administrative management for the spatial planning (e.g. Mallorca Territorial Plan, Menorca Equip-ment Territorial Plan, Menorca Reconversion Territorial Plan, Menorca Risks Territorial Plan, Waste Sector Master Plan, Quarries Sector Master Plan, Industrial Area, etc.);
- Limits and administrative management for the environment (e.g. Paraje Natural Sierra, special nature reserve, Sierra Nature Reserve, protected natural spaces, Natura 2000, place of scientific interest, marine reserves, controlled hunting, wildlife refuges etc.);
- Geology and land use (e.g. Corine Land cover in different years - 1990, 2000, 2002, 2006, geology, etc.);
- Mobility and street (e.g. road network, rail network and metro, seaports, airports, transport infrastructure, transport network etc.);
- Hydrography (e.g. water sources, hydrographic network, geo-morphological flood plans, riparian forests, control surface water, etc.);
- Atmosphere and weather (pluviometric zones);
- Biological aspect (e.g. bionomic, habitat, etc); this section also includes the Bioatlas. This is a free on-line catalog of fauna and flora species of Balearic islands;
- Economy (e.g. tourist establishments, facilities in beach, zone of tourist interest, tourist information offices);
- Health (e.g. sectors sanitary inspections, pharmacies, health centres etc.);
- Infrastructure (e.g. energy, conventional energy centres, pipelines, cogeneration-wind farms, photovoltaic panels, waste facilities, drainage and water treatment, water sup-ply etc.);
- Bathymetry;
- Nautical charts;
- Historic heritage (e.g. monuments, assets of cultural inter-est, environment assets of cultural interest, oil-mills, flour windmills, water extraction windmills, regulated anchorage, territorial waters, zone with submarine prohibition etc.).
A specific search function allows the user to find the data through the use of key words.
21807-REL-T002.1 page 141/337
2c Integration No specific integration among information is directly provided.
2d Spatial scale Local scale - Balearic Islands in the Mediterranean Sea.
2e Flexibility IDEIB and its map-viewer have been developed in order to be applied specifically to the zone of Balearic Island.
3 ICZM functionalities
3a Knowledge related functionalities
IDEIB catalogue and map-viewer provide some of the knowledge related functionalities considered by the analysis; specifically:
- Availability of spatial data; the system is designed to share some of the geographic data through Web Map Service (WMS), in particular through the Catalogue functionality.
- Operation at the different spatial scale is not fully devel-oped; however the map-viewer provides bathymetric lay-ers with different spatial resolution (1:50.000, 1:100.000, 1:200.000);
- Availability of multi-time data, such as in the case ortho-photos and topographic maps enabling to evaluate the evolution of the coastal system.
3b Process related func-tionalities
The system does not specifically include ICZM process related functionalities.
However, users are invited to provides their own data, thus en-abling their participation in the construction IDEIB.
4 Users
4a User typology
Main target users can be identified in:
- Coastal planners and managers; the map-viewer provides a high number of spatial data and the possibility to gener-ate simple customised maps;
- Experts, likely more interest in the Catalogue functionality, enabling to search for metadata and url for WMS connec-tion;
- Citizens, thanks to the intuitive use of the map-viewer.
The complete development of the SDI system will also improve the likely target users.
5 Use of the system
5a Accessibility The Map-viewer and the metadata catalogue are completely accessible on-line
5b User-friendliness
High/Medium
The map-viewer of the IDEIB is built around an interactive map very easy to browse, which allows anyone to identify and visual-ize those datasets relevant to their interest. Map-viewer is avail-
21807-REL-T002.1 page 142/337
able in 4 languages (Spanish, Catalan, English and German).
Current version of the web-site, likely due to the fact that it is under evolution, is not totally user-friendly.
5c Interactiveness
No specific e-participation tools are available. The IDEIB and its map-viewer enable users to provide suggestions to improve the functionality of the system. This can be done through a specific feedback form.
5d Data access
The system is designed to share some of the spatial data through Web Map Service (WMS); this can for example visual-ised thought the freely acquirable GAIA software. Spatial data can not however be downloaded.
The Catalogue is used to manage metadata through specific sheet also including url for the WMS connection..
6 Technological characteristics
6a Used technology Map-Viewer has been developed with licensed ESRI software.
6b Integration with other tools
No specific integration with other tools.
6c Integration with other CIS
There is no proper integration with other CIS. However, the IDEIB web-site allows connection to external web-site and ex-ternal web-GIS projects, such as:
- New web-site mapping of the Council of Minorca. This web-site provides different thematic web-GIS interfaces, such as those concerning: the insular territorial plan, the waste and quarries sector master plan and environmental planning.
- A web-site mapping of the Council of Mallorca. This web-site provides some thematic web-GIS interfaces , specifi-cally related to the Territorial Plan of Mallorca and a gener-ic map viewer of geographic information of the islands.
6d Interoperability
High
The system is compliant with International standard for metada-ta (ISO 19115).
The information content is structured according to the specifica-tions of the European Directive INSPIRE.
Indeed the whole SDI development aims to fully meet INSPIRE Directive and the Spanish IDEE requirements.
7 Cost/resources
7a Resources

21807-REL-T002.1 page 143/337
Web-site consultation:
http://www.ideib.cat/; last visit on 14/04/2011 at 12.30.
http://ideib.caib.es/visualitzador/visor.jsp; last visit on 15/04/2011 at 12.30.
http://cartografia.cime.es/; last visit on 15/04/2011 at 12.30.
http://www.conselldemallorca.net/; last visit on 15/04/2011 at 12.30.

21807-REL-T002.1 page 144/337
3.28 IDEC-LITORAL
1 General Information
1a Name IDEC-LITORAL
1b Description
IDEC-LITORAL is the specific section of the Catalonia Spatial Data Infrastructure (IDEC) focusing on the coastal zone. IDEC, including the IDEC-LITORAL section was created by the Institut Cartogràfic de Cataluña according to the Inspire European Directive require-ments.
IDEC main objective is to interchange and share spatial information through an internet platform, involving all interested Public Admin-istrations (such as the Generalitat de Catalunya, the Spanish Gov-ernment, local entities), as well as other public and private institu-tions of Catalonia. IDEC maintains a map viewer, various thematic geo-portals and some sectoral initiatives (including the IDEC-LITORAL one) with numerous services, a great number of available datasets and of registered organizations. Furthermore, IDEC pro-vides a Platform Resources of Geo-information (PRG); a web-site accessible only to the public administrations and their agencies (part of the IDEC network), enabling authorised users to mutually share and exchange data and information.
IDEC was the first fully developed regional SDI in Spain with a fully functional geo-portal. The portal is updated twice a year and in 2009 there were 161 entities that contributed with metadata, 169 entities with accessible WMS and 657 participant entities in thematic SDIs. IDEC has been awarded as one of the ‘best European practice’ of 2009 in the framework of the eSDInet+ project. In March 2010 the total metadata entries published were 23,344 with 213 registered organisations.
Within the above context IDEC-LITORAL provides a Web-GIS in-cluding a great number of spatial data on the coastal zone of Cata-lonia. It also includes the link to the general IDEC data catalog ena-bling users to search spatial data related to all IDEC themes (no on-ly those related to the coast) and access to metadata and data in different ways (i.e. direct downloading, through WMS service and/or static visualisation).
Currently IDEC-LITORAL is constantly updated by the Consorti El Far that also hosts the related web-site (http://www.geoportal-idec.net/idecostes/index.jsp).
1c Operating entity Cartographic Institute of Catalonia (ICC)
1d Management struc-ture
Cartographic Institute of Catalonia (ICC) with the technical support of Consortium El Far and
1d Contacts e-mail: [email protected]
Institut Cartogràfic de Catalunya (ICC) Parc de Montjuïc

21807-REL-T002.1 page 145/337
08038 Barcelona
Consorci EL FAR C. Escar, 6-8 08039 Barcelona
Web-site: http://www.geoportal-idec.net/idecostes/index.jsp?pag=home&lang=ca
1e Typology Operational
2 Operational context and information content
2a ICZM dimensions
IDEC-LITORAL addresses four of the five ICZM dimension: territory (e.g. for general geographic descriptors, land use, marine protected areas), environment (e.g. biology related spatial data), economy (e.g. energy consumption, fishery) and society (e.g. employed popu-lation, tourism).
2b ICZM Sectors
Data/cartographic information included in the Web-GIS of the IDEC-LITORAL are structured in 5 groups:
- Administrative boundaries;
- Cadastre;
- Coastal Observatory, including for example marine protected area, land protected area, coastal birds, generated waste, av-erage daily water consumption, power consumption, etc.;
- Fishery, including for example: bathymetry, map of sea-grass, coastline, artificial reef, lithology, prohibited areas for fishing, suitable areas for fishing, etc.
- Corine land use in different years.
The IDEC catalog provides a much wider set of spatial data, not specifically referred to the coastal system. Each layer is described through a metadata sheet. A great part of the layers are accessible to the generic user, while for some of them the access is restricted to the authorised users.
2c Integration The IDEC-LITORAL Web-GIS does not specifically include integrat-ed information
2d Spatial scale Sub-National – Catalonian coast in Spain.
2e Flexibility IDEC-LITORAL been developed in order to be applied to the specif-ic coastal territory of Catalonian coast.
3 ICZM functionalities
3a Knowledge related functionalities
IDEC-LITORAL provides some of the knowledge related functionali-ties considered by the analysis; specifically:
- Availability of spatial data; A great part of the spatial layer in-cluded in the IDEC SDI can be directly accessed (through downloading or WMS) by general users. Authorised users can fully benefit of the IDEC SDI and the related web-site to share
21807-REL-T002.1 page 146/337
and exchange spatial data on a high number of themes;
- Support experiences and best practices exchange in relation to data management and geographic information in general.
3b Process related func-tionalities
IDEC-LITORAL does not directly provides ICZM process related functionality. More in general IDEC SDI aiming to share and ex-change data and information can decision making (also in the ICZM process) and stakeholder involvement.
4 Users
4a User typology
The final users of the IDEC-LITORAL mainly are:
- Public Administrations, such as the Catalonia Government, the Spanish Government, local entities;
- Other public and private institutions of Catalonia
In general users are identified as all public bodies, actors and ser-vices working on public Geographic Information in the Catalonian Region. In march 2010, IDEC involved about 118 registered organi-zations.
5 Use of the system
5a Accessibility
Full access to all data (including data sharing and exchange) is pro-vided to members of the IDEC network. IDEC system is in general accessible by every user that can utilise the on-line Catalogue to search for and access to spatial data.
IDEC-LITORAL Web-GIS is freely accessible on-line, also enabling map customisation.
5b User-friendliness
Highly/Medium user-friendly.
The Web-GIS is built around an interactive map very easy to browse, which allows anyone to identify and visualize those da-tasets relevant to their interest. The spatial data catalogue is less easy and intuitive to use, also due to the great number of contained information. The use is however supported by filtering and searching functionalities.
The system is available in Spanish and English.
5c Interactiveness
Stakeholder involvement and participation is a specific aim of the IDEC SDI that provides the Platform Resources of Geo-information – to authorised users - to create a strong mutualisation of decisions related to data and information sharing and exchange.
5d Data access
For the IDEC SDI in general:
- All spatial data can be accessed by authorised users through the Platform Resources of Geo-information;
- More than 35% (15000 on 38000) spatial layers can be directly downloadable by general users through the Catalogue; another consistent part can be visualise through WMS. Other spatial data can not be directly accessed due to confidentiality rea-sons defined by data producers;
21807-REL-T002.1 page 147/337
- Metadata complying with ISO 19155 are available for all the IDEC layers.
All IDEC-LITORAL spatial data, including those visualised in the Web-GIS, are part of IDEC SDI
6 Technological characteristics
6a Used technology
6b Integration with other tools
No specific integration with other tools
6c Integration with other CIS
No specific integration with other CIS
6d Interoperability
High.
The IDEC is compliant with Open Geospatial Consortium standards and implement the existing specifications of the INSPIRE directive.
Metadata are structured and described according to the standard ISO 19115, being therefore complying with the INSPIRE Directive.
7 Cost/resources
7a Resources For the whole IDEC (including IDEC-Litoral, the specific section on the coastal zone) 13 persons are involved in the management of the GIS unit and further 3 persons for the SDI
Information sources for the overview analysis of IDEC-LITORAL:
Spatial Data Infrastructures in Spain: State of play 2010. Spatial application division –
K.U. Leuven Research & Development. Document available at:
http://inspire.jrc.ec.europa.eu/reports/stateofplay2009/rcr09ESv111.pdf
Black, E.D, 2010. Assessing organisational aspects of Sub-national SDIs: The case of
the Balearic Islands and Catalonia. Master Thesis Geographical Information Management
and Applications. Document available at:
http://www.geoportal-idec.net/geoportal/cat/documents/articles/MSC_GIMA_Erica_Black.pdf
Web-site consultation:
http://www.geoportal-idec.net/idecostes/index.jsp?pag=home&lang=ca; last visit on
13/04/2011 at 12.30
http://www.geoportal-idec.cat/geoportal/eng/; last visit on 13/04/2011 at 13.30.

21807-REL-T002.1 page 148/337
3.29 Thau Lagoon Coastal Information System
1 General Information
1a Name Thau Lagoon Coastal Information System
1b Description
The Thau Lagoon CIS is an off-line GIS managed by the “Ob-servatoire du Syndicat Mixte du Bassin de Thau” (Thau Lagoon Observatory). The Syndicat Mixte du Bassin de Thau (SMBT) is a management body created in 2005 and involving two Etablisse-ments Publics de Coopération Intercommunale (EPCI):
- La Communauté d'Agglomération du Bassin de Thau (CABT);
- La Communauté de Communes du Nord du Bassin de Thau (CCNBT).
In order to achieve the implementation of integrated management of the lagoon and its watershed, SMBT created the Thau Lagoon Observatory, whose main aim is to collect, managed and share information (data, statistics, indicators, maps, etc.) and tools (such as database and GIS) related to this territory. The Observa-tory also monitors the evolution and sustainable development of the territory, by means of long term indicators, particularly focus-ing on Integrated Coastal Zone Management (ICZM).
The Thau lagoon situated is situate along the French Mediterra-nean coast and has a surface of 75 km2 and an average depth of 4 m (max depth: 10 m).The population on the watershed was about 130.000 inhabitants in 2005 with a density of 465 inhabit-ants for km2 and with a very strong growing rate.
The Thau Lagoon is one of the sites analysed within the DITTY project that produced new management tools for this coastal and contributed to establish links or to strengthen the existing ones between administrative bodies, scientific institutions, universities and technical agencies.
1c Operating entity Syndacat Mixte du Basin de Thau
1d Management struc-ture
Thau Lagoon Observatory of the Syndacat Mixte du Basin de Thau
1d Contacts
Jean Jacques Taillade, e-mail [email protected]
Syndicat Mixte du Bassin de Thau 328, Quai des Moulins 34200 Sète
Web-site: http://smbt.teledetection.fr/
1e Typology Operational

21807-REL-T002.1 page 149/337
2 Operational context and information content
2a ICZM dimensions
The Thau Lagoon CIS addresses all the five considered infor-mation dimensions, although through simple but very communi-cative modalities (see section 2b), i.e. static maps contained in the Cartothèque section.
2b ICZM Sectors
The web-site of the Syndacat Mixte du Basin de Thau includes a specific section (Cartothèque) providing a great number of static maps related to the following main sectors:
- Territorial information;
- Planning and management; i.e. maps related to the “Sché-ma de COhérence Territoriale (SCOT)” and the “Schéma d'Aménagement et de Gestion des Eaux (SAGE)”
- ICZM; i.e. simple maps on competence related to ICZM im-plementation;
- Population, in particular including maps of the historical evo-lution of the population;
- Mobility, mainly related to workers travels;
- Economy; e.g. maps related to marinas, port activities, agri-culture, maritime transportation, etc.
- Architectonic heritage;
- Natural heritage; such as for example natural protected are-as, plans for the wetlands management, high-values areas, etc.;
- Sanitation; mainly waste water treatment plants;
- Drinking water resources;
- Monitoring of water quality of rivers of drainage basin;
- Monitoring of quality of bathing water;
- Monitoring of eutrophication in the lagoon;
- Escherichia coli surveillance.
Above maps are mainly addressing communication purposes and are therefore presented in simple a very clear modalities. The off-line GIS archives and manage data used to derive these maps, also including basic layers and others such as:
- Orthophotos database;
- Digital Elevation Model;
- Bathymetry;
- Topography;
- Cadastral maps.
- Corine Land Cover;
- Urban development, including scenario simulation for 2020.
2c Integration Main objectives of maps made available by the http://smbt.teledetection.fr/ site in the Cartothèque section ap-

21807-REL-T002.1 page 150/337
pears to be communication and awareness rising. In this per-spective for some of the main topics, the web-site provides syn-thetic maps that integrates different data, such as for example the map of the economic activities or the map of area s with high en-vironmental values.
2d Spatial scale Local – Thau Lagoon and the related drainage basin.
2e Flexibility The system has been developed in order to be applied specifical-ly to the territory of the Thau Lagoon Hydrographic basin.
3 ICZM functionalities
3a Knowledge related functionalities
Thau Lagoon CIS provides some of the knowledge related func-tionalities considered by the analysis, specifically:
- Integration among dimensions and/or sectors (see 2c), mainly related to communication aspects;
- Multi-time data and information: the system collects different temporal and environmental variables supporting a multi-level temporal analysis. This is particularly evident for popu-lation data and the territorial evolution (orthophotos).
- The Thau Lagoon Observatory has developed a set of 126 indicators (structured in 8 principal themes) for sustainable development and management of the Thau Lagoon in an ICZM perspective. In particular, SMBT, in partnership with the University of Montpellier I, Cepralmar, and the Ecole Normale Superieur de Cachan, formed in 2007-2008 a working group on "indicators" to identify and prioritize sus-tainable development indicators for the territory of Thau La-goon. The related report (December 2007) is available on-line. However, at the moment, the indicators are not directly integrated in the web-site.
3b Process related functionalities
Maps included in the web-site appear to properly support com-munication and awareness raising aspects of the ICZM process. In this perspective it is also important to stress that indicators were developed
4 Users
4a User typology
Main users of on-line maps appear to be the civil society in gen-eral and whoever can be interested in communication of the inte-grated management of the lagoon.
The off-line GIS is presumably targeted to expert users.
5 Use of the system
5a Accessibility The CIS is not on-line, but all the maps and the documents with the elaboration are freely downloadable.
5b User-friendliness
21807-REL-T002.1 page 151/337
5c Interactiveness The CIS is an off-line system. The web-site freely provides ac-cess to static maps to any users
5d Data access
All static maps and some documents are downloadable from the web-site (mainly in pdf format). Proper metadata are not available on-line; however map contents are illustrated by summary de-scriptions.
6 Technological characteristics
6a Used technology
6b Integration with oth-er tools
No specific integration with other tools
6c Integration with oth-er CIS
No specific integration with other CIS
6d Interoperability
Interoperability analysis is not fully applicable to the web-site that does not directly provide data.
Interoperability of the off-line system cannot be assessed. As re-port in (http://smbt.teledetection.fr/index.php?option=com_content&task=view&id=68&Itemid=201), the Observatory will use the on-line catalogue tool called “MDWEB”. MDWEB is a generic tool, open source based on international metadata standards (ISO 19115) and communication (OGC).
7 Cost/resources
7a Resources
Information sources for the overview analysis of Thau Lagoon Coastal Information System:
Rey-Valette H., Damart S., Rodriguez T. and Roussillon J.F., 2007. Hiérarchisation des in-
dicateurs de développement durable en vue de contribuer à la constitution d’un observa-
toire du territoire de Thau. Rapport Final – Atelier Sciences Sociales – Canthier Pnec « La-
gunes Méditerranées ». December 2007. Downloadable at:
http://smbt.teledetection.fr/index.php?option=com_content&task=view&id=61&Itemid=193
Web-site consultation
http://smbt.teledetection.fr; last visit on 31/03/2011 time 16.00
http://www.ifremer.fr/syscolag/index2.htm; last visit on 31/03/2011 at 17.00.
http://www.ifremer.fr/lerlr/surveillance/atlas/thau.htm; last visit 31/03/2011 at 9.10
http://ec.europa.eu/ourcoast/index.cfm?menuID=9&articleID=254; last visit 07/04/2011 at
12.10.

21807-REL-T002.1 page 152/337
3.30 CRIGE PACA Spatial Data Infrastructure
1 General Information
1a Name CRIGE-PACA Spatial Data Infrastructure (CRIGE-PACA SDI)
1b Description
CRIGE-PACA SDI is a framework of spatial data, metadata, users and tools that are interactively connected in order to use spatial data in an efficient and flexible way. The SDI is operated and managed by CRIGE-PACA the “Regional Centre for Geographic Information in Provence-Alpes-Cote d'Azur”. The on-line platform of the CRIGE-PACA SDI is the web-site http://www.crige-paca.org/. This is currently under further development and will be configured and named as Regional Geoportal.
CRIGE-PACA is a non-profit making organization created in 2002, led by national and regional authorities through a seven-year fi-nancial plans (2000-2006 and 2007-2013). CRIGE-PACA main mission is to promote, facilitate, support and spread geographical information to public administrations and when possible, to gen-eral public and stakeholders. The above overall aim includes the following specific objectives:
- Provide geographic referenced data (digital data-sets) via the existing CRIGE-PACA web-site and its future evolution in the Regional Geoportal; the on-line participative and data-sharing platform (for public administrations) of the CRIGE-PACA SDI;
- Provide technical support to users, including: help-line for assistances, production of technical and requirements guides, editing specifications, technical meetings, on-line re-sources;
- Support the Regional Geomatic Network, through: promotion of cooperation between local users and data providers, sup-port local communities of interests, management of thematic clusters, experiences and best practices exchange, acting as a resource centre on GIS concepts;
- Act as a coordination centre for the implementation of the INSPIRE directive at the regional level.
CRIGE-PACA is the coordinator of the Regional Geomatic Net-work involving thematic clusters (Pôles metiers). These clusters are structured around local animators and a certain number of working groups, bringing together regional organisations interests in thematic datasets issues. One of these twelve cluster deals with Sea and Coast (Mer & Littoral) bringing together the coastal stakeholders of the PACA region.
CRIGE PACA received in 2009 an “eSDI NET+ Best Practice Award” for its innovative organisational and institutional aspects in terms of cooperation, subsidiary and sustainability.
CRIGE-PACA SDI and its web-site are constantly updated and innovated; in particular a new version of the web-site (the Region-
21807-REL-T002.1 page 153/337
al Geoportal) will be available soon, including new applications to facilitate query and sharing of the data.
1c Operating entity Regional Centre for Geographic Information in Provence-Alpes-Cote d'Azur – CRIGE-PACA
1d Management struc-ture
Regional Centre for Geographic Information in Provence-Alpes-Cote d'Azur – CRIGE-PACA
1d Contacts
E-mail: [email protected]
Centre Régional de l'Information Géographique de Provence-Alpes-Côte d'Azur Domaine du Petit Arbois- Bâtiment MARTEL Avenue Louis Philibert BP 10019 - 13 545 Aix-en-Provence cedex 4 - FRANCE
Web-site of the CRIGE-PACA: http://www.crige-paca.org/
1e Typology Operational
2 Operational context and information content
2a ICZM dimensions
The CRIGE-PACA SDI addresses all the five ICZM dimensions, attempting to include the information relevant for the thematic clusters being part of the Regional Geomatic Network:
- Environment;
- Water;
- Agriculture;
- Forest;
- Sea and Coast;
- Risks;
- Urbanism;
- Employment;
- Telecom;
- Health;
- Economy;
- Fire
- Roads and transportation.
2b ICZM Sectors
Data/cartographic information included in CRIGE-PACA SDI and accessible through the CRIGE-PACA data catalogue are struc-tured in the following groups of spatial layers (some of them are downloadable):
- Geographic information; including for example topography, bathymetry, road, vegetation features, cadastral map, Euro Global Map, etc.;
- Thematic layers; this section contains about 85 lay-ers/documents such as for example: administrative bounda-ry, land cover, flooding zones, rainfall, mean annual temper-

21807-REL-T002.1 page 154/337
ature, biological reserves, natural areas, noise exposure, forest zones, identification of potential areas of radon ema-nations, posidonia monitoring network, soil classification, alti-tudinal vegetation, etc.). This group also contains some in-formation related to the governance dimension, such as layers and documents related to: Plans de Développement de Massif (PDM), Plans Simples de Gestion (PSG), Sché-mas d'Aménagement et de Gestion des Eaux (SAGE) en ré-gion PACA etc.
- Aerial Ortho photos; including for example: ortophotos with high resolution (20 cm), historical aerial photographs of the coast (several years), etc.
- Satellite images: including false colour image of the Region PACA (1999-2006) and false colour image of the Mediterra-nean 2006.
The CRIGE-PACA web-site also provides the “Cartopas 2010” functionality enabling the users to browse and visualise (in pdf format) maps related to the following themes:
- The territory and its evolution (e.g. land use, land use from 1990 to 2006, population density from 1996 to 2006 etc.);
- Management and planning (e.g. in French “Schémas de cohérence territoriale (SCoT) et schémas directeurs (SD)” and Local Plans (PLU), communal cards (CC), land use plans (POS), etc.);
- Air and climate (e.g. temperature, precipitation, state of air pollution by ozone, state of air pollution by suspended solids, etc.);
- Land polices for sustainable development (e.g. in French «Etat d’avancement des Schémas d’Aménagement et de Gestion des Eaux (SAGE)», the local Agenda 21 site and the map of the local plans energy environment (PLEE));
- Nature and biodiversity (e.g. natural reserve, natural areas of ecological interest for fauna and flora, site NATURA 2000 etc.);
- Landscapes and sites (e.g. map of regional synthesis of classified sites and sites registered under the Act of May 2, 1930 in the PACA region and Operations Great Sites, typol-ogy of regional landscapes, etc.);
- Data on water quality (e.g. aquifers and piezometric network, biological quality of the rivers, etc.);
- Water policy (e.g. principal water drainage, targets according to the Water Framework Directive (WFD), ecological and chemical status of rivers and coastal water, vulnerable and sensible zones for the nitrate, urban waste water treatment unit, annual volume of water used by geographical depart-ment, etc.);
- Energy (e.g. electricity transmission network, wind energy development, wind speed, wind power and potentially ener-gy, development status of photo voltaic power projects, etc.);
- Housing (e.g. Status of the Local Housing Programs (PLH), percentage of social housing, etc.);
21807-REL-T002.1 page 155/337
- Transport (e.g. road, traffic in major roads, etc.);
- Natural, technological and mining risk (e.g. flooding risk, at-las of the flooding zones, seismic risk, climatic occurrence of heavy rainfall, industrial risk, etc).
2c Integration
Examples of integrated information are maps from Cartopas 2010, related to the assessment of the natural and technological risks for the addressed territory. The “Natural risk” section for ex-ample includes maps related to flooding, seismic and landslide risks. Addressed technological risks include for example maps of: risk related to large dams, industrial risk and risk related to mining and quarrying.
Several integrated maps are available also in the data catalogue (e.g. Atlas of flooding zones)
2d Spatial scale Sub-National scale - PACA (Provence – Alpes - Cote d'Azur) Re-gion, also including the related coastal zone.
2e Flexibility
The system has been developed in order to be applied specifical-ly to PACA region territory.
CRIGA-PACA is in contact with various local authorities to whom it offers the possibility of mutualising data by creating a task force for the management of coastal data.
3 ICZM functionalities
3a Knowledge related functionalities
CRIGE-PACA SDI provides some of the knowledge related func-tionalities considered by the analysis; specifically:
- Integration among different information sectors (see point 2c), including some integrated maps related to natural and technological risks;
- Availability of spatial data; authorised users (mainly public administrations) can benefit of the CRIGE-PACA SDI and the related web-site to share and exchange spatial data on a high number of themes;
- Support experiences and best practices exchange in relation to data management and geographic information in general.
3b Process related functionalities
CRIGE-PACA SDI provides a high variety of data related to dif-ferent information sectors and dimensions and therefore can properly support problem understanding. Spatial data are organ-ised according to an articulated structure that can support user in the elaboration of conceptual models of the territory.
Stakeholder involvement and participation is a specific aim of the CRIGE-PACA SDI that provides a platform to create a strong mu-tualisation of decisions related to data and information sharing and exchange.
4 Users

21807-REL-T002.1 page 156/337
4a User typology
The final users of the Spatial Data Infrastructure developed and managed by the CRIGE-PACA are:
- Government agencies;
- Local governments as municipalities, Provinces, Region;
- Thematic public chambers;
- No profit making organizations;
- Universities and research laboratories.
In general users are identified as all public bodies, actors and services working on public Geographic Information in the PACA Region.
The Regional Geomatic Network currently involves about 3170 persons belongings to more than 1500 organizations.
5 Use of the system
5a Accessibility
Full access to all data (including data sharing and exchange) is provided to public bodies of the PACA Region that are members of the Regional Geomatic Network. Every public entity can be-come member of the Network through an on-line application form available in the Geoportal. CRIGE-PACA verifies if the applicant entities are really a public bodies and therefore may become Net-works members.
The system is in general accessible by every user that can visual-ise a great number of spatial layers (some of them can be also downloaded) and pre-defined maps in pdf format (through the “Cartopas 2010” functionality).
5b User-friendliness
Medium user friendly.
Current version on-line is not totally intuitive. “Cartopas 2010” provide an easy-to-use tool for query and browsing maps availa-ble in the system The new development of the web-site into the Regional Geoportal will significantly improve the intuitive and easy use of the system.
Currently, the system in only in French.
5c Interactiveness
Stakeholder involvement and participation is a specific aim of the CRIGE-PACA SDI that provides a platform to create a strong mu-tualisation of decisions related to data and information sharing and exchange.
5d Data access
Public bodies of the PACA Region that are members of the Re-gional Geomatic Network have access to all information and can download all spatial data. Other users can download some of the spatial layers available in the CRIGE-PACA web-site.
Metadata are provided for all data of the CRIGE-PACA web-site. For the data accessible through “Cartopas 2010” functionality brief metadata descriptions are made available.

21807-REL-T002.1 page 157/337
6 Technological characteristics
6a Used technology Open sources technologies are adopted for the development of the new version of the Regional Geoportal CRIGE-PAC, includ-ing: MAPSERVER, Geosource, PostGIS, MySQL, etc.
6b Integration with oth-er tools
Specific function of the CRIGE-PACA SDI is integration of data and information provided by the various members of the Regional Geomatic Network, i.e. public bodies. The SDI is therefore inte-grated with several database managed by various data providers (see the list at http://www.crige-paca.org/frontblocks/print/print_LOT_CARTES.asp )
6c Integration with oth-er CIS
In the case of CRIGE-PACA-SDI this issue is strictly connected with and therefore addressed in point 6b.
6d Interoperability
High.
The CRIGE-PACA regional Geoportal is compliant with Open Geospatial Consortium standards and implement the existing specifications of the INSPIRE directive. The CRIGE-PACA re-gional Geoportal is one of the first French regional web sites total-ly interoperable with national and European data management standards.
7 Cost/resources
7a Resources
CRIGE-PACA is responsible for the management of the CRIGE-PACA SDI and the related Regional Geoportal. CRIGE-PACA in-volves a team composed by 8 full-time persons. The budget for the SDI management from 2009 to 2011 was about 620.000 €/year.
Information sources for the overview analysis of CRIGE-PACA SDI:
Buchait R., 2009. A regional French SDI to coordinate regional dataset production and dis-
semination. Presented CPMR “AQUAMARINA”WORKING GROUP - THEMATIC
COMMISSION ON DATA AND INDICATORS”.
Rix J. et al., 2010. Operational SDIs: The Sub National Dimension in the European context.
Article under Review for the International Journal of Spatial Data Infrastructures Re-
search, submitted 2010-06-21.
Web-site consultation
http://www.crige-paca.org/; last visit on 22/02/2011 time 12.00.
http://www.esdinetplus.eu/; last visit on 22/02/2011 time 12.30.

21807-REL-T002.1 page 158/337
3.31 SICoast Information System
1 General Information
1a Name SICoast Information System (SICoast-IS)
1b Description
The SICoast Information system (SICoast-IS) was realized by the Spatial Planning Department of the Liguria Region.
SICoast-IS consists of various cartographic interfaces (Web-GISs), each one related to a specific thematic (e.g. geomor-phology, nature, landscape, public domain, administrative, regulatory etc.). These are actually pre-defined maps (each one with its own interface), that can be however customised by the user through Web Map Service (WMS). Data included in SICoast-IS have been collected and provided by various re-gional structures and related to numerous studies and research activities. Data contained in the information systems are those useful in supporting integrated coastal zone planning and man-agement of the Ligurian coast. In particular the system and data were used to support the elaboration of the “Territorial Plan of Coordination of the coast” (Piano Territoriale di Coordinamento della Costa). SICoast-IS is regularly updated and integrated with new levels of information, in order to provide a suitable tool to the most recent European policies on maritime spatial plan-ning.
Besides the Internet component, SICoast-IS also includes an Intranet Web-GIS, containing other spatial data and functionali-ties. This description mainly refers to the information system freely available in Internet.
The Liguria Region Authority has developed other Web-GIS tools related to sector themes that can be relevant for ICZM. Data included in these tools can be easily integrated in SICoast-IS through the WSM functionality. Two Web-GISs are particularly relevant in this perspective:
- SiSea – Information System on the quality marine-coastal waters;
- Web-GIS of the Water Conservation Plan (“Piano di Tutela delle Acque”), with information related to each water body;
- Sirip – Information System on nourishment interventions (under development).
1c Operating entity Spatial Planning Department of the Liguria Regional
1d Management struc-ture
Spatial Planning Department of the Liguria Region Information Systems Service
1d Contacts Corinna Artom, e-mail: [email protected]
Dipartimento Pianificazione Territoriale, Urbanistica Ufficio Aree Demaniali marittime Regione Liguria

21807-REL-T002.1 page 159/337
Regione Liguria via Fieschi 15 - piano S2 16121 - Genova
Web-GIS: http://www.cartografiarl.regione.liguria.it/SiraWebGis/IndiceCarte_PT.asp?idCanale=SICOAST
1e Typology Operational
2 Operational context and information content
2a ICZM dimensions
SICoast-IS mainly addresses three of the five considered infor-mation dimensions. The environment and the territory dimen-sion are both well developed. Some governance information are integrated in the system, in particular referring to the Plan of use of the public coastal areas (PUD = “Progetto Utilizzo De-manio Marittimo”).
2b ICZM Sectors
The SICoast-IS consists of different web-GIS applications, each on related to one of the following topics:
- Administrative boundary of the coastal municipalities;
- Coastal topography;
- Catalogue of photos of the coast (2006-2008-2010);
- Historical photos of the coast;
- Shoreline evolution from 1944 to 2003;
- Coastal defence;
- Beaches and high coasts;
- Bathymetry;
- Land and marine Natura 2000 sites;
- Atlas of the Marine Habitat;
- Fishing farming plants, aquaculture and barriers for the fish restocking;
- Marine Natural Protected Areas;
- Plan of use of the public coastal areas (PUD = “Progetto Utilizzo Demanio Marittimo”) including the actual use and the future planned one.
These are actually pre-defined maps (each one with its own in-terface), that can be however customised by the user through Web Map Service (WMS), thus enabling to visualise a higher number of spatial data. The Intranet component (not addressed in this description) includes other spatial data.
2c Integration No specific integration among different information is directly provided within the system.
2d Spatial scale Sub-National – Coast of the Liguria Region on the Tyrrhenian Sea.
2e Flexibility The SICoast-IS has been developed in order to be applied spe-cifically to the coastal zone of Liguria Region.
21807-REL-T002.1 page 160/337
3 ICZM functionalities
3a Knowledge related functionalities
SICoast-IS provides some of the knowledge related functionali-ties considered by the analysis, specifically:
- Operation at the different spatial scale; some of the avail-able spatial data can be re-scaled according to the con-sidered spatial extent; thus enabling to visualize more de-tails at a higher scales, e.g. the aerial photos, bathymetry etc..
- Availability of multi-time data; multi-time spatial data are for example provided for the shoreline evolution (1944-1973-1983-1993-2003). SICoast-IS also includes an his-torical collection of photos of the coast. Both dataset can be useful to evaluate the morphological evolution of the coastline.
3b Process related func-tionalities
The various customizable Web-GIS interfaces of SICoast-IS can provide a good support to problem understanding. The on-line component does not currently and directly provides other ICZM process related functionalities.
It is anyhow important to highlight that data contained in the in-formation systems are useful in supporting integrated coastal zone planning and management of the Ligurian coast. In partic-ular the system and data were used to support the elaboration of the “Territorial Plan of Coordination of the coast (Piano Terri-toriale di Coordinamento della Costa).
4 Users
4a User typology
The web-GIS is freely accessible to all the interested users. Target users can be in particular identified in: - Decision-makers; - Coastal planners and/or managers; - Specialized and expert users
The latter two can benefit of the WMS service, for example in-tegrating the Liguria Region spatial data with data provided by other sources.
The Intranet component of the system is accessible by the staff of the Spatial Planning Department and by other authorised us-ers (likely other regional public offices).
5 Use of the system
5a Accessibility
Internet versions of SICoast-IS is freely accessible. Users can also customise maps provided by the different Web-GIS through a Web Map Service (WMS). This in particular enable to poten-tially visualise SICoast-IS any spatial data , including in particu-lar those provided by the Liguria Region through the Carto-graphic Service: http://www.cartografia.regione.liguria.it. WMS service also provides the possibility to visualise and use data from a client application, for example using the freely available GAIA software. Access to the Intranet version is restricted only to authorised users.
21807-REL-T002.1 page 161/337
5b User-friendliness
Highly user-friendly.
The SICoast-IS Web-GIS component is very easy to use and enable a high level of customisation. The system is only in Ital-ian.
5c Interactiveness No specific e-participation tools are provided
5d Data access
Downloading of spatial data is possible for a sub-set of layers, through the Cartographic Service, that is directly linked to the SICoast-IS. The same service provides metadata for all the car-tographic layers. These can be both visualised and download-ed. Metadata format respect the ISO 19115 and respects the INSPIRE Directive.
SICoast-IS includes a functionality enables the user to create customised maps, that can exported in pdf format.
6 Technological characteristics
6a Used technology The system uses MapServer (4.10.3), (open source software).
6b Integration with other tools
No specific integration with other tools.
6c Integration with other CIS
SICoast-IS is structured as a set of thematic Web-GIS. All pre-defined interfaces can be highly customised by the users through the WMS functionality. This provides a dynamic inte-gration with other information systems supporting WMS, in par-ticular those provided by the same Liguria Region (see descrip-tion of some of them in 1b).
SICoast-IS is included in the BEACHMED-e (Strategic man-agement of beach protection for sustainable development of Mediterranean coastal zones) project web-site. The other web-GIS connected inside the BeachMed-e project are
- Emilia Romagna Region Web-GIS;
- Lazio Region web-GIS;
- Toscana Region Web-GIS;
- Catalunya Web-GIS.
6d Interoperability
High.
SICoast utilises Open Geospatial Consortium compliant Web Map Services (WMS). Metadata are structured and described according to the standard ISO 19115, being therefore meeting the INSPIRE Directive requirements.
7 Cost/resources
7a Resources

21807-REL-T002.1 page 162/337
Information sources for the overview analysis of SIcoast:
Artom C., 2009. Presentation given to “A day for cartographic system to manage coastal
zones”. Provence-Alpes-Côte d’Azur - Brussels Office on December 2010.
Gattulli O. and Fiorito M., 2010. Presentation given to “MAREMED – kick off meeting”. Re-
gion Provence-Alpes-Cote d’Azur – Marseille, June 2010.
Web-site consultation:
http://www.regione.liguria.it/argomenti/territorio-ambiente-e-infrastrutture/costa/sistema-
informativo-della-costa-sicoast-.html; last visit on 21/03/2011 at 10.30.
http://www.cartografiarl.regione.liguria.it/SiraWebGis/IndiceCarte_PT.asp?idCanale=SICO
AST; last visit on 21/03/2011 at 12.45.

21807-REL-T002.1 page 163/337
3.32 CMGIZC Web-GIS
1 General Information
1a Name
CMGIZC Web-GIS
Web-GIS of the “Centro di Monitoraggio per la Gestione Inte-grata della Zona Costiera della Regione Lazio” (Web-GIS of the Monitoring Centre for Integrated Coastal Zone Management of the Lazio Region)
1b Description
CMGIZC Web-GIS was developed by the Monitoring Centre for Integrated Coastal Zone Management of the Lazio Region. The Web-GIS covers the coastal and marine area of the Lazio Re-gion.
Main goals of this application are:
- Make a large number of information relevant for the man-agement of the coastal zone available;
- Collect in the same information system data provided by various sources
- Improve accessibility to the information on the coastal zone.
The Web-GIS is accessible through the web-site of the Monitor-ing Centre for ICZM of the Lazio Region that provides further information on ICZM in this area. The same site also includes an interactive “forum on the coast” aiming to involve citizens and stakeholders to provide opinions on the coastal manage-ment and in particular in indicating particular meteo-marine and erosive events along the Lazio coastline.
1c Operating entity Direzione Regionale Ambiente - Gestione Aree Marine Protette (Regional Environment Department – Management of Marine Protected Areas) of the Lazio Regional Authority
1d Management struc-ture
Centro di Monitoraggio per la Gestione Integrata della Zona Costiera (Monitoring Centre for Integrated Coastal Zone Mana-gement)
Direzione Regionale Ambiente - Gestione Aree Marine Protette (Regional Environment Department – Management of Marine Protected Areas)
1d Contacts
Paolo Lupino; e-mail: [email protected];
Silvia Bellacicco; e-mail: [email protected]
Monitoring Centre for Integrated Coastal Zone Management Regional Environment Department – Management of Marine Protected Areas Lazio Region
Web-GIS: http://80.94.113.69/cmg_segnalazioni/
21807-REL-T002.1 page 164/337
CMGIZC Web-Site: http://www.cmgizc.info/
1e Typology Operational
2 Operational context and information content
2a ICZM dimensions CMGIZC Web-GIS mainly addresses two of the five considered information dimensions. The environment and the territory di-mensions are in depth developed.
2b ICZM Sectors
Data/cartographic information included in web-GIS CMGICZ are related to the main following topics:
- Basic cartographic maps;
- Topography;
- Bathymetry;
- Rivers, canals, lakes, and other hydrologic layers;
- Use of the coast (2004-2005);
- Administrative boundary;
- Shoreline in different years (1944, 1955, 1990, 1992, 1994, 1996, 1998, 2002, 2005);
- Marine habitat (such as nursery areas and seagrass meadows)
- Coastal and marine protected coastal area;
- Underwater cables;
- Limitation of the sea use (e.g. military zones and no fishing areas);
- Typology of marine sediments, including potential mining areas;
- Coastal defence interventions;
- Ortophotos;
- Digital Elevation Model.
2c Integration No specific integration among information is directly provided.
2d Spatial scale Sub-National – Coast of Lazio Region along the Italian Tyrrhe-nian coast.
2e Flexibility The web-GIS was developed in order to be applied to the spe-cific coastal territory of Lazio Region.
3 ICZM functionalities
3a Knowledge related functionalities
CMGIZC Web-GIS provides some of the knowledge related functionalities considered by the analysis, specifically:
- Availability of spatial data; the system is designed to share some of the geographic data through Web Map Service
21807-REL-T002.1 page 165/337
(WMS). To support data sharing, the Web-GIS provides a direct link for the download of the GAIA software; this is a free software that can be easily used to visualise spatial data through WMS (and other similar protocols) from a cli-ent desktop. The Web-GIS also provides a clear help sup-porting the use of GAIA;
- Operation at the different spatial scale; some of the avail-able spatial data can be re-scaled according to the con-sidered spatial extent; thus enabling to visualize more de-tails at a higher scales (e.g. coastline and bathymetric line);
- Availability of multi-time data, such as in the case of coast-line in nine different years (from 1944 to 2005) enabling to evaluate the evolution of the coastal system.
3b Process related func-tionalities
CMGIZC web-GIS provides some of the process related func-tionalities considered by the analysis, specifically:
- Problem understanding and structuring; CMGIZC Web-GIS’s structure is well articulated and complete, thus ena-bling users to easily find data and information and relate the same to specific issues. Thus CMGIZC Web-GIS is well-shaped for problem understanding and structuring, as well as coastal management and planning at the sub-national level.
Furthermore, a new function called “Calcolo della linea di costa” (Calculation of the coastline) has been recently im-plemented in the web-GIS. This new tool enables the user (including no-expert ones) to calculate the morphological evolution of the coastline within a specific period a for se-lected coastal area. As results, the tool generates a graph representing the loss or the acquired volume (sedimenta-tion/erosion budget) for the selected zone and period. The user can also export the linear evolution of the coast in a couple of format.
- Stakeholder involvement and participation; the web-GIS. Includes a specific tool (recently implemented) allowing the user to enter georeferred observations, for example concerning the erosion problem. The design and imple-mentation of the new tool has been funded and by the MedLab European Project. The final aim is to involve citi-zens and stakeholders who can report relevant erosion, weather, marine and environmental events along the coastline.
The web-site hosting the CMGICZ includes also web coastal forum aiming to involve citizens and stakeholders to provide opinions on the coastal management and in par-ticular in indicating particular meteo-marine and erosive events along the Lazio coastline.
4 Users
4a User typology The broad nature of this web-GIS is intended for anyone who may be interested in the Lazio region coastal and marine infor-mation. For this reason potential users are:
21807-REL-T002.1 page 166/337
- Policy-makers;
- Decision-makers;
- Coastal planners and/or managers;
- Specialised and expert users.
- Civil society.
5 Use of the system
5a Accessibility Free access on-line to the complete web-GIS and related tools
5b User-friendliness
Highly user-friendly.
This web-GIS is built around an interactive map very easy to browse, which allows anyone to identify, visualize those da-tasets relevant to their interest. The new implemented tool for the calculation of the morphological evolution is easy and friend-ly to use (based on a Wizard solution). The system is only in Italian.
5c Interactiveness
The web-GIS and the related web-site of the “Monitoring Centre for Integrated Coastal Zone Management” include two tools specifically aiming to enhance stakeholder involvement and in-teraction.
The first one (recently implemented) allows the user to enter georeferred observations, for example concerning erosion, weather, marine and environmental problems and events occur-ring along the coastline.
The second tool is a web coastal forum aiming to involve citi-zens and stakeholders in providing and discussing opinions on integrated coastal management, in particular in relation to the main relevant problems for the Lazio Region (such as erosion).
5d Data access
The system is designed to share some of the spatial data through Web Map Service (WMS); this can for example visual-ised thought the freely acquirable GAIA software. Spatial data can not however be downloaded.
A specific functionality enables the user to create customised maps, that can exported in pdf format
At the moment the access at the metadata information is not al-lowed because the metadata description is under construction.
6 Technological characteristics
6a Used technology
The web-GIS is developed with MapGuide. MapGuide is an Open Source web-based platform that enables users to develop and deploy web mapping applications and geospatial web ser-vices.
6b Integration with other tools
No specific integration with other tools.
21807-REL-T002.1 page 167/337
6c Integration with other CIS
The web-site of the Monitoring Centre for Integrated Coastal Zone Management provides the link to other two small web-GIS specifically focusing on two naturalistically and tourism relevant islands of the Lazio Region: Ponza and Ventotene.
The web-GIS Lazio Region is included in the BEACHMED-e (Strategic management of beach protection for sustainable de-velopment of Mediterranean coastal zones) project web-site. The other web-GIS connected inside the BeachMed-e projectare:
- Emilia Romagna Region web-GIS;
- Liguria Region web-GIS;
- Toscana Region Web-GIS;
- Catalunya Web-GIS.
6d Interoperability
High.
Most of the dataset included in this Web-GIS are available via WMS. This guarantees a high interoperability of the system.
The structure of the data complies with the directive INSPIRE.
At the moment the access at the metadata information is not allowed because the metadata description is under construc-tion. However the metadata will comply with the requirements of Inspire Directive.
7 Cost/resources
7a Resources Currently web-GIS's maintenance involves one full-time person and two part time (50%) persons
Information sources for the overview analysis of Web-GIS Lazio Region:
Bratti A., 2009. Presentation “Lazio Region’s experience in the sharing of geographical
digital data for the Integrated Coastal Zone Management”. A day for a cartography systems
to damage Coastal Zones. 10 December 2009 - Provence-Alpes-Côte d’Azur.
Lupino P., 2010. “A living lab experience in the integrated coastal zone management”. Pro-
ceedings of the ESA Conference “Work shop of the MEDLAB - pilot project” Frascati 10 Ju-
ly 2010.
Web-site consultation:
http://www.beachmed.it/; last visit on 23/02/2011 at 15.00.
http://www.cmgizc.info/; last visit on 06/04/2011 at 15.00.
http://80.94.113.69/cmg_segnalazioni/; last visit on 06/04/2011 at 18.00.
21807-REL-T002.1 page 168/337
3.33 Web GIS Coast of the Campania Region
1 General Information
1a Name Web GIS Coast of the Campania Region
1b Description
The Soil Protection Department of Campania Region in the South of Italy has developed a Web based GIS related to coastal man-agement. The system has been developed taking into account the critical issues of the addressed coastal area, mainly affected by erosion for long tracts of its beaches, coastal stability problems, problems related to the presence of port activities and coastal pro-tection structures.
In this perspective, Regional river basin authorities are also work-ing on the preparation of plans to contrast coastal erosion, aiming at identifying coastal areas at risk and establishing guidelines for the implementation of coastal engineering interventions mainly for the high priority areas, with critical environmental problems.
The Web-GIS provides a tool for the Campania Region and other authorities to analyse the evolution of above critical issues, plan monitoring activities and interventions for coastal protection. This tool was developed within a “twinning project” (A.G.I.R.E. POR) between the Campania Emilia-Romagna Regions aiming at trans-ferring a procedural model for the development of an Information System of the Coast in support of integrated management and planning of coastal areas.
1c Operating entity Soil protection Department of Campania Region
1d Management structure
Soil protection Department of Campania Region
1e Contacts
info mail: [email protected]
Difesa del Suolo Regione Campania Via De Gasperi n 28 - 80133 Napoli
Web-GIS: http://www.difesa.suolo.regione.campania.it/content/view/20/36/
1f Typology Operational
2 Operational context and information content
2a ICZM dimensions
The Web-GIS mainly focuses on problems regarding coastal mor-phology and related coastal protection. Therefore, the Web-GIS considers two of the five analysed ICZM dimensions: territory and environment.
2b ICZM Sectors Spatial data are structured in the following main groups: Cartographic basic information: - Digital Elevation Model

21807-REL-T002.1 page 169/337
- Administrative boundaries - Coastline evolution - Territory - Coastal protection structures - Bathymetry - Geomorphology - Hydrodynamics - Land use - Landslides (IFFI project dataset) - Orthophotos
2c Integration No specific integrated information among different data is directly provided within the system
2d Spatial scale Sub-national scale – Coastal area of the Campania Region
2d Flexibility
The Web-GIS was designed and developed on the basis of the conceptual and procedural model used by Emilia Romagna Re-gion to implement its own CIS. Knowledge transfer has been one of the activity of the A.G.I.R.E. POR project. In particular, main ob-jective of this project was the transfer of a procedural model for the development of an Information System of the Coast in support of management and planning of coastal areas.
3 ICZM functionalities
3a Knowledge related functionalities
The Web-GIS provides only some of the considered ICZM knowledge related functionalities:
- Availability of spatial data; the system is designed to share geographic data through Web Map Service (WMS);
- Operation at the different spatial scale; some of the available spatial data can be re-scaled according to the considered spatial extent; thus enabling to visualize more details at a higher scales;
- Some multi-time data and information are available, e.g. for the coastline evolution, land use and orthophotos at differentyears. These information provides useful data to monitor the coastal evolution process and related problems.
3b Process related functionalities
The Web-GIS does not contain ICZM process related functionali-ties. Its data can properly support the problem understating and planning of relative solutions in relation to coastal erosion and oth-er problems affecting coastal morphology.
4 Users
4a User typology
Since one of the main objectives of the CIS is to support coastal planning activities, in particular in relation to coastal erosion, the main target users are coastal planners and managers. General users, interested in being informed on coastal protection and evo-lution are also included as target users; easy understandable and accessible spatial layers are in fact available through the CIS.
5 Use of the system
21807-REL-T002.1 page 170/337
5a Accessibility Free access on-line without password to the complete Web-GIS
5b User-friendliness
Highly user-friendly.
The use of the web-GIS on-line is simple and intuitive, also due to the present simple structure and limited contents of the system. Only Italian language is available.
5c Interactiveness No specific e-participation tools are available for interactiveness
5d Data access
From the Web-GIS, maps can be printed and exported in pdf for-mat; however the same tool does not enable to download spatial data.
The system is designed to share spatial data through Web Map Service (WMS); this can for example visualised thought the freely acquirable GAIA software
Very simple metadata are provided for each layer.
6 Technological characteristics
6a Used technology Used technology is MapServer, an Open Source platform for publish-ing spatial data and interactive mapping applications to the web.
6b Integration with other tools
The Web-GIS includes data of the IFFI Project (Inventory of land-slide phenomena) for the Campania Region, displaying landslide areas within 1km from the coast.
6c Integration with other CIS
No direct integration with other CIS is provided. The Soil Protec-tion Department of the Campania Region has developed other Web-GIS that however are not directly to the Web-GIS coast. The-se for example includes:
Web-GIS on interventions for soil protection;
Web-GIS on geological and geomorphological characteris-tics;
Web-GIS on the Regional Territory Plan.
6d Interoperability
Medium
Spatial data can be share and visualised through Web Map Ser-vice. This guarantees a high interoperability of the system in rela-tion to data sharing. However, currently only very simple metadata (not meeting INSPIRE protocols) are provided
7 Costs/Resources
7a Resources
Web-site consultation:
http://www.difesa.suolo.regione.campania.it/content/view/71/86/. Last visit on
24/02/2011 at 12.30
21807-REL-T002.1 page 171/337
3.34 Coastal and marine information system of Emilia Roma-gna Region
1 General Information
1a Name Coastal and marine information system of Emilia Romagna Region (CIS of Emilia Romagna)
1b Description
Since 2002 the Emilia-Romagna Region has been involved in ICZM and quickly grasped the need for tool that would facilitate the man-agement of data and enable an increased knowledge of coastal is-sues.
The Coastal and marine information system of Emilia Romagna Region has been implemented within the EU CADSEALAND (Land-sea interaction: coastal state and evolution in CADSES) (2004-2006) project and it has been designed following the guidelines is-sued by European Commission within the EUROSION programme(EU commission, 2004). After the CADSEALAND project, Emilia Romagna Region was involved in the EU funded PlanCoast project (2006-2008). Within the activities of that project, the CIS of Emilia Romagna was updated to further support coastal and marine spa-tial planning, too. PlanCoast also foresaw the use of the CIS of Emilia Romagna to define a conceptual framework for the Ferrara coastal area (included in the Emilia Romagna Region) in order to identify and evaluate coastal vulnerability and to define criteria and objectives for territorial programming and planning.
The CIS contains data collected by different Institutions during the last 100 years and several GIS products (maps) resulting from sur-vey activities and from studies recently carried out by the Geologi-cal, Seismic and Soil Survey of the Emilia Romagna Region. This CIS refers to the whole Emilia-Romagna coastal zone. This CIS is continuously updated and represents a fundamental support for de-cision makers and coastal planners dealing with ICZM.
Actually the CIS of Emilia Romagna is undergoing further imple-mentation and upgrades within the EU project MICORE (Morpho-logical Impacts and Coastal Risks induced by Extreme storms events – 2008 – 2011). The general aim of this project is to develop and test online tools for reliable predictions of the morphological impact of marine storm events in support to civil protection mitiga-tion strategies.
This CIS also includes a Web-GIS component, enabling the on-line publication of part of the spatial data contained in the off-line GIS. The Web-GIS will in particular support diffusion and share of data among the peripheral structures of the Emilia Romagna Region.
1c Operating entity Servizio Geologico, Sismico e dei Suoli (SGSS) - Emilia Romagna (Geological, Seismic and Soil Survey – Emilia Romagna Region)
1d Management struc-ture
Geological, Seismic and Soil Survey of Emilia Romagna Region
21807-REL-T002.1 page 172/337
1e Contacts
Luisa Perini, e-mail: [email protected]
Geological, Seismic and Soil Survey Regione Emilia-Romagna Viale della fiera 840127 Bologna, Italy
Web-GIS: http://geo.regione.emilia-romagna.it/costa/viewer.htm
Web-site of the site of Geological, Seismic and Soil Survey: http://www.regione.emilia-romagna.it/wcm/geologia_en/index.htm
1f Typology Operational
2 Operational context and information content
2a ICZM dimensions
This CIS addresses four of the five ICZM dimension: territory, envi-ronment, economy and society. The environment and the territory dimensions are in-depth developed. The economic dimension main-ly refers to information related to tourism and fishing activities. Few social information are available in the CIS; i.e. density population.
2b ICZM Sectors
This CIS has been designed following the guidelines issued by EC within the EUROSION programme (EU commission, 2004). Conse-quently, the CIS is organized according to these ten thematic top-ics:
- Topography (e.g. orthophotos, DEM, bathymetry);
- Geomorphology, geology and sedimentology;
- Hydrodynamics (e.g. waves, tides, current);
- Land cover;
- Administrative boundaries (provincial and municipal bounda-ries);
- Demography (e.g. population density and touristic fluxes);
- Heritage and protected Areas (e.g. Natura 2000 sites);
- Economic information (e.g. tourism infrastructure, fishing li-cense);
- Coastal defences; i.e. database containing the works of coastal defences;
- Sea Uses (e.g. pipelines, offshore plants, area for sand extrac-tion).
The Web-GIS component currently includes a sub-set of all data available in the off-line version.
2c Integration
This CIS is mainly developed like an operative tool. The aim is to collect and organize the data of the coastal environment. In addi-tion, a large amount of data available makes it possible to define the state of the coastal vulnerability and the coastal risk manage-ment through integration of different layers or comparative analysis of the available data.
In particular, the CIS is currently supporting MICORE project, deal-ing with integrated analysis of data to evaluate morphological im-pacts of marine storm events in support to civil protection mitigation strategies. The project is specifically targeted to contribute to the
21807-REL-T002.1 page 173/337
development of probabilistic mapping of the morphological impacts of marine storm and the production of early warning and information systems to support long-term disaster reduction.
2d Spatial scale
Sub-National scale – Coast of the Emilia Romagna Region.
This CIS covers the whole coast of the Emilia-Romagna region; a 130 km coastline along the Adriatic Sea, from the Goro Po mouth to the Gabicce village. The distinctive element of this coast is the beach, produced by the interaction, over a long period of time, be-tween sediment carried to the sea by rivers, redistribution and dep-osition by the waves and marine currents and the modelling action of the wind.
2e Flexibility
This CIS has not been developed in order to be specifically applied to other coastal territories. However, its conceptual and procedural model has been used to support the design of the Campania Re-gion CIS, within the twinning project A.G.I.R.E. POR.
3 ICZM functionalities
3a Knowledge related functionalities
This CIS provides some of the ICZM knowledge related functionali-ties considered by the analysis, specifically:
- Integration among different information sectors. CIS of Emilia Romagna Region for example includes maps of coastal vul-nerability to erosion, integrating information related to three main aspects: geomorphology, coastal evolution and human impact. Coastal vulnerability issue is further studied in the MICORE project (see 2c);
- Availability of spatial data. Currently the Web-GIS component still does not allow spatial data downloading; this functionality will be implemented in the near future;
- Operation at the different spatial scale; some of the available spatial data can be re-scaled according to the considered spa-tial extent; thus enabling to visualize more details at a higher scales;
- Availability of multi-time data: multi-time data are for example available for the shoreline position (six years within the 1953 –2006 period) for data related to storm events.
- This CIS does not specifically address coastal vulnerability to climate change, at the moment. MICORE project could deter-mine also improvement related to this point.
3b Process related functionalities
This CIS provides some of the processes related functionalities considered by the analysis, specifically:
- Problem understanding and structuring. This CIS was used within the CADSEALAND project to generate an integrated model of the Emilia Romagna coastal zone, related to: geo-morphology, infrastructure, bathymetry, waves and currents. These model and related results enabled to re-construct the historical evolution of coastal morphology. Indeed, erosion and morphological process in general are key topics for the coastal management of the Emilia Romagna Region. Furthermore, the CIS includes a GIS tool, called DSAS - Digital Shoreline Anal-
21807-REL-T002.1 page 174/337
ysis System (developed by the USGS) used to generate 3D morphological models of the shoreline and assess the 3D evo-lution in different time period.
- Monitoring and evaluation, adaptive planning and manage-ment. This CIS includes a database of coastal defence inter-ventions and measures. This Database contains technical da-ta about coastal defence infrastructure and data related to the assessment of the effects (or the impacts) induced on the coastal morphology. This Database, integrated with the CIS spatial data, supports the evaluation of coastal defence strate-gy and the relative adaptive planning and management.
4 Users
4a User typology
The complete version of this CIS is specifically dedicated to the staff of the Geological and Seismic Service of the Soil that has the credits to access to the system.
The web-GIS is freely accessible to all the citizens.
The on-going activities of the MICORE projects and the related re-sults (data and tool) are also targeted to the Italian Civil Protection, for the management and mitigation of coastal risks.
5 Use of the system
5a Accessibility
This CIS is completely accessible only to the staff of the Geologi-cal and Seismic Service by an Intranet connection.
The web-GIS component is freely accessible on line and makes available part of the information included in the off-line CIS.
5b User-friendliness
The Web-GIS is highly user-friendly.
Use of off-line system is technically demanding and specifically addressed to expert users. Web-GIS is only in Italian, all related documentation are also in English.
5c Interactiveness
The system includes a Web-GIS component, accessible to all on-line users. However, no other specific e-participation tools are in-cluded in the Web-GIS.
Future implementation should develop and activate an interface to collect and exchange data with web users.
5d Data access
Currently, the Web-GIS does not allow spatial data downloading. Static maps in pdf format can be created and exported. Future de-velopment also includes the implementation of data downloading functions.
Metadata are provided in the Web-GIS. Indeed the same can be used to query the available layers and visualise those correspond-ing to the defined selecting criteria.
6 Technological characteristics
6a Used technology This CIS is developed with ESRI GIS software. All data are stored and managed by Oracle; ArcSDE technology links the Oracle da-tabase with ESRI GIS software.

21807-REL-T002.1 page 175/337
The present hardware solution is quite simple. It is based on two servers: an internal server for processing, updating and validating data and another WEB server for data publication.
6b Integration with oth-er tools
This CIS is an integrated with the following tools:
- The SGSS Centralized Information System, making available raster and vectorial data for the GIS;
- DB-Sea-storm; database of historical data on storminess and related meteorological data;
- Some operational models like SWAN and ROMS, used to provide information regarding the forecast and hindcast of sea state and circulation;
- Xbeach model (DELFT Hydraulics) for the sea-storm events modelling. Xbeach is a two-dimensional model for wave propagation, long waves and mean flow, sediment transport and morphological changes of the near shore area, beaches, dunes and back barrier during storms
Some specific tools are implemented by this CIS, including:
- the Repository Manager; tool for the management of the Metadata collected respecting the ISO 19115;
- Database of the coastal defences measures and interven-tions (such as nourishment).
6c Integration with oth-er CIS
No specific integration with other CIS
6d Interoperability
High
The use of standard protocols (according to the Inspire Directive) for data management guarantees a high interoperability of the sys-tem. The data acquired were georeferred according to the WGS84 system (or ETRS98) as outlined in EU directives (INSPIRE) and subsequently converted to the regional georeference system.
7 Cost/Resources
7a Resources
10 persons are involved in the CIS of Emilia Romagna Region and related hardware and software management. 5 of them are specif-ically dedicated to CIS operation and 5 others to technological support (likely serving also other services).
21807-REL-T002.1 page 176/337
Information sources for the overview analysis of CIS of Emilia Romagna Region:
Bortone G., 2008. ”La Gestione Integrata delle Zone Costiere nel Mediterraneo”. Presented
in the conference: “Temi strategici per la protezione dell’ambiente e la promozione di uno
sviluppo territoriale sostenibile dello spazio MED” in Bologna 26 October 2008.
Perini 2007.“Il Sistema Informativo della Costa e i prodotti cartografici di supporto agli studi
e alle strategie di difesa”. “Ambiente e territorio”.
Perini L. e Calabrese Lorenzo, 2009. Il sistema mare-costa dell’Emilia-Romagna. Pen-
drangon (Regione Emilia Romagna, 2010).
Montaguti M. 2008. Developing the new Geographic Information System for the Servizio
Geologico, Sismico e dei Suoli, Regione Emilia-Romagna.
Web-site consultation:
http://geo.regione.emilia-romagna.it/costa/viewer.htm; last visit on 07/02/2011 at 16.30.
http://www.regione.emilia-
romagna.it/wcm/geologia/canali/cartografia/sito_cartografia/web_gis_costa.htm; last visit
on 07/02/2011 at 13.30.
21807-REL-T002.1 page 177/337
3.35 CISs of Venice Lagoon
Venice Lagoon is a complex and multi-functional coastal system that has been widely studied
and monitored for the great majority of its natural and anthropogenic components. The high
number of researches, studies and projects have generated an incredible amount of data and
information. These are organised in various information systems, only partially integrated
among each other, operated and managed by a variety of public and private subjects. In rela-
tion to the objectives of the “Options for coastal information system” project, two principal CISs
have been considered, being these the more completed and structured ones as well as those
strictly related to a concrete use within coastal zone planning and management. The two sys-
tems are:
The GIS tools of the Information Service of the Venice Water Authority (SINFO CIS);
The Atlas of the Venice Lagoon (SIL Venice) of the Municipality of Venice.
The two systems have different scopes and uses, that actually integrate each others’ ones.
The Information Service was set up in February 1984, implementing the first convention
signed between the Venice Water Authority and the Consorzio Venezia Nuova (in the context
of the first Special Law no. 171/1973 which established the principle that safeguarding of Ven-
ice was a matter of "priority national interest”). Main tasks of the Information Service were and
still are to generate, collect, classify and archive data and information on the lagoon environ-
ment and the related human activities. These data and information are used to support other
bodies operating in the Venice Lagoon (mainly the Venice Water Authority) in dealing wit the
assessment of the state of the system and the causes of the environmental and morphological
deterioration, as well as with the definition of safeguard plans of interventions (defence from
high waters, defence from sea storms and environmental protection) and its monitoring.
The Atlas of the Venice Lagoon was initially (2006) created by the Venice Municipality as a
collection of maps produced by other bodies. Subsequently the Atlas evolved in an on-line
Web-GIS, mainly to provide free access – to any user – to data and information generated by
various data producers, including the same Venice Water Authority and the related Information
Service. The two main Atlas objectives are to provide support to the Venice Municipality in
dealing with the Venice Lagoon management and to share and diffuse spatial data to interest-
ed users, including other public institutions, citizens and professionals. The Atlas gives also
much relevance to the INSPIRE Directive, aiming to meet related requirements.

21807-REL-T002.1 page 178/337
1 General Information
1a Name GIS tools of the Information Service of the Venice Water Authority (SINFO CIS).
1b Description
SINFO CIS refers to a set of GIS-based and related (database, models, decision support systems) tools developed by the “Servizio Informativo” (Information Service) of the Venice Magistrato alle Ac-que di Venezia (Venice Water Authority - MAV), in order to support the management and safeguarding activities of the Venice Lagoon implemented by the same MAV through it concessionary Consorzio Venezia Nuova.
Main purpose of the MAV Information Service is the organization of data and their integrated analysis in order to provide scientific-based information to support the management and safeguarding of the Venice Lagoon. Specifics objectives can be summarized as fol-lows:
- provide the knowledge base to define the state of the system, identify the causes of degradation and plan actions to safe-guard and related monitoring;
- Organise and make easily accessible and understandable the wide and complex set of data and information available on the Venice Lagoon and its territory,
- Standardize the used observation and measurement method-ology;
- Facilitate the technical collaboration among different institu-tions.
The activities of the MAV Information Service started in 1984. First period of activity mainly focused on collection and quality check of available documentation and creation of the Geographic Information System of the Venice Lagoon territory. The second period (started approximately in 1990) started addressing Venice Lagoon prob-lems. This implied the further development of the GIS tools as well as of other integrated tools, including models, specific software and various decision support systems. The third period (relative to re-cent years) is characterized by an operational dimension, directly serving institutions, where the activities are part of the production processes. The results of these activities were complementary and mutually reinforced by those reached by MAV through its conces-sionary the “Consorzio Venezia Nuova”,.
Several institutions have collaborated with the MAV Information Service in the acquisition of data included in the SINFO CIS; e.g.
- Veneto Regional Authority;
- Provincial and municipal Authorities of the Veneto Region;
- Universities of the Veneto Region;
- The Italian National Research Council (CNR);
- The National Institute of Statistics (ISTAT)
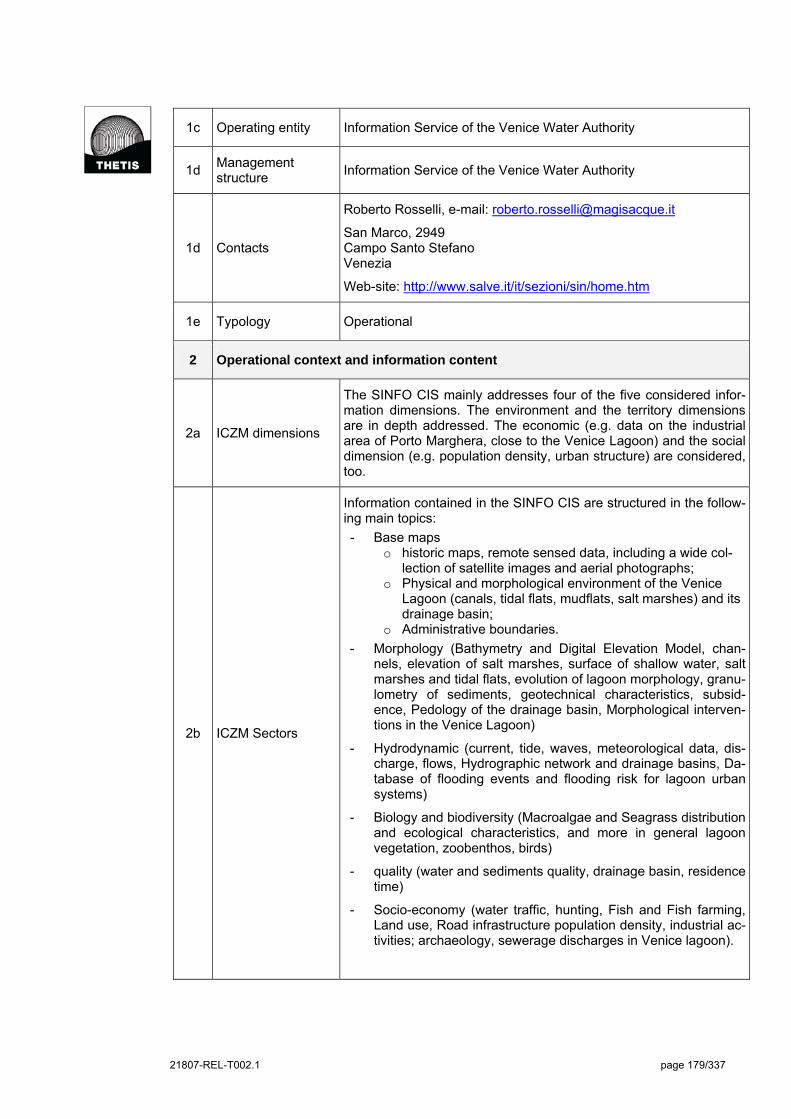
21807-REL-T002.1 page 179/337
1c Operating entity Information Service of the Venice Water Authority
1d Management structure
Information Service of the Venice Water Authority
1d Contacts
Roberto Rosselli, e-mail: [email protected]
San Marco, 2949 Campo Santo Stefano Venezia
Web-site: http://www.salve.it/it/sezioni/sin/home.htm
1e Typology Operational
2 Operational context and information content
2a ICZM dimensions
The SINFO CIS mainly addresses four of the five considered infor-mation dimensions. The environment and the territory dimensions are in depth addressed. The economic (e.g. data on the industrial area of Porto Marghera, close to the Venice Lagoon) and the social dimension (e.g. population density, urban structure) are considered, too.
2b ICZM Sectors
Information contained in the SINFO CIS are structured in the follow-ing main topics:
- Base maps o historic maps, remote sensed data, including a wide col-
lection of satellite images and aerial photographs; o Physical and morphological environment of the Venice
Lagoon (canals, tidal flats, mudflats, salt marshes) and its drainage basin;
o Administrative boundaries.
- Morphology (Bathymetry and Digital Elevation Model, chan-nels, elevation of salt marshes, surface of shallow water, salt marshes and tidal flats, evolution of lagoon morphology, granu-lometry of sediments, geotechnical characteristics, subsid-ence, Pedology of the drainage basin, Morphological interven-tions in the Venice Lagoon)
- Hydrodynamic (current, tide, waves, meteorological data, dis-charge, flows, Hydrographic network and drainage basins, Da-tabase of flooding events and flooding risk for lagoon urban systems)
- Biology and biodiversity (Macroalgae and Seagrass distribution and ecological characteristics, and more in general lagoon vegetation, zoobenthos, birds)
- quality (water and sediments quality, drainage basin, residence time)
- Socio-economy (water traffic, hunting, Fish and Fish farming, Land use, Road infrastructure population density, industrial ac-tivities; archaeology, sewerage discharges in Venice lagoon).

21807-REL-T002.1 page 180/337
2c Integration
Data and information contained in the set of GIS tools of the MAV Information System have been used, also through models, to sup-port many integrated analysis related to the Venice Lagoon man-agement. Results of these analysis have been often included in the SINFO CIS, e.g.:
- database of flooding events and of urban area affected by flooding risk;
- pollution loads (and relative budget) from the drainage basin;
- maps of the morphological evolution of the Venice Lagoon, al-so including areas subjected to sedimentation or erosion;
- map of the archaeological risk.
Above ones are just some examples of integrated analysis results included in the SINFO CIS. Data and information are also used to produce software and systems directly aiming to support decision making, such as the CRUP system, providing integrated infor-mation supporting the MAV in licensing discharges into lagoon generated by production activities- Other are illustrated in section 6b.
2d Spatial scale Local scale – Venice Lagoon and its drainage basin
2e Flexibility SINFO CIS is developed to address specificities of the Venice La-goon, with particular concern for planning, management and safe-guarding scopes.
3 ICZM functionalities
3a Knowledge related functionalities
SINFO CIS provides some of the knowledge related functionalities considered by the analysis, specifically:
- Integration among different information sectors (see point 2c); this functionality is widely developed;
- Operation at the different spatial scale; great part of the availa-ble spatial data can be re-scaled according to the consideredspatial extent; thus enabling to visualize more details at a higher scales.
- The data and information collected at the local level allows a more general inclusion in a larger scale, thus providing an ad-equate cooperation between different levels;
- Many layers and data present multi-time information. A very in-teresting example is the exhaustive and comprehensive set of historical maps and survey of the Venice Lagoon morphology, enabling to evaluate the long term evolution of the system. Im-portant time series are also available for environmental quality data for various matrixes (those data are contained in a specif-ic database, called BDMA).
3b Process related functionalities
SINFO CIS, and related tools of the Information Service (models, decision support systems, databases), specifically aims to provide scientifically-base information to local decision makers, planners and managers (Venice Water Authority and its concessionary Con-sorzio Venezia Nuova) dealing with the sustainable management of the Venice Lagoon.
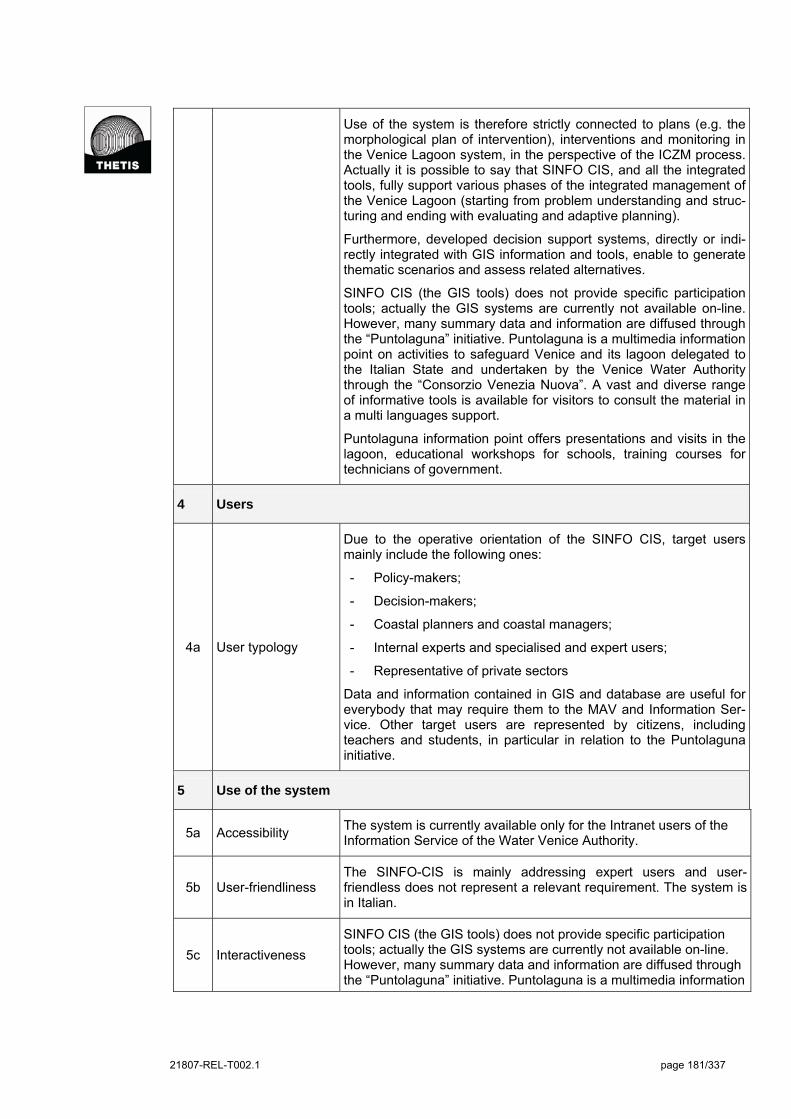
21807-REL-T002.1 page 181/337
Use of the system is therefore strictly connected to plans (e.g. the morphological plan of intervention), interventions and monitoring in the Venice Lagoon system, in the perspective of the ICZM process. Actually it is possible to say that SINFO CIS, and all the integrated tools, fully support various phases of the integrated management of the Venice Lagoon (starting from problem understanding and struc-turing and ending with evaluating and adaptive planning).
Furthermore, developed decision support systems, directly or indi-rectly integrated with GIS information and tools, enable to generate thematic scenarios and assess related alternatives.
SINFO CIS (the GIS tools) does not provide specific participation tools; actually the GIS systems are currently not available on-line. However, many summary data and information are diffused through the “Puntolaguna” initiative. Puntolaguna is a multimedia information point on activities to safeguard Venice and its lagoon delegated to the Italian State and undertaken by the Venice Water Authority through the “Consorzio Venezia Nuova”. A vast and diverse range of informative tools is available for visitors to consult the material in a multi languages support.
Puntolaguna information point offers presentations and visits in the lagoon, educational workshops for schools, training courses for technicians of government.
4 Users
4a User typology
Due to the operative orientation of the SINFO CIS, target users mainly include the following ones:
- Policy-makers;
- Decision-makers;
- Coastal planners and coastal managers;
- Internal experts and specialised and expert users;
- Representative of private sectors
Data and information contained in GIS and database are useful for everybody that may require them to the MAV and Information Ser-vice. Other target users are represented by citizens, including teachers and students, in particular in relation to the Puntolaguna initiative.
5 Use of the system
5a Accessibility The system is currently available only for the Intranet users of the Information Service of the Water Venice Authority.
5b User-friendliness The SINFO-CIS is mainly addressing expert users and user-friendless does not represent a relevant requirement. The system is in Italian.
5c Interactiveness
SINFO CIS (the GIS tools) does not provide specific participation tools; actually the GIS systems are currently not available on-line. However, many summary data and information are diffused through the “Puntolaguna” initiative. Puntolaguna is a multimedia information
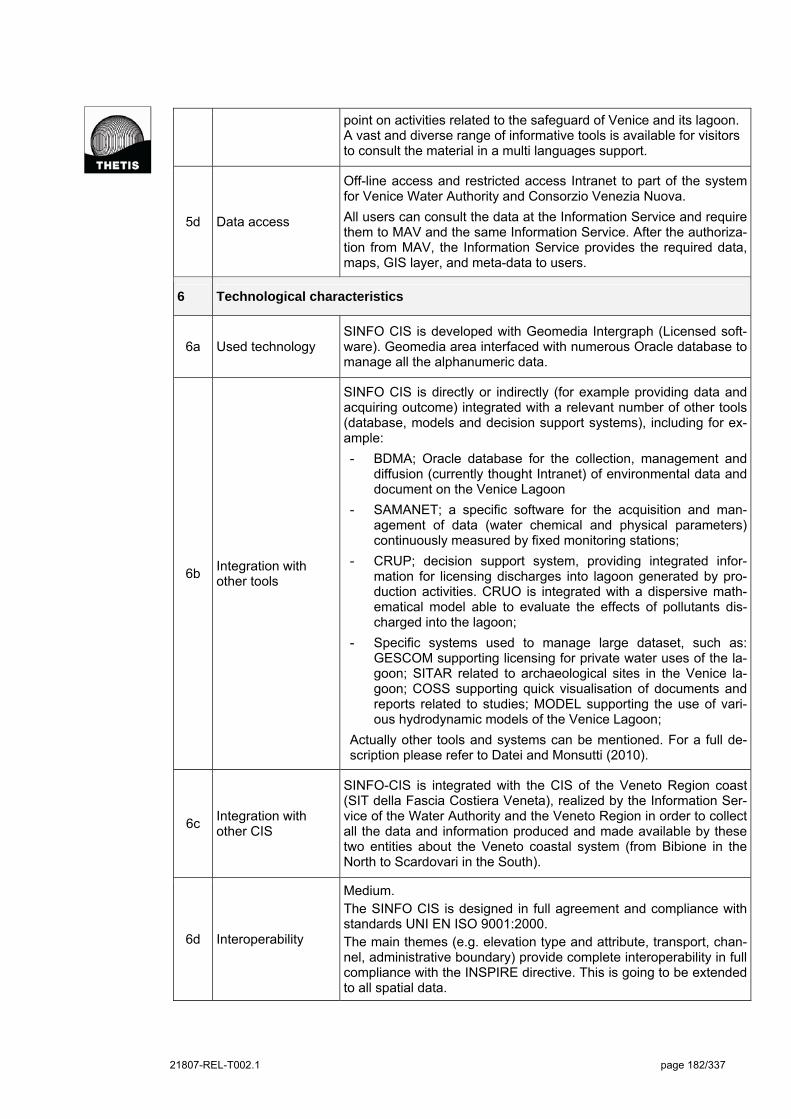
21807-REL-T002.1 page 182/337
point on activities related to the safeguard of Venice and its lagoon. A vast and diverse range of informative tools is available for visitors to consult the material in a multi languages support.
5d Data access
Off-line access and restricted access Intranet to part of the system for Venice Water Authority and Consorzio Venezia Nuova.
All users can consult the data at the Information Service and require them to MAV and the same Information Service. After the authoriza-tion from MAV, the Information Service provides the required data, maps, GIS layer, and meta-data to users.
6 Technological characteristics
6a Used technology SINFO CIS is developed with Geomedia Intergraph (Licensed soft-ware). Geomedia area interfaced with numerous Oracle database to manage all the alphanumeric data.
6b Integration with other tools
SINFO CIS is directly or indirectly (for example providing data and acquiring outcome) integrated with a relevant number of other tools (database, models and decision support systems), including for ex-ample:
- BDMA; Oracle database for the collection, management and diffusion (currently thought Intranet) of environmental data and document on the Venice Lagoon
- SAMANET; a specific software for the acquisition and man-agement of data (water chemical and physical parameters) continuously measured by fixed monitoring stations;
- CRUP; decision support system, providing integrated infor-mation for licensing discharges into lagoon generated by pro-duction activities. CRUO is integrated with a dispersive math-ematical model able to evaluate the effects of pollutants dis-charged into the lagoon;
- Specific systems used to manage large dataset, such as: GESCOM supporting licensing for private water uses of the la-goon; SITAR related to archaeological sites in the Venice la-goon; COSS supporting quick visualisation of documents and reports related to studies; MODEL supporting the use of vari-ous hydrodynamic models of the Venice Lagoon;
Actually other tools and systems can be mentioned. For a full de-scription please refer to Datei and Monsutti (2010).
6c Integration with other CIS
SINFO-CIS is integrated with the CIS of the Veneto Region coast (SIT della Fascia Costiera Veneta), realized by the Information Ser-vice of the Water Authority and the Veneto Region in order to collect all the data and information produced and made available by these two entities about the Veneto coastal system (from Bibione in the North to Scardovari in the South).
6d Interoperability
Medium. The SINFO CIS is designed in full agreement and compliance with standards UNI EN ISO 9001:2000. The main themes (e.g. elevation type and attribute, transport, chan-nel, administrative boundary) provide complete interoperability in full compliance with the INSPIRE directive. This is going to be extended to all spatial data.

21807-REL-T002.1 page 183/337
7 Cost/resources
7a Resources Management of the whole complex set of tools involves twelve full-time persons.
Information sources for the overview analysis of SINFO CIS:
Datei S. and Monsutti G., 2010. Il Servizio Informativo. Conoscenza e Gestione del territo-
rio come risorsa condivisa - The information service. Knowledge and Land Management as
a shared resource. Quaderni del Magistrato alle Acque – Marsilio Editor.
Web-site consultation:
http://www.salve.it/it/sezioni/sin/home.htm; visited on 18/03/2011 at 10.30.
21807-REL-T002.1 page 184/337
1 General Information
1a Name The Atlas of the Venice Lagoon - SIL Venice
1b Description
In 2006 the Atlas of the Venice Lagoon was firstly created by the Venice Municipality as a printed volume (still available on line) includ-ing 103 thematic maps and associated explanations supplied by pub-lic bodies, most of them from Venice Water Authority (Magistrato alle Acque di Venezia). Maps were grouped in five sections: Geosphere, Biosphere, Anthroposphere, Protected Environment and Integrated Analysis. Since February 2011 the Atlas of the Venice Lagoon has become a web portal, allowing access mainly to geographical and environmental data about the Venice Lagoon.
The key objective of the Atlas is to bring together and organise in-formation held and updated by separate data producer bodies; thus various users (citizens, professionals, and various institutions) can refer to a single, shared information base. The Atlas development is based on a cooperative conceptual approach, implying that anyone can share its own data and maps through this tool. Indeed, data and maps contained in both versions of the Atlas (printed and Web-GIS) are generated by a multitude of public bodies, including in particular the Venice Water Authority (Magistrato alle Acque di Venezia) and other bodies such as research institutions (e.g. the Italian National Research Council and the University of Venice), local authorities (e.g. the Venice Municipality), the Veneto Regional Authority and na-tional and international bodies (e.g. the Italian Ministry of the Envi-ronment and EEA).
Venice Lagoon is the specific area of interest of the Atlas; however the Atlas also includes environmental data related to the drainage basin and coastal waters. Data sets collected by the Atlas are ap-proximately two hundreds. This number is growing since new da-tasets are progressively added, in particular through Web Map Ser-vice (WMS) protocols.
1c Operating entity Municipality of Venice
1d Management structure
Municipality of Venice, Environment Department, Observatory of the Lagoon and its Territory (Osservatorio della Laguna e del Territorio).
The Atlas has been developed and is maintained by the staff of Ob-servatory of the Lagoon and its Territory, with the support of the Insti-tute of Marine Sciences of the Italian National Research Council (CNR-ISMAR), based in Venice.
1e Contacts
e-mail: [email protected] Osservatorio della Laguna e del Territorio Environment and Safety Directorate of Land Municipality of Venice Campo Manin, San Marco 4023 30124 Venezia Web Atlas: http://www.silvenezia.it/index.php Venice Municipality Web-site: http://www.comune.venezia.it/ambiente
21807-REL-T002.1 page 185/337
1f Typology Operational
2 Operational context and information content
2a ICZM dimensions
The Atlas mainly addresses four of the five considered information dimensions.
The environment and the territory dimension are in depth developed. Social related information is provided with some layers, including for example naturalistic and historic tourist route, military fortification, transport lines. Some governance information is also included.
2b ICZM Sectors
Data/cartographic information included in Atlas are structured in the following principal groups:
- Base Maps, e.g.: main morphological elements, imageries from several years, national and regional topography;
- Biosphere, e.g.: habitat of the lagoon, coastal vegetation and habitats, distribution of seagrass in the Venice Lagoon, fish farms, survey of ecological status of small islands, diffusion of invasive macroalgae;
- Atmosphere climate, e.g.: maps of air temperature, rainfall and winds in the lagoon and its catchment areas;
- Hydrosphere, e.g.: tides and waves; water temperature, salinity of the Venice Lagoon;
- Lithosphere, e.g. depth of the lagoon in different years, sedi-mentology;
- Protected areas, e.g. Natura 2000 sites, RAMSAR area, boat speed limits defined in protected areas;
- Anthroposphere, e.g.: naturalistic and historic tourist route, his-torical military fortifications, public transport lines in the lagoon; pollutant emissions from major industrial plants;
- Special projects, including: georeferred photographs taken by astronauts from the International Space Station; maps of bio-genic reefs in Venice coastal water the coast of Venice; maps on the morphological evolution of the Lagoon.
2c Integration
The Web version of the Atlas currently does not include layers providing an integrated analysis of sector data. Printed version of the Atlas contains a specific section dedicated to the Integrated Analysis, including for the example the following maps: sustainability indica-tors, cumulative impacts on the Venice Lagoon, conflict among la-goon uses. environmental risk due to heavy metal, salt-marshes functions, etc.
2d Spatial scale
Local scale – Venice Lagoon
Venice Lagoon is the specific area of interest of the Atlas; however the Atlas also includes environmental data related to the drainage basin and coastal waters.
2e Flexibility The Atlas has been developed in order to be applied specifically to Venice Lagoon system.
21807-REL-T002.1 page 186/337
3 ICZM functionalities
3a Knowledge relat-ed functionalities
The Atlas provides some of the knowledge related functionalities considered by the analysis; specifically:
- Integration among different information; the printed version of the atlas includes a significant number of maps related to inte-grated analysis. These are not currently accessible by the Web-GIS;
- Availability of spatial data; some layers are shared via Web Map Server facilities;
- Operation at the different spatial scale; some of the available spatial data can be re-scaled according to the considered spa-tial extent; thus enabling to visualize more details at a higher scales;
- Availability of multi-time data, such as in the case of morpholog-ical maps available for various time steps included in the period 1881 - 2003.
3b Process related functionalities
All data are freely shared by the Web-GIS component of the Atlas and made available to users. Indeed users can through the Atlas generate customised maps that can be used to support problem un-derstanding. Furthermore, the information of Atlas is clearly struc-tured in homogenous groups, thus providing a general conceptual modelling of the Venice Lagoon system.
The main goal of the Atlas is to collect and share data on the Venice Lagoon, rather than supporting a specific planning or managing ac-tivity. In this perspective the totally accessible Atlas represents a par-ticipation tool, providing the possibility to use all available data.
Moreover, through a specific functionality (using a lagoon map inter-face) users can enter georeferred naturalistic observations (such as evidence of bird presence, invasive species indication, etc.). In asso-ciation to the indication of the observation, users can provide video, photos or descriptions thought a proper sheet. Currently this tool is being tested.
4 Users
4a User typology
The Atlas offers a series of customizable maps that may results in being useful for various users:
- Coastal planners and/or managers;
- Specialised and expert users;
- Teachers and students;
- Citizens and citizens’ associations.
5 Use of the system
5a Accessibility Free access on-line (access allowed to all users with or without password) to the complete Atlas.
5b User-friendliness Highly user-friendly
The system is very easy to use. It is very user-friendly and it offers a
21807-REL-T002.1 page 187/337
clear explanation of all the functionalities that can be activated by the interactive screen. The Web Atlas is available both in Italian and English.
5c Interactiveness
The Atlas development is based on a cooperative conceptual ap-proach, implying that anyone can share its own data and maps through this tool.
The Atlas enables data producers to share its own spatial data through WMS in a unique Web-GIS environment. Data are stored physically in the data producer’s servers The WMS service allows to publish data in the Web-GIS component of the Atlas and visualize them in combination with data provided by other producers. Data providers have the responsibility to: update and quality check the da-ta, provide relative metadata description (through a metadata sheet), specify the legend of the spatial data. This sharing modality is cur-rently used by a limited number of data producers.
Interactiveness is also provided through a specific functionality (using a lagoon map interface) enabling users to provide georeferred natu-ralistic observation (see 3b).
5d Data access
The Atlas enables to:
- Generate customised maps and export them in pdf format;
- Access and directly visualise on his own computer some layers through the Web Map Service functionality;
- Visualise a comprehensive and explanatory metadata sheet for all available layers.
6 Technological characteristics
6a Used technology
All the web-portal of the Atlas of the Venice is developed using open source technologies:
- WebGIS: Pmapper
- Database: PostgreSQL, PostGIS;
- Server: Ubuntu, Apache, Tomcat; Map engines: Mapserver, Geoserver.
6b Integration with other tools
Integration with other tools is particularly developed, since the Atlas mainly visualise and share data provided by various institutions. In particular:
- The Atlas enables data producers to share its own spatial data through WMS in a unique Web-GIS environment (see 5c). This sharing modality is currently used by a limited number of data producers (basically the Institute of Marine Sciences of the Ital-ian National Research Council);
- The Atlas is connected to the Web Map Service of the National Cartographic portal;
- The Atlas integrates output of models of temperature and salini-ty in the Venice Lagoon, operated the Institute of Marine Sci-ences of the Italian National Research Council (CNR-ISMAR), based in Venice.;
- The Atlas is connected to the European Pollutant Release and

21807-REL-T002.1 page 188/337
Transfer Register (E-PRTR). This catalog is the new Europe-wide register that provides easily accessible key environmental data from industrial facilities in European Union Member States.
6c Integration with other CIS
The Atlas is not directly integrated with other CIS. However, as pre-viously described, the Atlas includes maps provided by a wide variety of institutions. In particular, many data are provided by the Infor-mation Service (SINFO CIS) of the Venice Water Authority.
6d Interoperability The Atlas provides complete interoperability of spatial data between the various European levels and sectors of Public Administration in full compliance with the INSPIRE directive.
7 Cost/Resources
7a Resources
The management of the Atlas of the Venice Lagoon involves two staff persons (half-time) of the Observatory of the Lagoon and its Territory of the Venice Municipality. Internal effort is supported by ex-ternal resources. Two consultants provide their service in relation to computer and technical GIS aspects; their commitment on the Atlas management is estimated to be about 20% of the comprehensive working time of each consultant.
Information sources for the overview analysis of Atlas of the Venice Lagoon:
Wright, D.J., Dwyer, N., Kopke, K., and O’Dea, L., 2010. Report of International Coastal
Atlas Network Workshop 4: Formalizing the Network, Engaging the Mediterranean,
UNESCO International Centre for Theoretical Physics, Trieste, Italy, 16-20 November
2009. Available online at http://ican.science.oregonstate. edu/ican4_final_rpt
Web-site consultation:
http://www.silvenezia.it/index.php; last visit on 19/03/2011 at 15.00.
http://www.ismar.cnr.it/products/data-base/atlas-lagoon-of-
venice/index.html%20?set_language=en&cl=en; last visit on 21/03/2011 at 12.00.
21807-REL-T002.1 page 189/337
3.36 Gulf of Gera Coastal Information System
1 General Information
1a Name Gulf of Gera Coastal Information System
1b Description
The Gulf of Gera CIS was developed within the Ditty Project (2003-2005) - Development of an Information Technology Tool for the Management of European Southern Lagoons under the influence of river basin runoff (funded by the Fifth Framework Program, Energy, Environment and Sustainable Development). The general objective of the Ditty Project was the development of information technology tools integrating databases, geographical information systems (GIS), mathematical models and DSS (Deci-sion Support Systems) to support the management of southern European coastal lagoons and adjacent watersheds, within the spirit of the Water Framework Directive.
Gulf of Gera was included as one of the test site of the project. The final result of the case study was a CIS including a database, a GIS component and mathematical models (coupled river basin-coastal lagoon models).
The study also generated a DSS meant to allow simulation of dif-ferent scenarios and to help policy and decision makers for as-sessing the effectiveness of measures designed to achieve goodquality status of waters and a sustainable use of resources, in relation to the Water Framework Directive. Scenarios were de-fined with stakeholders, addressing issues such as population growth, change in land use or resource exploitation, dredging operations and water reuse. Effects of climate change were also considered.
1c Operating entity
The system was developed by the Municipality of Gera and by the School of Environmental Sciences of the University of Aege-an.
The system is not on-line anymore. Municipality of Gera and the School of Environmental Sciences of the University of Aegean are still the contact points.
1d Management struc-ture
1d Contacts
George Sirtis, e-mail: [email protected]
University of the Aegean Department of Marine Science University Hill postal code 81100 MITILENE
Web-site: http://www.gera.gr/index.html
1e Typology Operational
The system is not on-line anymore.
21807-REL-T002.1 page 190/337
2 Operational context and information content
2a ICZM dimensions
The Gulf of Gera CIS addresses four of the five considered in-formation dimensions.
The environment and the territory dimension are in depth devel-oped. The economic information in the system is provided with some layers regarding aquaculture sites, agriculture and tourism (hotels). Social information only refers to population density.
2b ICZM Sectors
Spatial data included in Gulf of Gera CIS are structured in the fol-lowing principal groups:
- Physical environment (river, shoreline, hydrological net-work);
- Environmental monitoring (monitoring stations in marine and coastal zones);
- Meteorological historical data (rain, temperature);
- Infrastructure (road network);
- Land and marine uses;
- Fisheries, aquaculture and agriculture;
- Tourism and recreation;
- Human impact (urban areas with population density, admin-istrative boundaries).
2c Integration
2d Spatial scale
Local Scale – Gulf of Gera.
The gulf of Gera is a semi-enclosed water body located in the is-land of Lesvos, Greece in the Aegean archipelago. The water-shed of the gulf, of approximately 200 Km2, can be divided into two parts with differences in geomorphology and land use. The western part of 170 Km2, is characterized by a rather smooth ter-rain cultivated mainly with olive trees, the location of five villages with a total population of 7000 people and a rich hydro graphic network of small rivers flowing mainly during winter. The surface area of the gulf is approximately 43 Km2, and the mean depth of about 10 m. The gulf is connected to the open sea through a channel, having a width of 200-800 m, length of 6.5 Km and depth ranging from 10 to 30 m.
2e Flexibility
The methodological approach used to implement the Gulf of Ge-ra CIS was also used in the case of other two case studies of the Ditty project; the Thau Lagoon (France) and the Ria Formosa (Portugal). Gulf of Gera CIS can be therefore considered as party flexible and exportable to other similar areas, with the necessary customisation.
3 ICZM functionalities
3a Knowledge related functionalities
Gulf of Gera CIS provides only partly ICZM knowledge related functionalities considered by the analysis, specifically:
21807-REL-T002.1 page 191/337
- Multi-time data and information for some layers, e.g. envi-ronmental and meteorological (such as nutrient concentra-tion in the water column, rain and temperature). These data were used as input for the models;
- Analysis of climate change issue in the DSS application to derive scenarios to help policy and decision makers for as-sessing the effectiveness of measures designed to achieve good quality status of waters and a sustainable use of re-sources.
3b Process related functionalities
The CIS was used in combination with the DSS prototype to generate scenarios to assess the effectives of alternative meas-ure in achieving good quality status of water and a suitable use of resources. ICZM process related functionalities supported by the CIS therefore include:
- Scenario development;
- Assessment of management alternatives.
The CIS appears to not include specific functionalities related to stakeholder involvement and participation. However, the genera-tion of scenarios involved stakeholders.
4 Users
4a User typology
The system is specifically designed to support the scientifically-based management of the Gulf of Gera area, also including modelling and DSS tools. Indeed, main users are expert users, coastal planners and coastal managers. In particular the final "end-user" of the CIS is the Municipality of Gera.
5 Use of the system
5a Accessibility
Off-line access.
A DVD with all the data, the GIS and the report regarding the Dit-ty project may be requested by the web-site of the Municipality of Gera.
5b User-friendliness
5c Interactiveness No specific e-participation tools are provided
5d Data access No data and metadata are directly accessible on line. Data and metadata can be requested on DVD support (see 5a)
6 Technological characteristics
6a Used technology The CIS was developed with ESRI (ArcIMS) software. Spatial Analyst and 3D Analyst toolboxes were also used for specific elaborations.
6b Integration with other tools
Gulf of Gera CIS is integrated with other tools:
- Database with the meteorological data;

21807-REL-T002.1 page 192/337
- Hydrodynamic model developed with the Princeton Ocean Model and coupled with an ecological model for the nutrient transport;
Within the Ditty project activities, a Decision Support System was also developed, to simulate different management.
6c Integration with other CIS
No integration with other CIS
6d Interoperability
7 Cost/resources
7a Resources
Information sources for the overview analysis of Gulf of Gera CIS:
Aliaume C., Do Chi T., Viaroli P., Zaldívar J. M., 2007. Coastal lagoons of Southern Eu-
rope: recent changes and future scenarios. Transitional Waters Monographs, Volume 1, Is-
sue 1 (2007).
Kontogianni A., Kavakli Z., Avagianou E. and Tsirtsis G., 2006. Stakeholders Analisys, Gulf
of Gera case study. Document developed inside the Project: “Ditty Project”.
Kontogianni A., Kavakli Z., Avagianou E., Spatharis S. and Tsirtsis G., 2006. Scenario Ana-
lisys, Gulf of Gera case study. Document developed inside the Project: “Ditty Project”.
Kitsiou D., Nitis T., Tsirtis G., Tsaknakis A., Esteve M.A., Falcão M., Giordanni G. and
Loubersac L., 2006. WP3. Geographical Information System (GIS) development. Docu-
ment developed inside the Project: “Ditty Project”.
Tsirtsis G., Avagianou E., Kontogianni A., Spatharis S. and Kavakli Z., 2006 DSS devel-
opment and application: gulf of Gera case study. Document developed inside the Project:
“Ditty Project”.
Web-site consultation
http://www.env.aegean.gr/; last visit on 14/03/2011 at 11.30
http://www.mar.aegean.gr/english/defaulteng.htm; last visit on 14/03/2011 at 11.50
http://www.gera.gr/index.html; last visit 14/03/2011 at 11.30
21807-REL-T002.1 page 193/337
3.37 Bulgarian Black Sea Coastal Atlas
1 General Information
1a Name Bulgarian Black Sea Coastal Atlas (BCA)
1b Description
The geographical area covered by the Bulgarian Black Sea Coast Atlas (BCA) includes the Bulgarian Black Sea catchment area, the coastline, internal waters, territorial waters, contiguous zone and exclusive economic zone. The main BCA objectives are:
- share and use of geographically-linked spatial information on marine and coastal features along the Bulgarian part of the Black Sea coastal zone;
- provide coastal and marine data available to the general us-ers;
- improve public access to coastal information to help and sup-port different authorities, institutions and stakeholders in coastal zone management.
The idea for the development of the BCA emerged as part of a Bulgarian Oceanographic Data Centre (BGODC) initiative and it has been developed with the financial support of the SIBEMA pro-ject (Scientific and Institutional Capacity Building for Implementing European Marine Policy in the Black Sea Region). Only a few data have been published in Internet until now through the GIS Server of BGODC. However, there are many other GIS-layers available inthe IO-BAS (Bulgarian Institute of Oceanology within the Bulgarian Academy of Science) geo-database, related to various coastal and marine topics, to be still published in the BCA. Other bodies could contribute in providing useful data to the BCA, including: Water Basin Directorate (Ministry of Ecology), Cadestre Agency – Minis-try of Regional Development and Public Works, Navy Hydrograph-ic Service, National Institute of Meteorology and Hydrology – BAS, Institute of Fishery and Aquaculture – Varna.
The whole system is still not available on-line, but it was presented in 2009 at the 4th ICAN workshop (Trieste, November 2009). In his presentation, Stanchev (2009) highlighted the “lack of funding sources for web-atlas development and maintenance. It also tresses the lack of common spatial data standards and harmo-nised data management between different institutions, lack of common agreement for sharing spatial data between institution in-volved in data gathering and lack suitably qualified staff”…”The main challenge is to getting the Atlas development under way”.
1c Operating entity Bulgarian Institute of Oceanology within the Bulgarian Academy of Sciences (IO-BAS) and Bulgarian Oceanographic Data Centre (BGODC)
1d Management structure
Bulgarian Institute of Oceanology within the Bulgarian Academy of Sciences (IO-BAS) and Bulgarian Oceanographic Data Centre (BGODC)

21807-REL-T002.1 page 194/337
1d Contacts
Hristo Stanchev; e-mail [email protected]
Institute of Oceanology –Varna Bulgarian Oceanographic Data Centre (BGODC)
Web site: http://www.bgodc.io-bas.bg/
1e Typology
Pre-Operational
BCA was selected since it is one of the few CIS available for the Black Sea.
2 Operational context and information content
2a ICZM dimensions
The environment and the territory dimensions will be in depth de-veloped, also with information regarding erosion and coast protec-tion structures. The economic information in the system will be re-lated for example to fisheries and aquaculture.
2b ICZM Sectors
According to the presentation of the system given at the 4th ICAN workshop (Stanchev, 2009), the following information sectors will be covered by the atlas:
- Ecological features and eutrophication status
- Topographic and nautical maps
- Geomorphic typology
- Erosion sections, sandy beaches and coast-protection struc-tures
- Sea level rise
- Census data for population
- Photos of coastline and port/coast-protection structures
- Data from CTD monitoring station
- Fisheries and aquaculture
- Infrastructure
- Socio-economic data
2c Completeness and integration
No specific integrated data among different information is directly provided within the system
2d Spatial scale
National – Bulgarian Black Sea coast.
The geographical area covered by the BCA includes the Bulgarian Black Sea catchment area, coastline, internal waters, territorial waters, contiguous zone and exclusive economic zone (EEZ).
2e Flexibility BCA was developed to be specifically applied to the Bulgarian Black Sea coast.
3 ICZM functionalities
3a Knowledge related functionalities
Currently the system does not provide specific ICZM knowledge related functionalities.
3b Process related functionalities
Currently the system does not provide specific ICZM process re-lated functionalities.
21807-REL-T002.1 page 195/337
4 Users
4a User typology
Different target groups could benefit from the implementation of the BCA: the coastal scientific/research community in Bulgaria and outside; environmental agencies; governmental and municipal au-thorities; local communities/owners; civil protection authorities; coastal-protection agencies; and decision-makers.
5 Use of the system
5a Accessibility Only a few data have been published in Internet until now through the GIS Server of BGODC. Numerous data are waiting to be made available in Internet
5b User-friendliness
5c Interactiveness No specific e-participation tools are provided
5d Data access
6 Technological characteristics
6a Used technology BCA was developed with the ESRI ArcGis Server software (li-censed software).
6b Integration with other tools
No specific integration with other tools
6c Integration with other CIS
No specific integration with other CIS
6d Interoperability BCA aims to be complaint with the requirements and the protocols of the INSPIRE Directive.
7 Cost/Resources
7a Resources
In his presentation at the 4th ICAN workshop, Stanchev (2009) highlighted the “lack of funding sources for web-atlas development and maintenance. It also tresses the lack of common spatial data standards and harmonised data management between different institutions, lack of common agreement for sharing spatial data be-tween institution involved in data gathering and lack suitably quali-fied staff”…”The main challenge is to getting the Atlas develop-ment under way”.
21807-REL-T002.1 page 196/337
Information sources for the overview analysis of Bulgarian Black Sea Coastal Atlas:
Stanchev H., 2009. “The Bulgarian Black Sea Coastal Atlas (BULGCOAST Atlas) – devel-
opments and forthcomings” ICAN 4th Workshop Trieste, Italy, 16-20 November 2009.
Wright, D.J., Dwyer, N., Kopke, K., and O’Dea, L., 2010. Report of International Coastal
Atlas Network Workshop 4: Formalizing the Network, Engaging the Mediterranean,
UNESCO International Centre for Theoretical Physics, Trieste, Italy, 16-20 November
2009. Available online at <http://ican.science.oregonstate. edu/ican4_final_rpt>.
Web-site consultation:
http://www.bgodc.io-bas.bg/ last visit on 02/09/2011 at 10.00
21807-REL-T002.1 page 197/337
3.38 Akçakoca Costal Information System
1 General Information
1a Name Akçakoca Costal Information System (CIS)
1b Description
The Akçakoca CIS was developed within the pilot project on “testing of methodology on spatial planning for ICZM” (9 months project in year 2007) engaged to the Istanbul Technical University (ITU) as consultant to perform the services required by the UN Office for Pro-ject Services (UNOPS). The specific objective of the ICZM pilot pro-ject was the development of a spatial plan for the Akçakoca District coastal area – along the Black Sea coast of Turkey - according to the methodology developed within the Tacis/Europe Aid Projects (1998-2003). Related goals were (Tanik et al., 2008):
- To improve the protection of the marine environment and vul-nerable coastal zone;
- To help in creating the common regional understanding of ICZM approach and its benefit to the area;
- To enhance and strengthen the capabilities of the regional au-thorities for the coastal planning and management;
- To contribute to the effective implementation of the Black Sea Strategic Action Plan in the pilot area.
One of the main outcomes of CIS application was the production of integrated land use maps, supporting the analysis of inter-sectoral conflicts and coastal spatial planning.
1c Operating entity Istanbul technical University
1d Management structure
Istanbul technical University; Environmental Engineering Depart-ment, Geodesy and Photogrammetry Department and Urban and Regional Planning Department
1e Contacts
Aysegul Tanik; e-mail: [email protected];
Dursun Zafer Seker; e-mail: [email protected]
Department of Environmental Engineering Istanbul Technical University Faculty of Civil Engineering 34469, Maslak - Istanbul, Turkey
1f Typology The system was developed by and used within the pilot project im-plemented by the Istanbul technical University. It is not clear whether the system is currently used or not.
2 Operational context and information content
2a ICZM dimensions
The GIS database focuses on the territory ICZM dimension (mainly addressed in terms of land use/land cover), also including other three ICZM dimension: environment (e.g. ecological status of the dis-trict), economy and society (e.g. socio-demographic data).
21807-REL-T002.1 page 198/337
2b ICZM Sectors
Layers included in the Akçakoca CIS mainly refer to:
- Spatial-Base-Data (e.g. topography, administrative boundaries, bathymetry);
- Environmental and territorial data (e.g. geological data, erosion, slope, water resources and streams, forests, land use and land cover);
- Natural hazard and polluted areas;
- socio economic data (e.g. place of interest, transportation net-work, infrastructures for waste and water management).
2c Integration
The Akçakoca CIS was widely used to derive integrated maps, thus providing scientific-based knowledge to the related ICZM processes. Illustrative examples are:
- Sectoral conflicts between different land uses (e.g. map show-ing hazelnuts cultivation in forestry areas);
- Conflicts between a specific land use and the natural soil fea-tures (e.g. map showing hazelnuts cultivation in highly erodible areas);
- Maps of importance and vulnerability levels for the Akçakoca District; vulnerability is defined a the tolerance level of the natu-ral resource or structure to the human activities.
- Final maps of functional zoning, identifying different zones with different land-use functionality (e.g. forestry, agriculture, tour-ism) and different sectoral conflicts
2d Spatial scale
Local scale - Akçakoca District along the Turkish Black sea coast.
The system mainly includes data and maps related to the land com-ponent of the coastal area
2d Flexibility The system has been developed in order to be specifically applied to the Akçakoca District territory.
3 ICZM functionalities
3a Knowledge relat-ed functionalities
Akçakoca CIS provides only partly ICZM knowledge related func-tionalities considered by the analysis; in particular the integrated analysis is supported by means of various maps and information (see 2c).
3b Process related functionalities
The Akçakoca CIS was specifically developed to support the applica-tion and testing of an ICZM approach to the Akçakoca District aiming to develop a related spatial plan. The CIS was likely particularly use-ful for
- Problem understanding and structuring, in particular supported by the various integrated maps provided by the CIS, that can be also useful in prioritising coastal uses;
- Planning; as said above the CIS was intended to support the development of a spatial plan for the Akçakoca coastal area, in particular addressing uses conflicts.

21807-REL-T002.1 page 199/337
4 Users
4a User typology The project aimed at testing a methodology on spatial planning for ICZM also through the use of the Akçakoca CIS; principal target us-ers therefore were decision-makers and coastal planners.
5 Use of the system
5a Accessibility Only off-line access
5b User-friendliness
5c Interactiveness No specific e-participation tools are provided
5d Data access The access of the system is restricted only to off-line users; thus no data and metadata are provided to free access.
6 Technological characteristics
6a Used technology
6b Integration with other tools
No integration with other tools
6c Integration with other CIS
No integration with other CIS
6d Interoperability
7 Cost/resources
7a Resources
The GIS work involved Senior experts of the Environmental Engi-neering Department of ITU, together with the staff from the Geodesy and Photogrammetry Department and Urban and Regional Planning Department
Information sources for the overview analysis of Akçakoca CIS:
Istanbul technical University, 2009. Testing of methodology of spatial planning for ICZM
Akçakoca District Pilot Project. (00039160-RER/01/G33/A/1G/31). February – October
2007. Environmental Collaboration for the Black Sea. Project. Wrap-Up Conference 29 Oc-
tober 2009.
Tanik, A., Seker, D.Z., Ozturk, I., Tavsan, C., 2008. GIS based sectoral conflict analysis in
a coastal district of Turkey. ISPRS Congress. Beijing, 2008. Proceeding of Commission
VIII.

21807-REL-T002.1 page 200/337
3.39 Odessa Coastal Information System
1 General Information
1a Name Odessa Coastal Information System
1b Description
Odessa CIS is a Web-GIS developed within the PlanCoast Project (2007-2009). The coastline covered by this CIS is about 50 km long and include three main port areas in the Black Sea: Illichevsk, Odes-sa and Ugnii.
The Odessa CIS includes two main components: the ecological Atlas and the Marine information system for the analysis of the effect of accidental oil spills. The two components enable support the identifi-cation of zones at risk for ships and tanker accidents in the North Western part of Black Sea.
The Odessa CIS was expressly designed and implemented to sup-port spatial planning of the coastal zone and marine area of the re-gion of concern, specifically in relation to oil spill risk management. Planning activity was also part of the PlanCoast Project.
1c Operating entity Ukraine Scientific Centre of Ecology of Sea (UkrSCES)
1d Management struc-ture
Ukraine Scientific Centre of Ecology of Sea (UkrSCES)
1e Contacts
Richard Lisovsky; e-mail: [email protected]
Department for Scientific and Information Support Ukrainian Scientific Centre of Ecology
Web-GIS: http://ims2.sea.gov.ua:8083/website/Agglomeration/viewer.htm
UcrSES Web-site: www.sea.gov.ua
1f Typology Operational
2 Operational context and information content
2a ICZM dimensions
The Odessa CIS addresses four of the five considered ICZM dimen-sions: territory (e.g. city agglomeration, marine and coastal protected areas,) environment (e.g. maritime flora and fauna, natural habitat), economy (e.g. land and sea uses, industrial and waste water treat-ment plants, tourism infrastructure, pipelines and navigation lines), society (human pressure).
2b ICZM Sectors
The Odessa CIS includes the spatial layers related to the main fol-lowing topics:
- CIS area of interest, including three detailed areas Illichevsk, Odessa and Ugnii
- Topographic information, including: channels, lakes, rivers, railways, roads, city names, parks, gardens, building, etc.
21807-REL-T002.1 page 201/337
- Depth
- Coastal human uses
- Tourism infrastructure
- Sewer discharge and surface/underwater outfall
- Recreational zones;
- Coastal protected zone
- Marine flora and fauna
- Natural habitats
- Birds
- Ecological Sensitivity Index (ESI)
- Information relevant for port activities, including: anchorage ar-ea and points, wreck, fishing facilities, navigation lines, under-water pipelines, recommended tracks, traffic separation scheme.
2c Integration
The CIS does not provide much integration among different infor-mation. A layer on Ecological Sensitivity Index (ESI) is included; however no clear information on the computation method is provid-ed.
2d Spatial scale Local – Odessa coastal area in the Black Sea
2d Flexibility The system has been developed in order to be applied specifically to Odessa territory.
3 ICZM functionalities
3a Knowledge related functionalities
The CIS does not provide ICZM knowledge related functionalities, besides examples of integration among different information, i.e. the Ecological Sensitivity Index (ESI) layer (see 2c)
3b Process related functionalities
The Web-GIS does not include specific ICZM process related func-tionalities. The tool has been however used to support coastal and marine planning. Indeed, within the PlanCoast project, the Odessa CIS was expressly designed and implemented to support spatial planning of the coastal zone and marine area of the region of con-cern, specifically in relation to oil spill risk.
4 Users
4a User typology
Main users of the Odessa CIS appear to be decision-makers and coastal planners; actually the CIS was developed to support plan-ning and management of oil spill related risks. On-line access to the Web-GIS enables any user to have access to available maps.
5 Use of the system
5a Accessibility Free access on line (access allowed to all users without password) to the Web-GIS.
5b User-friendliness Medium.

21807-REL-T002.1 page 202/337
Intuitive operation of the system for the turn-off or turn-on of the in-formative layers. An identify function is available that helps the user to identify the specific features. The system is in Ukraine, also in-cluding parts in English.
5c Interactiveness No specific e-participation tools are provided.
5d Data access
Spatial data (GIS layer) are not downloadable. The maps can be visualised but can not be printed. There is no specific function to create the legend, so the user can hardly manage maps with lots of different data. There is no specific tool for map saving.
The meta-data are available (mainly in Ukrainian).
6 Technological characteristics
6a Used technology The Odessa CIS is designed on the basis of ESRI technology. The system uses an ArcIMS service for the application connect to the web server and ArcSDE service for the database connection.
6b Integration with other tools
No specific integration with other tools
6c Integration with other CIS
No specific integration with other CIS
6d Interoperability
Low.
The GIS project was developed in ArcGis 9.2 so the data layers are ESRI shape file. Spatial data however can not be downloaded and shared. Metadata do not meet requirements of ISO standards (INSPIRE Directive).
7 Cost/Resources
7a Resources
Information sources for the overview analysis of the Odessa CIS:
Richard Lisovsky, 2011. Information provided by mail on the 17.02.2011 at 14.23, CET
time.
Web-site consultation:
http://ims2.sea.gov.ua:8083/website/Agglomeration/viewer.htm; last visited on 23/02/2011
at 17.00.
http://www.plancoast.eu/wp/?p=203#more-203; last visited on 23/02/2011 at 17.30.
http://www.sea.gov.ua/index.htm.en; last visited on 23/02/2011 at 16.00.
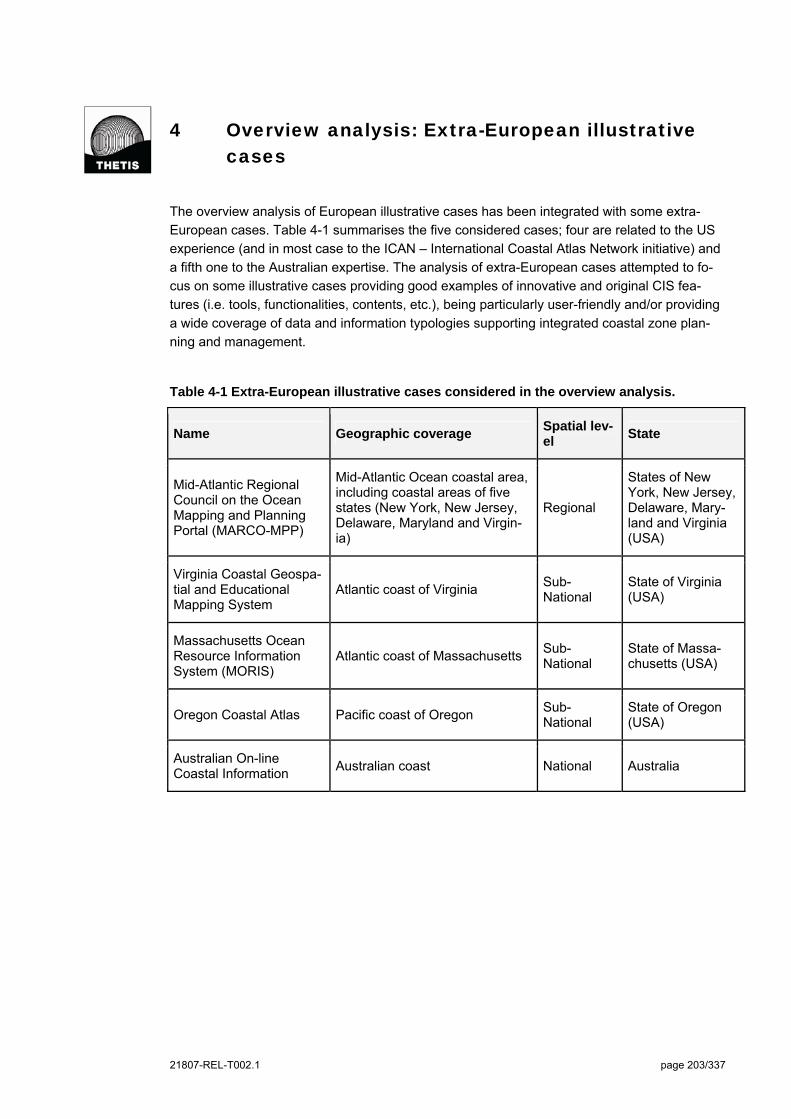
21807-REL-T002.1 page 203/337
4 Overview analysis: Extra-European illustrative cases
The overview analysis of European illustrative cases has been integrated with some extra-
European cases. Table 4-1 summarises the five considered cases; four are related to the US
experience (and in most case to the ICAN – International Coastal Atlas Network initiative) and
a fifth one to the Australian expertise. The analysis of extra-European cases attempted to fo-
cus on some illustrative cases providing good examples of innovative and original CIS fea-
tures (i.e. tools, functionalities, contents, etc.), being particularly user-friendly and/or providing
a wide coverage of data and information typologies supporting integrated coastal zone plan-
ning and management.
Table 4-1 Extra-European illustrative cases considered in the overview analysis.
Name Geographic coverage Spatial lev-el
State
Mid-Atlantic Regional Council on the Ocean Mapping and Planning Portal (MARCO-MPP)
Mid-Atlantic Ocean coastal area, including coastal areas of five states (New York, New Jersey, Delaware, Maryland and Virgin-ia)
Regional
States of New York, New Jersey, Delaware, Mary-land and Virginia (USA)
Virginia Coastal Geospa-tial and Educational Mapping System
Atlantic coast of Virginia Sub-National
State of Virginia (USA)
Massachusetts Ocean Resource Information System (MORIS)
Atlantic coast of Massachusetts Sub-National
State of Massa-chusetts (USA)
Oregon Coastal Atlas Pacific coast of Oregon Sub-National
State of Oregon (USA)
Australian On-line Coastal Information
Australian coast National Australia
21807-REL-T002.1 page 204/337
4.1 MORIS - Massachusetts Ocean Resource Information System
1 General Information
1a Name Massachusetts Ocean Resource Information System (MORIS)
1b Description
The Massachusetts Ocean Resource Information System (MORIS) is an on-line mapping tool (Web-GIS) created by the Massachusetts Office of Coastal Zone Management (CZM), the Massachusetts Office of Geographic Information (MassGIS), the Massachusetts Ocean Partnership (MOP), Applied Science Asso-ciates (ASA), and Charlton Galvarino.
MORIS can be used to search and display spatial data pertaining to the Massachusetts coastal zone. Users can interactively view various data layers (e.g., tide gauge stations, marine protected areas, access points, eelgrass beds, etc.) over a backdrop of aer-ial photographs, political boundaries, natural resources, human uses, bathymetry, or other data including Google base maps. In particular, MORIS is designed to:
- Provide spatial data that are, to the extent possible, accurate, scientifically sound, and credible;
- Provide information to decision makers, planners, and the general public that can be used to strengthen environmental policy and guide management decisions;
- Use a collaborative, interactive process that involves a varie-ty of partners and data sources;
- Ensure that the data are available in an easily accessible and useful manner.
Some of the MORIS data are provided and maintained by various agencies external CZM.
The Massachusetts Office of Coastal Zone Management (CZM) is a part of the Executive Office of Energy and Environmental Affairs (EEA). CZM’s mission is to balance the impacts of human activity with the protection of coastal and marine resources. As a net-worked program, CZM was specifically established to work with other state agencies, federal agencies, local governments, aca-demic institutions, non profit groups, and the general public to promote sound management of the Massachusetts coast. CZM is funded primarily through the Commonwealth of Massachusetts, the National Oceanic and Atmospheric Administration (NOAA), and the U.S. Environmental Protection Agency (EPA).
1c Operating entity Massachusetts Office of Coastal Zone Management
1d Management struc-ture
Massachusetts Office of Coastal Zone Management

21807-REL-T002.1 page 205/337
1d Contacts
e-mail: [email protected]
Massachusetts Office of Coastal Zone Management 251 Causeway Street, Suite 800 Boston, MA 02114-2138
Web-GIS: http://www.mass.gov/czm/mapping/index.htm
Web-site: http://www.mass.gov/czm/mapping/index.htm
1e Typology Operational
2 Operational context and information content
2a ICZM dimensions MORIS addresses all the five ICZM dimensions. For more details on the information provided by MORIS see next point (2b).
2b ICZM Sectors
Data/cartographic information included in MORIS are structured in the following principal groups:
- Bathymetry;
- Elevation;
- Hydrograph features;
- Intertidal flats;
- Wind speed;
- Land uses and land cover;
- Nautical charts;
- Ortho photos (Aerial photos) and topographic maps;
- Biological marine and estuarine data;
- Habitat;
- Colonial water bird;
- Geological marine and estuarine data;
- Shoreline and sea bottom data;
- Physical marine and estuarine data;
- Ocean management (etc. management areas, sand and gravel extraction, pipelines, cable, wind farm, etc.)
- Massachusetts ocean management planning area;
- Administrative boundaries;
- Infrastructure and transportation;
- Activities connected with the fisheries (e.g. fishing traffic);
- Important fish resources areas;
- Recreation and tourism (e.g. boating, coastal access, diving);
- Concentrated commerce traffic;
- Wind energy areas.
The Web-GIS contains more layers in particular related to marine and coastal planning and management.
21807-REL-T002.1 page 206/337
2c Integration
No specific integration among different information is directly pro-vided within the system. However the system contains a huge number of spatial data freely available and downloadable that can properly support integrated analysis and assessment.
2d Spatial scale Sub-national – Massachusetts sea and coastal areas in the North Atlantic coast of the USA, as well as including spatial data on the drainage basin.
2e Flexibility MORIS seems to be specifically developed for the Massachusetts sea and coastal areas.
3 ICZM functionalities
3a Knowledge related functionalities
MORIS provides some of the knowledge related functionalities considered by the analysis; specifically:
- Availability of spatial data: major part of the data collected in this online mapping tool is downloadable in shape files for-mat through an apposite function;
- Operation at the different spatial scale; some of the available spatial data can be re-scaled according to the considered spatial extent; thus enabling to visualize more details at a higher scales. This functionality is particularly developed in MORIS;
- Availability of multi-time data; a lot of spatial data are availa-ble for different time periods, such as for example the ortho photo layers (6 years in the period 1994-2008).
3b Process related func-tionalities
MORIS contains a huge amount of spatial data on the marine and costal system organised in an articulated structure; it can there-fore support problem understanding and structuring for the Mas-sachusetts coastal and marine area. MORIS specifically aims to scientifically-based knowledge and data to decision makers, plan-ners, and the general public that can be used to strengthen envi-ronmental policy and guide management decisions.
No specific ICZM process related functionalities appear to be pro-vided by MORIS. It is however really important to stress that MORIS is directly managed, and therefore used, by the Massa-chusetts Office of Coastal Zone Management (CZM), that is the office directly dealing with sustainable development of the coastal system.
4 Users
4a User typology
MORIS specifically aims to provide information to decision mak-ers, coastal and marine planners and the general public. The wide variety and very numerous spatial data included in the system can results in being also useful for the research community.
5 Use of the system
5a Accessibility Free access on-line to all the MORIS contents and functionalities.
21807-REL-T002.1 page 207/337
5b User-friendliness
Highly user-friendly.
MORIS is very easy to be used and only requires very basic GIS expertise. It also uses the common and well-known Google earth background and approach.
5c Interactiveness No specific e-participation tools are currently provided by the sys-tem.
5d Data access
Direct access to:
- All spatial layers; the majority of spatial data can be directly downloadable. Uses of other spatial information is restricted by confidentiality reasons defined by data producers;
- Metadata are provided for all layers. They are quickly and easily accessible and full explanatory.
6 Technological characteristics
6a Used technology
MORIS is a JavaScript web application that utilizes various com-ponents of GeoExt, a JavaScript toolkit for rich mapping applica-tions. The application is run through a client-side web browser.
MORIS pulls data through the GeoServer mapping software. Ge-oServer is a free, open-source, map-serving platform that serves data using Open Geospatial Consortium, Inc. (OGC) WMS and WFS formats, among others.
6b Integration with other tools
No specific integration with other tools
6c Integration with other CIS
Some of the data contained in MORIS are provided and main-tained by various agencies external to CZM.
6d Interoperability
High.
MORIS pulls data through the GeoServer mapping software. Ge-oServer is a free, open-source, map-serving platform that serves data using Open Geospatial Consortium, Inc. (OGC) WMS and WFS formats, among others.
Metadata description is particularly rich and complete.
7 Cost/resources
7a Resources
Web-site consultation:
http://www.mass.gov/czm/mapping/index.htm; visited on 25/03/2011 at 16.30

21807-REL-T002.1 page 208/337
4.2 Mapping and Planning Portal of the Mid-Atlantic Regional Council on the Ocean
1 General Information
1a Name Mid-Atlantic Regional Council on the Ocean Mapping and Plan-ning Portal (MARCO-MPP)
1b Description
The MARCO Mapping and Planning Portal (MARCO-MPP) is an on-line Web-GIS based system that allows state, federal, and local decision-makers and the public users to visualize, query, map, and analyze ocean and coastal data in the Mid-Atlantic Region (involving five federal states). The Governors of New York, New Jersey, Delaware, Maryland and Virginia have committed to a new comprehensive, regional approach, creating the Mid-Atlantic Re-gional Council on the Ocean (MARCO).
MARCO involves the following representative of the five federal states:
- New York State Department of State Division of Coastal Re-sources and New York Ocean and Great Lakes Ecosystem Conservation Council (New York);
- Coastal Management Program and New Jersey Department of Environmental Protection (New Jersey);
- Maryland Oceans (Maryland);
- Department of Natural Resources and Environmental Control and Delaware Coastal Program (Delaware);
- Virginia Secretary of Natural Resources and Virginia Coastal Zone Management Program (Virginia).
The four MARCO’s priority issue areas and goals are:
- Collaborate on Regional approach to support the sustainable development of renewable energy in offshore areas;
- Coordinate protection of important habitats and sensitive unique offshore areas on regional scale;
- Prepare the region’s coastal communities for the impacts of climate change on ocean and coastal resources;
- Promote improvements in the region’s coastal water quality.
The five MARCO states are working to maintain and improve the health of their ocean and coastal resources, and ensure that they continue to contribute to the high quality of life and economic vitali-ty of their region’s communities well into the future. The five MARCO states agreed to work together to develop a regional, web-based portal as part of their 2009 Action Plan. In response to this need, the Virginia Coastal Zone Management Program pro-vided funding (through their CZM Award from the National Ocean-ic and Atmospheric Administration - NOAA) for the creation of the mapping and planning portal for the Mid-Atlantic region.
21807-REL-T002.1 page 209/337
The structure of MARCO is composed of:
- The Council (the five Mid-Atlantic Governors);
- An Executive Committee (State Secretaries and Agency Heads);
- A Management Board (State CZM Directors and Senior Poli-cy Advisors);
- Five Action Teams (State staff with expertise in the four prior-ity issue areas plus a team for coastal and marine spatial planning).
1c Operating entity
Mid-Atlantic Regional Council on the Ocean.
The portal was developed by a team of representatives from each of the Mid-Atlantic States, NOAA, and The Nature Conservancy.
1d Management struc-ture
Mid-Atlantic Regional Council on the Ocean.
1d Contacts e-mail: [email protected]
Web-GIS: http://maps.tnc.org/MARCO/index.html
MARCO Web-site: http://www.midatlanticocean.org/index.htm
1e Typology Operational
2 Operational context and information content
2a ICZM dimensions
MARCO-MPP mainly addresses three of the five considered in-formation dimensions.
The environment and the territory dimension are in depth devel-oped. The economic information in the system is provided with layers regarding fishing effort and commercial shipping density.
2b ICZM Sectors
Currently, the MARCO portal includes map data layers grouped into five broad categories:
- Administrative layers (e.g. administrative boundaries, marine boundaries and jurisdictions, territorial sea, contiguous zone, exclusive economic zone, wind energy areas, etc.);
- Decision Support (e.g. overlays of various uses and natural features, 50 mile shoreline buffer etc.).
- Human Uses (e.g. fishing effort, commercial shipping density etc.);
- Biological (e.g. sea and benthic habitats, artificial reefs, water birds density information, etc.);
- Geophysical (e.g. vulnerability to sea level rise, bathymetry, major canyons, sediment grain size, seabed form, wind speed, etc.).
21807-REL-T002.1 page 210/337
2c Integration
MARCO-MPP contains some layers with integrated information.
The most relevant one is the vulnerability to sea level rise calcu-lated along all the Atlantic coastal area (from Maine to Florida). This layer provides a preliminary overview of the relative suscepti-bility of the Atlantic coast to sea level rise through the use of a coastal vulnerability index (CVI). The computation of the index is based upon the variables geomorphology, regional coastal slope, tide range, wave height, relative sea-level rise and shoreline ero-sion and accretion rates. CVI is finally expressed in four classes (low, medium, high, very high).
Other examples of integrated analysis are layers included in the Decision Support category.
2d Spatial scale
Regional – Mid-Atlantic Ocean, including coastal areas of five states (New York, New Jersey, Delaware, Maryland and Virginia).
Layer on coastal vulnerability to sea level rise is referred to the whole Atlantic coast of the United States.
2e Flexibility
MARCO-MPP is specifically developed to address Mid-Atlantic Ocean and related coastal area. However, MARCO-MPP’s struc-ture is very similar to the one adopted by HELCOM Map and Data Service supporting the activity of the Helsinki Commission.
3 ICZM functionalities
3a Knowledge related functionalities
MARCO-MPP provides some of the knowledge related functionali-ties considered by the analysis, specifically:
- Integration among different information sectors (see point 2c);
- Availability of spatial data; a function inside MARCO-MPP opens a web-page with the list of the downloadable layers and the respective link where the user can find them. Most layers are available for the download.
- Operation at the different spatial scale; some of the available spatial data can be re-scaled according to the considered spatial extent; thus enabling to visualize more details at a higher scales;
- Function abilities or maps related to assessment coastal vul-nerability; MARCO-MPP includes a specific layer represent-ing coastal vulnerability to sea level rise (see point 2c). The spatial extension of this layer is from the coast of Florida to the coast of Maine.
3b Process related func-tionalities
Currently MARCO-MPP does not include ICZM process related functionality. The system is however under constant development. To fully support the coastal and marine spatial planning process, the portal will evolve including more sophisticated decision support features, such as the ability for ocean users and managers to cre-ate spatial management scenarios and monitor and evaluate trends and goals.
21807-REL-T002.1 page 211/337
4 Users
4a User typology
MARCO-MPP is an on-line tool intended for anyone who may be interested in Mid-Atlantic coastal and marine information. Potential and effective users are mainly state, federal, and local decision-makers and the other public users.
5 Use of the system
5a Accessibility Free access on-line to all the MARCO-MPP contents and func-tionalities.
5b User-friendliness
Highly user-friendly.
MARCO MPP is provided with customised interfaces that are ra-ther simple to be used. Moreover use of the system is supported by a detailed and simply usable “Help Page” and a clear and ex-planatory description of layers contained in the system.
5c Interactiveness No specific e-participation tools are currently provided by the sys-tem.
5d Data access
- More than 90% of spatial layers are directly downloadable;
- Users can generate a customized map and a printable file in pdf format;
- Metadata description and explanation are provided by all lay-ers included in MARCO-MPP, through a summary fact sheet and a Full Metadata description.
6 Technological characteristics
6a Used technology ESRI ArcGis Server and Flex (licensed software).
6b Integration with other tools
No specific integration with other tools
6c Integration with other CIS
MARCO-MPP is not directly integrated to other CIS. The general MARCO web-site provide a link to the following other mapping systems:
- Multipurpose Marine Cadastre;
- Integrated Ocean Observing System Data Catalog;
- Virginia Coastal GEMS;
- Maryland Coastal Atlas;
- New York Ocean and Great Lakes Atlas.
6d Interoperability
High
Metadata description is particularly rich and complete. They are structured according to the Esri Profile of the Content Standard for Digital Geospatial Metadata.
21807-REL-T002.1 page 212/337
7 Cost/resources
7a Resources
The Mid-Atlantic Governors’ commitment to a regional approach is evidenced by the rapid creation of the Mid-Atlantic Regional Council on the Ocean (MARCO). Coastal policy makers and Coastal Zone Management Program (CZM) directors from New York, New Jersey, Delaware, Maryland and Virginia each devoted time and funds to bring about this new regional organization. Ex-clusive of staff time, the five states have, to date, dedicated about $300,000 to the formation of MARCO and implementation of initial actions.
Web-site consultation:
http://maps.tnc.org/MARCO/index.html; last visit on 29/03/2011 at 10.30;
http://www.midatlanticocean.org/index.htm; last visit on 29/03/2011 at 10.30.
21807-REL-T002.1 page 213/337
4.3 Virginia Coastal Geospatial and Educational Mapping System
1 General Information
1a Name Virginia Coastal Geospatial and Educational Mapping System (Coastal GEMS)
1b Description
Virginia Coastal Geospatial and Educational Mapping System (Coastal GEMS) is a dynamic internet mapping application (web-GIS) that serves as a gateway to information about Vir-ginia’s coastal resources.
Coastal GEMS is a result of a collaborative effort, including the data of some agencies and other partnering coastal organ-izations. Coastal GEMS was developed by the Virginia Coastal Zone Management Program (CZM). The idea of de-veloping web-GIS collecting the coastal data of the Virginia started in the 2001. During a CZM workshop state and local partners expressed the need for a “vision” of Virginia’s Coastal Zone and for a comprehensive inventory of Virginia’s coastal resources. For this reason Virginia CZM has begun collecting spatial data and creating management tools to be included in Coastal GEMS.
Coastal GEMS provides a high number of spatial lay-ers(provided by various data produces) covering the most im-portant topics related to the land and marine components of the coastal system. Each layer is associated to a detailed “fact sheet” collecting the metadata information. These “fact sheets” are of particular importance for layers regarding the Conservation Planning Tools and Conservation Planning ex-amples. These layers are indeed rather complex and not-intuitive, the “fact sheets” clearly explain their contents and meaning, supporting their proper users in coastal and marine planning and management.
Additional data layers are going to be continuously incorpo-rated into Coastal GEMS as agencies continue to develop da-ta and make it available for inclusion.
1c Operating entity Virginia Coastal Zone Management Program Office
1d Management structure Virginia Coastal Zone Management Program Office
1d Contacts
Laura McKay, e-mail: [email protected] Virginia Coastal Zone Management Program Office Department of Environmental Quality 629 East Main Street Richmond, Virginia 23219 Web-GIS: http://128.172.160.131/gems2/# Web-site: http://www.deq.virginia.gov/coastal/coastalgems.html
21807-REL-T002.1 page 214/337
1e Typology Operational
2 Operational context and information content
2a ICZM dimensions
Coastal GEMS mainly addresses four of the five considered information dimensions. The environment and the territory di-mension are in depth developed. The economic information in the system is provided with layers mainly regarding fisheries management area and touristic port and harbour. The govern-ance dimension is also highly developed including all the lay-ers related to two main groups: Conservation Planning Tools and Conservation planning examples.
2b ICZM Sectors
Coastal GEMS currently includes a high number and a wide variety of spatial layers. Additional data layers are going to be continuously incorporated into Coastal GEMS as agencies continue to develop data and make it available for inclusion. Spatial data are structured in the following topics:
- Water features, including for example: fisheries man-agement areas, private oyster leases, state constructed oyster reefs, commercial shellfish aquaculture sites, oys-ter gardening sites, submerged aquatic vegetation (SAV), seaside SAV planting sites, anadromous fish use areas, threatened and endangered species waters, sea-side oyster density and healthy streams, etc.;
- Shoreline features, including for example: beaches above high water, Chesapeake Bay dunes, wetlands (tidal and non tidal), restored riparian buffer sites, etc.;
- Land features, including for example: conservation lands, forest cover, barrier island ownership, etc.;
- Wildlife features, including for example: essential wildlife habitat, important bird areas, migratory songbird stopo-ver habitat, etc.;
- Recreational features, including for example: boat ramps, scenic rivers, birding and wildlife trail sites and loops, seaside eastern shore water trail, public access sites, etc.;
- Conservation Planning Tools, including for example: clam/oyster aquaculture suitability models, invasive reed (Phragmites), historic and cultural value model, predicted growth model, ecological cores and landscape corridors, marina sitting suitability model, impediments to fish movement, impaired waters, biotic stream assessment (INSTAR) locations, recreational value model, watershed integrity model, agricultural value model, forest econom-ics model, tidal flushing rates, clam/oyster aquaculture vulnerability models, benthic index of biotic integrity, condemned shellfish areas, potential wetland restoration sites, etc.;
- Conservation Planning Example, including for example: coastal avian protection zone, seaside heritage program boundary, southern watersheds program, Hampton roads conservation corridors and Priority Conservation Areas, etc.
21807-REL-T002.1 page 215/337
2c Integration
Coastal GEMS include a high number of spatial information derived through the integrated analysis of different data typol-ogies. This is particular evident for layers included in the Con-servation Planning Tools category, that are often results of modelling application. A couple of examples are:
- Aquaculture Vulnerability Model; this layer is the result of a model studying the risks associated with the shellfish aquaculture. The model firstly considers basics physical and biological conditions necessary for aquaculture suc-cess and secondly, the impacts that current land use and proposed local zoning has on suitable growing areas.
- Tidal rushing rates; this layer shows an evaluation of the water bodies in the Virginia coastal zone using several water quality models to calculate residence time. Results are grouped into tidal flushing categories: quickly, inter-mediate and slowly.
2d Spatial scale Sub-national – Virginia coastal zone along the Atlantic ocean
2e Flexibility Coastal GEMS is specifically developed for the Virginia coastal area
3 ICZM functionalities
3a Knowledge related func-tionalities
Coastal GEMS provides some of the knowledge related func-tionalities considered by the analysis, specifically:
- Integration among different information sectors (see point 2c); this functionality is particular developed and a rele-vant number of integrated information are included in and accessible through the Web-GIS;
- Availability of spatial data; the system allows the down-loading of GIS layers in shape file format;
- Operation at the different spatial scale; some of the available spatial data can be re-scaled according to the considered spatial extent; thus enabling to visualize more details at a higher scales.
3b Process related func-tionalities
Coastal GMES contains a huge amount of spatial data on the marine and costal system organised in an articulated struc-ture; it can therefore support problem understanding and structuring for the Virginia coastal and marine area. Further-more, coastal vulnerability is evaluated for various relevant topics (see the category Conservation Planning Tools, includ-ing for example spatial data on: vulnerability for clam aquacul-ture or oyster aquaculture), also through the use of specific models, and related layers are included in the Web-GIS.
The system also includes relevant spatial data about plan mainly dealing with coastal protection, thus also showing some of the results of the ICZM process.
21807-REL-T002.1 page 216/337
4 Users
4a User typology
As reported in the Coastal GEMS web-site, the system is mainly dedicated to:
- Local and regional planning agencies to better manage growth by determining the most suitable areas for con-servation and development;
- State and federal agencies to better manage projects such as roads and major facilities, habitat restoration, and public access plans. They could also use Coastal GEMS as a starting point for the environmental review process in order to quickly access agency data;
- Academic institutions to educate students about coastal resource use and values and to provide a basis of infor-mation for classroom projects and/or research;
- Private citizens, advocacy groups, and businesses to formulate their positions on the potential impacts of pro-jects on coastal resources;
- General public to learn more about Virginia’s coastal re-sources.
Indeed the wide nature of data included in the Coastal GMES can properly address the above variety of target users.
5 Use of the system
5a Accessibility Free access on-line to all the Coastal GEMS contents and functionalities.
5b User-friendliness
Highly user-friendly.
The Coastal GEMS is built around an interactive map very easy to browse, which allows anyone to identify, visualize and query those datasets relevant to their interest. Each layer is described accurately by a metadata description with all the in-formation necessary to support the correct comprehension of the data.
5c Interactiveness No e-participation tools are currently provided by the Coastal GMES
5d Data access
- The majority of spatial layers are downloadable through the link proposed in the “fact sheet”, also illustrating metadata information;
- Metadata description and explanation for all the layers included in the Coastal GEMS. Metadata are managed through detailed fact sheets. It is relevant stressing that these sheets also clearly indicate the last data updating that is a very useful information for the correct use of da-ta.
21807-REL-T002.1 page 217/337
6 Technological characteristics
6a Used technology ESRI ArcGis (licensed software).
6b Integration with other tools
Coastal GMES includes a relevant number of layers that are the results of specific model (in particular include in the Con-servation Planning Tools category). Model results are provid-ed mainly by the Centre for Coastal Resources Management that specifically works in the development of and support to integrated and adaptive management of coastal zone re-sources. The same Centre provides Interactive maps such as: aquaculture vulnerability model, erosion vulnerability, marina suitability tool, oil spill clean-up and response, shallow water use conflict tool, shoreline managers assessment mapper, wetland data viewer, wetland mitigation targeting tool (http://ccrm.vims.edu/gis_data_maps/interactive_maps/index.html)
6c Integration with other CIS
Coastal GEMS is a member of the International Coastal Atlas Network (ICAN).
6d Interoperability High/Medium
Metadata description is particularly rich and complete.
7 Cost/resources
7a Resources
Funding for the development of Coastal GEMS was provided by the Virginia CZM Program through grants from the Office of Ocean and Coastal Resource Management at the National Oceanic and Atmospheric Administration under the Coastal Zone Management Act.
Information sources for the overview analysis of Coastal GEMS
Coastal Geospatial and Education Mapping System, 2007. Virginia Coastal Zone Management
Program, Virginia Department of Environmental Quality, Richmond, VA 23219.
Web-site consultation:
http://www.deq.virginia.gov/coastal/coastalgems.html; last visit on 29/03/2011 at 16.30.
http://128.172.160.131/gems2/; last visit on 29/03/2011 at 17.30.
http://ican.science.oregonstate.edu/member_dir; last visit on 14/04/2011 at 9.00.
21807-REL-T002.1 page 218/337
4.4 Oregon Coastal Atlas
1 General Information
1a Name Oregon Coastal Atlas (OCA)
1b Description
The Oregon Coastal Atlas is a web atlas including background infor-mation for different coastal systems, access to interactive mapping, online geospatial analysis tools and direct download access to various planning and natural resource datasets related to coastal zone man-agement.
The heart of the Coastal Atlas is the archive of geospatial data collect-ed over the years by various program partners of the Oregon Ocean-Coastal Management Program. The Atlas includes four main sections:
- The "Search" section of the OCA website, constantly upgraded, allows to Search and download GIS Spatial Data from he above mentioned archive. Data search can be performed by coastal set-ting (from a list of predefined coastal places), keyword, data source or spatial scale.
- The Coastal Atlas includes an Internet Map Server to create sim-ple personalized maps, visualising and downloading data rele-vant to the coast. Maps can be exported as pdf format.
- The OCA web site provides also access to a variety of tools (see 6b) created by NOAA, FEMA and others designed to help differ-ent types of coastal users answer questions that are common in coastal areas. In addition, a series of Oregon topic-specific coastal tools constructed by Atlas partners are made available.
- Finally OCA provides a “Learn” section, containing simple intro-ductory information for a range of coastal geographic settings (estuaries, sandy shores, rocky shores, ocean areas) and coastal topics (access, hazards, history, processes)
The Oregon Coastal Atlas is a member of the International Coastal At-las Network (ICAN), an informal group of organizations who have been meeting since 2006 to scope and implement data interoperability ap-proaches to coastal web atlases. The Atlas is funded by the National Science Foundation, NOAA Coastal Services Centre, and U.S. geo-logical service/Federal Geographic Data Centre.
1c Operating entity
OCA is a multi-group project established by a partnership between Oregon Ocean Coastal Management Program, Oregon State Universi-ty Department of Geosciences and Ecotrust a NGO based in Portland (Oregon).
1d Management structure
1e Contacts
Atlas info mail [email protected]
Dawn Wright; e-mail [email protected] Department of geosciences 104 Wilkinson Hall – Oregon State Uni-versity, Corvallis, Oregon, USA
21807-REL-T002.1 page 219/337
Tania Haddad; e-mail: [email protected] Oregon Coastal Management Program 800 NE Oregon St. 18, Suite 1145 Portland, OR 97232, USA
OCA site: http://www.coastalatlas.net/
1f Typology Operational
2 Operational context and information content
2a ICZM dimensions
The atlas mainly deals with ICZM dimension of territory and environ-ment. Some information are also available for the economic (e.g. fish-ery, energy exploitation), social (beach access, bathing waters) and governance (State marine managed areas, dredge material disposal sites, wave energy preliminary permit sites) dimensions.
2b ICZM Sectors
The information contained in the OCA mainly concerns the following themes:
- Physical environment
- Coastal habitats
- Imagery
- Biology
- Management
- Human impact
- Conservation
- Environmental monitoring
- Infrastructures
- Natural resource
- Fisheries, aquaculture& agriculture
- Tourism and recreation
2c Integration
Some limited Integrated information is available through the Map viewer, i.e. landslide hazard areas, shorelines exposure to waves, beach water quality assessment (different coloured flags).
Much more integrated information can be accessed by the tools sec-tion (see 6b), in particular: Coastal Inundation Visualization; Coastal Risk and Vulnerability Assessment Tool; Landslide Hazard Maps; HAZUS-MH risk assessment software program for analyzing potential losses from floods, hurricane winds and earthquakes.
2d Spatial scale Sub-national scale - Oregon coasts and sea.
2d Flexibility Oregon Coastal Atlas is specifically designed to deal with the coastal area of Oregon.
21807-REL-T002.1 page 220/337
3 ICZM functionalities
3a Knowledge relat-ed functionalities
Some knowledge related functionalities are provided by OCA:
- Integration among different information sectors (see point 2c);
- Availability of spatial data; the system allows the downloading of GIS layers through an intuitive search functionality;
- Operation at the different spatial scale; some of the available spatial data can be re-scaled according to the considered spatial extent; thus enabling to visualize more details at a higher scales.
3b Process related functionalities
OCA provides a high variety of data on the marine and costal system organised in an articulated structure; it can therefore support problem understanding and structuring for the Oregon Coastal Areas.
Extended texts and images provide further support to problem under-standing. This kind of information is especially available in the Learn Section of the web site which provides introductory information for a range of coastal geographic settings (Estuaries, Sandy Shores, Rocky Shores, Ocean Areas), and coastal topics (Access, Water Quality, Hazards, Processes). Text information is also available in the Map Viewer section, interrogating the displayed layers.
Learn section is also very useful in addressing communication pur-poses.
4 Users
4a User typology
The Oregon Coastal Atlas aims at being an useful resource for various user typologies involved or interested in Oregon Coastal Zone man-agement, such as:
- Researchers/scientists;
- NGOs;
- Government/public bodies;
- Consultancies;
- Coastal/environmental managers;
- Decision makers;
- General Public.
Specific tools are also developed for three specific groups of users (public, planners and researchers, see 6b).
On average OCA receives about 13,945 visit per month resulting in about 280,745 page views per month (Haddad et al., 2011).
5 Use of the system
5a Accessibility Free access on-line without password to the complete CIS
5b User-friendliness Highly user-friendliness (designing simple, intuitive and informative web interface; complete help user-guide).
5c Interactiveness
No specific participation tools are available, though it was declared that the OCA has been developed also thanks of coastal people by “thoughtful feedback” on atlas prototypes and other interim steps (see information provided in http://www.coastalatlas.net/).
21807-REL-T002.1 page 221/337
5d Data access
Geospatial data and metadata are available from the search tool of OCA. Metadata are compliant with FGDC Content Standards for Digi-tal Geospatial Metadata,
Map can be printed/exported from the Internet Map Server.
6 Technological characteristics
6a Used technology
Maps are served using both proprietary software (ArcIMS) and Open Source Minnesota MapServer and a modified version of the ka-Explorer interface of ka-Map. Ka-Map is an open source project that is aimed at providing highly interactive web-mapping interfaces using features available in modern web browsers.
Server operating System: red Hat Linux, windows 2000 SP3
6b Integration with other tools
Within the coastal atlas web site a variety of tools has been assem-bled. They are created by several entities (e.g. NOAA, FEMA) and by Atlas partners, designed to help different types of coastal users an-swer questions that are common in coastal areas and specific for Ore-gon topics.
Tools are thought for public (e.g. link to The Oregon coastal access inventory for an accurate description of all public beach access points in Coastal Oregon), planners (e.g. Coastal Risk and Vulnerability As-sessment Tool of NOAA) or researchers (e.g. link to OrCOOS website facilitates the access to of a wide variety of near real-time ocean ob-serving and modelling systems). The full list of tools is provided at http://www.coastalatlas.net/index.php?option=com_content&task=blogsection&id=3&Itemid=4
6c Integration with other CIS
OCA is a member of the International Coastal Atlas Network (ICAN).
6d Interoperability Use of metadata standard FGDC
7 Cost/resources
7a Resources
Information sources for the overview analysis of the Oregon Coastal Atlas
Haddad E., Bailey R.J and Wright D.J., 2011. Chapter 6 “Oregon, USA”. In Wright D.J, Dwyer
E., Cummins V.[eds.], 2011. Coastal informatics: Web Atlas Design and Implementation. Infor-
mation science reference, Hershey, New York, pp. 91-104.
Report of International Coastal Atlas Network Workshop 4: Formalizing the Network, Engaging
the Mediterranean. 16 – 20 November 2009. Adriatico Guest House UNESCO International
Centre for Theoretical Physics, Trieste, Italy.
Web-site consultation:
http://www.coastalatlas.net/, Last visited on 14/04/2011 at 13.45.

21807-REL-T002.1 page 222/337
4.5 Australian on-line Coastal Information
1 General Information
1a Name OzCoasts – Australian on-line Coastal Information
1b Description
OzCoasts is a freely accessible on-line system with a web-based in-terface that provides comprehensive information about Australia's coasts (including its estuaries and coastal waterways) to natural re-source managers, marine scientists, planners, policy makers and general public. The content of OzCoasts represents the collaborative efforts of more than 100 coastal scientists from a wide range of gov-ernment agencies and universities.
OzCoasts was originally called OzEstuaries and was developed dur-ing the first National Land and Water Resources Audit to incorporate the Australian Estuarine Database and estuarine datasets compiled in the 2000. The content of the web-site was upgraded several times during the years.
Information collected in the web-site is structured in modules that have been designed in different time steps starting from 2000, involv-ing collaboration with various partners. The web-site modules are:
- Climate Change; it provides information and tools to help com-municate the risks of sea level rise and other potential impacts of climate change on coastal areas.
- Conceptual Models; it provides information and useful diagrams on conceptual modelling of different ecosystems;
- Coastal Indicators; the coastal indicator knowledge and infor-mation system is an information source and education tool for managers, students, researchers and policy makers with an in-terest in the coastal zone. It consists of a series of fact sheets that provide background scientific information on issues and measures that are commonly used as indicators.
- Habitat Mapping; it provides different links to web-sites with in-teractive mapping tools dealing with specific areas. Some of them are interactive three dimension models (i.e. Sydney har-bour, Woody Island, Keppel Bay and Cockburn Sound);
- Natural Resource Management; it provides online access to key information and data that support Natural Resource Manage-ment Reporting. Information on natural resource condition in-forms policy at national and state levels, and underpins man-agement at regional and local scales;
- Landform and stability maps: it provides detailed coastal land-form and landform sensitivity mapping for the entire continental Australian coastline. Related (topography, bathymetry, estuaries, beaches, political boundaries, bio-regions, geology, infrastruc-ture and land uses and population centres) is provided through a Web-GIS interface.
21807-REL-T002.1 page 223/337
OzCoasts web-site also includes a “Search Data” function to under-take a simple and advance (estuary search, beach search and map search) search to obtain data and information.
It is important to highlight that OzCoasts web-site is highly articulated and contains various complex sections. This is a summary description that can only generally illustrate the completeness and complexity of the system.
1c Operating entity Marine and Coastal Environment Group Geoscience Australia
1d Management structure
Marine and Coastal Environment Group Geoscience Australia
1d Contacts
e-mail: [email protected]
OzCoasts Marine & Coastal Environment Group Geoscience Australia GPO Box 378 CANBERRA ACT 2601 Australia
Web-site: http://www.ozcoasts.org.au/about/about.jsp
1e Typology Operational
2 Operational context and information content
2a ICZM dimensions
OzCoasts addresses all the five considered information dimensions. The Coastal Indicators module includes information related to the ter-ritory, environmental, social and economic dimensions.
The governance dimension in depth covered by the “Natural Re-source Management” module. Indeed, this module allows to query all typologies of Regional plans and/or strategies for each Australian Re-gion.
2b ICZM Sectors
Data, geographic information and coastal indicators included in the various modules of the OzCoasts are related to the following main topics:
- Climate change and scenarios maps (Climate change module);
- Wide set of coastal indicators (Coastal indicators module) organ-ised in the following main categories and subcategories: (i) coastal issues, including the following sub-categories: declining water quality, climate change, habitat/species alterations, eco-nomic values and consequences; (ii) biophysical indicators, in-cluding the following sub-categories: water quality, sediment quality, habitant extent and quality, biotic indictors; (iii) pressure indicators, including the following sub-categories: agricultural, in-dustrial, urban, catchment condition; (iv) coastal management indicators (i.e. coastal care community groups, marine network participation, marine protected areas);
- Coastal habitats with some links at external web-site providing interactive mapping tools for the coastal habitats (Habitat map-ping module);
21807-REL-T002.1 page 224/337
- Land form and stability maps of the entire Australian coastal ar-ea, viewable through a Web-GIS component. The module pro-vides a detailed map of the coastal landform types (or geomor-phology) of continental Australia and most adjacent islands (ex-cluding the Great Barrier Reef). As a geomorphological map, it represents not just the topography of the coast, elevation and shape of the coastal landforms but it also indicates what the dif-fering coastal landforms are made of (e.g. varying rock types, laterite, coral, sand, mud, boulders, beachrock). The map classi-fies coastal landforms into differing combinations of form (gener-alised shape) and constituents (or fabric) which in turn are indic-ative of the differing natural processes by which each coastal landform has developed.
2c Integration
OzCoasts includes a wide range of integrated information. Some rele-vant examples are: land forms, stability maps, vulnerability to inunda-tion and different climate change scenarios maps. Furthermore a complete set of coastal indicators propose integrated views and anal-ysis of the coastal area (see 2a).
2d Spatial scale National – Australian coasts.
2e Flexibility The system has been developed in order to be applied specifically to the Australian coastal area.
3 ICZM functionalities
3a Knowledge relat-ed functionalities
OzCoasts provides a relevant number of knowledge related function-alities, specifically:
- Integration among different information sectors (see point 2c);
- Availability of spatial data; some information regarding the coastal habitat are downloadable in shape-files format. Other in-formation are available through the link to the original docu-ments;
- Inclusion of a wide set of indicators focusing on coastal man-agement, issues (see point 2b);
- Inside the OzCoasts are provided a lot of coastal indicators on different ICZM dimensions and sectors (see 2a and 2c);
- Inclusion of various information related to coastal vulnerability to climate change. In particular a specific module is entirely dedi-cated to climate change, including detailed maps of sea level rise vulnerability and other related information (for example in relation to adaptation strategies to climate change or elevation data and modelling). The indicator set contains a specific sub-category dedicated to climate change, including the following indicators: global warming, ocean acidification, saline intrusion, sea level rise, vector borne disease.
3b Process related functionalities
Process related functionalities are also widely covered by OzCoasts, specifically:
- OzCoasts offers a wide range of conceptual models, in particu-lar: beach geomorphic models, estuarine biophysical models, stressor models process/threat models. This module also ena-

21807-REL-T002.1 page 225/337
bles user to build its own conceptual models. Problem under-standing and conceptual modelling is also supported by the wide set of indicators and the module focusing on coastal landform and stability maps. Furthermore the system will soon include a Coastal Eutrophication Risk Assessment Tool.
- The coastal stakeholder link search (within the Search Data function) enables to search stakeholders involved in coastal management according to spatial criteria and governance levels. This tool can actually support stakeholder cooperation within the ICZM process;
- Similarly to the previous tool, the regional plan and strategies link search enables to search planning documents according to spa-tial and typology criteria (e.g. coastal action plan, estuarine man-agement plan, river plan, coastal management plan, wetland management plan, coastal strategies, etc.). This tool can proper-ly support ICZ planning and management.
- Scenario building is provided for coastal vulnerability to sea level rise; in particular detailed inundation maps are available for some coastal areas at the sub-national and local scale.
4 Users
4a User typology
OzCoasts contains a wide variety of information, thus potentially ad-dressing more users:
- Policy and decision-makers, may be more interested in summary information such as those provided by coastal indicators or relat-ed to vulnerability maps to sea level rise;
- Same information can be also very useful for coastal planners and/or managers, that can be also interested in information on plans and strategies related to the coastal zones as well as in pre-defined and customised conceptual models;
- Experts can find in the system specific data related to coastal habitats and spatial data related to landform and stability maps;
- Fact sheets on indicators can be also useful to improve civil so-ciety awareness on Australian coastal problems.
5 Use of the system
5a Accessibility Free access on-line to all Ozcoasts contents and its functionalities.
5b User-friendliness
Medium user-friendly.
OzCoasts is structured on functional modules (those described in point 1b); this actually helps significantly the use of the system. How-ever, also due to the complexity of the system use of some of the modules is not totally intuitive and requires a high number of steps.
5c Interactiveness
Two participation tools are included in the OzCoasts system:
- A tool for the creation of customised conceptual models of coastal habitats and processes;
- The coastal stakeholder link search (within the Search Data function) enabling users to search stakeholders involved in
21807-REL-T002.1 page 226/337
coastal management according to spatial and governance crite-ria. This tool can actually support stakeholder cooperation within the ICZM process.
5d Data access This field is not properly applicable to OzCoasts
6 Technological characteristics
6a Used technology OzCoasts is a web-site developed with java scripts languages and standards.
6b Integration with other tools
No integration with other tools. OzCoasts is actually a systems formed by various tools (or modules).
6c Integration with other CIS
No specific integration with other CIS. OzCoasts is actually an on-line system including a high number of link to other coastal systems and web-site.
6d Interoperability Not applicable
7 Cost/resources
7a Resources
Web-site consultation:
http://www.ozcoasts.org.au/; last visit on 28/03/2011 at 10.30
21807-REL-T002.1 page 227/337
5 In-depth analysis of selected CIS
5.1 Rationale
Out of the overview analysis a subset of coastal information systems has been selected for an
in-depth description. Selection was based on the qualitative assessment of main CISs charac-
teristics highlighted by the general overview analysis. In particular identified CISs were select-
ed since they:
Cover a wide range of ICZM information dimensions (information dimensions considered
in the analysis are: territory, environment, economy, society, governance) and sectors;
thus providing a comprehensive knowledge base to support ICZM implementation.
Provide good illustrative examples of integration among data and information related to
different ICZM sectors and dimensions, thus supporting the integrated analysis of com-
plex coastal systems in particular by means of summary information (e.g. indicators or in-
tegrated maps, such as for example maps of coastal vulnerability to single or multi risks)
concretely useful for decision and policy making.
Provide good illustrative examples of ICZM knowledge related functionalities, in particu-
lar: integrated analysis of different information (see previous point); operation at different
spatial scale supporting multi-scale and/or cross-border analysis; multi-time data set ena-
bling the analysis of past trends of key coastal processes and supporting the definition of
possible future evolution; use of ICZM indicators; inclusion of maps on coastal vulnerabil-
ity to climate changes and other risks.
Are directly related to an ICZM process, that in some cases have also acted as key driver
for the development and implementation of the coastal information system.
Provide good examples of ICZM process related functionalities, such as those support-
ing: problem understanding (e.g. assessment of impacts, vulnerability and risk) and struc-
turing (i.e. conceptual modelling of identified problems); stakeholder involvement and par-
ticipation (i.e. through Web-GIS and/or other e-participation tools), vision building and
scenario development; assessment of alternatives in planning and/or management; moni-
toring and evaluation.
Are integrated with other tools (e.g. models, relational database, decision support sys-
tems, web viewers for indicators and/or statistics, etc.) and/or other coastal information
systems (also through international networks such as ICAN) that can significantly improve
the functionalities of the specific CIS, its capacity in providing data and information useful
for the ICZM process and enhance opportunities for the exchange of experiences and
best practices.
Above criteria were used to select cases to be in-depth described. The identified subset as a
whole widely covers these criteria; this actually means that each specific coastal information
system included in the subset positively responds to more than one single criteria, although
generally not to all of them. Selection based on criteria judgement was reviewed in order to
include illustrative cases representing various:
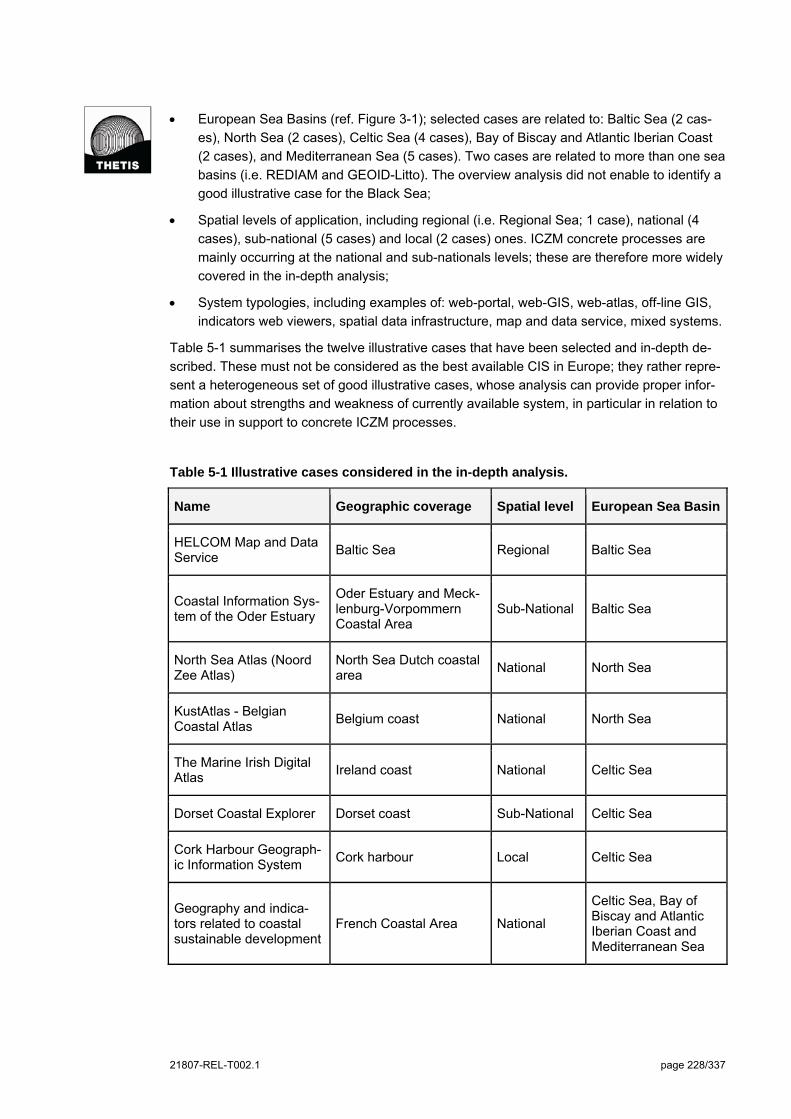
21807-REL-T002.1 page 228/337
European Sea Basins (ref. Figure 3-1); selected cases are related to: Baltic Sea (2 cas-
es), North Sea (2 cases), Celtic Sea (4 cases), Bay of Biscay and Atlantic Iberian Coast
(2 cases), and Mediterranean Sea (5 cases). Two cases are related to more than one sea
basins (i.e. REDIAM and GEOID-Litto). The overview analysis did not enable to identify a
good illustrative case for the Black Sea;
Spatial levels of application, including regional (i.e. Regional Sea; 1 case), national (4
cases), sub-national (5 cases) and local (2 cases) ones. ICZM concrete processes are
mainly occurring at the national and sub-nationals levels; these are therefore more widely
covered in the in-depth analysis;
System typologies, including examples of: web-portal, web-GIS, web-atlas, off-line GIS,
indicators web viewers, spatial data infrastructure, map and data service, mixed systems.
Table 5-1 summarises the twelve illustrative cases that have been selected and in-depth de-
scribed. These must not be considered as the best available CIS in Europe; they rather repre-
sent a heterogeneous set of good illustrative cases, whose analysis can provide proper infor-
mation about strengths and weakness of currently available system, in particular in relation to
their use in support to concrete ICZM processes.
Table 5-1 Illustrative cases considered in the in-depth analysis.
Name Geographic coverage Spatial level European Sea Basin
HELCOM Map and Data Service
Baltic Sea Regional Baltic Sea
Coastal Information Sys-tem of the Oder Estuary
Oder Estuary and Meck-lenburg-Vorpommern Coastal Area
Sub-National Baltic Sea
North Sea Atlas (Noord Zee Atlas)
North Sea Dutch coastal area
National North Sea
KustAtlas - Belgian Coastal Atlas
Belgium coast National North Sea
The Marine Irish Digital Atlas
Ireland coast National Celtic Sea
Dorset Coastal Explorer Dorset coast Sub-National Celtic Sea
Cork Harbour Geograph-ic Information System
Cork harbour Local Celtic Sea
Geography and indica-tors related to coastal sustainable development
French Coastal Area National
Celtic Sea, Bay of Biscay and Atlantic Iberian Coast and Mediterranean Sea
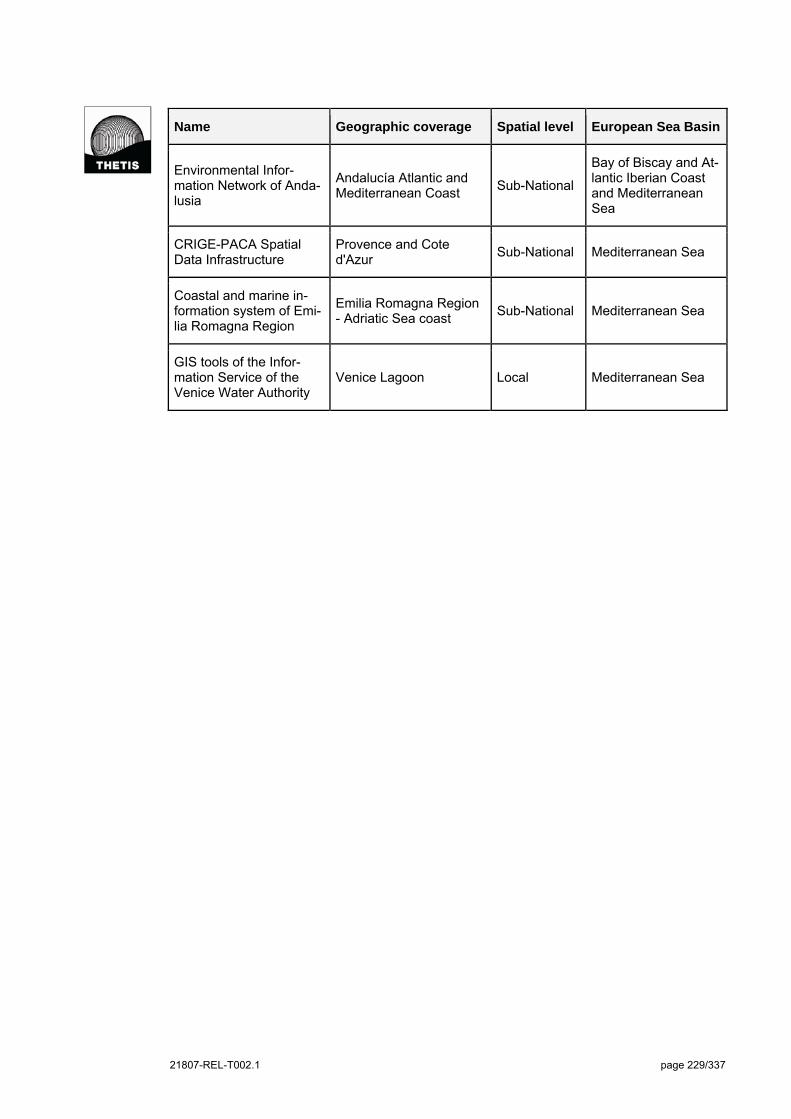
21807-REL-T002.1 page 229/337
Name Geographic coverage Spatial level European Sea Basin
Environmental Infor-mation Network of Anda-lusia
Andalucía Atlantic and Mediterranean Coast
Sub-National
Bay of Biscay and At-lantic Iberian Coast and Mediterranean Sea
CRIGE-PACA Spatial Data Infrastructure
Provence and Cote d'Azur
Sub-National Mediterranean Sea
Coastal and marine in-formation system of Emi-lia Romagna Region
Emilia Romagna Region - Adriatic Sea coast
Sub-National Mediterranean Sea
GIS tools of the Infor-mation Service of the Venice Water Authority
Venice Lagoon Local Mediterranean Sea
21807-REL-T002.1 page 230/337
5.2 HELCOM Map and Data Service
General Information
One of the main roles of Helsinki Commission (HELCOM) is to act as regional environmental
focal point, providing access to a wide range of information on pressures, state and trends
characterising the coastal and marine environment of the Baltic Sea.
During recent years, HELCOM has been increasingly using GIS solutions to analyse data and
to visualise complex scientific information on both static maps and interactive internet based
maps.
The HELCOM Map and Data Service (MDS) aims to make environmental information accessi-
ble for stakeholders and for general public, providing data on efficiency of measures under-
taken to protect the Baltic Sea, information about monitoring activities and regional prepared-
ness for accident response. HELCOM MDS gives particular attention to the issue of nutrients
and hazardous substances loads to the Baltic Sea and their effect on the marine ecosystem.
HELCOM MDS is formally operated by the Secretariat of the Helsinki Commission (Baltic Ma-
rine Environment Protection Commission). A contractual agreement has been set by HELCOM
with centres providing data to the system.
The HELCOM MDS current on-line is a recently updated version, which has been made pos-
sible by the work of the HELCOM project Development of HELCOM Data and Geographic In-
formation System which is funded by the Nordic Council of Minsters during 2009-2010.
HELCOM MDS is configured as a Web-GIS visualising and making accessible Baltic Sea re-
lated datasets . Former GIS map services (e.g. MARIS; Nutrient GIS; Marine spatial GIS;
Coastal fish monitoring; COMBINE monitoring GIS and Data delivery service) have been joint
into one single service, making it easier to combine and analyze data.
From the web site of HELCOM MDS, http://maps.helcom.fi/website/mapservice/index.html,
(Figure 5-1), users are able to:
visualize, analyze and search Baltic Sea environmental data;
draw and save or print customized maps;
download ESRI shape files;
access layers in OGC WMS standard protocol.
For any feedback, questions or assistance, data administrator at HELCOM Secretariat (Kata-
janokanlaituri 6 B, FI-00170 Helsinki Finland), Joni Kairaranta can be contacted at
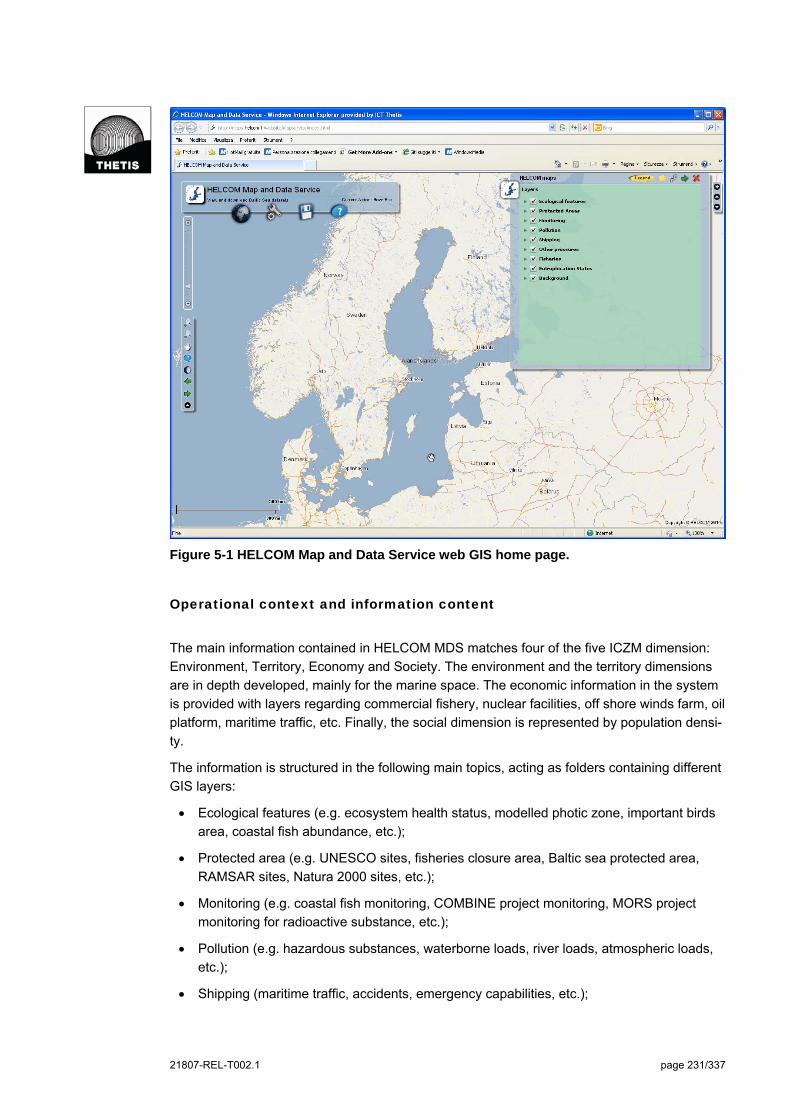
21807-REL-T002.1 page 231/337
Figure 5-1 HELCOM Map and Data Service web GIS home page.
Operational context and information content
The main information contained in HELCOM MDS matches four of the five ICZM dimension:
Environment, Territory, Economy and Society. The environment and the territory dimensions
are in depth developed, mainly for the marine space. The economic information in the system
is provided with layers regarding commercial fishery, nuclear facilities, off shore winds farm, oil
platform, maritime traffic, etc. Finally, the social dimension is represented by population densi-
ty.
The information is structured in the following main topics, acting as folders containing different
GIS layers:
Ecological features (e.g. ecosystem health status, modelled photic zone, important birds
area, coastal fish abundance, etc.);
Protected area (e.g. UNESCO sites, fisheries closure area, Baltic sea protected area,
RAMSAR sites, Natura 2000 sites, etc.);
Monitoring (e.g. coastal fish monitoring, COMBINE project monitoring, MORS project
monitoring for radioactive substance, etc.);
Pollution (e.g. hazardous substances, waterborne loads, river loads, atmospheric loads,
etc.);
Shipping (maritime traffic, accidents, emergency capabilities, etc.);

21807-REL-T002.1 page 232/337
Pressures (e.g. Baltic Sea Pressure Index, Baltic Sea Impacts Index, coastal defence
structures, etc.);
Fisheries (e.g. total commercial fishery, etc.);
Eutrophication status (e.g. nutrients, chlorophyll, benthic invertebrate communities)
Background layer information related to the marine and terrestrial environment (e.g.
Corine land cover, population density in the Baltic basin, etc.).
Data come from different providers, mainly the HELCOM secretariat, the Finnish Environmen-
tal Institute (SYKE), the Radiation and Nuclear Safety Authority of Finland (STUK), the Euro-
pean Monitoring and Evaluation Programme (EMEP), the International Council for exploration
of the Sea (ICES).
The HELCOM MDS provides various examples of integration among data related to different
sectors and information dimensions (Table 5-2). They mainly concern the following 3 thematic
issues:
the integrated assessment of the environmental status of coastal areas and open sea
(ecological, chemical, biological and eutrophication state);
the overall assessment of pressure and impacts from anthropogenic sources;
shore sensitivity to oil spill.

21807-REL-T002.1 page 233/337
Table 5-2 Integrated data published in HELCOM MDS.
Folder Layer Explanation
Ecological features
Overall eco-system health status, coastal area/open sea
Integrated classification of the ecosystem health status (HOLAS) in coastal/open sea assessment units. The ho-listic assessment builds on three thematic assessments: 1) Biodiversity status assessment tool (BEAT) 2) Chemi-cal status assessment tool (CHASE) 3) Eutrophication status assessment tool (HEAT)
Overall Biodi-versity status, coastal ar-ea/open sea
Integrated classification on biodiversity status of the Baltic Sea (BEAT) in coastal sites/open sea. It is the end result of the HELCOM Biodiversity Assessment Tool (BEAT).
Pollution
Overall chemi-cal status, coastal ar-ea/open sea
Integrated classification of the hazardous substances sta-tus in coastal assessment units, using the HELCOM Haz-ardous Substances Status Assessment Tool (CHASE)
Shipping
Shore sensitiv-ity to oil spill, summer, win-ter
Ranked polygons based on their sensitivity to oil spills.
Other pressures
Baltic sea Pressure In-dex
Baltic Sea Pressure Index (BSPI- HOLAS project), calcu-lated from spatial analysis of 52 human activities causing pressures on the Baltic Sea marine environment
Baltic Sea Im-pact Index
Baltic Sea Impact Index (BSII- HOLAS project), calculated from spatial analysis of 52 human activities causing im-pacts on the Baltic Sea marine environment
Eutrophication status
Overall (inte-grated) eu-trophication status, coastal area/open sea
Classification of Eutrophication status based on an inte-gration of all core set indicators using the HELCOM eu-trophication assessment tool (HEAT).
For all the available layers, HELCOM MDS allows easy access to detailed and clear metadata
(metadata sheets). They are structured and described according to the standard ISO 19115
and are compliant with the INSPIRE Directive standard.
HELCOM MDS, covering the whole Baltic Sea Area, is specifically developed to address Baltic
Sea specificities. Layers fit to the whole Baltic Sea and the Baltic coastal area, allowing zoom
to visualize information with more detail. A bookmark function, available among the web-GIS
tools, allows to switch quickly to customized subregions of Baltic Sea. Two bookmarks already
available as examples in the HELCOM MDS are “Gulf of Finland” and “Bothnian Bay” (Figure
5-2).
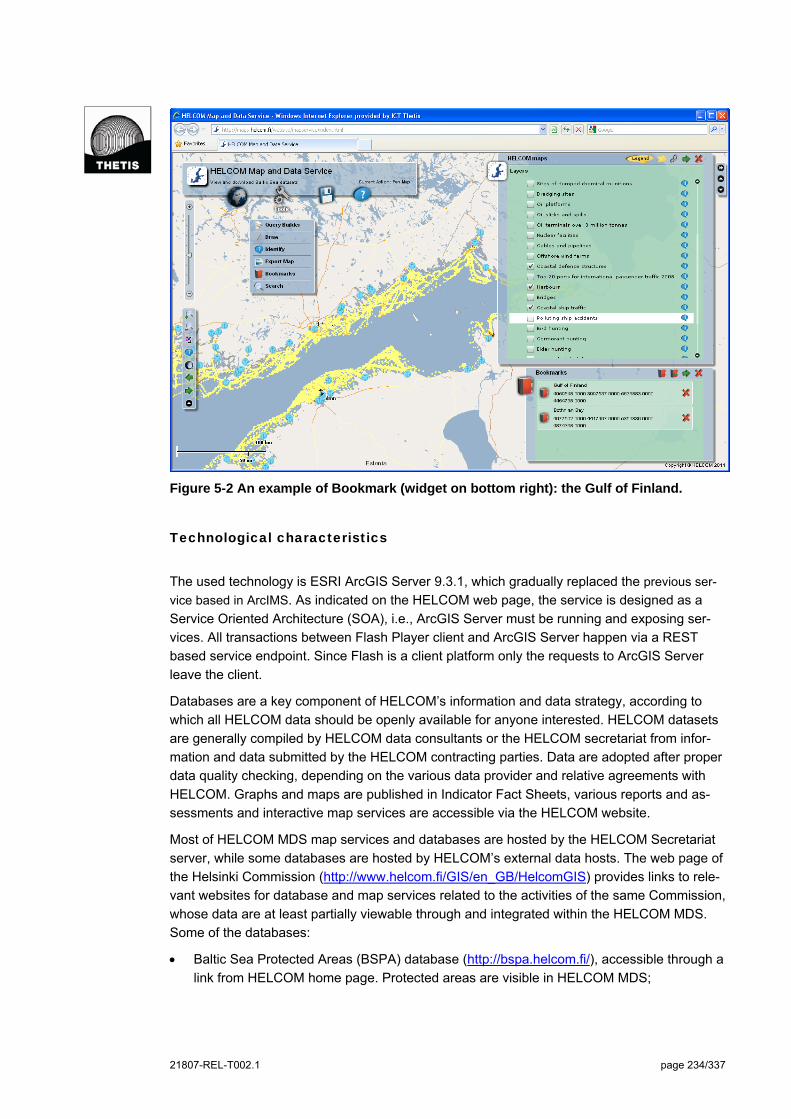
21807-REL-T002.1 page 234/337
Figure 5-2 An example of Bookmark (widget on bottom right): the Gulf of Finland.
Technological characteristics
The used technology is ESRI ArcGIS Server 9.3.1, which gradually replaced the previous ser-
vice based in ArcIMS. As indicated on the HELCOM web page, the service is designed as a
Service Oriented Architecture (SOA), i.e., ArcGIS Server must be running and exposing ser-
vices. All transactions between Flash Player client and ArcGIS Server happen via a REST
based service endpoint. Since Flash is a client platform only the requests to ArcGIS Server
leave the client.
Databases are a key component of HELCOM’s information and data strategy, according to
which all HELCOM data should be openly available for anyone interested. HELCOM datasets
are generally compiled by HELCOM data consultants or the HELCOM secretariat from infor-
mation and data submitted by the HELCOM contracting parties. Data are adopted after proper
data quality checking, depending on the various data provider and relative agreements with
HELCOM. Graphs and maps are published in Indicator Fact Sheets, various reports and as-
sessments and interactive map services are accessible via the HELCOM website.
Most of HELCOM MDS map services and databases are hosted by the HELCOM Secretariat
server, while some databases are hosted by HELCOM’s external data hosts. The web page of
the Helsinki Commission (http://www.helcom.fi/GIS/en_GB/HelcomGIS) provides links to rele-
vant websites for database and map services related to the activities of the same Commission,
whose data are at least partially viewable through and integrated within the HELCOM MDS.
Some of the databases:
Baltic Sea Protected Areas (BSPA) database (http://bspa.helcom.fi/), accessible through a
link from HELCOM home page. Protected areas are visible in HELCOM MDS;
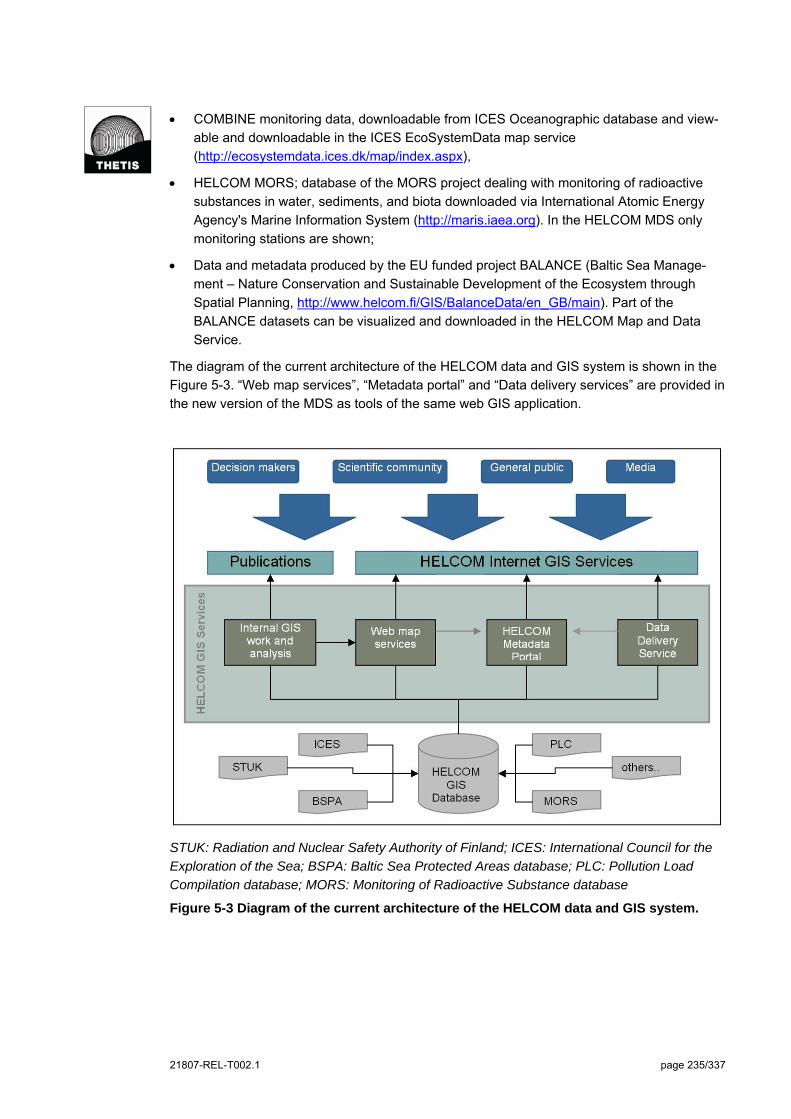
21807-REL-T002.1 page 235/337
COMBINE monitoring data, downloadable from ICES Oceanographic database and view-
able and downloadable in the ICES EcoSystemData map service
(http://ecosystemdata.ices.dk/map/index.aspx),
HELCOM MORS; database of the MORS project dealing with monitoring of radioactive
substances in water, sediments, and biota downloaded via International Atomic Energy
Agency's Marine Information System (http://maris.iaea.org). In the HELCOM MDS only
monitoring stations are shown;
Data and metadata produced by the EU funded project BALANCE (Baltic Sea Manage-
ment – Nature Conservation and Sustainable Development of the Ecosystem through
Spatial Planning, http://www.helcom.fi/GIS/BalanceData/en_GB/main). Part of the
BALANCE datasets can be visualized and downloaded in the HELCOM Map and Data
Service.
The diagram of the current architecture of the HELCOM data and GIS system is shown in the
Figure 5-3. “Web map services”, “Metadata portal” and “Data delivery services” are provided in
the new version of the MDS as tools of the same web GIS application.
STUK: Radiation and Nuclear Safety Authority of Finland; ICES: International Council for the
Exploration of the Sea; BSPA: Baltic Sea Protected Areas database; PLC: Pollution Load
Compilation database; MORS: Monitoring of Radioactive Substance database
Figure 5-3 Diagram of the current architecture of the HELCOM data and GIS system.
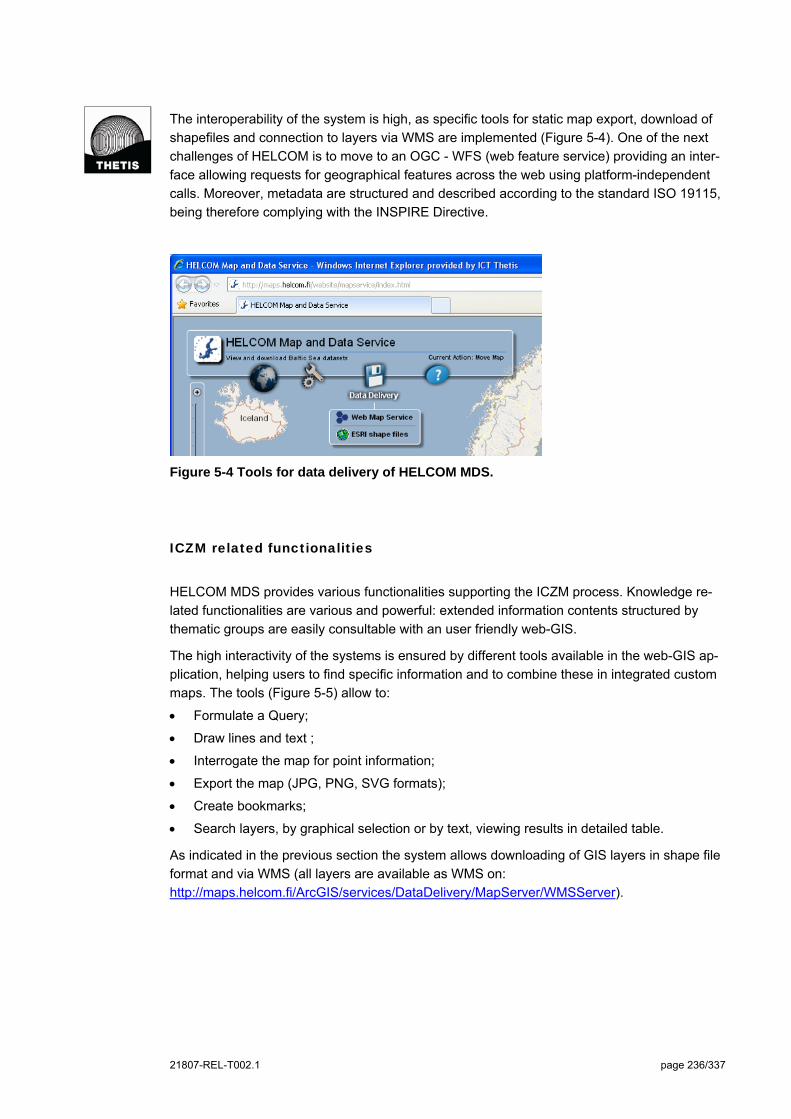
21807-REL-T002.1 page 236/337
The interoperability of the system is high, as specific tools for static map export, download of
shapefiles and connection to layers via WMS are implemented (Figure 5-4). One of the next
challenges of HELCOM is to move to an OGC - WFS (web feature service) providing an inter-
face allowing requests for geographical features across the web using platform-independent
calls. Moreover, metadata are structured and described according to the standard ISO 19115,
being therefore complying with the INSPIRE Directive.
Figure 5-4 Tools for data delivery of HELCOM MDS.
ICZM related functionalities
HELCOM MDS provides various functionalities supporting the ICZM process. Knowledge re-
lated functionalities are various and powerful: extended information contents structured by
thematic groups are easily consultable with an user friendly web-GIS.
The high interactivity of the systems is ensured by different tools available in the web-GIS ap-
plication, helping users to find specific information and to combine these in integrated custom
maps. The tools (Figure 5-5) allow to:
Formulate a Query;
Draw lines and text ;
Interrogate the map for point information;
Export the map (JPG, PNG, SVG formats);
Create bookmarks;
Search layers, by graphical selection or by text, viewing results in detailed table.
As indicated in the previous section the system allows downloading of GIS layers in shape file
format and via WMS (all layers are available as WMS on:
http://maps.helcom.fi/ArcGIS/services/DataDelivery/MapServer/WMSServer).
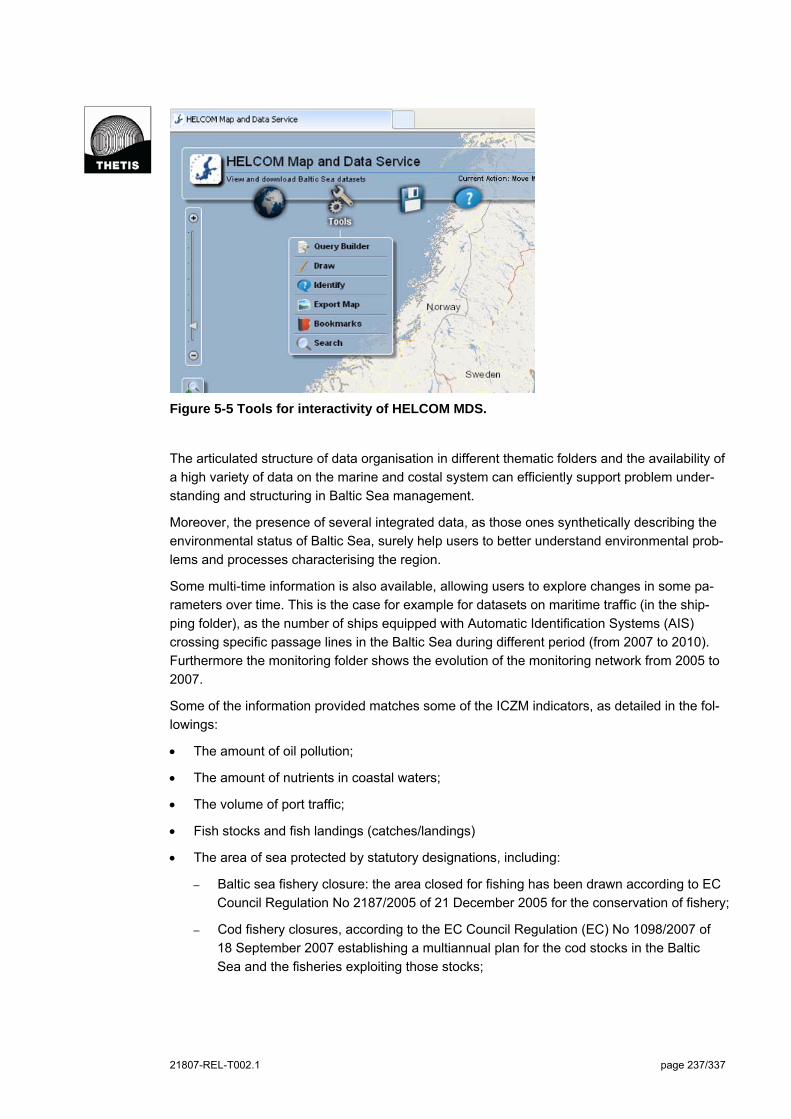
21807-REL-T002.1 page 237/337
Figure 5-5 Tools for interactivity of HELCOM MDS.
The articulated structure of data organisation in different thematic folders and the availability of
a high variety of data on the marine and costal system can efficiently support problem under-
standing and structuring in Baltic Sea management.
Moreover, the presence of several integrated data, as those ones synthetically describing the
environmental status of Baltic Sea, surely help users to better understand environmental prob-
lems and processes characterising the region.
Some multi-time information is also available, allowing users to explore changes in some pa-
rameters over time. This is the case for example for datasets on maritime traffic (in the ship-
ping folder), as the number of ships equipped with Automatic Identification Systems (AIS)
crossing specific passage lines in the Baltic Sea during different period (from 2007 to 2010).
Furthermore the monitoring folder shows the evolution of the monitoring network from 2005 to
2007.
Some of the information provided matches some of the ICZM indicators, as detailed in the fol-
lowings:
The amount of oil pollution;
The amount of nutrients in coastal waters;
The volume of port traffic;
Fish stocks and fish landings (catches/landings)
The area of sea protected by statutory designations, including:
– Baltic sea fishery closure: the area closed for fishing has been drawn according to EC
Council Regulation No 2187/2005 of 21 December 2005 for the conservation of fishery;
– Cod fishery closures, according to the EC Council Regulation (EC) No 1098/2007 of
18 September 2007 establishing a multiannual plan for the cod stocks in the Baltic
Sea and the fisheries exploiting those stocks;
21807-REL-T002.1 page 238/337
– Baltic sea protected area: it includes the borders of designated Baltic Sea Protected
Areas, according to the HELCOM Recommendation 15/5 (1994);
– Ramsar sites;
– Natura 2000 sites.
More in general the system is intended to provide knowledge-based support to the activities of
the Helsinki Commission related to the integrated planning and management of the marine
and coastal environment of the Baltic Sea. HELCOM MDS, acting as data integrator, is indeed
a fundamental information system for Baltic Sea management and planning.
System development and management
One of the main challenge of The HELCOM MDS is to constitute a data integrator from differ-
ent data sources. Data comes from different databases and different data providers and there-
fore one of the main difficulties encountered by the system developers is related to the hetero-
geneity of the available data, each of them having different format, different quality level and
different or lacking metadata. The process of data check and data validation, carried out by
the HELCOM secretariat and its data consultants, is therefore different depending on the dif-
ferent data providers and on the established agreement with them.
The data updating is periodically performed to maintain the Map and Data Service, depending
on the availability of relevant new data as well as regular reporting requirements under the
HELCOM framework (e.g. shipping accidents, illegal discharges, pollution loads etc).
The current application of the ArcGIS Server based HELCOM MDS developed during 2009-
2010, is the result of a long work starting about 5 years ago with:
A first application of MARIS (2005-2007), developed at SYKE (the Finnish Environmental
Institute), only hosted by HELCOM.
A following ArcIMS based systems, developed at HELCOM (2007-2009). The work in-
volved one person working part time with map services with additional help from 2-3 per-
son for layer preparation and optimization. Additionally, the HELCOM GIS system was de-
veloped with expert input provided on a project basis.
The now available application and the current maintaining and updating of HELCOM Map and
data service for 2011 is carried out by one person working full time with data administration
issues. Input in layer preparation and optimization is also provided by ~2-3 persons as well as
various HELCOM projects.
The target users of the HELCOM MDS are:
Decision-makers, at the Regional Sea level;
Coastal planners and/or managers, at the Regional Sea level;
Specialised and expert users;
Civil society, for awareness and communication issues related to the sustainable use of
the Baltic Sea;
Teachers and students for education programmes.
All the information published in HELCOM MDS is public, without any restriction or privilege for
different users.
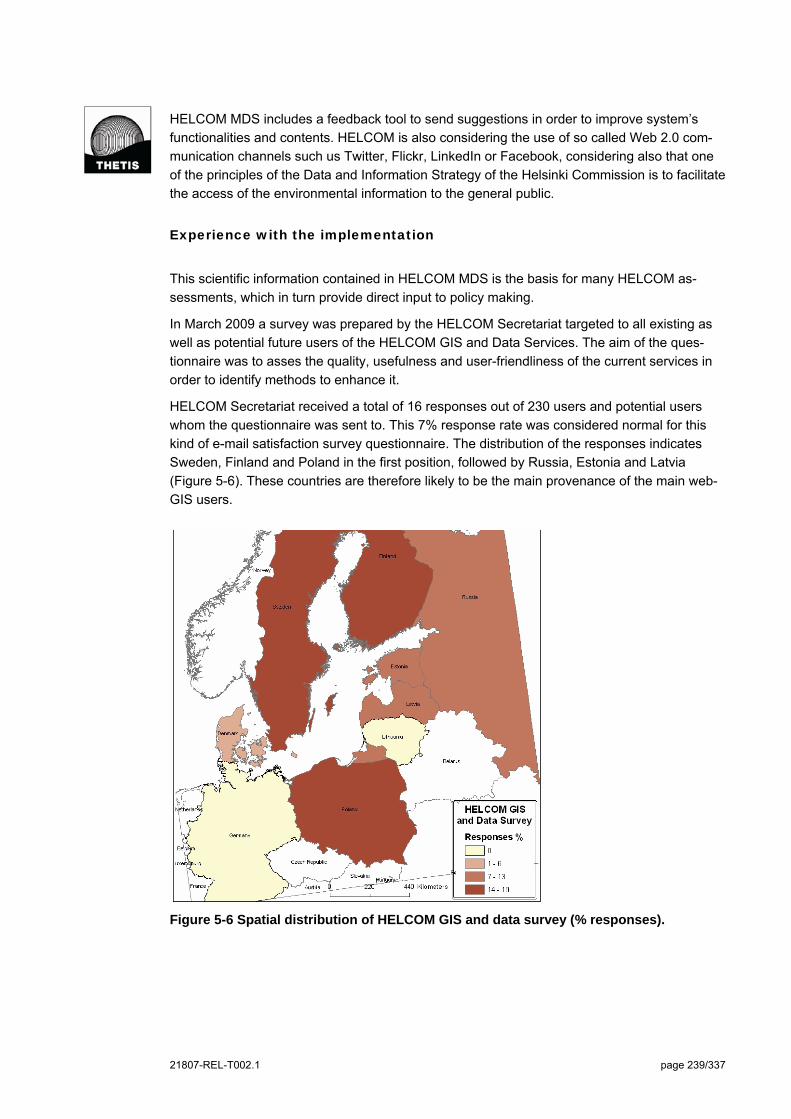
21807-REL-T002.1 page 239/337
HELCOM MDS includes a feedback tool to send suggestions in order to improve system’s
functionalities and contents. HELCOM is also considering the use of so called Web 2.0 com-
munication channels such us Twitter, Flickr, LinkedIn or Facebook, considering also that one
of the principles of the Data and Information Strategy of the Helsinki Commission is to facilitate
the access of the environmental information to the general public.
Experience with the implementation
This scientific information contained in HELCOM MDS is the basis for many HELCOM as-
sessments, which in turn provide direct input to policy making.
In March 2009 a survey was prepared by the HELCOM Secretariat targeted to all existing as
well as potential future users of the HELCOM GIS and Data Services. The aim of the ques-
tionnaire was to asses the quality, usefulness and user-friendliness of the current services in
order to identify methods to enhance it.
HELCOM Secretariat received a total of 16 responses out of 230 users and potential users
whom the questionnaire was sent to. This 7% response rate was considered normal for this
kind of e-mail satisfaction survey questionnaire. The distribution of the responses indicates
Sweden, Finland and Poland in the first position, followed by Russia, Estonia and Latvia
(Figure 5-6). These countries are therefore likely to be the main provenance of the main web-
GIS users.
Figure 5-6 Spatial distribution of HELCOM GIS and data survey (% responses).
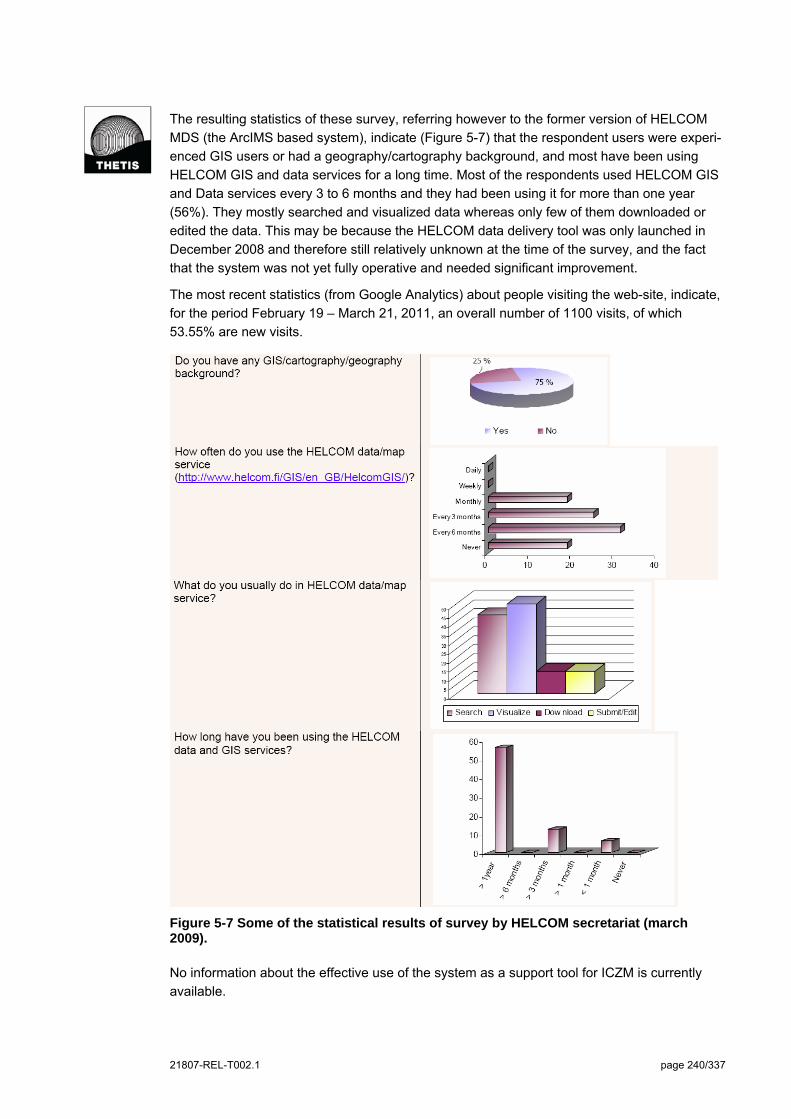
21807-REL-T002.1 page 240/337
The resulting statistics of these survey, referring however to the former version of HELCOM
MDS (the ArcIMS based system), indicate (Figure 5-7) that the respondent users were experi-
enced GIS users or had a geography/cartography background, and most have been using
HELCOM GIS and data services for a long time. Most of the respondents used HELCOM GIS
and Data services every 3 to 6 months and they had been using it for more than one year
(56%). They mostly searched and visualized data whereas only few of them downloaded or
edited the data. This may be because the HELCOM data delivery tool was only launched in
December 2008 and therefore still relatively unknown at the time of the survey, and the fact
that the system was not yet fully operative and needed significant improvement.
The most recent statistics (from Google Analytics) about people visiting the web-site, indicate,
for the period February 19 – March 21, 2011, an overall number of 1100 visits, of which
53.55% are new visits.
Figure 5-7 Some of the statistical results of survey by HELCOM secretariat (march 2009).
No information about the effective use of the system as a support tool for ICZM is currently
available.
21807-REL-T002.1 page 241/337
Concluding remarks
HELCOM Map and Data Service is the result of a successful project of data integration com-
bined with top of the range technological solutions for data publication and sharing.
The focus of the service, as defined by Helsinki Commission itself, is to provide a tool to sup-
port environmental planning of the Baltic Sea, which is a fundamental aspect of ICZM.
On the other hand, information on coastal characteristics and dynamics is not very detailed,
and actually the system is poorly linked with coastal plans and policies.
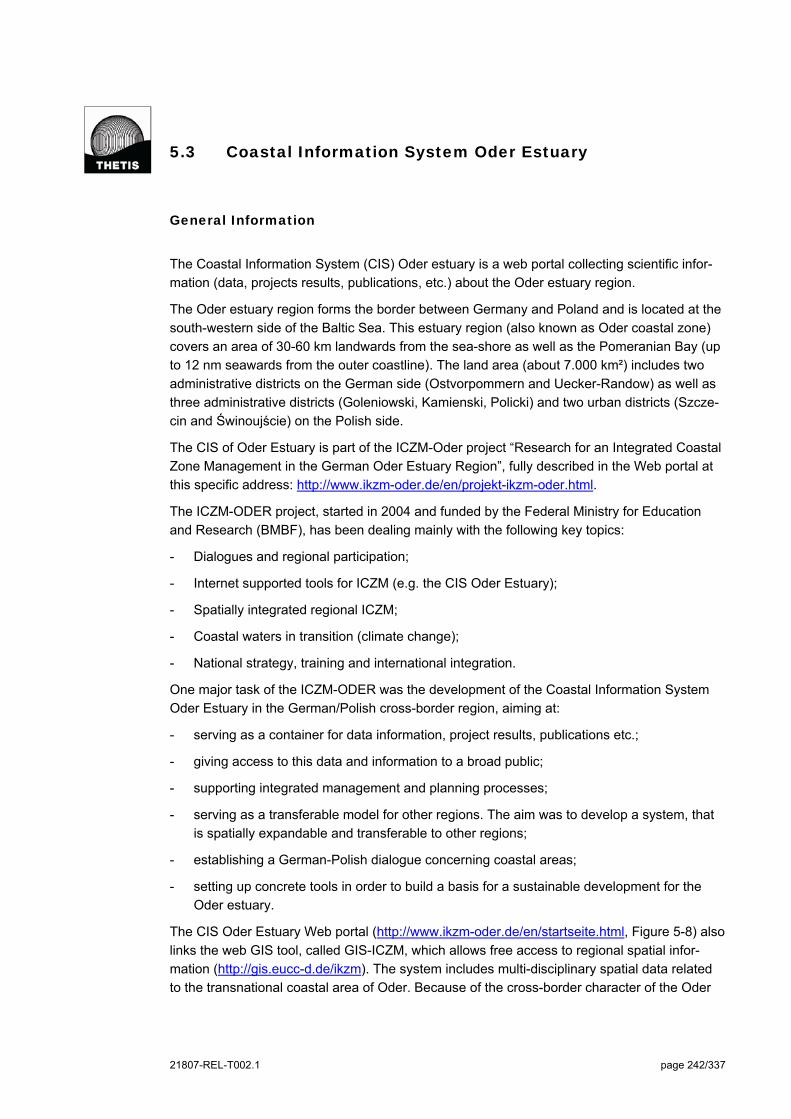
21807-REL-T002.1 page 242/337
5.3 Coastal Information System Oder Estuary
General Information
The Coastal Information System (CIS) Oder estuary is a web portal collecting scientific infor-
mation (data, projects results, publications, etc.) about the Oder estuary region.
The Oder estuary region forms the border between Germany and Poland and is located at the
south-western side of the Baltic Sea. This estuary region (also known as Oder coastal zone)
covers an area of 30-60 km landwards from the sea-shore as well as the Pomeranian Bay (up
to 12 nm seawards from the outer coastline). The land area (about 7.000 km²) includes two
administrative districts on the German side (Ostvorpommern and Uecker-Randow) as well as
three administrative districts (Goleniowski, Kamienski, Policki) and two urban districts (Szcze-
cin and Świnoujście) on the Polish side.
The CIS of Oder Estuary is part of the ICZM-Oder project “Research for an Integrated Coastal
Zone Management in the German Oder Estuary Region”, fully described in the Web portal at
this specific address: http://www.ikzm-oder.de/en/projekt-ikzm-oder.html.
The ICZM-ODER project, started in 2004 and funded by the Federal Ministry for Education
and Research (BMBF), has been dealing mainly with the following key topics:
- Dialogues and regional participation;
- Internet supported tools for ICZM (e.g. the CIS Oder Estuary);
- Spatially integrated regional ICZM;
- Coastal waters in transition (climate change);
- National strategy, training and international integration.
One major task of the ICZM-ODER was the development of the Coastal Information System
Oder Estuary in the German/Polish cross-border region, aiming at:
- serving as a container for data information, project results, publications etc.;
- giving access to this data and information to a broad public;
- supporting integrated management and planning processes;
- serving as a transferable model for other regions. The aim was to develop a system, that
is spatially expandable and transferable to other regions;
- establishing a German-Polish dialogue concerning coastal areas;
- setting up concrete tools in order to build a basis for a sustainable development for the
Oder estuary.
The CIS Oder Estuary Web portal (http://www.ikzm-oder.de/en/startseite.html, Figure 5-8) also
links the web GIS tool, called GIS-ICZM, which allows free access to regional spatial infor-
mation (http://gis.eucc-d.de/ikzm). The system includes multi-disciplinary spatial data related
to the transnational coastal area of Oder. Because of the cross-border character of the Oder
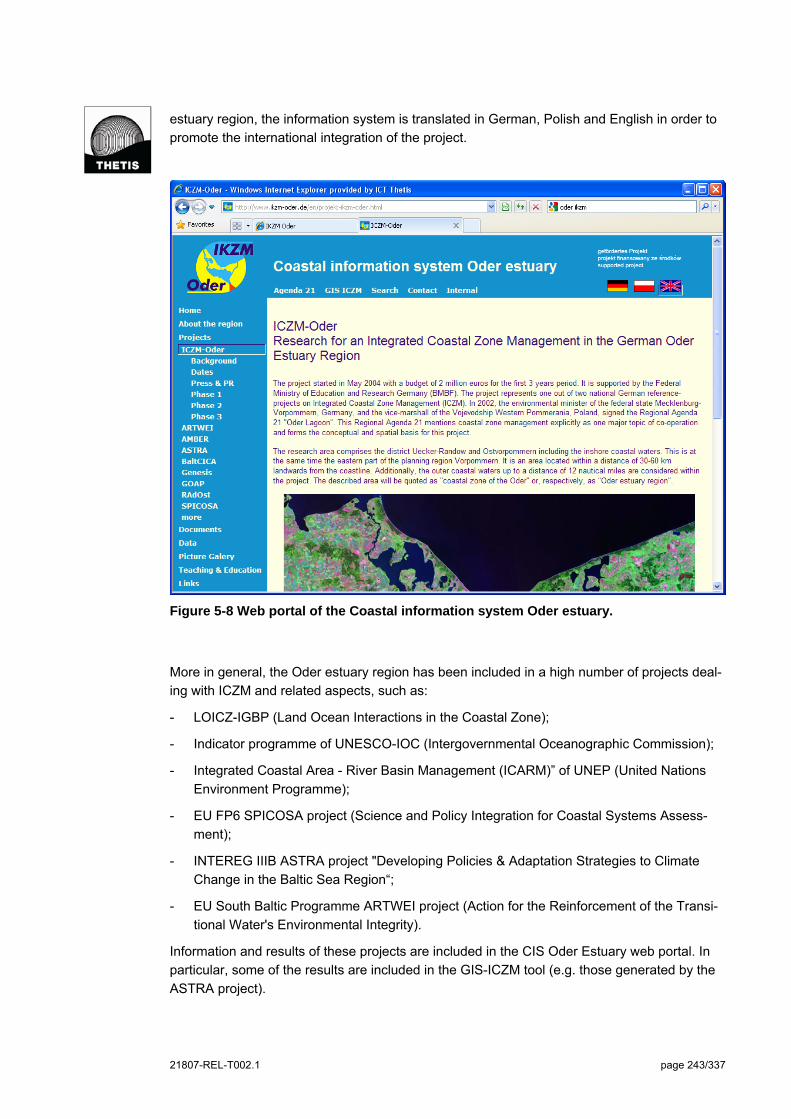
21807-REL-T002.1 page 243/337
estuary region, the information system is translated in German, Polish and English in order to
promote the international integration of the project.
Figure 5-8 Web portal of the Coastal information system Oder estuary.
More in general, the Oder estuary region has been included in a high number of projects deal-
ing with ICZM and related aspects, such as:
- LOICZ-IGBP (Land Ocean Interactions in the Coastal Zone);
- Indicator programme of UNESCO-IOC (Intergovernmental Oceanographic Commission);
- Integrated Coastal Area - River Basin Management (ICARM)” of UNEP (United Nations
Environment Programme);
- EU FP6 SPICOSA project (Science and Policy Integration for Coastal Systems Assess-
ment);
- INTEREG IIIB ASTRA project "Developing Policies & Adaptation Strategies to Climate
Change in the Baltic Sea Region“;
- EU South Baltic Programme ARTWEI project (Action for the Reinforcement of the Transi-
tional Water's Environmental Integrity).
Information and results of these projects are included in the CIS Oder Estuary web portal. In
particular, some of the results are included in the GIS-ICZM tool (e.g. those generated by the
ASTRA project).
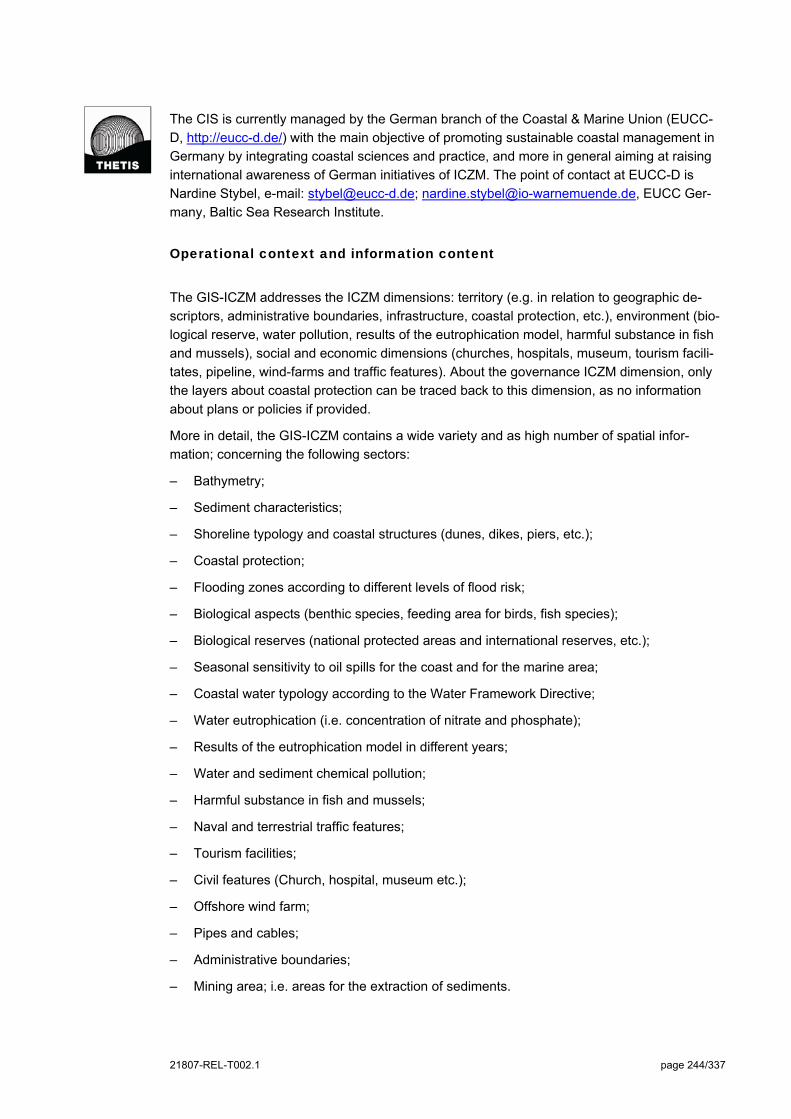
21807-REL-T002.1 page 244/337
The CIS is currently managed by the German branch of the Coastal & Marine Union (EUCC-
D, http://eucc-d.de/) with the main objective of promoting sustainable coastal management in
Germany by integrating coastal sciences and practice, and more in general aiming at raising
international awareness of German initiatives of ICZM. The point of contact at EUCC-D is
Nardine Stybel, e-mail: [email protected]; [email protected], EUCC Ger-
many, Baltic Sea Research Institute.
Operational context and information content
The GIS-ICZM addresses the ICZM dimensions: territory (e.g. in relation to geographic de-
scriptors, administrative boundaries, infrastructure, coastal protection, etc.), environment (bio-
logical reserve, water pollution, results of the eutrophication model, harmful substance in fish
and mussels), social and economic dimensions (churches, hospitals, museum, tourism facili-
tates, pipeline, wind-farms and traffic features). About the governance ICZM dimension, only
the layers about coastal protection can be traced back to this dimension, as no information
about plans or policies if provided.
More in detail, the GIS-ICZM contains a wide variety and as high number of spatial infor-
mation; concerning the following sectors:
– Bathymetry;
– Sediment characteristics;
– Shoreline typology and coastal structures (dunes, dikes, piers, etc.);
– Coastal protection;
– Flooding zones according to different levels of flood risk;
– Biological aspects (benthic species, feeding area for birds, fish species);
– Biological reserves (national protected areas and international reserves, etc.);
– Seasonal sensitivity to oil spills for the coast and for the marine area;
– Coastal water typology according to the Water Framework Directive;
– Water eutrophication (i.e. concentration of nitrate and phosphate);
– Results of the eutrophication model in different years;
– Water and sediment chemical pollution;
– Harmful substance in fish and mussels;
– Naval and terrestrial traffic features;
– Tourism facilities;
– Civil features (Church, hospital, museum etc.);
– Offshore wind farm;
– Pipes and cables;
– Administrative boundaries;
– Mining area; i.e. areas for the extraction of sediments.
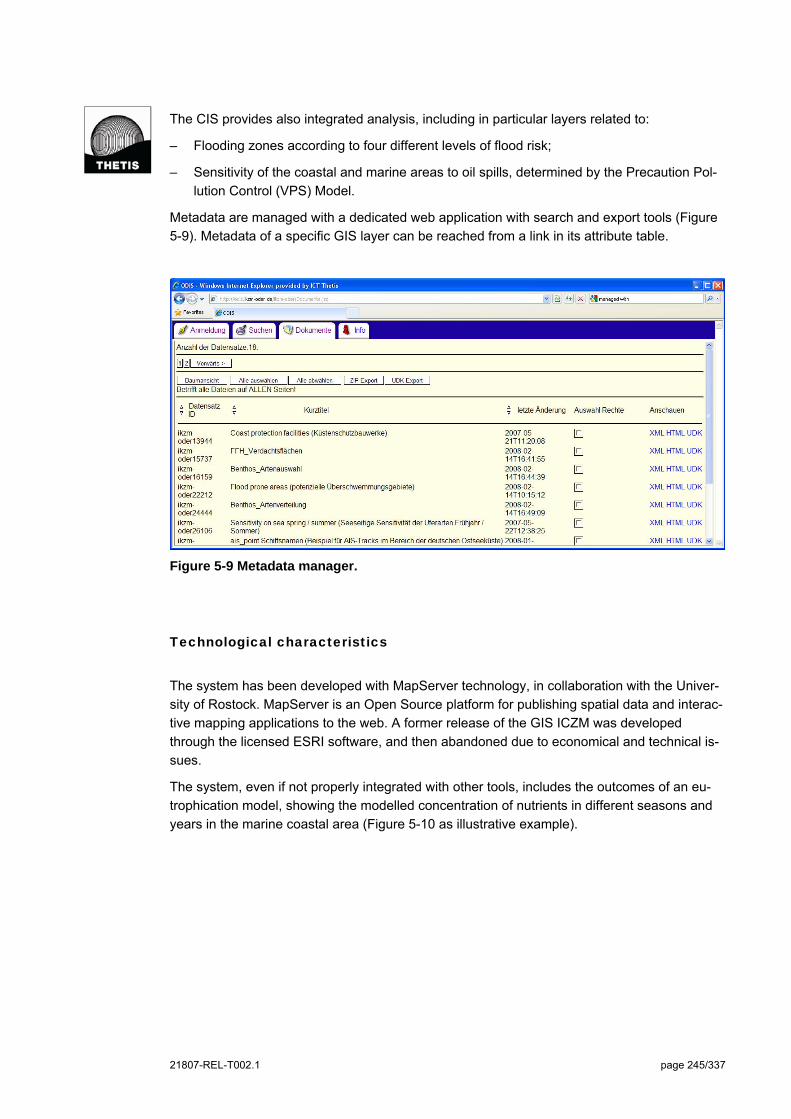
21807-REL-T002.1 page 245/337
The CIS provides also integrated analysis, including in particular layers related to:
– Flooding zones according to four different levels of flood risk;
– Sensitivity of the coastal and marine areas to oil spills, determined by the Precaution Pol-
lution Control (VPS) Model.
Metadata are managed with a dedicated web application with search and export tools (Figure
5-9). Metadata of a specific GIS layer can be reached from a link in its attribute table.
Figure 5-9 Metadata manager.
Technological characteristics
The system has been developed with MapServer technology, in collaboration with the Univer-
sity of Rostock. MapServer is an Open Source platform for publishing spatial data and interac-
tive mapping applications to the web. A former release of the GIS ICZM was developed
through the licensed ESRI software, and then abandoned due to economical and technical is-
sues.
The system, even if not properly integrated with other tools, includes the outcomes of an eu-
trophication model, showing the modelled concentration of nutrients in different seasons and
years in the marine coastal area (Figure 5-10 as illustrative example).

21807-REL-T002.1 page 246/337
Figure 5-10 Example of an outcome of the Oder Water Model: map of winter nitrate con-centration.
As an example of integration with other CISs, the link from the web portal to the GIS ICZM for
the federal state of Mecklenburg - Vorpommern (MV) has to be mentioned. As indicated in the
web portal, the GIS ICZM MV acts as an umbrella system for the GIS ICZM of the Oder Estu-
ary, also aiming to establish a connection to the systems of neighbouring regions: i.e. the fed-
eral state Schleswig-Holstein and those in Denmark and Poland.
The extensive link page of the web portal is accessible at http://www.ikzm-
oder.de/en/links.php.
ICZM related functionalities
The CIS includes several ICZM related functionalities, concerning both knowledge and pro-
cesses. As for knowledge related functionalities, the GIS-ICZM is provided with integrated in-
formation, information supporting the analysis of coastal vulnerability to climate change and
scalability.
An interesting example of integrated data available is represented by the layers on flooding
zones (see Figure 5-11), deriving from the ASTRA project "Developing Policies & Adaptation
Strategies to Climate Change in the Baltic Sea Region", aiming at estimating regional effects
of global climate change in the Baltic Sea Region and developing strategies to face climate
change. The ASTRA project analyzed 12 case studies, including the significant case of Oder
estuary.
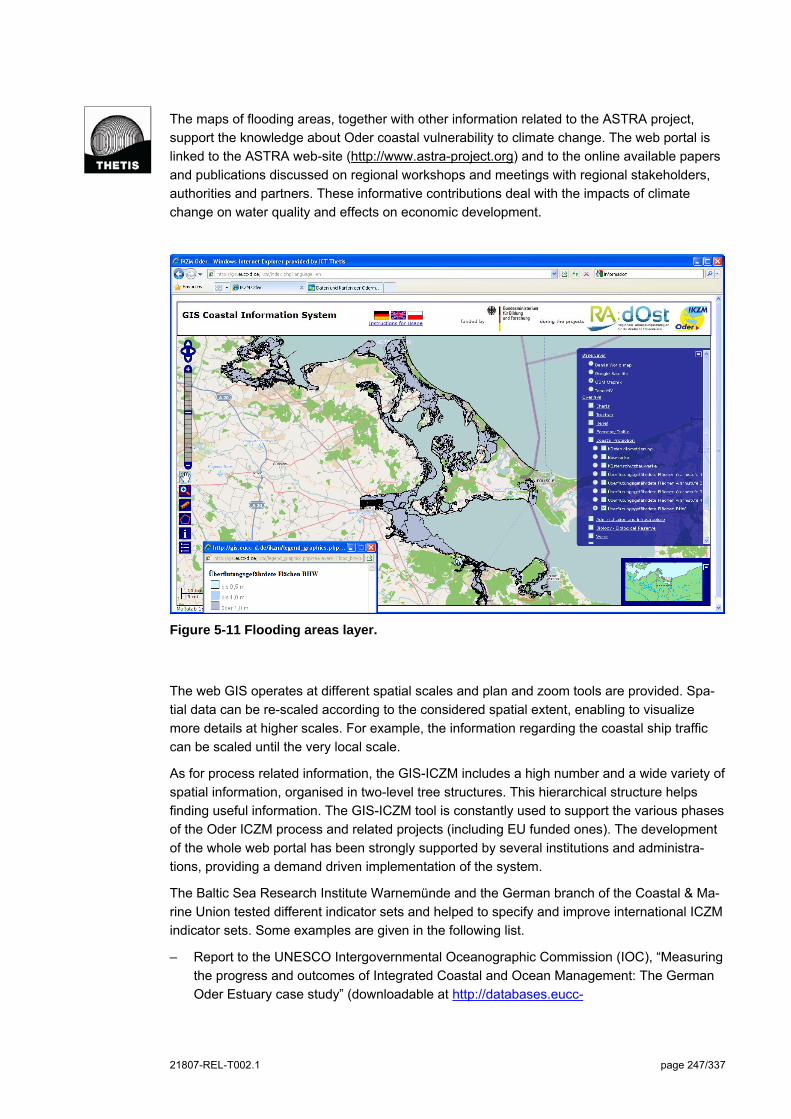
21807-REL-T002.1 page 247/337
The maps of flooding areas, together with other information related to the ASTRA project,
support the knowledge about Oder coastal vulnerability to climate change. The web portal is
linked to the ASTRA web-site (http://www.astra-project.org) and to the online available papers
and publications discussed on regional workshops and meetings with regional stakeholders,
authorities and partners. These informative contributions deal with the impacts of climate
change on water quality and effects on economic development.
Figure 5-11 Flooding areas layer.
The web GIS operates at different spatial scales and plan and zoom tools are provided. Spa-
tial data can be re-scaled according to the considered spatial extent, enabling to visualize
more details at higher scales. For example, the information regarding the coastal ship traffic
can be scaled until the very local scale.
As for process related information, the GIS-ICZM includes a high number and a wide variety of
spatial information, organised in two-level tree structures. This hierarchical structure helps
finding useful information. The GIS-ICZM tool is constantly used to support the various phases
of the Oder ICZM process and related projects (including EU funded ones). The development
of the whole web portal has been strongly supported by several institutions and administra-
tions, providing a demand driven implementation of the system.
The Baltic Sea Research Institute Warnemünde and the German branch of the Coastal & Ma-
rine Union tested different indicator sets and helped to specify and improve international ICZM
indicator sets. Some examples are given in the following list.
– Report to the UNESCO Intergovernmental Oceanographic Commission (IOC), “Measuring
the progress and outcomes of Integrated Coastal and Ocean Management: The German
Oder Estuary case study” (downloadable at http://databases.eucc-
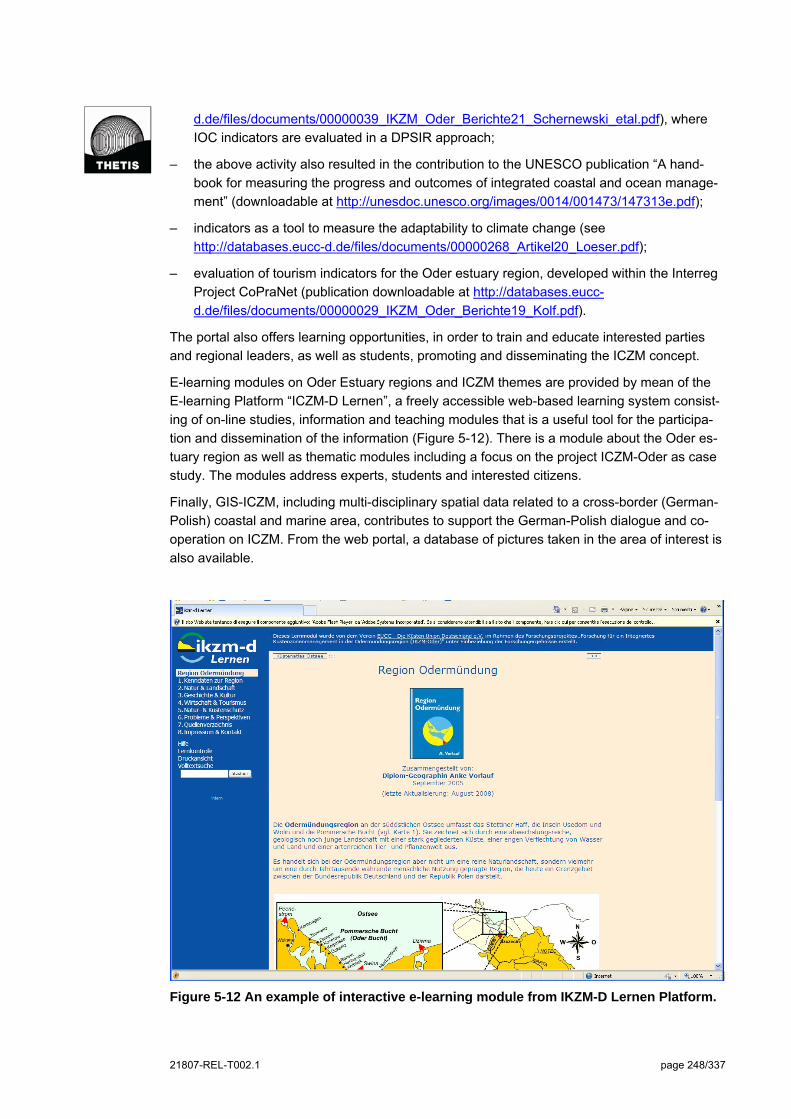
21807-REL-T002.1 page 248/337
d.de/files/documents/00000039_IKZM_Oder_Berichte21_Schernewski_etal.pdf), where
IOC indicators are evaluated in a DPSIR approach;
– the above activity also resulted in the contribution to the UNESCO publication “A hand-
book for measuring the progress and outcomes of integrated coastal and ocean manage-
ment” (downloadable at http://unesdoc.unesco.org/images/0014/001473/147313e.pdf);
– indicators as a tool to measure the adaptability to climate change (see
http://databases.eucc-d.de/files/documents/00000268_Artikel20_Loeser.pdf);
– evaluation of tourism indicators for the Oder estuary region, developed within the Interreg
Project CoPraNet (publication downloadable at http://databases.eucc-
d.de/files/documents/00000029_IKZM_Oder_Berichte19_Kolf.pdf).
The portal also offers learning opportunities, in order to train and educate interested parties
and regional leaders, as well as students, promoting and disseminating the ICZM concept.
E-learning modules on Oder Estuary regions and ICZM themes are provided by mean of the
E-learning Platform “ICZM-D Lernen”, a freely accessible web-based learning system consist-
ing of on-line studies, information and teaching modules that is a useful tool for the participa-
tion and dissemination of the information (Figure 5-12). There is a module about the Oder es-
tuary region as well as thematic modules including a focus on the project ICZM-Oder as case
study. The modules address experts, students and interested citizens.
Finally, GIS-ICZM, including multi-disciplinary spatial data related to a cross-border (German-
Polish) coastal and marine area, contributes to support the German-Polish dialogue and co-
operation on ICZM. From the web portal, a database of pictures taken in the area of interest is
also available.
Figure 5-12 An example of interactive e-learning module from IKZM-D Lernen Platform.
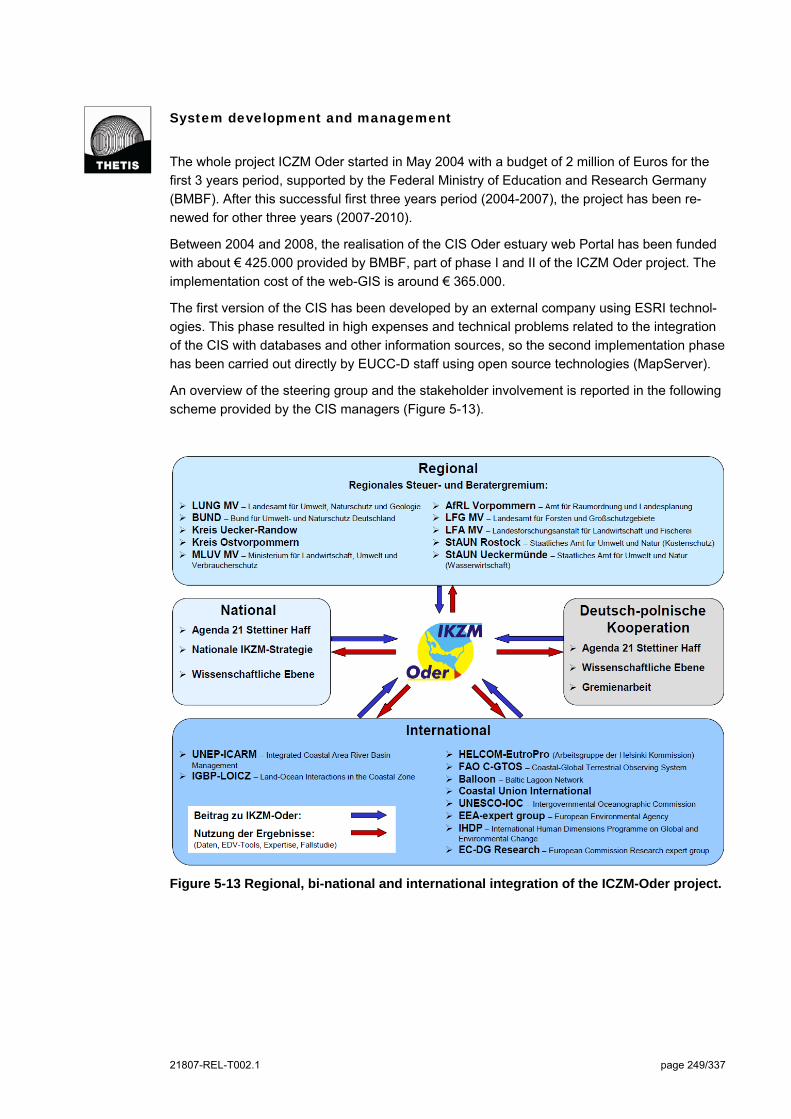
21807-REL-T002.1 page 249/337
System development and management
The whole project ICZM Oder started in May 2004 with a budget of 2 million of Euros for the
first 3 years period, supported by the Federal Ministry of Education and Research Germany
(BMBF). After this successful first three years period (2004-2007), the project has been re-
newed for other three years (2007-2010).
Between 2004 and 2008, the realisation of the CIS Oder estuary web Portal has been funded
with about € 425.000 provided by BMBF, part of phase I and II of the ICZM Oder project. The
implementation cost of the web-GIS is around € 365.000.
The first version of the CIS has been developed by an external company using ESRI technol-
ogies. This phase resulted in high expenses and technical problems related to the integration
of the CIS with databases and other information sources, so the second implementation phase
has been carried out directly by EUCC-D staff using open source technologies (MapServer).
An overview of the steering group and the stakeholder involvement is reported in the following
scheme provided by the CIS managers (Figure 5-13).
Figure 5-13 Regional, bi-national and international integration of the ICZM-Oder project.

21807-REL-T002.1 page 250/337
The steering group, during the development phase of the project, consisted of 12 direct and 8
indirect (extended steering committee) members from the following institutions: 1 NGO, 1 De-
partment of Ministry of Federal State of Mecklenburg-Vorpommern, 6 State Agencies of Meck-
lenburg-Vorpommern, 2 Districts, and 1 tourist association.
Polish stakeholders were involved mainly via smaller workshops and cross-border confer-
ences (the so called "German-Polish Coastal Dialogues").
The system is addressed to local and regional authorities, scientists, Polish and German ac-
tors and citizens (also including students and teachers). All the information published in the
web portal and in the web GIS is accessible without any restriction or privilege for different us-
ers.
The system is currently maintained by four persons at EUCC-D; further improvements are
foreseen, like the integration of an extensive geo-referenced photographic database to the
CIS.
Experience with the implementation
In the graph reported in Figure 5-14, the long term history of page visits of website portal
(http://www.ikzm-oder.de/) is shown. A growing number of visits characterised the first period
of the time series, with an initial peak in occasion of the launch of the portal and a second
higher peak in 2007; then visits have settled oscillating around a more stable value. Visitors
come from the German Baltic Coastal region (44.8%), followed by Poland (29.6) and Germa-
ny. Outside these areas, the coastal information system attracted comparatively lower num-
bers of users (see Figure 5-15). Taking into account the visiting hours (mainly during the typi-
cal office hours from 8 a.m. to 5 p.m.) a professional use of the portal was deduced.
Figure 5-14 History of web portal visits provided by EUCC-D.
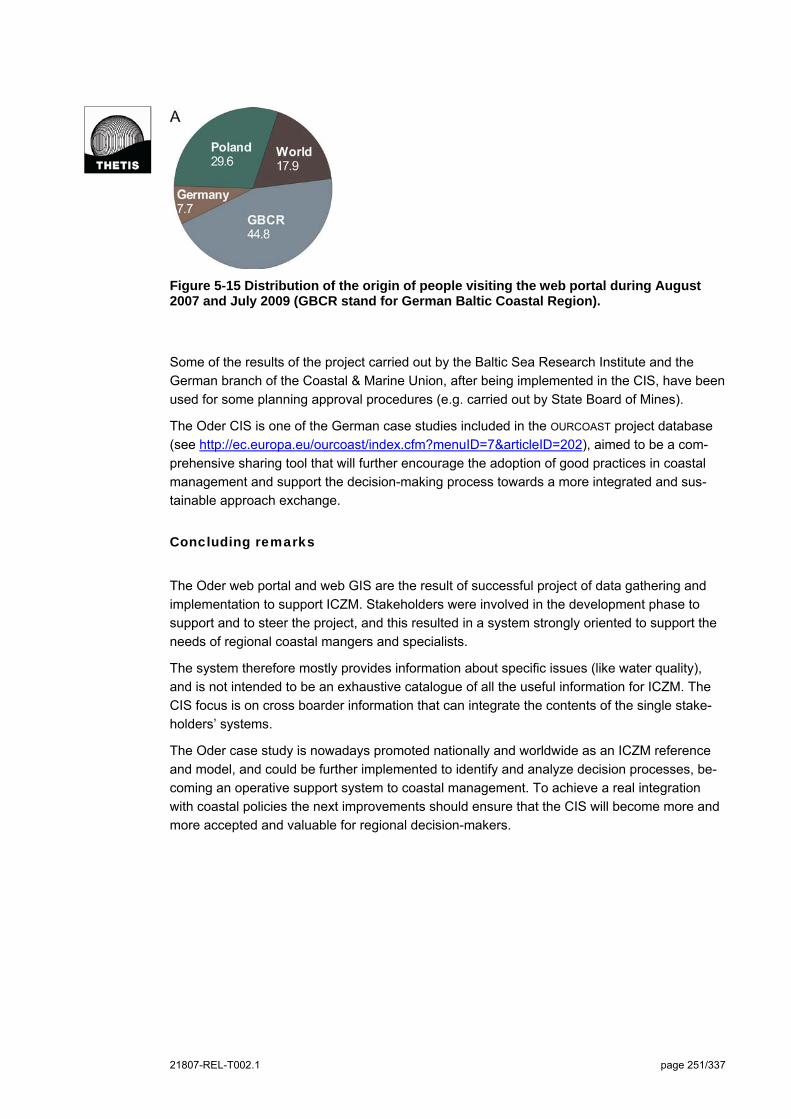
21807-REL-T002.1 page 251/337
Figure 5-15 Distribution of the origin of people visiting the web portal during August 2007 and July 2009 (GBCR stand for German Baltic Coastal Region).
Some of the results of the project carried out by the Baltic Sea Research Institute and the
German branch of the Coastal & Marine Union, after being implemented in the CIS, have been
used for some planning approval procedures (e.g. carried out by State Board of Mines).
The Oder CIS is one of the German case studies included in the OURCOAST project database
(see http://ec.europa.eu/ourcoast/index.cfm?menuID=7&articleID=202), aimed to be a com-
prehensive sharing tool that will further encourage the adoption of good practices in coastal
management and support the decision-making process towards a more integrated and sus-
tainable approach exchange.
Concluding remarks
The Oder web portal and web GIS are the result of successful project of data gathering and
implementation to support ICZM. Stakeholders were involved in the development phase to
support and to steer the project, and this resulted in a system strongly oriented to support the
needs of regional coastal mangers and specialists.
The system therefore mostly provides information about specific issues (like water quality),
and is not intended to be an exhaustive catalogue of all the useful information for ICZM. The
CIS focus is on cross boarder information that can integrate the contents of the single stake-
holders’ systems.
The Oder case study is nowadays promoted nationally and worldwide as an ICZM reference
and model, and could be further implemented to identify and analyze decision processes, be-
coming an operative support system to coastal management. To achieve a real integration
with coastal policies the next improvements should ensure that the CIS will become more and
more accepted and valuable for regional decision-makers.

21807-REL-T002.1 page 252/337
5.4 North Sea Atlas
General Information
The North Sea Atlas is a collection of maps on the marine environment of the Dutch North
Sea, with information on the water system, use, policy and management of the North Sea
(continental shelf and coastal area). The information content, based on the most recent avail-
able data, is limited to the water system including the seabed, with no specific information on
land. The information content is planned to be gradually updated.
The Atlas provides interactive and printable maps very easy to browse, which allows anyone
to visualize provided maps and layers.
The Atlas’ contents can be accessed by means of three ways:
1. using the online version of the Atlas (http://www.noordzeeatlas.nl/en/nzaEn.html);
2. visualising the printed version (2004 edition, which can be requested through the North
Sea Office website http://www.noordzeeatlas.nl/en/index.html);
3. using an ESRI GIS software, like ArcGIS 9.1 (licensed) or ArcExplorer (free reader soft-
ware).
The Atlas has been developed and is managed by the North Sea Office (Noordzee loket) to
support the activity of the North Sea Interdepartmental Consultation Directorate (IDON), acting
as a supervisor. IDON is a cooperative board of 10 representatives from different government
sub-structure levels (e.g. agency, directorate general, directorate, department) belonging to
four ministries:
Ministry of Infrastructure and the Environment: spatial planning, use of the sea, coast-
guard;
Ministry of Economic Affairs, Agriculture and Innovation: Oil & Gas Mining & Exploration;
Ministry of Foreign Affairs;
Ministry of Defence, Navy, Coastguard.
The primary purpose of IDON, created in 1998, is to debate and coordinate policies, directives and legislation about the North Sea.
For information about North Sea Atlas an info mail is available (noordzeeloket@rws); the con-
tact person at the Ministry of Infrastructure and Environment, North Sea Directorate (P.O. Box
5807, 2280 HV Rijswijk - The Netherlands) is Ad Stolk ([email protected]). Project leader of the
North Sea Atlas is Marcel Bommele ([email protected]).
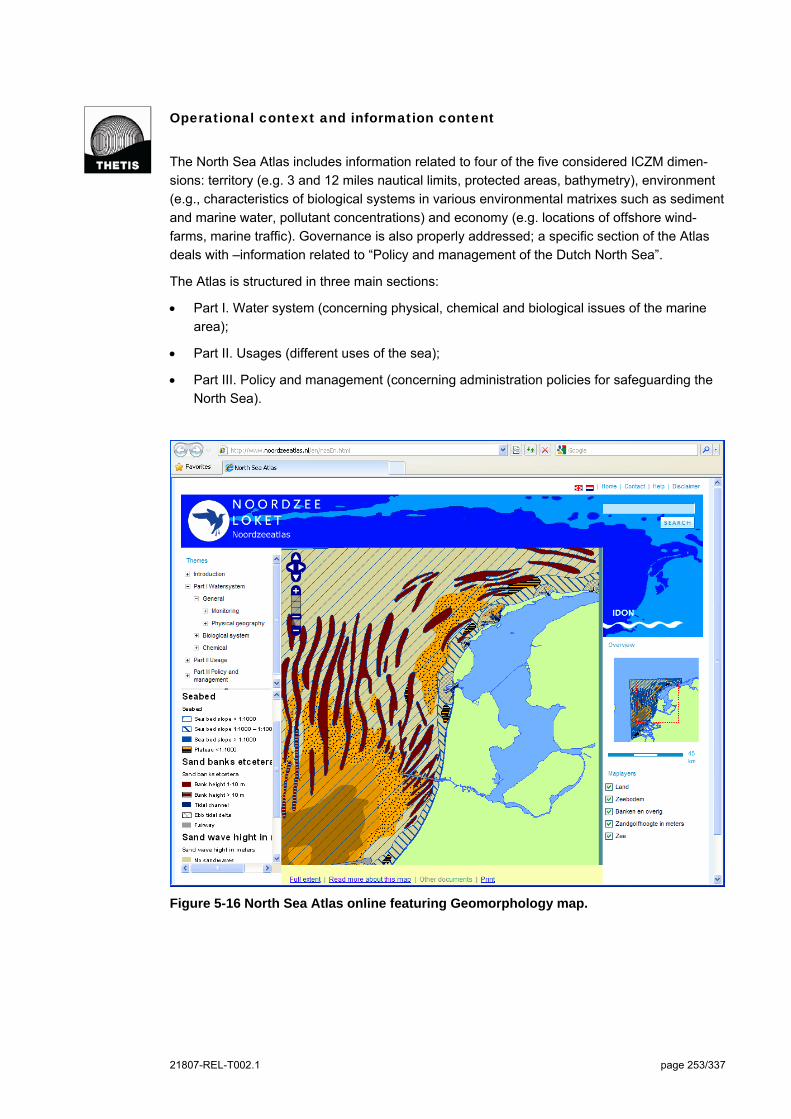
21807-REL-T002.1 page 253/337
Operational context and information content
The North Sea Atlas includes information related to four of the five considered ICZM dimen-
sions: territory (e.g. 3 and 12 miles nautical limits, protected areas, bathymetry), environment
(e.g., characteristics of biological systems in various environmental matrixes such as sediment
and marine water, pollutant concentrations) and economy (e.g. locations of offshore wind-
farms, marine traffic). Governance is also properly addressed; a specific section of the Atlas
deals with –information related to “Policy and management of the Dutch North Sea”.
The Atlas is structured in three main sections:
Part I. Water system (concerning physical, chemical and biological issues of the marine
area);
Part II. Usages (different uses of the sea);
Part III. Policy and management (concerning administration policies for safeguarding the
North Sea).
Figure 5-16 North Sea Atlas online featuring Geomorphology map.

21807-REL-T002.1 page 254/337
More in detail, information as bathymetry, geomorphology, sediment granulometry, hydrody-
namics compose the information about the physical geography of the area. The biological sys-
tem is described through the analysis of species distribution for sediment, water and air. Data
of pollutant concentration in sediments, data about salinity, suspended matter in water and da-
ta about erosion and transportation process of the suspended matter, compose the chemical
description of the sea. The monitoring network is also shown, with the specification of the
monitored stations for physical, chemical and biological data.
The information about the different uses of the sea includes archaeological zones, division of
the Dutch Continental Shelf, pollution reports on Dutch Continental Shelf, sand and shell ex-
traction, dumping sites of dredged material, submarine cables, platforms and pipelines, traffic
separation scheme, military use.
The section about the policy and management of the Dutch North Sea includes national com-
petence areas, maritime zoning (statutory administrative zones), maps of the spatial policy
document PKB “key planning decision”, protected sites according to the EU Birds and Habitats
Directive, drainage basins according to the Water Framework Directive, maps showing ele-
ments related to mining uses, and seabed protection areas.
Some integrated information is also provided in the Atlas. The most interesting are the analy-
sis of the sedimentation/erosion areas together with the transportation direction of suspended
matter in the seawater, the map showing the mining uses of the sea and the related regulation
and the map of the spatial policy document PKB.
In particular, the PKB, “key planning decision”, gives an overall picture of the spatial develop-
ments of the area. PKB defines two key objectives of spatial policy concerning the North Sea:
to enhance the economic significance of the North Sea and to conserve and develop interna-
tionally important ecological and landscape values.
The Atlas content refers to the national scale: all the Atlas information fit the Dutch Continental
shelf or more specifically the Dutch coastal area of the North Sea. For some layers, infor-
mation is available for a larger portion of the North Sea. The system has been developed in
order to be applied specifically to the zone of Dutch Sea. However, an upgrade of the system
is planned in order to make the Atlas a more flexible tool.
Metadata, available as descriptive sheets, are in general provided for the pre-defined maps
(groups of layers) included in the Atlas. However, they are not available for the specific layers.
Technological characteristics
The technology used for the North Sea Atlas is the licensed software ESRI ArcSDE. Data
standardization and validation is performed with ESRI ArcGIS.
The North Sea Atlas is part of the European Atlas of the Seas, offering a wide range of infor-
mation about Europe's seas. It was developed to raise awareness of Europe's oceans and
seas, in the context of the EU's integrated maritime policy
(http://ec.europa.eu/maritimeaffairs/atlas/index_en.htm).
About interoperability, the Atlas’ architecture is structured with ESRI technologies, so the for-
mats of spatial datasets are shapefile and ESRI Geo-DB. Data can be consulted in the web
application, but also through ArcExplorer / ArcExplorerWeb applications and IMS-server con-
nections. Direct download of spatial data from the Atlas in not available.
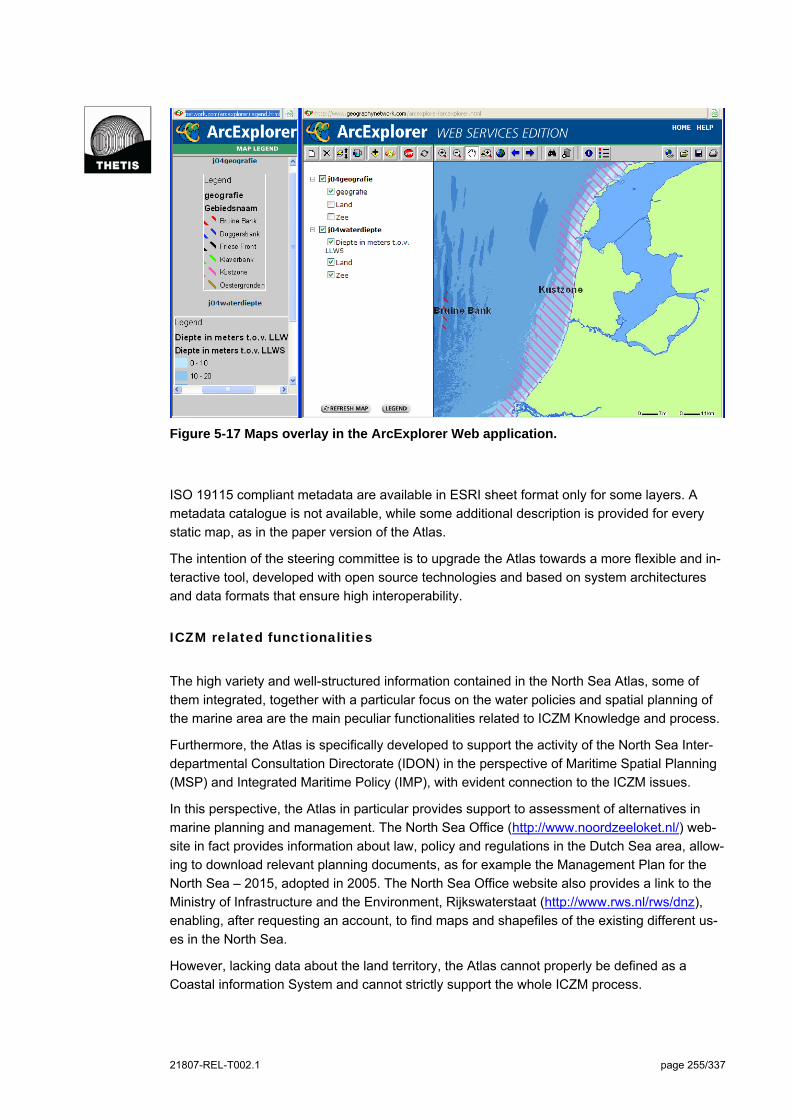
21807-REL-T002.1 page 255/337
Figure 5-17 Maps overlay in the ArcExplorer Web application.
ISO 19115 compliant metadata are available in ESRI sheet format only for some layers. A
metadata catalogue is not available, while some additional description is provided for every
static map, as in the paper version of the Atlas.
The intention of the steering committee is to upgrade the Atlas towards a more flexible and in-
teractive tool, developed with open source technologies and based on system architectures
and data formats that ensure high interoperability.
ICZM related functionalities
The high variety and well-structured information contained in the North Sea Atlas, some of
them integrated, together with a particular focus on the water policies and spatial planning of
the marine area are the main peculiar functionalities related to ICZM Knowledge and process.
Furthermore, the Atlas is specifically developed to support the activity of the North Sea Inter-
departmental Consultation Directorate (IDON) in the perspective of Maritime Spatial Planning
(MSP) and Integrated Maritime Policy (IMP), with evident connection to the ICZM issues.
In this perspective, the Atlas in particular provides support to assessment of alternatives in
marine planning and management. The North Sea Office (http://www.noordzeeloket.nl/) web-
site in fact provides information about law, policy and regulations in the Dutch Sea area, allow-
ing to download relevant planning documents, as for example the Management Plan for the
North Sea – 2015, adopted in 2005. The North Sea Office website also provides a link to the
Ministry of Infrastructure and the Environment, Rijkswaterstaat (http://www.rws.nl/rws/dnz),
enabling, after requesting an account, to find maps and shapefiles of the existing different us-
es in the North Sea.
However, lacking data about the land territory, the Atlas cannot properly be defined as a
Coastal information System and cannot strictly support the whole ICZM process.
21807-REL-T002.1 page 256/337
Some multi-time data, such as concentration of pollutants in the sea sediment, are also avail-
able in the North Sea Atlas, supporting knowledge about the evolution of coastal pollution.
These information concern both metals and persistent organic pollutants. By comparing re-
sults of different years, data for example indicate that cadmium levels fell by 71% between
1981 and 1996. It was linked with a huge drop in the amount of cadmium in the Rhine, in
dredging sludge and in the atmosphere.
The system finally provides spatial data enabling direct connection of users thought ESRI Arc
Explorer (free software) that allows the visualisation of selected layers on a client computer.
Pre-defined static maps available in the Atlas and customised maps can be exported and
print.
System development and management
The North Sea Atlas was first published as a book more then ten years ago. In occasion of the
update that took place in 2002, the Atlas has been also published in a dedicated web site.
The Atlas has been developed by a specialised GIS private company under the coordination
of the North Sea Office and the supervision of IDON. The first web version of the Atlas in-
volved 2 full time developers for about one year of work.
The system is continuously updated with new maps and technically upgraded with new func-
tionalities in order to acquire better usability. The cost of this activity is around € 15.000 / year,
and involves about 8 persons.
The main difficulties encountered in developing the atlas were not related to technological is-
sues but rather concerning data acquisition and institutional cooperation.
The North Sea Office is the focal point for the information about the North Sea and its man-
agement. The publishing of new maps in the Atlas needs to be approved by all the Ministries
that supervise the Atlas’ implementation. For this reason not all the maps produced by the
North Sea Office are finally published in the Atlas. The communication and agreement among
Ministries represents a crucial point for institutional cooperation and for the steering of the At-
las’ porpoises.
The steering group of the Atlas meets periodically to verify the contents of the Atlas and define
the new cartography to be developed in accordance with the annual budget. Technological
upgrade to enhance the Atlas with new functionalities is budgeted as a separate expenditure
and commissioned to a maintenance company.
The Atlas, free to all users and without any restriction or privilege for different users, is orient-
ed to a wide kind of users, including public and private entities, research institutions, students
and general public.

21807-REL-T002.1 page 257/337
Experience with the implementation
The main porpoise of the Atlas is to share data about water system, use and management of
the North Sea, and represents a focal point to visualise updated information about maritime
issues. The Atlas nowadays is not designed as a participation tool for coastal planners, as its
initial aim is to spread general information about the North Sea to a wide range of users, with
different interests and roles.
On the other hand, the need of information systems to support marine spatial planning and
ICZM is becoming more and more evident, and the number of requests to the Atlas’ managers
for thematic data and scientific information has been growing in the last years. As a conse-
quence, IDON and the steering committee of the Atlas are heading in that direction, planning
to provide new information contents and functionalities that will allow an easiest consultation
by general public and a more profitable usage by decision makers and stakeholders.
The Atlas is currently used within ICZM processes just as an investigation tool to acquire an
overview on the state and usage of marine areas.
Concluding remarks
The North Sea Atlas is the main source of updated information about Dutch marine areas,
dealing with physical and quality characteristics, but also with the actual use of the sea and
with the ongoing protection policies.
The actual state of the Atlas can provide a useful overview on marine areas to ICZM process-
es, and can represent a good base to develop a more comprehensive tool to support ICZM
processes. This is one of the main aims of the steering group of the Atlas that foresees im-
portant updates and upgrades both on information contents and on functionalities. Among
them, the inclusion of information about inland areas and the implementation of process relat-
ed functionalities seem to be the most relevant.
21807-REL-T002.1 page 258/337
5.5 KustAtlas – Belgian Coastal Atlas
General Information
The KustAtlas (coastal atlas) is an initiative of the Co-ordination Centre for Integrated Coastal
Zone Management, a contact centre for integrated matters in the coastal zone, also responsi-
ble for the maintenance of the atlas and updating the information.
The Atlas contains maps and other information on different coastal aspects, useful to support
ICZM process. It focuses mainly on the Belgian coast but for some issues (ICZM indicators)
also contains data about the wider area of Southern North Sea (Essex –UK; Kent – UK, Nord-
Pas De Calais - France, West Flanders - Belgium and Zeeland - the Netherlands).
The Coastal Atlas is a member of the newly formed International Coastal Atlas Network
(ICAN), a group of organizations who have been meeting over the past two years, to share
experience and knowledge on Coastal Web Atlases and to look at possibilities and added-
value of data interoperability approaches to coastal web atlases.
The Belgian Coastal Atlas was first published as a book in 2004, triggered by the reporting ob-
ligations to the European Commission about the state of the Belgian coasts related to the
ICZM Recommendations (2002/413/EC). From the beginning, the main aim was to present a
general and synthesised overview of the main characteristics of the Belgian coast in relation to
ICZM. The many requests for maps encouraged the developers to launch a web-based atlas.
Since November 2005, the on-line web-atlas is a fully operational system and it is available in
4 languages. Following the initial book perspective, the on-line system mainly aims to provide
an easily accessible, simple, user-friendly atlas to users, as well as to make available readily
usable maps on Belgian coasts. Maps have been produced using data mostly provided by the
public authorities and their administrations.
KustAtlas home page (http://www.kustatlas.be/en, see Figure 5-18) offers downloadable maps
(as PDF documents) with low possibility of interaction but high attention to the quality and look
of the image. Figures, diagrams and charts are also available and downloadable. The Atlas is
structured in 12 main sectors (chapters).
For direct information requests and suggestions, the contact person is Kathy Belpaeme of the
Belgium Coordination Centre on Integrated Coastal Zone Management in Belgium (Ghent,
BELGIUM, e-mail [email protected]). Web-site of the Belgium Coordination
Centre on ICZM is http://www.kustbeheer.be.
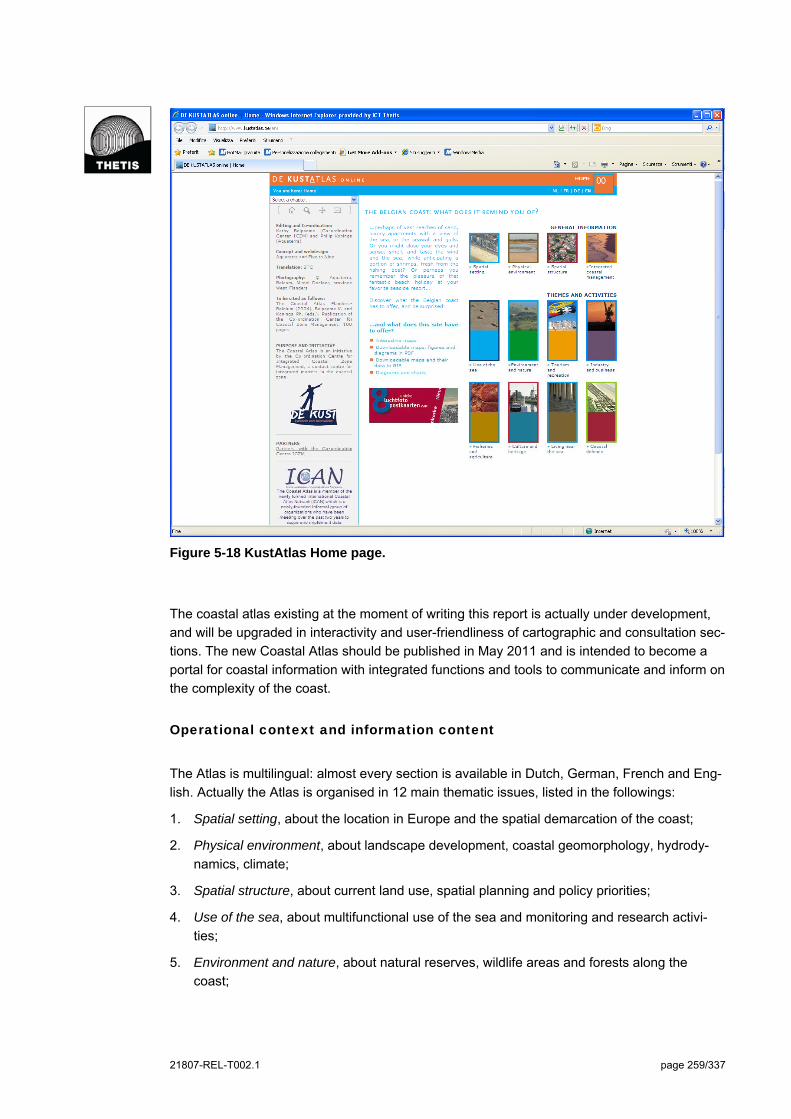
21807-REL-T002.1 page 259/337
Figure 5-18 KustAtlas Home page.
The coastal atlas existing at the moment of writing this report is actually under development,
and will be upgraded in interactivity and user-friendliness of cartographic and consultation sec-
tions. The new Coastal Atlas should be published in May 2011 and is intended to become a
portal for coastal information with integrated functions and tools to communicate and inform on
the complexity of the coast.
Operational context and information content
The Atlas is multilingual: almost every section is available in Dutch, German, French and Eng-
lish. Actually the Atlas is organised in 12 main thematic issues, listed in the followings:
1. Spatial setting, about the location in Europe and the spatial demarcation of the coast;
2. Physical environment, about landscape development, coastal geomorphology, hydrody-
namics, climate;
3. Spatial structure, about current land use, spatial planning and policy priorities;
4. Use of the sea, about multifunctional use of the sea and monitoring and research activi-
ties;
5. Environment and nature, about natural reserves, wildlife areas and forests along the
coast;
21807-REL-T002.1 page 260/337
6. Tourism and recreation, about tourism attractions, tourism facilities and accommodations;
7. Industry and business, about industrial estates, ports and airports;
8. Fishery and agriculture, about general facts on the fishery in Belgium and Agriculture in
the coastal plains, including a brief historical perspective;
9. Culture and heritage, about main events, activities and cultural centres;
10. Living by the sea, about coastal conurbation, settlement types and coastal architectures;
11. Coastal defence, about erosion, sedimentation and coastal protection structures;
12. Integrated coastal zone management, about the balance between the social, economic
and ecological aspects of the coast with link to sustainability indicators.
The above mentioned chapters - each of them containing data, maps and descriptive infor-
mation related to various items - match all the five ICZM dimensions of Environment, Territory,
Economy, Society and Governance.
Of particular interest, the Integrated coastal management sector (chapter 12) links the Atlas to
the databases of the sustainability indicator of the coast (for most indicators Dutch only, some
indicators developed in the SAIL project available in English), adding therefore a rich set of da-
ta to the Atlas. Indicators can also be linked to in different thematic chapters.
The so called “sustainability barometer for the coast” is a tool created by the Coordination
Centre for ICZM, in order to monitor the evolution of a set of themes or 'indicators' that are im-
portant for the coast and coastal policy. The indicators can refer to a single data set or can be
the results of aggregated data.
The system provides other examples of integrated data, merging together information from dif-
ferent sectors. They can be especially found among the ICZM coastal indicators (defined by
SAIL Project and all considered in the KustAtlas) which are accessible from every chapter of
the Atlas. For example, the percentage of Natura 2000 sites in Favourable Conservation Sta-
tus (FCS) according to the Habitat and birds EC directives provides information about the ef-
fective management of designed sites, integrating territorial information (Natura 2000 sites)
with environmental current status.
Furthermore, the number of people living in the area at risk from coastal flooding integrates
population density data with territorial data (areas delimited by the 5m height contours). Simi-
larly, the area of protected sites and value of economic assets within the zone at risk from
coastal flooding is another example of integrated information provided by KustAtlas, merging
economic and environmental data with territorial data.
Integrated maps are also provided, with multiple information contents related to a specific is-
sue in the same map. For example, the map of multifunctional use of the sea shows economic
activities together with Natura 2000 sites and planned energy production locations; the same
concept is applied to the map of mixed land use. The map of coastal evolution shows areas in
erosion/sedimentation together with the fixed coastline protection structures.
Information factsheets, interactive graphs, maps, trend and indication of data providers are al-
so available for every ICZM indicator.
Data providers are public authorities and their administrations, gathering the information them-
selves within their objectives and policies; in other cases, the data is generated by universities,
consultants or other institutions commissioned by the authorities.
21807-REL-T002.1 page 261/337
KustAtlas, specifically drawn up for the coastal area of Belgium, served as an example to de-
velop similar atlases in Vietnam and Catalonia (Spain). Thematic viewers fit to a transnational
scale, being referred not only to the Belgian coast, but also, as for ICZM indicators, to the wid-
er area of Southern North Sea. Currently maps can be consulted at two fixed scales, but the
new Atlas now being updated will provide more interactive zoom and pan functionalities.
Technological characteristics
The system works on the Apache web-server and it runs on a MSSQL relational database.
The web-site is set up in PHP/HTML and, for the interactive maps, flash applications and ac-
tion-scripts are used.
As mentioned in the previous section and deepened in the following section, the website is in-
tegrated with the “sustainability barometer” tool, through a link to an external website, from the
chapter 12 (Integrated management of the coast) and from the thematic chapters.
There is no proper integration with other coastal information system. The future development
of KustAtlas will be strictly connected to the development of the new CIS now being developed
by the Dorset Coastal Forum, as both are participating to the European project C-Scope, aim-
ing, inter alia, to develop tools for achieving sustainable coastal economies and environments.
Moreover, KustAtlas is included in the European Atlas of the Seas
(http://ec.europa.eu/maritimeaffairs/atlas/index_en.htm).
Actually interoperability is low, as the possibilities to analyze, compare and integrate the dif-
ferent informational contents are not very flexible. The new Atlas will have a strong focus on
cartography, with an enhanced web map viewer application that will allow interactively visual-
izing and identifying several layers at different scales. Some new tools (like measure) will be
provided.
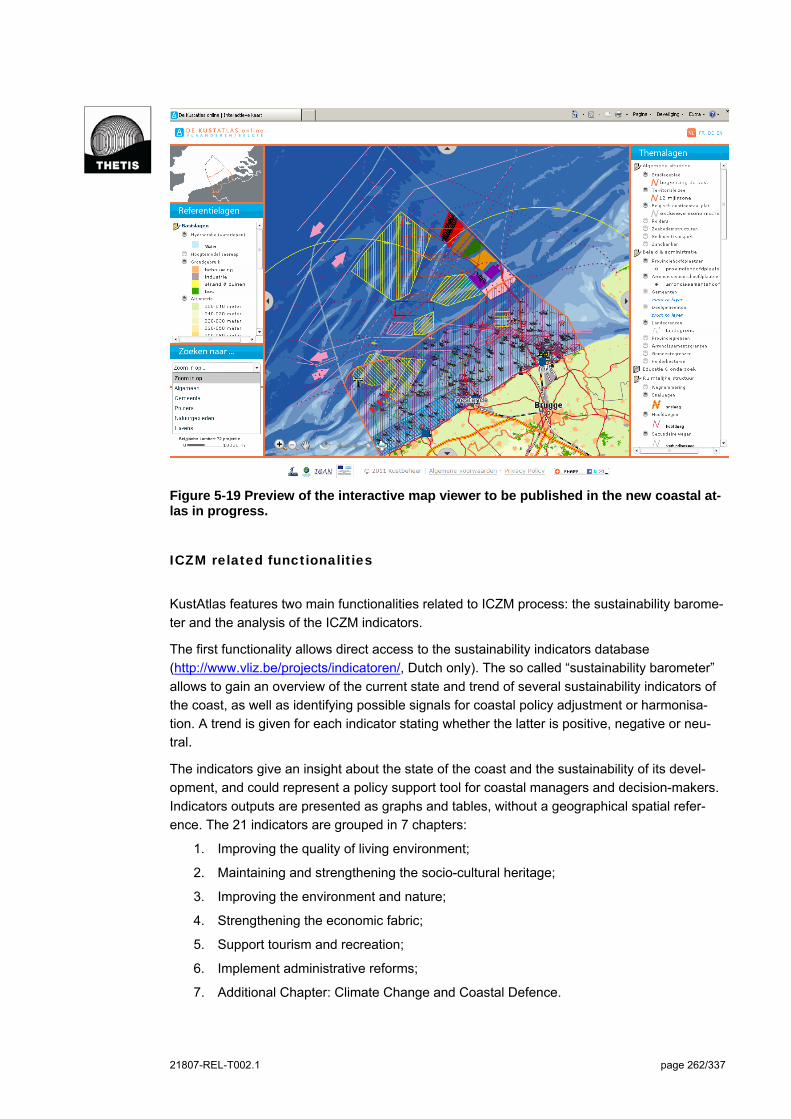
21807-REL-T002.1 page 262/337
Figure 5-19 Preview of the interactive map viewer to be published in the new coastal at-las in progress.
ICZM related functionalities
KustAtlas features two main functionalities related to ICZM process: the sustainability barome-
ter and the analysis of the ICZM indicators.
The first functionality allows direct access to the sustainability indicators database
(http://www.vliz.be/projects/indicatoren/, Dutch only). The so called “sustainability barometer”
allows to gain an overview of the current state and trend of several sustainability indicators of
the coast, as well as identifying possible signals for coastal policy adjustment or harmonisa-
tion. A trend is given for each indicator stating whether the latter is positive, negative or neu-tral.
The indicators give an insight about the state of the coast and the sustainability of its devel-
opment, and could represent a policy support tool for coastal managers and decision-makers.
Indicators outputs are presented as graphs and tables, without a geographical spatial refer-
ence. The 21 indicators are grouped in 7 chapters:
1. Improving the quality of living environment;
2. Maintaining and strengthening the socio-cultural heritage;
3. Improving the environment and nature;
4. Strengthening the economic fabric;
5. Support tourism and recreation;
6. Implement administrative reforms;
7. Additional Chapter: Climate Change and Coastal Defence.
21807-REL-T002.1 page 263/337
Another useful functionality to support ICZM processes knowledge is the analysis of the 27
ICZM indicators. Each chapter of the atlas explores relevant indicators for that thematic issue,
by linking to the SAIL project website (http://www.vliz.be/projects/SAIL/db.php). The SAIL pro-
ject (Schéma d'Aménagement Intégré du Littoral) was a partnership of regional and local au-
thorities, maritime organisations, and coastal and marine agencies, working together for the
sustainable development of the Southern North Sea tidal area. One of the major accomplish-
ments of the SAIL partnership is the implementation of sustainability indicators for the South-
ern North Sea region.
Both for sustainability and ICZM indicators some integrated data and maps are provided (see
section on “Operational context and information content”).
Other functionalities mark the system:
Even if designed using thematic classification, the Atlas contains cross-references aimed
to allow seamless navigation through themes and aspects. In the new web Atlas now be-
ing updated figures, graphs, tables, photographs, maps and external links will always be
readily available.
The availability of multi-time information, as for the coastal evolution (sedimentation / ero-
sion process), landscape evolution, historical perspective of some economic activities;
The availability of interactive graphics, extended explanations of coastal processes help
the users, especially stakeholders, to fully manage the information content, capturing the
implications in coastal planning and management.
The presence of dedicated fact sheets for each ICZM indicator (PDF documents) reporting
origin, source, results, implications in ICZM and reliability of every indicator.
A key message is furthermore reported in every fact sheet as useful summary information
for the monitored indicator.
Maps and graphics are downloadable in PDF format and available in printable versions
while data underlying some maps are available as XLS files. For some few layers shape-
files and interactive Google earth layers are also available. This aspect is one of the main
focuses of the actual improvement and updating of the Atlas.
System development and management
For the development of the atlas online at the moment of writing this report, the Coordination
Centre on ICZM collaborated with three private partners:
Aquaterra (http://www.aquaterra.be/nl/) for the geographic information, map digitisation
and content of the atlas;
Five to Nine (http://www.quoted.be/) for the website development;
Magenta (http://www.magenta.be/) for the design.
As for costs, the former printed version of the atlas cost € 46,381, while the development of
the on-line atlas cost € 25,073 for the set up of the on-line version and € 5,855 for the devel-
opment/translation of German and French version. The book and the online version of the
Belgian Coastal Atlas were financed by the project partners of the Coordination Centre: the
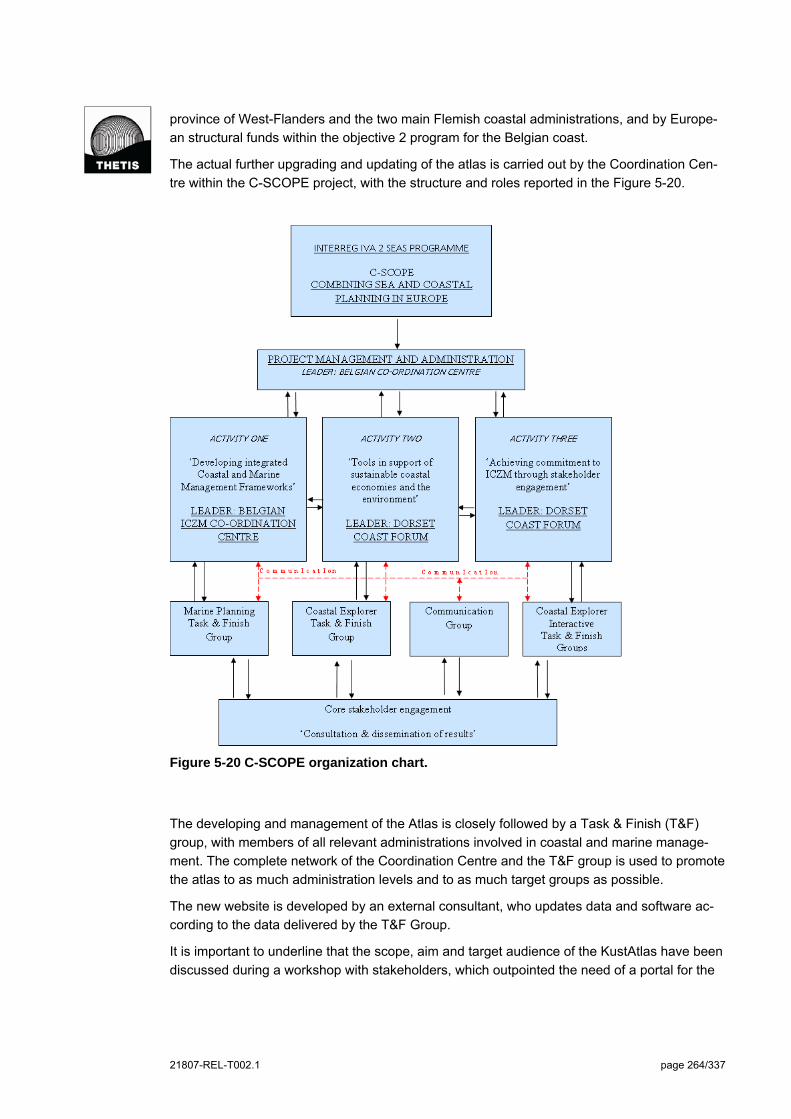
21807-REL-T002.1 page 264/337
province of West-Flanders and the two main Flemish coastal administrations, and by Europe-
an structural funds within the objective 2 program for the Belgian coast.
The actual further upgrading and updating of the atlas is carried out by the Coordination Cen-
tre within the C-SCOPE project, with the structure and roles reported in the Figure 5-20.
Figure 5-20 C-SCOPE organization chart.
The developing and management of the Atlas is closely followed by a Task & Finish (T&F)
group, with members of all relevant administrations involved in coastal and marine manage-
ment. The complete network of the Coordination Centre and the T&F group is used to promote
the atlas to as much administration levels and to as much target groups as possible.
The new website is developed by an external consultant, who updates data and software ac-
cording to the data delivered by the T&F Group.
It is important to underline that the scope, aim and target audience of the KustAtlas have been
discussed during a workshop with stakeholders, which outpointed the need of a portal for the

21807-REL-T002.1 page 265/337
coast to be used as communication tool. As a result, the Atlas is not aimed at giving an ex-
haustive list of data layers and detailed data.
The main difficulties encountered in developing the system were related to data acquisition,
definition of an impartial and general approach, management of the development in relation to
budget limitations.
The group in charge of data acquisition made a lot of efforts to deliver the necessary data to
the Co-ordination Centre. There were minor difficulties with copyright issues and indecisions of
some administrations about the terms and conditions of data accessibility. Additional contracts
and agreements on data acquisition had to be signed during the development of the Atlas.
Another difficulty was related to the need of keeping the data general, avoiding to go too much
into detail as regards to naming institutions, concrete projects, dates, etc., because the atlas
wants to be timeless and free from competition issues between institutions.
During the development, the project leader had to make firm decisions to keep the scope clear
and to limit to the budget the multitude of ideas and suggestions received to feed the atlas, as
in the development phase many more layers than foreseen were being collected.
The Atlas is intended to be a communication instrument for teachers, students, guides, educa-
tional initiatives and other coastal stakeholders, becoming an awareness raising tool to explain
the complexity of the coast. Sustainability indicators could also be usefully exploited by policy
makers and decision makers. With the next update, the Coordination Centre aims to develop
the Belgian Coastal Atlas as a more interactive information tool for coastal stakeholders and
members of the wider public interested in coastal complexity.
The access to the whole website is free, without privileges for different users. Illustrations, pic-
tures, maps and texts of the atlas can be used subject to prior written permission of the copy-
right owners and an express mention of the source.
Experience with the implementation
On average, the site has 2.000 hits per month (an average of about 70 people per day) of
which more than 50% are Belgian. Other top visiting countries are the Netherlands, Germany
and France. Since the site is visited mainly during the working week and during working hours,
it can be assumed that the site is visited mostly for work reasons. Most interested users, from
which the main requests for further information come from, are scientific users as well as gen-
eral public, administrations, supporting services and schools.
The stakeholders that participated in the definition of the aims of the Atlas were not interested
in developing a decision support tool, and this is the condition that determines the actual struc-
ture of the KustAtlas and the on-going implementations. The integration of sustainability indi-
cators in the atlas is also intended as an enhancement to add value in terms of raising aware-
ness on coastal sustainability.

21807-REL-T002.1 page 266/337
Concluding remarks
The KustAtlas features extensive information contents related to ICZM, with an ICZM dedicat-
ed section and links to specific ICZM coastal indicators defined within the SAIL project. The
new upgraded version of the atlas to be published in May 2011 will enhance cartographic in-
teractivity with spatial data and connections with implemented coastal policies.
Explicit aim of the Co-ordination Centre managing the atlas, in accordance with stakeholders
involved in the target definition, is to provide a point of reference for coastal information rather
than a decision support system for policy makers.
This analysis outpointed that the informational contents and functionalities of the atlas, with
particular reference to sustainability indicators, ICZM indicators fact-sheets and reports of im-
plemented policies, could be usefully exploited also by coastal planners and managers.
As the upgrade of the system foresees a stronger connection with policies on the coast, the
interconnection among costal information, coastal sustainability and coastal management will
be further investigated, and this could represent a great opportunity to develop an exhaustive
portal rich in information and a powerful tool for coastal management as well.
21807-REL-T002.1 page 267/337
5.6 MIDA – The Marine Irish Digital Atlas
General Information
The Marine Irish Digital Atlas (MIDA) is a web tool built in a web-GIS environment, where peo-
ple interested in coastal and marine information for Ireland can visualize and identify pertinent
geospatial datasets and determine where to acquire them. The atlas, which is being constantly
updated, currently displays more than 140 layers from over 35 coastal and marine organiza-
tions both within Ireland and abroad. It also features an “InfoPort” which is a repository of text,
imagery, links to spatial data sources and additional reference material for a wide range of
coastal and marine topics.
The MIDA is part of the International Coastal Atlas Network (ICAN), the group of organizations
that have been meeting since 2006 to scope and implement data interoperability approaches
to coastal web atlases.
Specific objectives of the MIDA Atlas are to:
Develop a web site for presentation of geo-referenced marine datasets of environmental
importance;
Provide greater accessibility to data and information in the form of a web enabled, custom-
ised GIS;
Provide flexibility of use by providing a range of tools that allow users to select, overlay
and compare geospatial layers;
Enable users to identify sources of data, information and expertise on the marine envi-
ronment;
Encourage a greater appreciation of Ireland's coastal regions by incorporating educational
and informational materials based on multi-media technology.
MIDA, a fully operational system, has been developed by the Coastal and Marine Research
Centre (CMRC) of University College Cork , in partnership with the Centre for Coastal and Ma-
rine Research, University of Ulster, Coleraine, Northern Ireland.
Funders of the Atlas are:
Ireland’s Higher Education Authority under the National Development Plan PRTLI III Pro-
gramme (development funds);
Environment and Heritage Service, Northern Ireland (Northern Ireland data and partner-
ship);
Coastal and Marine Research Centre, University College Cork.
From the Home page of the Atlas (http://mida.ucc.ie/pages/atlas/atlas.php, Figure 5-21), it is
possible to add layers to the map, to access layer information (quick overview, metadata and
data files), to zoom to pre-selected regions and specific themes (in order to get an integrated
map displaying all the information layers related to the selected theme and the selected spatial
area), to link to general information about MIDA (Atlas help, list of Layers, data contributors,

21807-REL-T002.1 page 268/337
information Resource, contacts) and finally to access the search tool (to find layers by text or
spatial selection).
For information, comments about MIDA, data sharing or mailing list joining an info mail is
available: [email protected]; the point of contact is Ned Dwyer ([email protected]), Coastal and Ma-
rine Research Centre - University College Cork (Naval Base, Haulbowline, Cobh, County
Cork, Ireland).
Figure 5-21 Homepage of MIDA.
Operational context and information content
The Atlas mainly addresses four of the five considered information dimensions: environment,
territory, economic and governance.
The environment and the territory dimension are the most developed dimensions (50 layers
refer to the physical environment and more than 100 layer refer to the biological environment),
while the economic information is provided by a great variety of layers regarding tourism, rec-
reation, fisheries, aquaculture, agriculture and coastal and marine industry. Governance in-
formation integrated in the system mainly refers to rural areas targeted for investment, current
exploration authorizations and license blocks given by the Petroleum Affairs Division.
21807-REL-T002.1 page 269/337
The information content is related to following topics:
Physical environment;
Coastal habitats;
Biology;
Management;
Human impact;
Conservation;
Environmental monitoring;
Infrastructure;
Industry;
Culture and heritage;
Natural resources;
Fisheries, aquaculture agriculture;
Tourism and recreation.
The list of layers published in the atlas, provided with description, indication of data owner and
status of the publication is available at http://mida.ucc.ie/pages/dataLayers.htm.
The data hierarchy was structured around four main categories (folders in the web-GIS inter-
face): Management, Physical Environment, Biological Environment, Socio-economic Activity.
Each of these categories is subdivided in several sub-categories.
Data are provided by various and heterogeneous private and public institutions acting at local,
national or international level, as research institution, environmental protection agencies, cul-
tural and recreation associations, information and cartographic services etc. The complete list
of the 37 current data contributors is available at http://mida.ucc.ie/pages/providers.htm.
Although data layer in the MIDA are provided from numerous organizations, many of these
can be grouped as government organizations, followed by educational institutions (about 27%)
and non governmental organizations (17%) while only about 4% of data layers is provided by
the private sector. The private sector has a low representation among data providers, mainly
due to the commercial sensitivity of certain type of data.
The system can display preset maps on 19 specific themes and 37 specific subregions, by
mean of the “Zoom to” tool, accessible from the homepage. These maps are good examples
of integrated maps, integrating all useful layers to compose a complete information framework
about a selected theme on a selected region. As an example, selecting “climatology” among
the available themes, layers about the location of the weather stations, the amount of season-
al rainfall and the annual rainfall, over base layers on coastline and bathymetry will be dis-
played. Selecting “tourist/recreation”, all the information about the pertinent socio-economic
activities (marinas and pontoons, visitor moorings, surfing associations etc.) and management
activities (national monuments, national parks, nature reserves, areas of outstanding natural
beauty etc.) are displayed together with base layers (bathymetry, coastline).
For each layer, complete metadata is available, stored in a database in order to optimize data
management. Metadata is compliant to ISO 19115 standard, used also by other key organisa-
21807-REL-T002.1 page 270/337
tions handling spatial data in Ireland (e.g., Marine Institute, Environmental Protection Agency
with the Water Framework Directive, The Department of the Environment with the ISDI). In
2002 the Irish government began developing the Irish Spatial Data Infrastructure (ISDI;
McCormack 2004).
The atlas contains three levels of metadata:
Abstract metadata, which provides a brief summary of the dataset; it includes the dataset
title, description, geographical extent, data owner and the data publication date. It is the
first window that appears when the metadata button is clicked in the Information table;
Discovery metadata, which consists of core metadata elements, providing more detailed
information about the dataset, in order to give a better idea of data quality as well as con-
tact information for the data owner; it serves as the central MIDA metadata database;
Full metadata, which is supplied by data owners and not stored in the MIDA XML data-
base. Each full metadata page is displayed in HTML as the owner provides it, therefore its
quality, standardisation, and completeness is the responsibility of the data providers
themselves and not of the MIDA development team.
Hyperlinks within the atlas allow users to move easily between the different metadata levels.
MIDA is explicitly dedicated to the whole coastal and marine Irish territory, which includes two
jurisdictions namely the Republic of Ireland and Northern Ireland (which is part of the United
Kingdom). This choice influenced data collection, which is focused on information available on
wide parts of the coast rather than local contexts. The possibility of developing several “local
MIDA” has been considered
Thematic viewers fit national scale, allowing zoom to visualize information with more detail.
The “Zoom to” tool allows working in 37 preset subregions of Ireland, as mentioned above. All
dataset include information pertinent to coastal and/or marine areas. When the dataset in-
cludes information on the inland areas, the complete dataset is presented rather than clipped.
On the seaward side datasets extend to the British coast on the East and the continental shelf
claim area to the West.
The participation in the International Coastal Atlas Network (ICAN), for which the MIDA team
served also as a catalyst together with the Oregon Coastal Atlas, represents another point of
strength towards the flexibility of the system.
Technological characteristics
MIDA has been implemented with Minnesota MapServer software, free and open source tech-
nology. The system uses Apache Web Server, MapServer, and PostgreS Database. Metadata
is stored in a database in order to optimize data management, permit efficient searching, and
facilitate catalogue sharing. Data management is operated with ESRI desktop applications.
About the server and data repository, a dedicated computer with a LINUX operating system
runs all software and contains all data (geospatial data, metadata and non-geospatial data as
texts, photos, animations etc). Currently, the atlas is not dynamically WMS supported.
The technological architecture of MIDA system is illustrated in the Figure 5-22.

21807-REL-T002.1 page 271/337
Figure 5-22 Elements of MIDA system, based on the INSPIRE model.
The integration with other coastal information system is performed through the participation in
the above mentioned International Coastal Atlas Network (ICAN). MIDA is also a node of the
Irish Spatial Data Exchange (ISDE) (http://www.isde.ie) and shares metadata across its dis-
tributed network. MIDA is finally included in the European Atlas of the Seas
(http://ec.europa.eu/maritimeaffairs/atlas/index_en.htm).
The interoperability is high, as layers are downloadable in Shapefile format and the metadata
standard (ISO 19115) is compliant to the requirement of both the Irish Spatial Data Infrastruc-
ture (ISDI, developed since 2002 by the Irish government McCormack 2004) and the larger
INSPIRE initiative for developing a European Spatial Data Infrastructure. Currently the
metadata is not delivered using ISO 19139 tags, but developments are underway as of 2011
to integrate this standard.
ICZM related functionalities
MIDA provides various functionalities supporting ICZM knowledge and processes, as:
the typology of the information content, supporting an integrated and dynamic view of the
coastal processes through preset integrated maps, multi-time information and ICZM indi-
cators;
the GIS tools, allowing the interactivity and the access to spatial data;
the structured organisation of the available information;
the availability of extensive information like texts and images;
the availability of the info email and tools for stakeholder involvement.
About the first topic, multi-time information is displayed only for some layers, such as land
cover change from 1990 to 2000 to 2006, seasonal pattern of rainfall and sea surface temper-
ature. The data layers include also some of the ICZM specific indicators. These are coastal
erosion, indication of areas of land and seas protected by statutory designations, sea level
rise, pressure for marine and coastal recreations (number of moorings) and quality of bathing
21807-REL-T002.1 page 272/337
waters. The inclusion of data on erosion trends, together with those on sea level rise in differ-
ent costal areas of Ireland, can also be useful for coastal vulnerability assessment to climate
change impacts. As for integrated maps, see section on “Operational Context and Information
Contents”.
About GIS functionalities, the web-GIS interface provide a high interactivity, allowing to cus-
tomise own maps, to make multi-layer interrogations, to search specific topics by text or spa-
tial selection and to zoom to specific preset areas. This can help user to create customised
work views, possibly useful for ICZM.
Spatial data are also downloadable in shapefile format for about 85 of the 140 layers. The oth-
er data cannot be directly downloaded due to confidentiality reasons defined by data provid-
ers, but links to data owner or internet page where the layer can be downloaded are provided
in metadata contents.
MIDA’s structure is well articulated and complete, thus enabling users to easily find data and
information and relate the same to specific issues. The list of layers prepared for display in
MIDA (http://mida.ucc.ie/pages/dataLayers.htm), with direct link for visualisation in the atlas,
represents a powerful knowledge related functionality.
Metadata is presented in a user-friendly and easy to follow layout. Thus, MIDA is well shaped
for problem understanding and structuring, as well as coastal management and planning at
the national level. The user statistics confirm that the Atlas is constantly visited attesting to its
relevance and usefulness.
Finally, the MIDA InfoPort, directly accessible from the information area, is a comprehensive
guide (work in progress) to information on coastal and marine themes and issues in Ireland. It
offers overview text and images, links to relevant organisations and documentation, and rec-
ommendations on sources of geospatial data, both within and outside of the MIDA (Figure
5-23). For some data layer, needing a deeper analysis, the information page is more complex
and structured in five tabs (overview, details, data sources, links and reference). In this regard
the MIDA follows the approach of traditional, printed atlases, which provide text information in
addition to the thematic maps.
Concerning stakeholder involvement and participation, MIDA is totally accessible on-line and,
through the “contribute” link, explicitly stimulates organisation to share their own data through
the MIDA tool, with expected benefits for data owners, data users, and Ireland as a whole.
21807-REL-T002.1 page 273/337
Figure 5-23 The MIDA InfoPort web interface.
System development and management
MIDA has been developed by CMRC with funds from the Higher Education Authority (HEA)
under the Programme for Research in Third-Level Institutions (PRTLI). Additional funding
came from the Environment and Heritage Service, Northern Ireland. CMRC currently main-
tains the Atlas from its own resources, since the initial development programme ended in
2007.
The implementation started in 2002, aiming to set up a centralized repository of spatial da-
tasets to be displayed via the web-GIS application. The main problems encountered during the
development were related to the wide range of data sources, with different data management
practices, data quality, scale, data licensing and metadata quantity, quality and format.
The identification of data owners represented a time consuming activity, as well as the digitali-
zation of back data in non-GIS format and the production of missing layers. The MIDA team
had also to face problems related to data acquisition and licensing restrictions.
21807-REL-T002.1 page 274/337
Quality control of data produced by other entities resulted very difficult to be performed; sys-
tem managers therefore decided to reduce to the minimum the elaboration of other providers’
data and to include in metadata contents some indications about data quality.
The management of MIDA currently involves one full time staff and four part time resources.
Among them, Ned Dwyer is the MIDA manager. Kathrin Kopke is the data manager; she is the
coordinator of the acquisition and of preparation of new layers as well as updating the atlas.
The others provide technical support, contributing to the database design and programming
and creating, editing and preparing various GIS layers as well as completing metadata rec-
ords.
The broad nature of the atlas contents can be exploited by a wide range of potential users,
like:
Policy-makers;
Decision-makers;
Coastal planners and/or managers;
Specialised and expert GIS users;
Representative of private sectors (e.g. industrial or energy companies);
Students;
General public.
There are no different privileges/restrictions for different user typology. The on-line data ac-
cess is free to all the MIDA Atlas contents and functionalities.
Experience with the implementation
The graph below shows the number of visits per month as well as the number of unique visits
per month over the last year. The number of visits is always more than 600 visits/months, with
a peak in November with 1400 visits/months (Figure 5-24).
An analysis performed in 2008 outpointed that most Atlas visitors were from the Republic of
Ireland, followed by visitors from the UK and the USA. High UK interest was expected, as the
MIDA was a cross border collaboration featuring island-wide dataset as well as some specific
Northern Irish data layers. The same 2008 usage statistics showed that the most popular lay-
ers were from the socio-economic activity section, specifically water-based recreation. The
MIDA is also used in teaching on a number of courses organized by the Department of Geog-
raphy within UCC. Feedback by students indicates that MIDA is also utilized as a tool by
teachers in some secondary schools.
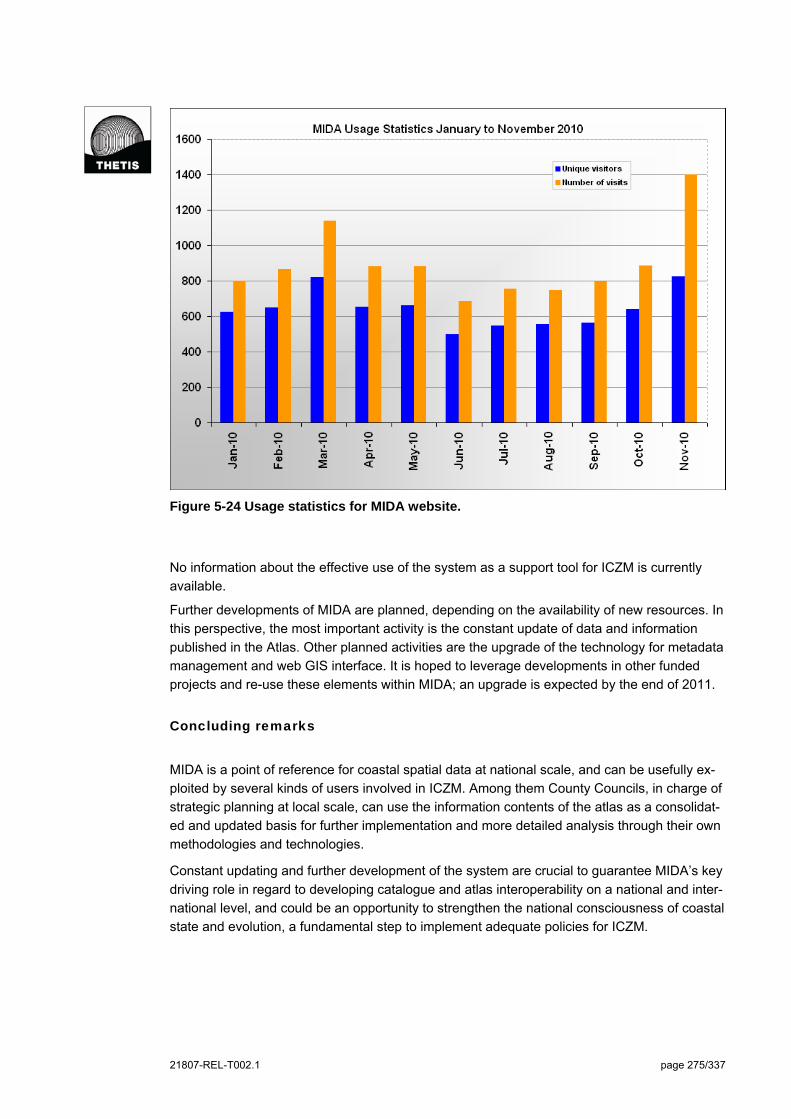
21807-REL-T002.1 page 275/337
Figure 5-24 Usage statistics for MIDA website.
No information about the effective use of the system as a support tool for ICZM is currently
available.
Further developments of MIDA are planned, depending on the availability of new resources. In
this perspective, the most important activity is the constant update of data and information
published in the Atlas. Other planned activities are the upgrade of the technology for metadata
management and web GIS interface. It is hoped to leverage developments in other funded
projects and re-use these elements within MIDA; an upgrade is expected by the end of 2011.
Concluding remarks
MIDA is a point of reference for coastal spatial data at national scale, and can be usefully ex-
ploited by several kinds of users involved in ICZM. Among them County Councils, in charge of
strategic planning at local scale, can use the information contents of the atlas as a consolidat-
ed and updated basis for further implementation and more detailed analysis through their own
methodologies and technologies.
Constant updating and further development of the system are crucial to guarantee MIDA’s key
driving role in regard to developing catalogue and atlas interoperability on a national and inter-
national level, and could be an opportunity to strengthen the national consciousness of coastal
state and evolution, a fundamental step to implement adequate policies for ICZM.
21807-REL-T002.1 page 276/337
5.7 Dorset Coastal Explorer
General Information
Dorset Coastal Explorer is a web GIS allowing users to visualize a great number of layers re-
lated to the Dorset Region in the South of England. Spatial information is not only related to
the coastal area, but more in general to the whole Dorset territory. The system is also particu-
larly interesting since provides some innovative functionalities for data query and investigation,
also enabling to re-call information related to local planning. Dorset Coastal Explorer provides
the possibility to export customised maps as PDF documents.
Dorset Coastal Explorer development is strictly related to the activities of the Dorset Coast Fo-
rum (http://www.dorsetforyou.com/dcf) that has been at the forefront of ICZM since 1995. The
Dorset Coast Forum is an established Strategic Coastal Partnership made up of over 220 pub-
lic, private and voluntary member organisations, covering fishing, commercial, environmental,
recreational, historical and touristic sectors that, as a whole, have expertise and local
knowledge of Dorset's coast and inshore waters.
The Dorset Coast Forum covers from Lyme Regis to Christchurch out to 12 nautical miles. Its
primary objective is to encourage co-operation and dialogue between all the different stake-
holders of the coast in the Dorset area, promoting a sustainable approach to the management,
use and development of Dorset's coast and inshore waters.
C-SCOPE Interreg project (Cross Border 2 Seas Programme, http://www.cscope.eu/en/), cur-
rently under going, is providing funds for the development of the Dorset Coastal Explorer. This
will be an innovative tool that will provide information on prevailing policies, ecology, current
uses and land/seascape features. It will list relevant planning policies and provide links to their
detail. The tool should be finalised by the end of 2011.
C-SCOPE will also develop a framework for integrating terrestrial and marine management
planning, involving the development of a pilot Marine Spatial Plan for a selected area of the
Dorset coast. Finally, C-SCOPE will provide a series of hi-tech interactive coastal information
points (or Coastal explorer access points) to improve stakeholders’ engagement.
The operating entity is the Dorset Coast Forum; the Dorset Coast Forum team is hosted by
Dorset County Council and funded by Weymouth and Portland Borough Council, Borough of
Poole, Environment Agency, Natural England, Wessex Water, Dorset Wildlife Trust, Dorset
County Council, West Dorset District Council.
The contact person at Dorset Coast Forum is James Feaver (e-mail:
[email protected]), Marine and Coastal GIS Officer, Dorset Coast Forum, Environment
Services, County Hall, Dorchester, Dorset, DT1 1XJ, United Kingdom.
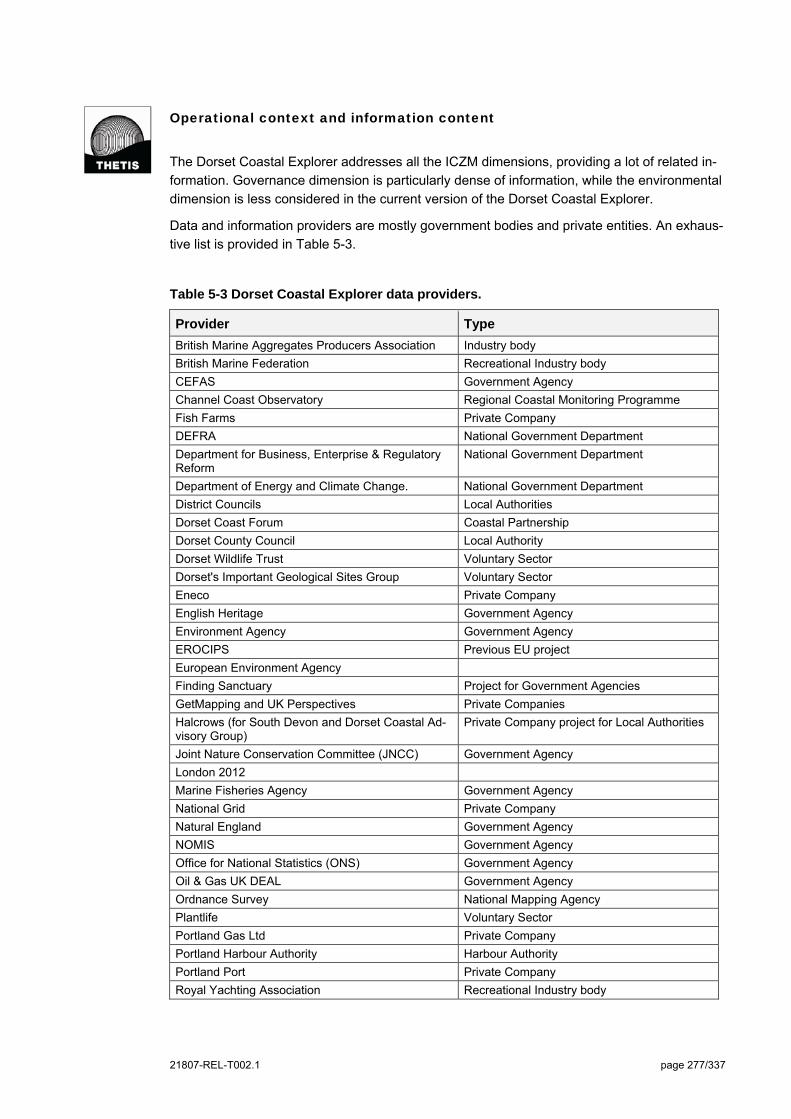
21807-REL-T002.1 page 277/337
Operational context and information content
The Dorset Coastal Explorer addresses all the ICZM dimensions, providing a lot of related in-
formation. Governance dimension is particularly dense of information, while the environmental
dimension is less considered in the current version of the Dorset Coastal Explorer.
Data and information providers are mostly government bodies and private entities. An exhaus-
tive list is provided in Table 5-3.
Table 5-3 Dorset Coastal Explorer data providers.
Provider Type
British Marine Aggregates Producers Association Industry body
British Marine Federation Recreational Industry body
CEFAS Government Agency
Channel Coast Observatory Regional Coastal Monitoring Programme
Fish Farms Private Company
DEFRA National Government Department
Department for Business, Enterprise & Regulatory Reform
National Government Department
Department of Energy and Climate Change. National Government Department
District Councils Local Authorities
Dorset Coast Forum Coastal Partnership
Dorset County Council Local Authority
Dorset Wildlife Trust Voluntary Sector
Dorset's Important Geological Sites Group Voluntary Sector
Eneco Private Company
English Heritage Government Agency
Environment Agency Government Agency
EROCIPS Previous EU project
European Environment Agency
Finding Sanctuary Project for Government Agencies
GetMapping and UK Perspectives Private Companies
Halcrows (for South Devon and Dorset Coastal Ad-visory Group)
Private Company project for Local Authorities
Joint Nature Conservation Committee (JNCC) Government Agency
London 2012
Marine Fisheries Agency Government Agency
National Grid Private Company
Natural England Government Agency
NOMIS Government Agency
Office for National Statistics (ONS) Government Agency
Oil & Gas UK DEAL Government Agency
Ordnance Survey National Mapping Agency
Plantlife Voluntary Sector
Portland Gas Ltd Private Company
Portland Harbour Authority Harbour Authority
Portland Port Private Company
Royal Yachting Association Recreational Industry body
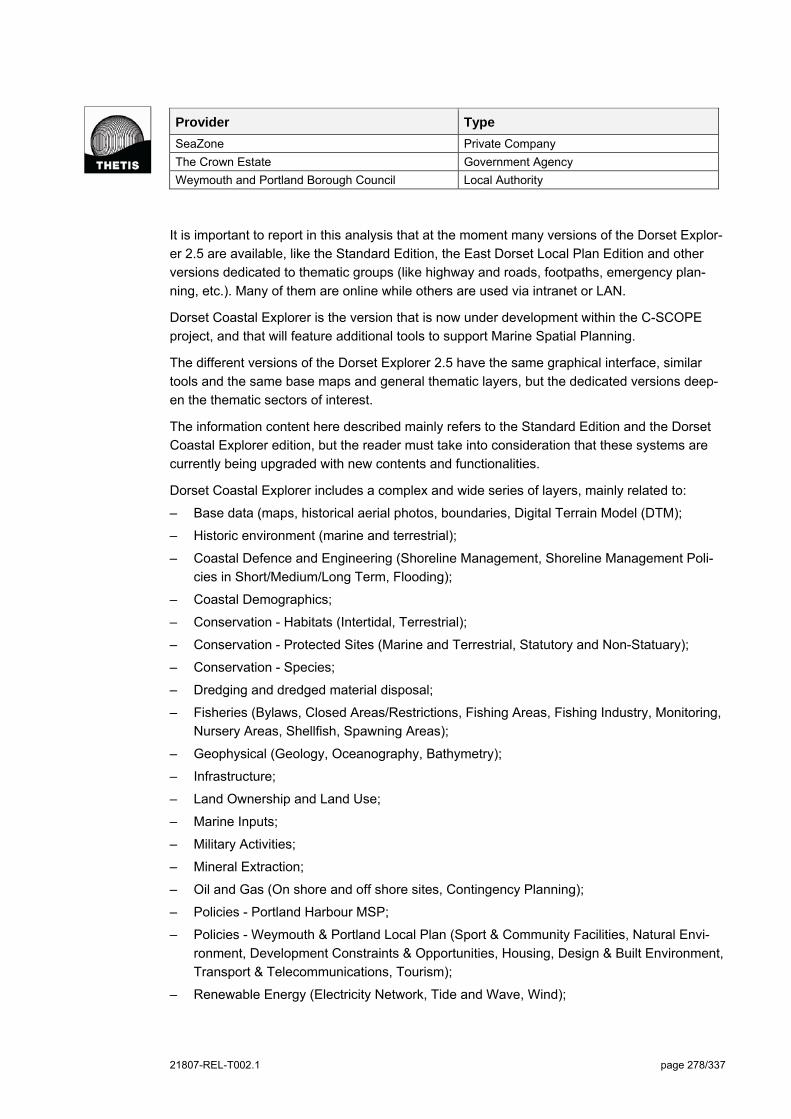
21807-REL-T002.1 page 278/337
Provider Type
SeaZone Private Company
The Crown Estate Government Agency
Weymouth and Portland Borough Council Local Authority
It is important to report in this analysis that at the moment many versions of the Dorset Explor-
er 2.5 are available, like the Standard Edition, the East Dorset Local Plan Edition and other
versions dedicated to thematic groups (like highway and roads, footpaths, emergency plan-
ning, etc.). Many of them are online while others are used via intranet or LAN.
Dorset Coastal Explorer is the version that is now under development within the C-SCOPE
project, and that will feature additional tools to support Marine Spatial Planning.
The different versions of the Dorset Explorer 2.5 have the same graphical interface, similar
tools and the same base maps and general thematic layers, but the dedicated versions deep-
en the thematic sectors of interest.
The information content here described mainly refers to the Standard Edition and the Dorset
Coastal Explorer edition, but the reader must take into consideration that these systems are
currently being upgraded with new contents and functionalities.
Dorset Coastal Explorer includes a complex and wide series of layers, mainly related to:
– Base data (maps, historical aerial photos, boundaries, Digital Terrain Model (DTM);
– Historic environment (marine and terrestrial);
– Coastal Defence and Engineering (Shoreline Management, Shoreline Management Poli-
cies in Short/Medium/Long Term, Flooding);
– Coastal Demographics;
– Conservation - Habitats (Intertidal, Terrestrial);
– Conservation - Protected Sites (Marine and Terrestrial, Statutory and Non-Statuary);
– Conservation - Species;
– Dredging and dredged material disposal;
– Fisheries (Bylaws, Closed Areas/Restrictions, Fishing Areas, Fishing Industry, Monitoring,
Nursery Areas, Shellfish, Spawning Areas);
– Geophysical (Geology, Oceanography, Bathymetry);
– Infrastructure;
– Land Ownership and Land Use;
– Marine Inputs;
– Military Activities;
– Mineral Extraction;
– Oil and Gas (On shore and off shore sites, Contingency Planning);
– Policies - Portland Harbour MSP;
– Policies - Weymouth & Portland Local Plan (Sport & Community Facilities, Natural Envi-
ronment, Development Constraints & Opportunities, Housing, Design & Built Environment,
Transport & Telecommunications, Tourism);
– Renewable Energy (Electricity Network, Tide and Wave, Wind);
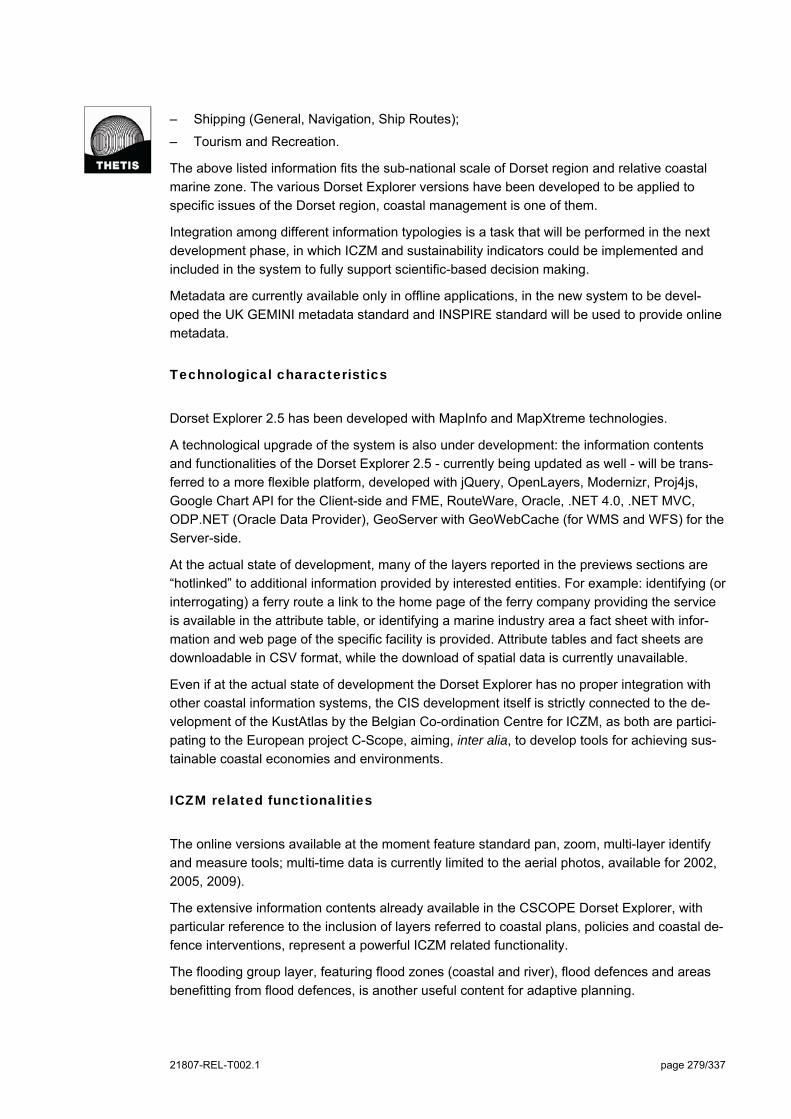
21807-REL-T002.1 page 279/337
– Shipping (General, Navigation, Ship Routes);
– Tourism and Recreation.
The above listed information fits the sub-national scale of Dorset region and relative coastal
marine zone. The various Dorset Explorer versions have been developed to be applied to
specific issues of the Dorset region, coastal management is one of them.
Integration among different information typologies is a task that will be performed in the next
development phase, in which ICZM and sustainability indicators could be implemented and
included in the system to fully support scientific-based decision making.
Metadata are currently available only in offline applications, in the new system to be devel-
oped the UK GEMINI metadata standard and INSPIRE standard will be used to provide online
metadata.
Technological characteristics
Dorset Explorer 2.5 has been developed with MapInfo and MapXtreme technologies.
A technological upgrade of the system is also under development: the information contents
and functionalities of the Dorset Explorer 2.5 - currently being updated as well - will be trans-
ferred to a more flexible platform, developed with jQuery, OpenLayers, Modernizr, Proj4js,
Google Chart API for the Client-side and FME, RouteWare, Oracle, .NET 4.0, .NET MVC,
ODP.NET (Oracle Data Provider), GeoServer with GeoWebCache (for WMS and WFS) for the
Server-side.
At the actual state of development, many of the layers reported in the previews sections are
“hotlinked” to additional information provided by interested entities. For example: identifying (or
interrogating) a ferry route a link to the home page of the ferry company providing the service
is available in the attribute table, or identifying a marine industry area a fact sheet with infor-
mation and web page of the specific facility is provided. Attribute tables and fact sheets are
downloadable in CSV format, while the download of spatial data is currently unavailable.
Even if at the actual state of development the Dorset Explorer has no proper integration with
other coastal information systems, the CIS development itself is strictly connected to the de-
velopment of the KustAtlas by the Belgian Co-ordination Centre for ICZM, as both are partici-
pating to the European project C-Scope, aiming, inter alia, to develop tools for achieving sus-
tainable coastal economies and environments.
ICZM related functionalities
The online versions available at the moment feature standard pan, zoom, multi-layer identify
and measure tools; multi-time data is currently limited to the aerial photos, available for 2002,
2005, 2009).
The extensive information contents already available in the CSCOPE Dorset Explorer, with
particular reference to the inclusion of layers referred to coastal plans, policies and coastal de-
fence interventions, represent a powerful ICZM related functionality.
The flooding group layer, featuring flood zones (coastal and river), flood defences and areas
benefitting from flood defences, is another useful content for adaptive planning.
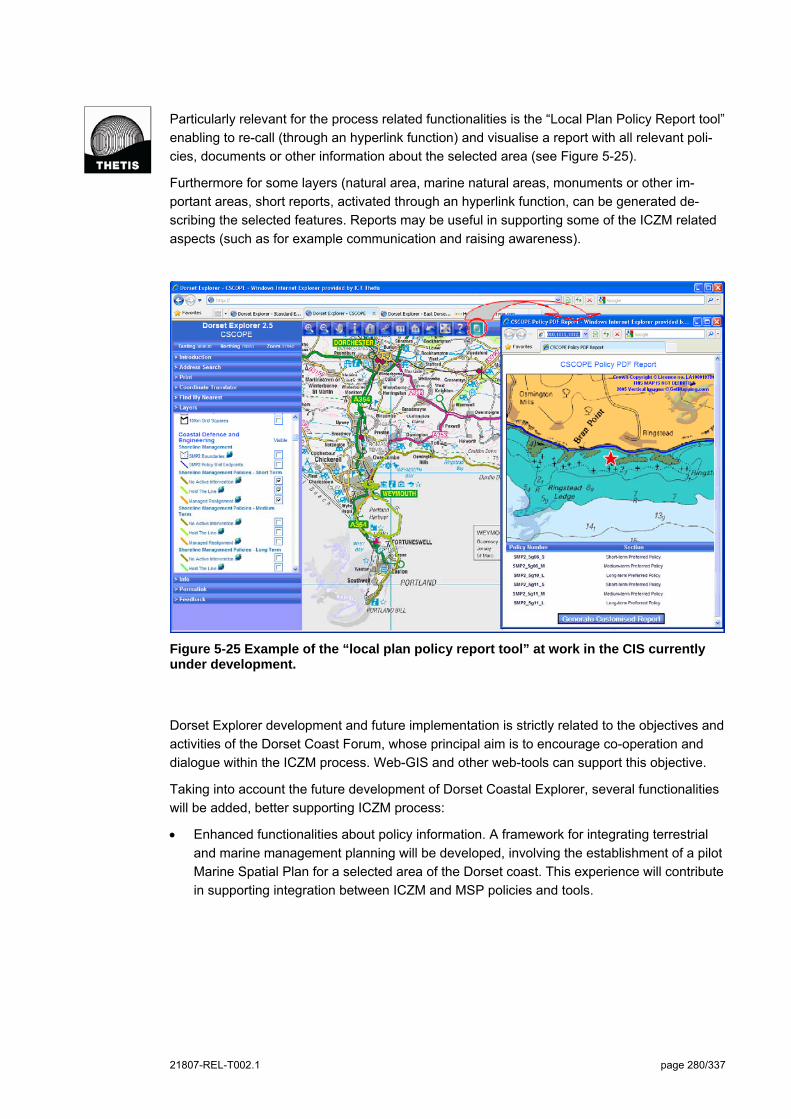
21807-REL-T002.1 page 280/337
Particularly relevant for the process related functionalities is the “Local Plan Policy Report tool”
enabling to re-call (through an hyperlink function) and visualise a report with all relevant poli-
cies, documents or other information about the selected area (see Figure 5-25).
Furthermore for some layers (natural area, marine natural areas, monuments or other im-
portant areas, short reports, activated through an hyperlink function, can be generated de-
scribing the selected features. Reports may be useful in supporting some of the ICZM related
aspects (such as for example communication and raising awareness).
Figure 5-25 Example of the “local plan policy report tool” at work in the CIS currently under development.
Dorset Explorer development and future implementation is strictly related to the objectives and
activities of the Dorset Coast Forum, whose principal aim is to encourage co-operation and
dialogue within the ICZM process. Web-GIS and other web-tools can support this objective.
Taking into account the future development of Dorset Coastal Explorer, several functionalities
will be added, better supporting ICZM process:
Enhanced functionalities about policy information. A framework for integrating terrestrial
and marine management planning will be developed, involving the establishment of a pilot
Marine Spatial Plan for a selected area of the Dorset coast. This experience will contribute
in supporting integration between ICZM and MSP policies and tools.
21807-REL-T002.1 page 281/337
System development and management
Responsibilities for the system are divided. The Dorset Coast Forum manages the coastal da-
ta (1 person). The tool (development and maintenance including base mapping data) is man-
aged by the County Council GIS team (5 persons).
Difficulties in developing the system mainly deal with copyright issues.
It is important to underline that the development of Dorset Coastal Explorer has been steered
by a Task and Finish group made up of Coast Forum Staff, GIS team members and a number
of external stakeholders.
Experience with the implementation
The actual versions of the Dorset Explorer 2.5 are used by different departments of public enti-
ties (Fire department, for example). The Dorset Explorer 2.5 version dedicated to coastal
management (Dorset Coastal Explorer) is under development and therefore not in use yet.
The scope, aim and target audience of Dorset Coastal Explorer under development within the
C-SCOPE project have been discussed with stakeholders, which outpointed the need of a tool
to analyze and support coastal management and planning.
Public participation has been used for useful data collection by the Dorset Coast Forum.
Concluding remarks
The CIS under development by the Dorset Coast Forum within the C-SCOPE project already
features powerful ICZM related functionalities explicitly aimed to support coastal management.
While the other CIS developed within the C-SCOPE - the KustAtlas - has been oriented by the
involved stakeholder to a wide audience, the Dorset CIS addresses policy makers and coastal
planners.
C-SCOPE will also develop a framework for integrating terrestrial and marine management
planning, involving the development of a pilot Marine Spatial Plan for a selected area of the
Dorset coast. This experience will contribute in supporting integration between ICZM and MSP
policies and tools.
The Dorset Coastal Explorer in its final release could be one of the best examples of tools in
support of ICZM. The following challenge could be represented by its effective use in decision-
making processes dealing with coastal and marine zones.
21807-REL-T002.1 page 282/337
5.8 Cork Harbour Geographic Information System
General Information
The Cork Harbour GIS was initially developed within the Interreg COREPOINT project (COastal
REsearch and POlicy INTegration) between 2004 and 2008, and then maintained and updated
by the Coastal and Marine Research Centre of the University College Cork (CMRC, website
http://cmrc.ucc.ie).
One of the main goals of the COREPOINT project was to bridge the gap between research insti-
tutions and local authorities dealing with ICZM. The project intended to properly use scientific
experience and resources to provide improved information for planners responsible for local
coastal areas as part of an ICZM approach. The project selected Cork Harbour as one of the
sites for the development of GIS tools supporting the ICZM process.
The Cork Harbour initiative focused on coastal vulnerability, habitat loss, tourism pressures
and development options for a Brownfield area. Inside the COREPOINT activity, the final out-
come of the Cork Harbour ICZM related initiative was the development and publication of an
Integrated Management Strategy for Cork Harbour in 2008. The strategy was the result of a
cooperative effort jointly produced by local authorities and academic experts.
The Cork Harbour initiative also included the development of a GIS providing support to the
above ICZM processes. The GIS is also used as an intermediary mechanism to collect shore-
line feature data and as a framework to house the “Coastal Inventory spatial database” of
shoreline features (see http://cmrc.ucc.ie/CI/index.htm). The GIS and the coastal inventory
compose a Coastal Information System (CIS) aiming to support the monitoring, management,
development and conservation of coastal, estuarine and riparian habitats.
Cork Harbour and the related CIS were also analysed by the EU FP7 SPICOSA project (2009-
2011) to develop a self-evolving and operational research approach framework for the as-
sessment of policy options for the sustainable management of coastal zone systems.
At the moment funding for the support and the implementation of the Integrated Management
Strategy and hence the development of the CIS, are allocated through a new INTERREG pro-
ject called IMCORE.
The Planning Policy Unit (PPU) of Cork County Council and the Coastal and Marine Research
Centre (CMRC) of University College Cork are IMCORE project partners. They also operate
the Secretariat function in joint venture, representing the CIS operating entity. One of the main
functions of the Secretariat is to manage the stakeholder’s involvement in the process, and to
maintain the http://www.corkharbour.ie website, which will be a focal point for information on
relevant activities. Cork Harbour CIS is currently an operational offline system used c/o
CMRC.
The contact person at CMRC is Cathal O’Mahony, email [email protected], while Darragh
O’Suilleabhain is the executive planner at the Planning Policy Unit (PPU) of Cork County
Council.

21807-REL-T002.1 page 283/337
Operational context and information content
The CIS is scaled to the Cork Harbour area, a large natural harbour on the southern coast of
Ireland, that represent a complex estuarine coastal system with a water body surface area of
approximately 100 km2. Some parts of the area are also densely populated, with about 65% of
County Cork’s population living in close proximity to the coast.
The CIS addresses all the considered information dimensions: environmental (e.g. shoreline,
river), territorial (land use manmade shoreline, roads) society (e.g. residential structures, mari-
nas, water safety training, diving), economic (industrial area, tourism activities), governance
(County Development Plan).
The Coastal Harbour CIS includes the following main spatial layers:
– Base data (Orthoimagery, Administrative boundaries, etc.);
– Shoreline type (natural or manmade, e.g. revetments, sea walls, beaches, docks, rocky
shores);
– Shoreline features (e.g. jetties, piers, pontoons, steps, ladders);
– Shoreline vulnerability (e.g. state of repair, conditions, erosion);
– Adjacent Land use (e.g. agriculture, industry, residential, amenity);
– Population density;
– Tourism structures (marinas, diving, charter companies, and sailings clubs);
– Infrastructures and footpaths;
– Activities (Angling, Sailing, Family and adventure, Rowing, Diving, Surfing);
– County Development Plan layers.
Data providers are universities, research institutions, cartographic institutions or agencies that
allow free data distribution. CMRC also carries out in-field geomorphological surveys and
monitoring activities using GPS technologies to integrate the system’s informational content.
The CIS is offline, so metadata is managed with desktop applications.
The system is intended to be a model that can be easily replicated in different sites. The
Coastal Inventory is currently used at CMRC and PPU and by local emergency planners and
tourism agencies, and can be easily replicated and integrated in other local contexts.
Technological characteristics
The core component of the CIS is the Coastal Inventory spatial database, a repository of vec-
tor and raster data in various formats. Data implementation and DB management is operated
at CMRC with ESRI desktop applications. PPU use the Coastal Inventory spatial database as
an additional component to the MapInfo systems in use at their offices.
In relation to interoperability and data access, data (raster and vector) can be distributed by
CMRC in accordance with copyrights of third parties and the governing law, by directly con-
tacting the Coastal Inventory Team at CMRC.
The CIS is not directly integrated with other systems, but part of the informational contents are
shared with the Marine Irish Digital Atlas http://mida.ucc.ie/ (MIDA, see section 5.6).
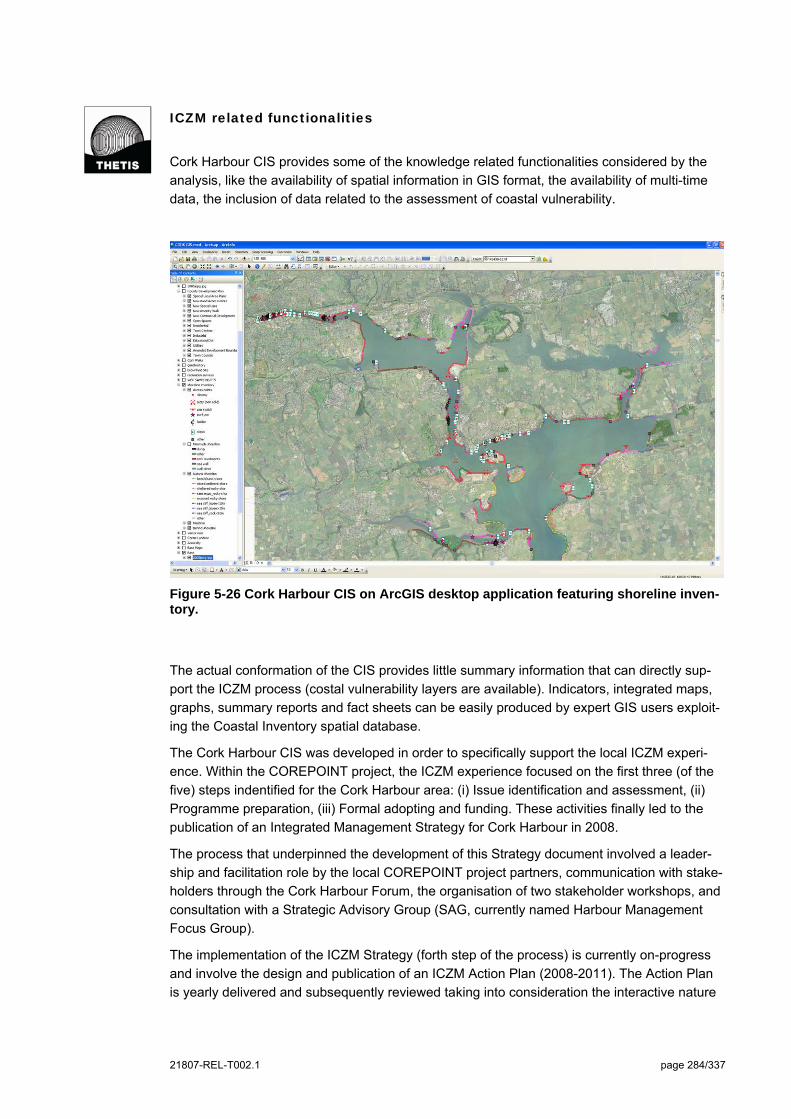
21807-REL-T002.1 page 284/337
ICZM related functionalities
Cork Harbour CIS provides some of the knowledge related functionalities considered by the
analysis, like the availability of spatial information in GIS format, the availability of multi-time
data, the inclusion of data related to the assessment of coastal vulnerability.
Figure 5-26 Cork Harbour CIS on ArcGIS desktop application featuring shoreline inven-tory.
The actual conformation of the CIS provides little summary information that can directly sup-
port the ICZM process (costal vulnerability layers are available). Indicators, integrated maps,
graphs, summary reports and fact sheets can be easily produced by expert GIS users exploit-
ing the Coastal Inventory spatial database.
The Cork Harbour CIS was developed in order to specifically support the local ICZM experi-
ence. Within the COREPOINT project, the ICZM experience focused on the first three (of the
five) steps indentified for the Cork Harbour area: (i) Issue identification and assessment, (ii)
Programme preparation, (iii) Formal adopting and funding. These activities finally led to the
publication of an Integrated Management Strategy for Cork Harbour in 2008.
The process that underpinned the development of this Strategy document involved a leader-
ship and facilitation role by the local COREPOINT project partners, communication with stake-
holders through the Cork Harbour Forum, the organisation of two stakeholder workshops, and
consultation with a Strategic Advisory Group (SAG, currently named Harbour Management
Focus Group).
The implementation of the ICZM Strategy (forth step of the process) is currently on-progress
and involve the design and publication of an ICZM Action Plan (2008-2011). The Action Plan
is yearly delivered and subsequently reviewed taking into consideration the interactive nature
21807-REL-T002.1 page 285/337
of ICZM and the need to ensure a flexible process to deal with emerging and changing priori-
ties.
The Cork Harbour CIS has therefore provided data and functionalities supporting various as-
pects of the ICZM experience, including problem understanding and structuring, assessment
of alternatives in planning and management, monitoring and evaluation, adaptive planning and
management. Furthermore, through the IMCORE project, specific research is undertaken to
examine the use of scenarios to support the planning process for climate change and ultimate-
ly benefit local coastal communities.
System development and management
The Coastal Inventory and the Cork Harbour GIS are developed by CMRC on voluntary basis,
aiming at providing a local model to be used in many ICZM contexts, filling an informational
gap in the local authorities’ coastal governance.
The main barriers encountered in developing the system are related to copyright issues and to
the definition of a shared goal. Another bottleneck is that the Integrated Management Strategy
reported in the previous paragraphs is a volunteer initiative, not binding for the entities taking
part to it. Even if the strategy sets quarterly meetings of the partners, some lack of interaction
between entities can be observed.
The Cork Harbour CIS was created following the guide line set out in the report "Guidelines for
Implementing Local Information Systems at the Coast", developed within the COREPOINT
project. The Guidelines were developed on the basis of the experience on local ICZM pro-
cesses of six COREPOINT partners (Essex Estuaries, Sefton Coast, Severn Estuary, Fal Es-
tuary, and Cork Harbour) and results of the engagement and participation of over 100 local
stakeholders.
System development and management is in charge of 4-5 persons (not at full time) at CMRC.
Cathal O’Mahony is manager of the local node of the system, while Vicki O'Donnell, in charge
of data validation and updating, is the contact person at CMRC for data commissioning.
Users of the Cork Harbour CIS are mainly coastal planners, managers, and regulators (i.e.
decision makers level).
Future activities foresee the development of a web GIS that will be made available to all po-
tential users (see http://www.corkharbour.ie/pages/gis.htm).
Experience with the implementation
At the moment, the access of the system is restricted only to off-line users at CMRC and PPU.
Next development steps will implement a web GIS that will enhance interactiveness and data
access. CMRC developed the Cork Harbour GIS as a model to be replicated and further de-
veloped in different institutions to support the Cork Harbour development strategy.
At the Planning Policy Unit (PPU) of Cork County Council the Coastal Inventory is used as an
additional informational component of the systems in use at their offices. Darragh
O’Suilleabhain is the executive planner at PPU that follows the project. The CIS has been
used as a support tool to develop the “Marine Leisure Infrastructure Strategy” of the Cork
County Council.
21807-REL-T002.1 page 286/337
No specific e-participation tools are currently available apart from the point of contact in the
CMRC web page, but the actual state of the system derives from a wide participatory ap-
proach and activities (i.e. Cork Harbour Forum, Harbour Management Focus Group, Cork
Harbour News, thematic workshops, Working Groups, etc.).
Concluding remarks
The Cork Harbour GIS is a system with a very simple architecture, not oriented to provide an
exhaustive set of information contents and tools for ICZM, but rather aimed at offering a case
study approach to bridge the gap between research institutions and local authorities dealing
with ICZM.
The actual efficacy of the system in supporting the implementation of the ICZM process is
demonstrated by the successful and productive joint venture between the research institution
that developed the system (CMRC) and the local planners involved in ICZM (PPU).
The further implementation of the system, which will enhance the participatory and process
related functionalities, could lead to a more structured and deployable tool able to support
many other aspects of the ICZM.
21807-REL-T002.1 page 287/337
5.9 GEOIDD-Litto
General Information
GEOIDD-Litto (Géographie et indicateurs liés au développement durable sur le littoral - Geog-
raphy and indicators related to coastal sustainable development) is a coastal, marine and mar-
itime web cartographical tool that allows to access a variety of geographical and statistical in-
formation, both for land and sea, along the French coast and overseas departments (Guade-
loupe, Martinique, Guyane, Reunion).
GEOIDD-Litto is an initiative of the Observatoire du Littoral (French Coastal observatory). The
Observatory includes, as part of an agreement, the Ministry of Ecology, Sustainable Develop-
ment, Transportation and Housing; the Inter-ministerial Delegation for Territorial Planning
(DATAR) and the General Secretariat of the Sea. The Centre has a Steering Committee, a
body chaired by DATAR and bringing together all government signatories of the agreement as
well as the Ministry of Food, Agriculture and Fisheries, the French Research Institute for Ex-
ploitation of the Sea (IFREMER), Hydrographic and Oceanographic Department of the Navy
(SHOM), the National Council for Geographic information (CNIG), the Agency for Marine Pro-
tected Areas and the coastal conservancy.
GEOIDD-Litto responds to some of the main objectives of the French Observatoire du Littoral,
in particular related to:
Organise and share information and data on the coastal system;
Improve the vertical and horizontal information flow among different administrations deal-
ing with coastal management issues;
Contribute to the discussion on the standardization of protocols for collecting, processing
and sharing data.
The operating entity is the Observatoire du Littoral (French coastal observatory). It includes,
as part of an agreement: the Ministry of Ecology, Sustainable Development, Transportation
and Housing; the Inter-ministerial Delegation for Territorial Planning; the General Secretariat
of the Sea.
The home page of the coastal observatory’s cartographical tool is
http://www.littoral.ifen.fr/Cartographie.6.0.html. The contact person is Sébastien Colas at the
Ministry of Ecology, Sustainable Development, Transportation and Housing (e-
mail:[email protected]).
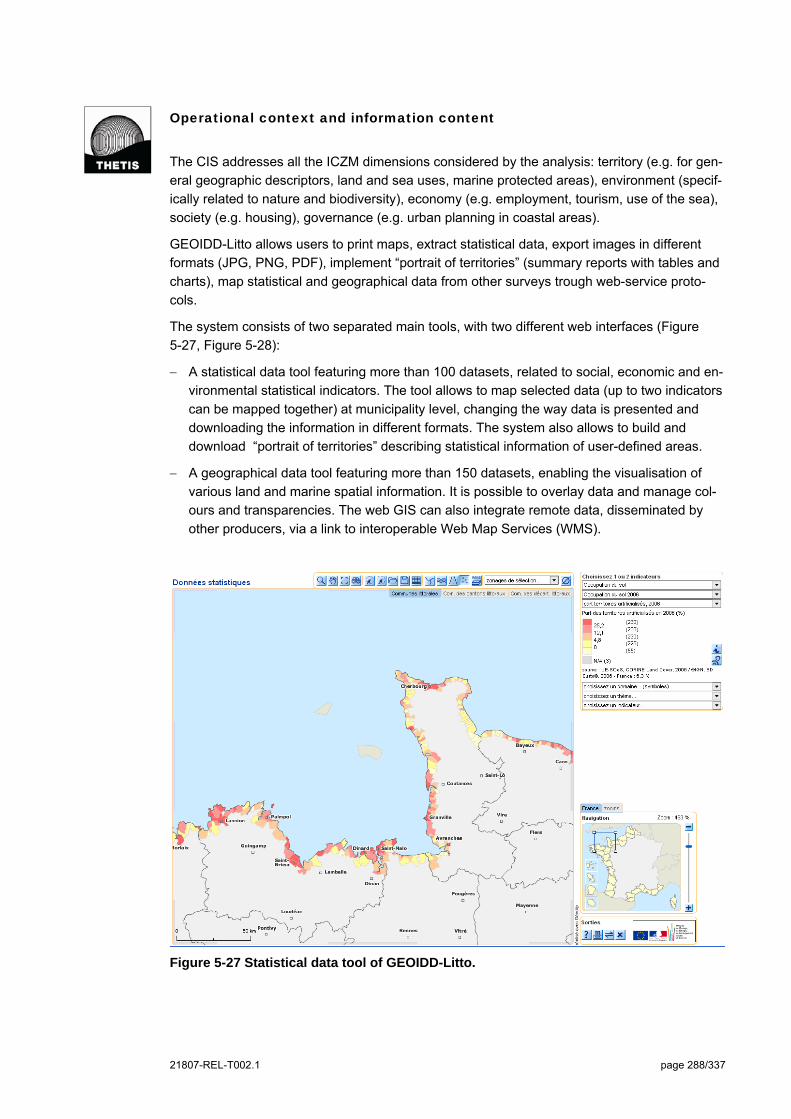
21807-REL-T002.1 page 288/337
Operational context and information content
The CIS addresses all the ICZM dimensions considered by the analysis: territory (e.g. for gen-
eral geographic descriptors, land and sea uses, marine protected areas), environment (specif-
ically related to nature and biodiversity), economy (e.g. employment, tourism, use of the sea),
society (e.g. housing), governance (e.g. urban planning in coastal areas).
GEOIDD-Litto allows users to print maps, extract statistical data, export images in different
formats (JPG, PNG, PDF), implement “portrait of territories” (summary reports with tables and
charts), map statistical and geographical data from other surveys trough web-service proto-
cols.
The system consists of two separated main tools, with two different web interfaces (Figure
5-27, Figure 5-28):
A statistical data tool featuring more than 100 datasets, related to social, economic and en-
vironmental statistical indicators. The tool allows to map selected data (up to two indicators
can be mapped together) at municipality level, changing the way data is presented and
downloading the information in different formats. The system also allows to build and
download “portrait of territories” describing statistical information of user-defined areas.
A geographical data tool featuring more than 150 datasets, enabling the visualisation of
various land and marine spatial information. It is possible to overlay data and manage col-
ours and transparencies. The web GIS can also integrate remote data, disseminated by
other producers, via a link to interoperable Web Map Services (WMS).
Figure 5-27 Statistical data tool of GEOIDD-Litto.
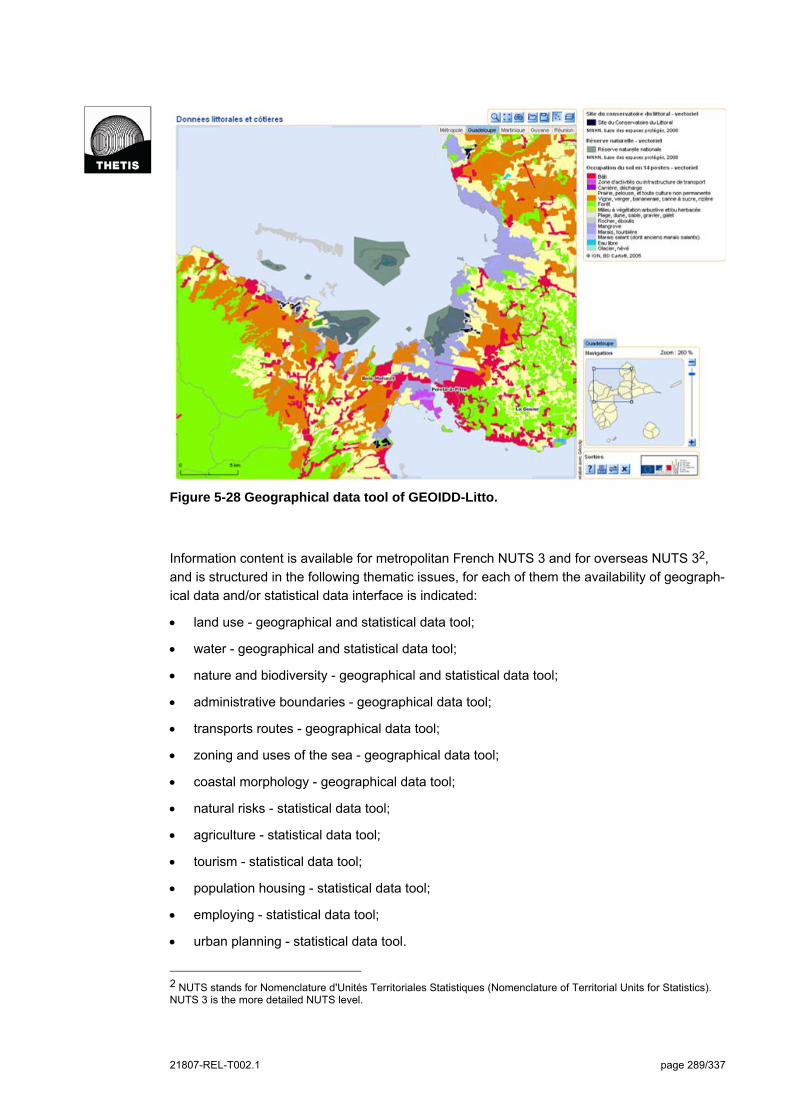
21807-REL-T002.1 page 289/337
Figure 5-28 Geographical data tool of GEOIDD-Litto.
Information content is available for metropolitan French NUTS 3 and for overseas NUTS 32,
and is structured in the following thematic issues, for each of them the availability of geograph-
ical data and/or statistical data interface is indicated:
land use - geographical and statistical data tool;
water - geographical and statistical data tool;
nature and biodiversity - geographical and statistical data tool;
administrative boundaries - geographical data tool;
transports routes - geographical data tool;
zoning and uses of the sea - geographical data tool;
coastal morphology - geographical data tool;
natural risks - statistical data tool;
agriculture - statistical data tool;
tourism - statistical data tool;
population housing - statistical data tool;
employing - statistical data tool;
urban planning - statistical data tool.
2 NUTS stands for Nomenclature d'Unités Territoriales Statistiques (Nomenclature of Territorial Units for Statistics). NUTS 3 is the more detailed NUTS level.
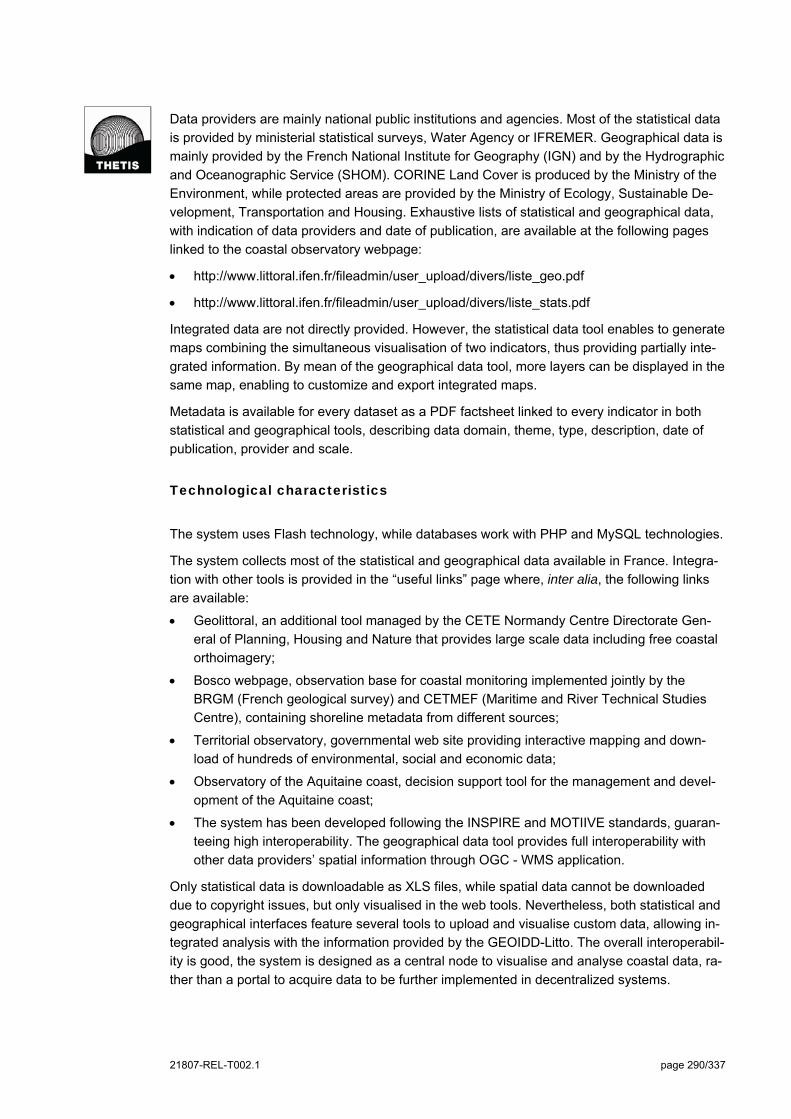
21807-REL-T002.1 page 290/337
Data providers are mainly national public institutions and agencies. Most of the statistical data
is provided by ministerial statistical surveys, Water Agency or IFREMER. Geographical data is
mainly provided by the French National Institute for Geography (IGN) and by the Hydrographic
and Oceanographic Service (SHOM). CORINE Land Cover is produced by the Ministry of the
Environment, while protected areas are provided by the Ministry of Ecology, Sustainable De-
velopment, Transportation and Housing. Exhaustive lists of statistical and geographical data,
with indication of data providers and date of publication, are available at the following pages
linked to the coastal observatory webpage:
http://www.littoral.ifen.fr/fileadmin/user_upload/divers/liste_geo.pdf
http://www.littoral.ifen.fr/fileadmin/user_upload/divers/liste_stats.pdf
Integrated data are not directly provided. However, the statistical data tool enables to generate
maps combining the simultaneous visualisation of two indicators, thus providing partially inte-
grated information. By mean of the geographical data tool, more layers can be displayed in the
same map, enabling to customize and export integrated maps.
Metadata is available for every dataset as a PDF factsheet linked to every indicator in both
statistical and geographical tools, describing data domain, theme, type, description, date of
publication, provider and scale.
Technological characteristics
The system uses Flash technology, while databases work with PHP and MySQL technologies.
The system collects most of the statistical and geographical data available in France. Integra-
tion with other tools is provided in the “useful links” page where, inter alia, the following links
are available:
Geolittoral, an additional tool managed by the CETE Normandy Centre Directorate Gen-
eral of Planning, Housing and Nature that provides large scale data including free coastal
orthoimagery;
Bosco webpage, observation base for coastal monitoring implemented jointly by the
BRGM (French geological survey) and CETMEF (Maritime and River Technical Studies
Centre), containing shoreline metadata from different sources;
Territorial observatory, governmental web site providing interactive mapping and down-
load of hundreds of environmental, social and economic data;
Observatory of the Aquitaine coast, decision support tool for the management and devel-
opment of the Aquitaine coast;
The system has been developed following the INSPIRE and MOTIIVE standards, guaran-
teeing high interoperability. The geographical data tool provides full interoperability with
other data providers’ spatial information through OGC - WMS application.
Only statistical data is downloadable as XLS files, while spatial data cannot be downloaded
due to copyright issues, but only visualised in the web tools. Nevertheless, both statistical and
geographical interfaces feature several tools to upload and visualise custom data, allowing in-
tegrated analysis with the information provided by the GEOIDD-Litto. The overall interoperabil-
ity is good, the system is designed as a central node to visualise and analyse coastal data, ra-
ther than a portal to acquire data to be further implemented in decentralized systems.
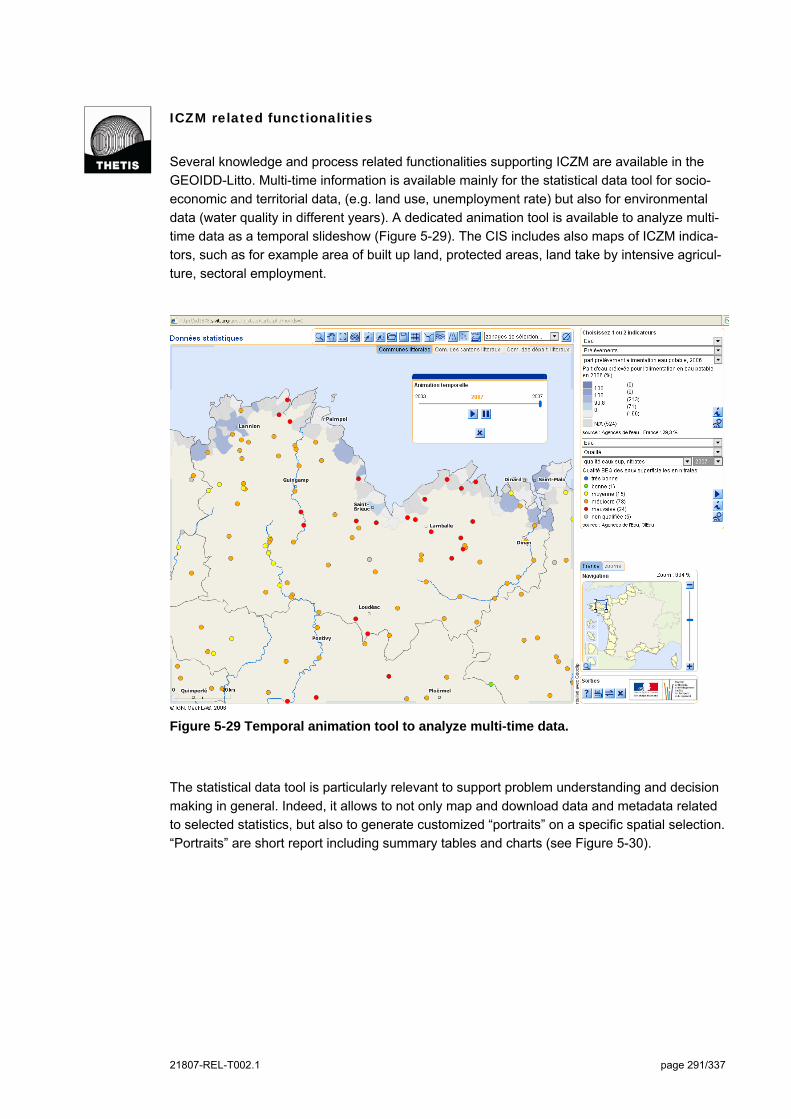
21807-REL-T002.1 page 291/337
ICZM related functionalities
Several knowledge and process related functionalities supporting ICZM are available in the
GEOIDD-Litto. Multi-time information is available mainly for the statistical data tool for socio-
economic and territorial data, (e.g. land use, unemployment rate) but also for environmental
data (water quality in different years). A dedicated animation tool is available to analyze multi-
time data as a temporal slideshow (Figure 5-29). The CIS includes also maps of ICZM indica-
tors, such as for example area of built up land, protected areas, land take by intensive agricul-
ture, sectoral employment.
Figure 5-29 Temporal animation tool to analyze multi-time data.
The statistical data tool is particularly relevant to support problem understanding and decision
making in general. Indeed, it allows to not only map and download data and metadata related
to selected statistics, but also to generate customized “portraits” on a specific spatial selection.
“Portraits” are short report including summary tables and charts (see Figure 5-30).
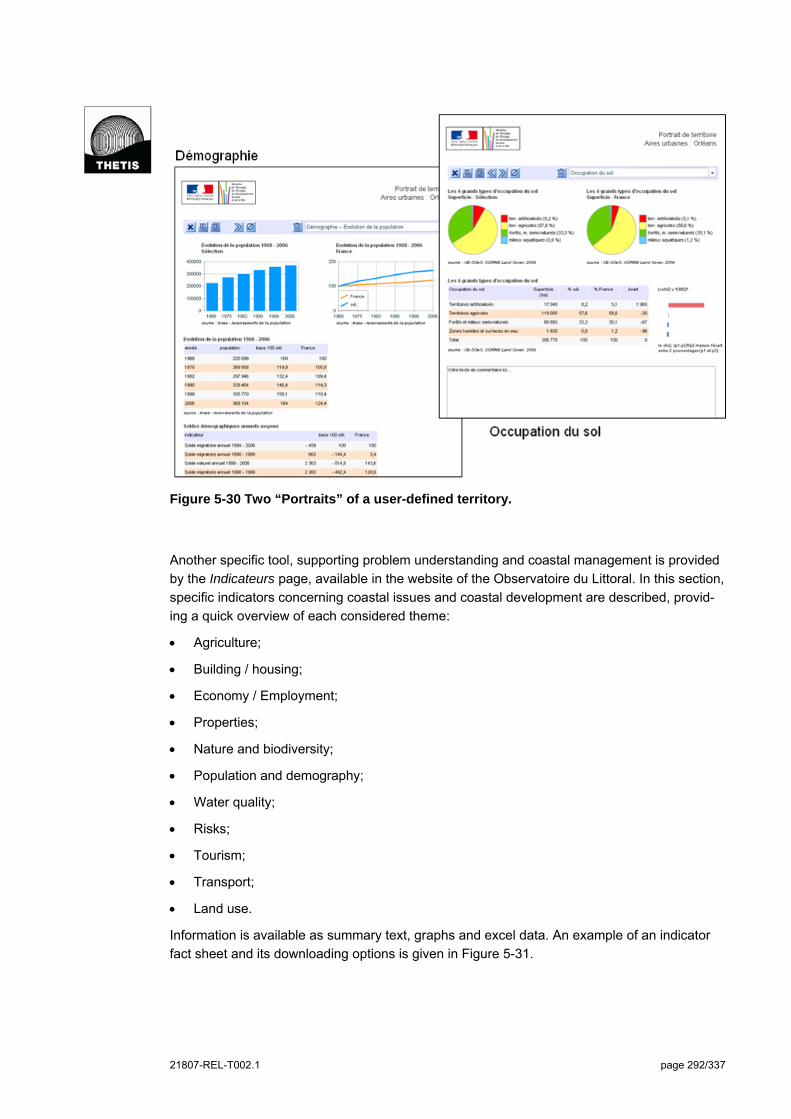
21807-REL-T002.1 page 292/337
Figure 5-30 Two “Portraits” of a user-defined territory.
Another specific tool, supporting problem understanding and coastal management is provided
by the Indicateurs page, available in the website of the Observatoire du Littoral. In this section,
specific indicators concerning coastal issues and coastal development are described, provid-
ing a quick overview of each considered theme:
Agriculture;
Building / housing;
Economy / Employment;
Properties;
Nature and biodiversity;
Population and demography;
Water quality;
Risks;
Tourism;
Transport;
Land use.
Information is available as summary text, graphs and excel data. An example of an indicator
fact sheet and its downloading options is given in Figure 5-31.

21807-REL-T002.1 page 293/337
Figure 5-31 An example of the information available in the Indicateurs tool.
The availability of the territory “portraits” and indicator factsheets, together with the high variety
of data related to different ICZM sectors and dimensions can properly support the problem un-
derstanding process.
System development and management
The statistical survey of the Ministry of Ecology, Sustainable Development, Transportation and
Housing manages, through different units, the GEOIDD-Litto and the online interactive carto-
graphic tool dedicated to the whole national territory (Géoïdd,
http://www.stats.environnement.developpement-durable.gouv.fr/index.php?id=3422)
Géoïdd and GEOIDD-Litto are two separated online tools with different information contents,
but with a similar aspect as they use the same web interface platform.
The web tool has been developed in a first version in 2006, and cost about € 45.000 within the
Interreg DEDUCE project budget. The tool actually online has been developed in 2009, to-
gether with the Géoïdd tool, by the French private company EMC3 (www.geoclip.fr), with an
additional cost of about € 50.000. Developers customised a generic tool (Géoclip) to the
Coastal Observatory’s needs.

21807-REL-T002.1 page 294/337
GEOIDD Litto is developed in flash technology in order to provide quick and interactive map
services and to work in vectorial format. All the databases work with PHP and MySQL tech-
nologies and are connected with a custom web interface that allows an easy consultation of
new indicators and geographical data, change of reference frame, etc..
The management of the online system (i.e. publishing new geographical or statistical data,
updating the "portraits " pages, publishing new zoning, updating the representation of indica-
tors, updating of metadata, etc) is in charge of one person (not full-time).
About difficulties encountered in developing the system, the management of sensitive data
can be reported. The Observatory in fact, as a National statistical service, has sometimes to
deal with secret statistical data.
Online tools have no restricted areas or privileged user typologies. Taking into account the
Observatory’s mission and the information content of the CIS, the target users can be mainly
identified as:
Decision makers;
Coastal planners and/or managers;
General public.
Experience with the implementation
Supporting the General Secretariat of the Sea (Secrétariat général de la mer), the Observa-
toire du Littoral represent France in the European working group about indicators and monitor-
ing data of ICZM. It also constitutes the main interlocutor of the European Environmental
Agency and of the European Topic Centre on Terrestrial Environment. Through the involve-
ment of IFREMER (French Research Institute for Exploitation of the Sea), the Observatoire du
Littoral is also involved in Interreg Project Deduce for the development of the 27 indicators of
ICZM.
No information about the effective use of the system as a support tool for ICZM is currently
available.
As reported by the CIS’s managers, the web tools are used by hundreds of people every
month, mostly to map indicators or to produce "portraits" for local spatial planning. The typical
users are researchers, local entities staff (like Départements and Régions employees), plan-
ners and students.
Concluding remarks
GEOIDD-Litto is the National point of reference for coastal statistical data. The system is de-
signed as a central node to visualise and analyse coastal data, rather than a portal to acquire
data to be further implemented in decentralized systems.
The system provides powerful knowledge related functionalities that can support ICZM pro-
cesses, but has no interconnections with stakeholders or local authorities in charge of coastal
planning.
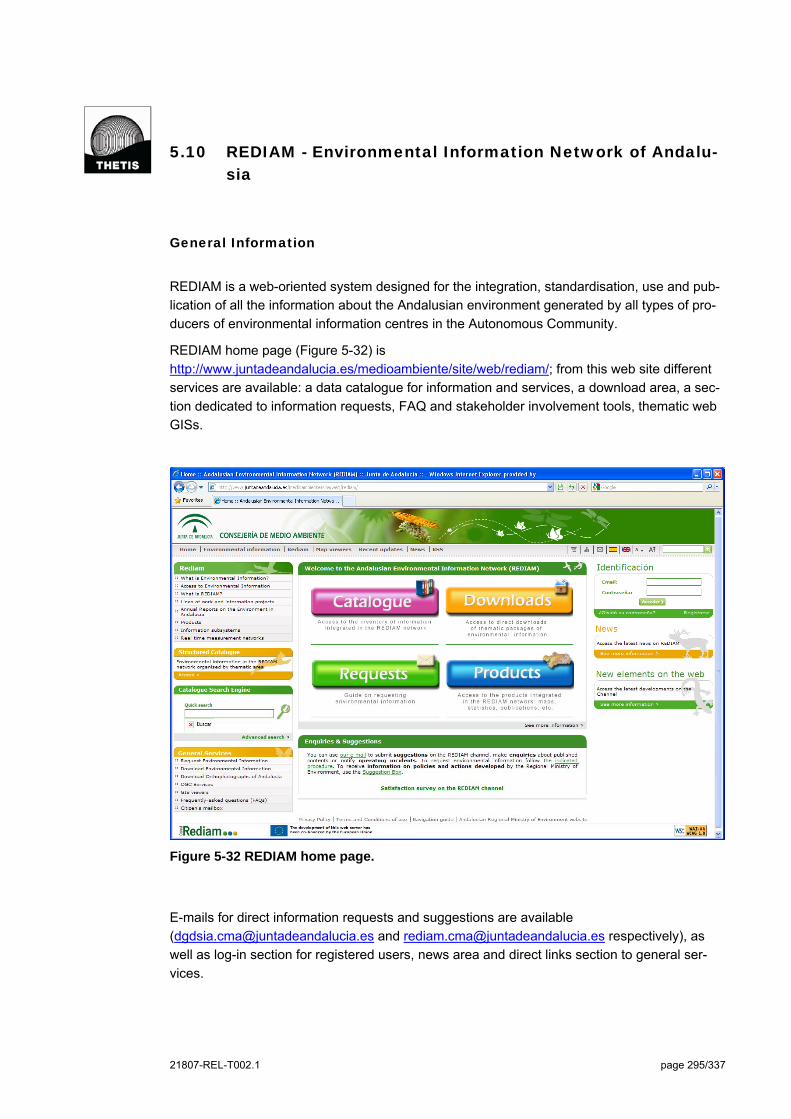
21807-REL-T002.1 page 295/337
5.10 REDIAM - Environmental Information Network of Andalu-sia
General Information
REDIAM is a web-oriented system designed for the integration, standardisation, use and pub-
lication of all the information about the Andalusian environment generated by all types of pro-
ducers of environmental information centres in the Autonomous Community.
REDIAM home page (Figure 5-32) is
http://www.juntadeandalucia.es/medioambiente/site/web/rediam/; from this web site different
services are available: a data catalogue for information and services, a download area, a sec-
tion dedicated to information requests, FAQ and stakeholder involvement tools, thematic web
GISs.
Figure 5-32 REDIAM home page.
E-mails for direct information requests and suggestions are available
([email protected] and [email protected] respectively), as
well as log-in section for registered users, news area and direct links section to general ser-
vices.
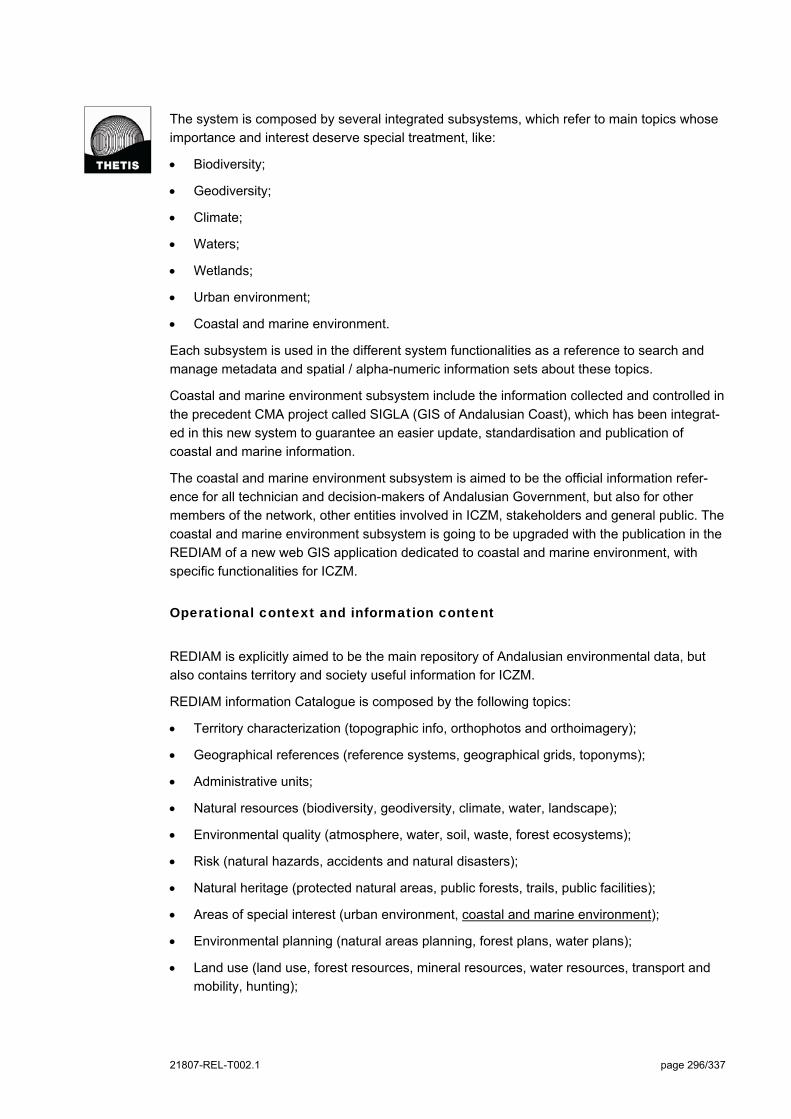
21807-REL-T002.1 page 296/337
The system is composed by several integrated subsystems, which refer to main topics whose
importance and interest deserve special treatment, like:
Biodiversity;
Geodiversity;
Climate;
Waters;
Wetlands;
Urban environment;
Coastal and marine environment.
Each subsystem is used in the different system functionalities as a reference to search and
manage metadata and spatial / alpha-numeric information sets about these topics.
Coastal and marine environment subsystem include the information collected and controlled in
the precedent CMA project called SIGLA (GIS of Andalusian Coast), which has been integrat-
ed in this new system to guarantee an easier update, standardisation and publication of
coastal and marine information.
The coastal and marine environment subsystem is aimed to be the official information refer-
ence for all technician and decision-makers of Andalusian Government, but also for other
members of the network, other entities involved in ICZM, stakeholders and general public. The
coastal and marine environment subsystem is going to be upgraded with the publication in the
REDIAM of a new web GIS application dedicated to coastal and marine environment, with
specific functionalities for ICZM.
Operational context and information content
REDIAM is explicitly aimed to be the main repository of Andalusian environmental data, but
also contains territory and society useful information for ICZM.
REDIAM information Catalogue is composed by the following topics:
Territory characterization (topographic info, orthophotos and orthoimagery);
Geographical references (reference systems, geographical grids, toponyms);
Administrative units;
Natural resources (biodiversity, geodiversity, climate, water, landscape);
Environmental quality (atmosphere, water, soil, waste, forest ecosystems);
Risk (natural hazards, accidents and natural disasters);
Natural heritage (protected natural areas, public forests, trails, public facilities);
Areas of special interest (urban environment, coastal and marine environment);
Environmental planning (natural areas planning, forest plans, water plans);
Land use (land use, forest resources, mineral resources, water resources, transport and
mobility, hunting);
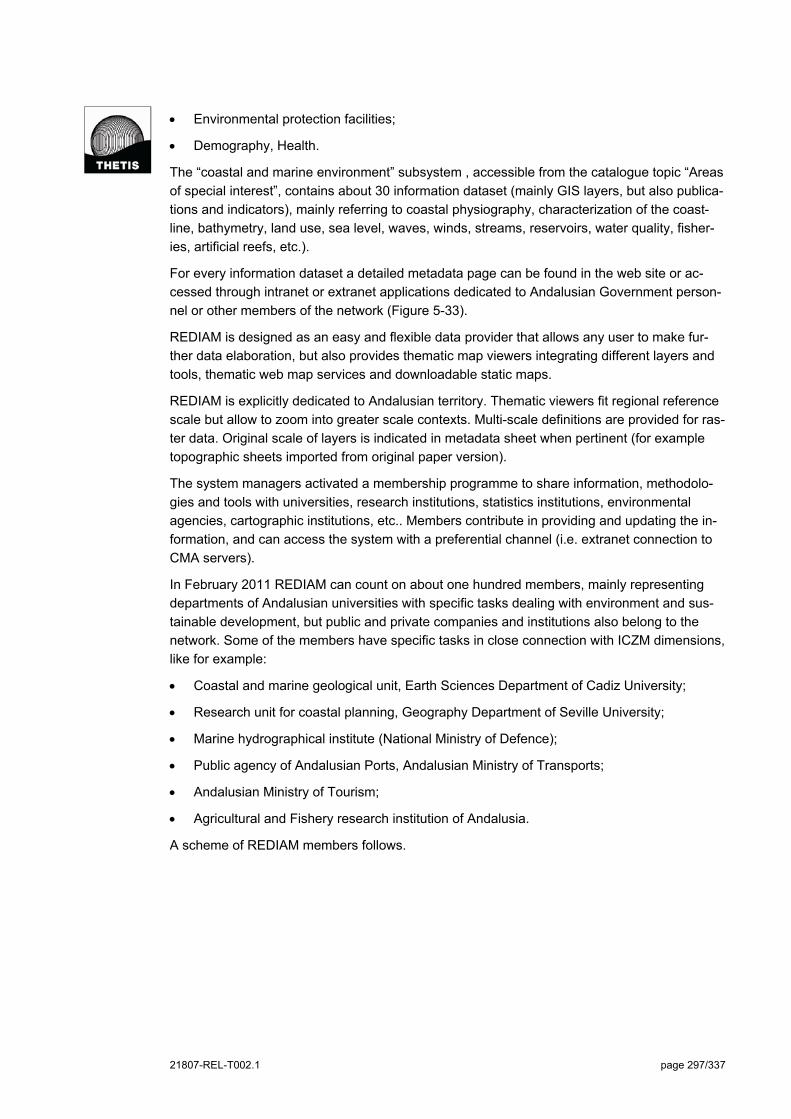
21807-REL-T002.1 page 297/337
Environmental protection facilities;
Demography, Health.
The “coastal and marine environment” subsystem , accessible from the catalogue topic “Areas
of special interest”, contains about 30 information dataset (mainly GIS layers, but also publica-
tions and indicators), mainly referring to coastal physiography, characterization of the coast-
line, bathymetry, land use, sea level, waves, winds, streams, reservoirs, water quality, fisher-
ies, artificial reefs, etc.).
For every information dataset a detailed metadata page can be found in the web site or ac-
cessed through intranet or extranet applications dedicated to Andalusian Government person-
nel or other members of the network (Figure 5-33).
REDIAM is designed as an easy and flexible data provider that allows any user to make fur-
ther data elaboration, but also provides thematic map viewers integrating different layers and
tools, thematic web map services and downloadable static maps.
REDIAM is explicitly dedicated to Andalusian territory. Thematic viewers fit regional reference
scale but allow to zoom into greater scale contexts. Multi-scale definitions are provided for ras-
ter data. Original scale of layers is indicated in metadata sheet when pertinent (for example
topographic sheets imported from original paper version).
The system managers activated a membership programme to share information, methodolo-
gies and tools with universities, research institutions, statistics institutions, environmental
agencies, cartographic institutions, etc.. Members contribute in providing and updating the in-
formation, and can access the system with a preferential channel (i.e. extranet connection to
CMA servers).
In February 2011 REDIAM can count on about one hundred members, mainly representing
departments of Andalusian universities with specific tasks dealing with environment and sus-
tainable development, but public and private companies and institutions also belong to the
network. Some of the members have specific tasks in close connection with ICZM dimensions,
like for example:
Coastal and marine geological unit, Earth Sciences Department of Cadiz University;
Research unit for coastal planning, Geography Department of Seville University;
Marine hydrographical institute (National Ministry of Defence);
Public agency of Andalusian Ports, Andalusian Ministry of Transports;
Andalusian Ministry of Tourism;
Agricultural and Fishery research institution of Andalusia.
A scheme of REDIAM members follows.
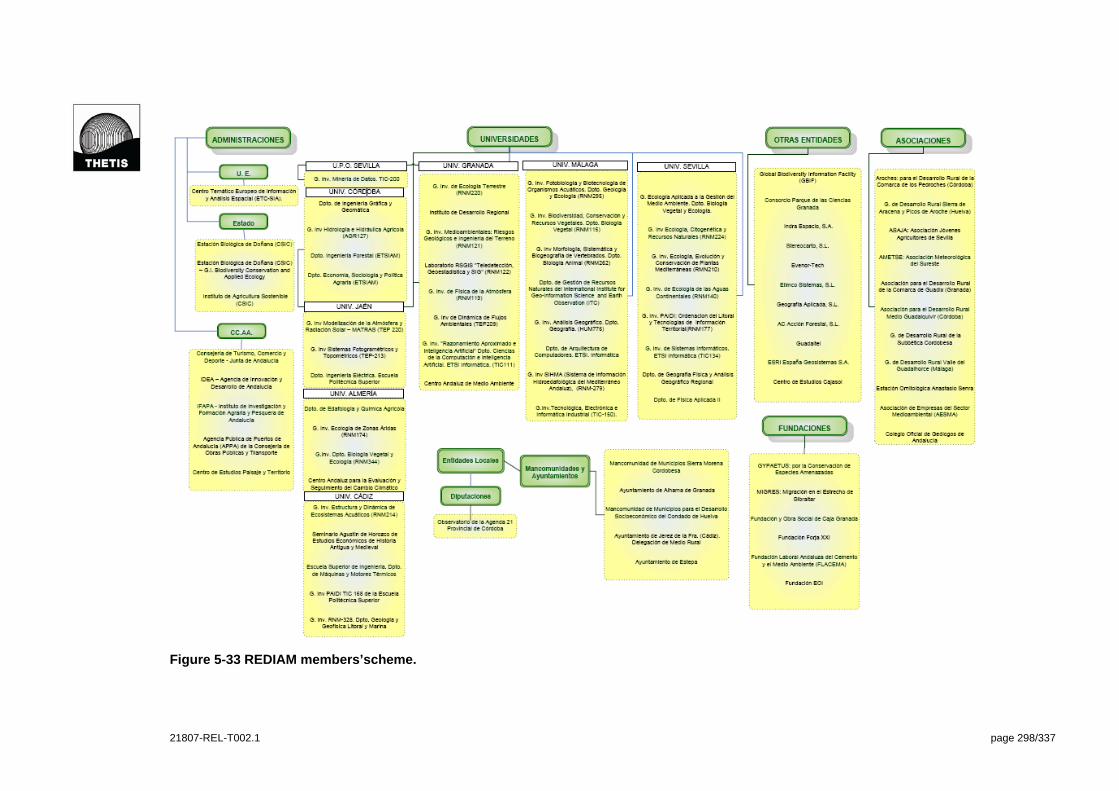
21807-REL-T002.1 page 298/337
Figure 5-33 REDIAM members’scheme.

21807-REL-T002.1 page 299/337
Technological characteristics
REDIAM makes up the Regional Focal Point of Andalusia for the European Information and
Observation Network about the Environment (EIONET) and is the specialized node in Envi-
ronmental Information within the Spatial Data Infrastructures of Andalusia (Infrastructura de
Datos Espaciales de Andalucia - IDEAndalucia).
The main technologies used are:
ESRI (for Geo-DB and spatial data standardisation),
Oracle (for alphanumeric and metadata storage),
MapServer (for web-GIS development),
OGC (for spatial data services).
To guarantee a high level of interoperability and flexibility of the system, the REDIAM web
page share standardised and uniform core information through Web map services (WMS) and
downloadable data in SHP, GML and KML formats.
INSPIRE Directive has been used as the protocol to standardise spatial data, EUROSTAT
standards for statistics, SEIS protocol for methodologies.
ICZM related functionalities
The Coastal and marine environment subsystem, explicitly aimed to support the Andalusian
ICZM, contains the information gathered by the SIGLA project and several other specific stud-
ies, such as diagnostics of coastal sustainability plan developed by the Andalusian Ministry of
Environment, the information on Management plans for natural resources of the coastal parks,
maps by the Spanish Institute of Oceanography (ESPACE project), and other results of pro-
jects related to the costs developed by various research centres.
This information is gradually expanding and complementing the existing basic information. At
the time of writing this report, the last WMSs published in Coastal and marine environment
subsystem are:
Physiographical Units of Andalusian Coasts, 2010;
Urban sprawl along the coast, 1956-2007 (3 layers at different scales);
Morphological characterisation of the coast (hierarchical legend and thematic layers for
urban areas, infrastructures, river mouths, dunes and beaches).
For every information dataset a detailed metadata page (Figure 5-34) can be found in the web
site, where users can also ask for more information through a dedicated page that allow to
send a certified message to system managers, or download the dataset containing spatial da-
ta (SHP and GML), PDF documents describing data template, data elaboration and classifica-
tion and metadata (XSL and XML format). Useful spatial information for ICZM can also be di-
rectly accessed by Web Map Services and therefore integrated in desktop and web applica-
tion.

21807-REL-T002.1 page 300/337
Figure 5-34 Example of metadata presentation in REDIAM web site. The links at the bot-tom of the page allow to read more detailed metadata, download the dataset or request more information.
Indicators included in the system (like coastal erosion, turbidity, chlorophyll, water tempera-
ture) are elaborated by CMA from remote sensing images. A publication on Andalusian ICZM
Indicators (Sistema de Indicadores para la gestión integrada del Litoral de Andalucía - SILA) is
also downloadable by the Coastal and Marine Subsystem. The document, published in 2007
by the Ministry of the Environment of Andalusia, is based on UNESCO handbook for measur-
ing the progress and outcomes of Integrated Coastal and Ocean Management, and consists in
the gathering of indicators developed by several institutions at different scales, in the analysis
of the most suitable ones for Andalusian coastal areas and proposes a methodology to define
and update a set of indicators for ICZM in Andalusia.
A coastal vulnerability index has also been developed, based on morphological, sea rise and
urbanisation data, but is not published in the web application because needs an expert usage
to be correctly understood and applied.
At present a new tool for ICZM is going to be integrated in the REDIAM, consisting in a dedi-
cated 2D, hybrid and 3D web GIS integrating general territory information, dedicated coastal
analysis and characterization, web map services provided by other entities (cadastre, geologi-
cal service, protected natural areas network), digital terrain and marine bottom model associ-
ated layers and analysis tools (Figure 5-35).
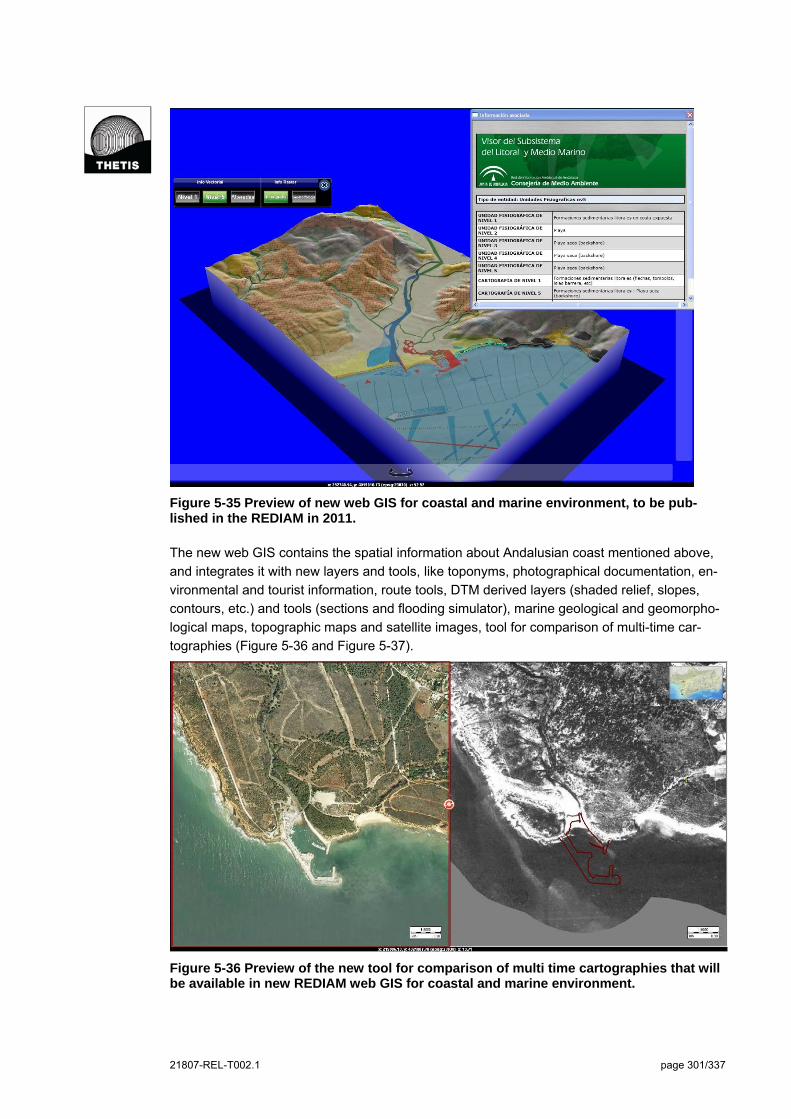
21807-REL-T002.1 page 301/337
Figure 5-35 Preview of new web GIS for coastal and marine environment, to be pub-lished in the REDIAM in 2011.
The new web GIS contains the spatial information about Andalusian coast mentioned above,
and integrates it with new layers and tools, like toponyms, photographical documentation, en-
vironmental and tourist information, route tools, DTM derived layers (shaded relief, slopes,
contours, etc.) and tools (sections and flooding simulator), marine geological and geomorpho-
logical maps, topographic maps and satellite images, tool for comparison of multi-time car-
tographies (Figure 5-36 and Figure 5-37).
Figure 5-36 Preview of the new tool for comparison of multi time cartographies that will be available in new REDIAM web GIS for coastal and marine environment.
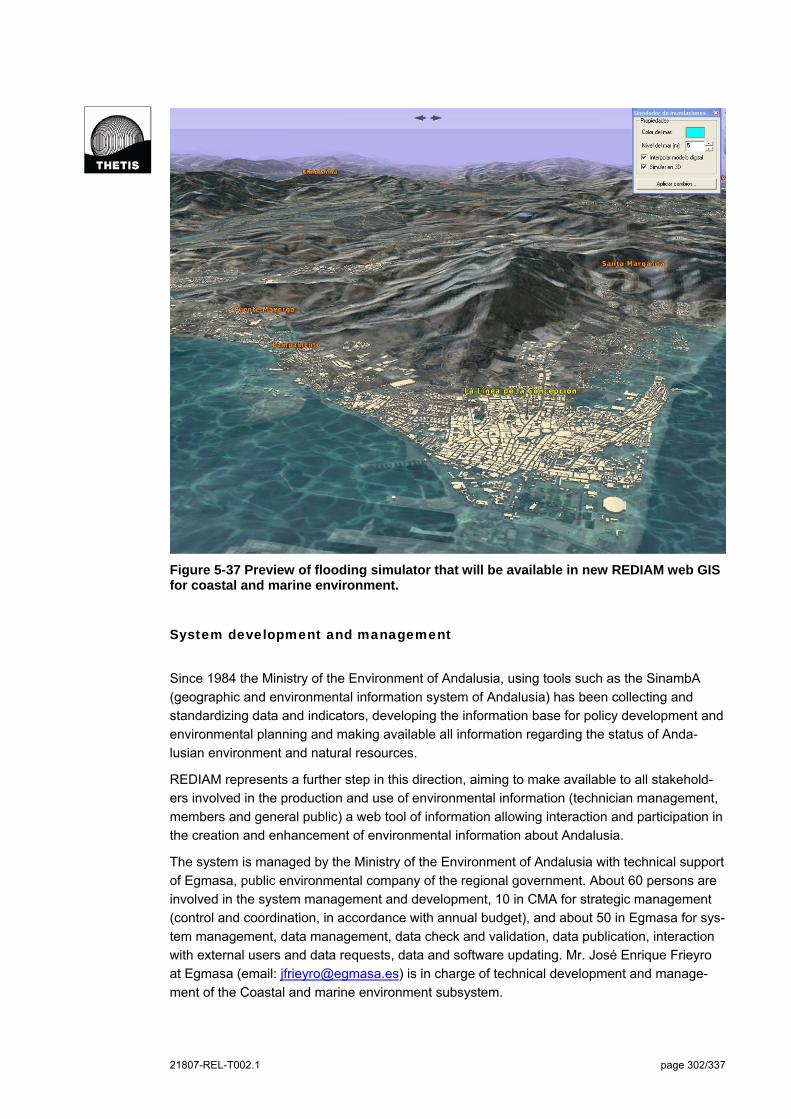
21807-REL-T002.1 page 302/337
Figure 5-37 Preview of flooding simulator that will be available in new REDIAM web GIS for coastal and marine environment.
System development and management
Since 1984 the Ministry of the Environment of Andalusia, using tools such as the SinambA
(geographic and environmental information system of Andalusia) has been collecting and
standardizing data and indicators, developing the information base for policy development and
environmental planning and making available all information regarding the status of Anda-
lusian environment and natural resources.
REDIAM represents a further step in this direction, aiming to make available to all stakehold-
ers involved in the production and use of environmental information (technician management,
members and general public) a web tool of information allowing interaction and participation in
the creation and enhancement of environmental information about Andalusia.
The system is managed by the Ministry of the Environment of Andalusia with technical support
of Egmasa, public environmental company of the regional government. About 60 persons are
involved in the system management and development, 10 in CMA for strategic management
(control and coordination, in accordance with annual budget), and about 50 in Egmasa for sys-
tem management, data management, data check and validation, data publication, interaction
with external users and data requests, data and software updating. Mr. José Enrique Frieyro
at Egmasa (email: [email protected]) is in charge of technical development and manage-
ment of the Coastal and marine environment subsystem.

21807-REL-T002.1 page 303/337
Centres or institutions can become members of the REDIAM network through collaboration
agreements, sharing common environmental data bases, technical criteria for information
gathering and classification, software to manage such information.
Egmasa and CMA defined a protocol to set standards for other providers’ incoming data, to
guarantee data quality and total suitability to the system. Nevertheless reaching topological
correctness of all layers from different providers represented a difficult task to accomplish. The
alignment of hydrographical and topographical data also requested a long standardisation
work but, as a result, this allow 3D views and analysis of different layers referred to dry land
and submarine environment.
REDIAM can be accessed via internet (general public), extranet (members) and intranet (Min-
istry of the Environment staff). Extranet and intranet connection allow accessing the Geo-DB
where all spatial data is stored, also through custom extensions of ArcGIS.
Personnel of Andalusian Autonomous Government can access REDIAM information also via
intranet with different user types privileges (basically normal user and technical manager)
(from Figure 5-38 to Figure 5-41).
Figure 5-38 Access to Coastal and marine environment subsystem information through intranet connection.
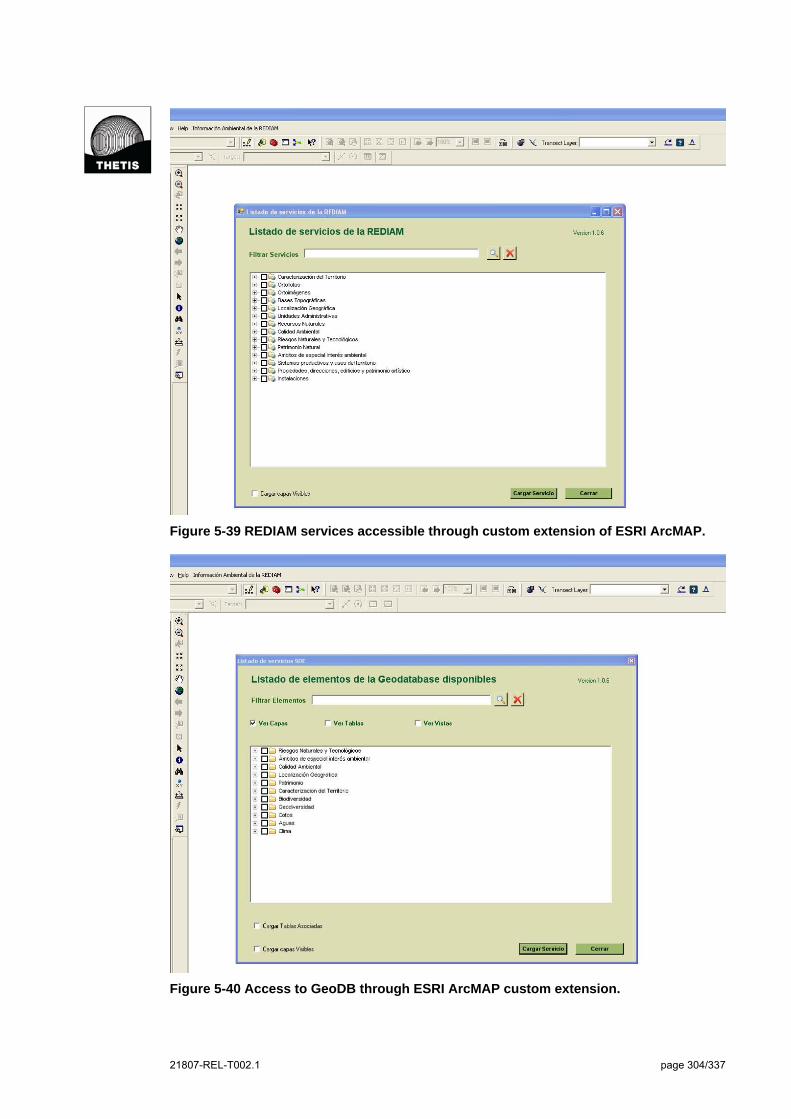
21807-REL-T002.1 page 304/337
Figure 5-39 REDIAM services accessible through custom extension of ESRI ArcMAP.
Figure 5-40 Access to GeoDB through ESRI ArcMAP custom extension.
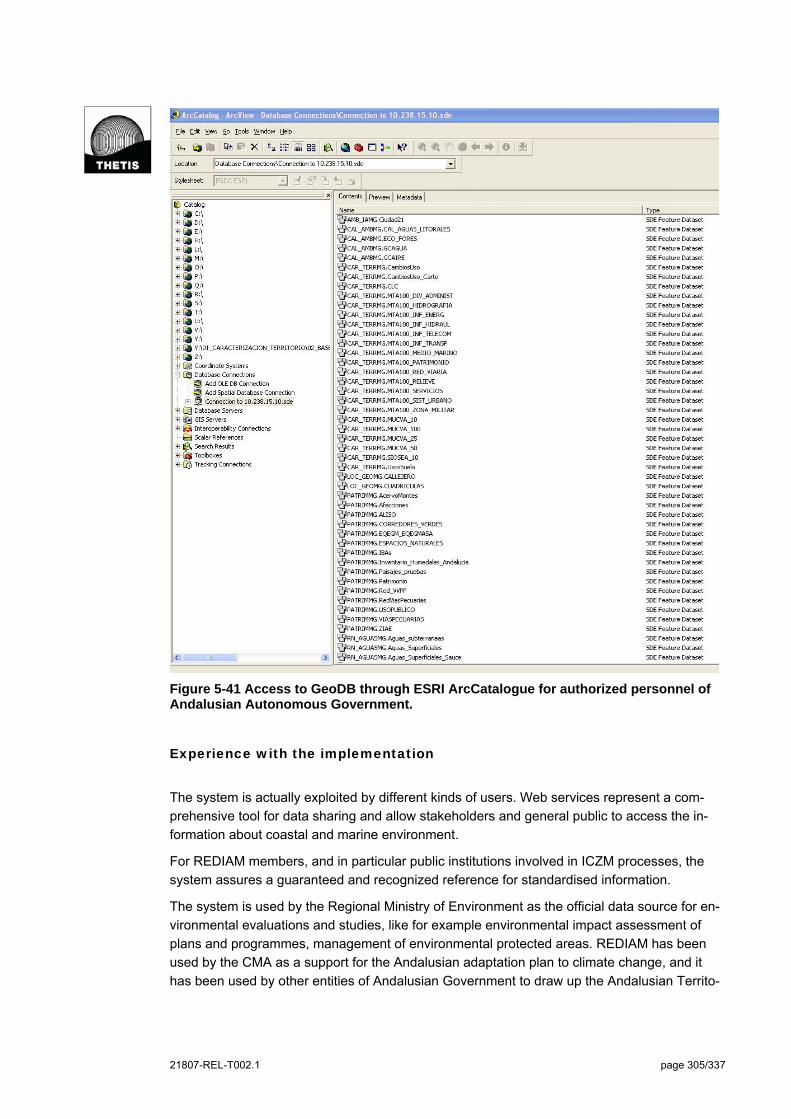
21807-REL-T002.1 page 305/337
Figure 5-41 Access to GeoDB through ESRI ArcCatalogue for authorized personnel of Andalusian Autonomous Government.
Experience with the implementation
The system is actually exploited by different kinds of users. Web services represent a com-
prehensive tool for data sharing and allow stakeholders and general public to access the in-
formation about coastal and marine environment.
For REDIAM members, and in particular public institutions involved in ICZM processes, the
system assures a guaranteed and recognized reference for standardised information.
The system is used by the Regional Ministry of Environment as the official data source for en-
vironmental evaluations and studies, like for example environmental impact assessment of
plans and programmes, management of environmental protected areas. REDIAM has been
used by the CMA as a support for the Andalusian adaptation plan to climate change, and it
has been used by other entities of Andalusian Government to draw up the Andalusian Territo-
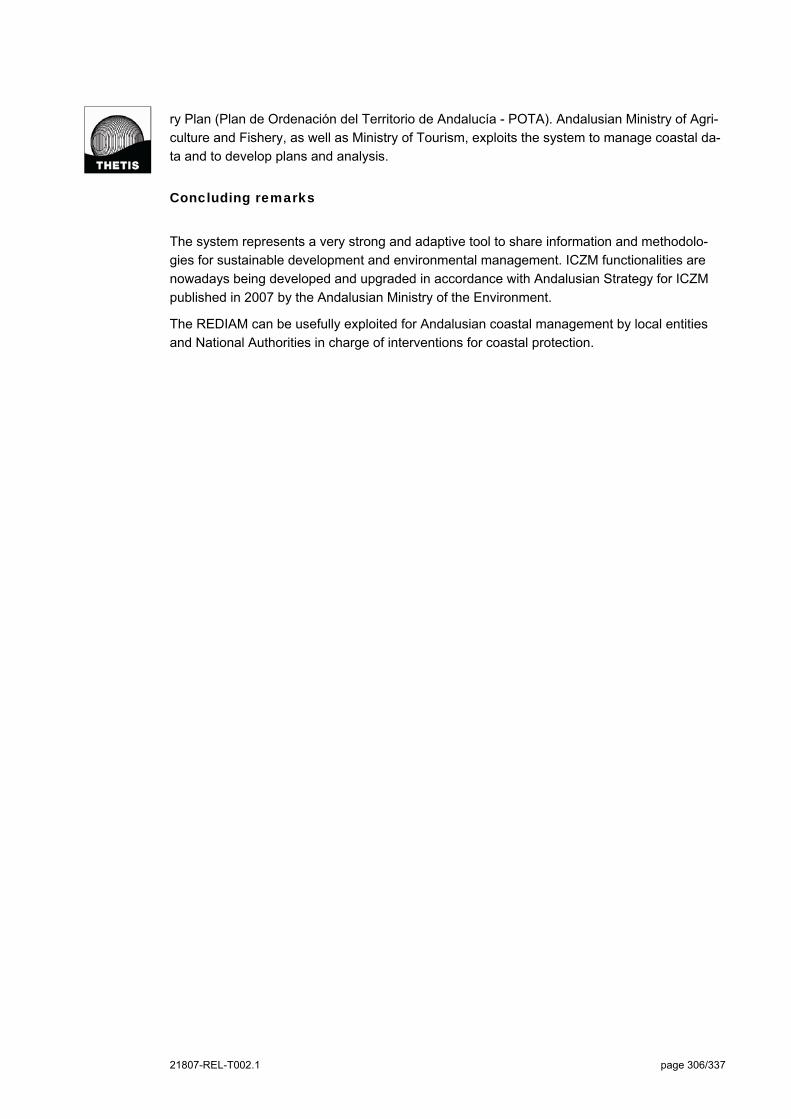
21807-REL-T002.1 page 306/337
ry Plan (Plan de Ordenación del Territorio de Andalucía - POTA). Andalusian Ministry of Agri-
culture and Fishery, as well as Ministry of Tourism, exploits the system to manage coastal da-
ta and to develop plans and analysis.
Concluding remarks
The system represents a very strong and adaptive tool to share information and methodolo-
gies for sustainable development and environmental management. ICZM functionalities are
nowadays being developed and upgraded in accordance with Andalusian Strategy for ICZM
published in 2007 by the Andalusian Ministry of the Environment.
The REDIAM can be usefully exploited for Andalusian coastal management by local entities
and National Authorities in charge of interventions for coastal protection.
21807-REL-T002.1 page 307/337
5.11 CRIGE PACA Spatial Data Infrastructure
General Information
The system here analyzed is a framework of spatial data, metadata, users and tools that are
interactively connected in order to use spatial data in an efficient and flexible way. This archi-
tecture is commonly called Spatial Data Infrastructure (SDI).
This SDI is operated and managed by CRIGE-PACA, the “Regional Centre for Geographic In-
formation in Provence-Alpes-Côte d'Azur”. The online platform of the CRIGE-PACA SDI is the
web site http://www.crige-paca.org, which is currently under further development and will be
configured and named as Regional Geoportal.
CRIGE-PACA is a non-profit organization created in 2002, led by national and regional author-
ities through a seven-year financial plan (2000-2006 and 2007-2013). CRIGE-PACA main
mission is to promote, facilitate, support and spread geographical information to public admin-
istrations on the one hand and, when possible, to general public and stakeholders on the other
hand. This generic aim includes specific objectives:
Provide geographic referenced data (digital data-sets) via the existing CRIGE-PACA web-
site and its future evolution in the Regional Geoportal; the on-line participative and data-
sharing platform (for public administrations) of the CRIGE-PACA SDI;
Provide technical support to users, including: help-line for assistances, production of tech-
nical and requirements guides, editing specifications, technical meetings, on-line re-
sources;
Support the Regional Geomatic Network, through: promotion of cooperation between local
users and data providers, support local communities of interests, management of thematic
clusters, experiences and best practices exchange, acting as a resource centre on GIS
concepts;
Act as a coordination centre for the implementation of the INSPIRE directive at the re-
gional level.
CRIGE-PACA is also the coordinator of the Regional Geomatic Network involving thematic
clusters. These clusters are structured around local coordinators (or animators, as defined in
the SDI) and a certain number of working groups, bringing together regional organisations in-
terests in thematic issues. One of these twelve clusters deals with Sea and Coast (Mer & Litto-
ral) bringing together the coastal stakeholders of the PACA region.
CRIGE PACA received in 2009 an “eSDI NET+ Best Practice Award” for its innovative organi-
sational and institutional aspects in terms of cooperation, subsidiary and sustainability.
The info mail [email protected] is available to contact CRIGE PACA (located in Do-
maine du Petit Arbois- Bâtiment MARTEL, Avenue Louis Philibert, BP 10019 - 13 545 Aix-en-
Provence cedex 4 – FRANCE).
21807-REL-T002.1 page 308/337
Operational context and information content
The website of CRIGE-PACA enables to access different typologies of spatial information, like:
Carthotéque (map library),
Catalogue de donnés (data catalogue),
Pôles métiers (Thematic working groups or thematic clusters).
From the map library, the regional Atlas “Cartopas 2010” (CARTOgraphie en Prêt A Servir)
enables users to browse and visualise static maps related to several themes developed from
data contained in the Geographic Information System (GIS) of the PACA DREAL (Direction
Régionale de l’Environnement, de l’Aménagement et du Logement). The map library mainly
concerns the environmental state of the region Provence-Alpes-Côte d'Azur, with particular
attention also to management, planning and policies for sustainable development. A list of the
map library themes follows, with some examples of contents.
The territory and its evolution (e.g. land use, land use from 1990 to 2006, population den-
sity from 1996 to 2006 etc.);
Management and planning (e.g. in French “Schémas de cohérence territoriale (SCoT) et
Schémas Directeurs (SD)” and Local Plans (PLU), communal cards (CC), land use plans
(POS), etc.);
Air and climate (e.g. temperature, precipitation, state of air pollution by ozone, state of air
pollution by suspended solids, etc.);
Land polices for sustainable development (e.g. in French «Etat d’avancement des Sché-
mas d’Aménagement et de Gestion des Eaux (SAGE)», the local Agenda 21 site and the
map of the local plans energy environment (PLEE));
Nature and biodiversity (e.g. natural reserve, natural areas of ecological interest for fauna
and flora, site NATURA 2000 etc.);
Landscapes and sites (e.g. map of regional synthesis of classified sites and sites regis-
tered under the Act of May 2, 1930 in the PACA region and Operations Great Sites, typol-
ogy of regional landscapes, etc.);
Data on water quality (e.g. aquifers and piezometric network, biological quality of the riv-
ers, etc.);
Water policy (e.g. principal water drainage, targets according to the Water Framework Di-
rective (WFD), ecological and chemical status of rivers and coastal water, vulnerable and
sensible zones for the nitrate, urban waste water treatment unit, annual volume of water
used by geographical department, etc.);
Energy (e.g. electricity transmission network, wind energy development, wind speed, wind
power and potentially energy, development status of photo voltaic power projects, etc.);
Housing (e.g. Status of the Local Housing Programs (PLH), percentage of social housing,
etc.);
Transport (e.g. road, traffic in major roads, etc.);
Natural, technological and mining risk (e.g. flooding risk, atlas of the flooding zones, seis-
mic risk, climatic occurrence of heavy rainfall, industrial risk, etc).
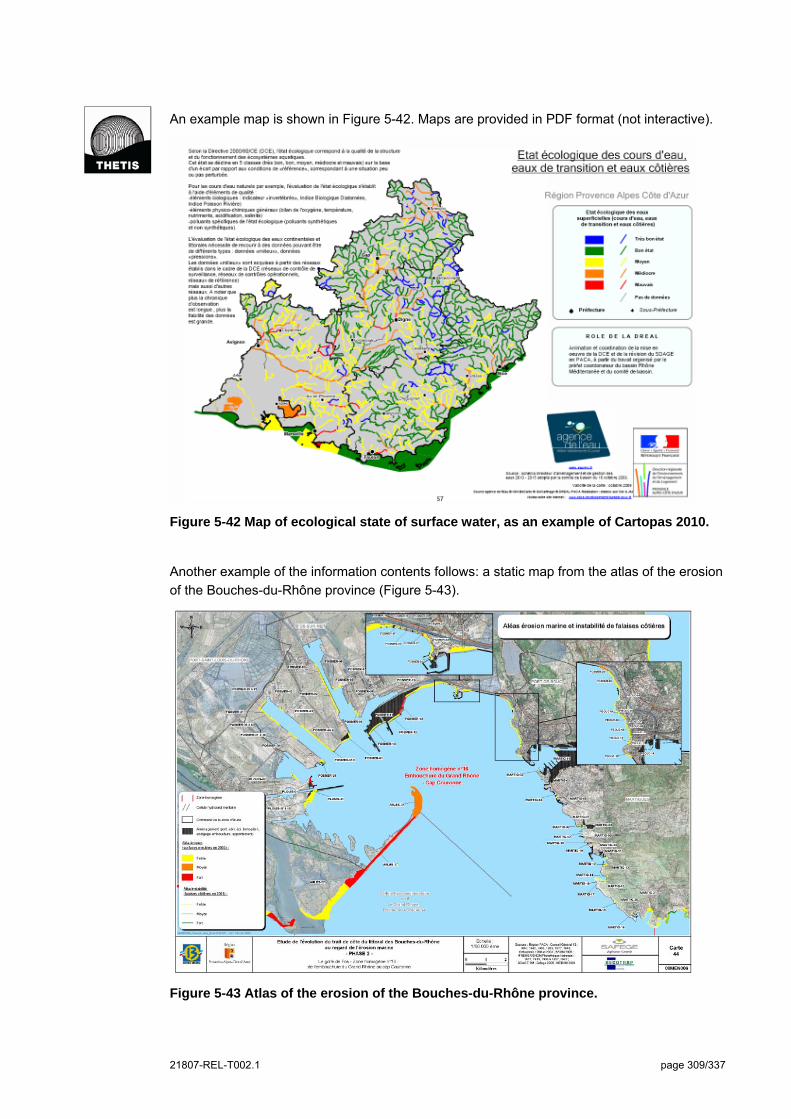
21807-REL-T002.1 page 309/337
An example map is shown in Figure 5-42. Maps are provided in PDF format (not interactive).
Figure 5-42 Map of ecological state of surface water, as an example of Cartopas 2010.
Another example of the information contents follows: a static map from the atlas of the erosion
of the Bouches-du-Rhône province (Figure 5-43).
Figure 5-43 Atlas of the erosion of the Bouches-du-Rhône province.
21807-REL-T002.1 page 310/337
The data catalogue enables to access to 4 groups of spatial layers:
Geographic information; base information including for example topography, bathymetry,
road, vegetation features, cadastral map, Euro Global Map, etc. Their production and
maintenance are carried out by public institutions.
Thematic layers; this section contains about 85 layers/documents produced by different
organizations in the region such as for example: administrative boundary, land cover,
flooding zones, rainfall, mean annual temperature, biological reserves, natural areas, for-
est zones, posidonia monitoring network, soil classification, altitudinal vegetation, etc).
This group also contains some information related to the governance dimension, such as
layers and documents related to: Plans de Développement de Massif (PDM), Plans
Simples de Gestion (PSG), Schémas d'Aménagement et de Gestion des Eaux (SAGE) en
région PACA, etc..
Aerial Ortho photos; including for example: orthoimagery with high resolution (20 cm), his-
torical aerial photographs of the coast (several years), etc.
Satellite images: including false colour image of the Region PACA (1999-2006) and false
colour image of the Mediterranean 2006.
The thematic sections allow downloading studies, news, documents, specifications, meeting
minutes and static maps dealing with the thematic working group’s activity. Registered users
can upload data in the thematic section through the mutualisation utilities.
The system can be exploited without registering, allowing to visualise a great number of spa-
tial layers (some of them can be also downloaded) and static maps in PDF format. Members
can download copyrighted data and access the upload utilities.
The CRIGE-PACA SDI addresses all the five ICZM dimensions, attempting to include the in-
formation relevant for the thematic information clusters part of the Regional Geomatic Network
to analyze, produce and disseminate information, carrying out different actions, as shown in
Figure 5-44.
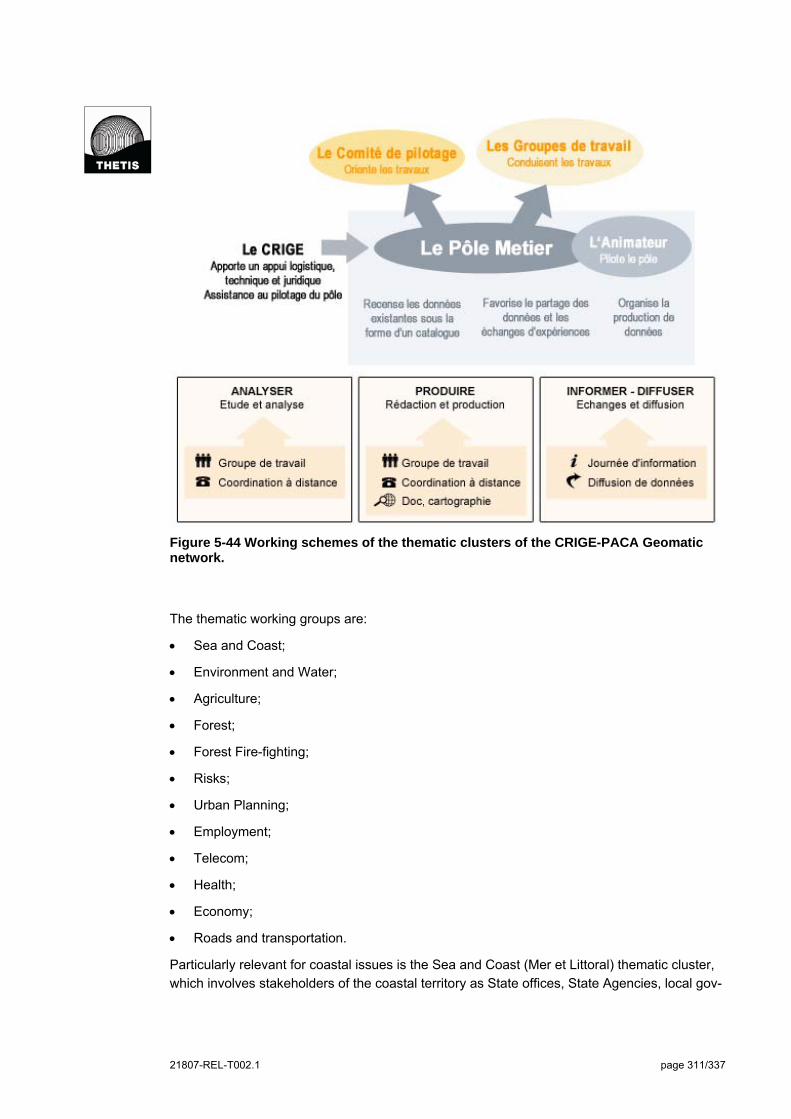
21807-REL-T002.1 page 311/337
Figure 5-44 Working schemes of the thematic clusters of the CRIGE-PACA Geomatic network.
The thematic working groups are:
Sea and Coast;
Environment and Water;
Agriculture;
Forest;
Forest Fire-fighting;
Risks;
Urban Planning;
Employment;
Telecom;
Health;
Economy;
Roads and transportation.
Particularly relevant for coastal issues is the Sea and Coast (Mer et Littoral) thematic cluster,
which involves stakeholders of the coastal territory as State offices, State Agencies, local gov-

21807-REL-T002.1 page 312/337
ernments (Region, Provinces, Municipalities), research laboratories, private companies in-
volved in the coastal management. The main aim is to develop actions in the field of geo-
graphical information in coastal PACA as well as exchange and disseminate data through the
regional CRIGE platform.
A metadata sheet is associated with each layer. For some layers further related documenta-
tion is also available for downloading.
Free access to data is available for most of the layers; the complete content of the SDI can be
accessed by registered users. Full access to all data (including data sharing and exchange) is
provided to public bodies of the PACA Region that are members of the Regional Geomatic
Network. Every public entity can become member of the Network through an on-line applica-
tion form available in the web-site. After CRIGE verification, the applicant entity can become
member of the SDI.
Several examples of integrated information can be found in the Atlas “Cartopas 2010” related
to the assessment of the natural and technological risks for the addressed territory. The “Natu-
ral risk” section for example includes maps related to flooding, seismic and landslide risks.
Addressed technological risks include for example maps of risk related to large dams, indus-
trial risk and risk related to mining and quarrying. Integrated information concern also the sec-
tion about water policies, where maps about ecological and chemical status of rivers and
coastal water, vulnerable and sensible zones for the nitrate are available,
Several integrated maps are available also in the data catalogue. One of the most interesting
example are the Atlas of the flooding zones, analysing the phenomena of flooding that may
occur by overflow of rivers, through an hydro-geomorphological approach.
Data providers are universities, research institution, statistics institutions, environmental agen-
cies, cartographic institutions, etc.); a complete list is currently available at http://www.crige-
paca.org/frontblocks/print/print_LOT_CARTES.asp.
Technological characteristics
The actual SDI is technically supported by a standard (and a bit outdated) web site. The map
viewer linked to the web page was developed with ER Mapper technology. The new geoportal
that will replace the actual web page has been developed mainly with open sources technolo-
gies (MapServer, PostGIS, OpenLayers, MySQL, Typo 3, Geonetwork or Geosource in
France, etc.).
The enhancement of interoperability is one of the principal aims of the Regional Geoportal of
next release, that will be compliant with Open Geospatial Consortium (OGC) standards and
implement the existing specifications of the INSPIRE directive. Some interesting tools will be
integrated in the new geoportal, like the Geo-viewer for data visualization (Figure 5-45), that
will allow to execute customized spatial data download (spatial reference, projection, extent,
clip, data format, etc.). A preview of the new Geo-viewer of next publication is given below.
Interoperability of spatial data will be managed, in the new Regional Geoportal, by a clear and
user-friendly data catalogue. A preview of the new interface is given below.
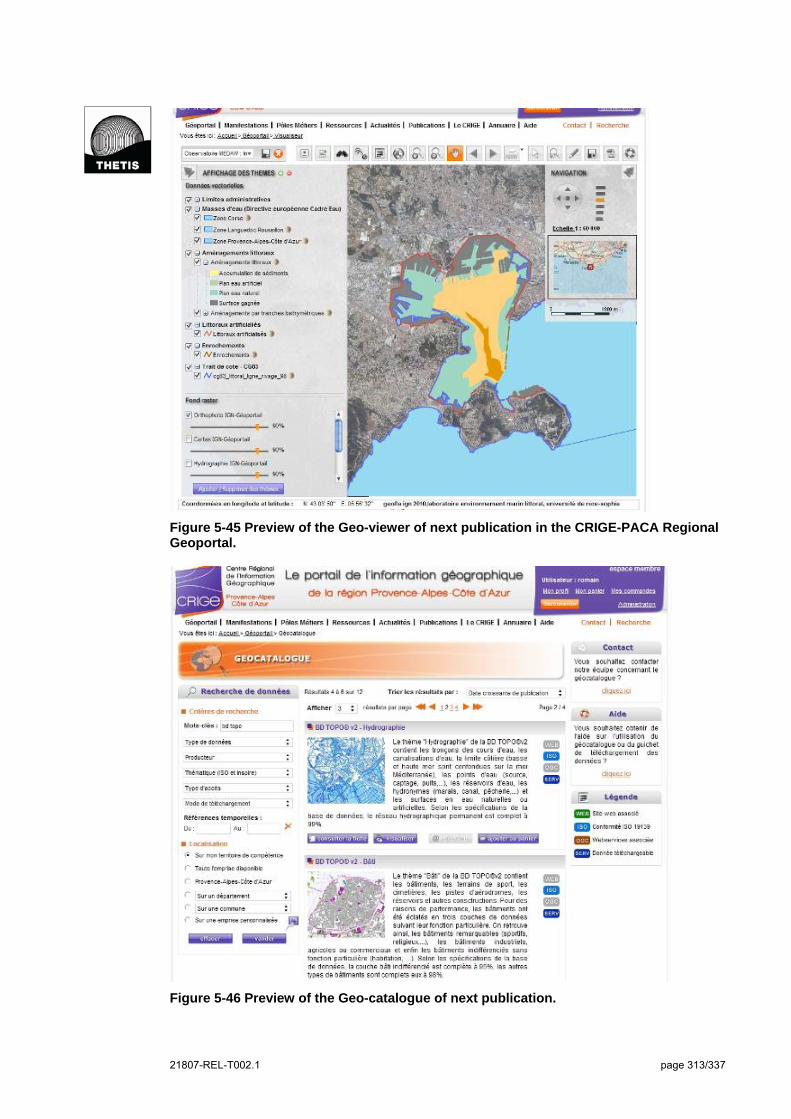
21807-REL-T002.1 page 313/337
Figure 5-45 Preview of the Geo-viewer of next publication in the CRIGE-PACA Regional Geoportal.
Figure 5-46 Preview of the Geo-catalogue of next publication.
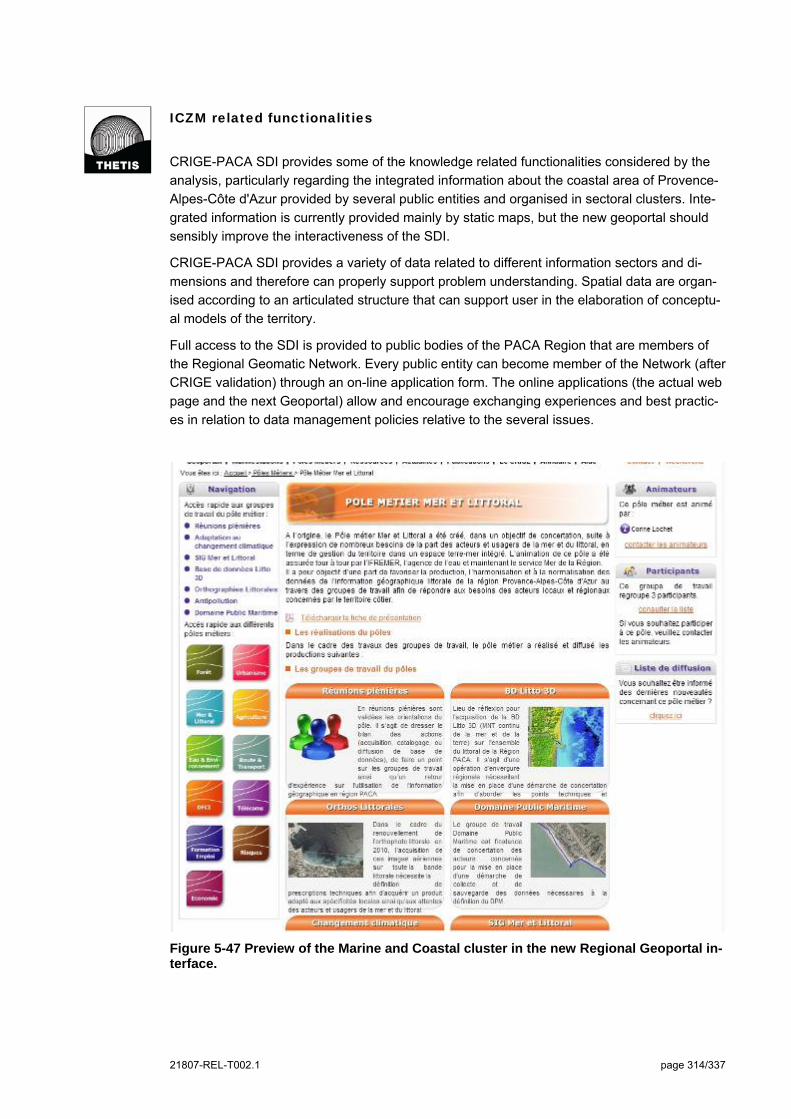
21807-REL-T002.1 page 314/337
ICZM related functionalities
CRIGE-PACA SDI provides some of the knowledge related functionalities considered by the
analysis, particularly regarding the integrated information about the coastal area of Provence-
Alpes-Côte d'Azur provided by several public entities and organised in sectoral clusters. Inte-
grated information is currently provided mainly by static maps, but the new geoportal should
sensibly improve the interactiveness of the SDI.
CRIGE-PACA SDI provides a variety of data related to different information sectors and di-
mensions and therefore can properly support problem understanding. Spatial data are organ-
ised according to an articulated structure that can support user in the elaboration of conceptu-
al models of the territory.
Full access to the SDI is provided to public bodies of the PACA Region that are members of
the Regional Geomatic Network. Every public entity can become member of the Network (after
CRIGE validation) through an on-line application form. The online applications (the actual web
page and the next Geoportal) allow and encourage exchanging experiences and best practic-
es in relation to data management policies relative to the several issues.
Figure 5-47 Preview of the Marine and Coastal cluster in the new Regional Geoportal in-terface.
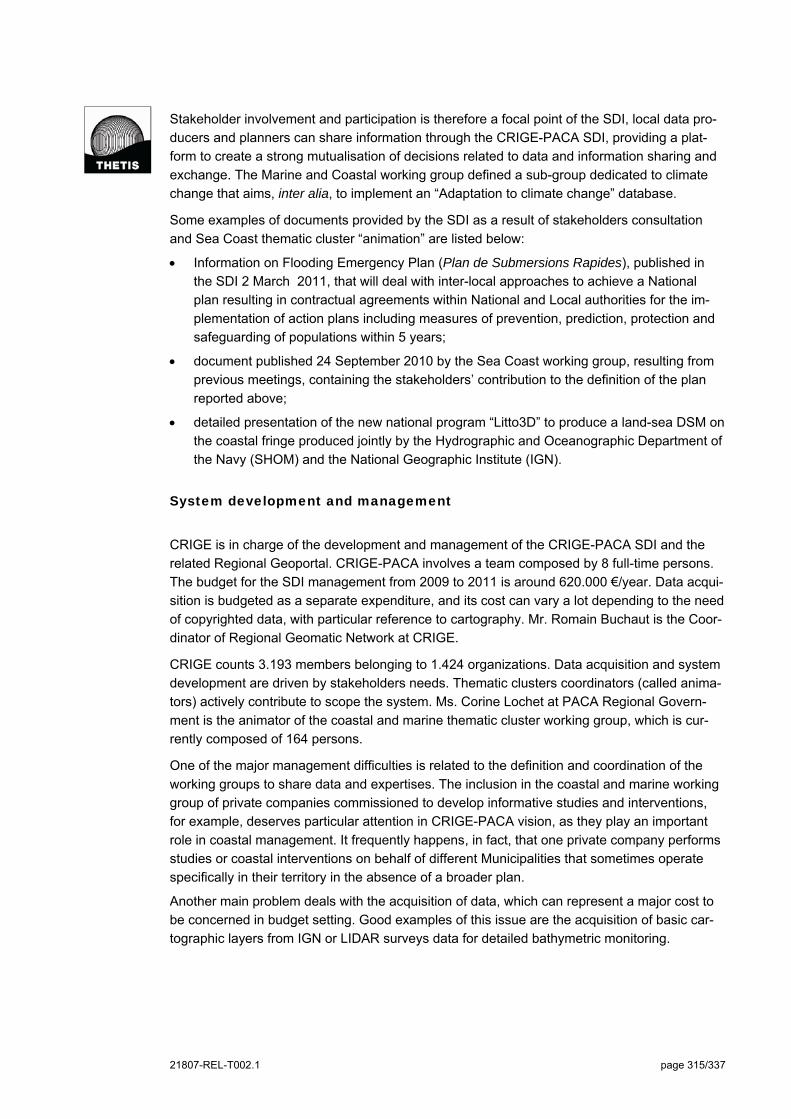
21807-REL-T002.1 page 315/337
Stakeholder involvement and participation is therefore a focal point of the SDI, local data pro-
ducers and planners can share information through the CRIGE-PACA SDI, providing a plat-
form to create a strong mutualisation of decisions related to data and information sharing and
exchange. The Marine and Coastal working group defined a sub-group dedicated to climate
change that aims, inter alia, to implement an “Adaptation to climate change” database.
Some examples of documents provided by the SDI as a result of stakeholders consultation
and Sea Coast thematic cluster “animation” are listed below:
Information on Flooding Emergency Plan (Plan de Submersions Rapides), published in
the SDI 2 March 2011, that will deal with inter-local approaches to achieve a National
plan resulting in contractual agreements within National and Local authorities for the im-
plementation of action plans including measures of prevention, prediction, protection and
safeguarding of populations within 5 years;
document published 24 September 2010 by the Sea Coast working group, resulting from
previous meetings, containing the stakeholders’ contribution to the definition of the plan
reported above;
detailed presentation of the new national program “Litto3D” to produce a land-sea DSM on
the coastal fringe produced jointly by the Hydrographic and Oceanographic Department of
the Navy (SHOM) and the National Geographic Institute (IGN).
System development and management
CRIGE is in charge of the development and management of the CRIGE-PACA SDI and the
related Regional Geoportal. CRIGE-PACA involves a team composed by 8 full-time persons.
The budget for the SDI management from 2009 to 2011 is around 620.000 €/year. Data acqui-
sition is budgeted as a separate expenditure, and its cost can vary a lot depending to the need
of copyrighted data, with particular reference to cartography. Mr. Romain Buchaut is the Coor-
dinator of Regional Geomatic Network at CRIGE.
CRIGE counts 3.193 members belonging to 1.424 organizations. Data acquisition and system
development are driven by stakeholders needs. Thematic clusters coordinators (called anima-
tors) actively contribute to scope the system. Ms. Corine Lochet at PACA Regional Govern-
ment is the animator of the coastal and marine thematic cluster working group, which is cur-
rently composed of 164 persons.
One of the major management difficulties is related to the definition and coordination of the
working groups to share data and expertises. The inclusion in the coastal and marine working
group of private companies commissioned to develop informative studies and interventions,
for example, deserves particular attention in CRIGE-PACA vision, as they play an important
role in coastal management. It frequently happens, in fact, that one private company performs
studies or coastal interventions on behalf of different Municipalities that sometimes operate
specifically in their territory in the absence of a broader plan.
Another main problem deals with the acquisition of data, which can represent a major cost to
be concerned in budget setting. Good examples of this issue are the acquisition of basic car-
tographic layers from IGN or LIDAR surveys data for detailed bathymetric monitoring.
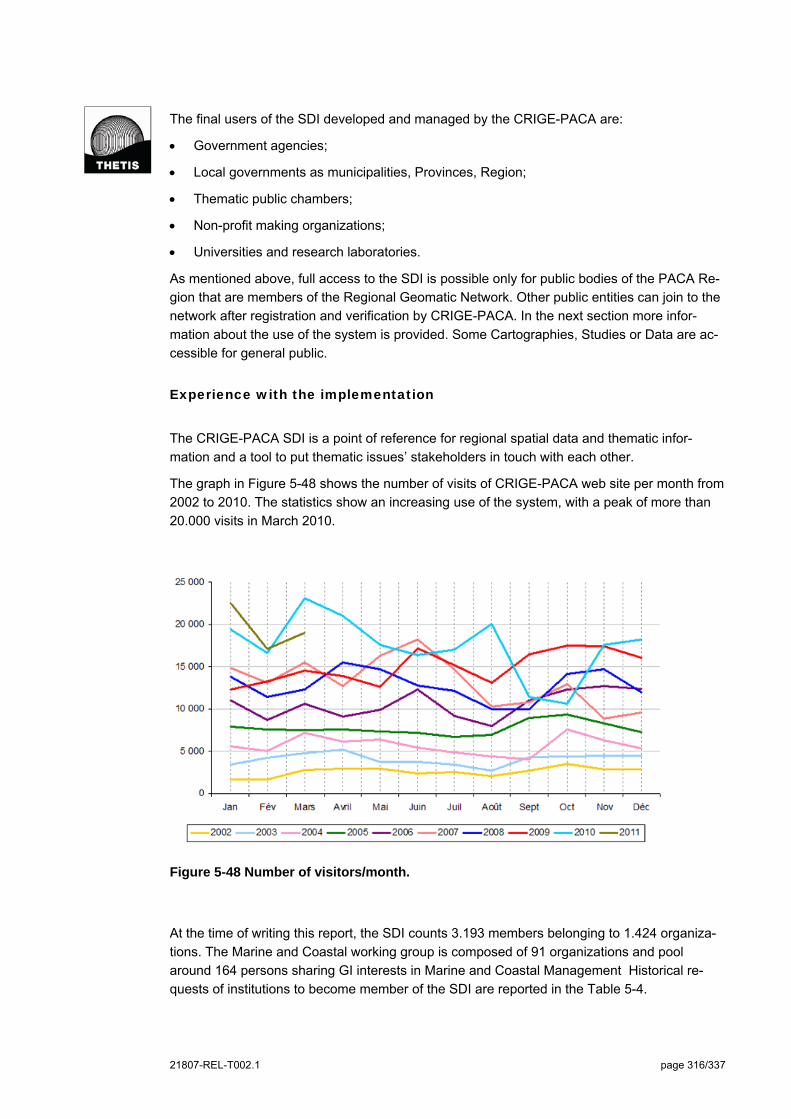
21807-REL-T002.1 page 316/337
The final users of the SDI developed and managed by the CRIGE-PACA are:
Government agencies;
Local governments as municipalities, Provinces, Region;
Thematic public chambers;
Non-profit making organizations;
Universities and research laboratories.
As mentioned above, full access to the SDI is possible only for public bodies of the PACA Re-
gion that are members of the Regional Geomatic Network. Other public entities can join to the
network after registration and verification by CRIGE-PACA. In the next section more infor-
mation about the use of the system is provided. Some Cartographies, Studies or Data are ac-
cessible for general public.
Experience with the implementation
The CRIGE-PACA SDI is a point of reference for regional spatial data and thematic infor-
mation and a tool to put thematic issues’ stakeholders in touch with each other.
The graph in Figure 5-48 shows the number of visits of CRIGE-PACA web site per month from
2002 to 2010. The statistics show an increasing use of the system, with a peak of more than
20.000 visits in March 2010.
Figure 5-48 Number of visitors/month.
At the time of writing this report, the SDI counts 3.193 members belonging to 1.424 organiza-
tions. The Marine and Coastal working group is composed of 91 organizations and pool
around 164 persons sharing GI interests in Marine and Coastal Management Historical re-
quests of institutions to become member of the SDI are reported in the Table 5-4.
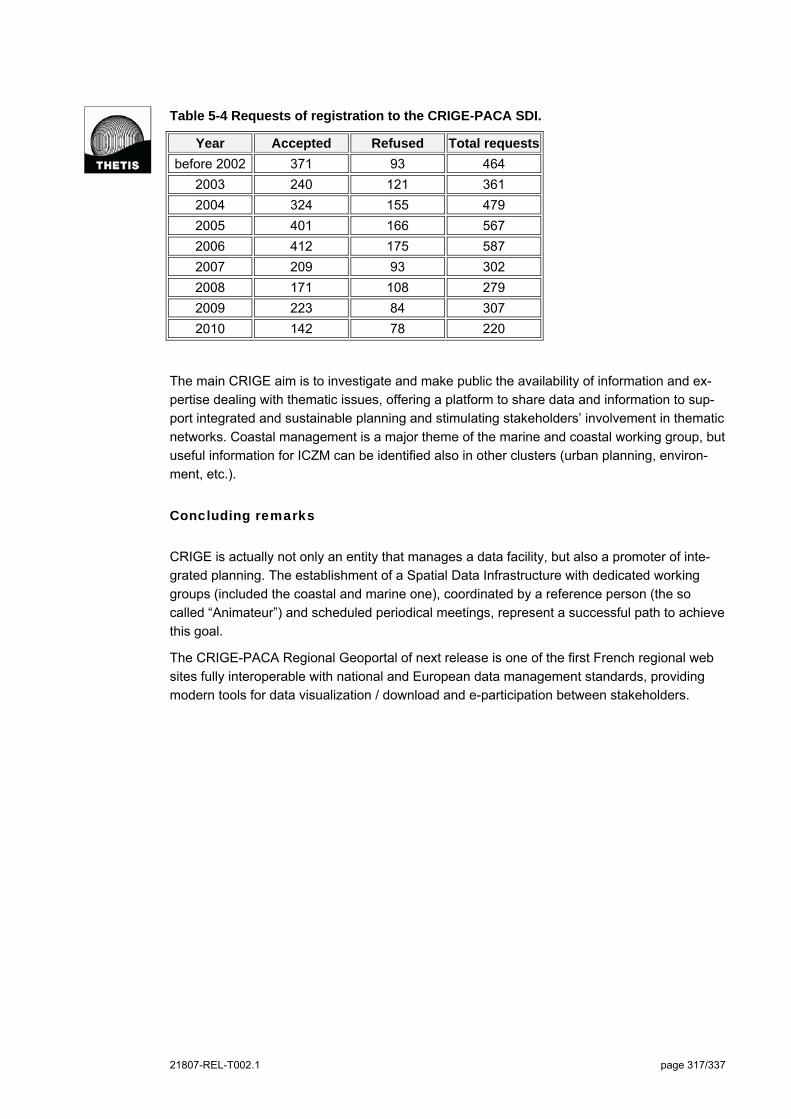
21807-REL-T002.1 page 317/337
Table 5-4 Requests of registration to the CRIGE-PACA SDI.
Year Accepted Refused Total requests
before 2002 371 93 464
2003 240 121 361
2004 324 155 479
2005 401 166 567
2006 412 175 587
2007 209 93 302
2008 171 108 279
2009 223 84 307
2010 142 78 220
The main CRIGE aim is to investigate and make public the availability of information and ex-
pertise dealing with thematic issues, offering a platform to share data and information to sup-
port integrated and sustainable planning and stimulating stakeholders’ involvement in thematic
networks. Coastal management is a major theme of the marine and coastal working group, but
useful information for ICZM can be identified also in other clusters (urban planning, environ-
ment, etc.).
Concluding remarks
CRIGE is actually not only an entity that manages a data facility, but also a promoter of inte-
grated planning. The establishment of a Spatial Data Infrastructure with dedicated working
groups (included the coastal and marine one), coordinated by a reference person (the so
called “Animateur”) and scheduled periodical meetings, represent a successful path to achieve
this goal.
The CRIGE-PACA Regional Geoportal of next release is one of the first French regional web
sites fully interoperable with national and European data management standards, providing
modern tools for data visualization / download and e-participation between stakeholders.

21807-REL-T002.1 page 318/337
5.12 Coastal and marine information system of Emilia Roma-gna Region
General Information
The Coastal and marine information system of Emilia Romagna Region has been mainly im-
plemented within the EU CADSEALAND (Land-sea interaction: coastal state and evolution in
CADSES, 2004-2006) project and it has been designed following the guidelines issued by Eu-
ropean Commission within the EUROSION programme (EU commission, 2004). After the
CADSEALAND project, Emilia Romagna Region (or RER) was involved in the EU funded
PlanCoast project (2006-2008). Within the activities of that project, the CIS has been updated
to further support coastal and marine spatial planning, too. PlanCoast also foresaw the use of
the CIS to define a conceptual framework for the Ferrara coastal area (included in the Emilia
Romagna Region) in order to identify and evaluate coastal vulnerability and to define criteria
and objectives for territorial programming and planning.
The CIS is managed by the Geological, Seismic and Soil Survey (Servizio Geologico, Sismico
e dei Suoli - SGSS) of Emilia Romagna Regional Government. Home page of the survey is
http://www.regione.emilia-romagna.it/wcm/geologia_en/index.htm; SGSS CIS coordinator is
Ms. Luisa Perini, e-mail: [email protected].
The Coastal and marine information system contains data collected by different Institutions
during the last 100 years and several GIS products resulting from survey activities and from
studies recently carried out by the SGSS. The CIS refers to the whole Emilia-Romagna
coastal zone and marine area, and is continuously updated in order to represent a fundamen-
tal support for decision makers and coastal planners dealing with ICZM.
Actually the Sea-Coast CIS is undergoing further implementation and upgrades within the EU
project MICORE (Morphological Impacts and Coastal Risks induced by Extreme storms
events, 2008 - 2011). The general aim of the project is to develop and test online tools for reli-
able predictions of the morphological impact of marine storm events in support to civil protec-
tion mitigation strategies.
The Sea-Coast CIS actually includes a web catalogue of metadata (http://geo.regione.emilia-
romagna.it/catalogo_web/catalogo) and a Web-GIS application (http://geo.regione.emilia-
romagna.it/costa/viewer.htm), enabling the on-line publication of validated spatial data. The
web applications are aimed to share and distribute data among the peripheral structures of the
Emilia Romagna Region, other public and private entities and general public.
21807-REL-T002.1 page 319/337
Operational context and information content
The information content currently available in the CIS can be resumed in the following catego-
ries:
Orthoimagery historical archive from 1946 to 2010;
Land use layers from 1946 to 2010 and elaborations on land use change;
Shoreline DTM;
Shoreline DSM from LIDAR and multibeam surveys;
Administrative boundaries;
Geological, geomorphological and sedimentological static maps;
Marine use DB;
Off-shore infrastructures layers;
Bathymetry;
Coastal protection interventions catalogue;
Submarine sands deposits DB;
Dune steadiness layer;
Coastal classification;
Coastal risk and vulnerability.
Further information content is currently work in progress:
Storms and exceptional events DB;
Shoreline interventions DB (fine sand nourishments);
Hydrodynamic;
Demography;
Cultural heritage;
Laws and regulations DB.
Finally, the CIS managers have identified further useful data for ICZM currently not available
and to be gathered or elaborated in the next future:
Ports;
Economic asset;
Marine Authorizations.
All layers are provided with metadata stored in a dedicated Repository manager ISO 19115
compliant, currently being upgraded. The metadata repository will store all the information
about GIS data contained in the regional data catalogue. Part of this metadata is distributed by
the web catalogue.
Main data and information providers can be resumed as: Regional Agency for the Protection
of the Environment (ARPA), Navy Hydrographical Institute (IIM), Military Geographic Institute
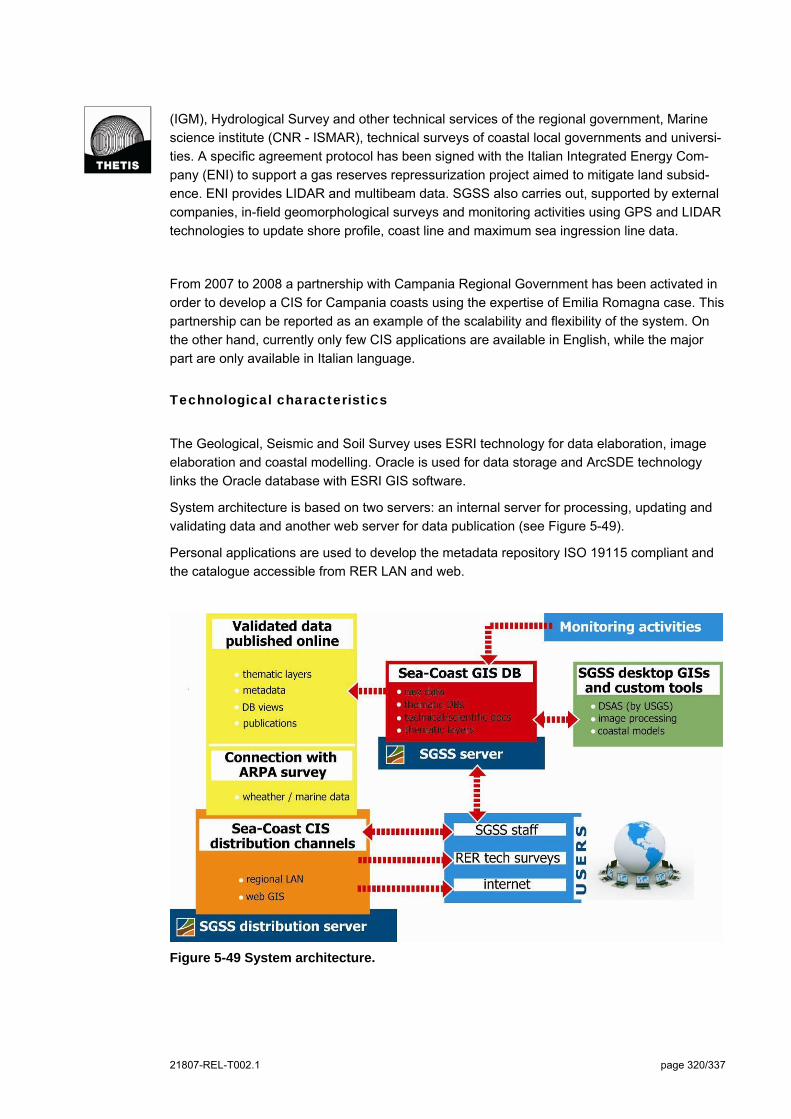
21807-REL-T002.1 page 320/337
(IGM), Hydrological Survey and other technical services of the regional government, Marine
science institute (CNR - ISMAR), technical surveys of coastal local governments and universi-
ties. A specific agreement protocol has been signed with the Italian Integrated Energy Com-
pany (ENI) to support a gas reserves repressurization project aimed to mitigate land subsid-
ence. ENI provides LIDAR and multibeam data. SGSS also carries out, supported by external
companies, in-field geomorphological surveys and monitoring activities using GPS and LIDAR
technologies to update shore profile, coast line and maximum sea ingression line data.
From 2007 to 2008 a partnership with Campania Regional Government has been activated in
order to develop a CIS for Campania coasts using the expertise of Emilia Romagna case. This
partnership can be reported as an example of the scalability and flexibility of the system. On
the other hand, currently only few CIS applications are available in English, while the major
part are only available in Italian language.
Technological characteristics
The Geological, Seismic and Soil Survey uses ESRI technology for data elaboration, image
elaboration and coastal modelling. Oracle is used for data storage and ArcSDE technology
links the Oracle database with ESRI GIS software.
System architecture is based on two servers: an internal server for processing, updating and
validating data and another web server for data publication (see Figure 5-49).
Personal applications are used to develop the metadata repository ISO 19115 compliant and
the catalogue accessible from RER LAN and web.
Figure 5-49 System architecture.

21807-REL-T002.1 page 321/337
The interoperability of the system is guaranteed by the use of standard protocols (INSPIRE)
for data management and storage.
A model used by the Regional Agency for the Protection of the Environment (ARPA) is inte-
grated with the CIS to provide sea-storm events modelling. This is the XBeach model devel-
oped by Delft Hydraulics, a two-dimensional model for wave propagation, long waves and
mean flow, sediment transport and morphological changes of the near shore area, beaches,
dunes and back barrier during storms. Operational models like SWAN and ROMS are also
used to provide information regarding the forecast of sea state and circulation.
A specific database of historical data on storms, exceptional events and related meteorological
data is currently under development by the SGSS within MICORE project, with dedicated fact
sheets providing extended descriptions, newspaper articles and photos. The sea-storm DB will
be integrated into the CIS.
The final aim of tools integration is to implement a more sophisticated "integrated information
system”, designed in CADSEALAND and MICORE projects, where the SGSS CIS and the in-
formation system of ARPA could melt together providing an adequate instrument for the pur-
pose of prediction and prevention of coastal risks.
ICZM related functionalities
The system architecture analyzed in the previous section provide a variety of information con-
tents and functionalities specifically dedicated to different levels of use for ICZM.
The most extended information repository is the one managed by the SGSS in the internal
server for data validation and updating. This information is managed and elaborated by SGSS
GIS officers with desktop applications. Custom extensions have been developed to facilitate
DB and metadata management (see Figure 5-50). A dedicated extension is also used to han-
dle and analyse DSM LIDAR data.
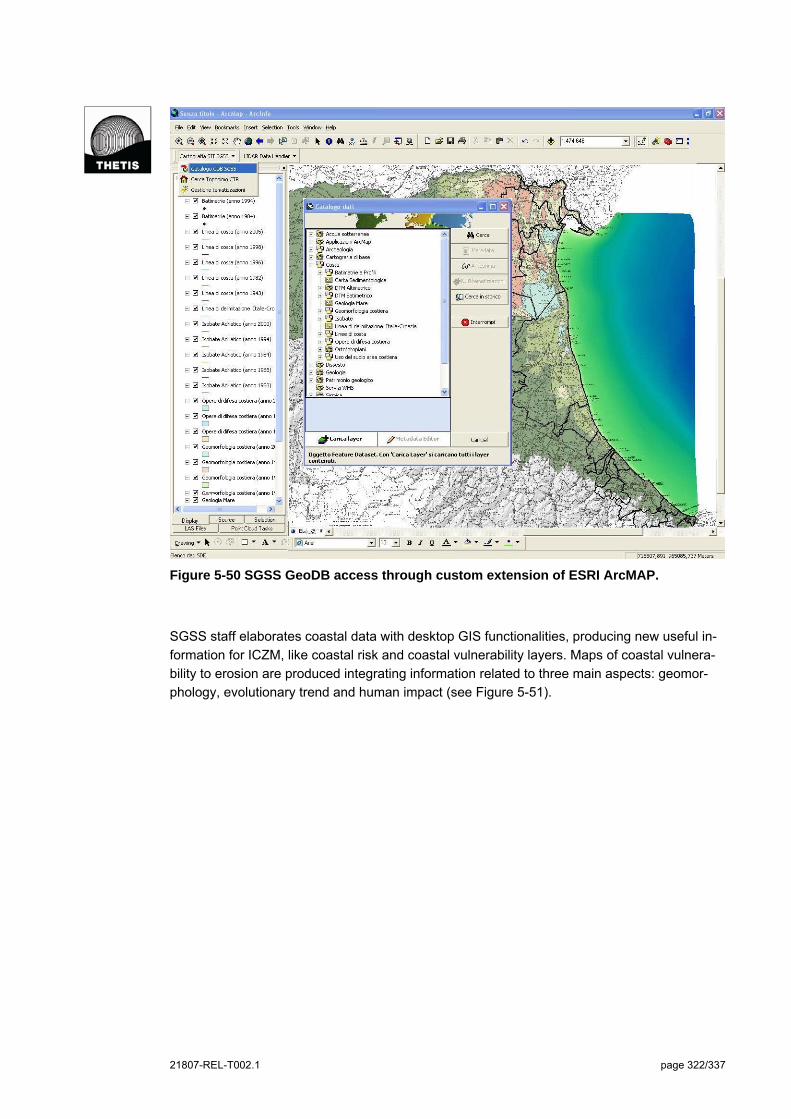
21807-REL-T002.1 page 322/337
Figure 5-50 SGSS GeoDB access through custom extension of ESRI ArcMAP.
SGSS staff elaborates coastal data with desktop GIS functionalities, producing new useful in-
formation for ICZM, like coastal risk and coastal vulnerability layers. Maps of coastal vulnera-
bility to erosion are produced integrating information related to three main aspects: geomor-
phology, evolutionary trend and human impact (see Figure 5-51).
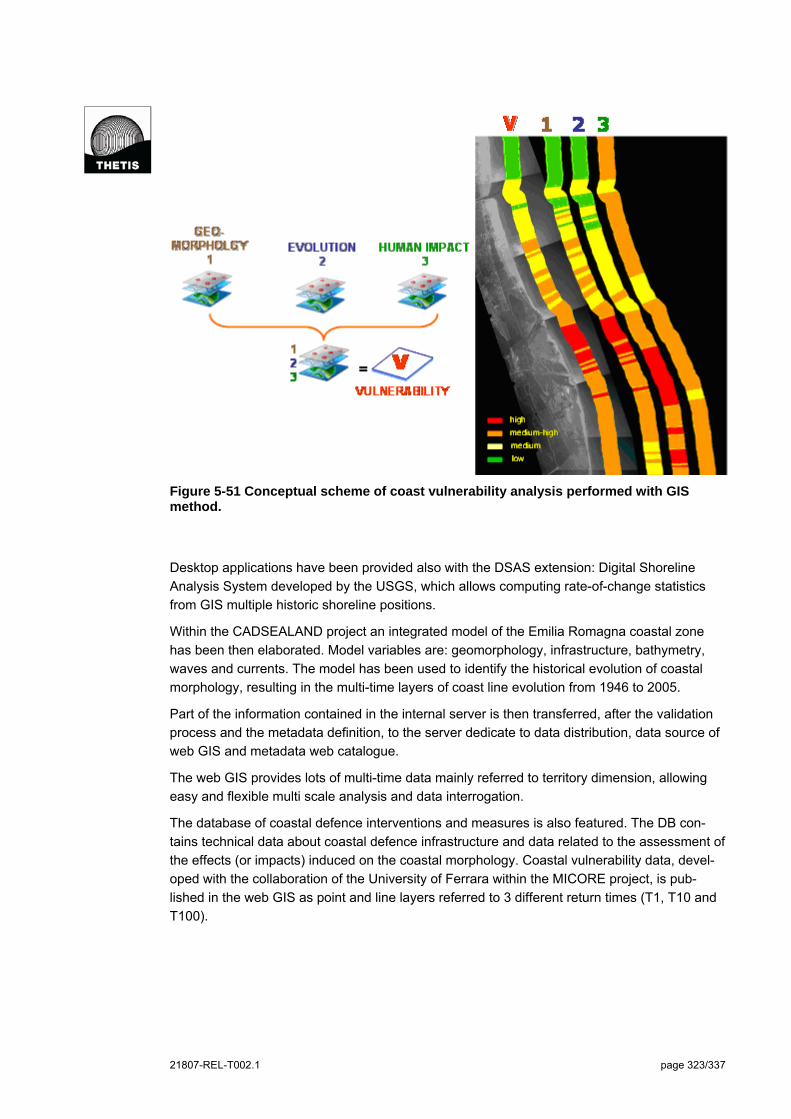
21807-REL-T002.1 page 323/337
Figure 5-51 Conceptual scheme of coast vulnerability analysis performed with GIS method.
Desktop applications have been provided also with the DSAS extension: Digital Shoreline
Analysis System developed by the USGS, which allows computing rate-of-change statistics
from GIS multiple historic shoreline positions.
Within the CADSEALAND project an integrated model of the Emilia Romagna coastal zone
has been then elaborated. Model variables are: geomorphology, infrastructure, bathymetry,
waves and currents. The model has been used to identify the historical evolution of coastal
morphology, resulting in the multi-time layers of coast line evolution from 1946 to 2005.
Part of the information contained in the internal server is then transferred, after the validation
process and the metadata definition, to the server dedicate to data distribution, data source of
web GIS and metadata web catalogue.
The web GIS provides lots of multi-time data mainly referred to territory dimension, allowing
easy and flexible multi scale analysis and data interrogation.
The database of coastal defence interventions and measures is also featured. The DB con-
tains technical data about coastal defence infrastructure and data related to the assessment of
the effects (or impacts) induced on the coastal morphology. Coastal vulnerability data, devel-
oped with the collaboration of the University of Ferrara within the MICORE project, is pub-
lished in the web GIS as point and line layers referred to 3 different return times (T1, T10 and
T100).

21807-REL-T002.1 page 324/337
The web GIS features a powerful multilayer interrogation tool that allow to identify and com-
pare the information of different layers on a spatial based query defined by the user (see Figu-
re 5-52). Interrogation outputs pop out in a new browser page report interactively linked to the
main map page and printable in PDF format.
Figure 5-52 Web GIS application: multilayer interrogation output based on custom spa-tial criteria.
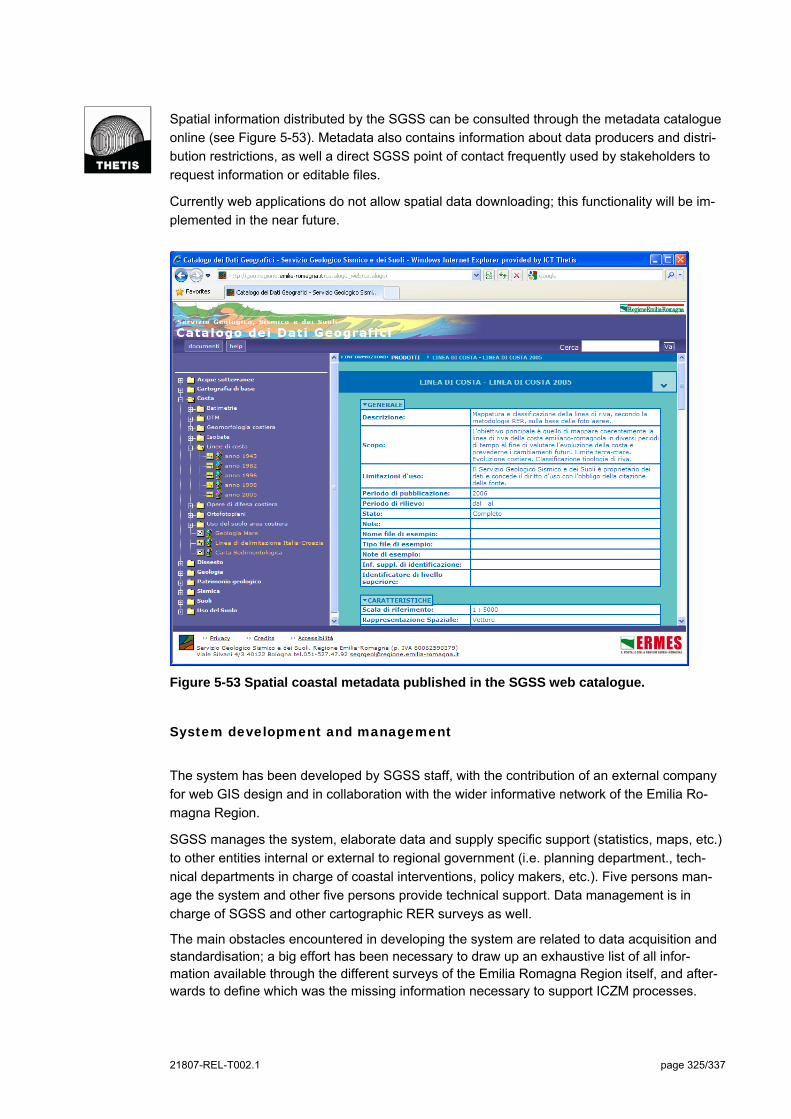
21807-REL-T002.1 page 325/337
Spatial information distributed by the SGSS can be consulted through the metadata catalogue
online (see Figure 5-53). Metadata also contains information about data producers and distri-
bution restrictions, as well a direct SGSS point of contact frequently used by stakeholders to
request information or editable files.
Currently web applications do not allow spatial data downloading; this functionality will be im-
plemented in the near future.
Figure 5-53 Spatial coastal metadata published in the SGSS web catalogue.
System development and management
The system has been developed by SGSS staff, with the contribution of an external company
for web GIS design and in collaboration with the wider informative network of the Emilia Ro-
magna Region.
SGSS manages the system, elaborate data and supply specific support (statistics, maps, etc.)
to other entities internal or external to regional government (i.e. planning department., tech-
nical departments in charge of coastal interventions, policy makers, etc.). Five persons man-
age the system and other five persons provide technical support. Data management is in
charge of SGSS and other cartographic RER surveys as well.
The main obstacles encountered in developing the system are related to data acquisition and standardisation; a big effort has been necessary to draw up an exhaustive list of all infor-mation available through the different surveys of the Emilia Romagna Region itself, and after-wards to define which was the missing information necessary to support ICZM processes.
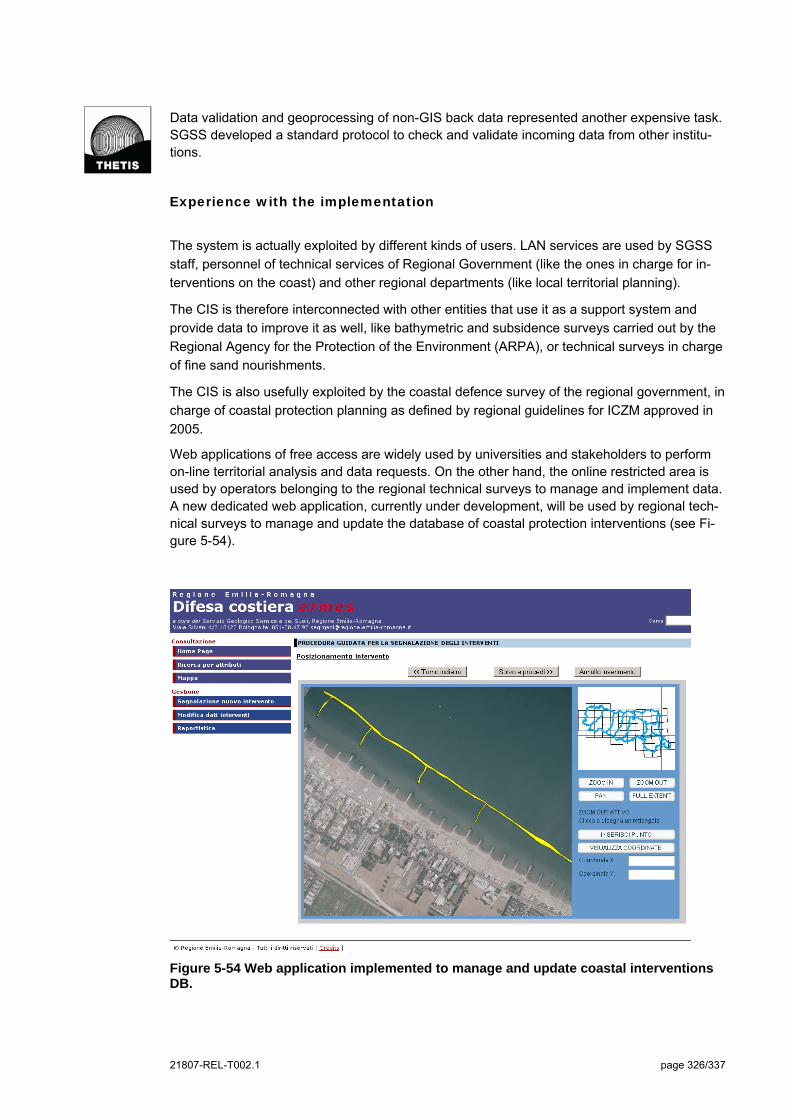
21807-REL-T002.1 page 326/337
Data validation and geoprocessing of non-GIS back data represented another expensive task. SGSS developed a standard protocol to check and validate incoming data from other institu-tions.
Experience with the implementation
The system is actually exploited by different kinds of users. LAN services are used by SGSS
staff, personnel of technical services of Regional Government (like the ones in charge for in-
terventions on the coast) and other regional departments (like local territorial planning).
The CIS is therefore interconnected with other entities that use it as a support system and
provide data to improve it as well, like bathymetric and subsidence surveys carried out by the
Regional Agency for the Protection of the Environment (ARPA), or technical surveys in charge
of fine sand nourishments.
The CIS is also usefully exploited by the coastal defence survey of the regional government, in
charge of coastal protection planning as defined by regional guidelines for ICZM approved in
2005.
Web applications of free access are widely used by universities and stakeholders to perform on-line territorial analysis and data requests. On the other hand, the online restricted area is used by operators belonging to the regional technical surveys to manage and implement data. A new dedicated web application, currently under development, will be used by regional tech-nical surveys to manage and update the database of coastal protection interventions (see Fi-gure 5-54).
Figure 5-54 Web application implemented to manage and update coastal interventions DB.
21807-REL-T002.1 page 327/337
Finally, a further development of the CIS is planned, foreseeing the upgrade of vulnerability
analysis of the coast, the integration of ARPA information system and their sharing with the
Italian Civil Protection Service in order to provide an integrated system for coastal risk man-
agement. This task is already under development on a case study area within the MICORE
project.
Concluding remarks
The Sea-Coast CIS of Emilia Romagna Region provide an effective support to ICZM pro-
gramme carried out by Emilia Romagna government, and is an operational application of re-
gional guidelines for ICZM that have been approved in 2005.
The CIS is also intended to become a decisional support system providing the needful
knowledge for policy and planning actions, structuring a network of all subjects operating in
coastal development, protection and defence and encouraging their cooperation.
21807-REL-T002.1 page 328/337
5.13 GIS tools of the Information Service of the Venice Water Authority
General Information
SINFO CIS refers to a set of GIS-based and related (database, models, decision support sys-
tems) tools developed by the “Servizio Informativo” (Information Service) of the Venice Magis-
trato alle Acque di Venezia (Venice Water Authority - MAV), in order to support the manage-
ment and safeguarding activities of the Venice Lagoon implemented by the same MAV
through it concessionary Consorzio Venezia Nuova.
The Information Service was set up in February 1984, implementing the first convention
signed between the Venice Water Authority and the Consorzio Venezia Nuova (in the context
of the first Special Law no. 171/1973 which established the principle that safeguarding of Ven-
ice was a matter of "priority national interest”). Main tasks of the Information Service were and
still are to generate, collect, classify and archive data and information on the lagoon environ-
ment and the related human activities. These data and information are used to support other
bodies operating in the Venice Lagoon (mainly the Venice Water Authority) in dealing wit the
assessment of the state of the system and the causes of the environmental and morphological
deterioration, as well as with the definition of safeguard plans of interventions (defence from
high waters, defence from sea storms and environmental protection) and its monitoring.
Main purpose of the MAV Information Service is the organization of data and their integrated
analysis in order to provide scientific-based information to support the management and safe-
guarding of the Venice Lagoon. Specifics objectives can be summarized as follows:
Produce the knowledge base to define the state of the system, identify the causes of deg-
radation and develop plan of actions for the Lagoon safeguard and related monitoring;
Organise and make easily accessible and understandable the wide and complex set of
data and information available on the Venice Lagoon and its territory;
Standardize the used observation and measurement methodology;
Facilitate the technical collaboration among different institutions.
All users can consult the data (and related metadata) at the Information Service and require
them to MAV and the same Information Service. After the authorization from MAV, the Infor-
mation Service provides the required data, maps, GIS layer, and meta-data to users. Data and
information (such as historical maps, other static digital maps, some spatial layers, etc.) can
be consulted at the Information Service through the SIGLA system showed in Figure 1-1. A
second tool (Co.Op.) has been specifically developed to support the research of documents
related to studies, project and interventions, etc (Figure 5-56).
The Information Service is located in the historical centre of Venice (S. Marco 2949) and can
be contacted by phone (041-5203188) or by e-mail: [email protected].

21807-REL-T002.1 page 329/337
Figure 5-55 SIGLA tool; the system is currently available only for the intranet users of the Information Service of the Water Venice Authority.
Figure 5-56 Co.Op. tool for the research of studies and projects realized by the Water Authority of Venice and its metadata (e.g. title, date, location of consultation).
21807-REL-T002.1 page 330/337
Operational context and information content
SINFO CIS has gradually evolved in time, since 1984, progressively acquiring new data and
developing new information and tools.
First period of activity mainly focused on collection and quality check of available documenta-
tion and creation of the Geographic Information System of the Venice Lagoon territory. The
second period (started approximately in 1990) started addressing Venice Lagoon problems.
This implied the further development of the GIS tools as well as of other integrated tools, in-
cluding models, specific software and various decision support systems. The third period (rela-
tive to recent years) is characterized by an operational dimension, directly serving institutions,
where the activities are part of the production processes. The results of these activities were
complementary and mutually reinforced by those reached by MAV through its concessionary
the “Consorzio Venezia Nuova”.
Several institutions have collaborated with the MAV Information Service in the acquisition of
data included in the SINFO CIS; e.g.:
Veneto Regional Authority;
Provincial and municipal Authorities of the Veneto Region;
Universities of the Veneto Region;
The Italian National Research Council (CNR);
The National Institute of Statistics (ISTAT).
The SINFO CIS mainly addresses four of the five considered information dimensions. The en-
vironment and the territory dimensions are in depth addressed. The economic (e.g. data on
the industrial area of Porto Marghera, close to the Venice Lagoon) and the social dimension
(e.g. population density, urban structure) are considered, too. The SINFO CIS includes several
information which refers to the following main topics:
Base maps
Historical maps, remote sensed data, including a wide collection of satellite images
and aerial photographs;
Physical and morphological environment of the Venice Lagoon (canals, tidal flats,
mudflats, salt marshes) and its drainage basin;
Administrative boundaries.
Morphology (bathymetry and digital elevation model, channels, elevation of salt marshes,
surface of shallow water, salt marshes and tidal flats, evolution of lagoon morphology,
granulometry of sediments, geotechnical characteristics, subsidence, pedology of the
drainage basin, morphological interventions in the Venice lagoon);
Hydrodynamic (current, tide, waves, meteorological data, discharge, flows, hydrographic
network and drainage basins, database of flooding events and flooding risk for lagoon ur-
ban systems);
Biology and biodiversity (macroalgae and seagrass distribution and ecological characteris-
tics, and more in general lagoon vegetation, zoobenthos, birds);
Quality (water and sediments quality, drainage basin, residence time);
21807-REL-T002.1 page 331/337
Socio-economy (water traffic, hunting, fish and fish farming, land use, road infrastructure
population density, industrial activities; archaeology, sewerage discharges in Venice la-
goon).
Data and information contained in the set of GIS tools of the MAV Information System have
been used, also through models, to support many integrated analysis related to the Venice
Lagoon management. Results of these analysis have been often included in the SINFO CIS,
e.g.:
database of flooding events and of urban area affected by flooding risk;
pollution loads (and relative budget) from the drainage basin;
maps of the morphological evolution of the Venice Lagoon, also including areas subjected
to sedimentation or erosion;
map of the archaeological risk.
Above ones are just some examples of integrated analysis results included in the SINFO CIS.
Technological characteristics
SINFO CIS is developed with Geomedia Intergraph (Licensed software). Geomedia area inter-
faced with numerous Oracle database to manage all the alphanumeric data. The main themes
(e.g. elevation type and attribute, transport, channel, administrative boundary) provide com-
plete interoperability in full compliance with the INSPIRE directive. This is going to be extend-
ed to all spatial data.
SINFO CIS is directly or indirectly (for example providing data and acquiring outcome) inte-
grated with a relevant number of other tools (database, models and decision support sys-
tems), including for example:
BDMA; Oracle database for the collection, management and diffusion (currently thought
Intranet) of environmental data and document on the Venice Lagoon
SAMANET; a specific software for the acquisition and management of data (water chemi-
cal and physical parameters) continuously measured by fixed monitoring stations;
CRUP; decision support system, providing integrated information for licensing discharges
into lagoon generated by production activities. CRUP is integrated with a dispersive math-
ematical model able to evaluate the effects of pollutants discharged into the lagoon;
Specific systems used to manage large dataset, such as: GESCOM supporting licensing
for private water uses of the lagoon; SITAR related to archaeological sites in the Venice
lagoon; COSS supporting quick visualisation of documents and reports related to studies;
MODEL supporting the use of various hydrodynamic models of the Venice Lagoon.
Particularly relevant is the integration of INFO-CIS with the CIS of the Veneto Region coast
(SIT della Fascia Costiera Veneta), realized by the Information Service of the Water Authority
and the Veneto Region in order to collect all the data and information produced and made
available by these two entities about the Veneto coastal system. Data and information are re-
lated to the coast from Bibbione in the north and Scardovari in the south and are organized in
two sections: Veneto coast and coastal hinterland (Figure 5-57). The system is still not availa-
ble on-line at the moment and it is going to be soon published as a fully interactive Web-GIS.
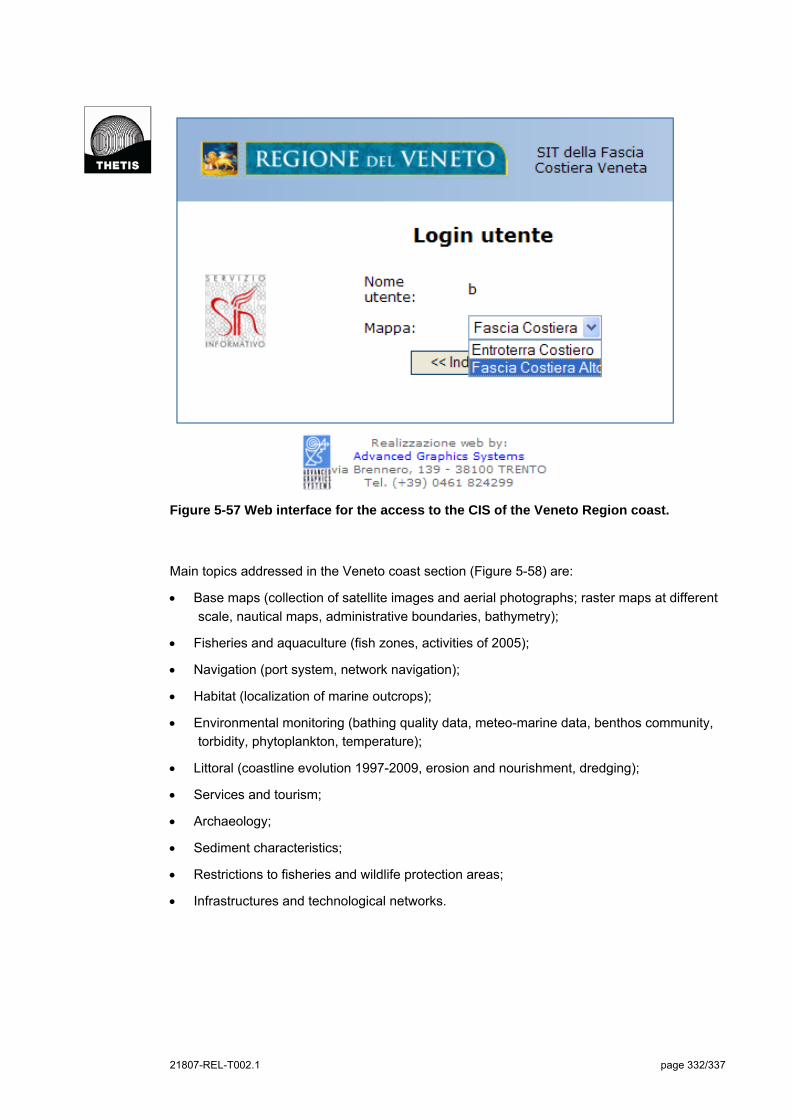
21807-REL-T002.1 page 332/337
Figure 5-57 Web interface for the access to the CIS of the Veneto Region coast.
Main topics addressed in the Veneto coast section (Figure 5-58) are:
Base maps (collection of satellite images and aerial photographs; raster maps at different
scale, nautical maps, administrative boundaries, bathymetry);
Fisheries and aquaculture (fish zones, activities of 2005);
Navigation (port system, network navigation);
Habitat (localization of marine outcrops);
Environmental monitoring (bathing quality data, meteo-marine data, benthos community,
torbidity, phytoplankton, temperature);
Littoral (coastline evolution 1997-2009, erosion and nourishment, dredging);
Services and tourism;
Archaeology;
Sediment characteristics;
Restrictions to fisheries and wildlife protection areas;
Infrastructures and technological networks.

21807-REL-T002.1 page 333/337
Figure 5-58 Web interface of the Veneto cost section.
Main topics addressed in the hinterland section are:
Base maps (collection of satellite images and aerial photographs; raster maps at different
scale, nautical maps, administrative boundaries, bathymetry);
Protected areas (Important Bird Area, Special Protection Area and Site of Community Im-
portance;
Infrastructures and technological networks;
Territorial plan.
Metadata are provided for all layers included in the CIS of the Veneto Region coast. In particu-
lar a specific tool enables to visualise a metadata form including the detailed description of the
data source and provider, as well as hyperlinks to detailed information related to the layer
(such as data tables, documents, web-sites with real-time data, etc.).
ICZM related functionalities:
SINFO CIS provides some of the ICZM knowledge related functionalities considered by the
analysis, specifically:
Integration among different information sectors this functionality is widely developed;
Operation at the different spatial scale; great part of the available spatial data can be re-
scaled according to the considered spatial extent; thus enabling to visualize more details at
a higher scales.
The data and information collected at the local level allows a more general inclusion in a
larger scale, thus providing an adequate cooperation between different levels.

21807-REL-T002.1 page 334/337
It is particularly important to stress wide availability of multi-timer layers and data. A very inter-
esting example is the exhaustive and comprehensive set of historical maps and survey of the
Venice Lagoon morphology, enabling to evaluate the long term evolution of the system. Histor-
ical maps can be directly consulted through the SIGLA tool, that enables to focus the analysis
on a specific lagoon area of interest (see an example in Figure 5-59).
Figure 5-59 Example of historical map search and visualisation.
Important time series are also available for environmental quality data of various matrixes.
These data are contained in a specific database; BDMA (Environmental Monitoring Database)
is a tool for Internet search and consultation of environmental data on the Venice lagoon and
surrounding areas (drainage basin and the coastal marine area). Other really important histor-
ical datasets are related to the coastline evolution (including quantitative data on erosion, sed-
imentation and nourishment processes) of the Venice littorals (see an example in Figure 5-60)
and the morphological evolution of the lagoon system, including in particular bathymetric data
on shallow waters, tidal flats and salt-marshes. These two set fully support the assessment of
coastal and lagoon dynamics and the definition of related plans of interventions.

21807-REL-T002.1 page 335/337
Figure 5-60 Example of multi-time spatial data on coastline evolution.
SINFO CIS, and related tools of the Information Service (models, decision support systems,
databases), specifically aims to provide scientifically-base information to local decision mak-
ers, planners and managers (Venice Water Authority and its concessionary Consorzio Vene-
zia Nuova) dealing with the sustainable management of the Venice Lagoon. Use of the system
is therefore strictly connected to plans (e.g. the morphological plan of intervention), interven-
tions and monitoring in the Venice Lagoon system, in the perspective of the ICZM process.
Actually it is possible to say that SINFO CIS, and all the integrated tools, fully support various
phases of the integrated management of the Venice Lagoon (starting from problem under-
standing and structuring and ending with evaluating and adaptive planning). Furthermore, de-
veloped decision support systems, directly or indirectly integrated with GIS information and
tools, enable to generate thematic scenarios and assess related alternatives.
Furthermore, the newly developed CIS of the Veneto Region coast (see Figure 5-57) has been
properly designed and implemented in order to support the Regional Authority in dealing with
the elaboration of the Coastal Plan (Piano Coste) within an ICZM perspective.
SINFO CIS (the GIS and related tools) does not provide specific participation tools; actually
the GIS systems are currently not available on-line. However, all users can consult the infor-
mation at the Information Service and require them to the Venice Water Authority and the
same Information Service.
Moreover many summary data and information are diffused through the “Puntolaguna” initia-
tive. Puntolaguna is a multimedia information point on activities related to the safeguard of
Venice and its lagoon undertaken by the Venice Water Authority through the “Consorzio Ve-
nezia Nuova”. A vast and diverse range of informative tools are available for visitors to consult
the material in a multi languages support (multimedia support, consultation on paper and on
video).
21807-REL-T002.1 page 336/337
Puntolaguna information point offers presentations on the safeguarding activities and "virtual”
visits to the lagoon. Puntolaguna is also used to organise the following initiatives:
Visit to the lagoon and the work sites of main interventions;
Training courses for technicians from the public administration in particular focusing on
data management and safeguarding activities of the Venetian lagoon ecosystem;
Technical seminars;
Educational laboratory.
System development and management
The complete set of GIS and other tool collectively included in the SINFO CIS has been pro-
gressively developed, since 1984, by the Information Service of the Venice Water Authority.
These activities also implied the collaboration with other public and private entities, in particu-
lar the Consorzio Venezia Nuova and other ones such as the Veneto Regional Authority and
Thetis, an engineering company based in Venice. Data contained in the SINFO CIS tools have
been produced by an remarkable high number of studies, project and monitoring activities in-
volving a wide variety of subjects working in the Venice Lagoon. A great part of funds used to
develop tools and acquire data have been directly provided by the Venice Water Authority
through its concessionary Consorzio Venezia Nuova. Indeed it is very difficult to provide a fig-
ure of costs related to this remarkable development effort.
Initial difficulties were mainly related to technological aspects of tools development. After-
wards, main obstacles were represented by data collection; a huge effort was implemented to
acquire raw data from the original producers and to standardise these data to common for-
mats.
SINFO-CIS is today managed and operated by the staff of the Information Service of the Ven-
ice Authority. Particular attention is given to maintain all part of the system and related dataset
updated to the last available data and technologies (both software and hardware). About
twelve full-time persons are currently involved in the management, updating and progressive
development of this complex system of systems. In particular:
All staff persons are involved in the operative management and use of the GIS tools, in-
cluding all the various phase of the production and analysis of spatial information; such as:
data digitalisation, editing, spatial analysis and output production;
Five of the twelve persons are specifically also dedicated to software development, includ-
ing web aspects.
Due to the operative orientation of the SINFO CIS, target users mainly include the following
ones:
Policy-makers and decision-makers, in particular those working for the Venice Water Au-
thority. Moreover, data have been provided to support decision making of various other in-
stitutions;
Coastal planners and coastal managers, in particular technicians working for the Consor-
zio Venezia Nuova;
Internal experts and specialised and expert users;

21807-REL-T002.1 page 337/337
Representative of private sectors that can be in particular interested in understanding
constrains and opportunities related to the lagoon environment for their economic activi-
ties.
Data and information contained in GIS and database are useful for everybody that may require
them to the MAV and Information Service. Other target users are represented by citizens, in
particular in relation to the Puntolaguna initiative.
Experience with the implementation
SINFO CIS is constantly used by the Venice Water Authority and its concessionary Consorzio
Venezia Nuova as the main data source for studies, projects and interventions related to the
safeguard of the Venice lagoon in the context of the Italian special law. The implemented stud-
ies, projects and monitoring activities generate data and information that are progressively ar-
chived in and managed through the same SINFO CIS’s systems.
The consultation and distribution of the information allows and guarantees support to man-
agement of coastal data, data sharing, communication, coastal monitoring, coastal planning
and management. The system is continuously implemented and is used for the on-going safe-
guarding activities, in particular related to: the protection of the historical city of Venice and its
lagoon from high water events, morphological and environmental requalification, and defence
of littorals.
Conclusive remarks
SINFO CIS is a system of different tools, including GIS-based tools, databases, models and
DSS. It archives and manages an incredibly rich and wide amount of information of the Venice
Lagoon.
This system is strictly integrated within its main final users, the Venice Water Authority and the
related concessionary Consorzio Venezia Nuova, that actually utilize tools and data as the
scientific base of studies, projects, interventions, plans, monitoring activities. All these activi-
ties are implemented in a holistic vision aiming to the overall safeguarding of the Venice la-
goon system, including a relevant natural heritage and the related human component. It is
possible to conclude that SINFO-CIS fully supports the implementation of an ICZM-like pro-
cess. In this perspective it is relevant to mention some rather new studies promoted by the
Venice Water Authority focusing on the sustainable development of the Venice Lagoon, the
assessment of climate change vulnerability and the development of adaptation strategies to
the same climate change impacts.
21807-REL-T002.1 Annex 1
Annex 1 – Information sources for in-depth analysis

21807-REL-T002.1 Annex 1 – page 1
HELCOM Map and Data Service
17/02/2011 Beginning of in-depth analysis from results of the overview assessment.
18/02/2011 Email to Manuel Frias and Minna Pyhala (not reply).
28/02/2011 Email to [email protected] and [email protected].
28/022011 Email from Joni Kaitaranta, data administrator in HELCOM and also in charge
of updating and development of the map service. Data requests can be divert-
ed to him.
08/03/2011 Mail to Joni Kaitaranta asking for further information and phone / skype inter-
view arrangement.
08/03/2011 Additional information and documentation received via email by Joni Kaitaran-
ta. Availability on 15 or 16 March for skype interview.
16/03/2011 Skype conference call.
Attendants:
Thetis Marco Zanetto, Chiara Castellani;
HelCom Joni Kaitaranta (Data administrator).
Discussed issues:
information contents and knowledge functionalities;
development and actual management of the system;
use and users of the system;
experiences with the implementation;
potentialities as DSS in ICZM dimensions.
22/03/2011 Additional information about system development and implementation re-
ceived via email by Joni Kaitaranta.
01/04/2011 In-depth analysis completed; draft version sent to Joni Kaitaranta.
04/04/2011 Comments and integrations received by HelCom Secretariat.
05/05/2011 In-depth analysis completed.
21807-REL-T002.1 Annex 1 – page 2
Coastal Information System Oder Estuary
04/02/2011 Beginning of in-depth analysis from results of the overview assessment.
09/02/2011 Beginning of further information collection via e-mail by Gerald Schernewski
that indicates Inga Haller and Susanne Schumacher as contact points of CIS
management (EUCC-D).
11/02/2011 Further information requested via e-mail to Inga Haller ([email protected]) and
Susanne Schumacher ([email protected]).
21/02/2011 Availability for a meeting requested via e-mail to Inga Haller (haller@eucc-
d.de) and Susanne Schumacher ([email protected]).
21/02/2011 Availability for face to face meeting from Nardine Stybel.
28/02/2011 Information request to Nardine Stybel via email (nardine.stybel@io-
warnemuende.de) and proposal for skype conference to7 March.
07/03/2011 Phone conference call (+49 381 5197279).
Attendants:
Thetis Marco Zanetto, Angiola Fanelli;
EUCC-D Nardine Stybel,
EUCC-D CIS developers.
Discussed issues:
ICZM related functionalities;
development and actual management of the system;
experiences with the implementation.
14/03/2011 Further information about coastal indicators, steering group, stakeholder in-
volvement and implementation phase received via email by Nardine Stybel.
06/04/2011 Draft in depth analysis completed and sent to Nardine Stybel.
15/04/2011 Suggestions for improvement received from Nardine Stybel.
15/04/2011 In depth analysis completed.
21807-REL-T002.1 Annex 1 – page 3
North Sea Atlas
08/02/2011 Beginning of in-depth analysis from results of the overview assessment.
09/02/2011 Further information requested via e-mail at [email protected].
10/02/2011 Phone call with Elly Kleis (+31 70 3366600) and email at [email protected] to
have a direct contact with CIS managers.
14/02/2011 Phone call with Elly Kleis and new mail asking for CIS information contact.
14/02/2011 Information contacts received by Elly Kleis: 1st contact is Ad Stolk (+31703366
787), 2nd contact Rob Vransen (+31703366648).
16/02/2011 Beginning of further information collection via email by Ad Stolk.
16/02/2011 Phone interview with Ad Stolk. Discussed issues: ICZM related functionalities,
technologies used, updating and use of the Atlas.
14/04/2011 Phone call: Ad Stolk is out of office for the whole week.
14/04/2011 Draft analysis sent to Ad Stolk and Rob Vransen.
15/04/2011 Phone talk with Marcel Bommele (Project leader of North Sea Atlas,
+31627038241). Discussed issues: development, management and actual
use of the Atlas.
18/04/2011 In depth analysis completed.
22/04/2011 Comments received by Ad Stolk.
26/04/2011 In depth analysis completed.
21807-REL-T002.1 Annex 1 – page 4
KustAtlas – Belgian Coastal Atlas
04/02/2011 Beginning of in-depth analysis from results of the overview assessment.
09/02/2011 Beginning of further information collection via e-mail by Kathy Belpaeme:
– Indication of handbook “Coastal Informatics: Web Atlas Design and Im-
plementation” as a comprehensive source of information about the Atlas;
– Information about new updated and upgraded version of the Atlas, with
more interactive maps and links to sustainability indicators, to be pub-
lished in May 2011.
14/02/2011 Kathy Belpaeme indicates Sofie Vanhooren as point of contact to achieve ex-
tra information requested about new features that will update and upgrade the
Atlas.
23/02/2011 Beginning of further information collection via e-mail by Sofie Vanhooren
28/03/2011 Phone call with Sofie Vanhooren (+3259340166) asking for missing infor-
mation about system development and management.
28/03/2011 As agreed, email to Sofie Vanhooren asking for missing information about
system development and management.
01/04/2011 Further information received via email from Sofie Vanhooren about system
development and management.
04/04/2011 In depth analysis completed; draft version sent to Sofie Vanhooren and Kathy
Belpaeme.
06/04/2011 Comments and integrations received by Sofie Vanhooren and Kathy Belpae-
me.
06/04/2011 In depth analysis completed.

21807-REL-T002.1 Annex 1 – page 5
MIDA – The Marine Irish Digital Atlas
08/02/2011 Beginning of in-depth analysis from results of the overview assessment.
10/02/2011 Beginning of further information collection via e-mail by Ned Dwyer (co-chair
of ICAN and project manager of the MIDA, [email protected]).
21/02/2011 Phone talk with Ned Dwyer to organize meeting.
25/02/2011 Mail from Ned Dwyer.
25/02/2011 Phone talk with Ned Dwyer: meeting arranged for 11 March.
07/03/2011 Mail to Ned Dwyer with overview analysis and indication of further information
needed for in-depth analysis.
11/03/2011 Meeting c/o CMRC.
Attendants:
Thetis Marco Zanetto, Angiola Fanelli;
CMRC Ned Dwyer.
Discussed issues:
origin, initial aim and development of the system;
management arrangements;
experiences with the implementation;
technological solutions;
ICZM related functionalities;
planned upgrades of the system.
01/04/2011 In depth analysis completed; draft version sent to Ned Dwyre.
07/04/2011 Comments and integrations received by Ned Dwyre.
08/04/2011 In-depth analysis completed.
21807-REL-T002.1 Annex 1 – page 6
Dorset Coastal Explorer
17/02/2011 Beginning of in-depth analysis from results of the overview assessment.
18/02/2011 Email to [email protected].
22/02/2011 Information received from James Feaver (Marine and Coastal GIS Officer):
the CIS is not operational yet and has more than a year to run.
04/03/2011 Phone call trial (+441305221697).
04/03/2011 Mail to James Feaver explaining why the system could be included in the in-
depth analysis even if pre-operational, asking for further information and
phone interview arrangement.
10/03/2011 Phone call with James Feaver (+441305221697), remote interview agreed for
23 March.
23/03/2011 Phone interview with James Feaver.
Discussed issues:
Operational systems developed by the Dorset Coast Forum;
State of the art of the new CIS;
knowledge functionalities;
use and users of the systems;
experiences with the implementation;
tool for ICZM policy tracking.
23/03/2011 New documentation collection by email from James Feaver.
06/04/2011 In depth analysis completed; draft version sent to James Feaver.
07/04/2011 Comments, integrations and further information received by James Feaver.
08/04/2011 In depth analysis completed.
21807-REL-T002.1 Annex 1 – page 7
Cork Harbour Geographic Information System
11/02/2011 Beginning of in-depth analysis from results of the overview assessment.
21/02/2011 Phone talk with Ned Dwyer to organize meeting with CIS responsible (Cathal
O’Mahony, [email protected]).
25/02/2011 Mail from Ned Dwyer.
25/02/2011 Phone talk with Ned Dwyer: meeting arranged for 11 March.
07/03/2011 Mail to Ned Dwyer and O’Mahony with overview analysis and indication of fur-
ther information needed for in-depth analysis.
11/03/2011 Meeting c/o CMRC.
Attendants:
Thetis Marco Zanetto, Angiola Fanelli;
CMRC Cathal O’Mahony.
Discussed issues:
information contents;
actual management of the system;
use and users of the system;
experiences with the implementation;
potentialities as DSS in ICZM dimensions.
24/03/2011 Email to Vicki O’Donnell (GIS officer, [email protected]) asking for specific
information.
25/03/2011 Email from Vicki O’Donnell with clarifications about data licence agreements.
28/03/2011 Exhaustive CIS information content requested by phone to Cathal O’Mahony.
28/03/2011 Additional specification of CIS information content received by Vicki
O’Donnell.
07/04/2011 In-depth analysis completed; draft version sent to Cathal O’Mahony and Vicki
O’Donnell.
07/07/2011 Integrations received by Vicki O’Donnell.
08/04/2011 In-depth analysis completed.

21807-REL-T002.1 Annex 1 – page 8
GEOIDD - Litto
08/03/2011 Beginning of in-depth analysis from results of the overview assessment.
08/03/2011 Email to [email protected] (returned).
10/03/2011 Email to [email protected] (returned).
10/03/2011 Phone call with operator of the French Environment Agency (+33 2
38797878).
10/03/2011 As agreed with operator, mail sent to cgdd-soes-orleans@developpement-
durable.gouv.fr for the attention of Sébastien Colas.
15/03/2011 Phone call with operator of the French Environment Agency. Sébastien Colas
will answer email today after talking with his boss.
15/03/2011 Beginning of further information collection via e-mail by Sébastien Colas (CIS
manager).
15/03/2011 Email to [email protected] asking for remote
interview on 24 or 25 March.
22/03/2011 Email to [email protected] asking for remote
interview on 24 or 25 March and additional documentation.
24/03/2011 New documentation collection via Email by Sébastien Colas. Availability for
phone talk.
14/04/2011 Phone call trial at +33238797806.
14/04/2011 Draft analysis sent to Sébastien Colas.
15/04/2011 Further information about system development and management collected via
mail by Sébastien Colas.
15/04/2011 Phone call with Sébastien Colas. Discussed issues: system management and
implementation.
15/04/2011 In depth analysis completed and sent to Sébastien Colas.
18/04/2011 Comments received by Sébastien Colas.
18/04/2011 In depth analysis completed.
21807-REL-T002.1 Annex 1 – page 9
REDIAM – Environmental Information Network of Andalusia
13/01/2011 Beginning of in-depth analysis from results of the overview assessment.
14/01/2011 Beginning of further information collection via e-mail (mainly by Jose Enrique
Frieyro de Lara).
25/01/2011 Phone talk with Jose Enrique Frieyro de Lara about integration of SIGLA in
REDIAM system, REDIAM actual functionalities and use, next upgrades.
31/01/2011 Meeting c/o Junta de Andalucia, Consejeria de Medio Ambiente (CMA).
Attendants:
Thetis Marco Zanetto;
CMA Jose Ramón Guzmán Álvarez (Belonging to “Dirección
General de gestión del Medio Natural”);
Egmasa Jose Enrique Frieyro de Lara (Technical manager of Coastal
and marine subsystem of REDIAM).
Discussed issues:
information contents;
management arrangements;
use and users of the system;
technology used;
experiences with the implementation;
next functionalities for ICZM to be implemented in the REDIAM.
07/02/2011 Beginning of further information acquisition via e-mail (by Jose Enrique Frieyro
de Lara) about CIS members and new tool for ICZM to be integrated in the
REDIAM.
10/03/2011 Draft in depth analysis completed and sent to Enrique Frieyro.
10/04/2011 In depth analysis completed.
21807-REL-T002.1 Annex 1 – page 10
CRIGE-PACA Spatial Data Infrastucture
21/02/2011 Beginning of in-depth analysis from results of the overview assessment.
21/02/2011 Beginning of further information collection via e-mail by Corine Lochet.
22/02/2011 Email to Corine Lochet for interview arrangement.
25/02/2011 Email from Corine Lochet (meeting arrangement).
28/02/2011 Email to Corine Lochet: proposed 21, 22, 23 March for face to face interview.
02/03/2011 Further information from Corine Lochet by email. Face to face interview ar-
ranged for 21 March.
21/03/2011 Meeting c/o CRIGE.
Attendants:
Thetis Marco Zanetto;
CMRC Romain Buchaut, Clément Mahoudeau;
PACA Region Corine Lochet.
Discussed issues:
operational context: ICZM in France and in PACA region;
experiences with the implementation;
technological solutions;
ICZM related functionalities;
planned upgrades of the system.
05/04/2011 Mail to Romain Buchaut asking for additional information about the new re-
gional geoportal.
06/04/2011 Further information received by Romain Buchaut via email.
08/04/2011 In-depth analysis completed; draft version sent to Corine Lochet, Romain
Buchaut, Clément Mahoudeau.
13/04/2011 Comments and integrations received on common work between PACA region
Maritime affairs office and CRIGE organization.
13/04/2011 In-depth analysis completed.
21807-REL-T002.1 Annex 1 – page 11
Coastal and marine information system of Emilia-Romagna Re-gion
17/01/2011 Beginning of in-depth analysis from results of the overview assessment.
19/01/2011 Phone talk with Luisa Perini (CIS point of contact, Geological, Seismic and
Soil Dept., Emilia Romagna Regional Government) about CIS actual function-
alities and use.
19/01/2011 Beginning of further information collection via e-mail (by Luisa Perini).
03/02/2011 Received book “Il sistema Mare Costa dell'Emilia Romagna” from Luisa Perini.
15/02/2011 Meeting c/o Emilia - Romagna Regional Government, Geological, Seismic and
Soil Survey (Servizio Geologico, Sismico e dei Suoli - SGSS).
Attendants:
Thetis Marco Zanetto,
Angiola Fanelli;
SGSS Luisa Perini (CIS point of contact);
SGSS CIS users;
SGSS CIS developers.
Discussed issues:
origin and initial aim of the system;
CIS development and management;
actual use and users of the system;
experiences with the implementation;
ICZM functionalities;
next upgrades to be implemented.
17/02/2011 Screenshots of the system received by Luisa Perini.
31/03/2011 In depth analysis completed; draft version sent to Luisa Perini.
04/04/2011 Comments and integrations received by Luisa Perini.
04/04/2011 Phone talk with Luisa Perini.
04/04/2011 In depth analysis completed.
21807-REL-T002.1 Annex 1 – page 12
GIS tools of the Information Service of the Venice Water Au-thority
21/03/2011 Beginning of in-depth analysis from result of the overview assessment.
21/03/2011 Beginning of further information collection via phone by Roberto Rosselli.
30/04/2011 Meeting c/o Information Service (SIN) of the Venice Water Authority.
Attendants:
Thetis Claudia Cerasuolo;
SIN Roberto Rosselli.
Discussed issues:
Operational context;
Technological characteristics;
ICZM related functionalities;
System development and management;
Experience with the implementation.
07/04/2011 Meeting c/o Information Service with Claudio Buzzino for consultation of
SIGLA system and CIS of the Veneto Region coast.
14/04/2011 further information received by Gianni Biotto via phone and email.
15/04/2011 In depth analysis completed; draft version sent to Roberto Rosselli.
18/04/2011 comments and integration received / draft version accepted by Roberto Ros-
selli.
18/04/2011 In depth analysis completed.