29 December 2021 Multi-population cohort meta-analysis of ...
15
19 January 2022 Multi-population cohort meta-analysis of human intestinal microbiota in early life reveals the existence of infant community state types (ICSTs) / Mancabelli, L.; Tarracchini, C.; Milani, C.; Lugli, G. A.; Fontana, F.; Turroni, F.; van Sinderen, D.; Ventura, M.. - In: COMPUTATIONAL AND STRUCTURAL BIOTECHNOLOGY JOURNAL. - ISSN 2001- 0370. - 18(2020), pp. 2480-2493. [10.1016/j.csbj.2020.08.028] Original Publisher: Published DOI:10.1016/j.csbj.2020.08.028 Terms of use: (Article begins on next page) Anyone can freely access the full text of works made available as "Open Access". Works made available under a Creative Commons license can be used according to the terms and conditions of said license. Use of all other works requires consent of the right holder (author or publisher) if not exempted from copyright protection by the applicable law. Availability: This version is available at: 11381/2881432 since: 2021-02-16T18:19:02Z Elsevier B.V. This is the peer reviewd version of the followng article: When citing, please refer to the published version. Open Access
-
Upload
khangminh22 -
Category
Documents
-
view
2 -
download
0
Transcript of 29 December 2021 Multi-population cohort meta-analysis of ...

19 January 2022
Multi-population cohort meta-analysis of human intestinal microbiota in early life reveals the existence of infantcommunity state types (ICSTs) / Mancabelli, L.; Tarracchini, C.; Milani, C.; Lugli, G. A.; Fontana, F.; Turroni, F.; vanSinderen, D.; Ventura, M.. - In: COMPUTATIONAL AND STRUCTURAL BIOTECHNOLOGY JOURNAL. - ISSN 2001-0370. - 18(2020), pp. 2480-2493. [10.1016/j.csbj.2020.08.028]
Original
Publisher:
PublishedDOI:10.1016/j.csbj.2020.08.028
Terms of use:
(Article begins on next page)
Anyone can freely access the full text of works made available as "Open Access". Works made available under aCreative Commons license can be used according to the terms and conditions of said license. Use of all other worksrequires consent of the right holder (author or publisher) if not exempted from copyright protection by the applicable law.
Availability:
This version is available at: 11381/2881432 since: 2021-02-16T18:19:02Z
Elsevier B.V.
This is the peer reviewd version of the followng article:
When citing, please refer to the published version.
Open Access

Computational and Structural Biotechnology Journal 18 (2020) 2480–2493
journal homepage: www.elsevier .com/locate /csbj
Multi-population cohort meta-analysis of human intestinal microbiotain early life reveals the existence of infant community state types (ICSTs)
https://doi.org/10.1016/j.csbj.2020.08.0282001-0370/� 2020 The Author(s). Published by Elsevier B.V. on behalf of Research Network of Computational and Structural Biotechnology.This is an open access article under the CC BY license (http://creativecommons.org/licenses/by/4.0/).
⇑ Corresponding author at: Department of Life Sciences, University of Parma,Parco Area delle Scienze 11a, 43124 Parma, Italy.
E-mail address: [email protected] (M. Ventura).
Leonardo Mancabelli a, Chiara Tarracchini a, Christian Milani a, Gabriele Andrea Lugli a, Federico Fontana a,Francesca Turroni a, Douwe van Sinderen b, Marco Ventura a,⇑a Laboratory of Probiogenomics, Department of Chemistry, Life Sciences and Environmental Sustainability, University of Parma, Parma, ItalybAPC Microbiome Institute and School of Microbiology, Bioscience Institute, National University of Ireland, Cork, Ireland
a r t i c l e i n f o
Article history:Received 25 July 2020Received in revised form 26 August 2020Accepted 27 August 2020Available online 15 September 2020
Keywords:Metagenomics16S rRNA profilingCommunity state types
a b s t r a c t
Appropriate development of the intestinal microbiota during infancy is known to be important for humanhealth. In fact, aberrant alterations of the microbial composition during childhood may cause short- and/or long-term negative health effects. Many factors influence the initial assembly and subsequent progres-sion of the gut microbiota of a neonate, such as feeding type, delivery mode, gestational age, maternalmetabolic status and antibiotic exposure.In the current study, the composition of the infant gut core-microbiota was explored, revealing partic-
ular variations of this core-microbiota during the first three years as influenced by delivery mode andfeeding type. A multi-population cohort meta-analysis was performed by selecting 15 publicly availabledatasets pertaining to taxonomic profiles of 1035 fecal samples of healthy infants, as obtained by meansof a 16S rRNA gene-based profiling approach. Interestingly, this multi-population cohort meta-analysisrevealed great microbial complexity and specific taxonomic shifts in children older than six months, sug-gesting a major impact by the introduction of solid foods which prompts progression of infant gut micro-biota towards that typical of adults. The taxonomic data sets employed in this multi-population cohortmeta-analysis possess the statistical robustness to allow the identification of infant community statetypes (ICSTs). Our analysis therefore reveals the existence of specific taxonomic patterns that correspondto particular nutritional and developmental stages of early life, and that had previously been obscured bythe high variability typical of such infant gut microbiota.� 2020 The Author(s). Published by Elsevier B.V. on behalf of Research Network of Computational andStructural Biotechnology. This is an open access article under the CC BY license (http://creativecommons.
org/licenses/by/4.0/).
1. Introduction
The human gastrointestinal tract is colonized by billions ofmicroorganisms, which are commonly referred to as the gut micro-biota, and which plays a major role in maintaining host health byinfluencing and modulating nutritional, metabolic, immunologicaland physiological functionalities [1]. Consequently, initial gut col-onization events and associated development of the gut microbiotain early (human) life is believed to elicit both temporary as well aslong-lasting health effects, and to play a key role in defining hosthealth status [2].
The early gut microbiota of healthy infants is characterized bylow biodiversity and predominance of genera belonging to theActinobacteria and Proteobacteria phyla, such as Escherichia,
Citrobacter and Bifidobacterium, being influenced by several factorssuch as mode of delivery, diet and gestational age [1,3]. With pro-gressive age, the microbiota becomes more complex and bacteriabelonging to Lachnospiraceae, Ruminococcaceae, Bacteroidaceae,Prevotellaceae, and Rikenellaceae families become the dominanttaxa [4].
The delivery mode plays an important role in the establishmentof the initial gut microbiota composition. In fact, comparisonbetween natural and caesarean section (C-section) deliveredinfants has revealed several differences in their gut microbial pop-ulation. In detail, the early gut microbiota of vaginally deliveredinfants has a composition enriched in vagina-associated microbessuch as Lactobacillus and Prevotella [5,6], while that of C-sectiondelivered infants was shown to have reduced biodiversity, beingcharacterized by the presence of environmental microorganismsthat probably originate from maternal skin and hospital environ-ment [7,8].

L. Mancabelli et al. Computational and Structural Biotechnology Journal 18 (2020) 2480–2493
The strong correlation between diet and development of theinfant gut microbiota has been highlighted in several studies[9,10]. Compared to formula-fed infants, breastfed infants havebeen shown to possess higher levels of bifidobacteria and lacto-bacilli [11], along with a lower abundance of the Bacteroides genusand potential pathogens belonging to clostridia, enterobacteria,enterococci and staphylococci [1].
The current study describes a multi-population cohort meta-analysis designed to evaluate the evolution of the infant micro-biota composition during the early stages of life and its possiblevariations due to mode of delivery and diet. In particular, in orderto define the composition of the infant core-microbiota from deliv-ery up to the age of 3 years, we analyzed data based on a total of1035 faecal samples of full-term, healthy infants. For this purpose,we selected 15 public datasets [12–26] obtained through 16S rRNAgene-based microbiota profiling, encompassing infants of an agethat ranged between a few days to 3 years. Furthermore, we inves-tigated variations of the infant gut microbiota based on the type ofdelivery and feeding of the newborn.
In contrast to the large part of the previously published meta-analyses regarding the human gut microbiota [27–32], in our studywe applied specific procedures aimed to minimize biases due tocross-study comparisons and maximize statistical accuracy. Indetail, we selected metagenomic datasets that rely the samesequencing methodology and that are based on PCR primers withhigh taxonomic coverage. In this context, the taxonomic resolutionof the different regions covered by the primer pairs included in thisstudy was validated to ensure efficient comparison of the results.Furthermore, the raw data were re-analyzed using the same bioin-formatics pipeline. Thus, our meta-analysis represents a relevantstep-forward respect to currently available scientific literature,thereby allowing an in depth assessment of the microbial taxo-nomic patterns characterizing the gut microbiota developmentduring infancy, and revealing the existence of distinct microbialassemblies named infant community state types (ICSTs).
2. Materials and methods
2.1. Database selection
In this meta-analysis, we obtained 1035 publicly available datasets from 15 studies involving the determination of the infant gutmicrobiota. In order to obtain high quality and coverage data, weselected 16S rRNA profiling datasets based on Illumina sequencingtechnology. The studies employed various primer pairs. In detail,we selected 16S rRNA microbial profiling datasets including onlyfaecal samples from healthy infants with an age ranging betweena few days to 3 years. No exclusions were made in the selectedcohorts based on the mode of delivery and diet.
2.2. Evaluation of primer pair efficiency
The performance of the 11 primer pairs employed in theselected datasets was evaluated through the web-tool TestPrime1.0 [33]. The latter executes an in silico PCR based on the SILVAdatabase and provides the percentage of amplified sequences foreach bacterial group at genus level [33]. The TestPrime was basedon RefRN SILVA Database ssu-138 and a maximum of three mis-matches was allowed [34].
2.3. 16S rRNA profiling analysis
To avoid biases caused by different bioinformatic analysispipelines, the sequence read pools of each dataset were filteredand analyzed through the same custom script based on the QIIME
2481
2 software suite [35,36]. Quality control maintained sequenceswith a length between 140 and 400 bp and average sequence qual-ity score of >20, while sequences with homopolymers of >7 bp andmismatched primers were omitted. 16S rRNA Operational Taxo-nomic Units (OTUs) were defined at 100% sequence homologyusing DADA2 [37] and OTUs that were represented by just a singlesequence were removed. All reads were classified to the lowestpossible taxonomic rank using QIIME 2 [35,36] and a referencedataset from the SILVA database v.132 [38]. In order to evaluatethe bacterial biodiversity, alpha-diversity was assessed based onGood’s coverage, Observed out, Chao1 and Shannon indexes andrepresented by box-and-whisker plots. Moreover, the Bray-Curtisdissimilarity index was used to estimate the beta-diversitybetween different age groups, delivery mode and diet. Dissimilar-ities were represented through a 3-Dimensional Principal Coordi-nate Analysis (PCoA).
2.4. Statistical analysis
QIIME 2 and SPSS software (www.ibm.com/software/it/analyt-ics/spss/) were used to compute statistical analyses. PERMANOVAanalyses were performed using 1000 permutations to estimate p-values for differences among populations in PCoA analyses. Fur-thermore, differential abundance of bacterial genera and alpha-diversity was tested by ANOVA analysis. Moreover, we also calcu-lated the post hoc analysis LSD (least significant difference) formultiple comparison.
2.5. Infant community state type (ICST) prediction
The hierarchical clustering (HCL) of samples was obtained usingbacterial composition at genus level and was calculated throughTMeV 4.8.1 software using Pearson correlation as a distance metricbased on information at genus level. The data obtained was repre-sented by a cladogram.
3. Results and discussion
3.1. Selection of public datasets
The multi-population cohort meta-analysis performed in thisstudy encompasses data sets corresponding to a total of 1035 fae-cal samples from healthy, full-term infants ranging from a fewhours after birth to 3 years of age (Table 1 and Table S1). These16S rRNA profiling datasets were selected so as to obtain a highsample number and reach corresponding robust statistical power,in accordance to previous studies [28,29,39]. In detail, we per-formed an in depth literature search for 16S rRNA profiling data-sets based on Illumina sequencing technology, allowing us toretrieve microbiota data from 15 publicly available datasets cover-ing 15 different countries (Table S1). Based on age at sampling, thedatasets were subdivided into four macro-groups, i.e. 0–1 M group(<1 month of age), 1–6 M group (between 1 and 6 months of age),6–12 M group (between 6 and 12 months of age) and 12–36 Mgroup (between 1 and 3 years of age) (Table S1). This subdivisionwas made on the reported assumption that the infant gut micro-biota is variable in composition and constantly evolving duringthe first three years after birth [40].
3.2. Homogeneity of the samples
16S rRNA gene-based microbiota profiling is the most com-monly employed approach to perform gut microbiota profiling.This approach has many advantages, i.e. low cost, high sensitivityand specificity in the identification of bacterial taxonomy and

Table 1Metadata of samples included in the meta-analysis.
Study(PMID)
Bioproject Number ofsamples
Age (days)(mean ± st.dev)
Age (months)(mean ± st.dev)
Nation Settlement Socioeconomicstatus
Technology Primerregion
24896187 PRJEB5482 190 258 ± 233 8 ± 8 Bangladesh Urban slum lowsocioeconomicstatus
Illumina MiSeq V1-V2
27160322 PRJNA318053 15 442 ± 262 15 ± 9 Ireland Urban area – Illumina_MiSeq V4–V527306664 PRJEB14529 225 246 ± 207 8 ± 7 USA Urban area – Illumina MiSeq V427717398 PRJNA331150 50 322 ± 104 11 ± 3 USA Urban area – Illumina MiSeq V428079170 PRJEB15633 18 115 ± 34 4 ± 1 Gambia Urban area – Illumina_MiSeq V428095889 PRJNA339264 167 8 ± 38 0 ± 0 Ireland Urban area – Illumina MiSeq V4–V528733284 PRJNA377056 9 383 ± 3 12 ± 0 Italy Urban area middle
socioeconomicstatus
Illumina_MiSeq V3-V4
28789705 PRJNA362530 10 28 ± 6 1 ± 0 Spain Urban area – Illumina_MiSeq V328877893 PRJEB21196 64 118 ± 51 4 ± 2 Germany Urban area – Illumina_MiSeq V3-V429184093 PRJNA403824 47 25 ± 31 1 ± 1 Canada Urban area – Illumina MiSeq V329217369 PRJEB21946 44 70 ± 0 2 ± 0 India Densely
populated Urbanarea
– Illumina MiSeq V4
29795809 PRJEB11419 127 646 ± 266 22 ± 9 USAThailandUnitedKingdomAustraliaIrelandNorwaySlovakiaCanada
Urban area – Illumina MiSeq V4
29884786 PRJNA450946PRJNA450998PRJNA451090PRJNA451108PRJNA451156PRJNA451314PRJNA451320PRJNA451359PRJNA451398PRJNA451432PRJNA453125PRJNA451346
24 186 ± 182 6 ± 6 Norway Urban area – Illumina HiSeq2500
V4
30131575 PRJNA350676 20 387 ± 0 13 ± 0 Italy Urban area – Illumina MiSeq V3-V430579350 PRJNA491825 25 806 ± 215 27 ± 7 Denmark Urban area – Illumina MiSeq V3-V4
L. Mancabelli et al. Computational and Structural Biotechnology Journal 18 (2020) 2480–2493
availability of user-friendly bioinformatic pipelines, all of whichhave promoted its wide-spread application. Despite these advan-tages, there is extensive methodological variability, with subse-quent output biases that may preclude consistent andmeaningful comparisons between datasets obtained from differentstudies [41]. In particular, one of the main reasons for variableresults is that different studies have employed different PCR pri-mer pairs to amplify hypervariable region(s) of the 16S rRNA gene[41]. In order to evaluate the accuracy of the 11 primer pairsemployed in the selected datasets (Table S2), we tested the primerpairs through the web-tool TestPrime 1.0 [33,42]. TestPrime allowsevaluation of the performance of a given primer pair by running anin silico PCR on the SILVA databases. Notably, this analysis showedrather similar amplification performances suggesting homogeneityof the selected datasets (Table S2). In particular, all tested primersshowed an in silico efficiency of >95% in their ability to amplify thetargeted 16S rRNA gene sequences (Table S2). While in vitro valida-tion may provide additional evidences, these findings suggest theabsence of any major bias in sequencing data generation. In orderto confirm this result, we generated artificial communities consti-tuted by genomes of species representative of the bacterial com-munities typically found in adult and infant feces (Table S3 andTable S4) [43]. These artificial communities were exploited to
2482
obtain PCR amplicons of the primer pairs included in this studyand the data sets were processed using the bioinformatics pipelinebased on the QIIME 2 software suite, as reported in material andmethods section. Remarkably, the results obtained revealed thatthe profiles generated by the PCR primers pairs included in thisstudy are comparable at the genus level, while, as expected, mis-classifications may be observed at species level (Table S3 andTable S4). Thus, highlighting the homogeneity in microbial taxo-nomic efficiency/accuracy of the PCR primer pairs included in thisgenus-level meta-analysis. In addition, an identical bioinformaticspipeline based on the QIIME 2 software suite was employed for re-analysis of all the samples in order to allow a reliable and robustcross-meta-analysis of all datasets produced by these differentresearch projects.
3.3. Meta-analysis of full-term infants’ microbiota over time
A total of 1035 publicly available datasets from 15 cohorts cor-responding to faecal samples of full-term infants were retrieved.These combined cohorts were then divided in 285, 271, 215 and264 samples belonging to the 0–1 M, 1–6 M, 6–12 M and 12–36 M groups, respectively (Table S1). Quality filtering resulted ina total of 40,014,085 reads with an average of 38,661 ± 48,855

Fig. 1. Exploration of the diversity and bacterial composition of healthy, full-term infant faecal samples over time. Panel a shows the box and whisker plot of the alpha-diversity calculated through Observed OTU index of the four age groups. The bottom and top of the box represent the first and third quartiles, and the band inside the box isthe median. Moreover, the ends of the whiskers represent the minimum and maximum of all data of the sample. Panel b reports the principal coordinate analysis (PCoA) ofthe collected infant samples of the four age groups. Panel c displays the bacteria belonging to core- and accessory-microbiota of each age group. The genera belonging to thecore are highlighted with a green outline. (For interpretation of the references to colour in this figure legend, the reader is referred to the web version of this article.)
L. Mancabelli et al. Computational and Structural Biotechnology Journal 18 (2020) 2480–2493
2483
L. Mancabelli et al. Computational and Structural Biotechnology Journal 18 (2020) 2480–2493
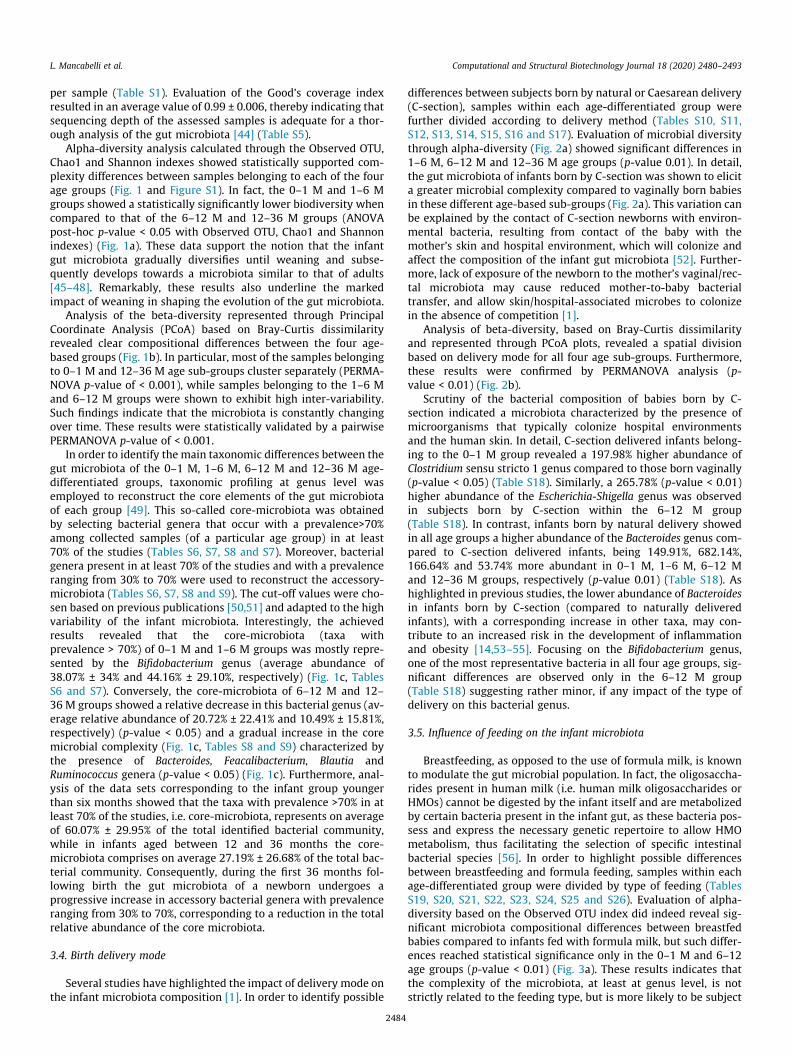
per sample (Table S1). Evaluation of the Good’s coverage indexresulted in an average value of 0.99 ± 0.006, thereby indicating thatsequencing depth of the assessed samples is adequate for a thor-ough analysis of the gut microbiota [44] (Table S5).
Alpha-diversity analysis calculated through the Observed OTU,Chao1 and Shannon indexes showed statistically supported com-plexity differences between samples belonging to each of the fourage groups (Fig. 1 and Figure S1). In fact, the 0–1 M and 1–6 Mgroups showed a statistically significantly lower biodiversity whencompared to that of the 6–12 M and 12–36 M groups (ANOVApost-hoc p-value < 0.05 with Observed OTU, Chao1 and Shannonindexes) (Fig. 1a). These data support the notion that the infantgut microbiota gradually diversifies until weaning and subse-quently develops towards a microbiota similar to that of adults[45–48]. Remarkably, these results also underline the markedimpact of weaning in shaping the evolution of the gut microbiota.
Analysis of the beta-diversity represented through PrincipalCoordinate Analysis (PCoA) based on Bray-Curtis dissimilarityrevealed clear compositional differences between the four age-based groups (Fig. 1b). In particular, most of the samples belongingto 0–1 M and 12–36 M age sub-groups cluster separately (PERMA-NOVA p-value of < 0.001), while samples belonging to the 1–6 Mand 6–12 M groups were shown to exhibit high inter-variability.Such findings indicate that the microbiota is constantly changingover time. These results were statistically validated by a pairwisePERMANOVA p-value of < 0.001.
In order to identify the main taxonomic differences between thegut microbiota of the 0–1 M, 1–6 M, 6–12 M and 12–36 M age-differentiated groups, taxonomic profiling at genus level wasemployed to reconstruct the core elements of the gut microbiotaof each group [49]. This so-called core-microbiota was obtainedby selecting bacterial genera that occur with a prevalence>70%among collected samples (of a particular age group) in at least70% of the studies (Tables S6, S7, S8 and S7). Moreover, bacterialgenera present in at least 70% of the studies and with a prevalenceranging from 30% to 70% were used to reconstruct the accessory-microbiota (Tables S6, S7, S8 and S9). The cut-off values were cho-sen based on previous publications [50,51] and adapted to the highvariability of the infant microbiota. Interestingly, the achievedresults revealed that the core-microbiota (taxa withprevalence > 70%) of 0–1 M and 1–6 M groups was mostly repre-sented by the Bifidobacterium genus (average abundance of38.07% ± 34% and 44.16% ± 29.10%, respectively) (Fig. 1c, TablesS6 and S7). Conversely, the core-microbiota of 6–12 M and 12–36 M groups showed a relative decrease in this bacterial genus (av-erage relative abundance of 20.72% ± 22.41% and 10.49% ± 15.81%,respectively) (p-value < 0.05) and a gradual increase in the coremicrobial complexity (Fig. 1c, Tables S8 and S9) characterized bythe presence of Bacteroides, Feacalibacterium, Blautia andRuminococcus genera (p-value < 0.05) (Fig. 1c). Furthermore, anal-ysis of the data sets corresponding to the infant group youngerthan six months showed that the taxa with prevalence >70% in atleast 70% of the studies, i.e. core-microbiota, represents on averageof 60.07% ± 29.95% of the total identified bacterial community,while in infants aged between 12 and 36 months the core-microbiota comprises on average 27.19% ± 26.68% of the total bac-terial community. Consequently, during the first 36 months fol-lowing birth the gut microbiota of a newborn undergoes aprogressive increase in accessory bacterial genera with prevalenceranging from 30% to 70%, corresponding to a reduction in the totalrelative abundance of the core microbiota.
3.4. Birth delivery mode
Several studies have highlighted the impact of delivery mode onthe infant microbiota composition [1]. In order to identify possible
2484
differences between subjects born by natural or Caesarean delivery(C-section), samples within each age-differentiated group werefurther divided according to delivery method (Tables S10, S11,S12, S13, S14, S15, S16 and S17). Evaluation of microbial diversitythrough alpha-diversity (Fig. 2a) showed significant differences in1–6 M, 6–12 M and 12–36 M age groups (p-value 0.01). In detail,the gut microbiota of infants born by C-section was shown to elicita greater microbial complexity compared to vaginally born babiesin these different age-based sub-groups (Fig. 2a). This variation canbe explained by the contact of C-section newborns with environ-mental bacteria, resulting from contact of the baby with themother’s skin and hospital environment, which will colonize andaffect the composition of the infant gut microbiota [52]. Further-more, lack of exposure of the newborn to the mother’s vaginal/rec-tal microbiota may cause reduced mother-to-baby bacterialtransfer, and allow skin/hospital-associated microbes to colonizein the absence of competition [1].
Analysis of beta-diversity, based on Bray-Curtis dissimilarityand represented through PCoA plots, revealed a spatial divisionbased on delivery mode for all four age sub-groups. Furthermore,these results were confirmed by PERMANOVA analysis (p-value < 0.01) (Fig. 2b).
Scrutiny of the bacterial composition of babies born by C-section indicated a microbiota characterized by the presence ofmicroorganisms that typically colonize hospital environmentsand the human skin. In detail, C-section delivered infants belong-ing to the 0–1 M group revealed a 197.98% higher abundance ofClostridium sensu stricto 1 genus compared to those born vaginally(p-value < 0.05) (Table S18). Similarly, a 265.78% (p-value < 0.01)higher abundance of the Escherichia-Shigella genus was observedin subjects born by C-section within the 6–12 M group(Table S18). In contrast, infants born by natural delivery showedin all age groups a higher abundance of the Bacteroides genus com-pared to C-section delivered infants, being 149.91%, 682.14%,166.64% and 53.74% more abundant in 0–1 M, 1–6 M, 6–12 Mand 12–36 M groups, respectively (p-value 0.01) (Table S18). Ashighlighted in previous studies, the lower abundance of Bacteroidesin infants born by C-section (compared to naturally deliveredinfants), with a corresponding increase in other taxa, may con-tribute to an increased risk in the development of inflammationand obesity [14,53–55]. Focusing on the Bifidobacterium genus,one of the most representative bacteria in all four age groups, sig-nificant differences are observed only in the 6–12 M group(Table S18) suggesting rather minor, if any impact of the type ofdelivery on this bacterial genus.
3.5. Influence of feeding on the infant microbiota
Breastfeeding, as opposed to the use of formula milk, is knownto modulate the gut microbial population. In fact, the oligosaccha-rides present in human milk (i.e. human milk oligosaccharides orHMOs) cannot be digested by the infant itself and are metabolizedby certain bacteria present in the infant gut, as these bacteria pos-sess and express the necessary genetic repertoire to allow HMOmetabolism, thus facilitating the selection of specific intestinalbacterial species [56]. In order to highlight possible differencesbetween breastfeeding and formula feeding, samples within eachage-differentiated group were divided by type of feeding (TablesS19, S20, S21, S22, S23, S24, S25 and S26). Evaluation of alpha-diversity based on the Observed OTU index did indeed reveal sig-nificant microbiota compositional differences between breastfedbabies compared to infants fed with formula milk, but such differ-ences reached statistical significance only in the 0–1 M and 6–12age groups (p-value < 0.01) (Fig. 3a). These results indicates thatthe complexity of the microbiota, at least at genus level, is notstrictly related to the feeding type, but is more likely to be subject

Fig. 2. Evaluation of the diversity and bacterial composition of healthy, full-term infant faecal samples as based on birth delivery mode. Panel a indicates the box and whiskerplot of the infant alpha-diversity calculated through Observed OTU index based on birth delivery methods. The bottom and top of the box represent the first and thirdquartiles, and the band inside the box is the median. Moreover, the ends of the whiskers represent the minimum and maximum of all data of the sample. Panel b reports theprincipal coordinate analysis (PCoA) of the collected infant samples, respectively, subdivided by age and birth delivery mode. Panel c displays the bacteria belonging to core-and accessory-microbiota of each delivery mode groups. The genera belonging to the core are highlighted with a green outline. (For interpretation of the references to colourin this figure legend, the reader is referred to the web version of this article.)
L. Mancabelli et al. Computational and Structural Biotechnology Journal 18 (2020) 2480–2493
2485

Fig. 3. Examination of the diversity and bacterial composition of healthy, full-term infant faecal samples based on type of feeding. Panel a shows the box and whisker plot ofthe infant alpha-diversity calculated through Observed OTU index based on type of feeding. The bottom and top of the box represent the first and third quartiles, and the bandinside the box is the median. Moreover, the ends of the whiskers represent the minimum and maximum of all the data of the sample. Panel b reports the principal coordinateanalysis (PCoA) of the collected infant samples, respectively subdivided by age and type of feeding. Panel c displays the bacteria belonging to core- and accessory-microbiotaof each age group. The genera belonging to the core are highlighted with a green outline. (For interpretation of the references to colour in this figure legend, the reader isreferred to the web version of this article.)
L. Mancabelli et al. Computational and Structural Biotechnology Journal 18 (2020) 2480–2493
2486

L. Mancabelli et al. Computational and Structural Biotechnology Journal 18 (2020) 2480–2493
to major changes by the transition to a semi-solid/solid diet thattypically occurs at an average age of 6 months [57,58]. Biodiversityanalysis revealed significant differences between the breastfedbabies compared to infants fed with formula milk in the four dis-tinct age groups (PERMANOVA < 0.05) (Fig. 3b).
In order to identify possible differences in gut microbiota com-position between breastfed and formula-fed infants for the fourdefined age-based macro-groups, the taxonomic changes at genuslevel were analyzed. This analysis showed that breastfed childrenpossess higher levels of the Bifidobacterium genus in their gutmicrobiota when compared to age-matched children fed with for-mulated milk, with significant differences in all age groups (p-value < 0.01) (Table S27). Furthermore, the Escherichia-Shigellagenus showed an average relative abundance of 13.38% ± 22.85%in breastfed infants of 0–1 M group, while subjects fed with for-mula milk revealed an average relative abundance of 35.25% ±37.32% (p-value < 0.01). Additionally, significant differences havebeen highlighted for the genus Bacteroides, which showed the high-est levels of relative abundance in the babies fed with formulamilk. In detail, comparisons between breastfed and formula-fedinfants showed a significant absolute difference (p-value < 0.01)of 19.22%, 21.26% and 16.83% in 1–6 M, 6–12 M and 12–36 Mgroups, respectively. These results show that the gut microbiotaof breastfed infants when compared to that of infants nourishedwith formula milk possess a higher relative abundance of Bifi-dobacterium [59], confirming the importance of breast milk intakein modulating the gut microbiota during the early stages of lifetoward presumed health-promoting microbial taxa [60].
3.6. Identification of ICSTs
In 2011 Arumugam et al. [48] proposed that the gut microbiotaof adults can be stratified into three distinct clusters driven by dis-criminative genera. These three clusters, also called enterotypes,include Bacteroides (enterotype 1), Prevotella (enterotype 2), andRuminococcus (enterotype 3) [48]. Furthermore, a recent study per-formed an analysis of the enterotypes of children at school-goingage by identifying three distinct clusters, dominated by Bacteroides,Prevotella, and Bifidobacterium, respectively [61]. Moreover, a lon-gitudinal study on neonatal gut suggested the possible existenceof community state types (CSTs) characterized by the presence ofEnterobacteriaceae, Veillonella, Ruminococcus, Streptococcus, Prevo-tella, Bacteroides, and Bifidobacterium [62]. Consequently, despitethe extreme dynamism of the infant gut microbiota that had previ-ously prevented identification of taxonomic patterns and cluster-discriminative genera, we exploited the statistical robustnessoffered by our extensive meta-analysis to investigate the possibleexistence of infant community state types (ICSTs) that correspondto the early stages of life. In this context, the distinctly highermicrobial gut community complexity of infants aged between 12and 36 months when compared to that of children less than sixmonths old (see meta-analysis discussed above), prompted us todivide the samples into two macro groups, i.e. a 0–6 M group (<6months) and a 6–36 M group (>6 months). Interestingly, thesetwo macro groups seem to correspond to the division betweenpre- and post-weaning infants indicated by the guidelines of theWorld Health Organization (WHO) [58] and reported in previousstudies [57].
Screening for ICSTs present in these two groups was performedby cluster analysis through hierarchical clustering (HCL) (Fig. 4aand 5a) and 3D Bray Curtis PCoA (Fig. 4b and 5b) of the collectedsamples as based on their 16S rRNA gene-derived microbial pro-files (Tables S28 and S29). Each statistically supported clusterhad to be represented by at least 10 samples to be considered asa putative ICST. Moreover, the representative taxa of each pro-posed ICST had to be present at an average abundance and preva-
2487
lence higher than 15% and 90%, respectively (Fig. 4c). Results wereverified by PCoA analyses followed by statistical validation throughPERMANOVA (p-value < 0.05).
Analysis of the 0–6 M samples allowed us to identify five maininfant community state types (0–6 M-ICST-Clostr, -Strept, -Bif, -Eschand -Kleb) (Fig. 4), while samples from the 6–36 M macro-grouprevealed seven main ICSTs (6–36 M-ICST-Bharg, -Odor, -Prev, -Esch,-Bif, -Faec and -Bact) (Fig. 4). Interestingly, the high number ofdetected ICSTs is presumed to reflect the high variability and dyna-mism of the microbiota at the early stages of life [63]. Particularly,the 0–6 M-ICSTs were shown to be dominated by the Bifidobac-terium genus (0–6 M-ICST-Bif), which is present with an abundanceaverage higher than 15% in 70% of the samples (Fig. 4a). In detail,174 samples of this bifidobacteria-dominated ICST (0–6 M-ICST-Bif) contained high levels of members of the Bifidobacterium genus(0–6 M-ICST-Bif1, bifidobacterial average abundance of 76.98%),while the 224 remaining samples were characterized by the com-bination of Bifidobacterium genus with other bacterial taxa (0–6 M-ICST-Bif2, -Bif3, -Bif4, -Bif5, -Bif6 and -Bif7) (Fig. 4a). Conversely, the6–36 M groups showed a decrease in community state types char-acterized by the presence of the genus Bifidobacterium (6–36 M-ICST-Bif main community state types encompassing 24.84% of thesamples) and an increase of ICSTs characterized by the genus Bac-teroides (6–36 M-ICST-Bact main community state types encom-passing 37.16% of the samples) (Fig. 5a). The community statetype characterized by the dominance of the Bacteroides genus (6–36 M-ICST-Bact1) and ICSTs dominated by typical adult bacterialgenera, such as Feacalibacterium (6–36 M-ICST-Faec), highlightthe shift of the infant’s microbiota towards a bacterial communitysimilar to that of adults.
Previous studies have reported that ethnicity in the early stagesof life plays a major role in the evolution of the gut microbiota [64–66]. Since the metadata accompanying the 16S rRNA microbialprofiling data used in this study do not provide any detail aboutethnicities, we decided to investigate possible correlationsbetween the metagenomic data and the geographical origins ofthe samples. Analysis of the 0–6 M samples revealed that mostnations are characterized by high prevalence of 0–6 M-ICST-Bif(prevalence in each nation >30%) except for the Spanish samplesthat seem most represented by 0–6 M-ICST-Esch (Table 2). Con-versely, samples from the 6–36 M macro-group showed hetero-geneity in the distribution of ICSTs. In detail, Danish, German,Norwegian and US samples seem to be characterized by highprevalence of 6–36 M-ICST-Bact (>30%), while Italian and Englishsamples showed prevalence >30% of 6–36 M-ICST-Bif1 and 6–36 M-ICST-Odor, respectively (Table 3). These results seem tounderline a possible correlation between geographical origin andinfant gut microbiota composition, especially in samples olderthan 6 months probably due to the transition to a solid diet. Aspecific study regarding geographical origin, race and socioeco-nomic status categories of infants could provide a much sharperview of their role in the maturation of the gut microbiome.
In addition, we evaluated co-variance between the bacterialgenera with a total average abundance of > 0.5%. In detail, co-variance analysis based on 0–6 M group samples (Table S30)revealed that the Bifidobacterium genus negatively correlates withmost other taxa that dominate in non-bifidobacterial ICSTs, suchas Clostridium sensu stricto 1 (0–6 M-ICST-Clostr), Streptococcus(0–6 M-ICST-Strept), Escherichia-Shigella (0–6 M-ICST-Esch) andKlebsiella (0–6 M-ICST-Kleb). Similarly, analysis of samples corre-sponding to 6–36 M infants showed a negative correlationbetween the Bifidobacterium and Bacteroides genera, which consti-tute the most representative community state types, yet revealed apositively correlation between typical adult taxa, such as Bac-teroides, Faecalibacterium and Alistipes (Table S31). These resultssupport the notion that during infancy Bifidobacterium represents

Fig. 4. Identification of 0–6 M group infant ICSTs. Panel a shows a circular cladogram of the samples belonging to the 0–6 M group, obtained by means of hierarchicalclustering (HCL) analysis. Panel b reports the principal coordinate analysis (PCoA) of the 0–6 M infant samples, subdivided by ICST. Panel c displays the average abundanceand prevalence of bacteria that correspond to an identified ICST. Values that represent the ICSTs cut-off are highlighted in green. (For interpretation of the references to colourin this figure legend, the reader is referred to the web version of this article.)
L. Mancabelli et al. Computational and Structural Biotechnology Journal 18 (2020) 2480–2493
2488

L. Mancabelli et al. Computational and Structural Biotechnology Journal 18 (2020) 2480–2493
2489

Table 3Assessment of distribution of 6–36 M-ICSTs in nations included in the study. 6–36 M-ICSTs with a presence greater than 30% are highlighted ingreen.
Bangladesh
(N=97) Canada (N=47)
Gambia (N=18)
Germany (N=49)
India (N=44)
Ireland (N=170)
Norway (N=12)
Spain (N=10)
USA (N=109)
0-6M-ICST-Clostr 1% 9% - 6% 5% 22% 17% - 6%
0-6M-ICST-Strept 5% 4% - - 5% 1% - - 1%
0-6M-ICST-Bif1 20% 38% 72% 49% 27% 38% 8% 20% 7%
0-6M-ICST-Bif2 8% 6% 22% - 25% 1% - - 1%
0-6M-ICST-Bif3 - 6% - 20% 5% 16% 67% 20% 50%
0-6M-ICST-Bif4 11% - - - - - - - -
0-6M-ICST-Bif5 30% - - - - - - - -
0-6M-ICST-Bif6 - - - 4% - 4% - - 2%
0-6M-ICST-Bif7 11% 15% 6% 8% 30% 7% - 20% 7%
0-6M-ICST-Esch 9% 13% - 6% 2% 4% - 30% 17%
0-6M-ICST-Kleb 4% 2% - 4% 2% 4% 8% - 6%
Others - 6% - 2% - 4% - 10% 5%
Table 2Evaluation of distribution of 0–6 M-ICSTs in nations included in the study. 0–6 M-ICSTs with a presence greater than 30% are highlighted ingreen.
Bangladesh
(N=97) Canada (N=47)
Gambia (N=18)
Germany (N=49)
India (N=44)
Ireland (N=170)
Norway (N=12)
Spain (N=10)
USA (N=109)
0-6M-ICST-Clostr 1% 9% - 6% 5% 22% 17% - 6%
0-6M-ICST-Strept 5% 4% - - 5% 1% - - 1%
0-6M-ICST-Bif1 20% 38% 72% 49% 27% 38% 8% 20% 7%
0-6M-ICST-Bif2 8% 6% 22% - 25% 1% - - 1%
0-6M-ICST-Bif3 - 6% - 20% 5% 16% 67% 20% 50%
0-6M-ICST-Bif4 11% - - - - - - - -
0-6M-ICST-Bif5 30% - - - - - - - -
0-6M-ICST-Bif6 - - - 4% - 4% - - 2%
0-6M-ICST-Bif7 11% 15% 6% 8% 30% 7% - 20% 7%
0-6M-ICST-Esch 9% 13% - 6% 2% 4% - 30% 17%
0-6M-ICST-Kleb 4% 2% - 4% 2% 4% 8% - 6%
Others - 6% - 2% - 4% - 10% 5%
L. Mancabelli et al. Computational and Structural Biotechnology Journal 18 (2020) 2480–2493
the most dominant genus and is replaced during weaning by bac-teria typical of an adult microbiota.
3.7. Evaluation of ICSTs corresponding to delivery mode and feedingtype
The infant microbiota composition appears to be predominantlyinfluenced by the delivery mode and feeding type (see above). Wetherefore decided to evaluate if and how ICSTs may be modulatedby these two factors. This analysis as based on 0–6 M group sam-ples showed that infants born by vaginal delivery were mainly rep-
Fig. 5. Identification of infant ICSTs based on the microbiota of faecal samples associatbelonging to the 6–36 M group, based on hierarchical clustering (HCL) analysis. Panel b sICSTs. Panel c reports the average abundance and prevalence of the bacteria that correspogreen. (For interpretation of the references to colour in this figure legend, the reader is
3
2490
resented by the 0–6 M-ICST-Bif1 (31.16% of the total samples) and0–6 M-ICST-Bif3 (33.70% of the total samples) community statetypes , which are dominated by the Bifidobacterium genus (Table 4).Similarly, samples from babies born by C-section stratified withinthe bifidobacterial community state type 0–6 M-CST-Bif1 (33.63%of the total samples), yet were also assigned to the communitystate type 0–6 M-ICST-Clostr (29.20% of the total samples) weredominated by the environmental Clostridium sensu stricto 1(Table 4). Interestingly, samples from infants born by natural deliv-ery and belonging to the 6–36 M group were shown to be fre-quently assigned to the Bacteroides community state types 6–
ed with the 6–36 M group. Panel a illustrates a circular cladogram of the sampleshows the principal coordinate analysis (PCoA) of the 6–36 M samples, subdivided bynd to an identified ICST. The values that represent the ICST cut-off are highlighted inreferred to the web version of this article.)
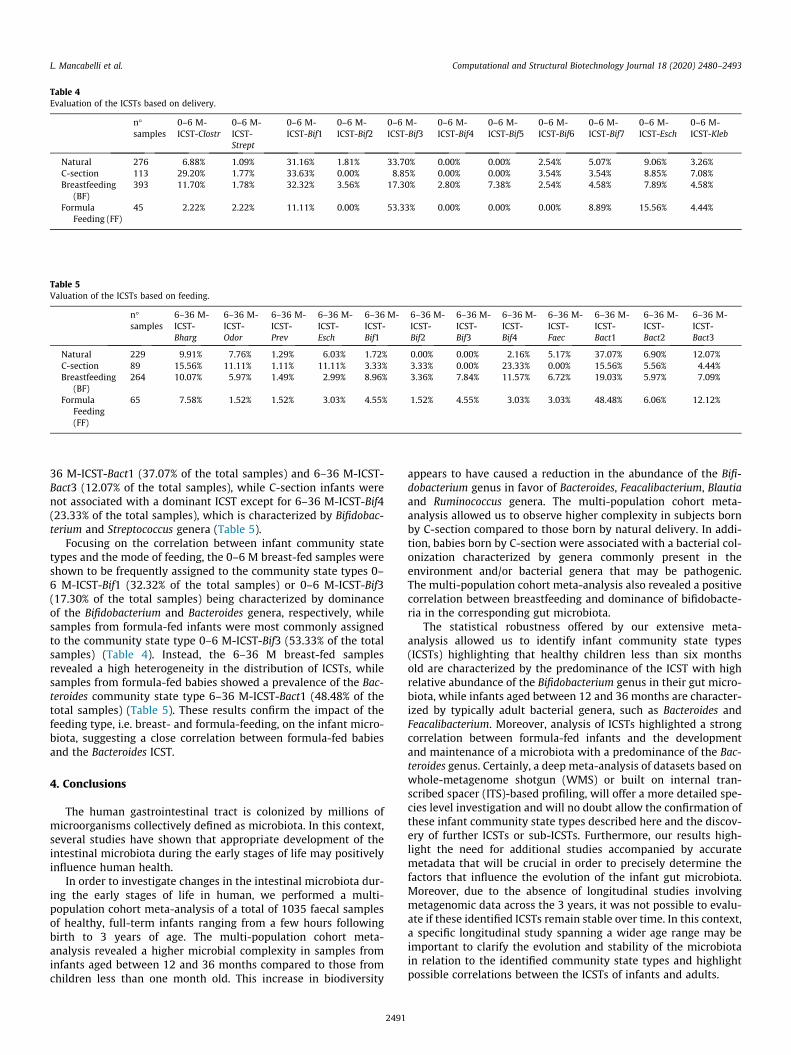
Table 5Valuation of the ICSTs based on feeding.
n�samples
6–36 M-ICST-Bharg
6–36 M-ICST-Odor
6–36 M-ICST-Prev
6–36 M-ICST-Esch
6–36 M-ICST-Bif1
6–36 M-ICST-Bif2
6–36 M-ICST-Bif3
6–36 M-ICST-Bif4
6–36 M-ICST-Faec
6–36 M-ICST-Bact1
6–36 M-ICST-Bact2
6–36 M-ICST-Bact3
Natural 229 9.91% 7.76% 1.29% 6.03% 1.72% 0.00% 0.00% 2.16% 5.17% 37.07% 6.90% 12.07%C-section 89 15.56% 11.11% 1.11% 11.11% 3.33% 3.33% 0.00% 23.33% 0.00% 15.56% 5.56% 4.44%Breastfeeding
(BF)264 10.07% 5.97% 1.49% 2.99% 8.96% 3.36% 7.84% 11.57% 6.72% 19.03% 5.97% 7.09%
FormulaFeeding(FF)
65 7.58% 1.52% 1.52% 3.03% 4.55% 1.52% 4.55% 3.03% 3.03% 48.48% 6.06% 12.12%
Table 4Evaluation of the ICSTs based on delivery.
n�samples
0–6 M-ICST-Clostr
0–6 M-ICST-Strept
0–6 M-ICST-Bif1
0–6 M-ICST-Bif2
0–6 M-ICST-Bif3
0–6 M-ICST-Bif4
0–6 M-ICST-Bif5
0–6 M-ICST-Bif6
0–6 M-ICST-Bif7
0–6 M-ICST-Esch
0–6 M-ICST-Kleb
Natural 276 6.88% 1.09% 31.16% 1.81% 33.70% 0.00% 0.00% 2.54% 5.07% 9.06% 3.26%C-section 113 29.20% 1.77% 33.63% 0.00% 8.85% 0.00% 0.00% 3.54% 3.54% 8.85% 7.08%Breastfeeding
(BF)393 11.70% 1.78% 32.32% 3.56% 17.30% 2.80% 7.38% 2.54% 4.58% 7.89% 4.58%
FormulaFeeding (FF)
45 2.22% 2.22% 11.11% 0.00% 53.33% 0.00% 0.00% 0.00% 8.89% 15.56% 4.44%
L. Mancabelli et al. Computational and Structural Biotechnology Journal 18 (2020) 2480–2493
36 M-ICST-Bact1 (37.07% of the total samples) and 6–36 M-ICST-Bact3 (12.07% of the total samples), while C-section infants werenot associated with a dominant ICST except for 6–36 M-ICST-Bif4(23.33% of the total samples), which is characterized by Bifidobac-terium and Streptococcus genera (Table 5).
Focusing on the correlation between infant community statetypes and the mode of feeding, the 0–6 M breast-fed samples wereshown to be frequently assigned to the community state types 0–6 M-ICST-Bif1 (32.32% of the total samples) or 0–6 M-ICST-Bif3(17.30% of the total samples) being characterized by dominanceof the Bifidobacterium and Bacteroides genera, respectively, whilesamples from formula-fed infants were most commonly assignedto the community state type 0–6 M-ICST-Bif3 (53.33% of the totalsamples) (Table 4). Instead, the 6–36 M breast-fed samplesrevealed a high heterogeneity in the distribution of ICSTs, whilesamples from formula-fed babies showed a prevalence of the Bac-teroides community state type 6–36 M-ICST-Bact1 (48.48% of thetotal samples) (Table 5). These results confirm the impact of thefeeding type, i.e. breast- and formula-feeding, on the infant micro-biota, suggesting a close correlation between formula-fed babiesand the Bacteroides ICST.
4. Conclusions
The human gastrointestinal tract is colonized by millions ofmicroorganisms collectively defined as microbiota. In this context,several studies have shown that appropriate development of theintestinal microbiota during the early stages of life may positivelyinfluence human health.
In order to investigate changes in the intestinal microbiota dur-ing the early stages of life in human, we performed a multi-population cohort meta-analysis of a total of 1035 faecal samplesof healthy, full-term infants ranging from a few hours followingbirth to 3 years of age. The multi-population cohort meta-analysis revealed a higher microbial complexity in samples frominfants aged between 12 and 36 months compared to those fromchildren less than one month old. This increase in biodiversity
2491
appears to have caused a reduction in the abundance of the Bifi-dobacterium genus in favor of Bacteroides, Feacalibacterium, Blautiaand Ruminococcus genera. The multi-population cohort meta-analysis allowed us to observe higher complexity in subjects bornby C-section compared to those born by natural delivery. In addi-tion, babies born by C-section were associated with a bacterial col-onization characterized by genera commonly present in theenvironment and/or bacterial genera that may be pathogenic.The multi-population cohort meta-analysis also revealed a positivecorrelation between breastfeeding and dominance of bifidobacte-ria in the corresponding gut microbiota.
The statistical robustness offered by our extensive meta-analysis allowed us to identify infant community state types(ICSTs) highlighting that healthy children less than six monthsold are characterized by the predominance of the ICST with highrelative abundance of the Bifidobacterium genus in their gut micro-biota, while infants aged between 12 and 36 months are character-ized by typically adult bacterial genera, such as Bacteroides andFeacalibacterium. Moreover, analysis of ICSTs highlighted a strongcorrelation between formula-fed infants and the developmentand maintenance of a microbiota with a predominance of the Bac-teroides genus. Certainly, a deep meta-analysis of datasets based onwhole-metagenome shotgun (WMS) or built on internal tran-scribed spacer (ITS)-based profiling, will offer a more detailed spe-cies level investigation and will no doubt allow the confirmation ofthese infant community state types described here and the discov-ery of further ICSTs or sub-ICSTs. Furthermore, our results high-light the need for additional studies accompanied by accuratemetadata that will be crucial in order to precisely determine thefactors that influence the evolution of the infant gut microbiota.Moreover, due to the absence of longitudinal studies involvingmetagenomic data across the 3 years, it was not possible to evalu-ate if these identified ICSTs remain stable over time. In this context,a specific longitudinal study spanning a wider age range may beimportant to clarify the evolution and stability of the microbiotain relation to the identified community state types and highlightpossible correlations between the ICSTs of infants and adults.

L. Mancabelli et al. Computational and Structural Biotechnology Journal 18 (2020) 2480–2493
CRediT authorship contribution statement
Leonardo Mancabelli: Conceptualization, Methodology, Formalanalysis, Investigation, Data curation, Visualization, Writing - orig-inal draft. Chiara Tarracchini: Methodology, Investigation, Datacuration, Visualization. Christian Milani: Methodology, Supervi-sion, Writing - review & editing. Gabriele Andrea Lugli: Conceptu-alization, Software. Federico Fontana: Data curation. FrancescaTurroni: Conceptualization, Supervision. Douwe Sinderen: Con-ceptualization, Supervision, Writing - review & editing. MarcoVentura: Conceptualization, Supervision, Project administration,Writing - review & editing.
Declaration of Competing Interest
The authors declare that they have no known competing finan-cial interests or personal relationships that could have appearedto influence the work reported in this paper.
Acknowledgements
Part of this research is conducted using the High PerformanceComputing (HPC) facility of the University of Parma. This workwas funded by the EU Joint Programming Initiative – A HealthyDiet for a Healthy Life (JPI HDHL, http://www.healthydiet-forhealthylife.eu/) to MV and DvS (Grant no. 15/JP/HDHL/3280),and the MIUR to MV. We thank GenProbio srl for financial supportof the Laboratory of Probiogenomics. DvS is a member of APCMicrobiome Ireland funded by Science Foundation Ireland (SFI),through the Irish Government’s National Development Plan (Grantno’s. SFI/12/RC/2273-P1 and SFI/12/RC/2273-P2).
Appendix A. Supplementary data
Supplementary data to this article can be found online athttps://doi.org/10.1016/j.csbj.2020.08.028.
References
[1] Milani C, Duranti S, Bottacini F, Casey E, Turroni F, Mahony J, et al. The firstmicrobial colonizers of the human gut: composition, activities, and healthimplications of the infant gut microbiota. Microbiol Mol Biol Rev 2017;81(4).
[2] Ventura M, Milani C, Lugli GA, van Sinderen D. Health benefits conferred by thehuman gut microbiota during infancy. Microb Biotechnol 2019;12(2):243–8.
[3] Fouhy F, Ross RP, Fitzgerald GF, Stanton C, Cotter PD. Composition of the earlyintestinal microbiota: knowledge, knowledge gaps and the use of high-throughput sequencing to address these gaps. Gut Microbes 2012;3(3):203–20.
[4] Rinninella E, Raoul P, Cintoni M, Franceschi F, Miggiano GAD, Gasbarrini A,et al. What is the healthy gut microbiota composition? A changing ecosystemacross age, environment, diet, and diseases. Microorganisms 2019;7(1).
[5] Dominguez-Bello MG, Costello EK, Contreras M, Magris M, Hidalgo G, Fierer N,et al. Delivery mode shapes the acquisition and structure of the initialmicrobiota across multiple body habitats in newborns. Proc Natl Acad Sci U S A2010;107(26):11971–5.
[6] Biasucci G, Rubini M, Riboni S, Morelli L, Bessi E, Retetangos C. Mode ofdelivery affects the bacterial community in the newborn gut. Early Hum Dev2010;86(Suppl 1):13–5.
[7] Backhed F, Roswall J, Peng Y, Feng Q, Jia H, Kovatcheva-Datchary P, et al.Dynamics and stabilization of the human gut microbiome during the first yearof life. Cell Host Microbe 2015;17(5):690–703.
[8] Salminen S, Gibson GR, McCartney AL, Isolauri E. Influence of mode of deliveryon gut microbiota composition in seven year old children. Gut 2004;53(9):1388–9.
[9] Yatsunenko T, Rey FE, Manary MJ, Trehan I, Dominguez-Bello MG, Contreras M,et al. Human gut microbiome viewed across age and geography. Nature2012;486(7402):222–7.
[10] O’Sullivan A, Farver M, Smilowitz JT. The influence of early infant-feedingpractices on the intestinal microbiome and body composition in infants. NutrMetab Insights 2015;8(Suppl 1):1–9.
[11] Stewart CJ, Ajami NJ, O’Brien JL, Hutchinson DS, Smith DP, Wong MC, et al.Temporal development of the gut microbiome in early childhood from theTEDDY study. Nature 2018;562(7728):583–8.
2492
[12] Subramanian S, Huq S, Yatsunenko T, Haque R, Mahfuz M, Alam MA, et al.Persistent gut microbiota immaturity in malnourished Bangladeshi children.Nature 2014;510(7505):417–21.
[13] Hill CJ, Brown JR, Lynch DB, Jeffery IB, Ryan CA, Ross RP, et al. Effect of roomtemperature transport vials on DNA quality and phylogenetic composition offaecal microbiota of elderly adults and infants. Microbiome 2016;4(1):19.
[14] Bokulich NA, Chung J, Battaglia T, Henderson N, Jay M, Li H, et al. Antibiotics,birth mode, and diet shape microbiome maturation during early life. Sci TranslMed 2016;8(343):343–82.
[15] Davis MY, Zhang H, Brannan LE, Carman RJ, Boone JH. Rapid change of fecalmicrobiome and disappearance of Clostridium difficile in a colonized infantafter transition from breast milk to cow milk. Microbiome 2016;4(1):53.
[16] Davis JC, Lewis ZT, Krishnan S, Bernstein RM, Moore SE, Prentice AM, et al.Growth and morbidity of gambian infants are influenced by maternal milkoligosaccharides and infant gut microbiota. Sci Rep 2017;7:40466.
[17] Hill CJ, Lynch DB, Murphy K, Ulaszewska M, Jeffery IB, O’Shea CA, et al.Evolution of gut microbiota composition from birth to 24 weeks in theINFANTMET Cohort. Microbiome 2017;5(1):4.
[18] Berni Canani R, De Filippis F, Nocerino R, Laiola M, Paparo L, Calignano A, et al.Specific signatures of the gut microbiota and increased levels of butyrate inchildren treated with fermented cow’s milk containing heat-killedlactobacillus paracasei CBA L74. Appl Environ Microbiol 2017;83(19).
[19] Nogacka A, Salazar N, Suarez M, Milani C, Arboleya S, Solis G, et al. Impact ofintrapartum antimicrobial prophylaxis upon the intestinal microbiota and theprevalence of antibiotic resistance genes in vaginally delivered full-termneonates. Microbiome 2017;5(1):93.
[20] Bazanella M, Maier TV, Clavel T, Lagkouvardos I, Lucio M, Maldonado-GomezMX, et al. Randomized controlled trial on the impact of early-life interventionwith bifidobacteria on the healthy infant fecal microbiota and metabolome.Am J Clin Nutr 2017;106(5):1274–86.
[21] Stearns JC, Simioni J, Gunn E, McDonald H, Holloway AC, Thabane L, et al.Intrapartum antibiotics for GBS prophylaxis alter colonization patterns in theearly infant gut microbiome of low risk infants. Sci Rep 2017;7(1):16527.
[22] Parker EPK, Praharaj I, Zekavati A, Lazarus RP, Giri S, Operario DJ, et al.Influence of the intestinal microbiota on the immunogenicity of oral rotavirusvaccine given to infants in south India. Vaccine 2018;36(2):264–72.
[23] McDonald D, Hyde E, Debelius JW, Morton JT, Gonzalez A, Ackermann G, et al.American gut: an open platform for citizen science microbiome research.mSystems 2018;3(3).
[24] de Muinck EJ, Trosvik P. Individuality and convergence of the infant gutmicrobiota during the first year of life. Nat Commun 2018;9(1):2233.
[25] Berni Canani R, De Filippis F, Nocerino R, Paparo L, Di Scala C, Cosenza L, et al.Gut microbiota composition and butyrate production in children affected bynon-IgE-mediated cow’s milk allergy. Sci Rep 2018;8(1):12500.
[26] Mortensen MS, Hebbelstrup Jensen B, Williams J, Brejnrod AD, O’BrienAndersen L, Roser D, et al. Stability and resilience of the intestinalmicrobiota in children in daycare - a 12 month cohort study. BMC Microbiol2018;18(1):223.
[27] Lozupone CA, Stombaugh J, Gonzalez A, Ackermann G, Wendel D, Vazquez-Baeza Y, et al. Meta-analyses of studies of the human microbiota. Genome Res2013;23(10):1704–14.
[28] Duvallet C, Gibbons SM, Gurry T, Irizarry RA, Alm EJ. Meta-analysis of gutmicrobiome studies identifies disease-specific and shared responses. NatCommun 2017;8(1):1784.
[29] Bisanz JE, Upadhyay V, Turnbaugh JA, Ly K, Turnbaugh PJ. Meta-analysisreveals reproducible gut microbiome alterations in response to a high-fat diet.Cell Host Microbe 2019;26(2):265–272 e264.
[30] Drewes JL, White JR, Dejea CM, Fathi P, Iyadorai T, Vadivelu J, et al. Erratum:author correction: high-resolution bacterial 16S rRNA gene profile meta-analysis and biofilm status reveal common colorectal cancer consortia. NPJBiofilms Microbiomes 2019;5:2.
[31] Pammi M, Cope J, Tarr PI, Warner BB, Morrow AL, Mai V, et al. Intestinaldysbiosis in preterm infants preceding necrotizing enterocolitis: a systematicreview and meta-analysis. Microbiome 2017;5(1):31.
[32] Bhute S, Pande P, Shetty SA, Shelar R, Mane S, Kumbhare SV, et al. Molecularcharacterization and meta-analysis of gut microbial communities illustrateenrichment of prevotella and megasphaera in indian subjects. Front Microbiol2016;7:660.
[33] Klindworth A, Pruesse E, Schweer T, Peplies J, Quast C, Horn M, et al. Evaluationof general 16S ribosomal RNA gene PCR primers for classical and next-generation sequencing-based diversity studies. Nucleic Acids Res 2013;41(1):e1.
[34] Lefever S, Pattyn F, Hellemans J, Vandesompele J. Single-nucleotidepolymorphisms and other mismatches reduce performance of quantitativePCR assays. Clin Chem 2013;59(10):1470–80.
[35] Caporaso JG, Kuczynski J, Stombaugh J, Bittinger K, Bushman FD, Costello EK,et al. QIIME allows analysis of high-throughput community sequencing data.Nat Methods 2010;7(5):335–6.
[36] Bokulich NA, Kaehler BD, Rideout JR, Dillon M, Bolyen E, Knight R, et al.Optimizing taxonomic classification of marker-gene amplicon sequences withQIIME 2’s q2-feature-classifier plugin. Microbiome 2018;6(1):90.
[37] Callahan BJ, McMurdie PJ, Rosen MJ, Han AW, Johnson AJ, Holmes SP. DADA2:High-resolution sample inference from Illumina amplicon data. Nat Methods2016;13(7):581–3.
[38] Quast C, Pruesse E, Yilmaz P, Gerken J, Schweer T, Yarza P, Peplies J, GlocknerFO: The SILVA ribosomal RNA gene database project: improved data

L. Mancabelli et al. Computational and Structural Biotechnology Journal 18 (2020) 2480–2493
processing and web-based tools. Nucleic Acids Res 2013, 41(Database issue):D590-596.
[39] Greathouse KL, White JR, Padgett RN, Perrotta BG, Jenkins GD, Chia N, et al. Gutmicrobiome meta-analysis reveals dysbiosis is independent of body massindex in predicting risk of obesity-associated CRC. BMJ Open Gastroenterol2019;6(1):e000247.
[40] Derrien M, Alvarez AS, de Vos WM. The Gut Microbiota in the First Decade ofLife. Trends Microbiol 2019;27(12):997–1010.
[41] Milani C, Hevia A, Foroni E, Duranti S, Turroni F, Lugli GA, et al. Assessing thefecal microbiota: an optimized ion torrent 16S rRNA gene-based analysisprotocol. PLoS ONE 2013;8(7):e68739.
[42] Mancabelli L, Milani C, Lugli GA, Fontana F, Turroni F, van Sinderen D, et al. Theimpact of primer design on amplicon-based metagenomic profiling accuracy:detailed insights into bifidobacterial community structure. Microorganisms2020;8(1).
[43] Milani C, Alessandri G, Mangifesta M, Mancabelli L, Lugli GA, Fontana F, et al.Untangling species-level composition of complex bacterial communitiesthrough a novel metagenomic approach. mSystems 2020;5(4).
[44] Alessandri G, Milani C, Mancabelli L, Mangifesta M, Lugli GA, Viappiani A, et al.The impact of human-facilitated selection on the gut microbiota ofdomesticated mammals. FEMS Microbiol Ecol 2019;95(9).
[45] Fallani M, Amarri S, Uusijarvi A, Adam R, Khanna S, Aguilera M, et al.Determinants of the human infant intestinal microbiota after the introductionof first complementary foods in infant samples from five European centres.Microbiology 2011;157(Pt 5):1385–92.
[46] Koenig JE, Spor A, Scalfone N, Fricker AD, Stombaugh J, Knight R, et al.Succession of microbial consortia in the developing infant gut microbiome.Proc Natl Acad Sci U S A 2011;108(Suppl 1):4578–85.
[47] Mancabelli L, Milani C, Lugli GA, Turroni F, Ferrario C, van Sinderen D, et al.Meta-analysis of the human gut microbiome from urbanized and pre-agricultural populations. Environ Microbiol 2017;19(4):1379–90.
[48] Arumugam M, Raes J, Pelletier E, Le Paslier D, Yamada T, Mende DR, et al.Enterotypes of the human gut microbiome. Nature 2011;473(7346):174–80.
[49] Salonen A, Salojarvi J, Lahti L, de Vos WM. The adult intestinal core microbiotais determined by analysis depth and health status. Clin Microbiol Infect2012;18(Suppl 4):16–20.
[50] Alessandri G, Milani C, Mancabelli L, Mangifesta M, Lugli GA, Viappiani A, et al.Metagenomic dissection of the canine gut microbiota: insights into taxonomic,metabolic and nutritional features. Environ Microbiol 2019;21(4):1331–43.
[51] Alessandri G, Milani C, Mancabelli L, Longhi G, Anzalone R, Lugli GA, et al.Deciphering the bifidobacterial populations within the canine and feline gutmicrobiota. Appl Environ Microbiol 2020;86(7).
[52] Shin H, Pei Z, Martinez 2nd KA, Rivera-Vinas JI, Mendez K, Cavallin H, et al. Thefirst microbial environment of infants born by C-section: the operating roommicrobes. Microbiome 2015;3:59.
2493
[53] Thavagnanam S, Fleming J, Bromley A, Shields MD, Cardwell CR. A meta-analysis of the association between Caesarean section and childhood asthma.Clin Exp Allergy 2008;38(4):629–33.
[54] Huh SY, Rifas-Shiman SL, Zera CA, Edwards JW, Oken E, Weiss ST, et al.Delivery by caesarean section and risk of obesity in preschool age children: aprospective cohort study. Arch Dis Child 2012;97(7):610–6.
[55] Lozupone CA, Stombaugh JI, Gordon JI, Jansson JK, Knight R. Diversity, stabilityand resilience of the human gut microbiota. Nature 2012;489(7415):220–30.
[56] Lugli GA, Duranti S, Milani C, Mancabelli L, Turroni F, Alessandri G, et al.Investigating bifidobacteria and human milk oligosaccharide composition oflactating mothers. FEMS Microbiol Ecol 2020.
[57] D’Auria E, Bergamini M, Staiano A, Banderali G, Pendezza E, Penagini F, et al.Italian Society of P: Baby-led weaning: what a systematic review of theliterature adds on. Ital J Pediatr 2018;44(1):49.
[58] World Health Organization U: Global strategy for infant and young childfeeding. 2003.
[59] Tanaka M, Sanefuji M, Morokuma S, Yoden M, Momoda R, Sonomoto K, et al.The association between gut microbiota development and maturation ofintestinal bile acid metabolism in the first 3 y of healthy Japanese infants. GutMicrobes 2020;11(2):205–16.
[60] Le Doare K, Holder B, Bassett A, Pannaraj PS. Mother’s milk: a purposefulcontribution to the development of the infant microbiota and immunity. FrontImmunol 2018;9:361.
[61] Zhong H, Penders J, Shi Z, Ren H, Cai K, Fang C, et al. Impact of early events andlifestyle on the gut microbiota and metabolic phenotypes in young school-agechildren. Microbiome 2019;7(1):2.
[62] Grier A, McDavid A, Wang B, Qiu X, Java J, Bandyopadhyay S, et al. Neonatal gutand respiratory microbiota: coordinated development through time and space.Microbiome 2018;6(1):193.
[63] Dogra S, Sakwinska O, Soh SE, Ngom-Bru C, Bruck WM, Berger B, et al.Dynamics of infant gut microbiota are influenced by delivery mode andgestational duration and are associated with subsequent adiposity. mBio2015;6(1).
[64] Stearns JC, Zulyniak MA, de Souza RJ, Campbell NC, Fontes M, Shaikh M, et al.Ethnic and diet-related differences in the healthy infant microbiome. GenomeMed 2017;9(1):32.
[65] Brooks AW, Priya S, Blekhman R, Bordenstein SR. Gut microbiota diversityacross ethnicities in the United States. PLoS Biol 2018;16(12):e2006842.
[66] Sordillo JE, Zhou Y, McGeachie MJ, Ziniti J, Lange N, Laranjo N, et al. Factorsinfluencing the infant gut microbiome at age 3–6 months: Findings from theethnically diverse Vitamin D Antenatal Asthma Reduction Trial (VDAART). JAllergy Clin Immunol 2017;139(2):482–491 e414.