12–17–04 Vol. 69 No. 242 Friday Dec. 17, 2004 Pages 75451 ...
International Journal of Advances in Engineering & Technology, Mar. 2014.
©IJAET ISSN: 22311963
242 Vol. 7, Issue 1, pp. 242-254
PERFORMANCE COMPARISON OF THREE DATA MINING
TECHNIQUES FOR PREDICTING KIDNEY DIALYSIS
SURVIVABILITY
K.R.Lakshmi1, Y.Nagesh2 and M.VeeraKrishna3
1Director, IERDS, Maddur Nagar, Kurnool, Andhra Pradesh, India 2Dept. of Computer Science, Assosa University, Ethiopia
3Dept of Mathematics, Rayalaseema University, Kurnool, Andhra Pradesh, India
ABSTRACT The main objective of this manuscript is to report on research where we took advantage of those available
technological advancements to develop prediction models for kidney dialysis survivability, and also the main
goal of medical data mining techniques is to get best algorithms that describe given data from multiple aspects.
The number of patients on hemodialysis due to end stage kidney disease is increasing. The median survival for
these patients is only about 3 years and the cost of providing care is high. Finding ways to improve patient
outcomes and reduce the cost of dialysis is a challenging task. Dialysis care is complex and multiple factors
may influence patient survival. More than 50 parameters may be monitored while providing a kidney dialysis
treatment. Understanding the collective role of these parameters in determining outcomes for an individual
patient and administering dividualized treatments is of importance. Individual patient survival may depend on a
complex interrelation ship between multiple demographic and clinical variables, medications, and medical
interventions. In this research, three data mining techniques (Artificial Neural Networks, Decision tree and
Logical Regression) are used to elicit knowledge about the interaction between these variables and patient
survival. A performance comparison of three data mining techniques is employed for extracting knowledge in
the form of classification rules. The concepts introduced in this research have been applied and tested using a
data collected at different dialysis sites. The computational results are reported. Finally, ANN is suggested for
Kidney dialysis to get better results with accuracy and performance.
KEYWORDS: Data mining techniques, decision tree, artificial neural networks, logistic regression,
Kidney, Dialysis.
I. INTRODUCTION
The prediction of Kidney dialysis survivability has been a challenging research problem for any
researchers. Since the early dates of the related research, much advancement has been recorded in
several related fields. For instance, thanks to innovative biomedical technologies, better explanatory
prognostic factors are being measured and recorded; thanks to low cost computer hardware and
software technologies, high volume better quality data is being collected and stored automatically;
and finally thanks to better analytical methods, those voluminous data is being processed effectively
and efficiently. Dialysis is the artificial process of eliminating waste (diffusion) and unwanted water
(ultra filtration) from the blood. Our kidneys do this naturally. Some people, however, may have
failed or damaged kidneys which cannot carry out the function properly - they may need dialysis. In
other words, dialysis is the artificial replacement for lost kidney function (renal replacement therapy).
Dialysis may be used for patients who have become ill and have acute kidney failure (temporary loss
of kidney function), or for fairly stable patients who have permanently lost kidney function. When we
International Journal of Advances in Engineering & Technology, Mar. 2014.
©IJAET ISSN: 22311963
243 Vol. 7, Issue 1, pp. 242-254
are healthy our kidneys regulate our body levels of water and minerals, and remove waste. The
kidneys also produce erythropoietin and 1, 25-dihydroxycholecalciferol (calcitriol) as part of the
endocrine system. Dialysis does not correct the endocrine functions of failed kidneys - it only
replaces some kidney functions, such as waste removal and fluid removal.
1.1. Dialysis and altitude - A study found that death rates for dialysis patients are 10%-15% lower
for those whose homes are higher than 4,000 feet, compared to those who live at sea level.
Approximately 1,500 liters of blood are filtered by a healthy person's kidneys each day. We could not
live if waste products were not removed from our kidneys. People whose kidneys either do not work
properly or not at all experience a buildup of waste in their blood. Without dialysis the amount of
waste products in the blood would increase and eventually reach levels that would cause coma and
death. Dialysis is also used to rapidly remove toxins or drugs from the blood. There are two main
types of dialysis-hemodialysis and peritoneal dialysis. What type of dialysis a patient should have
really does depend on each individual case. Studies have indicated clearly that for kidney disease
patients who need to undergo dialysis, one type of treatment is not best for all.
1.2. The symptoms of kidney failure: Kidney failure tends to happen gradually. Even if just one
kidney works, or both work partially, normal kidney function is still possible. So, it can be a very
long time before any symptoms are noticed by the patient. When symptoms do occur they tend to be
different from person-to-person, making it harder for doctors to diagnose kidney failure quickly. The
following symptoms may be present: Fatigue (tiredness), frequent need to urinate, especially at night.
Frequency grows with time, Itchy skin, Erectile dysfunction (men have difficulty getting and/or
sustaining an erection), Nausea, Shortness of breath, Water retention (swollen feet, hands, ankles),
Blood in urine, Protein in urine.
1.3. The causes of kidney disease: Diabetes - thought to cause about half of all cases, Hypertension
(high blood pressure) - thought to cause about one quarter of all cases, Inflammation of the kidney
(glomerulonephritis), Malaria, Long-term exposure to lead, solvents and fuels, Systemic lupus
erythematosus - body's own immune system attacks the kidneys, Polycystic kidney disease-inherited,
Physical injury, such as a heavy blow to the kidney, Kidney infection (pyelonephritis), Jaundice, Over
consumption of some medications, Unborn baby does not have normally developing kidneys, Yellow
fever.
1.4. Hemodialysis: The blood circulates outside the body of the patient - it goes through a machine
that has special filters. The blood comes out of the patient through a catheter (a flexible tube) that is
inserted into the vein. The filters do what the kidney's do; they filter out the waste products from the
blood. The filtered blood then returns to the patient via another catheter. The patient is, in effect,
connected to a kind of artificial kidney. Patients need to be prepared for hemodialysis. A blood vessel,
usually in the arm, needs to be enlarged. Surgery is required for this. The enlarged vein makes the
insertion of the catheters possible. Hemodialysis usually lasts about 3 to 4 hours each week. The
duration of each session depends on how well the patient's kidneys work, and how much fluids
weight the patient has gained between treatments.
1.5. Peritoneal dialysis: A sterile (dialysate) solution rich in minerals and glucose is run through a
tube into the peritoneal cavity, the abdominal body cavity around the intestine, where the peritoneal
membrane acts as a semi-permeable membrane. The abdomen is the area between the chests and hips
- it contains the stomach, small intestine, large intestine, liver, gallbladder, pancreas and spleen.
Peritoneal dialysis uses the natural filtering ability of the peritoneum - the internal lining of the
abdomen. In other words, peritoneal dialysis uses the lining of the abdomen as a filter of waste
products from the blood. The dialysate is left there for some time so that it can absorb waste products.
Then it is drained out through a tube and discarded. This exchange, or cycle, is generally repeated
several times during the day - with an automated system it is often done overnight. The elimination of
unwanted water (ultrafiltration) occurs through osmosis - as the dialysis solution has a high
concentration of glucose, it results in osmotic pressure which causes the fluid to move from the blood
into the dialysate. Consequently, a larger quantity of fluid is drained than introduced. Although
peritoneal dialysis is not as efficient as hemodialysis, it is carried out for longer periods. The net
effect in terms of total waste product and salt and water removal is about the same as hemodialysis.
Peritoneal dialysis is done at home by the patient; by a willing and motivated patient. It gives the
patient a greater amount of freedom and independence because he/she does not have to come in to the
clinic at multiple times each week. It can also be done while traveling with a minimum of specialized
International Journal of Advances in Engineering & Technology, Mar. 2014.
©IJAET ISSN: 22311963
244 Vol. 7, Issue 1, pp. 242-254
equipment. Before having peritoneal dialysis, the patient needs to have a small surgical procedure to
insert a catheter into the abdomen. This is kept closed off, except when fluid is being introduced or
taken out of the abdomen. There are two principal types of peritoneal dialysis: 1.5.1.Continuous
ambulatory peritoneal dialysis (CAPD) - this requires no machinery and can be done by the patient
or a caregiver. The dialysate is left in the abdomen for up to eight hours. It is then replaced with a
fresh solution straight away. This happens every day, about four to five times per day.
1.5.2. Continuous cyclic peritoneal dialysis (CCPD) - a machine does the dialysis fluid exchanges.
It is generally done during the night while the patient sleeps. This needs to be done every night. Each
session lasts from ten to twelve hours. After spending the night attached to the machine, the majority
of people keep fluid inside their abdomen during the day. Some patients may require another
exchange during the day. A study found that a significant number of patients prefer "dialysis while
you sleep" treatment. Nocturnal dialysis improves heart disease in patients with end-stage kidney
failure.
In this paper, three data mining techniques (Artificial Neural Networks, Decision tree and Logical
Regression) are used to elicit knowledge about the interaction between these variables and patient
kidney survival. A performance comparison of three data mining techniques is employed for
extracting knowledge in the form of classification rules. The concepts introduced in this research have
been applied and tested using a data collected at different dialysis sites. The computational results are
reported.
II. REVIEW OF THE RELATED LITERATURE
Chronic kidney disease (CKD) is a condition in which the kidneys are damaged and cannot filter
blood as well as possible. In advanced stage of CKD known as end-stage renal disease (ESRD) kidney
functions are reduced very severely. Hemodialysis (HD) treatment is the most common procedure
which is performed for ESRD patients and HD requires permanent vascular access (VA) as an
important aspect [1]. Furthermore, there are three main types of VA used in HD treatment:
arteriovenous fistula (AVF), synthetic arteriovenous graft (AVG), and central venous catheter (CVC)
[2]. Types of VA have their risks and can be expensive. According to recommendation of clinical
practice guidelines, AVF is the access of first choice based on the reduced associated complications,
morbidity, and mortality compared with AVG and CVC; also AVF has superior survival rate
(estimated at 90%after one year) than other VA types (such as 60%ofAVG) [3]. AVF is less
expensive and remains the gold standard access to HD. Since incidence of early AVF failure is
reported as 20–60% [4], therefore detection of risk factors in early AVF failure is essential in caring
for these HD patients in terms of medical, economic, and psychological impact. An AVF that is never
usable for dialysis or that fails within three months of usage, should be classified as an early failure
[5].
“Data mining” is defined as a step in the knowledge discovery in databases (KDD) process that
consists of applying data analysis and discovery algorithms that, under acceptable computational
efficiency limitations, produce a particular enumeration of patterns (or models) over the data [6]; also
KDD is defined as the nontrivial process of identifying valid, novel, potentially useful, and ultimately
understandable patterns in data. Data mining’s approaches are boosting and their applications have
become increasingly essential for healthcare organizations to make decisions based on the analysis of
the huge amounts of clinical data generated by healthcare transactions. Data mining is becoming
increasingly popular in healthcare, if not increasingly essential, and several factors motivated the use
of data mining applications in healthcare, such as fraud and abuse detection, ability of transforming
data, and benefit of healthcare providers [7]. Another factor is that data mining can improve decision
making by discovering patterns and trends in large amounts of complex data [8]. Several studies
employed data mining approaches to discover the knowledge of relation between the measured
parameters and prevention of AVF failure. Temporal data mining techniques are studied [9] for
dialysis failure prediction and analyzing the data of dialysis sessions coming from 43 different
patients. 𝐾-means and expectation maximization algorithm are implemented [10] to cluster some
attributes of HD patients. Data mining is considered in the medical settings of HD treatment and
provided a brief review of state-of-the-art methods for predicting patient risk and survival of dialysis
International Journal of Advances in Engineering & Technology, Mar. 2014.
©IJAET ISSN: 22311963
245 Vol. 7, Issue 1, pp. 242-254
patients [11]. WJ.48 tree algorithm is used for analyzing data of 170 patients on dialysis for 12 or
more months and interpreted patterns of high-risk groups in patients by extracting decision rules [12].
Hemodialysis (HD) and peritoneal dialysis are the two modalities of dialysis treatment. HD is
typically performed in a clinic setting and accounts for more than 80% of the dialysis population.
Peritoneal dialysis accounts for the remaining 20% and is usually performed by the patient at his/her
residence. During HD, the blood passes through an extra-corporal circuit where metabolites are
eliminated, the acid–base equilibrium is re-established and excess salt and water is removed [32]. The
process of diffusion exchanges solutes and metabolites across a semi-permeable membrane,
separating the blood and dialysate [33]. Water is removed from the body using a negative pressure
gradient in a process called ultra-filtration. After transit through the dialyzer, the clean, filtered blood
is returned to the body. A device called a hemodialyzer regulates the entire procedure. Typically, HD
is performed three times a week for 3–4 h each session, but dialysis time for these sessions varies
from patient to patient [31, 34]. Peritoneal dialysis works on the same principles of solute diffusion
and fluid ultra filtration as HD, but the blood is cleaned inside the body rather than through a
machine. The kidneys filter nearly 189 litres of liquid from blood per day but only about 1% (1.89 l)
of the original filtrate ultimately appears in the final urine as waste products and extra water. The
waste products are not reabsorbed and are concentrated in the final urine. These waste products such
as urea and create nine are derived from the normal breakdown of foods and tissues. The kidneys also
maintain the stability of the extracellular fluid (ECF) volume and electrolyte homeostasis by adjusting
excretion of water and electrolytes to balance changes in intake [32]. In addition to these excretory
functions, the kidney is an endocrine organ that produces hormones such as erythropoietin needed for
red blood cell production and metabolizes vitamin D into an active form needed for proper bone
growth and turnover. The kidneys are also the primary route for elimination of many foreign
substances such as drugs, food additives, pesticides, and other components from the body. With
kidney failure, waste products build up in the body, 3uid and water homeostasis is impaired and the
endocrine functions of the kidney are deranged. This impairs the function of multiple organ systems
producing a toxic condition known as uraemia that if not corrected will lead to death. Although
dialysis is life saving for a person with terminal kidney failure, survival is still markedly reduced
compared to an age-matched healthy population. The median life span of a dialysis patient in the US
is slightly more than 3 years [35]. Kidney failure due to health conditions such as diabetes accounts
for much of this excess mortality. However, the observation that recipients of kidney transplant do
better than similar patients who receive dialysis while on the waiting list for a kidney transplant
suggests that the process of dialysis could be improved. Targeted interventions for high-risk patients
and improvements in the dialysis prescription are possible by understanding factors that are predictive
of survival of a given patient.
2.1. World Statistics
The prevalence of CKD is increasing around the world. In 2010, more than 10% of people or more
than 20 million patients in the USA have CKD [13]. According to recent statistics of National Kidney
Foundation (NKF), there are 26 million CKD patients in USA in 2012 [14]. Also the rate of ESRD as
a chronic illness has grown rapidly in recent years [15]. At the end of 2004, ESRD is reported with a
prevalent world population of 400,000, including over 300,000 hemo dialysis (HD) patients [16]. At
the end of 2008, 547,982 USA residents were under treatment of ESRD and 382,343 of them received
dialysis, of which 354,443 were under hemo dialysis [17]. In Iran more than 14,000 patients are
treated with chronic
HD therapy for ESRD [18]. AVF is used by 93.4% of Iranian HD patients [1]. This finding exceeds
the recommendations by guidelines and the percentage of 67–91% reported by AVF usage in many
Western countries in recent years [19]. Shital Shah et.al [29] discussed a data mining approach is used
to elicit knowledge about the interaction between these variables and patient survival.
AndrewKusiaket.al [30] discussed data pre-processing, data transformations, and a data mining
approach are used to elicit knowledge about the interaction between many of these measured
parameters and patient survival. Two different data mining algorithms were employed for extracting
knowledge in the form of decision rules. These rules were used by a decision-making algorithm,
which predicts survival of new unseen patients. Important parameters identified by data mining are
interpreted for their medical significance. Recently Sriram.N [36] discussed the data mining approach
International Journal of Advances in Engineering & Technology, Mar. 2014.
©IJAET ISSN: 22311963
246 Vol. 7, Issue 1, pp. 242-254
for parametric evaluation to improve the treatment of kidney dialysis patient. The experimental result
shows that classification accuracy using Association mining between the ranges 50-97.7% is obtained
based on the dialysis parameter combination. Such a decision-based approach helps the clinician to
decide the level of dialysis required for individual patient. Jinn-Yi Yeh [37] studied combines
temporal abstraction with data mining techniques for analyzing dialysis patients' biochemical data to
develop a decision support system. The mined temporal patterns are helpful for clinicians to predict
hospitalization of hemo dialysis patients and to suggest immediate treatments to avoid hospitalization.
Later Mohammad Rezapouret.al [28] has found that this mentioned risk factor shave important roles
in outcome of vascular surgery, versus other parameters such as age. In this paper, a performance
comparison of three data mining techniques (ANN, Decision tree and Logical Regression) is
employed for extracting knowledge in the form of classification rules. ANN algorithm plays a
vital role in data mining techniques. ANN shows better results. The performance of ANN shows the
high level compare with other two techniques. Hence ANN shows the concrete results with Kidney
dialysis of patient records. Therefore ANN is suggested for Kidney dialysis to get better results with
accuracy and performance.
III. METHODOLOGY
3.1. k-Fold cross-validation
In order to minimize the bias associated with the random sampling of the training and holdout data
samples in comparing the predictive accuracy of two or more methods, researchers tend to use k-fold
cross-validation. In k-fold cross-validation, also called rotation estimation, the complete dataset (D) is
randomly split into k mutually exclusive subsets (the folds: D1, D2, . . ., Dk) of approximately equal
size. The classification model is trained and tested k times. Each time (t {1, 2, . . .,k}), it is trained
on all but one folds (Dt) and tested on the remaining single fold (Dt). The cross-validation estimate of
the overall accuracy is calculates as simply the average of the k individual accuracy measures
CVA
k
i
iA
1
(3.1.1)
where CVA stands for cross-validation accuracy, k is the number of folds used, and A is the accuracy
measure of each folds. Since the cross-validation accuracy would depend on the random assignment
of the individual cases into k distinct folds, a common practice is to stratify the folds themselves. In
stratified k-fold cross-validation, the folds are created in a way that they contain approximately the
same proportion of predictor labels as the original dataset. Empirical studies showed that stratified
cross-validation tend to generate comparison results with lower bias and lower variance when
compared to regular k-fold cross-validation. We describe some data mining techniques (prediction
models) artificial neural networks, decision trees and logical regression. The best results are achieved
by using Tanagra tool. Tanagra is data mining matching set.
3.2. Artificial neural networks
Artificial neural networks (ANNs) are commonly known as biologically inspired, highly sophisticated
analytical techniques, capable of modelling extremely complex non-linear functions. Formally
defined, ANNs are analytic techniques modelled after the processes of learning in the cognitive
system and the neurological functions of the brain and capable of predicting new observations (on
specific variables) from other observations (on the same or other variables) after executing a process
of so-called learning from existing data [38]. We used a popular ANN architecture called multi-layer
perceptron (MLP) with back-propagation (a supervised learning algorithm). The MLP is known to be
a powerful function approximator for prediction and classification problems. It is arguably the most
commonly used and well-studied ANN architecture. Our experimental runs also proved the notion
that for this type of classification problems MLP performs better than other ANN architectures such
as radial basis function (RBF), recurrent neural network (RNN), and self-organizing map (SOM). In
fact, Hornik et al.[39] empirically showed that given the right size and the structure, MLP is capable
of learning arbitrarily complex non linear functions to arbitrary accuracy levels. The MLP is
essentially the collection of nonlinear neurons (a.k.a. perceptrons) organized and connected to each
International Journal of Advances in Engineering & Technology, Mar. 2014.
©IJAET ISSN: 22311963
247 Vol. 7, Issue 1, pp. 242-254
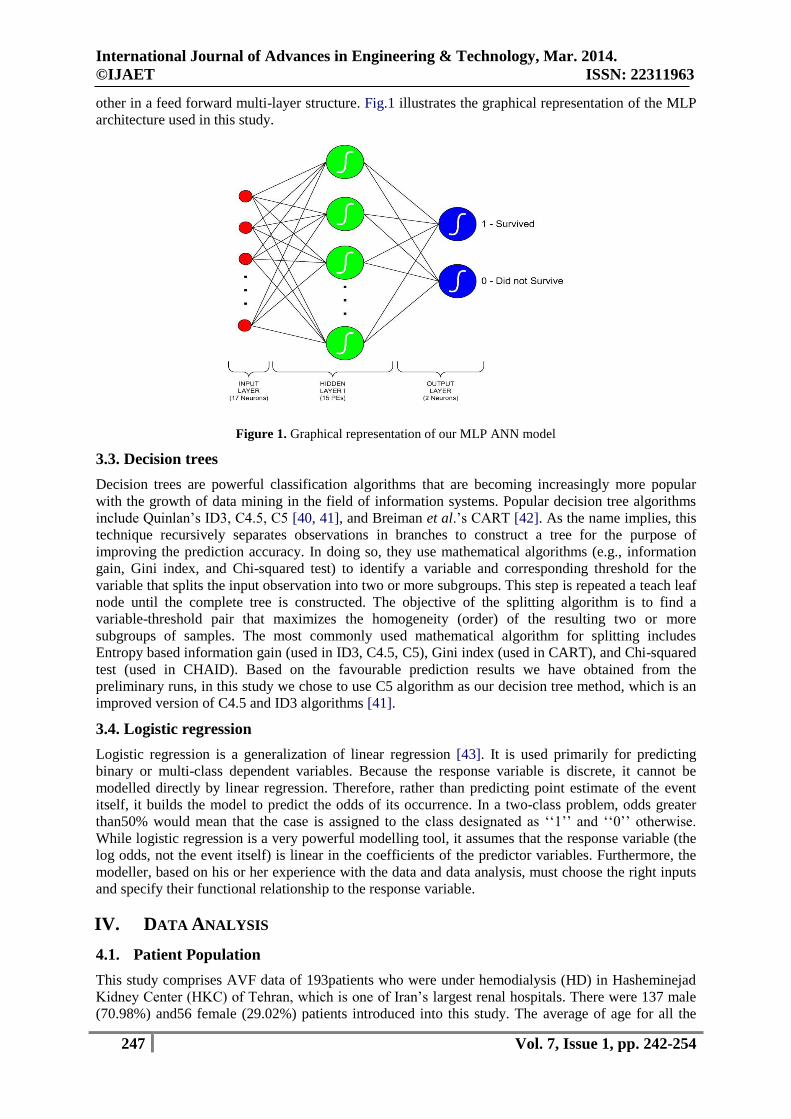
other in a feed forward multi-layer structure. Fig.1 illustrates the graphical representation of the MLP
architecture used in this study.
Figure 1. Graphical representation of our MLP ANN model
3.3. Decision trees
Decision trees are powerful classification algorithms that are becoming increasingly more popular
with the growth of data mining in the field of information systems. Popular decision tree algorithms
include Quinlan’s ID3, C4.5, C5 [40, 41], and Breiman et al.’s CART [42]. As the name implies, this
technique recursively separates observations in branches to construct a tree for the purpose of
improving the prediction accuracy. In doing so, they use mathematical algorithms (e.g., information
gain, Gini index, and Chi-squared test) to identify a variable and corresponding threshold for the
variable that splits the input observation into two or more subgroups. This step is repeated a teach leaf
node until the complete tree is constructed. The objective of the splitting algorithm is to find a
variable-threshold pair that maximizes the homogeneity (order) of the resulting two or more
subgroups of samples. The most commonly used mathematical algorithm for splitting includes
Entropy based information gain (used in ID3, C4.5, C5), Gini index (used in CART), and Chi-squared
test (used in CHAID). Based on the favourable prediction results we have obtained from the
preliminary runs, in this study we chose to use C5 algorithm as our decision tree method, which is an
improved version of C4.5 and ID3 algorithms [41].
3.4. Logistic regression
Logistic regression is a generalization of linear regression [43]. It is used primarily for predicting
binary or multi-class dependent variables. Because the response variable is discrete, it cannot be
modelled directly by linear regression. Therefore, rather than predicting point estimate of the event
itself, it builds the model to predict the odds of its occurrence. In a two-class problem, odds greater
than50% would mean that the case is assigned to the class designated as ‘‘1’’ and ‘‘0’’ otherwise.
While logistic regression is a very powerful modelling tool, it assumes that the response variable (the
log odds, not the event itself) is linear in the coefficients of the predictor variables. Furthermore, the
modeller, based on his or her experience with the data and data analysis, must choose the right inputs
and specify their functional relationship to the response variable.
IV. DATA ANALYSIS
4.1. Patient Population
This study comprises AVF data of 193patients who were under hemodialysis (HD) in Hasheminejad
Kidney Center (HKC) of Tehran, which is one of Iran’s largest renal hospitals. There were 137 male
(70.98%) and56 female (29.02%) patients introduced into this study. The average of age for all the
International Journal of Advances in Engineering & Technology, Mar. 2014.
©IJAET ISSN: 22311963
248 Vol. 7, Issue 1, pp. 242-254
patients was 53.87 17.47 years. Twenty eight patients had smoked and the number of diabetic
patients and non diabetics was 87 and 106, respectively. In previous study, we clustered the attributes
of early AVF failure, using descriptive approaches with 𝑛 = 99 patients [20].
In present study, we have two datasets of this vascular surgery: one of datasets was collected during
period from year 2005 to 2006 and contains 36 parameters of 99 patients who all had early AVF
failure; second dataset was collected from December to November 2010 and contains 25 parameters
of 94 patients of whom 87 patients had survival surgery and the remaining (7 patients) had early AVF
failure. So, by merging these two datasets we have 106 patients with early AVF failures and 87
patients without AVF failure.
4.2. Data Parameters
We merged two datasets and found eight similar parameters of them, where each patient is
characterized by seven attributes: age (age of patients), sex (male or female), htn (hypertension),
Diabetes M (diabetes mellitus), Hgb (hemoglobin), smoking (yes or no), and location (site of AVF
with brachial or radial).The last column thrombosis (yes: failure or no: survival) is the designated
class attribute.
V. COMPUTATIONAL RESULTS AND DISCUSSION
The basic phenomenon used to classify the Kidney dialysis using classifier is its performance and
accuracy. The performance of a chosen classifier is validated based on error rate and computation
time. The classification accuracy is predicted in terms of Sensitivity and Specificity. The computation
time is noted for each classifier is taken in to account. Classification Matrix displays the frequency of
correct and incorrect predictions. It compares the actual values in the test dataset with the predicted
values in the trained model. So we obtained a final dataset with 8 parameters of 193 records (patients),
which contain 106 cases of failures and 87 cases of survivals.
Table 1: confusion matrix
Predicted Classified as Healthy
(0)
Classified as not
Healthy
(1)
Actual Healthy
(0)
TP FN
Actual not Healthy
(1)
FP TN
Table. 1 shows the results of the Classification Matrix for all the three models. The rows represent
predicted values while the columns represent actual values (1 for patients with healthy, 0 for patients
with not healthy). The left-most columns show values predicted by the models. The diagonal values
show correct predictions. For Classification, this work constructed Confusion Matrix for the
frequency of correct and incorrect predictions. From the confusion matrix, the Specificity, Sensitivity,
Accuracy Rate and Error rate have been calculated. For measuring accuracy rate and Error Rate, the
following mathematical model is used.
5.1. Measures of Performance evaluation
Sensitivity (Recall) = FNTP
TP
, Specificity =
TNFP
TN
Accuracy = FNTNFPTP
TNTP
, Positive Precision =
FPTP
FP
Negative Precision = FNTN
FN
, Error Rate =
FNTNFPTP
FNFP
The software framework of this work has been developed with Tanagra tool. Tanagra is a data mining
suite build around graphical user interface. Tanagra is particularly strong in statistics, offering a wide
range of uni and multivariate parametric and nonparametric tests. Equally impressive is its list of
feature selection techniques. Together with a compilation of standard machine learning techniques, it

International Journal of Advances in Engineering & Technology, Mar. 2014.
©IJAET ISSN: 22311963
249 Vol. 7, Issue 1, pp. 242-254
also includes correspondence analysis, principal component analysis, and the partial least squares
methods. Tanagra is more powerful, it contains some supervised learning but also other paradigms
such as clustering, supervised learning, meta supervised learning, feature selection, data visualization
supervised learning assessment, statistics, feature selection and construction algorithms. The main
purpose of Tanagra project is to give researchers and students an easy-to-use data mining software,
conforming to the present norms of the software development in this domain , and allowing to analyze
either real or synthetic data. Tanagra can be considered as a pedagogical tool for learning
programming techniques. Tanagra is a wide set of data sources, direct access to data warehouses and
databases, data cleansing, interactive utilization. Table 2: Tabular results for 10-fold cross validation for all folds (ANN)
Fold
No.
TP FN FP TN Acc. (%)
Spe.
Sen. CVE rate
P (Prec)
N (Prec)
BVE rate
1 90 6 5 92 94.3005 0.9484 0.9375 0.0569 0.0526 0.0612 0.2243
2 89 5 6 93 94.3005 0.9393 0.9468 0.0569 0.0632 0.0510 0.2248
3 92 7 6 88 93.2642 0.9361 0.9292 0.0673 0.0612 0.0736 0.2251
4 91 8 4 80 93.4426 0.9523 0.9191 0.0656 0.0421 0.0909 0.2278
5 94 9 5 85 92.7461 0.9444 0.9126 0.0725 0.0505 0.0957 0.2265
6 92 6 6 89 93.7824 0.9368 0.9387 0.0622 0.0612 0.0631 0.2287
7 92 5 8 88 93.2642 0.9166 0.9484 0.0674 0.0800 0.0537 0.2215
8 90 5 5 93 94.8187 0.9489 0.9473 0.0518 0.0526 0.0510 0.2248
9 93 4 6 90 94.8187 0.9375 0.9587 0.0518 0.0606 0.0426 0.2286
10 92 5 7 89 93.7824 0.9271 0.9485 0.0622 0.0707 0.0532 0.2262
Mean 93.8521 0.9388 0.9387 0.0615 0.0595 0.0636 0.2258
Sd.dev. 0.6963 0.0108 0.0145 0.0069 0.0108 0.0178 0.0022
Table 3: Tabular results for 10-fold cross validation for all folds (Decision tree C5)
Fold
No.
TP FN FP TN Acc. (%)
Spe.
Sen. CVE rate
P (Prec)
N (Prec)
BVE rate
1 85 20 23 65 77.7202 0.7386 0.8095 0.2228 0.2129 0.2353 0.2545
2 86 22 21 64 77.7202 0.7529 0.7963 0.3228 0.1963 0.2558 0.2533
3 86 22 19 66 78.7565 0.7764 0.7963 0.2124 0.1809 0.2500 0.2558
4 85 23 19 66 78.2383 0.7764 0.7870 0.2176 0.1826 0.2584 0.2554
5 84 19 23 67 78.2383 0.7444 0.8155 0.2176 0.2149 0.2209 0.2556
6 83 23 19 68 78.2383 0.7816 0.7830 0.2176 0.1862 0.2527 0.2556
7 84 21 21 67 78.2383 0.7613 0.8000 0.2176 0.2000 0.2386 0.2574
8 82 21 20 70 78.7565 0.7777 0.7961 0.2124 0.1961 0.2308 0.2566
9 82 18 21 72 79.7927 0.7742 0.8200 0.2021 0.2038 0.2000 0.2547
10 86 21 20 66 78.7565 0.7674 0.8037 0.2124 0.1887 0.2414 0.2566
Mean 78.4455 0.7652 0.8008 0.2161 0.1963 0.2384 0.2556
Sd.dev. 0.6082 0.0152 0.0118 0.0049 0.0119 0.0179 0.0012
Table 4: Tabular results for 10-fold cross validation for all folds (Logical regression)
Fold
No.
TP FN FP TN Acc. (%)
Spe.
Sen. CVE rate
P (Prec)
N (Prec)
BVE rate
1 79 25 27 62 73.06 0.6966 0.7596 0.2694 0.2547 0.2874 0.3254
2 81 24 25 63 74.61 0.7159 0.7714 0.2539 0.2358 0.2759 0.3266
3 84 22 26 63 75.38 0.7079 0.7925 0.2462 0.2364 0.2588 0.3254
4 78 26 22 69 75.38 0.7582 0.7500 0.2462 0.2200 0.2737 0.3266
5 76 25 23 71 75.38 0.7553 0.7525 0.2462 0.2323 0.2604 0.3214
6 80 29 23 71 74.38 0.7553 0.7339 0.2562 0.2233 0.2900 0.3298
7 82 24 25 64 74.87 0.7191 0.7736 0.2513 0.2336 0.2727 0.3278
8 81 25 23 64 75.13 0.7356 0.7642 0.2487 0.2212 0.2808 0.3215
9 77 22 27 69 74.87 0.7188 0.7778 0.2513 0.2596 0.2417 0.3268
10 82 25 25 63 74.36 0.7160 0.7664 0.2564 0.9636 0.2840 0.3245
Mean 74.75 0.7279 0.7642 0.2526 0.2351 0.2756 0.3256
Sd.dev. 0.7113 0.0218 0.0163 0.0071 0.0132 0.0149 0.0026
International Journal of Advances in Engineering & Technology, Mar. 2014.
©IJAET ISSN: 22311963
250 Vol. 7, Issue 1, pp. 242-254
In this study, the models were evaluated based on the accuracy measures discussed above
(classification accuracy, sensitivity and specificity). We have used sensitivity analysis to gain some
insight into the decision variables used for the classification problem. Sensitivity analysis is a method
for extracting the cause and effect relationship between the inputs and outputs of a neural network
model. The results were achieved using 10 fold cross-validation for each model, and are based on the
average results obtained from the test dataset (the 10th fold) for each fold. In comparison to the above
studies, we found that the ANN model achieved a classification accuracy of 93.852% with a
sensitivity of 0.9387 and a specificity of 0.9387. However, the ANN preformed the best of the three
models evaluated. The logistic regression model achieved a classification accuracy of 74.74385%
with a sensitivity of 0.7642 and a specificity of 0.7279. The decision tree (C5) achieved a
classification accuracy of 78.4456% with a sensitivity of 0.8008 and a specificity of 0.7652. Tables
(2-4) show the complete set of results in a tabular format. For each fold of each model type, the
detailed prediction results of the validation datasets are presented in form of confusion matrices. A
confusion matrix is a matrix representation of the classification results. Once the confusion matrixes
were constructed, the accuracy, sensitivity and specificity of each fold were calculated using the
respective formulas presented in the previous section. The average is computing time in 852, 1005
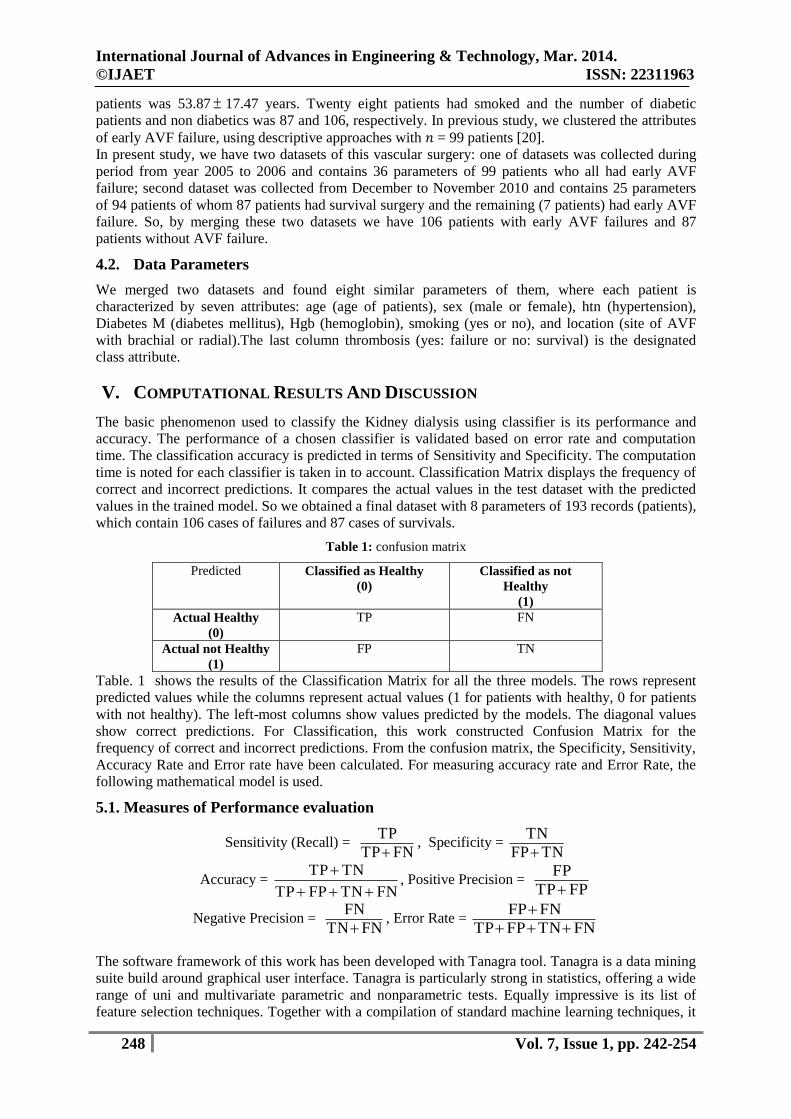
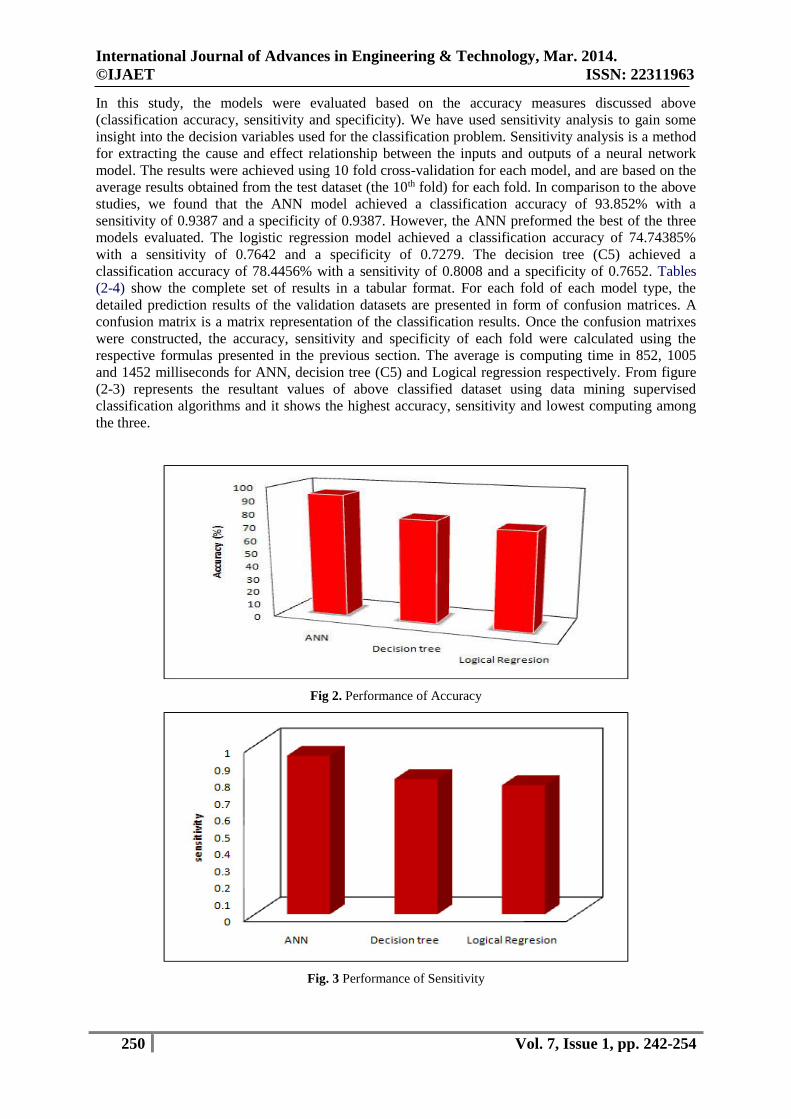
and 1452 milliseconds for ANN, decision tree (C5) and Logical regression respectively. From figure
(2-3) represents the resultant values of above classified dataset using data mining supervised
classification algorithms and it shows the highest accuracy, sensitivity and lowest computing among
the three.
Fig 2. Performance of Accuracy
Fig. 3 Performance of Sensitivity
International Journal of Advances in Engineering & Technology, Mar. 2014.
©IJAET ISSN: 22311963
251 Vol. 7, Issue 1, pp. 242-254
VI. CONCLUSIONS
The main goal medical data mining techniques is to get best algorithms that describe given data from
multiple aspects. The algorithms are very necessary for intend an automatic classification tools. The
artificial neural net works was the best one among three (five criteria are satisfied). Three axis are
used the redundancy cut value is 0.025, positive and negative values are predicted based on the recall
and 1-precision values. It can be classified as function as positive and negative and finally constant
value of positive and negative. The average is computing time in 852 milliseconds it is the lowest,
second one is Cross Validation error rate is 0.0615, If the precision value is less than 0.0595, fourth
one Bootstrap Validation error rate is 0.2258 lowest (i.e. repetition is 1, test error rate 0.2289,
Bootstrap, Bootstrap+) compare to others and finally three values (Accuracy, Specificity and
Sensitivity) are calculated by using formula and the prediction one is Accuracy. Then the Accuracy of
ANN is 93.8521%. From the above results ANN algorithm plays a vital role in data mining
techniques. ANN shows better results. The performance of ANN shows the high level compare with
other two techniques. Hence ANN shows the concrete results with Kidney dialysis of patient records.
Therefore ANN is suggested for Kidney dialysis to get better results with accuracy and performance.
ABBREVIATIONS
AVF: Arterio Venous Fistula
AVG: Arterio Venous Graft
CDC: Centers for Disease Control and Prevention
CKD: Chronic kidney disease
CVC: Central venous catheter
DM: Diabetes mellitus
DT: Decision tree
ESRD: End-stage renal disease
HD: Hemodialysis
HKC: Hasheminejad Kidney Center
IREP: Incremental reduced error pruning
KDD: Knowledge discovery in databases
MS: Master of Science
NKF: National Kidney Foundation
RIPPER: Repeated incremental pruning
to produce error reduction
TDIDT: Top-down induction of decision trees
TMU: Tarbiat Modares University
TUMS: Tehran University of Medical Sciences
USRDS: United States Renal Data System
VA: Vascular access.
VII. FUTURE WORK
The effectiveness of models was tested using different data mining methods. The purpose is to
determine which model gave the highest percentage of correct predictions for diagnosing patients with
a major life threatening diseases. The purpose of this study is to investigate the use of different
classifiers as tools for data mining, predictive modelling and data processing in the prognosis of
diseases. The goal of any modelling exercise or the best technique is to extract as much information as
possible from available data and provide an accurate representation of both the knowledge and
uncertainty about the epidemic. The prediction of life threatening diseases survivability has been a
challenging research problem for many researchers. Since the early dates of the related research, much
advancement has been recorded in several related fields. For instance, thanks to innovative biomedical
technologies, better explanatory prognostic factors are being measured and recorded; thanks to low
cost computer hardware and software technologies, high volume better quality data is being collected
and stored automatically; and finally thanks to better analytical methods, those voluminous data is
International Journal of Advances in Engineering & Technology, Mar. 2014.
©IJAET ISSN: 22311963
252 Vol. 7, Issue 1, pp. 242-254
being processed effectively and efficiently. Therefore, the main objective of this thesis is to report on
a research where we took advantage of those available technological advancements to develop
prediction and diagnosis models for major life threatening diseases survivability. The advancement in
computing technology, the reliability of computers, coupled with the development of easy-to-use but
nevertheless sophisticated software has led to significant changes in the way that data are collected
and analyzed. Computations has shifted from off-site main frames, dependent on highly trained
operators and located in special rooms accessible only to certain authorized staff, to the more
accessible desktop and laptop computers. This accessibility has resulted in an increasing number of
researches in data mining in which hidden predictive information are extracted from large databases,
using techniques from database research, artificial intelligence and statistics, to a wide variety of
domains such as finance, manufacturing and medicine. Predictive and Diagnosis data mining in
Medicine is a relatively new research area, which combines sophisticated representational and
computing techniques with the insights of expert physicians to produce tools for improving health
care. In future this work is extended by collecting real dataset in the clinical laboratory.
REFERENCES
[1]. M. K. Zadeh, Z. Omrani, N. Najmi et al., “Prevalence and survival of hemodialysis vascular access in
end-stage renal disease (ESRD) patients of Tehran, Iran,” Annals of Iranian Medicine, vol. 3, no. 8, pp.
37–40, 2006.
[2]. J. V. Tushar, “Dialysis vascular access selection in elderly patients,” US Nephrology, vol. 6, no. 2, pp.
128-130, 2011.
[3]. R. Fluck and M. Kumwenda, “UK Renal Association Clinical Practice Guidelines for Vascular Access,
2008–2011,” final version, 2011, http://www.renal.org/Libraries/Guidelines/Vascular Access for
Haemodialysis - Final Version-05 January 2011. sflb.ashx .
[4]. B. Gerald, “Fistula first has resulted in an Increase in catheter use, 6th annual controversies in dialysis
access,” Journal of Vascular Access, vol. 10, pp. 284-285, 2009.
[5]. G. A. Beathard,P.Arnold, J. Jacksonet al., “Aggressive treatment of early fistula failure. Physician
operators forum of RMSlifeline,” Kidney International, vol. 64, pp. 1487-1494, 2003.
[6]. U. Fayyad, G. Piatetsky-Shapiro, and P. Smyth, “From data mining to knowledge discovery in
databases,” AIMagazine, vol.17, no. 3, pp. 37-53, 1996.
[7]. H. C. Koh and G. Tan, “Data mining applications in healthcare,”Journal
ofHealthcareInformationManagement, vol. 19,no. 2, pp.64-72, 2005.
[8]. S. Biafore, “Predictive solutions bring more power to decisionmakers,” HealthManagement Technology,
vol. 20, no. 10, pp. 12–14, 1999.
[9]. R. Bellazzi, C. Larizza, P.Magni, and R. Bellazzi, “Temporal datamining for the quality assessment of
hemodialysis services,”Artificial Intelligence in Medicine, vol. 34, no. 1, pp. 25–39, 2005.
[10]. M. F. Bries,Modeling of hemodialysis patient hemoglobin: a datamining exploration [M.S. thesis] ,
University of Iowa, 2007.
[11]. T. Knorr, L. Schmidt Thieme, and C. Johner, “Identifyingpatients at risk: mining dialysis treatment data,”
in Cooperationin Classification andData Analysis, pp. 131-140, Springer, Berlin,Germany, 2009.
[12]. Y. Altintas, H. Gokcen, M. Ulgu et al., “Analysing interactionsof risk factors according to risk levels for
hemodialysis patientsin Turkey: a data mining application,” Gazi University Journal ofScience, vol. 24,
no. 4, pp. 829-839, 2011.
[13]. Centers for Disease Control and Prevention (CDC), NationalChronic Kidney Disease Fact Sheet:
General Information andNational Estimates on Chronic Kidney Disease in the UnitedStates, 2010, U.S.
Department of Health and Human Services(HHS), CDC, Atlanta, Ga, USA, 2010.
[14]. National Kidney Foundation (NKF), “The Facts About ChronicKidney Disease (CKD),” National
Kidney Foundation, 2012,http://www.kidney.org/kidneydisease/aboutckd.cfm .
[15]. M. Rambod and F. Rafii, “Perceived social support and qualityof life in Iranian hemodialysis patients,”
Journal of NursingScholarship, vol. 42, no. 3, pp. 242–249, 2010.
[16]. S. C. Smeltzer, B. G. Bare, J. L. Hinkle, and K. H. Cheever,Medical Surgical Nursing, Lippincott
Williams & Wilkins,Philadelphia, Pa, USA, 11th edition, 2008.
[17]. USRDS, 2010 Annual Data Report, the USRDS end-stagerenal disease incident and prevalent quarterly
update, 2010,http://www.usrds.org/qtr/default.aspx .
[18]. M. Aghighi, A. HeidaryRouchi, M. Zamyadi et al., “Dialysis inIran,” Iranian Journal of Kidney
Diseases, vol. 2, no. 1, pp. 11–15,2008.
International Journal of Advances in Engineering & Technology, Mar. 2014.
©IJAET ISSN: 22311963
253 Vol. 7, Issue 1, pp. 242-254
[19]. J. Ethier, D. C. Mendelssohn, S. J. Elder et al., “Vascular accessuse and outcomes: an international
perspective fromthe dialysisoutcomes and practice patterns study,” Nephrology DialysisTransplantation,
vol. 23, no. 10, pp. 3219–3226, 2008.
[20]. M. M. Sepehri, M. KhavaninZadeh, M. Rezapour et al.,“A data mining approach to fistula surgery failure
analysisin hemodialysis patients,” in Proceedings of the 18th IranianConference of Biomedical
Engineering (ICBME ’11), pp. 15–20,December 2011.
[21]. W. Cohen, “Fast effective rule induction,” in Proceedings of the12th International Conference
onMachine Learning (ML ’95), pp.115–123, 1995.
[22]. I. H. Witten, M. Frank, and M. A. Hall, Data Mining: PracticalMachine Learning Tool and Technique
With Java Implementation,Morgan Kaufmann, San Francisco, Calif,USA, 3rd edition,2011.
[23]. A. B. S. Serapiao and A. C. Bannwart, “Knowledge discoveryfor classification of three-phase vertical
flow patterns of heavyoil from pressure drop and flow rate data,” Journal of PetroleumEngineering, vol.
2013, Article ID 746315, 8 pages, 2013.
[24]. J. Quinlan, C4.5: Programs for Machine Learning, MorganKaufmann, San Francisco, Calif, USA, 1993.
[25]. G. Ilczuk, R. Mlynarski, A. Wakulicz-Deja, A. Drzewiecka,and W. Kargul, “Rough set techniques for
medical diagnosissystems,” in Proceedings of the Computers in Cardiology, pp. 837–840, September
2005.
[26]. P. Cohen and D. Jensen, “Over fitting explained,” in Proceedingsof the 6th International Workshop on
Artificial Intelligence andStatistics, pp. 115–122, 1997.
[27]. R. R. Bouckaert, E. Frank, M. Hall et al., WEKA Manual forVersion 3-6-0, University of Waikato,
Hamilton, New Zealand,2008.
[28]. Mohammad Rezapour, MortezaKhavaninZadeh, and MohammadMehdi Sepehri, “Implementation of
Predictive Data Mining Techniques for Identifying Risk Factors of Early AVF Failure in Hemodialysis
Patients,” Computational and Mathematical Methods in Medicine, Volume 2013, Article ID 830745, 8
pages, http://dx.doi.org/10.1155/2013/ 830745.
[29]. Shital Shah, Andrew Kusiak, and Bradley Dixon, “Data Mining in Predicting Survival of Kidney
Dialysis Patients, in Proceedings of Photonics West - Bios 2003, Bass, L.S. et al. (Eds), Lasers in
Surgery: Advanced Characterization, Therapeutics, and Systems XIII, Vol. 4949, SPIE, Belingham, WA,
pp. 1-8 January 2003.
[30]. AndrewKusiak, Bradley Dixon and Shital Shah, “Predicting survival time for kidney dialysis patients: a
data mining approach,” Computers in Biology and Medicine, vol. 35, pp. 311–327, 2005.
[31]. [4] National Institute of Diabetes & Digestive & Kidney Diseases, National Kidney and Urologic
Diseases Information Clearinghouse, Your Kidneys and How They Work, NIH Publication No. 02-4241.
February 2002, Website: www.niddk.nih.gov/health/kidney/ pubs/your kids/index.htm.
[32]. L. Sherwood, Human Physiology: From Cells to Systems, 3rd Edition, Wadsworth Publishing Company,
Albany, NY, 1993.
[33]. R. W. Hamilton, Principles of dialysis: diffusion, convection, and dialysis machines, in: W.L. Henrich,
W.M. Bennet (Eds.), Atlas of Diseases of the Kidney, Vol. 5, 1999, Website:
http://www.kidneyatlas.org/book5/adk5-01.ccc. QXD.pdf (On-line edition: ISN Informatics Commission
and NKF cyber Nephrology).
[34]. R. Bellazzi, C. Larizza, P. Magni, R. Bellazzi, S. Cetta, “Intelligent Data Analysis Techniques for
Quality Assessment of Hemodialysis Services”, Accessed on 2002, April 30, Website:
http://magix.fri.uni-lj.si/idamap2001/papers/bellazzi.pdf.
[35]. The United States Renal Data Systems, April 30, 2002, Website: www.usrds.org.
[36]. Sriram.N, Data mining approaches for kidney dialysis treatment. Journal of Mechanics in Medicine and
Biology, 6 (2). pp. 109-121, 2006.
[37]. Jinn-Yi Yeh, Tai-Hsi Wu and Chuan-Wei Tsao, “Using data mining techniques to predict hospitalization
of hemodialysis patients,”Data supporting systems, vol. 50 (2), pp. 439-448, Jan. 2011.
[38]. Haykin S. Neural networks: a comprehensive foundation. New Jersey: Prentice Hall; 1998.
[39]. Hornik K, Stinchcombe M, White H. Universal approximation of an unknown mapping and its
derivatives using multilayer feed forward network. Neural Netw, vol. 3, pp. 359-366, 1990.
[40]. Quinlan J. Induction of decision trees. Mach Learn, vol. 1, pp. 81-106, 1986.
[41]. Quinlan J. C4.5: programs for machine learning. San Mateo, CA: Morgan Kaufmann; 1993.
[42]. Breiman L, Friedman JH, Olshen RA, Stone CJ.,“Classification and regression trees”, Monterey, CA:
Wadsworth & Brooks/Cole Advanced Books & Software; 1984.
[43]. Hastie T, Tibshirani R, Friedman J. “The elements of statistical learning”, New York, NY: Springer-
Verlag; 2001.
International Journal of Advances in Engineering & Technology, Mar. 2014.
©IJAET ISSN: 22311963
254 Vol. 7, Issue 1, pp. 242-254
AUTHORS BIOGRAPHY
K. R. Lakshmi received the B.Sc., degree from Dr.B.R.Ambedkar open university,
Hyderabad, in 2006 and has completed master degree in Computer Applications in 2010
from Sri Krishnadevaraya University, Anantapur, Andhra Pradesh, India. She is pursuing
Ph.D., in Computer Applications. Also she is a Director, IERDS, MaddurNagar, Kurnool,
Andhra Pradesh, India. Her teaching and research areas interests Data mining techniques.
She has six research publications in international well reputed journals.
Yagnam Nagesh received the B.Sc. degree in Mathematics, Physics and Chemistry from
the Sri Krishnadevaraya University, Anantapur, Andhra Pradesh, India in 1995, the
M.C.A. degree in from the Sri Krishnadevaraya University, Anantapur, Andhra Pradesh, in
1998, the M.Tech., (Infomation Technology) degree from Punjabi University, Patiyala,
PUNJAB, in 2003, respectively. Currently, He is working in Assistant Professor in Assosa
University, Department of Computer Science, Ethiopia. His research areas include
Software Engineering and Data mining techniques. He has published 2 research paper
publications in national and international well reputed journals. MR.Yagnam Nagesh is
having 13 years of Teaching Experience National (8years) and International (5Years) Mr. Yagnam Nagesh may
be reached at [email protected], [email protected]
M. Veera Krishna received the B.Sc. degree in Mathematics, Physics and Chemistry
from the Sri Krishnadevaraya University, Anantapur, Andhra Pradesh, India in 1998,
the M.Sc. degree in Mathematics from the Sri Krishnadevaraya University, Anantapur,
Andhra Pradesh, in 2001, the M.Phil and Ph.D. degree in Mathematics from Sri
Krishnadevaraya University, Anantapur, Andhra Pradesh, in 2006 and 2008,
respectively. Currently, He is an in-charge of Department of Mathematics at
Rayalaseema University, Kurnool, Andhra Pradesh, India. His teaching and research
areas include Fluid mechanics, Heat transfer, MHD flows and Data mining techniques.
He has published 48 research papers in national and international well reputed journals.
Copyright © 2022 FDOKUMEN


![HKIFM CPD MVAC.ppt [\254\333\256e\274\322\246\241]](https://static.fdokumen.com/doc/165x107/63175591c72bc2f2dd056c30/hkifm-cpd-mvacppt-254333256e274322246241.jpg)


![100019.ppt [\254\333\256e\274\322\246\241]](https://static.fdokumen.com/doc/165x107/631ce499b8a98572c10d1be1/100019ppt-254333256e274322246241.jpg)


![100040.ppt [\254\333\256e\274\322\246\241]](https://static.fdokumen.com/doc/165x107/633baafca215b3a22b0d61d3/100040ppt-254333256e274322246241.jpg)