26-3jesa.pdf - Africa Portal
143
Sponsored by the Department of Science and Technology Volume 26 Number 3 • August 2015
-
Upload
khangminh22 -
Category
Documents
-
view
2 -
download
0
Transcript of 26-3jesa.pdf - Africa Portal

Sponsored by the Department of Science and Technology
Volume 26 Number 3 • August 2015

CONTENTS
2 Reliability benefit of smart grid technologies: A case for South AfricaAngela Masembe
10 Low-income resident’s preferences for the location of wind turbine farms in the Eastern Cape Province, South AfricaJessica Hosking, Mario du Preez and Gary Sharp
19 Identification and characterisation of performance limiting defects and cell mismatch inphotovoltaic modulesJacqui L Crozier, Ernest E van Dyk and Frederick J Vorster
27 A perspective on South African coal fired power station emissionsIlze Pretorius, Stuart Piketh, Roelof Burger and Hein Neomagus
41 Modelling energy supply options for electricity generations in TanzaniaBaraka Kichonge, Geoffrey R John and Iddi S N Mkilaha
58 Options for the supply of electricity to rural homes in South AfricaNoor Jamal
66 Determinants of energy poverty in South AfricaZaakirah Ismail and Patrick Khembo
79 An overview of refrigeration and its impact on the development in the Democratic Republic of Congo Jean Fulbert Ituna-Yudonago, J M Belman-Flores and V Pérez-García
90 Comparative bioelectricity generation from waste citrus fruit using a galvanic cell, fuel cell and microbial fuel cellAbdul Majeed Khan and Muhammad Obaid
100 The effect of an angle on the impact and flow quantity on output power of an impulse water wheel modelRam K Tyagi
CONFERENCE PAPERS
105 Harnessing Nigeria’s abundant solar energy potential using the DESERTEC modelUdochukwu B Akuru, Ogbonnaya I Okoro and Chibuike F Maduko
111 Efficiency analysis of an induction motor with direct torque and flux control at a hot rolling millRupert Gouws
116 Contemporary wind generatorsUdochukwu Bola Akuru and Maarten J Kamper
125 Impact of renewable energy deployment on climate change in NigeriaUdochukwu B Akuru, Ogbonnaya I Okoro and Edward Chikuni
135 Details of authors140 Site usage reports for the JESA
Volume 26 Number 3 • August 2015
Abstract
The South African power industry faces many chal-lenges, from poor performing networks, a shortageof generation capacity to significant infrastructurebacklog and an ageing work force. According to theDevelopment Bank of South Africa (DBSA), the keychallenge facing the industry is ageing infrastruc-ture. Smart grid technologies are a class of tech-nologies that are being developed and used by util-ities to deliver electrical systems into the 21st centu-ry using computer-based remote control andautomation. The main motive towards smart gridtechnologies is to improve reliability, flexibility,accessibility and profitability; as well as to supporttrends towards a more sustainable energy supply.This study identifies a number of smart grid tech-nologies and examines the impact they may haveon the distribution reliability of a test system. Thecomponents on the selected test system are thesame as those found on a South African feeder. Thebulk of the load in test system was modelled usingload data collected in South Africa. This study willconsider a number of different cases, with the basecase incorporating the impact of aged infrastructureon the reliability of the system. The smart grid tech-nologies were then introduced into the system andtheir impact on distribution reliability was deter-mined. These different cases were also compared tothe alternative of replacing the aged and worn outinfrastructure with new infrastructure. The findingsof this study indicate that the identified smart gridtechnologies improve the reliability of the system,mainly by decreasing the outage duration experi-enced by customers on the network. An even betterperformance was achieved when the ageing infra-structure was replaced with new infrastructure.
Keywords: distribution reliability, smart grid, feederautomation
1. Introduction
The distribution sub-system in South Africa, muchlike many other countries in the world, is still basedon 20th century technology (DBSA, 2012).According to NELT (2007) and SANEDI (2012a),20th century technology cannot efficiently sustain a21st century economy, and power networks need tobe ‘modernized’. A report released in 2007 by theNational Energy Regulator of South Africa(NERSA) on the state of the Electricity DistributionIndustry (EDI) infrastructure, indicated thatalthough there were pockets of good performance,assets needed urgent rehabilitation and investment(NERSA, 2007). A study conducted in 2008 by EDIHoldings on the state of the distribution grid of thecountry, revealed that the distribution grid infra-structure was ageing and poorly maintained, andthat its state was steadily deteriorating. The studyestimated that the maintenance, refurbishment andstrengthening backlog in the distribution gridamounted to about 27.4 billion 2008 South AfricanRand (2008 ZAR). This backlog was growing at analarming rate of 2.5 billion ZAR per annum (EDIHoldings, 2008). The same study pointed out thatthe current practices in the EDI do not promotebusiness sustainability and economic growth. It alsohighlighted the fact that the increased use of anunder-maintained distribution grid could be apotential risk to the industry.
A more recent report released in 2012 by theDevelopment Bank of South Africa (DBSA) on theState of South Africa’s Economic Infrastructure,identified ageing infrastructure as the key challengefor the electricity generation, transmission and dis-tribution sectors. The other challenges faced in theSouth African power industry include: poor per-formance networks, shortage of generation capaci-ty, significant infrastructure backlog, ageing workforce, inability to effectively introduce renewableenergy options into the grid, and the inability toeffectively introduce demand response strategies(SANEDI, 2012b).
The term ‘smart grid’ refers to a class of tech-
2 Journal of Energy in Southern Africa • Vol 26 No 3 • August 2015
Reliability benefit of smart grid technologies:
A case for South Africa
Angela MasembeEnergy Research Centre, University of Cape Town
nologies that are being developed and used by util-ities to deliver electrical systems into the 21st centu-ry using computer-based remote control andautomation (NELT, 2007). Smart grid technologieshave been proposed as one of the possible meansof implementing new technologies and techniquesinto the grids of different countries (SANEDI,2012a). The main motive towards smart grid tech-nologies is to improve reliability, flexibility, accessi-bility and profitability; as well as to support trendstowards a more sustainable energy supply(Slootweg, 2009).
This paper will focus on the improvement smartgrid technologies could have towards improvingdistribution reliability.
2. Distribution reliability
Reliability may be defined as the probability of asystem performing its required tasks, adequately fora period of time and under set operating conditions(Billinton & Allan, 1992). This definition in itselfhighlights the uncertainty surrounding the ability ofthe power system to perform as desired, and there-fore, the purpose of power system reliability evalu-ation and assessment, is to try and quantify the reli-ability of a system for planning and decision mak-ing.
Reliability indices are used extensively in thepower system industry as a means to quantify andassess reliability. Reliability indices measure the fre-quency, duration and severity of disturbances onthe network and give insight into the performanceof the system. These indices can be regarded asbeing predictive indices or past performanceindices. The indices considered in this study areSystem Average Interruption Duration Index(SAIDI), System Average Interruption FrequencyIndex (SAIFI), Momentary Average InterruptionFrequency Index (MAIFI) and Expected Energy NotSupplied (EENS). These indices are calculated asfollows (Billinton & Allan, 1994; Brown, 2006):
SAIDI = (1)
MAIFI = (2)
SAIFI = (3)
EENS = Σ Li ri,jλi,j (4)
where: Li is the average load at load point i ri,j is the outage duration of load point i due to thefailure of load point jλi,j is the failure rate of load point i due to the fail-ure of load point j
In this study, a momentary interruption isdefined as an interruption with duration greaterthan 3 seconds but not longer than 5 minutes, asdefined by the NRS 048-6:2006 specification forthe Electricity Supply Industry for medium voltage(MV) and low voltage (LV) systems (Chatterton etal., 2006).
3. Smart grid technologies
Smart grid technologies refer to a group ofimproved technologies and concepts, that use digi-tal and other advanced technologies, to monitorand manage the transmission of electricity from allgeneration sources, to meet the varying electricitydemands of end users (IEA, 2011). In a broadsense, a “smart grid” refers to a conventional elec-tric power system equipped with these technologiesfor the purpose of reliability improvement, ease ofcontrol and management, integrating of distributedenergy resources and electricity market operations.
One of the most appealing advantages of smartgrid technologies is the reduced reaction andrestoration time. This is most apparent when a faulthas occurred. Ordinarily when a disturbance causesa fault on the network, grid operators are unable toidentify the exact location of the faulted section ofthe feeder. The repair crew are dispatched, andhave to perform trial and error switching actions oncircuit breakers and isolators, in an effort to find theexact location of the fault. This can take a consider-able amount of time during the day and more espe-cially at night or during unfavourable weather con-ditions, resulting in an increased outage duration(Kazemi, 2011). There are a number of smart gridtechnologies which have been developed in orderto reduce the fault location time. These are dis-cussed below:
i) Distance to fault estimator
Fault locators reduce the impact of faults as theyspeed up the restoration process, by allowing isolat-ing and switching operations to be performed muchfaster (Morales-España et al., 2009). Distance tofault estimators, are an optional module of moderndistribution protection equipment which can beused for estimating the fault location. When a faultoccurs, this module calculates the fault location as adistance from the substation to the fault. It can alsonotify the control centre or utility repair crew of thisinformation crew using a suitable communicationmedium. By using distance to fault estimators, amuch smaller zone of the distribution network isinspected for faults. However, when a feeder hasmultiple taps, there might be several probable faultlocations for the fault distance indicated by thismodule. In order to overcome this problem, dis-tance to fault estimators should be used in conjunc-tion with fault passage indicators (Kazemi, 2011).
Journal of Energy in Southern Africa • Vol 26 No 3 • August 2015 3
sum of customer interruption durationtotal number of customers
total no customer momentary interruptionstotal number of customers served
total no customer sustained interruptionstotal number of customers served
ii) Fault passage indicators
Fault passage indictors are devices which are locat-ed at strategic points along the feeder, and aredesigned to indicate whether fault current haspassed that particular point. They are usuallyinstalled at points where switching decisions can bemade. Fault passage indicators are able to distin-guish between fault current and load current.Several fault passage indicators installed along afeeder will enable quick identification of the passageof fault current. The status of these devices can berecognized remotely or by visiting its physical loca-tion. In the past, fault passage indicators could onlybe used in radial distribution networks, but there arenew generation fault passage indicators which canbe used in other electricity distribution networks(Newman, 1990; Kazemi, 2011; Nortech, 2013).
iii) Feeder automation
Feeder automation is an automatic control schemethat is used for automatic fault location, isolation,and service restoration (FLISR) in an electricity dis-tribution network. Utilizing modern computer tech-nology, micro-electronics and communication tech-nology, modern feeder automation technologiesconduct operations and risk assessments, in orderto make decisions regarding the operation of thedistribution feeders and the distribution grid as awhole (Huang et al., 2012).
An automated grid is self-healing and recoversquickly from faults. When a permanent fault occurs,the customers affected by the fault may be catego-rized into two groups. The first group of customersare those who will have to wait until the faultedfeeder section has been repaired. The second groupincludes those customers whose power supply hasbeen interrupted, but can be restored through themain or alternate supplies by means of switchingand isolating healthy and faulted feeder sections(Kazemi, 2011). In most cases, the second group islarger than the first group (Uluski, 2010; Kazemi,2011).
In the case of manually operated distribution
systems and feeders, the fault isolation and servicerestoration activities can only be done after the faulthas been located. However, feeder automation canreduce the outage duration and restore supply to asmany customers as possible by performing FLISRautomatically. Automatic FLISR can restore serviceto customers in one minute or less, resulting in sig-nificant reliability improvement compared to tradi-tional manual switching (Uluski, 2010; Kazemi,2011).
4. Experiment design
4.1 Reliability model
The reliability model is required to evaluate the sys-tem indices, which give an indication on the relia-bility of a network.
i) Test system
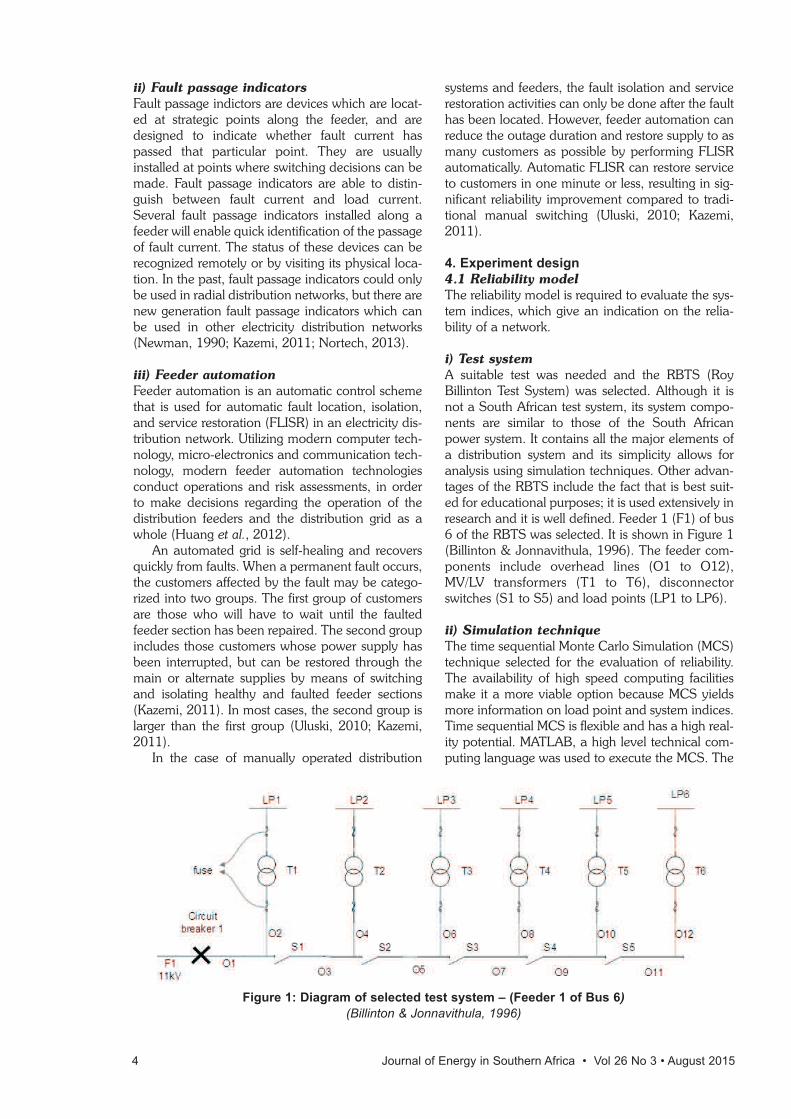
A suitable test was needed and the RBTS (RoyBillinton Test System) was selected. Although it isnot a South African test system, its system compo-nents are similar to those of the South Africanpower system. It contains all the major elements ofa distribution system and its simplicity allows foranalysis using simulation techniques. Other advan-tages of the RBTS include the fact that is best suit-ed for educational purposes; it is used extensively inresearch and it is well defined. Feeder 1 (F1) of bus6 of the RBTS was selected. It is shown in Figure 1(Billinton & Jonnavithula, 1996). The feeder com-ponents include overhead lines (O1 to O12),MV/LV transformers (T1 to T6), disconnectorswitches (S1 to S5) and load points (LP1 to LP6).
ii) Simulation technique
The time sequential Monte Carlo Simulation (MCS)technique selected for the evaluation of reliability.The availability of high speed computing facilitiesmake it a more viable option because MCS yieldsmore information on load point and system indices.Time sequential MCS is flexible and has a high real-ity potential. MATLAB, a high level technical com-puting language was used to execute the MCS. The
Figure 1: Diagram of selected test system – (Feeder 1 of Bus 6)
(Billinton & Jonnavithula, 1996)
4 Journal of Energy in Southern Africa • Vol 26 No 3 • August 2015
simulation algorithm adopted, was based on thetechnique developed by Billinton & Wang (1999).
The failure rates for the different system compo-nents in the MCS are given in Table 1. The inputparameters for the reliability study are given inTable 2.
Table 1: Component failure rates
(Allan et al., 1991)
System component Failure rate
Circuit breaker 1 0.006 (failures/yr)
O1-O12 0.065(failures/yr.km)
T1-T6 0.259 (failures/yr)
Table 2: Input parameters
Input parameter Average (hours)
Time To Locate Fault (TTLF) 1.5
Repair time (RT)
overhead lines 5
breaker 4
transformer 200
Switching time 1
Reclosing time 1minute
4.2 Load model
The incorporation of a load model, allowed for thedetermination of how much energy was not sup-plied to customers as a result of the interruptions.
The customer load model was developed usingdata from the RBTS data sheet and NRS data col-lected in South Africa. This study only consideredresidential and commercial customers. The cus-tomers at each load point were defined as shownbelow.
Table 3: Customer distribution of test system
Load point Number and type of customers
1 138 Residential
2 126 Residential
3 138 Residential
4 126 Residential
5 118 Residential+2 Commercial
6 118 Residential+3 Commercial
Total 764 Residential+5 Commercial
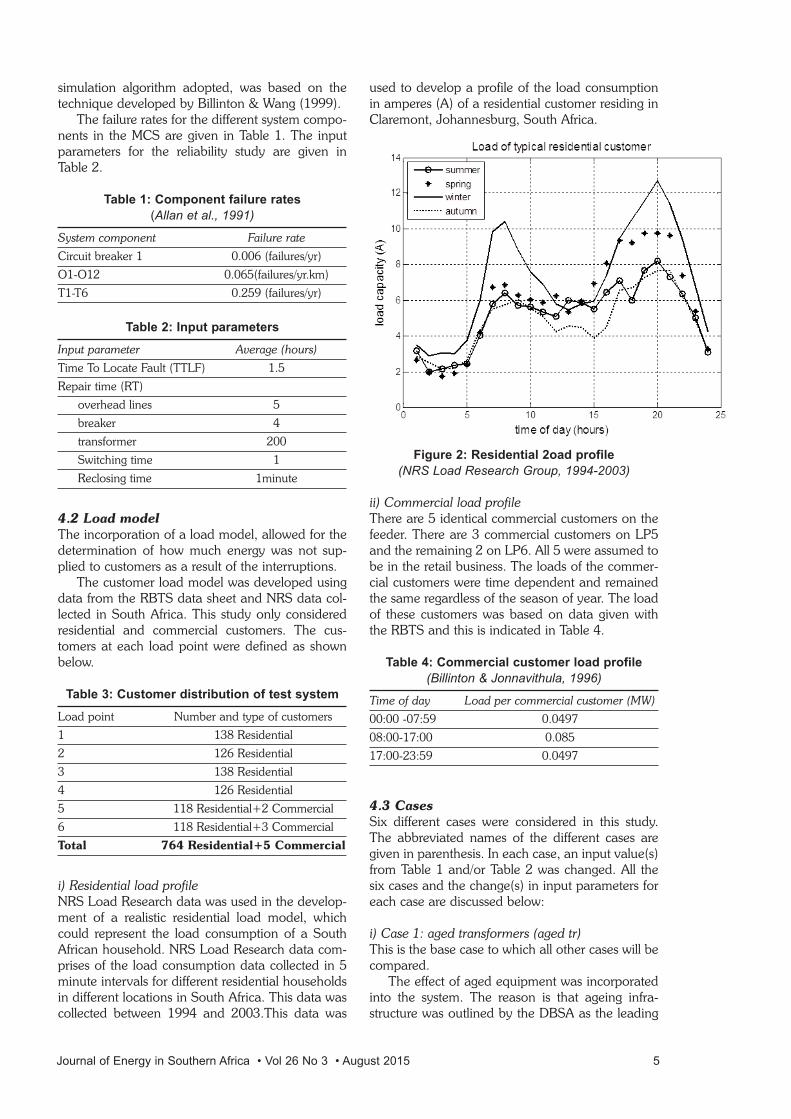
i) Residential load profileNRS Load Research data was used in the develop-ment of a realistic residential load model, whichcould represent the load consumption of a SouthAfrican household. NRS Load Research data com-prises of the load consumption data collected in 5minute intervals for different residential householdsin different locations in South Africa. This data wascollected between 1994 and 2003.This data was
used to develop a profile of the load consumptionin amperes (A) of a residential customer residing inClaremont, Johannesburg, South Africa.
Figure 2: Residential 2oad profile
(NRS Load Research Group, 1994-2003)
ii) Commercial load profileThere are 5 identical commercial customers on thefeeder. There are 3 commercial customers on LP5and the remaining 2 on LP6. All 5 were assumed tobe in the retail business. The loads of the commer-cial customers were time dependent and remainedthe same regardless of the season of year. The loadof these customers was based on data given withthe RBTS and this is indicated in Table 4.
Table 4: Commercial customer load profile
(Billinton & Jonnavithula, 1996)
Time of day Load per commercial customer (MW)
00:00 -07:59 0.0497
08:00-17:00 0.085
17:00-23:59 0.0497
4.3 Cases
Six different cases were considered in this study.The abbreviated names of the different cases aregiven in parenthesis. In each case, an input value(s)from Table 1 and/or Table 2 was changed. All thesix cases and the change(s) in input parameters foreach case are discussed below:
i) Case 1: aged transformers (aged tr) This is the base case to which all other cases will becompared.
The effect of aged equipment was incorporatedinto the system. The reason is that ageing infra-structure was outlined by the DBSA as the leading
Journal of Energy in Southern Africa • Vol 26 No 3 • August 2015 5
challenge facing the electricity industry. The effectof ageing was incorporated in the form of agedtransformers. Transformers represent a significantcost to the electric utilities, both as a capital invest-ment and as an ongoing operating expense. Theycan account for up to 20% of the total distributioncapital spending per annum (Van Zandt & Walling,2004). As transformers age, their internal conditiondeteriorates, increasing the risk of failure (Wang etal., 2002; Bartley, 2011). According to Bartley(2011), ageing transformers are a huge risk to theelectric power supply and could cause major losses.
All the transformers in this case were assumed tobe aged and worn out. The average failure rate oftransformers in this case was 0.259 failures/yearbased on data collected by Jagers & Tenbohlen(2009) on distribution transformers in South Africa.
ii) Case 2: Fault passage indicators and distance tofault estimators (FPI & DFE) This case investigated the effect of fault passageindicators and distance to fault estimators on thesystem performance of the base case. These smartgrid technologies assist in the location of faults afteran interruption has occurred. Therefore, for thiscase the input parameter, TTFL, was reduced to anaverage of 0.5 hours (Kazemi, 2011).
iii) Case 3: Feeder automation (feeder auto)The impact of feeder automation was investigatedin this case. Feeder automation implemented auto-matic FLISR. This procedure results in a decrease inboth the fault location time and switching time. Inthis case TTLF and switching time both had anaverage duration of 30 seconds (Uluski, 2010).
iv) Case 4: new transformers (new tr) Case 4 investigated the performance of the systemif all the transformers in the system were to bereplaced with new transformers. Hence, adecreased average transformer failure rate of 0.035failures/year (Jagers & Tenbohlen, 2009) was usedin this case.
v) Case 5: new transformers, fault passageindicators, distance to fault estimators (new tr &FPI and FDE)
This case considered the inclusion of new trans-formers, fault passage indicators and distance tofault estimators. The purpose of this case is to deter-mine the impact of fault passage indicators and dis-tance to fault estimators on a network with non-aged transformers.
vi) Case 6: new transformers and feederautomation (new tr & feeder auto)This case considered the inclusion of both newtransformers and feeder automation.
5. Results and analysis
5.1 SAIDI
The results of SAIDI for the different cases describedabove are given in Table 5. SAIDI gives an indica-tion of the average number of hours each customeron the feeder experiences with no electricity supplyin a calendar year due to a component in the net-work failing.
Table 5: SAIDI results
SAIDI (hours/customer year)
Case Magnitude Percentage difference
1. aged tr (base case) 9.10 -
2. FPI & DFE 8.83 -2.9%
3. feeder auto 8.19 -10.0%
4. new tr 0.27 -97.0%
5. new tr & FPI & DFE 0.24 -97.3%
6. new tr & feeder auto 0.20 -97.8%
From Table 5, it is evident that the base case has thehighest magnitude of SAIDI. A decrease in SAIDI isexperienced when fault passage indicators and dis-tance to fault estimators are introduced into the sys-tem. These smart grid technologies assist indecreasing the time it takes the repair crew to locatea fault. The impact of this is reflected in thedecrease in SAIDI.
An even greater decrease is realised when feed-er automation is implemented. Feeder automationdetects and isolates faults within 1 minute, allowingcustomers whose energy supply can be immediate-ly restored via switching, to be reconnected in ashorter period of time. It also facilitates in the quickidentification of faults to be attended to by therepair crew. These operations are responsible forthe decrease in SAIDI. For example, previously inthe base case, the failure of component O7 fromFigure 1, would result in customers of LP1 incurringan outage of about 2.5 hours but with the imple-mentation of automatic FLISR, this duration isreduced to 1 minute.
Case 4 explored replacing the aged transformerswith new transformers, which have a much lowerfailure rate. From Table 5, it is observable that alarge decline in SAIDI is experienced from the basecase to case 4. The main reason is the failure rate ofthe transformers. The transformers in the base caseare assumed to be worn out and aged, and there-fore they are more prone to failure. Transformersalso have the longest repair time of about 200hours, followed by overhead lines, with a repairtime of about 5 hours. Therefore, a decreased trans-former failure rate, as experienced in the case 4,results in a tremendous decrease in the outageduration experienced by customers. This drasticdecrease in outage duration is reflected in SAIDI.
6 Journal of Energy in Southern Africa • Vol 26 No 3 • August 2015
The incorporation of the selected smart gridtechnologies and new transformers was explored incases 5 and 6. A further decrease in SAIDI fromcase 4 was experienced, but the bulk of thedecrease is attributed to the implementation of thenew transformers.
5.2 SAIFI & MAIFI
The results of SAIFI for the different cases are givenin Table 6. SAIFI is the average number of sustainedinterruptions each customer on the feeder experi-ences in a calendar year due to a component in thenetwork failing. The magnitude of the frequency ofmomentary interruptions, MAIFI, is depicted inTable 7.
Table 6: SAIFI results
SAIFI (interruptions/customer year)
Case Magnitude Percentage difference
1. aged tr (base case) 0.73 -
2. FPI & DFE 0.73 0%
3. feeder auto 0.49 -32.8%
4. new tr 0.56 -23.3%
5. new tr & FPI & DFE 0.56 -23.3%
6. new tr & feeder auto 0.34 -53.4%
Table 7: MAIFI results
Case Magnitude
1. aged tr (base case) 0.00
2. FPI & DFE 0.00
3. feeder auto 0.23
4. new tr 0.00
5. new tr & FPI & DFE 0.00
6. new tr & feeder auto 0.22
The highest magnitude of SAIFI is experiencedin the base case. The magnitude of MAIFI in thebase case is 0, meaning all interruptions experi-enced in this case were sustained. The implementa-tion of passage indicators and distance to fault esti-mators had no impact on SAIFI and MAIFI. Thesetwo technologies do not affect the state or conditionof the main system components, but instead assistin the location of faults, after an interruption hasoccurred. They do not help to prevent the occur-rence of faults. Therefore, no impact on both SAIFIand MAIFI is observed in case 2. On the otherhand, the implementation of feeder automationresulted in a decrease in SAIFI and an increase inMAIFI. Feeder automation implements fault detec-tion, location and isolation. It then restores electricalenergy supply to customers who need not be dis-connected from the main supply. This group of cus-tomers instead experience a momentary interrup-tion, where they previously would have experi-
enced a sustained interruption. Therefore, theimplementation of feeder automation sees adecrease in SAIFI and an increase in MAIFI.
The magnitude of SAIFI in the case 4, wherenew transformers were introduced into the system,is much lower than that of the base case. This isattributed to avoided interruptions due to thedecreased transformer failure rate of the new trans-formers. No momentary interruptions were experi-enced in case 4. The magnitude of both SAIFI andMAIFI in case 5 is the same as that of cases 2 and4. As already mentioned, fault passage indicatorsand distance to fault estimators, have no impact onthe frequency of interruptions, therefore, the addi-tion of these technologies to case 4, would result inno impact to both SAIFI and MAIFI as observed incase 5.
SAIFI in case 6 dropped to less than half its mag-nitude in the base case. The implementation of newtransformers resulted in avoided interruptions,whereas feeder automation increased momentaryinterruptions and decreased sustained interruptionsby carrying out FLISR.
5.3 EENS
Table 8 compares the average amount of energynot supplied to the customers on the feeder in onecalendar year.
Table 8 EENS results
EENS (kWh/ year)
Case Magnitude Percentage difference
aged tr (base case) 58 848.92 -
FPI & DFE 54 555.47 -7.30%
Feeder auto 53 656.91 -8.80%
new tr 11 392.73 -80.6%
new tr & FPI & DFE 10 923.03 -81.4%
new tr & Feeder auto 9 434.54 -83.9%
The base case has the highest EENS becausethe EENS is directly related to the outage durationas given in equation 4. Therefore, the greater thedecrease in outage duration and failure frequency,the greater the decrease in EENS. Once the agedtransformers in the system were replaced with newtransformers, a decrease of about 80% was realizedin the unsupplied energy. The further integration ofsmart grid technologies into the system with newtransformers, results in an additional but smallerdecrease in the EENS magnitude.
The EENS represents the amount of energy thatthe customer could have consumed, but could notbecause they were disconnected from supply. Thiscould translate to different things for different sec-tors. For example in the commercial sector it couldmean a loss of sales and for the industrial sector, it
Journal of Energy in Southern Africa • Vol 26 No 3 • August 2015 7
could translate to the loss of production.
6. Conclusions
In this study, the reliability benefit of a number ofsmart grid technologies was examined. A feedercontaining all the fundamental components of adistribution grid i.e. fuses, transformers, overheadlines, circuit breaker and disconnector switches, wasselected from the RBTS and used as a test system.The load of the system consisted of mainly residen-tial customers and a few commercial customers.The loads of the residential customers were definedusing load data collected in South Africa. A numberof cases were considered where the identified smartgrid technologies were implemented. These werecompared to the base case which contained agedtransformers, since ageing was identified as the keychallenge the South Africa power industry is facing.
The key findings of this study point to following:i) The high failure rate of the transformers in the
base case contributed significantly to the failurefrequency. This is clearly indicated by thedecline in SAIFI when these aged transformersare replaced with new transformers. The agedtransformers also significantly increased the out-age duration because the average repair time ofthe transformers is very large (about 200 hours)compared to that of the other components in thesystem. This observation was apparent in thecomparison of SAIDI for the base case and case3. Each time a transformer failed, an outageduration equivalent to the repair time of 200hours was incurred. This drastically increasedSAIDI.
ii) Distance to fault estimators and passage faultindicators do not have an impact on SAIFI. Thisis because these technologies do not contributetowards the prevention of faults. On the otherhand, feeder automation has a positive impacton SAIFI and MAIFI. Feeder automation result-ed in a significant decrease in SAIFI and anincrease in MAIFI. The main reason for thiswould be the speed at which feeder automationlocates and isolates faults and then restores cus-tomers not directly impacted by a fault. Thisgroup of customers, not directly impacted by afault, would experience a momentary interrup-tion instead of a sustained interruption.
iii) The identified smart grid technologies had animpact on the reduction of TTLF. This impactwas carried through to SAIDI. Feeder automa-tion had a more of an impact on SAIDI than thedistance to fault estimators and fault passageindicators. Feeder automation prevents cus-tomers not directly impacted by the failure of acomponent from experiencing a sustained inter-ruption. Therefore, a potential outage durationof about 2.5 hours for a customer was reduced
to 1 minute.iv) The decrease in feeder outage duration, as a
result of the implementation of the identifiedsmart grid technologies, is carried through to theEENS of the feeder. The cases with higher out-age duration also experienced a higher EENS,because it is dependent on outage duration.
v) The findings have highlighted that the identifiedsmart grid technologies have no impact on thefrequency and rate of interruptions, butdecrease the total outage duration of the feeder.They also pinpointed that a network with agedinfrastructure has a much higher failure rate, andthat this increase is carried through to theincreased outage duration of the system. Whenthe aged transformers were replaced with newtransformers, the SAIDI, SAIFI and EENSdecreased drastically and with some of theseindices, it more than halved. None of the select-ed smart grid technologies had as much of apositive impact on the system reliability as thenew transformers. This therefore stresses theimportance of first identifying and correcting theroot causes of the underlying problems in thesystem before investing in further technologies,which may not address these fundamental prob-lems adequately.
ReferencesAllan, R.N. et al., (1991). A Reliability Test System for
Educational Purposes. IEEE Transactions on PowerSystems, 6(2), pp.813-20.
Bartley, W.H., (2011). Ageing Transformers Are A RiskTo The Electric Power Supply. Hartford SteamBolier Inspection and Insurance Company.
Billinton, R. & Allan, R.N., (1992). Reliability Evaluationof Engineering Systems. 2nd ed. New York, UnitedStates of America: Plenum Press.
Billinton, R. & Jonnavithula, S., (1996). A Test SystemFor Teaching Overall Power System ReliabilityAssessment. IEEE Transactions on Power Systems,11(4), pp.1670-76.
Billinton, R. & Wang, P., (1999). Teaching distributionsystem reliability evaluation using Monte-Carlo simu-lation. IEEE Transactions on Power Systems., 14(2),pp.397-403.
Chatterton, B., IARC & Eskom Holdings, (2006). NRS048-6:2006:Part 6: Distribution Network InterruptionPerformance Measurement and Reporting Standard.
DBSA, (2012). South Africa: State of EconomicInfrastructure. Development Bank of South Africa.
EDI Holdings, 2008. Approach to Asset DistributionManagement. Business Plan. Eskom DistributionIndustry.
Huang, B.B., Xie, G.H., Kong, W.Z. & Li, Q.H., (2012).Study on Smart Grid and Key Technology System toPromote the Development of DistributedGeneration. In IEEE Power and Energy SocietyInnovative Smart Grid Technologies – Asia. Tianjin,
8 Journal of Energy in Southern Africa • Vol 26 No 3 • August 2015
Journal of Energy in Southern Africa • Vol 26 No 3 • August 2015 9
2012. IEEE.IEA, (2011). Technology Roadmap: Smart Grids. Paris,
France, 2011.Jagers, J. & Tenbohlen, S., (2009). Evaluation of
Transformer Reliability Data Based on National andUtility Statistics. In 16th International Symposium onHigh Voltage Engineering. Cape Town, South Africa,2009.
Kazemi, S., (2011). Reliability Evaluation of SmartDistribution Grids. PhD Thesis. Helsinki, Finland:Aalto Print Aalto University.
Morales-España, G., Mora-Flórez, J. & Vargas-Torres,H., (2009). Elimination of Multiple Estimation forFault Location in Radial Power Systems by UsingFundamental Single-End Measurements. IEEETransactions on Power Delievery, 24(3), pp.1382-89.
NELT, (2007). The Modern Grid Initiative. USA:National Energy Technology Laboratory Office ofElectricity Delivery and Energy Reliability.
NERSA, (2007). State of EDI Infrastructure. SouthAfrica: National Energy Regulator of South Africa.
Newman, T., (1990). Pole mounted fault passage indica-tors. In IEE Colloquium on Improving SupplySecurity on 11 kV Overhead Networks. London,1990. IET.
Nortech, (2013). Remote Monitoring System for FaultPassage Indicators.
NRS Load Research Group, 1994-2003. NRS LoadResearch data. Cape Town, South Africa: PowerSystems Research Group, Department of ElectricalEngineering, University of Cape town.
SANEDI, (2012a). A Smarter Grid: A Proposal forSouth Africa.
SANEDI, (2012b). Proposed Smart Grid StakeholderEngagement Approach. Energize.
Slootweg, H., (2009). Smart Grids – the future or fanta-sy?. The Netherlands, 2009.
Uluski, R.W., (2010). The Role of Advanced DistributionAutomation in the Smart Grid. In IEEE Power andEnergy Society General Meeting. Minneapolis,2010. IEEE.
Van Zandt, D. & Walling, R., (2004). DSTAR’sTransformer Cost Analysis Software Enhances UtilityDecision Process. General Electric Company.
Wang, M., Vandermaar, A.J. & Srivastava, K.D., (2002).Review of Condition Assessment of PowerTransformers in Service. IEEE Electrical InsulationMagazine, 18(6), pp.12-25.
Received 19 August 2014; revised 29 July 2015
Abstract
There is a general consensus that South Africashould be generating more power through harness-ing renewable energy resources, such as windpower. However, there is no consensus with regardto the location of such generating projects. Thispaper describes a wind farm project proposed fordevelopment in the Kouga Local Municipality,reports low-income local residents’ preferences onits nature and applies choice modelling to analysethese preferences. A questionnaire was presented toeach respondent, the discrete choice experimentcomponent of the questionnaire included two dif-ferent onshore wind energy development scenariosand a status quo option. The scenarios differed bythe combination of four elements: the distance ofthe wind turbines from residential areas, job cre-ation, the number of turbines and a subsidy allocat-ed to each household. Keywords: wind, energy, underprivileged, welfare,preference, choice
1. Introduction
South Africa is the 12th largest emitter of green-house gasses in the world and responsible foralmost half of all emissions in Africa (EDF, 2014) inlarge part because the majority of electricity inSouth Africa is produced from coal. In order forSouth Africa to reduce its carbon emissions andcomply with the UN Framework Convention onClimate Change and the Kyoto Protocol, Eskom, itsleading electricity supplier, is committed to diversi-fying its energy mix (DEA, 2011; SAinfo Reporter,2008; UNEP, 2009; Gets & Mlanga, 2013). Thequest to reduce carbon emissions has led to a driveto increase the percentage of energy produced byrenewable and sustainable sources. The most
prominent of these sources today is wind energy.There are wind farms currently being developed inSouth Africa in both the Western Cape and EasternCape provinces of South Africa.
The reason wind is favoured as a source for thegeneration of electrical energy is because windresources are easily harnessed through the use ofwind turbine technology (Edkins, Marquard &Winkler, 2010). By the end of 2010, wind energyprojects in South Africa had an installed capacity of10 MW (WWEA, 2011). The goal of the SouthAfrican government was to generate approximately10 000 GWh of electricity through renewable ener-gies by 2013 (Edkins et. al. 2010; Eskom, 2015).This would require the installed capacity of windpower to be increased dramatically. The introduc-tion of a Renewable Energy Feed-In Tariff (REFIT)in 2009 incentivised independent power producersto propose different renewable power projectsthroughout South Africa. Several of these proposalshave caused concern for coastal communities. Themajority of these concerns are environmental andlocation related.
Their concerns are that wind turbines may(Binopoulos & Haviaropoulos, 2010):• increase road development in ecologically sensi-
tive areas; • detract from the visual appeal of an area, thus
affecting real estate values, and impacting aregion’s culture and heritage;
• increase industrial noise in the area in whichthey are erected;
• negatively impact on fauna and flora, e.g., dis-courage bird migration into the area; and
• reduce other development opportunities, e.g.flight paths for airports.
The negative externalities of wind energy are ofgreatest concern to the communities in the vicinity
Low-income resident’s preferences for the location of wind
turbine farms in the Eastern Cape Province, South Africa
Jessica Hosking1
Mario du Preez2
Gary Sharp2
1. Insight Analysis
2 Nelson Mandela Metropolitan University, Summerstrand Campus, Port Elizabeth, South Africa
10 Journal of Energy in Southern Africa • Vol 26 No 3 • August 2015
of the wind farms – this is because wind turbines aresite specific (Pasqualetti, 2011). These communitiesmay also derive benefits from wind energy in theform of employment creation, increased electricitysupply and increased tourism to the area. The com-munities that are located nearest to big industrydevelopments (factories, power stations etc.) arecharacterised as poor or low income or underprivi-leged (Siegfried, 2014; PRB, 1998). Such locationsmay be chosen by pure coincidence. Or, it may bethat these communities tend to underestimate thenegative environmental costs related to these proj-ects, relative to the new jobs prospect benefitclaimed for such developments, thus more easilyenabling development in these areas than in morewell-to-do areas. Whatever, the case, the prefer-ences of low income residents and how their happi-ness is influenced by various features of wind farmconstruction near their places of residence clearlymatter. For this reason, this paper has selected tofocus attention on this issue.
A number of studies have been conducted toassess the positive and negative environmental andsocial impacts that arise from the construction ofwind farms (Wolsink, 2007; Pasqualetti, 2011;Slattery, Johnson, Swofford & Pasqualetti, 2012).These studies highlight the issues pertaining to windfarms through analysis of public opposition withPasqueletti (2005) indicating that there are five keyissues (immobility, immutability, solidarity, imposi-tion and place). Krohn and Damborg (1999) andSlattery et al. (2012) are in agreement that propo-nents of wind energy focus on the benefits asopposed to opponents that share a negative attitudetowards the aspects of wind energy, with the over-arching view that public opinion on the issues is notstraightforward and is complex in nature. A numberof studies have also attempted to quantify theeffects of the erection of wind turbines in specific
locations (Ek, 2002; Krueger, 2007; Ladenberg &Dubgaard, 2007; Hanley et al., 2001; Alfarez-Farizo& Hanley, 2002).
The way in which these studies compare thecosts and benefits of wind turbine erection in certainlocations is through an analysis of the trade-offs res-idents in the area of the prospective wind farmswould be prepared to make in their assessment ofvarious potential impacts. A methodology for esti-mating these trade-offs is the choice experimentvariant of the Choice Modelling Technique(Hensher et al., 2005). This paper aims to estimatesome of these trade-offs by offering an analysis of asurvey on the different aspects of wind energydevelopments conducted with underprivileged resi-dents of the Kouga Local Municipality.
2. A proposal to harness wind energy in the
Kouga Municipality
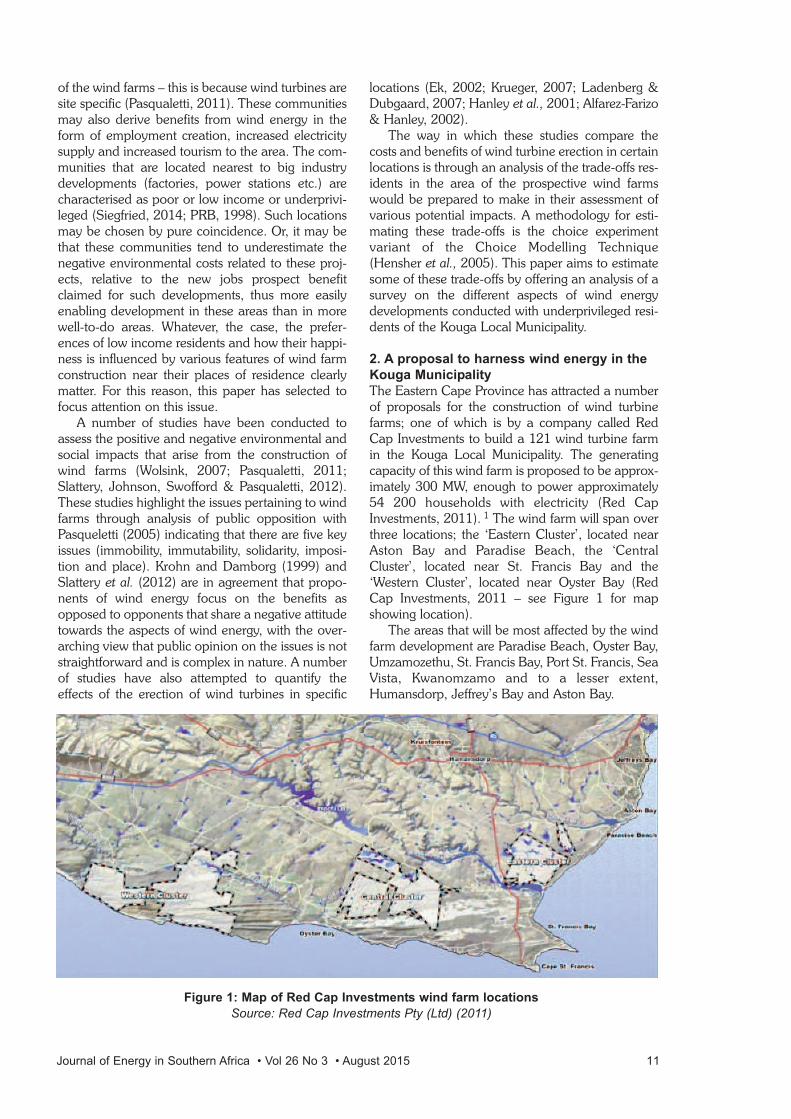
The Eastern Cape Province has attracted a numberof proposals for the construction of wind turbinefarms; one of which is by a company called RedCap Investments to build a 121 wind turbine farmin the Kouga Local Municipality. The generatingcapacity of this wind farm is proposed to be approx-imately 300 MW, enough to power approximately54 200 households with electricity (Red CapInvestments, 2011). 1 The wind farm will span overthree locations; the ‘Eastern Cluster’, located nearAston Bay and Paradise Beach, the ‘CentralCluster’, located near St. Francis Bay and the‘Western Cluster’, located near Oyster Bay (RedCap Investments, 2011 – see Figure 1 for mapshowing location).
The areas that will be most affected by the windfarm development are Paradise Beach, Oyster Bay,Umzamozethu, St. Francis Bay, Port St. Francis, SeaVista, Kwanomzamo and to a lesser extent,Humansdorp, Jeffrey’s Bay and Aston Bay.
Figure 1: Map of Red Cap Investments wind farm locations
Source: Red Cap Investments Pty (Ltd) (2011)
Journal of Energy in Southern Africa • Vol 26 No 3 • August 2015 11
Resistance to the erection of the turbines at cer-tain locations has come from the better-off residentsand businesses in the area (Meeting with St FrancisBay Residents Association, 2012). Many of theopponents to the wind turbine erections in theKouga municipality support the drive for cleanerenergy but they are unhappy at the prospect ofwind farms dominating the area surrounding them(this is characterised as the NIMBY syndrome)(Pasqualetti, 2011).
3. Background
Local critics have asserted that the wind farm devel-opment in the Kouga Local Municipality will nega-tively impact on the visual attractiveness of the land(landscape character), abundance of bird life,employment and in some cases property values inthe area (St Francis Bay Residents Association,2010). These impacts are typically cited as relevantin environmental impact assessments (EIA) of windfarms and clearly are important elements to consid-er in any comprehensive assessment of the merits ofbuilding a wind farm (Dimitropoulos & Kontoleon,2008). However, such factors are not of uniformimportance across all communities. They differaccording to social factors and general beliefs heldin the community (Alvarez-Farizo & Hanley, 2002).
For a given community it is possible to assessthis relative importance by means of discrete choiceexperiment (DCE) methodology (or conjoint analy-sis) (Hensher et al., 2005). It is a stated preferencetechnique that employs questionnaires in whichrespondents are required to choose between hypo-thetical scenarios. Typically these scenarios includea monetary payment or acceptance of some form ofcompensation element. By this inclusion it is possi-ble to estimate willingness to pay or acceptance ofcompensation for marginal changes to the givenscenario. DCE is a method frequently used to deter-mine the values of the environmental impacts thatare based mainly on perception. The technique isuseful in determining a scenarios impact on a pop-ulation in the absence of market trades that wouldotherwise reveal the preferences of the populationand therefore the impact.
3.1 Discrete choice experiments
12 Journal of Energy in Southern Africa • Vol 26 No 3 • August 2015
3.2 Compiling the questionnaire
An essential part of a DCE is creating an effectivesurvey tool that can provide relevant informationabout the respondents and their preferences. Thequestionnaire is constructed in four phases. Firstly,the researcher creates a description of all possiblecharacteristics that define the good to be analysed.Then a focus group is convened to ensure that onlythe relevant characteristics of the good are incorpo-rated into the questionnaire. The third phase is apilot study which is used to test the understandingand ease of the survey as well as identifying theappropriate bounds and levels for the cost attribute(Bateman and Willis, 1999). The last phase involvesfinalising the main questionnaire and administeringthe survey.
As this study was conducted in South Africa, adeveloping country, it is important to note that the
Journal of Energy in Southern Africa • Vol 26 No 3 • August 2015 13
distinct difference between this study and similarstudies conducted in industrialised nations is thatthe target respondent group for this study were low-income residents. This group was selected for twomain reasons. The first was that South Africa hassignificant inequalities in income distribution andan economy with dualistic features (Rosset, Patel &Courville, 2006). In a dual economy the behaviourof people varies according to the group to whichthey belong. The second is that low-income respon-dents are rarely included in studies of preference, sothere is a gap in describing their preferences to therelevant literature in South Africa. A possible reasonfor this gap is a perception that these respondentsare overwhelmingly influenced by price and jobincome prospects, rather than other factors, such asenvironmental impacts.
A focus group was conducted to address themain concerns of the wind farm development andcompile a provisional list of important wind farmattributes for inclusion in the choice experiment.Consultation with international literature and dis-cussions with informed residents resulted in therefinement to four key attributes, with three levelseach (Table 1).
Table 1: Attributes and levels included
in the DCE
Attribute Levels
Size of wind farm 10, 20, 53 turbines
Jobs Created 5, 20, 40
Proximity to residential areas 0.5km , 2km , 6km
Subsidy per household ZAR 3.25, ZAR 13, per month ZAR 19.5
Two physical wind farm characteristics wereincluded – one for the size of the wind farm in termsof number of turbines and proximity of the turbinesto residential areas in kilometres. An attribute foremployment possibilities from the wind farm devel-opment was highlighted as an important attributefor the low-income respondents and was alsoincluded in the DCE. The monetary attributeincluded was in the form of a subsidy, indicatingwillingness to accept (WTA) compensation asopposed to a price, indicating willingness to pay(WTP). A subsidy was chosen over a price forrenewable energy because it was assumed thatwind farm developments impose negative presencecosts on the residents in the surrounding areas, andthe residents surrounding the wind farm develop-ment were likely to have municipal property rightsthat would be infringed upon were the wind farm tobe built in proximity to their residence(Dimitropoulos & Kontoleon, 2008). The subsidytook the form of providing free (basic) electricity(South African Government Information, 2011).
Once the attributes and the levels were defined,
a main-effects-only, orthogonal and balanceddesign for the experiment was created in SPSS (ver-sion 12.01). As there were four attributes, each withthree corresponding levels, a total of 34 = 81 possi-ble treatment combinations of attribute levels wereidentified. A fractional factorial design was used toreduce this number to 27 treatment combinations.These combinations were randomly paired into 108choice sets (Hensher et. al., 2005). A total of 27unique questionnaires were created, each question-naire containing four choice tasks. A status quooption was added to each choice task.
The body of the questionnaire had four sections.The first two sections elicited information about therespondents’ understanding of wind energy. Thethird section contained the choice experiment. Fourpages were shown to the respondents. Each pagecontained two choice cards and each attribute onthe choice cards was represented by a picture. Therespondents were asked to choose between optionA, B and C, where option C was the status quo. Thefourth section contained questions about the socio-economic characteristics of the respondents. Thequestionnaire was simplified. Pictures were used toguide respondents with specific questions and toexplain the differences between the levels of theattributes. The survey team was comprised of mem-bers with fluency in either English or Afrikaans orisiXhosa.
A pilot survey was conducted to test the com-prehension and validity of the questionnaire. Thepilot survey included 27 respondents.
3.3 Sample description
A stratified sample of randomly selected heads ofhouseholds in the informal areas (townships) ofKwanomzamo, Sea Vista, Tokyo Sexwale, OceanView and Umzamowethu was included in the study.A total of 270 personal interviews of low-incomebracket households in the Kouga Local Municipalitywere conducted during a week in October 2012.The average household gross annual income for thesample was R30 800.89 or R2 600 per month.Table 2 shows the distribution of age, income andeducation of the sample group. The majority of therespondents were aged between 18 and 30 yearsold and had a low level of education.
4. Results
The econometric software NLOGIT (version 10)was used to compute the relevant utilities of thealternatives. The data matrix was in the form(Bergmann et. al., 2006):
Option A:
Va = β0a + β1Xsize + β2Xcluster/job
+ β3Xdistance + β4Xsubsidy [12]
14 Journal of Energy in Southern Africa • Vol 26 No 3 • August 2015
Option B:
Vb = β0b + β1Xsize + β2Xcluster/job
+ β3Xdistance + β4Xsubsidy [13]
Status quo option:
VSQ = β1Xsize + β2Xcluster/job + β3Xdistance
+ β4Xsubsidy [13]
where V is the observed utility and β0 is the alter-native specific constants for options A and B. Thestatus quo (non-option) level was used as the baselevel.
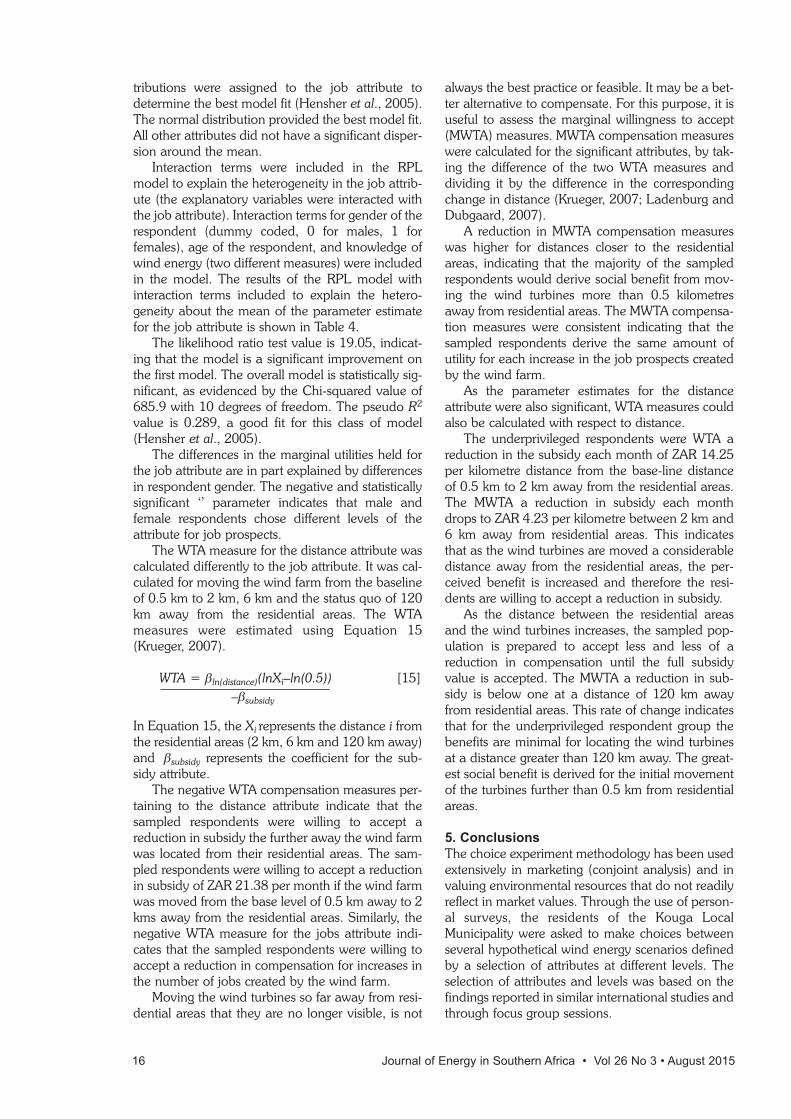
The estimation results of a conditional logitmodel are shown in Table 3. The influence of eachattribute on the choice probabilities can be deter-mined by the magnitude and sign of the coefficients(Krueger, 2007). The size attribute is insignificant atthe 5% level, suggesting that the respondent groupwere indifferent in their preferences for wind farmsize. The attributes for job and distance were posi-tive and significant, indicating that the respondentsderived greater utility from an increasing change in
the level of these attributes, i.e. through creatingmore job opportunities and locating the wind farmfurther away from residential areas.
The pseudo R2 is 0.12, indicating a comparableOLS model fit of 30%. This level of fit is acceptablebecause this model only includes the attributes asparameter estimates and does not account for indi-vidual characteristics or external determinants ofchoice.
A test to determine whether a violation of the IIAassumption was conducted using the Hausman test.The status quo was omitted from the data and therestricted model estimated. The resulting test statis-tic was 16.09 and the p-value for this test was0.0003, sufficient evidence to reject the null hypoth-esis that the IIA assumption is violated.
An RPL model was also fitted to the data todetermine whether there was heterogeneity in theparameter estimates for the sampled populationaround the mean parameter estimate (Hensher etal., 2005). The dispersion of the job attribute, rep-resented by the derived standard deviation of0.089, was statistically significant, with a Wald sta-tistic of 3.81 and a p-value of 0.0001. Different dis-
Table 2: Sample characteristics for the sample respondent group
Age Income Education
Underprivileged Sample
Range Sample Range Sample Level Sample
18 to 30 38.4% R0 to R15 000 17% Primary 23%
31 to 40 29% R15 001 to R50 000 42% Secondary 48.5%
41 to 50 19.6% R50001 to R200 000 19% Matriculation 22.5%
51 to 80 13% R200 001 to R750 000 0 % Tertiary 6%
Kouga Local Municipality
Age Income Education
Range % Kouga Population Range % Kouga Population Level % KougaPopulation
18 to 30 24% R0 to R19 600 41.7% Primary 53.6%
31 to 40 14% R19 601 to R76 400 36.1% Secondary 30.9%
41 to 50 12.3% R76 401 to R307 600 17.2% Matriculation 9.7%
51 to 80 18.5% R307 601 to R1 228 800 4.5% Tertiary 1%
Table 3: Conditional logit model results for low-income respondents
Variable Coefficient Standard error Wald statistic p-value
Subsidy (X1) 0.0288*** 0.0068 4.2400 0.0000
Size (X2) 0.0035 0.0026 1.3650 0.1721
lnDistance (X3) 0.1815*** 0.0469 3.8660 0.0001
Jobs (X4) 0.0410*** 0.0033 12.4670 0.0000
ASC(status quo) -1.3382*** 0.2564 -5.2200 0.0000
Maximum likelihood estimates
No. of observations 1080 Base LL function -965.487
No. of parameters 5 Pseudo R2 0.12
Estimated LL function -863.4402 AIC 1.608
Journal of Energy in Southern Africa • Vol 26 No 3 • August 2015 15
tributions were assigned to the job attribute todetermine the best model fit (Hensher et al., 2005).The normal distribution provided the best model fit.All other attributes did not have a significant disper-sion around the mean.
Interaction terms were included in the RPLmodel to explain the heterogeneity in the job attrib-ute (the explanatory variables were interacted withthe job attribute). Interaction terms for gender of therespondent (dummy coded, 0 for males, 1 forfemales), age of the respondent, and knowledge ofwind energy (two different measures) were includedin the model. The results of the RPL model withinteraction terms included to explain the hetero-geneity about the mean of the parameter estimatefor the job attribute is shown in Table 4.
The likelihood ratio test value is 19.05, indicat-ing that the model is a significant improvement onthe first model. The overall model is statistically sig-nificant, as evidenced by the Chi-squared value of685.9 with 10 degrees of freedom. The pseudo R2
value is 0.289, a good fit for this class of model(Hensher et al., 2005).
The differences in the marginal utilities held forthe job attribute are in part explained by differencesin respondent gender. The negative and statisticallysignificant ‘’ parameter indicates that male andfemale respondents chose different levels of theattribute for job prospects.
The WTA measure for the distance attribute wascalculated differently to the job attribute. It was cal-culated for moving the wind farm from the baselineof 0.5 km to 2 km, 6 km and the status quo of 120km away from the residential areas. The WTAmeasures were estimated using Equation 15(Krueger, 2007).
[15]
In Equation 15, the Xi represents the distance i fromthe residential areas (2 km, 6 km and 120 km away)and βsubsidy represents the coefficient for the sub-sidy attribute.
The negative WTA compensation measures per-taining to the distance attribute indicate that thesampled respondents were willing to accept areduction in subsidy the further away the wind farmwas located from their residential areas. The sam-pled respondents were willing to accept a reductionin subsidy of ZAR 21.38 per month if the wind farmwas moved from the base level of 0.5 km away to 2kms away from the residential areas. Similarly, thenegative WTA measure for the jobs attribute indi-cates that the sampled respondents were willing toaccept a reduction in compensation for increases inthe number of jobs created by the wind farm.
Moving the wind turbines so far away from resi-dential areas that they are no longer visible, is not
always the best practice or feasible. It may be a bet-ter alternative to compensate. For this purpose, it isuseful to assess the marginal willingness to accept(MWTA) measures. MWTA compensation measureswere calculated for the significant attributes, by tak-ing the difference of the two WTA measures anddividing it by the difference in the correspondingchange in distance (Krueger, 2007; Ladenburg andDubgaard, 2007).
A reduction in MWTA compensation measureswas higher for distances closer to the residentialareas, indicating that the majority of the sampledrespondents would derive social benefit from mov-ing the wind turbines more than 0.5 kilometresaway from residential areas. The MWTA compensa-tion measures were consistent indicating that thesampled respondents derive the same amount ofutility for each increase in the job prospects createdby the wind farm.
As the parameter estimates for the distanceattribute were also significant, WTA measures couldalso be calculated with respect to distance.
The underprivileged respondents were WTA areduction in the subsidy each month of ZAR 14.25per kilometre distance from the base-line distanceof 0.5 km to 2 km away from the residential areas.The MWTA a reduction in subsidy each monthdrops to ZAR 4.23 per kilometre between 2 km and6 km away from residential areas. This indicatesthat as the wind turbines are moved a considerabledistance away from the residential areas, the per-ceived benefit is increased and therefore the resi-dents are willing to accept a reduction in subsidy.
As the distance between the residential areasand the wind turbines increases, the sampled pop-ulation is prepared to accept less and less of areduction in compensation until the full subsidyvalue is accepted. The MWTA a reduction in sub-sidy is below one at a distance of 120 km awayfrom residential areas. This rate of change indicatesthat for the underprivileged respondent group thebenefits are minimal for locating the wind turbinesat a distance greater than 120 km away. The great-est social benefit is derived for the initial movementof the turbines further than 0.5 km from residentialareas.
5. Conclusions
The choice experiment methodology has been usedextensively in marketing (conjoint analysis) and invaluing environmental resources that do not readilyreflect in market values. Through the use of person-al surveys, the residents of the Kouga LocalMunicipality were asked to make choices betweenseveral hypothetical wind energy scenarios definedby a selection of attributes at different levels. Theselection of attributes and levels was based on thefindings reported in similar international studies andthrough focus group sessions.
WTA = βln(distance)(lnXi–ln(0.5))
–βsubsidy
16 Journal of Energy in Southern Africa • Vol 26 No 3 • August 2015
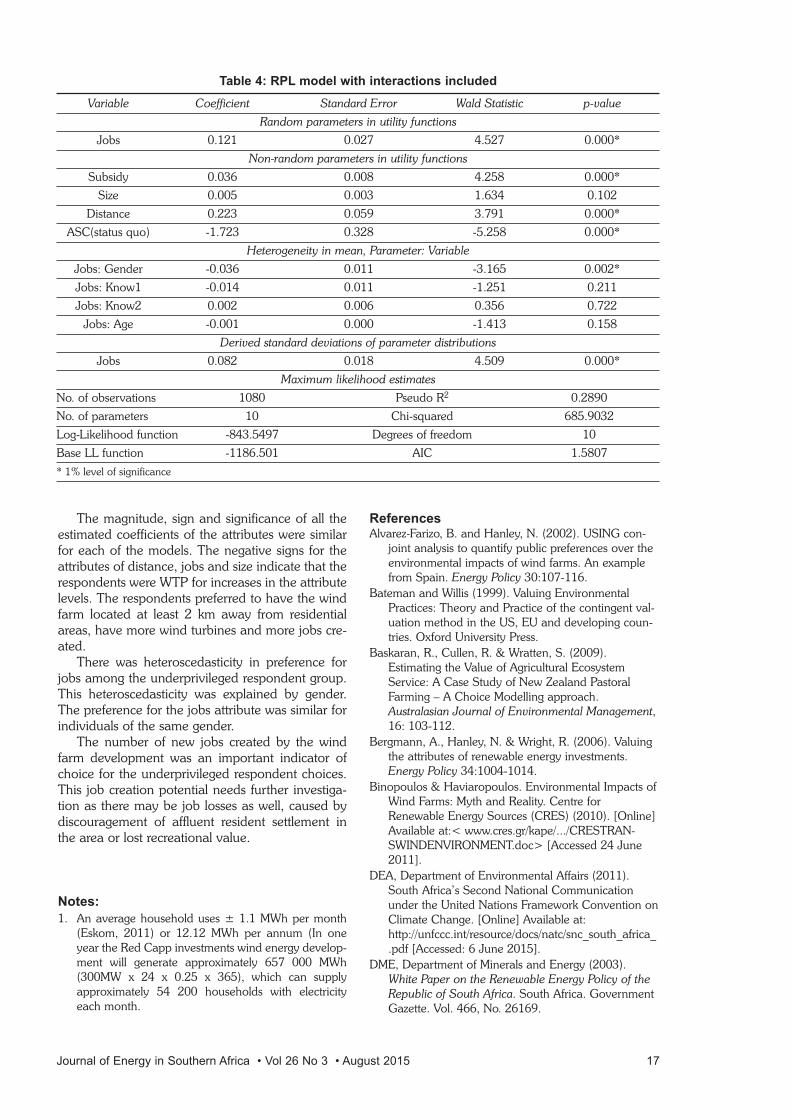
The magnitude, sign and significance of all theestimated coefficients of the attributes were similarfor each of the models. The negative signs for theattributes of distance, jobs and size indicate that therespondents were WTP for increases in the attributelevels. The respondents preferred to have the windfarm located at least 2 km away from residentialareas, have more wind turbines and more jobs cre-ated.
There was heteroscedasticity in preference forjobs among the underprivileged respondent group.This heteroscedasticity was explained by gender.The preference for the jobs attribute was similar forindividuals of the same gender.
The number of new jobs created by the windfarm development was an important indicator ofchoice for the underprivileged respondent choices.This job creation potential needs further investiga-tion as there may be job losses as well, caused bydiscouragement of affluent resident settlement inthe area or lost recreational value.
Notes:
1. An average household uses ± 1.1 MWh per month(Eskom, 2011) or 12.12 MWh per annum (In oneyear the Red Capp investments wind energy develop-ment will generate approximately 657 000 MWh(300MW x 24 x 0.25 x 365), which can supplyapproximately 54 200 households with electricityeach month.
ReferencesAlvarez-Farizo, B. and Hanley, N. (2002). USING con-
joint analysis to quantify public preferences over theenvironmental impacts of wind farms. An examplefrom Spain. Energy Policy 30:107-116.
Bateman and Willis (1999). Valuing EnvironmentalPractices: Theory and Practice of the contingent val-uation method in the US, EU and developing coun-tries. Oxford University Press.
Baskaran, R., Cullen, R. & Wratten, S. (2009).Estimating the Value of Agricultural EcosystemService: A Case Study of New Zealand PastoralFarming – A Choice Modelling approach.Australasian Journal of Environmental Management,16: 103-112.
Bergmann, A., Hanley, N. & Wright, R. (2006). Valuingthe attributes of renewable energy investments.Energy Policy 34:1004-1014.
Binopoulos & Haviaropoulos. Environmental Impacts ofWind Farms: Myth and Reality. Centre forRenewable Energy Sources (CRES) (2010). [Online]Available at:< www.cres.gr/kape/.../CRESTRAN-SWINDENVIRONMENT.doc> [Accessed 24 June2011].
DEA, Department of Environmental Affairs (2011).South Africa’s Second National Communicationunder the United Nations Framework Convention onClimate Change. [Online] Available at:http://unfccc.int/resource/docs/natc/snc_south_africa_.pdf [Accessed: 6 June 2015].
DME, Department of Minerals and Energy (2003).White Paper on the Renewable Energy Policy of theRepublic of South Africa. South Africa. GovernmentGazette. Vol. 466, No. 26169.
Table 4: RPL model with interactions included
Variable Coefficient Standard Error Wald Statistic p-value
Random parameters in utility functions
Jobs 0.121 0.027 4.527 0.000*
Non-random parameters in utility functions
Subsidy 0.036 0.008 4.258 0.000*
Size 0.005 0.003 1.634 0.102
Distance 0.223 0.059 3.791 0.000*
ASC(status quo) -1.723 0.328 -5.258 0.000*
Heterogeneity in mean, Parameter: Variable
Jobs: Gender -0.036 0.011 -3.165 0.002*
Jobs: Know1 -0.014 0.011 -1.251 0.211
Jobs: Know2 0.002 0.006 0.356 0.722
Jobs: Age -0.001 0.000 -1.413 0.158
Derived standard deviations of parameter distributions
Jobs 0.082 0.018 4.509 0.000*
Maximum likelihood estimates
No. of observations 1080 Pseudo R2 0.2890
No. of parameters 10 Chi-squared 685.9032
Log-Likelihood function -843.5497 Degrees of freedom 10
Base LL function -1186.501 AIC 1.5807
* 1% level of significance
Journal of Energy in Southern Africa • Vol 26 No 3 • August 2015 17
18 Journal of Energy in Southern Africa • Vol 26 No 3 • August 2015
Dimitropoulos, A. & Kontoleon, A. (2008). Assessing theDeterminants of Local Acceptability of Wind FarmInvestment: A Choice Experiment in the GreekAegean Islands. Cambridge Department of LandEconomy Discussion Paper Series, Number35.2008.
EDF. South Africa: The World’s carbon markets: A casestudy guide to emissions trading (2014). [Online]Available at: http://www.ieta.org/assets/EDFCaseStudyMarch2014/south%20africa%20case%20study%20march%202014.pdf [Accessed: 6June 2015].
Edkins, M., Marquard, A. & Winkler, H. (2010). SouthAfrica’s renewable energy policy roadmaps. UnitedNations Environment Programme Research Project.UCT. Cape Town.
Ek, K. (2002). Valuing the environmental impacts ofwind power: a choice experiment approach.Licentiate Thesis, Luella University of Technology,Sweden. [Online] Available at: <http://epubl.luth.se/1402-1757/2002/40/index-en.html> [Accessed 22February 2011].
Eskom (2011). Fact Sheet {online}. Available at: <http://www.eskom.co.za/c/25/facts-figures/>[Accessed 14 October 2011].
Gets, A. & Mlanga, R. (2013). Powering the Future:Renewable energy roll-out in South Africa.Greenpeace.
Glasgow, G. A. (1999). Random Parameters LogitModel for Estimating the Impact of Issues on VoteChoice. California: University of California.
Glasgow, G. (2001). Heterogeneity in Discrete ChoiceModels. University of California. [Online]. Available:http://polmeth.wustl.edu/media/Paper/glasg01b.pdf[Accessed 5/03/2012].
Hanley, N., Mourato, S. & Wright, R. (2001). Valuingthe environmental and employment impacts ofrenewable energy investment in Scotland. Scotecon,Stirling.
Hensher, D. A., Rose, J. M. & Greene, W. H. (2005).Applied Choice Analysis: A primer, Cambridge, UK,Cambridge University Press.
Krohn, S. & Damborg, S. (1999). On public attitudestowards wind power. Renewable Energy, 16:954-960.
Krueger, A. (2007). Valuing Public Preferences for off-shore wind power: A choice experiment approach.Ph.D. University of Delaware.
Ladenberg, J. & Dubgaard, A. (2007). Willingness toPay for Reduced Visual Disamenities from OffshoreWind Farms in Denmark. Energy Policy, 35: 4059-4071.
Lancaster , K. A (1966). New approach to consumertheory. Journal of Political Economy 74, 132-157.
Mazzanti, M. (2001). Discrete Choice Models andValuation Experiments. An Application to CulturalHeritage. Siep: University of Rome.
Pasqualetti, M.J. (2011). Opposing Wind EnergyLandscapes: A Search for a Common Cause. Annalsof the Association of American Geographers.
PRB, Population Reference Bureau (1998). US in theWorld. [Online] Available at:http://www.prb.org/pdf/california_southafrica.pdf.
Red Cap Investments (2011). Environmental ImpactAssessment for a Wind Farm in the Kouga LocalMunicipality. Revised Draft Environmental ImpactReport. [Online] Available at:<http://projects.gibb.co.za/en-za/projects/kougawind-farmfinaleir/kougafinaleir.aspx> [Accessed: 20 June2011].
Rosset, P. Patel, R. & Courville, M. (2006). PromisedLand: competing visions of agrarian reform. LandResearch Action Network. Food First Books. 63.
Siegfried, K. (2014). South Africa’s coal fired power sta-tions carry heavy health costs. The Guardian.[Online] Available at: http://www.theguardian.com/global-development/2014/sep/09/south-africas-coal-fired-power-stations-carry-heavy-health-costs.
SAinfo Reporter (2008). SA’s Energy Suppy. [online]Available at:http://www.southafrica.info/business/economy/infra-structure/energy.htm [Accessed 22 February 2011].
Slattery, M.C., Johnson, B.L., Swofford, J.A. &Pasqualetti, M.J. The predominance of economicdevelopment in the support for large-scale windfarms in the U.S. Great Plains.
South African Government Information. GovernmentServices (2011). [Online] Available at:<http://www.info.gov.za/faq/services.htm#munici-pal> [Accessed: 5 July 2011].
St Francis Bay Residents Association (2010). The pro-posed Kouga Wind Farm. [Online] Available at:<http://www.sfbresidents.org/news/2010/Windfarm-Feb.html> [Accessed: 20 June 2011].
UNEP (2009). Greenhouse gas emission baselines andreduction potentials from buildings in South Africa.[Online] Available at:http://www.gsb.uct.ac.za/files/PPIAFReport.pdf[Accessed 6 June 2015].
Wolsink, M. (2007). Planning of renewables schemes:Deliberative and fair decision-making on landscapeissues instead of reproachful accusations of non-cooperation. Energy Policy 35:2692–2704.
WWEA. World Wind Energy Report 2010. (2011).Germany: World Wind Energy Association.
Received 23 May 2014; revised 30 July 2015
Identification and characterisation of performance limiting
defects and cell mismatch in photovoltaic modules
Jacqui L Crozier
Ernest E van Dyk
Frederick J VorsterDepartment of Physics, Nelson Mandela Metropolitan University, Port Elizabeth, South Africa
Journal of Energy in Southern Africa • Vol 26 No 3 • August 2015 19
Abstract
The performance and longevity of photovoltaic (PV)modules can be severely limited by cell mismatchoccurring when a solar cell in a series-connectedstring produces a lower current than the other cellsin that string. The current output of the entire stringis limited by the weakest cell in the string so shadingor damage to a single cell in a module can affect theentire module’s current output. Electrolumin-escence (EL) occurs when a positive current andvoltage are applied to a solar cell and is used toidentify damage and defects in the cell. In this study,the cell mismatch in three single crystalline siliconmodules was investigated using EL and current-voltage (I-V) characterisation techniques. Two mod-ules have a white discolouration that affects themajority of the cells in the module and also havesigns of mechanical damage, while the third moduleacts as a reference as it has no discolouration andappears undamaged. The EL signal intensity isrelated to cell performance and identifies materialdefects, bad contacts and broken cells. Cell mis-match in a module results in a decrease in the per-formance parameters obtained from the I-V charac-teristic curve of the module. The I-V curves indicatethe presence of current mismatch in the degradedmodules, which is supported by the EL images ofthese modules. The use of EL images, in conjunc-tion with the I-V curves, allows the degradation inthe modules to be characterised.
Keywords: photovoltaics, cell mismatch, current-voltage characterisation, electroluminescence,degradation
1. Introduction
The reliability and longevity of photovoltaic (PV)modules is a key factor in the success of solar ener-gy as an alternative energy source. Cell mismatcharises from unbalanced current production of somecells in a series-connected string. This mismatchresults from degradation in the cell due to mechan-ically damaged cells or shading due to shadows orthe accumulation of dirt (Meyer and van Dyk,2004). Cell mismatch affects the current productionof the cell and, hence, the string.
The objectives of this investigation are to identi-fy and characterise cell mismatch in PV modules bycomparing the results of the current-voltage (I-V)characteristics with electroluminescence (EL)images. EL is a useful solar cell characterisationtechnique as it is fast, non-destructive and sensitiveto the effects of shunt and series resistances andrecombination parameters. This luminescence isdependent on the optical, electrical and resistiveproperties of the solar cell.
EL imaging is very effective in detecting defectsin modules such as cracks, broken fingers and bro-ken cells (Mansouri et al., 2012). For this reason, itis extensively integrated into module productionlines and module testing systems and highlights fea-tures that are missed during visual inspec-tion (Camino-Villacorta et al., 2012). The ELimages allow defective cells in a module to be iden-tified and these defects can be related to reducedoutput power.
1.1. Current-voltage (I-V) characteristics
and cell mismatch
Cell mismatch has a substantial effect on the cur-rent-voltage (I-V) curve of the whole module. A cellwith a current output lower than the rest of the cellsin the string of series-connected cells is referred to
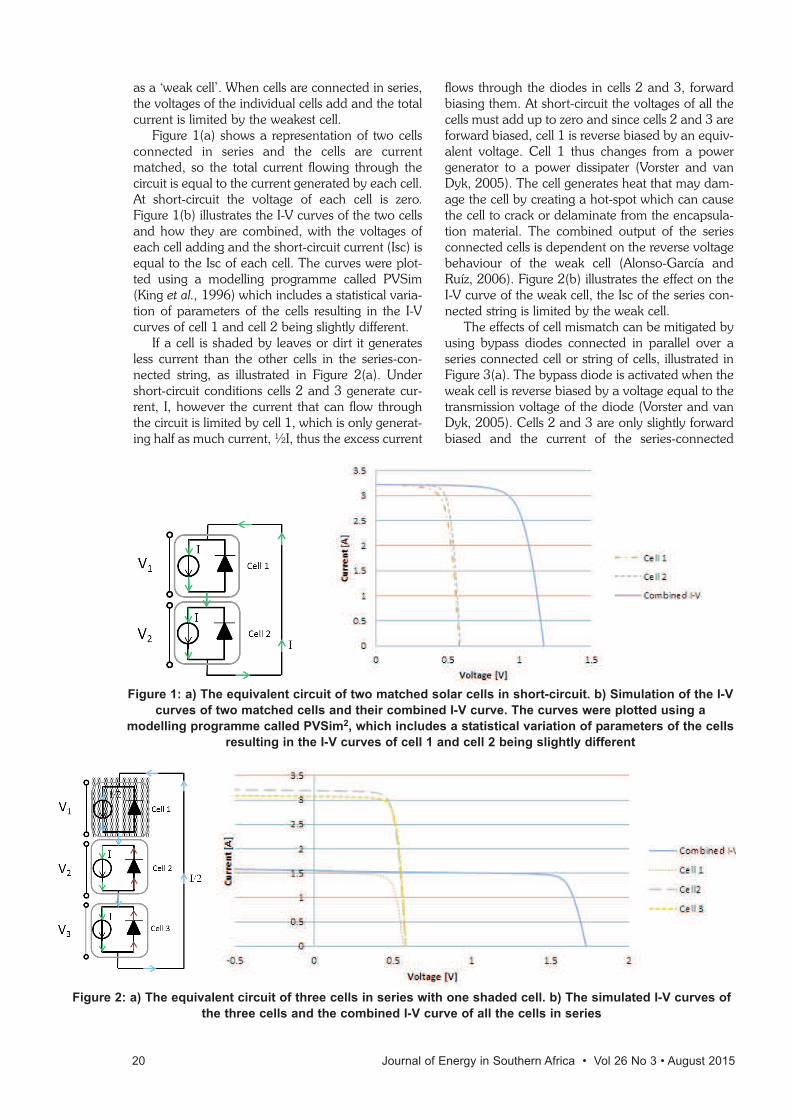
as a ‘weak cell’. When cells are connected in series,the voltages of the individual cells add and the totalcurrent is limited by the weakest cell.
Figure 1(a) shows a representation of two cellsconnected in series and the cells are currentmatched, so the total current flowing through thecircuit is equal to the current generated by each cell.At short-circuit the voltage of each cell is zero.Figure 1(b) illustrates the I-V curves of the two cellsand how they are combined, with the voltages ofeach cell adding and the short-circuit current (Isc) isequal to the Isc of each cell. The curves were plot-ted using a modelling programme called PVSim(King et al., 1996) which includes a statistical varia-tion of parameters of the cells resulting in the I-Vcurves of cell 1 and cell 2 being slightly different.
If a cell is shaded by leaves or dirt it generatesless current than the other cells in the series-con-nected string, as illustrated in Figure 2(a). Undershort-circuit conditions cells 2 and 3 generate cur-rent, I, however the current that can flow throughthe circuit is limited by cell 1, which is only generat-ing half as much current, ½I, thus the excess current
flows through the diodes in cells 2 and 3, forwardbiasing them. At short-circuit the voltages of all thecells must add up to zero and since cells 2 and 3 areforward biased, cell 1 is reverse biased by an equiv-alent voltage. Cell 1 thus changes from a powergenerator to a power dissipater (Vorster and vanDyk, 2005). The cell generates heat that may dam-age the cell by creating a hot-spot which can causethe cell to crack or delaminate from the encapsula-tion material. The combined output of the seriesconnected cells is dependent on the reverse voltagebehaviour of the weak cell (Alonso-García andRuíz, 2006). Figure 2(b) illustrates the effect on theI-V curve of the weak cell, the Isc of the series con-nected string is limited by the weak cell.
The effects of cell mismatch can be mitigated byusing bypass diodes connected in parallel over aseries connected cell or string of cells, illustrated inFigure 3(a). The bypass diode is activated when theweak cell is reverse biased by a voltage equal to thetransmission voltage of the diode (Vorster and vanDyk, 2005). Cells 2 and 3 are only slightly forwardbiased and the current of the series-connected
Figure 1: a) The equivalent circuit of two matched solar cells in short-circuit. b) Simulation of the I-V
curves of two matched cells and their combined I-V curve. The curves were plotted using a
modelling programme called PVSim2, which includes a statistical variation of parameters of the cells
resulting in the I-V curves of cell 1 and cell 2 being slightly different
Figure 2: a) The equivalent circuit of three cells in series with one shaded cell. b) The simulated I-V curves of
the three cells and the combined I-V curve of all the cells in series
20 Journal of Energy in Southern Africa • Vol 26 No 3 • August 2015
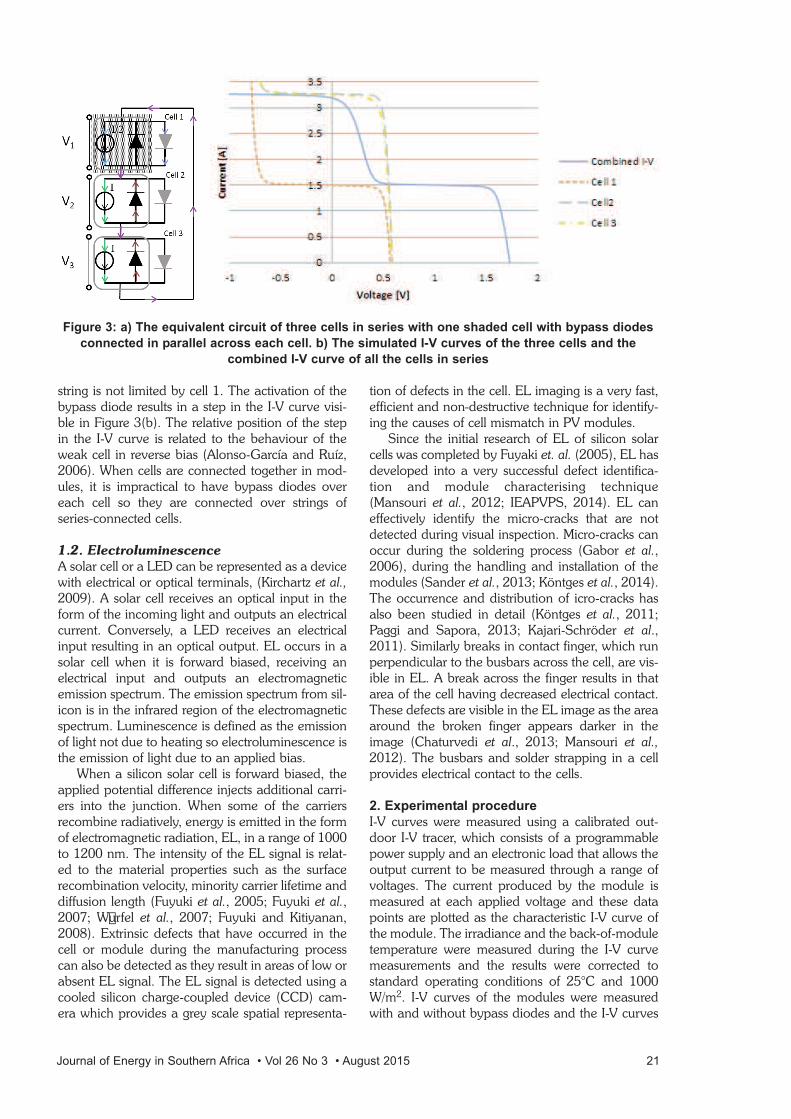
string is not limited by cell 1. The activation of thebypass diode results in a step in the I-V curve visi-ble in Figure 3(b). The relative position of the stepin the I-V curve is related to the behaviour of theweak cell in reverse bias (Alonso-García and Ruíz,2006). When cells are connected together in mod-ules, it is impractical to have bypass diodes overeach cell so they are connected over strings ofseries-connected cells.
1.2. Electroluminescence
A solar cell or a LED can be represented as a devicewith electrical or optical terminals, (Kirchartz et al.,2009). A solar cell receives an optical input in theform of the incoming light and outputs an electricalcurrent. Conversely, a LED receives an electricalinput resulting in an optical output. EL occurs in asolar cell when it is forward biased, receiving anelectrical input and outputs an electromagneticemission spectrum. The emission spectrum from sil-icon is in the infrared region of the electromagneticspectrum. Luminescence is defined as the emissionof light not due to heating so electroluminescence isthe emission of light due to an applied bias.
When a silicon solar cell is forward biased, theapplied potential difference injects additional carri-ers into the junction. When some of the carriersrecombine radiatively, energy is emitted in the formof electromagnetic radiation, EL, in a range of 1000to 1200 nm. The intensity of the EL signal is relat-ed to the material properties such as the surfacerecombination velocity, minority carrier lifetime anddiffusion length (Fuyuki et al., 2005; Fuyuki et al.,2007; Wu�rfel et al., 2007; Fuyuki and Kitiyanan,2008). Extrinsic defects that have occurred in thecell or module during the manufacturing processcan also be detected as they result in areas of low orabsent EL signal. The EL signal is detected using acooled silicon charge-coupled device (CCD) cam-era which provides a grey scale spatial representa-
tion of defects in the cell. EL imaging is a very fast,efficient and non-destructive technique for identify-ing the causes of cell mismatch in PV modules.
Since the initial research of EL of silicon solarcells was completed by Fuyaki et. al. (2005), EL hasdeveloped into a very successful defect identifica-tion and module characterising technique(Mansouri et al., 2012; IEAPVPS, 2014). EL caneffectively identify the micro-cracks that are notdetected during visual inspection. Micro-cracks canoccur during the soldering process (Gabor et al.,2006), during the handling and installation of themodules (Sander et al., 2013; Köntges et al., 2014).The occurrence and distribution of icro-cracks hasalso been studied in detail (Köntges et al., 2011;Paggi and Sapora, 2013; Kajari-Schröder et al.,2011). Similarly breaks in contact finger, which runperpendicular to the busbars across the cell, are vis-ible in EL. A break across the finger results in thatarea of the cell having decreased electrical contact.These defects are visible in the EL image as the areaaround the broken finger appears darker in theimage (Chaturvedi et al., 2013; Mansouri et al.,2012). The busbars and solder strapping in a cellprovides electrical contact to the cells.
2. Experimental procedure
I-V curves were measured using a calibrated out-door I-V tracer, which consists of a programmablepower supply and an electronic load that allows theoutput current to be measured through a range ofvoltages. The current produced by the module ismeasured at each applied voltage and these datapoints are plotted as the characteristic I-V curve ofthe module. The irradiance and the back-of-moduletemperature were measured during the I-V curvemeasurements and the results were corrected tostandard operating conditions of 25°C and 1000W/m2. I-V curves of the modules were measuredwith and without bypass diodes and the I-V curves
Figure 3: a) The equivalent circuit of three cells in series with one shaded cell with bypass diodes
connected in parallel across each cell. b) The simulated I-V curves of the three cells and the
combined I-V curve of all the cells in series
Journal of Energy in Southern Africa • Vol 26 No 3 • August 2015 21
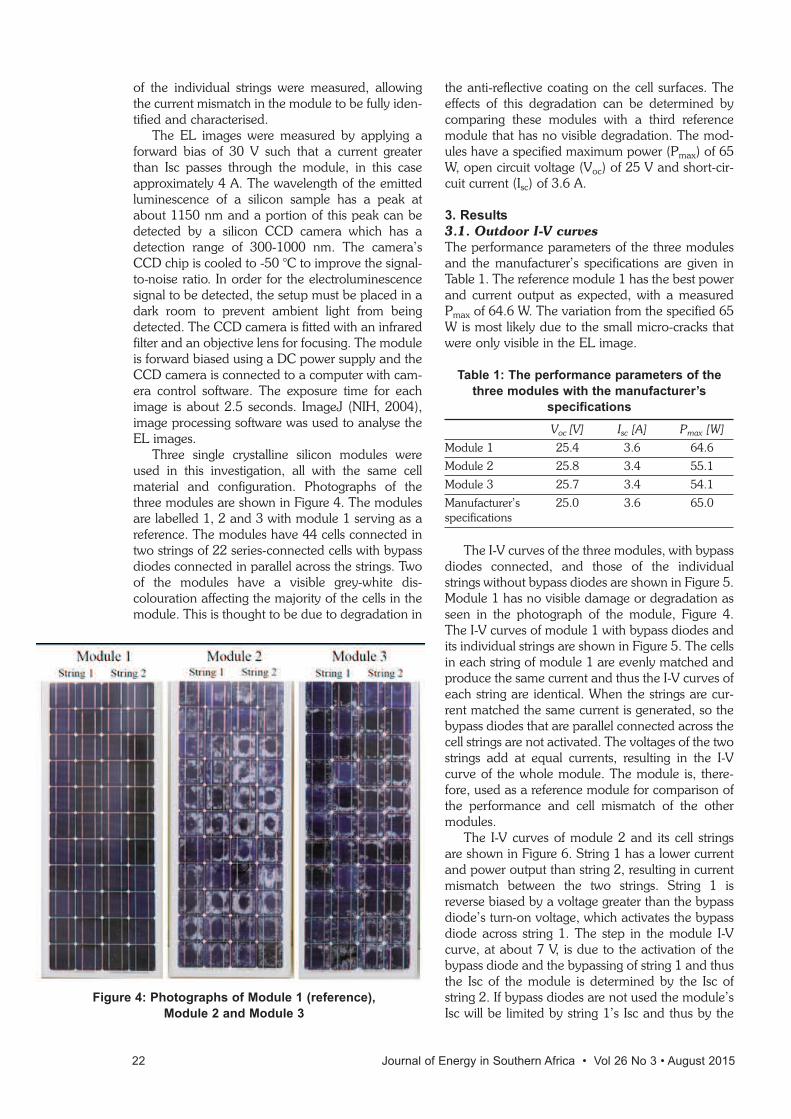
of the individual strings were measured, allowingthe current mismatch in the module to be fully iden-tified and characterised.
The EL images were measured by applying aforward bias of 30 V such that a current greaterthan Isc passes through the module, in this caseapproximately 4 A. The wavelength of the emittedluminescence of a silicon sample has a peak atabout 1150 nm and a portion of this peak can bedetected by a silicon CCD camera which has adetection range of 300-1000 nm. The camera’sCCD chip is cooled to -50 °C to improve the signal-to-noise ratio. In order for the electroluminescencesignal to be detected, the setup must be placed in adark room to prevent ambient light from beingdetected. The CCD camera is fitted with an infraredfilter and an objective lens for focusing. The moduleis forward biased using a DC power supply and theCCD camera is connected to a computer with cam-era control software. The exposure time for eachimage is about 2.5 seconds. ImageJ (NIH, 2004),image processing software was used to analyse theEL images.
Three single crystalline silicon modules wereused in this investigation, all with the same cellmaterial and configuration. Photographs of thethree modules are shown in Figure 4. The modulesare labelled 1, 2 and 3 with module 1 serving as areference. The modules have 44 cells connected intwo strings of 22 series-connected cells with bypassdiodes connected in parallel across the strings. Twoof the modules have a visible grey-white dis-colouration affecting the majority of the cells in themodule. This is thought to be due to degradation in
the anti-reflective coating on the cell surfaces. Theeffects of this degradation can be determined bycomparing these modules with a third referencemodule that has no visible degradation. The mod-ules have a specified maximum power (Pmax) of 65W, open circuit voltage (Voc) of 25 V and short-cir-cuit current (Isc) of 3.6 A.
3. Results
3.1. Outdoor I-V curves
The performance parameters of the three modulesand the manufacturer’s specifications are given inTable 1. The reference module 1 has the best powerand current output as expected, with a measuredPmax of 64.6 W. The variation from the specified 65W is most likely due to the small micro-cracks thatwere only visible in the EL image.
Table 1: The performance parameters of the
three modules with the manufacturer’s
specifications
Voc [V] Isc [A] Pmax [W]
Module 1 25.4 3.6 64.6
Module 2 25.8 3.4 55.1
Module 3 25.7 3.4 54.1
Manufacturer’s 25.0 3.6 65.0 specifications
The I-V curves of the three modules, with bypassdiodes connected, and those of the individualstrings without bypass diodes are shown in Figure 5.Module 1 has no visible damage or degradation asseen in the photograph of the module, Figure 4.The I-V curves of module 1 with bypass diodes andits individual strings are shown in Figure 5. The cellsin each string of module 1 are evenly matched andproduce the same current and thus the I-V curves ofeach string are identical. When the strings are cur-rent matched the same current is generated, so thebypass diodes that are parallel connected across thecell strings are not activated. The voltages of the twostrings add at equal currents, resulting in the I-Vcurve of the whole module. The module is, there-fore, used as a reference module for comparison ofthe performance and cell mismatch of the othermodules.
The I-V curves of module 2 and its cell stringsare shown in Figure 6. String 1 has a lower currentand power output than string 2, resulting in currentmismatch between the two strings. String 1 isreverse biased by a voltage greater than the bypassdiode’s turn-on voltage, which activates the bypassdiode across string 1. The step in the module I-Vcurve, at about 7 V, is due to the activation of thebypass diode and the bypassing of string 1 and thusthe Isc of the module is determined by the Isc ofstring 2. If bypass diodes are not used the module’sIsc will be limited by string 1’s Isc and thus by the
Figure 4: Photographs of Module 1 (reference),
Module 2 and Module 3
22 Journal of Energy in Southern Africa • Vol 26 No 3 • August 2015
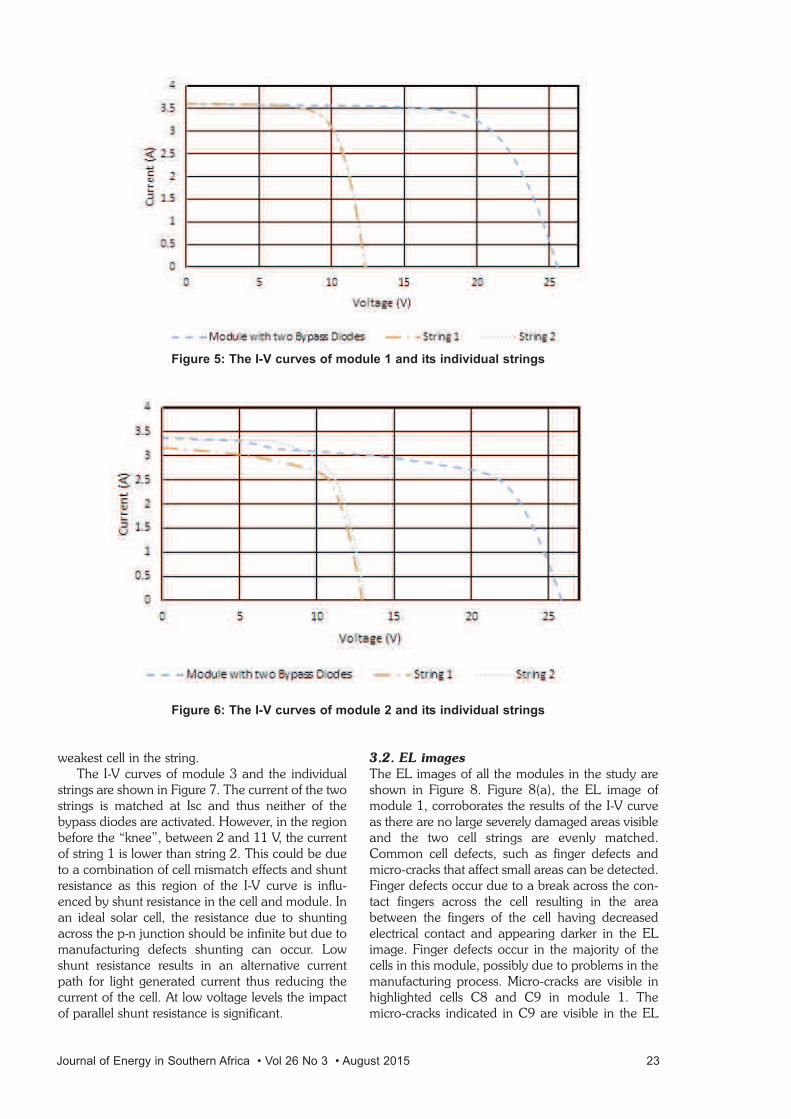
weakest cell in the string. The I-V curves of module 3 and the individual
strings are shown in Figure 7. The current of the twostrings is matched at Isc and thus neither of thebypass diodes are activated. However, in the regionbefore the “knee”, between 2 and 11 V, the currentof string 1 is lower than string 2. This could be dueto a combination of cell mismatch effects and shuntresistance as this region of the I-V curve is influ-enced by shunt resistance in the cell and module. Inan ideal solar cell, the resistance due to shuntingacross the p-n junction should be infinite but due tomanufacturing defects shunting can occur. Lowshunt resistance results in an alternative currentpath for light generated current thus reducing thecurrent of the cell. At low voltage levels the impactof parallel shunt resistance is significant.
3.2. EL images
The EL images of all the modules in the study areshown in Figure 8. Figure 8(a), the EL image ofmodule 1, corroborates the results of the I-V curveas there are no large severely damaged areas visibleand the two cell strings are evenly matched.Common cell defects, such as finger defects andmicro-cracks that affect small areas can be detected.Finger defects occur due to a break across the con-tact fingers across the cell resulting in the areabetween the fingers of the cell having decreasedelectrical contact and appearing darker in the ELimage. Finger defects occur in the majority of thecells in this module, possibly due to problems in themanufacturing process. Micro-cracks are visible inhighlighted cells C8 and C9 in module 1. Themicro-cracks indicated in C9 are visible in the EL
Figure 5: The I-V curves of module 1 and its individual strings
Figure 6: The I-V curves of module 2 and its individual strings
Journal of Energy in Southern Africa • Vol 26 No 3 • August 2015 23
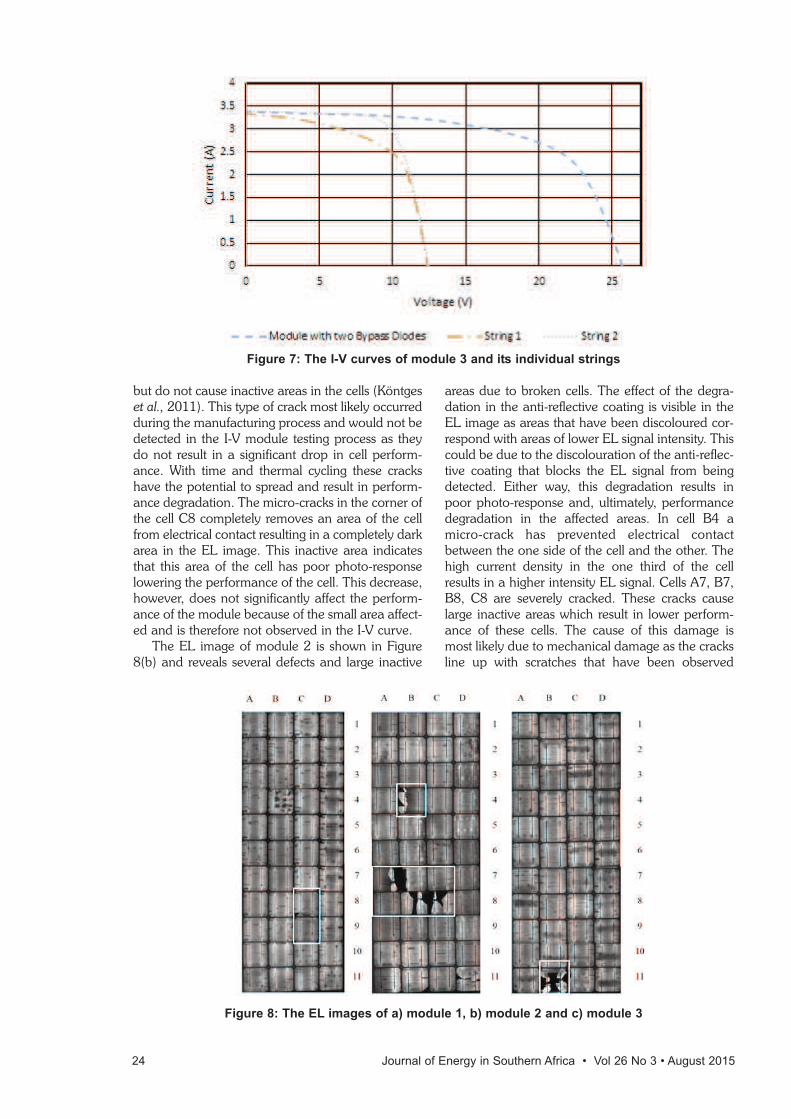
but do not cause inactive areas in the cells (Köntgeset al., 2011). This type of crack most likely occurredduring the manufacturing process and would not bedetected in the I-V module testing process as theydo not result in a significant drop in cell perform-ance. With time and thermal cycling these crackshave the potential to spread and result in perform-ance degradation. The micro-cracks in the corner ofthe cell C8 completely removes an area of the cellfrom electrical contact resulting in a completely darkarea in the EL image. This inactive area indicatesthat this area of the cell has poor photo-responselowering the performance of the cell. This decrease,however, does not significantly affect the perform-ance of the module because of the small area affect-ed and is therefore not observed in the I-V curve.
The EL image of module 2 is shown in Figure8(b) and reveals several defects and large inactive
areas due to broken cells. The effect of the degra-dation in the anti-reflective coating is visible in theEL image as areas that have been discoloured cor-respond with areas of lower EL signal intensity. Thiscould be due to the discolouration of the anti-reflec-tive coating that blocks the EL signal from beingdetected. Either way, this degradation results inpoor photo-response and, ultimately, performancedegradation in the affected areas. In cell B4 amicro-crack has prevented electrical contactbetween the one side of the cell and the other. Thehigh current density in the one third of the cellresults in a higher intensity EL signal. Cells A7, B7,B8, C8 are severely cracked. These cracks causelarge inactive areas which result in lower perform-ance of these cells. The cause of this damage ismost likely due to mechanical damage as the cracksline up with scratches that have been observed
Figure 7: The I-V curves of module 3 and its individual strings
Figure 8: The EL images of a) module 1, b) module 2 and c) module 3
24 Journal of Energy in Southern Africa • Vol 26 No 3 • August 2015
along the back surface of the module. The ELimages explain the mismatch seen in the I-V curvesof the two strings as string 1 has more inactive cellarea than string 2 and thus lower current output.
The EL image of module 3 is shown in Figure8(c). Cell B11 is the severely damaged with cracksresulting in large inactive areas which lower the per-formance of the module. This damaged cell isresponsible for the lower performance of string 1compared with string 2 obseved in the I-V curves.While this damaged cell doesn’t lower the Isc ofstring 1, it does contribute to the cell mismatch andshunting observed in the I-V curve.
4. Summary and conclusion
Electroluminescence is used as a fast and effectivetechnique in identifying defects and degradation inthese three PV modules. It is able to quickly detectcell defects that would not be detected in visualmodule inspection or I-V curve measurement.These defects can explain why some modules, suchas module 1, appear undamaged but have lowerpower output than expected. Defects in a modulecan be detected at the manufacturing stageenabling manufacturers to increase the reliability ofPV modules. Cell mismatch can be observed in theI-V curves of a module but the EL image of themodule allows the identification of cell defects andthe exact nature and position of the defects mayalso be determined.
Despite the EL of module 2 indicating that it hasseveral severely cracked cells, the performanceparameters of modules 2 and 3 are very similar.The bypass diodes in module 2 increases the Isc ofmodule 2, and thus the power outputs of module 2and 3 are very similar despite module 2 havingmore damaged cells. The EL images of module 2clearly indicate that the cell mismatch which is seenin the I-V curve of the module is due to cracked cellsand inactive areas. These defects result in a lowercurrent output in one string which is visible in the I-V curve. Similarly, a damaged cell only visible in theEL image of module 3 could be responsible for thelower performance and shunting visible in the I-Vcurve of the module.
References Alonso-García M.C. and Ruíz J.M. (2006). Analysis and
modelling the reverse characteristic of photovoltaiccells. Solar Energy Materials and Solar Cells 90:1105-1120.
Camino-Villacorta M., Coello J, Pérez L., et al. (2012).Comparative Analysis of Electroluminescence, IRThermography and Visual Inspection on c-SiModules. 27th European Photovoltaic Solar EnergyConference and Exhibition. Frankfurt, Germany.
Chaturvedi P., Hoex B. and Walsh T.M. (2013). Brokenmetal fingers in silicon wafer solar cells and PV mod-
ules. Solar Energy Materials and Solar Cells 108:78-81.
Fuyuki T. and Kitiyanan A. (2008). Photographic diag-nosis of crystalline silicon solar cells utilizing electro-luminescence. Applied Physics A 96: 189-196.
Fuyuki T, Kondo H., Kaji Y., et al. (2007). Analytic find-ings in the electroluminescence characterization ofcrystalline silicon solar cells. Journal of AppliedPhysics 101: 023711.
Fuyuki T., Kondo H., Yamazaki T., et al. (2005).Photographic surveying of minority carrier diffusionlength in polycrystalline silicon solar cells by electro-luminescence. Applied Physics Letters 86: 262108.
Gabor A.M., Ralli M., Montminy S., et al. (2006).Soldering Induced Damage to Thin Si Solar Cellsand Detection of Cracked Cells in Modules. 21stEuropean Photovoltaic Solar Energy Conference.Dresden, Germany.
IEAPVPS (2014). Performance and Reliability ofPhotovoltaic Systems Subtask 3.2:Review of Failuresof Photovoltaic Modules. IEA International EnergyAgency.
Kajari-Schröder S., Kunze I, Eitner U., et al. (2011).Spatial and orientational distribution of cracks incrystalline photovoltaic modules generated bymechanical load tests. Solar Energy Materials andSolar Cells 95: 3054-3059.
King D.L., Dudley J.K. and Boyson WE. (1996).PVSIM© : A Simulation Program for PhotovoltaicCells, Modules, and Arrays. 25th IEEE PVSC.Washington, DC.
Kirchartz T., Helbig A., Reetz W., et al. (2009).Reciprocity between electroluminescence and quan-tum efficiency used for the characterization of siliconsolar cells. Progress in Photovoltaics: Research andApplications 17: 394-402.
Köntges M., Kunze I., Kajari-Schröder S., et al. (2011).The risk of power loss in crystalline silicon basedphotovoltaic modules due to micro-cracks. SolarEnergy Materials and Solar Cells 95: 1131-1137.
Köntges M, Siebert M, Illing R, et al. (2014). Influence ofPhotovoltaic-module Handling on Solar CellCracking. 29th European Photovoltaic Solar EnergyConference and Exhibition. Amsterdam, theNetherlands, 2276-2282.
Mansouri A., Zettl M., Mayer O., et al. (2012). Defectdetection in photovoltaic modules using electrolumi-nescence imaging. 27th European Photovoltaic SolarEnergy Conference and Exhibition. Frankfurt,Germany.
Meyer E.L. and van Dyk E.E. (2004). Assessing theReliability and Degradation of Photovoltaic ModulePerformance Parameters. IEEE Transaction onReliability 53: 83-92.
NIH. (2004). ImageJ. Available at:http://rsbweb.nih.gov/ij/.
Paggi M. and Sapora A. (2013). Numerical Modelling ofMicrocracking in PV Modules Induced by Thermo-mechanical Loads. Energy Procedia 38: 506-515.
Sander M., Dietrich S., Pander M., et al. (2013).Systematic investigation of cracks in encapsulatedsolar cells after mechanical loading. Solar EnergyMaterials and Solar Cells 111: 82-89.
Journal of Energy in Southern Africa • Vol 26 No 3 • August 2015 25

26 Journal of Energy in Southern Africa • Vol 26 No 3 • August 2015
Vorster F.J. and van Dyk E.E. (2005). Current-voltagecharacteristics of high-concentration, photovoltaicarrays. Progress in Photovoltaics: Research andApplications 13: 55-66.
Würfel P., Trupke T., Puzzer T., et al. (2007). Diffusionlengths of silicon solar cells from luminescenceimages. Journal of Applied Physics 101: 123110.
Received 9 January 2014; revised 14 August 2015
Abstract
This paper investigates trends of historical and pro-jected future South African coal-fired power stationcriteria (total primary Particulate Matter (PM),Sulphur Dioxide (SO2) and Nitrogen Oxides (NOx))and Carbon Dioxide (CO2) emissions. It was foundthat an energy restricted environment has anincreasing effect on emissions, as emissions perenergy unit increased from the onset of the SouthAfrican energy crisis. PM emissions particularly,increased during the energy crisis period, due toincreased pressure on PM abatement and loweredmaintenance opportunity. Projections of future coal-fired power station criteria and CO2 emissions aremade for four different future scenarios for the peri-od 2015 to 2030. Three of the four scenarios arebased on the lower projected energy demand base-line case as published in the updated IntegratedDevelopment Plan (IRP). The difference betweenthese three scenarios is different retrofit rates ofpower stations with emissions abatement technolo-gies. The fourth scenario is a worst case scenarioand assumes high energy demand (and therefore nodecommissioning of power stations), high emissionrates (similar to worst past emission rates during theperiod 1999-2012) and no further abatement ofemissions above and beyond current mitigationefforts. This scenario gives an indication of whatSouth African coal-fired power station emissionscould look like if the energy crisis persists. There isa marked difference between projected best andworst case PM emissions during the entire projectedperiod, but especially during 2030 when worst casePM emissions compared to a 2015 baseline valueare expected to rise by 40% and best case PM emis-sions are projected to decline by 40%. Worst case
NOx emissions are expected to increase by 40% in2030 from a 2015 baseline value whereas best caseemissions are expected to decline 10% from thesame level in 2030. Worst case SO2 emissions arepredicted to increase by around 38% in 2030 andbest case emissions are expected to decrease byaround 20% in 2030 from a 2015 baseline value.Relative emissions used in the projection of futureCO2 emissions in this paper differ from that used inthe energy demand and energy mix modelling donefor the updated IRP baseline case. The reason forthis is that the modelling for the updated IRPassumed relative CO2 emission factors for supercrit-ical boilers, whereas only Kusile and Medupi fall inthis category and relative emissions from all otherstations are, in fact, between 5% and 16% higher.For this reason, it seems unlikely that the SouthAfrican climate commitment target for 2030 will bemade.
Keywords: coal-fired power station emissions; ener-gy crisis; South Africa; emissions projection; climatecommitments
1. Introduction
The South African energy sector is currently facedwith a number of challenges. Residential energyconsumption dramatically increased (by 50%) dur-ing the period 1994 to 2007 due to the implemen-tation of a Free Basic Electricity Policy in 2001. Thismeant that 50 kWh of electricity was supplied perhousehold to poor households per month, free ofcharge (Inglesi and Pouris, 2010). Since 2007 thecountry has been experiencing an ongoing energy
A perspective on South African coal fired power station
emissions
Ilze Pretorius1
Stuart Piketh1
Roelof Burger1
Hein Neomagus2
1. Engineering Power Plant Institute – Emission Control, Eskom; Climatology Research Group, Unit for
Environmental Sciences and Management, North-West University, Potchefstroom, South Africa
2. Engineering Power Plant Institute – Emission Control, Eskom; School of Chemical and Minerals Engineering,
Chemical Resource Beneficiation, North-West University, Potchefstroom, South Africa
Journal of Energy in Southern Africa • Vol 26 No 3 • August 2015 27
crisis. The main reason for this was the delay bygovernment in making a decision to fund the build-ing of a new power station after being warned of anenergy crisis approaching in 1998, combined withan increase in demand as a result of economicgrowth and the implementation of the Free BasicEnergy Policy (Department of Minerals and Energy(DME), 1998; Inglesi and Pouris).
During the energy crisis period, energy demandwas met by means of delaying maintenance on thegeneration fleet. This led to the decline in perform-ance of the fleet, which in turn, negatively impact-ed the effectiveness of the fleet to meet futuredemand (Integrated Resource Plan for Electricity(IRP), 2013). Three older power stations that weremothballed during the 1980’s and early 1990 werereturned back to service to alleviate the pressure onexisting stations. It is believed that the energydemand/supply balance will remain vulnerable untilMedupi and Kusile, two new power stations cur-rently under construction, come fully online expect-edly between 2018 and 2020 (Eskom, personalcommunication), although uncertainty still remainson the exact commissioning dates. In 2010 theSouth African Department of Environmental Affairs(DEA) promulgated a set of Minimum EmissionStandards (MES) for criteria pollutants that willcome into effect in 2015 and 2020, and is expectedto decrease emissions (Department ofEnvironmental Affairs (DEA), 2010a). However, anumber of industries, including Eskom and Sasol,the two major role players in the combustion of coalin South Africa have filed applications for the post-ponement of, and in some cases, exemption fromthe MES (Iliso Consulting, 2013; SRK Consulting,2013). The reasons for this are the high cost of com-pliance with the MES (with a capital cost of around6% of the South African nominal Gross DomesticProduct (GDP) for 2013) (Eskom, personal com-munication, 2014; Statistics South Africa, 2014),and the inflexibility of the MES by not taking theambient air quality and exposed population sur-rounding power stations into account. This meansthat stations are expected to comply with the MESeven if the national ambient air quality standardsare met before compliance. It is further envisagedthat a Carbon tax as an instrument to encouragecarbon mitigation will come into effect in 2016(Greve, 2013).
The energy sector in South Africa is the biggestcontributor to SO2 and NOx emissions and secondhighest contributor to PM emissions of all sources ofair emissions in the country (70%, 55% and 36%,respectively) compared to industrial, commercial &institutional fuel burning (27%, 23% and 44%),vehicle emissions (2%, 21%, 5%), biomass burning(0%, 0.3%, 6%) and domestic burning (0.8%,0.2%, 9%) (DEA, 2012; Scorgie et al., 2004).However, several studies have shown that power
station emissions are not the main cause of adversehealth impacts from air quality in South Africa. Paststudies have found that domestic burning has by farthe largest impact on human health (Friedl et al.,2008; Scorgie et al., 2004). Domestic burning ofwood, coal and paraffin is practiced by the verypoor, living in informal settlements, in South Africa.In 2011, the number of households living in infor-mal households was in the order of 1.25 Million, ofwhich 57% of these households did not have accessto electricity. Of the 43% of households that didhave access to electricity, many opted to still mak-ing use of domestic burning of wood, paraffin andcoal for their cooking and heating needs (HousingDevelopment Agency (HDA), 2013).The reason forthe large negative impact of domestic burning emis-sions on human health is the close proximity ofemissions to humans (at ground level), the con-comitance of peak emissions with periods of pooratmospheric dispersion (early morning, night timeand winter time) and the release of these emissionswithin areas of dense population exposure to bothindoor and outdoor pollution concentrations(Scorgie et al., 2004). On the other hand, powerstation emissions are emitted through tall stacks andtherefore usually dilute in the atmosphere beforereaching human lungs. It is believed that cost andunreliable supply are the main factors that keep theSouth African poor from switching to electricity(Friedl et al., 2008).
In the past, regional CO2 and NOx emission fac-tors for the power sector in Southern Africa weredetermined both theoretically and from continuousin-stack measurements for comparison to theIntergovernmental Panel on Climate Change(IPCC) default emission factors (Zhou et al. 2009).It was found that Southern African CO2 emissionfactors were on the upper end of the IPCC defaultemission range whereas NO2 emission factors werebelow the low end of the range. In 2013, a docu-ment was published on the outlook of the coalvalue chain in South Africa. Emissions projectionsfor South African coal-fired power stations weremade up until 2040 for four different future scenar-ios, namely a lag behind, more of the same, at theforefront and low carbon world scenario (SouthAfrican Coal Roadmap (SACRM), 2013). However,this document is already outdated in terms of thedecommissioning schedules of existing power sta-tions and the projection of future South Africanenergy demand (and therefore the building pro-gram of new power stations to meet this demand)(IRP, 2013). Currently there are no publicationsfocusing on the current and future status of coalfired power station emissions in South Africa – tak-ing into account the effect the energy crisis had onemissions, the most updated information on thedecommissioning schedules of stations, the com-missioning of stations currently under construction,
28 Journal of Energy in Southern Africa • Vol 26 No 3 • August 2015
the building of new stations and the retrofitting ofstations with new, more efficient, emissions abate-ment technologies in the future.
The aim of this paper is to give a perspective onthe contribution of South African coal-fired powerstations to a wide range of pollutants, including cri-teria pollutants (PM, NOx, SO2) and CO2. Historicalemissions were investigated in order to establish arelationship between an energy restricted environ-ment and emission trends. Estimations of futurecoal-fired power plant criteria and CO2 emissionsfrom 2015 to 2030 in South Africa are made forworst case, business as usual, intermediate and bestcase scenarios which are based on different predict-ed future energy demand outlooks and retrofit sce-narios of stations with emissions abatement tech-nologies.
1.1 The South African power sector
South Africa generates 32% of total energy on theAfrican continent. Eskom, one of the largest energyutilities in the world, is responsible for the genera-tion of approximately 95% of South African elec-tricity and 45% of Africa’s electricity (Eskom, 2010).Eskom power is exported to Botswana, Lesotho,Mozambique, Namibia, Swaziland and Zimbabwe.Eskom-owned coal-fired power plants, all of whichare base load plants, include Arnot, Duvha,Camden, Grootvei, Hendrina, Kendal, Komati,Kriel, Lethabo, Majuba, Matla, Matimba and Tutuka(Eskom, 2012). The remaining 5% of South Africanelectricity is generated by coal-fired power plantsowned by the private sector (Kelvin power plant),municipalities (Rooiwal, Pretoria West and Bloem-fontein power plants) and Sasol. Currently twoadditional Eskom plants are under construction,namely Medupi and Kusile. It is expected that thefirst units of each will come online during 2015,although there is still uncertainty about the precisedates (Eskom, 2013a; Eskom, 2013b). It is evidentthat even though the South African government istrying to reduce the country’s dependence on coal;it will remain a dominant source of energy in SouthAfrica, at least in the medium term.
Most South African power plants consist of six toten units with an average capacity of approximate-ly 600 megawatt (MW) each. Eight of the thirteenbase-load stations have generating capacities inexcess of 3 000 MW. When compared to theapproximate average sizes of thermal power plantsin the United States (737 MW) (US EnergyInformation Administration (US EIA), 2013a), it isclear that South African power stations are extreme-ly large when compared to their international coun-terparts.
South Africa has been at the forefront in thedeveloping world in recognizing climate change andits role in addressing carbon dioxide emissions. Thelatest developments include the commitments made
by the presidency at the 2009 Climate Summit, to a‘peak, plateau and decline’ emissions path between2010 and 2050. This means that carbon emissionsare allowed to peak between 2020 and 2025 at 500megatons (Mt) to 550 Mt CO2 equivalent and thento remain constant at this level until 2035, whereafter it should decline to between 200 Mt and 400Mt in 2050 (DEA, 2010; Department ofEnvironmental Affairs and Tourism (DEAT), 2009).In January 2010 the country formally notified its cli-mate change mitigation proposals with the UnitedNations Convention on Climate Change. Theseincluded a 34% reduction of emissions below‘Business as Usual’ by 2020 and a 42% reductionby 2025. Whether or not these targets can be real-istically met will be addressed in Section 3.3 of thispaper when future CO2 emissions projections forSouth Africa are discussed.
1.2 South African coal quality
South African coal has the general characteristics ofthe southern hemisphere Gondwana coal andtherefore differs from northern hemisphereLaurasian coal in being variable between regionsand seams and in possessing relatively high ashcontents, low calorific values and low sulphur, sodi-um, potassium and chlorine contents (Falcon andHam, 1988). The variability in the quality of SouthAfrican coals is illustrated by the fact that the differ-ence between the maximum and minimum ashcontents, calorific values and sulphur contentsburned at Eskom during the 1999 to 2012 histori-cal period was 4%, 6 mega joules per kilogram(MJ/kg) and 19%, respectively (Eskom, 2006 -2012). The average ash content, sulphur contentand calorific values of South African fuel coals com-pared to those of China, United States (US), India,Russia and Germany, the major coal consumers inthe world, are shown in Figure 1 (Chandra andChandra, 2004; Eskom, 2006; 2007; 2008; 2009;2011; 2012; European Association for Coal andLignite (EURACOAL), 2013; Podbaronova, 2010;Sun, 2010 and US EIA, 2013b). The annual coalconsumption of each country is also indicated inmegatons per annum (Mtpa) (US EIA, 2014).
2. Methods
2.1 Historical South African power plant
emissions
Historical South African coal-fired power stationemissions were investigated in order to understandthe effect of an energy restricted environment onemissions. Historical emissions and energy produc-tion information for Eskom power plants over theperiod 1999 to 2012 were obtained from theEskom energy utility’s annual reports (Eskom,2006-2012). Total annual PM emissions reported inthese reports were estimated by means of continu-ous opacity monitoring systems and estimated vol-
Journal of Energy in Southern Africa • Vol 26 No 3 • August 2015 29
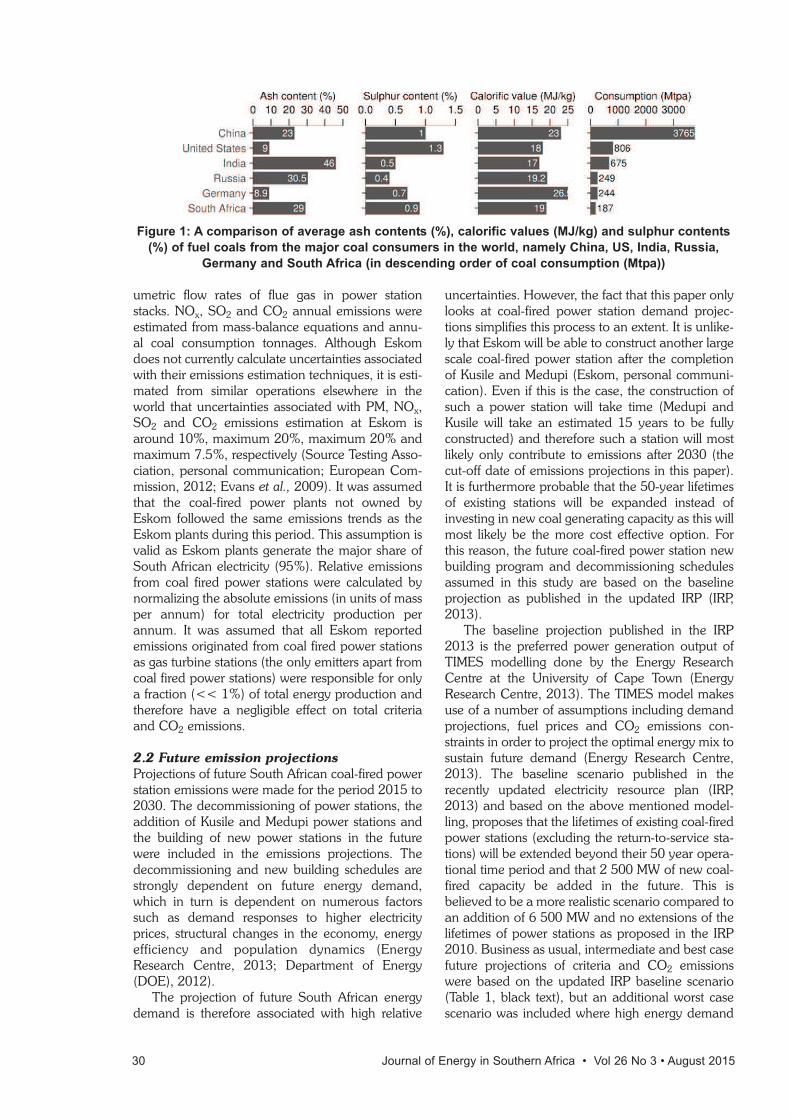
umetric flow rates of flue gas in power stationstacks. NOx, SO2 and CO2 annual emissions wereestimated from mass-balance equations and annu-al coal consumption tonnages. Although Eskomdoes not currently calculate uncertainties associatedwith their emissions estimation techniques, it is esti-mated from similar operations elsewhere in theworld that uncertainties associated with PM, NOx,SO2 and CO2 emissions estimation at Eskom isaround 10%, maximum 20%, maximum 20% andmaximum 7.5%, respectively (Source Testing Asso-ciation, personal communication; European Com-mission, 2012; Evans et al., 2009). It was assumedthat the coal-fired power plants not owned byEskom followed the same emissions trends as theEskom plants during this period. This assumption isvalid as Eskom plants generate the major share ofSouth African electricity (95%). Relative emissionsfrom coal fired power stations were calculated bynormalizing the absolute emissions (in units of massper annum) for total electricity production perannum. It was assumed that all Eskom reportedemissions originated from coal fired power stationsas gas turbine stations (the only emitters apart fromcoal fired power stations) were responsible for onlya fraction (<< 1%) of total energy production andtherefore have a negligible effect on total criteriaand CO2 emissions.
2.2 Future emission projections
Projections of future South African coal-fired powerstation emissions were made for the period 2015 to2030. The decommissioning of power stations, theaddition of Kusile and Medupi power stations andthe building of new power stations in the futurewere included in the emissions projections. Thedecommissioning and new building schedules arestrongly dependent on future energy demand,which in turn is dependent on numerous factorssuch as demand responses to higher electricityprices, structural changes in the economy, energyefficiency and population dynamics (EnergyResearch Centre, 2013; Department of Energy(DOE), 2012).
The projection of future South African energydemand is therefore associated with high relative
uncertainties. However, the fact that this paper onlylooks at coal-fired power station demand projec-tions simplifies this process to an extent. It is unlike-ly that Eskom will be able to construct another largescale coal-fired power station after the completionof Kusile and Medupi (Eskom, personal communi-cation). Even if this is the case, the construction ofsuch a power station will take time (Medupi andKusile will take an estimated 15 years to be fullyconstructed) and therefore such a station will mostlikely only contribute to emissions after 2030 (thecut-off date of emissions projections in this paper).It is furthermore probable that the 50-year lifetimesof existing stations will be expanded instead ofinvesting in new coal generating capacity as this willmost likely be the more cost effective option. Forthis reason, the future coal-fired power station newbuilding program and decommissioning schedulesassumed in this study are based on the baselineprojection as published in the updated IRP (IRP,2013).
The baseline projection published in the IRP2013 is the preferred power generation output ofTIMES modelling done by the Energy ResearchCentre at the University of Cape Town (EnergyResearch Centre, 2013). The TIMES model makesuse of a number of assumptions including demandprojections, fuel prices and CO2 emissions con-straints in order to project the optimal energy mix tosustain future demand (Energy Research Centre,2013). The baseline scenario published in therecently updated electricity resource plan (IRP,2013) and based on the above mentioned model-ling, proposes that the lifetimes of existing coal-firedpower stations (excluding the return-to-service sta-tions) will be extended beyond their 50 year opera-tional time period and that 2 500 MW of new coal-fired capacity be added in the future. This isbelieved to be a more realistic scenario compared toan addition of 6 500 MW and no extensions of thelifetimes of power stations as proposed in the IRP2010. Business as usual, intermediate and best casefuture projections of criteria and CO2 emissionswere based on the updated IRP baseline scenario(Table 1, black text), but an additional worst casescenario was included where high energy demand
30 Journal of Energy in Southern Africa • Vol 26 No 3 • August 2015
Figure 1: A comparison of average ash contents (%), calorific values (MJ/kg) and sulphur contents
(%) of fuel coals from the major coal consumers in the world, namely China, US, India, Russia,
Germany and South Africa (in descending order of coal consumption (Mtpa))
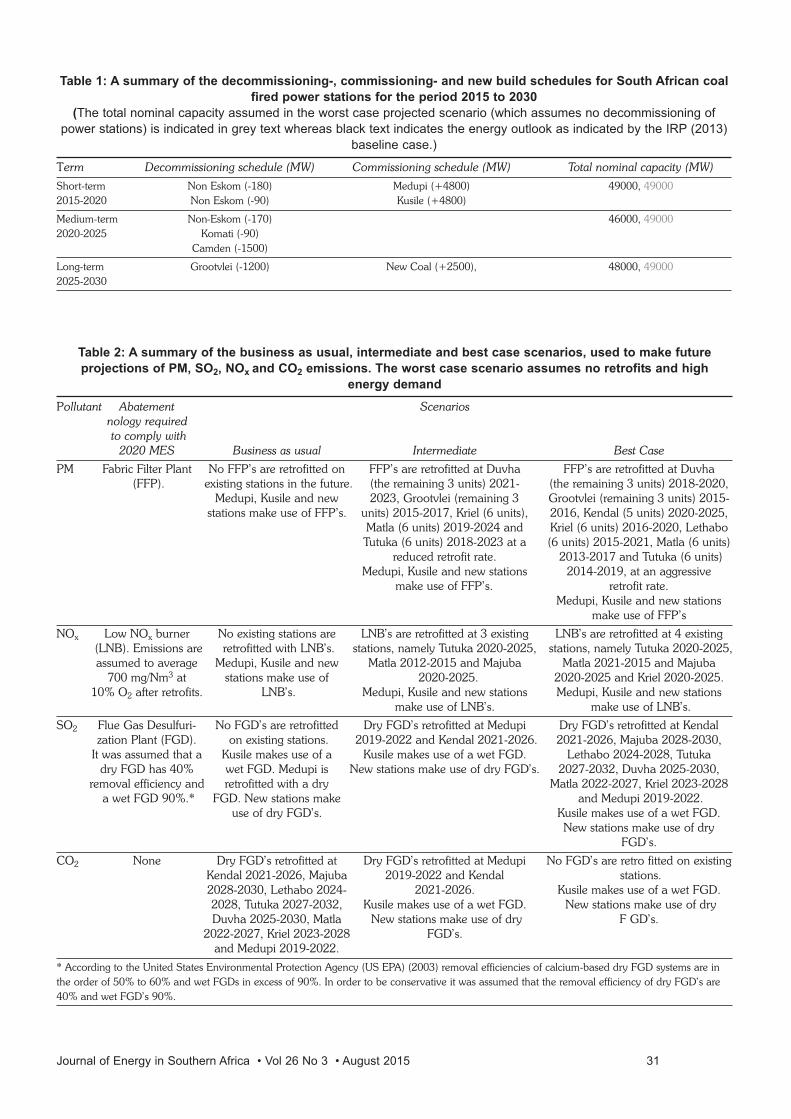
Table 1: A summary of the decommissioning-, commissioning- and new build schedules for South African coal
fired power stations for the period 2015 to 2030
(The total nominal capacity assumed in the worst case projected scenario (which assumes no decommissioning of
power stations) is indicated in grey text whereas black text indicates the energy outlook as indicated by the IRP (2013)
baseline case.)
Term Decommissioning schedule (MW) Commissioning schedule (MW) Total nominal capacity (MW)
Short-term Non Eskom (-180) Medupi (+4800) 49000, 490002015-2020 Non Eskom (-90) Kusile (+4800)
Medium-term Non-Eskom (-170) 46000, 490002020-2025 Komati (-90)
Camden (-1500)
Long-term Grootvlei (-1200) New Coal (+2500), 48000, 490002025-2030
Table 2: A summary of the business as usual, intermediate and best case scenarios, used to make future
projections of PM, SO2, NOx and CO2 emissions. The worst case scenario assumes no retrofits and high
energy demand
Pollutant Abatement Scenariosnology requiredto comply with 2020 MES Business as usual Intermediate Best Case
PM Fabric Filter Plant No FFP’s are retrofitted on FFP’s are retrofitted at Duvha FFP’s are retrofitted at Duvha(FFP). existing stations in the future. (the remaining 3 units) 2021- (the remaining 3 units) 2018-2020,
Medupi, Kusile and new 2023, Grootvlei (remaining 3 Grootvlei (remaining 3 units) 2015-stations make use of FFP’s. units) 2015-2017, Kriel (6 units), 2016, Kendal (5 units) 2020-2025,
Matla (6 units) 2019-2024 and Kriel (6 units) 2016-2020, LethaboTutuka (6 units) 2018-2023 at a (6 units) 2015-2021, Matla (6 units)
reduced retrofit rate. 2013-2017 and Tutuka (6 units)Medupi, Kusile and new stations 2014-2019, at an aggressive
make use of FFP’s. retrofit rate. Medupi, Kusile and new stations
make use of FFP’s
NOx Low NOx burner No existing stations are LNB’s are retrofitted at 3 existing LNB’s are retrofitted at 4 existing(LNB). Emissions are retrofitted with LNB’s. stations, namely Tutuka 2020-2025, stations, namely Tutuka 2020-2025, assumed to average Medupi, Kusile and new Matla 2012-2015 and Majuba Matla 2021-2015 and Majuba
700 mg/Nm3 at stations make use of 2020-2025. 2020-2025 and Kriel 2020-2025.10% O2 after retrofits. LNB’s. Medupi, Kusile and new stations Medupi, Kusile and new stations
make use of LNB’s. make use of LNB’s.
SO2 Flue Gas Desulfuri- No FGD’s are retrofitted Dry FGD’s retrofitted at Medupi Dry FGD’s retrofitted at Kendal zation Plant (FGD). on existing stations. 2019-2022 and Kendal 2021-2026. 2021-2026, Majuba 2028-2030,
It was assumed that a Kusile makes use of a Kusile makes use of a wet FGD. Lethabo 2024-2028, Tutukadry FGD has 40% wet FGD. Medupi is New stations make use of dry FGD’s. 2027-2032, Duvha 2025-2030,
removal efficiency and retrofitted with a dry Matla 2022-2027, Kriel 2023-2028a wet FGD 90%.* FGD. New stations make and Medupi 2019-2022.
use of dry FGD’s. Kusile makes use of a wet FGD. New stations make use of dry
FGD’s.
CO2 None Dry FGD’s retrofitted at Dry FGD’s retrofitted at Medupi No FGD’s are retro fitted on existingKendal 2021-2026, Majuba 2019-2022 and Kendal stations. 2028-2030, Lethabo 2024- 2021-2026. Kusile makes use of a wet FGD.2028, Tutuka 2027-2032, Kusile makes use of a wet FGD. New stations make use of dryDuvha 2025-2030, Matla New stations make use of dry F GD’s.
2022-2027, Kriel 2023-2028 FGD’s.and Medupi 2019-2022.
* According to the United States Environmental Protection Agency (US EPA) (2003) removal efficiencies of calcium-based dry FGD systems are inthe order of 50% to 60% and wet FGDs in excess of 90%. In order to be conservative it was assumed that the removal efficiency of dry FGD’s are40% and wet FGD’s 90%.
Journal of Energy in Southern Africa • Vol 26 No 3 • August 2015 31
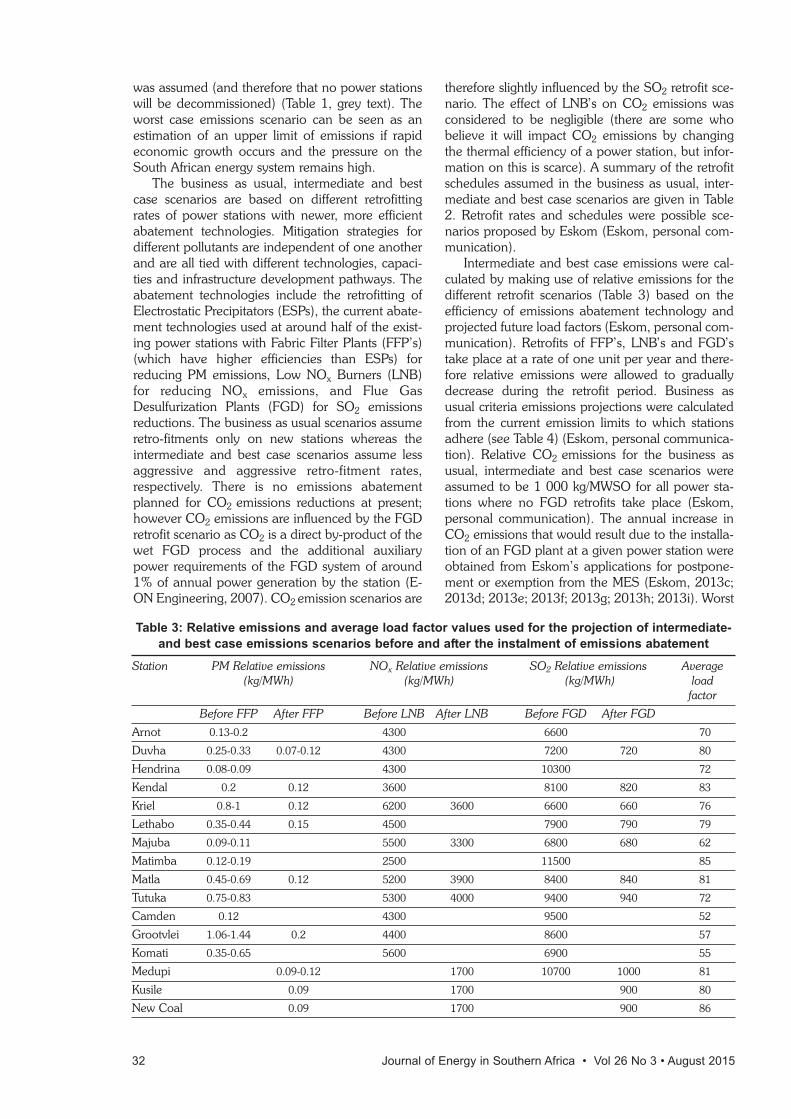
was assumed (and therefore that no power stationswill be decommissioned) (Table 1, grey text). Theworst case emissions scenario can be seen as anestimation of an upper limit of emissions if rapideconomic growth occurs and the pressure on theSouth African energy system remains high.
The business as usual, intermediate and bestcase scenarios are based on different retrofittingrates of power stations with newer, more efficientabatement technologies. Mitigation strategies fordifferent pollutants are independent of one anotherand are all tied with different technologies, capaci-ties and infrastructure development pathways. Theabatement technologies include the retrofitting ofElectrostatic Precipitators (ESPs), the current abate-ment technologies used at around half of the exist-ing power stations with Fabric Filter Plants (FFP’s)(which have higher efficiencies than ESPs) forreducing PM emissions, Low NOx Burners (LNB)for reducing NOx emissions, and Flue GasDesulfurization Plants (FGD) for SO2 emissionsreductions. The business as usual scenarios assumeretro-fitments only on new stations whereas theintermediate and best case scenarios assume lessaggressive and aggressive retro-fitment rates,respectively. There is no emissions abatementplanned for CO2 emissions reductions at present;however CO2 emissions are influenced by the FGDretrofit scenario as CO2 is a direct by-product of thewet FGD process and the additional auxiliarypower requirements of the FGD system of around1% of annual power generation by the station (E-ON Engineering, 2007). CO2 emission scenarios are
therefore slightly influenced by the SO2 retrofit sce-nario. The effect of LNB’s on CO2 emissions wasconsidered to be negligible (there are some whobelieve it will impact CO2 emissions by changingthe thermal efficiency of a power station, but infor-mation on this is scarce). A summary of the retrofitschedules assumed in the business as usual, inter-mediate and best case scenarios are given in Table2. Retrofit rates and schedules were possible sce-narios proposed by Eskom (Eskom, personal com-munication).
Intermediate and best case emissions were cal-culated by making use of relative emissions for thedifferent retrofit scenarios (Table 3) based on theefficiency of emissions abatement technology andprojected future load factors (Eskom, personal com-munication). Retrofits of FFP’s, LNB’s and FGD’stake place at a rate of one unit per year and there-fore relative emissions were allowed to graduallydecrease during the retrofit period. Business asusual criteria emissions projections were calculatedfrom the current emission limits to which stationsadhere (see Table 4) (Eskom, personal communica-tion). Relative CO2 emissions for the business asusual, intermediate and best case scenarios wereassumed to be 1 000 kg/MWSO for all power sta-tions where no FGD retrofits take place (Eskom,personal communication). The annual increase inCO2 emissions that would result due to the installa-tion of an FGD plant at a given power station wereobtained from Eskom’s applications for postpone-ment or exemption from the MES (Eskom, 2013c;2013d; 2013e; 2013f; 2013g; 2013h; 2013i). Worst
Table 3: Relative emissions and average load factor values used for the projection of intermediate-
and best case emissions scenarios before and after the instalment of emissions abatement
Station PM Relative emissions NOx Relative emissions SO2 Relative emissions Average(kg/MWh) (kg/MWh) (kg/MWh) load
factor
Before FFP After FFP Before LNB After LNB Before FGD After FGD
Arnot 0.13-0.2 4300 6600 70
Duvha 0.25-0.33 0.07-0.12 4300 7200 720 80
Hendrina 0.08-0.09 4300 10300 72
Kendal 0.2 0.12 3600 8100 820 83
Kriel 0.8-1 0.12 6200 3600 6600 660 76
Lethabo 0.35-0.44 0.15 4500 7900 790 79
Majuba 0.09-0.11 5500 3300 6800 680 62
Matimba 0.12-0.19 2500 11500 85
Matla 0.45-0.69 0.12 5200 3900 8400 840 81
Tutuka 0.75-0.83 5300 4000 9400 940 72
Camden 0.12 4300 9500 52
Grootvlei 1.06-1.44 0.2 4400 8600 57
Komati 0.35-0.65 5600 6900 55
Medupi 0.09-0.12 1700 10700 1000 81
Kusile 0.09 1700 900 80
New Coal 0.09 1700 900 86
32 Journal of Energy in Southern Africa • Vol 26 No 3 • August 2015
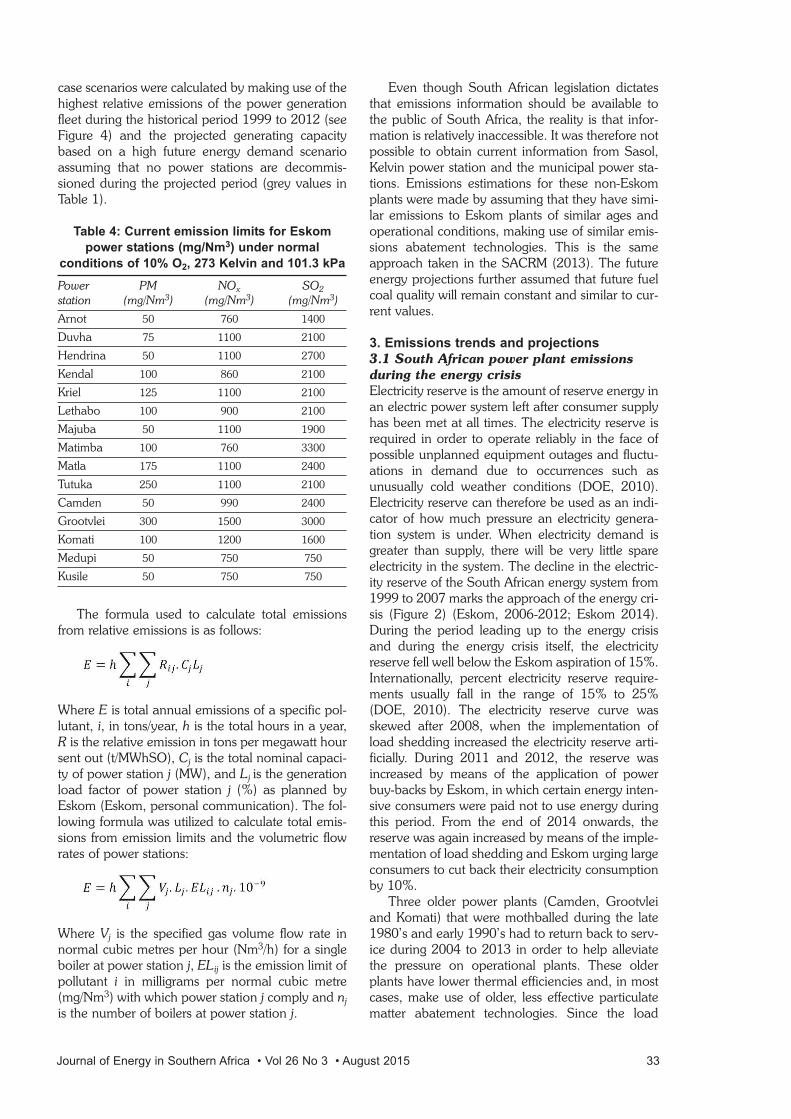
case scenarios were calculated by making use of thehighest relative emissions of the power generationfleet during the historical period 1999 to 2012 (seeFigure 4) and the projected generating capacitybased on a high future energy demand scenarioassuming that no power stations are decommis-sioned during the projected period (grey values inTable 1).
Table 4: Current emission limits for Eskom
power stations (mg/Nm3) under normal
conditions of 10% O2, 273 Kelvin and 101.3 kPa
Power PM NOx SO2
station (mg/Nm3) (mg/Nm3) (mg/Nm3)
Arnot 50 760 1400
Duvha 75 1100 2100
Hendrina 50 1100 2700
Kendal 100 860 2100
Kriel 125 1100 2100
Lethabo 100 900 2100
Majuba 50 1100 1900
Matimba 100 760 3300
Matla 175 1100 2400
Tutuka 250 1100 2100
Camden 50 990 2400
Grootvlei 300 1500 3000
Komati 100 1200 1600
Medupi 50 750 750
Kusile 50 750 750
The formula used to calculate total emissionsfrom relative emissions is as follows:
Where E is total annual emissions of a specific pol-lutant, i, in tons/year, h is the total hours in a year,R is the relative emission in tons per megawatt hoursent out (t/MWhSO), Cj is the total nominal capaci-ty of power station j (MW), and Lj is the generationload factor of power station j (%) as planned byEskom (Eskom, personal communication). The fol-lowing formula was utilized to calculate total emis-sions from emission limits and the volumetric flowrates of power stations:
Where Vj is the specified gas volume flow rate innormal cubic metres per hour (Nm3/h) for a singleboiler at power station j, ELij is the emission limit ofpollutant i in milligrams per normal cubic metre(mg/Nm3) with which power station j comply and njis the number of boilers at power station j.
Even though South African legislation dictatesthat emissions information should be available tothe public of South Africa, the reality is that infor-mation is relatively inaccessible. It was therefore notpossible to obtain current information from Sasol,Kelvin power station and the municipal power sta-tions. Emissions estimations for these non-Eskomplants were made by assuming that they have simi-lar emissions to Eskom plants of similar ages andoperational conditions, making use of similar emis-sions abatement technologies. This is the sameapproach taken in the SACRM (2013). The futureenergy projections further assumed that future fuelcoal quality will remain constant and similar to cur-rent values.
3. Emissions trends and projections
3.1 South African power plant emissions
during the energy crisis
Electricity reserve is the amount of reserve energy inan electric power system left after consumer supplyhas been met at all times. The electricity reserve isrequired in order to operate reliably in the face ofpossible unplanned equipment outages and fluctu-ations in demand due to occurrences such asunusually cold weather conditions (DOE, 2010).Electricity reserve can therefore be used as an indi-cator of how much pressure an electricity genera-tion system is under. When electricity demand isgreater than supply, there will be very little spareelectricity in the system. The decline in the electric-ity reserve of the South African energy system from1999 to 2007 marks the approach of the energy cri-sis (Figure 2) (Eskom, 2006-2012; Eskom 2014).During the period leading up to the energy crisisand during the energy crisis itself, the electricityreserve fell well below the Eskom aspiration of 15%.Internationally, percent electricity reserve require-ments usually fall in the range of 15% to 25%(DOE, 2010). The electricity reserve curve wasskewed after 2008, when the implementation ofload shedding increased the electricity reserve arti-ficially. During 2011 and 2012, the reserve wasincreased by means of the application of powerbuy-backs by Eskom, in which certain energy inten-sive consumers were paid not to use energy duringthis period. From the end of 2014 onwards, thereserve was again increased by means of the imple-mentation of load shedding and Eskom urging largeconsumers to cut back their electricity consumptionby 10%.
Three older power plants (Camden, Grootvleiand Komati) that were mothballed during the late1980’s and early 1990’s had to return back to serv-ice during 2004 to 2013 in order to help alleviatethe pressure on operational plants. These olderplants have lower thermal efficiencies and, in mostcases, make use of older, less effective particulatematter abatement technologies. Since the load
Journal of Energy in Southern Africa • Vol 26 No 3 • August 2015 33
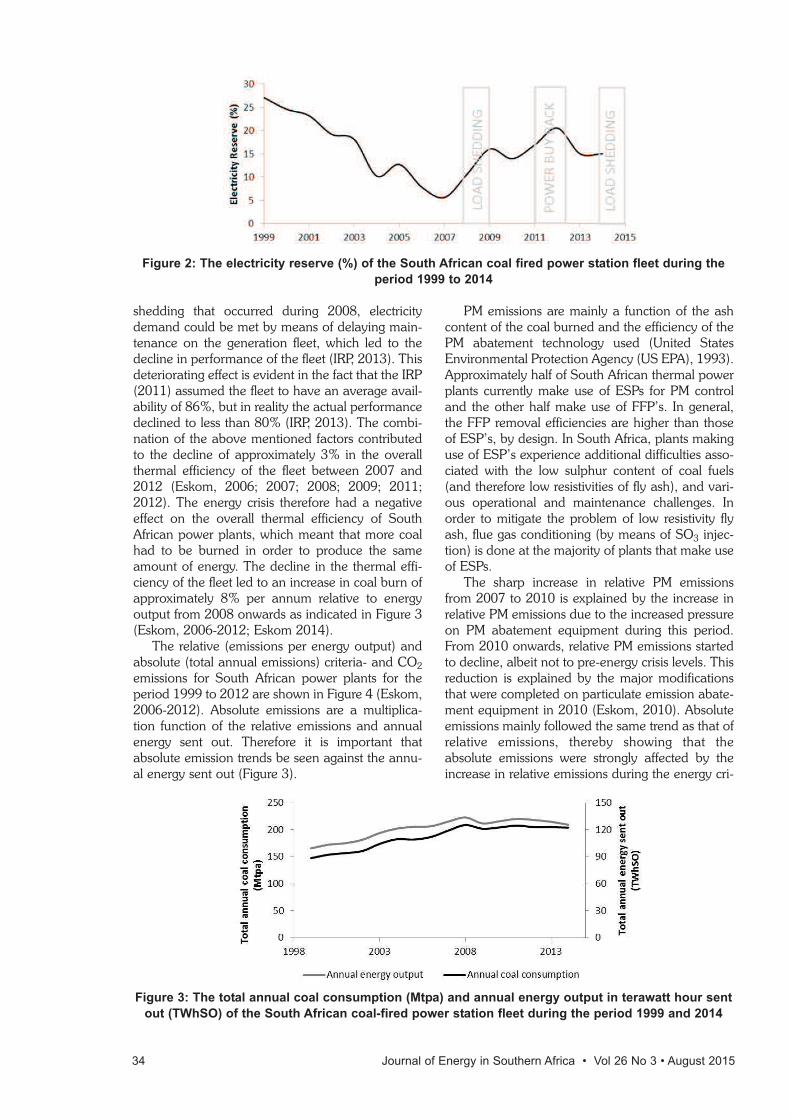
shedding that occurred during 2008, electricitydemand could be met by means of delaying main-tenance on the generation fleet, which led to thedecline in performance of the fleet (IRP, 2013). Thisdeteriorating effect is evident in the fact that the IRP(2011) assumed the fleet to have an average avail-ability of 86%, but in reality the actual performancedeclined to less than 80% (IRP, 2013). The combi-nation of the above mentioned factors contributedto the decline of approximately 3% in the overallthermal efficiency of the fleet between 2007 and2012 (Eskom, 2006; 2007; 2008; 2009; 2011;2012). The energy crisis therefore had a negativeeffect on the overall thermal efficiency of SouthAfrican power plants, which meant that more coalhad to be burned in order to produce the sameamount of energy. The decline in the thermal effi-ciency of the fleet led to an increase in coal burn ofapproximately 8% per annum relative to energyoutput from 2008 onwards as indicated in Figure 3(Eskom, 2006-2012; Eskom 2014).
The relative (emissions per energy output) andabsolute (total annual emissions) criteria- and CO2emissions for South African power plants for theperiod 1999 to 2012 are shown in Figure 4 (Eskom,2006-2012). Absolute emissions are a multiplica-tion function of the relative emissions and annualenergy sent out. Therefore it is important thatabsolute emission trends be seen against the annu-al energy sent out (Figure 3).
PM emissions are mainly a function of the ashcontent of the coal burned and the efficiency of thePM abatement technology used (United StatesEnvironmental Protection Agency (US EPA), 1993).Approximately half of South African thermal powerplants currently make use of ESPs for PM controland the other half make use of FFP’s. In general,the FFP removal efficiencies are higher than thoseof ESP’s, by design. In South Africa, plants makinguse of ESP’s experience additional difficulties asso-ciated with the low sulphur content of coal fuels(and therefore low resistivities of fly ash), and vari-ous operational and maintenance challenges. Inorder to mitigate the problem of low resistivity flyash, flue gas conditioning (by means of SO3 injec-tion) is done at the majority of plants that make useof ESPs.
The sharp increase in relative PM emissionsfrom 2007 to 2010 is explained by the increase inrelative PM emissions due to the increased pressureon PM abatement equipment during this period.From 2010 onwards, relative PM emissions startedto decline, albeit not to pre-energy crisis levels. Thisreduction is explained by the major modificationsthat were completed on particulate emission abate-ment equipment in 2010 (Eskom, 2010). Absoluteemissions mainly followed the same trend as that ofrelative emissions, thereby showing that theabsolute emissions were strongly affected by theincrease in relative emissions during the energy cri-
Figure 2: The electricity reserve (%) of the South African coal fired power station fleet during the
period 1999 to 2014
Figure 3: The total annual coal consumption (Mtpa) and annual energy output in terawatt hour sent
out (TWhSO) of the South African coal-fired power station fleet during the period 1999 and 2014
34 Journal of Energy in Southern Africa • Vol 26 No 3 • August 2015
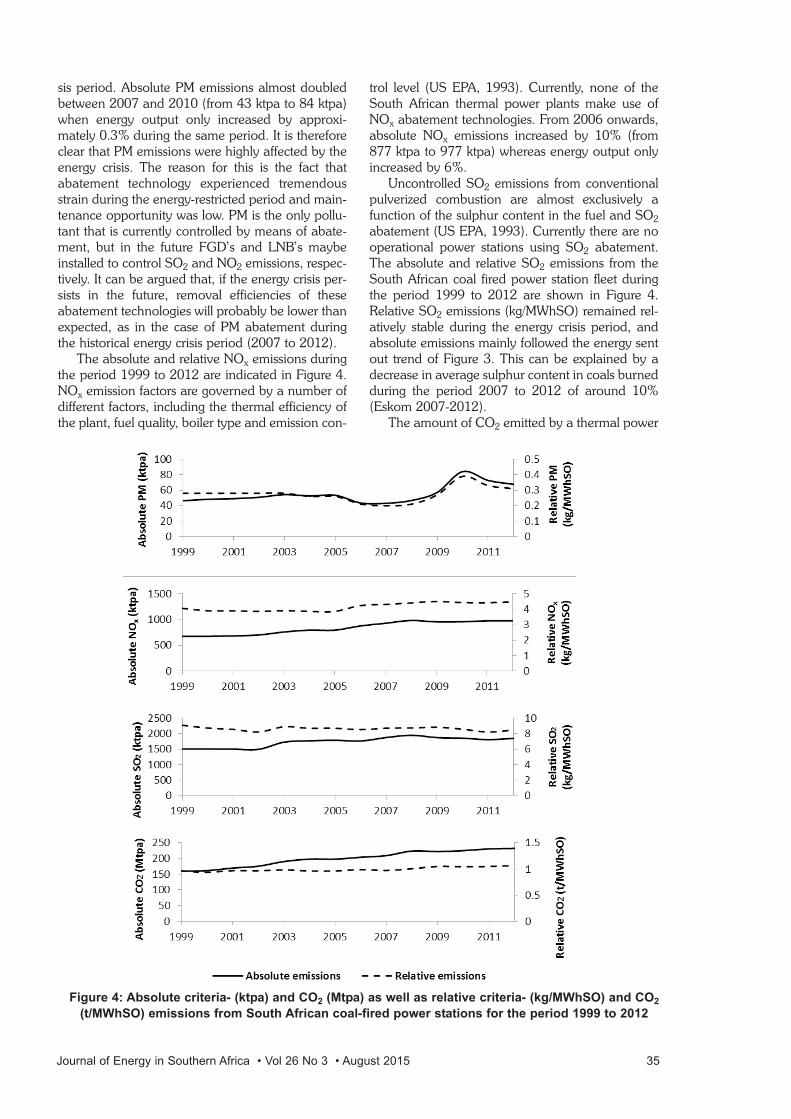
sis period. Absolute PM emissions almost doubledbetween 2007 and 2010 (from 43 ktpa to 84 ktpa)when energy output only increased by approxi-mately 0.3% during the same period. It is thereforeclear that PM emissions were highly affected by theenergy crisis. The reason for this is the fact thatabatement technology experienced tremendousstrain during the energy-restricted period and main-tenance opportunity was low. PM is the only pollu-tant that is currently controlled by means of abate-ment, but in the future FGD’s and LNB’s maybeinstalled to control SO2 and NO2 emissions, respec-tively. It can be argued that, if the energy crisis per-sists in the future, removal efficiencies of theseabatement technologies will probably be lower thanexpected, as in the case of PM abatement duringthe historical energy crisis period (2007 to 2012).
The absolute and relative NOx emissions duringthe period 1999 to 2012 are indicated in Figure 4.NOx emission factors are governed by a number ofdifferent factors, including the thermal efficiency ofthe plant, fuel quality, boiler type and emission con-
trol level (US EPA, 1993). Currently, none of theSouth African thermal power plants make use ofNOx abatement technologies. From 2006 onwards,absolute NOx emissions increased by 10% (from877 ktpa to 977 ktpa) whereas energy output onlyincreased by 6%.
Uncontrolled SO2 emissions from conventionalpulverized combustion are almost exclusively afunction of the sulphur content in the fuel and SO2abatement (US EPA, 1993). Currently there are nooperational power stations using SO2 abatement.The absolute and relative SO2 emissions from theSouth African coal fired power station fleet duringthe period 1999 to 2012 are shown in Figure 4.Relative SO2 emissions (kg/MWhSO) remained rel-atively stable during the energy crisis period, andabsolute emissions mainly followed the energy sentout trend of Figure 3. This can be explained by adecrease in average sulphur content in coals burnedduring the period 2007 to 2012 of around 10%(Eskom 2007-2012).
The amount of CO2 emitted by a thermal power
Figure 4: Absolute criteria- (ktpa) and CO2 (Mtpa) as well as relative criteria- (kg/MWhSO) and CO2
(t/MWhSO) emissions from South African coal-fired power stations for the period 1999 to 2012
Journal of Energy in Southern Africa • Vol 26 No 3 • August 2015 35
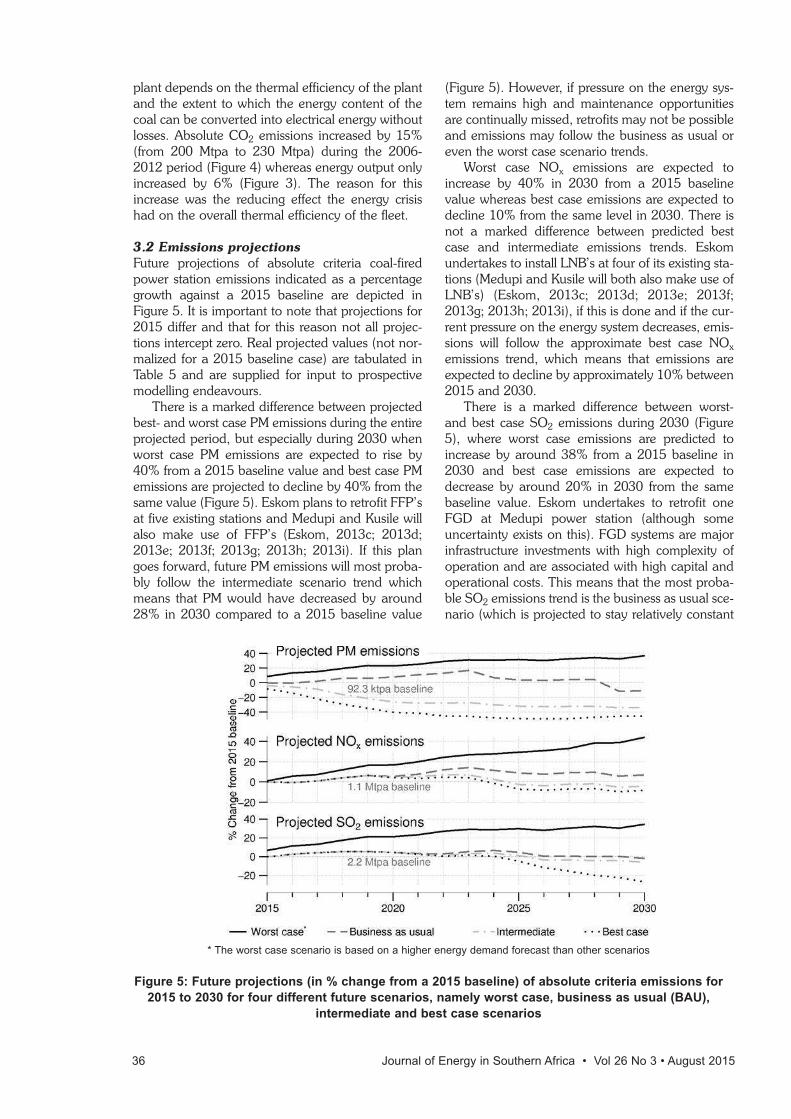
plant depends on the thermal efficiency of the plantand the extent to which the energy content of thecoal can be converted into electrical energy withoutlosses. Absolute CO2 emissions increased by 15%(from 200 Mtpa to 230 Mtpa) during the 2006-2012 period (Figure 4) whereas energy output onlyincreased by 6% (Figure 3). The reason for thisincrease was the reducing effect the energy crisishad on the overall thermal efficiency of the fleet.
3.2 Emissions projections
Future projections of absolute criteria coal-firedpower station emissions indicated as a percentagegrowth against a 2015 baseline are depicted inFigure 5. It is important to note that projections for2015 differ and that for this reason not all projec-tions intercept zero. Real projected values (not nor-malized for a 2015 baseline case) are tabulated inTable 5 and are supplied for input to prospectivemodelling endeavours.
There is a marked difference between projectedbest- and worst case PM emissions during the entireprojected period, but especially during 2030 whenworst case PM emissions are expected to rise by40% from a 2015 baseline value and best case PMemissions are projected to decline by 40% from thesame value (Figure 5). Eskom plans to retrofit FFP’sat five existing stations and Medupi and Kusile willalso make use of FFP’s (Eskom, 2013c; 2013d;2013e; 2013f; 2013g; 2013h; 2013i). If this plangoes forward, future PM emissions will most proba-bly follow the intermediate scenario trend whichmeans that PM would have decreased by around28% in 2030 compared to a 2015 baseline value
(Figure 5). However, if pressure on the energy sys-tem remains high and maintenance opportunitiesare continually missed, retrofits may not be possibleand emissions may follow the business as usual oreven the worst case scenario trends.
Worst case NOx emissions are expected toincrease by 40% in 2030 from a 2015 baselinevalue whereas best case emissions are expected todecline 10% from the same level in 2030. There isnot a marked difference between predicted bestcase and intermediate emissions trends. Eskomundertakes to install LNB’s at four of its existing sta-tions (Medupi and Kusile will both also make use ofLNB’s) (Eskom, 2013c; 2013d; 2013e; 2013f;2013g; 2013h; 2013i), if this is done and if the cur-rent pressure on the energy system decreases, emis-sions will follow the approximate best case NOxemissions trend, which means that emissions areexpected to decline by approximately 10% between2015 and 2030.
There is a marked difference between worst-and best case SO2 emissions during 2030 (Figure5), where worst case emissions are predicted toincrease by around 38% from a 2015 baseline in2030 and best case emissions are expected todecrease by around 20% in 2030 from the samebaseline value. Eskom undertakes to retrofit oneFGD at Medupi power station (although someuncertainty exists on this). FGD systems are majorinfrastructure investments with high complexity ofoperation and are associated with high capital andoperational costs. This means that the most proba-ble SO2 emissions trend is the business as usual sce-nario (which is projected to stay relatively constant
* The worst case scenario is based on a higher energy demand forecast than other scenarios
Figure 5: Future projections (in % change from a 2015 baseline) of absolute criteria emissions for
2015 to 2030 for four different future scenarios, namely worst case, business as usual (BAU),
intermediate and best case scenarios
36 Journal of Energy in Southern Africa • Vol 26 No 3 • August 2015
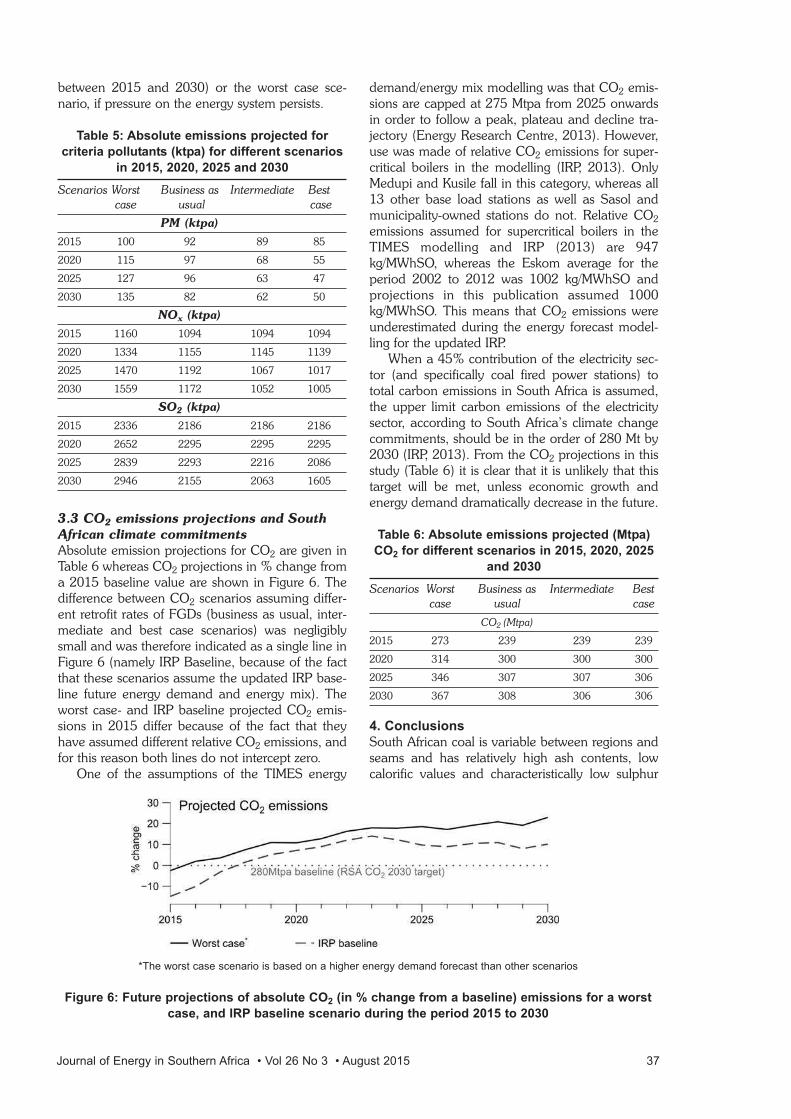
between 2015 and 2030) or the worst case sce-nario, if pressure on the energy system persists.
Table 5: Absolute emissions projected for
criteria pollutants (ktpa) for different scenarios
in 2015, 2020, 2025 and 2030
Scenarios Worst Business as Intermediate Bestcase usual case
PM (ktpa)
2015 100 92 89 85
2020 115 97 68 55
2025 127 96 63 47
2030 135 82 62 50
NOx (ktpa)
2015 1160 1094 1094 1094
2020 1334 1155 1145 1139
2025 1470 1192 1067 1017
2030 1559 1172 1052 1005
SO2 (ktpa)
2015 2336 2186 2186 2186
2020 2652 2295 2295 2295
2025 2839 2293 2216 2086
2030 2946 2155 2063 1605
3.3 CO2 emissions projections and South
African climate commitments
Absolute emission projections for CO2 are given inTable 6 whereas CO2 projections in % change froma 2015 baseline value are shown in Figure 6. Thedifference between CO2 scenarios assuming differ-ent retrofit rates of FGDs (business as usual, inter-mediate and best case scenarios) was negligiblysmall and was therefore indicated as a single line inFigure 6 (namely IRP Baseline, because of the factthat these scenarios assume the updated IRP base-line future energy demand and energy mix). Theworst case- and IRP baseline projected CO2 emis-sions in 2015 differ because of the fact that theyhave assumed different relative CO2 emissions, andfor this reason both lines do not intercept zero.
One of the assumptions of the TIMES energy
demand/energy mix modelling was that CO2 emis-sions are capped at 275 Mtpa from 2025 onwardsin order to follow a peak, plateau and decline tra-jectory (Energy Research Centre, 2013). However,use was made of relative CO2 emissions for super-critical boilers in the modelling (IRP, 2013). OnlyMedupi and Kusile fall in this category, whereas all13 other base load stations as well as Sasol andmunicipality-owned stations do not. Relative CO2emissions assumed for supercritical boilers in theTIMES modelling and IRP (2013) are 947kg/MWhSO, whereas the Eskom average for theperiod 2002 to 2012 was 1002 kg/MWhSO andprojections in this publication assumed 1000kg/MWhSO. This means that CO2 emissions wereunderestimated during the energy forecast model-ling for the updated IRP.
When a 45% contribution of the electricity sec-tor (and specifically coal fired power stations) tototal carbon emissions in South Africa is assumed,the upper limit carbon emissions of the electricitysector, according to South Africa’s climate changecommitments, should be in the order of 280 Mt by2030 (IRP, 2013). From the CO2 projections in thisstudy (Table 6) it is clear that it is unlikely that thistarget will be met, unless economic growth andenergy demand dramatically decrease in the future.
Table 6: Absolute emissions projected (Mtpa)
CO2 for different scenarios in 2015, 2020, 2025
and 2030
Scenarios Worst Business as Intermediate Best case usual case
CO2 (Mtpa)
2015 273 239 239 239
2020 314 300 300 300
2025 346 307 307 306
2030 367 308 306 306
4. Conclusions
South African coal is variable between regions andseams and has relatively high ash contents, lowcalorific values and characteristically low sulphur
*The worst case scenario is based on a higher energy demand forecast than other scenarios
Figure 6: Future projections of absolute CO2 (in % change from a baseline) emissions for a worst
case, and IRP baseline scenario during the period 2015 to 2030
Journal of Energy in Southern Africa • Vol 26 No 3 • August 2015 37
contents. The difference between the maximumand minimum ash contents, calorific values and sul-phur contents during the historical period 1999 to2012 is 4%, 6 MJ/kg and 19%, respectively. Theimplication of this is that emissions from SouthAfrican coal-fired power stations may vary onlybased on the variability of fuel coals. This is espe-cially true for uncontrolled SO2 emissions as sul-phur contents showed large variability during thehistorical period.
An energy-restricted environment has anincreasing effect on emissions. This is especially truefor pollutants controlled by means of abatement asincreased pressure on abatement technology andlow maintenance opportunity reduce removal effi-ciencies. Absolute PM emissions doubled between2007 and 2010, the height of the energy crisis,when energy output only increased by around0.3% during the same period. There is a markeddifference between projected best- and worst casePM emissions during the 2015 to 2030 projectedperiod, but especially during 2030 when worst casePM emissions are expected to rise by 40% from a2015 baseline value and best case PM emissionsare projected to decline by 40% from the samevalue.
NOx emissions increased by 10% during the2006-2012 energy crisis period whereas energyoutput only increased by 6%. The reason for thisincrease was the reducing effect the energy crisishad on the overall thermal efficiency of the coal-fired power station fleet. Worst case NOx emissionsare expected to increase by 40% in 2030 from a2015 baseline value whereas best case emissionsare expected to decline 10% from the same level in2030.
SO2 emissions did not increase during the ener-gy crisis because the sulphur content in fuel coalsdecreased. There is a marked difference betweenworst- and best case SO2 emissions during 2030,where worst case emissions are predicted toincrease by around 38% from a 2015 baseline in2030 and best case emissions are expected todecrease by around 20% in 2030 from the samebaseline value. The best case SO2 scenario (eightstations being retrofitted with FGD’s) is highlyimprobable as FGD systems are major infrastruc-ture investments with high complexity of operationand are associated with high capital and opera-tional costs. At best Eskom undertakes to retrofitone FGD at Medupi power station (although someuncertainty exists on this). This means that the mostprobable SO2 emissions trends are the business asusual scenario (which is projected to stay relativelyconstant between 2015 and 2030) or the worst casescenario (projected to increase by around 20% dur-ing the 2015 to 2030 period), if pressure on theenergy system persists.
CO2 emissions increased by 15% during the
2006-2012 period whereas energy output onlyincreased by 6%, as a result of the decline of powerstation thermal efficiencies during the energyrestricted period. Relative emissions used in theprojection of future CO2 emissions in this publica-tion differs from that used in the energy demandand energy mix modelling done for the updatedIRP baseline case. The reason for this is that themodelling for the updated IRP assumed a relativeCO2 emission for supercritical boilers whereas onlyKusile and Medupi fall in this category. The relativeCO2 emissions for the rest of the South African coal-fired power station fleet are between 5% and 16%higher than that of supercritical boilers. From pro-jections of future CO2 emissions in this study itseems unlikely that the South African climate com-mitment target of 280 Mt in 2030 will be made,unless energy demand dramatically decreases in thefuture.
Acknowledgements
The authors wish to thank Eskom for their knowledgesharing and for providing information without which thispublication could not be possible. The authors furtherthank the National Research Foundation for the fundingof this research project and three anonymous reviewersfor their constructive inputs.
ReferencesChandra, A., and Chandra, H., (2004). Impact of Indian
and imported coal on Indian thermal power plants.J. Sci. Ind. Res. 63, 156-162.
Department of Energy (DOE), (2010). Reserve Margin –IRP 2010 Input Parameter information sheet (Supplyinput).
Department of Energy (DOE), (2012). Draft 2012Integrated Energy Planning Report. Annexure A-Technical report, Part 1: Demand modelling report.
Department of Environmental Affairs (DEA), (2010).National Environmental Management: Air QualityAct, 2004 (Act No. 39 of 2004). List of activitieswhich result in atmospheric emissions which have ormay have a significant detrimental effect on theenvironment, including health, social conditions,economic conditions, ecological conditions or cultur-al heritage. Government Notice, No 33064, 10March 2010.
Department of Environmental Affairs (DEA), (2012).Fuel Burning Emissions: Contribution to total partic-ulate, sulphur dioxide and nitrogen oxide emissions.Accessed 18 June 2015,http://soer.deat.gov.za/1322.html.
Department of Environmental Affairs and Tourism(DEAT), (2009). South Africa’s Long TermMitigation Scenarios: Process and Outcomes.Presentation at the Climate Change Summit 2009.
Department of Minerals and Energy (DME), (1998).White Paper on the Energy Policy of the Republic ofSouth Africa.
Energy Research Centre, (2013).Towards a New Power
38 Journal of Energy in Southern Africa • Vol 26 No 3 • August 2015
Plan. For the National Planning Commission.University of Cape Town.
E-ON Engineering, (2007). Kendal Retrofit ResearchStudy, Phase 1.
Eskom, (2006). Eskom Annual Report. Eskom holdingsLimited.
Eskom, (2007). Eskom Annual Report. Eskom holdingsLimited.
Eskom, (2008). Eskom Annual Report. Eskom holdingsLimited.
Eskom, (2009). Eskom Annual Report. Eskom holdingsLimited.
Eskom (2010). Eskom Annual Report. Eskom holdingsLimited.
Eskom (2011). Eskom Integrated Report. Eskom hold-ings Limited
Eskom (2012). Eskom Integrated Report. Eskom hold-ings Limited.
Eskom (2013a). Eskom Integrated Report. Eskom hold-ings Limited.
Eskom, (2013b). Medupi Power Station ProjectSchedule.
Eskom, (2013c). Exemption from the MinimumEmission Standards for the Duvha power station.
Eskom, (2013d). Exemption from the MinimumEmission Standards for the Kendal power station.
Eskom, (2013e). Exemption from the MinimumEmission Standards for the Kriel power station.
Eskom, (2013f). Exemption from the MinimumEmission Standards for the Lethabo power station.
Eskom, (2013g). Exemption from the MinimumEmission Standards for the Matla power station.
Eskom, (2013h). Exemption from the MinimumEmission Standards for the Medupi power station.
Eskom, (2013i). Exemption from the Minimum EmissionStandards for the Tutuka power station.
European Association for Coal and Lignite (EURA-COAL), (2013). Annual Report, 2013.
European Commission, (2012). The Monitoring andReporting Regulation – Guidance on UncertaintyAssessment. MRR Guidance Document No. 4, finalversion of 5 October 2012.
Evans, S., Deery, S., and Bionsa, J., (2009). HowReliable are GHG Combustion Calculations andEmission Factors?, Presented at the CEM 2009Conference, Milan, Italy, available viahttp://www.theclimateregistry.org/down-loads/2009/05/Clean Air Engineering – How Reliableare GHG Combustion Emission Factors.pdf (lastaccess: 11 November 2014), 2009.
Falcon, R., and Ham, A.J., (1988).The characteristics ofSouthern African coals. J. S. Afr. Inst. Min. Metall.,88(5), 145-161.
Friedl, A., Holm, D., John, J., Kornelius, G., Pauw, C.J.,Oosthuizen, R., and van Niekerk, A.S., (2008). Airpollution in dense, low-income settlements in SouthAfrica. In proceedings: National Association forClean Air (NACA), 2008, Nelspruit, Mpumalanga.
Greve, N., (2013). Carbon tax postponed to 2016.Mining Weekly. Published 26th February 2013,Accessed 27 Feb 2014.http://www.miningweekly.com/article/carbon-tax-postponed-to-2016-2014-02-26.
Housing Development Agency, (2013). South Africa:Informal settlements Status (2013). Research Report,Johannesburg.
Iliso Consulting, (2013). Background InformationDocument on the application for postponement ofand in some cases exemption from the proposedMES for Eskom’s coal and liquid fuel-fired powerstations. Version 1: 5, June 2013.
Inglesi R, and Pouris A., (2010). Forecasting electricitydemand in South Africa: A critique of Eskom’s pro-jections. S Afr J Sci. 106 (1).
Integrated Resource Plan for Electricity (IRP), (2011).Integrated Resource Plan for Electricity 2010-2030.
Integrated Resource Plan for Electricity (IRP), (2013).Integrated Resource Plan for Electricity 2010-2030,Updated Report.
Podbaronova, J., (2010). Assessment of coals fromRussia and countries of former Soviet Union for utili-ty fluidized bed boilers. Master’s thesis,Lappeenranta University of Technology, Faculty ofTechnology, Bioenergy Technology.
Scorgie, Y., Burger L.W., and Annegarn, H.J. (2004).Socio-economic Impact of Air Pollution ReductionMeasures – Task 2: Establishment of SourceInventories, and Task 3: Identification andPrioritisation of Technology Options. Report com-piled on behalf of NEDLAC, 25 June 2003. NED-LAC, Rosebank.
South African Coal Roadmap (SACRM), (2013).Outlook for the coal value chain: Scenarios to 2040.Technical report.
SRK Consulting, (2013). Applications for Postponementand exemption from certain requirements of theNational Environmental Management: Air QualityAct No. 39 of 2004 – Minimum Emissions Standardsfor Sasol’s Operations in Secunda, Sasolburg andEkandustria.
Statistics South Africa, (2014). Gross Domestic Product,Fourth quarter 2013. Statistical release, Pretoria.
Sun, G., (2010). Coal Initiative Reports. Coal in China:Resources, Uses, and Advanced Coal Technologies.Energy Technology Innovation Policy Group,Kennedy School of Government, HarvardUniversity, Cambridge, MA.
US Energy Information administration, (2013a). ElectricPower Annual.
US Energy Information Administration, (2013b).Quarterly Coal Report, July – September 2013.
U.S. Energy Information administration, (2014).International Energy Statistics. Accessed 12December 2014 http://www.eia.gov/cfapps/ipdbpro-ject/IEDIndex3.cfm?tid=1&pid=1&aid=2.
United States Environmental Protection Agency (USEPA), (1993). Emission Factor Documentation forAP-42 Section Bituminous and Subbituminous coalcombustion. Office of Air Quality Planning andStandards, Office of Air and Radiation, USEnvironmental Protection Agency, Research TrianglePark, NC.
United States Environmental Protection Agency (USEPA), (2003). Air Pollution Control TechnologyFactsheet. Flue Gas Desulfurization (FGD) – Wet,Spray-Dry and Dry scrubbers.
Journal of Energy in Southern Africa • Vol 26 No 3 • August 2015 39

Zhou, P.P., Yamba, F.D., Lloyd, P., Nyahuma, L.,Mzezewa, C., Kipondya, F., Keir, J., Asamoah, J.,Simonsen, H., (2009). Determination of regionalemission factors for the power sector in SouthernAfrica. Journal of Energy in Southern Africa 20 (4).
Received 15 February 2015; revised 13 August 2015
40 Journal of Energy in Southern Africa • Vol 26 No 3 • August 2015
Abstract
The current study applies an energy-system modelto explore energy supply options in meetingTanzania’s electricity demands projection from 2010to 2040. Three economic scenarios namely; busi-ness as usual (BAU), low economic consumptionscenario (LEC) and high economic growth scenario(HEC) were developed for modelling purposes.Moreover, the study develops a dry weather sce-nario to explore how the country’s electricity systemwould behave under dry weather conditions. Themodel results suggests: If projected final electricitydemand increases as anticipated in BAU, LEC andHEC scenarios, the total installed capacity willexpand at 9.05%, 8.46% and 9.8% respectivelyfrom the base value of 804.2MW. Correspondingly,the model results depict dominance of hydro, coal,natural gas and geothermal as least-cost energy sup-ply options for electricity generation in all scenarios.The alternative dry weather scenario formulated tostudy electricity system behaviour under uncertainweather conditions suggested a shift of energy sup-ply option to coal and natural gas (NG) dominancereplacing hydro energy. The least cost optimizationresults further depict an insignificant contribution ofrenewable energy technologies in terms of solarthermal, wind and solar PV into the total generationshares. With that regard, the renewable energy pen-etration policy option (REPP), as an alternative sce-nario suggests the importance of policy options thatfavour renewable energy technologies inclusion inelectricity generation. Sensitivity analysis on the dis-count rate to approximate the influence of discountrate on the future pattern of electricity generationcapacity demonstrated that lower values favourwind and coal fired power plants, while higher val-ues favour the NG technologies. Finally, the model-
ling results conclude the self-sufficiency of the coun-try in generating future electricity using its ownenergy resources.
Keywords: electricity generation, MESSAGE mod-el, discount rate, renewable energy, supply options
1. Introduction
Energy is an important element in accomplishingthe interrelated socio-economic development ofany country. Tanzania’s energy supply relies mainlyon biomass, which accounts for nearly 90% of thetotal primary energy supply (Wawa, 2012, IEA,2013). The remaining energy supply is accountedfrom petroleum products at approximately 8%, gridelectricity 1% and renewable energy sources suchsolar and wind which account for nearly 1% (MEM,2012, Kabaka and Gwang’ombe, 2007). Total elec-tricity generation shares in 2012 were mainly fromnatural gas 50.7%, hydro 28.6%, oil products20.1%, biofuels 0.3% and solar PV 0.2% (IEA,2014). Projections are approximating electricitydemand to reach 47.7 TWh in the year 2035 equiv-alent to an annual growth of approximately 8%(MEM, 2012). Energy resources are enormous andare available in various forms, including biomass,hydro, geothermal, biogas, wind, solar, natural gasand coal (Kihwele et al., 2012, MEM, 2013a). Thereis an estimated coal proven reserve of 304 milliontonnes. whereas that of natural gas is 45 billioncubic meters (Kusekwa, 2013, MEM, 2012).Geothermal has an estimated potential of 650 MW(Mnjokava, 2008, Kihwele et al., 2012), while
Modelling energy supply options for electricity
generations in Tanzania
Baraka Kichonge1
Geoffrey R John2
Iddi S N Mkilaha2
1. Nelson Mandela African Institution of Science and Technology, Arusha, Tanzania
2. College of Engineering and Technology, University of Dar es Salaam , Dar es Salaam, Tanzania
Journal of Energy in Southern Africa • Vol 26 No 3 • August 2015 41
hydro estimated potential is 4700 MW (MEM,2012). Biomass estimated sustainable potential is12 million TOE from agriculture wastes, plantationforests and natural forests (Wilson, 2010). Thecountry experiences annual sunshine hours of 2800 to 3500 hours and solar irradiation rangingfrom 4-7 kWh/m2 across the country (Casmiri,2009, Kihwele et al., 2012). The renewable energypotential in the country is substantial but largelyuntapped for electricity and other thermal applica-tions (Bauner et al., 2012, Kichonge et al., 2014b).The country’s renewable energy potential frommunicipal solid wastes currently disposed in dumpsites is considerable as shown in studies by Omari etal. (2014a) and Omari et al. (2014b).
Tanzanian energy demand, specifically electrici-ty, has been growing over years because of socio-economic transformations that opened up thecountry’s economy. Statistics on the country’s GDPgrowth since the year 2000 show an annual aver-age increase of 7% (BOT, 2012). However, sub-stantial challenges faces the electricity sector owingto constrained generation capacity and distributionnetwork (Kapinga, 2013, Wangwe et al., 2014)which previously resulted in outages and rationing(Loisulie, 2010, MEM, 2013b). Despite the electric-ity sector challenges, the demand is expected togrow as the country targets a middle income econ-omy status as detailed in Development Vision 2025(URT, 1999) and its implementation through BigResults Now (BRN) initiatives (Kahyoza, 2013).Realizing Tanzania Development Vision 2025 goalsimplies that the country needs adequate, reliable,affordable and environmentally friendly electricitysupply options. Achieving these require optimalgeneration capacity additions, which considerdiversifications of power plants systems. Findingoptimal generation capacity addition based on leastcost plan is important in formulating supply optionsconsidering the high investments costs associatedwith it. It is therefore the objective of this study toapply MESSAGE (Model for Alternative EnergySupply Strategies and their General EnvironmentalImpacts) to find least-cost optimal energy supplyoptions. MESSAGE is an appropriate frameworkfor this study as it is capable of dealing with long-term planning horizons based on high-resolutionshort-term system dynamics. Using MESSAGE,optimization of electricity supply options in eachscenario will help describes possible future finalelectricity supply options availability. Study resultswill benefit policy and decision makers to arrive ata relevant solution interactively in national electrici-ty system expansion planning.
2. Methodology
2.1 MESSAGE Model
Model for Energy Supply Strategy Alternatives andtheir General Environmental Impacts (MESSAGE)
is an optimization modelling tool (Messner andStrubegger, 1995), which calculates the least-costenergy supply system. Connolly et al. (2010),describes MESSAGE as a bottom-up model capa-ble of optimizing operation and investment of tech-nologies in medium to long term energy systems.MESSAGE modelling approach allows the realisticevaluation of the long-term role of an energy sup-ply option under competitive conditions (IAEA,2008, Hainoun et al., 2010). The least-cost deter-mination in MESSAGE is through minimization ofthe total discounted energy system cost subject tothe constraints representing demands, resourcedeficiency and capacity limits. Discounted energysystem cost minimization includes investments,fixed and variable operation costs, maintenancecosts, fuel and any additional penalty costs, whichdefines the limits and constraints relation. WithMESSAGE, alternative energy supply strategies inagreement with user-defined constraints areassessed (IAEA, 2006, Tait et al., 2014).
Mathematical techniques tied up with MES-SAGE comprises of linear and mixed-integer pro-gramming. The purpose for linear programming(LP) applications is that all the limits and the objec-tive function (optimization target) are linear func-tions of the decision variables. Mixed-integer use inMESSAGE is due to integer values at the optimalsolution requirements by some of the decision vari-ables. Objective function in MESSAGE modellingapproach is as shown in Equation 1. The variableXi,j,t denotes a flow variable (input) of fuel form i intechnology j in the time step t. Flow variabledescribes amount produced in which technologyand the type of fuel. The investment variable denot-ed by Yi,t represents new installation of technology jin time step t.
(1)
The MESSAGE model computes the objectivefunction to satisfy the condition to ensure demand-supply balance as illustrated in equation 2. Theparameter D denotes energy demand, j representsenergy demand of j while t represents time step. Inaddition, η represents technology efficiency, Xdenotes production decision of the technology, i isthe number of technologies and n total number oftechnologies.
(2)
MESSAGE has been used to model the powersupply sector by means of the principle of referenceenergy system (RES), which allows representationof the entire energy network including possibledevelopment paths (Rečka, 2011, Selvakkumaranand Limmeechokchai, 2011). RES is composed of
42 Journal of Energy in Southern Africa • Vol 26 No 3 • August 2015
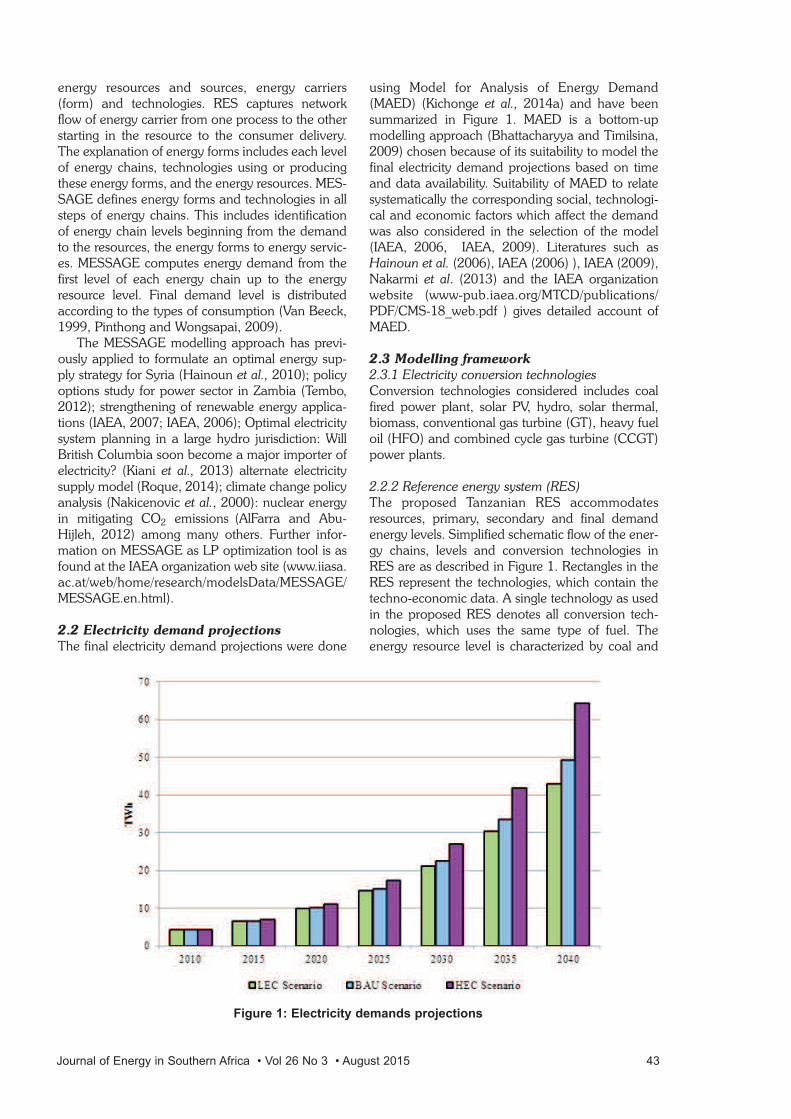
energy resources and sources, energy carriers(form) and technologies. RES captures networkflow of energy carrier from one process to the otherstarting in the resource to the consumer delivery.The explanation of energy forms includes each levelof energy chains, technologies using or producingthese energy forms, and the energy resources. MES-SAGE defines energy forms and technologies in allsteps of energy chains. This includes identificationof energy chain levels beginning from the demandto the resources, the energy forms to energy servic-es. MESSAGE computes energy demand from thefirst level of each energy chain up to the energyresource level. Final demand level is distributedaccording to the types of consumption (Van Beeck,1999, Pinthong and Wongsapai, 2009).
The MESSAGE modelling approach has previ-ously applied to formulate an optimal energy sup-ply strategy for Syria (Hainoun et al., 2010); policyoptions study for power sector in Zambia (Tembo,2012); strengthening of renewable energy applica-tions (IAEA, 2007; IAEA, 2006); Optimal electricitysystem planning in a large hydro jurisdiction: WillBritish Columbia soon become a major importer ofelectricity? (Kiani et al., 2013) alternate electricitysupply model (Roque, 2014); climate change policyanalysis (Nakicenovic et al., 2000): nuclear energyin mitigating CO2 emissions (AlFarra and Abu-Hijleh, 2012) among many others. Further infor-mation on MESSAGE as LP optimization tool is asfound at the IAEA organization web site (www.iiasa.ac.at/web/home/research/modelsData/MESSAGE/MESSAGE.en.html).
2.2 Electricity demand projections
The final electricity demand projections were done
using Model for Analysis of Energy Demand(MAED) (Kichonge et al., 2014a) and have beensummarized in Figure 1. MAED is a bottom-upmodelling approach (Bhattacharyya and Timilsina,2009) chosen because of its suitability to model thefinal electricity demand projections based on timeand data availability. Suitability of MAED to relatesystematically the corresponding social, technologi-cal and economic factors which affect the demandwas also considered in the selection of the model(IAEA, 2006, IAEA, 2009). Literatures such asHainoun et al. (2006), IAEA (2006) ), IAEA (2009),Nakarmi et al. (2013) and the IAEA organizationwebsite (www-pub.iaea.org/MTCD/publications/PDF/CMS-18_web.pdf ) gives detailed account ofMAED.
2.3 Modelling framework
2.3.1 Electricity conversion technologiesConversion technologies considered includes coalfired power plant, solar PV, hydro, solar thermal,biomass, conventional gas turbine (GT), heavy fueloil (HFO) and combined cycle gas turbine (CCGT)power plants.
2.2.2 Reference energy system (RES)The proposed Tanzanian RES accommodatesresources, primary, secondary and final demandenergy levels. Simplified schematic flow of the ener-gy chains, levels and conversion technologies inRES are as described in Figure 1. Rectangles in theRES represent the technologies, which contain thetechno-economic data. A single technology as usedin the proposed RES denotes all conversion tech-nologies, which uses the same type of fuel. Theenergy resource level is characterized by coal and
Figure 1: Electricity demands projections
Journal of Energy in Southern Africa • Vol 26 No 3 • August 2015 43
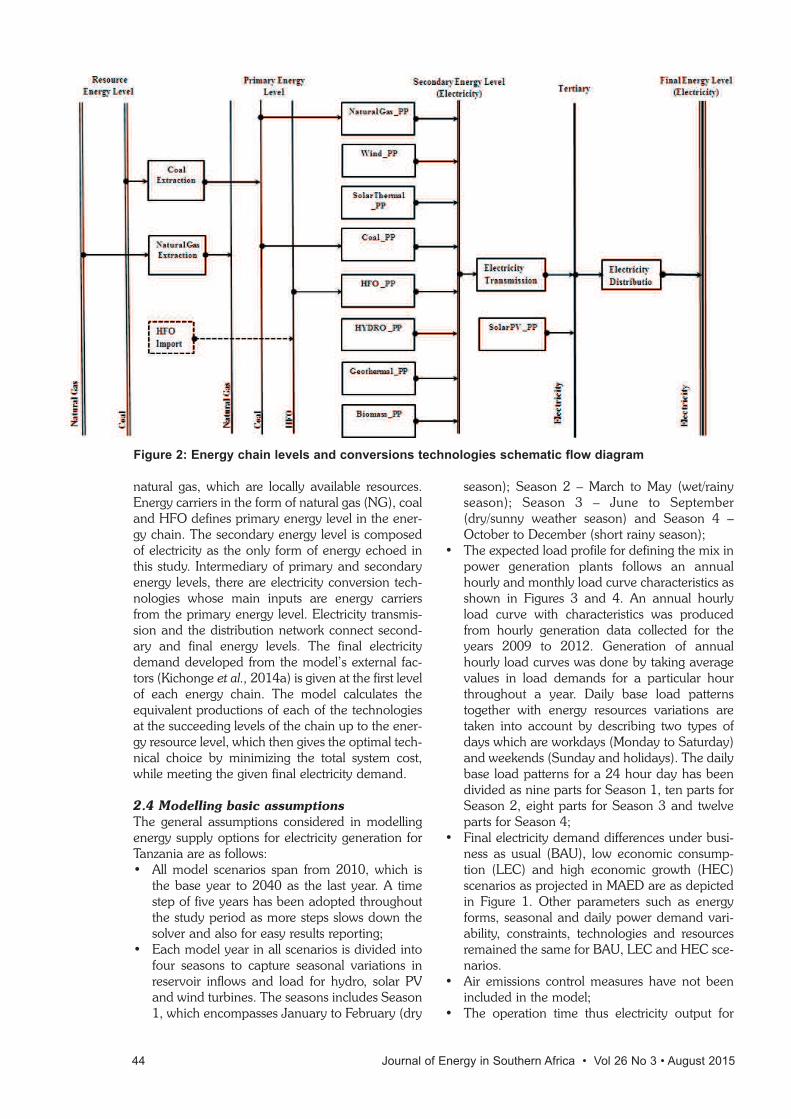
natural gas, which are locally available resources.Energy carriers in the form of natural gas (NG), coaland HFO defines primary energy level in the ener-gy chain. The secondary energy level is composedof electricity as the only form of energy echoed inthis study. Intermediary of primary and secondaryenergy levels, there are electricity conversion tech-nologies whose main inputs are energy carriersfrom the primary energy level. Electricity transmis-sion and the distribution network connect second-ary and final energy levels. The final electricitydemand developed from the model’s external fac-tors (Kichonge et al., 2014a) is given at the first levelof each energy chain. The model calculates theequivalent productions of each of the technologiesat the succeeding levels of the chain up to the ener-gy resource level, which then gives the optimal tech-nical choice by minimizing the total system cost,while meeting the given final electricity demand.
2.4 Modelling basic assumptions
The general assumptions considered in modellingenergy supply options for electricity generation forTanzania are as follows:• All model scenarios span from 2010, which is
the base year to 2040 as the last year. A timestep of five years has been adopted throughoutthe study period as more steps slows down thesolver and also for easy results reporting;
• Each model year in all scenarios is divided intofour seasons to capture seasonal variations inreservoir inflows and load for hydro, solar PVand wind turbines. The seasons includes Season1, which encompasses January to February (dry
season); Season 2 – March to May (wet/rainyseason); Season 3 – June to September(dry/sunny weather season) and Season 4 –October to December (short rainy season);
• The expected load profile for defining the mix inpower generation plants follows an annualhourly and monthly load curve characteristics asshown in Figures 3 and 4. An annual hourlyload curve with characteristics was producedfrom hourly generation data collected for theyears 2009 to 2012. Generation of annualhourly load curves was done by taking averagevalues in load demands for a particular hourthroughout a year. Daily base load patternstogether with energy resources variations aretaken into account by describing two types ofdays which are workdays (Monday to Saturday)and weekends (Sunday and holidays). The dailybase load patterns for a 24 hour day has beendivided as nine parts for Season 1, ten parts forSeason 2, eight parts for Season 3 and twelveparts for Season 4;
• Final electricity demand differences under busi-ness as usual (BAU), low economic consump-tion (LEC) and high economic growth (HEC)scenarios as projected in MAED are as depictedin Figure 1. Other parameters such as energyforms, seasonal and daily power demand vari-ability, constraints, technologies and resourcesremained the same for BAU, LEC and HEC sce-narios.
• Air emissions control measures have not beenincluded in the model;
• The operation time thus electricity output for
Figure 2: Energy chain levels and conversions technologies schematic flow diagram
44 Journal of Energy in Southern Africa • Vol 26 No 3 • August 2015
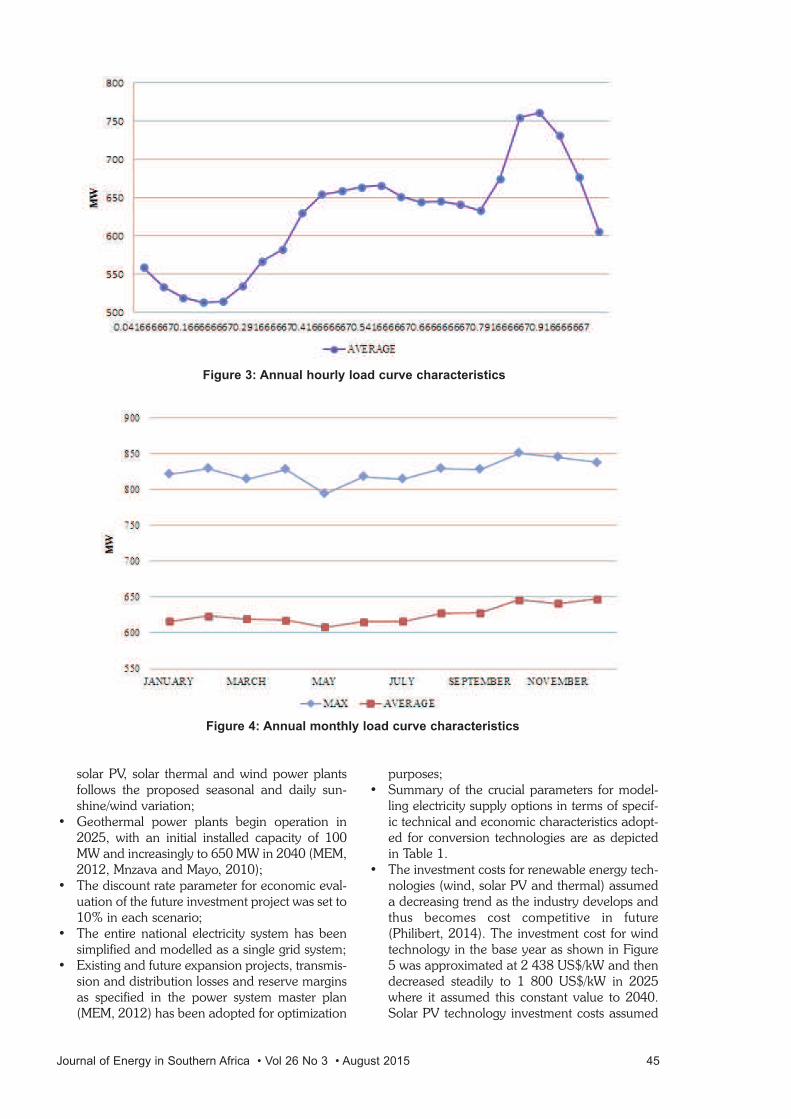
solar PV, solar thermal and wind power plantsfollows the proposed seasonal and daily sun-shine/wind variation;
• Geothermal power plants begin operation in2025, with an initial installed capacity of 100MW and increasingly to 650 MW in 2040 (MEM,2012, Mnzava and Mayo, 2010);
• The discount rate parameter for economic eval-uation of the future investment project was set to10% in each scenario;
• The entire national electricity system has beensimplified and modelled as a single grid system;
• Existing and future expansion projects, transmis-sion and distribution losses and reserve marginsas specified in the power system master plan(MEM, 2012) has been adopted for optimization
purposes;• Summary of the crucial parameters for model-
ling electricity supply options in terms of specif-ic technical and economic characteristics adopt-ed for conversion technologies are as depictedin Table 1.
• The investment costs for renewable energy tech-nologies (wind, solar PV and thermal) assumeda decreasing trend as the industry develops andthus becomes cost competitive in future(Philibert, 2014). The investment cost for windtechnology in the base year as shown in Figure5 was approximated at 2 438 US$/kW and thendecreased steadily to 1 800 US$/kW in 2025where it assumed this constant value to 2040.Solar PV technology investment costs assumed
Figure 3: Annual hourly load curve characteristics
Figure 4: Annual monthly load curve characteristics
Journal of Energy in Southern Africa • Vol 26 No 3 • August 2015 45
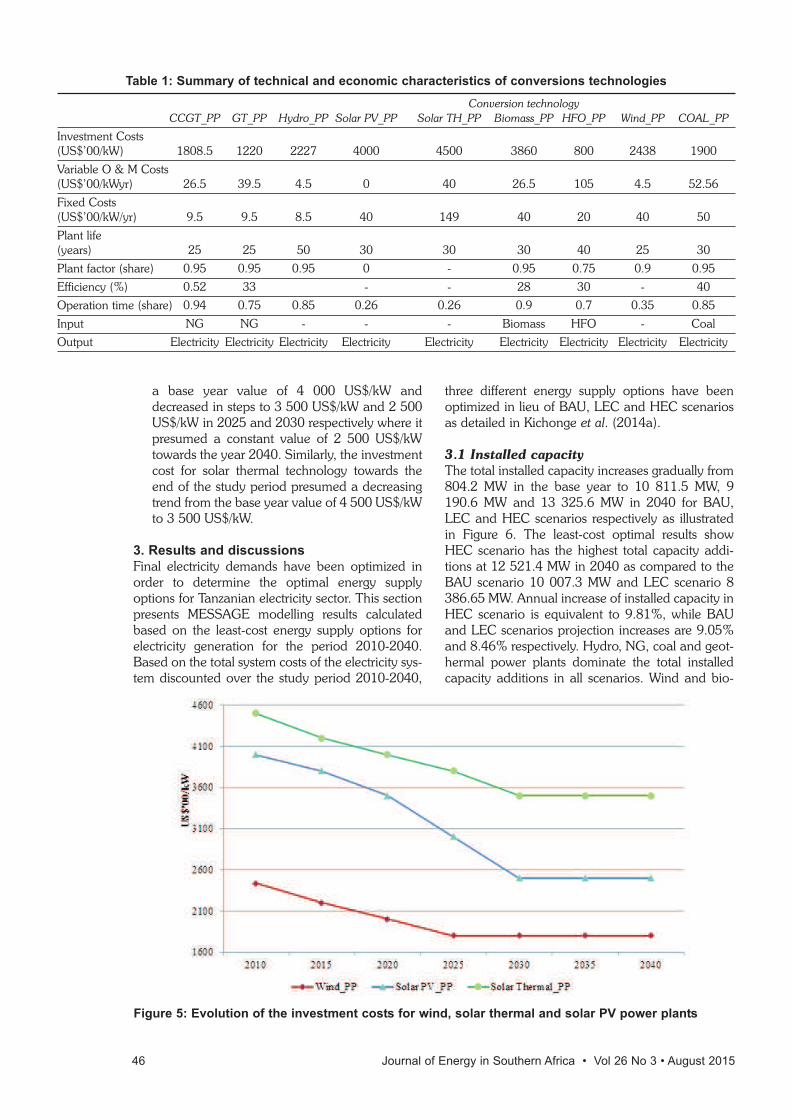
a base year value of 4 000 US$/kW anddecreased in steps to 3 500 US$/kW and 2 500US$/kW in 2025 and 2030 respectively where itpresumed a constant value of 2 500 US$/kWtowards the year 2040. Similarly, the investmentcost for solar thermal technology towards theend of the study period presumed a decreasingtrend from the base year value of 4 500 US$/kWto 3 500 US$/kW.
3. Results and discussions
Final electricity demands have been optimized inorder to determine the optimal energy supplyoptions for Tanzanian electricity sector. This sectionpresents MESSAGE modelling results calculatedbased on the least-cost energy supply options forelectricity generation for the period 2010-2040.Based on the total system costs of the electricity sys-tem discounted over the study period 2010-2040,
three different energy supply options have beenoptimized in lieu of BAU, LEC and HEC scenariosas detailed in Kichonge et al. (2014a).
3.1 Installed capacity
The total installed capacity increases gradually from804.2 MW in the base year to 10 811.5 MW, 9190.6 MW and 13 325.6 MW in 2040 for BAU,LEC and HEC scenarios respectively as illustratedin Figure 6. The least-cost optimal results showHEC scenario has the highest total capacity addi-tions at 12 521.4 MW in 2040 as compared to theBAU scenario 10 007.3 MW and LEC scenario 8386.65 MW. Annual increase of installed capacity inHEC scenario is equivalent to 9.81%, while BAUand LEC scenarios projection increases are 9.05%and 8.46% respectively. Hydro, NG, coal and geot-hermal power plants dominate the total installedcapacity additions in all scenarios. Wind and bio-
Table 1: Summary of technical and economic characteristics of conversions technologies
Conversion technologyCCGT_PP GT_PP Hydro_PP Solar PV_PP Solar TH_PP Biomass_PP HFO_PP Wind_PP COAL_PP
Investment Costs (US$’00/kW) 1808.5 1220 2227 4000 4500 3860 800 2438 1900
Variable O & M Costs (US$’00/kWyr) 26.5 39.5 4.5 0 40 26.5 105 4.5 52.56
Fixed Costs (US$’00/kW/yr) 9.5 9.5 8.5 40 149 40 20 40 50
Plant life (years) 25 25 50 30 30 30 40 25 30
Plant factor (share) 0.95 0.95 0.95 0 - 0.95 0.75 0.9 0.95
Efficiency (%) 0.52 33 - - 28 30 - 40
Operation time (share) 0.94 0.75 0.85 0.26 0.26 0.9 0.7 0.35 0.85
Input NG NG - - - Biomass HFO - Coal
Output Electricity Electricity Electricity Electricity Electricity Electricity Electricity Electricity Electricity
Figure 5: Evolution of the investment costs for wind, solar thermal and solar PV power plants
46 Journal of Energy in Southern Africa • Vol 26 No 3 • August 2015
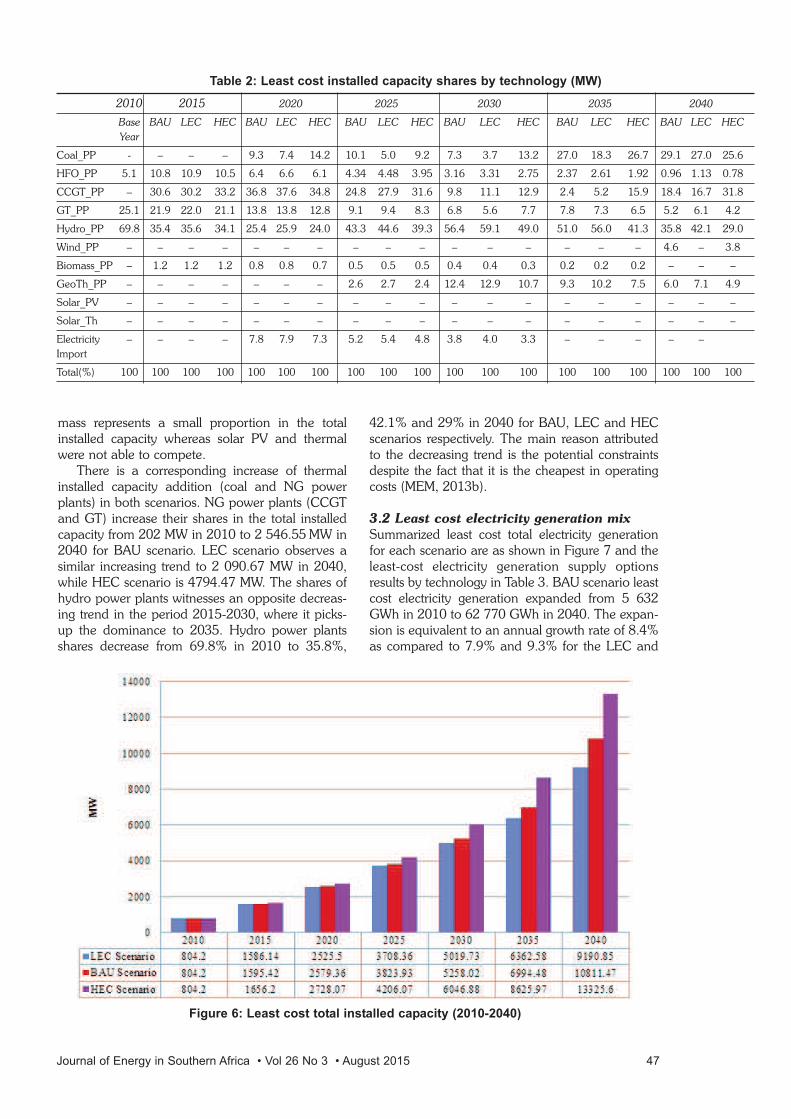
mass represents a small proportion in the totalinstalled capacity whereas solar PV and thermalwere not able to compete.
There is a corresponding increase of thermalinstalled capacity addition (coal and NG powerplants) in both scenarios. NG power plants (CCGTand GT) increase their shares in the total installedcapacity from 202 MW in 2010 to 2 546.55 MW in2040 for BAU scenario. LEC scenario observes asimilar increasing trend to 2 090.67 MW in 2040,while HEC scenario is 4794.47 MW. The shares ofhydro power plants witnesses an opposite decreas-ing trend in the period 2015-2030, where it picks-up the dominance to 2035. Hydro power plantsshares decrease from 69.8% in 2010 to 35.8%,
42.1% and 29% in 2040 for BAU, LEC and HECscenarios respectively. The main reason attributedto the decreasing trend is the potential constraintsdespite the fact that it is the cheapest in operatingcosts (MEM, 2013b).
3.2 Least cost electricity generation mix
Summarized least cost total electricity generationfor each scenario are as shown in Figure 7 and theleast-cost electricity generation supply optionsresults by technology in Table 3. BAU scenario leastcost electricity generation expanded from 5 632GWh in 2010 to 62 770 GWh in 2040. The expan-sion is equivalent to an annual growth rate of 8.4%as compared to 7.9% and 9.3% for the LEC and
Table 2: Least cost installed capacity shares by technology (MW)
2010 2015 2020 2025 2030 2035 2040
Base BAU LEC HEC BAU LEC HEC BAU LEC HEC BAU LEC HEC BAU LEC HEC BAU LEC HEC
Year
Coal_PP - – – – 9.3 7.4 14.2 10.1 5.0 9.2 7.3 3.7 13.2 27.0 18.3 26.7 29.1 27.0 25.6
HFO_PP 5.1 10.8 10.9 10.5 6.4 6.6 6.1 4.34 4.48 3.95 3.16 3.31 2.75 2.37 2.61 1.92 0.96 1.13 0.78
CCGT_PP – 30.6 30.2 33.2 36.8 37.6 34.8 24.8 27.9 31.6 9.8 11.1 12.9 2.4 5.2 15.9 18.4 16.7 31.8
GT_PP 25.1 21.9 22.0 21.1 13.8 13.8 12.8 9.1 9.4 8.3 6.8 5.6 7.7 7.8 7.3 6.5 5.2 6.1 4.2
Hydro_PP 69.8 35.4 35.6 34.1 25.4 25.9 24.0 43.3 44.6 39.3 56.4 59.1 49.0 51.0 56.0 41.3 35.8 42.1 29.0
Wind_PP – – – – – – – – – – – – – – – – 4.6 – 3.8
Biomass_PP – 1.2 1.2 1.2 0.8 0.8 0.7 0.5 0.5 0.5 0.4 0.4 0.3 0.2 0.2 0.2 – – –
GeoTh_PP – – – – – – – 2.6 2.7 2.4 12.4 12.9 10.7 9.3 10.2 7.5 6.0 7.1 4.9
Solar_PV – – – – – – – – – – – – – – – – – – –
Solar_Th – – – – – – – – – – – – – – – – – – –
Electricity – – – – 7.8 7.9 7.3 5.2 5.4 4.8 3.8 4.0 3.3 – – – – –Import
Total(%) 100 100 100 100 100 100 100 100 100 100 100 100 100 100 100 100 100 100 100
Figure 6: Least cost total installed capacity (2010-2040)
Journal of Energy in Southern Africa • Vol 26 No 3 • August 2015 47
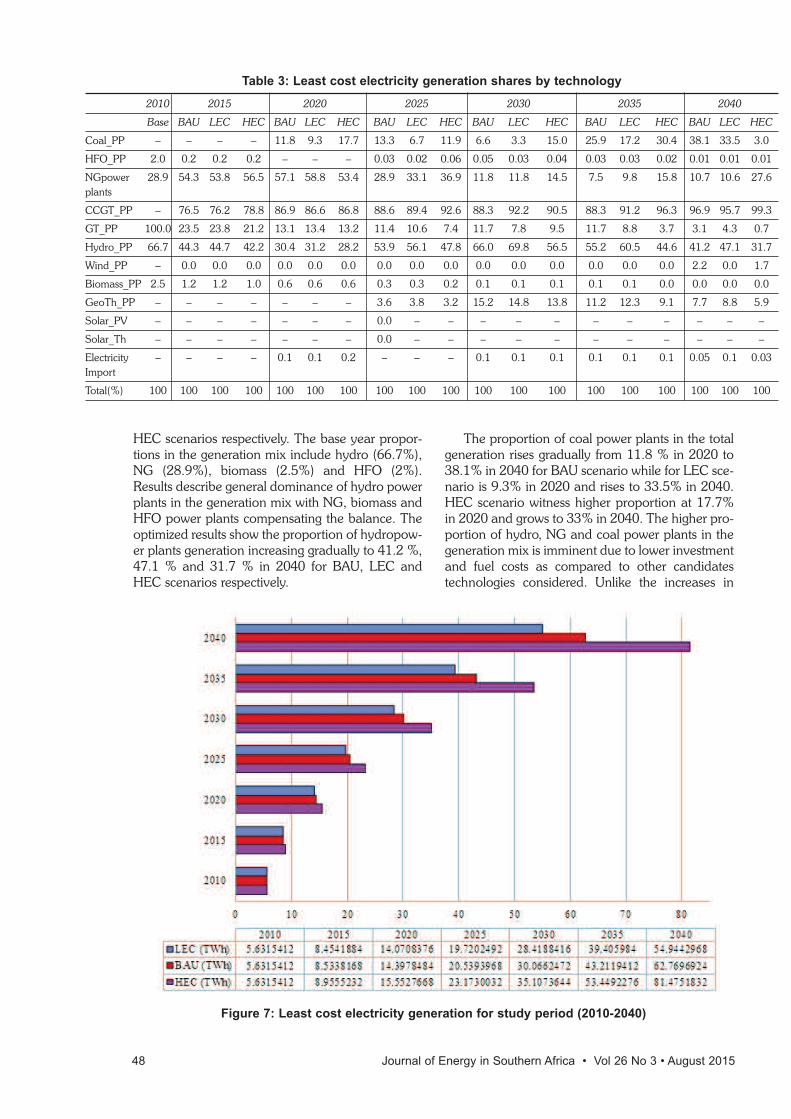
HEC scenarios respectively. The base year propor-tions in the generation mix include hydro (66.7%),NG (28.9%), biomass (2.5%) and HFO (2%).Results describe general dominance of hydro powerplants in the generation mix with NG, biomass andHFO power plants compensating the balance. Theoptimized results show the proportion of hydropow-er plants generation increasing gradually to 41.2 %,47.1 % and 31.7 % in 2040 for BAU, LEC andHEC scenarios respectively.
The proportion of coal power plants in the totalgeneration rises gradually from 11.8 % in 2020 to38.1% in 2040 for BAU scenario while for LEC sce-nario is 9.3% in 2020 and rises to 33.5% in 2040.HEC scenario witness higher proportion at 17.7%in 2020 and grows to 33% in 2040. The higher pro-portion of hydro, NG and coal power plants in thegeneration mix is imminent due to lower investmentand fuel costs as compared to other candidatestechnologies considered. Unlike the increases in
Table 3: Least cost electricity generation shares by technology
2010 2015 2020 2025 2030 2035 2040
Base BAU LEC HEC BAU LEC HEC BAU LEC HEC BAU LEC HEC BAU LEC HEC BAU LEC HEC
Coal_PP – – – – 11.8 9.3 17.7 13.3 6.7 11.9 6.6 3.3 15.0 25.9 17.2 30.4 38.1 33.5 3.0
HFO_PP 2.0 0.2 0.2 0.2 – – – 0.03 0.02 0.06 0.05 0.03 0.04 0.03 0.03 0.02 0.01 0.01 0.01
NGpower 28.9 54.3 53.8 56.5 57.1 58.8 53.4 28.9 33.1 36.9 11.8 11.8 14.5 7.5 9.8 15.8 10.7 10.6 27.6plants
CCGT_PP – 76.5 76.2 78.8 86.9 86.6 86.8 88.6 89.4 92.6 88.3 92.2 90.5 88.3 91.2 96.3 96.9 95.7 99.3
GT_PP 100.0 23.5 23.8 21.2 13.1 13.4 13.2 11.4 10.6 7.4 11.7 7.8 9.5 11.7 8.8 3.7 3.1 4.3 0.7
Hydro_PP 66.7 44.3 44.7 42.2 30.4 31.2 28.2 53.9 56.1 47.8 66.0 69.8 56.5 55.2 60.5 44.6 41.2 47.1 31.7
Wind_PP – 0.0 0.0 0.0 0.0 0.0 0.0 0.0 0.0 0.0 0.0 0.0 0.0 0.0 0.0 0.0 2.2 0.0 1.7
Biomass_PP 2.5 1.2 1.2 1.0 0.6 0.6 0.6 0.3 0.3 0.2 0.1 0.1 0.1 0.1 0.1 0.0 0.0 0.0 0.0
GeoTh_PP – – – – – – – 3.6 3.8 3.2 15.2 14.8 13.8 11.2 12.3 9.1 7.7 8.8 5.9
Solar_PV – – – – – – – 0.0 – – – – – – – – – – –
Solar_Th – – – – – – – 0.0 – – – – – – – – – – –
Electricity – – – – 0.1 0.1 0.2 – – – 0.1 0.1 0.1 0.1 0.1 0.1 0.05 0.1 0.03Import
Total(%) 100 100 100 100 100 100 100 100 100 100 100 100 100 100 100 100 100 100 100
Figure 7: Least cost electricity generation for study period (2010-2040)
48 Journal of Energy in Southern Africa • Vol 26 No 3 • August 2015
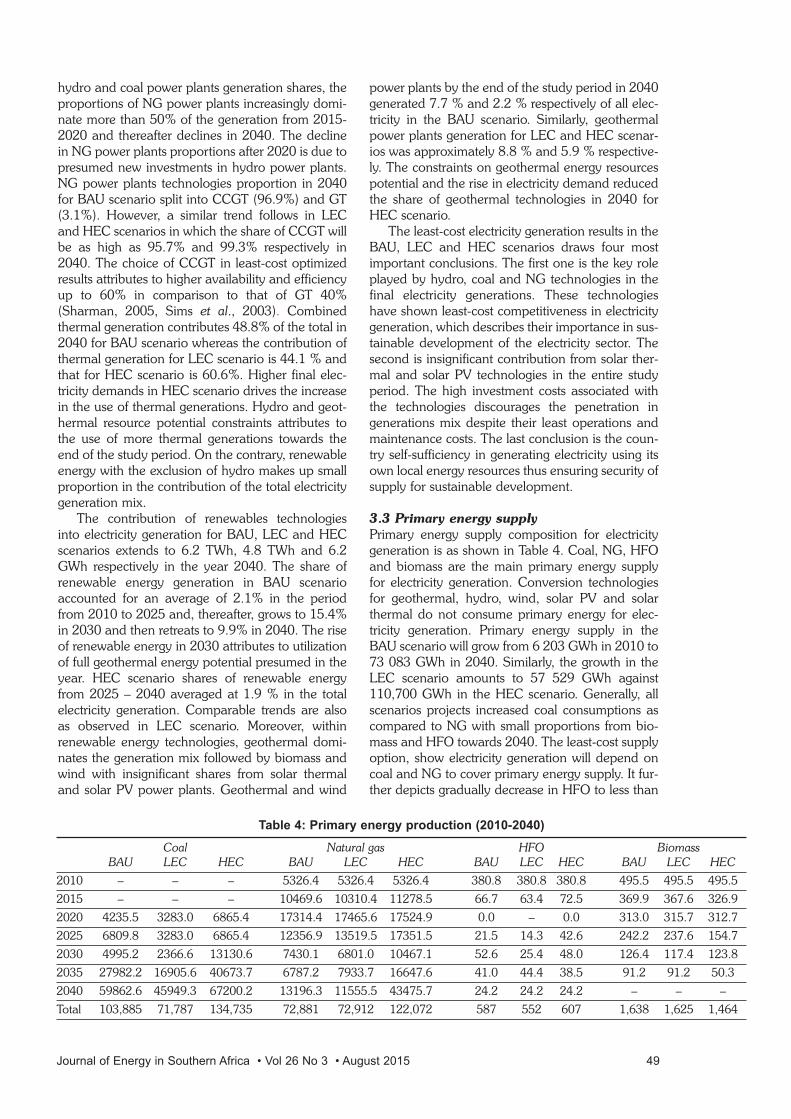
hydro and coal power plants generation shares, theproportions of NG power plants increasingly domi-nate more than 50% of the generation from 2015-2020 and thereafter declines in 2040. The declinein NG power plants proportions after 2020 is due topresumed new investments in hydro power plants.NG power plants technologies proportion in 2040for BAU scenario split into CCGT (96.9%) and GT(3.1%). However, a similar trend follows in LECand HEC scenarios in which the share of CCGT willbe as high as 95.7% and 99.3% respectively in2040. The choice of CCGT in least-cost optimizedresults attributes to higher availability and efficiencyup to 60% in comparison to that of GT 40%(Sharman, 2005, Sims et al., 2003). Combinedthermal generation contributes 48.8% of the total in2040 for BAU scenario whereas the contribution ofthermal generation for LEC scenario is 44.1 % andthat for HEC scenario is 60.6%. Higher final elec-tricity demands in HEC scenario drives the increasein the use of thermal generations. Hydro and geot-hermal resource potential constraints attributes tothe use of more thermal generations towards theend of the study period. On the contrary, renewableenergy with the exclusion of hydro makes up smallproportion in the contribution of the total electricitygeneration mix.
The contribution of renewables technologiesinto electricity generation for BAU, LEC and HECscenarios extends to 6.2 TWh, 4.8 TWh and 6.2GWh respectively in the year 2040. The share ofrenewable energy generation in BAU scenarioaccounted for an average of 2.1% in the periodfrom 2010 to 2025 and, thereafter, grows to 15.4%in 2030 and then retreats to 9.9% in 2040. The riseof renewable energy in 2030 attributes to utilizationof full geothermal energy potential presumed in theyear. HEC scenario shares of renewable energyfrom 2025 – 2040 averaged at 1.9 % in the totalelectricity generation. Comparable trends are alsoas observed in LEC scenario. Moreover, withinrenewable energy technologies, geothermal domi-nates the generation mix followed by biomass andwind with insignificant shares from solar thermaland solar PV power plants. Geothermal and wind
power plants by the end of the study period in 2040generated 7.7 % and 2.2 % respectively of all elec-tricity in the BAU scenario. Similarly, geothermalpower plants generation for LEC and HEC scenar-ios was approximately 8.8 % and 5.9 % respective-ly. The constraints on geothermal energy resourcespotential and the rise in electricity demand reducedthe share of geothermal technologies in 2040 forHEC scenario.
The least-cost electricity generation results in theBAU, LEC and HEC scenarios draws four mostimportant conclusions. The first one is the key roleplayed by hydro, coal and NG technologies in thefinal electricity generations. These technologieshave shown least-cost competitiveness in electricitygeneration, which describes their importance in sus-tainable development of the electricity sector. Thesecond is insignificant contribution from solar ther-mal and solar PV technologies in the entire studyperiod. The high investment costs associated withthe technologies discourages the penetration ingenerations mix despite their least operations andmaintenance costs. The last conclusion is the coun-try self-sufficiency in generating electricity using itsown local energy resources thus ensuring security ofsupply for sustainable development.
3.3 Primary energy supply
Primary energy supply composition for electricitygeneration is as shown in Table 4. Coal, NG, HFOand biomass are the main primary energy supplyfor electricity generation. Conversion technologiesfor geothermal, hydro, wind, solar PV and solarthermal do not consume primary energy for elec-tricity generation. Primary energy supply in theBAU scenario will grow from 6 203 GWh in 2010 to73 083 GWh in 2040. Similarly, the growth in theLEC scenario amounts to 57 529 GWh against110,700 GWh in the HEC scenario. Generally, allscenarios projects increased coal consumptions ascompared to NG with small proportions from bio-mass and HFO towards 2040. The least-cost supplyoption, show electricity generation will depend oncoal and NG to cover primary energy supply. It fur-ther depicts gradually decrease in HFO to less than
Table 4: Primary energy production (2010-2040)
Coal Natural gas HFO BiomassBAU LEC HEC BAU LEC HEC BAU LEC HEC BAU LEC HEC
2010 – – – 5326.4 5326.4 5326.4 380.8 380.8 380.8 495.5 495.5 495.5
2015 – – – 10469.6 10310.4 11278.5 66.7 63.4 72.5 369.9 367.6 326.9
2020 4235.5 3283.0 6865.4 17314.4 17465.6 17524.9 0.0 – 0.0 313.0 315.7 312.7
2025 6809.8 3283.0 6865.4 12356.9 13519.5 17351.5 21.5 14.3 42.6 242.2 237.6 154.7
2030 4995.2 2366.6 13130.6 7430.1 6801.0 10467.1 52.6 25.4 48.0 126.4 117.4 123.8
2035 27982.2 16905.6 40673.7 6787.2 7933.7 16647.6 41.0 44.4 38.5 91.2 91.2 50.3
2040 59862.6 45949.3 67200.2 13196.3 11555.5 43475.7 24.2 24.2 24.2 – – –
Total 103,885 71,787 134,735 72,881 72,912 122,072 587 552 607 1,638 1,625 1,464
Journal of Energy in Southern Africa • Vol 26 No 3 • August 2015 49
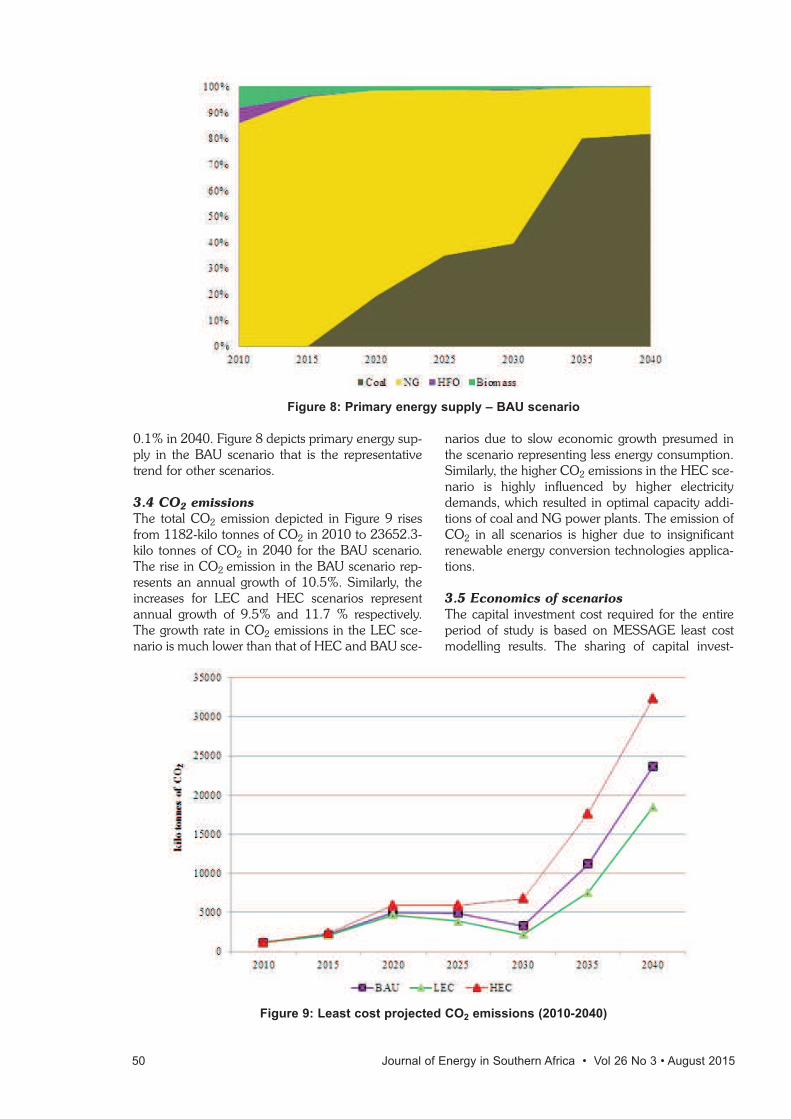
0.1% in 2040. Figure 8 depicts primary energy sup-ply in the BAU scenario that is the representativetrend for other scenarios.
3.4 CO2 emissions
The total CO2 emission depicted in Figure 9 risesfrom 1182-kilo tonnes of CO2 in 2010 to 23652.3-kilo tonnes of CO2 in 2040 for the BAU scenario.The rise in CO2 emission in the BAU scenario rep-resents an annual growth of 10.5%. Similarly, theincreases for LEC and HEC scenarios representannual growth of 9.5% and 11.7 % respectively.The growth rate in CO2 emissions in the LEC sce-nario is much lower than that of HEC and BAU sce-
narios due to slow economic growth presumed inthe scenario representing less energy consumption.Similarly, the higher CO2 emissions in the HEC sce-nario is highly influenced by higher electricitydemands, which resulted in optimal capacity addi-tions of coal and NG power plants. The emission ofCO2 in all scenarios is higher due to insignificantrenewable energy conversion technologies applica-tions.
3.5 Economics of scenarios
The capital investment cost required for the entireperiod of study is based on MESSAGE least costmodelling results. The sharing of capital invest-
Figure 8: Primary energy supply – BAU scenario
Figure 9: Least cost projected CO2 emissions (2010-2040)
50 Journal of Energy in Southern Africa • Vol 26 No 3 • August 2015
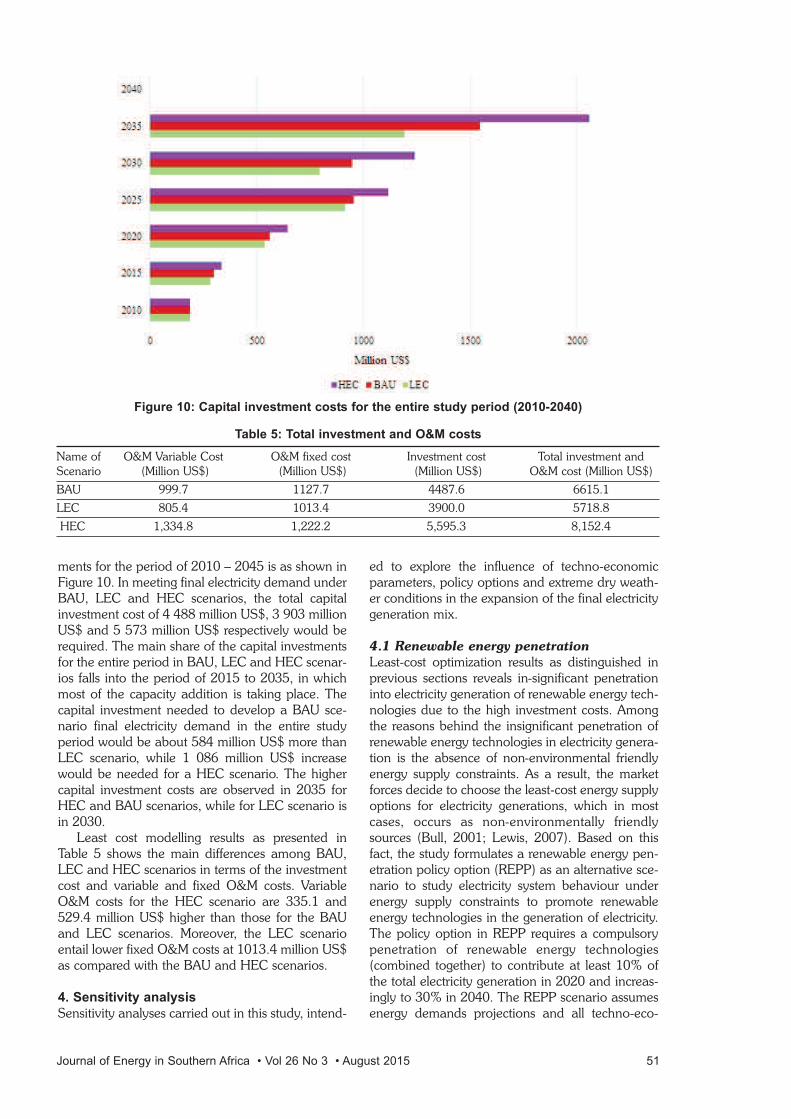
ments for the period of 2010 – 2045 is as shown inFigure 10. In meeting final electricity demand underBAU, LEC and HEC scenarios, the total capitalinvestment cost of 4 488 million US$, 3 903 millionUS$ and 5 573 million US$ respectively would berequired. The main share of the capital investmentsfor the entire period in BAU, LEC and HEC scenar-ios falls into the period of 2015 to 2035, in whichmost of the capacity addition is taking place. Thecapital investment needed to develop a BAU sce-nario final electricity demand in the entire studyperiod would be about 584 million US$ more thanLEC scenario, while 1 086 million US$ increasewould be needed for a HEC scenario. The highercapital investment costs are observed in 2035 forHEC and BAU scenarios, while for LEC scenario isin 2030.
Least cost modelling results as presented inTable 5 shows the main differences among BAU,LEC and HEC scenarios in terms of the investmentcost and variable and fixed O&M costs. VariableO&M costs for the HEC scenario are 335.1 and529.4 million US$ higher than those for the BAUand LEC scenarios. Moreover, the LEC scenarioentail lower fixed O&M costs at 1013.4 million US$as compared with the BAU and HEC scenarios.
4. Sensitivity analysis
Sensitivity analyses carried out in this study, intend-
ed to explore the influence of techno-economicparameters, policy options and extreme dry weath-er conditions in the expansion of the final electricitygeneration mix.
4.1 Renewable energy penetration
Least-cost optimization results as distinguished inprevious sections reveals in-significant penetrationinto electricity generation of renewable energy tech-nologies due to the high investment costs. Amongthe reasons behind the insignificant penetration ofrenewable energy technologies in electricity genera-tion is the absence of non-environmental friendlyenergy supply constraints. As a result, the marketforces decide to choose the least-cost energy supplyoptions for electricity generations, which in mostcases, occurs as non-environmentally friendlysources (Bull, 2001; Lewis, 2007). Based on thisfact, the study formulates a renewable energy pen-etration policy option (REPP) as an alternative sce-nario to study electricity system behaviour underenergy supply constraints to promote renewableenergy technologies in the generation of electricity.The policy option in REPP requires a compulsorypenetration of renewable energy technologies(combined together) to contribute at least 10% ofthe total electricity generation in 2020 and increas-ingly to 30% in 2040. The REPP scenario assumesenergy demands projections and all techno-eco-
Figure 10: Capital investment costs for the entire study period (2010-2040)
Table 5: Total investment and O&M costs
Name of O&M Variable Cost O&M fixed cost Investment cost Total investment and Scenario (Million US$) (Million US$) (Million US$) O&M cost (Million US$)
BAU 999.7 1127.7 4487.6 6615.1
LEC 805.4 1013.4 3900.0 5718.8
HEC 1,334.8 1,222.2 5,595.3 8,152.4
Journal of Energy in Southern Africa • Vol 26 No 3 • August 2015 51
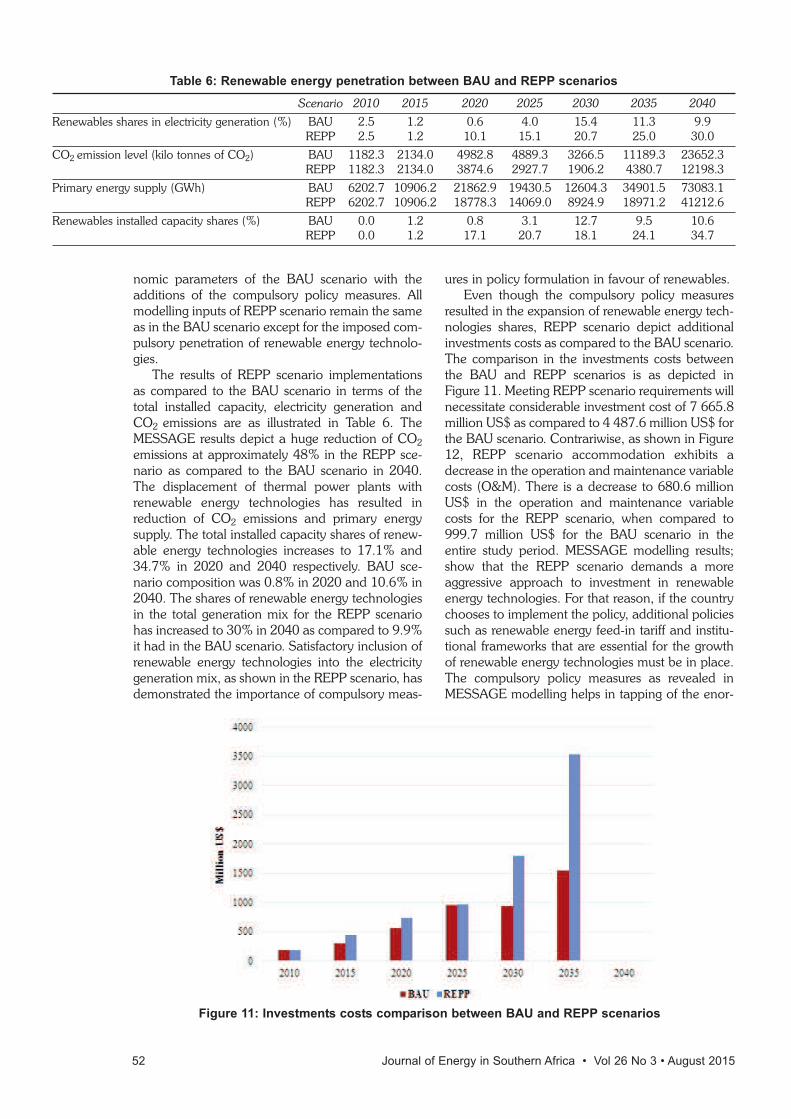
nomic parameters of the BAU scenario with theadditions of the compulsory policy measures. Allmodelling inputs of REPP scenario remain the sameas in the BAU scenario except for the imposed com-pulsory penetration of renewable energy technolo-gies.
The results of REPP scenario implementationsas compared to the BAU scenario in terms of thetotal installed capacity, electricity generation andCO2 emissions are as illustrated in Table 6. TheMESSAGE results depict a huge reduction of CO2emissions at approximately 48% in the REPP sce-nario as compared to the BAU scenario in 2040.The displacement of thermal power plants withrenewable energy technologies has resulted inreduction of CO2 emissions and primary energysupply. The total installed capacity shares of renew-able energy technologies increases to 17.1% and34.7% in 2020 and 2040 respectively. BAU sce-nario composition was 0.8% in 2020 and 10.6% in2040. The shares of renewable energy technologiesin the total generation mix for the REPP scenariohas increased to 30% in 2040 as compared to 9.9%it had in the BAU scenario. Satisfactory inclusion ofrenewable energy technologies into the electricitygeneration mix, as shown in the REPP scenario, hasdemonstrated the importance of compulsory meas-
ures in policy formulation in favour of renewables. Even though the compulsory policy measures
resulted in the expansion of renewable energy tech-nologies shares, REPP scenario depict additionalinvestments costs as compared to the BAU scenario.The comparison in the investments costs betweenthe BAU and REPP scenarios is as depicted inFigure 11. Meeting REPP scenario requirements willnecessitate considerable investment cost of 7 665.8million US$ as compared to 4 487.6 million US$ forthe BAU scenario. Contrariwise, as shown in Figure12, REPP scenario accommodation exhibits adecrease in the operation and maintenance variablecosts (O&M). There is a decrease to 680.6 millionUS$ in the operation and maintenance variablecosts for the REPP scenario, when compared to999.7 million US$ for the BAU scenario in theentire study period. MESSAGE modelling results;show that the REPP scenario demands a moreaggressive approach to investment in renewableenergy technologies. For that reason, if the countrychooses to implement the policy, additional policiessuch as renewable energy feed-in tariff and institu-tional frameworks that are essential for the growthof renewable energy technologies must be in place.The compulsory policy measures as revealed inMESSAGE modelling helps in tapping of the enor-
Table 6: Renewable energy penetration between BAU and REPP scenarios
Scenario 2010 2015 2020 2025 2030 2035 2040
Renewables shares in electricity generation (%) BAU 2.5 1.2 0.6 4.0 15.4 11.3 9.9REPP 2.5 1.2 10.1 15.1 20.7 25.0 30.0
CO2 emission level (kilo tonnes of CO2) BAU 1182.3 2134.0 4982.8 4889.3 3266.5 11189.3 23652.3REPP 1182.3 2134.0 3874.6 2927.7 1906.2 4380.7 12198.3
Primary energy supply (GWh) BAU 6202.7 10906.2 21862.9 19430.5 12604.3 34901.5 73083.1REPP 6202.7 10906.2 18778.3 14069.0 8924.9 18971.2 41212.6
Renewables installed capacity shares (%) BAU 0.0 1.2 0.8 3.1 12.7 9.5 10.6REPP 0.0 1.2 17.1 20.7 18.1 24.1 34.7
Figure 11: Investments costs comparison between BAU and REPP scenarios
52 Journal of Energy in Southern Africa • Vol 26 No 3 • August 2015
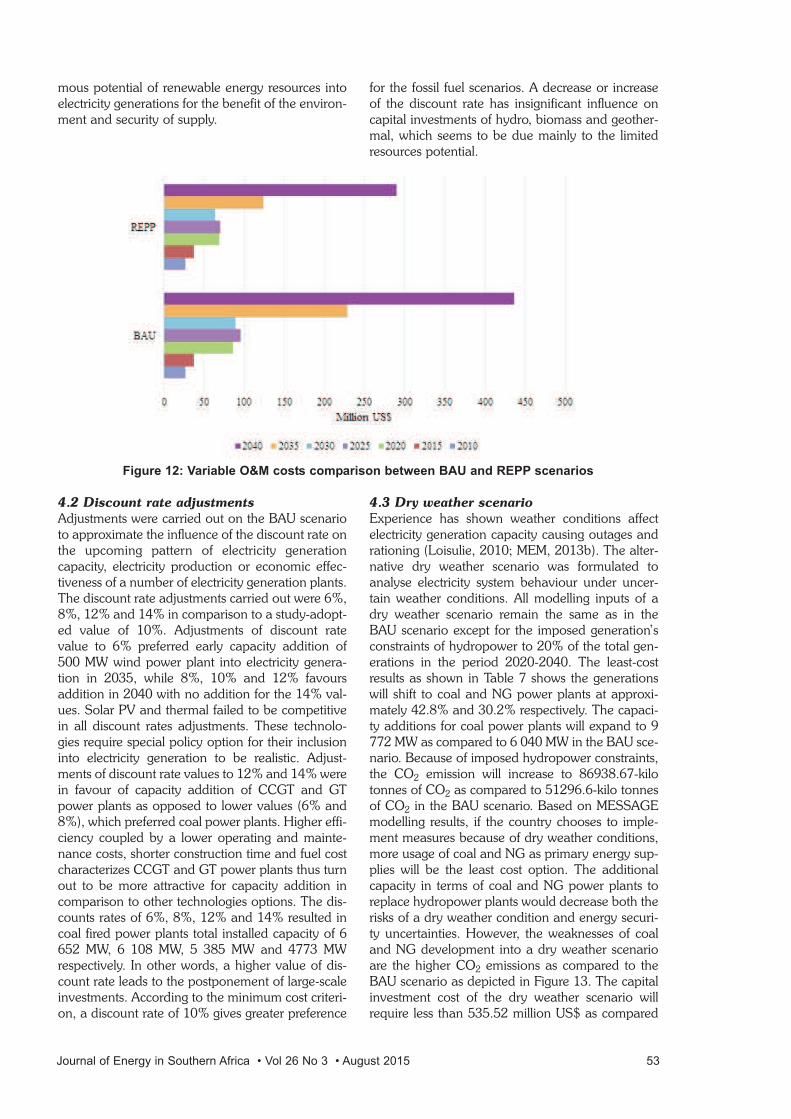
mous potential of renewable energy resources intoelectricity generations for the benefit of the environ-ment and security of supply.
4.2 Discount rate adjustments
Adjustments were carried out on the BAU scenarioto approximate the influence of the discount rate onthe upcoming pattern of electricity generationcapacity, electricity production or economic effec-tiveness of a number of electricity generation plants.The discount rate adjustments carried out were 6%,8%, 12% and 14% in comparison to a study-adopt-ed value of 10%. Adjustments of discount ratevalue to 6% preferred early capacity addition of500 MW wind power plant into electricity genera-tion in 2035, while 8%, 10% and 12% favoursaddition in 2040 with no addition for the 14% val-ues. Solar PV and thermal failed to be competitivein all discount rates adjustments. These technolo-gies require special policy option for their inclusioninto electricity generation to be realistic. Adjust-ments of discount rate values to 12% and 14% werein favour of capacity addition of CCGT and GTpower plants as opposed to lower values (6% and8%), which preferred coal power plants. Higher effi-ciency coupled by a lower operating and mainte-nance costs, shorter construction time and fuel costcharacterizes CCGT and GT power plants thus turnout to be more attractive for capacity addition incomparison to other technologies options. The dis-counts rates of 6%, 8%, 12% and 14% resulted incoal fired power plants total installed capacity of 6652 MW, 6 108 MW, 5 385 MW and 4773 MWrespectively. In other words, a higher value of dis-count rate leads to the postponement of large-scaleinvestments. According to the minimum cost criteri-on, a discount rate of 10% gives greater preference
for the fossil fuel scenarios. A decrease or increaseof the discount rate has insignificant influence oncapital investments of hydro, biomass and geother-mal, which seems to be due mainly to the limitedresources potential.
4.3 Dry weather scenario
Experience has shown weather conditions affectelectricity generation capacity causing outages andrationing (Loisulie, 2010; MEM, 2013b). The alter-native dry weather scenario was formulated toanalyse electricity system behaviour under uncer-tain weather conditions. All modelling inputs of adry weather scenario remain the same as in theBAU scenario except for the imposed generation’sconstraints of hydropower to 20% of the total gen-erations in the period 2020-2040. The least-costresults as shown in Table 7 shows the generationswill shift to coal and NG power plants at approxi-mately 42.8% and 30.2% respectively. The capaci-ty additions for coal power plants will expand to 9772 MW as compared to 6 040 MW in the BAU sce-nario. Because of imposed hydropower constraints,the CO2 emission will increase to 86938.67-kilotonnes of CO2 as compared to 51296.6-kilo tonnesof CO2 in the BAU scenario. Based on MESSAGEmodelling results, if the country chooses to imple-ment measures because of dry weather conditions,more usage of coal and NG as primary energy sup-plies will be the least cost option. The additionalcapacity in terms of coal and NG power plants toreplace hydropower plants would decrease both therisks of a dry weather condition and energy securi-ty uncertainties. However, the weaknesses of coaland NG development into a dry weather scenarioare the higher CO2 emissions as compared to theBAU scenario as depicted in Figure 13. The capitalinvestment cost of the dry weather scenario willrequire less than 535.52 million US$ as compared
Figure 12: Variable O&M costs comparison between BAU and REPP scenarios
Journal of Energy in Southern Africa • Vol 26 No 3 • August 2015 53
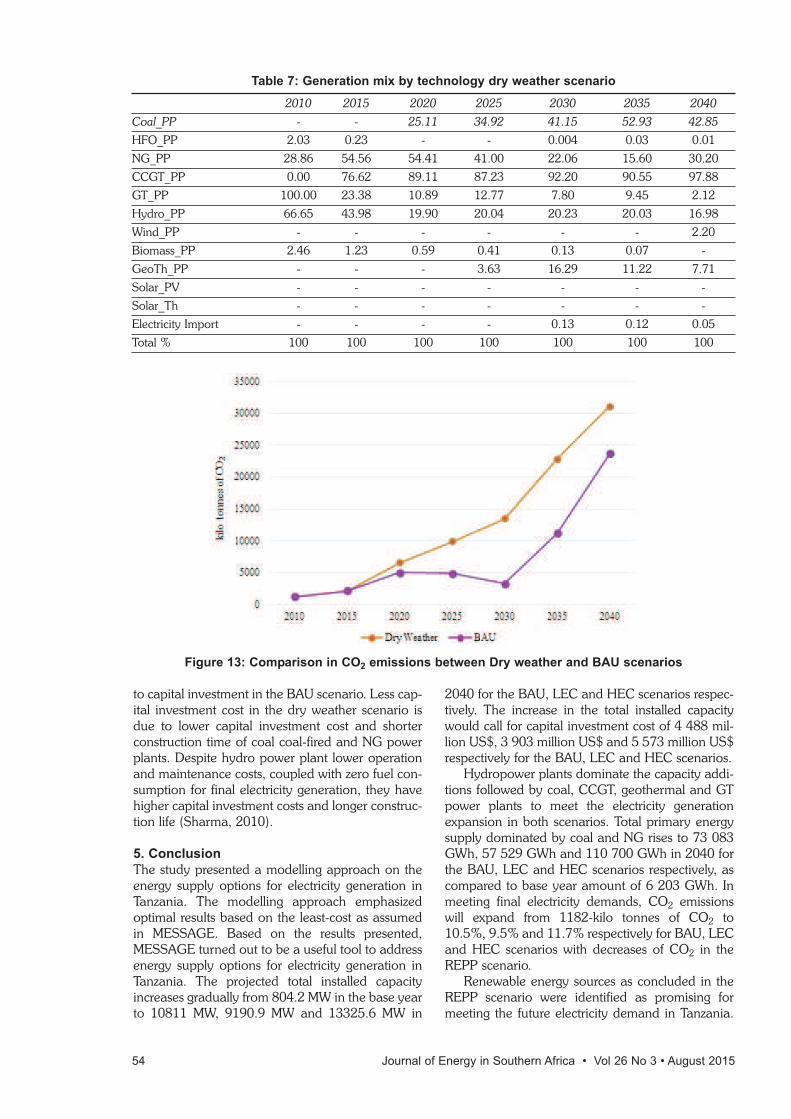
to capital investment in the BAU scenario. Less cap-ital investment cost in the dry weather scenario isdue to lower capital investment cost and shorterconstruction time of coal coal-fired and NG powerplants. Despite hydro power plant lower operationand maintenance costs, coupled with zero fuel con-sumption for final electricity generation, they havehigher capital investment costs and longer construc-tion life (Sharma, 2010).
5. Conclusion
The study presented a modelling approach on theenergy supply options for electricity generation inTanzania. The modelling approach emphasizedoptimal results based on the least-cost as assumedin MESSAGE. Based on the results presented,MESSAGE turned out to be a useful tool to addressenergy supply options for electricity generation inTanzania. The projected total installed capacityincreases gradually from 804.2 MW in the base yearto 10811 MW, 9190.9 MW and 13325.6 MW in
2040 for the BAU, LEC and HEC scenarios respec-tively. The increase in the total installed capacitywould call for capital investment cost of 4 488 mil-lion US$, 3 903 million US$ and 5 573 million US$respectively for the BAU, LEC and HEC scenarios.
Hydropower plants dominate the capacity addi-tions followed by coal, CCGT, geothermal and GTpower plants to meet the electricity generationexpansion in both scenarios. Total primary energysupply dominated by coal and NG rises to 73 083GWh, 57 529 GWh and 110 700 GWh in 2040 forthe BAU, LEC and HEC scenarios respectively, ascompared to base year amount of 6 203 GWh. Inmeeting final electricity demands, CO2 emissionswill expand from 1182-kilo tonnes of CO2 to10.5%, 9.5% and 11.7% respectively for BAU, LECand HEC scenarios with decreases of CO2 in theREPP scenario.
Renewable energy sources as concluded in theREPP scenario were identified as promising formeeting the future electricity demand in Tanzania.
Table 7: Generation mix by technology dry weather scenario
2010 2015 2020 2025 2030 2035 2040
Coal_PP - - 25.11 34.92 41.15 52.93 42.85
HFO_PP 2.03 0.23 - - 0.004 0.03 0.01
NG_PP 28.86 54.56 54.41 41.00 22.06 15.60 30.20
CCGT_PP 0.00 76.62 89.11 87.23 92.20 90.55 97.88
GT_PP 100.00 23.38 10.89 12.77 7.80 9.45 2.12
Hydro_PP 66.65 43.98 19.90 20.04 20.23 20.03 16.98
Wind_PP - - - - - - 2.20
Biomass_PP 2.46 1.23 0.59 0.41 0.13 0.07 -
GeoTh_PP - - - 3.63 16.29 11.22 7.71
Solar_PV - - - - - - -
Solar_Th - - - - - - -
Electricity Import - - - - 0.13 0.12 0.05
Total % 100 100 100 100 100 100 100
Figure 13: Comparison in CO2 emissions between Dry weather and BAU scenarios
54 Journal of Energy in Southern Africa • Vol 26 No 3 • August 2015
Potential contribution of renewable energy sourcesto the savings of coal and NG reserves would be agreat contribution to the economy and the environ-ment. However, the dry weather scenario hasshown a shift to coal and NG power plants genera-tions at approximately 42.8% and 30.2% respec-tively resulting into higher CO2. The sensitivityanalysis tests results have shown lower discountrates to favour investments on wind and coal powerplants, while higher discount rates favour NGpower plants. The least-cost results have shownimplications concerning capital investment costsversus environmental impacts concerns. Least costmodelling results have concluded that meeting finalelectricity demands without considerations of envi-ronmental impacts concerns is cheaper. Policy mak-ers should balance the capital investment costs andenvironmental concerns in the energy planning ofthe country.
Acknowledgments
The authors acknowledge the Tanzania Atomic EnergyCommission (TAEC), Arusha Technical College (ATC),Nelson Mandela African Institution of Science andTechnology (NM-AIST) and The College of EngineeringTechnology (CoET) of the University of Dar es Salaam(UDSM) for their kind support in successful completion ofthis study. Finally yet importantly, the authors wish toacknowledge valuable a contribution from SadikiMutabuzi of TAEC.
ReferencesAlFarra, H. J. & Abu-Hijleh, B. (2012). The potential
role of nuclear energy in mitigating CO2 emissions inthe United Arab Emirates. Energy Policy, 42, 272-285.
Bauner, D., Sundell, M., Senyagawa, J. & Doyle, J.(2012). Sustainable Energy Markets in TanzaniaReport II: Analysis and conclusions [Online].Swedish Agency for International DevelopmentCooperation (SIDA) and the British Department forInternational Development (DfID). Available:http://www.renetech.net/wp-content/uploads/2013/03/Sustainable_Energy_Markets_in_Tanzania_II_final.pdf [Accessed 28th June2013].
Bhattacharyya, S. C. & Timilsina, G. R. (2009). Energydemand models for policy formulation: a compara-tive study of energy demand models.
BOT (2012). Economic Bulletin for the Quarter EndingJune, 2012 Dar es Salaam: Bank of Tanzania.
Bull, S. R. (2001). Renewable energy today and tomor-row. Proceedings of the IEEE, 89, 1216-1226.
Casmiri, D. (2009). Energy Sytems: Vulnerability –Adaptation – Resilience (VAR) [Online]. HELIOInternational. Available: http://www.helio-internation-al.org/VARTanzania.En.pdf [Accessed 12th February2013].
Connolly, D., Lund, H., Mathiesen, B. V. & Leahy, M.(2010). A review of computer tools for analysing the
integration of renewable energy into various energysystems. Applied Energy, 87, 1059-1082.
Hainoun, A., Seif-Eldin, M. & Almoustafa, S. (2006).Analysis of the Syrian long-term energy and electrici-ty demand projection using the end-use methodolo-gy. Energy Policy, 34, 1958-1970.
Hainoun, A., Seif Aldin, M. & Almoustafa, S. (2010).Formulating an optimal long-term energy supplystrategy for Syria using MESSAGE model. Energypolicy, 38, 1701-1714.
IAEA. (2006). Assessing Policy Options for Increasingthe Use of Renewable Energy for SustainableDevelopment: Modelling Energy Scenarios forGhana [Online]. Vienna, Austria: International atom-ic Energy Agency. Available: www.unep.org/train-ing/programmes/.../Part_2/.../Energy/.../Ghana.pdf.
IAEA. (2007). Assessing policy options for increasing theuse of renewable energy for sustainable develop-ment: Modelling energy scenarios for Sichuan,China [Online]. Vienna, Austria: InternationalAtomic Energy Agency. Available:http://www.iaea.org/OurWork/ST/NE/Pess/assets/sichuan _case_study.pdf.
IAEA (2008). Guidance for the Application of anAssessment Methodology for Innovative NuclearEnergy Systems. INPRO Manual—Overview of theMethodology International Atomic Energy Agency.(IAEA-TECDOC-1575 Rev. 1): Vienna..
IAEA. (2009). IAEA Tools and Methodologies for EnergySystem Planning and Nuclear Energy SystemAssessments [Online]. Vienna, Austria: InternationalAtomic Energy Agency. [Accessed 16th October2012].
IAEA. (2006). Model for Analysis of Energy Demand(MAED-2) [Online]. Vienna, Austria: InternationalAtomic Energy Agency. Available: http://www-pub.iaea.org/MTCD/publications/PDF/CMS-18_web.pdf [Accessed 12th December 2012].
IEA. (2013). Energy balances of non-OECD countries2013 [Online]. Paris, France: International EnergyAgency. Available: http://www.iea.org/statistics/statis-ticssearch/report/?&country=TANZANIA&year=2011&product=Indicators.
IEA. (2014). Energy Balances of non-OECD Countries2014 [Online]. Paris, France: International EnergyAgency. Available: /content/book/energy_bal_non-oecd-2014-enhttp://dx.doi.org/10.1787/energy_bal_non-oecd-2014-en.
Kabaka, K. T. & Gwang’ombe, F. (2007). Challenges insmall hydropower development in Tanzania: ruralelectrification perspective. International Conferenceon Small Hydropower–Hydro. Sri Lanka, 2007. 22-24.
Kahyoza, N. (2013). Tanzania Gas Sector Economy inthe Light of Human Development [Online]. Dar esSalaam: Economic and Scocial Research Foundation(ESRF). Available: http://esrf.or.tz/docs/EPB-5-GasSector_HumanDev.pdf No. 5/2013].
Kapinga, S. (2013). A study on sustainable electricity:The Use of Energy Mix in Modernizing Tanzania.
Kiani, B., Rowe, A., Wild, P., Pitt, L., Sopinka, A. &Pedersen, T. F. (2013). Optimal electricity system
Journal of Energy in Southern Africa • Vol 26 No 3 • August 2015 55
56 Journal of Energy in Southern Africa • Vol 26 No 3 • August 2015
planning in a large hydro jurisdiction: Will BritishColumbia soon become a major importer of electric-ity? Energy Policy, 54, 311-319.
Kichonge, B., John, G. R., Mkilaha, I. S. & Sameer, H.(2014a). Modelling of Future Energy Demand forTanzania. Journal of Energy Technologies and Policy,Vol. 4, Issue No 7.
Kichonge, B., Mkilaha, I. S. & John, G. R. (2014b).Prediction of the Contribution of Renewable EnergySources into Electricity Generation in Tanzania.International Journal of Renewable EnergyTechnology Research (IJRETR), Vol. 3 1 – 13.
Kihwele, S., Hur, K. & Kyaruzi, A. (2012). Visions,Scenarios and Action Plans Towards NextGeneration Tanzania Power System. Energies, 5,3908-3927.
Kusekwa, M. A. (2013). Biomass Conversion to Energyin Tanzania: A Critique.
Lewis, N. S. (2007). Toward cost-effective solar energyuse. science, 315, 798-801.
Loisulie, S. (2010). Vulnerability of the TanzanianHydropower Production to Extreme Weather Events[Online]. Morogoro: Sokoine University ofAgriculture Faculty of Science. Available:http://cdsagenda5.ictp.trieste.it/html_trees_links/1201801804/participants_presentations/Loisulie-Tanzania_hydropower.pdf [Accessed 4th May 2010].
MEM (2012). Power System Master Plan 2012 Update.Ministry of Energy and Minerals-Dar es Salaam.
MEM (2013a). The Energy Sector Overview [Online].Ministry of Energy and Mineral-Tanzania. Available:http://www.mem.go.tz/AboutUs/MEMOverview/TheEnergySector/tabid/121/language/en-US/Default.aspx[Accessed 10th January 2013].
MEM (2013b). Scaling Up Renewable EnergyProgramme (SREP) – Investment Plan for Tanzania[Online]. Ministry of Energy and Minerals – UnitedRepublic of Tanzania. Available:http://www.mem.go.tz/Portals/0/EasyDNNNewsDocuments/1033/0039_08052013-SREP_Tanzania%20IP_Final_Draft.pdf [Accessed12th July 2013].
Messner, S. & Strubegger, M. (1995). User’s Guide forMESSAGE III. Rep. WP-95-69, International Institutefor Applied Systems Analysis, Laxenburg, Austria,14.
Mnjokava, T. (2008). Geothermal exploration inTanzania–Status report. Presentation by Geological.
Mnzava, L. J. & Mayo, A. W. (2010). Geochemicalinvestigation of geothermal power potential explo-ration of hot springs in South-western Tanzania.ABOUT IJWREE, 601.
Nakarmi, A. M., Mishra, T. & Banerjee, R. EnergyScenarios of Nepal 2010-2030: A Renewable andSustainable Approach. Proceedings of theInternational Conference on Energy Resources andTechnologies for Sustainable Development(ICERTSD), 2013 Howrah, West Bengal, India
Nakicenovic N, Alcamo J, Davis G, de Vries B, FenhannJ & Gaf�n S. (2000). Special report on emissionsscenarios. Intergovernmental panel on climatechange [Online]. Available:http://citeseerx.ist.psu.edu/viewdoc/summary?doi=1
0.1.1.260.1482.Omari, A., Kichonge, B., John, G. R., Njau, K. N. &
Mtui, P. L. (2014a). Potential of municipal solidwaste, as renewable energy source – a case study ofArusha, Tanzania. International Journal ofRenewable Energy Technology Research (IJRETR),Vol. 3,No. 6, pp. 1 – 9.
Omari, A., Said, M., Njau, K., John, G. & Mtui, P.(2014b.) Energy Recovery routes from MunicipalSolid Waste, A case study of Arusha-Tanzania.Journal of Energy Technologies and Policy, 4, 1-7.
Philibert, C. (2014). Technology roadmap: solar photo-voltaic energy, OECD/IEA.
Pinthong, T. & Wongsapai, W. Evaluation of EnergyDemand and Supply Under Electricity GenerationScenarios of Thailand. Proceedings of the WorldRenewable Energy Congress, 2009.
Rečka, L. (2011). Electricity system optimization: A caseof the Czech electricity system – application ofmodel MESSAGE.
Roque, P. M. (2014). Mozambique’s electricity demandforecasting and power supply alternative model. The9th Regional Collaboration Conference -Researchand Innovations forum for sustainable regionalDevelopment: Over a Decade of SwedishPartnership, July 20 – 23, 2014 2014 ImperialResort Beach Hotel, Entebbe, Uganda.
Selvakkumaran, S. & Limmeechokchai, B. Assessmentof Thailand’s energy policies on energy security.Utility Exhibition on Power and Energy Systems:Issues & Prospects for Asia (ICUE), 2011International Conference and, 2011. IEEE, 1-6.
Sharma, A. (2010). Hydro power vs thermal power: acomparative cost-benefit analysis. InternationalJournal of Arts and Sciences, 3, 125-143.
Sharman, H. Why UK wind power should not exceed10 GW. Proceedings of the ICE-Civil Engineering,2005. Thomas Telford, 161-169.
Sims, R. E., Rogner, H.-H. & Gregory, K. (2003).Carbon emission and mitigation cost comparisonsbetween fossil fuel, nuclear and renewable energyresources for electricity generation. Energy policy,31, 1315-1326.
Tait, L., McCall, B. & Stone, A. (2014). Energy futuresmodelling for African cities–selecting a modellingtool for the SAMSET project.
Tembo, B. (2012). Policy Options for the SustainableDevelopment of the Power Sector in Zambia. M ScThesis, University of Cape Town.[Links].
URT (1999). The Tanzania Development Vision 2025.Dar es Salaam: President’s Office.
Van Beeck, N. 1999. Classification of energy models,Citeseer.
Wangwe, S., Mmari, D., Aikaeli, J., Rutatina, N.,Mboghoina, T. & Kinyondo, A. (2014). The perform-ance of the manufacturing sector in Tanzania:Challenges and the way forward. WIDER WorkingPaper.
Wawa, A. I. (2012). The challenges of promoting andadopting biogas technology as alternative energysource in semi-arid areas of Tanzania: The case ofKongwa and Bahi districts of Dodoma region. PhD,The Open University Of Tanzania

Journal of Energy in Southern Africa • Vol 26 No 3 • August 2015 57
Wilson, L. (2010). Biomass Energy Systems andResources in Tropical Tanzania. Royal Institute ofTechnology; KTH: ISBN 978-91-7415-732-1
Received 3 November 2014; 29 July 2015
Abstract
The residential sector in South Africa is being elec-trified by the South African government on a prior-ity basis. For this purpose, both grid and off-gridelectrification options are being used. As off-gridoption, 50 Watt Solar Home Systems (SHS) isbeing provided to consumers in remote rural areaswhere grid connection is inaccessible. But the SHSof the mentioned size can hardly produce 0.3 to 0.4kilowatt-hour (kWh) of electricity per day, evenunder the best solar conditions. This electric energyis substantially lesser than the Basic Electric Energy(BEE = 50 kWh per month), being utilized in thecountry free of cost by grid connected low incomehouseholds. In this research work, efforts have beenmade to determine the most economical options inSouth Africa’s rural areas with off-grid capacityequivalent to BEE. For analysis, off-grid/micro gridoptions have been compared not only with oneanother but also with grid connection. To incorpo-rate renewable resources spatial variations, thework has been carried out at provincial level withthe period 2014 to 2050. From analysis, it has beenfound that currently grid-connection is marginallybetter than off-grid options. But due to increasinggrid connection cost and development in the off-grid technologies, the later with generation equiva-lent to BEE will be a more attractive option to elec-trify South African rural areas.
Keywords: South Africa, rural electrification, renew-able energy
Introduction
South Africa is a developing country, with a popu-lation of about 52.89 million people living inaround 13.2 million households. In the early 1990s,the electrified households’ percentage was around35% which grew up to around 75% (including bothformal and informal1 while 87% in the case of for-mal only). From this, it is clear that the SouthAfrican government electrified the residential sectoron a priority basis, but still a reasonable backlog, ofaround 3.4 million households, is to be electrified(Republic of South Africa, 2013), (Department ofEnergy, 2013).
In the latest approval, the South African govern-ment planned to electrify the sector to the maxi-mum limit (up to 97% in case of formal households)by 2025. From the Department of Energy’s state-ment, it is clear that they are not only consideringthe above mentioned backlog but also futuregrowth in the sector. Additionally, it is mentionedthat 90% of the households will be connected to thenational grid, while the remaining 7% will use qual-ity off-grid options (Bongwe, 2013).
The Department of Energy, South Africa, con-sidered off-grid options due to the grid system infra-structure limitations, mainly transmission and distri-bution system availability to remote rural areas. Toelectrify the sector through grid, many challengesare being faced by the Electricity SupplyCommission (Eskom)2 including:1. More than 95% of all non-electrified households
are from a low income group (i.e. annualincome around ZAR3 50,000.00). For them,payment of connection charges is obviously dif-ficult (Department of Energy, 2013), (Universityof South Africa, 2012).
2. About 31% of the South African population livesin rural areas of the country. In these areas,more than 60% of households have no access toelectricity. This means that the share of the ruralcommunities, in the non-electrified households,is more than 50%. From these facts, it can be
Options for the supply of electricity to rural homes
in South Africa
Noor JamalEuropean University, Flensburg, Germany
58 Journal of Energy in Southern Africa • Vol 26 No 3 • August 2015
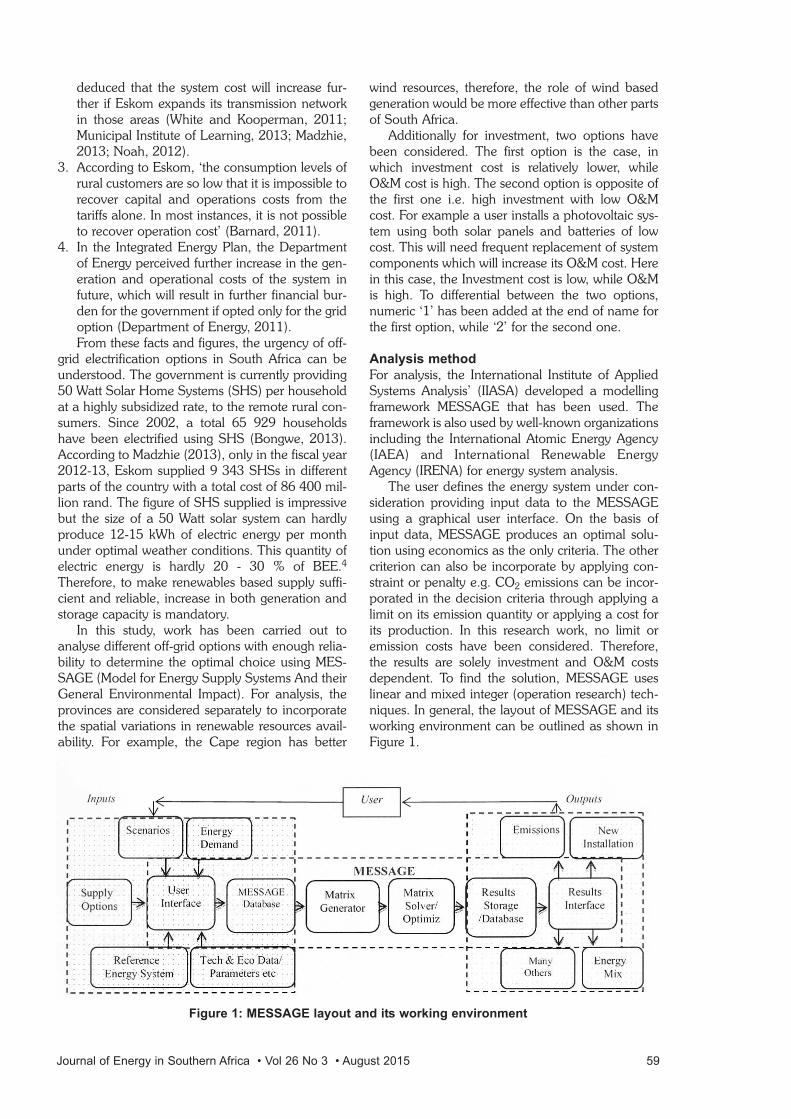
deduced that the system cost will increase fur-ther if Eskom expands its transmission networkin those areas (White and Kooperman, 2011;Municipal Institute of Learning, 2013; Madzhie,2013; Noah, 2012).
3. According to Eskom, ‘the consumption levels ofrural customers are so low that it is impossible torecover capital and operations costs from thetariffs alone. In most instances, it is not possibleto recover operation cost’ (Barnard, 2011).
4. In the Integrated Energy Plan, the Departmentof Energy perceived further increase in the gen-eration and operational costs of the system infuture, which will result in further financial bur-den for the government if opted only for the gridoption (Department of Energy, 2011). From these facts and figures, the urgency of off-
grid electrification options in South Africa can beunderstood. The government is currently providing50 Watt Solar Home Systems (SHS) per householdat a highly subsidized rate, to the remote rural con-sumers. Since 2002, a total 65 929 householdshave been electrified using SHS (Bongwe, 2013).According to Madzhie (2013), only in the fiscal year2012-13, Eskom supplied 9 343 SHSs in differentparts of the country with a total cost of 86 400 mil-lion rand. The figure of SHS supplied is impressivebut the size of a 50 Watt solar system can hardlyproduce 12-15 kWh of electric energy per monthunder optimal weather conditions. This quantity ofelectric energy is hardly 20 - 30 % of BEE.4
Therefore, to make renewables based supply suffi-cient and reliable, increase in both generation andstorage capacity is mandatory.
In this study, work has been carried out toanalyse different off-grid options with enough relia-bility to determine the optimal choice using MES-SAGE (Model for Energy Supply Systems And theirGeneral Environmental Impact). For analysis, theprovinces are considered separately to incorporatethe spatial variations in renewable resources avail-ability. For example, the Cape region has better
wind resources, therefore, the role of wind basedgeneration would be more effective than other partsof South Africa.
Additionally for investment, two options havebeen considered. The first option is the case, inwhich investment cost is relatively lower, whileO&M cost is high. The second option is opposite ofthe first one i.e. high investment with low O&Mcost. For example a user installs a photovoltaic sys-tem using both solar panels and batteries of lowcost. This will need frequent replacement of systemcomponents which will increase its O&M cost. Herein this case, the Investment cost is low, while O&Mis high. To differential between the two options,numeric ‘1’ has been added at the end of name forthe first option, while ‘2’ for the second one.
Analysis method
For analysis, the International Institute of AppliedSystems Analysis’ (IIASA) developed a modellingframework MESSAGE that has been used. Theframework is also used by well-known organizationsincluding the International Atomic Energy Agency(IAEA) and International Renewable EnergyAgency (IRENA) for energy system analysis.
The user defines the energy system under con-sideration providing input data to the MESSAGEusing a graphical user interface. On the basis ofinput data, MESSAGE produces an optimal solu-tion using economics as the only criteria. The othercriterion can also be incorporate by applying con-straint or penalty e.g. CO2 emissions can be incor-porated in the decision criteria through applying alimit on its emission quantity or applying a cost forits production. In this research work, no limit oremission costs have been considered. Therefore,the results are solely investment and O&M costsdependent. To find the solution, MESSAGE useslinear and mixed integer (operation research) tech-niques. In general, the layout of MESSAGE and itsworking environment can be outlined as shown inFigure 1.
Figure 1: MESSAGE layout and its working environment
Journal of Energy in Southern Africa • Vol 26 No 3 • August 2015 59
Assumption and data
Demand projection
The South African Government is providing 50units (i.e. kWh) of electricity per household permonth to low income consumers, free of cost, to ful-fil their basic electricity needs (Adam, 2010). In thisstudy, the total demand has been projected usingthe same electric demand per month per householdin rural areas. To determine the total demand, it istherefore necessary to know about the number ofhouseholds that are; I) located in rural areas; II) un-electrified; and III) belong to a low income group.For this purpose, the following information hasbeen considered.1. According to the University of South Africa
(2012), around 48% (6.7 million) households inSouth Africa belonged to a poor group withannual income between 0-50 000 Rand perannum by 2010.
2. The Department of Energy found that 95% (3.2million) of total un-electrified households,including both formal and informal, are from alower income class (Department of Energy,2013).
3. South Africa’s 31% of population live in ruralareas. In these areas, more than 61% are un-electrified. This means that:
Rural unelectrified population = Total population × 0.31 × 0.61= 52.89 million × 0.31 × 0.61= 10.0 million
With these facts in mind, it can be deduced thatmost of the un-electrified households are from alower income class and are locating in rural areas ofSouth Africa. For a future number of such house-holds, the Department of Energy (2013) house-hold’s projection has been taken into account withassumption that the low income class will decreasefrom 48% to 35% by 2050. This change could befor many reasons including socio-economic devel-opment, urbanization etc. Using these facts and fig-ures, the projection would look like as shown in
Figure 1. In this figure, the demand of BEE qualifiedhouseholds has been considered for further analysis
It is important to mention here that theDepartment of Energy numbers are average valuesat country level and may not represent specificallythe rural communities. But adjustment in the num-ber for rural community does not affect the mainobjective of the research work, which is targeted todetermine the optimal option. Therefore, changesin the demand will affect the scale of requiredinstalled capacity, while the sequence of optimalchoice would remain the same. Using Figure 2households’ projection with demand equal to BEEper household, the projected demand looks like asshown in Figure 3.
Supply options
The supply options are different type of standaloneor hybrid generation facilities that could fulfil therural consumers electric energy needs with reason-able reliability. For this purpose, the options consid-ered are given in Table 1.
Except grid connection, all the above mentionedoptions have been analysed with battery storage,even in the case of a diesel generator. To fulfil thedemand, the supply system charges the batteries tostore electric energy. The stored energy is supposedto be used by consumers as per demand. Due todifference in supply options reliability, the storagecapacity considered for each technology option isdifferent. The additional feedback is consideredonly with a solar and wind standalone supply sys-tem due to their relatively low reliability.
Techno-economic data
Technologies basic pricesThe basic prices of technologies are the marketprices including services, installation and infrastruc-ture cost (only if needed). For investment, WT andDG based standalone or their hybrid systems havebeen considered as micro grid. Due to this, addi-tional cost of 30 - 50% of total investment cost fordistribution within community has been considered.These basic prices of the technologies are the same
Figure 2: Projected electricity demand of un-electrified households in remote rural areas
of South Africa
60 Journal of Energy in Southern Africa • Vol 26 No 3 • August 2015
irrespective of its installation location and areshown in Table 1. Later on for analysis, they areadjusted as per installation requirement. The needof adjustment and its concept are discussed below.
Technologies adjusted pricesTo model the system, the investment and fixed costshould be in ‘cost per unit of installed capacity’,while variable cost in ‘cost per unit of generation’.But here in this particular case, market costs datacannot be used directly in the modelling frameworkdue to the following reasons: 1. The size of installed wind and solar change from
place to place to provide the same energy to theconsumer. For example, wind speed and itsavailability are better in the Western Cape than
Gauteng. Therefore, a 1 000 Watt wind turbinewill produce more energy in the Western Capethan Gauteng. To produce the same energy inGauteng as in Western Cape, more WT capaci-ty will be required there. This additional installa-tion will make wind energy more expensive inGauteng than Western Cape for the samedemand.
2. The required installed capacity (Watt) of differ-ent technologies within a region will also be dif-ferent from one another. For example anywhere,the required PV installed capacity will be signifi-cantly higher than DG to produce energy equiv-alent of BEE for the consumer.
3. In general, the household grid connection can-not be exactly defined in term of wattage due to
Figure 3: South Africa’s population, households and BEE qualified households projection
Table 1: Electric energy supply options in remote rural areas
Supply options Installed capacity expected Expected share in Feedback period throughgeneration (% of BEE)* demand fulfilment (%) storage
(days)
PV Standalone 200 100 1
PV-Diesel Generator Share NA 80 - 20 Nil
Diesel Generator Standalone NA 100 Nil
Wind Turbine Standalone 120 100 0.2
Wind Turbine-PV Hybrid 130 60 - 40 Nil
Grid System NA 100 Nil
* The expected generation of installed renewable capacity is based upon the resources availability under optimal weather conditions per day
Table 2: Supply technologies market prices
Sustainable (2014) Workstation Solutions (2014); Alternagy (2014); Uprice (2014): Department of Energy (2014);
Madzhie (2013); IRENA (2012)
Off-grid technology Technology types Investment cost Infrastructure Fueloptions (Rand/Watt)* (Rand/Watt) (Rand/Litre)
PV System (Including all Type 1 85.359 - -accessories and battery) Type 2 141.121 - -
Wind Turbine (Including all Type 1 94.153 5.878 -accessories and battery) Type 2 153.930 8.095 -
Diesel Generator - 6.143 3.072 12.600
* Investment cost including all accessories (i.e. inverter, converter) and storage costs
Journal of Energy in Southern Africa • Vol 26 No 3 • August 2015 61
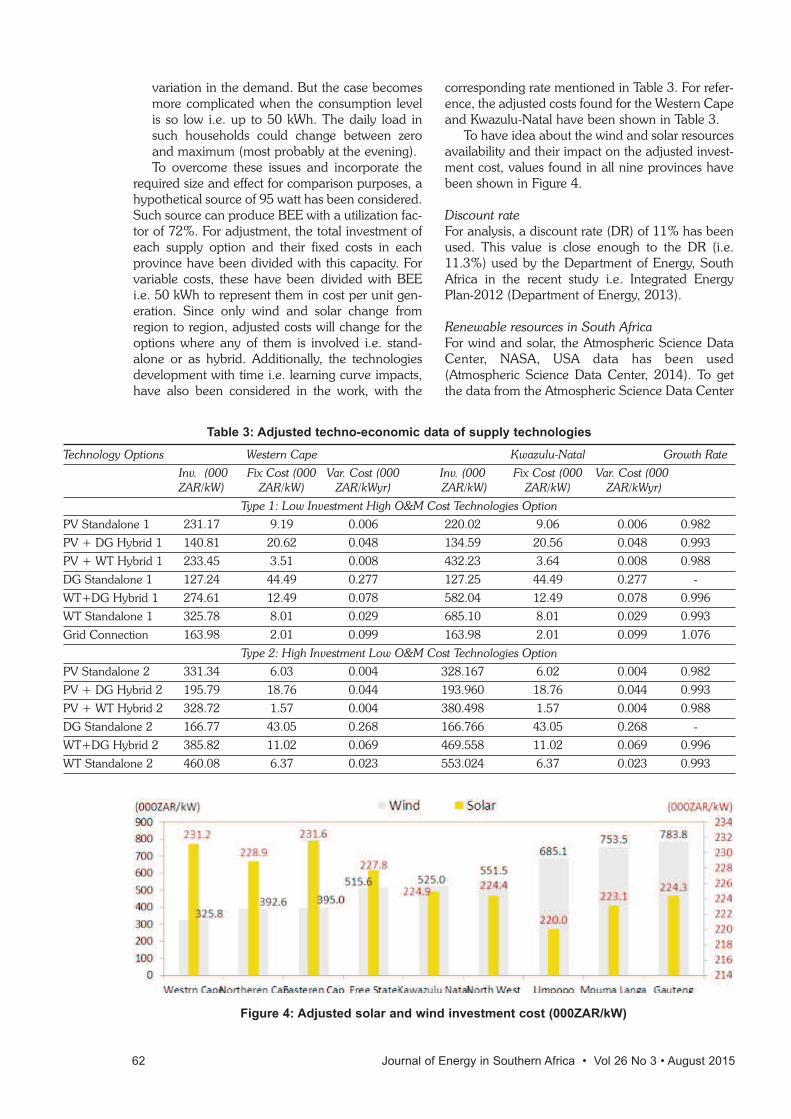
variation in the demand. But the case becomesmore complicated when the consumption levelis so low i.e. up to 50 kWh. The daily load insuch households could change between zeroand maximum (most probably at the evening).To overcome these issues and incorporate the
required size and effect for comparison purposes, ahypothetical source of 95 watt has been considered.Such source can produce BEE with a utilization fac-tor of 72%. For adjustment, the total investment ofeach supply option and their fixed costs in eachprovince have been divided with this capacity. Forvariable costs, these have been divided with BEEi.e. 50 kWh to represent them in cost per unit gen-eration. Since only wind and solar change fromregion to region, adjusted costs will change for theoptions where any of them is involved i.e. stand-alone or as hybrid. Additionally, the technologiesdevelopment with time i.e. learning curve impacts,have also been considered in the work, with the
corresponding rate mentioned in Table 3. For refer-ence, the adjusted costs found for the Western Capeand Kwazulu-Natal have been shown in Table 3.
To have idea about the wind and solar resourcesavailability and their impact on the adjusted invest-ment cost, values found in all nine provinces havebeen shown in Figure 4.
Discount rateFor analysis, a discount rate (DR) of 11% has beenused. This value is close enough to the DR (i.e.11.3%) used by the Department of Energy, SouthAfrica in the recent study i.e. Integrated EnergyPlan-2012 (Department of Energy, 2013).
Renewable resources in South AfricaFor wind and solar, the Atmospheric Science DataCenter, NASA, USA data has been used(Atmospheric Science Data Center, 2014). To getthe data from the Atmospheric Science Data Center
Table 3: Adjusted techno-economic data of supply technologies
Technology Options Western Cape Kwazulu-Natal Growth Rate
Inv. (000 Fix Cost (000 Var. Cost (000 Inv. (000 Fix Cost (000 Var. Cost (000 ZAR/kW) ZAR/kW) ZAR/kWyr) ZAR/kW) ZAR/kW) ZAR/kWyr)
Type 1: Low Investment High O&M Cost Technologies Option
PV Standalone 1 231.17 9.19 0.006 220.02 9.06 0.006 0.982
PV + DG Hybrid 1 140.81 20.62 0.048 134.59 20.56 0.048 0.993
PV + WT Hybrid 1 233.45 3.51 0.008 432.23 3.64 0.008 0.988
DG Standalone 1 127.24 44.49 0.277 127.25 44.49 0.277 -
WT+DG Hybrid 1 274.61 12.49 0.078 582.04 12.49 0.078 0.996
WT Standalone 1 325.78 8.01 0.029 685.10 8.01 0.029 0.993
Grid Connection 163.98 2.01 0.099 163.98 2.01 0.099 1.076
Type 2: High Investment Low O&M Cost Technologies Option
PV Standalone 2 331.34 6.03 0.004 328.167 6.02 0.004 0.982
PV + DG Hybrid 2 195.79 18.76 0.044 193.960 18.76 0.044 0.993
PV + WT Hybrid 2 328.72 1.57 0.004 380.498 1.57 0.004 0.988
DG Standalone 2 166.77 43.05 0.268 166.766 43.05 0.268 -
WT+DG Hybrid 2 385.82 11.02 0.069 469.558 11.02 0.069 0.996
WT Standalone 2 460.08 6.37 0.023 553.024 6.37 0.023 0.993
Figure 4: Adjusted solar and wind investment cost (000ZAR/kW)
62 Journal of Energy in Southern Africa • Vol 26 No 3 • August 2015
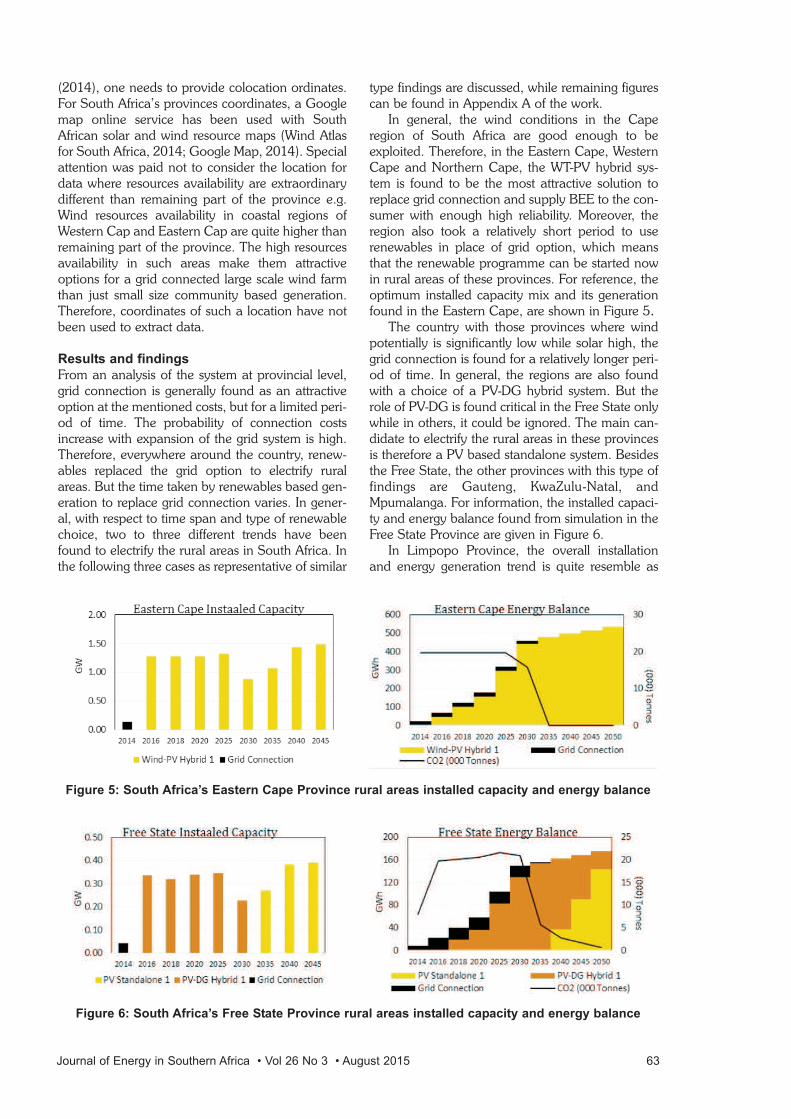
(2014), one needs to provide colocation ordinates.For South Africa’s provinces coordinates, a Googlemap online service has been used with SouthAfrican solar and wind resource maps (Wind Atlasfor South Africa, 2014; Google Map, 2014). Specialattention was paid not to consider the location fordata where resources availability are extraordinarydifferent than remaining part of the province e.g.Wind resources availability in coastal regions ofWestern Cap and Eastern Cap are quite higher thanremaining part of the province. The high resourcesavailability in such areas make them attractiveoptions for a grid connected large scale wind farmthan just small size community based generation.Therefore, coordinates of such a location have notbeen used to extract data.
Results and findings
From an analysis of the system at provincial level,grid connection is generally found as an attractiveoption at the mentioned costs, but for a limited peri-od of time. The probability of connection costsincrease with expansion of the grid system is high.Therefore, everywhere around the country, renew-ables replaced the grid option to electrify ruralareas. But the time taken by renewables based gen-eration to replace grid connection varies. In gener-al, with respect to time span and type of renewablechoice, two to three different trends have beenfound to electrify the rural areas in South Africa. Inthe following three cases as representative of similar
type findings are discussed, while remaining figurescan be found in Appendix A of the work.
In general, the wind conditions in the Caperegion of South Africa are good enough to beexploited. Therefore, in the Eastern Cape, WesternCape and Northern Cape, the WT-PV hybrid sys-tem is found to be the most attractive solution toreplace grid connection and supply BEE to the con-sumer with enough high reliability. Moreover, theregion also took a relatively short period to userenewables in place of grid option, which meansthat the renewable programme can be started nowin rural areas of these provinces. For reference, theoptimum installed capacity mix and its generationfound in the Eastern Cape, are shown in Figure 5.
The country with those provinces where windpotentially is significantly low while solar high, thegrid connection is found for a relatively longer peri-od of time. In general, the regions are also foundwith a choice of a PV-DG hybrid system. But therole of PV-DG is found critical in the Free State onlywhile in others, it could be ignored. The main can-didate to electrify the rural areas in these provincesis therefore a PV based standalone system. Besidesthe Free State, the other provinces with this type offindings are Gauteng, KwaZulu-Natal, andMpumalanga. For information, the installed capaci-ty and energy balance found from simulation in theFree State Province are given in Figure 6.
In Limpopo Province, the overall installationand energy generation trend is quite resemble as
Figure 5: South Africa’s Eastern Cape Province rural areas installed capacity and energy balance
Figure 6: South Africa’s Free State Province rural areas installed capacity and energy balance
Journal of Energy in Southern Africa • Vol 26 No 3 • August 2015 63
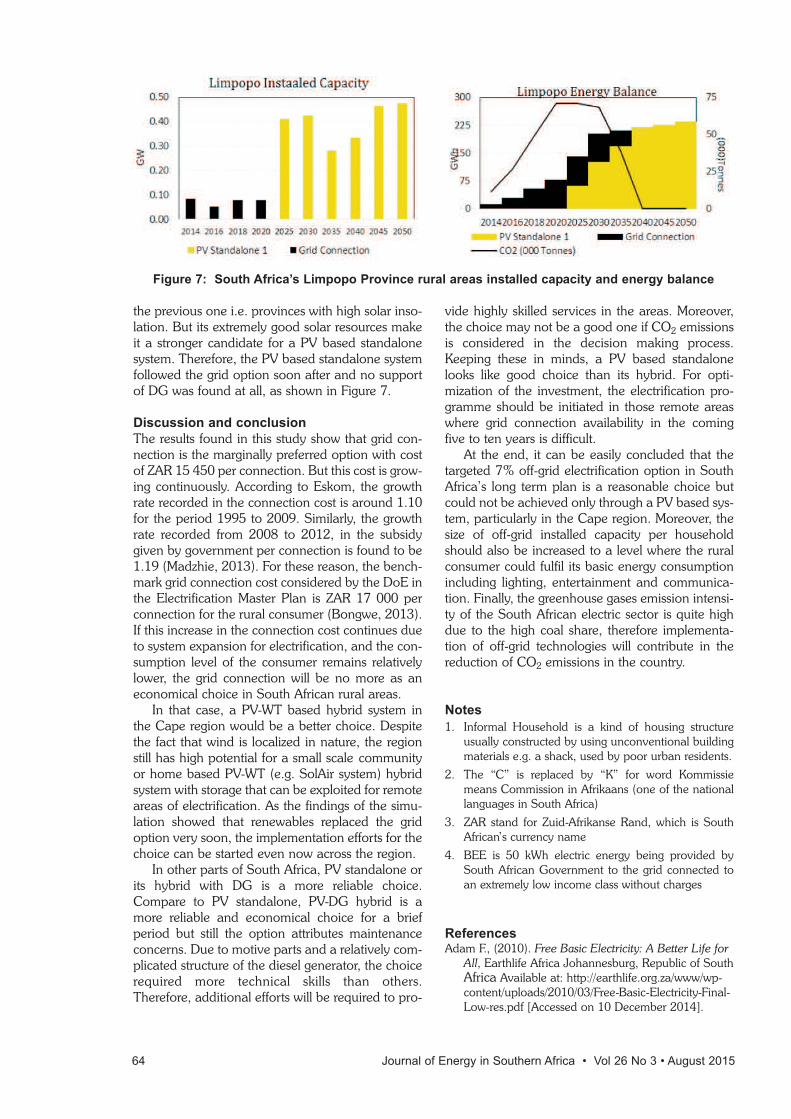
the previous one i.e. provinces with high solar inso-lation. But its extremely good solar resources makeit a stronger candidate for a PV based standalonesystem. Therefore, the PV based standalone systemfollowed the grid option soon after and no supportof DG was found at all, as shown in Figure 7.
Discussion and conclusion
The results found in this study show that grid con-nection is the marginally preferred option with costof ZAR 15 450 per connection. But this cost is grow-ing continuously. According to Eskom, the growthrate recorded in the connection cost is around 1.10for the period 1995 to 2009. Similarly, the growthrate recorded from 2008 to 2012, in the subsidygiven by government per connection is found to be1.19 (Madzhie, 2013). For these reason, the bench-mark grid connection cost considered by the DoE inthe Electrification Master Plan is ZAR 17 000 perconnection for the rural consumer (Bongwe, 2013).If this increase in the connection cost continues dueto system expansion for electrification, and the con-sumption level of the consumer remains relativelylower, the grid connection will be no more as aneconomical choice in South African rural areas.
In that case, a PV-WT based hybrid system inthe Cape region would be a better choice. Despitethe fact that wind is localized in nature, the regionstill has high potential for a small scale communityor home based PV-WT (e.g. SolAir system) hybridsystem with storage that can be exploited for remoteareas of electrification. As the findings of the simu-lation showed that renewables replaced the gridoption very soon, the implementation efforts for thechoice can be started even now across the region.
In other parts of South Africa, PV standalone orits hybrid with DG is a more reliable choice.Compare to PV standalone, PV-DG hybrid is amore reliable and economical choice for a briefperiod but still the option attributes maintenanceconcerns. Due to motive parts and a relatively com-plicated structure of the diesel generator, the choicerequired more technical skills than others.Therefore, additional efforts will be required to pro-
vide highly skilled services in the areas. Moreover,the choice may not be a good one if CO2 emissionsis considered in the decision making process.Keeping these in minds, a PV based standalonelooks like good choice than its hybrid. For opti-mization of the investment, the electrification pro-gramme should be initiated in those remote areaswhere grid connection availability in the comingfive to ten years is difficult.
At the end, it can be easily concluded that thetargeted 7% off-grid electrification option in SouthAfrica’s long term plan is a reasonable choice butcould not be achieved only through a PV based sys-tem, particularly in the Cape region. Moreover, thesize of off-grid installed capacity per householdshould also be increased to a level where the ruralconsumer could fulfil its basic energy consumptionincluding lighting, entertainment and communica-tion. Finally, the greenhouse gases emission intensi-ty of the South African electric sector is quite highdue to the high coal share, therefore implementa-tion of off-grid technologies will contribute in thereduction of CO2 emissions in the country.
Notes
1. Informal Household is a kind of housing structureusually constructed by using unconventional buildingmaterials e.g. a shack, used by poor urban residents.
2. The “C” is replaced by “K” for word Kommissiemeans Commission in Afrikaans (one of the nationallanguages in South Africa)
3. ZAR stand for Zuid-Afrikanse Rand, which is SouthAfrican’s currency name
4. BEE is 50 kWh electric energy being provided bySouth African Government to the grid connected toan extremely low income class without charges
ReferencesAdam F., (2010). Free Basic Electricity: A Better Life for
All, Earthlife Africa Johannesburg, Republic of SouthAfrica Available at: http://earthlife.org.za/www/wp-content/uploads/2010/03/Free-Basic-Electricity-Final-Low-res.pdf [Accessed on 10 December 2014].
Figure 7: South Africa’s Limpopo Province rural areas installed capacity and energy balance
64 Journal of Energy in Southern Africa • Vol 26 No 3 • August 2015
Alternagy, (2014). Alternagy Available at:http://www.alternagy.co.za/shop/earth-power-10kw-wind-turbine/, [Accessed on 10 February 2014].
Atmospheric Science Data Center (2014). AtmosphericScience Data Center, NASA Surface meteorologyand Solar Energy – Location. Available at:https://eosweb.larc.nasa.gov/cgi-bin/sse/[email protected] [Accessed on10 February 2014].
Barnard, W., (2011) Background to SA ElectrificationProgram [Presentation], Department of Energy,Republic of South Africa. 11 November. Availableat: http://siteresources.worldbank.org/EXTAFRREG-TOPENERGY/Resources/717305-1327690230600/8397692-1327691245128/WolseyBarnard_AEI_Presentation11Nov11.pdf [Accessed on 10 December 2014].
Bongwe K. (2013). Overview of Universal EnergyAccess Strategy [Presentation to StakeholdersConsultation Workshop on Integrated EnergyPlanning Report], Ministry of Energy, Department ofEnergy, Republic of South Africa. 31 October.Available at: http://www.energy.gov.za/files/IEP/DurbanWorkshop/Overview-of-Universal-Energy-Access-Strategy.pdf [Accessed on 10 December2014].
Department of Energy (2011). Integrated Resource Plan2010, Department of Energy, Republic of SouthAfrica. Available at: http://www.doe-irp.co.za/con-tent/IRP2010_updatea.pdf [Downloaded: 10December 2014].
Department of Energy, South Africa (2013). A survey ofenergy related behaviour and perceptions in SouthAfrica, The Residential Sector 2012. Ministry ofEnergy, Department of Energy, Republic of SouthAfrica. Available at:http://www.energy.gov.za/files/media/Pub/Survey%20of%20Energy%20related%20behaviour%20and%20perception%20in%20SA%20-%20Residential%20Sector%20-%202012.pdf[Accessed on 10 December 2014].
Department of Energy, (2013) Integrated EnergyPlanning Report-2012 Department of Energy,Republic of South Africa. Available at:http://www.energy.gov.za/files/IEP/IEP_Publications/Draft-2012-Integrated-Energy-Plan.pdf [Accessed on10 February 2014].
Department of Energy (2014), Department: Energy,Republic of South Africa Available at: www .energy.gov.za, [Accessed on 10 February 2014].
Google Map, (2014) Google Map Available at:https://www.google.de/maps [Accessed on 10February 2014].
International Renewable Energy Agency, (2012) PowerSector, Renewable Energy Technologies: CostAnalysis Series, International Renewable EnergyAgency (IRENA), Volume 1(5), pp. 34. Available at:https://www.irena.org/DocumentDownloads/Publications/RE_Technologies_Cost_Analysis-SOLAR_PV.pdf,[Accessed on 10 February 2014].
Madzhie, L, (2013) Integrated National ElectrificationProgram [Presentation], Department of Energy,Republic of South Africa. 13-June. Available at:http://mfma.treasury.gov.za/Media_Releases/ReviewO
fLGInfrastructureGrants/Documents/Review%20of%20Infrastructure%20Grants%20-%2019th%20March%20Sector%20Workshop/Presentations/DoE%20-%20INEP.pdf [Accessed on 10December 2014].
Municipal Institute of Learning (2013). Toward anIntegrated Urban Development Framework, ADiscussion Document. Municipal Institute ofLearning, Republic of South Africa, available at:http://sacitiesnetwork.co.za/wp-content/uploads/2014/08/urban-policy.pdf [Accessedon 20 January 2014].
Noah, A., (2012). Eskom’s Electrification Program[Presentation to National Electrification Indaba],Distribution Division, Eskom. 15 March. Availableat: https://pmg.org.za/files/131008eskom.ppt[Accessed on 10 December 2014].
Republic of South Africa (2013). Mid-Year PopulationEstimates-2013, Statistical Release-P0302. Availableat:http://beta2.statssa.gov.za/publications/P0302/P03022013.pdf [Accessed on 20 January 2014].
Sustainable, (2014). Sustainable. Available at:http://www.sustainable.co.za/ [Accessed on 10February 2014].
University of South Africa (2012). Income andExpenditure of Households in South Africa, Bureauof Market Research. Information Blurb, University ofSouth Africa. Available at:http://www.unisa.ac.za/contents/faculties/ems/docs/Press429.pdf [Accessed on 10 January 2014].
Uprice (2014). Available at: https://www.uprice.co.za,[Accessed on 10 February 2014].
White, S., and Koopman, S., (2011). Off-grid electrifica-tion in rural areas of South Africa, energize(September 2011), Available at:http://www.ee.co.za/wp-content/uploads/legacy/Energize_2011_/09_SeT_01_Eskom_off-grid.pdf [Accessed on 20 January 2014].
Wind Atlas for South Africa, (2014). Wind Atlas forSouth Africa. Available at:http://www.wasaproject.info/ [Accessed on 10February 2014].
Wind Atlas for South Africa, (2014). Wind Atlas forSouth Africa. Available at: http://www.wasaproject.info/ [Accessed on 10 February 2014].
Workstation Solutions, (2014). Workstation SolutionsAvailable at: http://www.wsol.co.za/genproducts.htm[Accessed on 10 February 2014].
Received May 2014; revised 25 June 2015
Journal of Energy in Southern Africa • Vol 26 No 3 • August 2015 65
Abstract
This paper provides empirical evidence on thedeterminants of energy poverty in South Africanhouseholds using the National Income DynamicsSurvey (NIDS, 2012), while controlling for individ-ual, household and demographic characteristics.This is formulated within a logistic regression frame-work, while defining energy poverty using theexpenditure approach consistent with the definitionby the Department of Energy (DoE) of SouthAfrica. The model reveals that household expendi-ture patterns, race, education level, household anddwelling size, location of the household and accessto electricity are important factors in explaining thestate of energy in South African households. Thispaper also discusses limitations in defining energypoverty using the expenditure approach. Finally,some recommendations are made for regulatorsand policy makers.
Keywords: energy, energy poverty, Logit, SouthAfrica
1. Introduction
South African policies echo the sentiment for ener-gy access through the White Energy Paper (RSA,1998) where it is stated that, “energy security forlow-income households can help reduce poverty,increase livelihoods and improve living standards”(RSA, 1998). Access to energy is important as itleads to an eradication of poverty throughimproved education, health services and may elim-inate structural unemployment (Department ofEnergy, 2009).
The South African government believes thatenergy poverty deepens general poverty and con-tributes to an erosion of health and education out-comes (RSA, 1998). As a result of it being a policyfocus, the country has made strides in addressingenergy poverty. This is evidenced in the MediumTerm Strategic Framework (MTSF, 2009), whichstates that the government aims to, “include,amongst others, diversification of the energy mix inpursuit of renewable energy alternatives and thepromotion of energy efficiency”.
According to the Integrated Energy Plan (IEP)(2013), South Africa has an urban electrificationrate that is around 80% and rural electrificationrates that is around 50%. Eskom is South Africa’selectricity public utility provider and in terms ofelectrical supply is the dominant player; supplying92.8% of the country’s electricity demands. Theremaining 7.2% is supplied by Independent PowerProducers (IPP) from renewable energy sources.
Even though South Africa possesses large elec-trification rates, Ferriel (2010) states that in totalthere are approximately 2.5 million rural and urbanhouseholds in the country not connected to thenational electricity grid, in addition to the millionsthat are connected to the grid but are not able topay for electricity. As a result, even with a high elec-trification rate, households earning low incomescannot afford sufficient electricity to improve theirwelfare (Mapako and Pasad, 2005). Many South
66 Journal of Energy in Southern Africa • Vol 26 No 3 • August 2015
Determinants of energy poverty in South Africa1
Zaakirah Ismail
Patrick KhemboDepartment of Economics and Economics History, Rhodes University, Grahamstown, South Africa
African households predominantly use traditionaland unclean energy resources for many activitiessuch as cooking, lighting and drying of farm pro-duce (Statistics SA, 2008). The attainment of theMillennium Development Goals (MDGs) rests onthe availability and access of affordable energy toall people (Kohler, Rhodes and Vermaak, 2009).Kohler, Rhodes and Vermaak, (2009) believe that inorder to achieve the MDGs, policy needs to bedeveloped to encourage the use of efficient energyat the household level, so that the use of uncleanenergy such as biomass and charcoal is minimised.
The following section provides a literaturereview, which explains the meaning of energyaccess and energy poverty. It ends with an overviewof some of the policy initiatives the South Africangovernment has implemented in order to combatenergy access and energy poverty issues.
2. Literature review
2.1 Energy access
There is a lack of consensus in the literature on whatthe term “energy access” means. One of the rea-sons is that there have been problems in the tech-niques and concepts used to define it (Kohler et al.,2009). For example, definitions that have beenbased on minimum physical levels of cooking orheating are often location specific due to the differ-ence in climatic conditions between different partsof the world (Barnes et al., 2011).
The IEA, in its World Energy Outlook (2009),identified three levels of access to energy servicesdepending on household energy needs and thebenefits energy services provide. These include:1. The minimum level of energy access required by
households to satisfy basic human needs (elec-tricity for lighting, health, education and com-munity services).
2. The energy access required by households toimprove productivity (electricity and modernfuels to improve productivity)
3. The level of energy access required by house-holds to satisfy modern society needs (modernservices for domestic appliances, increasedrequirements for cooking and heating and pri-vate transportation)
Kohler, Rhodes and Vermaak, (2009) describe atheory of transition in which households graduallyascend an “energy ladder. The ladder, beginningwith traditional biomass fuels (firewood and char-coal), moves through to transition fuels (kerosene,coal and charcoal) and then on to modern com-mercial fuels (Liquefied Petroleum Gas (LPG), nat-ural gas, or electricity) as incomes rise and urbani-sation grows (Kohler et al., 2009). According toLeach (1992), during periods of economic growth itis expected that people living within a communitywill switch from using traditional fuels to more mod-
ern fuels such as electricity, due to the industrializa-tion and urbanisation that takes place. This is theenergy transition prevalent in the model and statesthat as a country develops economically, house-holds will convert to more efficient sources of ener-gy.
Hosier and Dowd (1987) conducted empiricalresearch in order to determine which factors have asignificant effect on the energy ladder and factorswhich cause movements up the ladder focusing onpeople’s choice of household cooking fuels inZimbabwe. They found that the choice of fuels wasdetermined by household income, regional ecolog-ical potential, relative fuel prices, household size,and the perceived fuel wood accessibility. Theresults showed that a larger household size wouldcause a transition from wood to kerosene, butdecreases the chances that electricity will be usedover kerosene or wood. Hosier and Dowd (1987)also found that households located in urban areaswere significantly more likely to use kerosene thanwood. When relative per unit price of kerosene washigh compared to the per unit price of electricity,this increased the probability of a household choos-ing electricity over kerosene. Furthermore, house-holds that did not perceive wood as being difficultto collect, preferred wood. The results also showedthat substitutions to more sophisticated energysources, was likely to occur when householdincome rises.
Leach (1992) also investigated the energy tran-sition model. At the time, it was found that in thepoorest developing countries biomass accountedfor 60-95% of total energy consumption. In urbanareas of these countries energy transitions pro-gressed slowly and even slower in rural areas. Forexample in India, urban transitions were quickerwhen there was a rise in relative firewood pricesand an increase in household income. As a result,the use of biomass for cooking and heating fell from42% to 27% (Leach, 1992). These energy transi-tions were driven by the social economic changesthat give households the opportunity to use modernfuels.
Leach (1992) also found that the price of thesefuels is a major barrier in the transition to moremodern fuel sources especially in developing coun-tries where the price variations are greater. A house-hold’s ability in obtaining modern fuels is anothersignificant constraint on the energy transitionmodel. This was observed from the patterns ofhousehold energy use in comparison to the settle-ment size and the distance from major trading cen-tres and roads in rural areas located in India (Leach,1992). In these locations, even the highest incomehouseholds only used biofuel, with maybe kerosenefor lighting. This was the case because more effi-cient fuels could not easily be accessed in small andremote settlements due to the insufficient supply of
Journal of Energy in Southern Africa • Vol 26 No 3 • August 2015 67
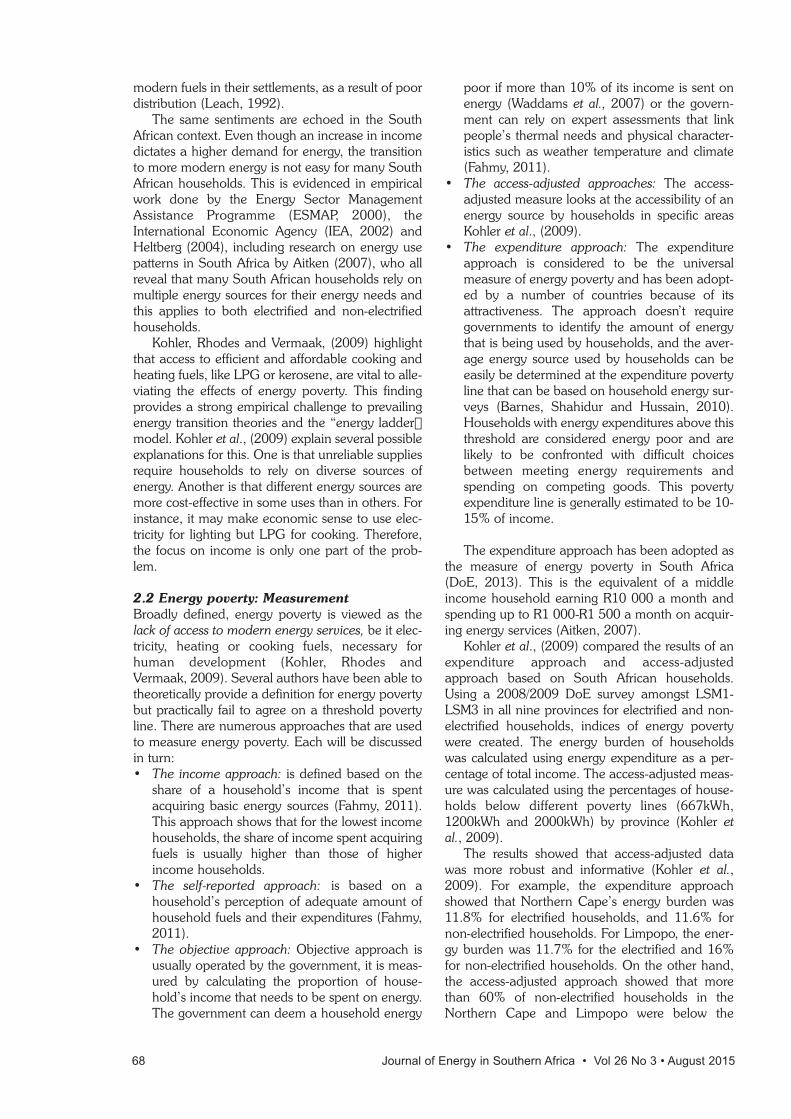
modern fuels in their settlements, as a result of poordistribution (Leach, 1992).
The same sentiments are echoed in the SouthAfrican context. Even though an increase in incomedictates a higher demand for energy, the transitionto more modern energy is not easy for many SouthAfrican households. This is evidenced in empiricalwork done by the Energy Sector ManagementAssistance Programme (ESMAP, 2000), theInternational Economic Agency (IEA, 2002) andHeltberg (2004), including research on energy usepatterns in South Africa by Aitken (2007), who allreveal that many South African households rely onmultiple energy sources for their energy needs andthis applies to both electrified and non-electrifiedhouseholds.
Kohler, Rhodes and Vermaak, (2009) highlightthat access to efficient and affordable cooking andheating fuels, like LPG or kerosene, are vital to alle-viating the effects of energy poverty. This findingprovides a strong empirical challenge to prevailingenergy transition theories and the “energy ladder�model. Kohler et al., (2009) explain several possibleexplanations for this. One is that unreliable suppliesrequire households to rely on diverse sources ofenergy. Another is that different energy sources aremore cost-effective in some uses than in others. Forinstance, it may make economic sense to use elec-tricity for lighting but LPG for cooking. Therefore,the focus on income is only one part of the prob-lem.
2.2 Energy poverty: Measurement
Broadly defined, energy poverty is viewed as thelack of access to modern energy services, be it elec-tricity, heating or cooking fuels, necessary forhuman development (Kohler, Rhodes andVermaak, 2009). Several authors have been able totheoretically provide a definition for energy povertybut practically fail to agree on a threshold povertyline. There are numerous approaches that are usedto measure energy poverty. Each will be discussedin turn:• The income approach: is defined based on the
share of a household’s income that is spentacquiring basic energy sources (Fahmy, 2011).This approach shows that for the lowest incomehouseholds, the share of income spent acquiringfuels is usually higher than those of higherincome households.
• The self-reported approach: is based on ahousehold’s perception of adequate amount ofhousehold fuels and their expenditures (Fahmy,2011).
• The objective approach: Objective approach isusually operated by the government, it is meas-ured by calculating the proportion of house-hold’s income that needs to be spent on energy.The government can deem a household energy
poor if more than 10% of its income is sent onenergy (Waddams et al., 2007) or the govern-ment can rely on expert assessments that linkpeople’s thermal needs and physical character-istics such as weather temperature and climate(Fahmy, 2011).
• The access-adjusted approaches: The access-adjusted measure looks at the accessibility of anenergy source by households in specific areasKohler et al., (2009).
• The expenditure approach: The expenditureapproach is considered to be the universalmeasure of energy poverty and has been adopt-ed by a number of countries because of itsattractiveness. The approach doesn’t requiregovernments to identify the amount of energythat is being used by households, and the aver-age energy source used by households can beeasily be determined at the expenditure povertyline that can be based on household energy sur-veys (Barnes, Shahidur and Hussain, 2010).Households with energy expenditures above thisthreshold are considered energy poor and arelikely to be confronted with difficult choicesbetween meeting energy requirements andspending on competing goods. This povertyexpenditure line is generally estimated to be 10-15% of income.
The expenditure approach has been adopted asthe measure of energy poverty in South Africa(DoE, 2013). This is the equivalent of a middleincome household earning R10 000 a month andspending up to R1 000-R1 500 a month on acquir-ing energy services (Aitken, 2007).
Kohler et al., (2009) compared the results of anexpenditure approach and access-adjustedapproach based on South African households.Using a 2008/2009 DoE survey amongst LSM1-LSM3 in all nine provinces for electrified and non-electrified households, indices of energy povertywere created. The energy burden of householdswas calculated using energy expenditure as a per-centage of total income. The access-adjusted meas-ure was calculated using the percentages of house-holds below different poverty lines (667kWh,1200kWh and 2000kWh) by province (Kohler etal., 2009).
The results showed that access-adjusted datawas more robust and informative (Kohler et al.,2009). For example, the expenditure approachshowed that Northern Cape’s energy burden was11.8% for electrified households, and 11.6% fornon-electrified households. For Limpopo, the ener-gy burden was 11.7% for the electrified and 16%for non-electrified households. On the other hand,the access-adjusted approach showed that morethan 60% of non-electrified households in theNorthern Cape and Limpopo were below the
68 Journal of Energy in Southern Africa • Vol 26 No 3 • August 2015
667kWh energy poverty line, meaning they hadaccess to 667kWh or less per person per year. Usingthe expenditure approach these provinces wereconsiderably not energy poor, but when the type offuels used is considered using access-adjustedapproach these areas were considerably energypoor.
The United Kingdom government defines ener-gy poverty using the objective method and a studyby Fahmy (2011) provides a summary of benefitsrelating to the objective approach. Households thatare defined as being energy poor must spend morethan 10% of their income on all fuel that is used towarm their homes to a decent level. The energypoverty measure focuses on warmth because 25000 people die every winter as a result of coldhomes (Hope, 2013). Fahmy (2011) iterates thatthe advantage of using the objective approach asopposed to the expenditure approach is that it hasthe ability to identify households that are spendingbelow the energy poverty line due to under-con-sumption. As well as being able to estimate the pro-portion of households that will need to spend dis-proportionately in order to maintain the adequatetemperatures in their homes, these households maybe supported by the government (Fahmy, 2011).Compared to the self-reported approach, the objec-tive approach is not subjected to the measurementerror that may result due to changes in wording(Fahmy, 2011). This is because changing the word-ing when conducting subjective surveys is known tochange people’s answers (Tietenberg and Lewis,2012).
The approaches mentioned above each haveadvantages and disadvantages when measuringenergy poverty. It is unlikely that one approach isable address all the concerns. The measure chosenshould be based on the policy objectives that aretrying to be achieved (Fahmy, 2011).
2.3 Policy initiatives in South Africa
Currently, Eskom and the Department of Energy(DoE) are embarking upon endeavours to increasethe electricity supply by commissioning renewableenergy from IPPs. The policy implemented toachieve the commissioning of renewable energyfrom IPPs is the Renewable Energy IndependentPower Producer Procurement Programme (REI4P).The South African government has made massivestrides to ensure that there is sufficient supply tomeet the growing demand of electricity. This will seethe price of electricity increase for South Africanhouseholds connected to the national grid.Furthermore, policy benefits will accrue only tohouseholds connected to the national grid who canafford to pay for the energy supply. This does verylittle for households which are not connected to thegrid.
In July 2003, the government endorsed the Free
Basic Electricity (FBE) policy as a possible solutionthe country’s electrification challenges. According toMvondo (2010), The FBE policy was derived fromthe government decision that was made two yearsprior to provide basic services to poor households,with a priority put on water, energy and sanitationservices (DoE, 2013). The policy compels munici-palities and state owned firms that are in the elec-tricity sector, to supply a certain amount of electric-ity to poor households in the country for free.Households that are already connected to the gridqualify for 50 kWh every month, as this is consid-ered sufficient to satisfy basic energy needs. Off-gridhouseholds are given a R40 subsidy per month thatis paid towards a R58 monthly service fee whichmakes for up to an 80% subsidy, such that thesehouseholds only have to make payments of R18 amonth (DoE, 2013).
Based on a study that was done in Buffalo Cityin the Eastern Cape using a Quality of Life (QoL)survey, Mvondo (2010) found that the FBE policyhad a major social impact on its population. It wasfound that the FBE policy was very limited in theproductive use of electricity as only 34% of thehouseholds were able to run at least one electricitydependent business (Mvondo, 2010). Regardingthe health benefits, it was found that 92% of thehouseholds indicated that they had not experiencedany illness cases in the last 9 months, the study alsoindicated that the electricity usage patterns wererelated to better health practices (Mvondo, 2010).For example, fires that were caused by using can-dles were reduced with better access to electricity.Regarding education, it was found that electricityaccess had a positive effect on the time childrenspent studying in most households, despite this pos-itive impact some households complained that chil-dren would spend more time watching television(Mvondo, 2010).
Ferriel (2010) conducted a qualitative studybased on 30 households to see if the 50kWh on theFBE was sufficient. Households were asked the fol-lowing two questions: 1) is the 50kWh of FBE suffi-cient? And 2) what amount of free electricity is rea-sonable? The results showed that only 25% felt thatthe 50kWh was sufficient but this had to be usedwith other energy sources. It also illustrated that onaverage households used up to 750kWk per month.This means that the free allocation was only 6.6%of monthly electricity use.
Ferriel (2010) concluded that the objective ofthe policy marginally improves the lives of the poor,removing the health risks of using wood for cook-ing. However, given that the 50kWh amount stillrequires many households to use other energysources, it cannot improve people’s lives especiallyfor those living in urban areas. The FBE policy alsostates that homes applying for FBE need to be fittedwith a pre-paid meter, and then vouchers have to
Journal of Energy in Southern Africa • Vol 26 No 3 • August 2015 69
be used in order to access the free based allowance(Mvondo, 2010). This further creates inequality asthe poor are often unable to buy vouchers due tothe uncertainty of incomes in poor households. Thepolicy also states that electricity demand for poorhouseholds could be met by restricting the currentsupply to 20 amps (Ferriel, 2010). This limited 20Amp restriction creates an inconvenience to lowincome as it limits the number of domestic tasksthey are to perform. Mvondo (2010) also recom-mended that social education programmes shouldbe implemented together with FBE in order torestrict the negative social effects of having electric-ity.
In 2008, the DoE implemented an Incline BlockTariff (IBT). IBTs divide the electricity price into sev-eral steps or blocks. The first block of electricity is atthe lowest price. As the customer purchases moreelectricity during the month, the electricity boughtwill eventually fall in block two, which is a bit moreexpensive. This process repeats automatically as thecustomer purchases further electricity to move intoblock 2. At the end of the month, the history is resetand the customer will again start the next monthfrom block 1. The process to move from the oneblock to the next is automatic and depends only onthe amount of electricity that is acquired by the cus-tomer. The movement to the next block is not at allaffected whether the purchases are spread overmany transactions or if all the electricity is part ofone transaction. Because the blocks increase in theprice, customers can save money by not buyingmore electricity than what they will use during themonth. It is much better to wait until the next monthand start to buy again at the low price (DoE, 2013).
This paper seeks to add to the energy povertyliterature and build and extend on the work byIsmail (2015) by empirically measuring energypoverty as defined by the DoE. More importantly,this paper empirically tests for determinants associ-ated with energy poverty amongst households. Thisis discussed in detail in the sections that follow.Therefore, the main goals of the paper are as fol-lows (Ismail, 2015):1. Estimating energy poverty of households using
the expenditure approach as defined by theDepartment of Energy of South Africa (DoE).
2. Constructing a logistic (logit) regression model ofthe determinants of energy poverty using themeasure of energy poverty developed in 1) as adependent variable.
The data is drawn from the National IncomeDynamics Survey (2012) since it provides detailedinformation of income and expenditures of house-holds, as well as individual, household and demo-graphic characteristics of South African households.
The paper is organised as follows: Section 3describes the data used, including a description of
variables used in estimation. Section 4 presents themeasurement of energy poverty and the methodol-ogy for logistic regression analysis. Section 5 pres-ents the results of the estimation and tests to ensurethe predictive power of the model. Section 6 talksabout the limitations of the energy poverty meas-urement in estimation. Section 7 provides policyrecommendations for regulators and policy makers.Lastly, section 8 concludes.
3. Data
The National Income Dynamic Survey (NIDS, wave3, 2012) is used for estimation in the logit regressionanalysis. The NIDS dataset is by nature an individ-ual dataset and each individual is tracked with aunique identification number across each of thethree waves. There are various questionnaires thatconsist of the NIDS data: including an individual,child, proxy and household questionnaire. Eachhousehold is tracked with a household identifica-tion number. This is unique within a wave, but notunique across the three waves. For this reason,household transitions in and out of energy povertycan be tracked at a particular point in time.However, it is difficult to track over time. Therefore,analysis of individuals is done at the householdlevel using only wave 3. Each questionnaire is struc-tured and given to the individual in the householdto be used for the collection of information. Thehousehold questionnaire is typically answered bythe oldest female in the household. The question-naire has a set of questions on variables such asgender, marital status, household size, dwelling size,location of the household, education, and energyuse, and income and expenditure patterns of thehousehold, amongst others (NIDS, 2012).
This paper only focuses on relevant informationfrom individuals in households needed to conductthis study. It follows the empirical work done byDunga, Grobler and Tchereni, (2013) and buildsand extends on the work by Ismail (2015) to esti-mate energy poverty and its determinants amongSouth African households. First, energy poverty iscalculated for each of the individuals in the house-holds using the expenditure approach. This allowsus to determine the number of individuals in house-holds below the expenditure energy poverty linewithin the sample (households spending more than10% of their income on energy sources). Second, adiscrete choice analysis using a logistic model isadopted to analyse determinants of energy poverty.Below are some statistics which describe the datasetused in the analysis.
3.1 Descriptive statistics
The sample used for estimation is comprised 6 961households and 29 918 individuals. Table 1 showsthat of the individuals in the sample, close to 25%live in energy poverty as defined by the expenditure
70 Journal of Energy in Southern Africa • Vol 26 No 3 • August 2015
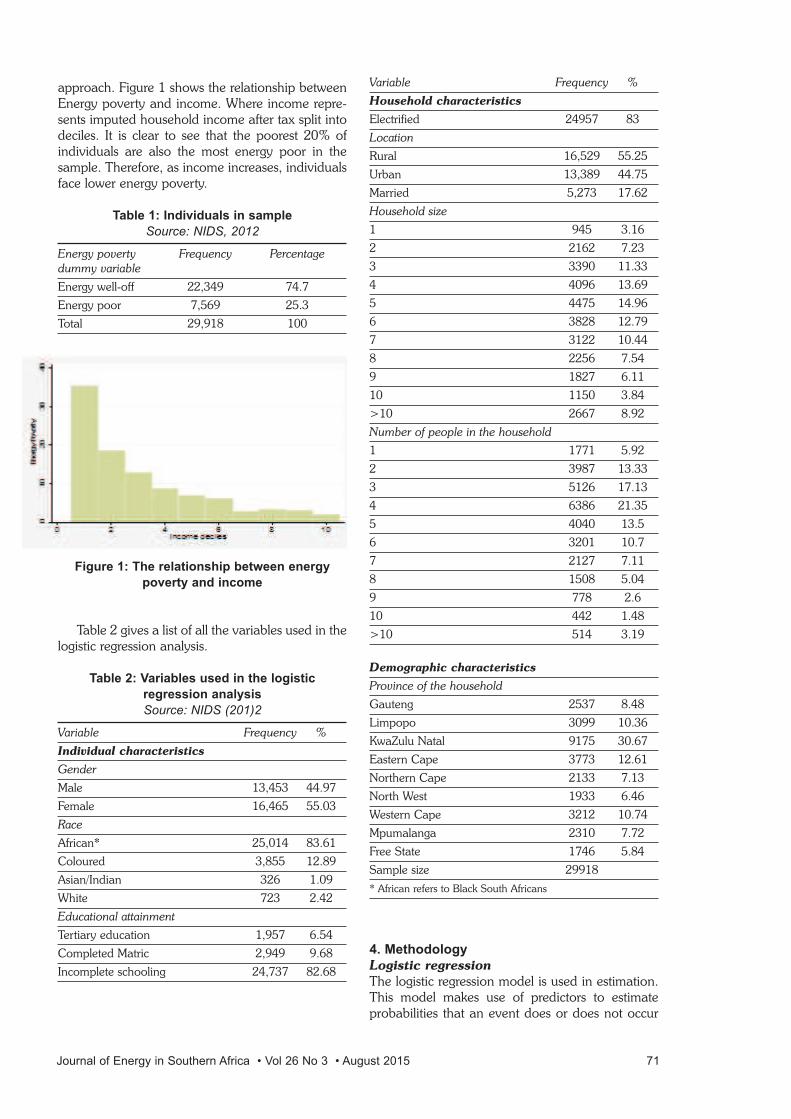
approach. Figure 1 shows the relationship betweenEnergy poverty and income. Where income repre-sents imputed household income after tax split intodeciles. It is clear to see that the poorest 20% ofindividuals are also the most energy poor in thesample. Therefore, as income increases, individualsface lower energy poverty.
Table 1: Individuals in sample
Source: NIDS, 2012
Energy poverty Frequency Percentagedummy variable
Energy well-off 22,349 74.7
Energy poor 7,569 25.3
Total 29,918 100
Figure 1: The relationship between energy
poverty and income
Table 2 gives a list of all the variables used in thelogistic regression analysis.
Table 2: Variables used in the logistic
regression analysis
Source: NIDS (201)2
Variable Frequency %
Individual characteristics
Gender
Male 13,453 44.97
Female 16,465 55.03
Race
African* 25,014 83.61
Coloured 3,855 12.89
Asian/Indian 326 1.09
White 723 2.42
Educational attainment
Tertiary education 1,957 6.54
Completed Matric 2,949 9.68
Incomplete schooling 24,737 82.68
Variable Frequency %
Household characteristics
Electrified 24957 83
Location
Rural 16,529 55.25
Urban 13,389 44.75
Married 5,273 17.62
Household size
1 945 3.16
2 2162 7.23
3 3390 11.33
4 4096 13.69
5 4475 14.96
6 3828 12.79
7 3122 10.44
8 2256 7.54
9 1827 6.11
10 1150 3.84
>10 2667 8.92
Number of people in the household
1 1771 5.92
2 3987 13.33
3 5126 17.13
4 6386 21.35
5 4040 13.5
6 3201 10.7
7 2127 7.11
8 1508 5.04
9 778 2.6
10 442 1.48
>10 514 3.19
Demographic characteristics
Province of the household
Gauteng 2537 8.48
Limpopo 3099 10.36
KwaZulu Natal 9175 30.67
Eastern Cape 3773 12.61
Northern Cape 2133 7.13
North West 1933 6.46
Western Cape 3212 10.74
Mpumalanga 2310 7.72
Free State 1746 5.84
Sample size 29918
* African refers to Black South Africans
4. Methodology
Logistic regression
The logistic regression model is used in estimation.This model makes use of predictors to estimateprobabilities that an event does or does not occur
Journal of Energy in Southern Africa • Vol 26 No 3 • August 2015 71
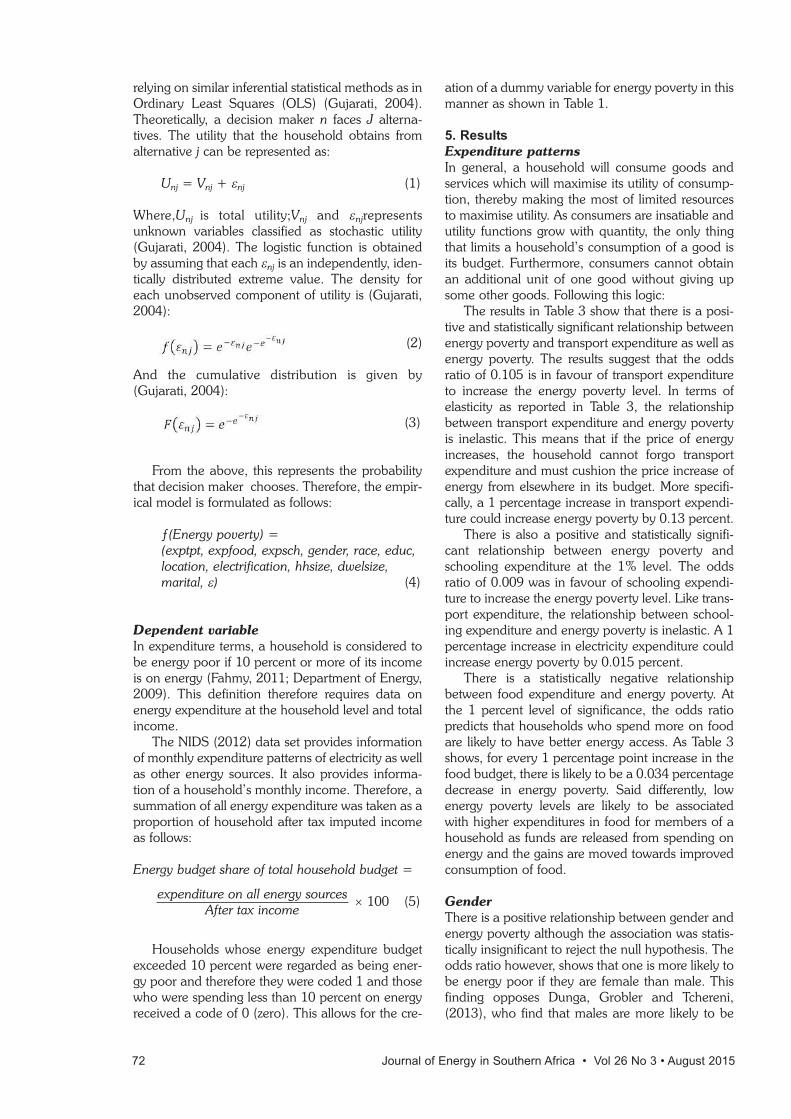
relying on similar inferential statistical methods as inOrdinary Least Squares (OLS) (Gujarati, 2004).Theoretically, a decision maker n faces J alterna-tives. The utility that the household obtains fromalternative j can be represented as:
Unj = Vnj + εnj (1)
Where,Unj is total utility;Vnj and εnjrepresentsunknown variables classified as stochastic utility(Gujarati, 2004). The logistic function is obtainedby assuming that each εnj is an independently, iden-tically distributed extreme value. The density foreach unobserved component of utility is (Gujarati,2004):
(2)
And the cumulative distribution is given by(Gujarati, 2004):
(3)
From the above, this represents the probabilitythat decision maker chooses. Therefore, the empir-ical model is formulated as follows:
ƒ(Energy poverty) = (exptpt, expfood, expsch, gender, race, educ, location, electrification, hhsize, dwelsize, marital, ε) (4)
Dependent variable
In expenditure terms, a household is considered tobe energy poor if 10 percent or more of its incomeis on energy (Fahmy, 2011; Department of Energy,2009). This definition therefore requires data onenergy expenditure at the household level and totalincome.
The NIDS (2012) data set provides informationof monthly expenditure patterns of electricity as wellas other energy sources. It also provides informa-tion of a household’s monthly income. Therefore, asummation of all energy expenditure was taken as aproportion of household after tax imputed incomeas follows:
Energy budget share of total household budget =
× 100 (5)
Households whose energy expenditure budgetexceeded 10 percent were regarded as being ener-gy poor and therefore they were coded 1 and thosewho were spending less than 10 percent on energyreceived a code of 0 (zero). This allows for the cre-
ation of a dummy variable for energy poverty in thismanner as shown in Table 1.
5. Results
Expenditure patterns
In general, a household will consume goods andservices which will maximise its utility of consump-tion, thereby making the most of limited resourcesto maximise utility. As consumers are insatiable andutility functions grow with quantity, the only thingthat limits a household’s consumption of a good isits budget. Furthermore, consumers cannot obtainan additional unit of one good without giving upsome other goods. Following this logic:
The results in Table 3 show that there is a posi-tive and statistically significant relationship betweenenergy poverty and transport expenditure as well asenergy poverty. The results suggest that the oddsratio of 0.105 is in favour of transport expenditureto increase the energy poverty level. In terms ofelasticity as reported in Table 3, the relationshipbetween transport expenditure and energy povertyis inelastic. This means that if the price of energyincreases, the household cannot forgo transportexpenditure and must cushion the price increase ofenergy from elsewhere in its budget. More specifi-cally, a 1 percentage increase in transport expendi-ture could increase energy poverty by 0.13 percent.
There is also a positive and statistically signifi-cant relationship between energy poverty andschooling expenditure at the 1% level. The oddsratio of 0.009 was in favour of schooling expendi-ture to increase the energy poverty level. Like trans-port expenditure, the relationship between school-ing expenditure and energy poverty is inelastic. A 1percentage increase in electricity expenditure couldincrease energy poverty by 0.015 percent.
There is a statistically negative relationshipbetween food expenditure and energy poverty. Atthe 1 percent level of significance, the odds ratiopredicts that households who spend more on foodare likely to have better energy access. As Table 3shows, for every 1 percentage point increase in thefood budget, there is likely to be a 0.034 percentagedecrease in energy poverty. Said differently, lowenergy poverty levels are likely to be associatedwith higher expenditures in food for members of ahousehold as funds are released from spending onenergy and the gains are moved towards improvedconsumption of food.
Gender
There is a positive relationship between gender andenergy poverty although the association was statis-tically insignificant to reject the null hypothesis. Theodds ratio however, shows that one is more likely tobe energy poor if they are female than male. Thisfinding opposes Dunga, Grobler and Tchereni,(2013), who find that males are more likely to be
72 Journal of Energy in Southern Africa • Vol 26 No 3 • August 2015
expenditure on all energy sourcesAfter tax income
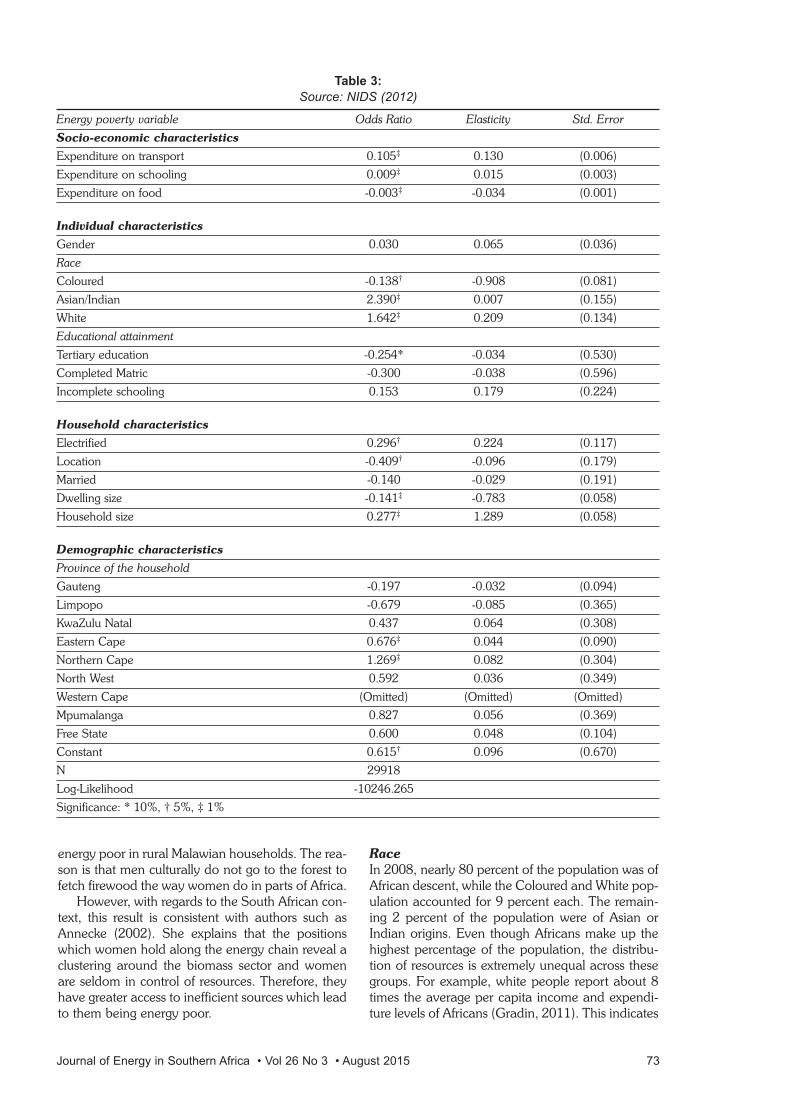
energy poor in rural Malawian households. The rea-son is that men culturally do not go to the forest tofetch firewood the way women do in parts of Africa.
However, with regards to the South African con-text, this result is consistent with authors such asAnnecke (2002). She explains that the positionswhich women hold along the energy chain reveal aclustering around the biomass sector and womenare seldom in control of resources. Therefore, theyhave greater access to inefficient sources which leadto them being energy poor.
Race
In 2008, nearly 80 percent of the population was ofAfrican descent, while the Coloured and White pop-ulation accounted for 9 percent each. The remain-ing 2 percent of the population were of Asian orIndian origins. Even though Africans make up thehighest percentage of the population, the distribu-tion of resources is extremely unequal across thesegroups. For example, white people report about 8times the average per capita income and expendi-ture levels of Africans (Gradin, 2011). This indicates
Journal of Energy in Southern Africa • Vol 26 No 3 • August 2015 73
Table 3:
Source: NIDS (2012)
Energy poverty variable Odds Ratio Elasticity Std. Error
Socio-economic characteristics
Expenditure on transport 0.105‡ 0.130 (0.006)
Expenditure on schooling 0.009‡ 0.015 (0.003)
Expenditure on food -0.003‡ -0.034 (0.001)
Individual characteristics
Gender 0.030 0.065 (0.036)
Race
Coloured -0.138† -0.908 (0.081)
Asian/Indian 2.390‡ 0.007 (0.155)
White 1.642‡ 0.209 (0.134)
Educational attainment
Tertiary education -0.254* -0.034 (0.530)
Completed Matric -0.300 -0.038 (0.596)
Incomplete schooling 0.153 0.179 (0.224)
Household characteristics
Electrified 0.296† 0.224 (0.117)
Location -0.409† -0.096 (0.179)
Married -0.140 -0.029 (0.191)
Dwelling size -0.141‡ -0.783 (0.058)
Household size 0.277‡ 1.289 (0.058)
Demographic characteristics
Province of the household
Gauteng -0.197 -0.032 (0.094)
Limpopo -0.679 -0.085 (0.365)
KwaZulu Natal 0.437 0.064 (0.308)
Eastern Cape 0.676‡ 0.044 (0.090)
Northern Cape 1.269‡ 0.082 (0.304)
North West 0.592 0.036 (0.349)
Western Cape (Omitted) (Omitted) (Omitted)
Mpumalanga 0.827 0.056 (0.369)
Free State 0.600 0.048 (0.104)
Constant 0.615† 0.096 (0.670)
N 29918
Log-Likelihood -10246.265
Significance: * 10%, † 5%, ‡ 1%
a stark inequality between the races.The results in Table 3 highlight this, as African
people are more energy poor than white andAsian/Indian people. These results are significant atthe 1% level. It was also found that Coloured peo-ple are more likely to be in energy poverty com-pared to African people. This was found to be sig-nificant at the 5% level. Differences of povertybetween races can be explained by unequal accessto education, family planning, or the labour market,or by the fact that they live in more deprived areas(Gradin, 2011). Each of these factors is likely toaffect the income of an individual and contributetowards higher energy poverty.
Educational attainment
At the 10% level, education of the members of thehousehold was statistically significant if they had atertiary level education. It was also found that pos-session of a matric certificate also reduced energypoverty. However, this finding is statistically insignif-icant. There is a negative relationship between levelof education and energy poverty. This is expected,since higher education levels are associated withhigher income levels and therefore the energy sharein the expenditure budget should be smaller. Theodds ratio obtained in the regression output, sup-ports this finding. Furthermore, it shows that anindividual’s completion of tertiary educationreduces energy poverty by 0.034 percent. The find-ings also indicate that having incomplete schoolingincreases energy poverty. Even though this findingis not significant, it highlights the importance of acomplete education for increased income and actsas a strong determinant of energy poverty.
Based on a study in a rural area in Assam, India,Kanagawa and Nakata (2008) investigated the rela-tionship between energy access and the improvingsocio-economic conditions affecting rural areas indeveloping countries. They found education to bethe most essential component for poverty reduc-tion. Kanagawa and Nakata (2008) explain thatpoor households are not able to complete their sec-ondary schooling because financial constraints donot allow them to pay the needed educationalexpenditures. Education therefore affects energypoverty as low education rates hamper people’shousehold incomes as a result aren’t able to affordmodern energy services causing energy poverty.
Marital status
On marital status, the relationship was negative sug-gesting that homes with married couples or com-mitted partners were less likely to be energy poorthan those who were not. The reason for this couldbe that married couples combine their income andshare the expenses of the household, includingenergy expenditure. However, this relationship isnot significant.
Household and dwelling size
The higher the number of people residing in thehousehold, the higher the incidence of energypoverty. The odds were that it was more likely for ahousehold with more members to be energy poorthan those with less members. This could bebecause as the number of household membersincrease, a fixed household budget must be distrib-uted amongst more people – thus, increasing ener-gy poverty. This relationship is statistically signifi-cant at the 1% level.
There was a negative relationship between thesize of the dwelling unit and energy poverty. Thisrelationship is statistically significant at the 1% level.The negative relationship suggests that individualsdwelling in larger houses were less likely to be ener-gy poor compared to those living in smaller units.One reason to explain this, is that the larger yourincome, the larger your household, therefore onehas more access to more modern energy sourcesIsmail (2015).
Demographic characteristics
In terms of the demographic characteristics, theWestern Cape was dropped in the regression due tocollinearity with the other variables in the regres-sion. All provinces exhibited a positive relationshipwith energy poverty, except for Gauteng andLimpopo. This means that households situated inthese provinces are more likely to be energy poor.However, of these four provinces, only the EasternCape and the Northern Cape displayed statisticalsignificance at the 1% level. Kohler, Rhodes andVermaak, (2009) found that the Eastern Cape isone of the provinces with the lowest electrificationrates in South Africa. Furthermore, this could alsosignal structural issues inherent within theseprovinces with regard to energy access.
Gauteng and Limpopo exhibit a negative rela-tionship with energy poverty. This means thathouseholds situated in these provinces are less like-ly to be energy poor. However, only Gautengprovince is statistically significant at the 5% level. Ofall the provinces, Gauteng is the most urbanizedand this could mean that inhabitants have moreaccess to cleaner and cheaper energy sources.
The results also show that households who areelectrified are more likely to be energy poor thanhouseholds who are not. This is significant at the5% level. This is an interesting result, as access toelectricity does not necessarily mean one will be lessenergy poor. This reflects the unaffordability of elec-tricity as lower income households cannot neces-sarily afford electricity provided by the nationalgrid, even though they might have access to it.
Lastly, there is a location dummy, which indi-cates that households situated in rural areas inSouth Africa are more likely to be energy poor thanhouses situated in urban areas. This could mean
74 Journal of Energy in Southern Africa • Vol 26 No 3 • August 2015
firstly that, households in urban areas have accessto better jobs and therefore higher incomes, suchthat they can afford energy. Second, rural house-holds are slower in transitioning up the energy lad-der and have access to less efficient energy sourcesthat cost more than cleaner energy.
5.1 Evaluation of the energy poverty
regression model
Logistic analysis relies on other statistics to analysethe reliability of any model (Gujarati, 2004). TheLog-Likelihood Ratio test is distributed as a Chi-Square and is computed to test the overall per-formance of the model (Gujarati, 2004). The Chi-Square statistic was 2332.84 and it was statisticallysignificant. Thus, the null hypothesis that the over-all explanatory power of the model could not berelied upon was rejected. The predictors in the logis-tic regression were collectively important in explain-ing the behaviour of energy poverty in SouthAfrican households.
The Pseudo R-squared was 62 percent implyingthat the model explained about 62 percent of thedeviations in the probability of energy poverty.
A further goodness of fit test that is recommend-ed for logistic regressions in the literature is theHosmer-Lomeshow (HL) Chi-square statistic (Ping,Lee & Ingersoll, 2002; Gujarati, 2004). The statisticis distributed as a Pearson Chi-square and is evalu-ated through a log-likelihood estimation calculatedfrom a 2 x g table of observed and expected fre-quencies, where g is the number of groups formedfrom expected probabilities of each one of theobservations (Gujarati, 2004). This test was con-ducted based on the results in Table 3 and the nullhypothesis that the model was a good fit to explainthe deviations in the behaviour of energy poverty isaccepted even at the 10 percent level of signifi-cance. The value of the HL statistic was 32.1 withthe probability to accept the null hypothesis ofabout 91 percent.
6. Limitations when defining energy poverty
The measure of energy poverty based solely onhousehold expenditures can be problematicbecause poor households in countries such asSouth Africa typically rely on cheap but inferior bio-mass for their energy needs. As a result, estimatingenergy poverty in the way above can underestimatethe extent of energy poverty in households (Kohler,Rhodes and Vermaak, 2009).
Kohler, Rhodes and Vermaak, (2009) put for-ward the following example: If households X and Yboth spend 15% of their income on energy, thenthe way in which the expenditure approach isdefined above will classify both households asbeing equally poor. However, they explain that ifthe type of energy used is taken into account: If itwas found that X uses paraffin and candles, while Y
uses electricity, then Y obtains a better use of quan-tity which is more useful since electricity is a moreefficient energy source. Therefore, X must be classi-fied as poorer than Y, by taking into account thequantity of energy used by the household, ratherthan just its cost. Furthermore, if household X nowgains access to free basic electricity (FBE), it shouldbe classified as less poor than it was before but itspoverty status would not change if energy povertyis defined according to the expenditure approach.
The reader should note that even though thisstudy is consistent with the DoE’s interpretation ofenergy poverty, more efficient results can beachieved if quantity of electricity is taken intoaccount in household expenditure/income data aswell as information on FBE at the household level.Neither the General Household Survey (GHS) northe NIDS data as used in this study allow for thisinformation to be incorporated. This then leads torecommendations in the following section.
7. Recommendations
The policy recommendations are based on theresults found in section 5. Households can be madeless poor by simply making all energy cheaper ifone solely looks at the expenditure approach.However, more rigorous analysis must be done bydissecting energy sources that South Africans relyon. With regard to the analysis done in this paper,this could not be done across each of the waves inthe NIDS dataset as households do not have uniqueidentification numbers across the three waves.Therefore, the expenditure approach becomesmore attractive as it allows measurability of energypoverty.
With regards to electrified households, theNational Energy Regulator of South Africa(NERSA) and the DoE can play an important rolein the determination of prices that individuals face,for the following reason:
As highlighted by Ismail, Mabuza, Xolo andPillay (2014): Allowable Revenue (AR) of a stateowned enterprise such as such as Eskom hugelyinfluences the amount of revenue the entity is enti-tled to receive as determined by the regulator(NERSA). The tariff decision of NERSA is normallybased on the amount of revenue that would rea-sonably be required to recover a set of costs includ-ed in the regulated asset base (RAB) amongst oth-ers (AER, 2011).
Allowable revenue (AR) = (RAB ´ WACC) + D + E + +C + F (6)
Tariff = Allowable revenue/ Quantity of out-put sold by the regulated entity (7)
Where: The RAB is the cumulative historical invest-ment made by the utility. The weighted average
Journal of Energy in Southern Africa • Vol 26 No 3 • August 2015 75
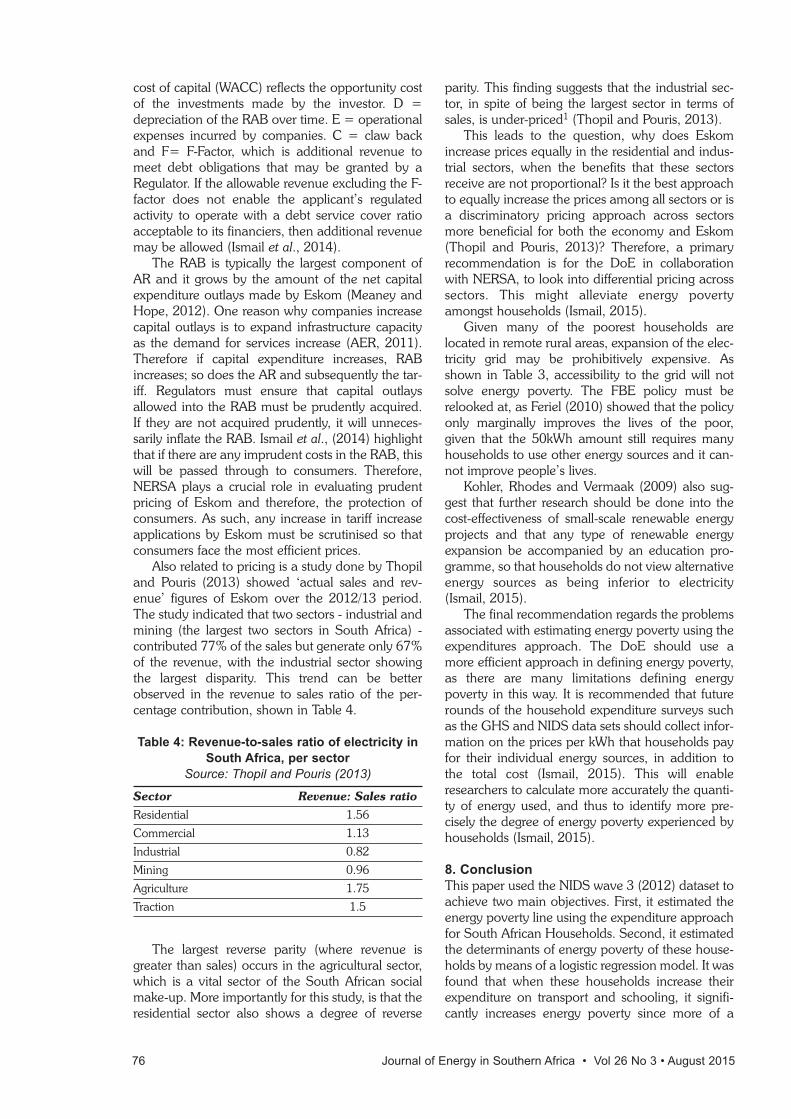
cost of capital (WACC) reflects the opportunity costof the investments made by the investor. D =depreciation of the RAB over time. E = operationalexpenses incurred by companies. C = claw backand F= F-Factor, which is additional revenue tomeet debt obligations that may be granted by aRegulator. If the allowable revenue excluding the F-factor does not enable the applicant’s regulatedactivity to operate with a debt service cover ratioacceptable to its financiers, then additional revenuemay be allowed (Ismail et al., 2014).
The RAB is typically the largest component ofAR and it grows by the amount of the net capitalexpenditure outlays made by Eskom (Meaney andHope, 2012). One reason why companies increasecapital outlays is to expand infrastructure capacityas the demand for services increase (AER, 2011).Therefore if capital expenditure increases, RABincreases; so does the AR and subsequently the tar-iff. Regulators must ensure that capital outlaysallowed into the RAB must be prudently acquired.If they are not acquired prudently, it will unneces-sarily inflate the RAB. Ismail et al., (2014) highlightthat if there are any imprudent costs in the RAB, thiswill be passed through to consumers. Therefore,NERSA plays a crucial role in evaluating prudentpricing of Eskom and therefore, the protection ofconsumers. As such, any increase in tariff increaseapplications by Eskom must be scrutinised so thatconsumers face the most efficient prices.
Also related to pricing is a study done by Thopiland Pouris (2013) showed ‘actual sales and rev-enue’ figures of Eskom over the 2012/13 period.The study indicated that two sectors - industrial andmining (the largest two sectors in South Africa) -contributed 77% of the sales but generate only 67%of the revenue, with the industrial sector showingthe largest disparity. This trend can be betterobserved in the revenue to sales ratio of the per-centage contribution, shown in Table 4.
Table 4: Revenue-to-sales ratio of electricity in
South Africa, per sector
Source: Thopil and Pouris (2013)
Sector Revenue: Sales ratio
Residential 1.56
Commercial 1.13
Industrial 0.82
Mining 0.96
Agriculture 1.75
Traction 1.5
The largest reverse parity (where revenue isgreater than sales) occurs in the agricultural sector,which is a vital sector of the South African socialmake-up. More importantly for this study, is that theresidential sector also shows a degree of reverse
parity. This finding suggests that the industrial sec-tor, in spite of being the largest sector in terms ofsales, is under-priced1 (Thopil and Pouris, 2013).
This leads to the question, why does Eskomincrease prices equally in the residential and indus-trial sectors, when the benefits that these sectorsreceive are not proportional? Is it the best approachto equally increase the prices among all sectors or isa discriminatory pricing approach across sectorsmore beneficial for both the economy and Eskom(Thopil and Pouris, 2013)? Therefore, a primaryrecommendation is for the DoE in collaborationwith NERSA, to look into differential pricing acrosssectors. This might alleviate energy povertyamongst households (Ismail, 2015).
Given many of the poorest households arelocated in remote rural areas, expansion of the elec-tricity grid may be prohibitively expensive. Asshown in Table 3, accessibility to the grid will notsolve energy poverty. The FBE policy must berelooked at, as Feriel (2010) showed that the policyonly marginally improves the lives of the poor,given that the 50kWh amount still requires manyhouseholds to use other energy sources and it can-not improve people’s lives.
Kohler, Rhodes and Vermaak (2009) also sug-gest that further research should be done into thecost-effectiveness of small-scale renewable energyprojects and that any type of renewable energyexpansion be accompanied by an education pro-gramme, so that households do not view alternativeenergy sources as being inferior to electricity(Ismail, 2015).
The final recommendation regards the problemsassociated with estimating energy poverty using theexpenditures approach. The DoE should use amore efficient approach in defining energy poverty,as there are many limitations defining energypoverty in this way. It is recommended that futurerounds of the household expenditure surveys suchas the GHS and NIDS data sets should collect infor-mation on the prices per kWh that households payfor their individual energy sources, in addition tothe total cost (Ismail, 2015). This will enableresearchers to calculate more accurately the quanti-ty of energy used, and thus to identify more pre-cisely the degree of energy poverty experienced byhouseholds (Ismail, 2015).
8. Conclusion
This paper used the NIDS wave 3 (2012) dataset toachieve two main objectives. First, it estimated theenergy poverty line using the expenditure approachfor South African Households. Second, it estimatedthe determinants of energy poverty of these house-holds by means of a logistic regression model. It wasfound that when these households increase theirexpenditure on transport and schooling, it signifi-cantly increases energy poverty since more of a
76 Journal of Energy in Southern Africa • Vol 26 No 3 • August 2015
household’s budget is allocated away from energyspending. Food expenditure has the opposite effect.If individuals within the household possessed edu-cation at the tertiary level, it significantly decreasesenergy poverty since education increases income.African people are more likely to be energy poorthan White and Asian/ Indian people, but not sig-nificantly more than Coloured people. This high-lights stark inequality between the different races.This paper also finds that larger households weresignificantly less likely to be energy poor but house-holds with more inhabitants within it are more like-ly to be energy poor.
Households who were connected to the nation-al electrical grid were found to be more energypoor. This is an interesting finding as it highlightsthe fact that connectivity is only one part of theproblem. Affordability of basic services is an issuethat needs to be addressed. Households situated inrural areas were found to be more energy poor thanhouseholds in urban areas. Lastly, it seems that theprovinces with the highest significant energy pover-ty rates are the Northern Cape and the EasternCape.
This paper acknowledges the limitations of esti-mating energy poverty using the expenditureapproach as it does not incorporate energy efficien-cy or FBE. This paper was unable to incorporatethese elements because of unavailability of data atthe household level within the NIDS (2012) dataset. Therefore, this paper ends with recommenda-tions to government as well as regulators.Regulators and government agencies should ensureelectricity is efficiently priced and also look into dif-ferential pricing across sectors. Current policies suchas the FBE policy must be revised, such that it con-tributes towards more intensive energy povertyeradication. Furthermore, accessibility and afford-ability of efficient energy sources such as electricityshould be made available to all South Africans. Thisis an expensive notion – therefore, this paper sug-gests that education campaigns around renewableenergy options must be made available to poorerhouseholds. Further, the DoE should use a moreefficient approach in defining energy poverty.Lastly, in order for a more accurate estimation ofenergy poverty using household data sets shouldincorporate data on pricing and quantity of differentenergy sources and information on free basic elec-tricity, so that more accurate results can be obtainedin the future.
Notes
1. This paper builds and extends on the work done byIsmail, Z. (2015). An Empirical Estimation of EnergyPoverty in Poor South African Households. Journal ofEconomics and Sustainable Development, Vol. 6 No.13, 2015.
2. One of the primary reasons for standing contractual
agreements between Eskom and large industrial userssuch as mines. These contracts are equally beneficialfor both entities: large industrial users contribute tothe largest section of revenue for the utility whilebeing able to keep their utility costs low
ReferencesAustralian Energy Regulator (AER) (2011). How are the
Electricity Prices set in Australia.Aitken, R. (2007). Household Energy Use: a comparison
of household energy consumption and expenditureacross three provinces. Journal of Energy inSouthern Africa, 18(1).
Annecke, W. (2002). The rich get richer and the poorget renewables: the WSSD, energy and women, amalevolent perspective. Agenda: EmpoweringWomen for Gender Equity. 52:8-16.
Barnes, Douglas F., Shahidur R. Khandker, and HussainA. Samad., (2011). Energy poverty in ruralBangladesh. Energy Policy. 39(2): 894-904.
Department of Energy (2009). Socio-Economic Impactof Electrification: Household Perspective 2009.
Department of Energy. (2013). A Survey of EnergyRelated Behaviour and Perceptions in South Africa.[Online] Department of Energy. Available:http://www.energy.gov.za/files/media/Pub/DoE-2013-Survey-of-EnergyRelated-Behaviour-and-Perception-in-SA.pdf [Accessed 15 May 2014].
Department of Energy (DoE) (2013). IntegratedResource Plan for Electricity (IRP) 2010-2030.Update Report 2013. Pretoria: Department ofEnergy.
Department of Minerals and Energy (2001). Guidelinesto the National Electrification Planning.
Dunga, S. H. Grobler, W. and Tchereni, B. H. M.(2013). Economic Analysis of Energy Poverty inSouth Lunzu, Malawi. Journal of Economics andSustainable Development. Vol. 4, No. 2013.
ESMAP. (2000). Energy and Development Report 2000- Energy Services for the World’s Poor. The WorldBank. GSSD (2006), Gauteng Strategy forSustainable Development: State of Play Report[Online].
Fahmy, E. (2011). The definition and measurement offuel poverty. A briefing paper to inform consumerfocus’s submission to the Hills fuel poverty review,University of Bristol.
Ferriel, A. (2010). Free basic electricity. A better life forall. Johannesburg: Earthlife Africa.
Gradin, C. (2011). Race, poverty, and deprivation inSouth Africa. Society for the Study of EconomicInequality. Working paper series ENCINEQ WP2011-24.
Gujarati, D. N. (2004). Basic Econometrics, 4th Edition.Mac Gaw-Hill, London.
Heltberg, R. (2003). Household Fuel and Energy Use inDeveloping Countries – A Multi-country Study. TheWorld Bank.
Hosier, R. and Dowd, J. (1987). Household fuel choicein Zimbabwe: an empirical test of the energy ladderhypothesis. Resources and Energy. 9 (4): 347-361.
International Energy Agency (IEA) (2009). World
Journal of Energy in Southern Africa • Vol 26 No 3 • August 2015 77
Energy Outlook, 2009International Energy Agency (IEA) (2002). World
Energy Outlook, 2002.Ismail, Z. (2015). An Empirical Estimation of Energy
Poverty in Poor South African Households. Journalof Economics and Sustainable Development. Vol. 6,No. 13, 2015.
Ismail, Z., Mabuza, P., Pillay, K., and Xolo, S. (2014).Infrastructure development within a regulated envi-ronment: concerns for regulators. Journal ofEconomic and Financial Sciences. 7(S):569-586.
Kanagawa, M. and Nakata, T. (2008). Assessment ofaccess to electricity and the socio-economic impactsin rural areas of developing countries. Energy Policy.36 (6): 2016-2029.
Kohler, M., Rhodes, B. and Vermaak, C. (2009).Developing an Energy-Based Poverty Line for SouthAfrica. Journal of Interdisciplinary Economics.
Leach, G. (1992). The energy transition. Energy Policy.20(2): 116-123.
Mapako, M. and Prasad, G. (2005). The Free BasicElectricity (FBE) policy and rural grid connectedhouseholds, solar home system (SHS) users andunelectrified households. Domestic Use of Energyconference, March 2005. Cape Town: CapeTechnikon.
Meaney, A. and Hope, P. (2012). Alternative ways offinancing infrastructure investment. Potential for“novel” financing models. Discussion paper No.2012-7, Oxford, UK: Oxford Consulting.
Mvondo, J. (2010). Impact of access to free basic elec-tricity on household’s poverty in Buffalo CityMunicipality in the Eastern Cape. Unpublished PhDdiss. Fort Hare: Department of Economics,University of Fort Hare.
Pachauri, S. & Spreng, D. (2003). Energy Use andEnergy Access in Relation to Poverty. CEPE WorkingPaper No. 25 (June 2003), pp 1-13.
Pachauri, S., Mueller, A., Kemmler, A. and Spreng, D.(2004). On measuring energy poverty in Indianhouseholds. World Development, 32(12): 2083-2104.
Ping, C. J., Lee, K. L., & Ingersoll, G. M. (2002). Anintroduction to logistic regression analysis andreporting. The Journal of Educational Research,96(1).
Republic of South Africa (RSA), (1998). White Paper onthe Energy Policy of the Republic of South Africa.Department of Minerals and Energy. December1998.
Statistics South Africa. (2008). General HouseholdSurvey 2008.
The Presidency RSA. (2009). Medium Term StrategicPlan: 2009-2014.
Thopil G.A. & Pouris A. (2013). International position-ing of South African electricity prices and commodi-ty differentiated pricing. S Afr J Sci. 2013; 109(7/8),Art #0075, 4 pages.http://dx,doi.org/10.1590/sajs.2013/20120075.
Tietenberg, T. and Lewis, l. (2012). EnvironmentalEconomics and Policy (6e). Boston, United States ofAmerica: Addison-Wesley.
Waddams, C., Brazier, K., Pham, K., Mathieu, L. and
Wang, W. (2007). Identifying fuel poverty usingobjective and subjective measures. Centre forCompetition Policy. 7(11).
Received 30 September 2014; revised 4 August 2015
78 Journal of Energy in Southern Africa • Vol 26 No 3 • August 2015
Abstract
The development of refrigeration is a priority in allcountries, given the multidimensional roles that itplays in the sustainable development of society. Indeveloping countries, efforts are being made tocatch up with the delayed experienced in the use ofrefrigeration. To achieve this goal, several countriesare allowed to trace the history of refrigeration intheir countries in order to understand the maincauses of non-expansion, and then set up a newstrategy of sustainable development for this tech-nology. The Democratic Republic of Congo (DRC)is a developing country that has experienced a veryinteresting history of refrigeration, but is still lessknown by the Congolese themselves as well as byscientists. This paper has traced out the outline inthe history of refrigeration in the DRC. Surveyswere conducted in the industrial, health, residential,commercial, and tourism sectors during the colonialand post-colonial period. Results showed that theuse of refrigeration in the DRC has been remarkablyobserved in the industrial sector, especially in brew-eries, with a cooling capacity ranging from 50.1thousand to 2.88 million kWh, about 5 659 %between 1929 and 1957; from 3 million to 26.5 mil-lion kWh, about 783.3 % between 1958 and 1980,and then dropped to 6.5 million kWh in 2004before resuming its growth up to 11 million kWh in2009. The variations in the use of refrigeration dur-ing the above periods significantly influenced theeconomy, in the sense that the economic and socialindicators of the country grew from 0.415 to 0.430between 1975 and 1985, and then declined to0.375 in 2000, due to political instability, before ris-ing up to 0.410 in 2005.
Keywords: sustainable development, refrigeration,cooling capacity, energy, food industry
1. Introduction
In prehistoric times, man found that the game killedin the hunt would last longer if it was stored in thecoolness of a cave or packed in snow. Later, ice washarvested from lakes and rivers and stored to beused in summer. As man became more industrial-ized and mechanized, cooling requirements inindustrial processes and other sectors became moreand more important. This led to a technological rev-olution in refrigeration. However, the evolution ofrefrigeration technology was slow and difficult untilthe invention and development of electricity in the19th century, which boosted the development oftechnology based on vapour compression (Arora,2000) that subsequently became more competitiveworldwide. The growth of refrigeration technologyand its applications has enabled many countriesaround the world to achieve sustainable develop-ment. Its impact may be appreciated through social,economic and environmental dimensions.
In society, the refrigeration sector generates jobs.According to the International Institute ofRefrigeration report (IIR, 2002), the refrigerationsector employs more than 2 million people world-wide, particularly in industrial and commercialareas. Refrigeration is essential to human life. In thefood sector, refrigeration contributes to reducingpost-harvest losses by allowing perishable foods tobe preserved at all stages from production to con-sumption (Laguerre et al., 2013; Tassou et al.,2010; Wang and Wang, 2005). In the health sector,refrigeration is used for vaccine storage (McCarneyet al., 2013), and new medical equipment and tools(Langenhuijsen et al., 2009; Polascik et al., 2007).Apart from its primary function of producing cold,refrigeration is used for air conditioning by creatingcomfortable living and working environments(Fanger, 2001; Ji et al., 2003).
Journal of Energy in Southern Africa • Vol 26 No 3 • August 2015 79
An overview of refrigeration and its impact on the
development in the Democratic Republic of Congo
Jean Fulbert Ituna-Yudonago1
J M Belman-Flores1
V Pérez-García2
1. Department of Mechanical Engineering, Engineering Division, Campus Irapuato-Salamanca, University of
Guanajuato, Salamanca, Gto, México
2. Department of Metal-Mechanical Engineering, University of Technological of Guanajuato Southwest, Valle de
Santiago, México
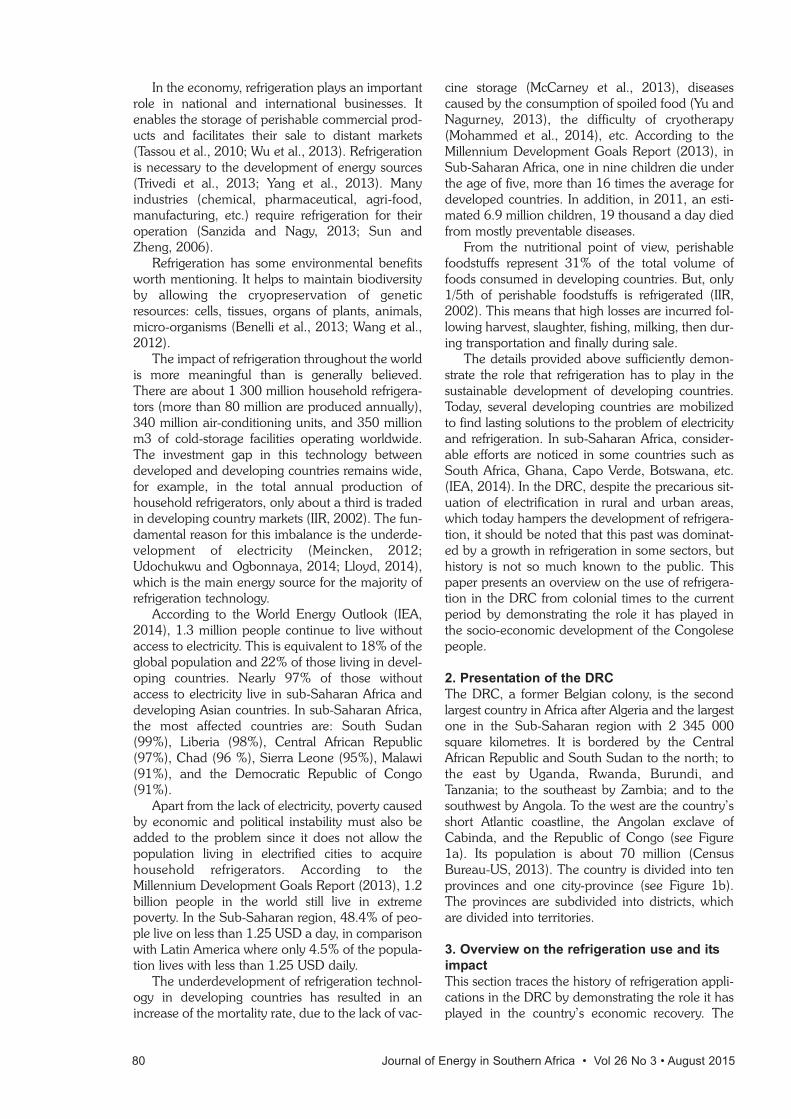
In the economy, refrigeration plays an importantrole in national and international businesses. Itenables the storage of perishable commercial prod-ucts and facilitates their sale to distant markets(Tassou et al., 2010; Wu et al., 2013). Refrigerationis necessary to the development of energy sources(Trivedi et al., 2013; Yang et al., 2013). Manyindustries (chemical, pharmaceutical, agri-food,manufacturing, etc.) require refrigeration for theiroperation (Sanzida and Nagy, 2013; Sun andZheng, 2006).
Refrigeration has some environmental benefitsworth mentioning. It helps to maintain biodiversityby allowing the cryopreservation of geneticresources: cells, tissues, organs of plants, animals,micro-organisms (Benelli et al., 2013; Wang et al.,2012).
The impact of refrigeration throughout the worldis more meaningful than is generally believed.There are about 1 300 million household refrigera-tors (more than 80 million are produced annually),340 million air-conditioning units, and 350 millionm3 of cold-storage facilities operating worldwide.The investment gap in this technology betweendeveloped and developing countries remains wide,for example, in the total annual production ofhousehold refrigerators, only about a third is tradedin developing country markets (IIR, 2002). The fun-damental reason for this imbalance is the underde-velopment of electricity (Meincken, 2012;Udochukwu and Ogbonnaya, 2014; Lloyd, 2014),which is the main energy source for the majority ofrefrigeration technology.
According to the World Energy Outlook (IEA,2014), 1.3 million people continue to live withoutaccess to electricity. This is equivalent to 18% of theglobal population and 22% of those living in devel-oping countries. Nearly 97% of those withoutaccess to electricity live in sub-Saharan Africa anddeveloping Asian countries. In sub-Saharan Africa,the most affected countries are: South Sudan(99%), Liberia (98%), Central African Republic(97%), Chad (96 %), Sierra Leone (95%), Malawi(91%), and the Democratic Republic of Congo(91%).
Apart from the lack of electricity, poverty causedby economic and political instability must also beadded to the problem since it does not allow thepopulation living in electrified cities to acquirehousehold refrigerators. According to theMillennium Development Goals Report (2013), 1.2billion people in the world still live in extremepoverty. In the Sub-Saharan region, 48.4% of peo-ple live on less than 1.25 USD a day, in comparisonwith Latin America where only 4.5% of the popula-tion lives with less than 1.25 USD daily.
The underdevelopment of refrigeration technol-ogy in developing countries has resulted in anincrease of the mortality rate, due to the lack of vac-
cine storage (McCarney et al., 2013), diseasescaused by the consumption of spoiled food (Yu andNagurney, 2013), the difficulty of cryotherapy(Mohammed et al., 2014), etc. According to theMillennium Development Goals Report (2013), inSub-Saharan Africa, one in nine children die underthe age of five, more than 16 times the average fordeveloped countries. In addition, in 2011, an esti-mated 6.9 million children, 19 thousand a day diedfrom mostly preventable diseases.
From the nutritional point of view, perishablefoodstuffs represent 31% of the total volume offoods consumed in developing countries. But, only1/5th of perishable foodstuffs is refrigerated (IIR,2002). This means that high losses are incurred fol-lowing harvest, slaughter, fishing, milking, then dur-ing transportation and finally during sale.
The details provided above sufficiently demon-strate the role that refrigeration has to play in thesustainable development of developing countries.Today, several developing countries are mobilizedto find lasting solutions to the problem of electricityand refrigeration. In sub-Saharan Africa, consider-able efforts are noticed in some countries such asSouth Africa, Ghana, Capo Verde, Botswana, etc.(IEA, 2014). In the DRC, despite the precarious sit-uation of electrification in rural and urban areas,which today hampers the development of refrigera-tion, it should be noted that this past was dominat-ed by a growth in refrigeration in some sectors, buthistory is not so much known to the public. Thispaper presents an overview on the use of refrigera-tion in the DRC from colonial times to the currentperiod by demonstrating the role it has played inthe socio-economic development of the Congolesepeople.
2. Presentation of the DRC
The DRC, a former Belgian colony, is the secondlargest country in Africa after Algeria and the largestone in the Sub-Saharan region with 2 345 000square kilometres. It is bordered by the CentralAfrican Republic and South Sudan to the north; tothe east by Uganda, Rwanda, Burundi, andTanzania; to the southeast by Zambia; and to thesouthwest by Angola. To the west are the country’sshort Atlantic coastline, the Angolan exclave ofCabinda, and the Republic of Congo (see Figure1a). Its population is about 70 million (CensusBureau-US, 2013). The country is divided into tenprovinces and one city-province (see Figure 1b).The provinces are subdivided into districts, whichare divided into territories.
3. Overview on the refrigeration use and its
impact
This section traces the history of refrigeration appli-cations in the DRC by demonstrating the role it hasplayed in the country’s economic recovery. The
80 Journal of Energy in Southern Africa • Vol 26 No 3 • August 2015
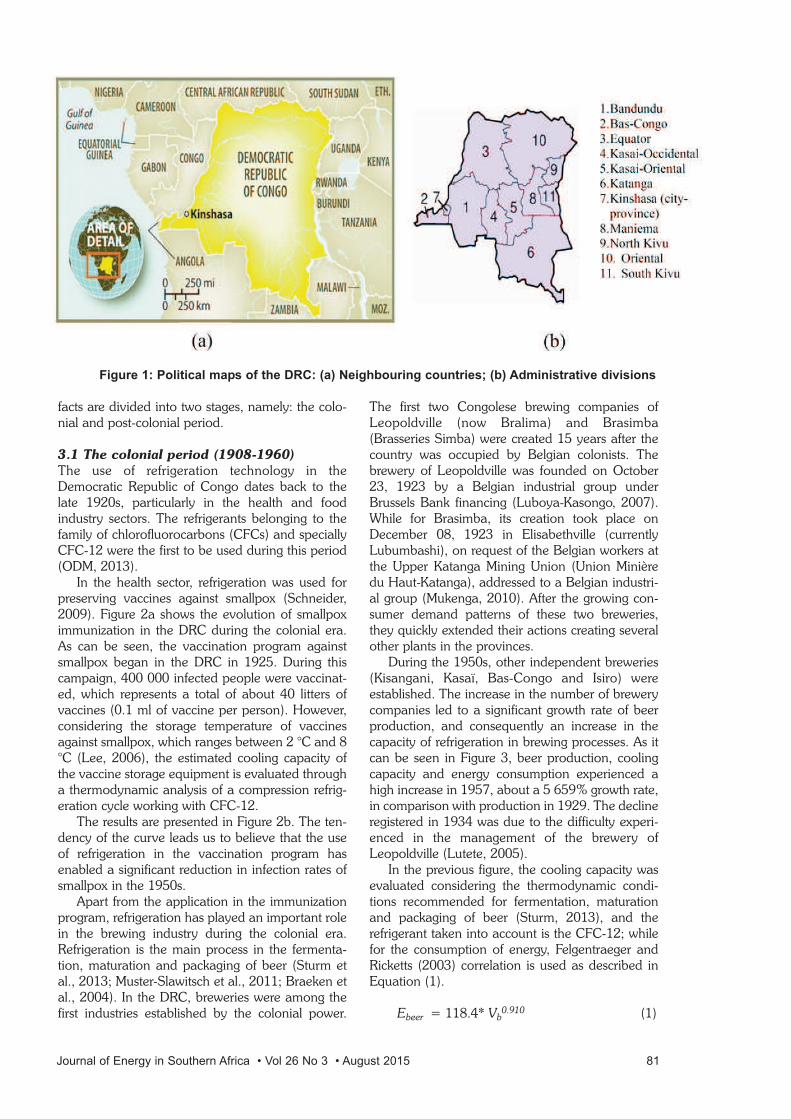
facts are divided into two stages, namely: the colo-nial and post-colonial period.
3.1 The colonial period (1908-1960)
The use of refrigeration technology in theDemocratic Republic of Congo dates back to thelate 1920s, particularly in the health and foodindustry sectors. The refrigerants belonging to thefamily of chlorofluorocarbons (CFCs) and speciallyCFC-12 were the first to be used during this period(ODM, 2013).
In the health sector, refrigeration was used forpreserving vaccines against smallpox (Schneider,2009). Figure 2a shows the evolution of smallpoximmunization in the DRC during the colonial era.As can be seen, the vaccination program againstsmallpox began in the DRC in 1925. During thiscampaign, 400 000 infected people were vaccinat-ed, which represents a total of about 40 litters ofvaccines (0.1 ml of vaccine per person). However,considering the storage temperature of vaccinesagainst smallpox, which ranges between 2 °C and 8°C (Lee, 2006), the estimated cooling capacity ofthe vaccine storage equipment is evaluated througha thermodynamic analysis of a compression refrig-eration cycle working with CFC-12.
The results are presented in Figure 2b. The ten-dency of the curve leads us to believe that the useof refrigeration in the vaccination program hasenabled a significant reduction in infection rates ofsmallpox in the 1950s.
Apart from the application in the immunizationprogram, refrigeration has played an important rolein the brewing industry during the colonial era.Refrigeration is the main process in the fermenta-tion, maturation and packaging of beer (Sturm etal., 2013; Muster-Slawitsch et al., 2011; Braeken etal., 2004). In the DRC, breweries were among thefirst industries established by the colonial power.
The first two Congolese brewing companies ofLeopoldville (now Bralima) and Brasimba(Brasseries Simba) were created 15 years after thecountry was occupied by Belgian colonists. Thebrewery of Leopoldville was founded on October23, 1923 by a Belgian industrial group underBrussels Bank financing (Luboya-Kasongo, 2007).While for Brasimba, its creation took place onDecember 08, 1923 in Elisabethville (currentlyLubumbashi), on request of the Belgian workers atthe Upper Katanga Mining Union (Union Minièredu Haut-Katanga), addressed to a Belgian industri-al group (Mukenga, 2010). After the growing con-sumer demand patterns of these two breweries,they quickly extended their actions creating severalother plants in the provinces.
During the 1950s, other independent breweries(Kisangani, Kasaï, Bas-Congo and Isiro) wereestablished. The increase in the number of brewerycompanies led to a significant growth rate of beerproduction, and consequently an increase in thecapacity of refrigeration in brewing processes. As itcan be seen in Figure 3, beer production, coolingcapacity and energy consumption experienced ahigh increase in 1957, about a 5 659% growth rate,in comparison with production in 1929. The declineregistered in 1934 was due to the difficulty experi-enced in the management of the brewery ofLeopoldville (Lutete, 2005).
In the previous figure, the cooling capacity wasevaluated considering the thermodynamic condi-tions recommended for fermentation, maturationand packaging of beer (Sturm, 2013), and therefrigerant taken into account is the CFC-12; whilefor the consumption of energy, Felgentraeger andRicketts (2003) correlation is used as described inEquation (1).
Ebeer = 118.4* Vb0.910 (1)
Journal of Energy in Southern Africa • Vol 26 No 3 • August 2015 81
Figure 1: Political maps of the DRC: (a) Neighbouring countries; (b) Administrative divisions
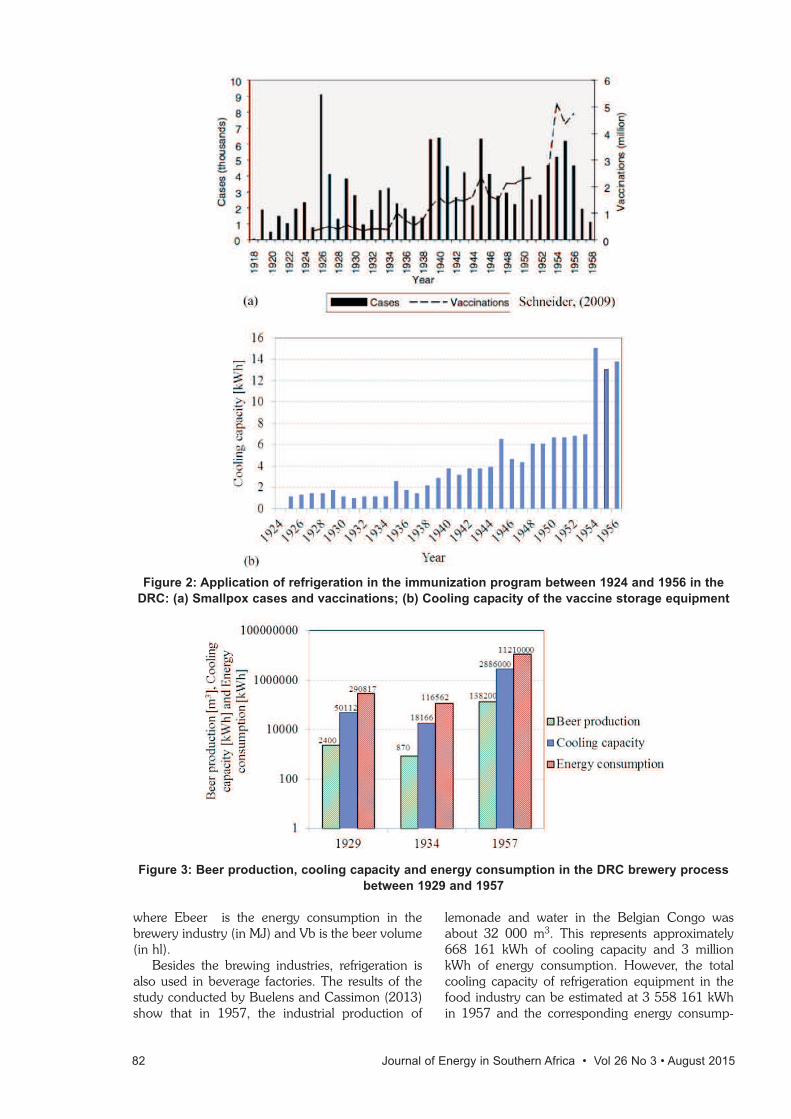
where Ebeer is the energy consumption in thebrewery industry (in MJ) and Vb is the beer volume(in hl).
Besides the brewing industries, refrigeration isalso used in beverage factories. The results of thestudy conducted by Buelens and Cassimon (2013)show that in 1957, the industrial production of
lemonade and water in the Belgian Congo wasabout 32 000 m3. This represents approximately668 161 kWh of cooling capacity and 3 millionkWh of energy consumption. However, the totalcooling capacity of refrigeration equipment in thefood industry can be estimated at 3 558 161 kWhin 1957 and the corresponding energy consump-
82 Journal of Energy in Southern Africa • Vol 26 No 3 • August 2015
Figure 2: Application of refrigeration in the immunization program between 1924 and 1956 in the
DRC: (a) Smallpox cases and vaccinations; (b) Cooling capacity of the vaccine storage equipment
Figure 3: Beer production, cooling capacity and energy consumption in the DRC brewery process
between 1929 and 1957
tion approximately 14.2 million kWh. Achieve-ments made in the food sector were not sufficientsince refrigeration was not developed in other foodareas such as the greengrocer, fishery and meatindustries. This was due to the agro-industrial poli-cy applied by settlers which was focused on the pro-duction of cash crops for export instead of food pro-duction (Jensen, 2012).
Apart from the food and health sectors thatexperienced refrigeration shortly after the takeoverof the Congo by the colonial power, other sectorssuch as residential and commercial did not experi-ence the same situation. The use of refrigeration inthe residential sector began in the DRC in the1950s. The use of this equipment was essentiallyreserved for settlers and expatriate officials. Thisrestriction was an obstacle to the development ofrefrigeration during the colonial period. Similarly,the Congolese commercial sector had not experi-enced significant development in refrigeration dur-ing the colonial period, due to the type of tradeapplied by settlers, which was centred on the exportof mineral resources and cash crops (Buelens andCassimon, 2013).
The development of refrigeration was intimatelylinked to electricity. Provinces that have experi-enced the development of refrigeration (especiallyin the brewing industry) were those in which elec-tricity has been developed. Table 1 shows the dif-ferent hydropower plants built during the colonialera and some plants whose construction was start-ed before independence. The total installed capaci-ty of these hydropower plants is about 630 160 kW.
Despite this important access to electricity,Congolese rural areas had remained without elec-tricity during the entire period of colonization.Some Congolese living in slums did not have accessto electricity (Kaplan, 2007; SNEL, 2013). This sit-uation was a major constraint to the developmentof refrigeration.
3.2 The post-colonial period (1960 -)
The inventory of refrigeration in the post-colonialperiod is characterized by a widening of its scope inalmost all sectors of activity, despite the slow start-up that the country had experienced shortly afterindependence due to the unpreparedness ofCongolese administrators during the colonial timeto ensure the continuity of public affairs (Kaplan,2007). The technology of refrigeration used in theearly post-colonial years was dominated bymechanical compression machines working withrefrigerants belonging to both hydrochlorofluoro-carbons (HCFCs) and chlorofluorocarbons (ODM,2013; WMO, 2011).
The development of refrigeration during thepost-colonial period was far more influenced by thecountry’s political stability. Several socio-politicalevents (war, political crisis, looting, etc.) occurredthroughout the post-colonial period were the basisof instability in the refrigeration use. Indeed, afterthe political instability experienced by the country inthe first five years of independence (1960-1965),the political recovery realized by President MobutuSese Seko (from 1965 to 1980) has led to socio-economic development of the country (FMI, 2010).
In the industrial sector, food industries experi-enced significant growth in production compared tothe colonial period. In brewery industries (seeFigure 4a), the growth rate of beer productionbetween 1964 and 1980 was about 63.80%. Whilein beverage, despite the decrease of production in1967, the growth rate between 1964 and 1980 stillremains important (about 80%) (Mukenga, 2010).Increasing beer and beverage production involves agrowth in the cooling capacity of refrigerationequipment used in fermentation, maturation andpackaging processes. Figure 4b shows the coolingcapacity of refrigeration equipment used in thebrewing and beverage process between 1958 and1980 and the corresponding energy consumption.
Journal of Energy in Southern Africa • Vol 26 No 3 • August 2015 83
Table 1: Hydropower plants built during the colonial era in the RDC
(SNEL, 2013; Buelens and Cassimon, 2013)
Location Plant Building date Capacity [kW]
Bas-Congo Mpozo 1934 2 200
Sanga 1932-1949 11 500
Zongo 1956-1965 75 000
Kasai-Occidental Lungudi 1949 1 560
Katanga Mwadingusha 1929 68 000
Koni 1950 42 000
Nzilo 1953-1954 108 000
Kilubi 1954 9900
Kyimbi 1959 17000
Nseke 1956-1957 248 000
Oriental Thsopo 1959-1974 18 000
South Kivu Ruzizi I 1958-1972 29 000
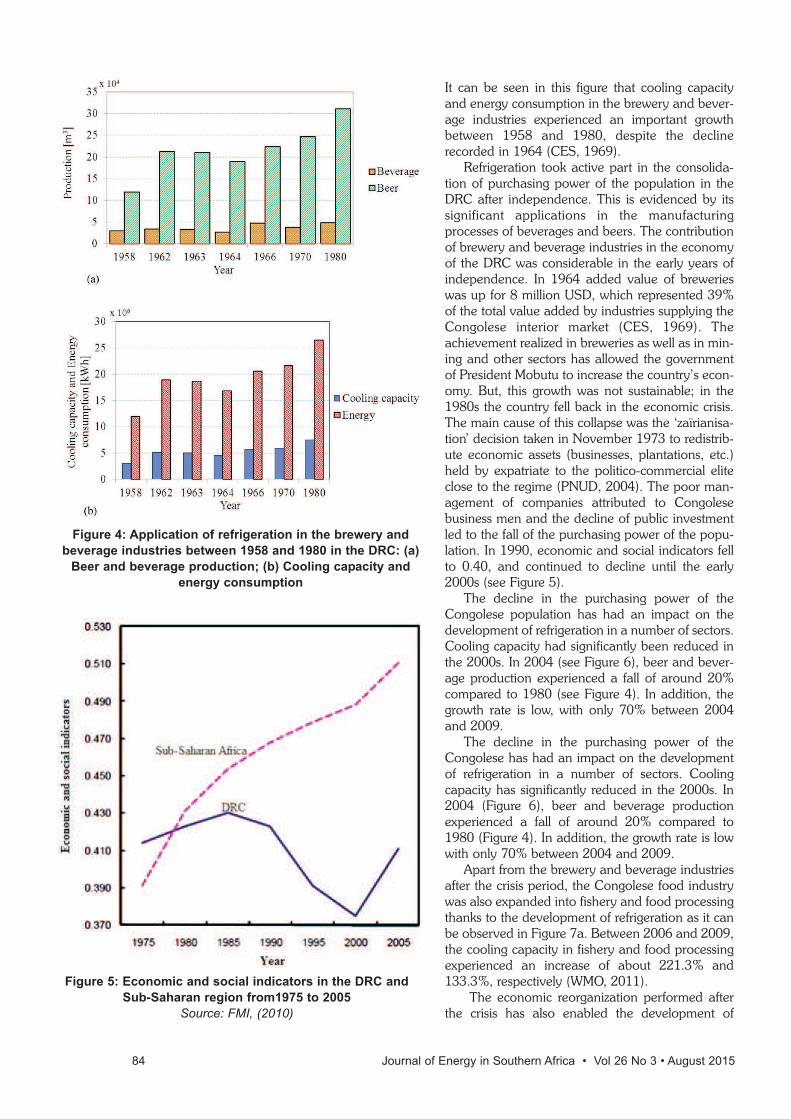
It can be seen in this figure that cooling capacityand energy consumption in the brewery and bever-age industries experienced an important growthbetween 1958 and 1980, despite the declinerecorded in 1964 (CES, 1969).
Refrigeration took active part in the consolida-tion of purchasing power of the population in theDRC after independence. This is evidenced by itssignificant applications in the manufacturingprocesses of beverages and beers. The contributionof brewery and beverage industries in the economyof the DRC was considerable in the early years ofindependence. In 1964 added value of brewerieswas up for 8 million USD, which represented 39%of the total value added by industries supplying theCongolese interior market (CES, 1969). Theachievement realized in breweries as well as in min-ing and other sectors has allowed the governmentof President Mobutu to increase the country’s econ-omy. But, this growth was not sustainable; in the1980s the country fell back in the economic crisis.The main cause of this collapse was the ‘zaïrianisa-tion’ decision taken in November 1973 to redistrib-ute economic assets (businesses, plantations, etc.)held by expatriate to the politico-commercial eliteclose to the regime (PNUD, 2004). The poor man-agement of companies attributed to Congolesebusiness men and the decline of public investmentled to the fall of the purchasing power of the popu-lation. In 1990, economic and social indicators fellto 0.40, and continued to decline until the early2000s (see Figure 5).
The decline in the purchasing power of theCongolese population has had an impact on thedevelopment of refrigeration in a number of sectors.Cooling capacity had significantly been reduced inthe 2000s. In 2004 (see Figure 6), beer and bever-age production experienced a fall of around 20%compared to 1980 (see Figure 4). In addition, thegrowth rate is low, with only 70% between 2004and 2009.
The decline in the purchasing power of theCongolese has had an impact on the developmentof refrigeration in a number of sectors. Coolingcapacity has significantly reduced in the 2000s. In2004 (Figure 6), beer and beverage productionexperienced a fall of around 20% compared to1980 (Figure 4). In addition, the growth rate is lowwith only 70% between 2004 and 2009.
Apart from the brewery and beverage industriesafter the crisis period, the Congolese food industrywas also expanded into fishery and food processingthanks to the development of refrigeration as it canbe observed in Figure 7a. Between 2006 and 2009,the cooling capacity in fishery and food processingexperienced an increase of about 221.3% and133.3%, respectively (WMO, 2011).
The economic reorganization performed afterthe crisis has also enabled the development of
84 Journal of Energy in Southern Africa • Vol 26 No 3 • August 2015
Figure 4: Application of refrigeration in the brewery and
beverage industries between 1958 and 1980 in the DRC: (a)
Beer and beverage production; (b) Cooling capacity and
energy consumption
Figure 5: Economic and social indicators in the DRC and
Sub-Saharan region from1975 to 2005
Source: FMI, (2010)
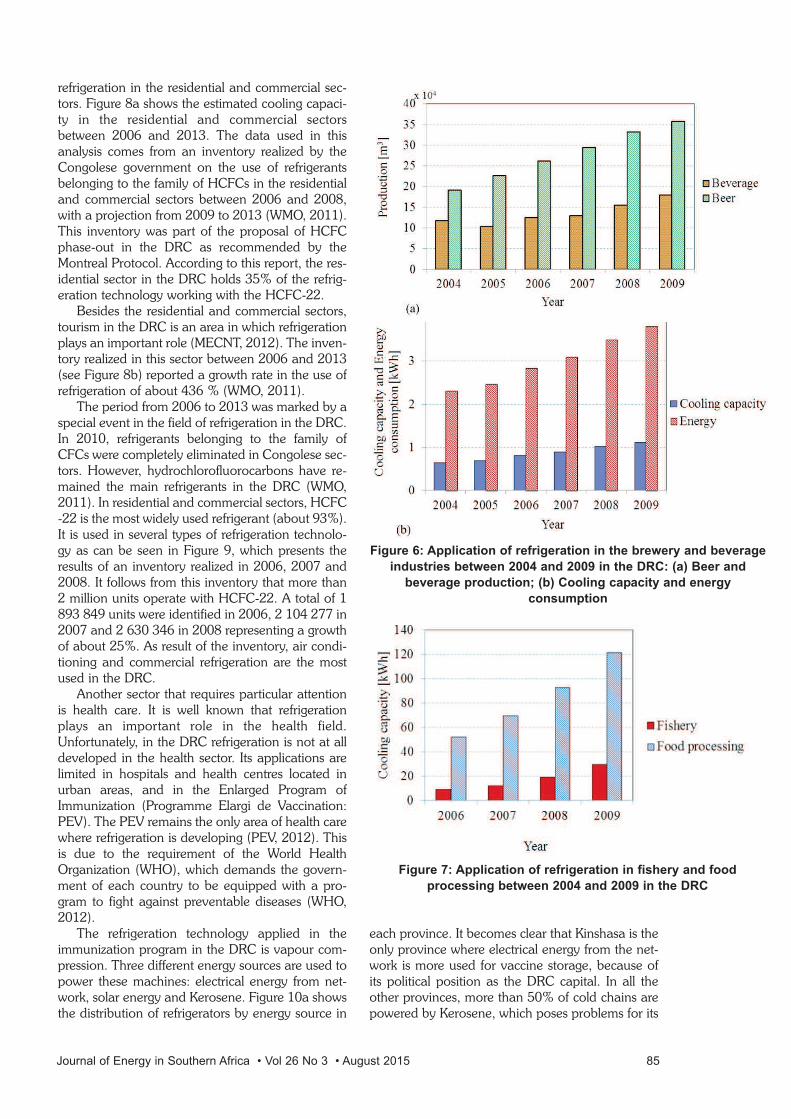
refrigeration in the residential and commercial sec-tors. Figure 8a shows the estimated cooling capaci-ty in the residential and commercial sectorsbetween 2006 and 2013. The data used in thisanalysis comes from an inventory realized by theCongolese government on the use of refrigerantsbelonging to the family of HCFCs in the residentialand commercial sectors between 2006 and 2008,with a projection from 2009 to 2013 (WMO, 2011).This inventory was part of the proposal of HCFCphase-out in the DRC as recommended by theMontreal Protocol. According to this report, the res-idential sector in the DRC holds 35% of the refrig-eration technology working with the HCFC-22.
Besides the residential and commercial sectors,tourism in the DRC is an area in which refrigerationplays an important role (MECNT, 2012). The inven-tory realized in this sector between 2006 and 2013(see Figure 8b) reported a growth rate in the use ofrefrigeration of about 436 % (WMO, 2011).
The period from 2006 to 2013 was marked by aspecial event in the field of refrigeration in the DRC.In 2010, refrigerants belonging to the family ofCFCs were completely eliminated in Congolese sec-tors. However, hydrochlorofluorocarbons have re-mained the main refrigerants in the DRC (WMO,2011). In residential and commercial sectors, HCFC-22 is the most widely used refrigerant (about 93%).It is used in several types of refrigeration technolo-gy as can be seen in Figure 9, which presents theresults of an inventory realized in 2006, 2007 and2008. It follows from this inventory that more than2 million units operate with HCFC-22. A total of 1893 849 units were identified in 2006, 2 104 277 in2007 and 2 630 346 in 2008 representing a growthof about 25%. As result of the inventory, air condi-tioning and commercial refrigeration are the mostused in the DRC.
Another sector that requires particular attentionis health care. It is well known that refrigerationplays an important role in the health field.Unfortunately, in the DRC refrigeration is not at alldeveloped in the health sector. Its applications arelimited in hospitals and health centres located inurban areas, and in the Enlarged Program ofImmunization (Programme Elargi de Vaccination:PEV). The PEV remains the only area of health carewhere refrigeration is developing (PEV, 2012). Thisis due to the requirement of the World HealthOrganization (WHO), which demands the govern-ment of each country to be equipped with a pro-gram to fight against preventable diseases (WHO,2012).
The refrigeration technology applied in theimmunization program in the DRC is vapour com-pression. Three different energy sources are used topower these machines: electrical energy from net-work, solar energy and Kerosene. Figure 10a showsthe distribution of refrigerators by energy source in
each province. It becomes clear that Kinshasa is theonly province where electrical energy from the net-work is more used for vaccine storage, because ofits political position as the DRC capital. In all theother provinces, more than 50% of cold chains arepowered by Kerosene, which poses problems for its
Journal of Energy in Southern Africa • Vol 26 No 3 • August 2015 85
Figure 6: Application of refrigeration in the brewery and beverage
industries between 2004 and 2009 in the DRC: (a) Beer and
beverage production; (b) Cooling capacity and energy
consumption
Figure 7: Application of refrigeration in fishery and food
processing between 2004 and 2009 in the DRC
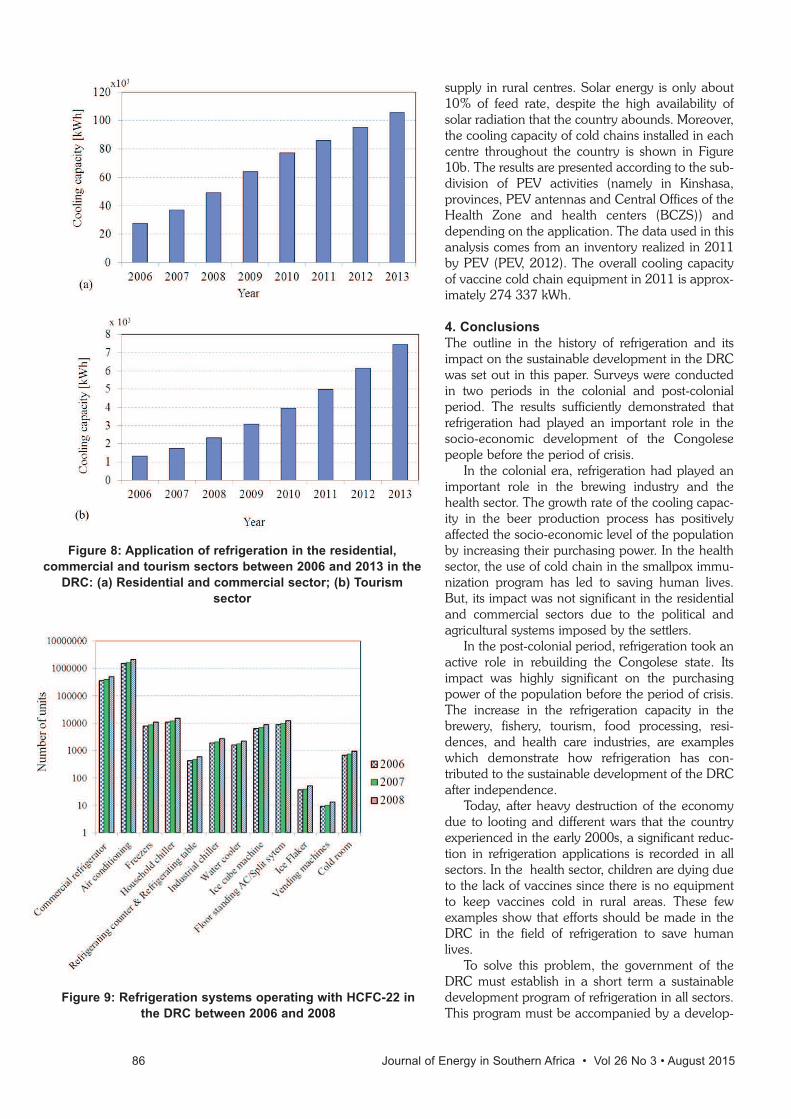
supply in rural centres. Solar energy is only about10% of feed rate, despite the high availability ofsolar radiation that the country abounds. Moreover,the cooling capacity of cold chains installed in eachcentre throughout the country is shown in Figure10b. The results are presented according to the sub-division of PEV activities (namely in Kinshasa,provinces, PEV antennas and Central Offices of theHealth Zone and health centers (BCZS)) anddepending on the application. The data used in thisanalysis comes from an inventory realized in 2011by PEV (PEV, 2012). The overall cooling capacityof vaccine cold chain equipment in 2011 is approx-imately 274 337 kWh.
4. Conclusions
The outline in the history of refrigeration and itsimpact on the sustainable development in the DRCwas set out in this paper. Surveys were conductedin two periods in the colonial and post-colonialperiod. The results sufficiently demonstrated thatrefrigeration had played an important role in thesocio-economic development of the Congolesepeople before the period of crisis.
In the colonial era, refrigeration had played animportant role in the brewing industry and thehealth sector. The growth rate of the cooling capac-ity in the beer production process has positivelyaffected the socio-economic level of the populationby increasing their purchasing power. In the healthsector, the use of cold chain in the smallpox immu-nization program has led to saving human lives.But, its impact was not significant in the residentialand commercial sectors due to the political andagricultural systems imposed by the settlers.
In the post-colonial period, refrigeration took anactive role in rebuilding the Congolese state. Itsimpact was highly significant on the purchasingpower of the population before the period of crisis.The increase in the refrigeration capacity in thebrewery, fishery, tourism, food processing, resi-dences, and health care industries, are exampleswhich demonstrate how refrigeration has con-tributed to the sustainable development of the DRCafter independence.
Today, after heavy destruction of the economydue to looting and different wars that the countryexperienced in the early 2000s, a significant reduc-tion in refrigeration applications is recorded in allsectors. In the health sector, children are dying dueto the lack of vaccines since there is no equipmentto keep vaccines cold in rural areas. These fewexamples show that efforts should be made in theDRC in the field of refrigeration to save humanlives.
To solve this problem, the government of theDRC must establish in a short term a sustainabledevelopment program of refrigeration in all sectors.This program must be accompanied by a develop-
86 Journal of Energy in Southern Africa • Vol 26 No 3 • August 2015
Figure 8: Application of refrigeration in the residential,
commercial and tourism sectors between 2006 and 2013 in the
DRC: (a) Residential and commercial sector; (b) Tourism
sector
Figure 9: Refrigeration systems operating with HCFC-22 in
the DRC between 2006 and 2008
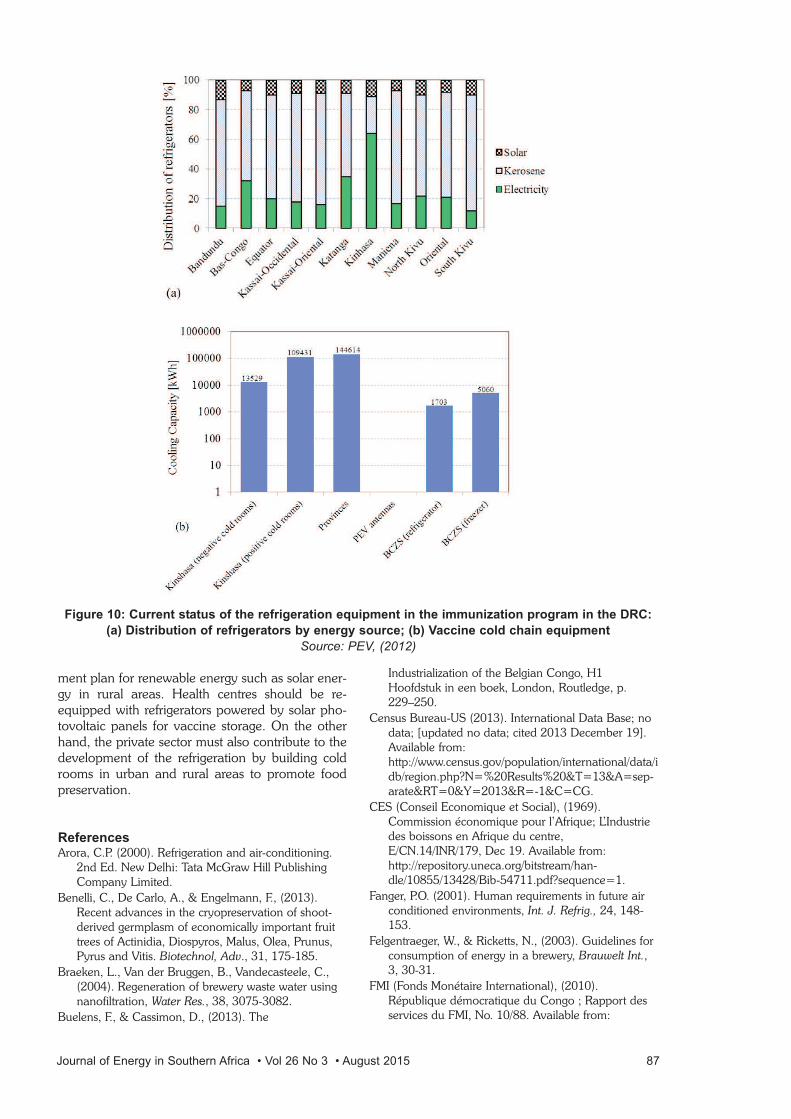
ment plan for renewable energy such as solar ener-gy in rural areas. Health centres should be re-equipped with refrigerators powered by solar pho-tovoltaic panels for vaccine storage. On the otherhand, the private sector must also contribute to thedevelopment of the refrigeration by building coldrooms in urban and rural areas to promote foodpreservation.
ReferencesArora, C.P. (2000). Refrigeration and air-conditioning.
2nd Ed. New Delhi: Tata McGraw Hill PublishingCompany Limited.
Benelli, C., De Carlo, A., & Engelmann, F., (2013).Recent advances in the cryopreservation of shoot-derived germplasm of economically important fruittrees of Actinidia, Diospyros, Malus, Olea, Prunus,Pyrus and Vitis. Biotechnol, Adv., 31, 175-185.
Braeken, L., Van der Bruggen, B., Vandecasteele, C.,(2004). Regeneration of brewery waste water usingnanofiltration, Water Res., 38, 3075-3082.
Buelens, F., & Cassimon, D., (2013). The
Industrialization of the Belgian Congo, H1Hoofdstuk in een boek, London, Routledge, p.229–250.
Census Bureau-US (2013). International Data Base; nodata; [updated no data; cited 2013 December 19].Available from:http://www.census.gov/population/international/data/idb/region.php?N=%20Results%20&T=13&A=sep-arate&RT=0&Y=2013&R=-1&C=CG.
CES (Conseil Economique et Social), (1969).Commission économique pour l’Afrique; L’Industriedes boissons en Afrique du centre,E/CN.14/INR/179, Dec 19. Available from:http://repository.uneca.org/bitstream/han-dle/10855/13428/Bib-54711.pdf?sequence=1.
Fanger, P.O. (2001). Human requirements in future airconditioned environments, Int. J. Refrig., 24, 148-153.
Felgentraeger, W., & Ricketts, N., (2003). Guidelines forconsumption of energy in a brewery, Brauwelt Int.,3, 30-31.
FMI (Fonds Monétaire International), (2010).République démocratique du Congo ; Rapport desservices du FMI, No. 10/88. Available from:
Journal of Energy in Southern Africa • Vol 26 No 3 • August 2015 87
Figure 10: Current status of the refrigeration equipment in the immunization program in the DRC:
(a) Distribution of refrigerators by energy source; (b) Vaccine cold chain equipment
Source: PEV, (2012)
https://www.imf.org/external/french/pubs/ft/scr/2010/cr1088f.pdf.
IEA (International Energy Agency), (2014). WorldEnergy Outlook. Energy access database. OECD/IEA2014 Paris (France). Available from:http://www.worldenergyoutlook.org/resources/ener-gydevelopment/energyaccessdatabase/.
IIR, (2002). Report on Refrigeration SectorAchievements and Challenges.
Jensen, C.H., (2012). Rumble in the jungle: TheBlessing and Curse of Mineral Wealth in the Congo[Thesis]. Aalborg: Aalborg University.
Ji, J., Chow, T., Pei, G., Dong, J., & He, W., (2003).Domestic air-conditioner and integrated water heaterfor subtropical climate, Appl. Therm. Eng., 23, 581-592.
Kaplan, S., (2007). The Wrong Prescription for theCongo, Orbis, 51(2), 299-311.
Laguerre, O., Hoang, H.M., & Flick, D., (2013).Experimental investigation and modelling in thefood cold chain: Thermal and quality evolution,Trends Food Sci. Technol., 29 (2), 87-97.
Langenhuijsen, J.F., Broers, E.M.P., & Vergunst, H.,(2009). Cryosurgery for Prostate Cancer: an Updateon Clinical Results of Modern Cryotechnology, Eur.Urol., 55(1), 76-86.
Lee, K.N., Hutson, C.L., Kline, R., Curns, A.T.,Dougherty, C., & Allen, C., et al., (2006). Smallpoxvaccine stability after maintenance at temperaturesnot recommended for shipping, Vaccine, 24, 884-886.
Lloyd, P., (2014). The energy profile of a low-incomeurban community, Journal of Energy in SouthernAfrica, 25(3), 80-85.
Luboya-Kasongo, D., (2007). Intégration de l’intelli-gence économique dans les pratiques managérialesdes entreprises congolaises [Thesis]. Kinshasa :Université de Kinshasa. Available from:http://www.memoireonline.com/02/10/3142/m_Integration-de-lintelligence-economique-dans-les-pra-tiques-manageriales-des-entreprises-congol16.html.
Lutete, M., Supplement, Hans Van Mameren, (2005).Administrateur Délégué [Internet] ; Bralima a con-solidé sa réputation et sa position de leader.Kinshasa (DRC). Le Potentiel; [update no data ;cited 2005]. Available from:http://www.stanleyville.be/documents/Histoire%20de%20la%20Bralima.pdf.
McCarney, S., Robertson, J., Arnaud, J., Lorenson, K.,& Lloyd, J., (2013). Using solar-powered refrigera-tion for vaccine storage where other sources of reli-able electricity are inadequate or costly, Vaccine, 31,6050-6057.
MECNT (Ministère de l’Environnement, Conservationde la Nature et Tourisme), (2012). Rapport nationalsynthèse sur le développement durable enRépublique Démocratique du Congo. RDCGovernment Publishing Service. Available from:http://sustainabledevelopment.un.org/content/docu-ments/997drc.pdf.
Meincken, M., (2012). Powering Africa, South AfricanJournal of Science, 108(1/2), Art. #1062, 2 pages.http:// dx.doi.org/10.4102/sajs. v108i1/2.1062.
Mohammed, A., Miller, S., et al., (2014). Cryotherapyand its applications in the management of urologicmalignancies: A review of its use in prostate andrenal cancers, Seminars and Original Investigations,32, 19-39.
Mukenga, A., (2010). Etude évolutive de la taille dumarché de la bière au Katanga [Thesis].Lubumbashi: Université de Lubumbashi. Availablefrom: http://www.memoireonline.com/07/10/3744/m_Etude-evolutive-de-la-taille-du-marche-de-la-biere-au-Katanga18.html.
Muster-Slawitsch, B., Weiss, W., Schnitzer, H., &Brunner, C., (2011). The green brewery concept-Energy efficiency and the use of renewable energysources in breweries, Appl. Therm. Eng., 31, 2123-2134.
ODM (Indicadores de los Objetivos de desarrollo delMilenio), (2013). Consumo de CFCs que deterioranla capa de ozono, en toneladas métricas de poten-cial de deterioro del ozono; no data; [updated nodata; cited 2013 Nov 26]. Available from:http://mdgs.un.org/unsd/mdg/SeriesDetail.aspx?srid=649.
PEV, (2012). Plan Pluri Annuel Complet du PEV de laRépublique Démocratique du Congo, 2013-2015.RDC Government Publishing Service. Availablefrom:http://www.nationalplanningcycles.org/sites/default/files/country_docs/Democratic%20Republic%20of%20Congo/ppac_rdc_2013-2015_mercredi_12_nov_2012_vf_-_alexis_2.pdf.
PNUD (Programme des Nations Unies pour leDéveloppement), (2004). Conflits armés enRépublique Démocratique du Congo, Le rôle desfacteurs économiques et leçons pour la reconstruc-tion. PNUD report. Available from:http://jordi.free.fr/PNUD-RAPPORTO%20RDC.pdf.
Polascik, T.J., Nosnik, I., Mayes, J.M., & Mouraviev, V.,(2007). Short–Term Cancer Control after PrimaryCryosurgical Ablation for Clinically LocalizedProstate Cancer Using Third-GenerationCryotechnology. Urology, 7(1), 117-121.
Sanzida, N., & Nagy, Z.K., (2013). Iterative learningcontrol for the systematic design of supersaturationcontrolled batch cooling crystallization processes,Comput. Chem. Eng., 59, 111-121.
Schneider, W.H., (2009). Smallpox in Africa duringColonial Rule, Med. Hist., 53(2), 193-227.
SNEL (National Electricity Society), (2013); Overview ofthe electricity sector in the Democratic Republic ofCongo, Report; RDC Government PublishingService. Available from: http://www.usea.org/sites/default/files/event/Democratic%20Republic%20of%20Congo%20Power%20Sector.pdf.
Sturm, B., Hugenschmidt, S., Joyce, S., Hofacker, W., &Roskilly, A.P., (2013). Opportunities and barriers forefficient energy use in a medium-sized brewery,Applied Thermal Engineering, 53, 397-404.
Sun, D.W., & Zheng, L., (2006). Vacuum cooling tech-nology for the agri-food industry: Past, present andfuture. J. Food Eng., 77, 203-214.
Tassou, S.A., Lewis, J.S., Ge, Y.T., Hadawey, A., &Chaer, I., (2010). A review of emerging technologiesfor food refrigeration applications, Appl. Therm.
88 Journal of Energy in Southern Africa • Vol 26 No 3 • August 2015
Eng., 30, 263-276.The Millennium Development Goals Report, (2013).
Available from:http://www.un.org/millenniumgoals/pdf/report-2013/mdg–report–2013-english.pdf.
Trivedi, D.P., Bagga, R.I., & Chokshi, J.V., (2013).Structural engineering challenges in structures forcooling water system in thermal power plant,Procedia Eng., 51, 141-150.
Udochukwu, B. A., & Ogbonnaya, I. O., (2014).Renewable energy investment in Nigeria: A reviewof the Renewable Energy Master Plan, Journal ofEnergy in Southern Africa, 25(3), 67-73.
Wang, B., Zhang, Z., Yin, Z.C., & Wang, Q., (2012).Novel and potential application of cryopreservationto plant genetic transformation, Biotechnol. Adv.,30, 604-612.
Wang, S.G., & Wang, R.Z., (2005). Recent develop-ments of refrigeration technology in fishing vessels,Renew. Energ., 30, 589-600.
WHO (World Health Organization), (2012). GlobalImmunization News. Available from:http://www.who.int/immunization/GIN_September_2012.pdf.
WMO, (2011). Global Ozone Research and MonitoringProject, Report No. 53, p. 198-220. Geneva(Switzerland). Available from:http://ozone.unep.org/Meeting_Documents/research-mgrs/8orm/8ORM_full_report.pdf.
Wu, X., Hu, S., & Mo, S., (2013). Carbon footprintmodel for evaluating the global warming impact offood transport refrigeration systems, J. Clean. Prod.,54, 115-124.
Yang, L.J., Chen, L., Du, X.Z., & Yang, Y.P., (2013).Effects of ambient winds on the thermo–flow per-formances of indirect dry cooling system in a powerplant, Int. J. Therm.Sci., 64, 178-187.
Yu, M., & Nagurney, A., (2013). Competitive food sup-ply chain networks with application to fresh produce,Eur. J. Oper. Res., 224, 273-282.
Received 12 October 2014; revised 24 August 2015
Journal of Energy in Southern Africa • Vol 26 No 3 • August 2015 89
Abstract
This article demonstrates the new approaches forthe generation of bioelectricity from waste citrusfruit using direct a galvanic cell (DGC), an indirectgalvanic cell (IDGC), a conventional fuel cell (CFC)and a microbial fuel cell (MFC). The citrus fruit wasused as whole for the preparation of DGC and theirjuices for the preparation of IDGC, CFC and MFC.The performance and bioelectrical parametersobtained were compared. The voltage found to beincreased by increasing the number of cells in aseries while, the current remains constant. Whereasthe voltage remains constant and the current foundto be increased with increasing the number of cellsin parallel sequence. The power output of threeunits of citrus fruit connected together in a seriesfound to be sufficient to turn on the LED light bulbin all cases. The result showed that lemons have themaximum power output by the DGC and MFCmethod, whereas grapefruit showed the maximumpower output by IDGC, and thus considered as thebest citrus fruit. Addition of NaCl solution in DGCand IDGC slightly increased the values of poweroutput. The power output of citrus fruit was alsodetermined by CFC and MFC before and after theinoculation of Escherichia coli. The detailed micro-scopic analysis of all the samples was carried out. Itis found that all MFCs have higher power output ascompared to their counterpart CFCs. However,maximum power output was displayed by DGCs.Moreover, a lemon fuel cell has the higher poweroutput as compared to the fuel cells of other citrusfruit. This approach can be used to overcome thedisadvantages of many non-renewable and conven-tional sources of energy including burning of fossilfuels to mitigate the major source of global warmingand pollution by using such biodegradable andrenewable sources.
Keywords: citrus fruit, bioelectricity, direct method,indirect method, galvanic cell, microbial fuel cell, E.coli
1. Introduction
Energy is the prime requirement of all sectorsincluding industry, transportation, agriculture anddomestic use without which advancement of tech-nology and survival of life is not possible (Carvalhoet al., 2011). Most of the energy around the worldcomes from non-renewable sources including:petroleum, coal, oil and natural gas which are beingdepleting at a high rate (Larhum, 2010). Fossil fuelsare the major source of global warming and pollu-tion due to increase in greenhouse gases, volatilematter and particles in the atmosphere (Khan et al.,2011). However, technologies of renewable energyare growing worldwide that can overcome thesedrawbacks (Christi, 2007; Goff et al., 2004; Ha etal., 2010). Biomass, which includes agriculturalcrops, seeds, algae and biowastes are major sourcesof renewable energy that replenish themselvesthrough natural processes (Hossain and Mekhled,2010; Mata et al., 2010; Dincer, 2000).Bioelectricity generation is reported from waste-water using a microbial fuel cell (Khan 2009, Khanet al., 2010, Khan et al., 2011, Khan and Naz,2014). Lemon, orange and grapefruit are examplesof biomass and commonly known as citrus fruit(Randhawa et al., 2014). They contain citric acid,sugar and other ingredients with sufficient chemicalenergy that can be converted into electrical energyby means of redox reaction with a specific conditionand thus be utilized as batteries to light up LEDsand power up a clock or a calculator etc. (Kelter andMorgan, 1996; Goodisman, 2001; Swartling et al.,1998). Under certain conditions, the citric acid con-tained in citrus fruit may act as an electrolyte, whichenables the generation of electricity just the sameway as a galvanic battery (Oon, 2007).
The population around the globe is continuous-ly increasing, which is demanding not only morefood but also the energy to fulfil the requirement ofthe latest needs and technology. Some crops maybe produced and consumed for both purposes likecorn, sugarcane, fruit and vegetable oils. Therefore,
90 Journal of Energy in Southern Africa • Vol 26 No 3 • August 2015
Comparative bioelectricity generation from waste citrus
fruit using a galvanic cell, fuel cell and microbial fuel cell
Abdul Majeed Khan
Muhammad ObaidDepartment of Chemistry, Federal Urdu University, Gulshan-e-Iqbal Campus, Karachi, Pakistan
there is an urgent need to develop the food vs.energy priority for a sustainable future. However,the increase in crop yield with the passage of time isnot as per the desired level, which may increase theprice of food grain but on the other hand, hectors ofarable land is available for additional harvesting ofcrops for both food and fuel (energy). This manu-script demonstrates the conversion of waste to ener-gy using waste citrus fruit as a source of biofeed-stock. Large quantities of waste citrus fruit are gen-erated from agricultural processes and in the retailmarkets worldwide. This waste is often simplydumped into landfills or the ocean. Therefore, thereis no doubt in easy availability and cheap prices ofsuch waste biofeedstock. Waste citrus fruit has suffi-cient content of acid and sugar that can be used forthe production of bioelectricity using a galvanic celland microbial fuel cell technology at a laboratoryscale. This will not only reduce the disposal cost ofwaste but also increase a total of the production ofbioenergy with nominal investment. Moreover, theproduction of citrus fruit is increasing gradually andthere is no evidence that the supply of citrus fruitwill face a shortage in the near future. Therefore,there is no significant impact of food vs energy dueto the generation of bioelectricity from waste citrusfruit.
2. Experimental
2.1. Materials and instruments
The materials and instruments applied during thisresearch included analytical weighing balance TE3135-DS (Sartoris, Germany), digital multimeter,CD771 (Sanawa, Japan), pH meter, Hi-9810(Hanna, Rhode Island), TDS/ conductivity meter,LF12 (Schott, Germany), Karl Fisher (Mettler,USA), Binocular Microscope, 107BN (JinhuaHuiyou Equipment and Instrument Co. Ltd.), incu-bator (MMM Medcenter Einrich-tungen, Germany),autoclave YX 280B (China), Cumber test kit(Roche), copper electrode, zinc electrode, LED(light bulb), copper electrical wire, connector, alliga-tor clip, fruit (lemons, oranges, grapefruit), sodiumchloride solution (1%), distilled water, potassiumchloride (KCl), volumetric flask, beaker, glass vessel,container, PVC pipe and microorganism (E. coli),glass slide, crystal violet, Gram’s stain, safranin,ethanol, and a wire loop.
2.2. Direct galvanic cell (DGC)
In this experiment, four series of fruit were studiedfor the generation of bioelectricity. The three seriescontain a single type of either of the waste fruit(lemon, orange and grapefruit) and the fourth seriescontain mixed fruit arranged in alternate arrange-ment in a successive manner. A zinc electrode ofdimension 5 cm x 1 cm was inserted into one sideof the fruit and a copper electrode of the samedimension was inserted into another side of the
fruit. A copper wire was connected to the zinc elec-trode on one end and the other end was connectedto one end of the electric socket. Similarly, a copperwire was connected to the copper electrode on oneend and the other end was connected to anotherend of the electric socket to complete the circuit.
The voltage, current and other parameters ofthis electric circuit were determined with a digitalmultimeter with a positive terminal connected to thezinc electrode and a negative terminal connectedwith copper electrode. The LED was connected tothe circuit with zinc electrode to its short leg andcopper electrode to its long leg. Then the numbersof citrus fruit were increased in series by connectingthe zinc electrode of one fruit to the copper elec-trode of the next fruit via copper wire using alligatorclips. In addition to the above series combination,the cells were also connected in parallel sequenceby connecting the anode electrodes (zinc) of all cellstogether and the cathode electrodes (copper) of allcells together. The electrical parameters were deter-mined using the same multimeter. Afterwards, 1%solution (1 ml) of NaCl was injected into each fruitand the electrical parameters were measured (seeFigure 1).
2.3. Indirect galvanic cell (IDGC)
During this experiment, the juice of waste citrus fruit(lemon, orange, grapefruit and mixed fruit), werecollected into a separate glass vessel. The parame-ters of the fruit juices including pH, total dissolvedsolids (TDS), water content (Karl Fisher), acid con-tent, salinity were determined and compared. Thejuices of citrus fruit were transferred into 1 to 4 glassvessels. One electrode of each metal (zinc and cop-per) of dimension 5 cm x 1 cm was inserted into thefruit juice distant (2 to 4 cm) to each other. A cop-per wire was connected to the zinc electrode on oneend and the other end was connected to an electricsocket. Similarly, a copper wire was connected tothe copper electrode on one end and the other endwas connected to the electric socket to complete thecircuit. The voltage and current were noted by con-necting a digital multimeter. The positive terminalwas connected to the zinc electrode and negativeterminal to the copper electrode. The LED was con-nected to the zinc electrode to its short leg and thecopper electrode to the long leg of the LED bulb.The cell units were also connected in a series andparallel combination and the electrical parameterswere determined using the same multimeter.Afterwards, 1% solution (1 ml) of NaCl was inject-ed into each fruit juice and the electrical parameterswere measured.
2.4. Conventional fuel cell
The construction of a conventional fuel cell (CFC)consists of two chambers. One is the Anodic cham-ber containing either of the fruit juice of waste
Journal of Energy in Southern Africa • Vol 26 No 3 • August 2015 91
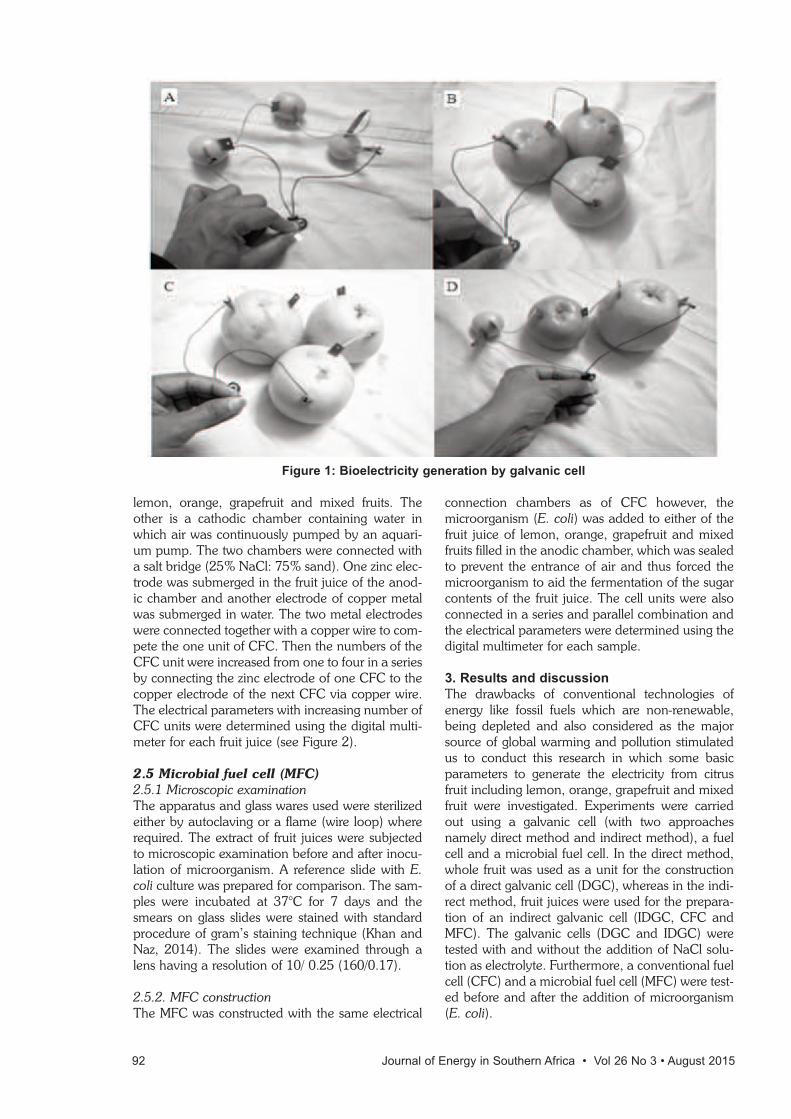
lemon, orange, grapefruit and mixed fruits. Theother is a cathodic chamber containing water inwhich air was continuously pumped by an aquari-um pump. The two chambers were connected witha salt bridge (25% NaCl: 75% sand). One zinc elec-trode was submerged in the fruit juice of the anod-ic chamber and another electrode of copper metalwas submerged in water. The two metal electrodeswere connected together with a copper wire to com-pete the one unit of CFC. Then the numbers of theCFC unit were increased from one to four in a seriesby connecting the zinc electrode of one CFC to thecopper electrode of the next CFC via copper wire.The electrical parameters with increasing number ofCFC units were determined using the digital multi-meter for each fruit juice (see Figure 2).
2.5 Microbial fuel cell (MFC)
2.5.1 Microscopic examinationThe apparatus and glass wares used were sterilizedeither by autoclaving or a flame (wire loop) whererequired. The extract of fruit juices were subjectedto microscopic examination before and after inocu-lation of microorganism. A reference slide with E.coli culture was prepared for comparison. The sam-ples were incubated at 37°C for 7 days and thesmears on glass slides were stained with standardprocedure of gram’s staining technique (Khan andNaz, 2014). The slides were examined through alens having a resolution of 10/ 0.25 (160/0.17).
2.5.2. MFC constructionThe MFC was constructed with the same electrical
connection chambers as of CFC however, themicroorganism (E. coli) was added to either of thefruit juice of lemon, orange, grapefruit and mixedfruits filled in the anodic chamber, which was sealedto prevent the entrance of air and thus forced themicroorganism to aid the fermentation of the sugarcontents of the fruit juice. The cell units were alsoconnected in a series and parallel combination andthe electrical parameters were determined using thedigital multimeter for each sample.
3. Results and discussion
The drawbacks of conventional technologies ofenergy like fossil fuels which are non-renewable,being depleted and also considered as the majorsource of global warming and pollution stimulatedus to conduct this research in which some basicparameters to generate the electricity from citrusfruit including lemon, orange, grapefruit and mixedfruit were investigated. Experiments were carriedout using a galvanic cell (with two approachesnamely direct method and indirect method), a fuelcell and a microbial fuel cell. In the direct method,whole fruit was used as a unit for the constructionof a direct galvanic cell (DGC), whereas in the indi-rect method, fruit juices were used for the prepara-tion of an indirect galvanic cell (IDGC, CFC andMFC). The galvanic cells (DGC and IDGC) weretested with and without the addition of NaCl solu-tion as electrolyte. Furthermore, a conventional fuelcell (CFC) and a microbial fuel cell (MFC) were test-ed before and after the addition of microorganism(E. coli).
92 Journal of Energy in Southern Africa • Vol 26 No 3 • August 2015
Figure 1: Bioelectricity generation by galvanic cell
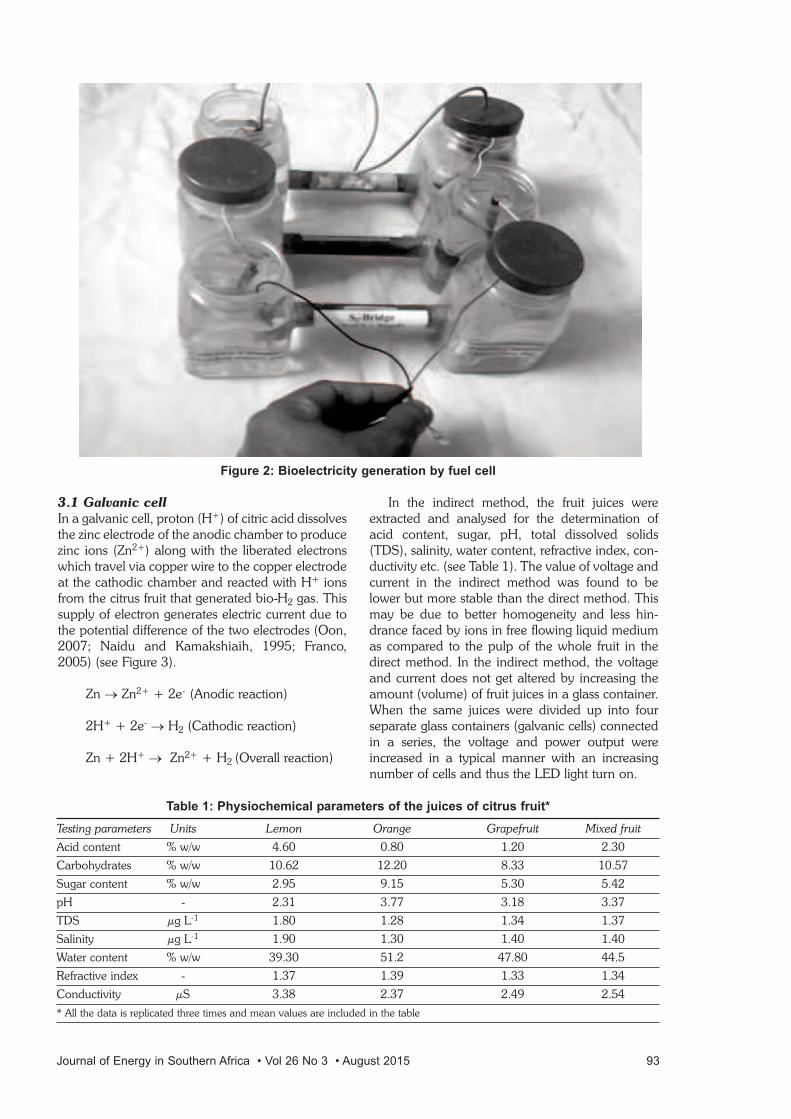
3.1 Galvanic cell
In a galvanic cell, proton (H+) of citric acid dissolvesthe zinc electrode of the anodic chamber to producezinc ions (Zn2+) along with the liberated electronswhich travel via copper wire to the copper electrodeat the cathodic chamber and reacted with H+ ionsfrom the citrus fruit that generated bio-H2 gas. Thissupply of electron generates electric current due tothe potential difference of the two electrodes (Oon,2007; Naidu and Kamakshiaih, 1995; Franco,2005) (see Figure 3).
Zn → Zn2+ + 2e- (Anodic reaction)
2H+ + 2e- → H2 (Cathodic reaction)
Zn + 2H+ → Zn2+ + H2 (Overall reaction)
In the indirect method, the fruit juices wereextracted and analysed for the determination ofacid content, sugar, pH, total dissolved solids(TDS), salinity, water content, refractive index, con-ductivity etc. (see Table 1). The value of voltage andcurrent in the indirect method was found to belower but more stable than the direct method. Thismay be due to better homogeneity and less hin-drance faced by ions in free flowing liquid mediumas compared to the pulp of the whole fruit in thedirect method. In the indirect method, the voltageand current does not get altered by increasing theamount (volume) of fruit juices in a glass container.When the same juices were divided up into fourseparate glass containers (galvanic cells) connectedin a series, the voltage and power output wereincreased in a typical manner with an increasingnumber of cells and thus the LED light turn on.
Journal of Energy in Southern Africa • Vol 26 No 3 • August 2015 93
Figure 2: Bioelectricity generation by fuel cell
Table 1: Physiochemical parameters of the juices of citrus fruit*
Testing parameters Units Lemon Orange Grapefruit Mixed fruit
Acid content % w/w 4.60 0.80 1.20 2.30
Carbohydrates % w/w 10.62 12.20 8.33 10.57
Sugar content % w/w 2.95 9.15 5.30 5.42
pH - 2.31 3.77 3.18 3.37
TDS µg L-1 1.80 1.28 1.34 1.37
Salinity µg L-1 1.90 1.30 1.40 1.40
Water content % w/w 39.30 51.2 47.80 44.5
Refractive index - 1.37 1.39 1.33 1.34
Conductivity µS 3.38 2.37 2.49 2.54
* All the data is replicated three times and mean values are included in the table
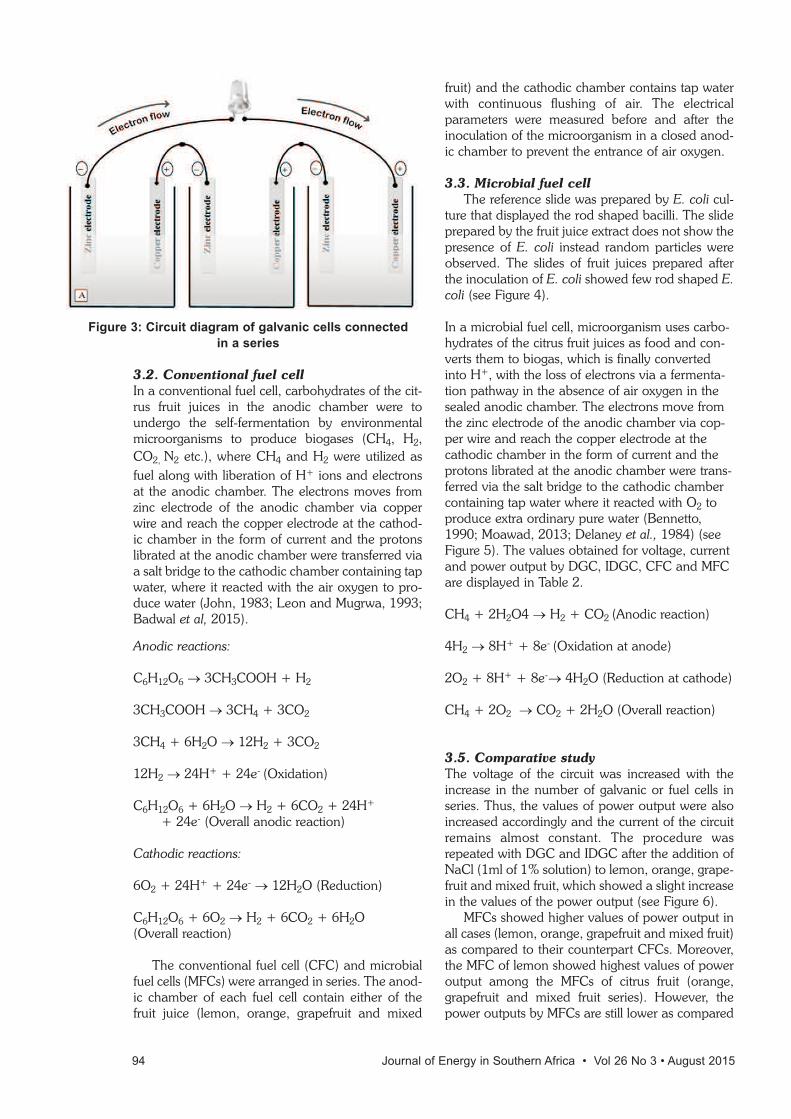
3.2. Conventional fuel cell
In a conventional fuel cell, carbohydrates of the cit-rus fruit juices in the anodic chamber were toundergo the self-fermentation by environmentalmicroorganisms to produce biogases (CH4, H2,CO2, N2 etc.), where CH4 and H2 were utilized asfuel along with liberation of H+ ions and electronsat the anodic chamber. The electrons moves fromzinc electrode of the anodic chamber via copperwire and reach the copper electrode at the cathod-ic chamber in the form of current and the protonslibrated at the anodic chamber were transferred viaa salt bridge to the cathodic chamber containing tapwater, where it reacted with the air oxygen to pro-duce water (John, 1983; Leon and Mugrwa, 1993;Badwal et al, 2015).
Anodic reactions:
C6H12O6 → 3CH3COOH + H2
3CH3COOH → 3CH4 + 3CO2
3CH4 + 6H2O → 12H2 + 3CO2
12H2 → 24H+ + 24e- (Oxidation)
C6H12O6 + 6H2O → H2 + 6CO2 + 24H+
+ 24e- (Overall anodic reaction)
Cathodic reactions:
6O2 + 24H+ + 24e- → 12H2O (Reduction)
C6H12O6 + 6O2 → H2 + 6CO2 + 6H2O (Overall reaction)
The conventional fuel cell (CFC) and microbialfuel cells (MFCs) were arranged in series. The anod-ic chamber of each fuel cell contain either of thefruit juice (lemon, orange, grapefruit and mixed
fruit) and the cathodic chamber contains tap waterwith continuous flushing of air. The electricalparameters were measured before and after theinoculation of the microorganism in a closed anod-ic chamber to prevent the entrance of air oxygen.
3.3. Microbial fuel cell
The reference slide was prepared by E. coli cul-ture that displayed the rod shaped bacilli. The slideprepared by the fruit juice extract does not show thepresence of E. coli instead random particles wereobserved. The slides of fruit juices prepared afterthe inoculation of E. coli showed few rod shaped E.coli (see Figure 4).
In a microbial fuel cell, microorganism uses carbo-hydrates of the citrus fruit juices as food and con-verts them to biogas, which is finally convertedinto H+, with the loss of electrons via a fermenta-tion pathway in the absence of air oxygen in thesealed anodic chamber. The electrons move fromthe zinc electrode of the anodic chamber via cop-per wire and reach the copper electrode at thecathodic chamber in the form of current and theprotons librated at the anodic chamber were trans-ferred via the salt bridge to the cathodic chambercontaining tap water where it reacted with O2 toproduce extra ordinary pure water (Bennetto,1990; Moawad, 2013; Delaney et al., 1984) (seeFigure 5). The values obtained for voltage, currentand power output by DGC, IDGC, CFC and MFCare displayed in Table 2.
CH4 + 2H2O4 → H2 + CO2 (Anodic reaction)
4H2 → 8H+ + 8e- (Oxidation at anode)
2O2 + 8H+ + 8e-→ 4H2O (Reduction at cathode)
CH4 + 2O2 → CO2 + 2H2O (Overall reaction)
3.5. Comparative study
The voltage of the circuit was increased with theincrease in the number of galvanic or fuel cells inseries. Thus, the values of power output were alsoincreased accordingly and the current of the circuitremains almost constant. The procedure wasrepeated with DGC and IDGC after the addition ofNaCl (1ml of 1% solution) to lemon, orange, grape-fruit and mixed fruit, which showed a slight increasein the values of the power output (see Figure 6).
MFCs showed higher values of power output inall cases (lemon, orange, grapefruit and mixed fruit)as compared to their counterpart CFCs. Moreover,the MFC of lemon showed highest values of poweroutput among the MFCs of citrus fruit (orange,grapefruit and mixed fruit series). However, thepower outputs by MFCs are still lower as compared
94 Journal of Energy in Southern Africa • Vol 26 No 3 • August 2015
Figure 3: Circuit diagram of galvanic cells connected
in a series
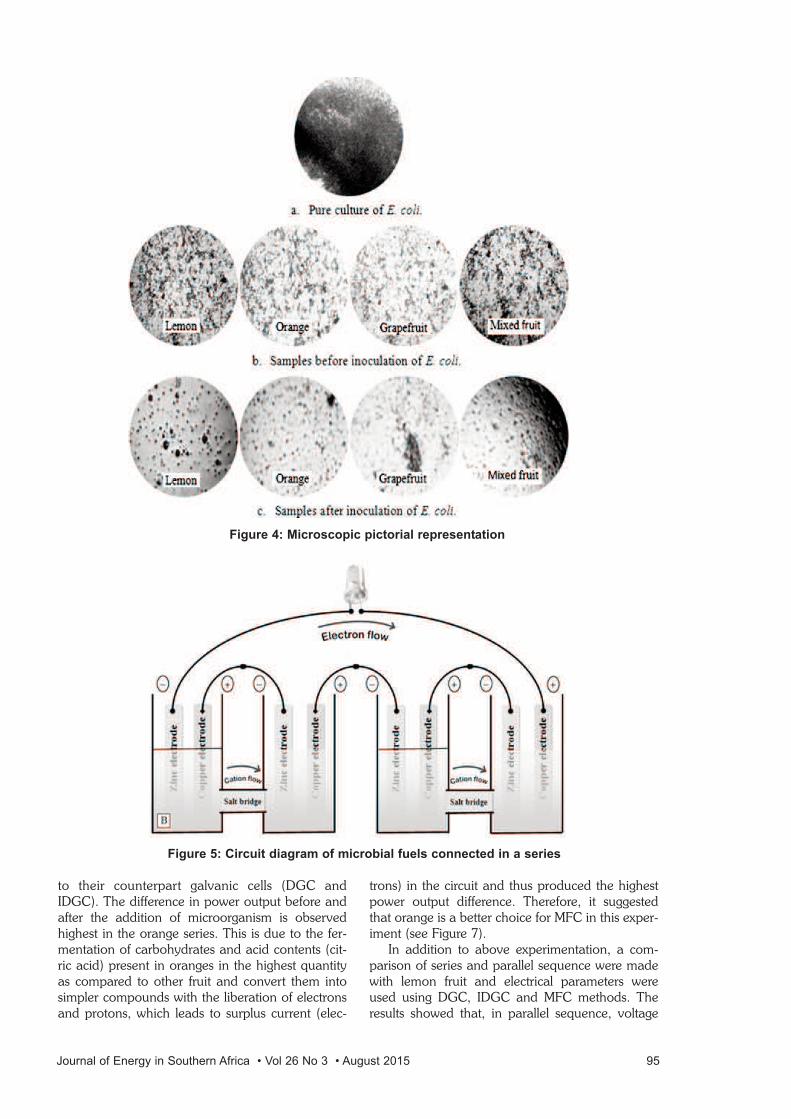
to their counterpart galvanic cells (DGC andIDGC). The difference in power output before andafter the addition of microorganism is observedhighest in the orange series. This is due to the fer-mentation of carbohydrates and acid contents (cit-ric acid) present in oranges in the highest quantityas compared to other fruit and convert them intosimpler compounds with the liberation of electronsand protons, which leads to surplus current (elec-
trons) in the circuit and thus produced the highestpower output difference. Therefore, it suggestedthat orange is a better choice for MFC in this exper-iment (see Figure 7).
In addition to above experimentation, a com-parison of series and parallel sequence were madewith lemon fruit and electrical parameters wereused using DGC, IDGC and MFC methods. Theresults showed that, in parallel sequence, voltage
Journal of Energy in Southern Africa • Vol 26 No 3 • August 2015 95
Figure 4: Microscopic pictorial representation
Figure 5: Circuit diagram of microbial fuels connected in a series
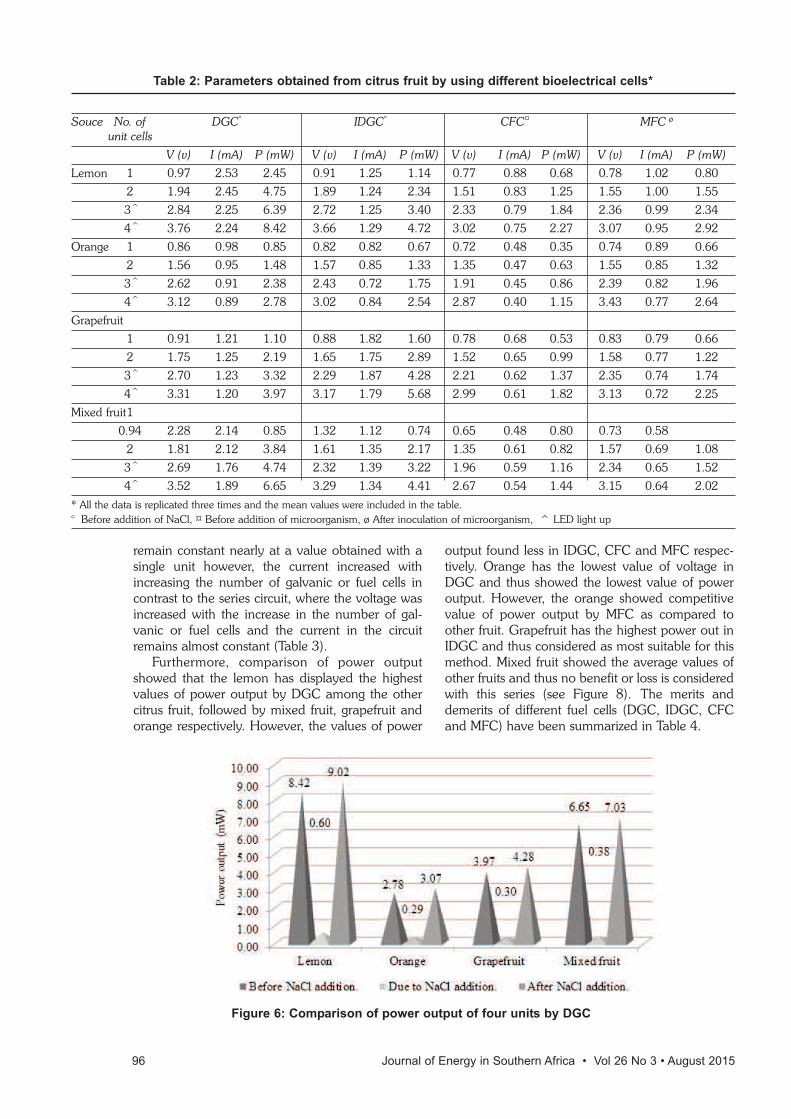
remain constant nearly at a value obtained with asingle unit however, the current increased withincreasing the number of galvanic or fuel cells incontrast to the series circuit, where the voltage wasincreased with the increase in the number of gal-vanic or fuel cells and the current in the circuitremains almost constant (Table 3).
Furthermore, comparison of power outputshowed that the lemon has displayed the highestvalues of power output by DGC among the othercitrus fruit, followed by mixed fruit, grapefruit andorange respectively. However, the values of power
output found less in IDGC, CFC and MFC respec-tively. Orange has the lowest value of voltage inDGC and thus showed the lowest value of poweroutput. However, the orange showed competitivevalue of power output by MFC as compared toother fruit. Grapefruit has the highest power out inIDGC and thus considered as most suitable for thismethod. Mixed fruit showed the average values ofother fruits and thus no benefit or loss is consideredwith this series (see Figure 8). The merits anddemerits of different fuel cells (DGC, IDGC, CFCand MFC) have been summarized in Table 4.
96 Journal of Energy in Southern Africa • Vol 26 No 3 • August 2015
Table 2: Parameters obtained from citrus fruit by using different bioelectrical cells*
Souce No. of DGC° IDGC° CFC¤ MFC ø
unit cells
V (v) I (mA) P (mW) V (v) I (mA) P (mW) V (v) I (mA) P (mW) V (v) I (mA) P (mW)
Lemon 1 0.97 2.53 2.45 0.91 1.25 1.14 0.77 0.88 0.68 0.78 1.02 0.80
2 1.94 2.45 4.75 1.89 1.24 2.34 1.51 0.83 1.25 1.55 1.00 1.55
3^ 2.84 2.25 6.39 2.72 1.25 3.40 2.33 0.79 1.84 2.36 0.99 2.34
4^ 3.76 2.24 8.42 3.66 1.29 4.72 3.02 0.75 2.27 3.07 0.95 2.92
Orange 1 0.86 0.98 0.85 0.82 0.82 0.67 0.72 0.48 0.35 0.74 0.89 0.66
2 1.56 0.95 1.48 1.57 0.85 1.33 1.35 0.47 0.63 1.55 0.85 1.32
3^ 2.62 0.91 2.38 2.43 0.72 1.75 1.91 0.45 0.86 2.39 0.82 1.96
4^ 3.12 0.89 2.78 3.02 0.84 2.54 2.87 0.40 1.15 3.43 0.77 2.64
Grapefruit
1 0.91 1.21 1.10 0.88 1.82 1.60 0.78 0.68 0.53 0.83 0.79 0.66
2 1.75 1.25 2.19 1.65 1.75 2.89 1.52 0.65 0.99 1.58 0.77 1.22
3^ 2.70 1.23 3.32 2.29 1.87 4.28 2.21 0.62 1.37 2.35 0.74 1.74
4^ 3.31 1.20 3.97 3.17 1.79 5.68 2.99 0.61 1.82 3.13 0.72 2.25
Mixed fruit1
0.94 2.28 2.14 0.85 1.32 1.12 0.74 0.65 0.48 0.80 0.73 0.58
2 1.81 2.12 3.84 1.61 1.35 2.17 1.35 0.61 0.82 1.57 0.69 1.08
3^ 2.69 1.76 4.74 2.32 1.39 3.22 1.96 0.59 1.16 2.34 0.65 1.52
4^ 3.52 1.89 6.65 3.29 1.34 4.41 2.67 0.54 1.44 3.15 0.64 2.02
* All the data is replicated three times and the mean values were included in the table.° Before addition of NaCl, ¤ Before addition of microorganism, ø After inoculation of microorganism, ^ LED light up
Figure 6: Comparison of power output of four units by DGC
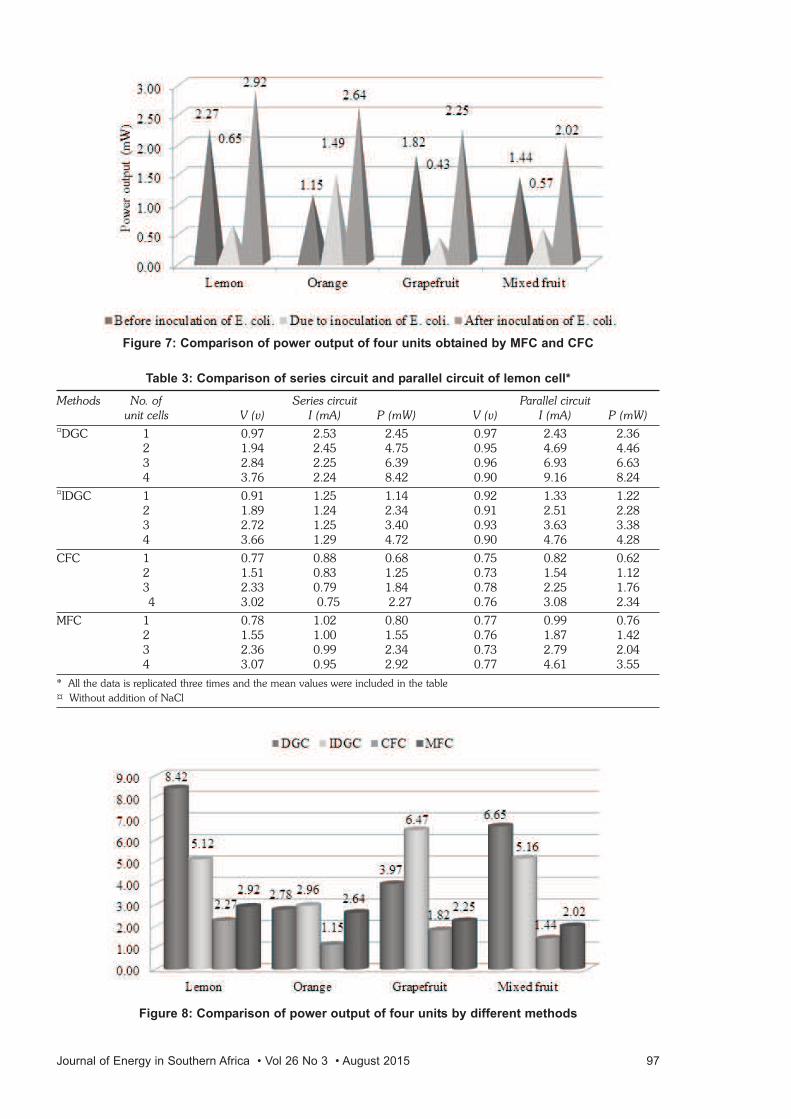
Journal of Energy in Southern Africa • Vol 26 No 3 • August 2015 97
Figure 7: Comparison of power output of four units obtained by MFC and CFC
Table 3: Comparison of series circuit and parallel circuit of lemon cell*
Methods No. of Series circuit Parallel circuitunit cells V (v) I (mA) P (mW) V (v) I (mA) P (mW)
¤DGC 1 0.97 2.53 2.45 0.97 2.43 2.362 1.94 2.45 4.75 0.95 4.69 4.463 2.84 2.25 6.39 0.96 6.93 6.634 3.76 2.24 8.42 0.90 9.16 8.24
¤IDGC 1 0.91 1.25 1.14 0.92 1.33 1.222 1.89 1.24 2.34 0.91 2.51 2.283 2.72 1.25 3.40 0.93 3.63 3.384 3.66 1.29 4.72 0.90 4.76 4.28
CFC 1 0.77 0.88 0.68 0.75 0.82 0.622 1.51 0.83 1.25 0.73 1.54 1.123 2.33 0.79 1.84 0.78 2.25 1.764 3.02 0.75 2.27 0.76 3.08 2.34
MFC 1 0.78 1.02 0.80 0.77 0.99 0.762 1.55 1.00 1.55 0.76 1.87 1.423 2.36 0.99 2.34 0.73 2.79 2.044 3.07 0.95 2.92 0.77 4.61 3.55
* All the data is replicated three times and the mean values were included in the table¤ Without addition of NaCl
Figure 8: Comparison of power output of four units by different methods
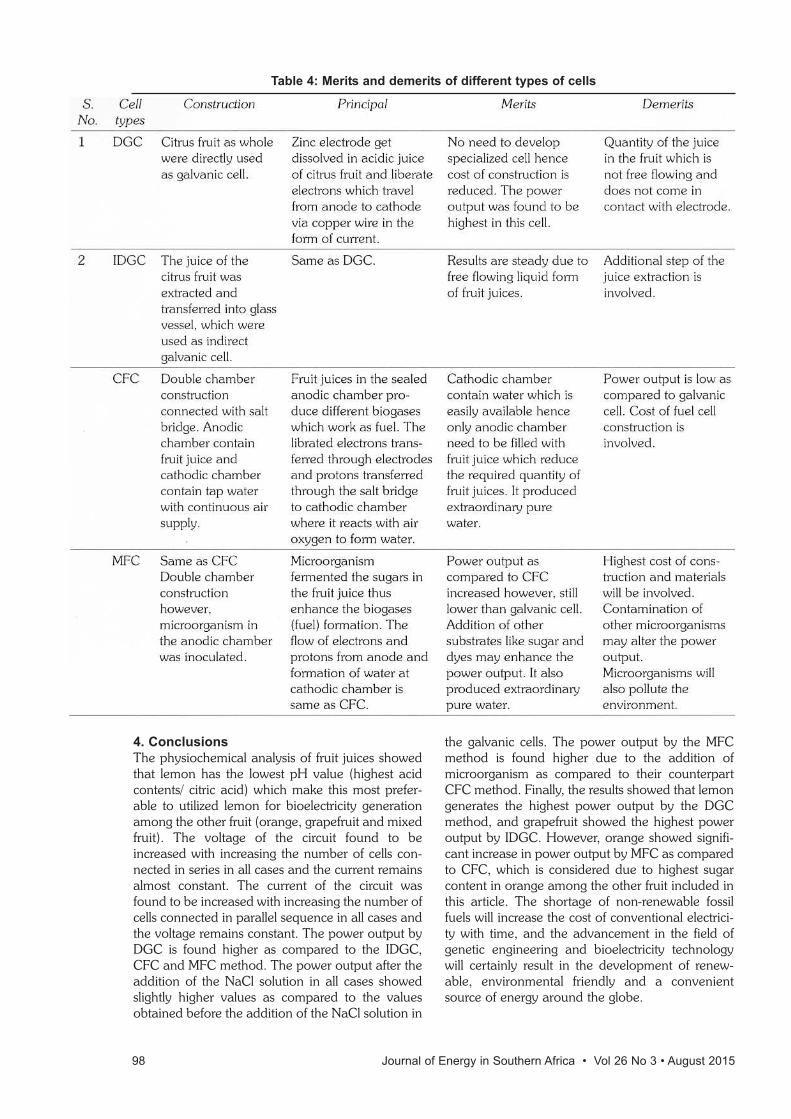
4. Conclusions
The physiochemical analysis of fruit juices showedthat lemon has the lowest pH value (highest acidcontents/ citric acid) which make this most prefer-able to utilized lemon for bioelectricity generationamong the other fruit (orange, grapefruit and mixedfruit). The voltage of the circuit found to beincreased with increasing the number of cells con-nected in series in all cases and the current remainsalmost constant. The current of the circuit wasfound to be increased with increasing the number ofcells connected in parallel sequence in all cases andthe voltage remains constant. The power output byDGC is found higher as compared to the IDGC,CFC and MFC method. The power output after theaddition of the NaCl solution in all cases showedslightly higher values as compared to the valuesobtained before the addition of the NaCl solution in
the galvanic cells. The power output by the MFCmethod is found higher due to the addition ofmicroorganism as compared to their counterpartCFC method. Finally, the results showed that lemongenerates the highest power output by the DGCmethod, and grapefruit showed the highest poweroutput by IDGC. However, orange showed signifi-cant increase in power output by MFC as comparedto CFC, which is considered due to highest sugarcontent in orange among the other fruit included inthis article. The shortage of non-renewable fossilfuels will increase the cost of conventional electrici-ty with time, and the advancement in the field ofgenetic engineering and bioelectricity technologywill certainly result in the development of renew-able, environmental friendly and a convenientsource of energy around the globe.
98 Journal of Energy in Southern Africa • Vol 26 No 3 • August 2015
Table 4: Merits and demerits of different types of cells
Acknowledgements
The authors are greatly thankful to the Higher EducationCommission of Pakistan for financial support. In addition,we are highly thankful to all those authors whose refer-ences were cited in this research article.
ReferencesBadwal, S. P. S., Giddey, S., Kulkarni, A., Goel, J., and
Basu, S. (2015). Direct ethanol fuel cells for trans-port and stationary applications – A comprehensivereview. Applied Energy 145. pp. 80-103. doi:10.1016/j.apenergy.2015.02.002.
Bennetto, H. P. (1990). Electricity generation bymicroorganism, Biotechnology Education, 1 (4), pp.163-168.
Carvalho, J., Ribeiro, A., Castro, J., Vilarinho, C. andCastro, F. (2011). Biodiesel production by microal-gae and macroalgae from north littoral Portuguesecoast. In: 1st International Conference held byCentre for Waste Valorisation (CVR) – Wastes:Solutions, Treatments and Opportunities,Guimarpes, Portugal, CVR, September 12th – 14th,2011.
Christi, Y. (2007). Biodiesel from microalgae,Biotechnology Advances, 25, pp. 294-296.
Delaney, G. M., Bennetto, H. P., Mason, J, R, Roller, S.D., Stirling, J. L. and Thurstan, C. F. (1984).Electron transfer coupling in microbial fuel cells, 2performance of fuel cells containing selectedmicroorganism-mediator-substrate combination,Journal of Chemical Technology and Biotechnology,34B, pp. 13-27.
Dincer, I. (2000). Renewable energy and sustainabledevelopment, Renewable and Sustainable EnergyReviews, 4, pp. 157-175.
Franco, D. (2005). “Volta and the‘Pile’”. Electrochemistry Encyclopaedia. CaseWestern Reserve University.
Goff, M., Nicholas, S. B., Shailesh, L., William, R. S.and Galen, J. S. (2004). Acid-catalysed alcoholysisof soybean oil, Journal of the American OilChemist’s Society, 81, pp. 415-420.
Goodisman, J. (2001). Observations on lemon cells,Journal of Chemical Education, 75 (4), pp. 516-518.
Ha, J. H., Shah, N., Islam, M. and Park, J. (2010).Production of bioethanol by simultaneous saccharifi-cation and fermentation process using waste frombeer fermentation broth, Journal of Biotechnology,150 (1), pp. 147-148.
Hossain, A. B. M.S. and Mekhled, M. A. (2010).Biodiesel fuel production from waste canola cookingoil as sustainable energy and environmental recy-cling process, Australian Journal of Crop Science, 4(7), pp. 543-549.
John A. A. (1989). Fuel Cell Handbook. New York: VanReinhold Co.
Kelter, P. B., Carr, J. D., Johnson, T. and Castro-Acuña,C. M. (1996). Citrus spp.: orange, mandarin, tanger-ine, clementine, grapefruit, pomelo, lemon and lime,Journal of Chemical Education, 73 (12), pp. 1123-1127.
Khan, A. M. and Naz, S. (2014). Biopower generationfrom kitchen wastewater using a bioreactor, Water
Environment Research, 86(1), pp. 3-12.Khan, A. M., Attaullah, Shaheen, A., Ahmed, I., Malik,
F. and Shahid, H. A. (2011). Correlation of CODand BOD of domestic wastewater with the poweroutput of bioreactor, Journal of the ChemicalSociety of Pakistan, 32 (2), pp. 269-274.
Khan, A. M. (2009). Electricity generation by microbialfuel cells, Advances in Natural and Applied Sciences,3(2), pp. 279-286.
Khan, A. M., Ali M. M., Naz S and Sohail M. (2010).Generation of electricity by the aerobic fermentationof domestic wastewater, Journal of the ChemicalSociety of Pakistan, 32(2), pp. 209-214.
Larhum, A. W. D. (2010). Limitations and prospects ofnatural photosynthesis for bioenergy production,Current Opinion in Biotechnology, 21, pp. 271-276.
Leo, B and Mugerwa, M. (1993). Fuel Cell Systems.New York: Plenum Press.
Moawad, E. Y. (2013). Growth Energy of Bacteria andthe Associated Electricity, Generation in Fuel Cells,Bioengineering and Bioscience 1(1), pp. 5-10.
Mata, T. M., Martins, A. A. and Caetano, N. S. (2010).Microalgae for biodiesel production and other appli-cations, Renewable and Sustainable Energy Reviews,14, pp. 217-232.
Naidu, M. S.; Kamakshiaih, S. (1995). Introduction toElectrical Engineering. Tata McGraw-Hill Education.p. 50. ISBN 9780074622926.
Oon, H. L. (2007). A simple electric cell, ChemistryExpression: An Inquiry Approach. Panpac EducationPte Ltd: Singapore, pp. 236. ISBN 978-981-271-162-5.
Randhawa, M. A., Rashid, A., Saeed, M., Javed, M. S.,Khan, A. A. and Sajid, M. W. (2014).Characterization of organic acids in juices in some ofPakistani citrus species and their retention duringrefrigerated storage, Journal of Animal and PlantScience, 24 (1), pp. 211-215.
Swartling, D. J. and Morgan, C. (1998) Lemon cellsrevisited-The lemon-powered calculator, Journal ofChemical Education, 75 (2), pp. 181-182.
Received 26 July 2014; revised 16 March 2015
Journal of Energy in Southern Africa • Vol 26 No 3 • August 2015 99
Abstract
Nowadays, the world is more focused on hydraulicenergy, which scientists have initiated thoroughanalyses of hydropower resources. The potential ofwind power generation is immense. It is an histori-cal source of energy but wind power is not applica-ble in this case. In India, water can be used for both- as a source of electricity and for irrigation and agri-cultural use. Impulse type water wheels wereemployed until flow is accessible. According toavailable literature, there are three types of waterwheels and the application of a particular type ofwater wheel depends upon the stream of water. Inthis article, an extremely uncomplicated categoryimpulse water wheel is fabricated. To fabricate thiswater wheel, little engineering is required. Theexperimental results obtained indicate that intensityof generated power depends upon the angle ofwater impact on the turbine blade, height, quantityof water flowing in pipe etc. The aim of this articleis to suggest an alternative source of economicaland environmentally friendly green energy for asmall quantity of fluid flowing. There are varioussources of small quantity water such as large socie-ty storage tank water, sewer line water, canals waterand many more. The construction cost of waterwheels is not as much since it does not have an intri-cate blade profile.
Keywords: water head, impulse, water wheel,angle, flow quantity, green energy, prototype, fabri-cation
List of symbols
P = Power in Wattsη = Hydraulic Efficiencyρ = Density of WaterQ = Volume of Water flowing in turbineH = Water pressure head
Fx = Force exerted by water Jeta = Cross-sectional area of Water Jetd = Diameter of JetV1 = Velocity of Jet at Inlet of Turbine BladeVw1 = Velocity of the whirl at inlet in m/s.Vw2 = Velocity of the whirl at outlet in m/sWJ = Work done by Jet on Turbineβ = Angle of Vane at outlet
Introduction
Water wheels are the oldest machines used for var-ious purposes. Initially, water wheels were madefrom wood and efficiency of the wheels was verysmall because design of such water wheels wasbased on random selection of material, shape,dimensions etc.
Among all the renewable energy sources avail-able, small hydropower is considered as the mostpromising source of energy. In many parts of thecountry, especially hill states, streams coming downthe hills possess sufficient potential energy that canbe utilized. The water wheels are used to convertthe potential energy of water to mechanical energy.Flowing water is directed onto the blades of waterwheels, creating a force on the blades which in turn,rotates the shaft (Khurana et al., 2012).
In the modern scenario, the development of thewater wheel is based on the principle of hydraulicengineering, proper material selection, considera-tion of aerodynamic forces etc. Therefore, the effi-ciency of modern water wheels has increasedsharply. The development of steam engines andhydraulic turbines also has been a milestone in thedevelopment of water wheels. Nowadays, waterwheels are rarely used but there is large scope forwater wheels in the modern era for utilizing smallwater flow and salvaging kinetic energy (Muller etal., 2004).
100 Journal of Energy in Southern Africa • Vol 26 No 3 • August 2015
The effect of an angle on the impact and flow quantity on
output power of an impulse water wheel model
Ram K TyagiDepartment of Mechanical Engineering, Amity School of Engineering and Technology, Amity University, Uttar
Pradesh, Noida, India
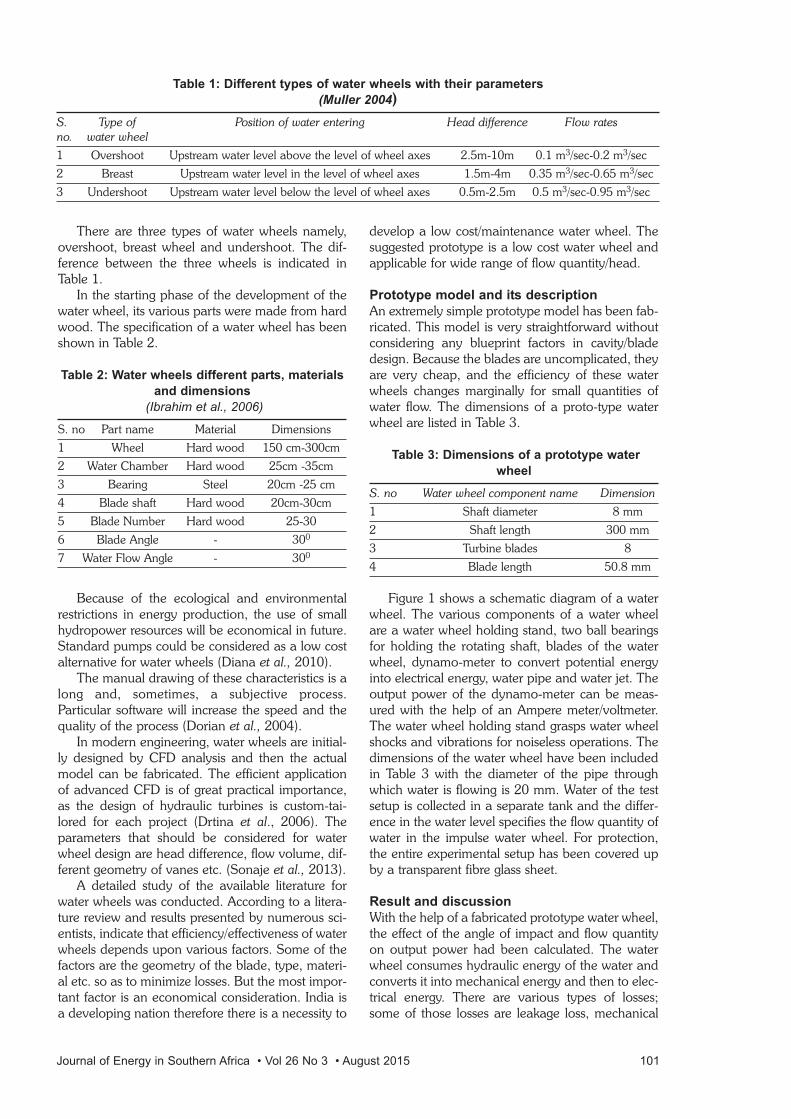
There are three types of water wheels namely,overshoot, breast wheel and undershoot. The dif-ference between the three wheels is indicated inTable 1.
In the starting phase of the development of thewater wheel, its various parts were made from hardwood. The specification of a water wheel has beenshown in Table 2.
Table 2: Water wheels different parts, materials
and dimensions
(Ibrahim et al., 2006)
S. no Part name Material Dimensions
1 Wheel Hard wood 150 cm-300cm
2 Water Chamber Hard wood 25cm -35cm
3 Bearing Steel 20cm -25 cm
4 Blade shaft Hard wood 20cm-30cm
5 Blade Number Hard wood 25-30
6 Blade Angle - 300
7 Water Flow Angle - 300
Because of the ecological and environmentalrestrictions in energy production, the use of smallhydropower resources will be economical in future.Standard pumps could be considered as a low costalternative for water wheels (Diana et al., 2010).
The manual drawing of these characteristics is along and, sometimes, a subjective process.Particular software will increase the speed and thequality of the process (Dorian et al., 2004).
In modern engineering, water wheels are initial-ly designed by CFD analysis and then the actualmodel can be fabricated. The efficient applicationof advanced CFD is of great practical importance,as the design of hydraulic turbines is custom-tai-lored for each project (Drtina et al., 2006). Theparameters that should be considered for waterwheel design are head difference, flow volume, dif-ferent geometry of vanes etc. (Sonaje et al., 2013).
A detailed study of the available literature forwater wheels was conducted. According to a litera-ture review and results presented by numerous sci-entists, indicate that efficiency/effectiveness of waterwheels depends upon various factors. Some of thefactors are the geometry of the blade, type, materi-al etc. so as to minimize losses. But the most impor-tant factor is an economical consideration. India isa developing nation therefore there is a necessity to
develop a low cost/maintenance water wheel. Thesuggested prototype is a low cost water wheel andapplicable for wide range of flow quantity/head.
Prototype model and its description
An extremely simple prototype model has been fab-ricated. This model is very straightforward withoutconsidering any blueprint factors in cavity/bladedesign. Because the blades are uncomplicated, theyare very cheap, and the efficiency of these waterwheels changes marginally for small quantities ofwater flow. The dimensions of a proto-type waterwheel are listed in Table 3.
Table 3: Dimensions of a prototype water
wheel
S. no Water wheel component name Dimension
1 Shaft diameter 8 mm
2 Shaft length 300 mm
3 Turbine blades 8
4 Blade length 50.8 mm
Figure 1 shows a schematic diagram of a waterwheel. The various components of a water wheelare a water wheel holding stand, two ball bearingsfor holding the rotating shaft, blades of the waterwheel, dynamo-meter to convert potential energyinto electrical energy, water pipe and water jet. Theoutput power of the dynamo-meter can be meas-ured with the help of an Ampere meter/voltmeter.The water wheel holding stand grasps water wheelshocks and vibrations for noiseless operations. Thedimensions of the water wheel have been includedin Table 3 with the diameter of the pipe throughwhich water is flowing is 20 mm. Water of the testsetup is collected in a separate tank and the differ-ence in the water level specifies the flow quantity ofwater in the impulse water wheel. For protection,the entire experimental setup has been covered upby a transparent fibre glass sheet.
Result and discussion
With the help of a fabricated prototype water wheel,the effect of the angle of impact and flow quantityon output power had been calculated. The waterwheel consumes hydraulic energy of the water andconverts it into mechanical energy and then to elec-trical energy. There are various types of losses;some of those losses are leakage loss, mechanical
Journal of Energy in Southern Africa • Vol 26 No 3 • August 2015 101
Table 1: Different types of water wheels with their parameters
(Muller 2004)
S. Type of Position of water entering Head difference Flow ratesno. water wheel
1 Overshoot Upstream water level above the level of wheel axes 2.5m-10m 0.1 m3/sec-0.2 m3/sec
2 Breast Upstream water level in the level of wheel axes 1.5m-4m 0.35 m3/sec-0.65 m3/sec
3 Undershoot Upstream water level below the level of wheel axes 0.5m-2.5m 0.5 m3/sec-0.95 m3/sec
loss, electrical loss etc. The basic equations whichcan be used to find hydraulic energy had been dis-cussed by Tyagi (2012). Some equations which playa vital role for finding hydraulic energy are writtenfrom Equation 1 to Equation 7.
The total power available in falling water:
Figure 2 demonstrates the deviation in outputpower for different values of pressure heads. In thisdiagram, three impact angles have been consid-ered, and these angles are 90 degree, 75 degree,and 60 degree respectively. The outcome achievedby experimental analysis demonstrates that outputpower is directly related to the angle of impact onthe blade of the water wheel. The results in Figure 2also indicate that after a certain value of water headoutput power is approximately constant for particu-lar dimensions of the water wheel. After a certainvalue of pressure head, there is no effect of increas-ing pressure on output power because a criticalvelocity of the water wheel is achieved. In the waterwheel, the critical velocity is the parameter wherethe wheel attains the maximum velocity for a par-ticular type of wheel. The value of the critical veloc-ity depends upon numerous parameters, some ofwhich are: wheel dimensions, and geometry ofwater wheel blade.
Figure 3 shows the variation of the water wheeloutput power versus flow quanity of water. Theresult obtained in Figure 3 indicates that after 1.5 l/sof water, there is no effect or only a marginal effecton output power. Again, water jet impact angles aresimilar to those discussed in the Figure 2. The resultobtained in Figure 2 illustritates that the criticalvelocity for the prototype wheel had been attainedat 1.5 l/s; and above this quantity there is no posi-tive effect on output power.
Figure 4 shows the variation of output powerversus angle of impact of water jet for different val-ues of the incident angle when the head and waterdischarge are fixed at 110 mm and 1.1 l/s respec-tively. In this experiment, the angle of impact of thewater jet varies from 0 degree to 180 degrees. Thevalue of the output power varies almost linearlyfrom zero to maximum from 0 to 90 degree andthen reduces from maximum to zero from 90 to 180degree. For given parameters the maximum value
102 Journal of Energy in Southern Africa • Vol 26 No 3 • August 2015
Figure 1: Schematic diagram of a prototype water wheel
of output power is 1.27 watts, when the angle ofimpact is 90 degree.
Figure 5 shows experimental results for the waterwheel model efficiency versus ratio of quantity offluid to maximum quantity of fluid for a water headof 110 mm. The efficiency and fluid quantity ratiograph have been drawn for incident water jet anglesof 90 degree, 75 degree, and 60 degree respective-ly. Above a ratio of quantity of fluid to maximumquantity of fluid of approximately 1.5 efficiency was
approximately constant.. Above that value, theeffect on output power is neglible.
Conclusions
A detailed study on the design of the simplest modelwater wheel has been investigated. In an experi-mental study, it was found that to make optimumuse of resources such as blade manufacturing cost,available water head etc., the simplest type of waterwheel will be a milestone for developing countries.
Journal of Energy in Southern Africa • Vol 26 No 3 • August 2015 103
Figure 2: Variation of energy output (W) versus water head (cm) for different values of water head
and discharge of water of 1.1 l/s
Figure 3: Variation of energy output (W) versus water discharge l/s for different values of water
discharge and head of water of 110 mm
Figure 4: Variation of energy output (W) versus angle of impact in degree for different values of
angle of incidence for head and discharge of water of 110 mm and 1.1 l/s
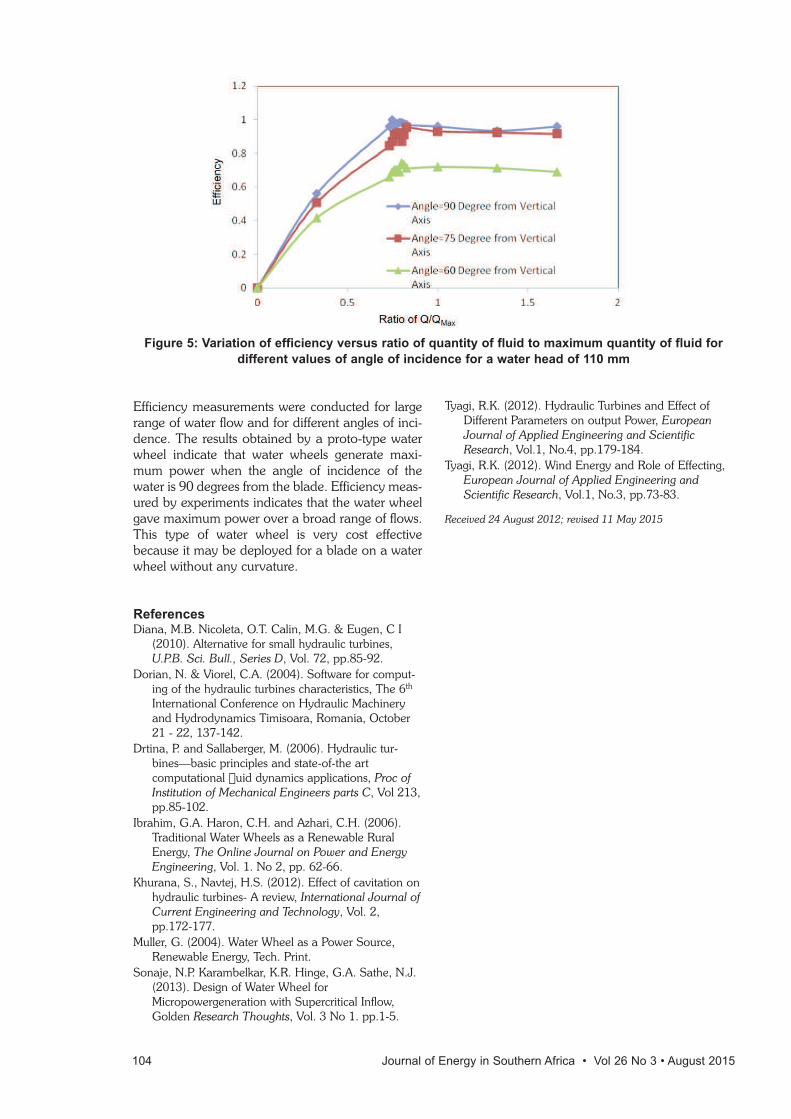
Efficiency measurements were conducted for largerange of water flow and for different angles of inci-dence. The results obtained by a proto-type waterwheel indicate that water wheels generate maxi-mum power when the angle of incidence of thewater is 90 degrees from the blade. Efficiency meas-ured by experiments indicates that the water wheelgave maximum power over a broad range of flows.This type of water wheel is very cost effectivebecause it may be deployed for a blade on a waterwheel without any curvature.
ReferencesDiana, M.B. Nicoleta, O.T. Calin, M.G. & Eugen, C I
(2010). Alternative for small hydraulic turbines,U.P.B. Sci. Bull., Series D, Vol. 72, pp.85-92.
Dorian, N. & Viorel, C.A. (2004). Software for comput-ing of the hydraulic turbines characteristics, The 6th
International Conference on Hydraulic Machineryand Hydrodynamics Timisoara, Romania, October21 - 22, 137-142.
Drtina, P. and Sallaberger, M. (2006). Hydraulic tur-bines—basic principles and state-of-the artcomputational �uid dynamics applications, Proc ofInstitution of Mechanical Engineers parts C, Vol 213,pp.85-102.
Ibrahim, G.A. Haron, C.H. and Azhari, C.H. (2006).Traditional Water Wheels as a Renewable RuralEnergy, The Online Journal on Power and EnergyEngineering, Vol. 1. No 2, pp. 62-66.
Khurana, S., Navtej, H.S. (2012). Effect of cavitation onhydraulic turbines- A review, International Journal ofCurrent Engineering and Technology, Vol. 2,pp.172-177.
Muller, G. (2004). Water Wheel as a Power Source,Renewable Energy, Tech. Print.
Sonaje, N.P. Karambelkar, K.R. Hinge, G.A. Sathe, N.J.(2013). Design of Water Wheel forMicropowergeneration with Supercritical Inflow,Golden Research Thoughts, Vol. 3 No 1. pp.1-5.
Tyagi, R.K. (2012). Hydraulic Turbines and Effect ofDifferent Parameters on output Power, EuropeanJournal of Applied Engineering and ScientificResearch, Vol.1, No.4, pp.179-184.
Tyagi, R.K. (2012). Wind Energy and Role of Effecting,European Journal of Applied Engineering andScientific Research, Vol.1, No.3, pp.73-83.
Received 24 August 2012; revised 11 May 2015
104 Journal of Energy in Southern Africa • Vol 26 No 3 • August 2015
Figure 5: Variation of efficiency versus ratio of quantity of fluid to maximum quantity of fluid for
different values of angle of incidence for a water head of 110 mm
Journal of Energy in Southern Africa • Vol 26 No 3 • August 2015 105
Abstract
The DESERTEC project, a European Union (EU)initiative to harness solar energy by means ofConcentrated Solar Power (CSP) from Africa foruse in Europe, shows the enormous potential thatexists in alternative energy sources for the sub-region once there is political will. The Trans-Mediterranean Renewable Energy Corporation(TREC), a network of scientists and politicians whohave taken it upon themselves to solve Europe’senergy problem using sun from Africa, conductedthree studies which evaluated the potential ofrenewable energy resources in the Middle East andNorth Africa (MENA), the expected needs for waterand power in EU-MENA between now and 2050and issues relating to the construction of an electric-ity transmission grid connecting the EU and MENA(EU-MENA-Connection), with a formula to turn theNorth African desert sun into electricity and trans-port same to Europe. This paper harnesses theTREC fact-finding studies in order to estimate howmuch the same ideas can be applied in many otherparts of the world, Nigeria in particular.Investigation reveals that this association exists withhuge potentials for an energy-starved country likeNigeria in harnessing her abundant hot sun in thenorth, which could go a long way in meeting theenergy needs in that part of the country andbeyond. Other benefits include unlimited suppliesof clean electricity, agricultural gains, and creationof new industries, new jobs and new sources ofincome.
Keywords: concentrated solar power, DESERTEC,Nigeria, solar energy
1. Introduction
Almost every other source of energy being exploit-ed by man is directly or indirectly tapped from thesun’s reservoir. In fact, it is proven that the sun hasas much effect on the process of establishing non-renewable energy sources as it does to renewablesources. At present, the amount of energy radiatedfrom the sun, that is wasted unutilised, is 10 000times the amount of energy required to run humanactivities worldwide.
Recurrent overdependence on fossil fuels has,apart from not sustainably meeting energydemands, been bedevilled with such drawbacks likepolitical instability, pollution and corruption, tomention a few. Consequently, Nigeria fits appropri-ately as a good case in this study when the back-drop of the oil resource-curse is revisited. The recentNiger-Delta unrest, the indiscriminate flaring of gasand oil-spillage by multi-national oil companies(MNOCs), as well as the gulf existing betweendemand and supply are daunting realities in theNigerian energy polity (Malumfashi, 2007; Colwelland Greene, 2008).
European scientists have gone out of their wayto research and develop better means of energygeneration using the DESERTEC initiative to boostenergy supply and reduce adverse environmentalimpacts. This initiative has been modelled to tapinto the Middle East and North Africa’s (MENA)cheap but unutilised deserts and seas in positioninga new brand of solar energy technology christened– Concentrated Solar Power (CSP). This technolo-gy will involve the construction of large solar plantsthat will drive power generating turbines to produceclean electricity for a greater percentage of
CONFERENCE PAPER
Harnessing Nigeria’s abundant solar energy potential
using the DESERTEC model
Udochukwu B AkuruDepartment of Electrical Engineering, University of Nigeria, Nsukka, Enugu State, Nigeria
Ogbonnaya I OkoroCollege of Engineering and Engineering Technology, Department of Electrical and Electronic Engineering,
Michael Okpara University of Technology, Umudike, Abia State, Nigeria
Chibuike F MadukoDepartment of Electrical Engineering, University of Oviedo, Spain
Paper presented at the 4th Electrical Engineering National Conference on Energy Sources for Power
Generation, 21 – 23 July 2013, University of Nigeria, Nsukka, Nigeria. Reproduced with permission. Not peer-
reviewed for JESA
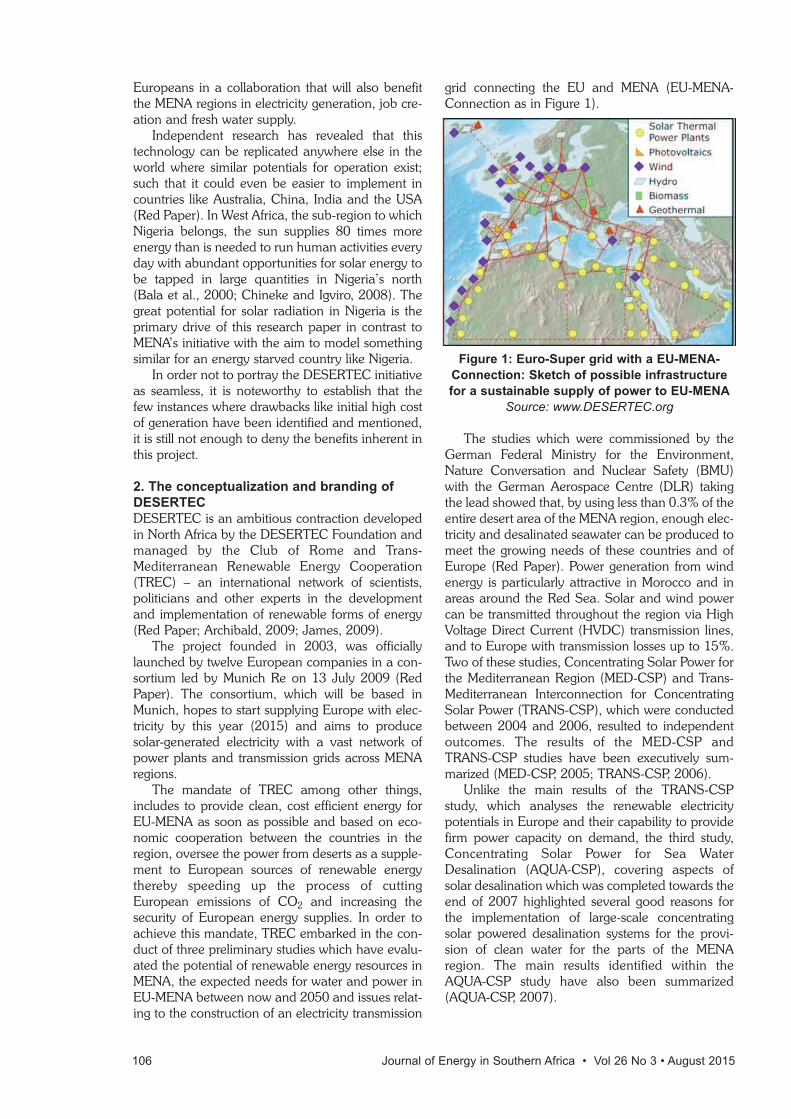
Europeans in a collaboration that will also benefitthe MENA regions in electricity generation, job cre-ation and fresh water supply.
Independent research has revealed that thistechnology can be replicated anywhere else in theworld where similar potentials for operation exist;such that it could even be easier to implement incountries like Australia, China, India and the USA(Red Paper). In West Africa, the sub-region to whichNigeria belongs, the sun supplies 80 times moreenergy than is needed to run human activities everyday with abundant opportunities for solar energy tobe tapped in large quantities in Nigeria’s north(Bala et al., 2000; Chineke and Igviro, 2008). Thegreat potential for solar radiation in Nigeria is theprimary drive of this research paper in contrast toMENA’s initiative with the aim to model somethingsimilar for an energy starved country like Nigeria.
In order not to portray the DESERTEC initiativeas seamless, it is noteworthy to establish that thefew instances where drawbacks like initial high costof generation have been identified and mentioned,it is still not enough to deny the benefits inherent inthis project.
2. The conceptualization and branding of
DESERTEC
DESERTEC is an ambitious contraction developedin North Africa by the DESERTEC Foundation andmanaged by the Club of Rome and Trans-Mediterranean Renewable Energy Cooperation(TREC) – an international network of scientists,politicians and other experts in the developmentand implementation of renewable forms of energy(Red Paper; Archibald, 2009; James, 2009).
The project founded in 2003, was officiallylaunched by twelve European companies in a con-sortium led by Munich Re on 13 July 2009 (RedPaper). The consortium, which will be based inMunich, hopes to start supplying Europe with elec-tricity by this year (2015) and aims to producesolar-generated electricity with a vast network ofpower plants and transmission grids across MENAregions.
The mandate of TREC among other things,includes to provide clean, cost efficient energy forEU-MENA as soon as possible and based on eco-nomic cooperation between the countries in theregion, oversee the power from deserts as a supple-ment to European sources of renewable energythereby speeding up the process of cuttingEuropean emissions of CO2 and increasing thesecurity of European energy supplies. In order toachieve this mandate, TREC embarked in the con-duct of three preliminary studies which have evalu-ated the potential of renewable energy resources inMENA, the expected needs for water and power inEU-MENA between now and 2050 and issues relat-ing to the construction of an electricity transmission
grid connecting the EU and MENA (EU-MENA-Connection as in Figure 1).
Figure 1: Euro-Super grid with a EU-MENA-
Connection: Sketch of possible infrastructure
for a sustainable supply of power to EU-MENA
Source: www.DESERTEC.org
The studies which were commissioned by theGerman Federal Ministry for the Environment,Nature Conversation and Nuclear Safety (BMU)with the German Aerospace Centre (DLR) takingthe lead showed that, by using less than 0.3% of theentire desert area of the MENA region, enough elec-tricity and desalinated seawater can be produced tomeet the growing needs of these countries and ofEurope (Red Paper). Power generation from windenergy is particularly attractive in Morocco and inareas around the Red Sea. Solar and wind powercan be transmitted throughout the region via HighVoltage Direct Current (HVDC) transmission lines,and to Europe with transmission losses up to 15%.Two of these studies, Concentrating Solar Power forthe Mediterranean Region (MED-CSP) and Trans-Mediterranean Interconnection for ConcentratingSolar Power (TRANS-CSP), which were conductedbetween 2004 and 2006, resulted to independentoutcomes. The results of the MED-CSP andTRANS-CSP studies have been executively sum-marized (MED-CSP, 2005; TRANS-CSP, 2006).
Unlike the main results of the TRANS-CSPstudy, which analyses the renewable electricitypotentials in Europe and their capability to providefirm power capacity on demand, the third study,Concentrating Solar Power for Sea WaterDesalination (AQUA-CSP), covering aspects ofsolar desalination which was completed towards theend of 2007 highlighted several good reasons forthe implementation of large-scale concentratingsolar powered desalination systems for the provi-sion of clean water for the parts of the MENAregion. The main results identified within theAQUA-CSP study have also been summarized(AQUA-CSP, 2007).
106 Journal of Energy in Southern Africa • Vol 26 No 3 • August 2015
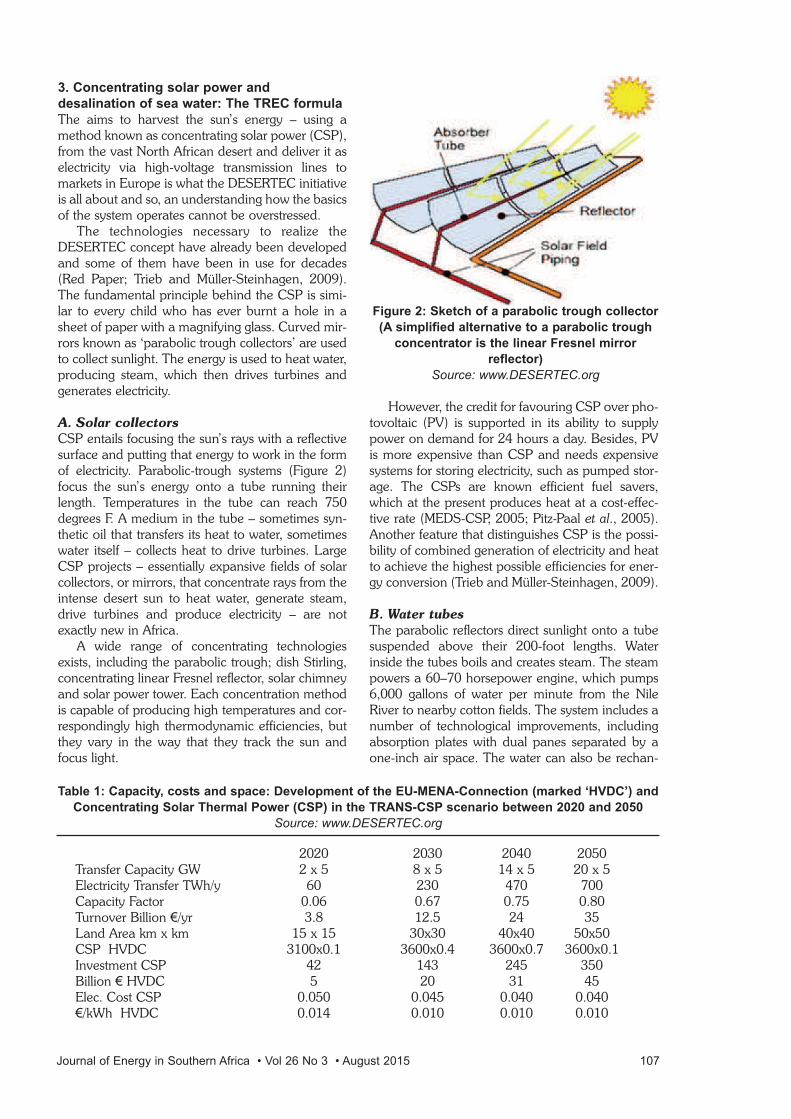
3. Concentrating solar power and
desalination of sea water: The TREC formula
The aims to harvest the sun’s energy – using amethod known as concentrating solar power (CSP),from the vast North African desert and deliver it aselectricity via high-voltage transmission lines tomarkets in Europe is what the DESERTEC initiativeis all about and so, an understanding how the basicsof the system operates cannot be overstressed.
The technologies necessary to realize theDESERTEC concept have already been developedand some of them have been in use for decades(Red Paper; Trieb and Müller-Steinhagen, 2009).The fundamental principle behind the CSP is simi-lar to every child who has ever burnt a hole in asheet of paper with a magnifying glass. Curved mir-rors known as ‘parabolic trough collectors’ are usedto collect sunlight. The energy is used to heat water,producing steam, which then drives turbines andgenerates electricity.
A. Solar collectors
CSP entails focusing the sun’s rays with a reflectivesurface and putting that energy to work in the formof electricity. Parabolic-trough systems (Figure 2)focus the sun’s energy onto a tube running theirlength. Temperatures in the tube can reach 750degrees F. A medium in the tube – sometimes syn-thetic oil that transfers its heat to water, sometimeswater itself – collects heat to drive turbines. LargeCSP projects – essentially expansive fields of solarcollectors, or mirrors, that concentrate rays from theintense desert sun to heat water, generate steam,drive turbines and produce electricity – are notexactly new in Africa.
A wide range of concentrating technologiesexists, including the parabolic trough; dish Stirling,concentrating linear Fresnel reflector, solar chimneyand solar power tower. Each concentration methodis capable of producing high temperatures and cor-respondingly high thermodynamic efficiencies, butthey vary in the way that they track the sun andfocus light.
However, the credit for favouring CSP over pho-tovoltaic (PV) is supported in its ability to supplypower on demand for 24 hours a day. Besides, PVis more expensive than CSP and needs expensivesystems for storing electricity, such as pumped stor-age. The CSPs are known efficient fuel savers,which at the present produces heat at a cost-effec-tive rate (MEDS-CSP, 2005; Pitz-Paal et al., 2005).Another feature that distinguishes CSP is the possi-bility of combined generation of electricity and heatto achieve the highest possible efficiencies for ener-gy conversion (Trieb and Müller-Steinhagen, 2009).
B. Water tubes
The parabolic reflectors direct sunlight onto a tubesuspended above their 200-foot lengths. Waterinside the tubes boils and creates steam. The steampowers a 60–70 horsepower engine, which pumps6,000 gallons of water per minute from the NileRiver to nearby cotton fields. The system includes anumber of technological improvements, includingabsorption plates with dual panes separated by aone-inch air space. The water can also be rechan-
Journal of Energy in Southern Africa • Vol 26 No 3 • August 2015 107
Table 1: Capacity, costs and space: Development of the EU-MENA-Connection (marked ‘HVDC’) and
Concentrating Solar Thermal Power (CSP) in the TRANS-CSP scenario between 2020 and 2050
Source: www.DESERTEC.org
2020 2030 2040 2050Transfer Capacity GW 2 x 5 8 x 5 14 x 5 20 x 5Electricity Transfer TWh/y 60 230 470 700Capacity Factor 0.06 0.67 0.75 0.80Turnover Billion €/yr 3.8 12.5 24 35Land Area km x km 15 x 15 30x30 40x40 50x50CSP HVDC 3100x0.1 3600x0.4 3600x0.7 3600x0.1Investment CSP 42 143 245 350Billion € HVDC 5 20 31 45Elec. Cost CSP 0.050 0.045 0.040 0.040€/kWh HVDC 0.014 0.010 0.010 0.010
Figure 2: Sketch of a parabolic trough collector
(A simplified alternative to a parabolic trough
concentrator is the linear Fresnel mirror
reflector)
Source: www.DESERTEC.org
nelled to benefit agricultural demands.
C. Business advantages in solar power
thermal plants
New solar thermal power plants with a total capac-ity of more than 2000 MW are at the planningstage, under construction, or already in operation.Favourable business conditions for CSP abound.For instance, where there is more sunshine, it is pos-sible to realize cheaper feed-in tariffs, as for exam-ple, at good locations in Africa, America, China,India, Australia or MENA. In time to come, high ini-tial investments will give room to long-term sustain-able costs (Table 1). This is because the costs forraw materials for solar thermal power stations arerising more slowly than the price of fossil fuels.Therefore, CSP may become competitive earlierthan previously expected (Red Paper).
D. High voltage direct current transmission
lines
HVDC transmission has proved very reliable andmuch more efficient than the use of hydrogen as anenergy vector. Using High Voltage Direct Current(HVDC) transmission lines, loss of power duringtransmission can be limited to only about 3% per1000 km. Although there would be transmissionlosses up to 15% between MENA and Europe, theyare more than offset by the fact that levels of solarradiation in MENA are about twice what they are insouthern Europe. Furthermore, there is much lessseasonal variation in levels of sunshine in MENAthan there is in Europe.
E. Desalination of sea water – A by-product
of the DESERTEC concept
The growing freshwater deficits in MENA willincreasingly require seawater desalination whichcan be done using sustainable sources of energy. Inbrief, the DESERTEC initiative also enables the useof solar electricity for membrane desalinationthrough combined solar heat and power for thermalseawater desalination to guarantee sustainability(Trieb and Müller-Steinhagen, 2009).
On the other hand, the considerable burden ofdesalination, though significantly reduced by theDESERTEC initiative, is not overlooked becausethe AQUA-CSP study analyses the environmentalimpact of a broad application of solar-powered sea-water desalination to cover the expected freshwaterdeficits in MENA.
4. Harnessing DESERTEC concept for
Nigeria and its comparative advantage
It is true that the advantages of DESERTEC forEurope look enormous; it frees the continent fromdependence on Russian gas, rising oil prices,radioactive waste and CO2-spewing coal powerplants. Energy can be harnessed even at night such
that excess heat produced during the day can bestored for several hours in tanks of molten salt. Thisway the turbines can produce electricity even whenthe sun is not shining. Moreover, the advantages forcountries such as Libya, Morocco, Algeria, Sudanand especially Middle Eastern states, other than thesolar power business triggering a truly sunny future,it would create jobs and build up a sustainable ener-gy industry, which would translate to cash-inflowinto these countries and an enabling infrastructureinvestment.
There is a similar advantage of DESERTEC forNigeria’s abundant solar reservoir. The annualaverage daily sunshine (measured with CampbellStokes recorder) is 9 hours at the far northernboundary of Nigeria (Chineke and Igwiro, 2008).,this amounts to about 4.851x10¹²kWh of energyper day from the sun (Ojosu,(1990); Chineke,(2002).. Worth mentioning also is the fact that solarelectric power could mean energy independence,economic value and environmental security. Aboveand beyond, it has the potential to supply a signifi-cant portion of the country’s electric energy require-ments, and lead to significant enhancements in liv-ing conditions, in sectors such as health services,communication, information and education. Thisform of electricity can also enhance the competi-tiveness of the country.
In the light of the present energy poverty in thecountry, production costs have been inflated lead-ing to competition in the global market. Recentdevelopment have shown the preference of indige-nous companies to relocate from Nigeria, wherebusiness has been qualified as being very expensiveto sustain, to neighbouring West African countrieswhere it is deemed cheaper. Indeed, access to elec-tricity is a prerequisite for economic growth and sus-tainable livelihoods, and is thus a fundamentalingredient for the achievement of the UnitedNations Millennium Development Goals (Okoro etal., 2006; Qurashi and Hussain, 2005; Modi et al.,2006).
There is no gainsaying that there is hope forNigeria to turnaround its present deficiency in ener-gy by implementing a national energy policy thatsubstantially incorporates renewably energy which,no doubt, already exists on paper but lacks actionas extensively reviewed in a recent research con-ducted by the authors Akuru, and Okoro (2010).This has been practised elsewhere and it is working.
Already, the DESERTEC concept which hasbeen designed to insure the livelihood of mankindbased on a lasting, developing, and peace support-ing form of power production by bringing togetherpolitical, economic, civil, and social interests caneasily be duplicated in Nigeria with high probabilityof achieving the expected results. For example,other than an existing solar resource base, the factthat northern Nigeria is located inside Nigeria, tech-
108 Journal of Energy in Southern Africa • Vol 26 No 3 • August 2015
nicalities for political, economic, and social furoreare greatly reduced. The existing national supplygrid can equally serve to support in the aspect ofissues relating to the construction of an electricitytransmission grid.
Whereas there has been extensive and on-goingresearch as well as implementation of solar PVs anddistillers for provision of clean water (Sambo,2009); Committee on Creation of Science-basedIndustries in Developing Countries Development,Security, and Cooperation Policy and GlobalAffairs, 2008)], the possibilities for water desalina-tion in Nigeria appear to be beyond the scope ofthis paper. However, it is hoped that with the pre-vailing pathetic situation of non-availability of cleanand portable drinking water in northern Nigeria,research can be initiated to ascertain the prospectsfor exploiting it as an alternative to the provision ofdrinkable water. Similarly, the possibilities for windpower exists in the DESERTEC project as earliermentioned and can be integrated into a concreteframework for Nigeria, who is equally endowedwith abundant wind energy in the north.
It is equally certain that there will be creation ofnew jobs which will mean new sources of incomefor natives and nationals alike. Sharing or transferof technologies is very possible in the long run forgreater impact of results.
That the region in the north instead of the southwould now be the hub of Nigeria’s energy base istrue to the fact, even if it may sound incongruous.This is because of the CSP plants can be used tomeet both local and foreign energy demands whichis expected to surpass whatever revenue thatNigeria gains from petroleum export at present.
5. Conclusion
The DESERTEC Concept has been termedsustainable, and it is so because according toits initiators, it meets all criteria for sustainabilitywhich is a necessary requirement for determinedpolitical support and action. The five focal pointsfor national and international policy for all countriesin EU-MENA support this claim (Trieb and Müller-Steinhagen, 2009).1. Increase support for research, development and
for the market introduction of measures for effi-cient supply, distribution and use of energy (effi-ciency focus).
2. Provide a reliable framework for the marketintroduction of existing renewable energy tech-nologies, based on best practice experience andincrease support for research and developmentfor promising enhancements (renewable energyfocus).
3. Initiate an EU-MENA-wide partnership for sus-tainable energy. Provide European support toaccelerate renewable energy use in MENA(interregional cooperation focus).
4. Initiate planning and evaluation of an EU-MENA High Voltage Direct Current super-grid tocombine the best renewable energy sources inthis region and to increase diversity and redun-dancy of supply (interconnection focus).
5. Support research and development for shiftingthe use of fossil fuels from bulk electricity to bal-ancing power production (balancing powerfocus).Not only that, highpoints of opportunities for the
MENA region has been brought to the fore andstressed in the light that duplicating it for any otherscenario (available abundant solar), given the sameconditions (congruent realizable framework), is verymuch possible. The basis for this hypothesis is thatfor countries like Nigeria where solar irradiation ishigh, similar or even better results can be obtained.Certain factors such as proximity of resource base,an existing electricity transmission backbone, anddwindling oil reserves due to overdependence anda non-renewability factor show that implementationin Nigeria can be achieved without difficulty. Cleanwater supply, jobs and income generation are otherbenefits that the DESERTEC initiative can leadNigeria into if and when it is adopted.
ReferencesAkuru, B.U. and Okoro, I.O. Renewable energy invest-
ments in Nigeria: A review of the Renewable EnergyMaster Plan. Unpublished..
AQUA-CSP (2007). Trieb, F., Schillings, C., Viebahn, P.,Paul, C., Altowaie, H., Sufian, T., Alnaser, W.,Kabariti, M., Shahin, W., Bennouna, A., Nokraschy,H., Kern, J., Knies, G., El Bassam, N., Hasairi, I.,Haddouche, A., Glade, H., Aliewi, A., ConcentratingSolar Power for Seawater Desalination. GermanAerospace Center (DLR), Study for the GermanMinistry of Environment, Nature Conversation andNuclear Safety, (ongoing) Stuttgart 2007,(www.dlr.de/tt/aqua-csp).
Archibald P. (2009). Siemens eyes orders from economicstimulus plans, Wall Street Journal. Retrieved on2009-07-03 from http://online.wsj.com/article/BT-CO-20090622-705321.html.
Bala, E.J., Ojosu, J.O. and Umar, I.H. (2000).Government policies and programmes on the devel-opment of Solar-PV sub-sector in Nigeria, NigeriaJournal of Renewable Energy, Vol. 8, No. 1&2, pp.1-6.
Chineke, T.C. (2002). Providing electricity for office anddomestic use using solar energy, In: Solar EnergyOptions for cooking, food processing and houselighting (Eds Chineke, T.C. Achunine, R.N. andNwofor, O.K.), Webscom Publishers, Owerri.
Chineke, T.C. and Igwiro, E.C. (2008). Urban and ruralelectrification: enhancing the energy sector inNigeria using photovoltaic technology, AfricanJournal of Science and Technology (AJST)Scienceand Engineering Series Vol. 9, No. 1, pp. 102 – 108.Available at
Journal of Energy in Southern Africa • Vol 26 No 3 • August 2015 109
http://www.ansti.org/volume/v9n1/Chineke-paper.PDF
Colwell, R.R. and Greene, M. (2008). Solutions forNigeria, USA National Academy of Sciences as aneditorial in Science Vol. 319, 25 January 2008(www.sciencemag.org).
Committee on Creation of Science-based Industries inDeveloping Countries Development, Security, andCooperation Policy and Global Affairs (2008).Mobilising Science-based enterprises for energy,water, and medicines in Nigeria, National ResearchCouncil of the National Academics, NigeriaAcademy of Science, The National Academ.iesPress, Washington D.C.
James K. (2009). European solar power from Africandeserts? The New York Times. Retrieved on 2009-07-03 fromhttp://greeninc.blogs.nytimes.com/2009/06/18/euro-pean-solar-power-from-african-deserts/.
Malumfashi, G.I. (2007). Phase-out of gas flaring inNigeria by 2008: The prospects of a multi-win proj-ect (Review of the regulatory, environmental andsocio-economic issues), Centre for Energy Petroleumand Mineral Law and Policy (CEPMLP), Universityof Dundee, Scotland, United Kingdom.
MED-CSP (2005). Trieb, F., Schillings, C., Kronshage,S., Viebahn, P., May, N., Paul, C., Klann, U.,Kabariti, M., Bennouna, A., Nokraschy, H., Hassan,S., Georgy Yussef, L., Hasni, T., Bassam, N., andSatoguina, H., Concentrating Solar Power for theMediterranean Region. German Aerospace Center(DLR), Study for the German Ministry ofEnvironment, Nature Conversation and NuclearSafety, April 2005. (www.dlr.de/tt/med-csp).
Modi, V., McDade, S., Lallement, D., and Saghir, J.(2006). Energy and the Millennium DevelopmentGoals, New York: Energy Sector ManagementAssistance Programme, United Nations DevelopmentProgramme, UN Millennium Project, and WorldBank.
Okoro, O.I. Govender, P. and Chikuni, E. (2006). Powersector reforms in Nigeria: opportunities and chal-lenges, Proceeding for 10th International Conferenceon the Domestic Use of Energy, Cape Town/SouthAfrica, pp. 29-34.
Ojosu, J.O. (1990). Data bank; the iso-radiation map forNigeria, Solar and wind Technology 7 pp 563-575.
Pitz-Paal, R., Dersch, J., and Milow, B., European con-centrated solar thermal road mapping, ECOSTAR,SES6-CT-2003-502578, European Commission, 6thFramework Programme, German Aerospace Center,Cologne 2005ftp://ftp.dlr.de/ecostar/ECOSTAR_Roadmap2005.pdf
Qurashi, M.M. and Hussain, T. (2005). Renewable ener-gy technologies for developing countries: Now andto 2023, publications of the Islamic Educational,Scientific and Cultural Organization – ISESCO –1426A.H.
Red Paper – An overview of the Desertec Concept..http://www.desertec.org/fileadmin/downloads/desertec-
foundation_redpaper_3rd-edition_english.pdf.Sambo, A. S. (2009). Strategies for the utilization of
solar and other renewable energy sources for rural
development in Nigeria, In: Solar & RenwewableEnergy Company (Nig.) Ltd; Meeting R&DCommercialisation Challenge (Eds Animalu, A.O.E.Osakwe, E.N.C. and Akuru, U.B.), SNAAP Press(Nig.) Ltd, Enugu.
TRANS-CSP (2006). Trieb, F., Schillings, C., Kronshage,S., Viebahn, P., May, N., Paul, C., Klann, U.,Kabariti, M., Bennouna, A., Nokraschy, H., Hassan,S., and Georgy Yussef, L., Hasni, T., Bassam, N.,Satoguina, H., Trans-Mediterranean Interconnectionfor Concentrating Solar Power. German AerospaceCenter (DLR), German Ministry of Environment,Nature Conversation and Nuclear Safety, June2006. (www.dlr.de/tt/trans-csp).
Trieb, F. and Müller-Steinhagen, H. (2009) The Desertecconcept: Sustainable electricity and Water forEurope, Middle East and North Africa, Whitebook –Clean Power from Deserts.http://www.desertec.org/fileadmin/downloads/DESERTEC-WhiteBook_en_small.pdf.
110 Journal of Energy in Southern Africa • Vol 26 No 3 • August 2015
Journal of Energy in Southern Africa • Vol 26 No 3 • August 2015 111
Abstract
This paper presents an efficiency analysis of aninduction motor with direct torque and flux controlat a hot rolling mill in South Africa. Two scenarioswere evaluated: 1) where the induction motor wascontrolled at a constant speed with a variable thick-ness slab; and 2) where the speed of the inductionmotor was controlled according to the thickness ofthe slab. Both scenarios used the speed as referenceto control the torque and flux of the inductionmotor. A comparison on the energy consumption ofthe induction motor for both scenarios was done bymeans of a detailed simulation model. The simula-tion model for this specific case study is explained indetail. The results obtained showed an increase inthe efficiency of the induction motor from the origi-nal system (scenario 1) to the improved system (sce-nario 2). Part of this paper provides an overview onhot rolling mills.
Keywords: efficiency analysis; induction motor; hotrolling mill; direct torque control; flux control
1. Introduction
In this paper, the efficiency analysis of an inductionmotor with direct torque and flux control at a hotrolling mill in South Africa is presented.
The energy consumption of the induction motoris calculated and compared by means of a simula-tion model for the following two scenarios: 1) wherethe speed is kept constant with a variable thicknessslab and 2) where the speed is controlled accordingto the thickness of the slab. Section 4 provides moredetail on the results obtained from the simulationmodel for this specific case study.
A hot rolling mill plant near Witbank inMpumalanga, South Africa, was investigated as acase study. The hot rolling mill plant has an installedcapacity to produce 4000 MT of steel bars in a
month. The monthly average production is current-ly 3400 MT (85% of the installed capacity).
The diameter of the bars being produced variesfrom 8 mm to 20 mm. The demand of the plant is1000 KVA and the daily energy con sumption is 10MWh. The parameters and specifications of the hotrolling mill plant were used in the design process ofthe simulation model. Section 3 provides moredetail on the simulation case study.
This paper provides an overview of hot rollingmills, a simulation case study where the specifica-tions and parameters of the hot rolling mill plantnear Witbank has been incorporated, results on thedifferent scenarios and a conclusion on the results.
When metal is passed through a pair of rolls, itis termed rolling. Hot rolling occurs when the tem-perature of the metal is above the recrystallizationtemperature and cold rolling occurs when the tem-perature of the metal is below the recrystallizationtemperature (Degarmo, et al., 2003; Roberts,1983).
2. Overview on hot rolling mills
Figure 1 provides a diagram of a four-high hotrolling mill stand. This rolling mill is also known asa reduction mill. A slab is passed through two workrollers which reduces the thickness of the slab. Thereduction in thickness is caused by a high compres-sion force applied by hydraulic rams. The reductionin strip thickness causes a temperature rise at theroll gap, which is cooled by air and a lubricant solu-tion (Pittner, et al., 2011).
Hot rolling mills are usually equipped with sen-sors to measure the roll force at each stand, striptension force, strip thickness, work roll speed, rollgap actuator (hydraulic ram) position and stripspeed. The backup rolls are installed to providerigid support to the working rolls and to preventbending under rolling load (Pittner, et al., 2011).
Figure 2 provides an overview diagram of thehot strip/rolling production process. After the refin-
CONFERENCE PAPER
Efficiency analysis of an induction motor with direct
torque and flux control at a hot rolling mill
Rupert GouwsFaculty of Engineering, North-West University, Potchefstroom, South Africa
Paper presented at the Industrial & Commercial Use of Energy Conference (ICUE) 2014, 18 – 20 August 2014,
Cape Town, South Africa. Rublished here with permission. Not peer-reviewed for JESA
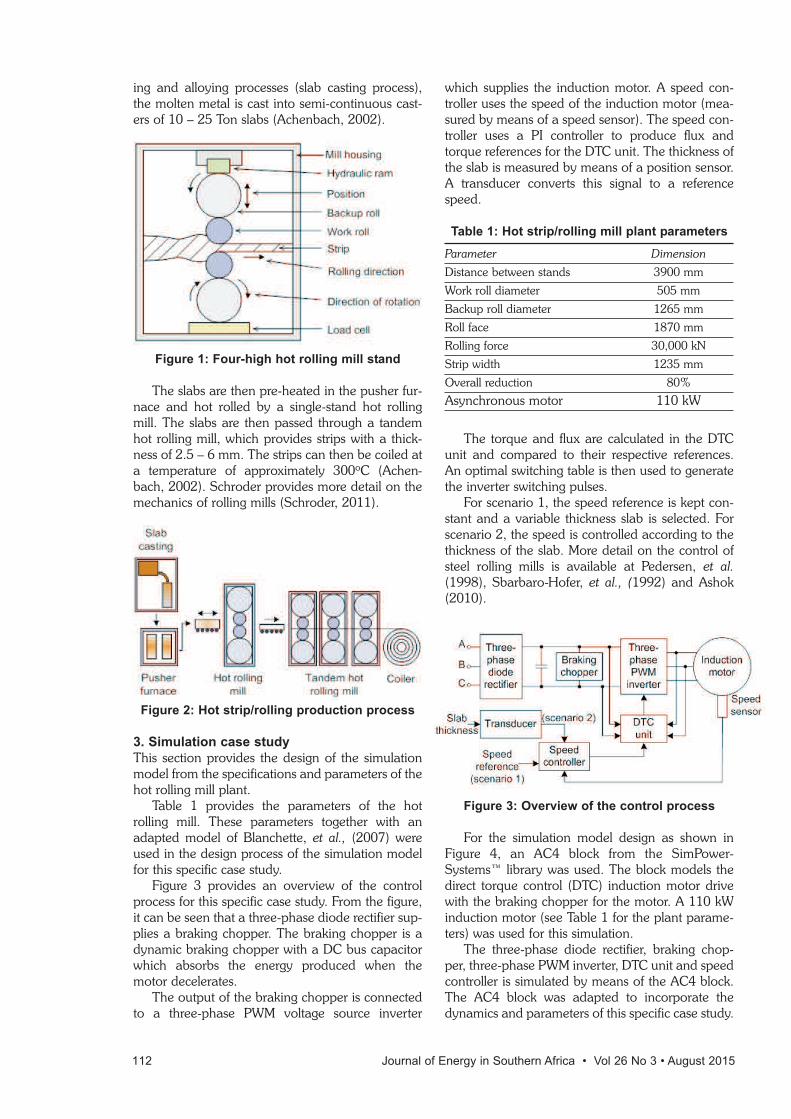
ing and alloying processes (slab casting process),the molten metal is cast into semi-continuous cast-ers of 10 – 25 Ton slabs (Achenbach, 2002).
Figure 1: Four-high hot rolling mill stand
The slabs are then pre-heated in the pusher fur-nace and hot rolled by a single-stand hot rollingmill. The slabs are then passed through a tandemhot rolling mill, which provides strips with a thick-ness of 2.5 – 6 mm. The strips can then be coiled ata temperature of approximately 300oC (Achen-bach, 2002). Schroder provides more detail on themechanics of rolling mills (Schroder, 2011).
Figure 2: Hot strip/rolling production process
3. Simulation case study
This section provides the design of the simulationmodel from the specifications and parameters of thehot rolling mill plant.
Table 1 provides the parameters of the hotrolling mill. These parameters together with anadapted model of Blanchette, et al., (2007) wereused in the design process of the simulation modelfor this specific case study.
Figure 3 provides an overview of the controlprocess for this specific case study. From the figure,it can be seen that a three-phase diode rectifier sup-plies a braking chopper. The braking chopper is adynamic braking chopper with a DC bus capacitorwhich absorbs the energy produced when themotor decelerates.
The output of the braking chopper is connectedto a three-phase PWM voltage source inverter
which supplies the induction motor. A speed con-troller uses the speed of the induction motor (mea-sured by means of a speed sensor). The speed con-troller uses a PI controller to produce flux andtorque references for the DTC unit. The thickness ofthe slab is measured by means of a position sensor.A transducer converts this signal to a referencespeed.
Table 1: Hot strip/rolling mill plant parameters
Parameter Dimension
Distance between stands 3900 mm
Work roll diameter 505 mm
Backup roll diameter 1265 mm
Roll face 1870 mm
Rolling force 30,000 kN
Strip width 1235 mm
Overall reduction 80%
Asynchronous motor 110 kW
The torque and flux are calculated in the DTCunit and compared to their respective references.An optimal switching table is then used to generatethe inverter switching pulses.
For scenario 1, the speed reference is kept con-stant and a variable thickness slab is selected. Forscenario 2, the speed is controlled according to thethickness of the slab. More detail on the control ofsteel rolling mills is available at Pedersen, et al.(1998), Sbarbaro-Hofer, et al., (1992) and Ashok(2010).
Figure 3: Overview of the control process
For the simulation model design as shown inFigure 4, an AC4 block from the SimPower-Systems™ library was used. The block models thedirect torque control (DTC) induction motor drivewith the braking chopper for the motor. A 110 kWinduction motor (see Table 1 for the plant parame-ters) was used for this simulation.
The three-phase diode rectifier, braking chop-per, three-phase PWM inverter, DTC unit and speedcontroller is simulated by means of the AC4 block.The AC4 block was adapted to incorporate thedynamics and parameters of this specific case study.
112 Journal of Energy in Southern Africa • Vol 26 No 3 • August 2015
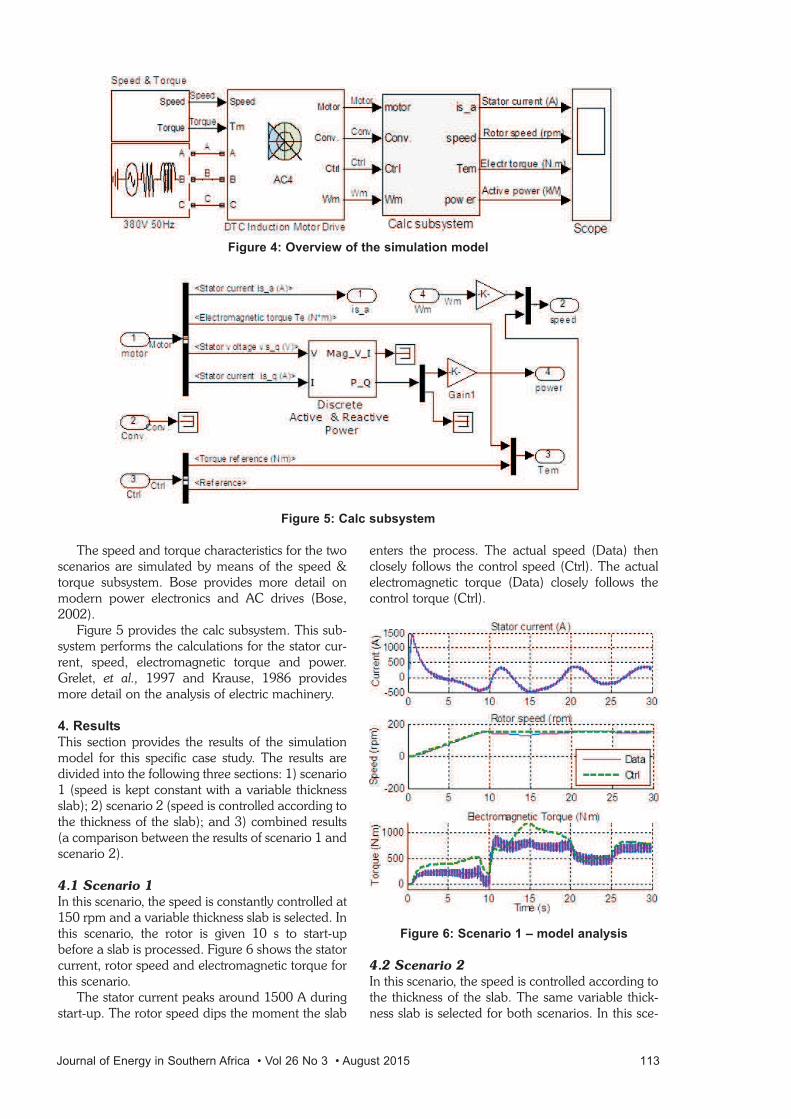
The speed and torque characteristics for the twoscenarios are simulated by means of the speed &torque subsystem. Bose provides more detail onmodern power electronics and AC drives (Bose,2002).
Figure 5 provides the calc subsystem. This sub-system performs the calculations for the stator cur-rent, speed, electromagnetic torque and power.Grelet, et al., 1997 and Krause, 1986 providesmore detail on the analysis of electric machinery.
4. Results
This section provides the results of the simulationmodel for this specific case study. The results aredivided into the following three sections: 1) scenario1 (speed is kept constant with a variable thicknessslab); 2) scenario 2 (speed is controlled according tothe thickness of the slab); and 3) combined results(a comparison between the results of scenario 1 andscenario 2).
4.1 Scenario 1
In this scenario, the speed is constantly controlled at150 rpm and a variable thickness slab is selected. Inthis scenario, the rotor is given 10 s to start-upbefore a slab is processed. Figure 6 shows the statorcurrent, rotor speed and electromagnetic torque forthis scenario.
The stator current peaks around 1500 A duringstart-up. The rotor speed dips the moment the slab
enters the process. The actual speed (Data) thenclosely follows the control speed (Ctrl). The actualelectromagnetic torque (Data) closely follows thecontrol torque (Ctrl).
Figure 6: Scenario 1 – model analysis
4.2 Scenario 2
In this scenario, the speed is controlled according tothe thickness of the slab. The same variable thick-ness slab is selected for both scenarios. In this sce-
Journal of Energy in Southern Africa • Vol 26 No 3 • August 2015 113
Figure 4: Overview of the simulation model
Figure 5: Calc subsystem
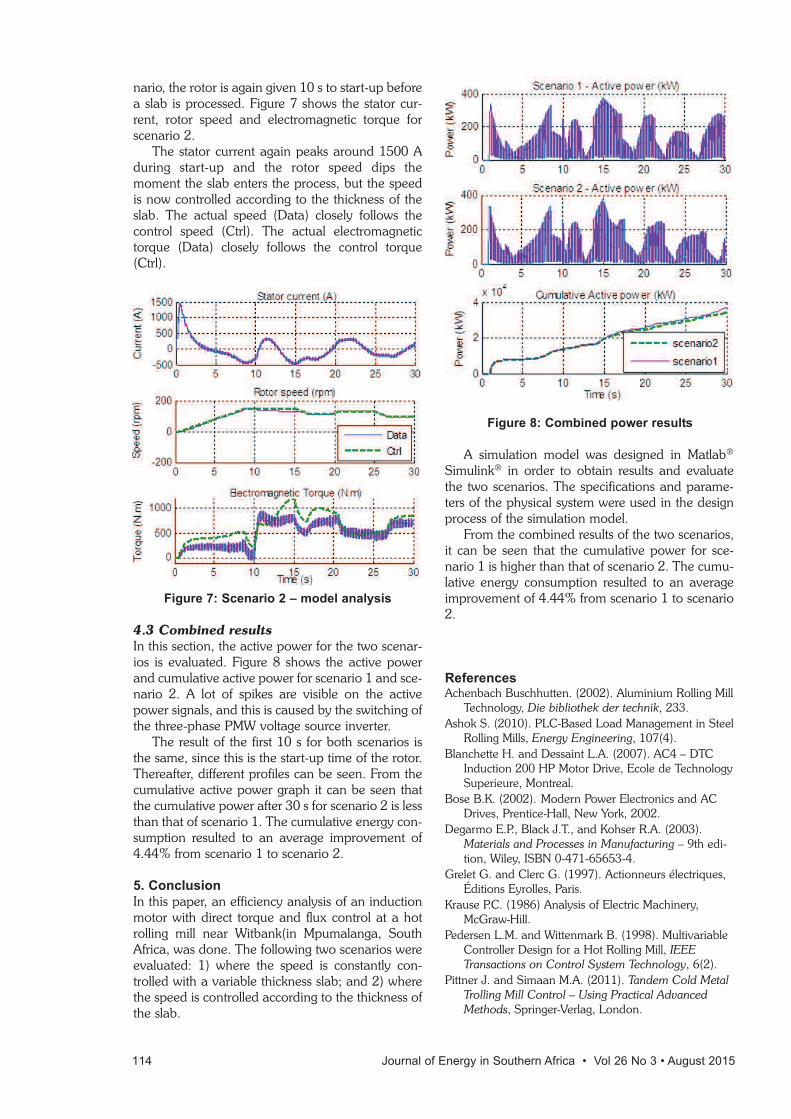
nario, the rotor is again given 10 s to start-up beforea slab is processed. Figure 7 shows the stator cur-rent, rotor speed and electromagnetic torque forscenario 2.
The stator current again peaks around 1500 Aduring start-up and the rotor speed dips themoment the slab enters the process, but the speedis now controlled according to the thickness of theslab. The actual speed (Data) closely follows thecontrol speed (Ctrl). The actual electromagnetictorque (Data) closely follows the control torque(Ctrl).
Figure 7: Scenario 2 – model analysis
4.3 Combined results
In this section, the active power for the two scenar-ios is evaluated. Figure 8 shows the active powerand cumulative active power for scenario 1 and sce-nario 2. A lot of spikes are visible on the activepower signals, and this is caused by the switching ofthe three-phase PMW voltage source inverter.
The result of the first 10 s for both scenarios isthe same, since this is the start-up time of the rotor.Thereafter, different profiles can be seen. From thecumulative active power graph it can be seen thatthe cumulative power after 30 s for scenario 2 is lessthan that of scenario 1. The cumulative energy con-sumption resulted to an average improvement of4.44% from scenario 1 to scenario 2.
5. Conclusion
In this paper, an efficiency analysis of an inductionmotor with direct torque and flux control at a hotrolling mill near Witbank(in Mpumalanga, SouthAfrica, was done. The following two scenarios wereevaluated: 1) where the speed is constantly con-trolled with a variable thickness slab; and 2) wherethe speed is controlled according to the thickness ofthe slab.
A simulation model was designed in Matlab®
Simulink® in order to obtain results and evaluatethe two scenarios. The specifications and parame-ters of the physical system were used in the designprocess of the simulation model.
From the combined results of the two scenarios,it can be seen that the cumulative power for sce-nario 1 is higher than that of scenario 2. The cumu-lative energy consumption resulted to an averageimprovement of 4.44% from scenario 1 to scenario2.
ReferencesAchenbach Buschhutten. (2002). Aluminium Rolling Mill
Technology, Die bibliothek der technik, 233.Ashok S. (2010). PLC-Based Load Management in Steel
Rolling Mills, Energy Engineering, 107(4).Blanchette H. and Dessaint L.A. (2007). AC4 – DTC
Induction 200 HP Motor Drive, Ecole de TechnologySuperieure, Montreal.
Bose B.K. (2002). Modern Power Electronics and ACDrives, Prentice-Hall, New York, 2002.
Degarmo E.P., Black J.T., and Kohser R.A. (2003).Materials and Processes in Manufacturing – 9th edi-tion, Wiley, ISBN 0-471-65653-4.
Grelet G. and Clerc G. (1997). Actionneurs électriques,Éditions Eyrolles, Paris.
Krause P.C. (1986) Analysis of Electric Machinery,McGraw-Hill.
Pedersen L.M. and Wittenmark B. (1998). MultivariableController Design for a Hot Rolling Mill, IEEETransactions on Control System Technology, 6(2).
Pittner J. and Simaan M.A. (2011). Tandem Cold MetalTrolling Mill Control – Using Practical AdvancedMethods, Springer-Verlag, London.
114 Journal of Energy in Southern Africa • Vol 26 No 3 • August 2015
Figure 8: Combined power results

Roberts W.L. (1983). Hot Rolling of Steel, CRC Press,ISBN 9780824713454.
Sbarbaro-Hofer D., Neumerkel D., and Hunt K. (1992).Neural Control of a Steel Rolling Mill, IEEEInternational Symposium on Intelligent Control.
Schroder K.H. (2011). A Basic Understanding of theMechanics of Rolling Mill Rolls, www.est.co.at.
Journal of Energy in Southern Africa • Vol 26 No 3 • August 2015 115
Abstract
It is believed that wind energy is growing at a veryrapid rate, especially in the last few years. Whencompared with other sources of renewable energyin the energy portfolio, it becomes evident that thebulk is wind energy-based. However, there aresome backlogs to full manifestation of this technolo-gy ranging from initial high cost to performance andreliability issues, among others. But in spite of thesebottlenecks, new research trends have beenassertive in seeking out a sustainable solution forharnessing wind energy for power generation –especially in the design and construction of windgenerators. In order to motivate and prime a sus-tainable energy mix among stakeholders, this paperis a shot at appraising the theory of these innovativewind generators towards ecological sustainability,economy, efficiency, and employment creation.
1. Introduction
Renewable energy is that source of energy which isabundant and continuously being replenished. Nodoubt, renewable energy comes with other benefitssuch as environmental friendliness, as well as beinga source of electricity. The traditional means of gen-erating electricity is by electrical generators runningon fossil fuels e.g. petroleum and coal. The burningof fossil fuels to generate electricity is a dirtyprocess, which leads to greenhouse gas (GHG)emissions vis-à-vis climate changes (Akuru et al,2013).
While there are many sources of renewableenergy, this paper will focus on wind energy, and itis too early to underscore this choice. In the interim,wind energy has been identified as the world’sfastest growing source of renewable energy, grow-
ing at a worldwide average of 30% annually (Swiftand Chapman, 2007), Figure 1 shows this growth.The global wind report for 2013 indicates that windenergy markets trends soared more in 2013 thanever before, and is anticipated to get even better inthe coming years (Global Wind Report, 2014).
The bottlenecks associated with the implemen-tation of wind energy for power generation is asmuch as its advantages and they continue to evolvewith time. There are issues bothering largely on theunpredictable nature of wind speed and direction,grid integration, and trapping of excess wind powerfor storage. Others are site location problems arisingfrom noise, and habitat nuisance. The issue oftransmission is also worrisome because wind powersites are usually remote from urban locations wherethe utility services are. Most of these problems leadoverall to high initial capital costs, which have con-tributed to a growing quest for improvement inwind generator designs, as well as other compo-nents comprising wind energy conversion (WEC).Consequently, the focus here will be on the newgenerators that are being developed in order tomake wind power generation more efficient, cheap-er, and cleaner.
The process of converting wind energy to elec-tricity is rather involved, moving through variousinterconnected stages. The next section is dedicatedto offer a basic description on the operational back-ground of the wind generator technology. Followingafter, Section 3 will review the conventional windgenerator concepts which will provide a back-ground for further deliberating on the newer mod-els in Section 4. The paper finishes with some con-cluding remarks in Section 5.
2. Overview of wind generator technology
A good historical account on how the WEC tech-nology started can be obtained from Ackermannand Söder (2005).Basically, the conversion is per-
116 Journal of Energy in Southern Africa • Vol 26 No 3 • August 2015
CONFERENCE PAPER
Contemporary wind generators
Udochukwu Bola Akuru
Maarten J KamperDepartment of Electrical and Electronic Engineering, Stellenbosch University, Stellenbosch, South Africa
Paper presented at the Domestic Use of Energy Conference, 19 – 20 August, 2014, Cape Town, South Africa,
and published in the conference proceedings. Reproduced with permission. Not peer-reviewed for JESA.
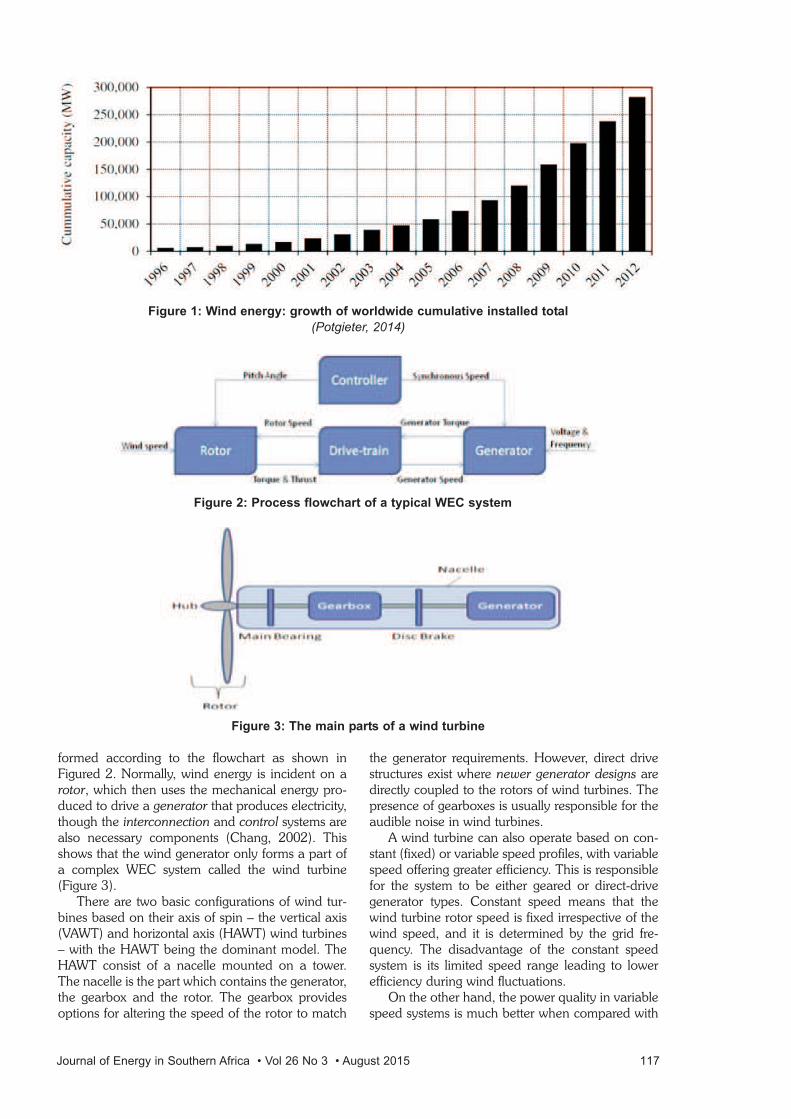
formed according to the flowchart as shown inFigured 2. Normally, wind energy is incident on arotor, which then uses the mechanical energy pro-duced to drive a generator that produces electricity,though the interconnection and control systems arealso necessary components (Chang, 2002). Thisshows that the wind generator only forms a part ofa complex WEC system called the wind turbine(Figure 3).
There are two basic configurations of wind tur-bines based on their axis of spin – the vertical axis(VAWT) and horizontal axis (HAWT) wind turbines– with the HAWT being the dominant model. TheHAWT consist of a nacelle mounted on a tower.The nacelle is the part which contains the generator,the gearbox and the rotor. The gearbox providesoptions for altering the speed of the rotor to match
the generator requirements. However, direct drivestructures exist where newer generator designs aredirectly coupled to the rotors of wind turbines. Thepresence of gearboxes is usually responsible for theaudible noise in wind turbines.
A wind turbine can also operate based on con-stant (fixed) or variable speed profiles, with variablespeed offering greater efficiency. This is responsiblefor the system to be either geared or direct-drivegenerator types. Constant speed means that thewind turbine rotor speed is fixed irrespective of thewind speed, and it is determined by the grid fre-quency. The disadvantage of the constant speedsystem is its limited speed range leading to lowerefficiency during wind fluctuations.
On the other hand, the power quality in variablespeed systems is much better when compared with
Journal of Energy in Southern Africa • Vol 26 No 3 • August 2015 117
Figure 1: Wind energy: growth of worldwide cumulative installed total
(Potgieter, 2014)
Figure 3: The main parts of a wind turbine
Figure 2: Process flowchart of a typical WEC system
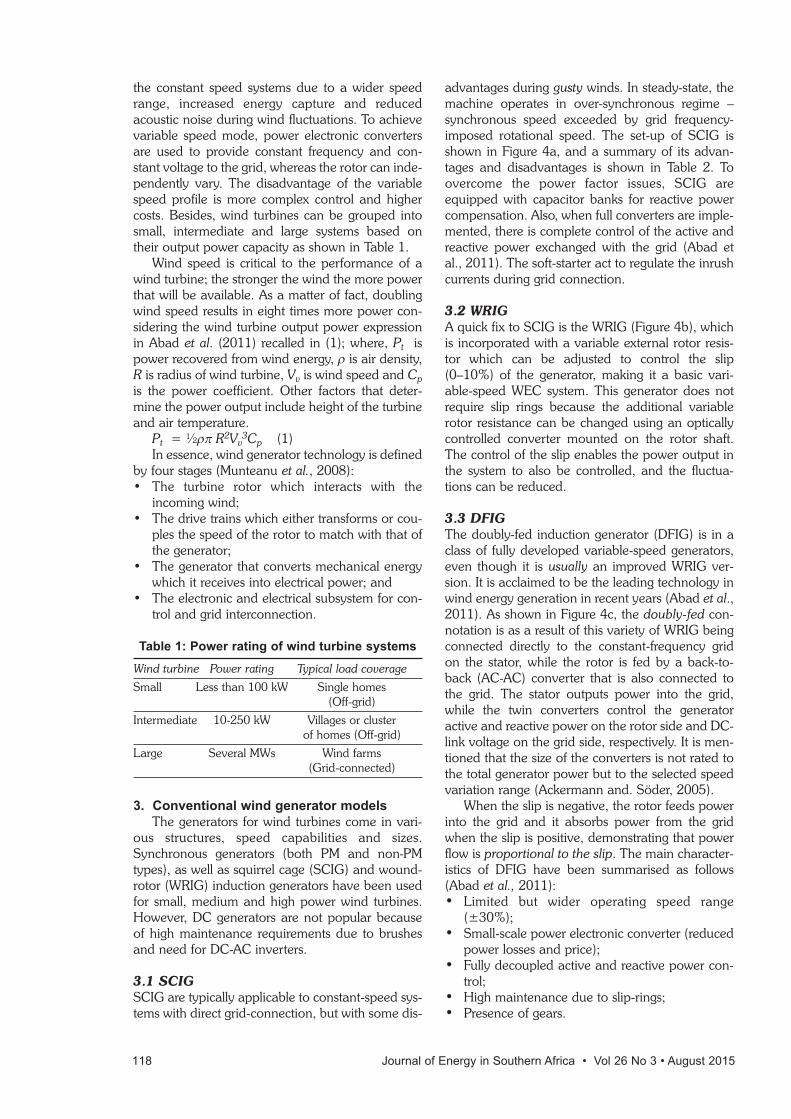
the constant speed systems due to a wider speedrange, increased energy capture and reducedacoustic noise during wind fluctuations. To achievevariable speed mode, power electronic convertersare used to provide constant frequency and con-stant voltage to the grid, whereas the rotor can inde-pendently vary. The disadvantage of the variablespeed profile is more complex control and highercosts. Besides, wind turbines can be grouped intosmall, intermediate and large systems based ontheir output power capacity as shown in Table 1.
Wind speed is critical to the performance of awind turbine; the stronger the wind the more powerthat will be available. As a matter of fact, doublingwind speed results in eight times more power con-sidering the wind turbine output power expressionin Abad et al. (2011) recalled in (1); where, Pt ispower recovered from wind energy, ρ is air density,R is radius of wind turbine, Vv is wind speed and Cp
is the power coefficient. Other factors that deter-mine the power output include height of the turbineand air temperature.
Pt = ½ρπ R2Vv3Cp (1)
In essence, wind generator technology is definedby four stages (Munteanu et al., 2008): • The turbine rotor which interacts with the
incoming wind;• The drive trains which either transforms or cou-
ples the speed of the rotor to match with that ofthe generator;
• The generator that converts mechanical energywhich it receives into electrical power; and
• The electronic and electrical subsystem for con-trol and grid interconnection.
Table 1: Power rating of wind turbine systems
Wind turbine Power rating Typical load coverage
Small Less than 100 kW Single homes (Off-grid)
Intermediate 10-250 kW Villages or cluster of homes (Off-grid)
Large Several MWs Wind farms (Grid-connected)
3. Conventional wind generator models
The generators for wind turbines come in vari-ous structures, speed capabilities and sizes.Synchronous generators (both PM and non-PMtypes), as well as squirrel cage (SCIG) and wound-rotor (WRIG) induction generators have been usedfor small, medium and high power wind turbines.However, DC generators are not popular becauseof high maintenance requirements due to brushesand need for DC-AC inverters.
3.1 SCIG
SCIG are typically applicable to constant-speed sys-tems with direct grid-connection, but with some dis-
advantages during gusty winds. In steady-state, themachine operates in over-synchronous regime –synchronous speed exceeded by grid frequency-imposed rotational speed. The set-up of SCIG isshown in Figure 4a, and a summary of its advan-tages and disadvantages is shown in Table 2. Toovercome the power factor issues, SCIG areequipped with capacitor banks for reactive powercompensation. Also, when full converters are imple-mented, there is complete control of the active andreactive power exchanged with the grid (Abad etal., 2011). The soft-starter act to regulate the inrushcurrents during grid connection.
3.2 WRIG
A quick fix to SCIG is the WRIG (Figure 4b), whichis incorporated with a variable external rotor resis-tor which can be adjusted to control the slip(0–10%) of the generator, making it a basic vari-able-speed WEC system. This generator does notrequire slip rings because the additional variablerotor resistance can be changed using an opticallycontrolled converter mounted on the rotor shaft.The control of the slip enables the power output inthe system to also be controlled, and the fluctua-tions can be reduced.
3.3 DFIG
The doubly-fed induction generator (DFIG) is in aclass of fully developed variable-speed generators,even though it is usually an improved WRIG ver-sion. It is acclaimed to be the leading technology inwind energy generation in recent years (Abad et al.,2011). As shown in Figure 4c, the doubly-fed con-notation is as a result of this variety of WRIG beingconnected directly to the constant-frequency gridon the stator, while the rotor is fed by a back-to-back (AC-AC) converter that is also connected tothe grid. The stator outputs power into the grid,while the twin converters control the generatoractive and reactive power on the rotor side and DC-link voltage on the grid side, respectively. It is men-tioned that the size of the converters is not rated tothe total generator power but to the selected speedvariation range (Ackermann and. Söder, 2005).
When the slip is negative, the rotor feeds powerinto the grid and it absorbs power from the gridwhen the slip is positive, demonstrating that powerflow is proportional to the slip. The main character-istics of DFIG have been summarised as follows(Abad et al., 2011):• Limited but wider operating speed range
(±30%);• Small-scale power electronic converter (reduced
power losses and price);• Fully decoupled active and reactive power con-
trol;• High maintenance due to slip-rings;• Presence of gears.
118 Journal of Energy in Southern Africa • Vol 26 No 3 • August 2015
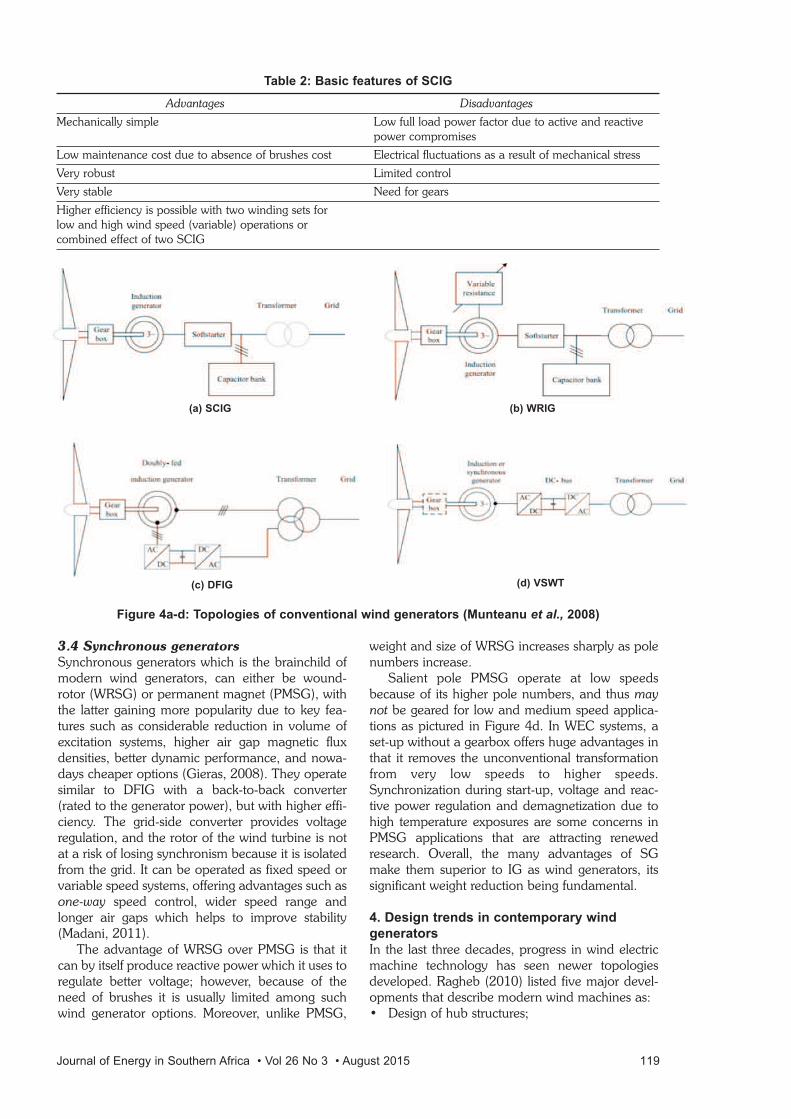
3.4 Synchronous generators
Synchronous generators which is the brainchild ofmodern wind generators, can either be wound-rotor (WRSG) or permanent magnet (PMSG), withthe latter gaining more popularity due to key fea-tures such as considerable reduction in volume ofexcitation systems, higher air gap magnetic fluxdensities, better dynamic performance, and nowa-days cheaper options (Gieras, 2008). They operatesimilar to DFIG with a back-to-back converter(rated to the generator power), but with higher effi-ciency. The grid-side converter provides voltageregulation, and the rotor of the wind turbine is notat a risk of losing synchronism because it is isolatedfrom the grid. It can be operated as fixed speed orvariable speed systems, offering advantages such asone-way speed control, wider speed range andlonger air gaps which helps to improve stability(Madani, 2011).
The advantage of WRSG over PMSG is that itcan by itself produce reactive power which it uses toregulate better voltage; however, because of theneed of brushes it is usually limited among suchwind generator options. Moreover, unlike PMSG,
weight and size of WRSG increases sharply as polenumbers increase.
Salient pole PMSG operate at low speedsbecause of its higher pole numbers, and thus maynot be geared for low and medium speed applica-tions as pictured in Figure 4d. In WEC systems, aset-up without a gearbox offers huge advantages inthat it removes the unconventional transformationfrom very low speeds to higher speeds.Synchronization during start-up, voltage and reac-tive power regulation and demagnetization due tohigh temperature exposures are some concerns inPMSG applications that are attracting renewedresearch. Overall, the many advantages of SGmake them superior to IG as wind generators, itssignificant weight reduction being fundamental.
4. Design trends in contemporary wind
generators
In the last three decades, progress in wind electricmachine technology has seen newer topologiesdeveloped. Ragheb (2010) listed five major devel-opments that describe modern wind machines as:• Design of hub structures;
Journal of Energy in Southern Africa • Vol 26 No 3 • August 2015 119
Table 2: Basic features of SCIG
Advantages Disadvantages
Mechanically simple Low full load power factor due to active and reactive power compromises
Low maintenance cost due to absence of brushes cost Electrical fluctuations as a result of mechanical stress
Very robust Limited control
Very stable Need for gears
Higher efficiency is possible with two winding sets for low and high wind speed (variable) operations or combined effect of two SCIG
Figure 4a-d: Topologies of conventional wind generators (Munteanu et al., 2008)
(a) SCIG (b) WRIG
(c) DFIG (d) VSWT
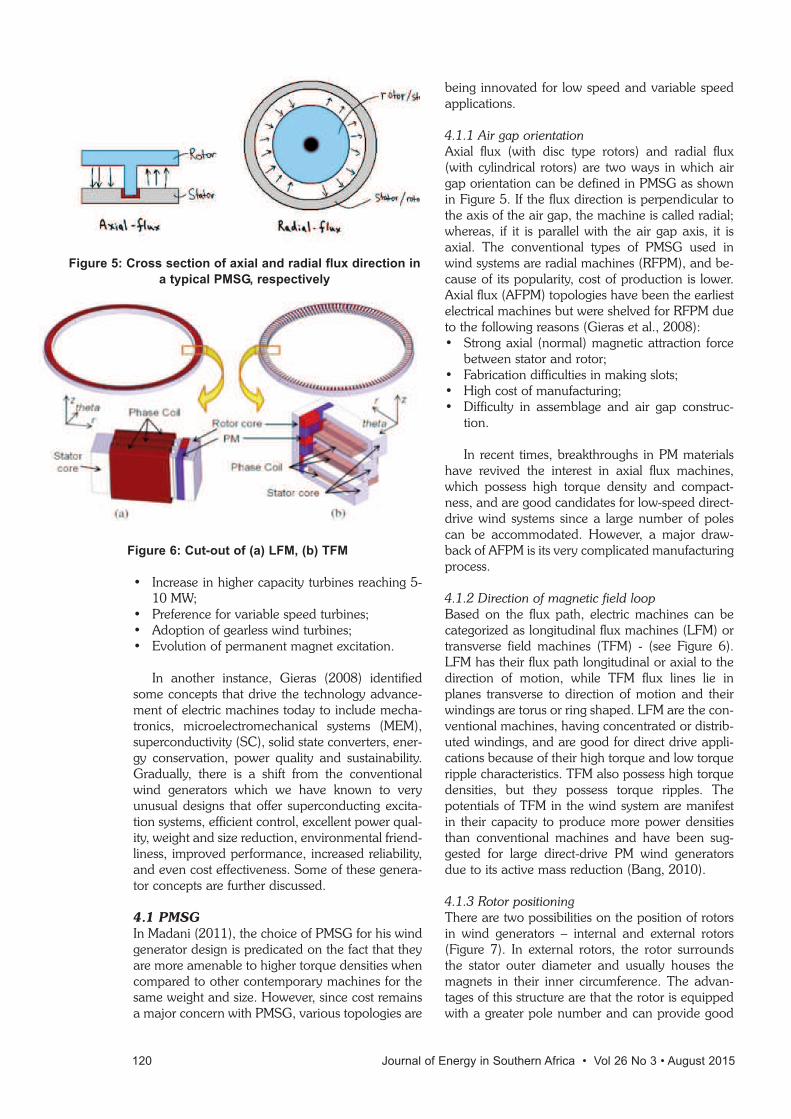
• Increase in higher capacity turbines reaching 5-10 MW;
• Preference for variable speed turbines;• Adoption of gearless wind turbines;• Evolution of permanent magnet excitation.
In another instance, Gieras (2008) identifiedsome concepts that drive the technology advance-ment of electric machines today to include mecha-tronics, microelectromechanical systems (MEM),superconductivity (SC), solid state converters, ener-gy conservation, power quality and sustainability.Gradually, there is a shift from the conventionalwind generators which we have known to veryunusual designs that offer superconducting excita-tion systems, efficient control, excellent power qual-ity, weight and size reduction, environmental friend-liness, improved performance, increased reliability,and even cost effectiveness. Some of these genera-tor concepts are further discussed.
4.1 PMSG
In Madani (2011), the choice of PMSG for his windgenerator design is predicated on the fact that theyare more amenable to higher torque densities whencompared to other contemporary machines for thesame weight and size. However, since cost remainsa major concern with PMSG, various topologies are
being innovated for low speed and variable speedapplications.
4.1.1 Air gap orientationAxial flux (with disc type rotors) and radial flux(with cylindrical rotors) are two ways in which airgap orientation can be defined in PMSG as shownin Figure 5. If the flux direction is perpendicular tothe axis of the air gap, the machine is called radial;whereas, if it is parallel with the air gap axis, it isaxial. The conventional types of PMSG used inwind systems are radial machines (RFPM), and be-cause of its popularity, cost of production is lower.Axial flux (AFPM) topologies have been the earliestelectrical machines but were shelved for RFPM dueto the following reasons (Gieras et al., 2008):• Strong axial (normal) magnetic attraction force
between stator and rotor;• Fabrication difficulties in making slots;• High cost of manufacturing;• Difficulty in assemblage and air gap construc-
tion.
In recent times, breakthroughs in PM materialshave revived the interest in axial flux machines,which possess high torque density and compact-ness, and are good candidates for low-speed direct-drive wind systems since a large number of polescan be accommodated. However, a major draw-back of AFPM is its very complicated manufacturingprocess.
4.1.2 Direction of magnetic field loopBased on the flux path, electric machines can becategorized as longitudinal flux machines (LFM) ortransverse field machines (TFM) - (see Figure 6).LFM has their flux path longitudinal or axial to thedirection of motion, while TFM flux lines lie inplanes transverse to direction of motion and theirwindings are torus or ring shaped. LFM are the con-ventional machines, having concentrated or distrib-uted windings, and are good for direct drive appli-cations because of their high torque and low torqueripple characteristics. TFM also possess high torquedensities, but they possess torque ripples. Thepotentials of TFM in the wind system are manifestin their capacity to produce more power densitiesthan conventional machines and have been sug-gested for large direct-drive PM wind generatorsdue to its active mass reduction (Bang, 2010).
4.1.3 Rotor positioning There are two possibilities on the position of rotorsin wind generators – internal and external rotors(Figure 7). In external rotors, the rotor surroundsthe stator outer diameter and usually houses themagnets in their inner circumference. The advan-tages of this structure are that the rotor is equippedwith a greater pole number and can provide good
120 Journal of Energy in Southern Africa • Vol 26 No 3 • August 2015
Figure 5: Cross section of axial and radial flux direction in
a typical PMSG, respectively
Figure 6: Cut-out of (a) LFM, (b) TFM
support for the magnets. Outer rotors have beenused in small HAWT. On the other hand, inner rotormachines are more common in wind generatorapplications, where they offer better cooling for thearmature windings placed on the stator.
4.1.4 Magnet arrangement PMSG can also be categorized based on the mag-net arrangement in the rotor. The commonest typesare the surface mounted permanent magnets(SMPM), where the magnet is mounted on the sur-face of the rotor. SMPM is the preferred configura-tion because of simple rotor geometry where thereis no saliency, but there is high risk of demagnetiza-tion. Others are, inset and buried magnets. In insetmachines, flux leakage is high because there areiron interpoles which create saliency. But in com-parison with SMPM, they possess higher torquedensity due to additional reluctance torque makingthem good candidates for direct-drive applicationsin wind generators.
Inset machines are also called interior perma-nent magnet (IPM) machines. A major advantage ofthis structure is that weak PM materal such as ferritecan be employed. It is also good in preventingdemagnetization. This topology is applicable inhigh-speed wind systems due to mechanicalstrength of the rotor against centrifugal force, but itis fraught with high flux leakage.
Figure 7: Internal (left) and external (right) rotor
PMSG
4.1.5 Winding selection Two types of windings are overlap and non-overlapwindings. Overlap windings are the conventionalwindings which can either be distributed or concen-trated. Distributed winding is associated with longend windings that result in higher copper losses andlonger axial lengths, a key disadvantage. Contrary,concentrated windings are built with shorter endwindings that lead to reduced joule losses, high effi-ciency and fault-tolerant applications in PMSG forwind systems.
Concentrated winding is a terminology which isbecoming familiar with non-overlap windings. Non-overlap (fractional-slot) windings bring an improve-ment to traditional concentrated windings in that itis possible to have reduced mutual coupling amongphases, reduced manufacturing costs, low torqueripple, as well as higher winding factors and higher
Journal of Energy in Southern Africa • Vol 26 No 3 • August 2015 121
Figure 8: Typical stator winding configurations
torque densities. Multiple layers are possible as thisreduces the harmonic content of the MMF which isa major drawback. It is reckoned that these MMFharmonics cause an alternating magnetic field inthe rotor giving rise to rotor losses (Libertt andSouland, 2003). It has also been reported thatemploying concentrated windings in PM generatorsfor low speed direct-drive applications is veryattractive because of their simple structure, higherpole numbers and shorter-end windings (Gieras etal., 2008). Figure 8 shows the various winding con-figurations discussed.
4.2 DrivetrainsTwo drivetrains have been mentioned earlier:geared and direct-drive (gearless) systems. Untilrecently, wind generation systems consisted of agearbox connected to high-speed variable speedgenerators. Today, wind energy systems can be dis-tinguished by the presence or absence of gears.Gearless systems are still very new, and are largelydue to advances in PM generators.
4.2.1 GearedThe function of a gearbox is to transform mechani-cal speed from low to high speed by means of astep-up system. Two main configurations in use arethe single-stage (1G) and three-stage (3G) geareddrivetrains. In the 1G concept, the generator, gear-box, main shaft, and shaft bearing are all integratedwithin a common housing. Multiple-gearboxschemes like the 3G concept is designed to furtherreduce the generator size and improve efficiency invariable wind concepts, and is usually connected toa full-scale power converter leading to losses morethan in the other drive concepts. Moreover, it iscostly, decreases drive efficiency and needs mainte-nance. The main advantage of geared systems istheir ability to ensure a wider speed range.
4.2.2 Direct-driveThis concept requires that SG is directly connectedto the turbine without making use of gears. Actually,WRSG and PMSG are applicable to this technolo-gy, but the future is more with PMSG. The advan-tages of this scheme are simple drivetrains, high effi-ciency, reliability, low speed applications andabsence of noisy gear boxes, thus making it acheaper bargain. There are also hybrid drivetrainsystems that utilize a medium-speed generator,which combines fewer gearing stages and convert-er-fed PMSG.
4.2.3 Full converter conceptsThere are three converter concepts based on thespeed drivetrain of a wind generator, namely; high-speed (HSFC), medium-speed (MSFC) and low-speed (LSFC) full converter concepts. Their charac-teristics are summarised in Table 3.
Table 3: Electrical drivetrain concepts
Parameter HSFC MSFC LSFC
Speed range 2000 rpm 500 rpm 30 rpm
Weight Lowest Intermediate Highest
Size Smallest Intermediate Largest
Gearbox Present (3G) Present (2G/1G) Absent
Generator Asynchronous/SynchronousSynchronous Synchronous
4.3 Power electronics
Another concept that has impacted the develop-ment of new wind generators is the strides recordedin power electronics technology. Power electronicshave developed various topologies of converterssuch as back-to-back, matrix and multi-level con-verters. Some of the achievements of power elec-tronics by means of efficient power converters arein gearless variable speed control, power amplifica-tion, power conversion, grid interconnection, andfrequency/voltage regulation. Although, a majorsetback is that they contribute to overall systemlosses and cost implications.
4.4 Innovative wind generator concepts
Before now, the dominating wind generators havebeen DC commutating machines, AC induction andAC synchronous machines. Presently, there are fartoo many other concepts for wind generating sys-tems that cannot be fully debated in this paperbecause they are either both developed but are yetestablished for wind generating systems, or are stillrelatively new and are being tested, or have beenproposed and information about them is veryscanty. However, a number of them will be men-tioned here for reference purposes:• Synchronous reluctance generator (SynRG)
(Tokunaga et al; 2011)• Switched reluctance generator (SRG) (Choi et
al, 2014);• Brushless DFIG (BDFIG) (Long et al., 2013);• Split–PM induction generator (S-PMIG)
(Potgieter, 2011);• Slip synchronous–PM generator (SS–PMG)
(Potgieter, 2014);• Switched-flux generator (SFG) (Sulaiman et al.,
2013; Kayano et al., 2010; Ojeda et al., 2012)• Ferrite–assisted reluctance synchronous genera-
tor (FA–RSG) (Baek et al, 2009);• Magnetic gears and pseudo–direct drive
(Wenlong, 2011);• Superconducting machines (Jensen et al, 2013);• PM Field–intensified synchronous reluctance
generator (FI–RSG) (theoretical).
4.5 Leading manufacturers and countries
There have been a number of manufacturers lead-ing the research, design and production of wind tur-bine concepts and generating systems worldwide.
122 Journal of Energy in Southern Africa • Vol 26 No 3 • August 2015
Key among them are Vestas (Denmark), GE (USA),Enercon (Germany), Gamsea (Spain), Suzlon(India), Siemens (Germany), Repower (Germany),Nordex (Germany), Ecotècnia (Spain), Mitsubishi(Japan), JSW (Japan), ScanWind (Norway),Vensys, STX Windpoer, EWT, MTorres, Leitwind,and Goldwin (Ragheh, 2010; Bang, 2010). Overthe years, some of these manufacturers get boughtover by larger companies; for instance GE boughtScanWind in 2009. Vestas Wind Systems A/S is thelargest manufacturer in the world with a total 51547wind turbines installed at a capacity of over 31 188MW in 73 countries (Vestas, 2014).
The world leader in wind power installed capac-ity is China with over 90 GW installed capacity,while Germany remains Europe’s superpower at34.25 GW (Global Wind Report, 2014). Egypt hasthe largest capacity in Africa at 550 MW, followedby Morocco and Ethiopia. The recent annualgrowth in wind power installations have been put at12 per cent, and certainly this trend will continue tointensify.
5. Conclusion
Wind generators are integral to wind energy con-version systems as revealed by the review under-taken in this paper. Little wonder, the vista of elec-trical machines in recent years, where wind energyhas received growing attention, has surpassed anyera of its existence. This is evident in the fact that allaspects of the traditional electrical machine is beingdissected and routinely transformed to meet grow-ing demands of this time. There are many consider-ations for this development as already highlightedin this paper that have specially considered one cat-egory of electrical machines – wind generators. Theadvantages of wind power generation, in spite ofobvious challenges, are huge. Wind power genera-tion leads to cleaner power options, as well as asource of income. There are many other benefitslike the impact of computational modelling andsimulation that are critical to contemporary designsof wind generators, but have not been expoundedhere. Therefore, the emphasis of this revision is animmediate call to action for sustained renewableenergy deployment as an immediate alternative tofossil fuels, bearing in mind that wind is abundant,more amenable to large power capture, safe, andsomehow, cheap.
Also worthy of mention, is the fact that electrici-ty generation have always been electrical generator-based and so, wind energy generation is closest toconventional electricity generation, as what is onlyrequired is to change the source of fuel in thesemachines into wind. The potential of using modernwind generators in sites where wind supply is verylow has been demonstrated (Kayano et al., 2010),making it attractive for all and sundry. Then ofcourse, there is the increasing drive for research and
development in wind power generation and thepromise it holds for a sustainable energy mix. Lastof all, one remarkable revelation in this evaluationis the bias for direct-drive applications in the designof modern wind generators.
ReferencesAckermann, T. and Söder, L. (2005). Wind Power in
Power Systems: An Introduction, in Wind Power inPower Systems (ed T. Ackermann), Chichester, UK:John Wiley & Sons.
Abad, G., López, J., Rodríguez, M., Morroyo, L. andIwanski, G. (2011). Doubly Fed Induction Machine:Modeling and Control for Wind Energy ConversionHoboken, New Jersey: John Wiley & Sons.
Akuru, U.B., Okoro, O.I. and Chikuni, E: Impact ofRenewable Energy Deployment on Climate Changein Nigeria, AFRICON, 2013, 9-12 Sept. 2013 doi:10.1109/AFRICON.2013.6757649.
Baek, J., Rahimian, M.M. and Toliyat, H.A.:(2009).Optimal design of PM assisted synchronousreluctance generators using lumped parametermodel and Differential Evolution Strategy, EnergyConversion Congress and Exposition, 2009. ECCE2009. IEEE, Vol., No., pp.2453, 2459, 20-24 Sept.2009 doi: 10.1109/ECCE.2009.5316225.
Bang, D. (2010). Design of a transverse flux permanentmagnet machines for large direct-drive wind tur-bines. MEng thesis, Pukyong National University,Korea.
Chang, L. (2002). Wind Energy Conversion Systems,IEEE Canadian Reviews-Spring, pp.12-16.
Choi, D-W., Byun, S-I. and Cho, Y-H. (2014). A Studyon the Maximum Power Control Method ofSwitched Reluctance Generator for WindTurbine, Magnetics, IEEE Transactions on, vol.50,no.1, pp.1,4, Jan. 2014 doi:10.1109/TMAG.2013.2274174.
Gieras, J.F. (2008) Advancements in Electric Machines,Milton Keynes, United Kingdom: Springer.
Gieras, J.F., Wang, R-J. and Kamper, M.J. (2008). AxialFlux Permanent Brushless Machines, Second edi-tion: Springer.
Global Wind Report: Annual Market Update 2013.Global Wind Energy Council (GWEC), April 2014.
Jensen, B.B., Mijatovic, N. and Abrahamsen, A.B.(2013). Development of superconductingwind turbine generators J. Renew. Sustain.Energy, Vol. 5, No. 2, pp. 023137-1-02313712.
Kayano, S., Sanada, M. and Morimoto, S. (2010).Power characteristics of a permanent magnet fluxswitching generator for a low-speed windturbine, Power Electronics Conference (IPEC), 2010International , vol., no., pp.258,263, 21-24 June2010 doi: 10.1109/IPEC.2010.5543884.
Libert F. and Soulard, J. (2003). Design Study of aDirect-Driven Surface Mounted Permanent MagnetMotor for Low Speed Application, Symposium onAdvanced Electromechanical Motion SystemsElectromotion 2003, Vol. 1 pp. 252-257, 26-28November 2003, Marrakesh, Morocco.
Journal of Energy in Southern Africa • Vol 26 No 3 • August 2015 123
Long T., Shao S., Abdi E., McMahon R.A. and Liu, S.(2013). Asymmetrical Low-Voltage Ride Through ofBrushless Doubly Fed Induction Generators for theWind Power Generation, Energy Conversion, IEEETransactions on, Vol. 28, No. 3, pp.502,511, Sept.2013doi: 10.1109/TEC.2013.2261818
Madani, N. (2011). Design of a permanent magnet syn-chronous generator for a vertical axis wind turbine.M Sc thesis, School of Electrical Engineering, RoyalInstitute of Technology, Stockholm, Sweden.
Munteanu, I., Bratcu, A.I., Cutululis N-A. and Ceanga,E. (2008). Optimal Control of Wind Energy Systemstowards a Global Approach, Springer.
Ojeda, J., Simoes, M.G., Guangjin L. and Gabsi, M.(2012). Design of a Flux-Switching ElectricalGenerator for Wind Turbine Systems, IndustryApplications, IEEE Transactions on, vol.48, no.6,pp.1808, 1816, Nov.-Dec. 2012 doi:10.1109/TIA.2012.2221674.
Potgieter, J.H.J. (2011). Design and analysis of a gear-less direct grid permanent magnet induction genera-tor. Masters thesis, University of Stellenbosch,Stellenbosch, South Africa.
Potgieter, J.H.J. (2014). Optimal topology and criticalevaluation of slip synchronous permanent magnetwind generator. PhD thesis, University ofStellenbosch, Stellenbosch, South Africa,
Ragheb, M. Modern Wind Generators, NetFiles.University of Illinois at Urbana-Champaign, 28 Feb.2010. Web 2 June 2014.
Sulaiman, E., and Teridi, M.F.M., Husin, Z.A., Ahmad,M.Z. and Kosaka, T. (2013. Investigation on FluxCharacteristics of Field Excitation Flux SwitchingMachine with Single FEC Polarity, ProcediaTechnology, Volume 11, Pages 572-579, ISSN 2212-0173, http://dx.doi.org/10.1016/j.prot-cy.2013.12.230.
Swift A. and Chapman, J. A Primer on Wind Energy:Meteorology, Technology, Economics andTransmission, presented at the University of TexasSchool of Law 2007 Wind Energy InstituteConference, Austin, Texas, February 2007, p. 1.
Tokunaga, S. and Kesamaru, K. (2011). FEM simulationof novel small wind turbine generation system withsynchronous reluctance generator, ElectricalMachines and Systems (ICEMS), 2011 InternationalConference on , pp.1,6, 20-23 Aug. 2011 doi:10.1109/ICEMS.2011.6073968.
Vestas track record as per 31 March, 2014. Available at:http://www.vestas.com/en/about/track_record#!.
Wenlong, L., Chau, K.T. and Jiang, J.Z.: Application ofLinear Magnetic Gears for Pseudo-Direct-DriveOceanic Wave Energy Harvesting, Magnetics, IEEETransactions on, Vol. 47, No.10, pp.2624,2627, Oct.2011 doi: 10.1109/TMAG.2011.2146233.
124 Journal of Energy in Southern Africa • Vol 26 No 3 • August 2015
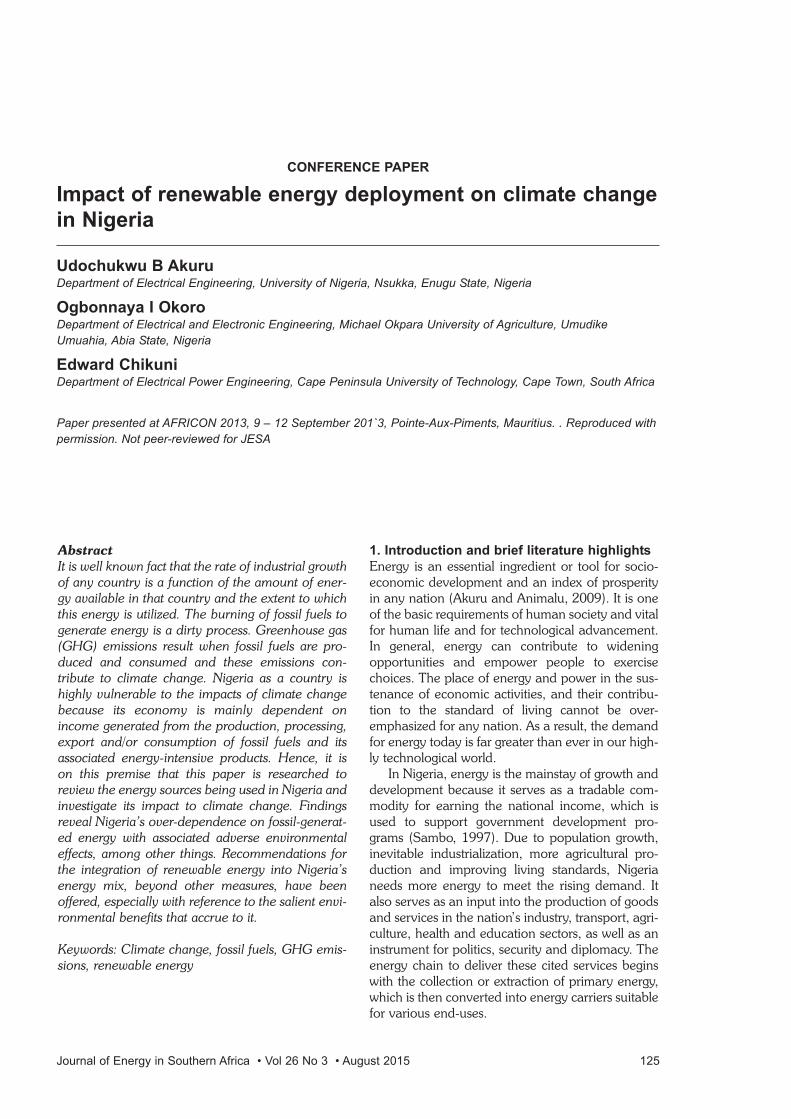
Journal of Energy in Southern Africa • Vol 26 No 3 • August 2015 125
Abstract
It is well known fact that the rate of industrial growthof any country is a function of the amount of ener-gy available in that country and the extent to whichthis energy is utilized. The burning of fossil fuels togenerate energy is a dirty process. Greenhouse gas(GHG) emissions result when fossil fuels are pro-duced and consumed and these emissions con-tribute to climate change. Nigeria as a country ishighly vulnerable to the impacts of climate changebecause its economy is mainly dependent onincome generated from the production, processing,export and/or consumption of fossil fuels and itsassociated energy-intensive products. Hence, it ison this premise that this paper is researched toreview the energy sources being used in Nigeria andinvestigate its impact to climate change. Findingsreveal Nigeria’s over-dependence on fossil-generat-ed energy with associated adverse environmentaleffects, among other things. Recommendations forthe integration of renewable energy into Nigeria’senergy mix, beyond other measures, have beenoffered, especially with reference to the salient envi-ronmental benefits that accrue to it.
Keywords: Climate change, fossil fuels, GHG emis-sions, renewable energy
1. Introduction and brief literature highlights
Energy is an essential ingredient or tool for socio-economic development and an index of prosperityin any nation (Akuru and Animalu, 2009). It is oneof the basic requirements of human society and vitalfor human life and for technological advancement.In general, energy can contribute to wideningopportunities and empower people to exercisechoices. The place of energy and power in the sus-tenance of economic activities, and their contribu-tion to the standard of living cannot be over-emphasized for any nation. As a result, the demandfor energy today is far greater than ever in our high-ly technological world.
In Nigeria, energy is the mainstay of growth anddevelopment because it serves as a tradable com-modity for earning the national income, which isused to support government development pro-grams (Sambo, 1997). Due to population growth,inevitable industrialization, more agricultural pro-duction and improving living standards, Nigerianeeds more energy to meet the rising demand. Italso serves as an input into the production of goodsand services in the nation’s industry, transport, agri-culture, health and education sectors, as well as aninstrument for politics, security and diplomacy. Theenergy chain to deliver these cited services beginswith the collection or extraction of primary energy,which is then converted into energy carriers suitablefor various end-uses.
CONFERENCE PAPER
Impact of renewable energy deployment on climate change
in Nigeria
Udochukwu B AkuruDepartment of Electrical Engineering, University of Nigeria, Nsukka, Enugu State, Nigeria
Ogbonnaya I OkoroDepartment of Electrical and Electronic Engineering, Michael Okpara University of Agriculture, Umudike
Umuahia, Abia State, Nigeria
Edward ChikuniDepartment of Electrical Power Engineering, Cape Peninsula University of Technology, Cape Town, South Africa
Paper presented at AFRICON 2013, 9 – 12 September 201`3, Pointe-Aux-Piments, Mauritius. . Reproduced with
permission. Not peer-reviewed for JESA
In an earlier paper (Akuru and Okoro, 2010),the statistics of energy and its contribution toNigeria’s GDP has been set forth, though these val-ues could increase if over 90% of energy used byrural dwellers is accounted for. Currently a high pro-portion of Nigeria’s total energy output is generatedfrom fossil fuels such as oil and coal. In general, thequest for an option to conventional power schemesfor extension to remote and rural locations of devel-oping countries like Nigeria arises from the highcosts associated with the extensions, as well as themaintenance, of the power grid system to ruralareas. This has led to a considerable interest in thedevelopment and application of renewable energy
resources. Interest in renewable energy has tradi-tionally grown from the need to expand energyresources to reach remote and rural locations.However, the use of conventional sources and fuel-wood to generate energy has continued to generatedire environmental consequences.
Renewable energy is that form of energyobtained from sources that are essentially inex-haustible, unlimited and rapidly replenished or nat-urally renewable such as wind, water, sun, wave,refuse, bio-fuels etc. Nigeria is endowed with suffi-cient renewable energy resources to meet its presentand future development requirements as well ascomplement its current oil-dependent economy
126 Journal of Energy in Southern Africa • Vol 26 No 3 • August 2015
Figure 1: Causal factors of climate change
Source: Odjugo, 2010
(Akuru and Okoro, 2010; Nigeria’s First NationalCommunication, 2003).
Greenhouse gas (GHG) emissions are producedwhen fossil fuels are produced and consumed andthese emissions contribute to climate change.Climate change is caused by two basic factors(Odjugo, 2010), which include natural processes(biogeographical) and human activities (anthro-pogenic) summarized in Figure 1. Nigeria as acountry is highly vulnerable to the impact of climatechange because its economy is mainly dependenton income generated from the production, process-ing, export and/or consumption of fossil fuels andassociated energy-intensive products Nigeria’s FirstNational Communication, 2003). It is well estab-lished that the activities of developed nations aremostly accountable for climate change, but devel-oping nations are those suffering more due toinability to cope as a result of poverty and low tech-nological development (Odjugo, 2010).
Several studies have focused on climatic impactsin Nigeria and the results are appalling (Odjugo,2010; Odjugo, 2005; Chindo and Nyelong, 2005;Adefolalu et al., 2007; Odjugo, 2010). Other inde-pendent studies have linked climate change withthe economy (Yahaya et al., 2010) and globalwarming) of Nigeria (Odjugo, 2011). The spill overeffects of climate changes are increasing tempera-ture (global warming), sea level rise leading to pop-ulation displacement as well as land disputes,draught and desertification, unpredictable rainfallwith negative impacts on agriculture, human healthproblems, etc. On the other hand, the visible effectsof climate change have resulted in setting up meas-ures to address it. Such mitigation options includeemission cuts, reduction in water pollution,afforestation and sustainable energy investments(Odjugo, 2010; Odjugo, 2011). Based on the com-parative impacts of climate change at regional lev-els, this paper is an attempt to review the dire con-sequences of Nigeria’s over-dependence on fossil-fuel-based energy resources and its impact on cli-mate change and propose a viable alternative intoits energy mix.
2. Methodology and research
The following questions have been developed toguide the process of this research:a) To what extent are fossil fuels being used in
energy production and associated activities inNigeria?
b) What are the indices used to measure the impactof climate change and to what extent has/couldit affect Nigeria?
c) What proactive measure(s) need to be taken toaddress the possibility of a negative impactassessment?
The impacts of climate change in Nigeria in thecoming years are expected to result from global
changes in climate. This change will in turn bebased on increases in the concentrations of thegreenhouse gases including carbon dioxide,methane and nitrous oxide. Increasing concentra-tions of greenhouse gases in the atmosphereenhances the potential of the atmosphere to con-serve heat and therefore bring about global warm-ing. Thus, increases in the concentrations of themajor greenhouse gas emissions within the countryis a function of the emissions of these gases and willdepend, in the main, on increases in the consump-tion of fossil fuels, among other factors. In otherwords, expected global climate change will dependbasically on global population increases, globalenergy consumption, and global changes in landuse pattern (Nigeria’s First National Communica-tion, 2003). Rich-income countries can be blamedelaborately for greenhouse gas emissions but notexclusively. This is because even if drastic efforts aremade by the developed world to reduce green-house gas pollution, there is even a greater risk thatgreenhouse gas emissions in the developing world ifunabated, would translate into worsening rates,caused by rapid industrial growth, in a not distantfuture (Odjugo, 2010).
Thus, the methodology adopted here, thoughqualitative, relies heavily on secondary data con-sisting mainly of existing records and documenta-tion in various forms including data both from theenergy sector in Nigeria and the NationalPopulation Commission and other sources relevantto the study. The general approach was to reusemostly the results of the available data that havebeen previously published and model them to suitthe objectives of this research. The various data setswere then analysed and the results interpreted andresolved into presentable formats using tables,charts and graphs.
a) Data
The rate of population growth in Nigeria is summa-rized in Figure 2. Energy Consumption by Source isthe total amount of primary energy consumed fromthe usage of a specified fuel. Primary energyincludes losses from transportation, friction, heatloss and other inefficiencies. Specifically, consump-tion equals indigenous production plus imports andstock changes, minus exports and internationalmarine bunkers; the IEA calls this value TotalPrimary Energy Supply (TPES) (Earth TrendsCountry Profile, 2003). Table 1 provides details forthe distribution of energy source and the amountconsumed in metric tons equivalent of oil inNigeria. All energy consumption values presentedhere are calculated and reported by theInternational Energy Agency (IEA) based on anenergy balance methodology using metric tons ofoil equivalent (toe) (Earth Trends Country Profile,2003).
Journal of Energy in Southern Africa • Vol 26 No 3 • August 2015 127
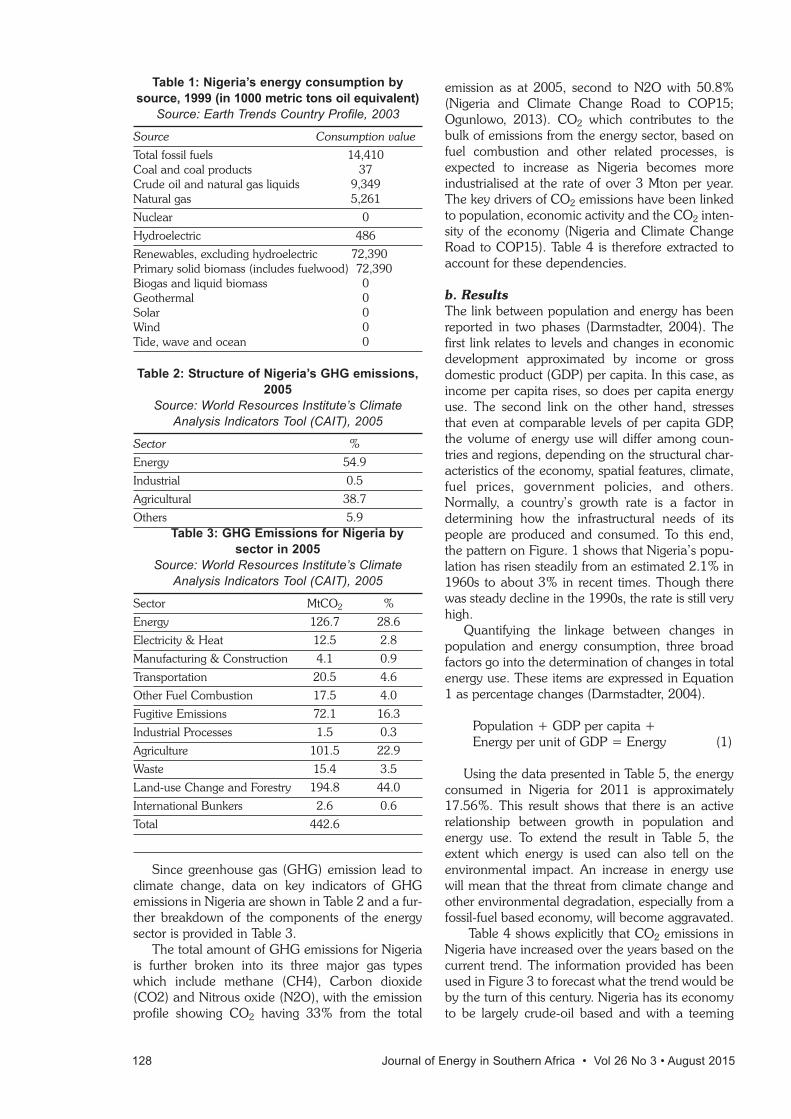
Table 1: Nigeria’s energy consumption by
source, 1999 (in 1000 metric tons oil equivalent)
Source: Earth Trends Country Profile, 2003
Source Consumption value
Total fossil fuels 14,410Coal and coal products 37Crude oil and natural gas liquids 9,349Natural gas 5,261
Nuclear 0
Hydroelectric 486
Renewables, excluding hydroelectric 72,390Primary solid biomass (includes fuelwood) 72,390Biogas and liquid biomass 0Geothermal 0Solar 0Wind 0Tide, wave and ocean 0
Table 2: Structure of Nigeria’s GHG emissions,
2005
Source: World Resources Institute’s Climate
Analysis Indicators Tool (CAIT), 2005
Sector %
Energy 54.9
Industrial 0.5
Agricultural 38.7
Others 5.9Table 3: GHG Emissions for Nigeria by
sector in 2005
Source: World Resources Institute’s Climate
Analysis Indicators Tool (CAIT), 2005
Sector MtCO2 %
Energy 126.7 28.6
Electricity & Heat 12.5 2.8
Manufacturing & Construction 4.1 0.9
Transportation 20.5 4.6
Other Fuel Combustion 17.5 4.0
Fugitive Emissions 72.1 16.3
Industrial Processes 1.5 0.3
Agriculture 101.5 22.9
Waste 15.4 3.5
Land-use Change and Forestry 194.8 44.0
International Bunkers 2.6 0.6
Total 442.6
Since greenhouse gas (GHG) emission lead toclimate change, data on key indicators of GHGemissions in Nigeria are shown in Table 2 and a fur-ther breakdown of the components of the energysector is provided in Table 3.
The total amount of GHG emissions for Nigeriais further broken into its three major gas typeswhich include methane (CH4), Carbon dioxide(CO2) and Nitrous oxide (N2O), with the emissionprofile showing CO2 having 33% from the total
emission as at 2005, second to N2O with 50.8%(Nigeria and Climate Change Road to COP15;Ogunlowo, 2013). CO2 which contributes to thebulk of emissions from the energy sector, based onfuel combustion and other related processes, isexpected to increase as Nigeria becomes moreindustrialised at the rate of over 3 Mton per year.The key drivers of CO2 emissions have been linkedto population, economic activity and the CO2 inten-sity of the economy (Nigeria and Climate ChangeRoad to COP15). Table 4 is therefore extracted toaccount for these dependencies.
b. Results
The link between population and energy has beenreported in two phases (Darmstadter, 2004). Thefirst link relates to levels and changes in economicdevelopment approximated by income or grossdomestic product (GDP) per capita. In this case, asincome per capita rises, so does per capita energyuse. The second link on the other hand, stressesthat even at comparable levels of per capita GDP,the volume of energy use will differ among coun-tries and regions, depending on the structural char-acteristics of the economy, spatial features, climate,fuel prices, government policies, and others.Normally, a country’s growth rate is a factor indetermining how the infrastructural needs of itspeople are produced and consumed. To this end,the pattern on Figure. 1 shows that Nigeria’s popu-lation has risen steadily from an estimated 2.1% in1960s to about 3% in recent times. Though therewas steady decline in the 1990s, the rate is still veryhigh.
Quantifying the linkage between changes inpopulation and energy consumption, three broadfactors go into the determination of changes in totalenergy use. These items are expressed in Equation1 as percentage changes (Darmstadter, 2004).
Population + GDP per capita +Energy per unit of GDP = Energy (1)
Using the data presented in Table 5, the energyconsumed in Nigeria for 2011 is approximately17.56%. This result shows that there is an activerelationship between growth in population andenergy use. To extend the result in Table 5, theextent which energy is used can also tell on theenvironmental impact. An increase in energy usewill mean that the threat from climate change andother environmental degradation, especially from afossil-fuel based economy, will become aggravated.
Table 4 shows explicitly that CO2 emissions inNigeria have increased over the years based on thecurrent trend. The information provided has beenused in Figure 3 to forecast what the trend would beby the turn of this century. Nigeria has its economyto be largely crude-oil based and with a teeming
128 Journal of Energy in Southern Africa • Vol 26 No 3 • August 2015
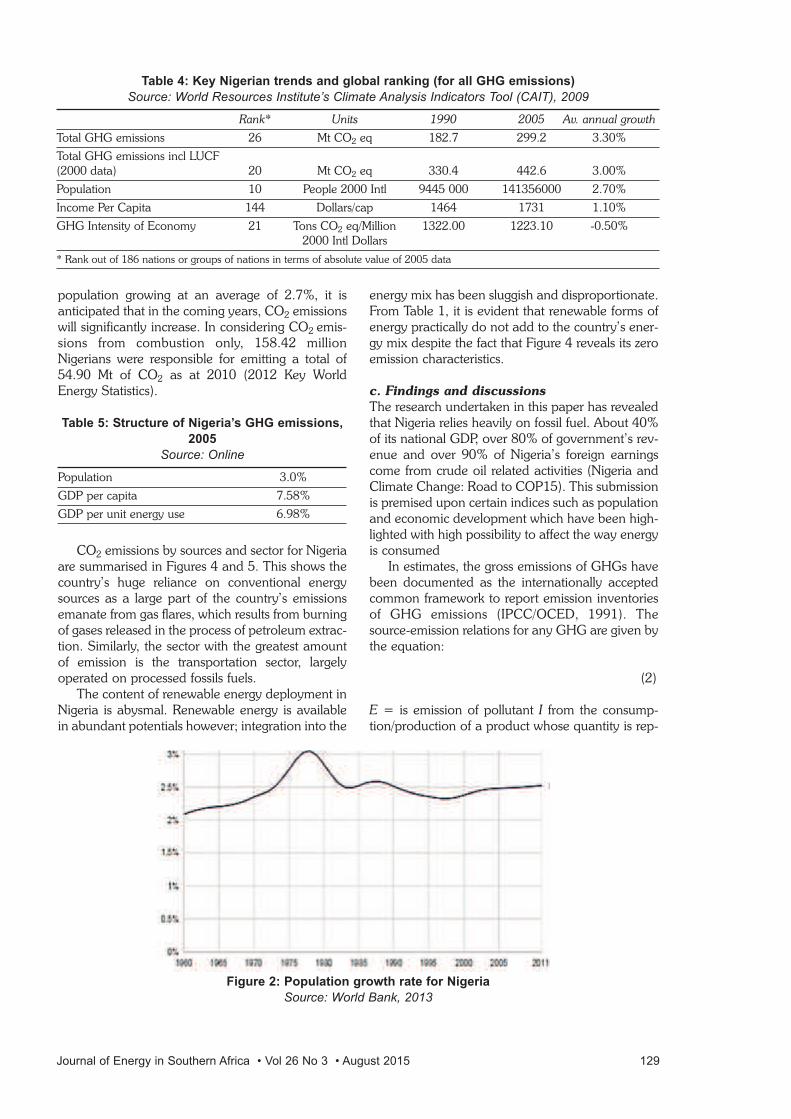
population growing at an average of 2.7%, it isanticipated that in the coming years, CO2 emissionswill significantly increase. In considering CO2 emis-sions from combustion only, 158.42 millionNigerians were responsible for emitting a total of54.90 Mt of CO2 as at 2010 (2012 Key WorldEnergy Statistics).
Table 5: Structure of Nigeria’s GHG emissions,
2005
Source: Online
Population 3.0%
GDP per capita 7.58%
GDP per unit energy use 6.98%
CO2 emissions by sources and sector for Nigeriaare summarised in Figures 4 and 5. This shows thecountry’s huge reliance on conventional energysources as a large part of the country’s emissionsemanate from gas flares, which results from burningof gases released in the process of petroleum extrac-tion. Similarly, the sector with the greatest amountof emission is the transportation sector, largelyoperated on processed fossils fuels.
The content of renewable energy deployment inNigeria is abysmal. Renewable energy is availablein abundant potentials however; integration into the
energy mix has been sluggish and disproportionate.From Table 1, it is evident that renewable forms ofenergy practically do not add to the country’s ener-gy mix despite the fact that Figure 4 reveals its zeroemission characteristics.
c. Findings and discussions
The research undertaken in this paper has revealedthat Nigeria relies heavily on fossil fuel. About 40%of its national GDP, over 80% of government’s rev-enue and over 90% of Nigeria’s foreign earningscome from crude oil related activities (Nigeria andClimate Change: Road to COP15). This submissionis premised upon certain indices such as populationand economic development which have been high-lighted with high possibility to affect the way energyis consumed
In estimates, the gross emissions of GHGs havebeen documented as the internationally acceptedcommon framework to report emission inventoriesof GHG emissions (IPCC/OCED, 1991). Thesource-emission relations for any GHG are given bythe equation:
(2)
E = is emission of pollutant I from the consump-tion/production of a product whose quantity is rep-
Journal of Energy in Southern Africa • Vol 26 No 3 • August 2015 129
Figure 2: Population growth rate for Nigeria
Source: World Bank, 2013
Table 4: Key Nigerian trends and global ranking (for all GHG emissions)
Source: World Resources Institute’s Climate Analysis Indicators Tool (CAIT), 2009
Rank* Units 1990 2005 Av. annual growth
Total GHG emissions 26 Mt CO2 eq 182.7 299.2 3.30%
Total GHG emissions incl LUCF (2000 data) 20 Mt CO2 eq 330.4 442.6 3.00%
Population 10 People 2000 Intl 9445 000 141356000 2.70%
Income Per Capita 144 Dollars/cap 1464 1731 1.10%
GHG Intensity of Economy 21 Tons CO2 eq/Million 1322.00 1223.10 -0.50%2000 Intl Dollars
* Rank out of 186 nations or groups of nations in terms of absolute value of 2005 data
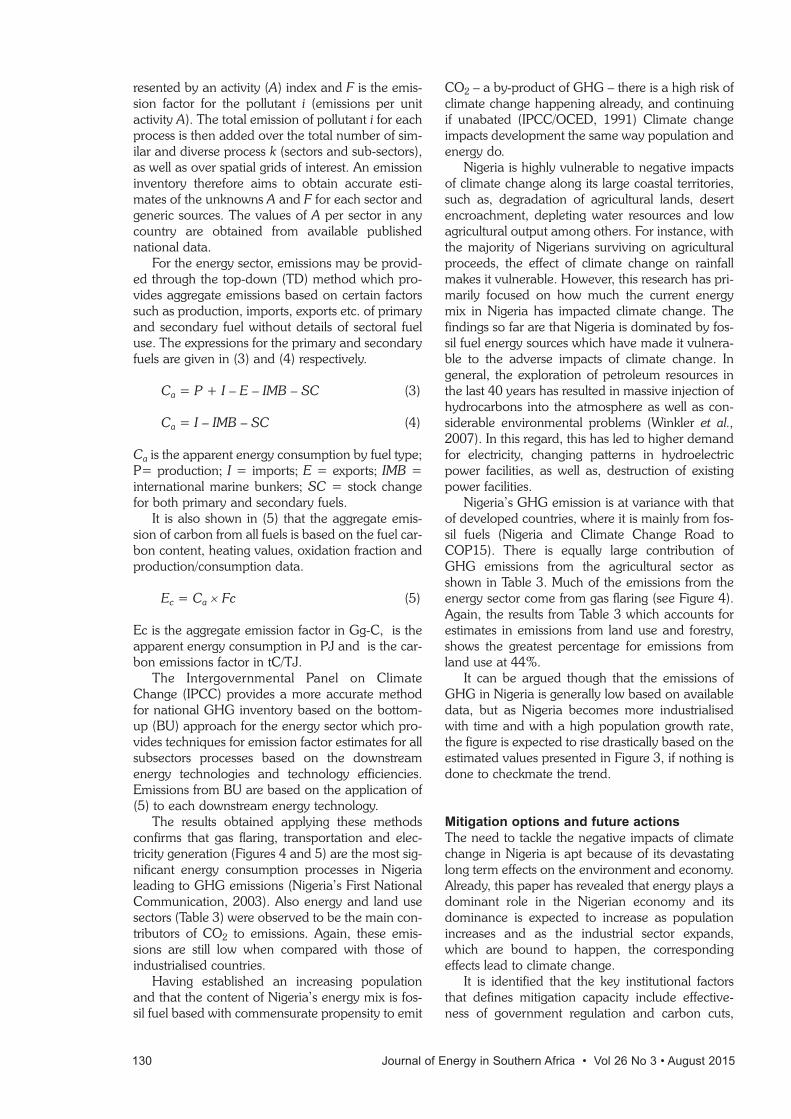
resented by an activity (A) index and F is the emis-sion factor for the pollutant i (emissions per unitactivity A). The total emission of pollutant i for eachprocess is then added over the total number of sim-ilar and diverse process k (sectors and sub-sectors),as well as over spatial grids of interest. An emissioninventory therefore aims to obtain accurate esti-mates of the unknowns A and F for each sector andgeneric sources. The values of A per sector in anycountry are obtained from available publishednational data.
For the energy sector, emissions may be provid-ed through the top-down (TD) method which pro-vides aggregate emissions based on certain factorssuch as production, imports, exports etc. of primaryand secondary fuel without details of sectoral fueluse. The expressions for the primary and secondaryfuels are given in (3) and (4) respectively.
Ca = P + I – E – IMB – SC (3)
Ca = I – IMB – SC (4)
Ca is the apparent energy consumption by fuel type;P= production; I = imports; E = exports; IMB =international marine bunkers; SC = stock changefor both primary and secondary fuels.
It is also shown in (5) that the aggregate emis-sion of carbon from all fuels is based on the fuel car-bon content, heating values, oxidation fraction andproduction/consumption data.
Ec = Ca × Fc (5)
Ec is the aggregate emission factor in Gg-C, is theapparent energy consumption in PJ and is the car-bon emissions factor in tC/TJ.
The Intergovernmental Panel on ClimateChange (IPCC) provides a more accurate methodfor national GHG inventory based on the bottom-up (BU) approach for the energy sector which pro-vides techniques for emission factor estimates for allsubsectors processes based on the downstreamenergy technologies and technology efficiencies.Emissions from BU are based on the application of(5) to each downstream energy technology.
The results obtained applying these methodsconfirms that gas flaring, transportation and elec-tricity generation (Figures 4 and 5) are the most sig-nificant energy consumption processes in Nigerialeading to GHG emissions (Nigeria’s First NationalCommunication, 2003). Also energy and land usesectors (Table 3) were observed to be the main con-tributors of CO2 to emissions. Again, these emis-sions are still low when compared with those ofindustrialised countries.
Having established an increasing populationand that the content of Nigeria’s energy mix is fos-sil fuel based with commensurate propensity to emit
CO2 – a by-product of GHG – there is a high risk ofclimate change happening already, and continuingif unabated (IPCC/OCED, 1991) Climate changeimpacts development the same way population andenergy do.
Nigeria is highly vulnerable to negative impactsof climate change along its large coastal territories,such as, degradation of agricultural lands, desertencroachment, depleting water resources and lowagricultural output among others. For instance, withthe majority of Nigerians surviving on agriculturalproceeds, the effect of climate change on rainfallmakes it vulnerable. However, this research has pri-marily focused on how much the current energymix in Nigeria has impacted climate change. Thefindings so far are that Nigeria is dominated by fos-sil fuel energy sources which have made it vulnera-ble to the adverse impacts of climate change. Ingeneral, the exploration of petroleum resources inthe last 40 years has resulted in massive injection ofhydrocarbons into the atmosphere as well as con-siderable environmental problems (Winkler et al.,2007). In this regard, this has led to higher demandfor electricity, changing patterns in hydroelectricpower facilities, as well as, destruction of existingpower facilities.
Nigeria’s GHG emission is at variance with thatof developed countries, where it is mainly from fos-sil fuels (Nigeria and Climate Change Road toCOP15). There is equally large contribution ofGHG emissions from the agricultural sector asshown in Table 3. Much of the emissions from theenergy sector come from gas flaring (see Figure 4).Again, the results from Table 3 which accounts forestimates in emissions from land use and forestry,shows the greatest percentage for emissions fromland use at 44%.
It can be argued though that the emissions ofGHG in Nigeria is generally low based on availabledata, but as Nigeria becomes more industrialisedwith time and with a high population growth rate,the figure is expected to rise drastically based on theestimated values presented in Figure 3, if nothing isdone to checkmate the trend.
Mitigation options and future actions
The need to tackle the negative impacts of climatechange in Nigeria is apt because of its devastatinglong term effects on the environment and economy.Already, this paper has revealed that energy plays adominant role in the Nigerian economy and itsdominance is expected to increase as populationincreases and as the industrial sector expands,which are bound to happen, the correspondingeffects lead to climate change.
It is identified that the key institutional factorsthat defines mitigation capacity include effective-ness of government regulation and carbon cuts,
130 Journal of Energy in Southern Africa • Vol 26 No 3 • August 2015
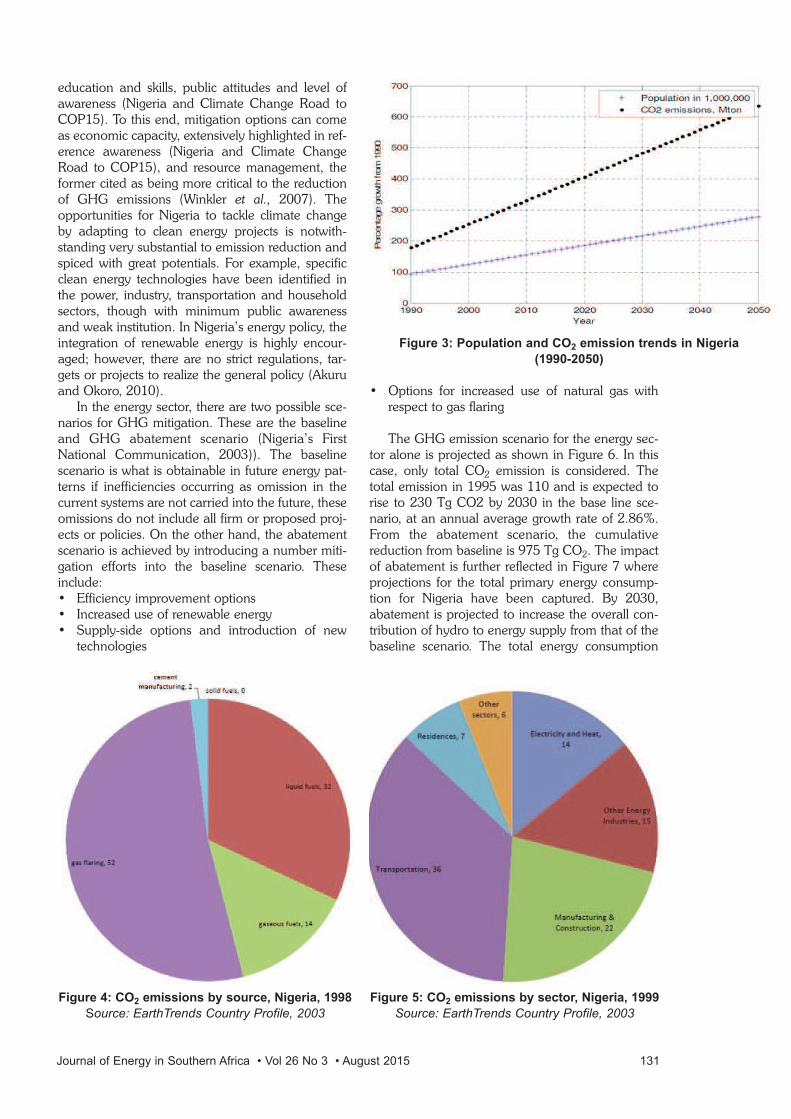
education and skills, public attitudes and level ofawareness (Nigeria and Climate Change Road toCOP15). To this end, mitigation options can comeas economic capacity, extensively highlighted in ref-erence awareness (Nigeria and Climate ChangeRoad to COP15), and resource management, theformer cited as being more critical to the reductionof GHG emissions (Winkler et al., 2007). Theopportunities for Nigeria to tackle climate changeby adapting to clean energy projects is notwith-standing very substantial to emission reduction andspiced with great potentials. For example, specificclean energy technologies have been identified inthe power, industry, transportation and householdsectors, though with minimum public awarenessand weak institution. In Nigeria’s energy policy, theintegration of renewable energy is highly encour-aged; however, there are no strict regulations, tar-gets or projects to realize the general policy (Akuruand Okoro, 2010).
In the energy sector, there are two possible sce-narios for GHG mitigation. These are the baselineand GHG abatement scenario (Nigeria’s FirstNational Communication, 2003)). The baselinescenario is what is obtainable in future energy pat-terns if inefficiencies occurring as omission in thecurrent systems are not carried into the future, theseomissions do not include all firm or proposed proj-ects or policies. On the other hand, the abatementscenario is achieved by introducing a number miti-gation efforts into the baseline scenario. Theseinclude:• Efficiency improvement options• Increased use of renewable energy• Supply-side options and introduction of new
technologies
• Options for increased use of natural gas withrespect to gas flaring
The GHG emission scenario for the energy sec-tor alone is projected as shown in Figure 6. In thiscase, only total CO2 emission is considered. Thetotal emission in 1995 was 110 and is expected torise to 230 Tg CO2 by 2030 in the base line sce-nario, at an annual average growth rate of 2.86%.From the abatement scenario, the cumulativereduction from baseline is 975 Tg CO2. The impactof abatement is further reflected in Figure 7 whereprojections for the total primary energy consump-tion for Nigeria have been captured. By 2030,abatement is projected to increase the overall con-tribution of hydro to energy supply from that of thebaseline scenario. The total energy consumption
Journal of Energy in Southern Africa • Vol 26 No 3 • August 2015 131
Figure 4: CO2 emissions by source, Nigeria, 1998
Source: EarthTrends Country Profile, 2003
Figure 5: CO2 emissions by sector, Nigeria, 1999
Source: EarthTrends Country Profile, 2003
Figure 3: Population and CO2 emission trends in Nigeria
(1990-2050)
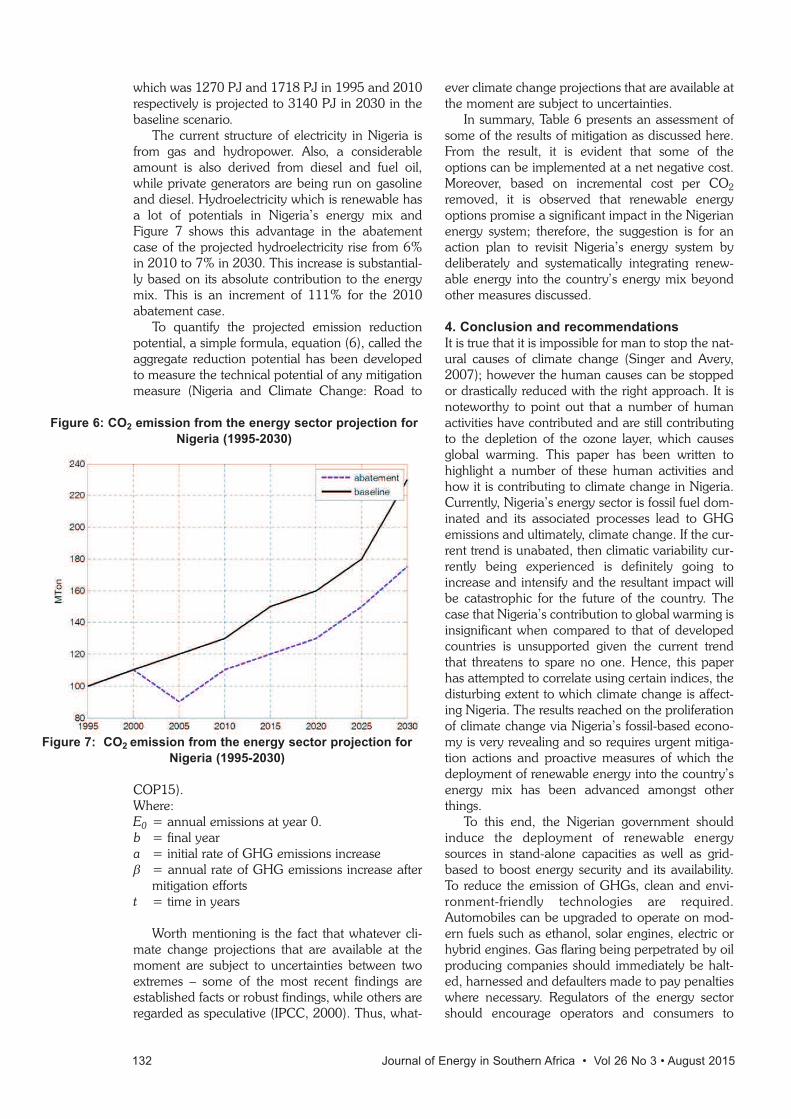
which was 1270 PJ and 1718 PJ in 1995 and 2010respectively is projected to 3140 PJ in 2030 in thebaseline scenario.
The current structure of electricity in Nigeria isfrom gas and hydropower. Also, a considerableamount is also derived from diesel and fuel oil,while private generators are being run on gasolineand diesel. Hydroelectricity which is renewable hasa lot of potentials in Nigeria’s energy mix andFigure 7 shows this advantage in the abatementcase of the projected hydroelectricity rise from 6%in 2010 to 7% in 2030. This increase is substantial-ly based on its absolute contribution to the energymix. This is an increment of 111% for the 2010abatement case.
To quantify the projected emission reductionpotential, a simple formula, equation (6), called theaggregate reduction potential has been developedto measure the technical potential of any mitigationmeasure (Nigeria and Climate Change: Road to
COP15). Where:E0 = annual emissions at year 0.b = final yeara = initial rate of GHG emissions increaseβ = annual rate of GHG emissions increase after
mitigation effortst = time in years
Worth mentioning is the fact that whatever cli-mate change projections that are available at themoment are subject to uncertainties between twoextremes – some of the most recent findings areestablished facts or robust findings, while others areregarded as speculative (IPCC, 2000). Thus, what-
ever climate change projections that are available atthe moment are subject to uncertainties.
In summary, Table 6 presents an assessment ofsome of the results of mitigation as discussed here.From the result, it is evident that some of theoptions can be implemented at a net negative cost.Moreover, based on incremental cost per CO2removed, it is observed that renewable energyoptions promise a significant impact in the Nigerianenergy system; therefore, the suggestion is for anaction plan to revisit Nigeria’s energy system bydeliberately and systematically integrating renew-able energy into the country’s energy mix beyondother measures discussed.
4. Conclusion and recommendations
It is true that it is impossible for man to stop the nat-ural causes of climate change (Singer and Avery,2007); however the human causes can be stoppedor drastically reduced with the right approach. It isnoteworthy to point out that a number of humanactivities have contributed and are still contributingto the depletion of the ozone layer, which causesglobal warming. This paper has been written tohighlight a number of these human activities andhow it is contributing to climate change in Nigeria.Currently, Nigeria’s energy sector is fossil fuel dom-inated and its associated processes lead to GHGemissions and ultimately, climate change. If the cur-rent trend is unabated, then climatic variability cur-rently being experienced is definitely going toincrease and intensify and the resultant impact willbe catastrophic for the future of the country. Thecase that Nigeria’s contribution to global warming isinsignificant when compared to that of developedcountries is unsupported given the current trendthat threatens to spare no one. Hence, this paperhas attempted to correlate using certain indices, thedisturbing extent to which climate change is affect-ing Nigeria. The results reached on the proliferationof climate change via Nigeria’s fossil-based econo-my is very revealing and so requires urgent mitiga-tion actions and proactive measures of which thedeployment of renewable energy into the country’senergy mix has been advanced amongst otherthings.
To this end, the Nigerian government shouldinduce the deployment of renewable energysources in stand-alone capacities as well as grid-based to boost energy security and its availability.To reduce the emission of GHGs, clean and envi-ronment-friendly technologies are required.Automobiles can be upgraded to operate on mod-ern fuels such as ethanol, solar engines, electric orhybrid engines. Gas flaring being perpetrated by oilproducing companies should immediately be halt-ed, harnessed and defaulters made to pay penaltieswhere necessary. Regulators of the energy sectorshould encourage operators and consumers to
132 Journal of Energy in Southern Africa • Vol 26 No 3 • August 2015
Figure 6: CO2 emission from the energy sector projection for
Nigeria (1995-2030)
Figure 7: CO2 emission from the energy sector projection for
Nigeria (1995-2030)
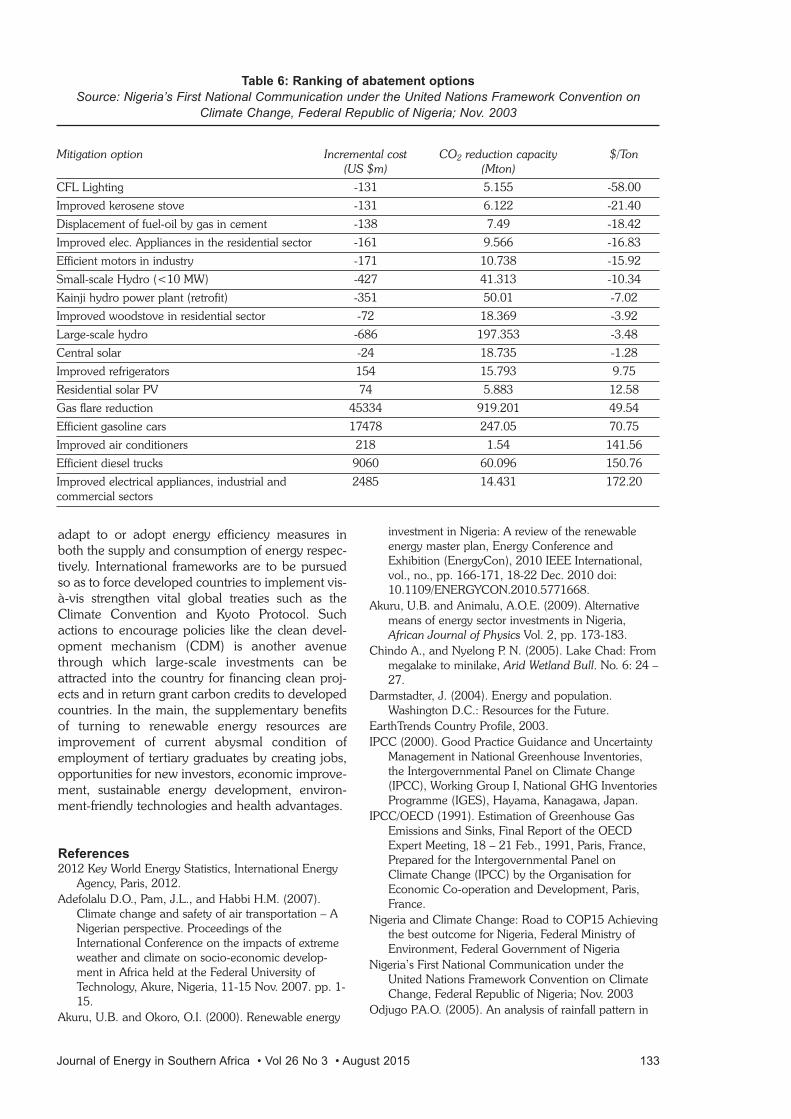
adapt to or adopt energy efficiency measures inboth the supply and consumption of energy respec-tively. International frameworks are to be pursuedso as to force developed countries to implement vis-à-vis strengthen vital global treaties such as theClimate Convention and Kyoto Protocol. Suchactions to encourage policies like the clean devel-opment mechanism (CDM) is another avenuethrough which large-scale investments can beattracted into the country for financing clean proj-ects and in return grant carbon credits to developedcountries. In the main, the supplementary benefitsof turning to renewable energy resources areimprovement of current abysmal condition ofemployment of tertiary graduates by creating jobs,opportunities for new investors, economic improve-ment, sustainable energy development, environ-ment-friendly technologies and health advantages.
References2012 Key World Energy Statistics, International Energy
Agency, Paris, 2012.Adefolalu D.O., Pam, J.L., and Habbi H.M. (2007).
Climate change and safety of air transportation – ANigerian perspective. Proceedings of theInternational Conference on the impacts of extremeweather and climate on socio-economic develop-ment in Africa held at the Federal University ofTechnology, Akure, Nigeria, 11-15 Nov. 2007. pp. 1-15.
Akuru, U.B. and Okoro, O.I. (2000). Renewable energy
investment in Nigeria: A review of the renewableenergy master plan, Energy Conference andExhibition (EnergyCon), 2010 IEEE International,vol., no., pp. 166-171, 18-22 Dec. 2010 doi:10.1109/ENERGYCON.2010.5771668.
Akuru, U.B. and Animalu, A.O.E. (2009). Alternativemeans of energy sector investments in Nigeria,African Journal of Physics Vol. 2, pp. 173-183.
Chindo A., and Nyelong P. N. (2005). Lake Chad: Frommegalake to minilake, Arid Wetland Bull. No. 6: 24 –27.
Darmstadter, J. (2004). Energy and population.Washington D.C.: Resources for the Future.
EarthTrends Country Profile, 2003.IPCC (2000). Good Practice Guidance and Uncertainty
Management in National Greenhouse Inventories,the Intergovernmental Panel on Climate Change(IPCC), Working Group I, National GHG InventoriesProgramme (IGES), Hayama, Kanagawa, Japan.
IPCC/OECD (1991). Estimation of Greenhouse GasEmissions and Sinks, Final Report of the OECDExpert Meeting, 18 – 21 Feb., 1991, Paris, France,Prepared for the Intergovernmental Panel onClimate Change (IPCC) by the Organisation forEconomic Co-operation and Development, Paris,France.
Nigeria and Climate Change: Road to COP15 Achievingthe best outcome for Nigeria, Federal Ministry ofEnvironment, Federal Government of Nigeria
Nigeria’s First National Communication under theUnited Nations Framework Convention on ClimateChange, Federal Republic of Nigeria; Nov. 2003
Odjugo P.A.O. (2005). An analysis of rainfall pattern in
Journal of Energy in Southern Africa • Vol 26 No 3 • August 2015 133
Table 6: Ranking of abatement options
Source: Nigeria’s First National Communication under the United Nations Framework Convention on
Climate Change, Federal Republic of Nigeria; Nov. 2003
Mitigation option Incremental cost CO2 reduction capacity $/Ton(US $m) (Mton)
CFL Lighting -131 5.155 -58.00
Improved kerosene stove -131 6.122 -21.40
Displacement of fuel-oil by gas in cement -138 7.49 -18.42
Improved elec. Appliances in the residential sector -161 9.566 -16.83
Efficient motors in industry -171 10.738 -15.92
Small-scale Hydro (<10 MW) -427 41.313 -10.34
Kainji hydro power plant (retrofit) -351 50.01 -7.02
Improved woodstove in residential sector -72 18.369 -3.92
Large-scale hydro -686 197.353 -3.48
Central solar -24 18.735 -1.28
Improved refrigerators 154 15.793 9.75
Residential solar PV 74 5.883 12.58
Gas flare reduction 45334 919.201 49.54
Efficient gasoline cars 17478 247.05 70.75
Improved air conditioners 218 1.54 141.56
Efficient diesel trucks 9060 60.096 150.76
Improved electrical appliances, industrial and 2485 14.431 172.20commercial sectors
Nigeria, Global J. Environ. Sci., 4(2): 139-145.Odjugo P.A.O. (2010). General overview of climate
change impacts in Nigeria, J Hum Ecol, 29(1): 47-55.
Odjugo P.A.O. (2010). Regional evidence of climatechange in Nigeria, Journal of Geography andRegional Planning, Vol. 3(6), pp. 142-150, June2010.
Odjugo P.A.O. (2011). Climate change and globalwarming: The Nigerian experience, Journal ofSustainable Development and EnvironmentalProtection, 1(1): June 2011.
Ogunlowo O.O. (2013). Exploration of CNG as trans-portation energy source in Nigeria, Midlands EnergyGraduate School, RGS-IBG Postgraduate Mid-termConference 2013: MEGS sponsored Energy SessionsReports, School of Geography, Earth andEnvironmental Service, University of Birmingham,25-27 March, 2013.
Sambo, A.S. (1997). Renewable Energy for Rural devel-opment: The Nigerian perspective, Vol. 2.
Singer, S.F. and Avery, D.T. (2007). Unstoppable globalwarming: Every 1000 years. New York: Rowmanand Littlefield Publishers Incm, P. 114.
Winkler, H., Baumert, K., Blanchardc, O., Burchd, S.and Robinsond, J., (2007). What factors influencemitigative capacity?, Energy Policy, 35, 692.
Yahaya K.A., Salam M.O., and Bamigbade D. (2011).Economic implications of climate change and theimperative of re-directing financial resources inNigeria, British Journal of Humanities and SocialSciences, 2(2): November 2011.
134 Journal of Energy in Southern Africa • Vol 26 No 3 • August 2015
Juan Manuel Belman FloresDepartment of Mechanical Engineering,Engineering Division, Technological University ofSouthwest Guanajuato, MexicoE-mail: [email protected] Manuel Belman-Flores, obtained his PhDdegree from the University Jaume I (Spain) in2008. He is currently a Full-time Professor in theEngineering Division at the University ofGuanajuato. Over 80 papers have been publishedin National and International Congress/ Jour-nals. His research interests include: refrigeration,thermal systems, energy saving and modelling sys-tems.
Roelof Burger MSc (Witwatersrand)Eskom Engineering Power Plant Institute –Emission Control, Climatology Research Group,Unit for Environmental Sciences andManagement, North-West University,Potchefstroom, 2520, South AfricaTel: +27 18 299 4269E-mail: [email protected] Burger is employed as a researcher at theClimatology Research Group, Unit forEnvironmental Sciences and Management, North-West University, South Africa.
Jacqui L Crozier B Sc (Physics &Chemistry) M Sc (Physics) PhD (Physics)Post-Doctoral Fellow- Centre for Energy ResearchDepartment of Physics, Nelson MandelaMetropolitan University, PO Box 77000,Port Elizabeth 6031 South AfricaTel: +27 41 504 2856Fax: +27 41 504 1959E-mail: [email protected] Crozier is currently a Post-Doctoral Fellow atthe Centre of Energy Research at NMMU. She grad-uated with her PhD in 2015 in the field of photo-voltaic (PV) device characterisation focusing onElectroluminescence (EL). In the course of her post-graduate research, she has gained experience withthe PV module characterisation techniques such asCurrent-Voltage (I-V) characterisation, EL, InfraredImaging and Light Beam Induced Current (LBIC)scans. She has done extensive research on cell mis-match in PV modules. Cell mismatch is caused by
degraded or damaged cells and results in decreasedpower outputs and shorter module lifetimes.
Mario du Preez D Com (UPE)NMMU, Summerstrand Campus, Port Elizabeth,6001, South AfricaTel: +27 (0) 41 504 2795E-mail: [email protected] du Preez is currently employed as anAssociate Professor in the Economics Department,Nelson Mandela Metropolitan University (NMMU).
Vicente Pérez GarcíaDepartment of Mechanical Engineering,Technological University of Southwest Guanajuato,MexicoE-mail: [email protected] Vincente Pérez-García obtained a degree inmechanical engineering in 2007 from the Universityof Guanajuato. In 2009 and 2014 he completed aMaster of mechanical engineering and PhD degreerespectively, also from the same university. He iscurrently a professor in the Technological Universityof Southwest Guanajuato. More than 30 papers ofhis have been published in National andInternational Congress/Journals. His research inter-ests are in the field of refrigeration, thermal systems,saving energy and modelling and CFD numericalanalysis.
Jessica L Hosking B Com (Hons) Statistics(UCT), B Com Economics and Statistics (NMMU)M Com Statistics (NMMU)196B Martin Way, Morden, London SM4 4AJUnited KingdomTel: +44 (0)75 234 63063E-mail: [email protected] Hosking is currently employed as an Analystat Insight Analysis and Consulting in the UnitedKingdom.
Zaakirah H Ismail B Com B Econ SciHonours M Com (Economics Science) Lecturer: Mathematical EconomicsRhodes UniversityDepartment of Economics and Economic HistoryP.O. Box 94, Grahamstown, Eastern Cape, 6140,South Africa
Journal of Energy in Southern Africa • Vol 26 No 3 • August 2015 135
Details of authors
Tel: +27 46 603 7406E-mail: [email protected] Ismail graduated in 2012 with an M Comin Economics Science at the University of theWitwatersrand. She has held a number of positionsin industry, both in the public sector and privatesector. These include being a consultant at InvestecPrivate Bank and a Researcher at the NationalEnergy Regulator of South Africa (NERSA). Shehas also lectured at Wits University and currentlyholds a position at Rhodes University as a lecturer.Her research interests are in the field of appliedmicroeconomics and include topics in Energy,Labour, Development and Sports Economics.
Jean Fulbert Ituna-YudonagoPhD StudentDepartment of Mechanical Engineering,Engineering Division, Campus Irapuato-Salamanca, University of Guanajuato PO Box: 36885, Salamanca, Guanajuato, MexicoTel.: +52 (464) 6479940 Ext. 2419 Fax: +52 (464) 6479940 Ext. 2311E-mails: [email protected] [email protected] Jean Fulbert Ituna-Yudonago is a PhD student witha Master’s degree in Mechanical Engineering. Bornand grown up in the Democratic Republic ofCongo, he completed his engineering studies at theSuperior Institute of Applied Techniques (ISTA-KIN-SHASA). Currently, he is a PhD student inMechanical Engineering at the University ofGuanajuato (Mexico). His field of research isModelling and Optimization of thermo-energeticsystems, with a focus on CO2 Transcritical refriger-ation system.
Noor Jamal B Eng (Electrical) M Eng (NuclearPower Eng) PhD Scholar: Department of Energy andEnvironment Management, European University,Flensburg, GermanyMunketoft 3B, 24937 Flensburg, GermanyTel: +49 151 71626546Fax: +27 21 881 3294E-mail: [email protected]. Noor Jamal is an electrical engineer with a mas-ter’s degree in nuclear power engineering. He hasworked for more than seven years in the area ofenergy and power system policy planning. He hasworked in the Energy Wing, Planning Commissionof Pakistan. He was a member of the national teamof Pakistan to develop the Pakistan-IntegratedEnergy Model (Pak-IEM). This project was executedby the International Resource Group (IRG) USAand was mainly sponsored by the AsianDevelopment Bank. He also participated in theSouth African Young Scientists SummerProgramme (SA-YSSP). This three months research
programme was organized by the InternationalInstitute of Applied Systems Analysis (IIASA),Austria and the Free State University, South Africa.Currently, he is pursuing his PhD research at theEuropean University, Flensburg, Germany. His PhDresearch theme is ‘to develop a modelling frame-work for a 100% renewable based power genera-tion system with high spatial and temporal resolu-tion’. In addition, the framework is being used as acase study for Pakistan.
Geoffrey Reuben John B Sc (MechanicalEngineering) M Sc (Combustion and Energy) PhD(Combustion and Energy)Professor: Combustion and Energy College of Engineering and technology (CoET)-University of Dar es Salaam (UDSM)P.O Box 35131, Dar es Salaam, TanzaniaTel. +255 22 754 319945 +255 22 2410754Fax +255 22 2410114E-mails: [email protected] and [email protected] Reuben John is a Mechanical engineerwith a Bachelor’s degree in Mechanical Engin-eering, a Master’s degree in Combustion andEnergy and a PhD in Combustion and Energy fromthe University Leeds, United Kingdom. Since 1995he has consulted to a variety of industry and publicsectors in Tanzania and other countries in the fieldsof Combustion and Energy, Mechanical engineer-ing and management. Currently he is appointed asa professor in the College of Engineering andTechnology (CoET), University of Dar es Salaam(UDSM). He is also Adjunct Professor and Senatemember at Nelson Mandela African Institution ofScience and Technology (NM-AIST) in the Schoolof Materials, Energy, Water and EnvironmentalSciences (MEWES). He is also a Chairman,Mechanical Engineering Divisional Committee(MEDC) of Tanzania Bureau of Standards (TBS).He is a Chairperson of the Tanzania RenewableEnergy Association (TAREA) and a member ofInstitute of Engineers-Tanzania and TanzaniaEngineers Registration Board (ERB). He has pub-lished a number of research articles in international,regional and local journals and supervised bothundergraduate and postgraduate students in vari-ous Universities.
Abdul Majeed KhanAssociate Professor, Department of Chemistry,Federal Urdu University, Karachi, PakistanE-mail: [email protected], Dir. Abdul Majeed Khan is serving as anAssociate Professor (BPS-20) and PrincipalInvestigator at the Research Laboratory ofBioenergy and Medicinal Chemistry (RLB-MC),Department of Chemistry, Federal Urdu University.He earned a B. Sc. in 1990 and M. Sc. in 1993
136 Journal of Energy in Southern Africa • Vol 26 No 3 • August 2015
from the University of Karachi, Pakistan. He did hisPhD in the field of Marine and Terrestrial NaturalProduct Chemistry in 2000 under the supervision ofProf Atta-ur-Rahman and then a Post Doctorate inthe field of X- Ray Crystallography in 2001 underthe supervision of Prof Muhammad IqbalChoudhary at the H. E. J. Research Institute ofChemistry, University of Karachi, Pakistan.
Dr Khan’s research interest is mainly based onthe generation of bioelectricity and production ofbiofuels from various biomasses (marine algae, ter-restrial plants and biowastes). In addition, Dr Khan’sresearch group is also involved in the developmentof Marine Natural Product Chemistry. As PrincipalInvestigator and Research Officer, he has conduct-ed a number of research projects funded by nation-al and international funding agencies. He gainedadequate experience in bioassay-guided isolation,semi-synthesis and structure elucidation of complexnatural products using the powerful tools of spec-troscopic techniques such as UV, IR, NMR, MS andX-Ray Crystallography. He is the author of largenumber of scientific research articles that have beenpublished in top class journals of internationalrepute. He has discovered one of the Novel MarineAlkaloisd namely ‘Jolynamine’ from marine brownalga. Moreover, he is the reviewer of ACS, JCSP,AENSI, IDOSI and Taylor & Francis publications.
He is an active resource person during variousinternational conferences, workshops and seminars.In addition, he has presented his new discoveriesduring 24 national and international conferences.He has participated in the 9th, 10th and 11thEurasia Conferences on Chemical Sciences held inTurkey, The Philippines and Jordan respectively. DrKhan is a dynamic member of a number of scientif-ic bodies and editorial boards of various interna-tional journals. He is also an HEC ApprovedSupervisor for PhD scholars.
He has initiated the M. Phil and PhD programsin the Department of Chemistry, FUUAST as thefirst M Phil/ PhD convenor in charge. A ResearchLaboratory of Bioenergy and Medicinal Chemistry(RLB-MC) has been established in the Departmentof Chemistry, Federal Urdu University. He played akey role for the upgrade of the Department ofChemistry through PC-1 funded by the HEC.Furthermore, Dr Khan has initiated the develop-ment of the Faculty of Pharmacy in charge of theevening program. Interestingly, he has initiatedadvanced research on the generation of bioelectric-ity from biowastes using novel technology of amicrobial fuel cell. In the history of Pakistan, devel-opment of this novel technology is an amazing andunique addition. To overcome the global threats likethe current energy crisis, global warming, globalpollution, global biodiversity and the global econo-my, he has successfully completed a number ofprojects for the production of biofuels like
bioethanol, biodiesel and biogas from marinealgae, biowastes and terrestrial sources. Biofuelsfrom marine algae are not reported from Pakistan. A new course of Renewable and Green Energy(Green Chemistry) has been initiated at PhD level.A large number of graduate and postgraduate stu-dents have benefited from his outstanding researchsupervision and teaching methodologies which arenow serving at their best in different organizationsaround the globe.
In view of his unique achievements he has beenrecognized as a ‘Productive Scientist of Pakistan’ bythe Pakistan Council of Science and Technology.Moreover, he was awarded the ‘Best UniversityTeacher Award-2011’ by the Higher EducationCommission of Pakistan, which was conferred bythe Education Minister Mian Muhammad Baligh-ur-Rahman for his very outstanding and distinguishedachievements in the field of Chemistry.
Patrick Khembo B Econ (Hons)106 Allen Place, 7 Allen Street, Grahamstown,6139, South AfricaE-mail: [email protected] Khembo is an economics student with aBachelor of Economics degree that he completed in2013, and then graduated with an honours degreein Economics the following year, in which he spe-cialised in financial economics and banking.However, he has written an Honours research proj-ect based on energy poverty. He is currently study-ing towards a Master’s degree by thesis inEconomics focusing on the public debt crisis.
Baraka Kichonge ADE (Mechanical Eng.)PGD (Mechanical Eng) M Sc (Production Eng)Assistant Lecturer: Mechanical and EnergyEngineeringMechanical Engineering Department, ArushaTechnical College (ATC)P.O Box 296, Arusha, TanzaniaTel: +255 2970056Fax: +255 27 2548337E-mails: [email protected] [email protected] Kichonge is a mechanical engineer with anAdvanced Diploma in Mechanical Engineering,Postgraduate Diploma in Mechanical Engineering,and a Master’s Degree in Production Engineeringfrom the College of Engineering and Technology(CoET), University of Dar es Salaam (UDSM). He iscurrently a postgraduate student (PhD) inSustainable Energy Science and Engineering(SESE) at the Nelson Mandela African Institution ofScience and Technology (NM-AIST) in the Schoolof Materials, Energy, Water and EnvironmentalSciences (MEWES). He has been engaged in teach-ing Mechanical Engineering subjects since 2003.Since 2008, he has consulted to a variety of indus-
Journal of Energy in Southern Africa • Vol 26 No 3 • August 2015 137
try and public sectors in Tanzania in the fields ofEnergy, Mechanical engineering and Productionengineering. Currently he is appointed as anAssistant Lecturer at the Department of MechanicalEngineering of Arusha Technical College (ATC). Heis a member of the Tanzania Renewable EnergyAssociation (TAREA) and Tanzania EngineersRegistration Board (ERB). He has published a num-ber of research articles related to engineering mate-rials and energy.
Angela Masembe B Sc Eng (Elec) M Sc Eng(Sustainable Energy)Technical Promotion Specialist, ABB South Africa,2 Lake Road, Longmeadow Business Estate,Modderfontein, 1609, JohannesburgE-mail: [email protected] Masembe is an electrical engineer with aMaster’s degrees in sustainable energy engineering.She obtained both her degrees from the Universityof Cape Town. She is currently employed by ABBSouth Africa in Johannesburg.
Iddi S N Mkilaha B Sc (Mechanical Eng.)M. Eng. (Energy Engineering) Dr Eng (Dieselengine emissions)Associate Professor: Combustion and Energy College of Engineering and technology (CoET)-University of Dar es Salaam (UDSM)P.O Box 35131, Dar es Salaam, TanzaniaTel. +255 22 754 319945 +255 22 2410754Fax +255 22 2410114E-mails: [email protected] and [email protected] Mkilaha is a Mechanical engineer with aBachelor’s degree in Mechanical Engineering,Masters of Engineering in Energy and a Doctor ofEngineering in diesel engine emissions fromToyohashi University of Technology-Japan. Since1981 he has been engaged in a variety of consul-tancy work in industries and public sectors ofTanzania and other countries in the fields of Energy,Mechanical engineering, Diesel engine emissionsand management. He is currently appointed as aDirector-General of the Tanzania Atomic EnergyCommission and associate professor in the Collegeof Engineering and Technology of the University ofDar es Salaam. He is also a Sustainable EnergyUtilization part-time Professor at Nelson MandelaAfrican Institution of Science and Technology in theSchool of Materials, Energy, Water andEnvironmental Sciences. He is also a member ofthe Institute of Engineers-Tanzania, Japan Societyof Mechanical Engineers, Society of AutomobileEngineers-Japan and Registered ProfessionalEngineer-Tanzania Engineers Registration Board.He has published books and a number of researcharticles in international, regional and local journals.
Hein Neomagus PhD Reactor EngineeringScience (Twente)Eskom Engineering Power Plant Institute -Emission Control, School of Chemical andMinerals Engineering, Chemical ResourceBeneficiation, North-West University,Potchefstroom, 2520, South AfricaTel: + 27 18 299 1991E-mail: [email protected] Neomagus is a Professor at the School ofChemical and Minerals Engineering, North-WestUniversity, South Africa.
Muhammad ObaidPhD Scholar, Department of Chemistry, FederalUrdu University of Arts, Science & Technology,Gulshan-e-Iqbal Campus, PakistanE-mail: [email protected] Obaid is a PhD Research Scholar atthe Department of Chemistry, Federal UrduUniversity of Arts, Science & Technology, Gulshan-e-Iqbal Campus. He started his PhD research workrelated to ‘Generation of bioelectricity and produc-tion of biofuels’ during the year 2008. He hasearned his Master’s (M.Sc.) degree in Chemistry,from the University of Karachi, Pakistan. He versa-tile research contribution started from his M.Sc.research work, experienced at the Fuel ResearchCentre (FRC), Department of Pakistan Council ofScientific and Industrial Research Centre (PCSIR).He got training at national and international level todevelop skills required for different research scenar-ios along with analytical testing of natural productsand fuel materials.
Ilze Pretorius M Sc Meteorology (Pretoria)Eskom Engineering Power Plant Institute –Emission Control, Climatology Research Group,Unit for Environmental Sciences andManagement, North-West University,Potchefstroom, 2520, South AfricaCell: +27 84 587 7783E-mails [email protected] [email protected] Pretorius is a full-time Geography andEnvironmental Management PhD student, Unit forEnvironmental Sciences and Management, North-West University, Potchefstroom.
Stuart Piketh PhD Atmospheric Research(Witwatersrand)Eskom Engineering Power Plant Institute –Emission Control, Climatology Research Group,Unit for Environmental Sciences andManagement, North-West University,Potchefstroom, 2520, South AfricaTel: +27 18 299 1582E-mail: [email protected] Piketh is a Professor at the Climatology
138 Journal of Energy in Southern Africa • Vol 26 No 3 • August 2015
Research Group, Unit for Environmental Sciencesand Management, North-West University, South AfSouth West Universitynce of 27e 2015 to 2030 peri-odt- and worst case emissions in 2030. emissionsdecrease by 20% from the samrica.Forster and van Dyk
Gary Sharp PhD StatisticsNMMU, Summerstrand Campus, Port Elizabeth,6001, South AfricaTel: +27 (0) 41 504 2288E-mail: [email protected] Sharp is currently employed as Head ofDepartment in the Statistics Department at NelsonMandela Metropolitan University (NMMU).
Ram K Tyagi M Tech (Design) PhD(Engineering)Associate Professor: Department of MechanicalEngineering, Amity School of Engineering andTechnology, Amity University, PO Box , Noida,201010, IndiaTel: +91 9911 393047E-mails: [email protected] and [email protected] K Tyagi is a mechanical engineer with aMaster’s Degree in design engineering, and a PhDin engineering. Since 2003 he has been teachingvarious subjects and guiding numerous students atundergraduate and post-graduate levels in India.Currently he is involved in various research activi-ties at Amity University in the field of green energyresources. He has filed 17 patents in the field ofgreen energy and automobile safety engineering inIndia.
Ernest E van Dyk B Sc (Physics and AppliedMathematics) B Sc Hons (Physics) M Sc (Physics)PhD (Physics), Pr.Nat.Sci. Pr.Phys.Professor of Physics, Nelson Mandela MetropolitanUniversity (NMMU)Director: Centre for Energy Research, NMMUCentre for Energy Research, PO Box 77000,Nelson Mandela Metropolitan University, PortElizabeth, 6031 Tel: +27 41 504 2259Fax: +27 41 504 1959E-mail: [email protected]: http://energy.nmmu.ac.zaProfessor Ernest van Dyk obtained his PhD inPhysics at the University of Port Elizabeth in 1994.He teaches Physics at the NMMU and is alsoDirector of the Centre for Energy Research (CER) atthe NMMU since 2006. The CER is involved withseveral renewable energy research projects forindustry and government agencies. Prof van Dyk’s research interests are in the field ofSolar Energy, specialising in Photovoltaics andSolar Thermal research. He has supervised 17 M Sc
and 7 PhD student projects to completion and iscurrently supervising 6 PhD students. He has pub-lished forty-nine scientific journal articles in the fieldof Photovoltaics and has authored or co-authored39 international conference papers and 128 nation-al conference presentations. Prof van Dyk has apassion for teaching Physics and researchingRenewable Energy Technologies. He also regularlyconsults on Photovoltaics and Solar Energy tonational and international companies.
Frederik J Vorster B Sc (Physics,Mathematics), M Sc (Physics), PhD (Physics)Senior Lecturer: PhysicsSenior Researcher: Centre for Renewable Energy,Nelson Mandela Metropolitan UniversityPO Box 770002, Nelson Mandela MetropolitanUniversity, Port Elizabeth, 6031, South AfricaTel: +27 41 504 3051Fax: +27 41 504 2573E-mail: [email protected] Vorster is a physicist with PhD specialisingin photovoltaics. He teaches Physics andEngineering subjects at the NMMU and is closelyinvolved with the management and development ofvarious projects at of the Centre for EnergyResearch. He is currently a Senior Lecturer at theNMMU and actively involved with supervision ofseveral Physics and Engineering masters and doc-toral students. Dr Vorster’s broad research interestsinclude solar energy, heat engines and micro windturbine development. His principal area of speciali-sation lies in concentrator and flat plate photo-voltaics, specifically the development on new char-acterisation techniques for photovoltaic materials,modules and systems. He has consulted to a varietyof industry and public sectors in South Africa in thefields of photovoltaics and domestic solar waterheating.
Journal of Energy in Southern Africa • Vol 26 No 3 • August 2015 139
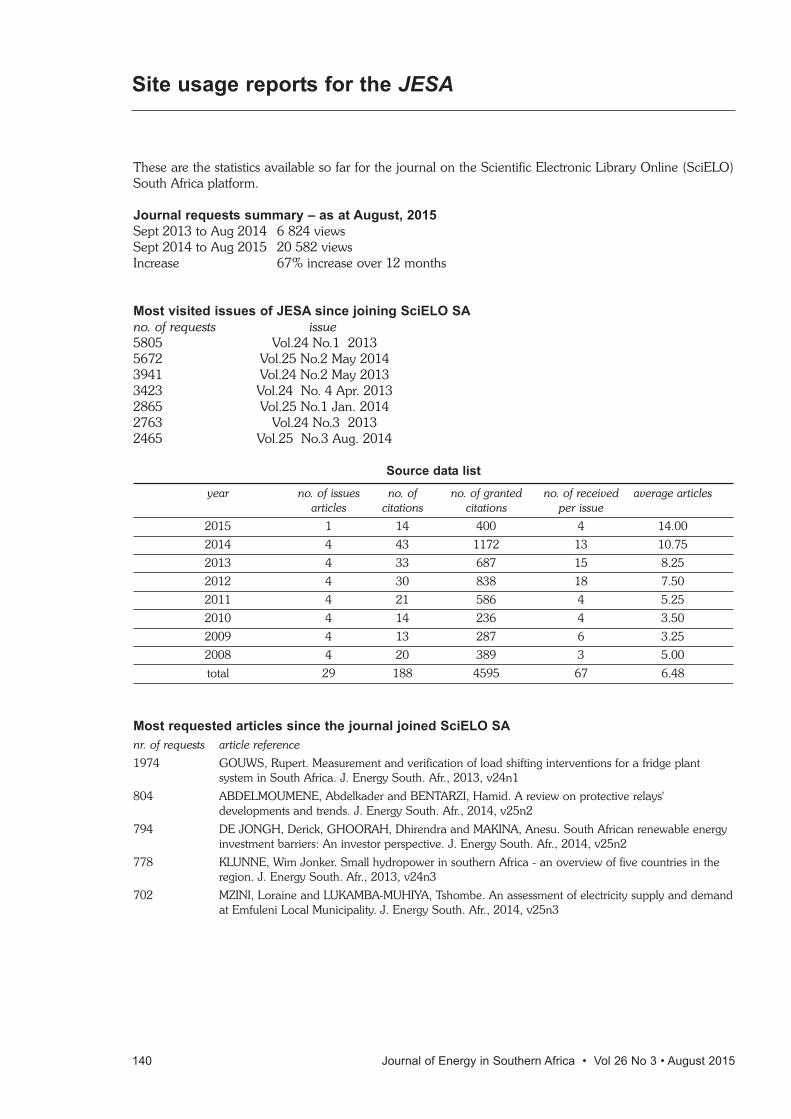
140 Journal of Energy in Southern Africa • Vol 26 No 3 • August 2015
These are the statistics available so far for the journal on the Scientific Electronic Library Online (SciELO)South Africa platform.
Journal requests summary – as at August, 2015
Sept 2013 to Aug 2014 6 824 views Sept 2014 to Aug 2015 20 582 viewsIncrease 67% increase over 12 months
Most visited issues of JESA since joining SciELO SA
no. of requests issue5805 Vol.24 No.1 2013 5672 Vol.25 No.2 May 2014 3941 Vol.24 No.2 May 2013 3423 Vol.24 No. 4 Apr. 2013 2865 Vol.25 No.1 Jan. 2014 2763 Vol.24 No.3 2013 2465 Vol.25 No.3 Aug. 2014
Source data list
year no. of issues no. of no. of granted no. of received average articles articles citations citations per issue
2015 1 14 400 4 14.00
2014 4 43 1172 13 10.75
2013 4 33 687 15 8.25
2012 4 30 838 18 7.50
2011 4 21 586 4 5.25
2010 4 14 236 4 3.50
2009 4 13 287 6 3.25
2008 4 20 389 3 5.00
total 29 188 4595 67 6.48
Most requested articles since the journal joined SciELO SA
nr. of requests article reference
1974 GOUWS, Rupert. Measurement and verification of load shifting interventions for a fridge plant system in South Africa. J. Energy South. Afr., 2013, v24n1
804 ABDELMOUMENE, Abdelkader and BENTARZI, Hamid. A review on protective relays' developments and trends. J. Energy South. Afr., 2014, v25n2
794 DE JONGH, Derick, GHOORAH, Dhirendra and MAKINA, Anesu. South African renewable energy investment barriers: An investor perspective. J. Energy South. Afr., 2014, v25n2
778 KLUNNE, Wim Jonker. Small hydropower in southern Africa - an overview of five countries in the region. J. Energy South. Afr., 2013, v24n3
702 MZINI, Loraine and LUKAMBA-MUHIYA, Tshombe. An assessment of electricity supply and demand at Emfuleni Local Municipality. J. Energy South. Afr., 2014, v25n3
Site usage reports for the JESA
The Journal of Energy in Southern Africa publishes
papers covering the technical, economic, policy,
environmental and social aspects of energy
research and development carried out in, or rele-
vant to, Southern Africa. Contributions from those
working in these fields are welcome.
Submissions
All contributions should be submitted in English.
Only original work will be accepted, and by submit-
ting an original work for publication the author
grants the publisher a worldwide, non-exclusive,
royalty-free and perpetual licence to reproduce,
publish and distribute the author’s work in any for-
mat or medium.
The suggested length for full-length articles is 3 000
to 5 000 words. All full-length articles are refereed,
and amendments to scripts and formats may be
required before final acceptance. The Editor
reserves the right to make editorial changes to con-
tributions.
The following shorter items are also welcome, but
are not refereed:
• Research notes, Shorter communications and
Case studies ( 500–2 500 words)
• Conference reports (100–1 500 words)
• Book reviews (800–1 000 words)
Format
Contributions should be in electronic format, and
submitted either on disk or via e-mail. They should
preferably be in a format compatible with MS Word.
The Editor might also request the submission of a
printed version.
Text should be single-spaced, with a wide left-hand
margin. Standard international (SI) units must be
used throughout.
An abstract of the article should be provided, not
exceeding 500 words, resuming the contents and
conclusions of the article. A maximum of six key-
words should be included, reflecting the entries the
author(s) would like to see in the annual Subject
Index published in the last issue for the year. The
keywords may consist of more than one word each,
but the entire concept should not be more than 30
characters long.
References must be made according to the Harvard
(author, date) system. See articles in the JESA for
examples of this and of other aspects of its house
style.
Notes, where unavoidable, should not be automati-
cally embedded, but gathered at the end of the arti-
cle and indicated in the text by means of sequential
arabic numbers in superscript.
Numbers for headings, captions for tables and fig-
ures, etc should be manually inserted, rather than
automatically generated.
Illustrations and tables
If the contribution is accepted, original electronic
versions of graphs must be supplied; produced,
where possible, with MS Office programmes (Excel,
PowerPoint). The quality of the illustrations must be
acceptable to the Editor. For photographs and non-
electronically produced drawings, the originals will
have to be provided, or scans of an acceptable
quality (minimum 300DPI). Straight screen-grabs
are never acceptable. All illustrations must be pro-
vided in monochrome, and readable as such
(colour photographs can be converted by us).
Illustrations and tables should appear in their prop-
er places in the submitted document (not gathered
at the end). All should be referred to in the text,
numbered sequentially (manually rather than auto-
matically), and with accompanying captions. Tables
must be submitted as text, rather than as images.
General
No material will be returned to the author(s) follow-
ing publication unless this is requested by at the
time of original submission.
At the time of submission, the author(s) must state
that the contribution has not been published and is
not being considered for publication elsewhere, and
will not be submitted for publication elsewhere
unless rejected by the Journal of Energy in
Southern Africa or withdrawn by the author(s).
Authors must supply a brief CV (maximum of 500
words), which includes the following personal infor-
mation (for the Details of authors section): sur-
name, initials, address, contact telephone/fax num-
bers, email address, qualifications, occupation
and/or employment.
Authors of accepted contributions will receive a free
copy of the issue in which their contribution appears
as well as a PDF version.
Neither the Editorial Committee nor the Publisher
accepts responsibility for the opinions or viewpoints
expressed, or for the correctness of facts and fig-
ures.
All contributions and enquiries should be addressed
to: The Editor, Journal of Energy in Southern Africa,
Energy Research Centre, University of Cape Town,
Private Bag, Rondebosch 7701, South Africa. E-
mail: [email protected]
INFORMATION FOR AUTHORS