204 67 458 Technical Report: Validation of a So - OECD
75
Research and Development Project of the German Federal Environmental Agency FKZ: 204 67 458 Technical Report: Validation of a Soil Bioaccumulation Test with Terrestrial Oligochaetes by an International Ring Test (Validierung einer Methode zur Messung der Bioakkumulation in terrestrischen Organismen mittels eines internationalen Ringtests) Authors: Philipp Egeler, Daniel Gilberg, Adam Scheffczyk, Thomas Moser, Jörg Römbke ECT Oekotoxikologie GmbH Böttgerstr. 2-14 D-65439 Flörsheim/Main ON BEHALF OF THE GERMAN FEDERAL ENVIRONMENTAL AGENCY January 2009
-
Upload
khangminh22 -
Category
Documents
-
view
4 -
download
0
Transcript of 204 67 458 Technical Report: Validation of a So - OECD
Research and Development Project of the German Federal Environmental Agency
FKZ: 204 67 458
Technical Report:
Validation of a Soil Bioaccumulation Test with Terrestrial Oligochaetes by an International Ring Test
(Validierung einer Methode zur Messung der Bioakkumulation in terrestrischen Organismen mittels eines internationalen Ringtests)
Authors:
Philipp Egeler, Daniel Gilberg, Adam Scheffczyk, Thomas Moser, Jörg Römbke
ECT Oekotoxikologie GmbH Böttgerstr. 2-14
D-65439 Flörsheim/Main
ON BEHALF OF THE
GERMAN FEDERAL ENVIRONMENTAL AGENCY
January 2009
2
Berichts - Kennblatt 1. Berichtsnummer UBA-FB 204 67 458
2. 3.
4. Titel des Berichts Validation of a Soil Bioaccumulation Test with Terrestrial Oligochaetes by an International Ring Test (Validierung einer Methode zur standardisierten Messung der Bioakkumulation mit terrestrischen Oligochaeten)
5. Autor(en) (Name, Vorname(n)) Egeler, Philipp; Gilberg, Daniel; Scheffczyk, Adam; Moser, Thomas; Römbke, Jörg
6. Abschlussdatum 15. November 2007
8. Durchführende Institution(en) (Name, Adresse)
7. Veröffentlichungsdatum
ECT Oekotoxikologie GmbH
9. UFOPLAN-Nr.
Böttgerstr. 2-14 10. Seitenzahl 75
D-65439 Flörsheim/Main 11. Literaturangaben 35
12. Fördernde Institution(en) (Name, Adresse) Umweltbundesamt, Wörlitzer Platz 1, 06844 Dessau
13. Tabellen und Diagramme 31
14. Abbildungen 6
15. Zusätzliche Angaben
16. Zusammenfassung/Kurzfassung Aufgabe des Vorhabens war die Organisation und Durchführung eines internationalen Ringtests mit dem vor einigen Jahren im Auftrag des Umweltbundesamtes entwickelten Bioakkumulationstest mit terrestrischen Oligochaeten. Dabei sollten bestehende Kenntnisse, insbesondere die UBA-Berichte F + E 206 03 909 (1997) und 298 64 416 (2001) berücksichtigt werden. Auf Basis der Ergebnisse eines Startworkshops wurde eine Prüfvorschrift erstellt, anhand welcher der Test bei den einzelnen Ringtestteilnehmern durchgeführt wurde. Insgesamt nahmen 14 Institutionen (Behörden, Universitäten, Auftragslabors und Industrie) aus 7 Ländern am Ringtest teil. Lumbriciden (Eisenia fetida, E. andrei) und Enchyträen (Enchytraeus albidus, E. crypticus) wurden als Testorganismen verwendet. Als Testsubstanzen wurden
14C-markiertes Hexachlorobenzol (HCB) und Cadmiumchlorid ausgewählt. Die
Einzeltests wurden je einmal pro Teilnehmer durchgeführt und bestanden aus einer Aufnahme- und einer Eliminationsphase. Insgesamt wurden 33 Tests durchgeführt und vollständig ausgewertet. Während des Ringtests wurden mehrere Workshops sowie ein praktisches Training der Teilnehmer organisiert. Die Aufnahme- und Eliminationskinetik der einzelnen Tests wurde mittels nichtlinearer Regressionsanalyse ausgewertet. Im Anschluss wurden in einer Gesamtschau die Vergleichbarkeit und Variabilität der Testergebnisse sowie zentrale Aspekte der Testmethodik ausgewertet und im Rahmen eines Workshops von den Ringtestteilnehmern diskutiert. Anhand dieser Auswertung wurden die am besten geeigneten Endpunkte und die Randbedingungen für ein adäquates Testdesign festgelegt sowie die vorläufigen Validitätskriterien überprüft. Nach Auswertung des Ringtests wurde ein Richtlinienentwurf entsprechend OECD-Format formuliert, der im Anschluss an das Vorhaben bei der OECD eingereicht werden kann.
17. Schlagwörter Bioakkumulation, Boden, Oligochaeten, Testrichtlinie, Ringtest
18. Preis 19. 20.
UBA-F+E-Berichtskennblatt 06/2000

3
Document Control Sheet 1. Report No. UBA-FB 204 67 458
2. 3.
4. Report Title Validation of a Soil Bioaccumulation Test with Terrestrial Oligochaetes by an International Ring Test (Validierung einer Methode zur standardisierten Messung der Bioakkumulation mit terrestrischen Oligochaeten)
5. Author(s) (Family Name(s), First Name(s)) Egeler, Philipp; Gilberg, Daniel; Scheffczyk, Adam; Moser, Thomas; Römbke, Jörg
6. Report Date November 15, 2007
8. Performing Organisation(s) (Name, Address)
7. Publication Date
ECT Oekotoxikologie GmbH
9. UFOPLAN-Ref. Nr.
Böttgerstr. 2-14
10. No. of Pages 75
D-65439 Flörsheim/Main
11. No. of References 35
12. Funding Agency (Name, Address) Umweltbundesamt, Wörlitzer Platz 1, 06844 Dessau
13. No. of Tables and Diagrams 31
14. No. of Figures 6
15. Supplementary Notes
16. Abstract The aim of the project was the validation of a soil bioaccumulation test with endobenthic oligochaetes by an international ring test. The test method was developed taking into account existing methods (UBA-reports 206 03 909 (1997) and 298 64 416 (2001)). A test protocol was prepared and used to run the test. A total of 14 institutions (governmental, universities, contract laboratories and industry) from 7 different countries participated in the ring test. Lumbricids (Eisenia fetida, E. andrei) and enchytraeids (Enchytraeus albidus, E. crypticus) were used as test species. The test compounds were
14C-labelled hexachlorobenzene (HCB) and
cadmium chloride. The ring test runs were performed once by each laboratory, and consisted of an uptake and an elimination phase. Analysis of total radioactive residues and Cd-concentrations in soil, and tissue samples was performed. In total, 33 tests were performed, and evaluated. Several courses and workshops were organised to inform and train the participants. In a first step following practical ring-testing, the kinetic results of the single test runs were evaluated by nonlinear regression analysis. Additionally, comparability and variability of the results, as well as advantages and difficulties of the method were assessed and discussed by the ring test participants at a workshop. The outcome of the workshop was used to refine evaluation of the results and the test methodology, to define the most appropriate endpoints, the prerequisites for establishing a suitable test design and the validity criteria of this test. As a major outcome of the ring test, the draft test guideline, which closely follows formal requirements of the OECD test guidelines, was updated and prepared for submission to OECD`s Test Guideline Programme.
17. Keywords Bioaccumulation, Soil, Oligochaetes, Test Guideline, Ring Test
18. Price
19. 20.
Report Cover Sheet 06/2000
4
Contents Page
1 Introduction ............................................................................................................ 9 2 Organisation of the Ring Test .............................................................................. 11
2.1 Ring Test Participants ................................................................................. 11 2.2 Co-ordinating Institute ................................................................................. 12 2.3 Monitoring ................................................................................................... 12 2.4 Distribution of Materials ............................................................................... 13
3 Acknowledgements .............................................................................................. 13 4 Practical Performance of the Ringtest - Test Methods ......................................... 13
4.1 Test Organisms ........................................................................................... 15 4.2 Culture Conditions ....................................................................................... 16 4.3 Soil .............................................................................................................. 16
4.3.1 Artificial Soil ............................................................................................. 16 4.3.2 Field Soils ................................................................................................ 17
4.4 Determination of Soil pH, Moisture and Organic Carbon Content (TOC) ..... 21 4.5 Determination of Soil Water Holding Capacity (WHC) ................................. 22
5 Test Substances .................................................................................................. 23 5.1 Hexachlorobenzene (HCB) .......................................................................... 23
5.1.1 Method of Spiking .................................................................................... 24 5.1.2 Test Apparatus ........................................................................................ 24 5.1.3 Radio-chemical Analysis .......................................................................... 25
5.2 Cadmium ..................................................................................................... 28 5.2.1 Method of Spiking .................................................................................... 28 5.2.2 Chemical Analysis ................................................................................... 29
5.3 Equilibration and Addition of Food ............................................................... 30 5.4 Measurement Endpoints .............................................................................. 31
6 Experimental Procedures and Methods ............................................................... 32 6.1 General Aspects: Test Vessels, Loading, Replicates ................................... 32 6.2 Test Set-up .................................................................................................. 33 6.3 Addition of the Test Organisms ................................................................... 33 6.4 Duration of Uptake and Elimination Phase .................................................. 34
6.4.1 Maintenance during the exposure period ................................................. 36 6.4.2 Sampling Procedures .............................................................................. 36 6.4.3 Worm Dry Weight .................................................................................... 37 6.4.4 Worm Lipid Content ................................................................................. 38
7 Data Assessment and Statistical Evaluation ........................................................ 39 7.1 General Evaluations .................................................................................... 39 7.2 Evaluation of Uptake Kinetics ...................................................................... 40 7.3 Evaluation of Elimination Kinetics ................................................................ 42 7.4 Alternative Model Calculations .................................................................... 43 7.5 Tests for normal-distribution and variance homogeneity .............................. 43 7.6 Validity Criteria in the Ring Test .................................................................. 44 7.7 Number of Tests .......................................................................................... 45
8 Results ................................................................................................................ 46 8.1 Hexachlorobenzene..................................................................................... 46
8.1.1 Kinetics in Earthworms ............................................................................ 46 8.1.2 Kinetics in Enchytraeids ........................................................................... 51 8.1.3 Quantification of Radioactive Residues in Worms and Soil ...................... 52
5
8.2 Cadmium ..................................................................................................... 54 8.2.1 Kinetics in Earthworms ............................................................................ 54 8.2.2 Kinetics in Enchytraeids ........................................................................... 59
8.3 Synopsis ...................................................................................................... 62 8.4 Test Validity ................................................................................................. 65
8.4.1 Mortality ................................................................................................... 65 8.4.2 Weight Loss (Earthworms) ...................................................................... 65
8.5 Gut-purging: Impact on Body Residue ......................................................... 66 9 Discussion ........................................................................................................... 67
9.1 Test Method ................................................................................................ 67 9.1.1 Practicability ............................................................................................ 67 9.1.2 Test Species ............................................................................................ 67
9.2 Non-eliminated Residues (NER) .................................................................. 67 9.3 Kinetic Modelling ......................................................................................... 68
10 Conclusions ......................................................................................................... 69 11 References .......................................................................................................... 70 12 Annexes .............................................................................................................. 75 Annex 1: Draft Test Guideline Annex 2: Minutes of the final workshop: Ring Test of the Test Method:
―Bioaccumulation: Soil Test using terrestrial Oligochaetes‖ held at Coimbra/Curia, Portugal, May 17 - 18, 2007
List of Tables Page
Table 1: Composition of the artificial soil. .................................................................... 16 Table 2: Typical characteristics of LUFA standard soil. ............................................... 18 Table 3: Typical characteristics of Sassafras field reference soil; texture: sandy loam.19 Table 4: Typical characteristics of the Mediterranean field soils in comparison with parameters measured for OECD artificial soil. ............................................................ 20 Table 5: Extraction methods and TLC conditions for 14C-HCB in worm and soil samples. ..................................................................................................................... 27 Table 6: Typical sampling schedule for earthworms and enchytraeids. ....................... 35 Table 7: Overview of the evaluated data sets. ............................................................ 45 Table 8: Overview of the HCB uptake parameters: Earthworms in spiked OECD soil. 46 Table 9: Overview of the HCB elimination parameters: Earthworms in spiked OECD soil; parameters in dpm/g wet weight. ......................................................................... 47 Table 10: Example of HCB kinetics in earthworms calculated according to section 7.4: parameters are based on soil and worm wet weight.................................................... 49 Table 11: Overview of the HCB uptake parameters: Earthworms in spiked field soils. 50 Table 12: Overview of the HCB elimination parameters: Earthworms in spiked field soils; parameters in dpm/g wet weight. ....................................................................... 50 Table 13: Overview of the HCB uptake parameters: Enchytraeids in spiked OECD soil. ................................................................................................................................... 51 Table 14: Overview of the HCB elimination parameters: Enchytraeids in spiked OECD soil; parameters in dpm/g wet weight. ......................................................................... 51
6
Table 15: Overview of the HCB uptake parameters: Enchytraeids in spiked field soils. ................................................................................................................................... 52 Table 16: Overview of the HCB elimination parameters: Enchytraeids in spiked field soils; parameters in dpm/g wet weight. ....................................................................... 52 Table 17: Extraction efficiency for worm and soil samples spiked with 14C-HCB. ........ 53 Table 18: Overview of the Cd uptake parameters: Earthworms in spiked OECD soil based on residues in mg/kg dry weight. ...................................................................... 54 Table 19: Overview of the Cd elimination parameters: Earthworms in spiked OECD soil; parameters in mg/kg dry weight. .......................................................................... 55 Table 20: Example of Cd kinetics in earthworms calculated according to section 7.4: parameters are based on soil and worm dry weight. ................................................... 57 Table 21: Overview of the Cd uptake parameters: Earthworms in spiked field soil based on residues in mg/kg dry weight. ................................................................................. 58 Table 22: Overview of the Cd elimination parameters: Earthworms in spiked OECD soil; parameters in mg/kg dry weight. .......................................................................... 58 Table 23: Overview of the Cd uptake parameters: Enchytraeids in spiked OECD soil based on residues in mg/kg dry weight. ...................................................................... 59 Table 24: Overview of the Cd elimination parameters: Enchytraeids in spiked OECD soil; parameters in mg/kg dry weight. .......................................................................... 60 Table 25: Overview of the Cd uptake parameters: Enchytraeids in spiked field soil based on residues in mg/kg dry weight. ...................................................................... 60 Table 26: Overview of the Cd elimination parameters: Enchytraeids in spiked field soil; parameters in mg/kg dry weight. ................................................................................. 61 Table 27: Overview of the HCB uptake parameters: Parameters based on residues in wet worm and soil. ...................................................................................................... 62 Table 28: Overview of the HCB elimination parameters: Parameters in % of eliminated residues. ..................................................................................................................... 62 Table 29: Overview of the cadmium uptake parameters: Parameters based on residues in dry worm and soil. ................................................................................................... 63 Table 30: Overview of the cadmium elimination parameters: Parameters based on residues in dry worm and soil. ..................................................................................... 64 Table 31: Comparison of body residues in purged and non-purged earthworms. ........ 66 List of Figures Page
Figure 1: Eisenia fetida (left) and Enchytraeus albidus (right). .................................... 15 Figure 2: Test apparatus, schematic setup (from Bruns et al. 2001a). ........................ 33 Figure 3: Example of HCB kinetics in earthworms calculated conventionally according to sections 7.2 & 7.3; HCB in E. fetida in OECD soil (lab code O5). ............................ 48 Figure 4: Example of HCB kinetics in earthworms calculated according to section 7.4; HCB in E. fetida in OECD soil (lab code O5). .............................................................. 49 Figure 5: Example of Cd kinetics in earthworms calculated conventionally according to sections 7.2 & 7.3; Cd in E. fetida in OECD soil (lab code O13). ................................. 56 Figure 6: Example of Cd kinetics in earthworms calculated according to section 7.4; Cd in E. fetida in OECD soil (lab code O13). .................................................................... 57
7
Definitions Bioaccumulation is the increase in concentration of the test substance in or on an organism relative to the concentration of the test substance in the surrounding medium. Bioaccumulation results from both bioconcentration and biomagnification processes (see below). Bioconcentration is the increase in concentration of the test substance in or on an organism, resulting exclusively from uptake via the body surface, relative to the concentration of the test substance in the surrounding medium. Biomagnification is the increase in concentration of the test substance in or on an organism, resulting mainly from uptake from contaminated food or prey, relative to the concentration of the test substance in the food or prey. Biomagnification can lead to a transfer or accumulation of the test substance within food webs. The elimination of a test substance is the loss of this substance from the test organism tissue by active or passive processes, that occurs independently of presence or absence of the test substance in the surrounding medium. The bioaccumulation factor (BAF) at any time during the uptake phase of this bioaccumulation test is the concentration of test substance in/on the test organism (Ca in g kg-1 wet or dry weight) divided by the concentration of the substance in the surrounding medium (Cs as g kg-1 of wet or dry weight of soil). In order to refer to the units of Ca and Cs, the BAF has the units of g soil kg-1 worm. The steady state bioaccumulation factor (BAFss) is the BAF at steady state and does not change significantly over a prolonged period of time, the concentration of the test substance in the surrounding medium (Cs as g kg-1 of wet or dry weight of soil) being constant during this period of time. The biota-soil accumulation factor (BSAF) is the lipid-normalised steady state concentration of test substance in/on the test organism divided by the organic carbon-normalised concentration of the substance in the soil at steady state. Ca is then expressed as g kg-1 lipid content of the organism, and Cs as g kg-1 organic content of the soil. A plateau or steady state is defined as the equilibrium between the uptake and elimination processes that occur simultaneously during the exposure phase. The steady state is reached in the plot of the BAF at each sampling period against time when the curve becomes parallel to the time axis and three successive analyses of BAF made on samples taken at intervals of at least two days are within 20% of each other, and there are no statistically significant differences among the three sampling periods. Bioaccumulation factors calculated directly from the ratio of the soil uptake rate constant divided by the elimination constant kinetic rate constants (ks and ke, respectively - see below) are termed kinetic bioaccumulation factor (BAFK).
8
The uptake or exposure phase is the time period during which the test organisms are exposed to the test substance. The soil uptake rate constant (ks) is the numerical value defining the rate of increase in the concentration of the test substance in/on the test organism resulting from uptake from the soil phase. ks is expressed in g soil kg-1 of worm d-1. The elimination phase is the time period, following the transfer of the test organisms from a contaminated medium to a medium free of the test substance, during which the elimination (or the net loss) of the substance from the test organisms is studied. The elimination rate constant (ke) is the numerical value defining the rate of reduction in the concentration of the test substance in/on the test organism, following the transfer of the test organisms from a medium containing the test substance to a substance-free medium; ke is expressed in d-1. The organic carbon-water partitioning coefficient (Koc) is the ratio of the concentration of a substance in/on the organic carbon fraction of a soil and the concentration of the substance in water at equilibrium. The octanol-water partitioning coefficient (Kow; also sometimes expressed as Pow) is the ratio of the solubility of a substance in n-octanol and water at equilibrium and represents the lipophilicity of a substance. The Kow or its logarithm of Kow (log Kow) is used as an indication of the potential of a substance for bioaccumulation by aquatic organisms. The conditioning period is used to stabilise the microbial component of the soil and to remove e.g. ammonia originating from soil components; it takes place prior to spiking of the soil with the test substance. The equilibration period is used to allow for distribution of the test substance between the solid phase, and the porewater; it takes place after spiking of the soil with the test substance and prior to addition of the test organisms. Artificial soil, or formulated, reconstituted or synthetic soil, is a mixture of materials used to mimic the physical components of a natural soil. Spiked soil is soil to which test substance has been added. Porewater or interstitial water is the water occupying space between sediment or soil particles.
9
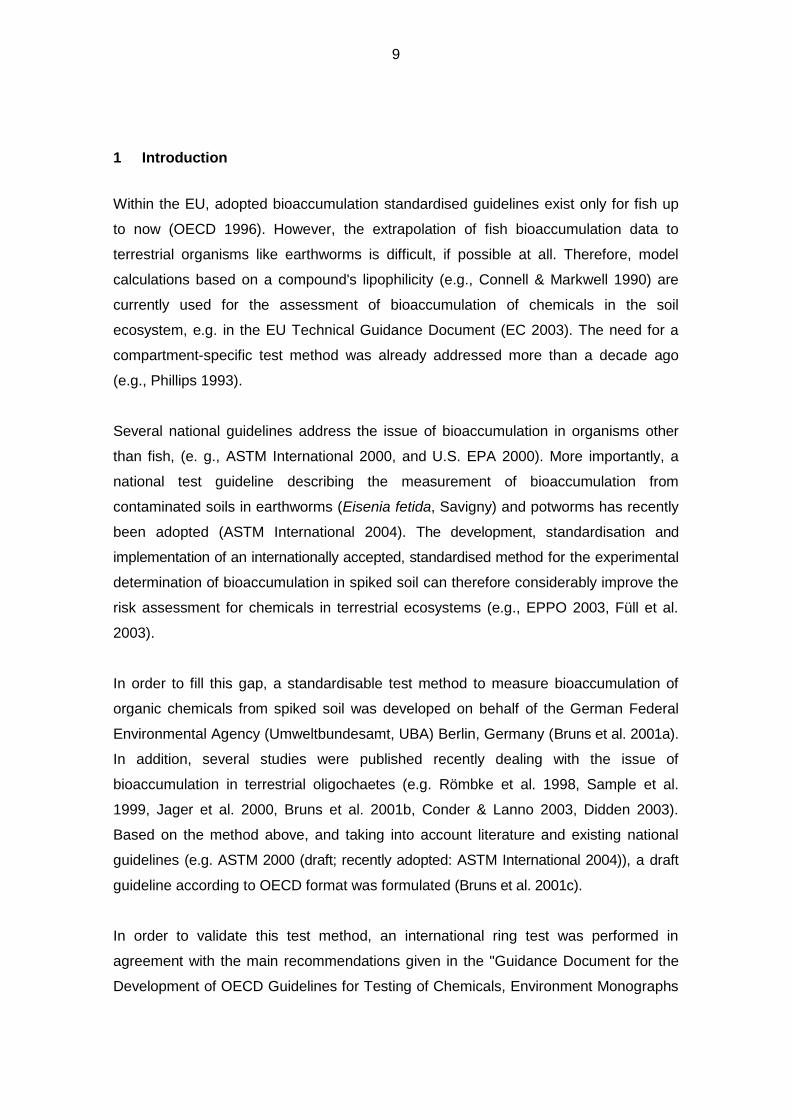
1 Introduction
Within the EU, adopted bioaccumulation standardised guidelines exist only for fish up
to now (OECD 1996). However, the extrapolation of fish bioaccumulation data to
terrestrial organisms like earthworms is difficult, if possible at all. Therefore, model
calculations based on a compound's lipophilicity (e.g., Connell & Markwell 1990) are
currently used for the assessment of bioaccumulation of chemicals in the soil
ecosystem, e.g. in the EU Technical Guidance Document (EC 2003). The need for a
compartment-specific test method was already addressed more than a decade ago
(e.g., Phillips 1993).
Several national guidelines address the issue of bioaccumulation in organisms other
than fish, (e. g., ASTM International 2000, and U.S. EPA 2000). More importantly, a
national test guideline describing the measurement of bioaccumulation from
contaminated soils in earthworms (Eisenia fetida, Savigny) and potworms has recently
been adopted (ASTM International 2004). The development, standardisation and
implementation of an internationally accepted, standardised method for the experimental
determination of bioaccumulation in spiked soil can therefore considerably improve the
risk assessment for chemicals in terrestrial ecosystems (e.g., EPPO 2003, Füll et al.
2003).
In order to fill this gap, a standardisable test method to measure bioaccumulation of
organic chemicals from spiked soil was developed on behalf of the German Federal
Environmental Agency (Umweltbundesamt, UBA) Berlin, Germany (Bruns et al. 2001a).
In addition, several studies were published recently dealing with the issue of
bioaccumulation in terrestrial oligochaetes (e.g. Römbke et al. 1998, Sample et al.
1999, Jager et al. 2000, Bruns et al. 2001b, Conder & Lanno 2003, Didden 2003).
Based on the method above, and taking into account literature and existing national
guidelines (e.g. ASTM 2000 (draft; recently adopted: ASTM International 2004)), a draft
guideline according to OECD format was formulated (Bruns et al. 2001c).
In order to validate this test method, an international ring test was performed in
agreement with the main recommendations given in the "Guidance Document for the
Development of OECD Guidelines for Testing of Chemicals, Environment Monographs

10
No. 76" (OECD 2006) and the "Guidance Document on the Validation and International
Acceptance of New or Updated Test Methods for Hazard Assessment, Series on
Testing and Assessment No. 34" (OECD 2005). Fourteen institutions (governmental,
universities, contract laboratories and industry) from seven countries participated in the
ring test.
The study was carried out based on the Draft Test Guideline: "Bioaccumulation: Soil
Test Using Terrestrial Oligochaetes" (Egeler et al. 2005). The performance and
documentation was done in general agreement with GLP-rules, but no formal certificate
was required for the participating laboratories.
This report describes methods and results of the ring test. Based on the outcome of
this ring test project, the draft guideline was revised and updated for submission to the
OECD testing programme.
Discussion of results and data from the ring test (Workshop Minutes) as well as the
revised draft guideline are included in the Annexes to this report.
11
2 Organisation of the Ring Test
In the ring test presented in this report, the main recommendations of the OECD
(OECD 2005, OECD 2006) were fulfilled.
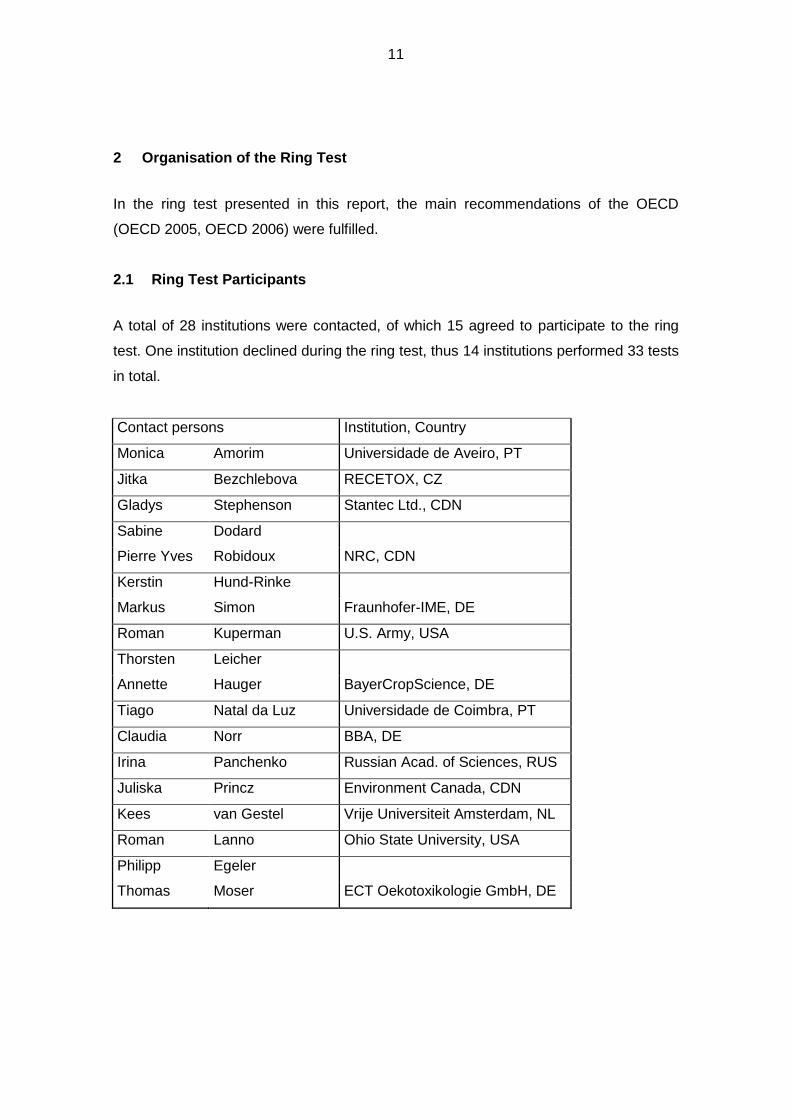
2.1 Ring Test Participants
A total of 28 institutions were contacted, of which 15 agreed to participate to the ring
test. One institution declined during the ring test, thus 14 institutions performed 33 tests
in total.
Contact persons Institution, Country
Monica Amorim Universidade de Aveiro, PT
Jitka Bezchlebova RECETOX, CZ
Gladys Stephenson Stantec Ltd., CDN
Sabine Dodard
Pierre Yves Robidoux NRC, CDN
Kerstin Hund-Rinke
Markus Simon Fraunhofer-IME, DE
Roman Kuperman U.S. Army, USA
Thorsten Leicher
Annette Hauger BayerCropScience, DE
Tiago Natal da Luz Universidade de Coimbra, PT
Claudia Norr BBA, DE
Irina Panchenko Russian Acad. of Sciences, RUS
Juliska Princz Environment Canada, CDN
Kees van Gestel Vrije Universiteit Amsterdam, NL
Roman Lanno Ohio State University, USA
Philipp Egeler
Thomas Moser ECT Oekotoxikologie GmbH, DE
12
2.2 Co-ordinating Institute
ECT Oekotoxikologie GmbH
Boettgerstr. 2 - 14
D-65439 Floersheim am Main
Germany
2.3 Monitoring
Dr. Gabriele Studinger
Umweltbundesamt
Fachgebiet IV 2.3
Wörlitzer Platz 1
06844 Dessau
Germany
13
2.4 Distribution of Materials
The test compounds including Certificate of Analysis and Safety Data Sheet, as well as
peat (air-dried and ground) were used of one batch and were distributed to the ring test
participants. Due to import restrictions, the participants located in North America
worked with separate batches of peat powder.
The radiolabelled test compound was obtained and distributed from Institute of
Isotopes Co., Ltd., 1121 Budapest, Hungary. Cadmium chloride hemipentahydrate was
obtained and distributed by Sigma-Aldrich, Taufkirchen, Germany.
Those laboratories requiring starter cultures of E. fetida or E. andrei and/or E. albidus
were provided with animals from ECT's culture, and with culture instructions. All other
institutes worked with oligochaetes from their own in-house cultures.
The ring test protocol including addenda, excel files for calculating application rates as
well as form sheets and excel files for the recording of raw data were also sent to all
participants prior to start of the definitive tests.
3 Acknowledgements
The authors thank the German Federal Environmental Agency (UBA) for funding and
supporting this ring test. Additionally, the authors wish to thank all participants of the
ring test for their dedicated work during ring testing. Sonia Chelinho, Tjago Natal da
Luz and Paulo Sousa of the Instituto do Ambentie e Vida, Dep. Zoologia da
Universidade de Coimbra, (Coimbra Portugal) are thanked for hosting the final
workshop. Acknowledgements are also due to Gabriele Studinger (UBA), for
encouraging monitoring throughout the project.
4 Practical Performance of the Ringtest - Test Methods
The study was carried out based on the Draft Test Guideline: "Bioaccumulation: Soil
Test Using Terrestrial Oligochaetes" (Egeler et al. 2005).
14
To determine the bioaccumulation of the test chemical, adult oligochaetes were
exposed to soil spiked with the test chemical. Artificial and field soils were used as
substrate. Test vessels without the addition of the test chemical served as controls.
The soil was equilibrated for 4 days after application of 14C-labelled hexachlorobenzene
(3 weeks equilibration for cadmium). The test animals were exposed to the spiked,
equilibrated soil for a period of up to 21 days to assess the bioaccumulation kinetics of
the test chemical in the test organisms (uptake phase). After the uptake phase, the
remaining test animals were exposed to control soil to eliminate accumulated test
chemical for a period of up to 21 days (elimination phase). With respect to the low
nutrient content of the soil, the worms were fed during the test with the same type of
food as in the cultures (e.g. with finely ground dung (earthworms) or ground oat flakes
(enchytraeids)). The food was mixed into the soil immediately before adding the test
organisms.
Endpoints to be determined were 1. the bioaccumulation factor (BAF) as the ratio of the
concentration of the test chemical in the test organisms and the concentration of the
test chemical in the soil at the end of the uptake phase; 2. the soil uptake rate constant
ks and the elimination rate constant ke; 3. the Non-Eliminated Residues (NER), which is
the concentration of the test chemical in the test organisms at the end of the elimination
phase compared to the concentration of the test chemical in the test organisms at the
end of the uptake phase.
Hexachlorobenzene was used in radiolabelled form (14C) in order to facilitate the
quantification of the test chemical (i.e. parent compound and its major metabolites) in
soil and worm samples. Total radioactive residues were measured by liquid scintillation
counting (LSC) following extraction, combustion or tissue solubilisation. Therefore, the
bioaccumulation factor (BAF) is based on the parent compound including any retained
metabolites. Additionally, and in a separate run under identical conditions, the
percentage of radioactivity associated with the parent compound was quantified in
aged OECD soil and earthworms at the end of the uptake phase.
Cadmium was used as cadmium chloride. The concentrations were measured as mg
metal per kg dry soil, e.g. by atomic absorption spectroscopy.
15
The ring test protocol as it was distributed to the ring test participants and used during
the ring test contained methods to be applied during practical performance in the ring
test. It was optional to the ring test participants to appIy other methods, e.g. for lipid
and TOC determination, than the ones outlined in the protocol, as long as these
alternative methods were summarised and referenced. In the following sections, the
test method and procedures are summarised.
4.1 Test Organisms
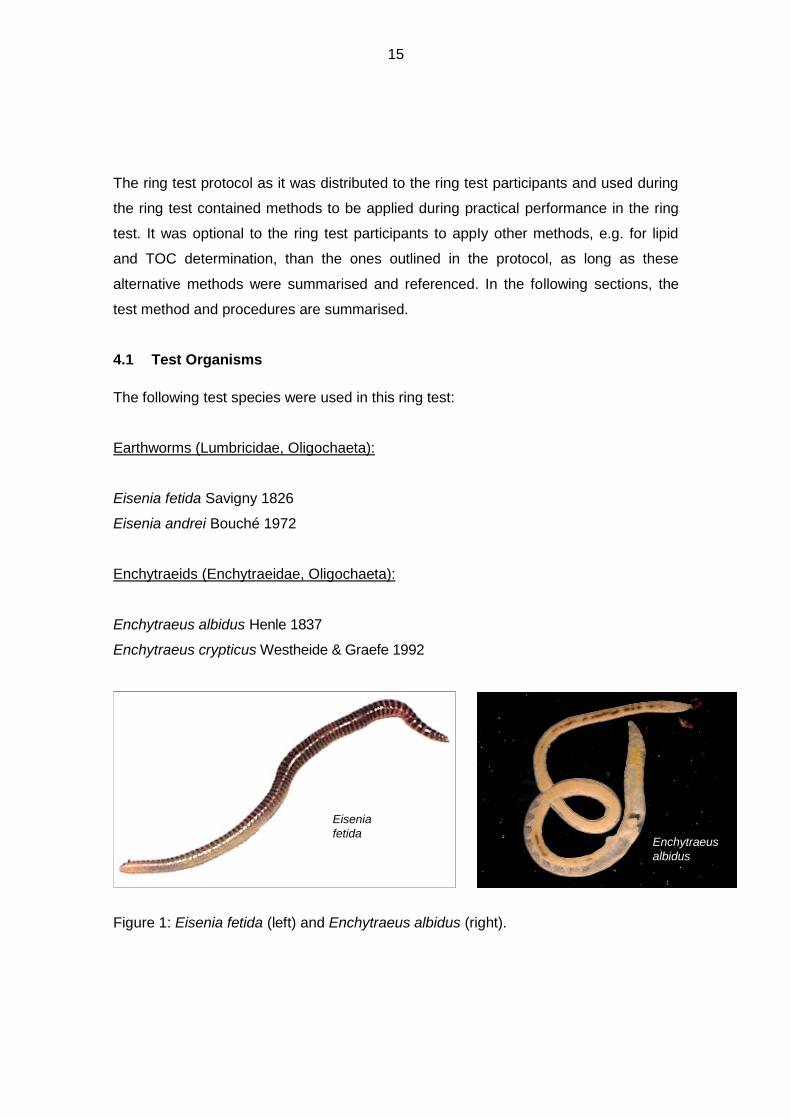
The following test species were used in this ring test:
Earthworms (Lumbricidae, Oligochaeta):
Eisenia fetida Savigny 1826
Eisenia andrei Bouché 1972
Enchytraeids (Enchytraeidae, Oligochaeta):
Enchytraeus albidus Henle 1837
Enchytraeus crypticus Westheide & Graefe 1992
Enchytraeus
albidus
Eisenia
fetida
Figure 1: Eisenia fetida (left) and Enchytraeus albidus (right).
16
4.2 Culture Conditions
The participating laboratories used their regular culture conditions. Additionally, some
recommendations for culturing of the oligochaete species used in the ring test are
given in the draft guideline.
4.3 Soil
4.3.1 Artificial Soil
For the ring test, artificial soil was used in order to provide comparable test conditions
between the laboratories. The composition of this artificial soil is is based on OECD
Guideline No. 207 (OECD 1984); the percentages refer to the soil dry weight as shown
in Table 1.
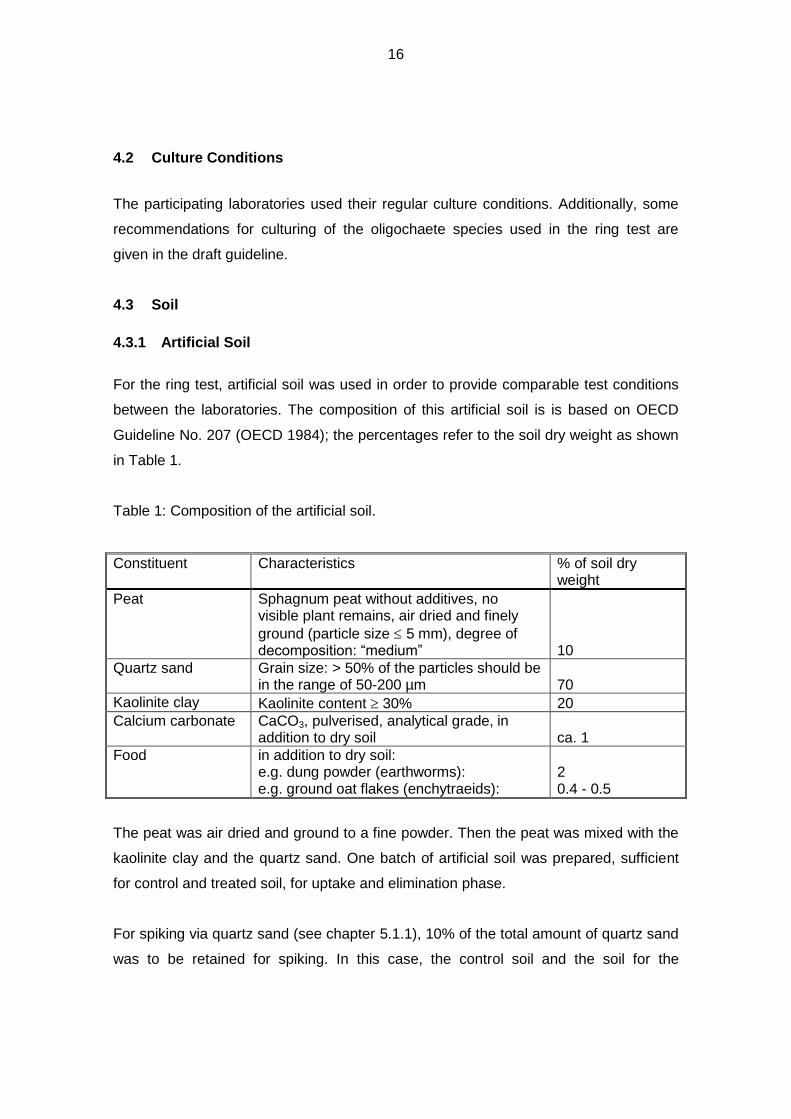
Table 1: Composition of the artificial soil.
Constituent
Characteristics % of soil dry weight
Peat Sphagnum peat without additives, no visible plant remains, air dried and finely
ground (particle size 5 mm), degree of decomposition: ―medium‖ 10
Quartz sand Grain size: > 50% of the particles should be in the range of 50-200 µm 70
Kaolinite clay Kaolinite content 30% 20
Calcium carbonate CaCO3, pulverised, analytical grade, in addition to dry soil ca. 1
Food in addition to dry soil: e.g. dung powder (earthworms): e.g. ground oat flakes (enchytraeids):
2 0.4 - 0.5
The peat was air dried and ground to a fine powder. Then the peat was mixed with the
kaolinite clay and the quartz sand. One batch of artificial soil was prepared, sufficient
for control and treated soil, for uptake and elimination phase.
For spiking via quartz sand (see chapter 5.1.1), 10% of the total amount of quartz sand
was to be retained for spiking. In this case, the control soil and the soil for the
17
elimination phase was to be mixed with a corresponding amount of quartz sand before
use.
The pH in soil was measured in a mixed sample in a 1 M solution of potassium chloride
(KCl) or a 0.01 M solution of calcium chloride (CaCl2) according to ISO-Norm 10390
(1994). If necessary, the pH of the final mixture was adjusted to 6 ± 0.5 with calcium
carbonate (CaCO3).
Thereafter the maximum water holding capacity (WHC) was measured (see chapter
4.5).
At least two days before spiking, the soil was moistened with deionised water (40 - 60%
of WHC) for conditioning.
For spiking via water (see chapter 5.2.1), the soil was moistened with 40 - 60% of WHC
minus the volume of application solution needed (e.g. moistened to 10 or 20% of WHC).
After spiking the test item, the final soil moisture was adjusted.
The artificial soil to be used in the test was conditioned for four days (14C-HCB), and
three weeks (Cd) prior to spiking with the test chemical.
4.3.2 Field Soils
The performance of test with field soils was an option in this ring test. In the following,
field (reference) soils used by individual labs are described. Characteristics are
reported as provided by the respective laboratories.
LUFA standard soil
LUFA standard soil 2.2 was used in this ring test (Labs O2, O5). The properties of this
reference soil are shown in Table 2.
18
Table 2: Typical characteristics of LUFA standard soil.
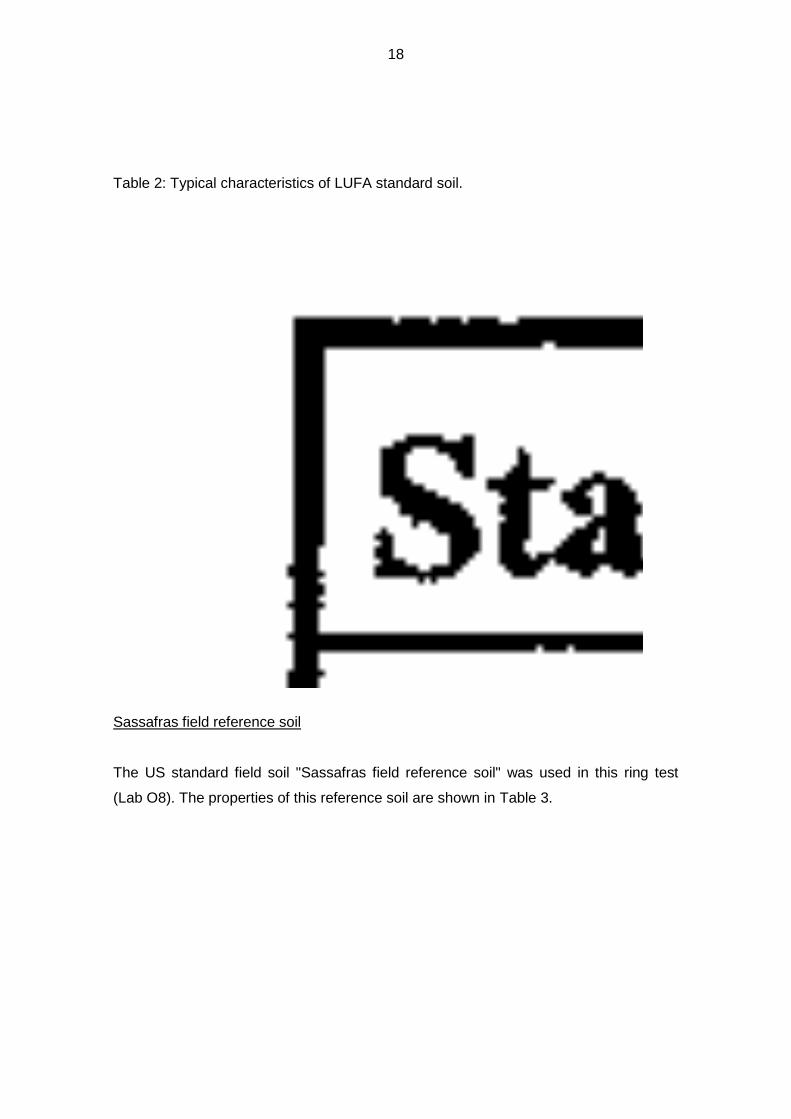
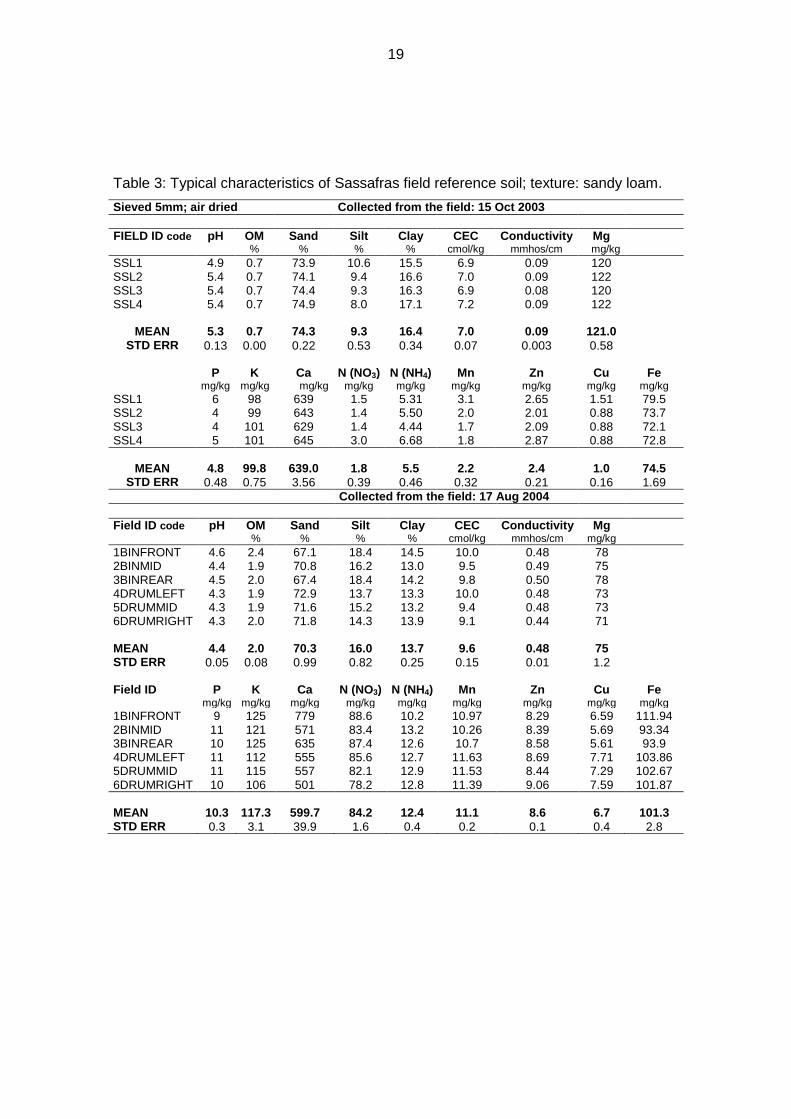
Sassafras field reference soil
The US standard field soil "Sassafras field reference soil" was used in this ring test
(Lab O8). The properties of this reference soil are shown in Table 3.
19
Table 3: Typical characteristics of Sassafras field reference soil; texture: sandy loam.
Sieved 5mm; air dried Collected from the field: 15 Oct 2003
FIELD ID code pH OM Sand Silt Clay CEC Conductivity Mg % % % % cmol/kg mmhos/cm mg/kg
SSL1 4.9 0.7 73.9 10.6 15.5 6.9 0.09 120 SSL2 5.4 0.7 74.1 9.4 16.6 7.0 0.09 122 SSL3 5.4 0.7 74.4 9.3 16.3 6.9 0.08 120 SSL4 5.4 0.7 74.9 8.0 17.1 7.2 0.09 122
MEAN 5.3 0.7 74.3 9.3 16.4 7.0 0.09 121.0 STD ERR 0.13 0.00 0.22 0.53 0.34 0.07 0.003 0.58
P K Ca N (NO3) N (NH4) Mn Zn Cu Fe mg/kg mg/kg mg/kg mg/kg mg/kg mg/kg mg/kg mg/kg mg/kg
SSL1 6 98 639 1.5 5.31 3.1 2.65 1.51 79.5 SSL2 4 99 643 1.4 5.50 2.0 2.01 0.88 73.7 SSL3 4 101 629 1.4 4.44 1.7 2.09 0.88 72.1 SSL4 5 101 645 3.0 6.68 1.8 2.87 0.88 72.8
MEAN 4.8 99.8 639.0 1.8 5.5 2.2 2.4 1.0 74.5
STD ERR 0.48 0.75 3.56 0.39 0.46 0.32 0.21 0.16 1.69
Collected from the field: 17 Aug 2004
Field ID code pH OM Sand Silt Clay CEC Conductivity Mg % % % % cmol/kg mmhos/cm mg/kg
1BINFRONT 4.6 2.4 67.1 18.4 14.5 10.0 0.48 78 2BINMID 4.4 1.9 70.8 16.2 13.0 9.5 0.49 75 3BINREAR 4.5 2.0 67.4 18.4 14.2 9.8 0.50 78 4DRUMLEFT 4.3 1.9 72.9 13.7 13.3 10.0 0.48 73 5DRUMMID 4.3 1.9 71.6 15.2 13.2 9.4 0.48 73 6DRUMRIGHT 4.3 2.0 71.8 14.3 13.9 9.1 0.44 71 MEAN 4.4 2.0 70.3 16.0 13.7 9.6 0.48 75 STD ERR 0.05 0.08 0.99 0.82 0.25 0.15 0.01 1.2 Field ID P K Ca N (NO3) N (NH4) Mn Zn Cu Fe mg/kg mg/kg mg/kg mg/kg mg/kg mg/kg mg/kg mg/kg mg/kg
1BINFRONT 9 125 779 88.6 10.2 10.97 8.29 6.59 111.94 2BINMID 11 121 571 83.4 13.2 10.26 8.39 5.69 93.34 3BINREAR 10 125 635 87.4 12.6 10.7 8.58 5.61 93.9 4DRUMLEFT 11 112 555 85.6 12.7 11.63 8.69 7.71 103.86 5DRUMMID 11 115 557 82.1 12.9 11.53 8.44 7.29 102.67 6DRUMRIGHT 10 106 501 78.2 12.8 11.39 9.06 7.59 101.87
MEAN 10.3 117.3 599.7 84.2 12.4 11.1 8.6 6.7 101.3 STD ERR 0.3 3.1 39.9 1.6 0.4 0.2 0.1 0.4 2.8
20
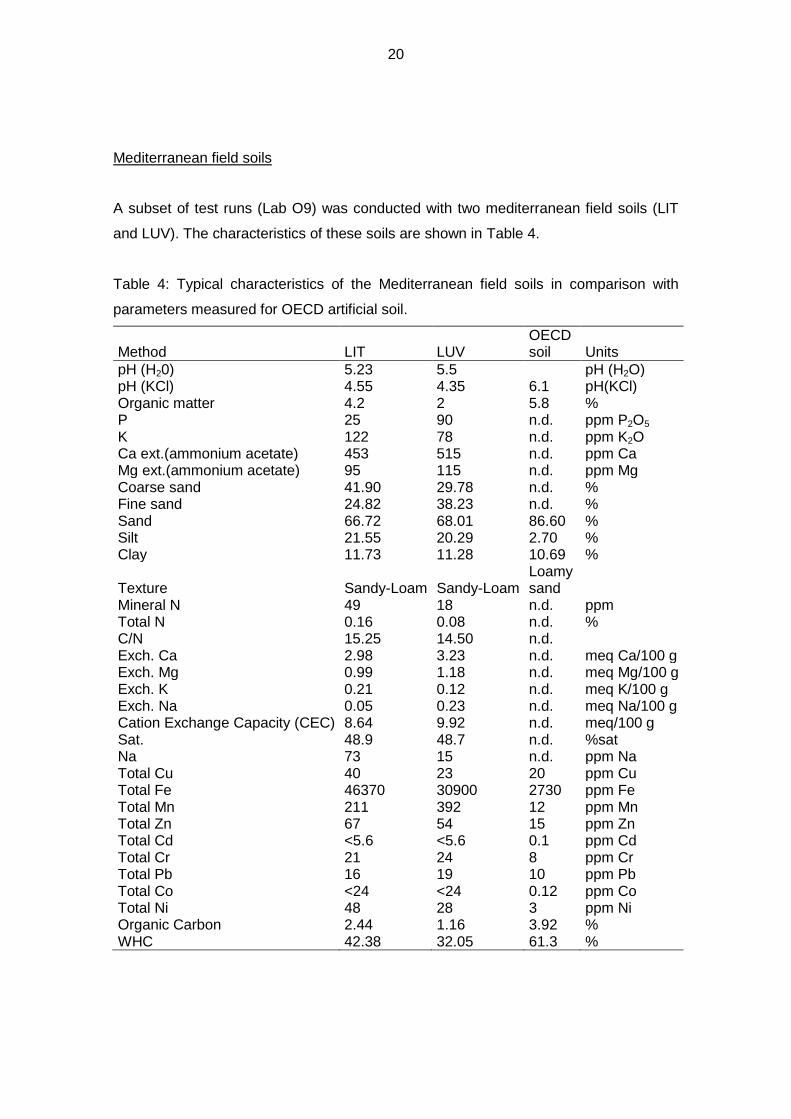
Mediterranean field soils
A subset of test runs (Lab O9) was conducted with two mediterranean field soils (LIT
and LUV). The characteristics of these soils are shown in Table 4.
Table 4: Typical characteristics of the Mediterranean field soils in comparison with
parameters measured for OECD artificial soil.
Method LIT LUV OECD soil Units
pH (H20) 5.23 5.5 pH (H2O) pH (KCl) 4.55 4.35 6.1 pH(KCl) Organic matter 4.2 2 5.8 % P 25 90 n.d. ppm P2O5 K 122 78 n.d. ppm K2O Ca ext.(ammonium acetate) 453 515 n.d. ppm Ca Mg ext.(ammonium acetate) 95 115 n.d. ppm Mg Coarse sand 41.90 29.78 n.d. % Fine sand 24.82 38.23 n.d. % Sand 66.72 68.01 86.60 % Silt 21.55 20.29 2.70 % Clay 11.73 11.28 10.69 %
Texture Sandy-Loam Sandy-Loam Loamy sand
Mineral N 49 18 n.d. ppm Total N 0.16 0.08 n.d. % C/N 15.25 14.50 n.d. Exch. Ca 2.98 3.23 n.d. meq Ca/100 g Exch. Mg 0.99 1.18 n.d. meq Mg/100 g Exch. K 0.21 0.12 n.d. meq K/100 g Exch. Na 0.05 0.23 n.d. meq Na/100 g Cation Exchange Capacity (CEC) 8.64 9.92 n.d. meq/100 g Sat. 48.9 48.7 n.d. %sat Na 73 15 n.d. ppm Na Total Cu 40 23 20 ppm Cu Total Fe 46370 30900 2730 ppm Fe Total Mn 211 392 12 ppm Mn Total Zn 67 54 15 ppm Zn Total Cd <5.6 <5.6 0.1 ppm Cd Total Cr 21 24 8 ppm Cr Total Pb 16 19 10 ppm Pb Total Co <24 <24 0.12 ppm Co Total Ni 48 28 3 ppm Ni Organic Carbon 2.44 1.16 3.92 % WHC 42.38 32.05 61.3 %
21
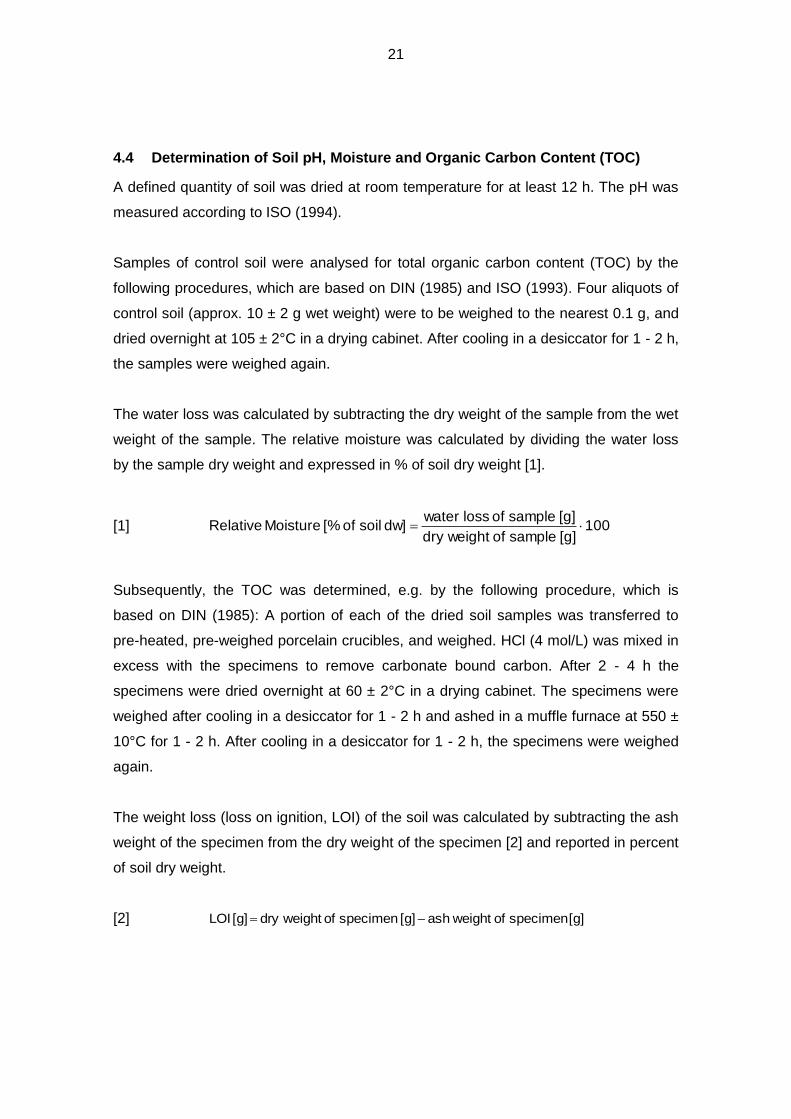
4.4 Determination of Soil pH, Moisture and Organic Carbon Content (TOC)
A defined quantity of soil was dried at room temperature for at least 12 h. The pH was
measured according to ISO (1994).
Samples of control soil were analysed for total organic carbon content (TOC) by the
following procedures, which are based on DIN (1985) and ISO (1993). Four aliquots of
control soil (approx. 10 ± 2 g wet weight) were to be weighed to the nearest 0.1 g, and
dried overnight at 105 ± 2°C in a drying cabinet. After cooling in a desiccator for 1 - 2 h,
the samples were weighed again.
The water loss was calculated by subtracting the dry weight of the sample from the wet
weight of the sample. The relative moisture was calculated by dividing the water loss
by the sample dry weight and expressed in % of soil dry weight [1].
[1] 100[g] sample of dry weight
[g] sample of loss water dw] soil of [% Moisture Relative
Subsequently, the TOC was determined, e.g. by the following procedure, which is
based on DIN (1985): A portion of each of the dried soil samples was transferred to
pre-heated, pre-weighed porcelain crucibles, and weighed. HCl (4 mol/L) was mixed in
excess with the specimens to remove carbonate bound carbon. After 2 - 4 h the
specimens were dried overnight at 60 ± 2°C in a drying cabinet. The specimens were
weighed after cooling in a desiccator for 1 - 2 h and ashed in a muffle furnace at 550 ±
10°C for 1 - 2 h. After cooling in a desiccator for 1 - 2 h, the specimens were weighed
again.
The weight loss (loss on ignition, LOI) of the soil was calculated by subtracting the ash
weight of the specimen from the dry weight of the specimen [2] and reported in percent
of soil dry weight.
[2] [g] specimen of weightash [g] specimen of dry weight [g] LOI
22
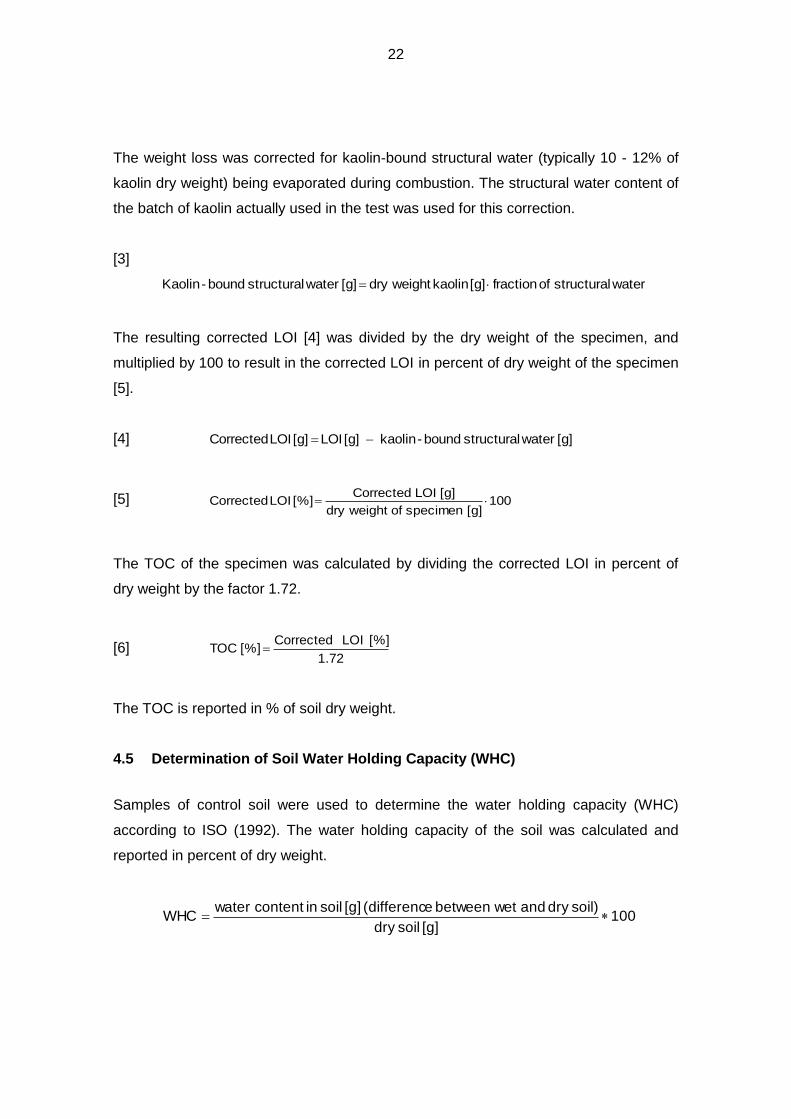
The weight loss was corrected for kaolin-bound structural water (typically 10 - 12% of
kaolin dry weight) being evaporated during combustion. The structural water content of
the batch of kaolin actually used in the test was used for this correction.
[3]
waterstructural of fraction [g] kaolin dry weight [g] waterstructural bound-Kaolin
The resulting corrected LOI [4] was divided by the dry weight of the specimen, and
multiplied by 100 to result in the corrected LOI in percent of dry weight of the specimen
[5].
[4] [g] waterstructural bound-kaolin [g] LOI [g] LOI Corrected
[5] 100en [g] of specimdry weight
LOI [g]Corrected [%] LOI Corrected
The TOC of the specimen was calculated by dividing the corrected LOI in percent of
dry weight by the factor 1.72.
[6] 72.1
[%] LOI Corrected [%] TOC
The TOC is reported in % of soil dry weight.
4.5 Determination of Soil Water Holding Capacity (WHC)
Samples of control soil were used to determine the water holding capacity (WHC)
according to ISO (1992). The water holding capacity of the soil was calculated and
reported in percent of dry weight.
100[g] soildry
soil)dry and wetbetween e(differenc [g] soil in content water WHC
23
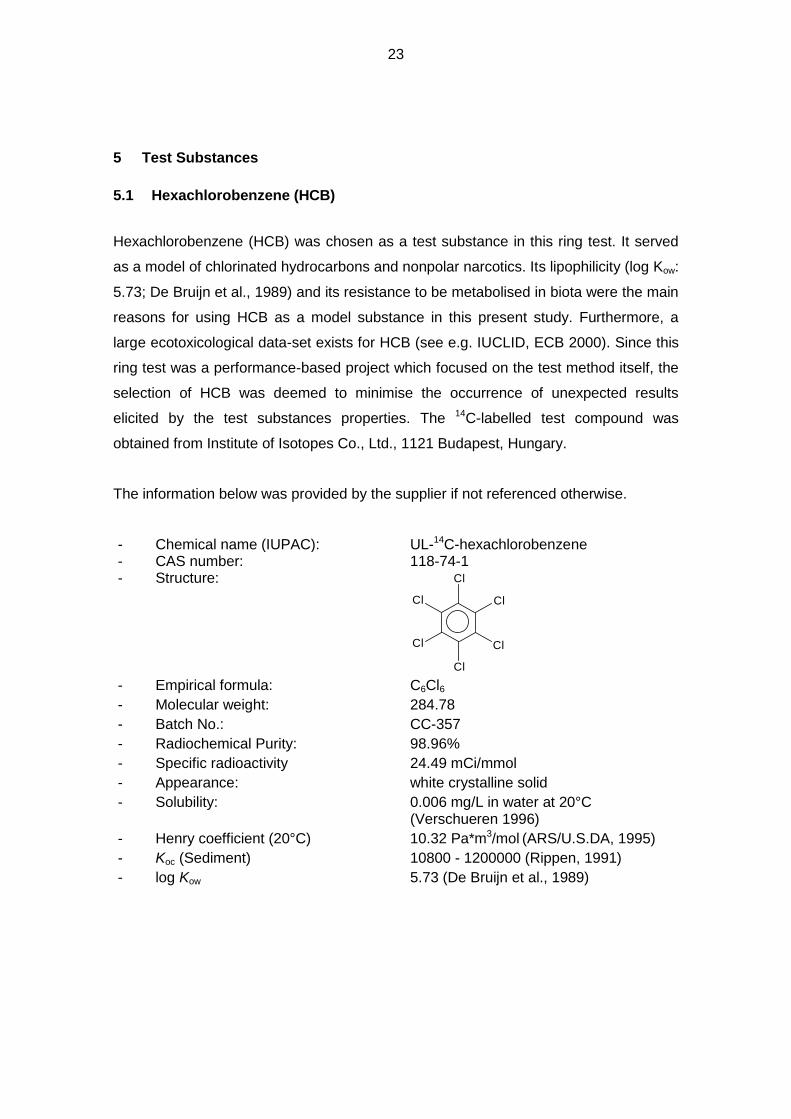
5 Test Substances
5.1 Hexachlorobenzene (HCB)
Hexachlorobenzene (HCB) was chosen as a test substance in this ring test. It served
as a model of chlorinated hydrocarbons and nonpolar narcotics. Its lipophilicity (log Kow:
5.73; De Bruijn et al., 1989) and its resistance to be metabolised in biota were the main
reasons for using HCB as a model substance in this present study. Furthermore, a
large ecotoxicological data-set exists for HCB (see e.g. IUCLID, ECB 2000). Since this
ring test was a performance-based project which focused on the test method itself, the
selection of HCB was deemed to minimise the occurrence of unexpected results
elicited by the test substances properties. The 14C-labelled test compound was
obtained from Institute of Isotopes Co., Ltd., 1121 Budapest, Hungary.
The information below was provided by the supplier if not referenced otherwise.
- Chemical name (IUPAC): UL-14C-hexachlorobenzene - CAS number: 118-74-1 - Structure: Cl
ClCl
Cl Cl
Cl - Empirical formula: C6Cl6
- Molecular weight: 284.78
- Batch No.: CC-357
- Radiochemical Purity: 98.96%
- Specific radioactivity 24.49 mCi/mmol
- Appearance: white crystalline solid
- Solubility: 0.006 mg/L in water at 20°C (Verschueren 1996)
- Henry coefficient (20°C) 10.32 Pa*m3/mol (ARS/U.S.DA, 1995)
- Koc (Sediment) 10800 - 1200000 (Rippen, 1991)
- log Kow 5.73 (De Bruijn et al., 1989)
24
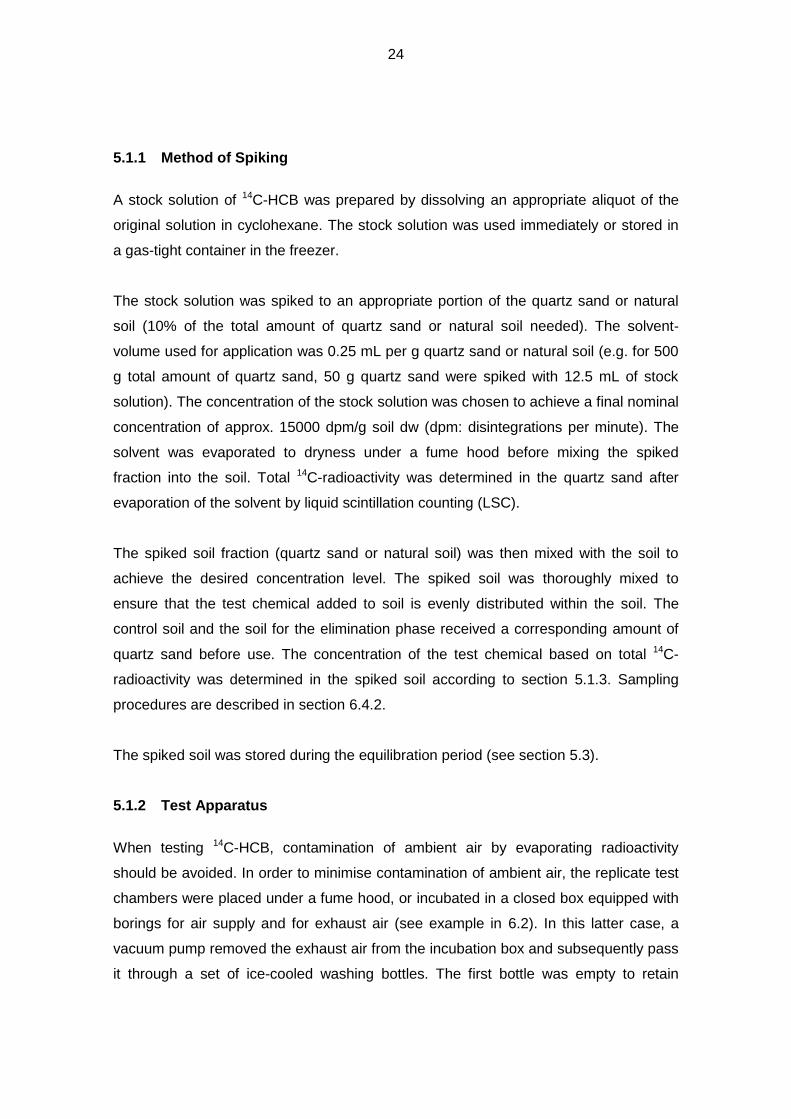
5.1.1 Method of Spiking
A stock solution of 14C-HCB was prepared by dissolving an appropriate aliquot of the
original solution in cyclohexane. The stock solution was used immediately or stored in
a gas-tight container in the freezer.
The stock solution was spiked to an appropriate portion of the quartz sand or natural
soil (10% of the total amount of quartz sand or natural soil needed). The solvent-
volume used for application was 0.25 mL per g quartz sand or natural soil (e.g. for 500
g total amount of quartz sand, 50 g quartz sand were spiked with 12.5 mL of stock
solution). The concentration of the stock solution was chosen to achieve a final nominal
concentration of approx. 15000 dpm/g soil dw (dpm: disintegrations per minute). The
solvent was evaporated to dryness under a fume hood before mixing the spiked
fraction into the soil. Total 14C-radioactivity was determined in the quartz sand after
evaporation of the solvent by liquid scintillation counting (LSC).
The spiked soil fraction (quartz sand or natural soil) was then mixed with the soil to
achieve the desired concentration level. The spiked soil was thoroughly mixed to
ensure that the test chemical added to soil is evenly distributed within the soil. The
control soil and the soil for the elimination phase received a corresponding amount of
quartz sand before use. The concentration of the test chemical based on total 14C-
radioactivity was determined in the spiked soil according to section 5.1.3. Sampling
procedures are described in section 6.4.2.
The spiked soil was stored during the equilibration period (see section 5.3).
5.1.2 Test Apparatus
When testing 14C-HCB, contamination of ambient air by evaporating radioactivity
should be avoided. In order to minimise contamination of ambient air, the replicate test
chambers were placed under a fume hood, or incubated in a closed box equipped with
borings for air supply and for exhaust air (see example in 6.2). In this latter case, a
vacuum pump removed the exhaust air from the incubation box and subsequently pass
it through a set of ice-cooled washing bottles. The first bottle was empty to retain
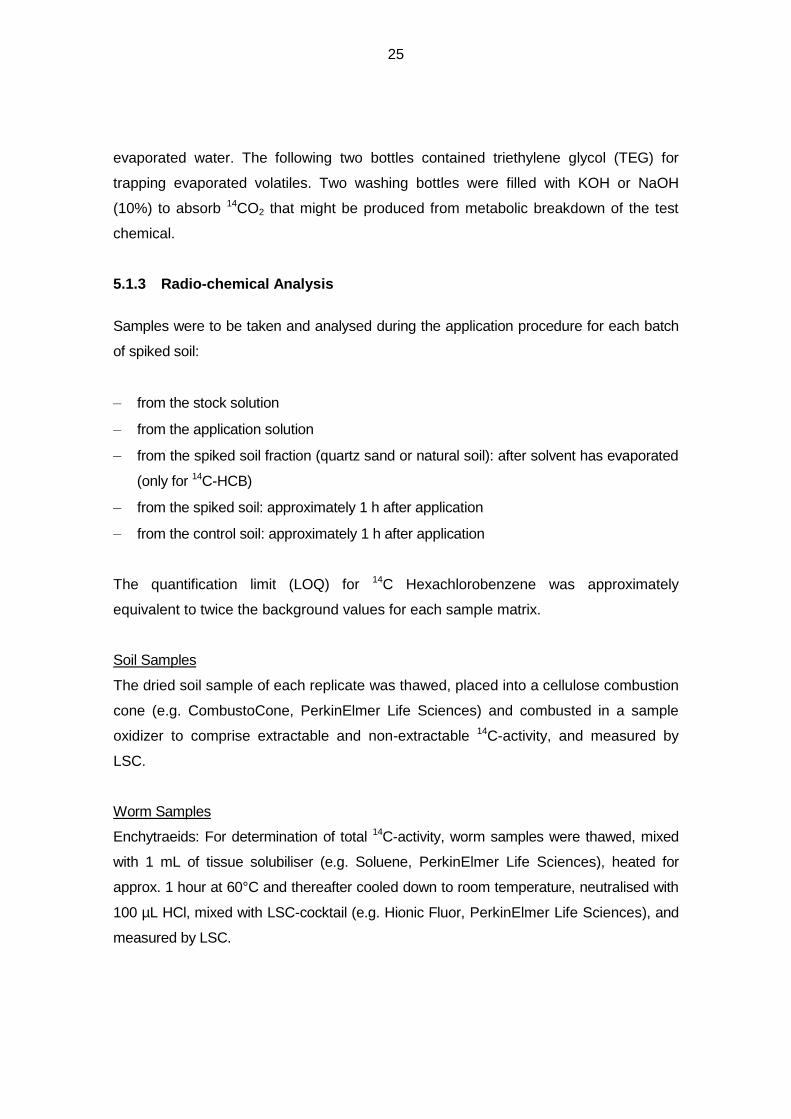
25
evaporated water. The following two bottles contained triethylene glycol (TEG) for
trapping evaporated volatiles. Two washing bottles were filled with KOH or NaOH
(10%) to absorb 14CO2 that might be produced from metabolic breakdown of the test
chemical.
5.1.3 Radio-chemical Analysis
Samples were to be taken and analysed during the application procedure for each batch
of spiked soil:
– from the stock solution
– from the application solution
– from the spiked soil fraction (quartz sand or natural soil): after solvent has evaporated
(only for 14C-HCB)
– from the spiked soil: approximately 1 h after application
– from the control soil: approximately 1 h after application
The quantification limit (LOQ) for 14C Hexachlorobenzene was approximately
equivalent to twice the background values for each sample matrix.
Soil Samples
The dried soil sample of each replicate was thawed, placed into a cellulose combustion
cone (e.g. CombustoCone, PerkinElmer Life Sciences) and combusted in a sample
oxidizer to comprise extractable and non-extractable 14C-activity, and measured by
LSC.
Worm Samples
Enchytraeids: For determination of total 14C-activity, worm samples were thawed, mixed
with 1 mL of tissue solubiliser (e.g. Soluene, PerkinElmer Life Sciences), heated for
approx. 1 hour at 60°C and thereafter cooled down to room temperature, neutralised with
100 µL HCl, mixed with LSC-cocktail (e.g. Hionic Fluor, PerkinElmer Life Sciences), and
measured by LSC.

26
Earthworms: Worm samples of each replicate were thawed, placed into a cellulose
combustion cone (e.g. CombustoCone, PerkinElmer Life Sciences) and combusted in a
sample oxidizer to comprise extractable and non-extractable 14C-activity; 14CO2 was
trapped in an absorbing agent (CarboSorb, PerkinElmer Life Sciences), mixed with
LSC-cocktail (e.g. Permafluor, PerkinElmer Life Sciences), and measured by LSC.
Trapping Solutions
Water and TEG samples were mixed with LSC-cocktail (e.g. Ultima Gold, PerkinElmer
Life Sciences). KOH or NaOH samples were mixed with LSC-cocktail (e.g. Hionic Fluor).
Afterwards, they were analysed for total 14C-activity by LSC. The amount of trapped
14C-activity was calculated for the total volume of the content in the washing bottles.
Recovery Samples
In order to assure the validity of the analytical results, control test soil and worm samples
were fortified with the test substance in the range between the quantification limit and the
test concentration, and analysed once before start of analytical procedures.
The average recovery in fortified samples was to be within the range of 90 - 110% with a
standard deviation of less than 20% to be considered as acceptable. At least two
recoveries were performed per sample matrix.
27
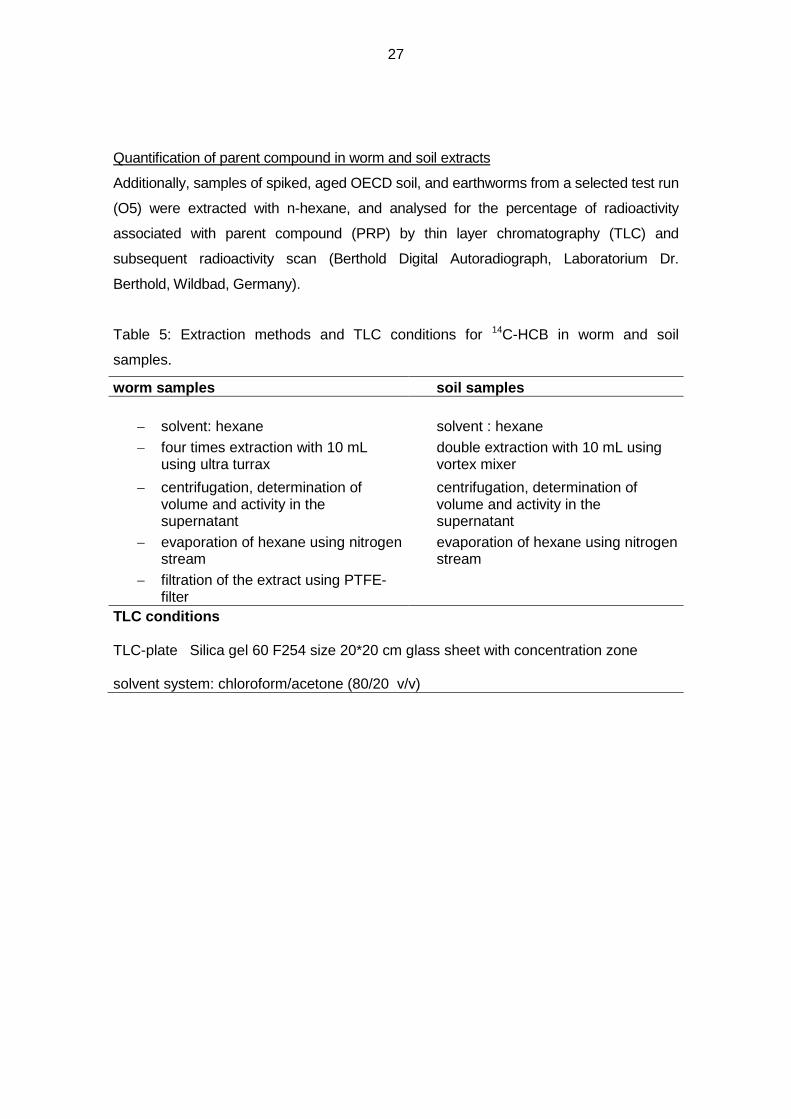
Quantification of parent compound in worm and soil extracts
Additionally, samples of spiked, aged OECD soil, and earthworms from a selected test run
(O5) were extracted with n-hexane, and analysed for the percentage of radioactivity
associated with parent compound (PRP) by thin layer chromatography (TLC) and
subsequent radioactivity scan (Berthold Digital Autoradiograph, Laboratorium Dr.
Berthold, Wildbad, Germany).
Table 5: Extraction methods and TLC conditions for 14C-HCB in worm and soil
samples.
worm samples soil samples
solvent: hexane solvent : hexane
four times extraction with 10 mL using ultra turrax
double extraction with 10 mL using vortex mixer
centrifugation, determination of volume and activity in the supernatant
centrifugation, determination of volume and activity in the supernatant
evaporation of hexane using nitrogen stream
evaporation of hexane using nitrogen stream
filtration of the extract using PTFE-filter
TLC conditions TLC-plate Silica gel 60 F254 size 20*20 cm glass sheet with concentration zone solvent system: chloroform/acetone (80/20 v/v)
28
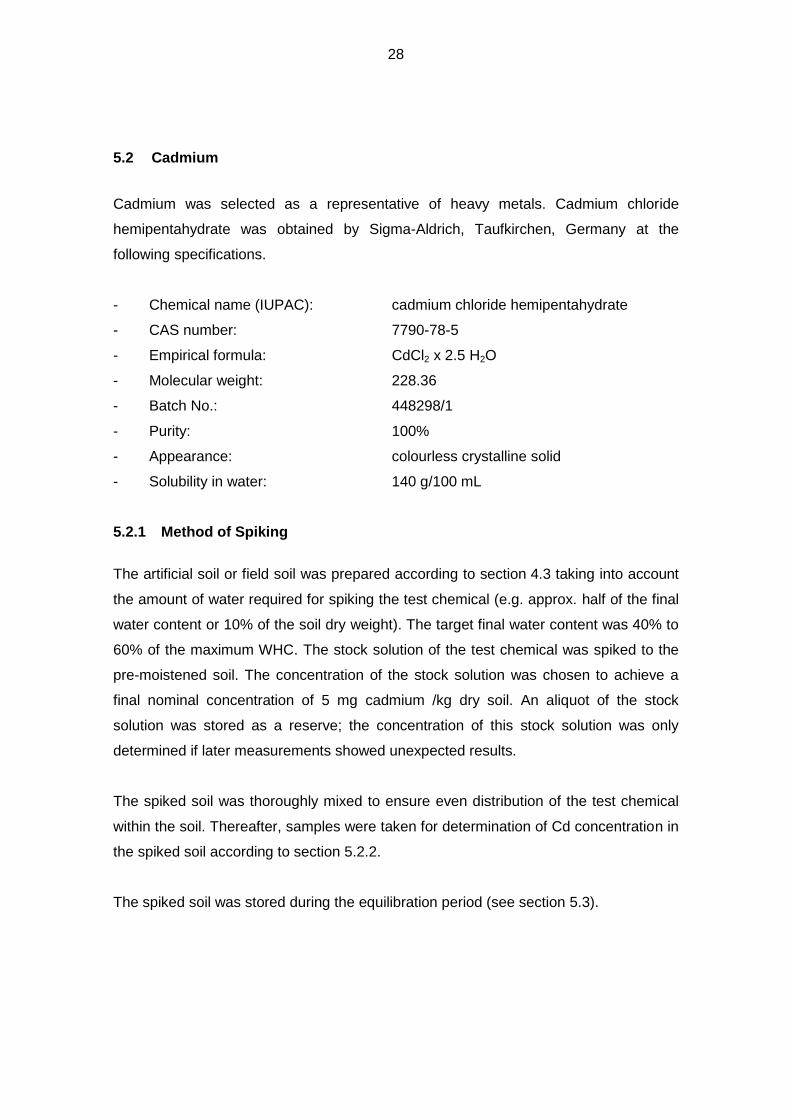
5.2 Cadmium
Cadmium was selected as a representative of heavy metals. Cadmium chloride
hemipentahydrate was obtained by Sigma-Aldrich, Taufkirchen, Germany at the
following specifications.
- Chemical name (IUPAC): cadmium chloride hemipentahydrate
- CAS number: 7790-78-5
- Empirical formula: CdCl2 x 2.5 H2O
- Molecular weight: 228.36
- Batch No.: 448298/1
- Purity: 100%
- Appearance: colourless crystalline solid
- Solubility in water: 140 g/100 mL
5.2.1 Method of Spiking
The artificial soil or field soil was prepared according to section 4.3 taking into account
the amount of water required for spiking the test chemical (e.g. approx. half of the final
water content or 10% of the soil dry weight). The target final water content was 40% to
60% of the maximum WHC. The stock solution of the test chemical was spiked to the
pre-moistened soil. The concentration of the stock solution was chosen to achieve a
final nominal concentration of 5 mg cadmium /kg dry soil. An aliquot of the stock
solution was stored as a reserve; the concentration of this stock solution was only
determined if later measurements showed unexpected results.
The spiked soil was thoroughly mixed to ensure even distribution of the test chemical
within the soil. Thereafter, samples were taken for determination of Cd concentration in
the spiked soil according to section 5.2.2.
The spiked soil was stored during the equilibration period (see section 5.3).
29
5.2.2 Chemical Analysis
Samples from the tests were analysed for total amount of cadmium by Atomic
Absorption Spectometry (AAS). One lab used inductively-coupled plasma mass
spectrometry (ICO-MS) for Cd-analysis. The following samples were taken according to
the ring test protocol:
– stock solution (reserve)
– spiked soil: approximately 1 h after application
– control soil: approximately 1 h after application
– worm and soil samples during uptake and elimination phase.
In general, the samples were processed and analysed for metal concentration
according to the methods available to analysing laboratories. The cadmium residues in
each sample were determined by comparison to a calibration curve consisting of at
least 3 points (duplicate determination) or 5 points (single determination). The lowest
point of the calibration curve was to correspond to 70% or less of the determination
limit of the method.
Demonstration of the validity of the analytical method and results were performed by
each participating laboratory. For example, control test soil and worm samples were
fortified with the test item in the range of the quantification limit to the highest test
concentration of the biological part, and analysed with each set of samples.
The average recovery should be within the range of 70 - 110% with a standard
deviation of less than 20 % to be considered as acceptable. At least two recoveries
were performed per sample matrix.
Soil and Worm Samples
The soil and worm samples for metal analysis should be stored dried (105°C) or
freeze-dried until analysis according to the ring test protocol. Note: Weighing of dried
worms appeared to be problematic especially for enchytraeid samples because of
hygroscopic weight increase and electrostatic charge. Additionally, worm tissue tended
30
to stick to vessel walls and was difficult to remove when dried. Worms should therefore
be stored frozen before analysis, not dried in an oven.
Samples for analysis were digested using a mixture of concentrated HNO3 and HCl (4:1)
for soil and earthworm samples, and a mixture of concentrated HNO3 and HClO4 (7:1)
for enchytraeid samples.
Analysis was performed by Atomic Absorption Spectrometry (AAS) at a wavelength of
228.9 nm. The quantification limit (LOQ) for cadmium in soil was 7 µg/l or 0.32-0.7 µg/g
dry soil as reported by lab O15. For earthworm samples, the LOQ was 7 µg/l or approx.
1 µg/g dry earthworm tissue. The detection limit for enchytraeid samples was 0.224
µg/l or 0.025 µg/g dry sample.
5.3 Equilibration and Addition of Food
After spiking, the spiked soil was stored in one container for equilibration. The
equilibration period for 14C-HCB-spiked soil was 4 days, while cadmium-spiked soil was
equilibrated for 3 weeks. The equilibration period ended on day 0 of the uptake phase.
The container with the spiked soil was incubated for equilibration under test conditions
(i.e., at 20 ± 2C, and a light regime of 16:8 (light:dark) with a light intensity of 100 -
1000 lx). After the equilibrium period the moisture of the soil was controlled by
reweighing the vessel without test organisms and food, and - if necessary - adjusted to
the initial value by adding deionised water.
The control soil was treated in the same manner as the spiked soil.
After the equilibration period, the food source was added to the soil. The worms were
fed with the same type of food as in the cultures.
Example: For earthworms, 20 mg dried dung per g soil dry weight were recommended;
for enchytraeids, 4 - 5 mg of ground oat flakes per g soil dry weight were
recommended.
31
If other food sources were to be used in the test, the concentration of food per g dry
soil was to be chosen so that the biomass of the test organisms did not decrease, and
that the food or substrate did not get moldy.
The food source was thoroughly and evenly distributed within the soil. The type and
quantity of food applied (in g/kg dry soil) was reported by each participating laboratory.
Soil samples were taken (3 spiked and 4 control samples) for analysis of the
concentration of the test chemical in soil after equilibration.
The spiked, equilibrated soil (with food source) was then distributed to the replicate test
vessels.
5.4 Measurement Endpoints
Parameters to be determined were the concentrations of the test chemical (14C-HCB
and Cd) in soil and worms over the time course of uptake and elimination phase.
Endpoints to be determined were the bioaccumulation factor (BAF) as the ratio of the
concentration of the test chemical in the test organisms and the concentration of the
test chemical in the soil at the end of the uptake phase, and the concentration of the
test chemical in the test organisms at the end of the elimination phase compared to the
concentration of the test chemical in the test organisms at the end of the uptake phase.
Additionally, the kinetics of uptake and elimination including the corresponding rate
constants were to be calculated.
32
6 Experimental Procedures and Methods
6.1 General Aspects: Test Vessels, Loading, Replicates
The test was conducted in glass, plastic or stainless steel vessels. The vessels were to
be appropriately covered to prevent escaping of the worms, while allowing sufficient air
supply (e.g. by a perforated aluminium foil). The target amount of soil in the vessels
was a layer of 2 - 3 cm (enchytraeids) or 4 - 5 cm (earthworms) of soil prepared as
described above.
For example, for Eisenia sp., a loading rate of 3 - 5 mg of worm tissue (wet weight) per
gram of wet soil was recommended. This corresponds to a loading rate of 1 mg of
worm tissue (dry weight) per 1.25 g of soil (dry weight) calculated for Eisenia sp. and
artificial soil. Values for the other species were to be selected accordingly.
In general, a minimum of 3 replicates containing spiked soil was prepared for each
sampling date.
At least 3 x 4 control replicates were prepared for sampling at the start and end of the
uptake phase, and at the end of the elimination phase, respectively.
In cases where worms with and without gut content were analysed at the end of the
uptake phase and/or at start of the elimination phase (e.g. lab O5), the corresponding
number of additional replicate test vessels was prepared.
If dry weight and lipid content were to be determined additionally at the end of the
uptake phase, the corresponding number of additional control vessels was prepared.
A set of at least 3 replicates containing spiked soil was to be prepared as a reserve.
All vessels were weighed on day 0 after addition of worms.
33
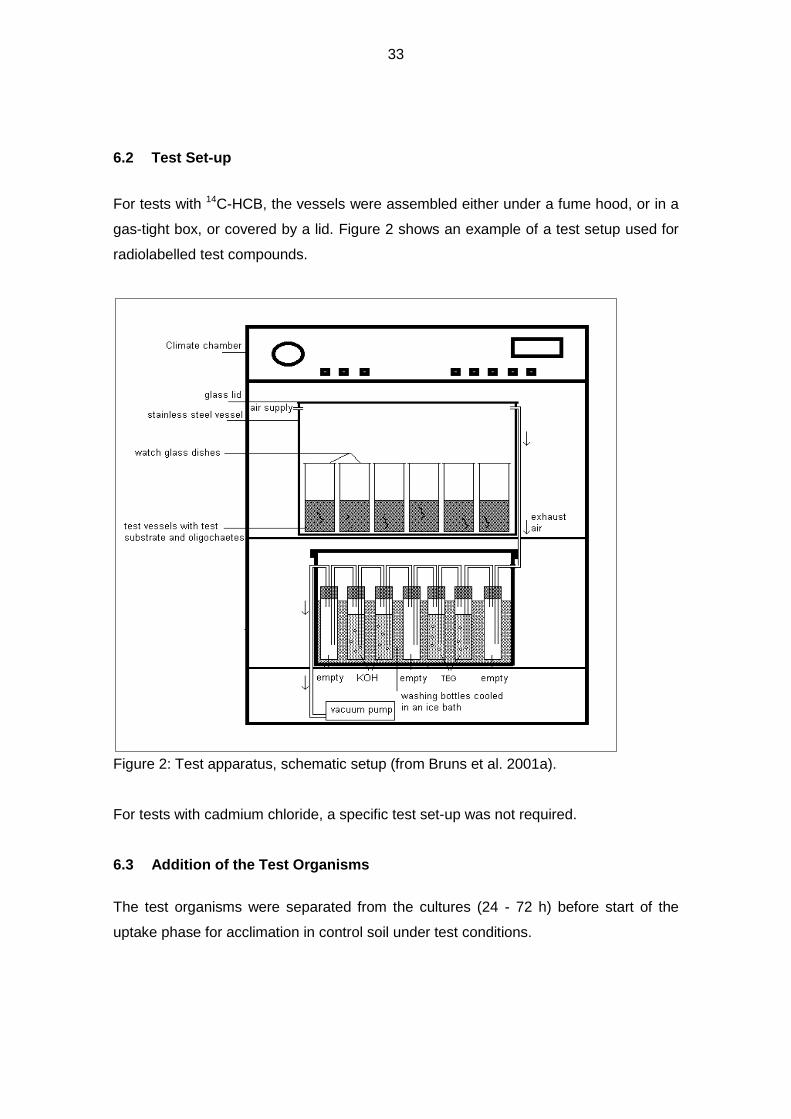
6.2 Test Set-up
For tests with 14C-HCB, the vessels were assembled either under a fume hood, or in a
gas-tight box, or covered by a lid. Figure 2 shows an example of a test setup used for
radiolabelled test compounds.
Figure 2: Test apparatus, schematic setup (from Bruns et al. 2001a).
For tests with cadmium chloride, a specific test set-up was not required.
6.3 Addition of the Test Organisms
The test organisms were separated from the cultures (24 - 72 h) before start of the
uptake phase for acclimation in control soil under test conditions.
34
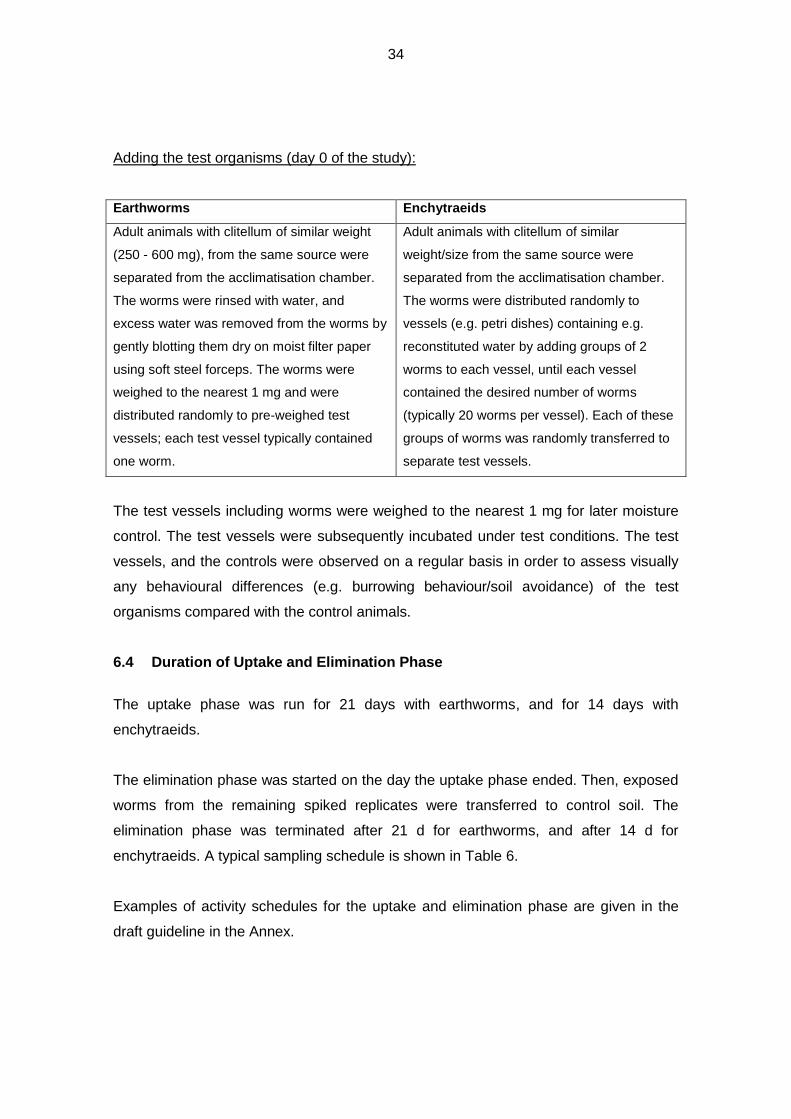
Adding the test organisms (day 0 of the study):
Earthworms Enchytraeids
Adult animals with clitellum of similar weight
(250 - 600 mg), from the same source were
separated from the acclimatisation chamber.
The worms were rinsed with water, and
excess water was removed from the worms by
gently blotting them dry on moist filter paper
using soft steel forceps. The worms were
weighed to the nearest 1 mg and were
distributed randomly to pre-weighed test
vessels; each test vessel typically contained
one worm.
Adult animals with clitellum of similar
weight/size from the same source were
separated from the acclimatisation chamber.
The worms were distributed randomly to
vessels (e.g. petri dishes) containing e.g.
reconstituted water by adding groups of 2
worms to each vessel, until each vessel
contained the desired number of worms
(typically 20 worms per vessel). Each of these
groups of worms was randomly transferred to
separate test vessels.
The test vessels including worms were weighed to the nearest 1 mg for later moisture
control. The test vessels were subsequently incubated under test conditions. The test
vessels, and the controls were observed on a regular basis in order to assess visually
any behavioural differences (e.g. burrowing behaviour/soil avoidance) of the test
organisms compared with the control animals.
6.4 Duration of Uptake and Elimination Phase
The uptake phase was run for 21 days with earthworms, and for 14 days with
enchytraeids.
The elimination phase was started on the day the uptake phase ended. Then, exposed
worms from the remaining spiked replicates were transferred to control soil. The
elimination phase was terminated after 21 d for earthworms, and after 14 d for
enchytraeids. A typical sampling schedule is shown in Table 6.
Examples of activity schedules for the uptake and elimination phase are given in the
draft guideline in the Annex.
35
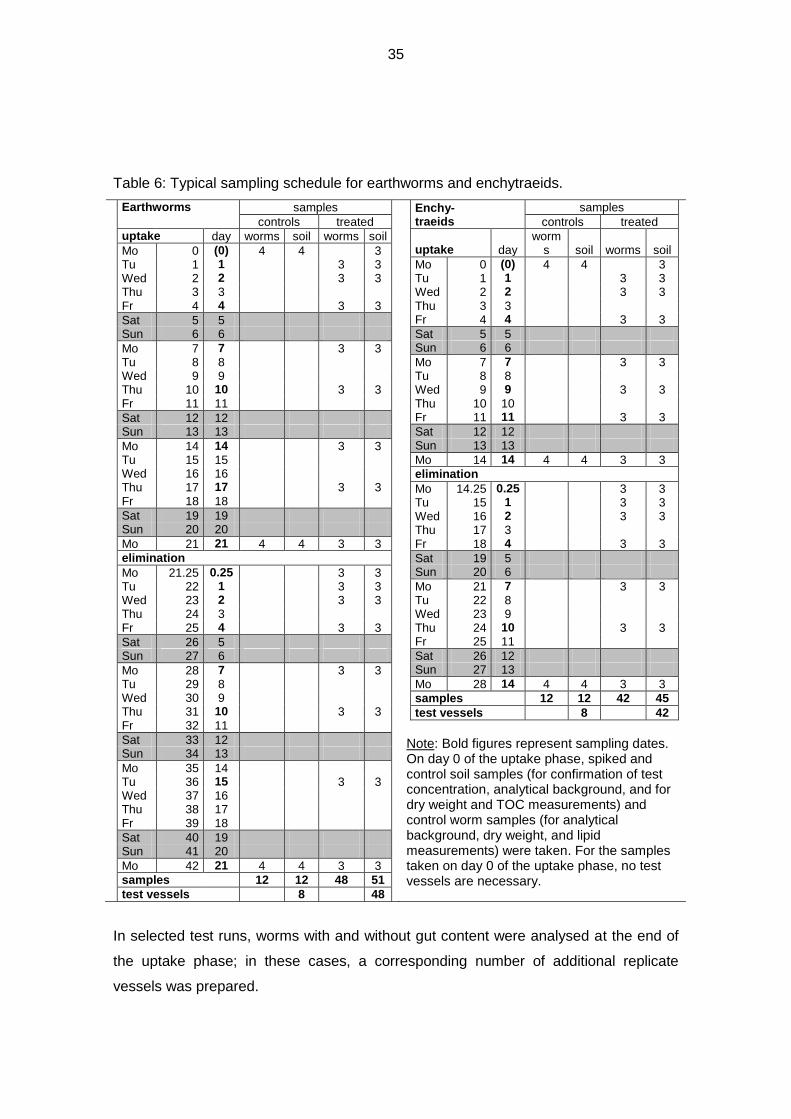
Table 6: Typical sampling schedule for earthworms and enchytraeids.
Earthworms samples
controls treated
uptake day worms soil worms soil
Mo 0 (0) 4 4 3 Tu 1 1 3 3 Wed 2 2 3 3 Thu 3 3 Fr 4 4 3 3
Sat 5 5 Sun 6 6
Mo 7 7 3 3 Tu 8 8 Wed 9 9 Thu 10 10 3 3 Fr 11 11
Sat 12 12 Sun 13 13
Mo 14 14 3 3 Tu 15 15 Wed 16 16 Thu 17 17 3 3 Fr 18 18
Sat 19 19 Sun 20 20
Mo 21 21 4 4 3 3
elimination
Mo 21.25 0.25 3 3 Tu 22 1 3 3 Wed 23 2 3 3 Thu 24 3 Fr 25 4 3 3
Sat 26 5 Sun 27 6
Mo 28 7 3 3 Tu 29 8 Wed 30 9 Thu 31 10 3 3 Fr 32 11
Sat 33 12 Sun 34 13
Mo 35 14 Tu 36 15 3 3 Wed 37 16 Thu 38 17 Fr 39 18
Sat 40 19 Sun 41 20
Mo 42 21 4 4 3 3
samples 12 12 48 51
test vessels 8 48
Enchy-traeids
samples
controls treated
uptake day worm
s soil worms soil
Mo 0 (0) 4 4 3 Tu 1 1 3 3 Wed 2 2 3 3 Thu 3 3 Fr 4 4 3 3
Sat 5 5 Sun 6 6
Mo 7 7 3 3 Tu 8 8 Wed 9 9 3 3 Thu 10 10 Fr 11 11 3 3
Sat 12 12 Sun 13 13
Mo 14 14 4 4 3 3
elimination
Mo 14.25 0.25 3 3 Tu 15 1 3 3 Wed 16 2 3 3 Thu 17 3 Fr 18 4 3 3
Sat 19 5 Sun 20 6
Mo 21 7 3 3 Tu 22 8 Wed 23 9 Thu 24 10 3 3 Fr 25 11
Sat 26 12 Sun 27 13
Mo 28 14 4 4 3 3
samples 12 12 42 45
test vessels 8 42
Note: Bold figures represent sampling dates. On day 0 of the uptake phase, spiked and control soil samples (for confirmation of test concentration, analytical background, and for dry weight and TOC measurements) and control worm samples (for analytical background, dry weight, and lipid measurements) were taken. For the samples taken on day 0 of the uptake phase, no test vessels are necessary.
In selected test runs, worms with and without gut content were analysed at the end of
the uptake phase; in these cases, a corresponding number of additional replicate
vessels was prepared.
36
6.4.1 Maintenance during the exposure period
Daily on weekdays
Worm behaviour (e.g. burrowing behaviour/soil avoidance) was checked visually. If a
closed test system was used, aeration was checked, and adjusted, if necessary.
Once per week
The moisture of the soil was controlled by re-weighing each test vessel and if
necessary adjusted to the initial value with deionised water.
Measurement of at least the following parameters was required:
temperature in test room (at least at start and end of uptake and elimination phase,
preferably online measurement at least once daily)
control and adjustment of test vessel weight (at start of uptake and elimination phase,
and once per week)
soil pH (at start and at end of uptake and elimination phase)
water holding capacity (for each batch of soil)
soil dry matter and soil moisture (for each batch of soil, and at start of uptake and
elimination phase)
soil total organic carbon (for each batch of soil)
worm dry weight to wet weight ratio (at least at start of uptake phase)
lipid in worms (at least at start of uptake phase).
6.4.2 Sampling Procedures
Worms
In general, the worms were rinsed immediately after sampling to remove soil particles.
The adhering water was removed carefully without injuring the worms, e.g. by blotting
them on a pre-moistened filter prior to weighing.
The contents of each test chamber were poured onto a stainless steel tray; the worms
including any cocoons and juveniles were collected with soft steel forceps, counted and
transferred to a petri dish containing e.g. reconstituted water.
37
Earthworms Enchytraeids
were rinsed, placed on a moist filter paper to
allow gut-purging (overnight). Thereafter the
worms were transferred to pre-weighed
containers (LSC-vials), weighed (to the
nearest 1 mg), and killed by freezing.
were rinsed, placed on a pre-moistened paper
tissue to remove excess water, transferred to
pre-weighed LSC-vials, weighed (to the
nearest 1 mg), and killed by freezing.
The worm samples for metal analysis were stored dried (105°C) or freeze-dried until
analysis. The worm samples for analysis of 14C-HCB were stored frozen until analysis.
Soil
After collection of the worms, the soil of a given replicate was mixed, and for each
replicate subsamples of approximately 0.5 g soil wet weight were taken (approximately
2 g soil wet weight for cadmium analysis). The samples were transferred to pre-
weighed LSC-vials, and weighed to the nearest 1 mg to determine the wet weight;
afterwards the weighed samples were air-dried at room temperature overnight under a
fume hood, weighed (to the nearest 1 mg) and processed or stored in the freezer. The
soil samples for metal analysis were stored dried (105°C) or freeze-dried in appropriate
containers (e.g. paper envelopes) until analysis.
When required by the schedule, soil samples for pH measurement were also taken.
Trapping solutions (for 14C-HCB test with closed system only)
At least at the end of the uptake phase, the total volume of solution was recorded for
each washing bottle. 2-5 mL samples of each of the trap contents were taken and
directly processed as described in section 5.1.3.
6.4.3 Worm Dry Weight
Samples of acclimatised control worms were used to determine the dry weight of the test
organisms. At least 3 (preferably 4) aliquots of control worms were transferred to dried,
pre-weighed and labelled weigh boats (one weigh boat per replicate), weighed to the
nearest 1 mg, killed e.g. by deep-freezing, and dried overnight at 105 ± 2°C in a drying

38
cabinet. After cooling in a desiccator for 1 - 2 h, the samples were weighed again to
determine the worm dry weight.
The worm dry-to-wet weight ratio and the water content of the worms were calculated for
each aliquot:
dry-to-wet weight ratio = dry weight of sample [mg] / wet weight of sample [mg]
100[g] weightwet
[g] )dry weight - weight(wet weight wetof % in content water
6.4.4 Worm Lipid Content
At least 3 (preferably 4) separate samples of gut-purged control worms designated for
dry weight (dw), and at least 3 (preferably 4) separate samples of control worms
designated for lipid measurements were prepared (approx. 1 g wet weight (ww) per
sample) and used for determination of dry weight and lipid content of the worms.
The method according to De Boer et al. (1999) was recommended for determination of
lipid content (Flipid) of the test organisms, using non-chlorinated solvents for extraction
of lipids.
After sample processing, the resulting lipid content was calculated and expressed in
per cent of worm wet weight. The lipid content (Flipid) was calculated according to:
(lipid weight [g]) x 100
——————————— = Flipid in % ww
sample ww [g]
Using the previously measured dry weight to wet weight ratio, the lipid content could
then be converted to per cent of worm dry weight.
39
7 Data Assessment and Statistical Evaluation
This section gives an overview of the assessment and statistical evaluation of the
kinetic parameters measured in the single test runs, and on the statistical assessment
of the ring test results.
7.1 General Evaluations
The concentration in soil and worm samples was expressed in dpm/g (14C-HCB) and
mg/kg (cadmium) based on worm and soil wet and dry weight, respectively. They were
obtained by dividing the amount of test compound in the sample (dpm: corrected for
background activity) by sample weight in g. The concentration in worm samples was
then divided by the concentration in the soil of the corresponding sampling vessel to
result in the bioaccumulation factor (BAF) for each specific sampling date of the uptake
phase.
Body residues in earthworms worms with and without gut content were analysed using
one-way Analysis of Variance (ANOVA; p ≤ 0.05). Since the enchytraeids were not
allowed to purge their gut contents after sampling, the measured body concentration
includes residues bound to soil present in the gastro-intestinal tract. Information on the
influence of gut-associated residues on the total body concentration in the worms can
be obtained from the concentration in worms after the initial 4 - 6 hours of the
elimination phase. The difference between the concentration in the worms at the end of
the uptake phase and the concentration in the worms after the initial 4 - 6 hours of the
elimination phase can be assigned to gut-soil bound residues. In addition, a
comparison was made between purged and non-purged worms sampled at the end of
the uptake phase of selected test runs.
The main parameters evaluated statistically were the uptake and elimination kinetics
(see sections 7.2 and 7.3). The software package SPSS 11.5 was used for the
statistical calculations.
The Non-Eliminated Residues (NER) were calculated as a secondary endpoint by
multiplying the ratio of the average concentration in the worms (Ca) at the end of the
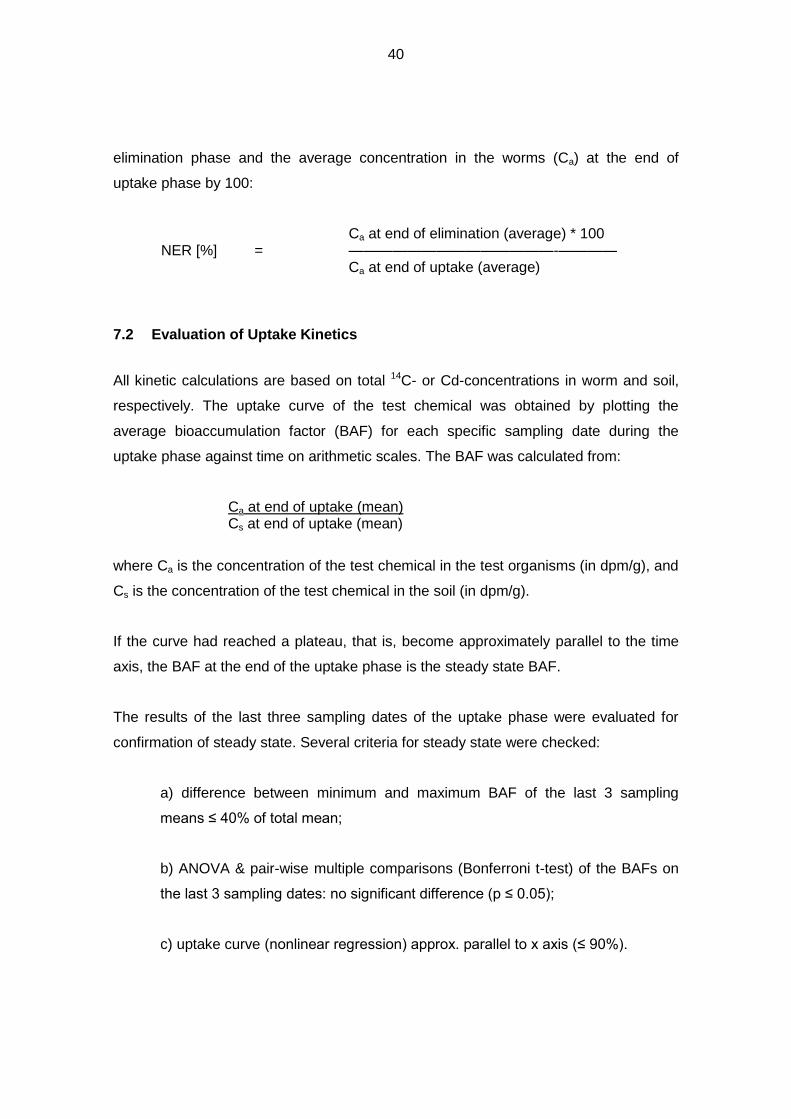
40
elimination phase and the average concentration in the worms (Ca) at the end of
uptake phase by 100:
Ca at end of elimination (average) * 100 NER [%] = ——————————————-————
Ca at end of uptake (average)
7.2 Evaluation of Uptake Kinetics
All kinetic calculations are based on total 14C- or Cd-concentrations in worm and soil,
respectively. The uptake curve of the test chemical was obtained by plotting the
average bioaccumulation factor (BAF) for each specific sampling date during the
uptake phase against time on arithmetic scales. The BAF was calculated from:
Ca at end of uptake (mean) Cs at end of uptake (mean)
where Ca is the concentration of the test chemical in the test organisms (in dpm/g), and
Cs is the concentration of the test chemical in the soil (in dpm/g).
If the curve had reached a plateau, that is, become approximately parallel to the time
axis, the BAF at the end of the uptake phase is the steady state BAF.
The results of the last three sampling dates of the uptake phase were evaluated for
confirmation of steady state. Several criteria for steady state were checked:
a) difference between minimum and maximum BAF of the last 3 sampling
means ≤ 40% of total mean;
b) ANOVA & pair-wise multiple comparisons (Bonferroni t-test) of the BAFs on
the last 3 sampling dates: no significant difference (p ≤ 0.05);
c) uptake curve (nonlinear regression) approx. parallel to x axis (≤ 90%).
41
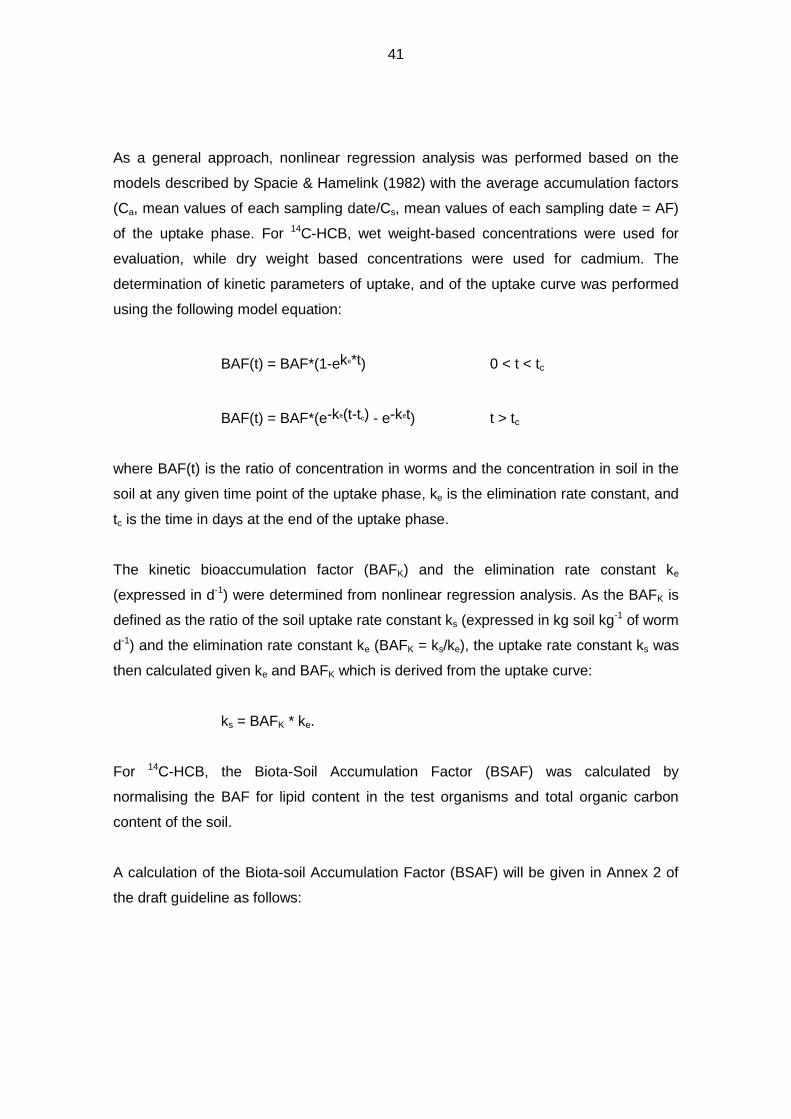
As a general approach, nonlinear regression analysis was performed based on the
models described by Spacie & Hamelink (1982) with the average accumulation factors
(Ca, mean values of each sampling date/Cs, mean values of each sampling date = AF)
of the uptake phase. For 14C-HCB, wet weight-based concentrations were used for
evaluation, while dry weight based concentrations were used for cadmium. The
determination of kinetic parameters of uptake, and of the uptake curve was performed
using the following model equation:
BAF(t) = BAF*(1-eke*t) 0 < t < tc
BAF(t) = BAF*(e-ke(t-tc) - e-ket) t > tc
where BAF(t) is the ratio of concentration in worms and the concentration in soil in the
soil at any given time point of the uptake phase, ke is the elimination rate constant, and
tc is the time in days at the end of the uptake phase.
The kinetic bioaccumulation factor (BAFK) and the elimination rate constant ke
(expressed in d-1) were determined from nonlinear regression analysis. As the BAFK is
defined as the ratio of the soil uptake rate constant ks (expressed in kg soil kg-1 of worm
d-1) and the elimination rate constant ke (BAFK = ks/ke), the uptake rate constant ks was
then calculated given ke and BAFK which is derived from the uptake curve:
ks = BAFK * ke.
For 14C-HCB, the Biota-Soil Accumulation Factor (BSAF) was calculated by
normalising the BAF for lipid content in the test organisms and total organic carbon
content of the soil.
A calculation of the Biota-soil Accumulation Factor (BSAF) will be given in Annex 2 of
the draft guideline as follows:
42
foc BSAF = BAFK* ––––––––––– flip
where foc is the fraction of soil organic carbon, and flip is the fraction of worm lipid, both
based either on dry weight or on wet weight, respectively.
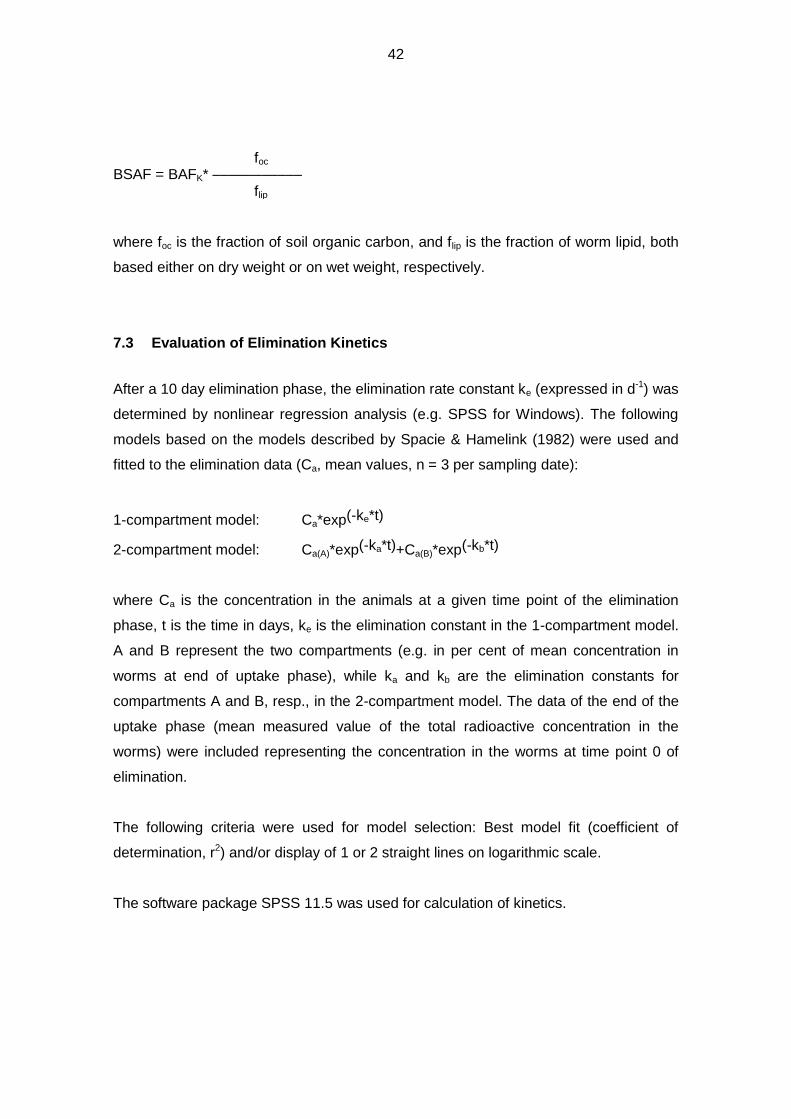
7.3 Evaluation of Elimination Kinetics
After a 10 day elimination phase, the elimination rate constant ke (expressed in d-1) was
determined by nonlinear regression analysis (e.g. SPSS for Windows). The following
models based on the models described by Spacie & Hamelink (1982) were used and
fitted to the elimination data (Ca, mean values, n = 3 per sampling date):
1-compartment model: Ca*exp(-ke*t)
2-compartment model: Ca(A)*exp(-ka*t)+Ca(B)*exp(-kb*t)
where Ca is the concentration in the animals at a given time point of the elimination
phase, t is the time in days, ke is the elimination constant in the 1-compartment model.
A and B represent the two compartments (e.g. in per cent of mean concentration in
worms at end of uptake phase), while ka and kb are the elimination constants for
compartments A and B, resp., in the 2-compartment model. The data of the end of the
uptake phase (mean measured value of the total radioactive concentration in the
worms) were included representing the concentration in the worms at time point 0 of
elimination.
The following criteria were used for model selection: Best model fit (coefficient of
determination, r2) and/or display of 1 or 2 straight lines on logarithmic scale.
The software package SPSS 11.5 was used for calculation of kinetics.
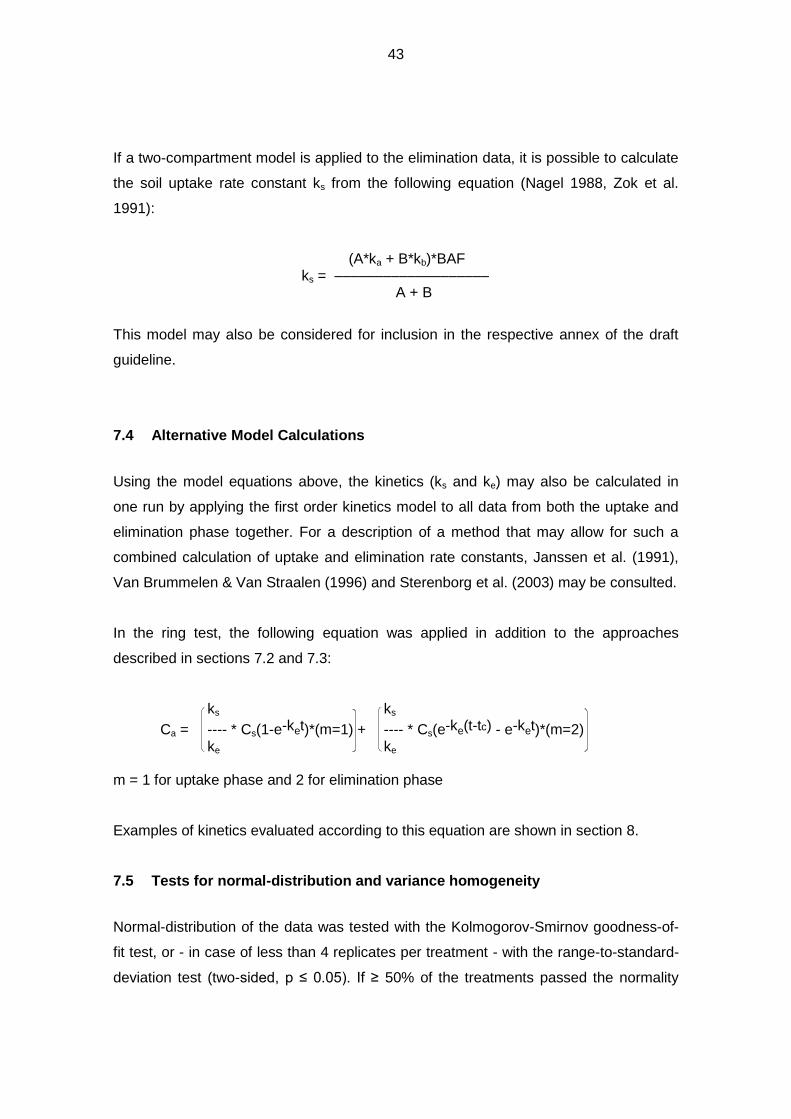
43
If a two-compartment model is applied to the elimination data, it is possible to calculate
the soil uptake rate constant ks from the following equation (Nagel 1988, Zok et al.
1991):
(A*ka + B*kb)*BAF ks = ––––––––––––––––––– A + B
This model may also be considered for inclusion in the respective annex of the draft
guideline.
7.4 Alternative Model Calculations
Using the model equations above, the kinetics (ks and ke) may also be calculated in
one run by applying the first order kinetics model to all data from both the uptake and
elimination phase together. For a description of a method that may allow for such a
combined calculation of uptake and elimination rate constants, Janssen et al. (1991),
Van Brummelen & Van Straalen (1996) and Sterenborg et al. (2003) may be consulted.
In the ring test, the following equation was applied in addition to the approaches
described in sections 7.2 and 7.3:
ks
Ca = ---- * Cs(1-e-ket)*(m=1) + ke
ks
---- * Cs(e-ke(t-tc) - e-ket)*(m=2) ke
m = 1 for uptake phase and 2 for elimination phase
Examples of kinetics evaluated according to this equation are shown in section 8.
7.5 Tests for normal-distribution and variance homogeneity
Normal-distribution of the data was tested with the Kolmogorov-Smirnov goodness-of-
fit test, or - in case of less than 4 replicates per treatment - with the range-to-standard-
deviation test (two-sided, p ≤ 0.05). If ≥ 50% of the treatments passed the normality
44
test, data were regarded normally distributed. Otherwise the data were transformed
prior to hypothesis testing. Cochran's test (two-sided, p ≤ 0.05) was used to test
variance homogeneity.
7.6 Validity Criteria in the Ring Test
The following, preliminary validity criteria were to be fulfilled according to the test
protocol used in the ring test:
The overall mortality during uptake and elimination phase or other adverse
effects/diseases in both control and treated worms should be less than 10%
(earthworms) or 20% (enchytraeids) at the end of the test (at the end of the
elimination phase).
In case of significant deviations from these validity criteria the test was not regarded as
valid. The validity criteria as given in the test protocol were revised on the basis of the
ring test results.
The preliminary validity criteria (above) were discussed and refined by the ring test
participants after evaluation of the ring test results. According to the outcome of these
discussions, the following validity criteria were adopted for the draft guideline:
At the end of the test, the overall mortality during uptake and elimination phase
should not exceed 10% (earthworms) or 20% (enchytraeids) of the total number
of the introduced worms.
For earthworms, the mean mass loss as measured at the end of the uptake and
at the end of the elimination phase should not exceed 20% compared to the
initial fresh weight (fw) for each phase.
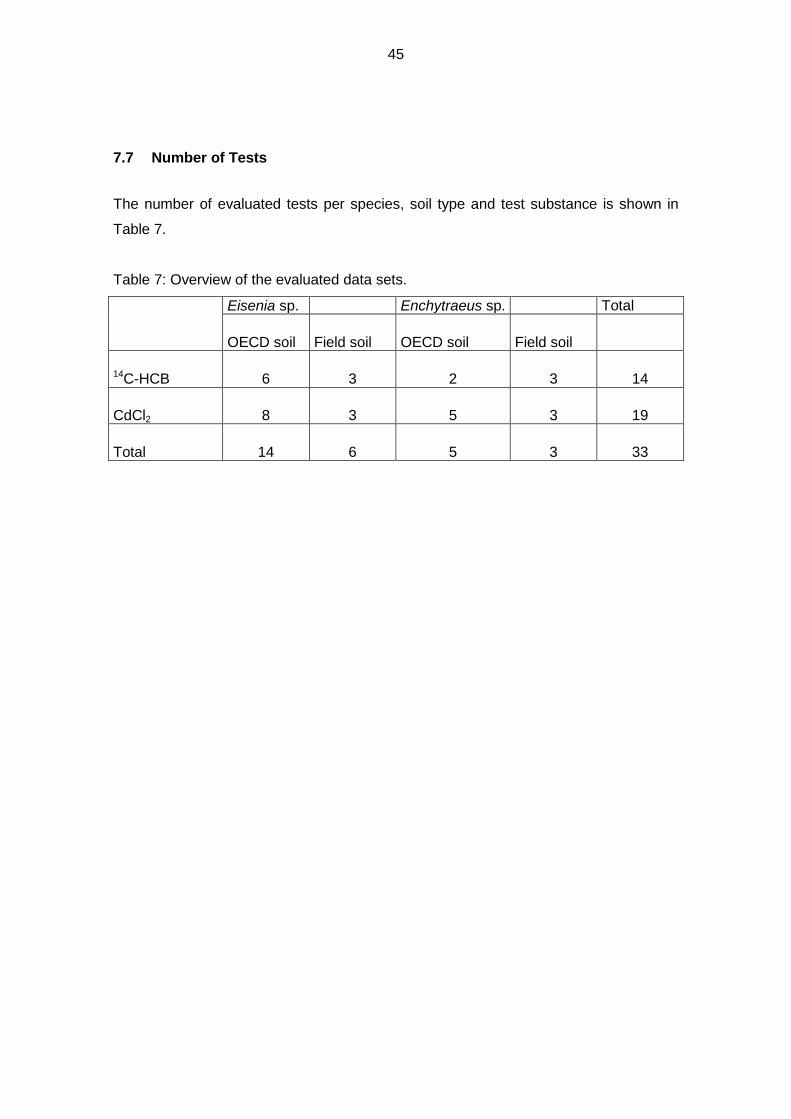
45
7.7 Number of Tests
The number of evaluated tests per species, soil type and test substance is shown in
Table 7.
Table 7: Overview of the evaluated data sets.
Eisenia sp. Enchytraeus sp. Total
OECD soil Field soil OECD soil Field soil
14C-HCB 6 3 2 3 14
CdCl2 8 3 5 3 19
Total 14 6 5 3 33
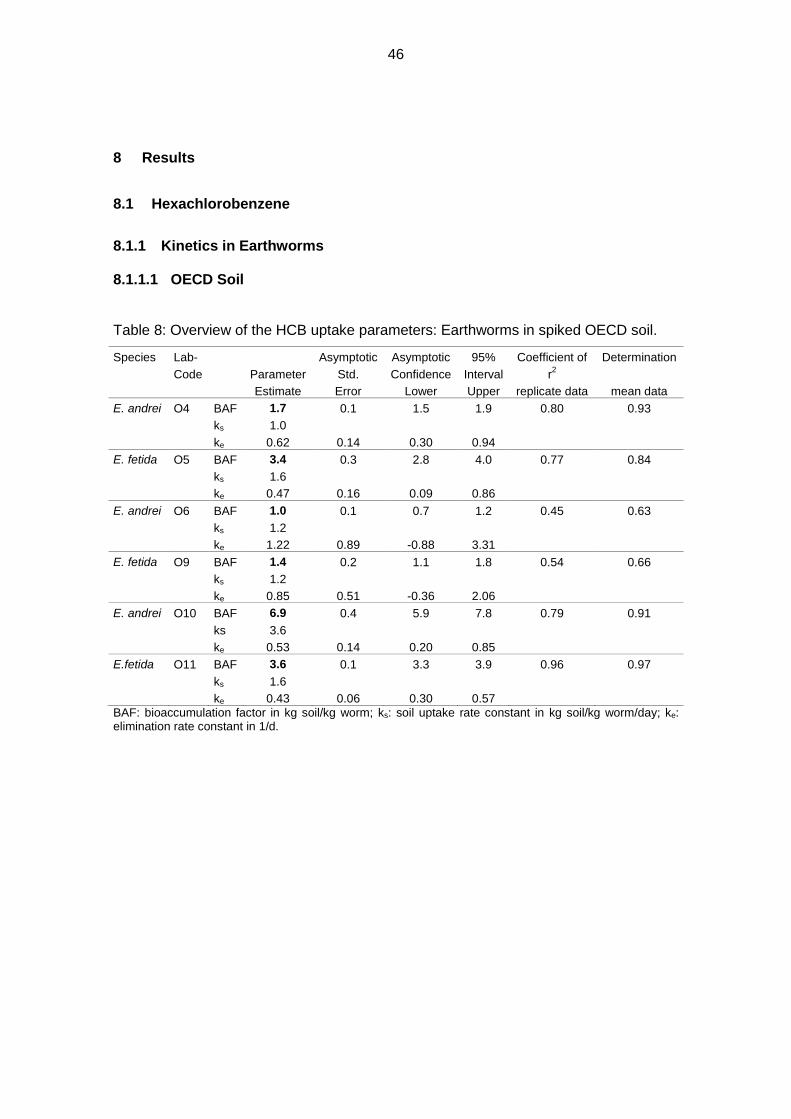
46
8 Results
8.1 Hexachlorobenzene
8.1.1 Kinetics in Earthworms 8.1.1.1 OECD Soil Table 8: Overview of the HCB uptake parameters: Earthworms in spiked OECD soil.
Species Lab- Asymptotic Asymptotic 95% Coefficient of Determination
Code Parameter Std. Confidence Interval r2
Estimate Error Lower Upper replicate data mean data
E. andrei O4 BAF 1.7 0.1 1.5 1.9 0.80 0.93
ks 1.0
ke 0.62 0.14 0.30 0.94
E. fetida O5 BAF 3.4 0.3 2.8 4.0 0.77 0.84
ks 1.6
ke 0.47 0.16 0.09 0.86
E. andrei O6 BAF 1.0 0.1 0.7 1.2 0.45 0.63
ks 1.2
ke 1.22 0.89 -0.88 3.31
E. fetida O9 BAF 1.4 0.2 1.1 1.8 0.54 0.66
ks 1.2
ke 0.85 0.51 -0.36 2.06
E. andrei O10 BAF 6.9 0.4 5.9 7.8 0.79 0.91
ks 3.6
ke 0.53 0.14 0.20 0.85
E.fetida O11 BAF 3.6 0.1 3.3 3.9 0.96 0.97
ks 1.6
ke 0.43 0.06 0.30 0.57
BAF: bioaccumulation factor in kg soil/kg worm; ks: soil uptake rate constant in kg soil/kg worm/day; ke: elimination rate constant in 1/d.
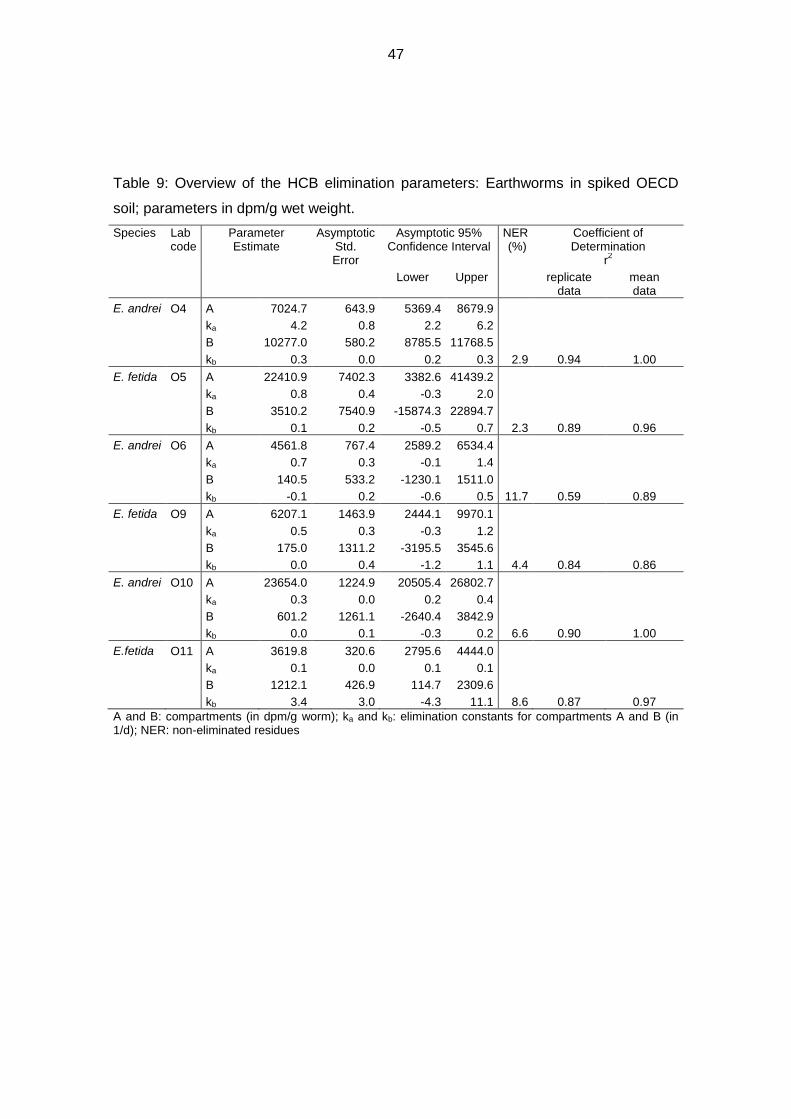
47
Table 9: Overview of the HCB elimination parameters: Earthworms in spiked OECD
soil; parameters in dpm/g wet weight.
Species Lab code
Parameter Estimate
Asymptotic Std. Error
Asymptotic 95% Confidence Interval
NER (%)
Coefficient of Determination
r2
Lower Upper replicate data
mean data
E. andrei O4 A 7024.7 643.9 5369.4 8679.9
ka 4.2 0.8 2.2 6.2
B 10277.0 580.2 8785.5 11768.5
kb 0.3 0.0 0.2 0.3 2.9 0.94 1.00
E. fetida O5 A 22410.9 7402.3 3382.6 41439.2
ka 0.8 0.4 -0.3 2.0
B 3510.2 7540.9 -15874.3 22894.7
kb 0.1 0.2 -0.5 0.7 2.3 0.89 0.96
E. andrei O6 A 4561.8 767.4 2589.2 6534.4
ka 0.7 0.3 -0.1 1.4
B 140.5 533.2 -1230.1 1511.0
kb -0.1 0.2 -0.6 0.5 11.7 0.59 0.89
E. fetida O9 A 6207.1 1463.9 2444.1 9970.1
ka 0.5 0.3 -0.3 1.2
B 175.0 1311.2 -3195.5 3545.6
kb 0.0 0.4 -1.2 1.1 4.4 0.84 0.86
E. andrei O10 A 23654.0 1224.9 20505.4 26802.7
ka 0.3 0.0 0.2 0.4
B 601.2 1261.1 -2640.4 3842.9
kb 0.0 0.1 -0.3 0.2 6.6 0.90 1.00
E.fetida O11 A 3619.8 320.6 2795.6 4444.0
ka 0.1 0.0 0.1 0.1
B 1212.1 426.9 114.7 2309.6
kb 3.4 3.0 -4.3 11.1 8.6 0.87 0.97
A and B: compartments (in dpm/g worm); ka and kb: elimination constants for compartments A and B (in 1/d); NER: non-eliminated residues
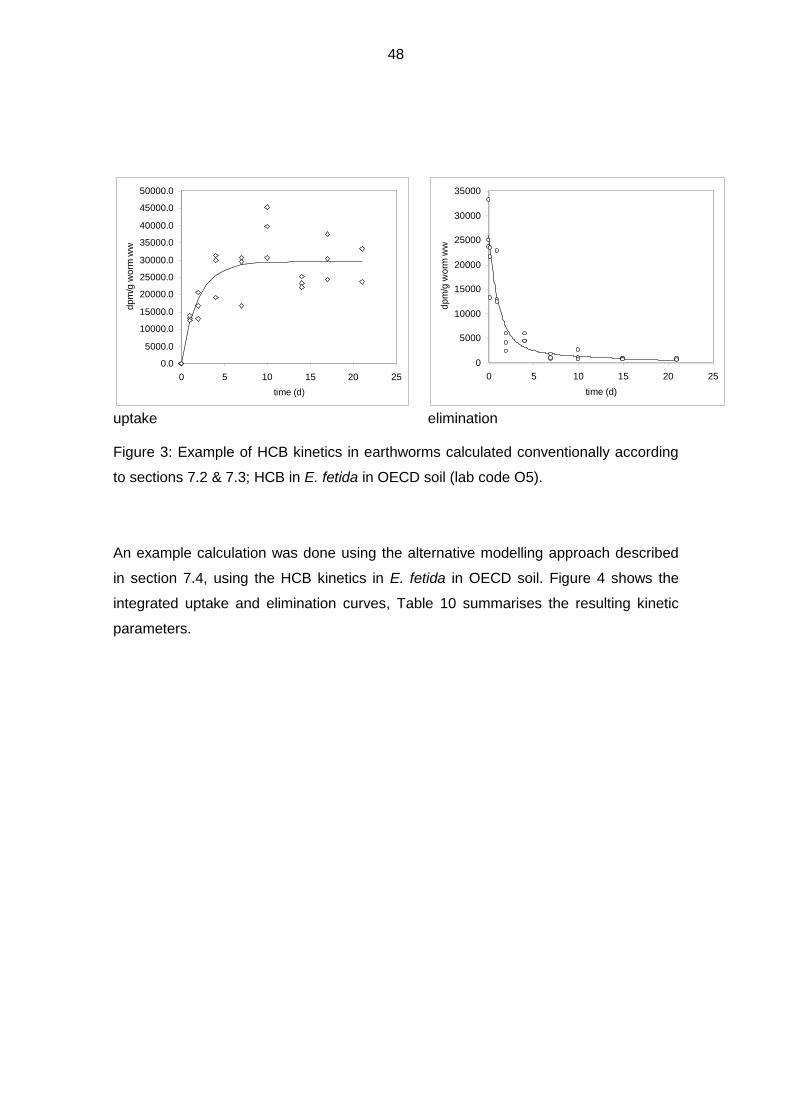
48
0.0
5000.0
10000.0
15000.0
20000.0
25000.0
30000.0
35000.0
40000.0
45000.0
50000.0
0 5 10 15 20 25
time (d)
dp
m/g
wo
rm w
w
0
5000
10000
15000
20000
25000
30000
35000
0 5 10 15 20 25
time (d)
dp
m/g
wo
rm w
w
uptake elimination Figure 3: Example of HCB kinetics in earthworms calculated conventionally according
to sections 7.2 & 7.3; HCB in E. fetida in OECD soil (lab code O5).
An example calculation was done using the alternative modelling approach described
in section 7.4, using the HCB kinetics in E. fetida in OECD soil. Figure 4 shows the
integrated uptake and elimination curves, Table 10 summarises the resulting kinetic
parameters.
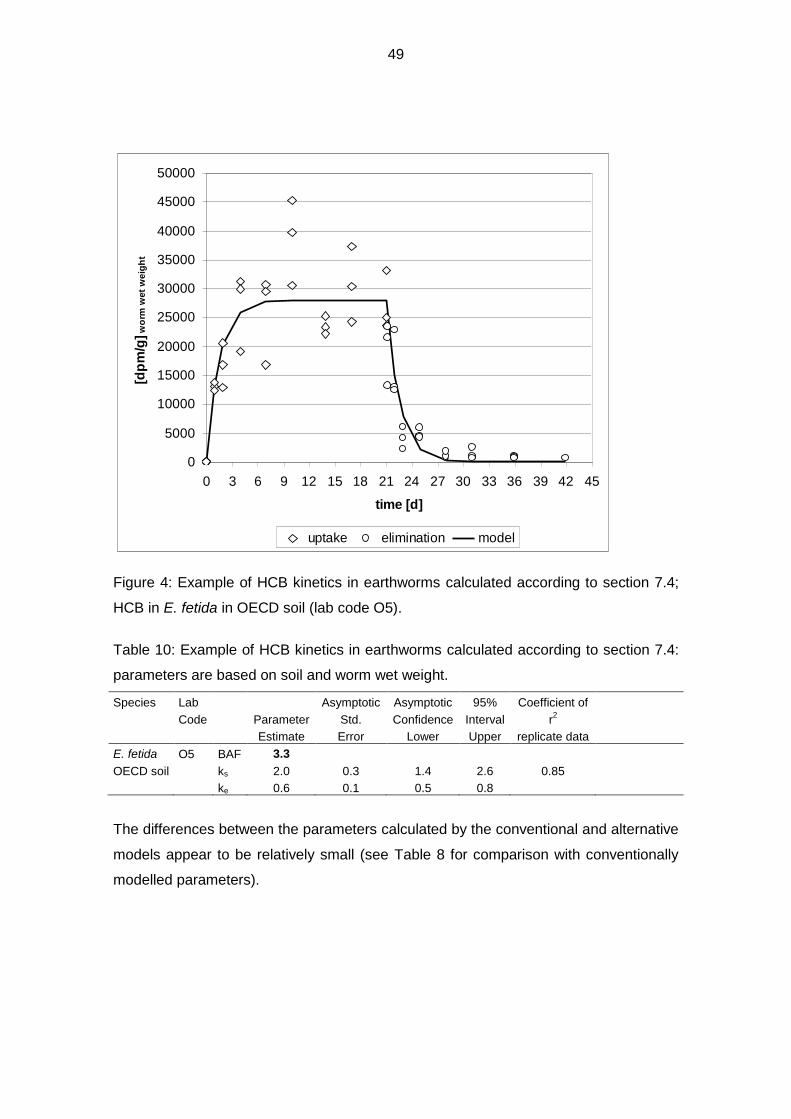
49
0
5000
10000
15000
20000
25000
30000
35000
40000
45000
50000
0 3 6 9 12 15 18 21 24 27 30 33 36 39 42 45
time [d]
[dp
m/g
] w
orm
wet
weig
ht
uptake elimination model
Figure 4: Example of HCB kinetics in earthworms calculated according to section 7.4;
HCB in E. fetida in OECD soil (lab code O5).
Table 10: Example of HCB kinetics in earthworms calculated according to section 7.4:
parameters are based on soil and worm wet weight.
Species Lab Asymptotic Asymptotic 95% Coefficient of
Code Parameter Std. Confidence Interval r2
Estimate Error Lower Upper replicate data
E. fetida O5 BAF 3.3
OECD soil ks 2.0 0.3 1.4 2.6 0.85
ke 0.6 0.1 0.5 0.8
The differences between the parameters calculated by the conventional and alternative
models appear to be relatively small (see Table 8 for comparison with conventionally
modelled parameters).
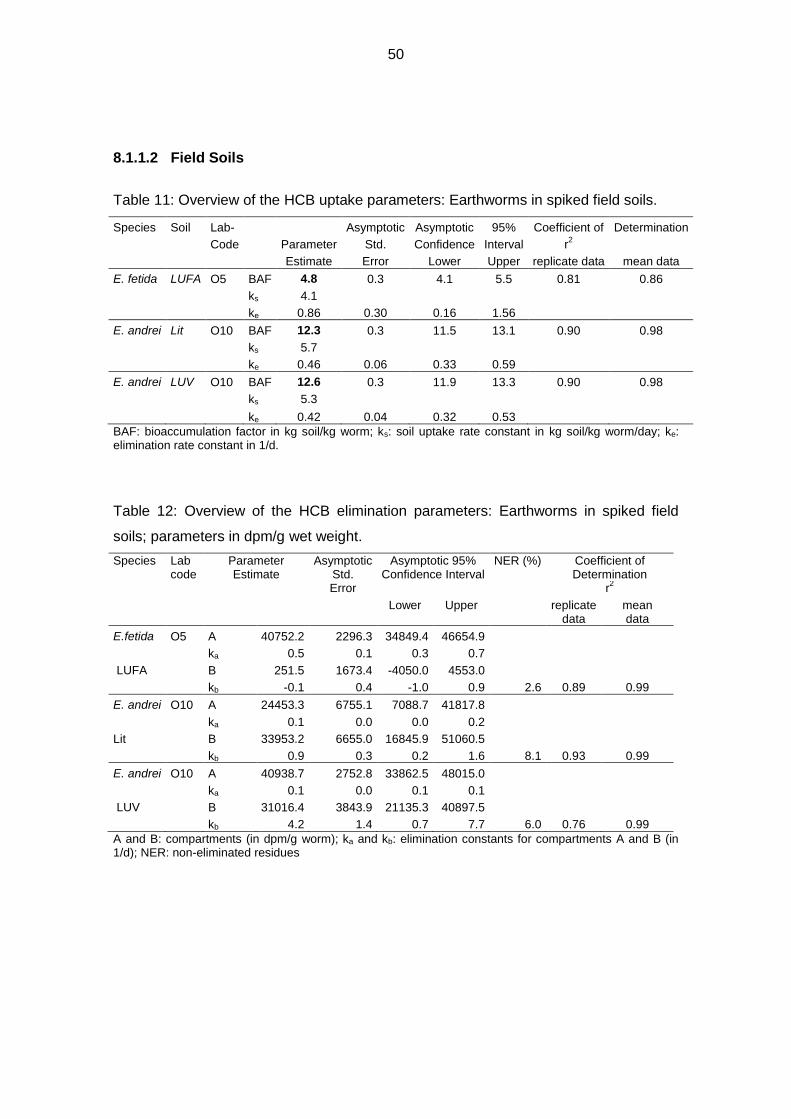
50
8.1.1.2 Field Soils
Table 11: Overview of the HCB uptake parameters: Earthworms in spiked field soils.
Species Soil Lab- Asymptotic Asymptotic 95% Coefficient of Determination
Code Parameter Std. Confidence Interval r2
Estimate Error Lower Upper replicate data mean data
E. fetida LUFA O5 BAF 4.8 0.3 4.1 5.5 0.81 0.86
ks 4.1
ke 0.86 0.30 0.16 1.56
E. andrei Lit O10 BAF 12.3 0.3 11.5 13.1 0.90 0.98
ks 5.7
ke 0.46 0.06 0.33 0.59
E. andrei LUV O10 BAF 12.6 0.3 11.9 13.3 0.90 0.98
ks 5.3
ke 0.42 0.04 0.32 0.53
BAF: bioaccumulation factor in kg soil/kg worm; ks: soil uptake rate constant in kg soil/kg worm/day; ke: elimination rate constant in 1/d.
Table 12: Overview of the HCB elimination parameters: Earthworms in spiked field
soils; parameters in dpm/g wet weight.
Species Lab code
Parameter Estimate
Asymptotic Std. Error
Asymptotic 95% Confidence Interval
NER (%) Coefficient of Determination
r2
Lower Upper replicate data
mean data
E.fetida O5 A 40752.2 2296.3 34849.4 46654.9
ka 0.5 0.1 0.3 0.7
LUFA B 251.5 1673.4 -4050.0 4553.0
kb -0.1 0.4 -1.0 0.9 2.6 0.89 0.99
E. andrei O10 A 24453.3 6755.1 7088.7 41817.8
ka 0.1 0.0 0.0 0.2
Lit B 33953.2 6655.0 16845.9 51060.5
kb 0.9 0.3 0.2 1.6 8.1 0.93 0.99
E. andrei O10 A 40938.7 2752.8 33862.5 48015.0
ka 0.1 0.0 0.1 0.1
LUV B 31016.4 3843.9 21135.3 40897.5
kb 4.2 1.4 0.7 7.7 6.0 0.76 0.99
A and B: compartments (in dpm/g worm); ka and kb: elimination constants for compartments A and B (in 1/d); NER: non-eliminated residues
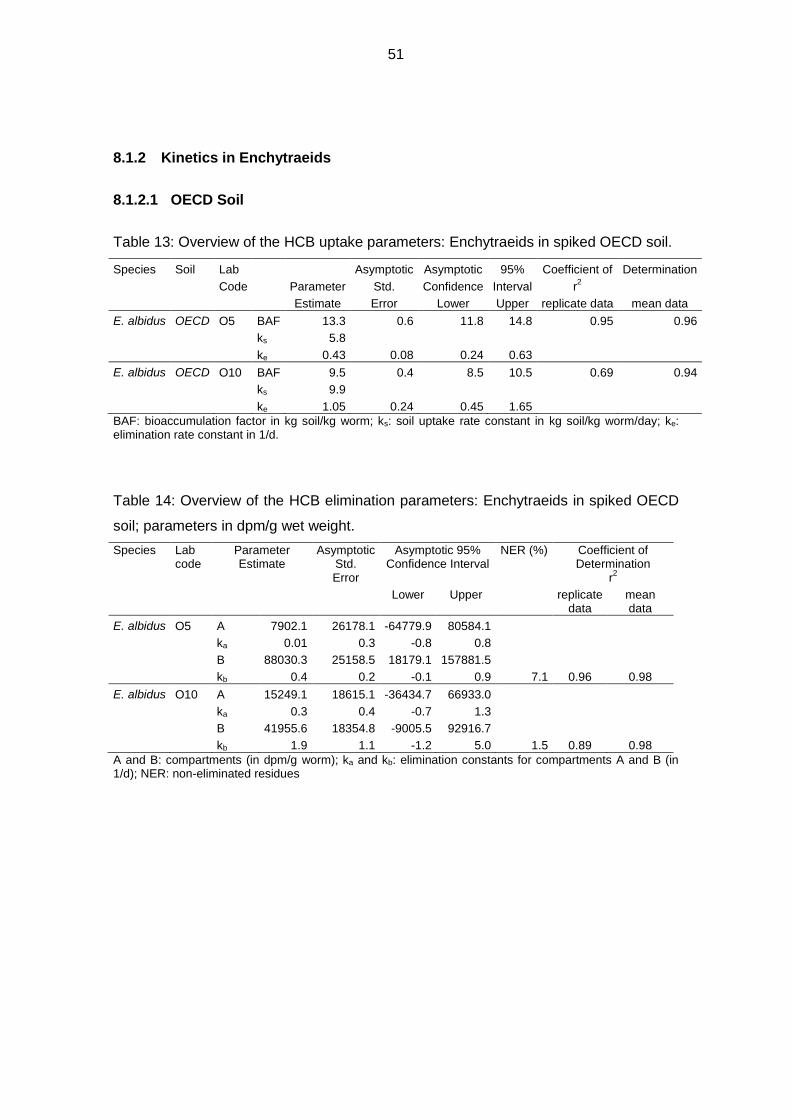
51
8.1.2 Kinetics in Enchytraeids
8.1.2.1 OECD Soil
Table 13: Overview of the HCB uptake parameters: Enchytraeids in spiked OECD soil.
Species Soil Lab Asymptotic Asymptotic 95% Coefficient of Determination
Code Parameter Std. Confidence Interval r2
Estimate Error Lower Upper replicate data mean data
E. albidus OECD O5 BAF 13.3 0.6 11.8 14.8 0.95 0.96
ks 5.8
ke 0.43 0.08 0.24 0.63
E. albidus OECD O10 BAF 9.5 0.4 8.5 10.5 0.69 0.94
ks 9.9
ke 1.05 0.24 0.45 1.65
BAF: bioaccumulation factor in kg soil/kg worm; ks: soil uptake rate constant in kg soil/kg worm/day; ke: elimination rate constant in 1/d.
Table 14: Overview of the HCB elimination parameters: Enchytraeids in spiked OECD
soil; parameters in dpm/g wet weight.
Species Lab code
Parameter Estimate
Asymptotic Std. Error
Asymptotic 95% Confidence Interval
NER (%) Coefficient of Determination
r2
Lower Upper replicate data
mean data
E. albidus O5 A 7902.1 26178.1 -64779.9 80584.1
ka 0.01 0.3 -0.8 0.8
B 88030.3 25158.5 18179.1 157881.5
kb 0.4 0.2 -0.1 0.9 7.1 0.96 0.98
E. albidus O10 A 15249.1 18615.1 -36434.7 66933.0
ka 0.3 0.4 -0.7 1.3
B 41955.6 18354.8 -9005.5 92916.7
kb 1.9 1.1 -1.2 5.0 1.5 0.89 0.98
A and B: compartments (in dpm/g worm); ka and kb: elimination constants for compartments A and B (in 1/d); NER: non-eliminated residues
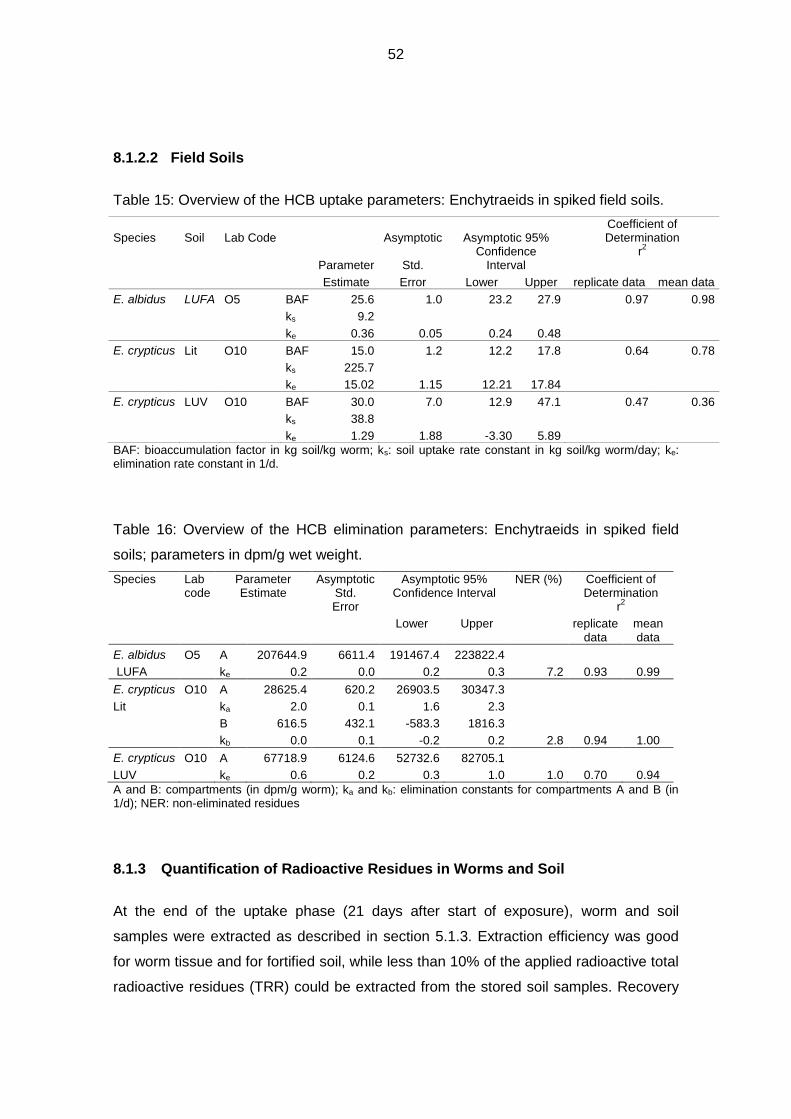
52
8.1.2.2 Field Soils
Table 15: Overview of the HCB uptake parameters: Enchytraeids in spiked field soils.
Species Soil Lab Code Asymptotic Asymptotic 95% Coefficient of Determination
Parameter Std. Confidence
Interval r2
Estimate Error Lower Upper replicate data mean data
E. albidus LUFA O5 BAF 25.6 1.0 23.2 27.9 0.97 0.98
ks 9.2
ke 0.36 0.05 0.24 0.48
E. crypticus Lit O10 BAF 15.0 1.2 12.2 17.8 0.64 0.78
ks 225.7
ke 15.02 1.15 12.21 17.84
E. crypticus LUV O10 BAF 30.0 7.0 12.9 47.1 0.47 0.36
ks 38.8
ke 1.29 1.88 -3.30 5.89
BAF: bioaccumulation factor in kg soil/kg worm; ks: soil uptake rate constant in kg soil/kg worm/day; ke: elimination rate constant in 1/d.
Table 16: Overview of the HCB elimination parameters: Enchytraeids in spiked field
soils; parameters in dpm/g wet weight.
Species Lab code
Parameter Estimate
Asymptotic Std. Error
Asymptotic 95% Confidence Interval
NER (%) Coefficient of Determination
r2
Lower Upper replicate data
mean data
E. albidus O5 A 207644.9 6611.4 191467.4 223822.4
LUFA ke 0.2 0.0 0.2 0.3 7.2 0.93 0.99
E. crypticus O10 A 28625.4 620.2 26903.5 30347.3
Lit ka 2.0 0.1 1.6 2.3
B 616.5 432.1 -583.3 1816.3
kb 0.0 0.1 -0.2 0.2 2.8 0.94 1.00
E. crypticus O10 A 67718.9 6124.6 52732.6 82705.1
LUV ke 0.6 0.2 0.3 1.0 1.0 0.70 0.94
A and B: compartments (in dpm/g worm); ka and kb: elimination constants for compartments A and B (in 1/d); NER: non-eliminated residues
8.1.3 Quantification of Radioactive Residues in Worms and Soil
At the end of the uptake phase (21 days after start of exposure), worm and soil
samples were extracted as described in section 5.1.3. Extraction efficiency was good
for worm tissue and for fortified soil, while less than 10% of the applied radioactive total
radioactive residues (TRR) could be extracted from the stored soil samples. Recovery
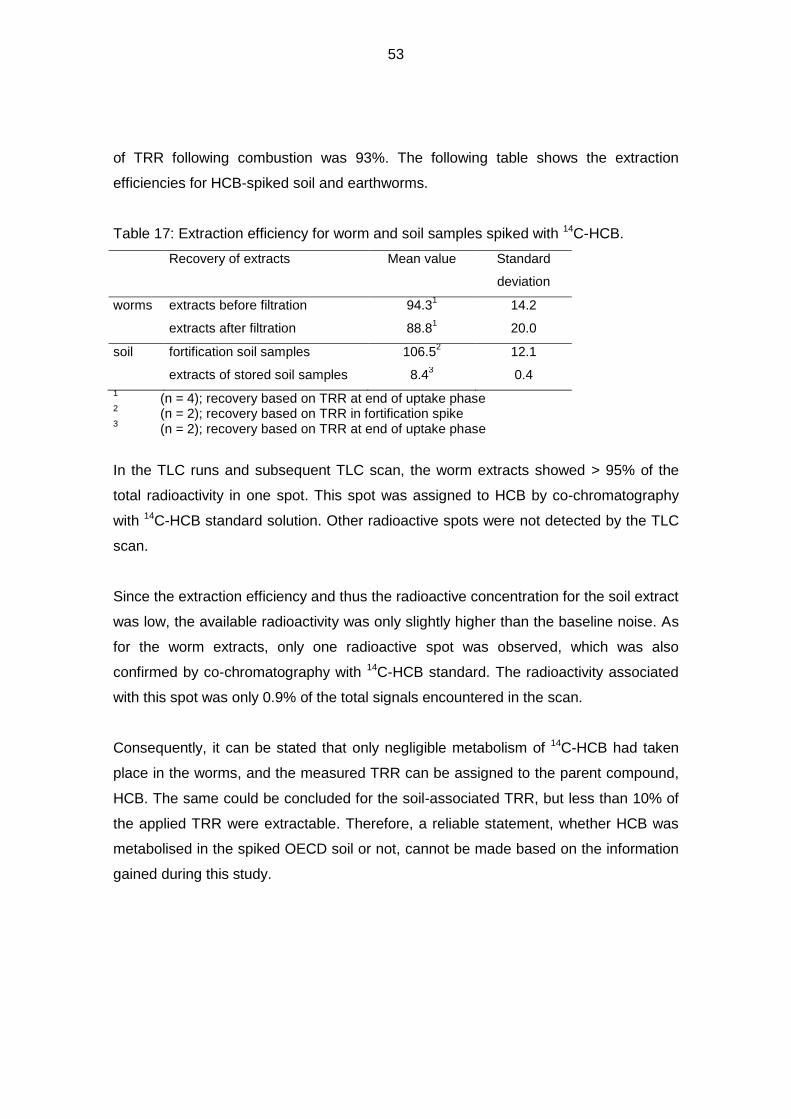
53
of TRR following combustion was 93%. The following table shows the extraction
efficiencies for HCB-spiked soil and earthworms.
Table 17: Extraction efficiency for worm and soil samples spiked with 14C-HCB.
Recovery of extracts Mean value Standard
deviation
worms extracts before filtration 94.31 14.2
extracts after filtration 88.81 20.0
soil fortification soil samples 106.52 12.1
extracts of stored soil samples 8.43 0.4
1 (n = 4); recovery based on TRR at end of uptake phase
2 (n = 2); recovery based on TRR in fortification spike
3 (n = 2); recovery based on TRR at end of uptake phase
In the TLC runs and subsequent TLC scan, the worm extracts showed > 95% of the
total radioactivity in one spot. This spot was assigned to HCB by co-chromatography
with 14C-HCB standard solution. Other radioactive spots were not detected by the TLC
scan.
Since the extraction efficiency and thus the radioactive concentration for the soil extract
was low, the available radioactivity was only slightly higher than the baseline noise. As
for the worm extracts, only one radioactive spot was observed, which was also
confirmed by co-chromatography with 14C-HCB standard. The radioactivity associated
with this spot was only 0.9% of the total signals encountered in the scan.
Consequently, it can be stated that only negligible metabolism of 14C-HCB had taken
place in the worms, and the measured TRR can be assigned to the parent compound,
HCB. The same could be concluded for the soil-associated TRR, but less than 10% of
the applied TRR were extractable. Therefore, a reliable statement, whether HCB was
metabolised in the spiked OECD soil or not, cannot be made based on the information
gained during this study.
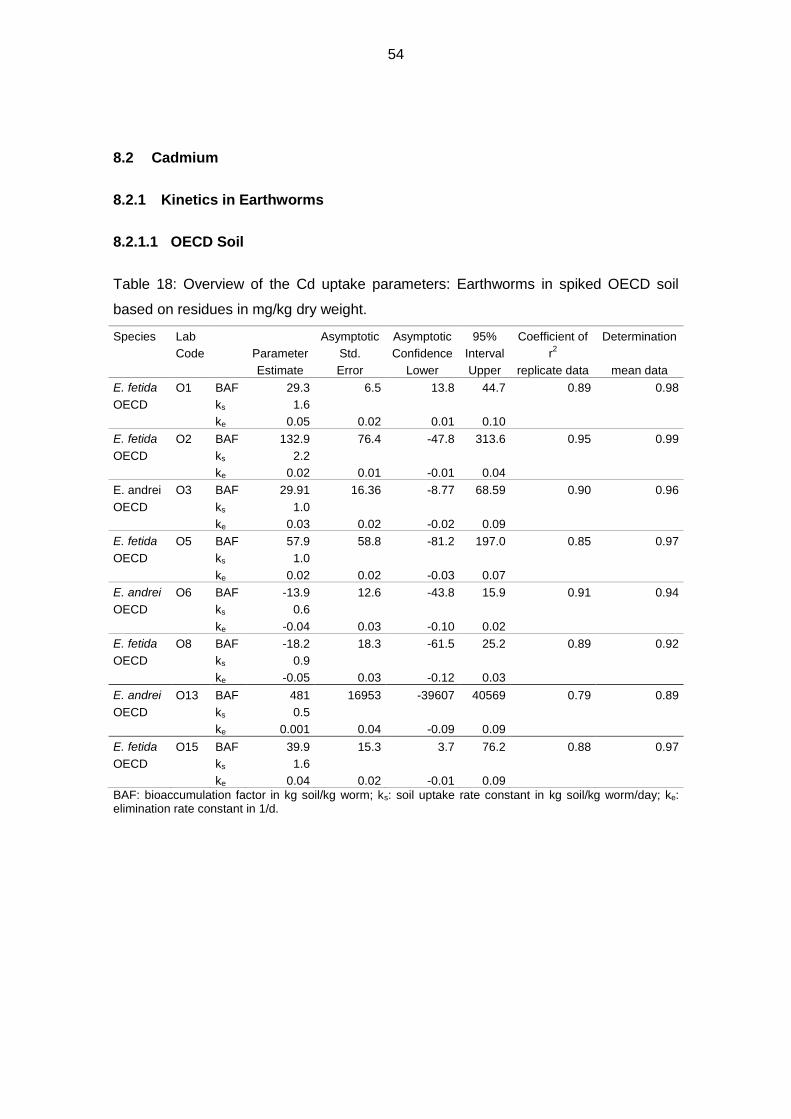
54
8.2 Cadmium
8.2.1 Kinetics in Earthworms
8.2.1.1 OECD Soil
Table 18: Overview of the Cd uptake parameters: Earthworms in spiked OECD soil
based on residues in mg/kg dry weight.
Species Lab Asymptotic Asymptotic 95% Coefficient of Determination
Code Parameter Std. Confidence Interval r2
Estimate Error Lower Upper replicate data mean data
E. fetida O1 BAF 29.3 6.5 13.8 44.7 0.89 0.98
OECD ks 1.6
ke 0.05 0.02 0.01 0.10
E. fetida O2 BAF 132.9 76.4 -47.8 313.6 0.95 0.99
OECD ks 2.2
ke 0.02 0.01 -0.01 0.04
E. andrei O3 BAF 29.91 16.36 -8.77 68.59 0.90 0.96
OECD ks 1.0
ke 0.03 0.02 -0.02 0.09
E. fetida O5 BAF 57.9 58.8 -81.2 197.0 0.85 0.97
OECD ks 1.0
ke 0.02 0.02 -0.03 0.07
E. andrei O6 BAF -13.9 12.6 -43.8 15.9 0.91 0.94
OECD ks 0.6
ke -0.04 0.03 -0.10 0.02
E. fetida O8 BAF -18.2 18.3 -61.5 25.2 0.89 0.92
OECD ks 0.9
ke -0.05 0.03 -0.12 0.03
E. andrei O13 BAF 481 16953 -39607 40569 0.79 0.89
OECD ks 0.5
ke 0.001 0.04 -0.09 0.09
E. fetida O15 BAF 39.9 15.3 3.7 76.2 0.88 0.97
OECD ks 1.6
ke 0.04 0.02 -0.01 0.09
BAF: bioaccumulation factor in kg soil/kg worm; ks: soil uptake rate constant in kg soil/kg worm/day; ke: elimination rate constant in 1/d.
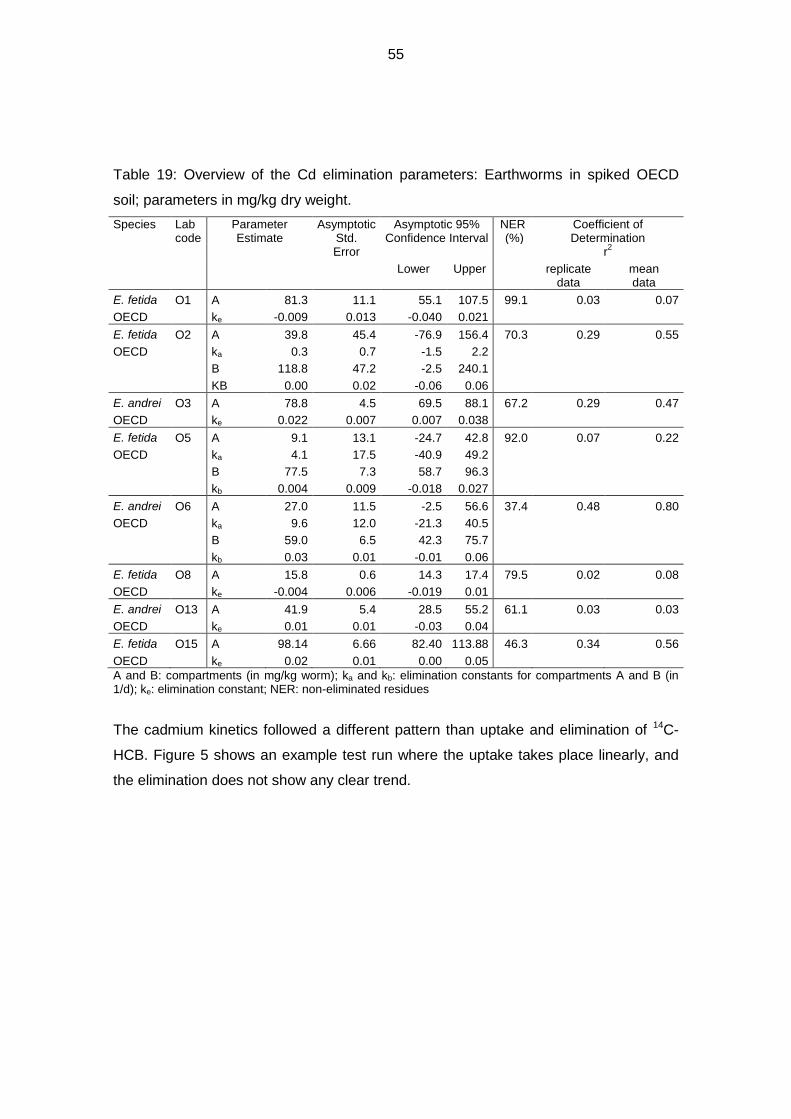
55
Table 19: Overview of the Cd elimination parameters: Earthworms in spiked OECD
soil; parameters in mg/kg dry weight.
Species Lab code
Parameter Estimate
Asymptotic Std. Error
Asymptotic 95% Confidence Interval
NER (%)
Coefficient of Determination
r2
Lower Upper replicate data
mean data
E. fetida O1 A 81.3 11.1 55.1 107.5 99.1 0.03 0.07
OECD ke -0.009 0.013 -0.040 0.021
E. fetida O2 A 39.8 45.4 -76.9 156.4 70.3 0.29 0.55
OECD ka 0.3 0.7 -1.5 2.2
B 118.8 47.2 -2.5 240.1
KB 0.00 0.02 -0.06 0.06
E. andrei O3 A 78.8 4.5 69.5 88.1 67.2 0.29 0.47
OECD ke 0.022 0.007 0.007 0.038
E. fetida O5 A 9.1 13.1 -24.7 42.8 92.0 0.07 0.22
OECD ka 4.1 17.5 -40.9 49.2
B 77.5 7.3 58.7 96.3
kb 0.004 0.009 -0.018 0.027
E. andrei O6 A 27.0 11.5 -2.5 56.6 37.4 0.48 0.80
OECD ka 9.6 12.0 -21.3 40.5
B 59.0 6.5 42.3 75.7
kb 0.03 0.01 -0.01 0.06
E. fetida O8 A 15.8 0.6 14.3 17.4 79.5 0.02 0.08
OECD ke -0.004 0.006 -0.019 0.01
E. andrei O13 A 41.9 5.4 28.5 55.2 61.1 0.03 0.03
OECD ke 0.01 0.01 -0.03 0.04
E. fetida O15 A 98.14 6.66 82.40 113.88 46.3 0.34 0.56
OECD ke 0.02 0.01 0.00 0.05
A and B: compartments (in mg/kg worm); ka and kb: elimination constants for compartments A and B (in 1/d); ke: elimination constant; NER: non-eliminated residues
The cadmium kinetics followed a different pattern than uptake and elimination of 14C-
HCB. Figure 5 shows an example test run where the uptake takes place linearly, and
the elimination does not show any clear trend.
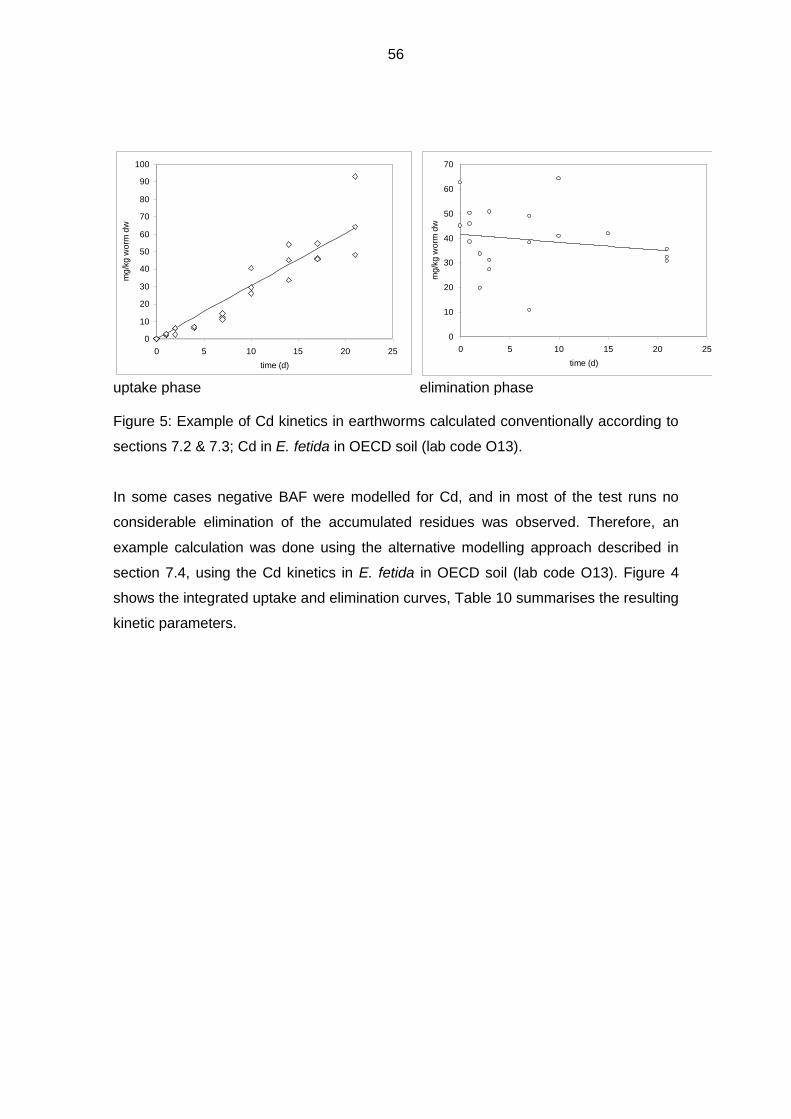
56
0
10
20
30
40
50
60
70
80
90
100
0 5 10 15 20 25
time (d)
mg
/kg
wo
rm d
w
0
10
20
30
40
50
60
70
0 5 10 15 20 25
time (d)
mg
/kg
wo
rm d
w
uptake phase elimination phase Figure 5: Example of Cd kinetics in earthworms calculated conventionally according to
sections 7.2 & 7.3; Cd in E. fetida in OECD soil (lab code O13).
In some cases negative BAF were modelled for Cd, and in most of the test runs no
considerable elimination of the accumulated residues was observed. Therefore, an
example calculation was done using the alternative modelling approach described in
section 7.4, using the Cd kinetics in E. fetida in OECD soil (lab code O13). Figure 4
shows the integrated uptake and elimination curves, Table 10 summarises the resulting
kinetic parameters.
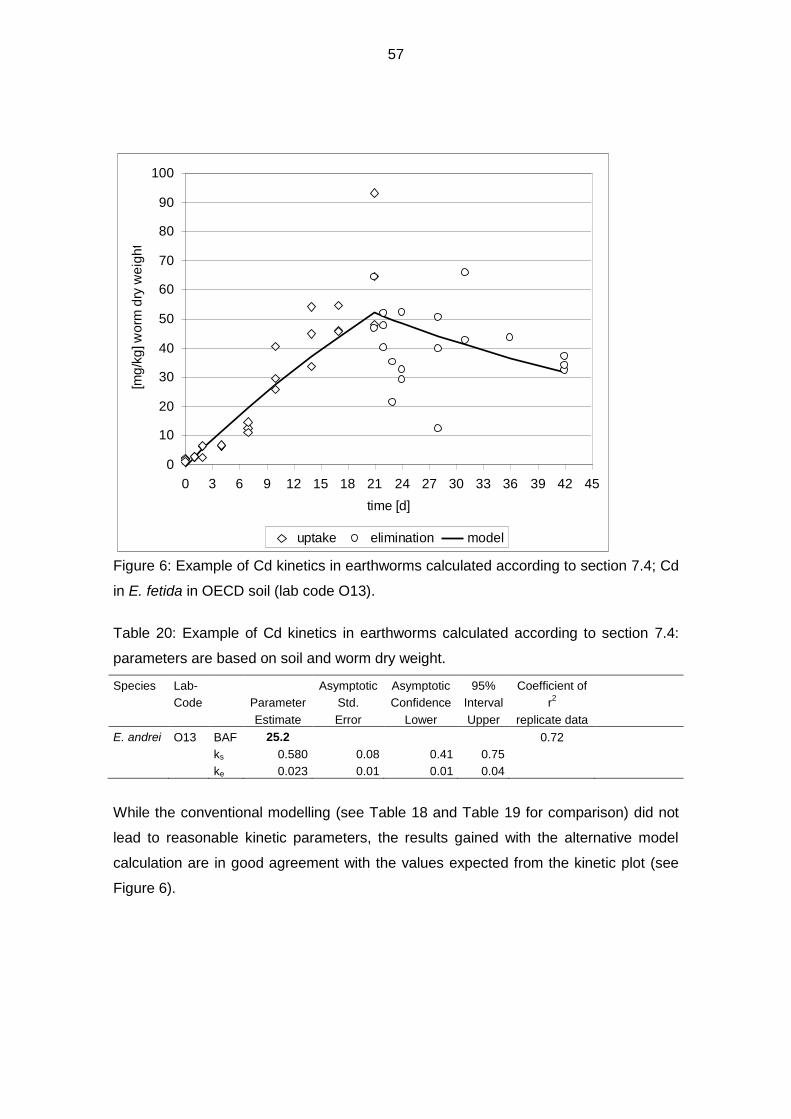
57
0
10
20
30
40
50
60
70
80
90
100
0 3 6 9 12 15 18 21 24 27 30 33 36 39 42 45
time [d]
[mg
/kg
] w
orm
dry
we
igh
t
uptake elimination model
Figure 6: Example of Cd kinetics in earthworms calculated according to section 7.4; Cd
in E. fetida in OECD soil (lab code O13).
Table 20: Example of Cd kinetics in earthworms calculated according to section 7.4:
parameters are based on soil and worm dry weight.
Species Lab- Asymptotic Asymptotic 95% Coefficient of
Code Parameter Std. Confidence Interval r2
Estimate Error Lower Upper replicate data
E. andrei O13 BAF 25.2 0.72
ks 0.580 0.08 0.41 0.75
ke 0.023 0.01 0.01 0.04
While the conventional modelling (see Table 18 and Table 19 for comparison) did not
lead to reasonable kinetic parameters, the results gained with the alternative model
calculation are in good agreement with the values expected from the kinetic plot (see
Figure 6).
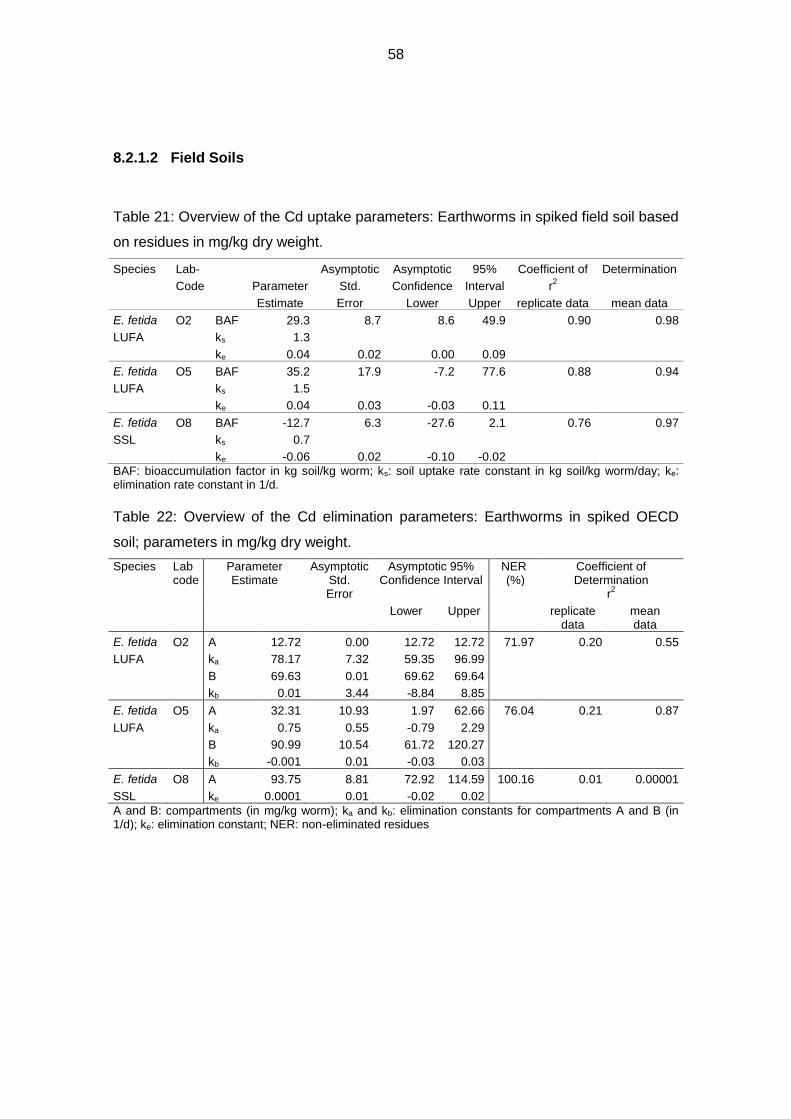
58
8.2.1.2 Field Soils
Table 21: Overview of the Cd uptake parameters: Earthworms in spiked field soil based
on residues in mg/kg dry weight.
Species Lab- Asymptotic Asymptotic 95% Coefficient of Determination
Code Parameter Std. Confidence Interval r2
Estimate Error Lower Upper replicate data mean data
E. fetida O2 BAF 29.3 8.7 8.6 49.9 0.90 0.98
LUFA ks 1.3
ke 0.04 0.02 0.00 0.09
E. fetida O5 BAF 35.2 17.9 -7.2 77.6 0.88 0.94
LUFA ks 1.5
ke 0.04 0.03 -0.03 0.11
E. fetida O8 BAF -12.7 6.3 -27.6 2.1 0.76 0.97
SSL ks 0.7
ke -0.06 0.02 -0.10 -0.02
BAF: bioaccumulation factor in kg soil/kg worm; ks: soil uptake rate constant in kg soil/kg worm/day; ke: elimination rate constant in 1/d.
Table 22: Overview of the Cd elimination parameters: Earthworms in spiked OECD
soil; parameters in mg/kg dry weight.
Species Lab code
Parameter Estimate
Asymptotic Std. Error
Asymptotic 95% Confidence Interval
NER (%)
Coefficient of Determination
r2
Lower Upper replicate data
mean data
E. fetida O2 A 12.72 0.00 12.72 12.72 71.97 0.20 0.55
LUFA ka 78.17 7.32 59.35 96.99
B 69.63 0.01 69.62 69.64
kb 0.01 3.44 -8.84 8.85
E. fetida O5 A 32.31 10.93 1.97 62.66 76.04 0.21 0.87
LUFA ka 0.75 0.55 -0.79 2.29
B 90.99 10.54 61.72 120.27
kb -0.001 0.01 -0.03 0.03
E. fetida O8 A 93.75 8.81 72.92 114.59 100.16 0.01 0.00001
SSL ke 0.0001 0.01 -0.02 0.02
A and B: compartments (in mg/kg worm); ka and kb: elimination constants for compartments A and B (in 1/d); ke: elimination constant; NER: non-eliminated residues
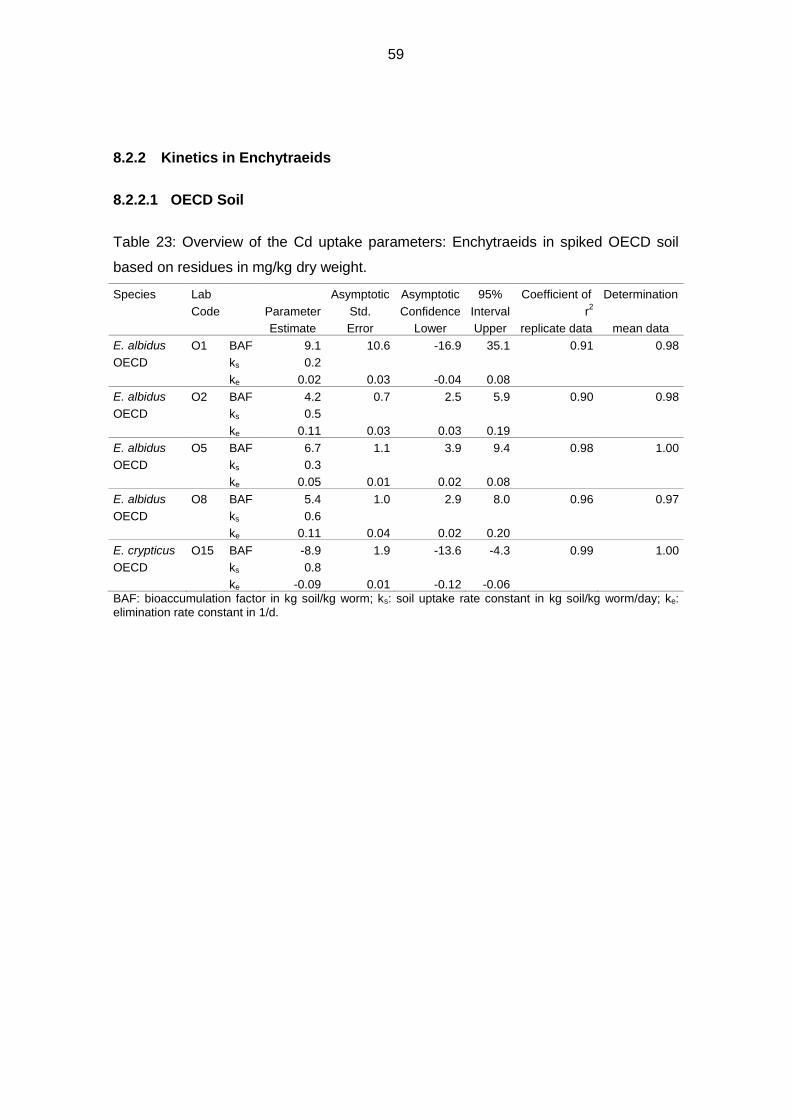
59
8.2.2 Kinetics in Enchytraeids
8.2.2.1 OECD Soil
Table 23: Overview of the Cd uptake parameters: Enchytraeids in spiked OECD soil
based on residues in mg/kg dry weight.
Species Lab Asymptotic Asymptotic 95% Coefficient of Determination
Code Parameter Std. Confidence Interval r2
Estimate Error Lower Upper replicate data mean data
E. albidus O1 BAF 9.1 10.6 -16.9 35.1 0.91 0.98
OECD ks 0.2
ke 0.02 0.03 -0.04 0.08
E. albidus O2 BAF 4.2 0.7 2.5 5.9 0.90 0.98
OECD ks 0.5
ke 0.11 0.03 0.03 0.19
E. albidus O5 BAF 6.7 1.1 3.9 9.4 0.98 1.00
OECD ks 0.3
ke 0.05 0.01 0.02 0.08
E. albidus O8 BAF 5.4 1.0 2.9 8.0 0.96 0.97
OECD ks 0.6
ke 0.11 0.04 0.02 0.20
E. crypticus O15 BAF -8.9 1.9 -13.6 -4.3 0.99 1.00
OECD ks 0.8
ke -0.09 0.01 -0.12 -0.06
BAF: bioaccumulation factor in kg soil/kg worm; ks: soil uptake rate constant in kg soil/kg worm/day; ke: elimination rate constant in 1/d.
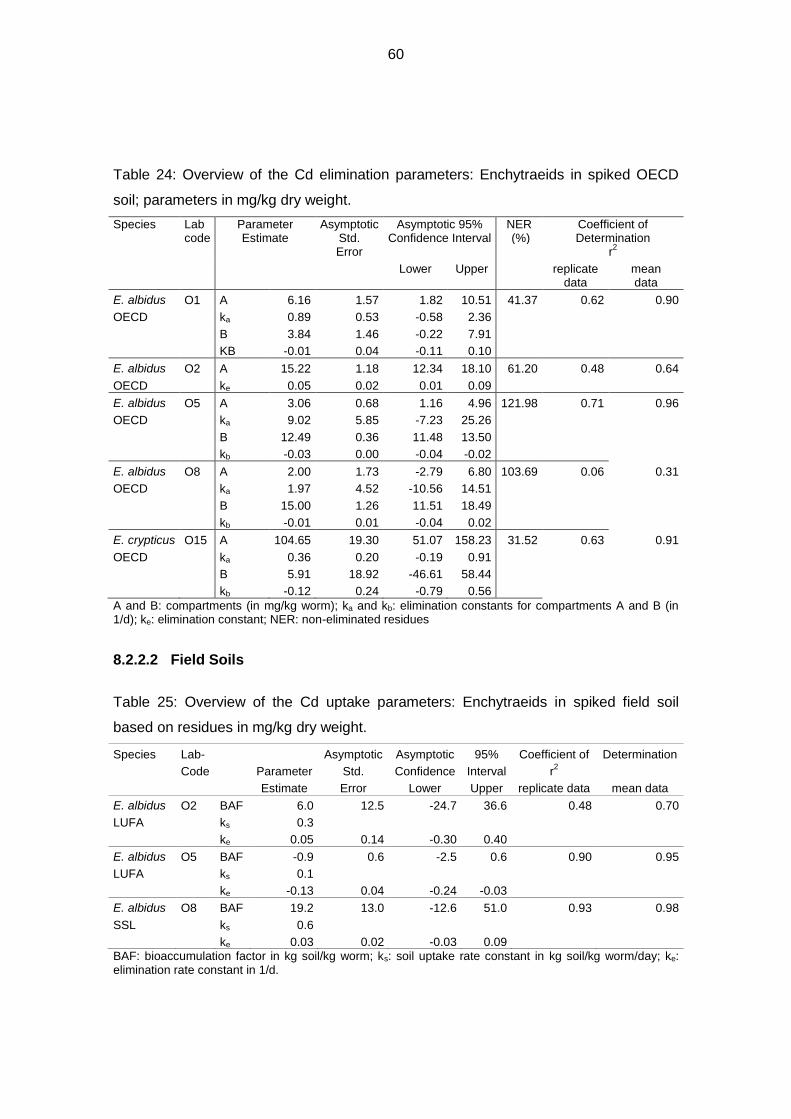
60
Table 24: Overview of the Cd elimination parameters: Enchytraeids in spiked OECD
soil; parameters in mg/kg dry weight.
Species Lab code
Parameter Estimate
Asymptotic Std. Error
Asymptotic 95% Confidence Interval
NER (%)
Coefficient of Determination
r2
Lower Upper replicate data
mean data
E. albidus O1 A 6.16 1.57 1.82 10.51 41.37 0.62 0.90
OECD ka 0.89 0.53 -0.58 2.36
B 3.84 1.46 -0.22 7.91
KB -0.01 0.04 -0.11 0.10
E. albidus O2 A 15.22 1.18 12.34 18.10 61.20 0.48 0.64
OECD ke 0.05 0.02 0.01 0.09
E. albidus O5 A 3.06 0.68 1.16 4.96 121.98 0.71 0.96
OECD ka 9.02 5.85 -7.23 25.26
B 12.49 0.36 11.48 13.50
kb -0.03 0.00 -0.04 -0.02
E. albidus O8 A 2.00 1.73 -2.79 6.80 103.69 0.06 0.31
OECD ka 1.97 4.52 -10.56 14.51
B 15.00 1.26 11.51 18.49
kb -0.01 0.01 -0.04 0.02
E. crypticus O15 A 104.65 19.30 51.07 158.23 31.52 0.63 0.91
OECD ka 0.36 0.20 -0.19 0.91
B 5.91 18.92 -46.61 58.44
kb -0.12 0.24 -0.79 0.56
A and B: compartments (in mg/kg worm); ka and kb: elimination constants for compartments A and B (in 1/d); ke: elimination constant; NER: non-eliminated residues
8.2.2.2 Field Soils
Table 25: Overview of the Cd uptake parameters: Enchytraeids in spiked field soil
based on residues in mg/kg dry weight.
Species Lab- Asymptotic Asymptotic 95% Coefficient of Determination
Code Parameter Std. Confidence Interval r2
Estimate Error Lower Upper replicate data mean data
E. albidus O2 BAF 6.0 12.5 -24.7 36.6 0.48 0.70
LUFA ks 0.3
ke 0.05 0.14 -0.30 0.40
E. albidus O5 BAF -0.9 0.6 -2.5 0.6 0.90 0.95
LUFA ks 0.1
ke -0.13 0.04 -0.24 -0.03
E. albidus O8 BAF 19.2 13.0 -12.6 51.0 0.93 0.98
SSL ks 0.6
ke 0.03 0.02 -0.03 0.09
BAF: bioaccumulation factor in kg soil/kg worm; ks: soil uptake rate constant in kg soil/kg worm/day; ke: elimination rate constant in 1/d.
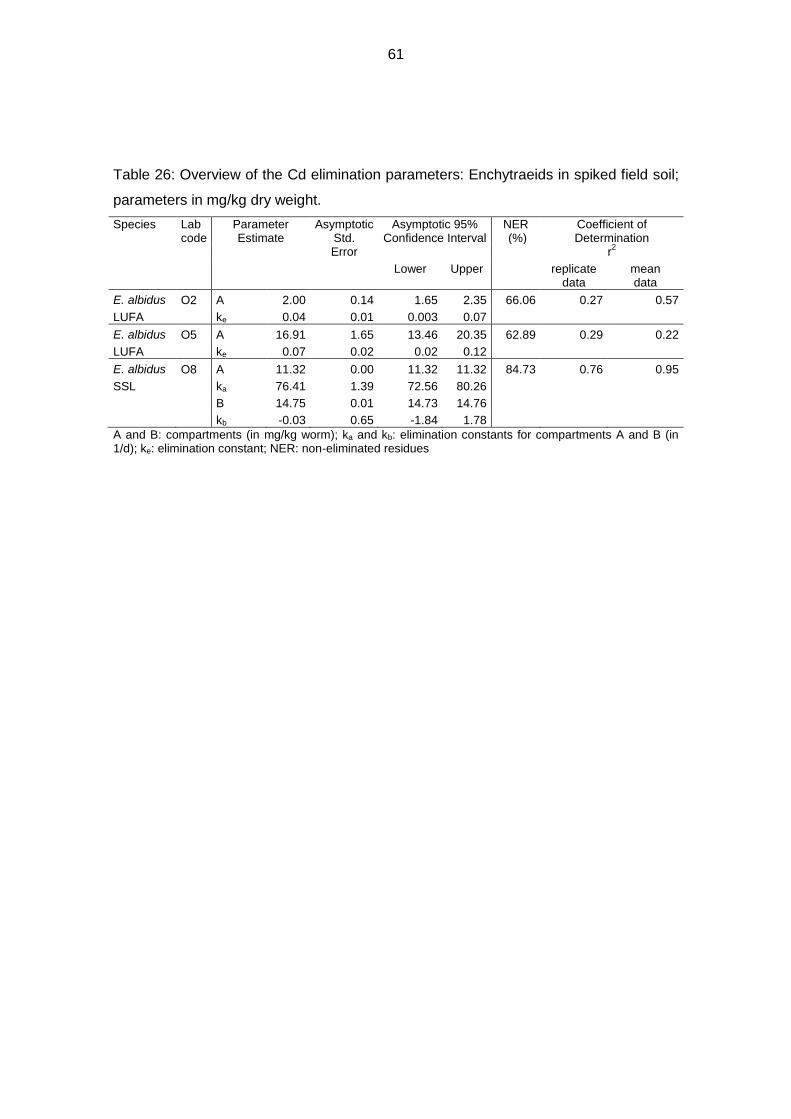
61
Table 26: Overview of the Cd elimination parameters: Enchytraeids in spiked field soil;
parameters in mg/kg dry weight.
Species Lab code
Parameter Estimate
Asymptotic Std. Error
Asymptotic 95% Confidence Interval
NER (%)
Coefficient of Determination
r2
Lower Upper replicate data
mean data
E. albidus O2 A 2.00 0.14 1.65 2.35 66.06 0.27 0.57
LUFA ke 0.04 0.01 0.003 0.07
E. albidus O5 A 16.91 1.65 13.46 20.35 62.89 0.29 0.22
LUFA ke 0.07 0.02 0.02 0.12
E. albidus O8 A 11.32 0.00 11.32 11.32 84.73 0.76 0.95
SSL ka 76.41 1.39 72.56 80.26
B 14.75 0.01 14.73 14.76
kb -0.03 0.65 -1.84 1.78
A and B: compartments (in mg/kg worm); ka and kb: elimination constants for compartments A and B (in 1/d); ke: elimination constant; NER: non-eliminated residues
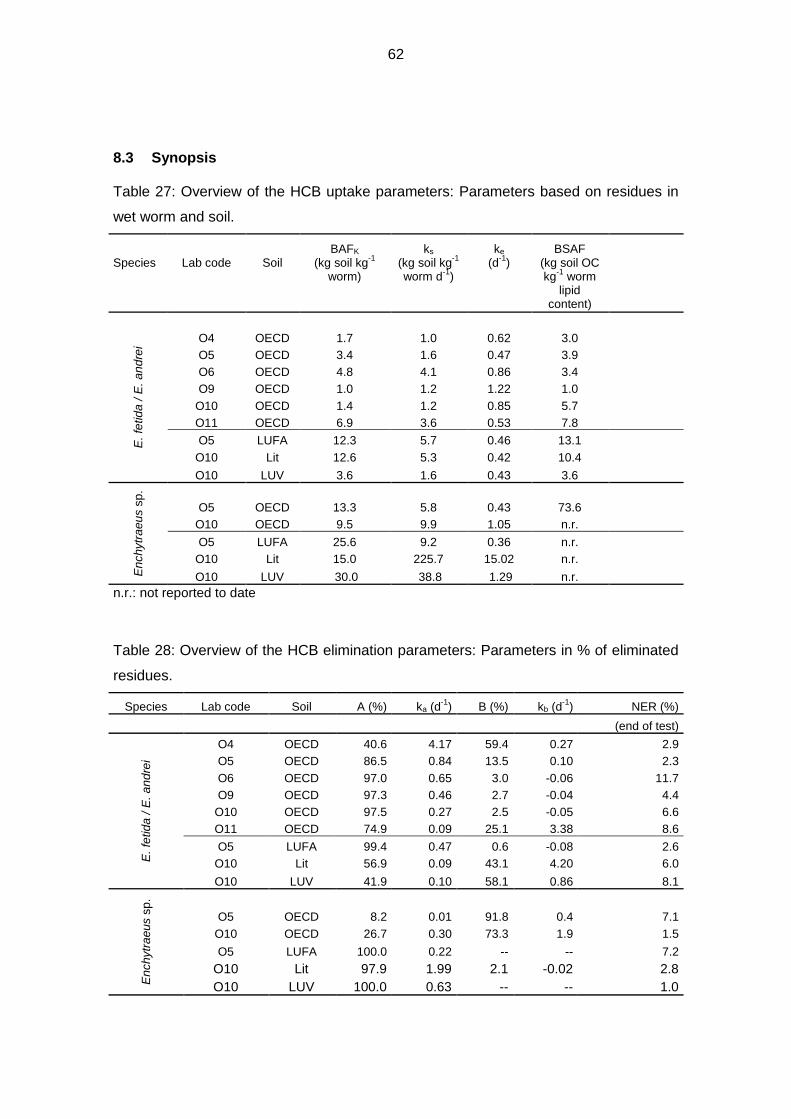
62
8.3 Synopsis Table 27: Overview of the HCB uptake parameters: Parameters based on residues in
wet worm and soil.
BAFK ks ke BSAF
Species Lab code Soil (kg soil kg-1
worm)
(kg soil kg-1
worm d
-1)
(d-1
) (kg soil OC kg
-1 worm
lipid content)
E.
fetid
a /
E. a
nd
rei
O4 OECD 1.7 1.0 0.62 3.0
O5 OECD 3.4 1.6 0.47 3.9
O6 OECD 4.8 4.1 0.86 3.4
O9 OECD 1.0 1.2 1.22 1.0
O10 OECD 1.4 1.2 0.85 5.7
O11 OECD 6.9 3.6 0.53 7.8
O5 LUFA 12.3 5.7 0.46 13.1
O10 Lit 12.6 5.3 0.42 10.4
O10 LUV 3.6 1.6 0.43 3.6
En
chytr
aeu
s s
p.
O5 OECD 13.3 5.8 0.43 73.6
O10 OECD 9.5 9.9 1.05 n.r.
O5 LUFA 25.6 9.2 0.36 n.r.
O10 Lit 15.0 225.7 15.02 n.r.
O10 LUV 30.0 38.8 1.29 n.r.
n.r.: not reported to date
Table 28: Overview of the HCB elimination parameters: Parameters in % of eliminated
residues.
Species Lab code Soil A (%) ka (d-1
) B (%) kb (d-1
) NER (%)
(end of test)
E.
fetid
a /
E. a
nd
rei
O4 OECD 40.6 4.17 59.4 0.27 2.9
O5 OECD 86.5 0.84 13.5 0.10 2.3
O6 OECD 97.0 0.65 3.0 -0.06 11.7
O9 OECD 97.3 0.46 2.7 -0.04 4.4
O10 OECD 97.5 0.27 2.5 -0.05 6.6
O11 OECD 74.9 0.09 25.1 3.38 8.6
O5 LUFA 99.4 0.47 0.6 -0.08 2.6
O10 Lit 56.9 0.09 43.1 4.20 6.0
O10 LUV 41.9 0.10 58.1 0.86 8.1
En
chytr
aeu
s s
p.
O5 OECD 8.2 0.01 91.8 0.4 7.1
O10 OECD 26.7 0.30 73.3 1.9 1.5
O5 LUFA 100.0 0.22 -- -- 7.2
O10 Lit 97.9 1.99 2.1 -0.02 2.8
O10 LUV 100.0 0.63 -- -- 1.0
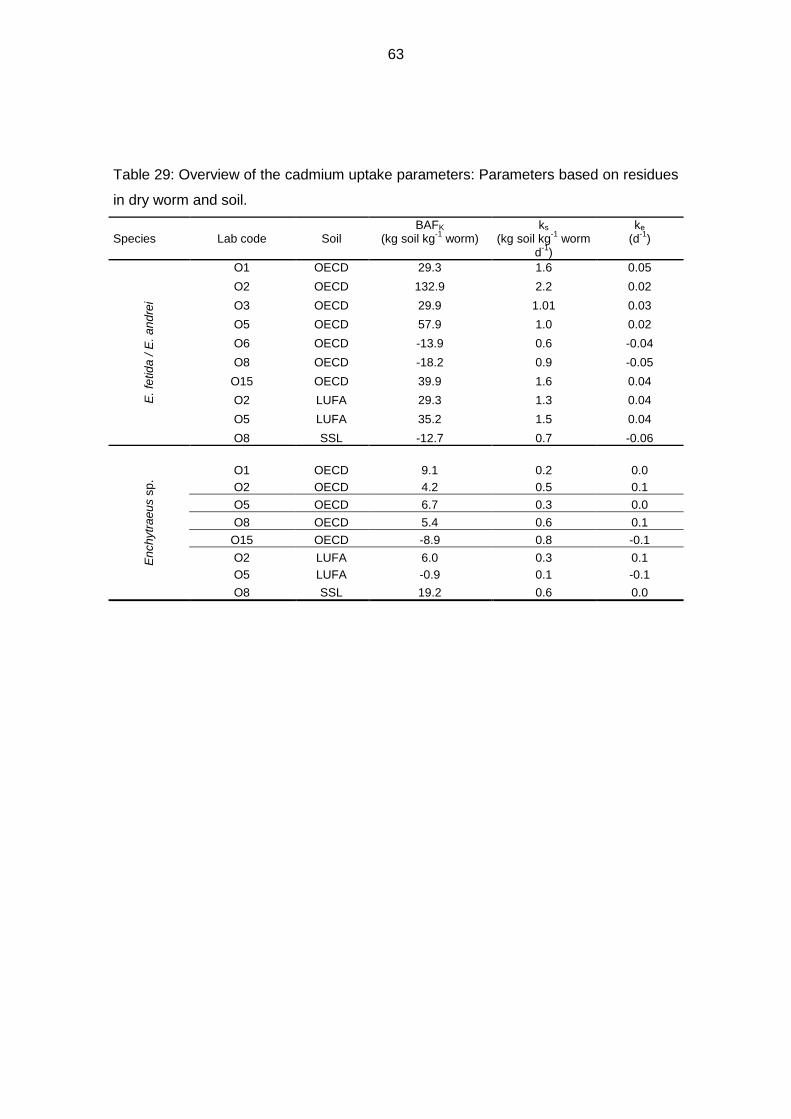
63
Table 29: Overview of the cadmium uptake parameters: Parameters based on residues
in dry worm and soil.
BAFK ks ke Species Lab code Soil (kg soil kg
-1 worm) (kg soil kg
-1 worm
d-1
) (d
-1)
E.
fetid
a /
E. a
nd
rei
O1 OECD 29.3 1.6 0.05
O2 OECD 132.9 2.2 0.02
O3 OECD 29.9 1.01 0.03
O5 OECD 57.9 1.0 0.02
O6 OECD -13.9 0.6 -0.04
O8 OECD -18.2 0.9 -0.05
O15 OECD 39.9 1.6 0.04
O2 LUFA 29.3 1.3 0.04
O5 LUFA 35.2 1.5 0.04
O8 SSL -12.7 0.7 -0.06
En
chytr
aeu
s s
p.
O1 OECD 9.1 0.2 0.0
O2 OECD 4.2 0.5 0.1
O5 OECD 6.7 0.3 0.0
O8 OECD 5.4 0.6 0.1
O15 OECD -8.9 0.8 -0.1
O2 LUFA 6.0 0.3 0.1
O5 LUFA -0.9 0.1 -0.1
O8 SSL 19.2 0.6 0.0
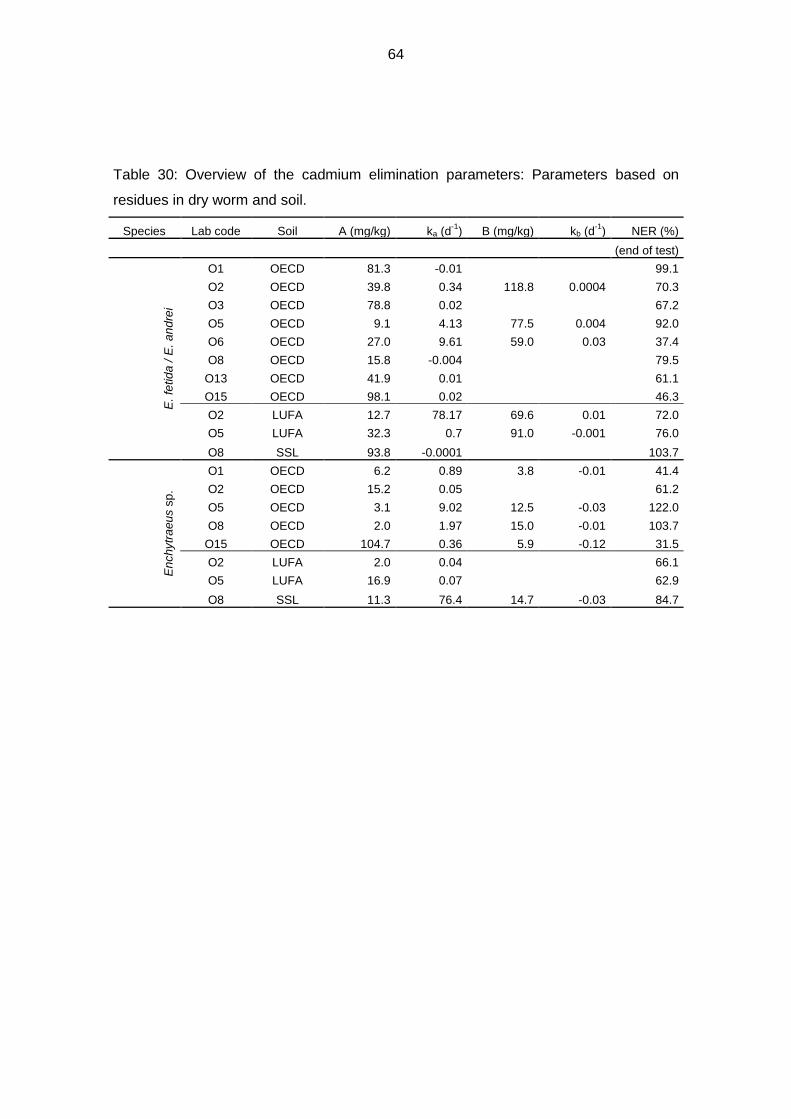
64
Table 30: Overview of the cadmium elimination parameters: Parameters based on
residues in dry worm and soil.
Species Lab code Soil A (mg/kg) ka (d-1
) B (mg/kg) kb (d-1
) NER (%)
(end of test)
E.
fetid
a /
E. a
nd
rei
O1 OECD 81.3 -0.01 99.1
O2 OECD 39.8 0.34 118.8 0.0004 70.3
O3 OECD 78.8 0.02 67.2
O5 OECD 9.1 4.13 77.5 0.004 92.0
O6 OECD 27.0 9.61 59.0 0.03 37.4
O8 OECD 15.8 -0.004 79.5
O13 OECD 41.9 0.01 61.1
O15 OECD 98.1 0.02 46.3
O2 LUFA 12.7 78.17 69.6 0.01 72.0
O5 LUFA 32.3 0.7 91.0 -0.001 76.0
O8 SSL 93.8 -0.0001 103.7
En
chytr
aeu
s s
p.
O1 OECD 6.2 0.89 3.8 -0.01 41.4
O2 OECD 15.2 0.05 61.2
O5 OECD 3.1 9.02 12.5 -0.03 122.0
O8 OECD 2.0 1.97 15.0 -0.01 103.7
O15 OECD 104.7 0.36 5.9 -0.12 31.5
O2 LUFA 2.0 0.04 66.1
O5 LUFA 16.9 0.07 62.9
O8 SSL 11.3 76.4 14.7 -0.03 84.7
65
8.4 Test Validity 8.4.1 Mortality
Earthworm mortality was kept well below 10% during the ring test runs; only in one
case, 10% was reached. The validity criterion is therefore considered acceptable.
Enchytraeid mortality was - as expected - somewhat higher than earthworm mortality.
In the test runs where enchytraeid mortalities were reported, the values range from 1%
to 38% of the initial number of worms, which exceeds the preliminary validity criterion
of 20%. This high mortality was reported mostly where E. albidus was tested in OECD
soil; reported mortalities for the other soil types and enchytraeid species were in
general much lower.
8.4.2 Weight Loss (Earthworms)
In general, the weight loss of the earthworms measured as the difference between the
initial wet weight, and the wet weight at date of sampling was less than 20% of the
initial wet weight. Therefore, a weight loss of less than 20% of the initial weight can be
considered as an indication of appropriate test conditions and is included as a critical
value in the validity criteria.
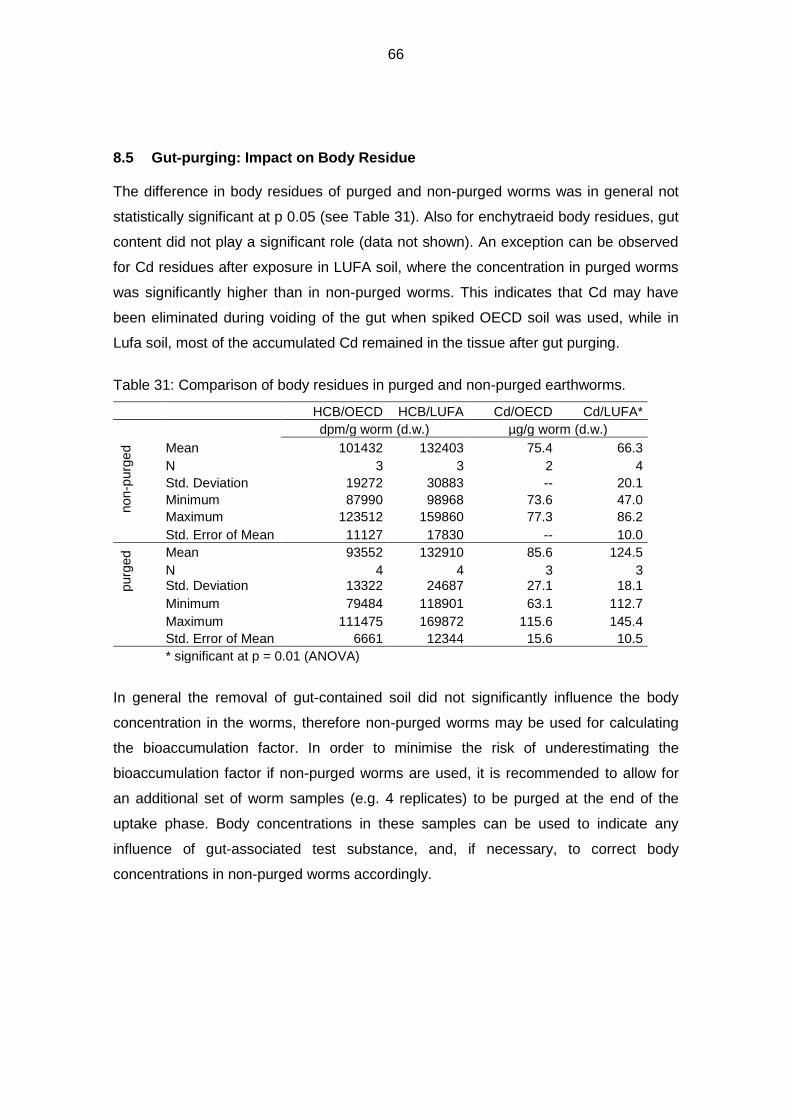
66
8.5 Gut-purging: Impact on Body Residue The difference in body residues of purged and non-purged worms was in general not
statistically significant at p 0.05 (see Table 31). Also for enchytraeid body residues, gut
content did not play a significant role (data not shown). An exception can be observed
for Cd residues after exposure in LUFA soil, where the concentration in purged worms
was significantly higher than in non-purged worms. This indicates that Cd may have
been eliminated during voiding of the gut when spiked OECD soil was used, while in
Lufa soil, most of the accumulated Cd remained in the tissue after gut purging.
Table 31: Comparison of body residues in purged and non-purged earthworms.
HCB/OECD HCB/LUFA Cd/OECD Cd/LUFA*
dpm/g worm (d.w.) µg/g worm (d.w.)
non
-purg
ed
Mean 101432 132403 75.4 66.3
N 3 3 2 4
Std. Deviation 19272 30883 -- 20.1
Minimum 87990 98968 73.6 47.0
Maximum 123512 159860 77.3 86.2
Std. Error of Mean 11127 17830 -- 10.0
purg
ed
Mean 93552 132910 85.6 124.5
N 4 4 3 3 Std. Deviation 13322 24687 27.1 18.1
Minimum 79484 118901 63.1 112.7
Maximum 111475 169872 115.6 145.4
Std. Error of Mean 6661 12344 15.6 10.5
* significant at p = 0.01 (ANOVA)
In general the removal of gut-contained soil did not significantly influence the body
concentration in the worms, therefore non-purged worms may be used for calculating
the bioaccumulation factor. In order to minimise the risk of underestimating the
bioaccumulation factor if non-purged worms are used, it is recommended to allow for
an additional set of worm samples (e.g. 4 replicates) to be purged at the end of the
uptake phase. Body concentrations in these samples can be used to indicate any
influence of gut-associated test substance, and, if necessary, to correct body
concentrations in non-purged worms accordingly.
67
9 Discussion
9.1 Test Method 9.1.1 Practicability
No major difficulties were reported by the ring rest participants. Some participants
reported losses of 14C-HCB after evaporation of the solvent during coating of the quartz
sand. In order to minimise losses, it is recommended to keep the time allowed for
evaporation of the solvent to a minimum, and to mix the coated quartz sand into the
soil immediately after the quartz sand is dry.
9.1.2 Test Species
In general, both earthworms and enchytraeids appeared suitable as test organisms.
Due to their size, earthworms were easier to handle and to weigh than the much
smaller enchytraeids.
Mortalities were low in the majority of test runs. Problems were evident when testing
enchytraeids in OECD soil. In some cases high mortalities occurred in treatment and in
controls, which were most probably associated with the moisture and/or pH of the soil.
This indicates that the soil parameters as described in section 4.3.1 need to be met
closely and monitored during the test; earthworms appeared more tolerant towards
slight variations of the mentioned soil parameters.
9.2 Non-eliminated Residues (NER)
In the ring test, 14C-HCB was lost from the worm tissue nearly completely. The non-
eliminated residues were 5.2% of the accumulated residues on average, and did not
exceed 11.7%.
With Cadmium, elimination was highly variable, and in most cases the accumulated
residues were not lost from the worms during the elimination phase. The average NER
was 73.5%; the lowest NER was 31.5%.
68
9.3 Kinetic Modelling
In this ring test, two modelling approaches were applied. In the conventional approach,
uptake and elimination kinetics are modelled separately (see sections 7.2 and 7.3). In
the alternative approach, both uptake and elimination kinetics are integrated in one
model equation (see section 7.4). It was shown that for the HCB kinetics, which
followed a first order model, both approaches led to similar results.
Cadmium did not show the uptake and elimination pattern found for HCB. In many
cases a linear increase of body residues over time was observed during the uptake
phase. Also, most of the accumulated Cd residues remained in the worms during the
elimination phase. Thus, the conventional one- or two compartment uptake and
elimination models did not lead to reasonable results. In the case of Cadmium the
alternative, combined model described the time series of data points much better,
reflecting the measured values more accurately than the conventional models. It is
therefore considered appropriate to use the combined model where the conventional
models fail, e.g. for kinetics of metals.
69
10 Conclusions
The ring test has demonstrated that the test method was practicable and produced
comparable results in the different laboratories. The mathematical tools available for
evaluation of the test results proved to be appropriate. On the basis of the ring test
protocol, the results obtained, and the discussions at the final ring test workshop, the
earlier version of the draft test guideline was revised and refined according to OECD
format.
70
11 References
ASTM (2000). Standard guide for determination of the bioaccumulation of sediment-
associated contaminants by benthic invertebrates. American Society for Testing and
Materials, E 1688 - 00a: 54 pp.
ASTM International (2000). Standard guide for conducting laboratory soil toxicity or
bioaccumulation tests with the lumbricid earthworm Eisenia fetida and the enchytraeid
potworm Enchytraeus albidus (draft). American Society for Testing and Materials, E
1676-97.
ASTM International (2004). Standard guide for conducting laboratory soil toxicity or
bioaccumulation tests with the lumbricid earthworm Eisenia fetida and the enchytraeid
potworm Enchytraeus albidus. ASTM International, E1676-04: 26 pp.
Bruns, E., Egeler, Ph., Moser, Th., Römbke, J. Scheffczyk, A., Spörlein, P. (2001a).
Standardisierung und Validierung eines Bioakkumulationstests mit terrestrischen
Oligochaeten. Abschlussbericht für das Umweltbundesamt, UBA-F+E 298 64 416.
Bruns, E., Egeler, Ph., Römbke, J. Scheffczyk, A., Spörlein, P. (2001b).
Bioaccumulation of lindane and hexachlorobenzene by the oligochaetes Enchytraeus
luxuriosus and Enchytraeus albidus (Enchytraeidae, Oligochaeta, Annelida).
Hydrobiologia 463, 185-196.
Bruns, E., Egeler, Ph., Moser, Th., Römbke, J., Scheffczyk, A., and G. Studinger
(2001c). Bioaccumulation: Soil Test Using Terrestrial Oligochaetes. Proposal for a draft
guideline according to OECD format. In: Bruns, E., Egeler, Ph., Moser, Th., Römbke, J.
Scheffczyk, A., Spörlein, P. (2001). Standardisierung und Validierung eines
Bioakkumulationstests mit terrestrischen Oligochaeten. Abschlussbericht für das
Umweltbundesamt, UBA-F+E 298 64 416.
Conder, J.M. & Lanno, R.P. (2003) Lethal critical body residues as measures of Cd,
Pb, and Zn bioavailability and toxicity in the earthworm Eisenia fetida. J. Soils
Sediments 3: 13-20.
71
Connell, D.W. & Markwell, R.D. (1990): Bioaccumulation in the Soil to Earthworm
System. Chemosphere 20: 91-100.
De Bruijn, J., Busser, F., Seinen, W. & Hermens, J. (1989). Determination of
octanol/water partition coefficients for hydrophobic organic chemicals with the "slow-
stirring" method. Environ. Toxicol. Chem. 8: 499-512.
De Boer, J., Smedes, F., Wells, D. & Allan, A. (1999): Report on the Quash
interlaboratory study on the determination of total-lipid in fish and shellfish. Round 1
SBT-2. Exercise 1000.
Didden, W. (2003): Oligochaeta. In: Bioindicators and biomonitors. Markert, B.A.,
Breure, A.M. & Zechmeister, H.G. (eds.). Elsevier Science Ltd., The Netherlands. pp.
555-576.
DIN 38414 (1985). Part 3. Schlamm und Sedimente (Gruppe S). Bestimmung des
Glührückstandes und des Glühverlustes der Trockenmasse eines Schlammes.
EC (2003). Technical Guidance Document in support of Commission Directive
93/67/EEC on Risk Assessment for new notified substances, Commission Regulation
(EC) No 1488/94 on Risk Assessment for existing substances and Directive 98/8/EC of
the European Parliament and of the Council concerning the placing of biocidal products
on the market; Part I - IV. Office for Official Publications of the EC (European
Commission), Luxembourg.
Egeler, Ph., Moser, T., Römbke, J., Gilberg, D., Scheffczyk, A. & Studinger, G. (2005).
Bioaccumulation: Soil test using terrestrial oligochaetes. Proposal for a new guideline
according to OECD format. 1st draft (2001), revised October 2005. Federal
Environmental Agency (Umweltbundesamt, UBA), Dessau-Rosslau, Germany.
EPPO (2003) Environmental Risk Assessment scheme for plant protection products.
Soil organisms and functions. EPPO (European Plant Protection Organization) (2003)
EPPO Standards. Bull. OEPP/EPPO 33: 195-208.
72
ECB (2000). Public data on high volume chemicals. European Commission, Joint
Research Centre, Institute for Health and Consumer Protection, European Chemicals
Bureau. ISDN 92-828-8647-7.
Füll, C., Schulte, C. & Kula, C. (2003): Bewertung der Auswirkungen von
Pflanzenschutzmitteln auf Regenwürmer. UWSF - Z. Umweltchem. Ökotox. 15: 78-84.
ISO (International Organization for Standardization) (1992). Soil Quality -
Determination of water retention characteristics - Laboratory methods, No. 11274. ISO,
Geneve.
ISO (International Organization for Standardization) (1993). Soil Quality –Determination
of dry matter and water content on a mass basis – Gravimetric method, No. 11465.
ISO, Geneve.
ISO (International Organization for Standardization) (1994). Soil Quality -
Determination of pH, No. 10390. ISO, Geneve.
Jager, T., Sanchez, P.A., Muijs, B., van der Welde, E & Posthuma, L. (2000):
Toxicokinetics of Polycyclic Aromatic Hydrocarbons in Eisenia andrei (Oligochaeta)
using Spiked Soil. Environ. Toxicol. Chem. 19: 953-961.
Janssen, M.P.M., A Bruins, T.H. De Vries & Van Straalen, N.M. (1991). Comparison of
cadmium kinetics in four soil arthropod species. Arch. Environ. Contam. Toxicol. 20:
305-312.
Nagel, R. (1988). Umweltchemikalien und Fische - Beiträge zu einer Bewertung.
Habilitationsschrift, Johannes Gutenberg-Universität Mainz, Germany.
OECD (1984). Guideline for the testing of chemicals no. 207; "Earthworm, acute
toxicity tests". Organisation for Economic Co-Operation and Development, Paris.
OECD (1996). Guideline for the testing of chemicals no. 305: "Bioconcentration: flow-
through fish test". Organisation for Economic Co-Operation and Development, Paris.

73
OECD (2005). Guidance document on the validation and international acceptance of
new or updated test methods for hazard assessment. OECD Environment, Health and
Safety Publications, Series on Testing and Assessment No. 34. Organisation for
Economic Co-Operation and Development, Paris.
OECD (2006). Guidance Document for the Development of OECD Guidelines for
Testing of Chemicals, Environment Monographs No. 76. Organisation for Economic
Co-Operation and Development, Paris.
Phillips, D.J.H. (1993). Bioaccumulation. In: Handbook of Ecotoxicology Vol. 1. Calow,
P. (ed.). Blackwell Scientific Publ., Oxford. 378-396.
Römbke, J., Egeler, P. & Füll, C. (1998): Literaturstudie über Bioakkumulationstests mit
Oligochaeten im terrestrischen Medium. UBA-Texte 28/98, 84 S.
Sample, B.E., Suter, D.W., Beauchamp, J.J. & Efroymson, R.A. (1999): Literature-
derived bioaccumulation models for earthworms: Development and validation. Environ.
Toxicol. Chem. 18: 2110-2120.
Spacie, A. & Hamelink, J.L. (1982). Alternative models for describing the
bioconcentration of organics in fish. Environ. Toxicol. Chem. 1, 309-320.
Sterenborg, I., Vork, N.A., Verkade, S.K., Van Gestel, C.A.M. & Van Straalen, N.M.
(2003). Dietary zinc reduces uptake but not metallothionein binding and elimination of
cadmium in the springtail Orchesella cincta. Environ. Toxicol. Chemistry 22: 1167-
1171.
U.S. EPA (2000). Methods for measuring the toxicity and bioaccumulation of sediment-
associated contaminants with freshwater invertebrates. Second Edition. EPA 600/R-
99/064, U.S. Environmental Protection Agency, Duluth, MN, March 2000.
74
Van Brummelen, T.C. & Van Straalen, N.M. (1996). Uptake and elimination of
benzo(a)pyrene in the terrestrial isopod Porcellio scaber. Arch. Environ. Contam.
Toxicol. 31: 277-285.
Zok, S., Görge, G., Kalsch, W. & Nagel, R. (1991). Bioconcentration, metabolism and
toxicity of substituted anilines in the zebrafish (Brachydanio rerio). Sci. Total
Environment 109/110: 411-421.
75
12 Annexes
Annex 1: Draft Test Guideline
Annex 2: Minutes of the final workshop: Ring Test of the Test Method:
―Bioaccumulation: Soil Test using terrestrial Oligochaetes‖ held at Coimbra/Curia,
Portugal, May 17 - 18, 2007