2021 Water System Plan Update Volume 1 of 11 (DRAFT)
340
SNOHOMISH COUNTY PUD 2021 Water System Plan Update Volume 1 of 11 (DRAFT) February 2022
-
Upload
khangminh22 -
Category
Documents
-
view
3 -
download
0
Transcript of 2021 Water System Plan Update Volume 1 of 11 (DRAFT)

S N O H O M I S H C O U N T Y P U D
2021 Water System Plan UpdateVolume 1 of 11 (DRAFT)February 2022

THIS PAGE INTENTIONALLY LEFT BLANK

DRAFT
2021 Water System Plan Update
Snohomish County PUD
February 2022
DRAFT
Murraysmith
1102 Broadway Plaza
Suite 401
Tacoma, WA 98402

DRAFT
THIS PAGE INTENTIONALLY LEFT BLANK
DRAFT
20-2733 Page A&A-i 2021 Water System Plan Update February 2022 Snohomish County PUD No. 1
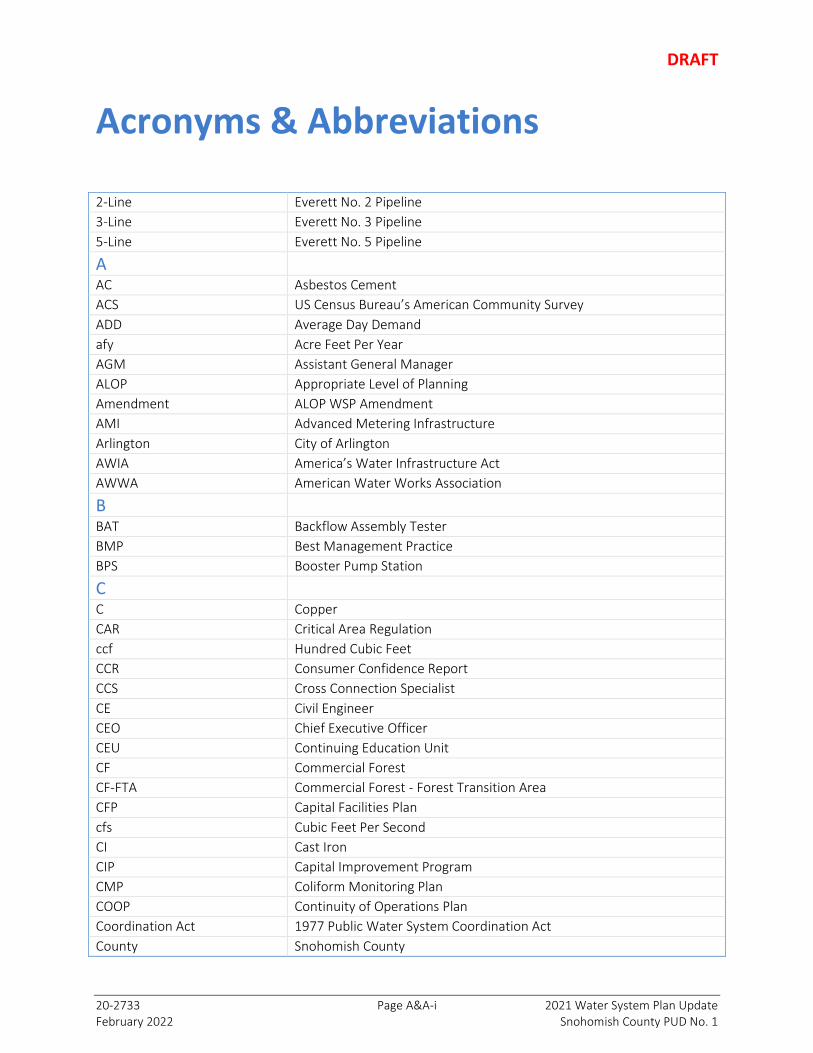
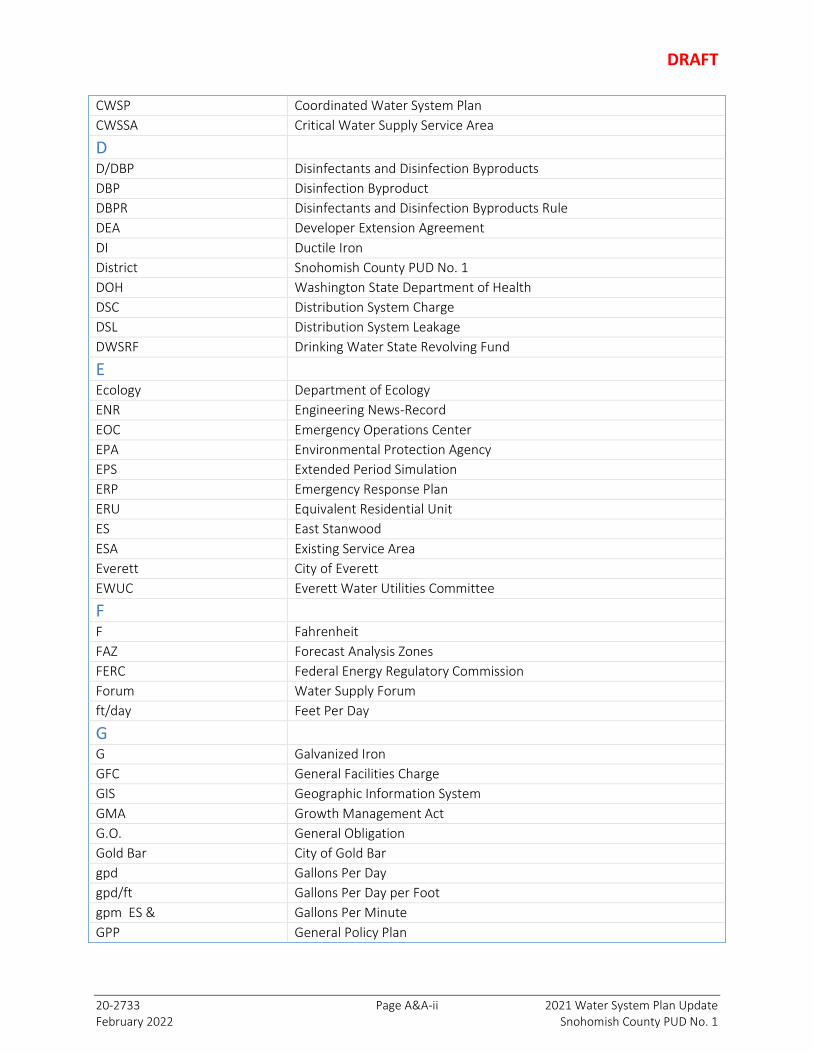
Acronyms & Abbreviations
2-Line Everett No. 2 Pipeline
3-Line Everett No. 3 Pipeline
5-Line Everett No. 5 Pipeline
A
AC Asbestos Cement
ACS US Census Bureau’s American Community Survey
ADD Average Day Demand
afy Acre Feet Per Year
AGM Assistant General Manager
ALOP Appropriate Level of Planning
Amendment ALOP WSP Amendment
AMI Advanced Metering Infrastructure
Arlington City of Arlington
AWIA America’s Water Infrastructure Act
AWWA American Water Works Association
B
BAT Backflow Assembly Tester
BMP Best Management Practice
BPS Booster Pump Station
C
C Copper
CAR Critical Area Regulation
ccf Hundred Cubic Feet
CCR Consumer Confidence Report
CCS Cross Connection Specialist
CE Civil Engineer
CEO Chief Executive Officer
CEU Continuing Education Unit
CF Commercial Forest
CF-FTA Commercial Forest - Forest Transition Area
CFP Capital Facilities Plan
cfs Cubic Feet Per Second
CI Cast Iron
CIP Capital Improvement Program
CMP Coliform Monitoring Plan
COOP Continuity of Operations Plan
Coordination Act 1977 Public Water System Coordination Act
County Snohomish County
DRAFT
20-2733 Page A&A-ii 2021 Water System Plan Update February 2022 Snohomish County PUD No. 1
CWSP Coordinated Water System Plan
CWSSA Critical Water Supply Service Area
D
D/DBP Disinfectants and Disinfection Byproducts
DBP Disinfection Byproduct
DBPR Disinfectants and Disinfection Byproducts Rule
DEA Developer Extension Agreement
DI Ductile Iron
District Snohomish County PUD No. 1
DOH Washington State Department of Health
DSC Distribution System Charge
DSL Distribution System Leakage
DWSRF Drinking Water State Revolving Fund
E
Ecology Department of Ecology
ENR Engineering News-Record
EOC Emergency Operations Center
EPA Environmental Protection Agency
EPS Extended Period Simulation
ERP Emergency Response Plan
ERU Equivalent Residential Unit
ES East Stanwood
ESA Existing Service Area
Everett City of Everett
EWUC Everett Water Utilities Committee
F
F Fahrenheit
FAZ Forecast Analysis Zones
FERC Federal Energy Regulatory Commission
Forum Water Supply Forum
ft/day Feet Per Day
G
G Galvanized Iron
GFC General Facilities Charge
GIS Geographic Information System
GMA Growth Management Act
G.O. General Obligation
Gold Bar City of Gold Bar
gpd Gallons Per Day
gpd/ft Gallons Per Day per Foot
gpm ES & Gallons Per Minute
GPP General Policy Plan

DRAFT
20-2733 Page A&A-iii 2021 Water System Plan Update February 2022 Snohomish County PUD No. 1
GPTRAC General Particle Tracking Module
Granite Falls City of Granite Falls
GSA Getchell-Snohomish Aquifer
Guidebook Water Use Efficiency Guidebook
GWMP Groundwater Management Plan
H
HAA5 A group of 5 Haloacetic Acids
HDPE High-density Polyethylene
HGL Hydraulic Grade Line
HPC Heterotrophic Plate Count
I
ICS Incident Command Structure
IGEA Investment Grade Efficiency Audit
IOC Inorganic Contaminate
IT In Training
J
JOA Joint Operating Agreement
K
kw Kilowatt
L
LA Lakes Aquifer
LCR Lead and Copper Rule
LSWTF Lake Stevens Water Treatment Facility
LT2 Long-Term 2 Enhanced Surface Water Treatment Rule
LUD Local Utility District
M
M Million
Marysville City of Marysville
MCL Maximum Contaminate Level
MCLG Maximum Contaminate Level Goal
MDD Maximum Day Demand
MG Million Gallons
mg/L Milligrams Per Liter
MGD Million Gallons per Day
MMM Multi-Media Mitigation
Model Municipal Water Demand Forecast Model
Monroe City of Monroe
MWL Municipal Water Law
N
ND Not Detected
NEB Net Ecological Benefit
ng/L Nanograms Per Liter

DRAFT
20-2733 Page A&A-iv 2021 Water System Plan Update February 2022 Snohomish County PUD No. 1
NPDES National Pollutant Discharge Elimination System
NSWUCC North Snohomish County Water Utility Coordinating Committee
NWRO Northwest Regional Office
O
O&M Operations and Maintenance
OFM Washington Office of Financial Management
Outlook Regional Water Supply Outlook
P
pCi/L Pico Curies Per Liter
PE Polyethylene
PFAS Polyfluoroalkyl Substances
PFBS Perfluorobutanesulfonic Acid
PFHxS Perfluorohexanesulfonic Acid
PFNA Perfluorononanoic Acid
PFOA Perfluorooctanoic Acid
PFOS Perfluorooctane Sulfonate
PHD Peak Hour Demand
Policy Manual Policies and Procedures Manual for Administration of Water Services
ppb Parts Per Billion
ppm Parts Per Million
PRV Pressure Reducing Valve
PSI Pounds Per Square Inch
PSRC Puget Sound Regional Council
PUD Public Utility District
PVC Polyvinyl Chloride
PWB Public Works Board
PWTF Public Works Trust Fund
Q
Qa Annual Quantity
Qal Alluvium
Qi Instantaneous Quantity
Qtb Transitional Beds
Qu Undifferentiated Sediments
Qva Vashon Advance Outwash
Qvr Vashon Recessional Outwash
Qvt Vashon Till
R
RCW Revised Code of Washington
RRA Risk and Resilience Assessment
RSA Retail Service Area
RTCR Revised Total Coliform Rule

DRAFT
20-2733 Page A&A-v 2021 Water System Plan Update February 2022 Snohomish County PUD No. 1
S
SAL State Action Level
SCADA Supervisory Control and Data Acquisition
SDWA Safe Drinking Water Act
Sewer District Lake Stevens Sewer District
SIRC Stillaguamish River Implementation Review Committee
SkA Skykomish Aquifer
SMA Satellite Management Agency
Snohomish City of Snohomish
SOC Synthetic Organic Compound
SSM Satellite System Management
ST Steel
Stanwood City of Stanwood
State State of Washington
Sultan City of Sultan
SWTR Surface Water Treatment Rule
T
tb Bedrock
TDH Total Dynamic Head
THM Trihalomethanes
Three Lakes Three Lakes Water Association
TOT Time of Travel
TuA Tulalip Aquifer
U
UGA Urban Growth Area
ULID/LID Utility Local Improvement District
USRP Utility Service Review Procedure
UV Ultraviolet
V
VFD Variable Frequency Drive
VOC Volatile Organic Compound
VSS Very Small System Waiver
W
WAC Washington Administration Code
WARN Washington State Intrastate Water and Wastewater Agency Response Network
Watershed Plan Watershed Restoration and Enhancement Plan
WBWA Warm Beach Water Association
WDM Water Distribution Manager
WDS Water Distribution Specialist
WFI Water Facility Inventory
WHPA Wellhead Protection Area

DRAFT
20-2733 Page A&A-vi 2021 Water System Plan Update February 2022 Snohomish County PUD No. 1
WHPP Wellhead Protection Program
WIFIA Water Infrastructure Funding Innovation Act
WRIA Water Resource Inventory Area
WRSA Water Right Self-Assessment
WSA Water Service Area
WSP Water System Plan
WTPO Water Treatment Plant Operator
WUE Water Use Efficiency
WWTF Wastewater Treatment Facility
WWUC Washington Water Utility Council

DRAFT
20-2733 Page i 2021 Water System Plan Update February 2022 Snohomish County PUD No. 1
Table of Contents
Executive Summary
ES-1 Management, History, and General Description .............................................................. 1
ES-2 Service Areas and Policies ................................................................................................ 2
ES-3 Adjacent Systems, Related Plans, and Agreements ......................................................... 2
ES-4 Existing Facilities ............................................................................................................... 3
ES-5 Planning Data and Demand Forecasting .......................................................................... 3
ES-6 Conservation/Water Use Efficiency .................................................................................. 4
ES-7 Facility Analysis ................................................................................................................. 4
ES-8 Source of Supply ............................................................................................................... 6
ES-10 Operations and Maintenance Overview ........................................................................... 6
ES-11 Water Quality and Compliance ........................................................................................ 7
ES-12 Improvement Plan ............................................................................................................ 8
ES-13 Financial Plan .................................................................................................................... 8
Chapter 1 Management, History, and General Description
1.1 Authority and Management ............................................................................................... 1-1
1.2 History and Future .............................................................................................................. 1-2
1.3 Accomplishments Since the 2011 Water System Plan ....................................................... 1-3
1.4 Overview of Existing Water Systems .................................................................................. 1-6
Chapter 2 Service Areas and Policies
2.1 Background .................................................................................................................. 2-1
2.1.1 Municipal Water Law: Rules and Related Policies ....................................................... 2-1
2.1.2 Coordinated Water System Planning in Snohomish County ........................................ 2-2
2.1.3 Satellite Management Agencies .................................................................................. 2-3
2.1.4 Growth Management Act ............................................................................................ 2-4
2.2 District Water Service Areas Adjustments .......................................................................... 2-4
2.2.1 Future Service Area Adjustments/Relinquishments ..................................................... 2-5
2.2.2 Satellite Management System Service Area ................................................................ 2-8
2.3 Resulting District Water Service Areas ............................................................................... 2-8

DRAFT
20-2733 Page ii 2021 Water System Plan Update February 2022 Snohomish County PUD No. 1
2.3.1 Lake Stevens Integrated Water Service Area ............................................................... 2-9
2.3.2 Wholesale Service Areas .............................................................................................. 2-9
2.3.3 Sunday Lake Water Service Area ............................................................................... 2-10
2.3.4 The 212 Market & Deli and Otis Water Service Areas ............................................... 2-10
2.3.5 Warm Beach/Kayak Water Systems Consolidation ................................................... 2-11
2.3.6 May Creek Water Service Area .................................................................................. 2-11
2.3.7 Skylite Water Service Area ......................................................................................... 2-12
2.4 Service Area Policies ......................................................................................................... 2-12
2.4.1 Timely and Reasonable Water Service: Future and Retail Service Areas ................... 2-12
2.4.2 Receivership: Future and SMA Service Areas ............................................................. 2-16
2.4.3 Policy and Procedures Manual .................................................................................. 2-17
2.4.4 Other Key Service Area Policies .................................................................................. 2-19
2.4.5 Satellite System Management Program .................................................................... 2-20
2.5 Service Area Physical and Environmental Characteristics ................................................ 2-20
2.5.1 Climate and Precipitation .......................................................................................... 2-21
2.5.2 Topography and Elevation ......................................................................................... 2-21
2.5.3 Geology and Soils ...................................................................................................... 2-22
2.5.4 Critical Areas ............................................................................................................. 2-22
Chapter 3 Adjacent Systems, Related Plans and Agreements
3.1 Adjacent Water Purveyors ................................................................................................. 3-1
3.2 Related Planning Documents ............................................................................................. 3-2
3.2.1 Service Area Consistency ............................................................................................. 3-3
3.2.2 Land Use Plans and Zoning .......................................................................................... 3-4
3.2.3 Related Water System Plans ........................................................................................ 3-6
3.2.4 Other Relevant Planning Documents ........................................................................... 3-9
3.2.5 Review of Reclaimed Water in Other Planning Documents ....................................... 3-13
3.3 Agreements with Other Water Systems ........................................................................... 3-14
3.3.1 Sultan River Agreement ............................................................................................. 3-16
3.3.2 North Snohomish County Joint Operating Agreements ............................................. 3-17
3.3.3 Gold Bar Agreements ................................................................................................ 3-18
3.3.4 Arlington Wholesale Water Agreement ..................................................................... 3-19
3.3.5 Sudden View Wholesale Water Agreement ............................................................... 3-19

DRAFT
20-2733 Page iii 2021 Water System Plan Update February 2022 Snohomish County PUD No. 1
3.3.6 Twin Falls Wholesale Water Agreement .................................................................... 3-20
3.3.7 Granite Falls Wholesale Water Agreement ............................................................... 3-21
3.3.8 City of Snohomish ...................................................................................................... 3-22
3.3.9 CWSP Service Area Agreement .................................................................................. 3-23
3.3.10 Three Lakes Service Area Agreement....................................................................... 3-23
3.3.11 Monroe Service Area Letter ..................................................................................... 3-23
3.3.12 Roosevelt Water Association, Three Lakes Water Association, and Meadow Lake Water Association .............................................................................................................. 3-24
3.3.13 Warm Beach, Kayak, and Seven Lakes Water System ............................................. 3-24
3.3.14 Tulalip Settlement Agreement for May Creek Water Rights .................................... 3-24
3.3.15 Sultan Water Supply Pipeline Agreement ................................................................ 3-24
3.3.16 Mutual Aid Agreements ........................................................................................... 3-25
Chapter 4 Existing Facilities
4.1 Primary Source of Supply ................................................................................................... 4-1
4.2 Pressure Zones .................................................................................................................. 4-2
4.3 Facilities and Components ................................................................................................. 4-2
4.3.1 Storage Facilities ......................................................................................................... 4-2
4.3.2 Pump Stations.............................................................................................................. 4-2
4.3.3 Pressure Reducing Valve Stations and Flow Control Valves ......................................... 4-3
4.3.4 Pipelines....................................................................................................................... 4-3
4.3.5 Wells ............................................................................................................................ 4-3
4.3.6 Interties ....................................................................................................................... 4-3
4.3.7 Treatment Facilities ..................................................................................................... 4-4
Chapter 5 Planning Data and Demand Forecasting
5.1 Introduction .................................................................................................................. 5-1
5.2 Definitions .................................................................................................................. 5-1
5.3 Historical Water Usage ....................................................................................................... 5-2
5.3.1 Water Supply Purchased and Produced ....................................................................... 5-3
5.3.2 Historical Water Consumption .................................................................................. 5-10
5.3.3 Trends in Customer Demands .................................................................................... 5-17
5.3.4 Non-Revenue Water Use and Distribution System Leakage ...................................... 5-19
5.3.5 Peaking Factors ......................................................................................................... 5-22

DRAFT
20-2733 Page iv 2021 Water System Plan Update February 2022 Snohomish County PUD No. 1
5.4 Future Population and Connections ................................................................................. 5-26
5.4.1 Relevant Planning Documents ................................................................................... 5-26
5.4.2 Historical Population and Connections ...................................................................... 5-26
5.4.3 Future Population and Connection Projections.......................................................... 5-32
5.5 Future Water Demands .................................................................................................... 5-33
5.6 Summary ................................................................................................................ 5-39
Chapter 6 Water Use Efficiency
6.1 Introduction .................................................................................................................. 6-1
6.2 Everett Water Utilities Committee ..................................................................................... 6-1
6.3 Water Use Efficiency Program Requirements .................................................................... 6-1
6.4 Objectives and Goals .......................................................................................................... 6-2
6.5 Water Use Efficiency Program for 2021 to 2030 ................................................................ 6-3
6.5.1 Supply-Side Measures .................................................................................................. 6-3
6.5.2 Demand-Side Measures ............................................................................................... 6-4
6.5.3 Cost Effective Analysis ................................................................................................. 6-8
6.5.4 Conservation Impact on the Demand Forecast ........................................................... 6-8
6.5.5 Evaluating Program Effectiveness ............................................................................... 6-9
6.5.6 Funding the WUE Program .......................................................................................... 6-9
6.6 Historical Water Use Efficiency Program .......................................................................... 6-10
6.6.1 Measuring Success – Supply-Side Goal ...................................................................... 6-10
6.6.2 Measuring Success – Demand-Side Goal ................................................................... 6-11
Chapter 7 Facility Analysis
7.1 System Analysis Criteria...................................................................................................... 7-1
7.2 Hydraulic Model ................................................................................................................. 7-3
7.3 Lake Stevens Integrated Facilities Analysis ......................................................................... 7-4
7.3.1 Water Supply Facility Evaluation for the Lake Stevens Integrated............................... 7-5
7.3.2 Boosted Pressure Zones within the Lake Stevens Integrated System ........................... 7-6
7.3.3 Distribution System Evaluation for the Lake Stevens Integrated System ................... 7-13
7.3.4 Storage Evaluation for the Lake Stevens Integrated System ..................................... 7-15
7.4 Storm Lake Ridge Facilities Analysis ................................................................................. 7-20
7.4.1 Water Supply Facility Evaluation for the Storm Lake Ridge System ........................... 7-20
7.4.2 Boosted Pressure Zone within the Storm Lake Ridge Water System .......................... 7-21

DRAFT
20-2733 Page v 2021 Water System Plan Update February 2022 Snohomish County PUD No. 1
7.4.3 Distribution System Evaluation for the Storm Lake Ridge System ............................. 7-22
7.4.4 Storage Evaluation for the Storm Lake Ridge Water System ..................................... 7-22
7.4.5 Remaining Physical Capacity in Existing Storm Lake Ridge Facilities ......................... 7-23
7.5 Creswell Facilities Analysis ................................................................................................ 7-24
7.5.1 Water Supply Facility Evaluation for the Creswell Water System .............................. 7-24
7.5.2 Distribution System Evaluation for the Creswell Water System ................................. 7-25
7.5.3 Storage Evaluation for the Creswell Water System ................................................... 7-25
7.5.4 Remaining Physical Capacity in Existing Creswell Facilities ....................................... 7-26
7.6 May Creek Facilities Analysis ............................................................................................ 7-27
7.6.1 Water Supply Facility Evaluation for the May Creek System ..................................... 7-27
7.6.2 Distribution System Evaluation for the May Creek System ........................................ 7-28
7.6.3 Storage Evaluation for the May Creek System ........................................................... 7-28
7.6.4 Remaining Physical Capacity in Existing May Creek Facilities ................................... 7-29
7.7 Skylite Water System Facilities Analysis ........................................................................... 7-30
7.7.1 Water Supply Facility Evaluation for the Skylite System ............................................ 7-31
7.7.2 Boosted Pressure Zone within the Skylite System ...................................................... 7-32
7.7.3 Distribution System Evaluation for the Skylite System ............................................... 7-32
7.7.4 Storage Evaluation for the Skylite System ................................................................. 7-33
7.7.5 Remaining Physical Capacity in Existing Skylite Facilities .......................................... 7-33
7.8 Sunday Lake Water System Facilities Analysis .................................................................. 7-34
7.8.1 Water Supply Facility Evaluation for the Sunday Lake System .................................. 7-34
7.8.2 Boosted Pressure Zone within the Sunday Lake System ............................................ 7-35
7.8.3 Distribution System Evaluation for the Sunday Lake System ..................................... 7-36
7.8.4 Storage Evaluation for the Sunday Lake System ........................................................ 7-36
7.8.5 Remaining Physical Capacity in Existing Sunday Lake Facilities ................................. 7-37
7.9 Warm Beach System Facilities Analysis ............................................................................ 7-38
7.9.1 Water Supply Facility Evaluation for the Warm Beach System .................................. 7-38
7.9.2 Boosted Pressure Zone within the Warm Beach System ............................................ 7-39
7.9.3 Distribution System Evaluation for the Warm Beach System .................................... 7-39
7.9.4 Storage Evaluation for the Warm Beach System ....................................................... 7-40
7.9.5 Remaining Physical Capacity in Existing Warm Beach Facilities ................................ 7-41

DRAFT
20-2733 Page vi 2021 Water System Plan Update February 2022 Snohomish County PUD No. 1
Chapter 8 Source of Supply
8.1 Surface Water .................................................................................................................. 8-1
8.1.1 Surface Water Rights ................................................................................................... 8-1
8.1.2 Surface Water Supply Yield .......................................................................................... 8-2
8.1.3 Surface Water Shortage Response Plan ...................................................................... 8-2
8.1.4 Watershed Plans .......................................................................................................... 8-2
8.1.5 General Hydrology / Fishery Conditions....................................................................... 8-4
8.2 Groundwater .................................................................................................................. 8-5
8.2.1 Wellhead Protection Program ..................................................................................... 8-6
8.2.2 Snohomish County Hydrogeology ................................................................................ 8-9
8.2.3 District Aquifer Sources ............................................................................................. 8-10
8.3 Retail Water Service Area / Forecast Water Rights .......................................................... 8-13
8.4 Groundwater System Expansions / Additions .................................................................. 8-13
8.4.1 Warm Beach Water Association (WBWA) ................................................................. 8-13
8.4.2 Kayak Water System (now referred to as Warm Beach Water System) .................... 8-14
Chapter 9 Operations and Maintenance
9.1 Operations Program ........................................................................................................... 9-1
9.2 Organizational Structure and Responsibilities .................................................................... 9-1
9.2.1 Assistant General Manager, Water Utility ................................................................... 9-1
9.2.2 Water Superintendent ................................................................................................. 9-1
9.2.3 Water Crew Coordinator ............................................................................................. 9-2
9.2.4 Water Foremen ........................................................................................................... 9-2
9.2.5 Water Maintenance and Operations Crew .................................................................. 9-2
9.2.6 Engineering Staff ......................................................................................................... 9-3
9.2.7 Administrative Support ................................................................................................ 9-3
9.3 Personnel Certification ....................................................................................................... 9-4
9.4 Routine Operations and Preventive Maintenance ............................................................. 9-4
9.4.1 Wells ............................................................................................................................ 9-6
9.4.2 Reservoirs .................................................................................................................... 9-6
9.4.3 Transmission and Distribution Pipelines ...................................................................... 9-6
9.4.4 Supply Pump Stations and Booster Pump Stations ...................................................... 9-7
9.4.5 Treatment Facilities ..................................................................................................... 9-8

DRAFT
20-2733 Page vii 2021 Water System Plan Update February 2022 Snohomish County PUD No. 1
9.4.6 Pressure Reducing Stations .......................................................................................... 9-8
9.4.7 Fire Hydrants ............................................................................................................... 9-8
9.4.8 Valves .......................................................................................................................... 9-9
9.4.9 Main Flushing .............................................................................................................. 9-9
9.4.10 SCADA Network ......................................................................................................... 9-9
9.4.11 Staffing .................................................................................................................... 9-10
9.5 Water Quality Sampling .................................................................................................... 9-10
9.6 Cross-Connection Control Program .................................................................................. 9-10
9.7 District Vehicles ................................................................................................................ 9-10
9.8 Vulnerability Assessment and Emergency Procedure ...................................................... 9-10
9.8.1 AWIA Risk and Resilience Assessment ....................................................................... 9-11
9.8.2 Other Factors for Dealing with Emergencies ............................................................. 9-11
9.8.3 Contingency Plan ....................................................................................................... 9-15
Chapter 10 Water Quality and Compliance Introduction
10.1 Water Quality ................................................................................................................ 10-1
10.2 Water Quality Monitoring - Integrated System .............................................................. 10-1
10.3 Current Regulations ........................................................................................................ 10-1
10.3.1 Revised Total Coliform Rule and Coliform Monitoring Plan ..................................... 10-2
10.3.2 Disinfectants and Disinfection Byproduct Rule and Disinfection Byproduct Monitoring Plan ..................................................................................................................................... 10-3
10.3.3 Surface Water Treatment Rule ................................................................................ 10-4
10.3.4 Lead and Copper ...................................................................................................... 10-5
10.4 Water Quality Monitoring – Other Group A Systems ..................................................... 10-5
10.5 Consumer Confidence Reports and Public Notification Rule ......................................... 10-6
10.6 Emergency Response Program ....................................................................................... 10-8
10.7 Cross-Connection Control Program ................................................................................ 10-8
10.8 Anticipated Water Quality Regulations .......................................................................... 10-8
10.8.1 Endocrine Disruptors ............................................................................................... 10-8
10.8.2 Radon ...................................................................................................................... 10-9
10.8.3 Proposed Revisions to the Lead and Copper Rule .................................................... 10-9
10.8.4 Future PFOA and PFOS Regulations ......................................................................... 10-9
10.9 Laboratory Certification ............................................................................................... 10-10
10.10 Water Quality Sampling and Violation Response Procedures .................................... 10-10

DRAFT
20-2733 Page viii 2021 Water System Plan Update February 2022 Snohomish County PUD No. 1
10.10.1 Monitoring ........................................................................................................... 10-10
10.10.2 Reporting and Public Notification ........................................................................ 10-10
10.10.3 Customer Inquiries and Record Keeping .............................................................. 10-11
10.11 Treatment and Monitoring Violation Procedures ...................................................... 10-11
Chapter 11 Improvement Program
11.1 Prioritization ................................................................................................................ 11-1
11.2 Budget Level Cost Estimates .......................................................................................... 11-1
11.3 Summary of Major Improvements ................................................................................. 11-2
11.3.1 Overall Water System .............................................................................................. 11-2
11.3.2 Reservoirs ................................................................................................................ 11-2
11.3.3 Pump Stations.......................................................................................................... 11-3
11.3.4 Distribution .............................................................................................................. 11-3
Chapter 12 Financial Plan
12.1 Introduction ................................................................................................................ 12-1
12.2 Past Financial Performance ............................................................................................ 12-1
12.2.1 Comparative Financial Statements .......................................................................... 12-1
12.3 Current Financial Structure ............................................................................................ 12-3
12.3.1 Financial Plan .......................................................................................................... 12-4
12.4 Available Funding Assistance and Financing Resources ................................................. 12-6
12.4.1 District Resources .................................................................................................... 12-6
12.4.2 Outside Resources ................................................................................................... 12-8
12.5 Financial Forecast ......................................................................................................... 12-10
12.5.1 Current Financial Structure .................................................................................... 12-11
12.6 Current and Projected Rates ........................................................................................ 12-15
12.6.1 Current Rates ......................................................................................................... 12-15
12.6.2 Projected Rates ...................................................................................................... 12-15
12.7 Affordability .............................................................................................................. 12-17
12.8 Conclusion .............................................................................................................. 12-18
Tables
Table ES-1 | 20-Year Capital Funding Strategy ............................................................................ 9
Table 1-1 | District Water Systems as of December 2019 ....................................................... 1-2
Table 1-2 | Length of Water Mains Constructed since 2010 ................................................... 1-3

DRAFT
20-2733 Page ix 2021 Water System Plan Update February 2022 Snohomish County PUD No. 1
Table 1-3 | District Projects since 2010 ................................................................................... 1-4
Table 2-1 | General District Criteria for Timely and Reasonable Water Service Decisions .... 2-14
Table 2-2 | Weather Station Statistics from East to West ..................................................... 2-21
Table 3-1 | Adjacent Water Purveyors ..................................................................................... 3-1
Table 3-2 | Related Planning Documents ................................................................................. 3-2
Table 3-3 | Consistency with Local Plans and Regulations ....................................................... 3-3
Table 3-4 | City and County Population Growth Targets ......................................................... 3-5
Table 3-5 | City Land Use Maps ............................................................................................... 3-6
Table 3-6 | Granite Falls Projected Water Needs..................................................................... 3-8
Table 3-7 | Regional Average Water Use in 2004-2006 ......................................................... 3-10
Table 3-8 | Relevant Water Agreements ............................................................................... 3-15
Table 4-1 | Pressure Zones....................................................................................................... 4-6
Table 4-2 | Storage Facilities .................................................................................................... 4-7
Table 4-3 | Pump Stations ........................................................................................................ 4-8
Table 4-4 | Pressure Reducing Valves .................................................................................... 4-15
Table 4-5 | Length of System Pipe ......................................................................................... 4-17
Table 4-6 | Inventory of Active Wells ..................................................................................... 4-19
Table 4-7 | Interties to Adjacent Purveyors ........................................................................... 4-21
Table 5-1 | Historical Water Supply ......................................................................................... 5-4
Table 5-2 | Historical Water Consumption ............................................................................ 5-11
Table 5-3 | Historical Water Use Efficiency (1,000-gal) ......................................................... 5-20
Table 5-4 | Calculated Peaking Factors .................................................................................. 5-23
Table 5-5 | Historical Population and Connection ................................................................. 5-27
Table 5-6 | Comparative Population Projections by System .................................................. 5-32
Table 5-7 | Summary of Growth Rates by System ................................................................. 5-33
Table 5-8 | Planning Values for Water Demand Projections .................................................. 5-34
Table 5-9 | Water Demand Projection ................................................................................... 5-35
Table 6-1 | Required WUE Program Elements ......................................................................... 6-2
Table 6-2 | Demand-Side Measures ......................................................................................... 6-5
Table 6-3 | District Projected Water Savings over the Next 10 Years ...................................... 6-9
Table 6-4 | Reported DSL in Annual WUE Performance Reports ........................................... 6-11
Table 6-5 | Estimated Regional Water Savings from 2014-2019 (MGD) ................................ 6-12
Table 6-6 | Water Savings by System ..................................................................................... 6-12

DRAFT
20-2733 Page x 2021 Water System Plan Update February 2022 Snohomish County PUD No. 1
Table 7-1 | System Analysis Criteria ......................................................................................... 7-2
Table 7-2 | Lake Stevens Integrated System Supply Evaluation ............................................... 7-6
Table 7-3 | Granite Falls 726 Pressure Zone Supply Evaluation ............................................... 7-7
Table 7-4 | Lake Roesiger 811 Pressure Zone Supply Evaluation ............................................. 7-8
Table 7-5 | Hillcrest 580 Pressure Zone Supply Analysis .......................................................... 7-9
Table 7-6 | Walker Hill 580 Pressure Zone Supply Analysis ................................................... 7-10
Table 7-7 | Lake Cassidy 580 Pressure Zone Supply Analysis ................................................. 7-11
Table 7-8 | Machias Ridge East 640 Pressure Zone Supply Analysis ...................................... 7-12
Table 7-9 | Dubuque Boosted 640 Pressure Zone Supply Analysis ........................................ 7-13
Table 7-10 | Fire Flow Requirements ..................................................................................... 7-14
Table 7-11 | 2020 Storage Analysis ........................................................................................ 7-16
Table 7-12 | 2030 Storage Analysis ........................................................................................ 7-16
Table 7-13 | 2040 Storage Analysis ........................................................................................ 7-17
Table 7-14 | Lake Stevens Integrated Existing System Capacity Analysis (Entire Water System) .................................................................................................................................... 7-18
Table 7-15 | Storm Lake Ridge Supply Evaluation .................................................................. 7-21
Table 7-16 | Boosted Pressure Zone within the Storm Lake Ridge Supply Analysis ............... 7-22
Table 7-17 | Storm Lake Ridge Storage Analysis .................................................................... 7-23
Table 7-18 | Storm Lake Existing System Capacity Analysis ................................................... 7-23
Table 7-19 | Creswell System Supply Evaluation ................................................................... 7-24
Table 7-20 | Creswell Existing System Capacity Analysis ....................................................... 7-26
Table 7-21 | May Creek System Supply Evaluation ................................................................ 7-27
Table 7-22 | May Creek Storage Analysis ............................................................................... 7-28
Table 7-23 | May Creek Existing System Capacity Analysis .................................................... 7-29
Table 7-24 | Skylite System Supply Evaluation ....................................................................... 7-31
Table 7-25 | Boosted Pressure Zone within the Skylite Supply Analysis ................................ 7-32
Table 7-26 | Skylite Storage Analysis ..................................................................................... 7-33
Table 7-27 | Skylite Existing System Capacity Analysis ........................................................... 7-34
Table 7-28 | Sunday Lake System Supply Evaluation ............................................................. 7-35
Table 7-29 | Boosted Pressure Zone within the Sunday Lake Supply Analysis....................... 7-35
Table 7-30 | Sunday Lake Storage Analysis ............................................................................ 7-36
Table 7-31 | Sunday Lake Existing System Capacity Analysis ................................................. 7-37
Table 7-32 | Warm Beach System Supply Evaluation ............................................................ 7-38

DRAFT
20-2733 Page xi 2021 Water System Plan Update February 2022 Snohomish County PUD No. 1
Table 7-33 | Boosted Pressure Zone within the Warm Beach Supply Analysis ...................... 7-39
Table 7-34 | Warm Beach Storage Analysis ........................................................................... 7-41
Table 7-35 | Warm Beach System Capacity Analysis ............................................................. 7-42
Table 8-1 | Jointly Held Surface Water Rights .......................................................................... 8-1
Table 8-2 | Susceptibility Ratings for District Satellite Water Systems .................................... 8-7
Table 8-3 | Existing and Forecast Groundwater Rights for Retail Service Area ...................... 8-16
Table 9-1 | Years of Experience and Waterworks Certifications .............................................. 9-3
Table 9-2 | Facility Maintenance Schedule (Target Frequencies) ............................................ 9-5
Table 9-3 | Emergency Notification Numbers (Area Code is 425 Unless Indicated) .............. 9-12
Table 10-1 | Other Group A Water Systems D/DBP Monitoring Results ................................ 10-4
Table 10-2 | Everett Regional Lead and Copper Monitoring Results ..................................... 10-5
Table 11-1 | Snohomish County PUD – Capital Improvement Plan ....................................... 11-5
Table 12-1 | Summary of Historical Fund Resources and Uses Arising From Cash Transactions .................................................................................................................................... 12-1
Table 12-2 | 10- and 20-Year CIP ........................................................................................... 12-5
Table 12-3 | 10 Year CIP (Escalated $) ................................................................................... 12-5
Table 12-4 | 20-Year Capital Funding Strategy ...................................................................... 12-6
Table 12-5 | 10-Year Financial Forecast ............................................................................... 12-14
Table 12-6 | Ending Cash Balance Summary ........................................................................ 12-15
Table 12-7 | Existing Schedule of Rates ............................................................................... 12-15
Table 12-8 | Projected Schedule of Rates ............................................................................ 12-16
Table 12-9 | Conservation Based Rate Structure ................................................................. 12-17
Table 12-10 | Affordability Test ........................................................................................... 12-17
Figures Figure 1-1 | PUD Leadership Chart .......................................................................................... 1-9
Figure 1-2 | Water Resources Organization Chart ................................................................. 1-10
Figure 1-3 | Vicinity Map ........................................................................................................ 1-11
Figure 2-1 | Proposed District Water Service Area ................................................................ 2-23
Figure 2-2 | Proposed District Water Service Area (Large Size) ............................................. 2-25
Figure 4-1 | Major Source of Supply ...................................................................................... 4-22
Figure 4-2 | Source of Supply and PUD Taps .......................................................................... 4-23
Figure 4-3A | Hydraulic Profile, Lake Stevens Integrated, Creswell, and Storm Lake Ridge WSAs .................................................................................................................................... 4-25

DRAFT
20-2733 Page xii 2021 Water System Plan Update February 2022 Snohomish County PUD No. 1
Figure 4-3B | Hydraulic Profile, Warm Beach WSA ................................................................ 4-26
Figure 4-3C | Hydraulic Profile, Sunday Lake, Skylite, and May Creek WSAs ......................... 4-27
Figure 4-4A | Lake Stevens Integrated Water System Southwest Sub Area .......................... 4-29
Figure 4-4B | Integrated System Granite Falls Area ............................................................... 4-30
Figure 4-4C | Sunday Lake Water System .............................................................................. 4-31
Figure 4-4D | Skylite Water System ....................................................................................... 4-32
Figure 4-4E | May Creek Water System ................................................................................. 4-33
Figure 4-4F | Otis Water System ............................................................................................ 4-34
Figure 4-4G | Warm Beach Water System ............................................................................. 4-35
Figure 4-5 | Existing Interties (with Marysville and Goldbar) ................................................. 4-36
Figure 5-1 | Temperature Effect on Lake Stevens Integrated Customer Water Demands .... 5-18
Figure 5-2 | Temperature’s Effect on Combined Warm Beach Customer Water Demands .. 5-19
Figure 7-1 | Lake Stevens Integrated and Storm Lake Ridge Fire Flow and PHD Deficiencies 7-43
Figure 7-2 | Warm Beach Fire Flow and PHD Deficiencies ..................................................... 7-44
Figure 8-1 | Wellhead Protection Area (Lake Stevens Integrated) ........................................ 8-17
Figure 8-2 | Wellhead Protection Area (May Creek) .............................................................. 8-18
Figure 8-3 | Wellhead Protection Area (Warm Beach) .......................................................... 8-19
Figure 8-4 | Wellhead Protection Area (Skylite) .................................................................... 8-20
Figure 8-5 | Wellhead Protection Area (Sunday Lake and 212 Market) ................................ 8-21
Figure 11-1 | Lake Stevens and Storm Lake Ridge Hydraulic CIP ........................................... 11-9
Figure 11-2 | Warm Beach CIP and Developer Improvements ............................................ 11-10
Appendices
Appendix 0-1 Submittal and Consistency Checklists
Appendix 0-2 SEPA Documentation
Appendix 0-3 Comments and Response
Appendix 1-1 Policy Manual
Appendix 1-2 DOH Water Facility Inventory Forms
Appendix 1-3 DOH Operating Permits
Appendix 1-4 Warm Beach ALOP DOH Approval
Appendix 2-1 North Snohomish Coordinated Water System Plan
Appendix 2-2 Pertinent District Resolutions
Appendix 2-3 Current Satellite Management Program

DRAFT
20-2733 Page xiii 2021 Water System Plan Update February 2022 Snohomish County PUD No. 1
Appendix 3-1 Reclaimed Water Reuse References
Appendix 3-2 Agreements
Appendix 3-3A Snohomish County Land Use Map
Appendix 3-3B Lake Stevens Land Use
Appendix 3-3C Granite Falls Land Use
Appendix 3-3D Gold Bar Land Use
Appendix 3-3E Marysville Land Use
Appendix 3-3F Snohomish City Land Use
Appendix 5-1 Water Multi-Family Unit Count
Appendix 5-2 Snohomish County FAZ Map
Appendix 6-1 Conservation Rates Meeting Agenda
Appendix 7-1 Hydraulic Model Calibration Tech Memo
Appendix 7-2 Storage Analyses
Appendix 8-1 2001 Drought Response Plan
Appendix 8-2 Water Rights
Appendix 8-3A Wellhead Protection Program Lake Stevens
Appendix 8-3B Kayak Wellhead Protection Plan
Appendix 8-3C Lake Stevens Aquifer Study – Figure 1
Appendix 9-1 Risk and Resilience Tech Memo
Appendix 9-2 Continuity of Operations Plan
Appendix 10-1A SnoPUD 1 2019 Ground Water Coliform Monitoring Plan with Appendices
Appendix 10-1B SnoPUD 1 2019 Surface Water Coliform Monitoring Plan with Appendices
Appendix 10-2 Disinfection By-Product Monitoring Plans
Appendix 10-3 Monitoring Requirements
Appendix 10-4 Consumer Confidence Reports
Appendix 10-5 Water Utility Cross-Connection Control SOP
Appendix 10-6 Public Notification Forms
Appendix 11-1 Cost Estimating Methodology
Appendix 12-1 Snohomish PUD Financial Model

DRAFT
20-2733 Page xiv 2021 Water System Plan Update February 2022 Snohomish County PUD No. 1
THIS PAGE INTENTIONALLY LEFT BLANK

Executive Summary

THIS PAGE INTENTIONALLY LEFT BLANK

DRAFT
20-2733 Page ES-1 2021 Water System Plan Update February 2022 Snohomish County PUD No. 1
Executive Summary
The Snohomish County PUD No. 1 (District) prepared this Water System Plan (WSP) to provide policies and guidance for the utility to maintain a high level of service for existing customers while meeting the needs of planned growth. The WSP meets Washington Department of Health (DOH) planning requirements and is a summary of the manner in which the District fulfills its mission, “safely providing quality products and services in a cost-effective and environmentally sound manner;” its business strategy, “ensuring adequate, high quality and reliable water supplies and distribution systems that meet the needs of existing and future customers, while continuously pursuing increased customer service levels and cost efficiencies;” and its obligation as a public water utility.
Major changes in the District’s water system since the 2011 Plan include the following:
▪ Acquired the Warm Beach water system and consolidated it with the Kayak water system, including a new connection between the two systems
▪ Merged the Lake Roesiger water system into the Lake Stevens Integrated water system by constructing water main extensions that combined the Lake Roesiger and Lake Bosworth pressure zones including a new pressure reducing valve (PRV) station that allows that zone to feed into the Granite Falls pressure zone, improving system connectivity and looping
▪ Merged the Dubuque and Lake Stevens Integrated water systems by constructing a new water main that connected the systems and boosted system redundancy
▪ Abandoned/removed Williams Road master meter, Portage master meter, Pilchuck 10 wells, and East Hewitt Pump Station. Customers served by the Pilchuck wells were connected to the Lake Stevens Integrated water system
▪ Replaced 16.8 miles of aging water mains since 2010 to improve hydraulic capacity of the water system and prevent leaks and water main breaks
The following sections summarize the content of each chapter in this WSP.
ES-1 Management, History, and General Description
Authority: The District is a municipal corporation of the State of Washington with authority to provide water utility service to all portions of Snohomish County (County) and Camano Island not served by other municipal water utilities or districts. Public Utility Districts (PUDs) are organized to provide electric and/or water utility service to their customers on a non-profit, cost of service basis. By special voter approval, PUDs can also provide sewer utility service. Local, publicly
DRAFT
20-2733 Page ES-2 2021 Water System Plan Update February 2022 Snohomish County PUD No. 1
owned utility systems are based on the initiative law passed in 1930 by a majority vote of the people of the entire state. The PUDs were originally formed to combat high electric rates charged by private utilities, provide electricity to rural areas where such service had been denied, and to provide utility water service to otherwise un-served areas. The District has been providing water utility service in the County since 1946.
Administration: The District’s water systems are administered according to RCW (Revised Code of Washington) 54.16.030, municipal codes, and policies and procedures set forth in the Policies and Procedures Manual for Administration of Water Services adopted by the District’s Board of Commissioners by Resolution No. 4848-J in April 1999 and last amended and approved on March 1, 2010, under Resolution No. 5484. It is under this authority that the District provides water service to its retail and wholesale water customers.
Overview of Systems: The District owns and operates nine separate public water systems located throughout the County. The District’s largest system is its Lake Stevens Integrated water system which provides wholesale service to the City of Granite Falls (Granite Falls) and the City of Arlington (Arlington). Other standalone systems include the May Creek, Warm Beach (including the recently merged Kayak system), Storm Lake Ridge, Sunday Lake, Skylite, Creswell, 212 Market & Deli, and Otis water systems.
Regional Coordination: The District actively participates as a member of the Everett Water Utilities Committee (EWUC), the North Snohomish County Water Utility Coordinating Committee (NSWUCC), and the Washington Water Utility Council (WWUC).
ES-2 Service Areas and Policies
Regulatory Requirements for Water Service Areas: The District’s 2011 WSP is consistent with requirements of the Public Water System Coordination Act, Growth Management Act, and 2003 Municipal Water Law.
District Water Service Areas: The District’s water service areas (WSAs) were refined to be consistent with requirements of the Municipal Water Law and the County’s Comprehensive Plan. This WSP distinguishes between the District’s existing service areas, retail service areas where expansion is anticipated within the next ten years, and a future service area.
Service Area Policies: The WSP clarifies the District’s processes to provide water service in a “timely and reasonable” manner and outlines the format of the District’s Water Policies and Procedures Manual.
ES-3 Adjacent Systems, Related Plans, and Agreements
Related Plans: The District works to coordinate water system planning issues with other regional planning documents such as the City of Everett’s (Everett’s) Comprehensive Water Plan, the DRAFT 20-2733 Page ES-3 2021 Water System Plan Update October 2021 Snohomish County

DRAFT
20-2733 Page ES-3 2021 Water System Plan Update February 2022 Snohomish County PUD No. 1
PUD No. 1 Snohomish County Comprehensive Plan, the Growth Management Act, and the North Snohomish County Coordinated Water System Plan (CWSP). Concurrence with county and local land-use plans and policies, surrounding purveyor’s water system plans, wholesale customer plans (Arlington, Granite Falls, and Snohomish), and supplier plans (Everett), is critical in the evaluation of long-term adequacy of the water system.
Service Area Agreements: A list of relevant interlocal agreements that the District has entered into with cities and other water utilities is incorporated into Chapter 3. The agreements include the Sultan River Agreement, North Snohomish County Joint Operating Agreements, Everett Water Supply Contract, and the Arlington, Gold Bar, Granite Falls, Sudden View, and Twin Falls wholesale water agreements. Also included are various CWSP service boundary area agreements.
ES-4 Existing Facilities
The District’s nine water systems include approximately 408 miles of pipelines, 15.5 million gallons (MG) of storage (16 active storage tanks), 12 booster pump stations, 6 water supply pump stations, 14 active wells, and 40 pressure zones. Each of these facilities is integral to the operation of the District’s water systems. The District also owns and operates treatment systems for its Lake Stevens, Sunday Lake, Kayak, and Warm Beach wells.
ES-5 Planning Data and Demand Forecasting
Future Growth: Future growth projections were calculated by analyzing historical service connection growths as well as the Puget Sound Regional Council’s (PSRC’s) growth projections for each service area. Annual growth rates were chosen for each system using the District’s knowledge of the areas as well as regional growth projections and planning documents.
Future water demand projections were calculated using both the historical water supply and demand trends information as well as the growth projections for each system. These demand projections are used in later chapters to assess system capacity and inform when and where improvements will be needed to meet the District’s design criteria.
Retail Service Area Demand: The District’s retail service area includes Lake Stevens Integrated (and the greater Arlington and Granite Falls areas), and two additional satellite systems served by water purchased from Everett: Storm Lake Ridge and Creswell. The service area also includes an additional six systems served with groundwater sources: May Creek, Warm Beach (which includes the Kayak system), Sunday Lake, Skylite, 212 Market & Deli (Moa/Holbeck), and Otis.
Based on projections found in PSRC’s VISION 2040 Plan and historical data provided by the District’s utility billing records, the population in the District’s integrated service area (Lake Stevens Integrated) is predicted to increase between 1.15 and 1.51 percent annually over the next 20 years. The projected growth results in in over 6,000 new equivalent residential units (ERUs) within the District’s retail service area in the next 20 years.

DRAFT
20-2733 Page ES-4 2021 Water System Plan Update February 2022 Snohomish County PUD No. 1
Wholesale Demands: The District serves five routine wholesale customers: Arlington, Snohomish, and Granite Falls; and the Sudden View and Twin Falls water systems. Wholesale water sales have remained fairly constant during the past five years with wholesale purchases representing between 9 and 33 percent of the District’s total water sales. Wholesale customers perform their own population and water demand projections.
ES-6 Conservation/Water Use Efficiency
The District has engaged in water conservation planning and promotion of educational programs for a number of years. As a wholesale customer of Everett, the District participates in a regional conservation program established by the Everett Water Utilities Customers’ conservation subcommittee in 1999.
The District has proposed the following supply-side and demand-side goals to be consistent with the Water Use Efficiency Rule which was updated in January 2017:
Supply-side goal: The District shall maintain its distribution leakage below the Washington State 10 percent standard and shall strive to progressively achieve lower percentages of lost water, where possible.
Demand-side goal: The District shall actively participate in the EWUC regional Water Use Efficiency (WUE) Program to reduce regional water demand by approximately by 1.4 million gallons per day (MGD) between 2020 and 2029, or approximately a two percent reduction (cumulative) in the projected water demand in 2029.
ES-7 Facility Analysis
The District’s water systems are designed and constructed to provide long-term, reliable service. The systems are generally robust, with adequate supply and service pressures under most conditions. Recommended improvements in this section are designed to meet or exceed the District’s level of service standards for existing customers while meeting needs for planned growth.
This chapter evaluates the capacity of the District’s pump stations, water distribution, transmission, and storage by water system. Where deficiencies are identified, specific improvements are recommended to address those deficiencies. The specific improvements are identified in Chapter 11 – Improvement Program.
Lake Stevens Integrated Water System: This system has sufficient overall supply to meet existing and projected demands. However, additional booster station capacity will be required for the Granite Falls 726 Pressure Zone before 2040. The Walker Hill Booster Station can meet demand requirements (including minimum fire flow), but station retrofits are proposed to improve reliability and zone pressures during fire flow. Additional storage capacity is required to meet DOH standards, so three new tanks are proposed for Lake Stevens Integrated system and one

DRAFT
20-2733 Page ES-5 2021 Water System Plan Update February 2022 Snohomish County PUD No. 1
new tank is proposed for the Warm Beach system (see below). The analysis also considered the number of ERUs that can be supported by the system’s supply sources and storage. Storage was the limiting factor for the existing system capacity and will support water demand growth through 2030.
Storm Lake Ridge Water System: The Storm Lake Ridge Water System has sufficient supply, booster pump capacity, and storage to support projected growth through 2040; however, the number of dead ends in the system makes the distribution system ill-suited to provide minimum required fire flows. Improvements to address these deficiencies are included in Chapter 11. The analysis also evaluated the system capacity from a per-ERU standpoint; this evaluation, consistent with the other analyses, showed that the system should have adequate capacity through 2040 (limited factor is storage).
Creswell Water System: This small system receives all supply from a tap connected to an Everett transmission main, and this source is sufficient to support projected demands through 2040. The District intends to connect the Creswell system to the Lake Stevens Integrated Water System in the future, the distribution system has not changed since the 2011 distribution analysis, so no analysis was performed on the Creswell distribution system. The proposed connection from the Creswell Water System to the Lake Stevens Integrated Water System through the Lake Roesiger 811 pressure zone was evaluated for headloss during the minimum required fire flow of 1,000 gallons per minute (gpm). This analysis showed relatively minimal headloss in the pipe and velocities below the District standard of 8 feet per second.
May Creek Water System: Both the overall system and per-ERU analyses showed that the existing May Creek Water System can support projected growth through 2040, with storage as the limiting capacity factor. However, if any expansion occurs at elevations over 300 feet, a booster station will be required to supply adequate pressures to those new customers.
Skylite Water System: This small system is served entirely by booster pumps drawing water from storage which is filled by a well. While the source supply, distribution system, and storage can support 2040 projected growth, the booster pumps are deficient by 30 gallons per minute (gpm) according to DOH’s firm capacity requirement. Because this is a minor deficiency, the District will monitor the situation but does not have plans for any improvements. The per-ERU analysis showed that the existing system will be at capacity in 2040 (water rights is the limiting capacity factor, aside from the booster station deficiency).
Sunday Lake Water System: The supply analysis for the Sunday Lake Water System showed that the DOH recommendation that sources supply maximum day demand (MDD) with 20 hours or less of pumping will not be met in 2040 (though it is met for 2020 and 2030) based on projected growth, with a deficit of 164 gpm. Because this is a minor deficiency, the District will monitor the situation but does not have current plans for a project to address it. Booster pump stations, the distribution system, and the storage system are sufficient to meet projected demands through 2040. According to the per-ERU analysis, the existing system has sufficient capacity to support 2040 projected demands.

DRAFT
20-2733 Page ES-6 2021 Water System Plan Update February 2022 Snohomish County PUD No. 1
Warm Beach Water System: Water supply and booster capacity in the Warm Beach Water System are sufficient to meet projected demands through 2040. Warm Beach Well 2, however, operates below its water rights capacity, so a pump replacement for this well is included in the District’s Capital Improvement Program (CIP). High elevation customers and long dead-end pipes in the system also make fire flow availability below the required minimum in some locations, a deficiency that will be addressed by the connection between the Warm Beach and former Kayak systems, select pipe improvement projects, and possibly some service line booster pumps. The Warm Beach storage facilities are not adequate for existing or future projected demands; Chapter 11 includes a new tank to address this deficiency. Consistent with the overall system analysis, the per-ERU analysis showed that the existing system capacity is deficient by an estimated 169 ERUs.
ES-8 Source of Supply
Water Rights: The District purchases the majority of its supply from Everett. The principal source of water is Sultan Basin water, which has been filtered, treated, chlorinated, and fluoridated by Everett. Existing water rights on the Sultan River are sufficient to meet forecast demands for Everett and its wholesale customers beyond 2050.
The District also holds groundwater rights for its Lake Stevens Integrated, May Creek, Warm Beach, Skylite, Sunday Lake, 212 Market & Deli (Moa/Holbeck), and Otis water systems. Treatment provided for water systems supplied by wells varies, depending on the characteristics of the water supply. The District also has an emergency intertie with the City of Gold Bar. For the most part, the District’s existing water rights are sufficient to meet the foreseeable needs of the individual satellite systems and the District has no need to apply for new water rights.
Wellhead Protection: Individual wellhead protection plans have been developed for each of the District’s active Group A water systems, and a Susceptibility Assessment Survey was conducted for each system. As required by the state’s Wellhead Protection Program, the District has notified owners of property with potential contaminant sources of their presence. All federal, state, and local regulatory agencies with jurisdiction over the water systems have been advised regarding the delineated wellhead protection areas and potential contaminant sources. Contingency and emergency response plans have been developed for each system to ensure availability of safe drinking water in the event contamination occurs within or near a wellhead protection area.
ES-10 Operations and Maintenance Overview
The District utilizes established goals and procedures to maintain reliability, performance, and water quality under routine and emergency conditions. The goals and procedures are reviewed periodically to respond to new or revised regulations, updated best management practices and system modifications, and revisions in tools, equipment, and techniques. Guidelines and manuals are retained at the District’s Water Operations Facility and at the sites of specific equipment or
DRAFT
20-2733 Page ES-7 2021 Water System Plan Update February 2022 Snohomish County PUD No. 1
treatment facilities. In addition, operations and maintenance manuals required by DOH are on-site and updated as necessary to remain in compliance with all regulations.
Personnel Certification: The District is in compliance with all laws and regulations regarding staff certification and training. All water crew employees, including three foremen, possess DOH certifications. The levels of certification of all water field crews and the District’s management is included in Table 9-1. All personnel are actively encouraged to achieve the highest levels of certification possible.
Routine Operations and Preventive Maintenance: The District’s goal is to follow a routine schedule of operating, monitoring, and maintaining facilities within its water systems. The schedule considers the features, use and critical role of each component, the number of customers served, failure or breakdown history, availability of staff resources and industry standards for maintenance. In addition to visits by crew members, the supervisory control and data acquisition (SCADA) system electronically monitors the status at key pump stations, master meters, and reservoirs.
Vulnerability Assessment and Emergency Procedures: The District has adopted both a Continuity of Operations Plan (COOP), which is inclusive of all of the District’s departments and a departmental specific Emergency Response Plan (ERP). A Risk and Resilience Assessment (RRA) was completed in accordance with the 2018 America’s Water Infrastructure Act (AWIA).
ES-11 Water Quality and Compliance
The District is responsible for monitoring and compliance with all Safe Drinking Water Act (SDWA) and Washington Administrative Code (WAC) regulations. Because the District purchases the bulk of its water from Everett, the District is not responsible for documenting compliance with regulations that apply to source water. Everett is responsible for maintaining and documenting compliance with all requirements covering source water monitoring, maximum contaminant levels for specific compounds, filtered water quality, and disinfection contact times. The District complies with regulations pertaining to finished water impacts associated with disinfection in the distribution system. Since the water received from Everett is subsequently re-chlorinated, the District conducts chlorine residual monitoring.
The District does treat well water from the Lake Stevens and Warm Beach wells. An optimization study was completed for the Lake Stevens Water Treatment Facility (LSWTF) in 2019. The recommendations that came out of the study included installing pH adjustment treatment to optimize the facility under the Lead and Copper Rule. The District is in the process of finalizing the design and permitting necessary to make the operational changes with the goal of completing the improvements in 2022.
The water quality requirements for the District vary depending on the source of water for the specific system. The District’s water quality monitoring program meets all state and federal requirements.

DRAFT
20-2733 Page ES-8 2021 Water System Plan Update February 2022 Snohomish County PUD No. 1
Consumer Confidence Reports: The District provides an annual water quality report to its retail customers informing them of test results, including any violations of maximum contaminant levels. As a wholesale supplier, the District also provides its wholesale customers with the necessary water quality data and other related information needed to prepare their own consumer confidence reports each year.
Emerging Water Quality Regulations: Several new or revised SDWA regulations are on the horizon. District staff continues to anticipate and track development of these regulations.
ES-12 Improvement Plan
The District’s water system was designed and constructed to provide long-term, reliable service. The system is generally robust, with sufficient capacity to provide adequate supply and service pressures under most conditions. Improvements are needed over the next 20 years to repair and rehabilitate existing facilities and to add new capacity to meet the needs of planned growth.
Major planned system improvements and the estimated costs (in year 2021 dollars) include:
▪ Storage: New storage tanks will be constructed in the Warm Beach (one tank) and Lake Stevens Integrated (three tanks) Water Systems. Seven existing tanks are schedule for re-coats. A condition assessment and seismic analysis will be conducted for 12 older storage tanks. (Estimate $22.2 million (M))
▪ Pump Stations: The Granite Falls Pump Station will be retrofitted to meet 2040 demands, and capacity will be added to the Walker Hill Pump Station to boost zone pressures during fire flow demands. Improvements and pump replacements are planned for the Walker Hill, Machias, and East Hewitt Pump Stations. (Estimate $2.9M)
▪ Distribution Mains: There are approximately 408 miles of pipeline in the Lake Stevens Integrated System. When analyzing the needs of the distribution system, pipe projects were grouped into three categories: CIP-Funded, Developer-Funded, and Miscellaneous Main Replacement. Funding for developer projects comes solely from those developers requiring water service from the District. The CIP and Miscellaneous Main Replacements are estimated to cost $70.2M over the next 20 years.
▪ Overall Water System: Recommended projects that will benefit the overall water system total $26.6M over the next 20 years and include SCADA hardware and software upgrades, meter replacement, corrosion control optimization, conversion to advanced metering infrastructure (AMI) metering, security improvements, and new/replacement vehicles and equipment.
ES-13 Financial Plan
The purpose of the financial plan is to demonstrate the financial viability of the water utility to meet the system needs outlined in the WSP update. This analysis considers historical

DRAFT
20-2733 Page ES-9 2021 Water System Plan Update February 2022 Snohomish County PUD No. 1
performance, the sufficiency of utility revenues to meet current and future operating and maintenance (O&M) needs, policy obligations, and the impact of executing the CIP. The following plan demonstrates the ability of the water utility to maintain sufficient funds to construct, operate, and manage the system on a continuing basis, in full compliance with federal, state, and local requirements through the end of the planning period.
In developing the 2020-2040 financial forecast, three cost components were reviewed:
▪ Operation and maintenance expenses,
▪ Taxes and debt service, and
▪ Capital improvement projects.
▪ The CIP developed for this WSP identifies $87.0M in escalated project costs over the 10-year planning horizon. The 20-year period totals $172.1M in escalated project costs. Costs were escalated by 2.79 percent annually to the year of planned spending. The capital financing strategy developed to fund the CIP identified in this WSP assumes the following funding resources:
▪ Accumulated cash reserves;
▪ Excess cash (over minimum balance targets) from the Water System Revenue Fund;
▪ General Facilities Charge revenues;
▪ Interest earned on fund balances and other miscellaneous capital resources; and
▪ Revenue bond financing.
▪ The 20-Year proposed Capital Funding Strategy is shown in Table ES-1.
Table ES-1 | 20-Year Capital Funding Strategy
Year Capital Expenditures (escalated)
Revenue Bond Annual Funding
Cash Funding Total Financial Resources
2021 $5.7 $0.0 $5.7 $5.7
2022 $13.3 $0.0 $13.3 $13.3
2023 $13.5 $13.5 $0.0 $13.5
2024 $15.9 $2.8 $13.2 $15.9
2025 $7.8 $7.8 $0.0 $7.8
2026 $6.3 $2.3 $4.0 $6.3
2027 $6.5 $6.5 $0.0 $6.5
2028 $6.2 $3.6 $2.5 $6.2
2029 $6.2 $3.0 $3.2 $6.2
2030 $5.7 $0.0 $5.7 $5.7

DRAFT
20-2733 Page ES-10 2021 Water System Plan Update February 2022 Snohomish County PUD No. 1
Year Capital Expenditures (escalated)
Revenue Bond Annual Funding
Cash Funding Total Financial Resources
Subtotal $87.0 $39.5 $47.5 $87.0
2031-2040 $85.1 $30.7 $54.5 $85.1
Total $172.1 $70.1 $102.0 $172.1
▪ The financial forecast, or revenue requirement analysis, forecasts the amount of annual
revenue that needs to be generated by user rates. The analysis incorporates operating revenues, O&M expenses, debt service payments, rate-funded capital needs, and any other identified revenues or expenses related to operations. The objective of the financial forecast is to evaluate the sufficiency of the current level of rates. In addition to annual operating costs, the revenue needs also include debt covenant requirements and specific fiscal policies and financial goals of the District.
▪ The financial forecast indicates that the utility is currently covering all financial obligations under existing rates, however as the District prepares to fund the $172.1 million in needed capital improvements identified in the WSP, rates will need to increase annually to support the capital funding plan. The financial plan proposes the following rate increases and debt issuances to satisfy the identified future obligations of the utility, allowing for 59 percent cash funding of future capital improvements:
o 1.75 percent in 2022, followed by 2.15 percent from 2023 through 2030.
o Three new revenue bonds proposed in the ten-year planning period:
• $24M revenue bond in 2023, $10.14M revenue bond in 2027, and a $2.95M revenue bond in 2029.
• Annual new debt service payments are forecast to increase from $713,000 with the first issuance to $3.2M by the third new debt issuance. Including this new debt, total debt service will increase from $2.0M in 2021 to $4.3M by 2030.
▪ The results of this analysis indicate that annual rate increases are needed to provide revenue sufficient to cover all financial obligations of the utility. Rate increases are proposed at 1.75 percent in 2022, followed by 2.15 percent from 2023 through 2030.
▪ It is important to remember that the analysis performed in this chapter assumes population growth rates based on the assumptions outlined in Chapter 5, Planning Date and Demand Forecasting. If the future growth rates change, the existing rate strategy may need to be updated and revised.
▪ It is recommended that the District continue with the current practice of regular annual rate reviews and to update the key underlying assumptions that compose the multi-year financial plan to ensure that adequate revenues are collected to meet the District’s total financial obligations.

Chapter 1

THIS PAGE INTENTIONALLY LEFT BLANK

DRAFT
20-2733 Page 1-1 2021 Water System Plan Update February 2022 Snohomish County PUD No. 1
Chapter 1
Management, History, and General Description
1.1 Authority and Management
Snohomish County PUD No. 1 (District) is a municipal corporation of the State of Washington (State) created by a county-wide vote in 1936. The District is authorized to provide electric and water service to all portions of Snohomish County (County) and Camano Island not served by other municipal water utilities or districts.
Public Utility Districts (PUDs) are organized to provide utility service to their customers on a non-profit, cost of service basis. The authority to create municipal corporations to own and operate utilities outside of city limits began with approval of State Initiative No. 1 in the 1930 general election. The PUDs were originally formed to combat high electric rates charged by private utilities, to provide electricity in rural areas where service had been denied, and to provide water service in otherwise unserved areas.
The legal responsibilities and powers of the District, including establishment of rates and charges for services rendered, are exercised through a three-member Board of Commissioners elected from separate commissioner districts for staggered six-year terms. The District’s Water Utility is administered according to Revised Code of Washington (RCW) 54, municipal codes, applicable state codes, and the Policies and Procedures Manual for Administration of Water Services (Policy Manual) adopted by the Board of Commissioners and included in this plan as Appendix 1-1. Pursuant to RCW 90.03.015 and the beneficial use of its water rights, the District is recognized as municipal water supplier.
The District is also an approved Satellite Management Agency (SMA) authorized by the Washington Department of Health (DOH) to serve the County. State rules require any new water system to be owned and operated by a SMA if one is available and willing to provide service. The District’s most recent Satellite Management Program was approved in 2011. During this Water System Plan (WSP) Update the District has adjusted its Satellite Service Area and Satellite Management Program policies as more fully described in Chapter 2 and the District’s Policy Manual.
The District’s management and organizational structure is summarized in Figure 1-1 and Figure 1-2 at the end of this chapter. The Water Utility Assistant General Manager (AGM) is one of twelve positions reporting directly to the District’s Chief Executive Officer (CEO)/General

DRAFT
20-2733 Page 1-2 2021 Water System Plan Update February 2022 Snohomish County PUD No. 1
Manager. Figure 1-2 shows all current Water Utility staff. Further detail about the Water Utility’s organizational structure can be found in Chapter 9.
Copies of DOH Water Facility Inventory (WFI) forms and DOH Operating Permits are provided in Appendix 1-2 and Appendix 1-3. The WFIs summarize facility information and contain contact names, addresses, and phone numbers for DOH records. Operating Permits are a DOH compliance tool linked to annual performance evaluations of the water systems. A “Green” permit category means a water system is substantially in compliance with drinking water requirements.
1.2 History and Future
The District began water operations in 1946 with the acquisition of the Beverly Park Water System and construction of the Lake Stevens Water System. The District sold Beverly Park to the City of Everett (Everett) in 1960 when a large portion of that service area was annexed. The Lake Stevens Water System subsequently expanded through mergers with adjacent water systems and capital improvements. The District also became responsible for various satellite water systems over the years.
Today, the District owns and operates nine water systems throughout the County. These systems are listed in Table 1-1 and illustrated in Figure 1-3. DOH approved consolidation of the Warm Beach and Kayak water systems in December 2020 and is in process of combining them under the name and WFI # of the Warm Beach system. Table 1-1 shows the number of water services and population as they were reported to DOH in December 2019.
Table 1-1 | District Water Systems as of December 2019
Water System Name WFI # Reported Connections Reported Population
Lake Stevens Integrated 80907 1 20,775 51,625
Systems that will merge with the Lake Stevens Integrated Water System
Storm Lake Ridge 44431 6 242 605
Creswell 06325 V 23 57
Satellite systems that have been merged1
Warm Beach 93000 F 630 1,578
Kayak 23111 5 384 962
Satellite systems that will remain detached
May Creek 52105 0 492 1,215
Sunday Lake 85205 D 194 485
Skylite 80220 1 153 383
212 Market & Deli 04515 Q 2 25
Otis 06956 X 4 10 Note: 1. Water connections and population data is from 2019, before Warm Beach and Kayak were merged.

DRAFT
20-2733 Page 1-3 2021 Water System Plan Update February 2022 Snohomish County PUD No. 1
In the 1996 edition of its WSP, the District outlined a sub-area within its authorized service area described as the integrated water service area (WSA), where many water systems had consolidated over the years and where more water systems were expected to merge into an integrated water system. The District retained the name Lake Stevens for the integrated water system as it grew via further water main extensions and consolidations. Since completion of the 2011 edition of its WSP, the District completed water mains to connect Lake Stevens Integrated System to the Lake Roesiger and Pilchuck 10 Water Systems in 2011 and to the Dubuque and Cascade Acres Water Systems in 2014. Storm Lake Ridge and Creswell are the remaining District water systems to be merged with Lake Stevens Integrated System as growth occurs over the next 20 years. Figure 11-1, , shows the master plan to merge these systems. Merging the water systems will have no impact on the external boundary of the future service area, illustrated in Figure 2-1 in the next chapter.
District water systems outside of the integrated service area are known as satellite water systems because they are too far away to connect to the Lake Stevens Integrated System within the next 20 years. Warm Beach became the District’s most recent satellite water system when ownership transferred from the Warm Beach Water Association (WBWA) to the District in September 2018. As part of the process leading up to the Warm Beach ownership transfer, the District completed a feasibility study/project report in September 2016, which laid out the plan for improvements to Warm Beach and to connect it to the District’s Kayak Water System. These improvements and the connection would increase operational safety and redundancy of the Warm Beach system. The combined system is referred to as the Warm Beach Water System. Though the merged system has been approved by DOH (see Appendix 1-4), the two systems are still showing as separate systems in the DOH database. For the purposes of this WSP, the two systems will be referred to as the Warm Beach Water System except for where they must be differentiated from each other (e.g., when analyzing historical data).
It is possible that additional water systems could ask to consolidate with the District in coming years, either by connection to an existing District water system or as stand-alone satellite water system.
1.3 Accomplishments Since the 2011 Water System Plan
As shown in Table 1-2 and Table 1-3, the District’s water utility has been engaged in multiple projects since the 2011 edition of this WSP. Because the 2011 WSP presented data through 2009, Table 1-2 summarizes the length of pipe installed and Table 1-3 describes the District’s major water projects since 2010.
Table 1-2 | Length of Water Mains Constructed since 2010
Year In Service
Pipe Extensions Pipe Replacement*
By Developers (feet)
By District* (feet)
Total New Pipe (miles)
By Developers (feet)
By District* (feet)
Total New Pipe (miles)
2010 18,604 6,850 4.8 187 11,300 2.2
2011 13,803 27,250 7.8 880 7,155 1.5

DRAFT
20-2733 Page 1-4 2021 Water System Plan Update February 2022 Snohomish County PUD No. 1
Year In Service
Pipe Extensions Pipe Replacement*
By Developers (feet)
By District* (feet)
Total New Pipe (miles)
By Developers (feet)
By District* (feet)
Total New Pipe (miles)
2012 5,832 1,465 1.4 0 4,550 0.9
2013 15,569 0 2.9 100 0 0.0
2014 17,151 15,840 6.2 179 15,609 3.0
2015 8,506 0 1.6 3,024 7,900 2.1
2016 6,659 0 1.3 655 7,380 1.5
2017 14,502 0 2.7 0 3,390 0.6
2018 22,146 0 4.2 300 11,225 2.2
2019 41,280 0 7.8 0 14,808 2.8
Total 164,052 51,405 40.8 5,325 83,317 16.8 Note: 1. Description of District-constructed water mains is in Table 1-3
Table 1-3 | District Projects since 2010
Project Name (File #)
Description Year Completed
Projects to Support Population and Merge Systems in Lake Stevens Integrated Area
Granite Falls Alternate Route (WE-729)
This project installed approximately 6,850’ of new 12” ductile iron to enhance redundancy and reliability to the City of Granite Falls and the entire Granite Falls 726 Pressure Zone.
2010/11
Robe Menzel/ Menzel Lake Rd Extension (WE-761)
This project installed approximately 27,250’ of new 12” ductile iron water main to connect the District’s Lake Roesiger and Pilchuck 10 Water System Areas to Lake Stevens Integrated, providing redundancy in the District’s 810 Bosworth area as well as looping the Granite Falls 726 Pressure Zone with the Lake Roesiger 810 Pressure Zone for improved water quality, fire flows, and system redundancy.
2011/12
Tom Marks Main Extension (WE-804)
Installed approximately 1,465’ of 8” DI to loop Tom Marks Road. 2012
16th St NE Main Extension (WE-813)
This project installed approximately 1,614’ of new 8” ductile iron to enhance system hydraulics and redundancy to the City of Lake Stevens.
2014
Dubuque Intertie Project (WE-805)
This project installed approximately 14,226’ of new 12” ductile iron main to consolidate the District’s Dubuque Water System into Lake Stevens Integrated, making water storage available to customers in the Dubuque area. The project also allowed the District to assume ownership and consolidate the Cascade Acres Water System into Lake Stevens Integrated.
2014
North Lake Stevens Reservoir – Site Acquisition
Acquired property for the future 3.9 MG North Lake Stevens Reservoir in Lake Stevens Integrated.
2015
Satellite Water System Projects
Warm Beach Water System Acquisition
Completed Public Process, applied for and received DWSRF funding, and completed the acquisition of the Warm Beach Water System Area.
2018
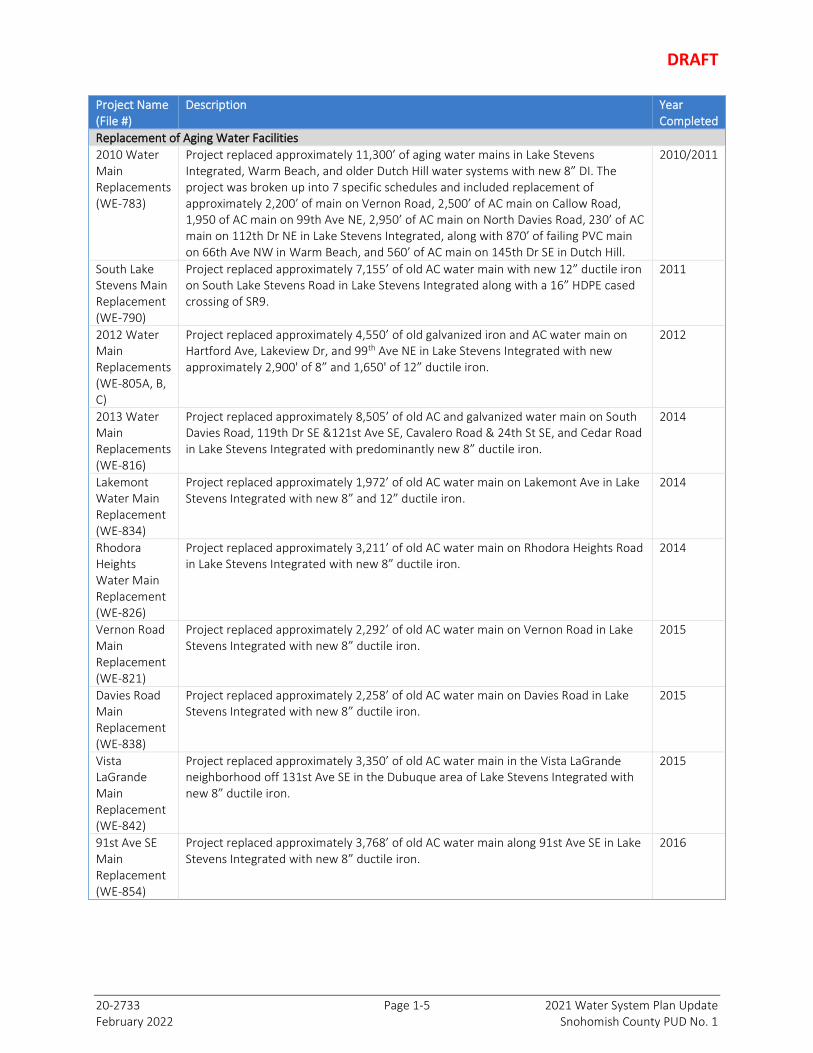
DRAFT
20-2733 Page 1-5 2021 Water System Plan Update February 2022 Snohomish County PUD No. 1
Project Name (File #)
Description Year Completed
Replacement of Aging Water Facilities
2010 Water Main Replacements (WE-783)
Project replaced approximately 11,300’ of aging water mains in Lake Stevens Integrated, Warm Beach, and older Dutch Hill water systems with new 8” DI. The project was broken up into 7 specific schedules and included replacement of approximately 2,200’ of main on Vernon Road, 2,500’ of AC main on Callow Road, 1,950 of AC main on 99th Ave NE, 2,950’ of AC main on North Davies Road, 230’ of AC main on 112th Dr NE in Lake Stevens Integrated, along with 870’ of failing PVC main on 66th Ave NW in Warm Beach, and 560’ of AC main on 145th Dr SE in Dutch Hill.
2010/2011
South Lake Stevens Main Replacement (WE-790)
Project replaced approximately 7,155’ of old AC water main with new 12” ductile iron on South Lake Stevens Road in Lake Stevens Integrated along with a 16” HDPE cased crossing of SR9.
2011
2012 Water Main Replacements (WE-805A, B, C)
Project replaced approximately 4,550’ of old galvanized iron and AC water main on Hartford Ave, Lakeview Dr, and 99th Ave NE in Lake Stevens Integrated with new approximately 2,900' of 8” and 1,650' of 12” ductile iron.
2012
2013 Water Main Replacements (WE-816)
Project replaced approximately 8,505’ of old AC and galvanized water main on South Davies Road, 119th Dr SE &121st Ave SE, Cavalero Road & 24th St SE, and Cedar Road in Lake Stevens Integrated with predominantly new 8” ductile iron.
2014
Lakemont Water Main Replacement (WE-834)
Project replaced approximately 1,972’ of old AC water main on Lakemont Ave in Lake Stevens Integrated with new 8” and 12” ductile iron.
2014
Rhodora Heights Water Main Replacement (WE-826)
Project replaced approximately 3,211’ of old AC water main on Rhodora Heights Road in Lake Stevens Integrated with new 8” ductile iron.
2014
Vernon Road Main Replacement (WE-821)
Project replaced approximately 2,292’ of old AC water main on Vernon Road in Lake Stevens Integrated with new 8” ductile iron.
2015
Davies Road Main Replacement (WE-838)
Project replaced approximately 2,258’ of old AC water main on Davies Road in Lake Stevens Integrated with new 8” ductile iron.
2015
Vista LaGrande Main Replacement (WE-842)
Project replaced approximately 3,350’ of old AC water main in the Vista LaGrande neighborhood off 131st Ave SE in the Dubuque area of Lake Stevens Integrated with new 8” ductile iron.
2015
91st Ave SE Main Replacement (WE-854)
Project replaced approximately 3,768’ of old AC water main along 91st Ave SE in Lake Stevens Integrated with new 8” ductile iron.
2016

DRAFT
20-2733 Page 1-6 2021 Water System Plan Update February 2022 Snohomish County PUD No. 1
Project Name (File #)
Description Year Completed
123rd Ave SE & 12th St SE Main Replacement (WE-839)
Project replaced approximately 3,612’ of old AC water main along 123rd Ave SE and 12th St SE in Lake Stevens Integrated with new 8” ductile iron.
2016
117th Ave NE Water Main Replacement (WE-869)
Project replaced approximately 1,390’ of old AC water main along 117th Ave NE in Lake Stevens Integrated with new 8” ductile iron.
2017
Vernon West Main Replacement (WE-841)
Project replaced approximately 2,000 of old AC water main along Vernon Road in Lake Stevens Integrated with new 8” ductile iron.
2017
Frontier Circle West Main Replacement (WE-867)
Project replaced approximately 7,700’ of old AC water main along Frontier Circle West and the Frontier Heights neighborhood in Lake Stevens Integrated with new 8” and 12” ductile iron.
2017/18
87th Ave NE Main Replacement (WE-888)
Project replaced approximately 3,525’ of old AC water main along 87th Ave NE in Lake Stevens Integrated with new 8” ductile iron.
2018
32nd St SE Main Replacement (WE-887)
Project replaced approximately 8,331 of old AC water main along 32nd St SE in Lake Stevens Integrated with new 8” ductile iron.
2019
101st Ave NE Main Replacement (WE-899)
Project replaced approximately 450’ of old AC water main along 101st Ave NE in Lake Stevens Integrated with new 4” ductile iron.
2019
114th Dr NE, 11th Dr NE Main Replacement (WE-901)
Project replaced approximately 2,501’ of old AC water main along 114th Dr NE and 11th Dr NE in Lake Stevens Integrated with new 8” ductile iron.
2019
116th Ave NE, 26th St NE Main Replacement (WE-902)
Project replaced approximately 3,526’ of old AC water main along 116th Ave NE in Lake Stevens Integrated with new 8” ductile iron.
2019
1.4 Overview of Existing Water Systems
The District currently provides water through nine water systems located throughout the County. Current water service spans an area extending from the City of Stanwood (Stanwood) to the City of Gold Bar (Gold Bar) and from the City of Lake Stevens to the City of Arlington (Arlington). Most of the systems are classified as “Group A Community” water systems because they serve 25 or more year-round residents. The 212 Market & Deli is a “Group A Transient Non-

DRAFT
20-2733 Page 1-7 2021 Water System Plan Update February 2022 Snohomish County PUD No. 1
Community” system because it serves an average non-residential population of 25. Otis is a “Group B” water system because it serves less than 25 residents.
All the District’s water systems are continuously chlorinated except for water delivered to four customers on the Otis Water System. Water supply purchased from the Everett filter plant and produced from the Lake Stevens Integrated wells is also fluoridated. The Sunday Lake and Warm Beach Systems have filtration treatment to remove manganese, iron, and a trace of hydrogen sulfide, which occur naturally in the well water. Water from the well serving the Skylite Water System is aerated as it enters the storage tanks to raise the pH and reduce the degree of corrosiveness toward copper plumbing.
Following is a description of each water system. Detailed information on the water facilities is provided in Chapter 4.
Lake Stevens Integrated – The Lake Stevens Integrated Water System is the District’s largest water system supplying water to the City of Lake Stevens and City of Granite Falls (Granite Falls) areas. Most of the water for this system is obtained from Everett’s filter plant and is supplemented by treated water from the Lake Stevens Integrated System Wells. The purchased water from the Everett is supplied by six taps on the Everett No. 3 Pipeline (3-Line), three taps on the Everett No. 5 Pipeline (5-Line), and one tap on the line shared with the Marysville Joint Operating Agreement (JOA) Line, which is also connected to the 3-Line. In an emergency, several of these taps can be switched to Everett’s No. 2 pipeline (2-Line). The Lake Stevens Integrated System contains 25 pressure zones, serving a wide range of elevations from almost sea level to over 700 feet. Lake Stevens Integrated also has 14.2 million gallons (MG) of water storage in eight tanks located on five sites throughout the system.
Storm Lake Ridge – The Storm Lake Ridge Water System supplies water to the Storm Lake Ridge community and surrounding area approximately three miles east of Machias and five miles north of the City of Monroe (Monroe). The system is supplied by a tap on Everett’s 5-Line from which water is pumped into the distribution system and then to a concrete reservoir. There is a small “boosted” pressure zone served by pumps in the vicinity of the storage tank.
Creswell – The Creswell Water System (formerly known as Butterfield) is supplied from a tap on Everett’s 3-Line at the northwest corner of Dubuque Road and Creswell Road. There is also a connection from Everett’s 2-Line as a backup. Creswell does not have a storage tank but will eventually be merged into the District’s adjacent Lake Stevens Integrated System that does have storage.
Warm Beach – The Warm Beach Water System is the most recent addition to the District’s water systems. Warm Beach is located near the Puget Sound, just north of the Tulalip Reservation and about three miles south of Stanwood. This system has three pressure zones with a bolted steel reservoir in the middle zone. The upper zone is served by a booster pump station (BPS) and the lower zone is served by two pressure reducing stations. Two active wells are treated to supply the system. One of these wells is treated, and treatment is planned for the second well.

DRAFT
20-2733 Page 1-8 2021 Water System Plan Update February 2022 Snohomish County PUD No. 1
Additionally, the Kayak Water System to the south has been merged with the adjacent Warm Beach Water System. The Kayak portion of Warm Beach has two active wells that pump through treatment to the distribution system. A concrete tank is located at the highest ground elevation on the east side of the system, and pressure reducing stations control water pressure to lower elevations on the west side of the system.
Kayak – See Warm Beach Water System
May Creek – The May Creek Water System, located east of Gold Bar, supplies water to the May Creek community and surrounding area. The system has two wells which supply water to the distribution system and two concrete reservoirs. Chlorine is added to the well water. An emergency intertie connects May Creek to the Gold Bar Water System.
Sunday Lake – The Sunday Lake community is supplied by a single well located west of the lake. The water is treated before it is sent to the distribution system and a concrete storage tank. A BPS serves a newer development northwest of the original Sunday Lake subdivision.
Skylite – The Skylite Water System is located south of Highway-2 between the City of Sultan (Sultan) and Gold Bar and south of the Skykomish River. The system is supplied by a single well equipped with two pumps. The well water is chlorinated and aerated as it fills an adjacent concrete tank. Water is then pumped from the tank into the distribution system.
212 Market & Deli – The 212 Market & Deli Water System (formerly known as Moa/Holbeck) supplies water to a gas station and convenience store near Exit 212, southwest of the intersection of I-5 and Highway 532. The system is supplied by a well which pumps chlorinated water to a small concrete storage tank. Water is then pumped from the tank to the store.
Otis – The Otis Water System is designed to serve five lots and currently supplies water to four homes north of 196th Street NE on Burn Road. A single well supplies water directly to the homes.
The District’s Jackson Hydroelectric Plant also has a tap on the Everett 5-line for its drinking water supply. Because the District does not sell this water, Jackson is considered a commercial customer of Everett. The District also shares ownership of a separate transmission main from the Everett 5-line to Sultan in the vicinity of the power plant. The District currently has no customers on this transmission main and Sultan pays Everett directly for the water that it consumes.
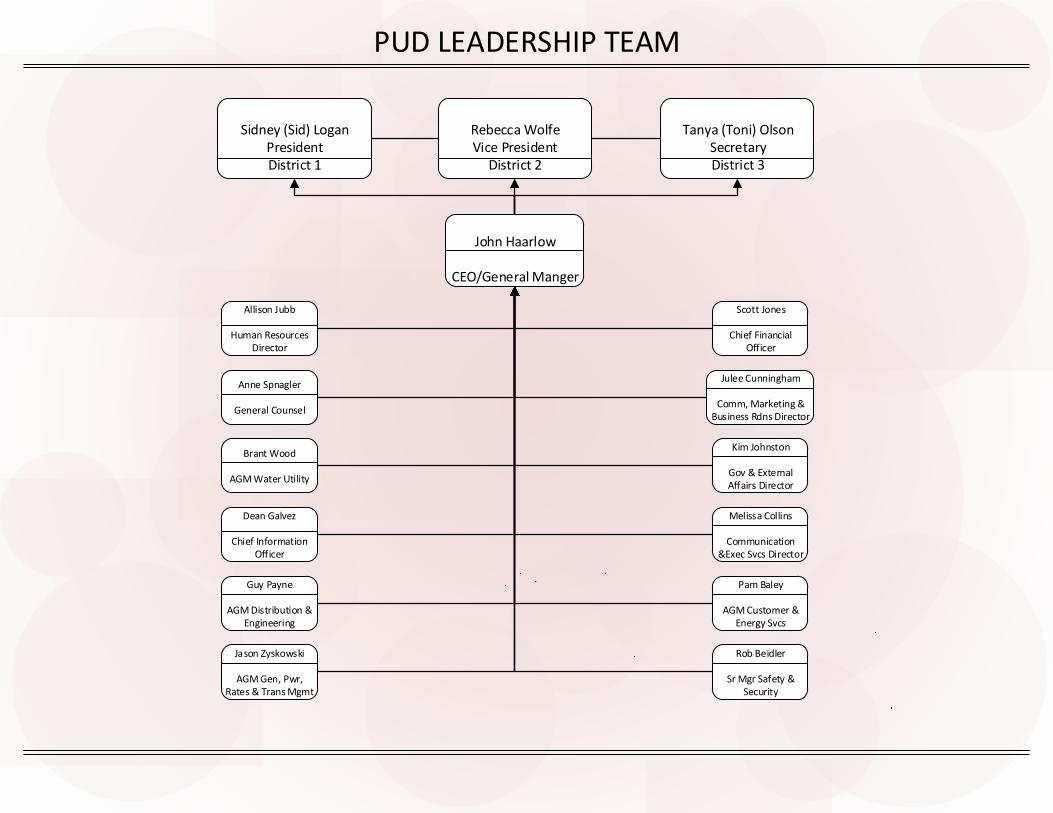
PUD LEADERSHIP TEAM
John Haarlow
CEO/General Manger
Allison Jubb
Human Resources Director
Anne Spnagler
General Counsel
Sidney (Sid) LoganPresidentDistrict 1
Rebecca WolfeVice President
District 2
Tanya (Toni) OlsonSecretaryDistrict 3
Brant Wood
AGM Water Utility
Dean Galvez
Chief Information Officer
Guy Payne
AGM Distribution & Engineering
Julee Cunningham
Comm, Marketing & Business Rdns Director
Melissa Collins
Communication &Exec Svcs Director
Rob Beidler
Sr Mgr Safety & Security
Kim Johnston
Gov & External Affairs Director
Pam Baley
AGM Customer & Energy Svcs
Jason Zyskowski
AGM Gen, Pwr, Rates & Trans Mgmt
Scott Jones
Chief Financial Officer

Water Resources
Christina Arndt
Manger WaterBusiness Services
Tracy Boggs
Utility Administrator
Veronica Black
Water Utility Specialist
Misty Stevens
Sr. Water Service Liaison
Lois Stone
Water Service Liaison
Amy Tonsgard
Water Utility Associate
Paul Federspiel
Principal Engineer
Karen Heneghan
Principal Engineer
Max Selin
Principal Engineer
Kevin Presler
Engineering Tech III
Lillian Manley
Engineering Tech I
Brant Wood
AGM Water Utility
Dale AschenbrennerCrew Coordinator
Brett Gehrke
Water Superintendent
Arlee BarkerWater Distribution Specialist
Thomas BladesWater Distribution Specialist
Tucker NiemanWater Distribution Specialist
Alan LunaWater Foreman
Maint & Op
Zach McKinneyConstruction Foreman
Lee ErvinConstruction Inspector
Tom HeaphyWater Distribution Specialist
Noah RuiWater Woker
Ron SheppardWater Distribution Specialist
Jonathan EbertWater Distribution Specialist
Monte VitaleWater Distribution Specialist
Glenn EstabayaStorekeeper
Jeff OgivileWater Electrician
TBAWater Distribution Specialist
TBAWater Helper
elisheva.walters
Text Box
Kassidi Neal
elisheva.walters
Text Box
Andrew Jacques
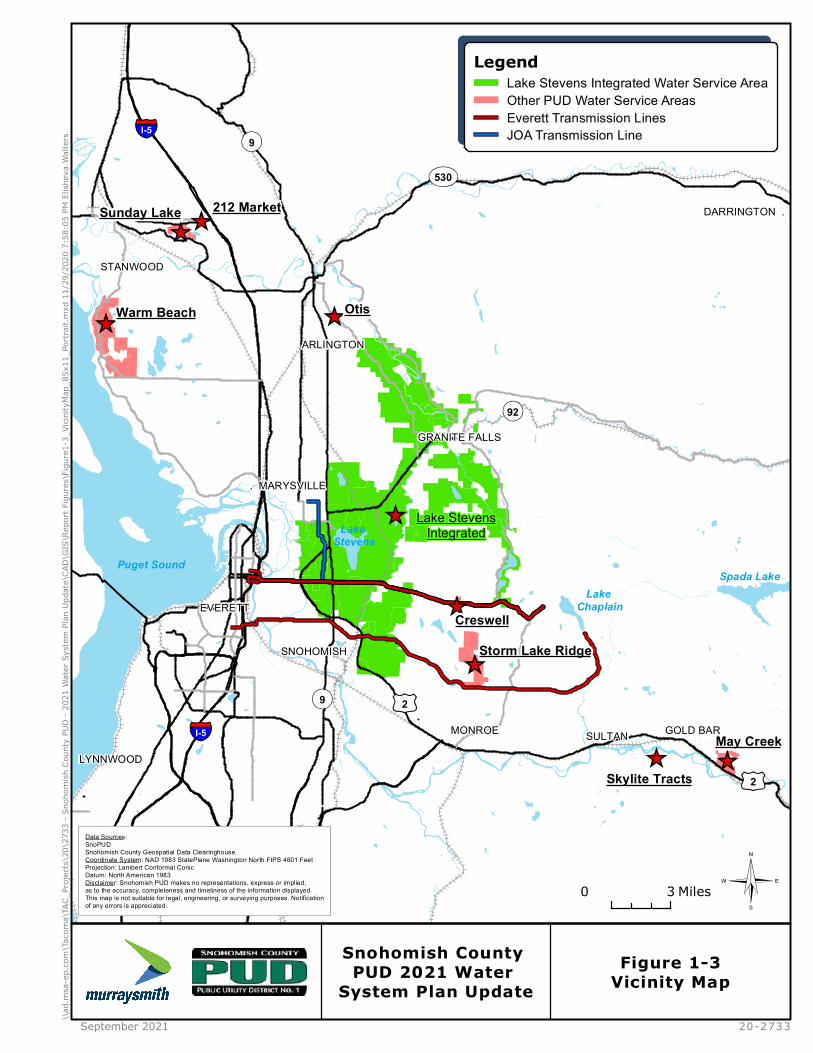
\\ad.
msa-
ep.co
m\Ta
coma
\TAC
_Pro
jects\
20\2
733
- Sno
hom
ish C
ount
y PUD
- 20
21 W
ater
Sys
tem
Plan
Upda
te\C
AD\G
IS\R
epor
t Figu
res\F
igure
1-3_
Vicini
tyMa
p_85
x11_
Portr
ait.m
xd 11
/29/
2020
7:5
8:05
PM E
lishe
va.W
alter
s
Spada Lake
Lake Chaplain
Lake Stevens
ST530
_̂_̂
_̂
_̂
_̂ _̂
_̂
Sunday Lake 212 Market
Otis
Storm Lake Ridge
May Creek
Skylite Tracts
Creswell
_̂
_̂Warm Beach
§̈¦I-5
Puget Sound
EVERETT
. MARYSVILLE
SULTAN
Lake StevensIntegrated
DARRINGTON .
GRANITE FALLS
GOLD BAR
SNOHOMISH
STANWOOD
LYNNWOOD
ARLINGTON
MONROE§̈¦I-5¬«9
¬«9
¬«92
£¤2
£¤2
20-2733September 2021
0 3 Miles
LegendLake Stevens Integrated Water Service AreaOther PUD Water Service AreasEverett Transmission LinesJOA Transmission Line
Snohomish County PUD 2021 Water
System Plan UpdateFigure 1-3
Vicinity Map
Data Sources:SnoPUDSnohomish County Geospatial Data Clearinghouse.Coordinate System: NAD 1983 StatePlane Washington North FIPS 4601 FeetProjection: Lambert Conformal ConicDatum: North American 1983Disclaimer: Snohomish PUD makes no representations, express or implied,as to the accuracy, completeness and timeliness of the information displayed.This map is not suitable for legal, engineering, or surveying purposes. Notificationof any errors is appreciated. ©

DRAFT
20-2733 Page 1-12 2021 Water System Plan Update February 2022 Snohomish County PUD No. 1
THIS PAGE INTENTIONALLY LEFT BLANK

Chapter 2

THIS PAGE INTENTIONALLY LEFT BLANK

DRAFT
20-2733 Page 2-1 2021 Water System Plan Update February 2022 Snohomish County PUD No 1
Chapter 2
Service Areas and Policies
This chapter summarizes regulatory requirements for the District’s Water Systems. It also describes current and proposed service area boundaries and summarizes related policies.
2.1 Background
The District is authorized by RCW 54.04.030 to provide water service within and outside the corporate boundaries of Snohomish County. The District is also expressly recognized under the 2003 Municipal Water Law (MWL) as a municipal water supply system pursuant to RCW 90.03.015. Two state statutes set the requirements for water system service areas: (1) MWL, and (2) the 1977 Public Water System Coordination Act. The following sections describe how the provisions and criteria set by these statutes and implementing rules affect the District’s Water Systems and policies.
2.1.1 Municipal Water Law: Rules and Related Policies
In 2003, the MWL was passed by the State Legislature. The MWL and related DOH rules changed how municipal water suppliers are to describe their water system service area(s) within their WSPs. To this end, DOH rules were adopted in 2008 and later amended in 2016 to require municipal water supply systems to identify within WSPs, their retail, future, and wholesale service areas as applicable. The following text describes the categories of service areas applicable to District operations.
▪ Retail Service Area (RSA): The specific area designated by the municipal water supplier where it has a duty to provide service to all new service connections as set forth in RCW 43.20.260.
▪ Future Service Area: The specific area a water system in a Critical Water Supply Service Area (CWSSA) plans to provide water service as determined by a written agreement between purveyors under Chapter 70.116 RCW and Chapter 246-293 Washington Administrative Code (WAC). No duty to serve is required for areas designated as future service areas (if they are unserved and fall outside of a designated RSA). Future service areas generally correspond to the service area a purveyor claims in a Coordinated Water System Plan (CWSP).
▪ Wholesale Service Area: A municipal water supplier may designate a wholesale WSA within a WSP or update. In this regard, a wholesale water system refers to “a public water system that treats source water as necessary to produce finished water and then

DRAFT
20-2733 Page 2-2 2021 Water System Plan Update February 2022 Snohomish County PUD No 1
delivers some or all of that finished water to another public water system. Delivery may be through a direct connection or through the distribution system of one or more consecutive systems.” (40 CFR 141.2)
Prior to 2017, WAC 246-290 included a definition for existing service area (ESA) as the area within which direct service or retail service connections are currently available. A direct service connection is a service hookup to a property where an extension of a distribution main would not be needed to provide service. Although there is no longer a requirement to show the ESA, the District is continuing this practice because it helps to show how the RSA extends beyond the areas with existing distribution mains.
Retail Service Area: Duty to Serve
Pursuant to RCW 43.20.260, a municipal water supply system has a duty to serve new connections falling within a designated RSA occurs if the following criteria can be met:
1. Sufficient capacity exists to serve water in a safe and reliable manner;
2. Service can be provided in a manner consistent with provisions of adopted land use plans and development regulations that reasonably relate to water service;
3. Sufficient water rights exist to provide the service;
4. Service can be provided in a timely and reasonable manner.
Regarding the “duty to serve” conditions 1, 2, and 3, this WSP Update evaluates District water facilities, water sources, and water rights to ensure that planned improvements are at least sufficient to support projected growth in the retail portion of the WSAs over a 10-year planning period. Further, this WSP Update is consistent with applicable county and city land use comprehensive plans and policies. This condition is also satisfied through ongoing coordination with local jurisdictions as they process permits in the District’s service areas.
Condition 4 is addressed by conducting business in accordance with District procedures for providing timely and reasonable water service, as described later in this chapter.
The MWL did not define “timely and reasonable” for designated RSAs. The DOH has determined per rule guidance, however, that municipal water suppliers are responsible within their WSPs for identifying the “timely and reasonable” criteria and dispute resolution process for their RSAs. Such criteria and processes may be distinct from the CWSP criteria and process involving future service areas.
2.1.2 Coordinated Water System Planning in Snohomish County
The Coordination Act of 1977 applies where a county declares a CWSSA. By declaring a CWSSA, the local government determines that coordinated planning among water purveyors within the area is essential for orderly development.

DRAFT
20-2733 Page 2-3 2021 Water System Plan Update February 2022 Snohomish County PUD No 1
The County Council declared North Snohomish County to be a CWSSA on October 19, 1988. As the next step, the North Snohomish Water Utility Coordinating Committee (NSWUCC) was formed to implement Coordination Act requirements. Membership consists of systems with 50 or more services in the CWSSA and representatives from the County, Snohomish Health District, DOH, and the Tulalip Tribes. The first NSWUCC action was to define the external boundary of the CWSSA, which is illustrated in the North Snohomish County CWSP figure, see Appendix 2-1. This boundary was ratified by the County Council on July 5, 1989 and remains unchanged to this day.
Members of the NSWUCC worked together to create the North Snohomish CWSP, which was completed in 1991 and most recently updated in 2010. The 2010 CWSP Update sets minimum standards that must be followed by all water systems in unincorporated parts of the CWSSA. It also designates service area boundaries for each system to prevent overlapping or redundant water service. For this effort, the proposed service areas of participating systems were combined on a base map, and efforts were made to resolve conflicting boundaries. Then, each system signed a Service Area Agreement and submitted individual WSPs to demonstrate responsibility for their designated area. The District’s agreement can be found with Resolution 4590 in Appendix 2-2.
The NSWUCC also established a Utility Service Review Procedure (USRP) to identify water service for new developments located within future service areas, with a goal to minimize creation of new public water systems. As administrator of the USRP, the County refers each subdivision to the closest water utility in this order of precedence: (1) public water supplier in a designated future WSA, (2) adjacent water utilities that intend to expand, (3) the District, or (4) other approved SMAs. If water service is not “available” from these purveyors, the subdivision can proceed with individual wells, or a new water system can be created to serve the project under certain conditions.
As discussed earlier, the MWL had the effect of modifying the definition and responsibilities of municipal water system service areas within their planning areas, with particular regard to RSA designation and policies. The RSA policies may or may not directly correspond with all of the policies cited in a CWSP pertaining to future (claimed) service areas. More detail regarding the CWSP can be found in Appendix 2-1.
2.1.3 Satellite Management Agencies
The concept of SMAs was introduced with the Coordination Act. The SMAs can own or operate more than one water system on a regional or countywide basis, without the necessity for a physical connection between such systems. An SMA may prescribe a service area and conditions of service that correspond to SMA acceptance, operational, and financial criteria.
The Coordination Act was amended in 1991 to require counties to identify SMAs to serve in areas where no water purveyor is designated. When a new water system is proposed in an area not claimed by an existing system, local agencies must refer it to one or more qualified SMA, to explore the possibility of the SMA either owning or operating the new system.

DRAFT
20-2733 Page 2-4 2021 Water System Plan Update February 2022 Snohomish County PUD No 1
In 1995, Senate Bill 5448 further tightened requirements by specifying that new public water systems must be owned by an SMA, rather than just requiring that the option be explored. If an SMA is not “available,” the new system can be approved with a condition that it will be owned or managed by an SMA in the future if such management or ownership can be made with reasonable economy and efficiency. A 1995 guidance memo from DOH to local government jurisdictions emphasized that these provisions apply to any new water system, down to the smallest systems serving only two houses.
2.1.4 Growth Management Act
The Growth Management Act (GMA) was enacted to ensure a continuation of the State’s high quality of life. The GMA originally passed in 1990 and has been amended several times since. The basic objective is to encourage local county and city governments to develop and implement 20-year Comprehensive Plans that incorporate their vision of the future within the framework of the broader needs of the State.
Under the GMA, municipalities must complete their own Comprehensive Plans while coordinating planning efforts with those of the county and surrounding municipalities. Likewise, water service provided by expanding public water systems must be consistent with land uses established in the Comprehensive Plans, as well as with WSAs established in CWSPs or other state approved planning processes.
The GMA requires water purveyors to provide evidence of adequate water service before the County will issue a permit for new development in unincorporated areas. Therefore, the District must anticipate the location of future development and plan for construction of water distribution systems sufficient to meet future demands.
The District serves water customers within the Urban Growth Areas (UGA) of four cities: The City of Lake Stevens, Granite Falls, Gold Bar, and the City of Snohomish. The District’s WSAs have been developed to be consistent with the land use plans of the jurisdictions it serves.
2.2 District Water Service Areas Adjustments
As noted above, because the District is a municipal water supplier, it must identify its retail service area and future service area in accordance with the MWL. As noted earlier, the RSA is where the District has a “duty to serve”, subject to referenced statutory criteria. Service areas in the North Snohomish County CWSP figure (see Appendix 2-1), described in the previous section, are future service areas. All of these terms were explained previously.
Figure 2-1 and Figure 2-2 show the District’s proposed WSAs adjusted as appropriate to correspond to applicable MWL criteria, District operational criteria, and land use development trends. Section 2.2.1 describes adjustments to the District’s future service area boundaries that are being submitted to adjacent water purveyors for review. Section 2.2.2 describes changes the District’s Satellite Water System Management service area. Section 2.3 will describe all resulting

DRAFT
20-2733 Page 2-5 2021 Water System Plan Update February 2022 Snohomish County PUD No 1
service areas, including the RSAs within the future service areas where the MWL “duty to serve” criteria will apply.
The District has determined that no purveyors will be affected by the service area adjustments. A conformed and revised future service area map (Figure 2-1) will be provided to the NSWUCC and submitted to the County Planning Department.
2.2.1 Future Service Area Adjustments/Relinquishments
As part of this WSP Update, the District intends to voluntarily diminish and relinquish parts of its CWSP-based future service area as depicted on Figure 2-1. The reason for such action is based on the following factors and developments. This section also clarifies boundaries with some water utilities that are immediately adjacent to the District’s future service areas.
The District has determined that no purveyors will be affected by the service area adjustments. After review by the adjacent water purveyors, a conformed and revised future service area map (Figure 2-1) will be provided to the NSWUCC and submitted to the County Planning Department.
2.2.1.1 Removing the Lake Goodwin Future Service Area
Prior to 2011, the District was approached by a developer interested in extending water from Lake Stevens Integrated to a project on the north side of the Seven Lakes Water Association. Although it appears the Seven Lakes Water Association did not have capacity to serve the project, it did not formally decline to serve.
At the request of the developer, the District issued a letter of water availability stating that water could be provided from the Lake Stevens Integrated System, if facilities were extended at the developer’s expense. The District then showed the project within the District’s Lake Goodwin future service area which overlapped the service area claimed by Seven Lakes Water Association. The District did not oppose Seven Lakes Water Association serving the project but was prepared to assume the water service role if the Seven Lakes Water Association was unable to serve. By not agreeing to serve the project, that portion of the Seven Lake’s service area was considered relinquished according to Coordination Act and CWSP procedures.
Subsequent to 2011, the preliminary plat for the development and the water availability certificate provided to the developer expired and all work on the project has terminated. There is no evidence that any new development is being planned at this time or in the foreseeable future. Because of this, the District intends to remove the Lake Goodwin area from its future service area. The District has determined that no purveyor, including the Seven Lakes Water Association, will be affected by this service area adjustment.
2.2.1.2 Pulling Back Northeast of City of Arlington Future Service Area
The District intends to relinquish part of its future service area that is east and northeast of Arlington. The new future service area boundary shall follow along the boundary of Arlington

DRAFT
20-2733 Page 2-6 2021 Water System Plan Update February 2022 Snohomish County PUD No 1
and the Sudden View WSAs on the west, then along the District’s current RSA as was depicted in the 2011 WSP, and along the south side of Jim Creek to the east until intersecting with the District’s current future service area boundary.
Reasons for relinquishing this portion of the District’s future water service area include the following:
▪ Restrictions that were placed on pipeline sizing when the water main along Jordan Rd was constructed make it difficult to achieve the District’s fire flow goals into the area
▪ The District has not received significant requests for water service in the area that would justify the facility investments that would be needed to properly serve the area
2.2.1.3 Pulling Back East of Storm Lake Ridge Service Area
The District intends to relinquish the future service area that is east of the Storm Lake Ridge Water System. The new future service area boundary shall follow along the western boundary of Commercial Forest – Forest Transition Area (CF-FTA). This corresponds to the eastern edge of the RSA, which, as defined later per the County’s 2015 General Policy Plan, allows for development with the CF-FTA.
Land use in the area that is being removed is designated as Low Density Rural Residential with 1 dwelling unit per 20 acres and there is an island of CF-FTA designated land within that area. To loop a water main through that low-density rural area would involve passing through the Highland Water District service area. Considering these boundaries and the unlikely cost-effectiveness for water service extensions, the revised service area follows the western edge of the CF-FTA “island.”
2.2.1.4 Service Area Adjustment with City of Marysville
In 2013-14, a portion of the District’s service area west of Highway 9 and north of Soper Hill Rd was transferred to the City of Marysville. This change has already been made to the CWSP map in Appendix 2-1. The figures in the District’s WSP are now also being updated to reflect this change.
2.2.1.5 Service Area Adjustment with City of Granite Falls
In 2020, Granite Falls signed a new wholesale water agreement with the District, which can be found in Appendix 3-2. The exhibit in the agreement reflects a couple adjustments to Granite Falls’ future service area compared to the depiction in their 2013 WSP and on the CWSP map in Appendix 2-1. The District considers its future service area boundary to be adjusted with Granite Falls in accordance with the 2020 agreement.
Furthermore, Granite Falls’ mapping shows the City has a pipe serving several lots outside their future service area to the southeast along Menzel Lake Road. The District is adding those lots to its wholesale water service area because they receive water that Granite Falls purchases from
DRAFT
20-2733 Page 2-7 2021 Water System Plan Update February 2022 Snohomish County PUD No 1
the District. It is understood that Granite Falls will show those customers within their existing service area, although they may choose to leave them outside of their future service area. If Granite Falls does not add those lots to their future service area, the PUD will leave them in its future service area even though District does not have any pipes near those lots and does not currently have plans to extend a pipe up Menzel Lake Road. The City of Granite Falls is preparing its WSP Update. It is expected that their future service area boundary will also be consistent with the description above, which is reflected in Figure 2-1 and Figure 2-2.
2.2.1.6 Service Area Adjustment with City of Snohomish
The District provides water service to several properties in the northwest portion of Snohomish’s UGA and city limits. These lots are labeled on a copy of the City of Snohomish’s Land Use Designation Map in Appendix 3-3F.
In 2011, the District and the City of Snohomish cooperated to identify a common boundary for their future water service areas. The 2011 boundary revision was described in Section 3.2.3 of the District’s 2011 WSP and is reflected on the CWSP Map in Appendix 2-1 and in the service area figures of the District’s 2011 WSP and the City of Snohomish’s WSP.
In 2012, the District water main serving the Snohomish School District bus barn was extended an additional 500 feet into the future service area claimed by the City of Snohomish along Sinclair Ave for an office building the City of Snohomish was unable to serve. One existing house fronting the water main also connected. When the development was proposed in 2008, the property had not yet been annexed into the city limits. According to the North Snohomish CWSP Utility Service Review Procedure (which applies outside of incorporated city limits), that part of the City of Snohomish water service area would have been considered relinquished because the City of Snohomish did not agree to provide timely and reasonable water service when it was requested. The area was subsequently annexed into the City of Snohomish.
The District is adding the two lots described above (at 3800 and 3811 Sinclair Ave) to its service area. Continued District service to these lots is authorized within city limits, according to RCW 54, which regulates Public Utility Districts. Other unserved lots adjacent to the District’s water main on Sinclair Ave are now inside the Snohomish city limits and in their future service area. If the District receives a connection request from these properties, it should first contact Snohomish to determine if they decline to provide the water service and provide documentation of any further adjustment to the agreed water service area to the County.
Additionally, the District is slightly pulling back its future service area in the vicinity of 92nd St SE and Highway 2 (west of Bartelheimer dairy) because of an overlap with the City of Snohomish’s water service area. The City of Snohomish’s WSP shows they have existing pipes in that area, outside of their UGA and city limits. The District has no objection to the City of Snohomish continuing to serve that area.

DRAFT
20-2733 Page 2-8 2021 Water System Plan Update February 2022 Snohomish County PUD No 1
2.2.1.7 Reducing the Sunday Lake Future Service Area
The 2011 WSP depicted the Sunday Lake future service area extending east all the way to I-5, west to Stanwood’s service area boundary, north approximately 4,000 feet from the existing pipes and south to the top of the steep slope above Pioneer Highway. Considering that this might be overextending, the District has decided to pull back the Sunday Lake future service area to match the previously identified retail service area boundary, where the District is confident it can meet its duty to serve.
2.2.2 Satellite Management System Service Area
When first planned, the District’s satellite system area was designated as the entire County, less those areas claimed or served by other purveyors as retail and/or future service areas. The District was most recently approved to serve as a SMA throughout the County as a result of its 2011 WSP update.
Within the CWSSA boundary, the CWSP gives the District first priority as the SMA. If the District decides a proposed water system is not feasible to serve, the County will refer the project to another approved SMA. The District’s Satellite System Management (SSM) Policies may be found in Section 4 of the District Water Policy Manual.
As part of this WSP update, the District has elected to adjust and diminish the SMA service area reflected in its 2011 Satellite Management Plan from the entire area of unincorporated County to that area depicted in Figure 2-1 that falls within the existing CWSSA boundary, plus Skylite.
The primary reason for the adjustments is based on the District’s determination that it does not believe that it would be technically or financially feasible to provide SMA services to the entire originally delineated CWSSA SMA service area.
In addition to the above SMA service area adjustment, the District has revised its Policies, Procedures, and Conditions as described in Chapter 4 of the SMA Policy Manual and Section 2.4.3 of this Chapter.
2.3 Resulting District Water Service Areas
Following is a description of the resulting District service areas after the above adjustments are factored into the boundaries previously established in the District’s 2011 WSP. This includes description of the existing service areas and RSAs within the future service areas. As noted earlier, the RSA is where the District has a “duty to serve.” Service areas in the North Snohomish County CWSP figure (see Figure 2-1) described in the previous section, are future service areas. All of these terms were explained previously.

DRAFT
20-2733 Page 2-9 2021 Water System Plan Update February 2022 Snohomish County PUD No 1
2.3.1 Lake Stevens Integrated Water Service Area
The District’s 2011 WSP updated the eastern boundary of its Lake Stevens Integrated WSA to match the edge of the CF-FTA in the County Comprehensive Plan, and further proposed adjustments were described in Section 2.2.1. The CF-FTA is a quarter-mile wide overlay along the perimeter of Commercial Forest (CF) land use areas. The County’s 2015 General Policy Plan intended to allow partial development in the CF-FTA at one dwelling per 10 to 20 acres, but only if adjacent land use restricts normal forest practices. Otherwise, the minimum lot size is 80 acres. Excluding the CF-FTA at the eastern edge of the WSA simply indicates that the District does not foresee water facilities in that area, because it is unlikely that extending water mains to lots of this size would be cost effective. If the District receives a request for water service consistent with land use, the WSA boundary can be adjusted with the agreement of other water purveyors in the CWSSA if provision of water service is feasible. The proposed future WSA also includes adjustments along rivers and highways and minor modifications with adjacent utilities.
The District has planned water facilities for at least 20 years of population growth in the Lake Stevens Integrated Water System, including water mains that will connect the water systems to each other. In the rural areas, water extensions are typically for rural cluster subdivisions, which allow groupings of lots while preserving tracts of land for open space. Water extensions to rural clusters promote water resource conservation by use of metered water services compared to the alternative of larger lots with individual wells.
Figure 2-1 shows the RSA within the adjusted future WSA. The RSA covers where water main extensions could reasonably happen in the next ten years. To determine the retail area, a distance of about a half-mile from existing water mains was examined. This area was pulled back around water mains smaller than 8-inch diameter and in areas where geologic features make expansion more involved than simple water main extensions. The retail area was expanded beyond a half-mile where there are known requests for service and in the vicinity of planned water main extensions.
Additionally, the Lake Stevens Integrated WSA includes both Creswell and Storm Lake Ridge Water System within the RSA and future WSA boundaries. These two Water Systems are planned to be connected with Lake Stevens Integrated within the next twenty years.
2.3.2 Wholesale Service Areas
The District currently sells water to Granite Falls, Arlington, and City of Snohomish as well as the Sudden View and Twin Falls (Seymours) water systems on a wholesale basis. These wholesale service areas are outlined in Figure 2-1. Although Arlington only uses District-provided wholesale water in part of its system, the entire Arlington service area is described in the District’s wholesale service area because the District’s agreement with Arlington does not limit where the water can be used. Granite Falls, Twin Falls, and Sudden View use District wholesale water as their sole source of supply.

DRAFT
20-2733 Page 2-10 2021 Water System Plan Update February 2022 Snohomish County PUD No 1
The Granite Falls wholesale service area has been adjusted was described in Section 2.2.1.5 for consistency with the Granite Falls’ planned changes to their service area map.
Wholesale water sold to the City of Snohomish serves approximately 75 City of Snohomish customers along a transmission main that previously conveyed water from their decommissioned treatment plant. It also serves as a redundant supply for the City of Snohomish’s 218-HGL pressure zone. The City of Snohomish’s transmission line is approximately 14.7 miles long, starting near the south end of Menzel Lake Rd, passing through easements to Robe-Menzel Rd, then south along Robe-Menzel Rd to N Carpenter Rd, east and south on N Carpenter Rd to OK Mill Rd, east along OK Mill Rd to S Machias Rd, and then along S Machias Rd into the City of Snohomish. This linear wholesale service area is not shown on Figure 2-1 and Figure 2-2 because it is involved to illustrate.
The District also sells water to several mobile home parks and to Lake Conner Park, a private camping club with about 200 sites. These systems are billed as commercial customers and are not classified as wholesale because they are not regulated public water systems.
2.3.3 Sunday Lake Water Service Area
Sunday Lake is currently approved for 278 Equivalent Residential Units (ERUs) and the District has made commitments for 194 connections. This leaves 84 available single-family hook-ups. The “existing service area” is an outline of lots currently served by the system. The “retail service area” represents an area that could consume the remaining approved water services if every lot connects to the system and subdivides to the maximum allowed potential under current zoning. The District has determined within recent years that full build-out of the Sunday Lake RSA may be affected by the fact that many existing lots are already developed with houses served by wells.
As described in Section 2.2.1.7, the District has decided to pull back the Sunday Lake future service area to match the RSA. If a request is received outside of the RSA that could make beneficial use of Sunday Lake’s available water supply, and it looks like a development project will move forward, the District will prepare a WSP amendment to adjust the place of use/service area of the related Sunday Lake groundwater rights to correspond to the future service area consistent with RCW 90.03.386(2). In this way, the retail area will always represent the maximum area that can be supported by the system, while leaving options in the future service area as the true direction of development unfolds.
2.3.4 The 212 Market & Deli and Otis Water Service Areas
The 212 Market & Deli and Otis will remain non-expanding water systems. The 212 Market & Deli will only serve the gas station, market, and deli that it was originally designed to serve. Similarly, Otis will only serve the five residential lots that it was designed to serve.

DRAFT
20-2733 Page 2-11 2021 Water System Plan Update February 2022 Snohomish County PUD No 1
Otis is located inside Arlington’s future service area. It is possible that Otis could merge into Arlington’s water system in the future if development extends a water main past the system along Burn Road.
2.3.5 Warm Beach/Kayak Water Systems Consolidation
In 2016, the District commenced work with the assistance of a DOH grant to study the feasibility of the District assuming ownership and operation of the Warm Beach Water Association (WBWA), including the cost of related improvements, and consolidating its operations as appropriate with the District’s Kayak Water System in order to improve system reliability, redundancy, operational integrity, and emergency water access. As discussed below, this effort resulted in the 2020 operational consolidation of the Warm Beach and Kayak water systems.
Key among the actions deemed necessary by the District to ensure the proposed system consolidation could meet Warm Beach and District operational objectives, was the construction of two points of connection between the Warm Beach and Kayak Water Systems and securing an extension of Warm Beach groundwater permit G1-25686. The extension which runs to 2035 was approved by Ecology on July 9, 2019.
Consistent with the Drinking Water State Revolving Fund (DWSRF) loan criteria, the District provided project information to DOH regarding how the two systems would be operationally and financially consolidated through development of joint storage facilities, source of supply connections, and other related facilities. This information was then further refined and submitted as a limited appropriate level of planning (ALOP) WSP amendment to DOH and Ecology in March 2020.
On December 16, 2020, DOH approved the District’s WSP ALOP to consolidate the Warm Beach and Kayak Water Systems as consistent with WAC 246-290-100. The ALOP approval included, as authorized by RCW 90.03.386(2), a place of use expansion of Kayak Groundwater rights (G1-24415C/ G1-25989C) enabling service to the Warm Beach community during exigent or maintenance circumstances. Consistent with terms of the ALOP, the water supply for customers located within the former Warm Beach and Kayak water service areas continues to be provided by their respective original wells/sources.
With approval of the ALOP WSP, the operational consolidation of the two water systems has occurred and the newly consolidated system is now referred to by the District as the Warm Beach Water System.
Please see Figure 2-1 depicting the WBWA and Kayak (qualified) consolidated service area.
2.3.6 May Creek Water Service Area
Pursuant to its updated Water Service Area Agreement with Gold Bar, the District has made a one-time, voluntary boundary line adjustment to its May Creek retail service area that transfers two residential properties to Gold Bar’s retail service area. Other than this minor change, the

DRAFT
20-2733 Page 2-12 2021 Water System Plan Update February 2022 Snohomish County PUD No 1
proposed future WSA for May Creek is identical to the North Snohomish County CWSP figure, see Appendix 2-1. The existing service area in Figure 2-1 includes lots currently served by the system. The RSA extends beyond the existing service area to a ground elevation of 300 feet, which can be served by gravity from the storage tanks. A BPS would be needed to deliver water to any proposed subdivision to the east. Pursuant to its updated Water Service Area Agreement with the City of Gold Bar (Gold Bar), the District has made a one-time, voluntary boundary line adjustment to its May Creek retail service area that transfers two residential properties to Gold Bar’s retail service area.
2.3.7 Skylite Water Service Area
Skylite is a non-expanding water system located outside of the CWSSA boundary, along the south side of the Skykomish River. There were originally 185 platted lots in this 1960s subdivision, some of which were later lost to river erosion. The early recreational use for the lots gradually transitioned into full-time occupancy. To assure that water hook-ups are available for remaining lots that the system was intended to serve, the District does not presently plan to hook up any lots outside of this defined service area. Consequently, the existing, retail, and future service areas are identical.
2.4 Service Area Policies
The District has attempted to define retail WSAs in a manner that assures it can fulfill its duty to serve. The District will strive to serve all applicants in its retail WSAs, provided all District policies related to service can be met, and the project is consistent with applicable statutes, rules, and guidance.
All proposed connections and extensions within the retail WSAs shall be allowed unless deemed unfeasible by the District at the time of request due to water supply and/or system capacity constraints.
It is important to recognize that the District’s function is not to plan land uses within its boundaries, but to respond to land uses under applicable land use plans. The District’s facilities are not to be used as tools for implementing changes in the character or timing of planned land uses.
2.4.1 Timely and Reasonable Water Service: Future and Retail Service Areas
A basic tenet of District policy is that growth pays for growth, or that existing water customers do not subsidize system expansions. District policies are designed to ensure that each new connection or facility extension will be paid for by the individuals that are benefitted.
The District has developed the following documentation of routine procedures for timely provision of service for its retail and future service areas to be consistent with the Coordination

DRAFT
20-2733 Page 2-13 2021 Water System Plan Update February 2022 Snohomish County PUD No 1
Act and District policies. Because time associated with design, permitting, and construction is outside the District’s control, these are not counted in the timeline. The goals for District turnaround times are underlined. When added together, the combined District turnaround times are less than 120 days. There is no guarantee that all service requests can be processed in these timeframes. Large or complex projects, especially, might take more time. Table 2-1 has been developed to illustrate how the District determines when it is “reasonable” to provide water service.

DRAFT
20-2733 Page 2-14 Service Areas and Policies February 2022 Snohomish County PUD No. 1
Table 2-1 | General District Criteria for Timely and Reasonable Water Service Decisions
Scenario Distance from existing water main inside District RSA 1
Water main Fronts Property Within 1/4-mile 2 1/4- to 1/2-mile 2 Greater than 1/2-mile 2
Standard Subdivision (5 or more lots)
Required to hook up a Water available if willing to extend at own expense per District standardsa3
Water available if willing to extend at own expense per District standards a3
Water available if willing to extend at own expense per District standards a3
Short Subdivision (4 or fewer lots outside a UGA; 9 or less lots in a UGA)
Required to hook up a Water available if willing to extend at own expense per District standardsa3
Water available if willing to extend at own expense per District standards a3
Water available if willing to extend at own expense per District standards a3
Rural Cluster Subdivision Required to hook up a Required to extend District facilities c
Water available if willing to extend at own expense per District standards a3
Water available if willing to extend at own expense per District standards a3
Proposed Group A water system Required to hook up b Required to extend District facilities b3
Required to extend District facilities b3
Evaluate on case-by-case basis b3
Proposed Group B water system Required to hook up b Required to extend District facilities b3
Evaluate on case-by-case basis b3
Evaluate on case-by-case basis b3
Proposed “two-party” water system Required to hook up b Consider interim connection agreement b
Water available if willing to extend at own expense per District standards a3
Water available if willing to extend at own expense per District standards a3
Individual service request for existing lot
District agrees to serve Consider interim connection agreement
Water available if willing to extend at own expense per District standards a3
Water available if willing to extend at own expense per District standards a3
Proposed individual well on existing lot (not subdividing)
Not required to hook up a Not required to hook up a Not required to hook up a Not required to hook up a
Notes 1. Measured along existing or proposed roads to the project site. 2. Applies if existing water main is 8-inch diameter or larger. For smaller existing water main, scenario will be evaluated on a case-by-case basis. 3. Individual wells are an allowed alternative for each residential lot, if lots are 1-acre or larger and can meet septic system setback requirements. Authority 3a. North Snohomish County Coordinated Water System Plan (Per CWSP Section V.1, use of individual wells allowed only when public water does not meet the criteria of “available” in subsection V.7. Water for houses on existing lots is exempt from this procedural policy.) 3b. Coordination Act, RCW 70.116.060 (No new public water system shall be created in the CWSSA unless existing purveyors are unable to provide service in a timely and reasonable manner.) 3c. County Code (SCC 30.41C.070(3)(e) for rural clusters within ¼-mile of existing water mains)

DRAFT
20-2733 Page 2-15 Service Areas and Policies February 2022 Snohomish County PUD No. 1
Typically, an owner, representative, or potential purchaser of a property will call the District in the early stages of investigating options for water service. The District’s goal is to initially respond to such requests within two working days. Some projects may necessitate meetings and further exchange of information. This WSP and related Policy Manual govern the determination of water improvements. Each project is evaluated in relation to the existing water system and the applicant is informed of any facilities that would need to be constructed and the related fees. The District does not consider such inquiries to be official requests for service until an agreement is signed to extend facilities or until all fees are paid to install an individual service.
The District will write water availability letters for applicants that pay the currently established fee for such letters or upon the request of applicants that have paid all fees for service installation. The requested service will be evaluated by District staff to determine system capacity, fire flow availability, meter size and/or other improvements necessary to provide adequate water pressure, fire flow, and water quality. In many cases, this has already been done during an initial inquiry, so availability letters can usually be issued within one week. After the letter is issued, it is up to the applicant to determine their schedule to proceed with installation (by paying the remaining fees or, for larger projects, designing and constructing facilities in accordance with District procedures). Water availability letters expire after five years but can usually be renewed if requested.
In addition to the District’s water availability letters, the County may send a Preliminary Certificate of Water Availability for the District to complete and return within 30 days. This occurs when the County receives a land use application and determines that the District is the appropriate purveyor following the Utility Service Review Process. The District’s goal is to complete and return these certificates within one week.
If the District declines to provide service in its retail area or if an applicant disagrees with offered terms of service, the potential customer can appeal through the dispute resolution procedure described in the District’s Policy Manual. In addition, an appeal to the NSWUCC under the CWSP can occur if the District requires an applicant to hook up to District facilities and the applicant does not believe the District’s terms are timely or reasonable.
For individual service connections, after all fees are paid, the service line and water meter can usually be installed within three weeks. Priorities for construction crews are, first, emergencies; second, critical maintenance and operation projects; and third, new service installation. Unexpected conditions or events can delay installation of new water services, but timeframes will not exceed the 120-day clock of the Coordination Act.
To extend water facilities or create a new satellite system, the applicant starts the process by submitting three copies of water construction drawings along with an Information Request form. The District drafts a Developer Extension Agreement (DEA) and sends it for signature with the first design review. The signed DEA and review fees should be returned with the applicant’s first response, but at least before the District approves the project for construction. District engineers typically review the drawings in a timeframe consistent with the applicant’s schedule. Applicants and design engineers are encouraged to communicate with District engineers as they prepare

DRAFT
20-2733 Page 2-16 Service Areas and Policies February 2022 Snohomish County PUD No. 1
their drawings and to submit their plans well in advance of their anticipated construction start date. At minimum, applicants should be prepared for a 30-day turnaround for the initial review and a two-week turnaround for each subsequent review, until comments are satisfactorily addressed. Large or complex projects can experience longer review times. Design and review can occur concurrently with County review of the plat, so that the project can start construction when preliminary plat approval is received. After drawings are approved, remaining steps for construction include:
▪ Any off-site easements are drafted
▪ Right of way permit application is submitted to County, if applicable
▪ Contractor provides certificate of insurance and applies for a meter and cross-connection control assembly to use during construction
▪ A pre-construction meeting is held
▪ The District inspector monitors the project throughout construction
▪ Final disinfection, pressure, and bacteria tests are conducted until passed
▪ A District engineer signs the Certificate of Construction Completion form
▪ If requested, an agreement is drafted to defer general facility charges (GFCs) to future lot owners
▪ All remaining fees and charges are collected
▪ The applicant’s engineer provides as-built water drawings
▪ The applicant provides a two-year maintenance bond for ten percent of installed cost
▪ Bill of Sale is executed to transfer ownership to the District
▪ The District reviews the draft “final plat” drawing to confirm that on-site water easements will show on the face of the recorded plat
▪ District sends a plat acceptance letter to the County
2.4.2 Receivership: Future and SMA Service Areas
The District’s role as a potential receiver on behalf of the County shall be limited to those water systems falling within the Districts adjusted future service area as depicted in Figure 2-1. Pursuant to RCW 7.60.280, the District may refuse to act as receiver and/or resign such position at its discretion.

DRAFT
20-2733 Page 2-17 Service Areas and Policies February 2022 Snohomish County PUD No. 1
2.4.3 Policy and Procedures Manual
The District’s Policy Manual is included as Appendix 1-1. This manual is also posted on the District’s website. District staff keep copies of the manual at their desks for frequent reference when responding to water service inquiries. The copies are updated whenever there is a change to the manual. Copies of the extension policies, standards, and specifications sections of this manual are also kept readily available to distribute to applicants, design engineers, and construction contractors.
The District’s service policies are established under RCW Title 54, governing public utility districts, and by the District’s elected Board of Commissioners through the adoption of written resolutions at regularly scheduled public meetings. Copies of pertinent District resolutions can be found in Appendix 2-2. The general public is free to address the Commission on any issue regarding the District’s responsibilities of providing potable water service.
This WSP, which contains statements of District policy, will be adopted by resolution following a public process to address any comments. The Policy Manual is a supplement to this WSP. Any amendments to this WSP or changes to the policies must also be reviewed and adopted by the Commission through the public process.
Following is a summary of the structure of the Policy Manual:
Policy Manual Section 1: Introduction
▪ Goal is to provide a helpful guide for customers, building trades, and representatives of the District.
▪ Also, the goal is to provide safe and reliable service at the most economical cost possible.
▪ Improvements and incremental extensions of the District’s water systems must be consistent with the WSP, whether they are carried out by the District or a third party.
Policy Manual Section 2: General Terms, Conditions, and Policies for Water Service
Describes the District’s routine procedures for water service, including:
▪ Guidelines to initiate or terminate water service ▪ Service equipment requirements and responsibilities, including cross-connection control ▪ Meter reading, billing, and collections procedures ▪ Dispute resolution ▪ Description of rates, fees, and charges ▪ District action for violations ▪ Guidelines to process applications for fire protection only ▪ Special arrangements for short-term water use

DRAFT
20-2733 Page 2-18 Service Areas and Policies February 2022 Snohomish County PUD No. 1
Policy Manual Section 3: Extension Policies
Describes the process for projects requiring an extension of water facilities, including:
▪ Procedures to apply for extension or improvement of a District water system ▪ Responsibility for preparation, review, and approval of design drawings ▪ Requirement to execute a Developer Extension Agreement ▪ Responsibilities for permits and easements ▪ Responsibility to submit as-built drawings and other conditions for final acceptance ▪ Description of fees and options to finance ▪ Design and construction procedures ▪ Provisions for interim connections
Policy Manual Section 4: Satellite System Management
Communicates the steps involved and service options to prospective clients of District’s satellite system services, including:
▪ Direct Service, for a system that will be owned and operated by the District,
▪ Contract Services, including operation, maintenance, monitoring, billing, and other tasks for a system not owned by the District, or
▪ Support Assistance on a more limited scale, with charges determined in advance on a time and materials basis
Policy Manual Appendix A: Standards and Specifications for Design and Construction
▪ Can be used as a free-standing document to communicate with engineers and contractors
▪ Specifies design and performance standards for source, transmission, storage, and distribution, including material and construction specifications and detail drawings
▪ This part of the manual is updated regularly by the District’s Water Resources Standard Committee to keep pace with changing technology and issues encountered in the course of design and construction
Policy Manual Appendix B: Rates, Charges, and Fees
▪ Contains a series of tables listing all of the District’s current charges for water customers and projects
▪ Rates and Fees may be adjusted as necessary as approved and adopted by the Commission.

DRAFT
20-2733 Page 2-19 Service Areas and Policies February 2022 Snohomish County PUD No. 1
2.4.4 Other Key Service Area Policies
A DOH fact sheet lists elements that water systems should consider when developing service area policies. The following text describes how the District approaches these issues or where they can be found in the Policy Manual.
Possibility for cost recovery through latecomer agreements: See Section 3.3.9 of the Policy Manual.
Surcharges for areas outside a corporate boundary: The District does not distinguish its charges inside or outside of corporate boundaries. The District does have surcharges to recover costs of system improvements, as shown in Tables B-6, 7, and 8 of the Policy Manual.
Differences between service within or outside an Urban Growth Area: The District does not distinguish its service inside or outside of UGAs.
Cost for up-sizing facilities: See Section 3.3.11 of the Policy Manual for upsizing extension projects. Also, for an individual customer to increase the size of a service or to add a second meter, see Section 2.3.19 of the Policy Manual.
Wholesaling water: The District negotiates agreements to deliver wholesale water on a case-by-case basis. These agreements are described in Chapter 3.
Wheeling water: Water purchased from the Everett is re-sold through the wholesale water agreements described above.
Procedures for granting or requesting project time extensions: Water availability letters are good for five years but can usually be renewed. Other than this, applicants set their own schedule based on specific needs of their project.
Guiding principles for “first-come, first served” policies: When a system begins to approach its capacity-limit based on facilities or water rights, the District tracks service commitments to assure that it does not promise service that would exceed available capacity.
Annexation: The District’s preference is to continue serving where it has existing water facilities, even if an area becomes annexed by a city. Public utility district laws protect District facilities from condemnation. The District will consider adjusting service area boundaries for areas not yet receiving District water service, as long as this does not adversely affect future water service or cost recovery for the District’s overall water systems. District agreements with Granite Falls and the City of Marysville (Marysville) contain sections that discuss annexation issues. If a city insists that it wants to purchase District water facilities in an annexed area, the District will consider negotiations on a case-by-case basis. However, as a general rule, the District will not agree to give up service areas where it has existing or planned facilities.

DRAFT
20-2733 Page 2-20 Service Areas and Policies February 2022 Snohomish County PUD No. 1
2.4.5 Satellite System Management Program
The District clearly has a role as an SMA because it is authorized to provide water service within the County. The District’s first policy to implement a Satellite Water System Management Program was adopted on August 5, 1980 under Resolution 2409.
In 1994, DOH finalized its guidance and sent letters to purveyors already recognized as SMAs, inviting them to prepare submittals and become approved. The District completed this task by providing required information in its 1995 WSP. With its 2002 WSP, the District created a free-standing Satellite Management Program to describe how it manages the program and meets state requirements. The document can be found in Appendix 2-3.
Section 4 of the Policy Manual describes options to potential satellite system applicants. The District offers three options (1) direct service, in which the District owns the water system; (2) contract services, in which the District performs routine operation and maintenance for systems that are not owned by the District; and (3) support assistance, consisting of one time or long-term support to systems requiring assistance on a more limited scale. If an extension of the District’s system is feasible, then satellite system ownership or management is not an option.
In addition to the above SMA service area adjustment described earlier, the District has revised its SMA Program Policies, Procedures and Conditions in the following manner:
▪ Identified more specific/stringent satellite system qualification and assessment criteria, including the requirement of substantive cooperation and support of key state agencies (e.g., DOH/Ecology).
▪ Clarified District policies and position regarding acceptance/rejection of proposed extension of service to new satellite systems that may fall within the District’s future service area but are currently provided retail service by other municipal water purveyors.
▪ Clarified review process for state agency financing options and regulatory support.
▪ Clarified approval process criteria and factors, particularly pertaining to water right regulatory issues, inter-agency coordination, and project support relating to water system consolidations.
More specific detail regarding the SMA program changes can be found in Section 4 of the SMA policy manual.
2.5 Service Area Physical and Environmental Characteristics
A general description of the physical environment in the water service areas is provided in the following sections. A working description of the service area is useful in identifying the constraints that may affect the implementation and development of the District’s water systems.

DRAFT
20-2733 Page 2-21 Service Areas and Policies February 2022 Snohomish County PUD No. 1
2.5.1 Climate and Precipitation
The climate of west central Snohomish County is dominated by marine influences bringing moist air into the interior of the County from Puget Sound and the Pacific Coast. The Cascade Mountains force the moisture laden clouds upward with a resultant release of moisture. The mountains also act as a barrier against extreme continental influences which occur east of the Cascades. The prevailing winds are from the southwest in winter and the northwest in the summer. The winds have a modifying effect on the climate. As a result of these conditions, the climate in the District’s area is characterized by high rainfall and low evaporation rates in winter, while summers are cool and relatively dry.
In general, the District’s easternmost water systems, Skylite and May Creek closest to the Cascade Mountains, experience the highest average annual rainfall. The District’s westernmost systems (Kayak, Sunday Lake, and 212 Market & Deli) have the least amount of rainfall, experiencing the rain shadow effect of the San Juan Islands. This trend of increasing rainfall from east to west across the County is illustrated by data in Table 2-1, obtained from the Western Regional Climate Center. Thunderstorms are rare and approximately 70 percent of the precipitation falls during October through March. The driest months are typically July, August, and September. Late fall and winter can produce potentially damaging flood flows in the rivers, while low flow conditions are common in the summer.
Temperatures in the region rarely exceed the 80s, in degrees Fahrenheit (F), and only occasionally fall below freezing. As can be seen in Table 2-2, average temperatures are relatively consistent throughout the region. The mean average annual temperatures in the County are about 60 degrees maximum and 40 degrees minimum.
Table 2-2 | Weather Station Statistics from East to West
Weather Station Location Average Annual Rainfall (inches)
Avg Max Temperature (F)
Avg Min Temperature (F)
Mount Vernon 32.30 59.1 41.8
Everett Junior College 36.72 59.1 42.6
Arlington 46.34 not available not available
Monroe 48.43 60.6 42.2
Startup 65.40 60.8 41.4
Darrington Ranger Station 79.48 59.3 38.9
2.5.2 Topography and Elevation
The District’s water systems serve a wide range of elevations. For instance, Lake Stevens Integrated serves customers ranging from 65 to 742 feet in elevation. To maintain service pressures within the level of service standards, the District’s systems are split into many pressure zones which are described in Chapter 4. The Soil Survey of Snohomish County Area, Washington, published in 1983, describes the area as follows:

DRAFT
20-2733 Page 2-22 Service Areas and Policies February 2022 Snohomish County PUD No. 1
The physiography of the survey area is characterized by: (1) nearly level alluvial deposits along the major river valleys; (2) glacial till plains, outwash plains, and terraces in the middle part of the area; and (3) mountainous areas in the eastern part of the area. The basic drainage flow is from the mountains in the east to the Puget Sound in the west. The North Fork of the Stillaguamish River, along the northern edge of the survey area, begins at the town of Darrington and drains into the Puget Sound. The South Fork, which is in the center of the area, begins at Granite Falls and joins the North Fork at the town of Arlington. The Skykomish River begins at the town of Index in the southern part of the area, flows westerly through the towns of Sultan and Monroe, and joins the Snoqualmie River near the town of Snohomish to form the Snohomish River. The Snohomish River flows northwesterly through Everett to the Puget Sound.
2.5.3 Geology and Soils
Because the District’s WSAs cover a large part of western Snohomish County, the full range of the region’s geologic and soils conditions can be encountered in the construction of District water facilities. In the 1983 Snohomish County Soil Survey, soil scientists determined there are about 40 kinds of soil in the survey area, differing widely in texture, natural drainage, and other characteristics. Chapter 8, Source of Supply, describes of the geologic history and hydrogeology of the area and includes a detailed discussion of how these influence the District’s groundwater sources.
2.5.4 Critical Areas
Critical areas include fish and wildlife habitat conservation areas, wetlands, geologic hazard areas, critical aquifer recharge areas and frequently flooded areas. Every seven years, local governments are required to review and, if necessary, revise their critical areas regulations to assure that they reflect "best available science" related to the protection and management of these areas. The County updated its Critical Area Regulation (CAR) in 2015. The CAR can be found in County Code Title 30, Chapter 30.62. Maps for a variety of critical areas categories can be downloaded from the County’s website. These maps are useful to get a general sense of critical areas on a regional planning level. Detailed critical area mapping occurs during development review. The District also examines and considers critical areas when designing and constructing its water facilities.

THREE LAKES
HIGHLAND
CITY OF MONROE
ROOSEVELT
CITY OF MARYSVILLE
TULALIP WATER
SEVEN LAKES
STANWOOD
CITY OFEVERETT
MUKILTEO
ALDERWOOD
CROSS VALLEY
SILVER LAKE
CITY OF ARLINGTON
GRANITE FALLS
CITY OFSULTAN GOLDBARSno
homish C
ounty
Island C
ounty
LakeStevens
SpadaLake Res.Lake
Chaplain
South Fork Stillaquamish River
North Fork
Stillaquamish River
Snohomish River
King County
Skagit County
CITY OF LYNNWOOD
CITY OF MOUNTLAKE TERRACE
WARM BEACH
SKYLITEMAY CREEK
TATOOSH
STARTUP
CITY OF SNOHOMISH
LAKE STEVENS INTEGRATED
SUNDAY LAKE
TWIN FALLSSUDDEN VIEW
WILDERNESS RIDGE Snohomish County
Snohomish County
212 MARKET
OTIS
0 3 Miles ©
20-2733February 2022
Wholesale CustomerOther Water SystemsCritical Water SupplyService Area (CWSSA)/Satellite SystemManagement Area
K:\TAC_Projects\20\2733 - Snohomish County PUD - 2021 Water System Plan Update\CAD\GIS\Report Figures\Figure2-1_ProposedDistrictWaterServiceArea.mxd 2/24/2022 7:50:00 AM christoph.tanner
Snohomish County PUD2021 Water System Plan Update
Figure 2-1 Proposed District Water Service Area
Data Sources:SnoPUDSnohomish County Geospatial Data Clearinghouse.Coordinate System: NAD 1983 StatePlane Washington North FIPS 4601 FeetProjection: Lambert Conformal ConicDatum: North American 1983Disclaimer: Snohomish PUD makes no representations, express or implied,as to the accuracy, completeness and timeliness of the information displayed.This map is not suitable for legal, engineering, or surveying purposes. Notificationof any errors is appreciated.

DRAFT
20-2733 Page 2-24 Service Areas and Policies February 2022 Snohomish County PUD No. 1
THIS PAGE INTENTIONALLY LEFT BLANK

K:\T
AC_P
rojec
ts\20
\273
3 - S
noho
mish
Cou
nty P
UD -
2021
Wat
er S
yste
m Pl
an U
pdat
e\CA
D\GI
S\Re
port
Figur
es\F
igure
2-2_
Prop
osed
Distr
ictWa
terS
ervic
eAre
a_La
rgeS
ize.m
xd 2
/22/
2022
3:4
9:17
PM ch
risto
ph.ta
nner
THREE LAKES
HIGHLAND
ROOSEVELT
CITY OF MARYSVILLE
TULALIP WATER
SEVEN LAKES
STANWOOD
WARM BEACH
CITY OFEVERETT
MUKILTEO
SILVER LAKE
CITY OF ARLINGTON
GRANITE FALLS
Snohom
ish Count
yIsland C
ounty
LakeStevens
Puget Sound
LakeChaplain
South Fork Stillaquamish River
Skagit County
TATOOSH
£¤2
£¤2
§̈¦5
UV9
UV9
§̈¦5
UV99
Spada Lake Reservoir
North Fork Stillaquamish River
CITY OF SNOHOMISH
DARRINGTON
SUNDAY LAKE
SUDDEN VIEW
TWIN FALLS
SNOHOMISH PUDINTEGRATED SYSTEM
WILDERNESSRIDGE
CRESWELL
STORM LAKE
212 MARKET
OTIS
MEADOW LAKE
45143
3 2
1
4
65 2
6
32
2
7
1 5
1
6
14
1
6
2
512
6
7 9
5
4
6
3
8
1
1
8
3
6
9
7
1
4
6
51
9
4
9
4
55
32
9
7
3
4
5
3
2
8
5
12
35 4
5
9
8
1
5
5
3
89
9
7
6
8
8
8
4
6
9
7
9
7
9
4
5
8
3
1
3
7
1
5
8
4
1
3
7
8
8
5
5
2
5
5
2
2
8
6
7
8
2
8
3
4
7
5
1
8
8
8
1
3
2
9
8
9
2
9
8
7
7
6
3
8
9
6
9
3
4
9
8 98 9
8
9
3
9
4
8 9
7
5
9
2
9
2
1
4
7
8
9
4
87
8
8
9
4
9
7
9
1
4
1
7
8
5
7
9
41
9
8
6
8
4
3 2
9
6
24 35
3
8
1
51
3
1
4
1
7
6
9
7
3 3 5
9
3
1
6
4 4
7
5
9
2
7
2
2
5
2
7
2
8
3
3
4
2
6
1
46
6
9
2
6
5
6
77
6
7
4 3
3 2
5
4
22
2
6
434
16
7
6
56 5
7
1 6
3
7
3
2
6
3
7
2
7
6
6
4
7
3
6
5 4
2
0
31
1
30
12
19
35
32
32 33
18
34
16
10
36
28
11
21
10
15
23
11
22
17
12
11
36
11
15
13
11
28
1111
24
16
11
25
17
12
27
33
10
27
20
18
22
19
31
16
11
11
3533
1111
11
11
30
34
12
11
11
11
11
24
12
15
11
18
12
18
15
22
11
19
21
18
13
30
14
27
10
33
11
32
11
11
18
15
16
2120
32
24
29
16
15
36
1211
17
11
33
23
14
10
15
28
19
30
31
32
29
17
24
30
1
21
20
18
21
21
32
31
13
25
12
22
35
30
11
24
29
33
23
19
21
32
16
10
21
19
24
31
20
15
16
17
25
29
16
20
22
27
34
25
14 16
34
15
17
26
10
17
25
11
2120
29
28
11
23
27
17
28
26
31
28
21
12
16
21
1417
24
13
13
12
20
32
34
21
29
30
26
17
21
24
26 30
11
22
25
10
13 15
35
13
33
32
3029
17
3136
30
31
27
10
19
10
22
13
22
29
17
20
16
28
12
34
17
1318
36
30
24
20
10
22
12
10
23
19
30
21
16
14
13
13
19
14
29
28
21
16 1713
26
13
19
22
25
15
25
12
14
34
32
21
33
20
28
14
25
16
10
17
36
10
21
18
19
27
31
26
17
19
2730
18
30
10
28
34
34
23
24
24
14
25
12
16
27
17
32
33
20
15
24
28
10
15
27
31
32
31
24
34
23
18
15
20
28
13
33
36
13
28
17
25
19
29
22
10
27
22
23
23
18
14
12
17
26
20
24
29
25
22
28
33
22
32
13
10
13
15
32
35
15
24
17
26
28
29
31
34
22
15
29
22
22
15
20
23
21
27
10
35
31
24
27
14
27
2320
25
33
32
27
18
26
10
29
32
20
15
19
26
15
22
21
28
32
12
23
22
26
26
16
32
29
33
1413
22
34
33
25
14
26
2023
27
14
23
2625
12
1714 1613 15
23
28
2124 22
27
10
20
27
10
26
20
17
29
21
16
22
15
2928
21
16
35
25
16
36
34
35
29
21
22
13
16
34
23
15
28
15
21
27
31
18
10
18
10
34
22
16
35
14
29
20
19
26
33
20
23
33
32
10
20
12
19
30
34
13
27
20
29
12
23
10
23
24
36
29
28
24
32
15
35
24
21
23
27
30
31
36
23
36
29
12
33
12
14
29
14
19
16
30
15
16
17
19
16
12
22
31
14
21
24
17
28
15
23
28
31
22
18
21
36
30
13
18
28
12
21
17
14
29
35
23
23
26
18
34
13
12
3535
31
33
14
33
24
20
17
33
35
24
20
20
35
21
20
34
18
31
26
23
17
18
34
30
29
32
22
25
17
22
28
36
10
19
14
21
29
34
26
31
21
25
27
33 35
24
34
30
13
27
13
19
17
2626
16
29
15
26
14
15
16
17
22
33
36
19
22
10
24
24
16
35
18
32
1814
13
12
33
15
25
19
17
15
15
32
3536
19
25
15
36
10
13
34
18
36
12
35
31
1717
20
28
12
14
24
22
19
13
35
20
32
33
34
11
18
32
23
36
25
14
25
30
36
35
36
27
16
26
35
36
16
18
28
17
35
16
24
36
34
26
14
27
14
10
26
35
12
28
24
25
19
13
23
18
33
22
34
16
23
32
10
27
14
29
1418
27
22
20
28
14
12
36
27
24
30
20
25
30
21
30
31
11
19
10
18
24
16
23
33
23
34
26
31
10
19
36
12
21
16
20
11
35
19
31
16
21
31
19
14
18
13
30
23
27
22
26
18
23
2
19
30
25
19
18
10
15
31
36
25 30
19
30
27
18
26 2529
26
20
11
29 283028
14
35
23
27 2525
2829 27
35
2630
23
23
30
11
2628
26
14
35
2529
36
27 26
0
1
12
29
11
13
26
28 27 26
34
1
14
30
25
0
7
17
35
13
24
12
33
20
28
34
25
3225
33
1
36
25
6
34
24
13
35
12
36
36
25
24
31
13
1
12
32
2
LegendRetail Service AreaExisting Service AreaFuture Service AreaWholesale CustomersOther Service AreaCritical Water SupplyService Area(CWSSA)/Satellite SystemManagement Area
Project Number: 20-2733February 2022
0 1 Miles
©
FIGURE 2-2
Proposed District WaterService Area - Large
Snohomish County PUD 2021 Water System Plan Update
Data Sources:SnoPUDSnohomish County Geospatial Data Clearinghouse.Coordinate System: NAD 1983 StatePlane Washington North FIPS 4601 FeetProjection: Lambert Conformal ConicDatum: North American 1983Disclaimer: Snohomish PUD makes no representations, express or implied,as to the accuracy, completeness and timeliness of the information displayed.This map is not suitable for legal, engineering, or surveying purposes. Notificationof any errors is appreciated.
0 42 Miles

DRAFT
20-2733 Page 2-26 Service Areas and Policies February 2022 Snohomish County PUD No. 1
THIS PAGE INTENTIONALLY LEFT BLANK

Chapter 3

THIS PAGE INTENTIONALLY LEFT BLANK

DRAFT
20-2733 Page 3-1 2021 Water System Plan Update February 2022 Snohomish County PUD No. 1
Chapter 3
Adjacent Systems, Related Plans and Agreements
This WSP was developed in coordination with other existing local WSPs, the CWSP, and with planning projections from county and city governments that partially or wholly encompass the District’s service areas. The District intends to continue its cooperative relationship with local, state, tribal, and federal governments toward effective management of water resources in the county.
3.1 Adjacent Water Purveyors
Table 3-1 lists adjacent expanding water systems, including systems that have wholesale arrangements with the District. The locations of these systems can be seen in Figure 2-1 and Figure 2-2 in the previous chapter. Many additional non-expanding water systems exist inside the District’s WSAs. These small existing systems (not shown in Table 3-1) are understood to remain independent during the planning period.
Table 3-1 | Adjacent Water Purveyors
Adjacent System Name Residential Population1
# of Services1
Adjacent to Receives Everett water?
Wholesale Water Provider
Everett 103,000 28,605
District Wholesale Customers
City of Arlington 18,952 7,581 Lake Stevens Integrated Partially
City of Granite Falls 3,647 1,437 Lake Stevens Integrated Yes
City of Snohomish 10,200 4,827 Lake Stevens Integrated Yes
Sudden View 60 24 Lake Stevens Integrated Yes
Twin Falls 0 1 Lake Stevens Integrated Yes
Other Adjacent Expanding Systems
City of Marysville 67,820 27,362 Lake Stevens Integrated Partially
Roosevelt Water Assoc 3,028 1,211 Lake Stevens Integrated & Storm Lake
Yes
Three Lakes Water Assoc 2,143 857 Lake Stevens Integrated & Storm Lake
Yes
City of Monroe 19,250 8,019 Storm Lake Yes
Highland Water District 3,000 1,207 Storm Lake Yes

DRAFT
20-2733 Page 3-2 2021 Water System Plan Update February 2022 Snohomish County PUD No. 1
Adjacent System Name Residential Population1
# of Services1
Adjacent to Receives Everett water?
Seven Lakes Water Assoc 5,557 2,298 Warm Beach No
Tulalip Tribes unknown unknown Warm Beach Partially
Warm Beach Conference Grounds
540 181 Warm Beach No
City of Stanwood 7,455 3,948 Sunday Lake No
City of Sultan 4,650 1,985 Jackson Partially
Startup Water District 643 269 Jackson/Sultan No
City of Gold Bar 2,175 729 May Creek No
Note: 1. From the DOH Water Facility Inventory records as of December 2019.
3.2 Related Planning Documents
Concurrence with land-use policies and with plans of other water purveyors is critical in evaluating the long-term adequacy of District water systems. The District maintains a library of WSPs from other water systems and works to stay abreast of city and county comprehensive plans. Table 3-2 lists planning documents considered by the District when preparing this WSP.
Table 3-2 | Related Planning Documents
GMA Comprehensive Plans: Year of Full Update*
Snohomish County 2015
City of Lake Stevens 2015
City of Granite Falls 2015
City of Marysville 2015
City of Gold Bar 2015
City of Snohomish 2016
Water System Plans: Year of Full Update
City of Arlington 2015, amended 2017 and 2019
City of Everett 2014, 2020
City of Granite Falls 2013
City of Gold Bar 2015
Highland Water District 2016
City of Marysville 2016
City of Monroe 2015
Roosevelt Water Association 2014
Seven Lakes Water Association Unknown
City of Snohomish 2020
Stanwood 2015
Startup Water District 2017
Sultan 2018

DRAFT
20-2733 Page 3-3 2021 Water System Plan Update February 2022 Snohomish County PUD No. 1
Three Lakes Water Association 2013, and 2019 limited update extension
Warm Beach Conference Grounds 2009 with 2014 & 2015 updates
Other Relevant Plans: Year of Full Update
North Snohomish County CWSP 2016
Snohomish County Groundwater Management Plan (GWMP)
1999
Snohomish River Basin Salmon Conservation Plan 2005
Lake Stevens Sewer District, Wastewater Facilities Plan 2016
Regional Water Supply Outlook 2009 Note: 1. Comprehensive Plans are frequently amended in years between full updates.
3.2.1 Service Area Consistency
The MWL requires public water suppliers to describe how they have considered consistency with local plans and regulations. Table 3-3 lists local planning elements that must be examined and where they can be found in this document.
Local governments in the District’s service areas include the County, Granite Falls, Gold Bar, the City of Lake Stevens, and the City of Snohomish. The District mailed a copy of this WSP and a review checklist to each of these jurisdictions. A representative of the local government is asked to sign and return the checklist, certifying that the elements are consistent with adopted local plans and development regulations. The signed forms are in Appendix 0-1.
Table 3-3 | Consistency with Local Plans and Regulations
Local Government Consistency Element Location in this Document
The WSA is consistent with the adopted land use and zoning within the service area.
Section 2.3 and 3.2.2
Figure 2-2 and Appendix 3-3A
The growth projection used to forecast water demand is consistent with the adopted city or county’s population growth projections. If a different growth projection is used, provide an explanation of the alternative growth projection and methodology.
Section 5.4 and 5.5; Table 5-7 and Table 5-8
For cities and towns that provide water service: All WSA policies of the city or town described in the plan conform to all relevant utility service extension ordinances.
Not Applicable
WSA policies for new service connections conform to the adopted local plans and adopted development regulations of all cities and counties with jurisdiction over the WSA.
Section 2.4
Appendix 1-1

DRAFT
20-2733 Page 3-4 2021 Water System Plan Update February 2022 Snohomish County PUD No. 1
Local Government Consistency Element Location in this Document
Other relevant elements related to water supply are addressed in the WSP, if applicable. This may include CWSPs, Regional Wastewater Plans, Reclaimed Water Plans, Groundwater Management Area Plans, and the Capital Facilities Element of local comprehensive plans.
North Snohomish CWSP: Section 2.1.2; Appendix 2-1
County/City Comprehensive Plans: Section 3.2.2
Other WSPs: Section 3.2.2
Groundwater Management Plan: Section 3.2.4
Wastewater/Reclaimed Water Plans: Section 3.2.4
Watershed Basin Planning: Section 8.1
3.2.2 Land Use Plans and Zoning
County and city comprehensive plans and policies focus primarily on compliance with the GMA, which requires local jurisdictions to define UGA boundaries separating urban and rural areas. The GMA calls for phased development in urban areas to balance growth with transportation, infrastructure, employment, and economic development. The GMA also requires a rural element in county comprehensive plans to permit land uses compatible with rural character and to provide a variety of rural densities.
3.2.2.1 Snohomish County Comprehensive Plan
The County finalized its first GMA Comprehensive Plan in June 1995 and completed a 10-year update in 2005 and again in 2015, extending planning projections through 2035.
The General Policy Plan (GPP) within the County Comprehensive Plan establishes a framework of goals, objectives, and policies for more detailed planning and implementation that will occur in unincorporated UGAs and rural areas. The GPP has been amended several times since its first adoption with the current version becoming effective as of October 14, 2017. District planning for water service in these areas is restricted to densities shown on the Future Land Use Map in Appendix 3-3A, with allowances for rural cluster developments. (Rural clusters allow a greater number of smaller lots than underlying zoning in exchange for preserving open space.)
The Capital Facilities Plan (CFP) within the Comprehensive Plan establishes level of service standards, prioritizes needed facilities, and contains an inventory of County public facilities. The CFP also includes a Countywide Utility Inventory Report, which presents water system information and projected water facility needs compiled from the WSPs of major water systems in the county.
Table 3-4 summarizes the currently effective County 2035 population growth targets within rural areas (non-UGA) and within the UGAs that influence District water system growth. These growth projections are considered when developing water demand projections in Chapter 5.
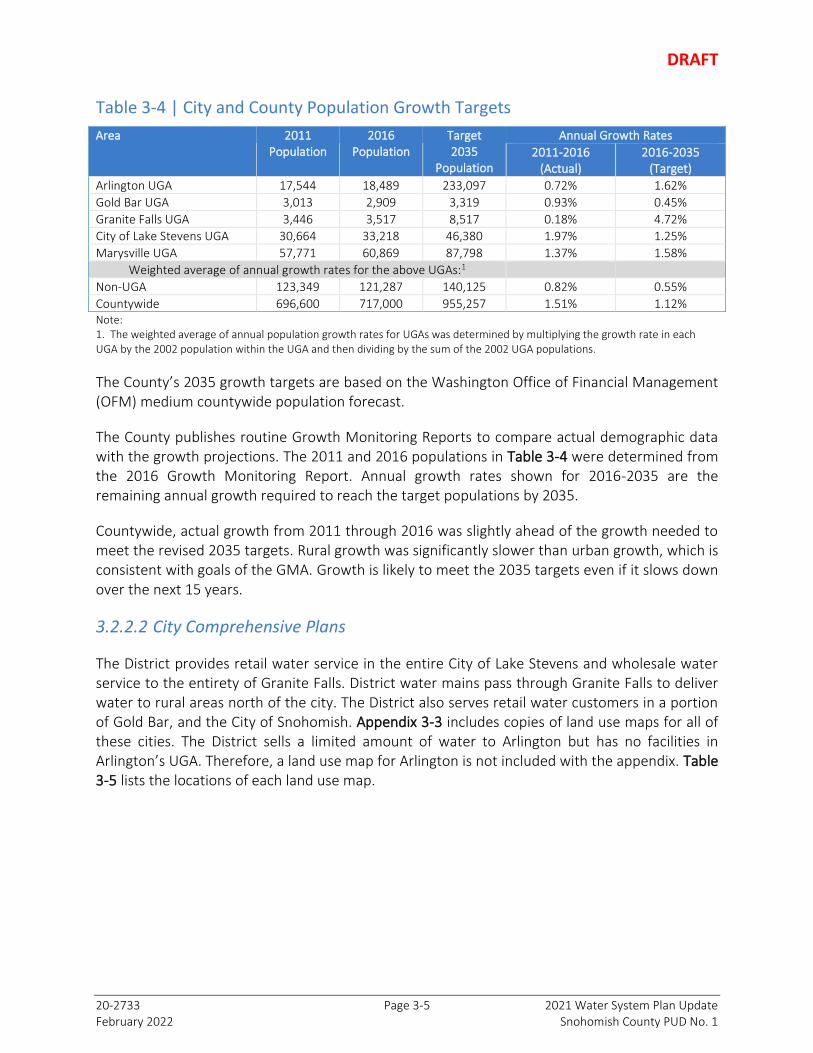
DRAFT
20-2733 Page 3-5 2021 Water System Plan Update February 2022 Snohomish County PUD No. 1
Table 3-4 | City and County Population Growth Targets
Area 2011 Population
2016 Population
Target 2035
Population
Annual Growth Rates
2011-2016 (Actual)
2016-2035 (Target)
Arlington UGA 17,544 18,489 233,097 0.72% 1.62%
Gold Bar UGA 3,013 2,909 3,319 0.93% 0.45%
Granite Falls UGA 3,446 3,517 8,517 0.18% 4.72%
City of Lake Stevens UGA 30,664 33,218 46,380 1.97% 1.25%
Marysville UGA 57,771 60,869 87,798 1.37% 1.58%
Weighted average of annual growth rates for the above UGAs:1
Non-UGA 123,349 121,287 140,125 0.82% 0.55%
Countywide 696,600 717,000 955,257 1.51% 1.12% Note: 1. The weighted average of annual population growth rates for UGAs was determined by multiplying the growth rate in each UGA by the 2002 population within the UGA and then dividing by the sum of the 2002 UGA populations.
The County’s 2035 growth targets are based on the Washington Office of Financial Management (OFM) medium countywide population forecast.
The County publishes routine Growth Monitoring Reports to compare actual demographic data with the growth projections. The 2011 and 2016 populations in Table 3-4 were determined from the 2016 Growth Monitoring Report. Annual growth rates shown for 2016-2035 are the remaining annual growth required to reach the target populations by 2035.
Countywide, actual growth from 2011 through 2016 was slightly ahead of the growth needed to meet the revised 2035 targets. Rural growth was significantly slower than urban growth, which is consistent with goals of the GMA. Growth is likely to meet the 2035 targets even if it slows down over the next 15 years.
3.2.2.2 City Comprehensive Plans
The District provides retail water service in the entire City of Lake Stevens and wholesale water service to the entirety of Granite Falls. District water mains pass through Granite Falls to deliver water to rural areas north of the city. The District also serves retail water customers in a portion of Gold Bar, and the City of Snohomish. Appendix 3-3 includes copies of land use maps for all of these cities. The District sells a limited amount of water to Arlington but has no facilities in Arlington’s UGA. Therefore, a land use map for Arlington is not included with the appendix. Table 3-5 lists the locations of each land use map.

DRAFT
20-2733 Page 3-6 2021 Water System Plan Update February 2022 Snohomish County PUD No. 1
Table 3-5 | City Land Use Maps
City/Entity Appendix Reference
Snohomish County 3-3A
City of Lake Stevens 3-3B
Granite Falls 3-3C
Gold Bar 3-3D
City of Snohomish 3-3F
3.2.2.3 Anticipated Zoning and Land-Use Changes
The County and cities periodically review zoning and land use in response to proposals, which may be adopted as changes to their Comprehensive Plans. No further land use or zoning changes that would significantly affect the District’s planning are currently anticipated.
3.2.3 Related Water System Plans
Because the District purchases water from Everett and Marysville, the District communicates projected water demands for inclusion in their planning processes. Similarly, because the District provides wholesale water to Granite Falls, Arlington and Snohomish, the District verifies that its water supply plan reflects the projected demands of these systems.
3.2.3.1 Everett 2020 Water System Plan
Everett is the predominant water supplier in the County. Everett’s WSP estimated that, in 2018, 615,000 people out of 805,120 people in the County received Everett water either directly or indirectly. This works out to 76 percent of the County population receiving Everett water. The WSP counted 31 Group A and 66 Group B water systems purchasing Everett water directly, and 11 systems purchasing indirectly through other systems.
Everett examined the plans of its wholesale customers for historic water demands, peaking factors, and demand forecasts. Water demand forecasts were developed for each wholesale customer and for Everett’s retail service area (RSA). These were summed to determine the total forecasted demand for Everett water. Everett concluded its surface and groundwater rights can meet average day water and maximum day demands beyond the 2040 planning period. A yield analysis concluded that climate change has potential to negatively impact Everett’s safe yield, but surface water will be available to meet Everett’s projected 2040 average day demand (ADD). Everett’s WSP identifies alternative water sources that can be developed for longer-term water supply needs, including the Snohomish Regional Water Authority water right, additional reclaimed water, and unused groundwater rights.
Chapter 5 of Everett’s WSP includes a water conservation plan developed by the Everett Water Utilities Committee (EWUC). The District is an active participant in this committee, and this conservation plan plays a crucial role in the District’s Water Use Efficiency Program.

DRAFT
20-2733 Page 3-7 2021 Water System Plan Update February 2022 Snohomish County PUD No. 1
3.2.3.2 Marysville 2016 Water System Plan
Under a JOA with Marysville, the District and the Tulalip Tribes are entitled to a share of water delivered from a transmission main that conveys water from the Everett 3-line. Marysville’s WSP observed that water purchased by the District from this shared transmission line ranged from 164 MG to 258 MG between 2007 and 2014. The amount of water purchased increased significantly in 2014 due to a change in the location JOA flow control valve, which allowed the District to increase pumping from this line. Marysville projected future District usage to grow proportionally with population increase with the city for the 20-year planning period, resulting in the District purchasing approximately 2.27 million gallons per day (MGD) (1,573 gallons per minute [gpm]) in 2036.
Marysville’s WSP projects its retail customer demands with the following water use factors, determined as an average of the city’s 2007-2014 records.
▪ 101 gallons per day (gpd) per capita in 2014, including distribution system leakage, ▪ Assumed future demand of 97 gpd per capita, ▪ 162 gpd per single-family household (average from 2010 to 2014), ▪ A maximum day to average day demand (MDD/ADD) ratio of 2.14
In 2013, consistent with a 2003 Agreement between the Marysville and the District and as amended in 2011, Marysville purchased and took ownership of District water facilities located inside its annexed city limits, as shown in Appendix 3-3E. The area transferred to the Marysville consisted of approximately 113,404 linear feet of water mains (4 inches - 12 inches), 168 fire hydrants, and 1,800 water services/customer connections.
3.2.3.3 Granite Falls 2013 Water System Plan and Update
Granite Falls was in process of updating its 2013 WSP while the District prepared its update. Granite Falls provided their key planning data shown in Table 3-6 so that the District could achieve consistency in the planning efforts.
The District sells wholesale water to Granite Falls through three master meters and provides water storage for the city. Granite Falls paid for its share of transmission and storage for existing customers as part of the Granite Falls Regional Project. Source and storage for new city customers is assured as the city forwards a portion of its water connection fees to the District to pay for the additional transmission and storage impacts.
Granite Falls’ wells are equipped with pumps but are disconnected from the system. Granite Falls occasionally uses its wells to supply non-potable bulk water to nearby quarries and for other non- potable purposes.
The Granite Falls WSP update will assume a water use factor of 143 gpd/ERU (compared to 155 gpd/ERU in their 2013 WSP). The MDD/ADD ratio for data in Table 3-6 works out to 2.6, compared to 2.3 MDD/ADD in their 2013 WSP.
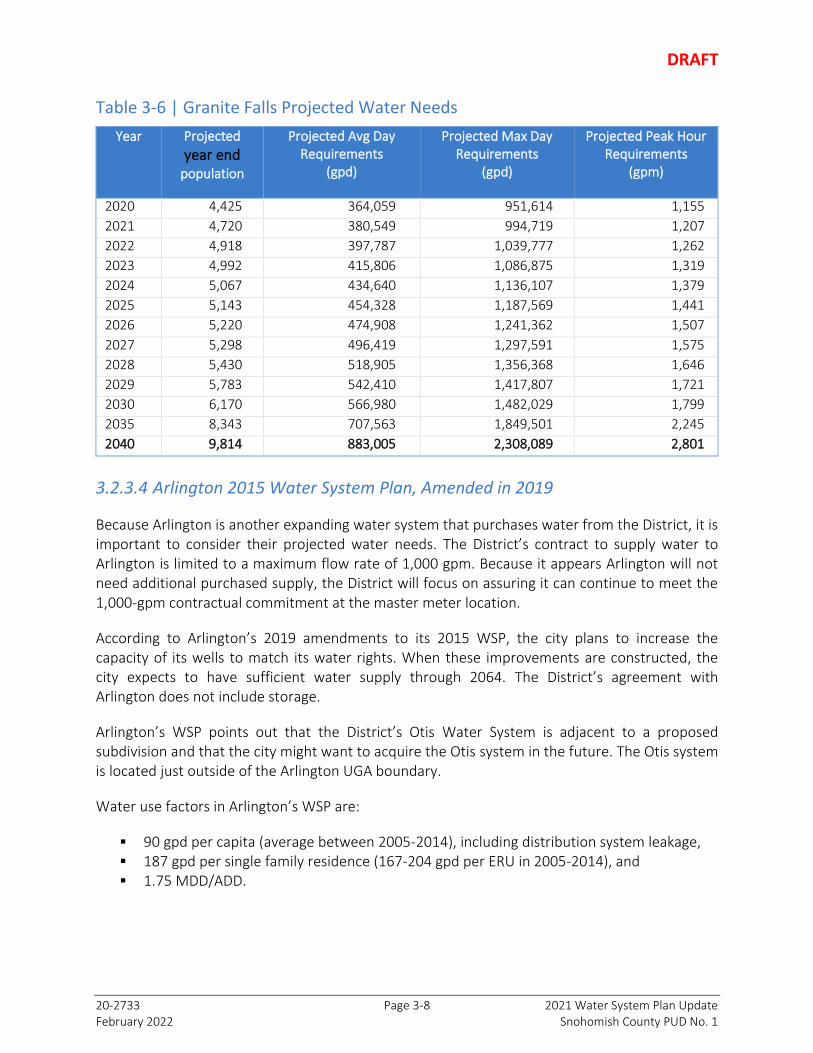
DRAFT
20-2733 Page 3-8 2021 Water System Plan Update February 2022 Snohomish County PUD No. 1
Table 3-6 | Granite Falls Projected Water Needs
Year Projected
year end population
Projected Avg Day Requirements
(gpd)
Projected Max Day Requirements
(gpd)
Projected Peak Hour Requirements
(gpm)
2020 4,425 364,059 951,614 1,155
2021 4,720 380,549 994,719 1,207
2022 4,918 397,787 1,039,777 1,262
2023 4,992 415,806 1,086,875 1,319
2024 5,067 434,640 1,136,107 1,379
2025 5,143 454,328 1,187,569 1,441
2026 5,220 474,908 1,241,362 1,507
2027 5,298 496,419 1,297,591 1,575
2028 5,430 518,905 1,356,368 1,646
2029 5,783 542,410 1,417,807 1,721
2030 6,170 566,980 1,482,029 1,799
2035 8,343 707,563 1,849,501 2,245
2040 9,814 883,005 2,308,089 2,801
3.2.3.4 Arlington 2015 Water System Plan, Amended in 2019
Because Arlington is another expanding water system that purchases water from the District, it is important to consider their projected water needs. The District’s contract to supply water to Arlington is limited to a maximum flow rate of 1,000 gpm. Because it appears Arlington will not need additional purchased supply, the District will focus on assuring it can continue to meet the 1,000-gpm contractual commitment at the master meter location.
According to Arlington’s 2019 amendments to its 2015 WSP, the city plans to increase the capacity of its wells to match its water rights. When these improvements are constructed, the city expects to have sufficient water supply through 2064. The District’s agreement with Arlington does not include storage.
Arlington’s WSP points out that the District’s Otis Water System is adjacent to a proposed subdivision and that the city might want to acquire the Otis system in the future. The Otis system is located just outside of the Arlington UGA boundary.
Water use factors in Arlington’s WSP are:
▪ 90 gpd per capita (average between 2005-2014), including distribution system leakage, ▪ 187 gpd per single family residence (167-204 gpd per ERU in 2005-2014), and ▪ 1.75 MDD/ADD.

DRAFT
20-2733 Page 3-9 2021 Water System Plan Update February 2022 Snohomish County PUD No. 1
3.2.3.5 City of Snohomish 2020 Water System Plan
In 2020 the District and the City of Snohomish entered into a wholesale water supply agreement (see Appendix 3-2). The agreement allows the City of Snohomish to serve its existing transmission line customers, served previously by its Water Treatment Plan Facility which they decommissioned in 2017, through an existing 2-inch master meter. The agreement contains a provision that would allow the City of Snohomish to upsize this water meter or to install additional master meters at their expense if they need additional water supply capacity from the District in the future. Further description of this agreement is provided in Section 3.3.8.
See Section 2.2.1.6 for a description of the District’s proposed service area changes in relation to the City of Snohomish.
3.2.3.6 Water System Plans of Other Adjacent Purveyors
The WSPs of other adjacent purveyors have been reviewed. The District is not aware of anything in the remaining plans that would impact the District’s WSP.
3.2.3.7 Previous Editions of District Water System Plans
The District has prepared many WSPs since beginning its water utility operations in 1946. The level of detail in the plans increased as regulatory requirements have been added. The last update was in 2011. Table 1-3, in Chapter 1, lists the projects completed since the 2011 WSP. For the most part, completed projects are consistent with the improvement plan in the 2011 WSP. Some funds and resources intended for replacing old water mains were used to accommodate unexpected county projects and the consolidation of the Warm Beach system, resulting in some delay to the District’s pipe replacement program; however, the District still believes it is on track to have the majority of the oldest AC water main replaced by 2028 as shown in the capital facilities planning chapter.
3.2.4 Other Relevant Planning Documents
3.2.4.1 North Snohomish County Coordinated Water System Plan
The District is a member of NSWUCC. This group of water suppliers work together to create the North Snohomish CWSP, mostly recently updated in 2010. The 2010 CWSP Update sets minimum standards that must be followed by all water systems in unincorporated parts of the CWSSA. It also designates service area boundaries for each system to prevent overlapping or redundant water service.
More information on the CWSP can be found in Chapter 2.

DRAFT
20-2733 Page 3-10 2021 Water System Plan Update February 2022 Snohomish County PUD No. 1
3.2.4.2 Regional Water Supply Outlook
The Regional Water Supply Outlook (Outlook) is a regional assessment of municipal water supply and demand throughout King, Pierce, and Snohomish Counties. The Outlook was developed by the Water Supply Forum (Forum). The Forum is a voluntary organization comprised of representatives from water utilities and local governments. District participation occurs through its involvement in the EWUC, which is a Forum member. As part of this effort, water demand data was gathered from 118 water utilities in the region that serve greater than 500 customers. These utilities provide water to more than 94 percent of the area population.
The Forum issued full Outlook reports in 2001 and 2009 with an abbreviated Regional Water Supply Update in 2012.The Outlook describes how conservation efforts have significantly reduced water demands since 1990. The Executive Summary of the 2009 Outlook states that water use by single-family homes was 276 gpd in 1990 compared to 197 gpd in 2005. The Seattle, Tacoma, and Everett areas use less water today than 40 years ago, despite significant population growth. Primary reasons for this reduction are water metering and increasing water rates. Other reasons include a reduction in water use by the region’s industries, plumbing code changes, utility conservation programs, efforts to reduce distribution system leakage, and lingering changes in habits from water short years.
Table 3-7 summarizes the weighted average water use factors for single-family, multi-family, and non-residential customer classes in each county and the region for 2004-2006, in addition to sub-area averages determined for Snohomish County. The weighted averages were computed based on usage reported by each utility weighted by the number of households in each utility’s service area. Weighted averages for non-residential water use were determined by matching the non-residential usage from the water utility surveys with employment populations from Puget Sound Regional Council (PSRC) demographic data.
Table 3-7 | Regional Average Water Use in 2004-2006
Single-family (gpd/unit)
Multi-family (gpd/unit)
Non-residential (gpd/employee)
King County weighted average 193 124 41
Pierce County weighted average 244 167 78
Snohomish County weighted average 220 131 57
Regional Weighted Average 210 142 65
Range of individual water system data 130-370 40-255 21-265
Snohomish County PUD No. 1 (Lake Stevens Integrated System)
215 70 38
Everett (Retail and Wholesale) weighted average 219 133 57
Rest of Snohomish County weighted average 226 109 60
Data reported for the District in this study is included in Table 3-8 for comparison. The District’s single-family water use factor of 215 gpd per unit in 2004-2006 corresponds closely with County and Everett regional weighted averages. The low water use factor indicated for the District’s

DRAFT
20-2733 Page 3-11 2021 Water System Plan Update February 2022 Snohomish County PUD No. 1
multi-family customers may be due to the study’s methodology for counting multi-family units in the District’s service area. For non-residential usage, the District’s result is reasonably close to the weighted averages.
The Outlook also observes that MDD/ADD ratios in data reported by the water systems ranged from 1.4 to 3.0. The average ratio among the surveyed water providers was 2.2. Generally, larger water systems with more commercial and industrial users had lower peak day factors.
Work for the 2009 Outlook included preparation of a Municipal Water Demand Forecast Model (Model) to forecast water needs by decade from 2010 through 2060 and to extrapolate the regional water demand to 2110. The Model tested several scenarios including variations of demographic growth and climate change. Under all scenarios, the Outlook found that existing active water supplies in the region can meet projected demands through 2050, but localized water shortages may exist where infrastructure is unavailable or inadequate to move water where it is needed. In the baseline and the low demographic scenarios, existing drinking water supplies could meet demands until 2060 or beyond.
After 2050, there could be shortages in water supply if climate change materializes as forecasted and/or if population growth is greater than the baseline demographics. Climate change scenarios in the model predict that available surface water supply will decrease, and projected water demands will increase. The model predicts that stream flows will be greater in the winter/fall months and lower in the spring/summer months compared to historical conditions, and that this impact widens over time. The model also predicts that customer water demands could be as much as 12 percent greater by 2060 due to the dryer spring and summer months. These projections assume no changes to reservoir operation and management and no new water supplies or additional conservation. Area utilities have adapted to past water supply fluctuations and drought periods through reservoir management, system adaptations, long-term conservation programs, and short-term curtailments. Climate change may increase these challenges, and utilities must be prepared to address such uncertainty in addition to planning for long-term supply availability.
Looking to the future, the Outlook examines potential water supply projects that water utilities have been studying and planning, plus other possible new projects. The projects are categorized into surface water, groundwater, desalination, reclaimed water, and green options. Unit costs of the identified projects ranged from $50 to $43,000 per MG of water produced. The Outlook provides information on these potential water supplies, but does not recommend which, if any, should be developed. However, the Outlook does propose a multi-criteria evaluation method that can be used by decision-makers in the region to compare supply options using a consistent and transparent approach.
The 2012 report update noted plateaued water use due to conservation and the departure of the Kimberly-Clark paper mill from the region. The update included a new 50-year demand forecast which predicted 2060 demands at approximately 70 MGD, approximately 100 MGD lower than the 2007 forecast for 2060. The report showed a similar trend for major adjacent water supply purveyors such as Tacoma Water and Seattle Public Utilities. These conservation

DRAFT
20-2733 Page 3-12 2021 Water System Plan Update February 2022 Snohomish County PUD No. 1
measures as well as better stewardship of regional supply sources means that “The central Puget Sound region has sufficient water for at least the next 50 years, given considerations of growth in the region and the potential impacts of climate change.”
3.2.4.3 Watershed Basin Plans
District water facilities are located in two Ecology Water Resource Inventory Areas (WRIAs): the Stillaguamish Basin WRIA 5 and the Snohomish Basin WRIA 7. Planning efforts for these basins are described in Section 8.1.
3.2.4.4 Groundwater Management Plan
The County developed its draft Groundwater Management Plan (GWMP) in 1999. The GWMP provides a framework for protection of ground water resources within the County. The Surface Water Management Division of the County Public Works Department is the lead agency for implementing the GWMP.
The County developed a Ground Water Management Program as a direct result of the GWMP. The program objectives include:
▪ Providing the public with data on the groundwater resources of the County by compiling groundwater data and creating an on-line groundwater database.
▪ Preparing a subarea groundwater study to evaluate groundwater issues and recommend solutions at a local scale.
▪ Providing stewardship of groundwater in the County by recommending and implementing actions to protect groundwater quality for residential consumption and groundwater quantity for aquatic ecosystems.
▪ Providing management, policy, and technical expertise to help protect the quality and quantity of the groundwater resources in the County.
▪ Identifying development standards, policies, and regulations that would protect recharge to groundwater, prevent groundwater contamination, and maintain groundwater inputs to stream base flows.
▪ Coordinating and implementing groundwater management alternatives with purveyors, County departments, state, and federal agencies, and interested parties as set forth by the GWMP.
The County’s groundwater database has been a useful reference for the District, as it combines information from multiple data sources.
The subarea study mentioned above is the draft Getchell Plateau Groundwater Investigation, published in June 2005. The Getchell Plateau was selected for the study because residents in the

DRAFT
20-2733 Page 3-13 2021 Water System Plan Update February 2022 Snohomish County PUD No. 1
area are highly dependent on groundwater for potable water and because groundwater systems beneath the Getchell Plateau are representative of other County groundwater systems. The area covered by the investigation extends from the City of Snohomish to Arlington and from Marysville to Granite Falls, which pretty much covers the Lake Stevens Integrated WSA.
This investigation developed a picture of groundwater availability as both a source of potable water and as source of discharge to lakes, streams, and wetlands. The investigation also examined the potential impact of future urban and rural development on groundwater quality.
3.2.5 Review of Reclaimed Water in Other Planning Documents
The 2003 MWL and the amended Reclaimed Water Statute RCW 90.46 require water systems serving one thousand or more connections to evaluate opportunities for the use of reclaimed water. This section describes the District’s review of local planning documents to: (1) identify where reclaimed water production facilities and reclaimed water distribution lines exist; and (2) identify where reclaimed water is used or proposed within the District’s water service areas. Additional elements to evaluate reclaimed water opportunities are addressed in Chapter 6.
3.2.5.1 Reclaimed Water and Lake Stevens Sewer District Comprehensive Plan
The District has a close relationship with the Lake Stevens Sewer District (Sewer District), considering that Lake Stevens Integrated is the heart of the District’s largest water system. The Sewer District’s 2016 Wastewater Facilities Plan evaluated the potential for wastewater reclamation and reuse.
The Sewer District’s wastewater treatment facility (WWTF), completed in 2012, does not have sufficient storage volume for either bypass or reclaimed water. The Sewer District’s National Pollutant Discharge Elimination System (NPDES) Permit allows for discharge to Ebey Slough, and because of this, bypass and reclaimed water storage are not a requirement for the WWTF. Currently, the Sewer District can meet its NPDES discharge limits and not meet requirements for “Class A” Reclaimed Water.
Potential reuse options include offsets to existing water rights, irrigation or landscaping use, flushing of sanitary sewers and industrial use. For reclaimed water to be economically feasible, the cost of producing and distributing reclaimed water must be less than the cost of purchasing water. Currently, the Sewer District has determined that water reuse is only cost effective for sanitary sewer flushing.
3.2.5.2 Reclaimed Water Evaluation by Granite Falls
The Granite Falls 2013 WSP states the potential for reuse within the water system. Granite Falls currently reuses non-potable water at the wastewater treatment plant for equipment wash down. In order to use more reclaimed water, additional wastewater treatment process capacity would be required for reuse, in addition to new pipeline and pumping capacity. Granite Falls has also determined that there are limited opportunities for reuse within the city as a majority of the

DRAFT
20-2733 Page 3-14 2021 Water System Plan Update February 2022 Snohomish County PUD No. 1
water use within the city is residential use. Therefore, expanding its reclaimed water program has been deemed infeasible at this time. Granite Falls will continue to perpetually re-evaluate reclaimed water opportunities.
3.2.5.3 Reclaimed Water Reuse by Everett
Reclaimed water use projects by Everett are beneficial to the District because of the shared Sultan Basin water supply. In 2005, Everett began providing reclaimed water for use as single-pass non-contact cooling water in Kimberly-Clark’s paper mill bleach plant heat exchanger. When the plant closed in 2012, this was discontinued, resulting in no remaining significant reclaimed water customers.
Everett has reviewed the feasibility of providing reclaimed water to other customers. Everett has identified potential customers for reclaimed water including two city-owned golf courses and the private Everett Golf and Country Club. Everett’s Legion Golf Course is within one mile from the Crosstown Line. However, in order for Everett’s reclaimed water to be used by these customers, it would need to be treated to a tertiary effluent level, most likely to a Class A reclaimed water standard, and additional permitting would be required.
Everett does not have plans to provide reclaimed water to other customers in the next 10 years, due to the high infrastructure cost to treat and deliver the water and the fact that there is not a near-term need for additional water supply.
3.2.5.4 Reclaimed Water Evaluation by Marysville
Marysville also has a wastewater treatment plant. Marysville’s 2016 WSP indicates that significant investments would be needed to install advanced treatment technology and a delivery system to customers that could put the water to use. Marysville does not currently have any plans to implement a reuse strategy but will periodically evaluate opportunities for reuse in the future.
3.3 Agreements with Other Water Systems
Table 3-8 lists relevant interlocal agreements that the District shares with cities and other water utilities. Numbers in the table correspond to the order of the agreements in Appendix 3-2. The following summaries are provided for information only.

DRAFT
20-2733 Page 3-15 2021 Water System Plan Update February 2022 Snohomish County PUD No. 1
Table 3-8 | Relevant Water Agreements
Agreement Dated Effective Through
Everett Water Supply Agreements
1 Agreement for Multipurpose Development of the Sultan River
July 21, 1960 The duration of the Federal Energy
Regulatory Commission (FERC) license, provided that the agreement will be renegotiated after 2031
2 Amended Agreement for Multipurpose Development of the Sultan River
November 17, 1981 The duration of the FERC license, provided that the agreement will be renegotiated after 2031
3 Supplemental Agreement Between the District and Everett
October 16, 2007 Addendum to the 1960 and 1981 agreements
4 Everett Water Rates Ordinance 3721-21 February 12, 2021 No end date.
North Snohomish County Joint Operating Agreements (JOA)
5 North Snohomish County Regional Water Supply JOA
January 10, 1991 No expiration date, but requires further agreements to be developed
6 Everett and JOA Participants Water Supply Contract
June 15, 2021 December 31, 2050
7 2003 Agreement between Marysville and the District for Water Supply
June 23, 2003 The life of the JOA Pipeline subject to review and modification every 10 years
District Wholesale Water Agreements
8 Gold Bar November 4, 2013 December 31, 2026
9 Arlington July 28, 1998 December 31, 2018 and thereafter unless terminated by mutual agreement or upon 5 year written notice of either party.
10 Sudden View January 1, 2020 December 31, 2029
11 Twin Falls (aka Seymour’s Water Company)
January 6, 2020 December 31, 2029
12 Granite Falls November 4, 2020 December 31, 2040
13 City of Snohomish November 20, 2020 December 31, 2040
Water Service Area Agreements
14 Gold Bar Settlement and Release Agreement
June 18, 2001 January 2020 (Update No. 16 below)
15 3.3.9 CWSP Service Area Agreement January 29, 1997 No end date.
16 Water Service Area Agreement Between PUD May Creek Water System and the City of Gold Bar
December 13, 2021 No end date. Agreement shall remain in effect unless terminated by written mutual agreement or upon one (1) year written notice by either party
17 Three Lakes Service Area Agreement 2010 No end date. Amended in 2011.
18 Letter from Monroe regarding temporary water service
November 5, 2010 No end date.
19 Agreement with Roosevelt Water Association, Three Lakes Water Association, Inc, and Meadow Lake Water Association
August 2011 No end date.
20 Revised Agreement with WBWA, the District – Kayak, and Seven Lakes Water System
February 2016 No end date.

DRAFT
20-2733 Page 3-16 2021 Water System Plan Update February 2022 Snohomish County PUD No. 1
Agreement Dated Effective Through
Other Agreements
21 Tulalip Settlement Agreement regarding May Creek Water Right
November 6, 1999 Binding
22 Sultan Water Supply Pipeline Construction, Operation, and Maintenance Agreement
April 25, 2000
23 Water and Sewer Mutual Aid Agreement August 15, 2006 Binding until a purveyor revokes its authorizing action and delivers a copy to the Everett Utilities Director
24 Mutual Aid Agreement for Intrastate Water Utilities
September 15, 2009 Termination in its entirety when there are less than two Members
3.3.1 Sultan River Agreement
The 1981 Amended Agreement for Multipurpose Development of the Sultan River updates an earlier 1960 agreement between Everett and the District (with amendments/supplements in 1981, 2007, 2008, 2009, 2012, and 2017) to build and maintain hydroelectric and water supply facilities in the Sultan River Basin, now collectively known as the Henry M. Jackson Hydroelectric Project. As will be described in the next chapter, the construction of the Jackson Project increased storage available for Everett’s primary water source in addition to creating the District’s Jackson Hydroelectric Plant. The agreements divide the project costs into water costs, hydroelectric costs, and joint costs and describe how the District and Everett will jointly operate the Jackson Project.
The District initially funded and constructed the Culmback Dam Stage I facilities, which were completed in 1965. The agreement specified a payment plan for Everett to reimburse half of the Joint Costs and all of the water costs. For Stage II, the District covered 25 percent of the filter plant costs and the entire cost of raising the dam and associated facilities, because Everett did not need additional storage at the time. When Everett’s water use reaches 140 MGD as a three-month average (1981 Amended Agreement), or when it exhausts the 11 billion gallons of storage in Culmback Dam Stage I and the 2.6 billion gallons in Lake Chaplain in three separate water years (2017 Am. Agmt), it will repay half the Stage II joint use facilities up to $10M over a 30-year period, with interest accruing from the time it reaches the usage limit.
The 1981 Amended Agreement, Article VII, states that water supply will continue to have precedence over power generation up to 225 MGD to the year 2020 but adds a restriction that water distribution is limited to a portion of the County specified by Exhibit A in the agreement. This does not change the fact that Everett’s water rights allow the water to be used throughout the County, and long-term planning still supports this use. However, the self-imposed limit will apply until 2020 unless the District and Everett agree to another amendment.
In the article of the 1981 agreement on water rates and service, Everett agrees to sell water to the District for re-sale to potential customers, provided that Everett has first option to serve previously un-served areas of the County on the same terms that the District would serve. Everett also agrees to charge reasonable rates to all city water customers whether such

DRAFT
20-2733 Page 3-17 2021 Water System Plan Update February 2022 Snohomish County PUD No. 1
customers are inside or outside of Everett. A copy of Everett’s current water rate ordinance is included in Appendix 3-2.
That same 2007 supplemental agreement (refined in 2008, 2009, and 2012) documented that the District and Everett entered into a supplemental agreement that, conforming to a declaratory order by the FERC, Everett was not required to be a licensee for any future FERC license for the Jackson Hydroelectric Project following the expiration of the existing FERC license in 2011. Everett will continue to cooperate with the District with respect to the operation of the project consistent with the requirements of the 1960 and 1981 Agreements, as amended and supplemented. The 2017 Amended Agreement detailed the criteria for sharing of operations, maintenance, repair and construction costs related to the Jackson Project, specifically for those Project elements that provided mutual value to both Everett and the District.
3.3.2 North Snohomish County Joint Operating Agreements
The District shares in the use of a 30-inch diameter pipeline (the Joint Operating Agreement Pipeline referred to herein as the JOA Pipeline) that delivers water from the Everett 3-Line to the Sunnyside vicinity of Marysville. Three agreements govern this arrangement, as described below.
3.3.2.1 North Snohomish County Regional Water Supply JOA
This agreement, executed on January 10, 1991, establishes initial arrangements between Marysville, the District, and the Tulalip Tribes (JOA Participants) so that construction of the JOA Pipeline could begin. The pipeline is owned by Marysville with each participant paying a proportionate share of the construction cost based on their percentage of a forecasted 2010 peak day demand. Before construction completion, the participants expected to develop more detailed procedures for managing, operating, maintaining, and financing for the pipeline and associated facilities. If water use by a participant exceeds its capacity rights, the remaining participants will lease back their unused rights until additional regional facilities are constructed, as also anticipated by the agreement.
3.3.2.2 Everett and JOA Participants Water Supply Contract
The original 1991 agreement between the City of Everett and JOA Participants was updated and approved by all parties in June of 2021. The agreement establishes the terms in which the City of Everett agrees to supply water to the JOA Pipeline and Participants. The critical provisions of the agreement include the following:
▪ Everett agrees to deliver and sell up to 20 MGD to the JOA Participants from the existing tap owned by Marysville located at 87th Avenue SE and 20th Street SE
▪ An Operating plan shown as Exhibit B in the agreement was developed to accommodate the operational needs of the parties

DRAFT
20-2733 Page 3-18 2021 Water System Plan Update February 2022 Snohomish County PUD No. 1
▪ If peak flow ratios (peak flow/average flow) become an issue that adversely affects Everett’s ability to deliver water under the conditions of the contract, a committee of the Participants will be convened and charged with modifying the Operating Plan in such a manner to reverse effects of peaking. If this effort is unsuccessful, Everett reserves the right to implement, and the Participants agree to pay, a demand charge as may be established by Everett ordinance
▪ Everett shall deliver high quality drinking water that meets all State and Federal standards at the point of delivery
▪ Rates and charges shall be established by ordinance of Everett from time to time
▪ Participants must obtain approval from Everett before selling the water to a future customer through a connection larger than 12 inches or more than 1 MGD and indicates that the decision would be based on water supply impacts to the Everett water system.
▪ Participants are restricted to providing water in the areas outside the service area shown in Exhibit A of the agreement.
3.3.2.3 Agreement with Marysville for Supply from the JOA Pipeline
This 2003 agreement details arrangements between the District and Marysville, including a charge to compensate Marysville for the operation and maintenance cost of making the water available at the District’s point of connection. By the time of this agreement, the District’s assigned capacity was determined to be 16.55 percent of the JOA Pipeline capacity, or 2,375 gpm over 24 hours, whichever is greater.
3.3.3 Gold Bar Agreements
The District has an emergency interconnect with Gold Bar. A copy of the current 2013 agreement is provided in Appendix 3-2 for information.
Also, a 2001 agreement with Gold Bar modified the service area boundary between the city’s water system and the District’s May Creek Water System. Negotiations for this agreement occurred sporadically from 1992 until the signing of the agreement. The parties agreed to adjust boundaries so that portions of the area where the District did not already have water facilities were transferred to Gold Bar’s future service area. The District continues to serve an area inside the city limits where District water facilities existed prior to annexation. Until 2020, the parties agree not to “contest” each other’s water service area boundaries.
On December 13, 2021, the District and Gold Bar executed a new water service area agreement that maintains, with the exception of two residential properties already served by Gold Bar, the retail and future service area boundaries shown in the 2001 Settlement and Release Agreement and the parties respective boundaries shown in their current water system plans. A copy of the new 2021 service area agreement is provided in Appendix 3-2 for information.

DRAFT
20-2733 Page 3-19 2021 Water System Plan Update February 2022 Snohomish County PUD No. 1
3.3.4 Arlington Wholesale Water Agreement
The District’s 1998 agreement with Arlington was designed to provide water to the city through a wholesale master meter identified in the District’s 1995 WSP. The District agreed to provide up to 1,000 gpm by 2002. Arlington agreed to consume the water in a manner to minimize its peaking factor, determined as a ratio of annual peak day to ADDs. This is accomplished by a flow control valve at the master meter and by Arlington’s use of the connection as a base source of supply with demands in excess of the agreed amount being supplied by Arlington’s other sources.
Wholesale water rates paid by Arlington are based on Everett’s water rates plus the District’s cost of pumping, conveyance, administration, and depreciation. The rate is adjusted annually, effective April 1st of each year, in accordance with cost components listed in Exhibit 2 of the agreement. The District aims to notify Arlington at least 45 days before each rate change becomes effective.
Arlington paid a GFC for 1,820 ERUs, determined by dividing 1,000 gpm by 0.55 gpm per ERU. The District committed to provide the water between 650 and 726 feet hydraulic grade line (HGL) at the master meter location. The agreement says the District’s system will have sufficient capacity to supply the water in accordance with the agreement. Arlington provides its own water storage, as described in its WSP.
The District and the Arlington are beginning negotiations on a new wholesale water service agreement with the hope to complete the new agreement in 2022.
3.3.5 Sudden View Wholesale Water Agreement
In 1999, the District entered into a standard Developer Extension Agreement with Iliad, Inc. to extend a water main to resolve capacity issues in the Sudden View system. As construction neared completion, the District and Iliad entered into a Wholesale Water Agreement to define ongoing arrangements for delivery of the water. The agreement was renewed in 2010 and again in 2020. Key points in the current agreement are:
▪ The agreement is intended for 48 ERUs.
▪ If Iliad wants to connect more than 48 homes or to connect a non-residential customer, it must first contact the District for written agreement.
▪ The wholesale water rate is the District’s Commercial Water Rate.
▪ Iliad must keep its well disconnected from the system.
▪ Iliad must annually test the cross-connection control assembly and submit the results to the District.

DRAFT
20-2733 Page 3-20 2021 Water System Plan Update February 2022 Snohomish County PUD No. 1
▪ Iliad will pay the District’s GFC charge for each new connection to the system. To date, Iliad has paid for 22 of the 48 ERUs, and 26 ERUs remain available. If a connection is made without the GFC payment, Iliad will pay 12 percent annual interest on the amount due from the time the connection was made.
▪ Iliad must submit an annual report by January 15th each year, listing the current customers. If Iliad fails to submit the report, a 30 percent surcharge can be added to the water bill after January 15th until the report is submitted.
▪ If Iliad fails to produce the annual report on more than one occasion or fails to pay a GFC when due, the District can collect all remaining GFC payments for the 48 ERUs.
▪ Iliad is responsible for maintaining water quality beyond the master meter.
▪ The District aims to provide the water at a hydraulic grade line above 600 feet, in the absence of a fire flow or water main break event.
▪ The hydraulic capacity of the Sudden View system does not include fire flow, and the maximum instantaneous flow for 48 ERUs is expected to be 103.1 gpm.
▪ Iliad is responsible to install and maintain pressure reducing and pressure relief valves to protect the Sudden View distribution system and its water service customers.
3.3.6 Twin Falls Wholesale Water Agreement
Twin Falls is a small water system owned by the Seymour Water Company and designed to serve up to 14 homes, with its own BPS and equalizing storage. The District preferred to provide water through a master meter, rather than owning and maintaining these water facilities. The District’s wholesale agreement with Twin Falls is less detailed than the agreement with Sudden View because all fees were paid up front. Key points of the Twin Falls agreement are:
▪ The agreement is intended for a maximum of 14 ERUs.
▪ To serve more than 14 homes or to connect any non-residential customer, Twin Falls must contact the District for written approval. Any capacity not achieved through the 1 ½-inch meter would require payment of additional GFCs and installation of a larger meter.
▪ The wholesale water rate is the District’s Commercial Water Rate.
▪ Twin Falls must annually test the cross-connection control assembly at the master meter and submit the results to the District.
▪ The District aims to provide the water at a hydraulic grade line above 500 feet at the master meter, in the absence of a fire flow or water main break event.

DRAFT
20-2733 Page 3-21 2021 Water System Plan Update February 2022 Snohomish County PUD No. 1
▪ Twin Falls is advised of potential low chlorine concentrations and high disinfection byproduct concentrations due to its long distribution and service lines and because of possible low water usage patterns. Twin Falls is responsible for any distribution system disinfection and flushing to maintain potable water quality for its customers.
3.3.7 Granite Falls Wholesale Water Agreement
The District’s 2020 agreement with Granite Falls replaces a previous 2009 agreement.
Key features of the agreement are:
▪ Three existing master meters define the point of delivery from the District’s system to Granite Falls’ Water System. The master meters are owned and maintained by the District. Additional master meters can be installed at Granite Falls’ expense. There are currently plans in place to establish a new fourth master meter in the vicinity of Gun Club Road to replace the master meter that was abandoned on Portage Avenue in 2018 at the request of the City.
▪ The District aims to provide water between 716 and 726 HGL at the master meter locations during normal operation. The regional water supply project can support a maximum flow of 3,000 gpm through the combined master meters for two hours. Granite Falls owns and maintains control valves on the downstream of the master meters to regulate pressure.
▪ Granite Falls will retain its wells and water rights for non-potable use. If it decides to reconnect the wells to its distribution system, it will install backflow prevention measures at the master meters.
▪ “Direct Service Customers” will continue to be allowed within Granite Falls’ Retail Water Service Area; however, subject to the revised 2020 Wholesale agreement the following new conditions will apply:
o Granite Falls will be billed the District’s current retail rate for each existing and new Direct Service Customer.
o Connection to a District water main inside Granite Falls’ Retail Water Service Area is not intended to be permanent and over time those services will be transferred to a permanent Granite Falls water main; therefore, the District will waive the Distribution System Charge (DSC) for any new Direct Service Customer connected to an existing District water main within the Granit Falls Retail Water Service Area, after the date of execution of this Agreement. The District’s DSC; however, will still be charged to new Direct Service Customers outside of the Granite Falls RSA but inside its future service area.

DRAFT
20-2733 Page 3-22 2021 Water System Plan Update February 2022 Snohomish County PUD No. 1
o All applicable customer service fees associated with a Direct Service Customer (e.g., shut-off, turn-on, and miscellaneous connection fees, etc.) shall be billed to Granit Falls as set forth in Appendix B of the District’s Policies Manual.
o The District will own, locate, and maintain service lines for Direct Service Customers from the District’s main to the water meter. This gives the District more control over facilities connected to its pipes.
o The District reads the meters for Direct Service Customers.
o The District bills Granite Falls monthly for water passing through the master meters and Direct Service Customers.
▪ Wholesale rates may be adjusted by the District’s Board of Commissioners from time to time as needed.
▪ When Granite Falls connects a new customer (either to its own distribution system or as a Direct Service Customer, it passes a portion of the hook-up fees to the District, equivalent to the GFC charge. The GFC covers water supply, transmission, and storage facilities that the District has agreed to provide to support each new city customer.
▪ For any new Direct Service Customer connected outside of the Granite Falls’ RSA but within their future service area, Granite Falls passes both the GFC and DSC to the District, to cover the cost of the District’s pipe fronting the property in addition to the source, transmission, and storage impacts.
▪ The ERU determination for calculating GFCs is based on tables in Appendix B of the District’s Policy Manual.
▪ Granite Falls’ Retail Water Service Area can expand within the UGA of its 2015 Comprehensive Plan. Any expansion beyond this boundary must be mutually agreed upon.
▪ The District can add customers in the UGA, but they must be transferred to city pipes as city limits expand. If a city main is not available when an area is annexed, then these remain District customers. When a city main becomes available, such customers will transfer to the city pipe, and the city will pay to abandon the old services.
3.3.8 City of Snohomish
In November 2020 the District entered into a new wholesale water agreement with the City of Snohomish. This new agreement replaced a Temporary/Emergency only use agreement from 2012 and a temporary, but full-time use, agreement that was entered into in 2017.

DRAFT
20-2733 Page 3-23 2021 Water System Plan Update February 2022 Snohomish County PUD No. 1
Key features of the agreement are:
▪ The City of Snohomish retains ownership and operation of its transmission line and approximately 75 customers served from that main
▪ General Facilities Charge: Under normal circumstances the GFC would be levied per ERU for a customer’s hook-up to the City of Snohomish’s water system, representing a proportionate share of the cost of providing the additional source, storage, and transmission components necessary to provide service to the new customers. Due to the unknown nature of the City of Snohomish’s future service to its current Transmission Main Customers, the GFC was waived in lieu of a capacity leasing agreement whereas the City of Snohomish agrees to pay for access to capacity being made available by the District on a per one hundred cubic feet (ccf) basis.
▪ Master Meter: The City of Snohomish is being served by an existing 2-inch master meter that was in installed in 2012 to serve the City of Snohomish Temporary/Emergency supply in the event of a water quality issue at their now decommissioned water treatment plant. The Agreement allows additional master meters to be installed at the City of Snohomish’s cost in the future, if the District agrees it is reasonably necessary to enhance the City of Snohomish’s water system.
▪ The wholesale water rates to the City of Snohomish will be adjusted by the District’s Board of Commissioners from time to time as needed.
3.3.9 CWSP Service Area Agreement
As described in Chapter 2, the District signed the Agreement for Establishing Water Utility Service Area Boundaries in 1997. The agreement verifies that the District accepts responsibilities assigned by the CWSP in its claimed water service areas.
3.3.10 Three Lakes Service Area Agreement
The District agreed to adjust its service area boundary with the Three Lakes Water Association in 2011. The process began with a request for water service that the District agreed would be better provided by the Three Lakes System. Representatives of Three Lakes and the District met to review the entire boundary in relation to the location of existing water mains before presenting the change to the County. The County required evidence of agreement between the water systems before making changes to the CWSP service area map.
3.3.11 Monroe Service Area Letter
The District has one residential customer inside Monroe’s claimed service area. This property is located outside of Monroe’s UGA. A letter from Monroe included in Appendix 3-2 documents the situation. If a city water main becomes available at this location, the city can transfer the service and abandon the District’s water service at its own expense.

DRAFT
20-2733 Page 3-24 2021 Water System Plan Update February 2022 Snohomish County PUD No. 1
3.3.12 Roosevelt Water Association, Three Lakes Water Association, and Meadow Lake Water Association
In August 2011, Roosevelt Water Association, Three Lakes, Meadow Lake Water Association, and the District signed an agreement to adjust their service boundaries to clarify service to unserviced lots between or overlapping areas of their original boundaries.
3.3.13 Warm Beach, Kayak, and Seven Lakes Water System
In February 2016, Warm Beach Water Association, Seven Lakes Water System, and the District (previously the Kayak portion of the district) signed an agreement to adjust their service boundaries to clarify service to unserviced lots between or overlapping areas of their original boundaries.
3.3.14 Tulalip Settlement Agreement for May Creek Water Rights
In 1996, the Tulalip Tribes appealed Ecology’s approval of a change to the District’s May Creek water rights. This 1999 settlement agreement outlines mitigation, in the form of a stream flow augmentation plan, which was satisfactory for the Tribes to drop their appeal.
When water pumped from the wells exceeds 398,880 gallons in a calendar day, the District will divert a “mitigation flow” back to May Creek using a formula and method described in the agreement. The District installed facilities and a control system to implement the agreement, which were inspected and approved by the Washington Department of Fish and Wildlife. As will be seen in Chapter 5, the District is far from reaching the usage limit that would result in these facilities being put to use.
3.3.15 Sultan Water Supply Pipeline Agreement
In 1998, Sultan and the District worked together to fund a Regional Water Supply Alternatives Study relating to Sultan’s UGA and the District’s satellite water service area. The study recommended a new pipeline to Everett’s 5-line. The route for the pipeline passes through the District’s Jackson Hydroelectric Project. The District took the lead for the design, construction, and long-term maintenance of the pipeline on District property due to potential risks and costs associated with crossing the Sultan River in the vicinity of the Jackson Project Powerhouse, the Lake Chaplain Return Line, and high-pressure penstock facilities. The District required that the pipeline be large enough to minimize the likelihood of future related river crossings or construction disturbances.
A 16-inch diameter pipeline (Phase 1) was determined to be sufficient to meet the above criteria from the 5-line connection to the point where the pipe leaves the powerhouse access road and enters Sultan’s easement. A 12-inch diameter water main (Phase 2) was constructed from that point to Sultan’s treatment plant and storage tanks. Sultan paid the District $200,000 to design

DRAFT
20-2733 Page 3-25 2021 Water System Plan Update February 2022 Snohomish County PUD No. 1
and develop plans and specifications for both phases. The District obtained the permits and government approvals, while Sultan took responsibility for the environmental review process.
The District paid the first $200,000 of the pipeline construction costs and the first $100,000 toward construction of the steel truss bridge carrying the pipe across the river, and Sultan paid for the rest of the construction expenses. Upon construction completion, the District became the owner of Phase 1 and Sultan became the owner of Phase 2, except for the master meter owned by Everett.
The District agreed to be responsible for maintaining and repairing the pipeline from where it connects to the 5-line to the point where the powerhouse access road turns eastward to join 116th Street SE and to be responsible for any future relocation of the pipeline resulting from improvements to the powerhouse or penstock facility. The District also took responsibility for the steel truss bridge for its useful life.
Sultan owns 66.7 percent, and the District owns 33.3 percent of the pipeline capacity, which is estimated to be between 3.89 and 5.76 MGD. Sultan is entitled to use the District’s capacity share until the District has need for it. At the end of its service life, the cost to replace any portion of the pipeline will be shared by the parties proportional to their share in the capacity ownership. The cost to replace the steel truss bridge at the end of its useful service life will be shared equally by the parties.
3.3.16 Mutual Aid Agreements
In 2006 an agreement was drafted between many water and sewer purveyors in the County. The agreement enables the purveyors to make requests through their “Designated Official” to other purveyors for personnel, materials, equipment, or other resources to deal with a disaster or emergency. Each utility executed the agreement in accordance with their applicable procedures. The District’s Board of Commissioners authorized its General Manager to sign the agreement through Resolution 5275 in August 2001.
In September 2009, the District’s Board of Commissioners authorized its General Manager to sign a mutual aid and assistance agreement with the Washington State Intrastate Water and Wastewater Agency Response Network (WARN) for personnel, materials, equipment, or other resources required in a disaster or emergency. The WARN is administered through regional committees and a state-wide committee. The agreement establishes how WARN is administered and details the procedures for requesting assistance, responding to requests, withdrawing from responding, cost reimbursement and the dispute process.

DRAFT
20-2733 Page 3-26 2021 Water System Plan Update February 2022 Snohomish County PUD No. 1
THIS PAGE INTENTIONALLY LEFT BLANK

Chapter 4
THIS PAGE INTENTIONALLY LEFT BLANK
DRAFT
20-2733 Page 4-1 2021 Water System Plan Update February 2022 Snohomish County PUD No. 1
Chapter 4
Existing Facilities
This chapter inventories the District’s major water facilities, including nine water systems with approximately 408 miles of pipelines, 15.5 MG of storage (16 active tanks), six water supply pump stations, 12 BPSs, 14 active wells, and 40 pressure zones. The physical condition, capacity, and age of these facilities are important in determining the adequacy of the water systems for meeting future water demands.
4.1 Primary Source of Supply
The District purchases the majority of its water from Everett, which uses the Sultan River as its primary water source. By 1942, Everett’s facilities included a concrete diversion dam and Tunnel No. 1, directing water from the Sultan River into the 4.5-billion-gallon Chaplain Reservoir about 16 miles east of Everett. These facilities are shown in Figure 4-1.
Everett and the District joined forces to build the “Sultan Project” starting in the early 1960s, as water supply needs increased. The first stage was completed in 1965 by constructing the Culmback Dam about 6.5 river miles upstream of Everett’s diversion dam, which created the Spada Reservoir. In 1984, the second stage of the Sultan Project raised the dam, increasing the Spada Reservoir capacity to 50 billion gallons. The second phase also included the construction of the Jackson Hydroelectric Plant, including a 14-foot diameter tunnel and 10-foot diameter pipeline from Spada Reservoir to the hydroelectric plant and a 72-inch diameter pipeline from the power plant to Chaplain Reservoir. These facilities are also shown in Figure 4-1.
Under typical operating conditions, Tunnel No. 1 is now used in reverse to return water to the Sultan River to maintain critical instream flows. The diversion tunnel can still be used in its original flow direction if supply from the hydropower plant is interrupted. Another use for the diversion tunnel is to provide an alternate supply to the filtration plant in the event of short-term water quality problems in Chaplain Reservoir.
District water systems receiving Everett water are Lake Stevens Integrated, Storm Lake Ridge, and Creswell. Figure 4-2 shows the location of District taps on transmission lines from the filtration plant. Water is normally conveyed to the District’s systems through Everett’s 3- and 5-Lines and through a connection on the Marysville JOA-Line. The District has eight connections on the 3-Line (most with backup connections on the 2-Line) and four connections on the 5-Line.
A more detailed description of all water sources supplying the District’s systems can be found in Chapter 8, including discussion of water rights, hydrology and hydrogeology, fishery conditions, watershed plans, supply yield, water shortage response planning, and wellhead protection plans.

DRAFT
20-2733 Page 4-2 2021 Water System Plan Update February 2022 Snohomish County PUD No. 1
4.2 Pressure Zones
Figure 4-3A, Figure 4-3B, and Figure 4-3C are schematic hydraulic profiles of the District’s Water Systems. Ground elevations within these systems range from about 20 to 730 feet. To provide water at adequate pressure, the Lake Stevens Integrated Water System is divided into 25 pressure zones; the Storm Lake Ridge Water System is divided into two pressure zones and the Creswell Water System consists of a single pressure zone. Lake Stevens Integrated hydraulic profile (Figure 4-3A) illustrates how the three water systems will be connected to form a single system in the future. The Warm Beach system (Figure 4-3B) consists of the six pressure zones, the Sunday Lake Water System of two pressure zones, and the Skylite and May Creek S\Water Systems of one pressure zone each (Figure 4-3C). The small 212 Market and Otis Water Systems also consist of one pressure zone each and are not included in the hydraulic profile figures.
The nominal HGLs and range of service elevations for each pressure zone is summarized in Table 4-1.
The pressure zones and their boundaries are based on topography, service elevations, natural and physical barriers, and the District’s WSA boundaries. Topographic considerations are significant because the District seeks to maintain service pressures between 40 and 80 pounds per square inch (psi). Service pressures exceeding 80 psi are unavoidable in many low-lying areas to assure that minimum pressure requirements are met at the highest elevations. Where service pressure exceeds 120 psi, the District installs and maintains pressure reducing valves (PRVs) in each meter box to protect the meter and the customer’s plumbing. When service pressure is between 80 and 120 psi, the District gives customers an option to pay for a District-maintained PRV or to install their own PRV in their plumbing system.
4.3 Facilities and Components
The District’s water facilities are shown on Figure 4-4A through 4-4G. The figures also illustrate the boundaries of the pressure zones described in the previous section.
4.3.1 Storage Facilities
The District owns and operates 16 water reservoirs dispersed throughout its water systems as detailed in Table 4-2 and shown in the figures at the end of this chapter. Recent changes to State and Federal seismic resiliency requirements may point to older tanks (in otherwise good condition) that could be vulnerable during an earthquake.
4.3.2 Pump Stations
The District owns and operates six main supply pump stations, five of which deliver purchased water to Lake Stevens Integrated and one that delivers purchased water to the Storm Lake Ridge Water System. In some areas of Lake Stevens Integrated, the purchased water is supplied
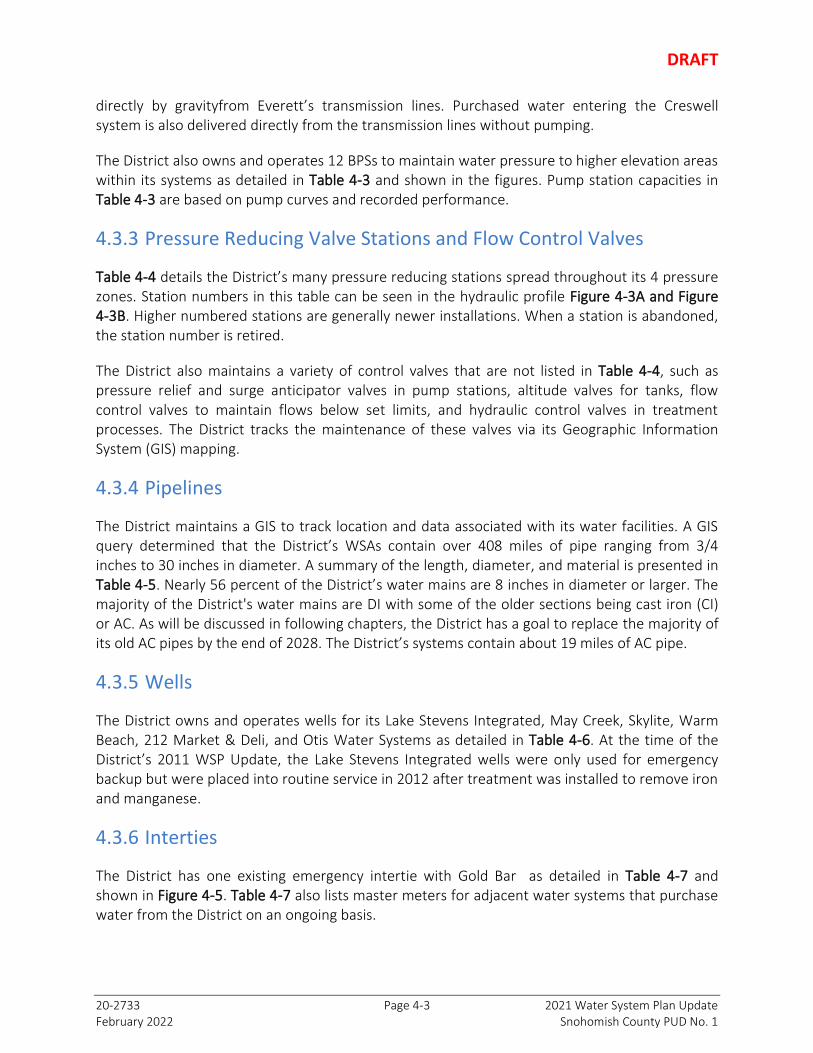
DRAFT
20-2733 Page 4-3 2021 Water System Plan Update February 2022 Snohomish County PUD No. 1
directly by gravityfrom Everett’s transmission lines. Purchased water entering the Creswell system is also delivered directly from the transmission lines without pumping.
The District also owns and operates 12 BPSs to maintain water pressure to higher elevation areas within its systems as detailed in Table 4-3 and shown in the figures. Pump station capacities in Table 4-3 are based on pump curves and recorded performance.
4.3.3 Pressure Reducing Valve Stations and Flow Control Valves
Table 4-4 details the District’s many pressure reducing stations spread throughout its 4 pressure zones. Station numbers in this table can be seen in the hydraulic profile Figure 4-3A and Figure 4-3B. Higher numbered stations are generally newer installations. When a station is abandoned, the station number is retired.
The District also maintains a variety of control valves that are not listed in Table 4-4, such as pressure relief and surge anticipator valves in pump stations, altitude valves for tanks, flow control valves to maintain flows below set limits, and hydraulic control valves in treatment processes. The District tracks the maintenance of these valves via its Geographic Information System (GIS) mapping.
4.3.4 Pipelines
The District maintains a GIS to track location and data associated with its water facilities. A GIS query determined that the District’s WSAs contain over 408 miles of pipe ranging from 3/4 inches to 30 inches in diameter. A summary of the length, diameter, and material is presented in Table 4-5. Nearly 56 percent of the District’s water mains are 8 inches in diameter or larger. The majority of the District's water mains are DI with some of the older sections being cast iron (CI) or AC. As will be discussed in following chapters, the District has a goal to replace the majority of its old AC pipes by the end of 2028. The District’s systems contain about 19 miles of AC pipe.
4.3.5 Wells
The District owns and operates wells for its Lake Stevens Integrated, May Creek, Skylite, Warm Beach, 212 Market & Deli, and Otis Water Systems as detailed in Table 4-6. At the time of the District’s 2011 WSP Update, the Lake Stevens Integrated wells were only used for emergency backup but were placed into routine service in 2012 after treatment was installed to remove iron and manganese.
4.3.6 Interties
The District has one existing emergency intertie with Gold Bar as detailed in Table 4-7 and shown in Figure 4-5. Table 4-7 also lists master meters for adjacent water systems that purchase water from the District on an ongoing basis.

DRAFT
20-2733 Page 4-4 2021 Water System Plan Update February 2022 Snohomish County PUD No. 1
4.3.7 Treatment Facilities
4.3.7.1 Everett Filter Plant
Everett adds chlorine and fluoride at its filter plant, which is conveyed through the District’s Lake Stevens Integrated, Storm Lake Ridge, and Creswell water systems. The District boosts the chlorine at its Granite Falls BPS to maintain a residual to the far ends of its Lake Stevens Integrated WSA.
4.3.7.2 Groundwater Treatment
The District also chlorinates its groundwater systems, with the exception of the Otis Water System. In all cases, chlorine is added as a preventive measure to control bacteria growth in the distribution systems. There are no known bacteria or virus concerns with the wells. Sodium hypochlorite is used as the form of chlorine in all District disinfection facilities.
4.3.7.3 Sunday Lake, Skylite, and Warm Beach Treatment
In addition, the District has a greensand filter system at its Sunday Lake Water System and two pyrolusite filter systems at its Warm Beach Water System to remove manganese, iron, and a trace of hydrogen sulfide. These are secondary contaminants that are only a concern for aesthetic reasons.
At the Skylite Water System, the District aerates the water as it enters storage tanks. This releases naturally occurring carbon dioxide, which in turn raises the pH to reduce corrosiveness of the water toward copper (C) plumbing.
4.3.7.4 Lake Stevens Well Treatment Facility (LSWTF):
In 2012 the District installed treatment to remove iron and manganese at its existing Lake Stevens Well site, after approximately 26 years of using the wells only as an emergency backup source. The treatment system consists of chlorine and potassium permanganate oxidation followed by filtration through Pyrolox (Manganese Dioxide) media to remove the iron and manganese found in the two wells on site. Fluoride is added to the finished water to ensure the treated water is consistent with water supplied by the District’s Everett wholesale supply.
In 2018/19 the estimated population served by the District’s Lake Stevens Integrated Water System exceeded 50,000 thus pushing the system into what is considered under the Lead and Copper Rule (LCR) as a large system. Based on the change of status, the District was required to perform an optimization study with respect to the LCR to identify the optimal corrosion control strategy for the system.
The District engaged the services of Confluence Engineering Group to complete the optimization study which examined the water quality data for the two sources of supply to the Lake Stevens system, the LSWTF and the Everett supply, existing water quality conditions in the distribution

DRAFT
20-2733 Page 4-5 2021 Water System Plan Update February 2022 Snohomish County PUD No. 1
system, lead and copper data collected under the LCR, the results of water quality modeling, and potential, future Long-Term Revisions to the LCR. This analysis led to the conclusion that pH adjustment treatment is recommended at the LSWTF for it to be considered optimized under the LCR. Although lead levels have been stable, copper levels have increased since the LSWTF was placed into service and pH adjustment is anticipated to reduce copper levels in the Lake Stevens system.
Specific conclusions and recommendations are as follows:
▪ The LSWTF water should be treated to a target pH of 7.6 with an operational range of 7.6 to 7.8. The minimum pH in the distribution system should be 7.4.
▪ Sodium hydroxide is the recommended pH adjustment method for the LSWTF.
▪ Once corrosion control treatment has been installed, the District will collect follow-up samples for lead and copper and conduct monitoring within the distribution system to confirm that the recommended minimum pH of 7.4 is being maintained.
The LSWTF optimization study was completed in June of 2019 and approved by DOH on July 31, 2019.
Due to space constraints associated with the existing LSTWF filter building the District budgeted for and began the design and permitting process for an expansion of the existing treatment building to accommodate the safe storage of the sodium hydroxide necessary to allow the optimal corrosion control treatment as outlined in the above-mentioned approved study. The roughly 528 square foot expansion of the existing building would allow for all treatment chemicals to be located in a separate room and provide sufficient space to accommodate the newly required sodium hydroxide main supply and day tanks. Based on the proximity of the LSWTF to Catherine Creek the first step was to work with the City of Lake Stevens on the land use permitting, specifically a required Shoreline Substantial Development permit. Delays in design and permitting due to the Covid 19 worldwide pandemic significantly delayed the design and permitting of the building expansion; however, the Shoreline Substantial Development permit was approved by the City on February 11, 2021. The District is currently in the process of finishing the final civil, structural, and electrical plans in preparation to go out to bid for the construction of the new addition to the existing treatment facility with the intent of constructing the new treatment plant building expansion before the end of 2021. During construction of the new chemical room, the plant will for the most part remain in service and no changes to the treatment process will be proposed.
Once the new expansion is complete, the design plans for the new chemical feed system and chemical storage tanks will be finalized along with the associated design report and provided to DOH for review and approval. It is anticipated that the installation of the new chemical storage tanks, chemical feed system, and control system changes will be completed by District staff with the assistance of the District’s supervisory control and Data Acquisition (SCADA) consultant and water quality consultant, Confluence Engineering, by summer of 2022, subject to DOH approval.

DRAFT
20-2733 Page 4-6 2021 Water System Plan Update February 2022 Snohomish County PUD No. 1
Table 4-1 | Pressure Zones
Pressure Zone Zone HGL (ft)
Max service Elev (ft)
Min Static Pressure (psi)
Min Service Elev (ft)
Max Static Pressure (psi)
Lake Stevens Integrated Water System
10th St SE 320 220 43 20 130
28th St SE 360 220 61 120 104
Blue Spruce/Rainbow Springs 400 280 52 160 104
Cavaleros 460 280 78 80 165
Cedar Lane/Indian Summer 320 190 56 170 65
Crest Lane 470 360 48 300 74
Dubuque – 157th Boosted (aka Machias Ridge East)
640 520 52 340 130
Dubuque – 44th Boosted 640 540 43 350 126
Dubuque Southwest 400 240 69 70 143
East Everett 300 203 42 80 95
Engebretson 470 320 65 185 123
Granite Falls 726 600 55 200 228
Hillcrest 580 460 52 260 139
Jordan 520 420 43 120 173
Jordan River Trails 325 210 50 140 80
Kla-ha-ya East 350 220 56 120 100
Kla-ha-ya North 270 140 56 80 82
Lake Cassidy 580 460 52 320 113
Lake Stevens Integrated 500 400 43 100 173
Lake Roesiger 811 730 35 420 169
Meeker Retreat 270 140 56 120 65
Soper Hill 450 300 65 80 160
Sunset Ridge 700 580 52 390 134
Sunnyside 300 205 41 20 121
Walker Hill 580 440 61 320 113
Storm Lake Ridge & Creswell Water Systems (to be connected with Lake Stevens Integrated)
Storm Lake Ridge (SLR) 760 670 39 320 191
Storm Lake Ridge Boosted 850 720 56 660 82
Creswell 525 360 71 300 97
Satellite Water Systems (groundwater sources)
Kayak-5351 (in Warm Beach) 535 450 37 325 91
Kayak-450 (in Warm Beach) 450 320 56 160 126
Kayak-370 (in Warm Beach) 370 180 82 150 95
Warm Beach-450 450 320 56 200 108
Warm Beach-350 350 240 48 80 117
Warm Beach-232 232 120 49 10 96
Sunday Lake 430 340 39 223 90
Sunday Lake Boosted 500 370 56 270 100
May Creek 392 330 27 200 83
Skylite 280 160 52 140 61
212 Market & Deli 360 245 50 235 54
Otis 540 425 50 400 61 Note: 1. The Kayak tank overflow is 546 feet; however, due to losses in the system, the zone HGL is closer to 535 feet when the tank is full.

DRAFT
20-2733 Page 4-7 2021 Water System Plan Update February 2022 Snohomish County PUD No. 1
Table 4-2 | Storage Facilities
Facility Type Location Year Built
Total Volume
(MG)
Diameter (ft)
Overflow Elevation
(ft)
Base Elevation
(ft)
Lake Stevens Integrated Water System
Walker Hill 1 & 2 Steel Cedar Road, near Lake Stevens Integrated HS
1973& 1990
2.0 & 2.0
70 490 422
Hillcrest 1 & 2 Steel 96th Ave SE & 9th Pl, E of Hwy 9
1998& 2009
3.0 & 3.0
100 502 450
Granite Falls Steel Wayside Mine Rd, near Iron Mountain Quarry
1995 2.7 120 726 694
Bosworth Steel N of 56th St NE, NW of the lake
1996 1.0 46 811 728
Lake Roesiger 1 & 2
Concrete Frank Monson Rd, NE of the lake
1992 0.2 & 0.2
30 811 771
Total Lake Stevens Integrated System Storage: 14.1
Other Systems with Purchased Water
Storm Lake Ridge Concrete 72nd Pl SE, W of Mero Rd
2000 0.23 30 762 718
Groundwater Systems
Kayak Tank Concrete North end of 66th Ave NW
2009 0.29 26 548 474
Warm Beach Tank
Bolted Steel
Well 4 Site 1995 0.2 32.7 350 319
Sunday Lake Concrete West end of 254th St NW
1995 0.2 26 430 380
Skylite Concrete 357th Ave SE, near Mann Rd
1997 0.1 30 170 150
May Creek 1 & 2 Concrete 156th St SE, W of 423rd Ave SE
1984 0.175 & 0.175
26 392 347
212 Market & Deli
Concrete Old Hwy 99 N at I5& Hwy 532
1995 0.002 6x5x9 vault
250
System with no storage that will merge into adjacent systems: Creswell
System with no storage requirement: Otis

DRAFT
20-2733 Page 4-8 2021 Water System Plan Update February 2022 Snohomish County PUD
Table 4-3 | Pump Stations
Facility/ Yr Constructed
Year Pump
Installed
Supply HGL Pressure Zone Served
Pump No.
Pump Mfr. Pump Model No. Rated Flow1 (gpm)
Rated Head (ft)
Speed (rpm)
Motor Power
(hp)
Supply Pump Stations to Lake Stevens Integrated 500 Pressure Zone:
E. Hewitt Supply/19682
1992 3 Line-450 Lk Stvns-500 1 Fairbanks 6937T, 6” impeller Previously 600
148 1,765 30
1968 3 Line-450 Lk Stvns-500 2 Goulds 10 LHC, 8” impeller Previously 1,450
100 1,765 50
Station capacity with both pumps running near rated flows:2021 Decommissioned
Soperwood Supply/1997
1997 JOA-450 Lk Stvns-500 1 Cornell 5RB-60-4, 12.25” Imp 1,365 120 VFD 60
1997 JOA-450 Lk Stvns-500 2 Cornell 5RB-60-4, 12.25” Imp 1,365 120 VFD 60
Station capacity with both pumps running near rated flows: 1,7003
Machias Supply/2002
2002 3 Line-450 Lk Stvns-500 1 Byron Jackson
12MQH-2 Stage 8.1298” Impeller
1,375 110 1,963 max VFD
60
2002 3 Line-450 Lk Stvns-500 2 Byron Jackson
same as pump1 1,375 110 1,750 max VFD
60
2006 3 Line-450 Lk Stvns-500 3 Byron Jackson
same as pump1 1,375 110 1,764/ VFD.
60
Current output with two pumps running at 25-50 ft TDH and 3rd pump maintained as a spare: 3,000
Glenwood Supply/2006
2006 3 Line-450 Lk Stvns-500 1 Goulds 14RJMC, 1 stage, 8.625” impeller
1,500 65 1,760/ VFD
40
2006 3 Line-450 Lk Stvns-500 2 Goulds same as pump1 1,500 65 1,760/ VFD
40
Recorded flow with both pumps running in July 2009 (speed is restricted to 85% max): 2,000
Lake Steven Integrated 500 Pressure Zone Total Pumped Supply: 6,700

DRAFT
20-2733 Page 4-9 2021 Water System Plan Update February 2022 Snohomish County PUD
Facility/ Yr Constructed
Year Pump
Installed
Supply HGL Pressure Zone Served
Pump No.
Pump Mfr. Pump Model No. Rated Flow1 (gpm)
Rated Head (ft)
Speed (rpm)
Motor Power
(hp)
Supply Pump Stations to Lake Stevens Integrated 580 Hillcrest Pressure Zone:
Hillcrest Booster/1982
1982 Lk Stvns-500 Hillcrest-580 1 Paco 71-2D121-730101A01-1
100 85 1,745 5
1982 Lk Stvns-500 Hillcrest-580 2 Paco 71-2D121-730101A01-1
200 85 1,750 10
1982 Lk Stvns-500 Hillcrest-580 3 Paco 71-2D121-730101A01-1
200 85 1,750 10
1982 Lk Stvns-500 Hillcrest-580 4 Paco 71-30121-740101A01-1
333 85 1,760 15
1982 Lk Stvns-500 Hillcrest-580 5 Paco 71-40125-740101A01-1
667 85 1,765 20
Hillcrest station capacity at rated flow and head: 1,500
Glenwood Supply/2006
2006 3 Line-450 Hillcrest-580 3 Goulds 10RJLC, 5 stage, 6.1875” impeller
500 145 1,740/ VFD
30
2006 3 Line-450 Hillcrest-580 4 Goulds 12CLC, 3 stage, 8.5625” impeller
1,000 155 1,750/ VFD
60
2006 3 Line-450 Hillcrest-580 5 Goulds same as pump 4 1,000 155 1,750/ VFD
60
Glenwood station capacity to Hillcrest-580 zone with largest pump reserved as a spare: 1,500
Lake Steven Integrated 580 Hillcrest Pressure Zone Total Pumped Supply with largest pump reserved as a spare: 2,333

DRAFT
20-2733 Page 4-10 2021 Water System Plan Update February 2022 Snohomish County PUD
Facility/ Yr Constructed
Year Pump
Installed
Supply HGL Pressure Zone Served
Pump No.
Pump Mfr. Pump Model No. Rated Flow1 (gpm)
Rated Head (ft)
Speed (rpm)
Motor Power
(hp)
Supply Pump Stations to Lake Stevens Integrated 580 Walker Hill Pressure Zone:
Walker Hill Booster/1992
1992 Lk Stvns-500 Walker Hill-580
1 Paco 16-20955130101-2689
95 80 1,745 5
1992 Lk Stvns-500 Walker Hill-580
2 Paco 16-30955130101-2782
200 80 1,755 10
1992 Lk Stvns-500 Walker Hill-580
3 Paco 16-30955130101-2782
200 80 1,755 10
1992 Lk Stvns-500 Walker Hill-580
4 Paco 16-50957140101-2852
500 80 1,765 20
1992 Lk Stvns-500 Walker Hill-580
5 Paco 16-50957140101-2852
500 80 1,765 20
1992 Lk Stvns-500 Walker Hill-580
6 Paco 16-50957140101-2852
500 80 1,765 20
Lake Steven Integrated 580 Walker Hill Pressure Zone Total Pumped Supply with largest pump reserved as a spare: 1,500
Supply Pump Stations to Lake Stevens Integrated 726 Granite Falls Pressure Zone:
Granite Falls Booster/1995
2006 Lk Stvns-500 Granite Falls-726
1 Peerless 12MB-8 Stage, 8.47” Impeller
1,000 355 VFD 150
2006 Lk Stvns-500 Granite Falls-726
2 Peerless same as pump 1 1,000 355 VFD 150
2002 Lk Stvns-500 Granite Falls-726
3 Peerless same as pump 1 1,000 355 VFD 150
2002 Lk Stvns-500 Granite Falls-726
4 Peerless same as pump 1 1,000 355 VFD 150
Lake Stevens Integrated 726 Granite Falls Pressure Zone Total Pumped Supply (operation limited to 2 pumps at a time):
2,000
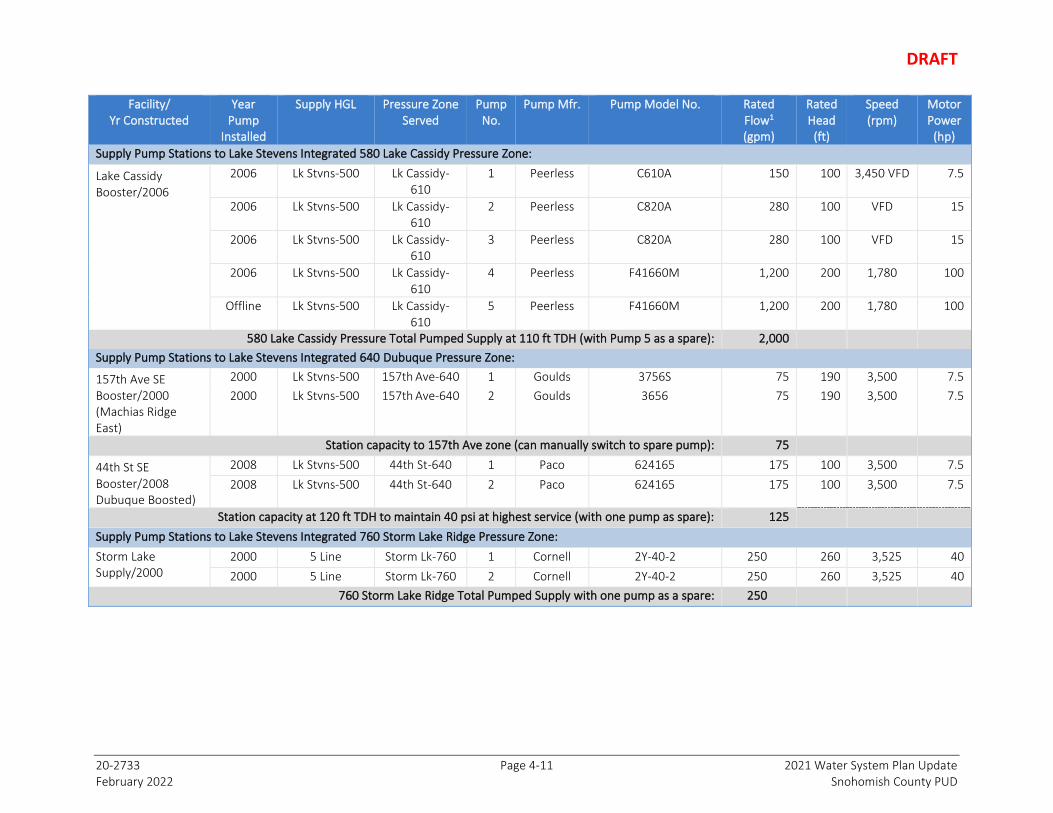
DRAFT
20-2733 Page 4-11 2021 Water System Plan Update February 2022 Snohomish County PUD
Facility/ Yr Constructed
Year Pump
Installed
Supply HGL Pressure Zone Served
Pump No.
Pump Mfr. Pump Model No. Rated Flow1 (gpm)
Rated Head (ft)
Speed (rpm)
Motor Power
(hp)
Supply Pump Stations to Lake Stevens Integrated 580 Lake Cassidy Pressure Zone:
Lake Cassidy Booster/2006
2006 Lk Stvns-500 Lk Cassidy-610
1 Peerless C610A 150 100 3,450 VFD 7.5
2006 Lk Stvns-500 Lk Cassidy-610
2 Peerless C820A 280 100 VFD 15
2006 Lk Stvns-500 Lk Cassidy-610
3 Peerless C820A 280 100 VFD 15
2006 Lk Stvns-500 Lk Cassidy-610
4 Peerless F41660M 1,200 200 1,780 100
Offline Lk Stvns-500 Lk Cassidy-610
5 Peerless F41660M 1,200 200 1,780 100
580 Lake Cassidy Pressure Total Pumped Supply at 110 ft TDH (with Pump 5 as a spare): 2,000
Supply Pump Stations to Lake Stevens Integrated 640 Dubuque Pressure Zone:
157th Ave SE Booster/2000 (Machias Ridge East)
2000 Lk Stvns-500 157th Ave-640 1 Goulds 3756S 75 190 3,500 7.5
2000 Lk Stvns-500 157th Ave-640 2 Goulds 3656 75 190 3,500 7.5
Station capacity to 157th Ave zone (can manually switch to spare pump): 75
44th St SE Booster/2008 Dubuque Boosted)
2008 Lk Stvns-500 44th St-640 1 Paco 624165 175 100 3,500 7.5
2008 Lk Stvns-500 44th St-640 2 Paco 624165 175 100 3,500 7.5
Station capacity at 120 ft TDH to maintain 40 psi at highest service (with one pump as spare): 125
Supply Pump Stations to Lake Stevens Integrated 760 Storm Lake Ridge Pressure Zone:
Storm Lake Supply/2000
2000 5 Line Storm Lk-760 1 Cornell 2Y-40-2 250 260 3,525 40
2000 5 Line Storm Lk-760 2 Cornell 2Y-40-2 250 260 3,525 40
760 Storm Lake Ridge Total Pumped Supply with one pump as a spare: 250
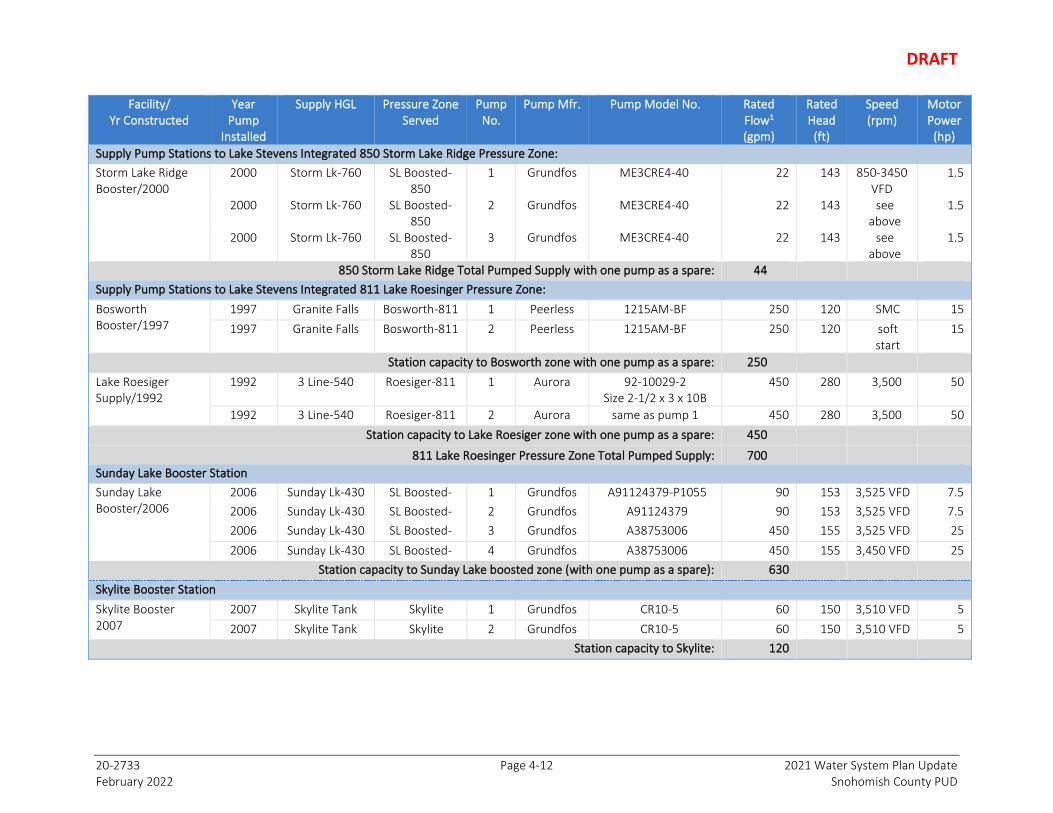
DRAFT
20-2733 Page 4-12 2021 Water System Plan Update February 2022 Snohomish County PUD
Facility/ Yr Constructed
Year Pump
Installed
Supply HGL Pressure Zone Served
Pump No.
Pump Mfr. Pump Model No. Rated Flow1 (gpm)
Rated Head (ft)
Speed (rpm)
Motor Power
(hp)
Supply Pump Stations to Lake Stevens Integrated 850 Storm Lake Ridge Pressure Zone:
Storm Lake Ridge Booster/2000
2000 Storm Lk-760 SL Boosted-850
1 Grundfos ME3CRE4-40 22 143 850-3450 VFD
1.5
2000 Storm Lk-760 SL Boosted-850
2 Grundfos ME3CRE4-40 22 143 see above
1.5
2000 Storm Lk-760 SL Boosted-850
3 Grundfos ME3CRE4-40 22 143 see above
1.5
850 Storm Lake Ridge Total Pumped Supply with one pump as a spare: 44
Supply Pump Stations to Lake Stevens Integrated 811 Lake Roesinger Pressure Zone:
Bosworth Booster/1997
1997 Granite Falls Bosworth-811 1 Peerless 1215AM-BF 250 120 SMC 15
1997 Granite Falls Bosworth-811 2 Peerless 1215AM-BF 250 120 soft start
15
Station capacity to Bosworth zone with one pump as a spare: 250
Lake Roesiger Supply/1992
1992 3 Line-540 Roesiger-811 1 Aurora 92-10029-2 Size 2-1/2 x 3 x 10B
450 280 3,500 50
1992 3 Line-540 Roesiger-811 2 Aurora same as pump 1 450 280 3,500 50
Station capacity to Lake Roesiger zone with one pump as a spare: 450
811 Lake Roesinger Pressure Zone Total Pumped Supply: 700
Sunday Lake Booster Station
Sunday Lake Booster/2006
2006 Sunday Lk-430 SL Boosted- 1 Grundfos A91124379-P1055 90 153 3,525 VFD 7.5
2006 Sunday Lk-430 SL Boosted- 2 Grundfos A91124379 90 153 3,525 VFD 7.5
2006 Sunday Lk-430 SL Boosted- 3 Grundfos A38753006 450 155 3,525 VFD 25
2006 Sunday Lk-430 SL Boosted- 4 Grundfos A38753006 450 155 3,450 VFD 25
Station capacity to Sunday Lake boosted zone (with one pump as a spare): 630
Skylite Booster Station
Skylite Booster 2007
2007 Skylite Tank Skylite 1 Grundfos CR10-5 60 150 3,510 VFD 5
2007 Skylite Tank Skylite 2 Grundfos CR10-5 60 150 3,510 VFD 5
Station capacity to Skylite: 120

DRAFT
20-2733 Page 4-13 2021 Water System Plan Update February 2022 Snohomish County PUD
Facility/ Yr Constructed
Year Pump
Installed
Supply HGL Pressure Zone Served
Pump No.
Pump Mfr. Pump Model No. Rated Flow1 (gpm)
Rated Head (ft)
Speed (rpm)
Motor Power
(hp)
Warm Beach Booster Station
Well 4 Booster/1995
1995 Warm Beach Tank
Warm Beach 450 PZ
1 Paco Smart Pump 65 140 3,500 7.5
1995 Warm Beach Tank
Warm Beach 450 PZ
2 Paco Smart Pump 65 140 3,500 7.5
Station Capacity to Warm Beach boost zone (one pump as a spare) 65
Note: 1. Rated flow when a single pump is operating 2. East Hewitt PS was decommissioned in 2021 through a developer extension agreement between the City of Lake Stevens and the District based on the proximity of a new road being proposed by the City of Lake Stevens that required approximately 20’ of fill in the area of the existing system. In return, the City of Lake Stevens provided the District a new fenced build site at the grade of the new road that includes suction and discharge piping as well as electrical and communication conduits necessary for the construction of a new pump station (shown in the CIP [see Chapter 11) as being planned for 2029). 3. Measured flow with two pumps on

DRAFT
20-2733 Page 4-14 2021 Water System Plan Update February 2022 Snohomish County PUD
THIS PAGE INTENTIONALLY LEFT BLANK

DRAFT
20-2733 Page 4-15 2021 Water System Plan Update February 2022 Snohomish County PUD No. 1
Table 4-4 | Pressure Reducing Valves
Station # / Location Zone Valve Size (in.)
Typical Upstream Pressure
(psi)
Settings (psi unless otherwise
noted)
Elevation (ft)
Calculated HGL (ft)
Zone HGL (ft)
Pressure Relief Valve Reverse Flow
Notes
From To Size (in)
Setting (psi)
Lake Stevens Integrated Water System Pressure Reducing Stations
1 / Jordan Rd & Jordan Trails Rd
Granite Falls Jordan Road 2-½
8 158
57 51
383 515 500
520
3 80 Yes Small valves in Stations 1& 3 work together as lead.
Station 1 large valve is 1st lag. Station 3 large valve is 2nd lag. 3 / Jordan Rd & 179th Dr NE
Granite Falls Jordan Road 3 8
215 105 95
273 515 492
3 125 Yes
2 / Rainbow Drive Jordan Road Blue Spruce 2-½
8 106
57 47
279 411 388
400
3 60 Yes
4 / Chappel Rd & 117th Pl NE
Jordan Road Blue Spruce 2 8
115 62 55
245 388 372
3 65 Yes Station 4 operates as lag to Station 2.
5 / Chappel Rd & 119th Pl NE
Jordan Road Blue Spruce 2 - 65 245 395 none n/a No Serves a dead-end pipe in the vicinity of other Blue Spruce stations.
6 / Chappel Rd & 177th Av NE
Jordan Road Blue Spruce 2 160 61 245 386 none n/a No Station 6 operates as lag to Station 7 in a small loop off of Chappel Rd.
7 / Chappel Rd & 178th Dr NE
Jordan Road Blue Spruce 1 160 65 265 415 none n/a No
27 / Jordan Rd, NW of 137th Dr NE
Jordan Road Meeker Retreat 2 - 55 140 267 270 none n/a No Small zone serving only 4 meters.
28 / Jordan River Trails Jordan Road Jordan River Trails 1-½ (2)3
140 35 30
247 328 316
325 none n/a No Two 3” valves in series to avoid cavitation.
43 / Jordan Trails Rd & Crest Lane
Jordan Road Crest Lane 2 78 58 340 474 470 none n/a No Serves 8 meters west of Jordan River Trails.
9 / Engebretsen Rd, N of Jordan Road
Granite Falls Engebretsen 2 8
163 68 63
315 472 461
470 3 85 No
8 / Engebretsen Rd & 175th Av NE
Engebretsen Cedar Lane/ Indian
Summer 2 8
148 55 45
194 321 298
320
3 60 Yes Station 42 is lag to the small valve in Station 8.
The large valve in Station 8 opens last for fire flows or flushing. 42 / Engebretsen Rd & 172nd Dr NE
Engebretsen Cedar Lane/ Indian
Summer 2 148 55 190 317 none n/a No
11 / Lake Bosworth Pump Station
Lake Roesiger Granite Falls 6 110 95 455 674 726 none n/a Yes Allows water back into the Granite Falls zone in case of emergency. Also
controls discharge pressure at the outlet of the Bosworth pumps, which is currently set for 140 psi.
41 / Carpenter Rd & Menzel Lake Rd
Lake Roesiger Granite Falls 2 8
120 83 77
532 724 3 unknown Yes Includes an upstream pressure sustaining feature set for 100 psi.
17 / 23rd St NE & 159th Av NE
Lake Roesiger Sunset Ridge 1 2
117 70 65
540 702 700 none n/a No Serves about 20 homes on 4” pipe, southwest of Lake Bosworth
10 / Granite Falls Pump Station
Granite Falls Lake Stevens 8 - 65 270 420 500
4 225 Yes
Allows water back to the Lake Stevens zone in case of emergency. An 8-in valve is on the suction side of the pumps. A solenoid valve closes when pumps turn on, so that the valve does not open when the pumps draw
down the suction side pressure.
24 / 36th St SE & 101st Av SE
Hillcrest Lake Stevens 6 88 44 377 479 3 65 Yes Supports fire flow to the Lake Stevens zone. Includes reverse flow in case
of major pressure loss in the Hillcrest zone.
47 / 8421 19th St NE (Campus Park)
Lake Stevens Soper Hill 2 8
86 53 46
305 427 411
450 3 65 Yes This station assists with fire flow and provide backup to gravity flow from the Marysville JOA line to the Soper Hill area. Can also flow in reverse to
back up the Lake Stevens zone.
15 / Sunnyside Blvd & 71st Av NE
Soper Hill Sunnyside 2 8
151 104 97
60 300 284
300 3 110 Yes Third and fifth valves to open to the Sunnyside Zone.

DRAFT
20-2733 Page 4-16 2021 Water System Plan Update February 2022 Snohomish County PUD No. 1
Station # / Location Zone Valve Size (in.)
Typical Upstream Pressure
(psi)
Settings (psi unless otherwise
noted)
Elevation (ft)
Calculated HGL (ft)
Zone HGL (ft)
Pressure Relief Valve Reverse Flow
Notes
From To Size (in)
Setting (psi)
21 / S. Lk Stevens Rd & 87th Av SE
Lake Stevens Cavaleros 8 123 90 223 431
460
3 115 Yes Backup supply to Cavaleros zone, which is normally fed from Everett
transmission.
45 / 8099 8th St SE Lake Stevens Cavaleros 6 2
88 64 64
294 442 3 unknown Yes
54 / 20th Sth SE & 79th Ave SE
Lake Stevens Cavaleros 12 97 67 269 424 none n/a Yes
18 / 10th St SE, West of 79th Av SE
Cavaleros 10th SE 2 8
118 60 55
177 316 304
320
3 70 Yes
46 / 157th Ave SE & 15th Pl SE
Cavaleros 10th SE 2-½
8 100
48 43
209 320 308
3 58 Yes Serves the plat of Cavalero Ridge. Equipped with a pressure sustaining
feature, to prevent pressure drop in the upstream 460 zone.
52 / Valtera, between Sunnyside &
Lundeen Lake Stevens 10th SE
2-½ 8
123 60 50
190 329 306
3 70 Yes Serves the plat of Valtera. Also has a pressure sustaining feature.
20 / 28th St SE & Cavaleros Rd
Cavaleros 28th St SE 2 140 75 180 353 360 none n/a No
53 / 17th St SE & 73rd Ave SE
Cavaleros East Everett 2-½
8 115
45 40
200 304 292
300 3 55 Yes Serves the plat of East Everett Hills. Station has a pressure sustaining
feature.
29 Kla-ha-ya (Tap) 5 Line Dubuque 6 170/140 110 433 - - No Everett-owned PRV
26 88th St SE & 125th Av SE
Lake Stevens Dubuque
Southwest 2 6
145 80 70
210 395 372
400
2 90 No Small valves in Stations 26 and 33 work together as lead. Large valve in Station 33 opens next. Large valve in Station 26 opens last.
33 / 121st Ave SE & 8th St SE
Lake Stevens Dubuque
Southwest 1 2
125 80 75
213 398 386
- - No
60 / Bartelheimer Dairy
Lake Stevens 2 120 70 75 237 - - No This is a service PRV on the 2” pipe that only goes to the Dairy.
30 / Kla-ha-ya, 60th St NE
Lake Stevens Kla-ha-ya E 1 2
145-175 100 95
120 351 339
350 - - No Upstream pressure depends on Everett 5-line, which
varies depending on season.
31 / 123rd Av SE, S of 58th Pl SE
Lake Stevens Kla-ha-ya N 2 6
145-160 65 60
124 274 263
270 3 75 No Upstream pressure depends on Everett 5-line, which
varies depending on season.
Warm Beach System Pressure Reducing Stations
48 / 7908 150th Pl NW Kayak-535 Kayak-450 2 6
129 66 57
302 444 433
440
3 72 Yes
49 / 17217 84th Ave NW (at 172nd St
NW) Kayak-535 Kayak-450
2 6
119 50 58
320 432 421
3 63 Yes
50 / 15219 Kayak Pt Rd Kayak-535 Kayak-450 2 6
120 40 33
321 413 397
3 50 Yes
51 / 16322 91st Ave NW
Kayak-450 Kayak-370 3 75 20 290 336 3 50 Yes
63 / 9620 188th St NW Warm Beach -
350 Warm Beach – 232
1.5 4
95 28 33
130 206
232
1.5 50 No
64 / 19212 96th Ave NW
Warm Beach - 350
Warm Beach – 232 1.5 4
97 30 35
125 206 1.5 50 No

DRAFT
20-2733 Page 4-17 2021 Water System Plan Update February 2022 Snohomish County PUD No. 1
Table 4-5 | Length of System Pipe
Diameter (in) AC C CI DI G PE PVC ST Total (ft) Total (mi)
¾-inch
97
97 0.02
1-inch
264 5
1,104
1,373 0.26
1-¼-inch
54
54 0.01
1-½-inch
111
313 1,730
2,154 0.41
2-inch 236
304 2,201 487 13,709 42,154 69 59,160 11.20
2-½-inch
25
2,817
2,842 0.54
3-inch 107
451 5
8,238 6 8,807 1.67
4-inch 9,554 62
140,691
115 37,636
188,058 35.62
6-inch 75,362 3,587
78,095
31,384 85 188,513 35.70
8-inch 15,587 4,664
1,133,853
528 62,936 53 1,217,621 230.61
10-inch 733 1,451
3,735
195
6,114 1.16
12-inch 23 13,643
366,732
1,328 5,563
387,289 73.35
16-inch
70,600
2,186
72,786 13.79
18-inch
319
319 0.06
24-inch
17,774
17,774 3.37
30-inch
3,015
3,015 0.57
Total (ft) 101,602 23,407 776 1,817,496 492 18,233 193,757 213 2,155,976
Total (mi) 19.2 4.4 0.1 344.2 0.1 3.5 36.7 0.04 408.3 408.3
AC = asbestos cement; C = copper; CI = cast iron DI = ductile iron; G = galvanized iron; PE = polyethylene; PVC = polyvinyl chloride; ST = steel; XX=Unknown
DRAFT
20-2733 Page 4-18 2021 Water System Plan Update February 2022 Snohomish County PUD No. 1
THIS PAGE INTENTIONALLY LEFT BLANK

DRAFT
20-2733 Page 4-19 2021 Water System Plan Update February 2022 Snohomish County PUD No. 1
Table 4-6 | Inventory of Active Wells
Water System DOH Source
ID
Well Tag #
PUD Source Name
Year Drilled
Year Pump
Installed
Diameter (in)
Ground Surface
Elev (ft)
Top of Screen (ft)
Bottom of
Screen (ft)
Completed Well
Depth (ft)
Pump No.
Pump Mfr. Type Pump Model No. Rated Flow
(gpm)
Rated Head (ft)
Speed (rpm)
Motor Power
(hp)
Generator
Sunday Lake S03 AGB638 Well 3 1994 1998 12 220 364 431 436 1 Goulds Submersible 8 RALC 6 Stage, 5”
Impeller 100 575 3500 20
Wired for trailer generator.
Skylite S01 AAA901 Well 1 1962 1986 8 154 38 48 48 1 UNK Submersible UNK 60 150 3450 3 Generator on site.
Skylite Secondary pump in Well 1 - 1982 - - - - - 2 UNK Submersible UNK 60 150 3450 5
May Creek S01 AGB579 Well 1 1983 1984 8 260 64 138 143 1 Layne & Bowler
Submersible 6 GH – 4 Stage 277 196 3500 20
Generator on site. May Creek S02 AGB629 Well 2 1994 2001 12 260 90 151 156 2 Goulds Submersible
10 RJMC – 8 Stage 8-1/2” Impeller
500 268 1740 50
Otis S01 AGB580 Well 1994 1994 423 228 233 233 1 Flint & Walling
Submersible Aermotor 31 Stage 33 368 3450 5 None
Lake Stevens
Integrated S05 AGB694 Well 1 1984 16 217 78 108 111 1
Byron Jackson
Submersible 12MQH 1200 405 1760 150 Wired for trailer
generator. Lake Stevens
Integrated S06 AGB695 Well 2 1984 16 217 78 98 101.5 2
Byron Jackson
Submersible 12MQH 1200 405 1760 150
212 Market &
Deli S01 ABD001 Well 1994 6 93 108 118 1 UNK Submersible UNK 2.5 UNK 3500 UNK None
Warm Beach S01 (Kayak) BBF570 Well 2 1979 2017 15 (reduces
to 10) 321 341 361 381 1 Grundfos Submersible
230S600-19, Product No 15BH0019, 19 stage
275 654 3450 60 Wired for trailer
generator. Warm Beach S02 (Kayak) BBF571 Well 3 1993 1994 12 333 370 400 402 2
American Turbine
Vertical Turbine
10-L-20 13 Stage
300 600 1765 60
Warm Beach S01 (Warm
Beach) ABR307 Well 2 1982 2014 6 175 171 180 180 Grundfos Submersible 60S75-13 50 303 3450 7.5 None
Warm Beach S04 (Warm
Beach) ABR309 Well 4 1990 2020 12 320 527 537 542 Franklin Submersible
F8STS225-4 Impeller diam "4B"
200 390 3450 25 Propane Gen. (permanent)

DRAFT
20-2733 Page 4-20 2021 Water System Plan Update February 2022 Snohomish County PUD No. 1
THIS PAGE INTENTIONALLY LEFT BLANK

DRAFT
20-2733 Page 4-21 2021 Water System Plan Update February 2022 Snohomish County PUD No. 1
Table 4-7 | Interties to Adjacent Purveyors
Purveyor Location Meter Size (inch) Purpose
Gold Bar May Creek Road 4” & (2) 2” Emergency Interlocal Agreement
Granite Falls (Saratoga) 830 Saratoga St 6” Wholesale
Granite Falls (100th St) 1401 100th St NE 8” Wholesale
Granite Falls (Alder) 100 S. Alder Ave 6” Wholesale
Arlington 11700 172nd St NE 6” Wholesale
City of Snohomish 3124 Robe Menzel Road (approximate)
2” Wholesale
Sudden View 17523 123rd Ave NE 2 Wholesale
Twin Falls 155th Ave NE, North of Jordan Rd
1.5 Wholesale

!
!
!
!!!!!!
!
!
!
!
!
!!
!
!
!!
!!!
!
!!
!
!!
!
!
!
!
!
!
!
!
!
!
!
!
!
!!
!!
! ! !!
!!
!!
!!
!
!
!
!
!
!!!!
!
!
!
!
!
!
!!
!
!
!
!!
!
!!
!!
!!
!!
!!
!!
!
!
!
!
!
!
!
!
!
Power tunnel
Power pipeline
Tunnel #1
Sultan R.
So. Fk. Sultan R.
Sultan
R.
Willi a
mson
Creek
Chaplain Cr.
Sulta
n Bas
in Rd
.
Lake ChaplainRd.
South Shore Road
Spada LakeReservoir
Lake Chaplain
Woods Lk.
Big Greider Lake
Little Greider Lake
Echo Lake
Sul ta
n R.
Treatment Plant
Tunnels#2& 3
Pipeline#5
Pipelines#2,3 & 4
PUD ReturnLine
0 3 Miles©
20-2733October 2021
Legend! ! Utility Tunnel
Everett Transmission LinesRoadsWaterRivers & Creeks
K:\TAC_Projects\20\2733 - Snohomish County PUD - 2021 Water System Plan Update\CAD\GIS\Report Figures\Figure4-1_MajorSourceofSupply.mxd 2/23/2021 5:39:38 PM Elisheva.Walters
Snohomish County PUD2021 Water System Plan Update
Figure 4-1Major Source of Supply
Data Sources:SnoPUDSnohomish County Geospatial Data Clearinghouse.Coordinate System: NAD 1983 StatePlane Washington North FIPS 4601 FeetProjection: Lambert Conformal ConicDatum: North American 1983Disclaimer: Snohomish PUD makes no representations, express or implied,as to the accuracy, completeness and timeliness of the information displayed.This map is not suitable for legal, engineering, or surveying purposes. Notificationof any errors is appreciated.

T
T
T
TT
T
TT
TT
T
T
T
Lake Stevens
Storm Lake Ridge
Creswell
Everett Transmission Lines #2,3 & 4
Everett Transmission Line #5
EVERETT
. MARYSVILLE
Lake StevensIntegrated
SNOHOMISH£¤2
¬«92
¬«9§̈¦I-5¬Ä1
€12
€8
€9€10
€13
€3€6
€4€5
€11
€2
€7
0 1 Miles ©
20-2733February 2022
LegendT Tap Source
Lake Stevens Integrated Water SystemOther PUD Water SystemsJOA Transmission LineEverett Transmission Lines
K:\TAC_Projects\20\2733 - Snohomish County PUD - 2021 Water System Plan Update\CAD\GIS\Report Figures\Figure4-2_SourceofSupplyandPUDTaps.mxd 2/7/2022 12:56:25 PM Christoph.Tanner
Snohomish County PUD2021 Water System Plan Update
Figure 4-2Source of Supply and
PUD Taps
Data Sources:SnoPUDSnohomish County Geospatial Data Clearinghouse.Coordinate System: NAD 1983 StatePlane Washington North FIPS 4601 FeetProjection: Lambert Conformal ConicDatum: North American 1983Disclaimer: Snohomish PUD makes no representations, express or implied,as to the accuracy, completeness and timeliness of the information displayed.This map is not suitable for legal, engineering, or surveying purposes. Notificationof any errors is appreciated.
Location # Location Name1 Lake Roseiger2 Storm Lake Ridge3 Creswell Taps 1&24 Dutch Hill Tap #2 (Dubuque)5 Dutch Hill Tap #1 (Dubuque)6 Machias Ridge East
(157th Avenue SE Tap)7 Machias Pump Station8 123rd Avenue SE (Kla-Ha-Ya)9 Williams Road (abandoned)10 Glenwood Pump Station11 East Hewitt Pump Station (Inactive)12 Cavaleros Pump Station13 Soperwood Pump Station
(Marysville JOA)
DRAFT
20-2733 Page 4-24 2021 Water System Plan Update February 2022 Snohomish County PUD No. 1
THIS PAGE INTENTIONALLY LEFT BLANK

2.0 MG
1000
300
400
500
600
700
800
200
900
100
20
40
60
80
20
40
60
80
20
40
60
80
20
40
60
80
20
40
60
80
20
40
60
80
20
40
60
80
20
40
60
80
20
40
60
80
0
20
40
60
80
EL 215
EL 185
EL 110
P
M
LAKE STEVENS WELLS
MEEKER RETREAT
270 PZ
E. EVERETT
300 PZ
SUNNYSIDE
300 PZ
10TH SE
320 PZ
CEDAR LANE
INDIAN SUMMER
320 PZ
JORDAN RIVER TRAILS
325 PZ
28TH SE
360 PZ
SOPER
HILL
450 PZ
CAVALEROS
460 PZ
BLUE SPRUCE &
RAINBOW SPRINGS
400 PZ
ENGEBRETSON
470 PZ
CREST
LANE
470 PZ
JORDAN
520 PZ
LAKE
STEVENS
500 PZ
CRESWELL
525 PZ
WALKER HILL
580 PZ
LAKE
CASSIDY
580 PZ
HILLCREST
580 PZ
SUNSET RIDGE
700 PZ
LAKE
ROESIGER
811 PZ
GRANITE
726 PZ
SOPERWOOD
TAP
M
CRESWELL
TAP
3.0 MG 3.0 MG
WALKER
HILLS TANKS
OE=502'
2.0 MG 2.0 MG
HILLCREST TANKS
OE=502'
PRV
15
PRV
47
PRV
65
PP
P
PRV
24
PRV
17
0.2 MG 0.2 MG
LAKE ROESIGER TANKS
OE=811'
1.0 MG
LAKE BOSWORTH TANKS
OE=811'
PRV
46
PRV
18
PRV
52
PRV
21
PRV
54
M
CAVALEROS
TAP
PP P
P
PRV
53
PRV
20
EVERETT PIPELINES 2 & 3
HGL 450
EVERETT
PIPELINES
2 & 3,
HGL 525
JOA
PIPELINE,
HGL 450
PRV
8
PRV
42
PRV
9
PRV
1
PRV
3
PRV
28
PRV
27
PRV
43
PRV
2
PRV
4
PRV
5
PRV
6
PRV
7
P
PRV
10
P
PRV
11
2.7 MG
GRANITE
FALLS TANK
OE=726'
M
CITY OF
ARLINGTON
M
FUTURE, GUN
CLUB RD
M
M
M
M
LAKE
ROESIGER
TAP
P
KLA-HA-YA
270 PZ
PRV
31
DUBUQUE
SOUTHWEST
400 PZ
PRV
26
PRV
33
KLA-HA-YA EAST
350 PZ
PRV
30
EVERETT
PIPELINES
2 & 3,
HGL 460
M
157TH AVE
TAP
STORM
LAKE RIDGE
760 PZ
DUBUQUE
BOOSTED
640 PZ
MACHIAS
RIDGE
EAST
640 PZ
P P
LAKE
ROESIGER
PS
SOPERWOOD
PS
WALKER
PS
LAKE
CASSIDY
PS
GRANITE
PS
BOSWORTH
PS
HILLCREST
PS
GLENWOOD
1 & 2, PS
E. HEWITT PS
(TO BE REPLACED)
MACHIAS
PS
157TH ST
PS
44TH ST
PS
GLENWOOD
3, 4 & 5
PS
EVERETT
PIPELINE
5, HGL
530
EVERETT
PRV 29
M
DUTCHH
TAP #2
M
123RD
AVE TAP
M
STORM LAKE
RIDGE TAP
P
STORM LAKE
RIDGE PS
0.2 MG
STORM LAKE RIDGE
TANK OE=762'
STORM LAKE
RIDGE BOOSTED
850 PZ
P
STORM LAKE
RIDGE BOOSTED
PS
PRV
41
3.6 MG
FUTURE BURN
ROAD TANK
OE=726'FUTURE STORM
LAKE RIDGE
CONNECTION
FUTURE
CRESWELL
CONNECTION
FUTURE CRESWELL
CONNECTION
M
DUTCHH
TAP #1
100TH ST
ALDER
SARATOGA
M
CITY OF
SNOHOMISH
(FT)
FUTURE CRESWELL CONNECTION
FUTURE NORTH
LAKE STEVENS
TANK OE=502'
~0.2 MG
FUTURE LAKE
ROESIGER TANK
OE=811'
K:\TAC_Projects\20\2733 - Snohom
ish County PU
D - 2021 W
ater System
Plan U
pdate\CAD
\Figures\20-2733-W
A-H
YD
RAU
LIC PRO
FILES-CT.dw
g 4-3A 2/17/2022 1:30 PM
CH
RISTO
PH
.TAN
NER
23.0s (LM
S Tech)
Water SystemPlan Update
20-2733
February 2022
ABBREVIATIONS
ELEVATION
MILLION GALLONS
OVERFLOW ELEVATION
PRESSURE REDUCING VALVE
PUMP STATION
PRESSURE ZONE
EL
MG
OE
PRV
PS
PZ
LEGEND
1.0 MG
OE=1240'
EXISTING FACILITIES
FUTURE FACILITIES
PRESSURE ZONE OR
SUBZONE
RESERVOIR
OVERFLOW
ELEVATION
CAPACITY
FIGURE 4-3A
HYDRAULIC PROFILELAKE STEVENS INTEGRATED,CRESWELL AND STORM LAKERIDGE WATER SYSTEMS
CONTROL VALVE
PUMP STATION
WELL
METER TAP OR
WHOLESALE USER
STORAGE ANALYSIS
SERVICE AREA
M
STORM LAKE RIDGE
SYSTEM
CRESWELL
SYSTEM
CITY OF GRANITE
FALLS TAPS
LAKE STEVENS
STORAGE ANALYSIS
SERVICE AREA
LAKE ROESIGER
STORAGE ANALYSIS
SERVICE AREA
GRANITE FALLS
STORAGE ANALYSIS
SERVICE AREA
AutoCAD SHX Text
P

300
400
500
600
700
200
100
20
40
60
80
20
40
60
80
20
40
60
80
20
40
60
80
20
40
60
80
20
40
60
80
0
20
40
60
80
KAYAK WELL 1
(INACTIVE)
KAYAK
WELL 2 KAYAK
WELL 3
WARM BEACH
WELL 4
WARM B EACH
WELL 2
LAKE MARTHA
INTAKE
(INACTIVE)
0.02 MG0.02 MG
LAKE MARTHA
SMALL TANKS
OE=200'
(INACTIVE)
0.055 MG0.055 MG
LAKE MARTHA
LARGE TANKS
OE=232'
(INACTIVE)
WARM
BEACH
232 PZ
PP
176TH
BOOSTER
STATION
(INACTIVE)
LAKE MARTHA
TRANSFER
STATION
(INACTIVE)
WARM
BEACH
PRV 1
LAKE MARTHA TANKS
ALTITUDE VALVE
(INACTIVE)
P
WELL 4
BOOSTER
STATION
WARM BEACH
350 PZ
0.207 MG
WARM BEACH TANK
OE=350'
WARM
BEACH
450 PZ
KAYAK
ESTATES-1
535 PZ
FUTURE
KAYAK TO
WARM BEACH
350 PZ PRV
KAYAK
ESTATES-3
370 PZ
PRV
KAYAK
ESTATES-2
450 PZ
152XX
KAYAK PT RD
PRV 50
172ND ST NW
& 84TH AVE NW
PRV 49
80XX
156TH ST NW
PRV 48
KAYAK - WARM
BEACH
CONNECTION
0.207 MG
KAYAK TANK*
OE=548'
-200
-100
-20
-40
-60
-80
-20
-40
-20
-40
-60
-80
EL 270
EL 231
EL 200
EL 321
EL -60
VOL TBD
FUTURE KAYAK
2 TANK
OE=548'
WARM BEACH
WELL 3
(INACTIVE)
EL 166
EL 12
EL -20
WARM BEACH
WELL 3R
(EMERGENCY
BACK-UP)
EL 166
EL 12
EL -44
WARM BEACH
WELL 5
(INACTIVE)
EL 165
EL -201
EL 5
WARM BEACH
WELL 1
(INACTIVE)
EL 13
EL -70
EL 175
EL 170
EL 20
EL -5
EL 333
EL 53
EL -69
EL 320
EL 55
EL -222
EL 53
(FT)
WARM
BEACH
PRV 2
K:\TAC_Projects\20\2733 - Snohom
ish County PU
D - 2021 W
ater System
Plan U
pdate\CAD
\Figures\20-2733-W
A-H
YD
RAU
LIC PRO
FILES.dw
g 4-3B 2/19/2021 1:16 PM
M
ATT.FEATH
ERSTO
NE 23.0s (LM
S Tech)
Water SystemPlan Update
20-2733
February 2021
FIGURE 4-3B
HYDRAULIC PROFILEWARM BEACHWATER SYSTEMS
ABBREVIATIONS
ELEVATION
FEET
MILLION GALLONS
OVERFLOW ELEVATION
PRESSURE REDUCING VALVE
PUMP STATION
PRESSURE ZONE
EL
FT
MG
OE
PRV
PS
PZ
LEGEND
1.0 MG
OE=1240'
EXISTING FACILITIES
FUTURE FACILITIES
PRESSURE ZONE OR
SUBZONE
RESERVOIR
OVERFLOW
ELEVATION
CAPACITY
NOTE:
*ZONE HGL IS LOWER THAN
TANK OVERFLOW DUE TO
SYSTEM LOSSES.
CONTROL VALVE
PUMP STATION
WATER TREATMENT
FACILITY
WELL
METER TAP OR
WHOLESALE USER
M
AutoCAD SHX Text
I
AutoCAD SHX Text
I
AutoCAD SHX Text
P

300
400
500
600
200
100
20
40
60
80
20
40
60
80
20
40
60
80
20
40
60
80
20
40
60
80
0
20
40
60
80
SUNDAY LAKE
WELL
SKYLITE
WELL
0.1 MG
SKYLITE
TANK
OE=170'
P
SKYLITE
PS
SUNDAY LAKE
430 PZ
SKYLITE
280 PZ
MAY CREEK
392 PZ
0.175 MG
MAY CREEK TANKS
OE=392'
0.2 MG
SUNDAY LAKE
TANK
OE=430'
P
SUNDAY LAKE
PS
SUNDAY LAKE
BOOSTED
500 PZ
0.175 MG
-200
-100
-20
-40
-60
-80
-20
-40
-20
-40
-60
-80
EL 220
EL 41
EL -216
EL 154
EL 136
EL 106 MAY CREEK
WELL 1
EL 260
EL 122
MAY CREEK
WELL 2
EL 109
(FT)
EL 265
EL 260
K:\TAC_Projects\20\2733 - Snohom
ish County PU
D - 2021 W
ater System
Plan U
pdate\CAD
\Figures\20-2733-W
A-H
YD
RAU
LIC PRO
FILES.dw
g 4-3C 2/19/2021 1:16 PM
M
ATT.FEATH
ERSTO
NE 23.0s (LM
S Tech)
Water SystemPlan Update
20-2733
February 2021
FIGURE 4-3C
HYDRAULIC PROFILESUNDAY LAKE, SKYLITE,AND MAY CREEK WATERSYSTEMS
ABBREVIATIONS
ELEVATION
MILLION GALLONS
OVERFLOW ELEVATION
PRESSURE REDUCING VALVE
PUMP STATION
PRESSURE ZONE
EL
MG
OE
PRV
PS
PZ
LEGEND
1.0 MG
OE=1240'
EXISTING FACILITIES
FUTURE FACILITIES
PRESSURE ZONE OR
SUBZONE
RESERVOIR
OVERFLOW
ELEVATION
CAPACITY
CONTROL VALVE
PUMP STATION
WELL
METER TAP OR
WHOLESALE USER
M
SUNDAY LAKE SYSTEM
SKYLITE SYSTEM MAY CREEK SYSTEM
AutoCAD SHX Text
P

DRAFT
20-2733 Page 4-28 2021 Water System Plan Update February 2022 Snohomish County PUD No. 1
THIS PAGE INTENTIONALLY LEFT BLANK

K:\T
AC_P
rojec
ts\20
\273
3 - S
noho
mish
Cou
nty P
UD -
2021
Wat
er S
ystem
Plan
Upd
ate\
CAD\
GIS\
Repo
rt Fig
ures
\Figu
re4-
4A_I
nteg
rate
dSys
tem-
Lake
Stev
ensA
rea.m
xd 2
/7/2
022
12:2
0:32
PM C
hrist
oph.
Tann
er
UT
UT
?>
?>
?>
?>
?>
?>
?>
?>?>
?>
[Ú
[Ú[Ú
[Ú
[Ú
[Ú
[Ú
[Ú [Ú[Ú
[Ú
[Ú
[Ú[Ú
[Ú[Ú
[Ú
[Ú[Ú
[Ú
[Ú
[Ú
[Ú[Ú[Ú
[Ú
[Ú
[Ú
[Ú
[Ú
[Ú
[Ú[Ú
[Ú
[Ú
[Ú
Î $³
Î $³
Î $³
Î $³
Î $³
Î $³
Î $³
Î $³
Î $³
Î $³
Î $³
Î $³
Î $³
Î $³
Î $³
Î $³
Î $³
Î $³Î $³
Î $³
Î $³
Î $³
Î $³
Î $³
Î $³Î $³
Î $³
Î $³
Î $³
Î $³Î $³
Î $³Î $³Î $³
Î $³
Î $³
Î $³Î $³
Î $³
Î $³
Î $³
T T
T
T
TT
T
T
T
TT
T
T
T
T
580,Hillcrest
700, SunsetRidge
350, Kla-Ha-Ya(East)270, Kla-Ha-Ya (North)
580, LakeCassidy
300, E. Everett
400, DubuqueSouthwest
460,Cavaleros
360, 28THST SE
640, 44thStreet
300,Sunnyside
420,Soper
Hill
811, LakeRoesiger
640, MachiasRidge East
(157th Ave SE)
580,Walker Hill
500, LakeStevens
320, 10thStreet SE
¬«92
¬«9
§̈¦I-5
Rte_2_Extension
State
Rte 5
29
Callo
w Rd
1st St
Vernon Rd
20thSt SE
147th A
ve NE
159th
Ave N
E28th St NESoper Hill Rd
123rd
Ave N
E64th St NERo
ss Rd
83rd
Ave S
E
92
State Rte 2
04
State
Rte 5
29
2nd St
Ceda
r Ave
60th St NE
Pine A
ve
Skylin
e Dr
91st
Ave S
EVer
non Rd
2
Fail Rd
71st
Ave N
E
Tanner Rd
Bickford Ave
Sexto
n Rd
84th St NE
Ave A
79th
Ave N
E
Lake Dr
Sunnyside Blvd N Davies Rd
Walnu
t St
Pine S
t
Rte_2_Extension
Beac
h Ave
43rd
Ave S
E
S Dav
ies R
d
E Lak
e Stev
ens R
d
60th St SE
4th St
44th St NE
67th
Ave N
E
Kuhlman Dr
Skipley Rd
Pilch
uck T
ree Fa
rm R
d
Maple
StCe
dar
St
79th
Ave N
E
80th St NE
83rd
Ave N
E
91st
Ave N
E
99th
Ave N
E
Sunnyside BlvdS M
achias
Rd
Ave D
Libert
y St
Rte_2_Extension
Grade Rd
Three Lakes Rd
20th St SE
Newb
erg R
d
61st
Ave S
E
Hickok Rd
Ok Mill Rd
147th
Ave S
E
131s
t Ave
SE
Maple
Ave
44th St NE
I-5
Rivershore Rd
Carlson Rd
Dubuque Rd
Oil Well Rd
LowellSnohomishRiver Rd
103rd
Ave S
E
State
Ave
Lundeen Park Way
Machias Cut Off Rd
Bunk Foss Rd
139th
Ave S
E
63rd
Ave N
E
14th St NE
N Machias Rd
171s
t Ave
SE
Sunn
yside
Blvd S
E
Larimer Rd
Riverview Rd
110th
Ave N
E
9
US Hwy 2
Ebey Island Rd
87th
Ave N
E
Fobes Rd
Foster Slough Rd
I-5
Lowell Larimer RdRiv
er Rd
20-2733 February 2022
0 1 Miles
T TapsÎ $³ PRV[Ú Pump Station?> WellsUT
EverettTransmission LineJOA TransmissionLines
Pipe -
Snohomish County PUD 2021 Water
System Plan Update
Figure 4-4A: Lake Stevens Integrated
Water SystemSouthwest Sub Area
Data Sources:Snohomish PUDSnohomish County Geospatial Data Clearinghouse.Coordinate System: NAD 1983 StatePlane Washington North FIPS 4601 FeetProjection: Lambert Conformal ConicDatum: North American 1983Disclaimer: Snohomish PUD makes no representations, express or implied,as to the accuracy, completeness and timeliness of the information displayed.This map is not suitable for legal, engineering, or surveying purposes. Notificationof any errors is appreciated.
©
Lake Stevens
Cavaleros Tap
44th PS
Glenwood TapGlenwood PS
Williams Rd Tap(abandoned)
Machias PS Tap Machias PS
Hillcrest PSHillcrest Tanks
Lake Stevens WellsWalker Hill PS
Walker Hill Tanks
Soperwood PSSoperwood Tap
Lake Cassidy PS
Conti
nuati
on to
Figu
re 4-4
BContinuation to Figure 4-4B
123rd Ave SE TapDutch Hill #1 Tap
Dutch Hill #2 Tap
Granite Falls PS
157th Ave SE Tap157th Ave SE PS
E Hewitt Tap

K:\T
AC_P
rojec
ts\20
\273
3 - S
noho
mish
Cou
nty P
UD -
2021
Wat
er S
ystem
Plan
Upd
ate\
CAD\
GIS\
Repo
rt Fig
ures
\Figu
re4-
4B_I
nteg
rate
d Sys
tem
Gran
ite Fa
lls A
rea.m
xd 1
0/2/
2021
11:
45:3
3 AM
Elish
eva.W
alter
s
UT
UT
UT
UT
?>
[Ú
[Ú
[Ú
[Ú[Ú
[Ú[Ú
[Ú
[Ú[Ú[Ú[Ú
[Ú
[Ú
[Ú[Ú
[Ú
T T
T
T
TT
T
T
T
TT
T
T
T
T
4
4
4
4
4
Î $³
Î $³
Î $³
Î $³
Î $³
Î $³
Î $³ Î $³
Î $³
Î $³
Î $³
Î $³
Î $³
Î $³Î $³Î $³
Î $³Î $³
Î $³
Î $³
Î $³Î $³
Î $³Î $³
Î $³Î $³
Î $³
Î $³
SR 92
S Machias Road
726,GraniteFalls
700, Sunset Ridge
320, Cedar Ln/ Indian Summer
470,Engebretson
580, LakeCassidy
811, LakeRoesiger
400, BlueSpruce &Rainbow Springs
545, Jordan
470, CrestLane
580,WalkerHill
500, LakeStevens
270, Meeker Retreat325, JordanRiver Trails
726, GraniteFalls
726,GraniteFalls
McElr
oy R
d
N Carpenter Rd
147th A
ve NE
159th
Ave N
E28th St NE
Mountain Loop Hwy
123rd
Ave N
E
92
60th St NE
Service
RdSte
arns R
d
Tanner Rd
Pilchuck
Tree F
arm Rd
Burn Rd
79th Pl NE
Lerch Rd
56th St NE
132nd St NE
Scotty Rd
Grade Rd
84th St NE
Jordan Rd
Jordan Trails Rd
Engebretsen Rd
44th St NE
N Machias Rd
Chappel Rd
Trangen Rd
Pilchuck Pl
Newberg Rd
Stehr Rd
Wayside Mine Rd
Hartfo
rd-Ge
tchell
Rd
Goebel Hill Rd
Scherrer Rd
158th St NE
72nd S
t NE
14thSt NE
N River Dr
Burn Rd
Granite
Falls-Pilchuck Rd
Bosworth
Dr
155th
Ave N
ESkinner Rd
Menzel Lake Rd
River
Rd Pilchuck
Tree Farm Rd
20-2733October 2021
0 4,000 Feet
LegendÎ $³ PRV4 Master Meter[Ú Pump Station?> WellsUT Tank
Pipe - Diameter6"8"10"12"16"18"24"
Snohomish County PUD 2021 Water
System Plan UpdateFigure 4-4B
Integrated SystemGranite Falls Area
Data Sources:SnoPUDSnohomish County Geospatial Data Clearinghouse.Coordinate System: NAD 1983 StatePlane Washington North FIPS 4601 FeetProjection: Lambert Conformal ConicDatum: North American 1983Disclaimer: Snohomish PUD makes no representations, express or implied,as to the accuracy, completeness and timeliness of the information displayed.This map is not suitable for legal, engineering, or surveying purposes. Notificationof any errors is appreciated.
©
LakeStevens
Arlington MM
Granite Falls Tank
Walker Hill PSWalker Hill Tanks
Lake Stevens Wells
Lake Basworth Tank
Lake Bosworth PSLake Cassidy PS
Lake Cassidy PS
Continuation to Figure 4-4B
Continuation to Figure 4-4B

K:\T
AC_P
rojec
ts\20
\273
3 - S
noho
mish
Cou
nty P
UD -
2021
Wat
er S
ystem
Plan
Upd
ate\
CAD\
GIS\
Repo
rt Fig
ures
\Figu
re4-
4C_S
unda
y Lak
e Wat
er S
yste
m.m
xd 1
0/2/
2021
11:
51:1
4 AM
Elis
heva
.Walt
ers
UT
?>
[Ú[Ú[Ú
[Ú
[Ú
T
T
T
T
TT
T
T
T
T
T
T
T
T
T
430,Sunday
Lake
500, SundayLake Boosted
254th St NW25th
Ave N
W
28th
Ave N
W
36th
Ave N
W
Pioneer Hwy
28th
Ave N
W
40th Ave NW
274th St NW
268th St NW
34th
Ave N
W
256th St NW
263rd St NW
Levis
on R
d
State Rte 532
Sunday Lake Rd
Olso
n Rd
20-2733October 2021
0 1,000 Feet
Legend[Ú Pump Station?> WellsUT Tank
Pipe - Diameter4"6"8"10"
Snohomish County PUD 2021 Water
System Plan UpdateFigure 4-4C
Sunday Lake Water Service Area
Data Sources:Snohomish PUDSnohomish County Geospatial Data Clearinghouse.Coordinate System: NAD 1983 StatePlane Washington North FIPS 4601 FeetProjection: Lambert Conformal ConicDatum: North American 1983Disclaimer: Snohomish PUD makes no representations, express or implied,as to the accuracy, completeness and timeliness of the information displayed.This map is not suitable for legal, engineering, or surveying purposes. Notificationof any errors is appreciated.
©
Sunday Lake
Sunday Lake Tank
Sunday Lake Booster Pump Station
Sunday Lake Well

K:\T
AC_P
rojec
ts\20
\273
3 - S
noho
mish
Cou
nty P
UD -
2021
Wat
er S
ystem
Plan
Upd
ate\
CAD\
GIS\
Repo
rt Fig
ures
\Figu
re4-
4D_S
kylite
Wat
er S
yste
m.mx
d 2/
7/20
22 1
2:53
:17
PM C
hrist
oph.T
anne
r
UT?>?>[Ú[Ú[Ú[Ú
T
T
T
T
T
T
T
T
T
T
T
T
T
T
T
MANN RD
358T
H AV
SE
356T
H AV
SE
355T
H DR
SE
357T
H AV
SE
158TH ST SE
157TH PL SE
357T
H AV
SE
280,Skylite
355th
Dr S
E
158th St SE
358th
Ave S
E
Mann Rd
357th
Ave S
E
356th
Ave S
E
160th
St SE
20-2733February 2022
0 500 Feet
Legend[Ú Pump Station?> WellUT Tank
Pipe - Diameter0.5" to 3"4"8"
Snohomish County PUD 2021 Water
System Plan UpdateFigure 4-4D
SkyliteWater System
Data Sources:Snohomish PUDSnohomish County Geospatial Data Clearinghouse.Coordinate System: NAD 1983 StatePlane Washington North FIPS 4601 FeetProjection: Lambert Conformal ConicDatum: North American 1983Disclaimer: Snohomish PUD makes no representations, express or implied,as to the accuracy, completeness and timeliness of the information displayed.This map is not suitable for legal, engineering, or surveying purposes. Notificationof any errors is appreciated.
©
Skykomish River
Skylite Tank andBooster Pump Station

K:\T
AC_P
rojec
ts\20
\273
3 - S
noho
mish
Cou
nty P
UD -
2021
Wat
er S
ystem
Plan
Upd
ate\
CAD\
GIS\
Repo
rt Fig
ures
\Figu
re4-
4E_M
ay C
reek
Wate
r Sys
tem.m
xd 1
0/2/
2021
11:5
9:05
AM
Chris
toph
.Tann
er
UTUT
?>?>[Ú[Ú
TT
T
T
TT
T
T
T
T
T
T
T
T
T
Dorman Rd
17th St
10th S
t
Linda Ave
Amanda Ave
Mountain Vw
May Creek DrGoldbar Blvd
415th
Ave S
E
Shelb
y St
6th St
9th St
7th St
8th St
May Creek Rd
408th A
ve SE
Orchard Ave
Evergreen Way418th Ave SE
Ajer Dr
13th S
t
405th A
ve SE
427th Ave SE
Goldbar Dr
Larson Dr
170th Pl SEReiter Rd
MountainView Pl E
Alpine Way
Timbe
rLn
168th St SE
Wallace Falls
Loop Rd
HallsLn
156th St SE
419th
Ave S
E
164th St SE
Moon
light
Dr
419th
Ave
423rd
Ave S
E
19th
StLe
y Rd
145th Pl SE
Gunn Rd
Dorman Rd
17th St
10th S
t
Linda Ave
AmandaAve
Goldbar Blvd
415th
Ave S
E
9th St
5th St
8th St
May Creek Rd
408th
Ave SE
AjerDr
13th
St
427th Ave SE
Goldbar Dr
LarsonDr
Reite
r Rd
AlpineWay
Moon
light
Dr
419th Ave
423rd
Ave S
E
19th St
Ley Rd
145th Pl SE
Gunn Rd
392, MayCreek
DormanRd
17th S
t
10th
St
Reiter Rd
LindaAve
May Creek Rd
AmandaAve
MountainVw
Goldbar Blvd
415th
Ave S
E
9th St
8th St
408th
Ave SE
418th
Ave S
E
Wallace Lake Rd
433rd Ave SE
13th St
405th
Ave SE
427th Ave SE
Larso
n Dr
7th St
2
MountainViewPl E
168thSt SE
429th
Ave S
E
169th St SE
156thSt SE
419th
Ave S
E
430th
Ave S
E
419th Ave
423rd
Ave S
E
19th St
May C
reek R
d
Ley R
d
145thPl SE
Gunn Rd
£¤2
20-2733February 2022
0 2,000 Feet
Legend[Ú Pump Station?> WellsUT Tank
Pipe - Diameter4"6"8"12"
Snohomish County PUD 2021 Water
System Plan UpdateFigure 4-4EMay Creek
Water System
Data Sources:Snohomish PUDSnohomish County Geospatial Data Clearinghouse.Coordinate System: NAD 1983 StatePlane Washington North FIPS 4601 FeetProjection: Lambert Conformal ConicDatum: North American 1983Disclaimer: Snohomish PUD makes no representations, express or implied,as to the accuracy, completeness and timeliness of the information displayed.This map is not suitable for legal, engineering, or surveying purposes. Notificationof any errors is appreciated.
©Skykomish River
Wallace River
May Creek Tanks
May Creek Wells 1 & 2

K:\T
AC_P
rojec
ts\20
\273
3 - S
noho
mish
Cou
nty P
UD -
2021
Wat
er S
ystem
Plan
Upd
ate\
CAD\
GIS\
Repo
rt Fig
ures
\Figu
re4-
4F_O
tis W
ater
Sys
tem.
mxd
2/7
/202
2 12
:52:
39 PM
Chr
istop
h.Ta
nner
?>[Ú
T
T
T
T
T
T
T
T
T
T
T
T
T
T
T
540, Otis
Burn Rd
Old Burn Rd
20-2733February 2022
0 400 Feet
Legend[Ú Pump Station?> WellsPipe - Diameter
0.5" to 3"
Snohomish County PUD 2021 Water
System Plan UpdateFigure 4-4FOtis Water
System
Data Sources:Snohomish PUDSnohomish County Geospatial Data Clearinghouse.Coordinate System: NAD 1983 StatePlane Washington North FIPS 4601 FeetProjection: Lambert Conformal ConicDatum: North American 1983Disclaimer: Snohomish PUD makes no representations, express or implied,as to the accuracy, completeness and timeliness of the information displayed.This map is not suitable for legal, engineering, or surveying purposes. Notificationof any errors is appreciated.
©
Otis Well

K:\T
AC_P
rojec
ts\20
\273
3 - S
noho
mish
Cou
nty P
UD -
2021
Wat
er S
ystem
Plan
Upd
ate\
CAD\
GIS\
Repo
rt Fig
ures
\Figu
re4-
4G_W
arm
Beac
h Wa
ter S
yste
m.m
xd 2
/7/2
022
12:5
0:25
PM C
hrist
oph.
Tann
er
UT
UT
?>?>
?>
?>
[Ú[Ú
[Ú
[Ú
[Ú[Ú
TT
T
T
TT
T
T
T
T
T
T
T
T
T
Î $³
Î $³
Î $³
Î $³
Î $³
Î $³
Î $³
Î $³
Î $³
Î $³
Î $³
450, KayakEstates-2
370, KayakEstates-3
535, KayakEstates-1
450, WARMBEACH 3
350, WARMBEACH 2232, WARM
BEACH 1
20-2733 February 2022
0 4,000 Feet
LegendÎ $³ PRV[Ú Pump Station?> WellsUT Tank
Pipe - Diameter46"8"10"12"
Snohomish County PUD 2021 Water
System Plan UpdateFigure 4-4GWarm Beach
Water System
Data Sources:Snohomish PUDSnohomish County Geospatial Data Clearinghouse.Coordinate System: NAD 1983 StatePlane Washington North FIPS 4601 FeetProjection: Lambert Conformal ConicDatum: North American 1983Disclaimer: Snohomish PUD makes no representations, express or implied,as to the accuracy, completeness and timeliness of the information displayed.This map is not suitable for legal, engineering, or surveying purposes. Notificationof any errors is appreciated.
©
Puget SoundWarm Beach Well
& Pump Booster Station
Kayak Tank
Kayak Well &Pump Station

T
T
T
T
TT
T
T
T
T
T
T
T
T
T
ÍÎ $³
MAY CREEK RD
LEY R
D
Larson Dr
Linda Ave
8th St
Goldbar Dr
May Creek Rd
Lewis Ave W
Evergreen Way
Ajer Dr
Wallace Falls Loop Rd
6th St
May Creek Pl
7th St
Mountain Vw9th St
Goldbar Blvd
Moon
light
Dr
StickneyMountain Pl Le
y Rd
Timbe
r Ln
0 400 800 Feet
T
T
T
T
TT
T
T
T
T
T
T
T
T
T
ÍÎ $³
MARYSVILLE
75th
Ave N
E
49th St NE
71st
Dr N
E
49th Pl NE
67th
Ave N
E
70th Ave NE
44th St NE
49th Pl NE 73rd
Dr N
E
76th
Dr N
E
45th Pl NE
71st
Ave N
E
68th
Dr N
E
79th A
ve NE
72nd
Dr N
E
52nd Pl NE 80th Ave NE
79th
Ave N
E
0 400 800 Feet
K:\T
AC_P
rojec
ts\20
\273
3 - S
noho
mish
Cou
nty P
UD -
2021
Wat
er S
ystem
Plan
Upd
ate\
CAD\
GIS\
Repo
rt Fig
ures
\Figu
re4-
5_Ex
isting
Inte
rties
_with
Mary
sville
andG
oldBa
r.mxd
10/
2/20
21 1
1:56
:16 A
M Eli
shev
a.Walt
ers
20-2733 October 2021
Snohomish County PUD 2021 Water
System Plan Update
Figure 4-5: Existing Interties (with Marysville and
Gold Bar)
©
©
Near: 40720 May CreekRd. Goldbar
Near: 7315 44TH ST NE.Marysville

Chapter 5

THIS PAGE INTENTIONALLY LEFT BLANK

DRAFT
20-2733 Page 5-1 2021 Water System Plan Update February 2022 Snohomish County PUD No. 1
Chapter 5
Planning Data and Demand Forecasting
5.1 Introduction
The planning efforts conducted by the District rely on a thorough analysis of its systems’ water demands. This section summarizes the District’s historical water consumption and supply trends in each water system between 2010 and 2019. Using this data, the demand per ERU, the ADD, and the MDD for each of the District’s systems are calculated for each year. The analysis then looks at the historical trends of these values and determines “planning” values to use in forecasting the system’s future water demand.
These planning values are used to forecast the future water supply and demands needs for the system for the next 10- and 20-year planning periods. The future water supply and demands determined by this analysis are used in later chapters to identify the required piping and facility capacity as one of the primary inputs to the capital improvement plan.
5.2 Definitions
When evaluating planned water use, it is important to clearly define the language used. Below is a summary of the terms used in this chapter and the throughout this plan.
Customers: The number of service connections served by the District.
Consumption: The true volume of water used by the water system’s customers. The volume is measured at each customer's connection to the distribution system.
Demand: The quantity of water required from a water supply source over a period of time necessary to meet the needs of domestic, commercial, industrial, and public uses, and to provide enough water to supply firefighting, system losses, and miscellaneous water uses. Demands are normally discussed in terms of flow rate, such as MGD or gpm and are described in terms of a volume of water delivered during a certain time period. Flow rates pertinent to the analysis and design of water systems are:
▪ Average Day Demand (ADD): The total amount of water delivered to the system in a year divided by the number of days in the year.
▪ Maximum Day Demand (MDD): The maximum amount of water delivered to the system during a 24-hour time period of a given year.

DRAFT
20-2733 Page 5-2 2021 Water System Plan Update February 2022 Snohomish County PUD No. 1
▪ Peak Hour Demand (PHD): The maximum amount of water delivered to the system, excluding fire flow, during a one-hour time period of a given year. A systems peak hour demand usually occurs during the same day as the peak day demand.
Distribution System Leakage (DSL): The annual amount of water calculated from the difference between the measured amount of water supplied into the system and the measured amount of water taken out of the system for consumption and other authorized uses. Authorized uses include both metered and unmetered water uses. Water use that is unmetered must be estimated to be classified as an authorized use. Examples of common unmetered water uses include the use of hydrants for flushing, firefighting, and construction. The calculated DSL volume consists primarily of water loss through leaks in the water system, but may also include meter inaccuracies, meter reading errors, water theft, and reservoir overflows.
Equivalent Residential Units (ERUs): One ERU represents the amount of water used by one single family residence for a specific water system. The demand of other customer classes can be expressed in terms of ERU’s by dividing the demand of each of the other customer classes by the demand represented by one ERU.
Non-revenue water usage: Consumption that is tracked or estimated, but not billed. The District tracks non-revenue water as water used for flushing, tank cleaning, construction, fire-fighting, and similar activities. Non-revenue water use typically makes up a small part of the total demand.
Supply: Water that is delivered to a water system by one or more supply facilities which may consist of supply stations, BPSs, and wells. Supply is further broken down into two categories, as further described below.
▪ Production: The amount of water supplied by District sources (e.g., Production wells).
▪ Purchased water: Supply purchased from another water system and supplied through third party mains. “
Unaccounted-for Water: Water that is measured as going into the distribution system but not metered as going out of the system.
5.3 Historical Water Usage
The systems managed by the District have changed since the last update of the WSP in 2011. The Lake Roesiger, Pilchuck 10, and Dubuque systems were merged into the Lake Stevens Integrated system in 2012, 2012, and 2014, respectively. The historical data for these systems have been combined with the Lake Stevens Integrated system.
The District acquired the Warm Beach system in September 2018 and historical data is available beginning in 2014. The Warm Beach system is currently in the process of being combined with the Kayak system, which will be jointly called Warm Beach. These two combined systems will be

DRAFT
20-2733 Page 5-3 2021 Water System Plan Update February 2022 Snohomish County PUD No. 1
shown as one system in the future projections at the end of this chapter and the system analysis shown in Chapter 7. A combined Warm Beach table is provided for each historical usage table shown below. The values shown in these tables come from the historical water usage of both the Kayak and Warm Beach systems.
5.3.1 Water Supply Purchased and Produced
Table 5-1 summarizes the monthly supply for each water system from 2010 through 2019. The tables review both purchased and well supply. Of the District’s nine existing systems, two purchase water (Creswell and Storm Lake Ridge), seven pump water from their wells (May Creek, Skylite, Kayak, Warm Beach, Sunday Lake, 212 Market & Deli, and Otis), and one system, Lake Stevens Integrated, uses both purchased and well water to supply its customers.

DRAFT
20-2733 Page 5-4 2021 Water System Plan Update February 2022 Snohomish County PUD No. 1
Table 5-1 | Historical Water Supply
Lake Stevens Integrated Water Purchased & Pumped (1000-gal)
2010 2011 2012 2013 2014 2015 2016 2017 2018 2019
January 120,670 125,832 112,228 110,825 99,454 104,847 176,974 101,841 111,662 107,967
February 110,300 112,017 102,996 98,039 89,764 90,959 62,424 105,133 105,181 83,006
March 123,140 124,167 106,753 107,987 101,899 104,846 67,980 103,146 100,216 105,101
April 122,255 119,930 117,797 109,786 113,679 106,952 112,689 108,056 131,151 109,521
May 133,780 130,353 123,372 126,407 113,190 128,363 121,466 119,832 129,971 176,355
June 138,290 137,089 114,015 134,259 128,889 191,574 144,260 178,796 177,132 193,479
July 232,293 157,465 149,885 212,612 195,552 221,612 146,459 215,274 216,866 170,914
August 214,719 201,991 193,825 174,738 164,745 183,527 173,361 208,289 191,507 195,053
September 135,438 167,124 156,690 128,588 132,824 117,242 130,881 174,655 156,170 132,332
October 129,245 126,429 115,203 117,188 106,702 105,627 106,777 112,201 115,932 127,292
November 128,878 112,532 106,382 107,391 104,137 104,389 104,555 107,474 111,658 96,004
December 120,893 112,734 111,436 114,166 104,120 107,703 112,434 102,037 106,264 133,020
Annual Production (1000-gal/year)
1,709,361 1,627,662 1,510,583 1,541,986 1,454,953 1,567,641 1,460,261 1,636,734 1,653,710 1,630,043
ADD (1000-gal/day) 4,683 4,459 4,139 4,225 3,986 4,295 4,000 4,484 4,531 4,466
Storm Lake Ridge Water Purchased (1000-gal)
2010 2011 2012 2013 2014 2015 2016 2017 2018 2019
January 749 859 832 1,034 1,059 915 910 1,068 994 1,003
February 688 815 790 889 877 868 907 860 983 1,038
March 770 830 797 937 903 878 939 939 950 949
April 786 895 917 1,008 1,101 1,006 1,135 1,004 1,230 1,183
May 968 896 1,142 1,121 1,126 1,482 1,372 1,281 1,190 1,552
June 1,040 952 975 1,456 1,490 2,780 1,690 1,720 2,620 1,918
July 2,927 1,313 1,458 2,851 2,432 3,340 1,785 3,252 2,620 2,352
August 2,445 2,028 2,579 2,085 2,035 2,364 2,331 3,193 2,023 2,302
September 1,025 1,775 1,827 1,177 1,290 1,128 1,131 1,889 2,023 1,419
October 928 984 1,208 1,032 1,032 1,054 1,039 1,021 1,078 1,245
November 925 791 855 951 921 955 983 1,045 1,043 935
December 839 993 967 941 948 969 1,034 993 1,051 1,195
Annual Production (1000-gal/year)
14,092 13,131 14,348 15,484 15,214 17,739 15,257 18,265 17,805 17,090
ADD (1000-gal/day) 39 36 39 42 42 49 42 50 49 47
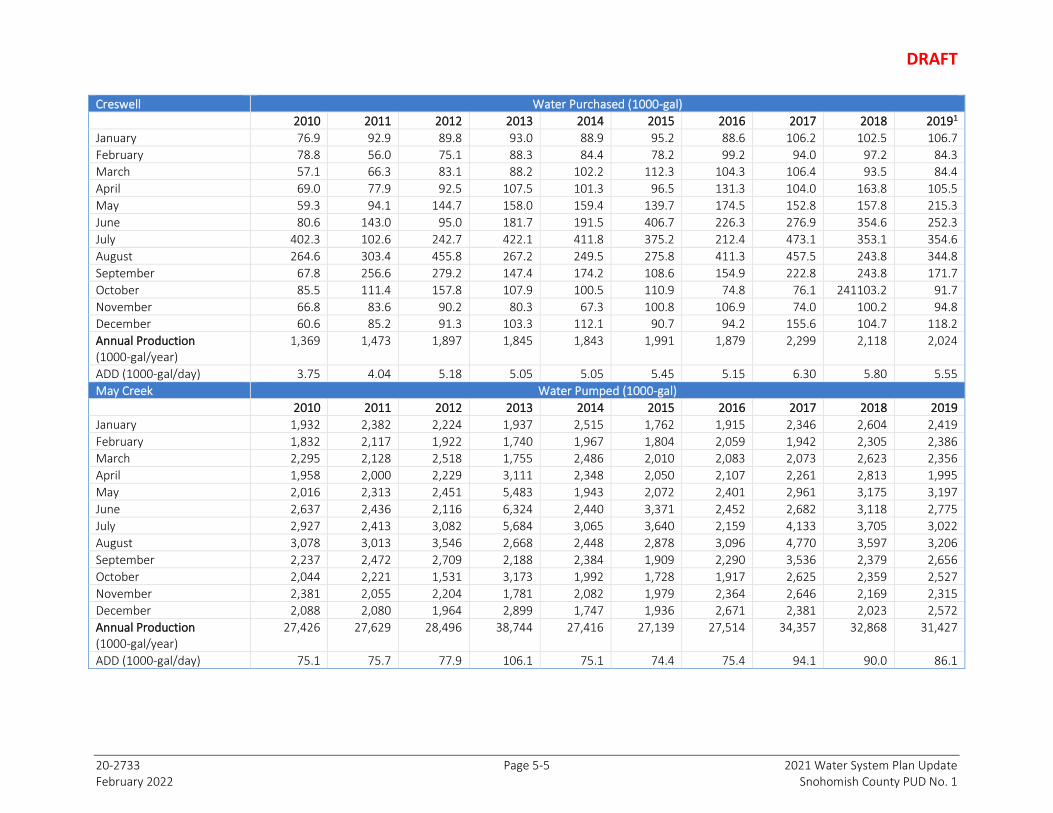
DRAFT
20-2733 Page 5-5 2021 Water System Plan Update February 2022 Snohomish County PUD No. 1
Creswell Water Purchased (1000-gal)
2010 2011 2012 2013 2014 2015 2016 2017 2018 20191
January 76.9 92.9 89.8 93.0 88.9 95.2 88.6 106.2 102.5 106.7
February 78.8 56.0 75.1 88.3 84.4 78.2 99.2 94.0 97.2 84.3
March 57.1 66.3 83.1 88.2 102.2 112.3 104.3 106.4 93.5 84.4
April 69.0 77.9 92.5 107.5 101.3 96.5 131.3 104.0 163.8 105.5
May 59.3 94.1 144.7 158.0 159.4 139.7 174.5 152.8 157.8 215.3
June 80.6 143.0 95.0 181.7 191.5 406.7 226.3 276.9 354.6 252.3
July 402.3 102.6 242.7 422.1 411.8 375.2 212.4 473.1 353.1 354.6
August 264.6 303.4 455.8 267.2 249.5 275.8 411.3 457.5 243.8 344.8
September 67.8 256.6 279.2 147.4 174.2 108.6 154.9 222.8 243.8 171.7
October 85.5 111.4 157.8 107.9 100.5 110.9 74.8 76.1 241103.2 91.7
November 66.8 83.6 90.2 80.3 67.3 100.8 106.9 74.0 100.2 94.8
December 60.6 85.2 91.3 103.3 112.1 90.7 94.2 155.6 104.7 118.2
Annual Production (1000-gal/year)
1,369 1,473 1,897 1,845 1,843 1,991 1,879 2,299 2,118 2,024
ADD (1000-gal/day) 3.75 4.04 5.18 5.05 5.05 5.45 5.15 6.30 5.80 5.55
May Creek Water Pumped (1000-gal)
2010 2011 2012 2013 2014 2015 2016 2017 2018 2019
January 1,932 2,382 2,224 1,937 2,515 1,762 1,915 2,346 2,604 2,419
February 1,832 2,117 1,922 1,740 1,967 1,804 2,059 1,942 2,305 2,386
March 2,295 2,128 2,518 1,755 2,486 2,010 2,083 2,073 2,623 2,356
April 1,958 2,000 2,229 3,111 2,348 2,050 2,107 2,261 2,813 1,995
May 2,016 2,313 2,451 5,483 1,943 2,072 2,401 2,961 3,175 3,197
June 2,637 2,436 2,116 6,324 2,440 3,371 2,452 2,682 3,118 2,775
July 2,927 2,413 3,082 5,684 3,065 3,640 2,159 4,133 3,705 3,022
August 3,078 3,013 3,546 2,668 2,448 2,878 3,096 4,770 3,597 3,206
September 2,237 2,472 2,709 2,188 2,384 1,909 2,290 3,536 2,379 2,656
October 2,044 2,221 1,531 3,173 1,992 1,728 1,917 2,625 2,359 2,527
November 2,381 2,055 2,204 1,781 2,082 1,979 2,364 2,646 2,169 2,315
December 2,088 2,080 1,964 2,899 1,747 1,936 2,671 2,381 2,023 2,572
Annual Production (1000-gal/year)
27,426 27,629 28,496 38,744 27,416 27,139 27,514 34,357 32,868 31,427
ADD (1000-gal/day) 75.1 75.7 77.9 106.1 75.1 74.4 75.4 94.1 90.0 86.1

DRAFT
20-2733 Page 5-6 2021 Water System Plan Update February 2022 Snohomish County PUD No. 1
Skylite Water Pumped (1000-gal)
2010 2011 2012 2013 2014 2015 2016 2017 2018 2019
January 987 894 776 693 730 605 776 1,399 691 767
February 729 1,071 681 357 640 579 881 769 627 604
March 888 1,032 727 1,023 767 721 877 747 715 611
April 671 678 808 721 644 663 857 667 765 625
May 743 823 985 815 669 638 1,043 880 820 909
June 971 808 898 926 768 1,074 1,095 889 784 817
July 1,165 846 1,148 1,622 988 1,143 1,131 1,257 1,113 882
August 1,274 1,260 1,124 1,456 889 941 1,382 1,008 1,028 907
September 858 1,300 976 1,164 862 779 849 781 728 652
October 782 1,372 610 719 697 698 825 673 683 709
November 875 824 1,194 540 704 795 1,027 724 659 620
December 1,020 844 735 786 682 818 1,101 642 604 821
Annual Production (1000-gal/year)
10,964 11,752 10,661 10,821 9,042 9,453 11,844 10,437 9,218 8,924
ADD (1000-gal/day) 30 32 29 30 25 26 32 29 25 24
Otis Water Pumped (1000-gal)
2010 2011 2012 2013 2014 2015 2016 2017 2018 2019
January 16.5 14.9 13.7 18.3 15.8 15.3 15.0 12.4 16.1 11.9
February 13.9 13.2 14.6 14.1 16.9 12.9 15.9 9.4 14.0 7.9
March 16.1 15.7 14.7 13.9 15.0 15.9 15.0 10.4 13.4 11.7
April 17.8 14.4 16.3 16.5 17.1 16.0 16.5 11.7 15.8 12.6
May 16.0 15.3 20.9 17.5 22.9 21.1 17.5 16.3 16.4 22.8
June 18.1 14.7 14.7 16.8 18.5 28.2 20.1 15.2 13.9 19.0
July 18.6 19.0 18.2 20.5 26.5 26.0 19.7 16.8 19.7 25.8
August 16.1 22.6 18.1 17.1 15.5 19.8 21.7 16.2 26.7 22.8
September 13.5 17.3 17.1 15.6 20.3 16.5 13.2 14.3 20.1 11.2
October 13.9 14.4 19.4 17.4 21.1 19.5 11.2 15.8 14.1 10.6
November 14.0 15.6 15.2 13.8 17.5 15.5 14.7 14.6 11.4 10.2
December 12.9 14.7 15.2 18.1 14.6 16.8 14.2 14.4 9.3 13.9
Annual Production (1000-gal/year)
187 192 198 200 221 224 195 167 191 180
ADD (1000-gal/day) 0.51 0.53 0.54 0.55 0.61 0.61 0.53 0.46 0.52 0.49

DRAFT
20-2733 Page 5-7 2021 Water System Plan Update February 2022 Snohomish County PUD No. 1
Sunday Lake Water Pumped (1000-gal)
2010 2011 2012 2013 2014 2015 2016 2017 2018 2019
January 652 648 652 727 635 601 660 684 708 770
February 607 721 632 539 575 540 581 588 649 650
March 800 832 732 623 566 645 844 757 648 734
April 709 546 576 680 724 667 702 631 727 722
May 720 722 899 758 746 772 1,118 954 1,416 1,565
June 859 773 827 861 936 1,959 1,052 1,293 1,530 1,860
July 1,565 827 1,103 1,840 1,841 1,877 1,459 2,052 2,572 2,192
August 1,556 1,450 1,520 1,317 1,372 1,628 2,098 2,381 2,194 2,101
September 653 1,243 1,092 752 968 831 952 1,226 1,022 1,026
October 650 591 759 750 712 738 688 748 770 833
November 714 622 770 346 667 722 693 736 718 692
December 573 601 606 942 613 647 699 658 644 856
Annual Production (1000-gal/year)
10,058 9,578 10,169 10,135 10,355 11,628 11,546 12,708 13,599 14,001
ADD (1000-gal/day) 27.6 26.2 27.8 27.8 28.4 31.9 31.5 34.8 37.3 38.4
212 Market & Deli Water Pumped (1000-gal)
2010 2011 2012 2013 2014 2015 2016 2017 2018 2019
January 12.3 8.4 7.7 7.6 13.9 13.6 9.4 18.5 14.1 4.9
February 11.3 8.9 6.6 11.9 13.6 15.3 8.2 10.7 10.7 3.9
March 9.9 9.3 6.9 15.0 11.5 17.5 10.3 9.2 4.9 4.1
April 6.9 5.4 7.4 15.7 13.0 16.6 8.8 4.9 6.1 4.9
May 7.2 8.3 10.2 17.8 10.4 15.6 10.4 5.0 6.3 5.6
June 8.7 10.7 9.9 14.9 9.5 17.4 8.2 5.6 4.4 4.8
July 9.7 16.0 14.5 16.5 12.5 11.8 8.8 3.1 5.7 5.5
August 9.1 24.2 9.6 15.0 10.7 12.4 9.3 5.3 5.6 4.4
September 13.0 18.2 9.2 13.1 11.1 17.8 11.8 4.9 5.0 4.1
October 14.2 14.0 10.4 7.9 11.5 9.2 11.8 8.2 5.0 3.7
November 12.7 12.7 10.3 20.9 11.2 14.0 15.8 16.5 5.3 3.2
December 9.7 9.1 5.1 12.8 11.2 9.6 16.4 15.9 4.9 3.4
Annual Production (1000-gal/year)
125 145 108 169 140 171 129 108 78 52
ADD (1000-gal/day) 0.34 0.40 0.29 0.46 0.38 0.47 0.35 0.30 0.21 0.14

DRAFT
20-2733 Page 5-8 2021 Water System Plan Update February 2022 Snohomish County PUD No. 1
Kayak Water Pumped (1000-gal)
2010 2011 2012 2013 2014 2015 2016 2017 2018 2019
January 2,034 2,407 2,432 2,340 1,978 2,295 2,097 2,131 2,291 1,975
February 1,801 1,724 1,851 1,615 1,875 1,777 2,079 1,713 1,780 2,096
March 1,969 2,485 1,996 1,953 1,730 2,304 2,307 2,125 1,797 1,919
April 1,902 1,932 2,306 2,201 2,069 2,198 2,032 1,791 2,025 1,928
May 2,423 2,274 2,462 2,304 2,216 2,747 2,910 2,704 3,497 3,542
June 2,184 2,585 2,363 2,827 2,933 5,345 2,820 3,516 3,372 3,969
July 4,534 2,642 3,861 5,262 5,332 5,291 3,813 5,149 5,895 5,213
August 4,365 4,366 6,908 3,867 3,870 4,667 5,174 5,756 4,770 4,403
September 2,089 3,400 2,966 2,154 2,819 2,508 2,422 3,061 2,502 2,281
October 760 1,921 2,169 2,389 2,010 2,214 1,829 2,084 2,126 1,885
November 3,425 2,111 2,314 1,618 2,120 2,179 2,062 1,937 1,944 1,660
December 1,966 1,843 1,878 2,287 1,909 1,960 2,053 1,714 1,720 2,116
Annual Production (1000-gal/year)
29,453 29,691 33,506 30,818 30,860 35,487 31,599 33,680 33,719 32,987
ADD (1000-gal/day) 81 81 92 84 85 97 86 92 92 90
Warm Beach Water Pumped (1000-gal)
2014 2015 2016 2017 2018 2019
January 1,696 2,126 2,020 2,592 2,464 2,566
February 2,243 1,978 1,924 2,103 2,149 2,178
March 1,762 2,264 2,554 2,130 2,254 2,380
April 2,238 2,064 2,346 2,072 2,267 2,405
May 2,337 2,297 3,079 2,931 3,645 3,392
June 2,809 4,492 3,033 3,275 3,532 3,115
July 4,462 4,418 3,570 4,694 5,544 4,686
August 3,708 3,654 4,914 5,195 4,407 4,186
September 2,898 2,558 2,490 3,020 2,857 2,515
October 2,552 2,117 2,378 2,525 2,390 2,361
November 1,812 1,860 2,429 2,250 2,263 1,856
December 2,495 2,641 2,347 2,189 2,211 2,417
Annual Production (1000-gal/year)
31,012 32,469 33,082 34,975 35,982 34,056
ADD (1000-gal/day) 85.0 89.0 90.4 95.8 98.6 93.3

DRAFT
20-2733 Page 5-9 2021 Water System Plan Update February 2022 Snohomish County PUD No. 1
Combined Warm Beach Water Purchased (1000-gal)
2014 2015 2016 2017 2018 2019
January 3,674 4,422 4,117 4,724 4,755 4,541
February 4,117 3,755 4,003 3,816 3,929 4,274
March 3,492 4,567 4,861 4,254 4,051 4,299
April 4,307 4,263 4,378 3,863 4,292 4,333
May 4,553 5,045 5,989 5,635 7,142 6,934
June 5,742 9,837 5,853 6,791 6,904 7,084
July 9,794 9,710 7,383 9,843 11,438 9,899
August 7,578 8,321 10,088 10,950 9,177 8,590
September 5,717 5,066 4,912 6,081 5,359 4,796
October 4,562 4,331 4,207 4,609 4,516 4,246
November 3,932 4,039 4,491 4,187 4,206 3,516
December 4,403 4,601 4,401 3,903 3,931 4,533
Annual Production (1000-gal/year)
61,872 67,956 64,682 68,655 69,700 67,043
ADD (1000-gal/day) 170 186 177 188 191 184 In Creswell 2019 production, hydrant usage is subtracted because it was atypical.

DRAFT
20-2733 Page 5-10 2021 Water System Plan Update February 2022 Snohomish County PUD No. 1
5.3.2 Historical Water Consumption
The District divides its water consumption into four customer classifications: single family, multi-family, non-residential, and wholesale. These four user groups are described in more detail below:
▪ Single family connections include all residential dwellings designed to accommodate a single residential unit.
▪ Multi-family connections include all residential dwellings designed to accommodate two or more residential units.
▪ Non-residential customers include businesses, schools, day cares, churches, industries, public parks, some irrigation customers, camps, and mobile home parks, which are not considered single family connections to be consistent with District records and historical reports.
▪ Wholesale customers are other water systems that purchase water from the District.
o Arlington, Granite Falls, and the City of Snohomish purchase water from the Lake Stevens Integrated system.
o During the historical review period (2010-2019), Gold Bar purchased wholesale water from the May Creek system through an emergency intertie. This intertie is expected to remain an emergency intertie only and Gold Bar is not anticipated to routinely purchase wholesale water in the future.
o Two small water systems (Sudden View and Twin Falls) also purchase water from the Lake Stevens Integrated system. In 2010-2019, their use was billed under the non-residential rate category. Going forward, water use by these systems will be recorded as wholesale use.
The consumption analysis that follows will summarize the water use patterns of these four user groups. Table 5-2 shows the average annual consumption, average number of connections, and average daily consumption per connection for each customer group between 2010 and 2019. The table also evaluates customer water consumption in terms of ERUs.
Average demand per ERU varies between systems based on the average age and size of single-family lots. Newer homes typically have more water efficient fixtures and appliances and are therefore more water efficient. Large homes on large, rural lots typically use more water than small homes on intercity lots. The District’s many satellite systems are composed of different types of customers, which accounts for the differences in demand per ERU between systems.
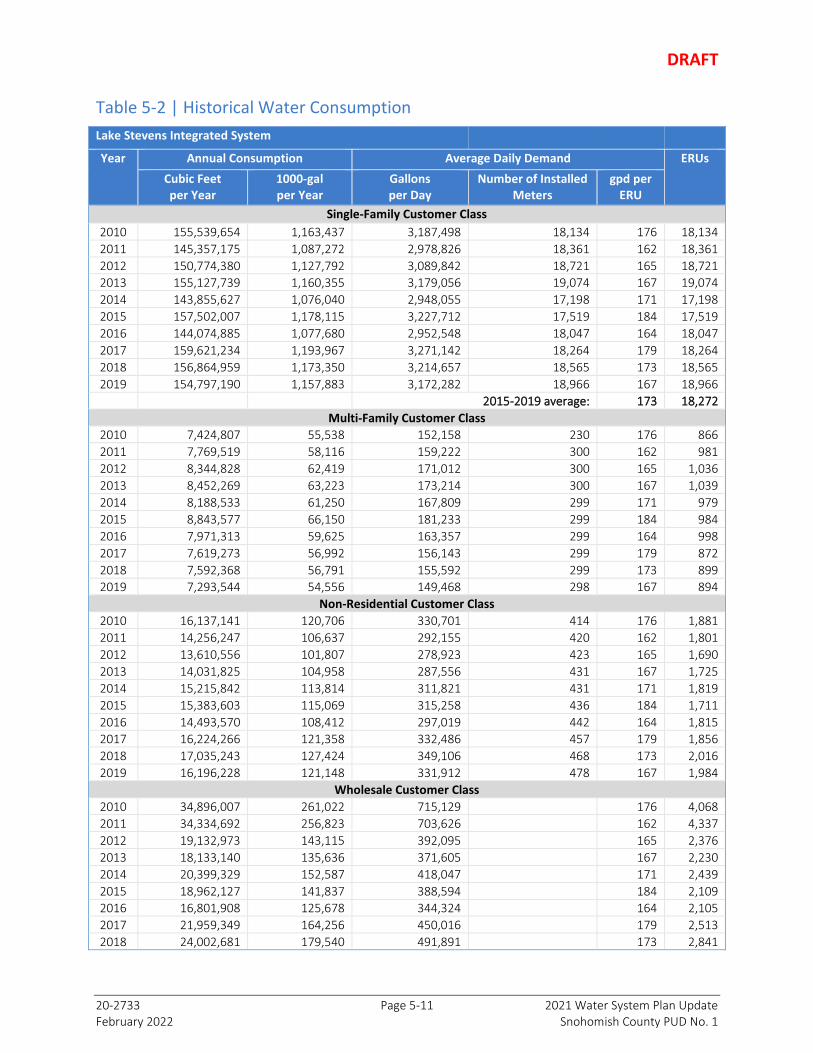
DRAFT
20-2733 Page 5-11 2021 Water System Plan Update February 2022 Snohomish County PUD No. 1
Table 5-2 | Historical Water Consumption
Lake Stevens Integrated System
Year Annual Consumption Average Daily Demand ERUs
Cubic Feet per Year
1000-gal per Year
Gallons per Day
Number of Installed Meters
gpd per ERU
Single-Family Customer Class
2010 155,539,654 1,163,437 3,187,498 18,134 176 18,134
2011 145,357,175 1,087,272 2,978,826 18,361 162 18,361
2012 150,774,380 1,127,792 3,089,842 18,721 165 18,721
2013 155,127,739 1,160,355 3,179,056 19,074 167 19,074
2014 143,855,627 1,076,040 2,948,055 17,198 171 17,198
2015 157,502,007 1,178,115 3,227,712 17,519 184 17,519
2016 144,074,885 1,077,680 2,952,548 18,047 164 18,047
2017 159,621,234 1,193,967 3,271,142 18,264 179 18,264
2018 156,864,959 1,173,350 3,214,657 18,565 173 18,565
2019 154,797,190 1,157,883 3,172,282 18,966 167 18,966
2015-2019 average: 173 18,272
Multi-Family Customer Class
2010 7,424,807 55,538 152,158 230 176 866
2011 7,769,519 58,116 159,222 300 162 981
2012 8,344,828 62,419 171,012 300 165 1,036
2013 8,452,269 63,223 173,214 300 167 1,039
2014 8,188,533 61,250 167,809 299 171 979
2015 8,843,577 66,150 181,233 299 184 984
2016 7,971,313 59,625 163,357 299 164 998
2017 7,619,273 56,992 156,143 299 179 872
2018 7,592,368 56,791 155,592 299 173 899
2019 7,293,544 54,556 149,468 298 167 894
Non-Residential Customer Class
2010 16,137,141 120,706 330,701 414 176 1,881
2011 14,256,247 106,637 292,155 420 162 1,801
2012 13,610,556 101,807 278,923 423 165 1,690
2013 14,031,825 104,958 287,556 431 167 1,725
2014 15,215,842 113,814 311,821 431 171 1,819
2015 15,383,603 115,069 315,258 436 184 1,711
2016 14,493,570 108,412 297,019 442 164 1,815
2017 16,224,266 121,358 332,486 457 179 1,856
2018 17,035,243 127,424 349,106 468 173 2,016
2019 16,196,228 121,148 331,912 478 167 1,984
Wholesale Customer Class
2010 34,896,007 261,022 715,129 176 4,068
2011 34,334,692 256,823 703,626 162 4,337
2012 19,132,973 143,115 392,095 165 2,376
2013 18,133,140 135,636 371,605 167 2,230
2014 20,399,329 152,587 418,047 171 2,439
2015 18,962,127 141,837 388,594 184 2,109
2016 16,801,908 125,678 344,324 164 2,105
2017 21,959,349 164,256 450,016 179 2,513
2018 24,002,681 179,540 491,891 173 2,841

DRAFT
20-2733 Page 5-12 2021 Water System Plan Update February 2022 Snohomish County PUD No. 1
Lake Stevens Integrated System
Year Annual Consumption Average Daily Demand ERUs
Cubic Feet per Year
1000-gal per Year
Gallons per Day
Number of Installed Meters
gpd per ERU
2019 26,837,348 200,743 549,982 167 3,288
Billed Fill Stations
2013 256,483 1,918 5,256 167 32
2014 135,754 1,015 2,782 171 16
2015 238,725 1,786 4,892 184 27
2016 361,626 2,705 7,411 164 45
2017 1,017,402 7,610 20,850 179 116
2018 1,977,528 14,792 40,526 173 234
2019 1,141,237 8,536 23,388 167 140
Total Demand
2010 213,997,609 1,600,702 4,385,485 18,778 176 24,949
2011 201,717,633 1,508,848 4,133,830 19,081 162 25,480
2012 191,862,737 1,435,133 3,931,872 19,444 165 23,823
2013 196,001,456 1,466,091 4,016,687 19,805 167 24,100
2014 187,795,085 1,404,707 3,848,513 17,928 171 22,451
2015 200,930,039 1,502,957 4,117,690 18,254 184 22,350
2016 183,703,302 1,374,101 3,764,659 18,788 164 23,011
2017 206,441,524 1,544,183 4,230,637 19,020 179 23,621
2018 207,472,779 1,551,896 4,251,771 19,332 173 24,554
2019 206,265,547 1,542,866 4,227,031 19,742 167 25,272
Storm Lake Ridge
Year Annual Consumption Average Daily Demand ERUs**
Cubic Feet per Year
1000-gal per Year
Gallons per Day*
Number of Installed Meters
gpd per ERU
Single-Family Customer Class
2010 1,816,409 13,587 63,489 190 334 190
2011 1,568,152 11,730 32,136 192 167 192
2012 1,812,173 13,555 37,137 205 181 205
2013 2,026,103 15,155 41,521 212 196 212
2014 1,990,715 14,891 40,796 214 191 214
2015 2,305,588 17,246 47,249 218 217 218
2016 1,929,887 14,436 39,549 224 177 224
2017 2,379,103 17,796 48,755 229 213 229
2018 2,328,249 17,415 47,713 230 207 230
2019 2,209,844 16,530 45,287 257 176 257 2015-2019 average: 198 232

DRAFT
20-2733 Page 5-13 2021 Water System Plan Update February 2022 Snohomish County PUD No. 1
Creswell
Year Annual Consumption Average Daily Demand ERUs**
Cubic Feet per Year
1000-gal per Year
Gallons per Day
Number of Installed Meters
gpd per ERU
Single-Family Customer Class
2010 146,046 1,092 2,993 16 187 16
2011 172,396 1,290 3,533 20 177 20
2012 249,938 1,870 5,122 23 223 23
2013 242,427 1,813 4,968 23 216 23
2014 227,823 1,704 4,669 23 203 23
2015 270,605 2,024 5,546 23 241 23
2016 246,808 1,846 5,058 23 220 23
2017 303,471 2,270 6,219 23 270 23
2018 279,366 2,090 5,725 23 249 23
2019 265,008 1,982 5,431 23 236 23
2015-2019 average: 243 23
May Creek
Year Annual Consumption Average Daily Demand ERUs
Cubic Feet per Year
1000-gal per Year
Gallons per Day
Number of Installed Meters
gpd per ERU
Single-Family Customer Class
2010 3,264,176 24,416 66,893 440 152 440
2011 3,168,194 23,698 64,926 442 147 442
2012 3,250,566 24,314 66,614 443 150 443
2013 3,088,671 23,103 63,297 446 142 446
2014 3,155,540 23,603 64,667 447 145 447
2015 3,431,172 25,665 70,316 450 156 450
2016 3,213,236 24,035 65,849 459 143 459
2017 3,873,570 28,974 79,382 475 167 475
2018 3,620,554 27,082 74,197 480 155 480
2019 3,564,591 26,663 73,050 491 149 491
2015-2019 average: 154 471
Non-Residential Customer Class
2010 97,535 730 1,999 5 152 13
2011 83,029 621 1,702 5 147 12
2012 65,278 488 1,338 5 150 9
2013 62,567 468 1,282 5 142 9
2014 232,094 1,736 4,756 5 145 33
2015 109,221 817 2,238 5 156 14
2016 126,353 945 2,589 6 143 18
2017 155,866 1,166 3,194 6 167 19
2018 151,484 1,133 3,104 6 155 20
2019 146,091 1,093 2,994 6 149 20
Wholesale Customer Class
2010 18,268 137 374 1 152 1
2011 0 0 0 1 147 0
2012 59,470 445 1,219 1 150 3
2013 1,381,945 10,337 28,320 1 142 63
2014 0 0 0 1 145 0

DRAFT
20-2733 Page 5-14 2021 Water System Plan Update February 2022 Snohomish County PUD No. 1
May Creek
Year Annual Consumption Average Daily Demand ERUs
Cubic Feet per Year
1000-gal per Year
Gallons per Day
Number of Installed Meters
gpd per ERU
Single-Family Customer Class
2015 0 0 0 1 156 0
2016 0 0 0 1 143 0
2017 229,293 1,715 4,699 1 167 10
2018 0 0 0 1 155 0
2019 0 0 0 1 149 0
Total Demand
2010 3,379,979 25,282 69,266 445 152 454
2011 3,251,223 24,319 66,628 447 147 454
2012 3,375,314 25,247 69,171 448 150 455
2013 4,533,183 33,908 92,899 451 142 519
2014 3,387,634 25,340 69,423 452 145 480
2015 3,540,393 26,482 72,554 455 156 464
2016 3,339,589 24,980 68,439 465 143 477
2017 4,258,729 31,855 87,275 481 167 504
2018 3,772,038 28,215 77,301 486 155 500
2019 3,710,682 27,756 76,044 497 149 511
Skylite
Year Annual Consumption Average Daily Demand ERUs
Cubic Feet per Year
1000-gal per Year
Gallons per Day
Number of Installed Meters
gpd per ERU
Single-Family Customer Class
2010 1,297,495 9,705 26,590 152 175 152
2011 1,451,935 10,860 29,755 152 196 152
2012 1,288,603 9,639 26,408 152 174 152
2013 1,174,025 8,782 24,059 152 158 152
2014 1,109,227 8,297 22,732 152 150 152
2015 1,073,988 8,033 22,009 152 145 152
2016 1,112,601 8,322 22,801 152 150 152
2017 1,148,130 8,588 23,529 152 155 152
2018 1,156,509 8,651 23,701 152 156 152
2019 1,112,692 8,323 22,803 153 149 153
2015-2019 average: 151 152

DRAFT
20-2733 Page 5-15 2021 Water System Plan Update February 2022 Snohomish County PUD No. 1
212 Market & Deli
Year Annual Consumption Average Daily Demand ERUs
Cubic Feet per Year
1000-gal per Year
Gallons per Day
Number of Installed Meters
gpd per ERU
Non-Residential Customer Class
2010 18,147 136 372
2011 19,526 146 400
2012 15,146 113 310
2013 20,907 156 428
2014 19,276 144 395
2015 24,297 182 498
2016 17,370 130 356
2017 14,174 106 290
2018 11,333 85 232
2019 7,065 53 145
Sunday Lake
Year Annual Consumption Average Daily Demand ERUs
Cubic Feet per Year
1000-gal per Year
Gallons per Day
Number of Installed Meters
gpd per ERU
Single-Family Customer Class
2010 1,236,693 9,250 25,344 153 166 153
2011 1,188,017 8,886 24,346 155 157 155
2012 1,259,817 9,423 25,818 155 167 155
2013 1,244,386 9,308 25,501 156 163 156
2014 1,304,095 9,755 26,725 161 166 161
2015 1,475,330 11,035 30,234 170 178 170
2016 1,435,772 10,740 29,423 177 166 177
2017 1,613,999 12,073 33,076 187 177 187
2018 1,726,405 12,914 35,379 194 182 194
2019 1,753,817 13,119 35,941 194 185 194
2015-2019 average: 178 184
Otis
Year Annual Consumption Average Daily Demand ERUs
Cubic Feet per Year
1000-gal per Year
Gallons per Day
Number of Installed Meters
gpd per ERU
Single-Family Customer Class
2010 29,171 218 598 4 149 4
2011 25,279 189 518 4 130 4
2012 23,289 174 477 4 119 4
2013 27,236 204 558 4 140 4
2014 33,778 253 692 4 173 4
2015 27,656 207 567 4 142 4
2016 26,365 197 540 4 135 4
2017 22,113 165 453 4 113 4
2018 26,587 199 545 4 136 4
2019 24,261 181 497 4 124 4
2015-2019 average: 130 4
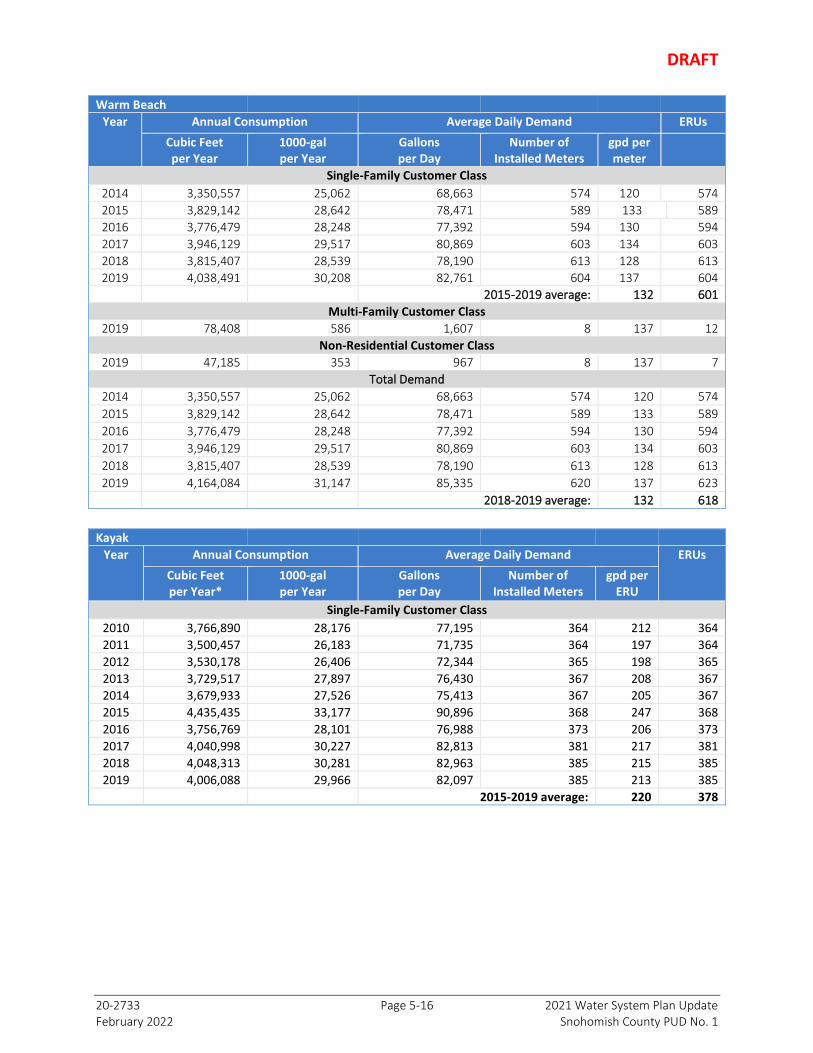
DRAFT
20-2733 Page 5-16 2021 Water System Plan Update February 2022 Snohomish County PUD No. 1
Warm Beach
Year Annual Consumption Average Daily Demand ERUs
Cubic Feet per Year
1000-gal per Year
Gallons per Day
Number of Installed Meters
gpd per meter
Single-Family Customer Class
2014 3,350,557 25,062 68,663 574 120 574
2015 3,829,142 28,642 78,471 589 133 589
2016 3,776,479 28,248 77,392 594 130 594
2017 3,946,129 29,517 80,869 603 134 603
2018 3,815,407 28,539 78,190 613 128 613
2019 4,038,491 30,208 82,761 604 137 604
2015-2019 average: 132 601
Multi-Family Customer Class
2019 78,408 586 1,607 8 137 12
Non-Residential Customer Class
2019 47,185 353 967 8 137 7
Total Demand
2014 3,350,557 25,062 68,663 574 120 574
2015 3,829,142 28,642 78,471 589 133 589
2016 3,776,479 28,248 77,392 594 130 594
2017 3,946,129 29,517 80,869 603 134 603
2018 3,815,407 28,539 78,190 613 128 613
2019 4,164,084 31,147 85,335 620 137 623
2018-2019 average: 132 618
Kayak
Year Annual Consumption Average Daily Demand ERUs
Cubic Feet per Year*
1000-gal per Year
Gallons per Day
Number of Installed Meters
gpd per ERU
Single-Family Customer Class
2010 3,766,890 28,176 77,195 364 212 364
2011 3,500,457 26,183 71,735 364 197 364
2012 3,530,178 26,406 72,344 365 198 365
2013 3,729,517 27,897 76,430 367 208 367
2014 3,679,933 27,526 75,413 367 205 367
2015 4,435,435 33,177 90,896 368 247 368
2016 3,756,769 28,101 76,988 373 206 373
2017 4,040,998 30,227 82,813 381 217 381
2018 4,048,313 30,281 82,963 385 215 385
2019 4,006,088 29,966 82,097 385 213 385
2015-2019 average: 220 378

DRAFT
20-2733 Page 5-17 2021 Water System Plan Update February 2022 Snohomish County PUD No. 1
Combined Warm Beach
Year Annual Consumption Average Daily Demand ERUs
Cubic Feet per Year*
1000-gal per Year
Gallons per Day
Number of Installed Meters
gpd per meter
Single-Family Customer Class
2014 7,030,490 52,588 144,077 941 153 941
2015 8,264,577 61,819 169,367 957 177 957
2016 7,533,248 56,349 154,380 967 160 967
2017 7,987,127 59,744 163,681 984 166 984
2018 7,863,720 58,821 161,152 998 161 998
2019 8,044,579 60,173 164,859 989 167 989
2015-2019 average: 166 979
Non-Residential Customer Class
2019 47,185 353 967 8 137 7
Total Demand
2014 7,038,140 52,645 144,234 942 153 1,882
2015 8,301,050 62,092 170,115 958 177 1,914
2016 7,592,281 56,790 155,590 968 160 1,934
2017 8,070,552 60,368 165,391 985 166 1,968
2018 7,944,357 59,424 162,805 999 161 1,996
2019 8,176,368 61,159 167,560 1,006 167 1,990
2015-2019 average: 167 1960
5.3.3 Trends in Customer Demands
Water purveyors serving more than 1,000 customers evaluate seasonal variations in water use by customer class. Of the District’s existing systems, Lake Stevens Integrated is the only District system to meet this requirement. However, the combined Warm Beach system will have approximately 1,000 customers. Therefore, the seasonal variations in water demands for both the Lake Stevens Integrated and combined Warm Beach systems have been analyzed.
Figure 5-1 illustrates the relationship between the average monthly temperature in the County and the monthly Lake Stevens Integrated system demand between in 2019. Figure 5-2 compares these average monthly temperatures to the average combined Warm Beach system demands in 2019. In general, as temperature increases, so does water demand.

DRAFT
20-2733 Page 5-18 2021 Water System Plan Update February 2022 Snohomish County PUD No. 1
Figure 5-1 | Temperature Effect on Lake Stevens Integrated Customer Water Demands
0
10
20
30
40
50
60
70
80
90
100
0
50,000
100,000
150,000
200,000
250,000
JAN FEB MAR APR MAY JUN JUL AUG SEP OCT NOV DEC
Tem
per
atu
re (
F)
Syst
em D
eman
d (
1,0
00
gal
)
Single Family Multi-Family Commercial
Billed Fill Station Wholesale Unbilled AC
Average Monthly Temperature

DRAFT
20-2733 Page 5-19 2021 Water System Plan Update February 2022 Snohomish County PUD No. 1
Figure 5-2 | Temperature’s Effect on Combined Warm Beach Customer Water Demands
5.3.4 Non-Revenue Water Use and Distribution System Leakage
Non-revenue and DSL are additional demands on the system. Combined non-revenue, DSL, and customer consumption equal the total water supplied to a system.
Table 5-3 summarizes non-revenue water use (non-billed consumption) and DSL in the District’s water systems. The numbers shown in Table 5-3 differ from those reported annually to DOH. This difference is due to the timing of the reporting. Until 2018, the District reported annual water usage from March to February. The District changed from bi-monthly to monthly service meter reading starting in September 2015. After a few years examining the impact of this change on DSL calculations the District adjusted its reporting to show annual water usage from January to December. Table 5-3 also shows annual water usage as from January to December.
Per WAC 246-290-820(1)(b)(i), DSL is required to be less than 10 percent on a 3-year rolling average. Table 5-3 shows that two of the District’s systems exceed this standard, May Creek and Warm Beach. The Skylite 3-year average DSL previously exceeded the standard but reduced below 10 percent in 2019. Such systems must develop an action plan to identify steps and timelines to reduce leakage below the standard. The District’s action plan to meet this standard is described in Chapter 6. The District’s two smallest systems, 212 Market & Deli and Otis, both show some years of negative DSL, which is due to the difference in timing between the source meter and service meter readings.
0
10
20
30
40
50
60
70
80
90
100
0
1,000
2,000
3,000
4,000
5,000
6,000
7,000
8,000
9,000
10,000
JAN FEB MAR APR MAY JUN JUL AUG SEP OCT NOV DEC
Tem
per
atu
re (
F)
Syst
em D
eman
d (
1,0
00
gal
)
BILLED FILL STATION UNBILLED OPERATION/CONSTRUCTION
COMMERCIAL SINGLE FAMILY
MULTI-FAMILY Average Monthly Temperature
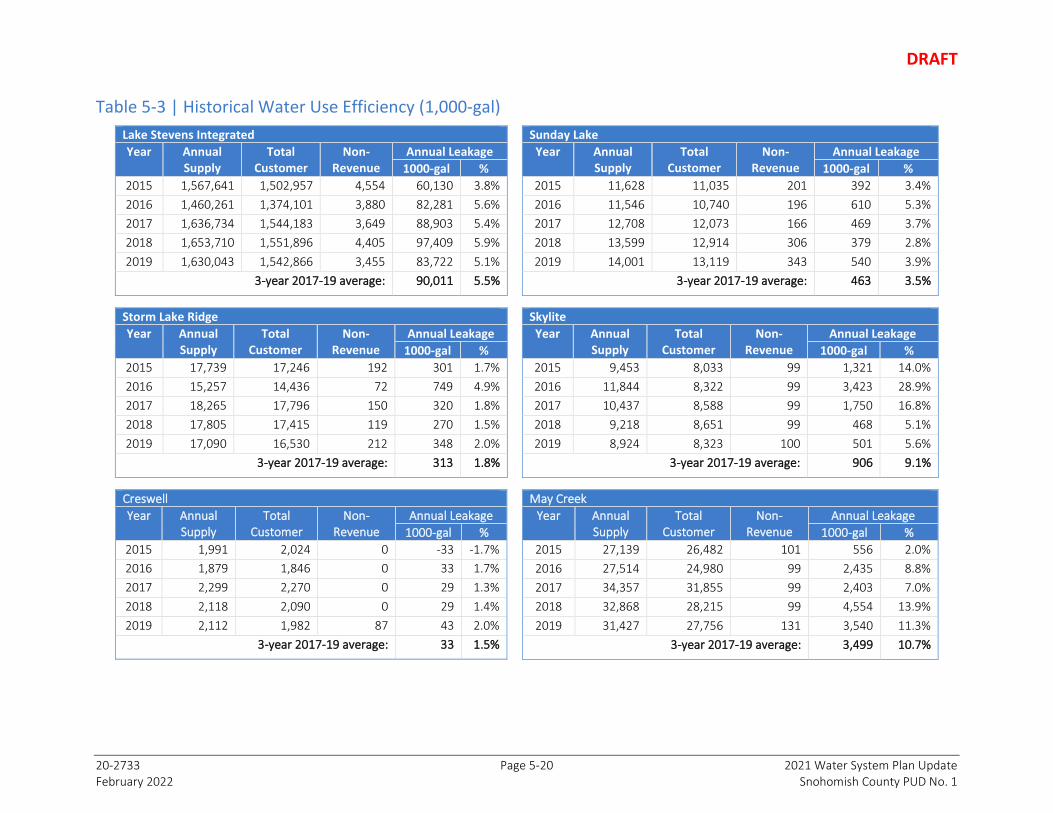
DRAFT
20-2733 Page 5-20 2021 Water System Plan Update February 2022 Snohomish County PUD No. 1
Table 5-3 | Historical Water Use Efficiency (1,000-gal)
Lake Stevens Integrated
Year Annual Supply
Total Customer
Non-Revenue
Annual Leakage
1000-gal %
2015 1,567,641 1,502,957 4,554 60,130 3.8%
2016 1,460,261 1,374,101 3,880 82,281 5.6%
2017 1,636,734 1,544,183 3,649 88,903 5.4%
2018 1,653,710 1,551,896 4,405 97,409 5.9%
2019 1,630,043 1,542,866 3,455 83,722 5.1%
3-year 2017-19 average: 90,011 5.5%
Sunday Lake
Year Annual Supply
Total Customer
Non-Revenue
Annual Leakage
1000-gal %
2015 11,628 11,035 201 392 3.4%
2016 11,546 10,740 196 610 5.3%
2017 12,708 12,073 166 469 3.7%
2018 13,599 12,914 306 379 2.8%
2019 14,001 13,119 343 540 3.9%
3-year 2017-19 average: 463 3.5%
Storm Lake Ridge
Year Annual Supply
Total Customer
Non-Revenue
Annual Leakage
1000-gal %
2015 17,739 17,246 192 301 1.7%
2016 15,257 14,436 72 749 4.9%
2017 18,265 17,796 150 320 1.8%
2018 17,805 17,415 119 270 1.5%
2019 17,090 16,530 212 348 2.0%
3-year 2017-19 average: 313 1.8%
Skylite
Year Annual Supply
Total Customer
Non-Revenue
Annual Leakage
1000-gal %
2015 9,453 8,033 99 1,321 14.0%
2016 11,844 8,322 99 3,423 28.9%
2017 10,437 8,588 99 1,750 16.8%
2018 9,218 8,651 99 468 5.1%
2019 8,924 8,323 100 501 5.6%
3-year 2017-19 average: 906 9.1%
Creswell
Year Annual Supply
Total Customer
Non-Revenue
Annual Leakage
1000-gal %
2015 1,991 2,024 0 -33 -1.7%
2016 1,879 1,846 0 33 1.7%
2017 2,299 2,270 0 29 1.3%
2018 2,118 2,090 0 29 1.4%
2019 2,112 1,982 87 43 2.0%
3-year 2017-19 average: 33 1.5%
May Creek
Year Annual Supply
Total Customer
Non-Revenue
Annual Leakage
1000-gal %
2015 27,139 26,482 101 556 2.0%
2016 27,514 24,980 99 2,435 8.8%
2017 34,357 31,855 99 2,403 7.0%
2018 32,868 28,215 99 4,554 13.9%
2019 31,427 27,756 131 3,540 11.3%
3-year 2017-19 average: 3,499 10.7%

DRAFT
20-2733 Page 5-21 2021 Water System Plan Update February 2022 Snohomish County PUD No. 1
Kayak
Year Annual Supply
Total Customer
Non-Revenue
Annual Leakage
1000-gal %
2015 35,487 33,450 264 1,773 5.0%
2016 31,599 28,542 186 2,871 9.1%
2017 33,680 30,851 122 2,707 8.0%
2018 33,719 30,885 57 2,777 8.2%
2019 32,987 30,012 61 2,913 8.8%
3-year 2017-19 average: 2,799 8.4%
Warm Beach
Year Annual Supply
Total Customer
Non-Revenue
Annual Leakage
1000-gal %
2015 32,469 28,642 553 3,274 10.1%
2016 33,082 28,248 745 4,089 12.4%
2017 34,975 29,517 661 4,797 13.7%
2018 35,982 28,539 746 6,696 18.6%
2019 34,056 31,147 689 2,220 6.5%
3-year 2017-19 average: 4,571 13.0%
212 Market & Deli Year Annual
Supply Total
Customer Non-
Revenue Annual Leakage
1000-gal %
2015 171 182 0 -11 -6.5%
2016 129 130 0 -1 -0.6%
2017 108 106 0 2 1.7%
2018 78 85 0 -7 -8.7%
2019 52 53 0 0 -0.7%
3-year 2017-19 average: -2 -2.6%
Otis Year Annual
Supply Total
Customer Non-Revenue Annual Leakage
1000-gal %
2015 224 207 0 17 7.4%
2016 195 197 0 -3 -1.3%
2017 167 165 0 2 1.2%
2018 191 199 0 -8 -4.2%
2019 180 181 0 -1 -0.5%
3-year 2017-19 average: -2 -0.5%
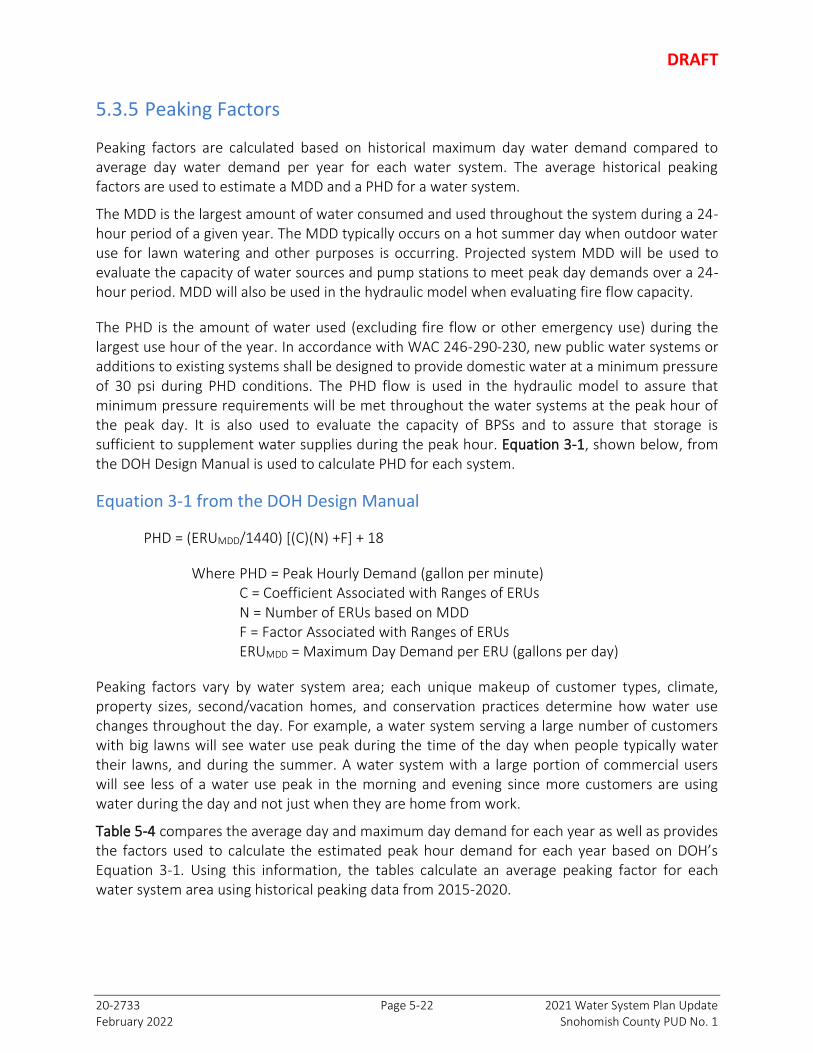
DRAFT
20-2733 Page 5-22 2021 Water System Plan Update February 2022 Snohomish County PUD No. 1
5.3.5 Peaking Factors
Peaking factors are calculated based on historical maximum day water demand compared to average day water demand per year for each water system. The average historical peaking factors are used to estimate a MDD and a PHD for a water system.
The MDD is the largest amount of water consumed and used throughout the system during a 24-hour period of a given year. The MDD typically occurs on a hot summer day when outdoor water use for lawn watering and other purposes is occurring. Projected system MDD will be used to evaluate the capacity of water sources and pump stations to meet peak day demands over a 24-hour period. MDD will also be used in the hydraulic model when evaluating fire flow capacity.
The PHD is the amount of water used (excluding fire flow or other emergency use) during the largest use hour of the year. In accordance with WAC 246-290-230, new public water systems or additions to existing systems shall be designed to provide domestic water at a minimum pressure of 30 psi during PHD conditions. The PHD flow is used in the hydraulic model to assure that minimum pressure requirements will be met throughout the water systems at the peak hour of the peak day. It is also used to evaluate the capacity of BPSs and to assure that storage is sufficient to supplement water supplies during the peak hour. Equation 3-1, shown below, from the DOH Design Manual is used to calculate PHD for each system.
Equation 3-1 from the DOH Design Manual
PHD = (ERUMDD/1440) [(C)(N) +F] + 18
Where PHD = Peak Hourly Demand (gallon per minute) C = Coefficient Associated with Ranges of ERUs N = Number of ERUs based on MDD F = Factor Associated with Ranges of ERUs ERUMDD = Maximum Day Demand per ERU (gallons per day)
Peaking factors vary by water system area; each unique makeup of customer types, climate, property sizes, second/vacation homes, and conservation practices determine how water use changes throughout the day. For example, a water system serving a large number of customers with big lawns will see water use peak during the time of the day when people typically water their lawns, and during the summer. A water system with a large portion of commercial users will see less of a water use peak in the morning and evening since more customers are using water during the day and not just when they are home from work.
Table 5-4 compares the average day and maximum day demand for each year as well as provides the factors used to calculate the estimated peak hour demand for each year based on DOH’s Equation 3-1. Using this information, the tables calculate an average peaking factor for each water system area using historical peaking data from 2015-2020.

DRAFT
20-2733 Page 5-23 2021 Water System Plan Update February 2022 Snohomish County PUD No. 1
Table 5-4 | Calculated Peaking Factors
Lake Stevens Integrated System
Year Number of ERUs (N)
ERUADD (gpd/ERU)
Average Day (gpd)
Max Day (gpd)
MDD Factor
C Factor
F Factor
Calculated PHD (gpm)
Calculated PHD
2015 22,350 184 4,294,906 10,620,540 2.47 1.60 225.00 11,403 1.55
2016 23,011 164 3,989,784 7,620,010 1.91 1.60 225.00 8,056 1.52
2017 23,621 179 4,484,203 9,014,720 2.01 1.60 225.00 9,524 1.52
2018 24,554 173 4,530,713 9,747,760 2.15 1.60 225.00 10,240 1.51
2019 25,272 167 4,465,872 8,463,970 1.90 1.60 225.00 8,969 1.53
Average 173
2.09
1.53
Storm Lake Ridge
Year Number of ERUs (N)
ERUADD (gpd/ERU)
Average Day (gpd)
Max Day (gpd)
MDD Factor
C Factor
F Factor
Calculated PHD (gpm)
Calculated PHD
2015 218 217 48,600 167,703 3.45 2.00 75.00 283 2.43
2016 224 177 41,686 115,203 2.76 2.00 75.00 195 2.44
2017 229 213 50,042 140,109 2.80 2.00 75.00 239 2.45
2018 230 207 48,780 160,406 3.29 2.00 75.00 271 2.44
2019 257 176 46,823 117,528 2.51 1.80 125.00 198 2.43
Average 198
2.96
2.44
Creswell
Year Number of ERUs (N)
Average Day Demand (gpd/ERU)
Average Day (gpd)
3-Day Max Average (gpd)
MDD Factor
C Factor
F Factor
Calculated PHD (gpm)
Calculated PHD
2015 23 241 5,454 18,333 3.36 3.00 0.00 57 4.46
2016 23 220 5,133 17,000 3.31 3.00 0.00 53 4.48
2017 23 270 6,300 20,000 3.17 3.00 0.00 59 4.26
2018 23 249 5,804 21,667 3.73 3.00 0.00 63 4.16
2019 23 236 5,546 17,667 3.19 3.00 0.00 54 4.40
Average 243
3.35
4.35

DRAFT
20-2733 Page 5-24 2021 Water System Plan Update February 2022 Snohomish County PUD No. 1
May Creek
Year Number of ERUs (N)
ERUADD (gpd/ERU)
Average Day (gpd)
Max Day (gpd)
MDD Factor
C Factor
F Factor
Calculated PHD (gpm)
Calculated PHD
2015 464 156 74,353 168,406 2.26 1.80 125.00 254 2.17
2016 477 143 75,174 138,594 1.84 1.80 125.00 199 2.06
2017 504 167 94,128 166,219 1.77 1.60 225.00 229 1.99
2018 500 155 90,048 172,594 1.92 1.60 225.00 229 1.91
2019 511 149 86,100 148,594 1.73 1.60 225.00 204 1.98
Average 154
1.90
2.02
Skylite
Year Number of ERUs (N)
Average Day Demand (gpd/ERU)
Average Day (gpd)
3-Day Max Average (gpd)
MDD Factor
C Factor
F Factor
Calculated PHD (gpm)
Calculated PHD
2015 152 145 25,898 48,000 1.85 2.00 75.00 89 2.66
20161 152 150 32,360 59,000 1.82 2.00 75.00 90 2.20
2017 152 155 28,593 50,667 1.77 2.00 75.00 90 2.56
2018 152 156 25,255 48,333 1.91 2.00 75.00 97 2.88
2019 153 149 24,450 44,333 1.81 2.00 75.00 89 2.91
Average 151
1.84
2.75 Note: 1. 2016 was removed from the average due to exceedingly high DSL during this year.
Sunday Lake
Year Number of ERUs (N)
ERUADD (gpd/ERU)
Average Day (gpd)
3-Day Peak Average (gpd)
MDD Factor
C Factor
F Factor
Calculated PHD (gpm)
Calculated PHD
2015 170 178 31,859 98,588 3.09 2.00 75.00 177 2.58
2016 177 166 31,546 87,206 2.76 2.00 75.00 155 2.56
2017 187 177 34,815 95,588 2.75 2.00 75.00 169 2.55
2018 194 182 37,257 114,144 3.06 2.00 75.00 198 2.49
2019 194 185 38,360 103,526 2.70 2.00 75.00 179 2.49
Average 178
2.87
2.53

DRAFT
20-2733 Page 5-25 2021 Water System Plan Update February 2022 Snohomish County PUD No. 1
Warm Beach
Year Number of ERUs (N)
Average Day Demand (gpd/ERU)
Average Day (gpd)
Max Day (gpd)
MDD Factor
C Factor
F Factor
Calculated PHD (gpm)
Calculated PHD
2019 623 137 93,305 192,693 2.07 1.60 225.00 258 1.93
Average 137
2.07
1.93
Planning Value 137 2.70 2.48
Kayak
Year Number of ERUs (N)
ERUADD (gpd/ERU)
Average Day (gpd)
Max Day (gpd)
MDD Factor
C Factor
F Factor
Calculated PHD (gpm)
Calculated PHD
2015 736 247 88,957 281,951 3.17 1.60 225.00 781 3.99
2016 746 206 90,389 207,830 2.30 1.60 225.00 486 3.36
2017 762 217 95,822 222,646 2.32 1.60 225.00 525 3.39
2018 770 215 98,580 237,491 2.41 1.60 225.00 543 3.29
2019 770 213 93,305 220,627 2.36 1.60 225.00 528 3.45
Average 220
2.51
3.50
Combined Warm Beach
Year Number of ERUs (N)
Average Day Demand (gpd/ERU)
Average Day (gpd)
Max Day (gpd)
MDD Factor
C Factor
F Factor
Calculated PHD (gpm)
Calculated PHD
2019 1,393 166 186,611 413,320 2.21 1.60 225.00 644 2.25
Average 166
2.21
2.25
Planning Value 166 2.61 2.96

DRAFT
20-2733 Page 5-26 2021 Water System Plan Update February 2022 Snohomish County PUD No. 1
5.4 Future Population and Connections
Developing accurate projections for populations and connections in each system is critical to the veracity of the system analysis and capital improvement plans described later in this document. Therefore, the District has analyzed relevant planning documents for the systems as well as historical trends to create reliable projections.
5.4.1 Relevant Planning Documents
Relevant planning documents from various agencies were used in the future population and water demand estimations. These documents include the comprehensive plans of Snohomish County; comprehensive plans of Gold Bar, Granite Falls, Marysville, the City of Snohomish, and the City of Lake Stevens; water system plans from adjacent systems; the North Snohomish County CWSP; and PSRC VISION 2040 and draft VISION 2050 plans. A detailed summary of these related planning documents is provided in Chapter 3.
5.4.2 Historical Population and Connections
The historical water connection and population trends were analyzed for each system. Due to the lack of population data related directly to the water system retail service areas (RSAs), historical populations were estimated from the number of residential meters (single family and multi-family) and an assumed people per meter. For all single-family meters, the analysis assumed 2.68 people per household (this is an updated estimate from what has been used historically, which was 2.5), which is the average household size in the County according to the US Census Bureau’s American Community Survey (ACS), dated July 1, 2019. For multi-family meters, the analysis used an estimated five households per meter in Lake Stevens Integrated and two households per meter in Kayak and Warm Beach, based on a Water Multi Family Unit Count Report provided by the District, included in Appendix 5-1. For non-residential meters, the analysis used the county-wide average of 7.5 employees per non-residential meter.
Water purveyors that purchase from the District on a wholesale basis are responsible to determine their own number of households, population, and growth projections. Population and water demand projections by the District’s major wholesale water customers (Granite Falls, Arlington, and City of Snohomish) reference the information provided in their comprehensive and water system plans, described in Chapter 3.
Table 5-5 presents historic retail water connections for all single-family, multi-family, and non-residential customers served from 2010-2019. Otis and 212 Market & Deli water systems are not included in this table because there is no expected growth for these systems.

DRAFT
20-2733 Page 5-27 2021 Water System Plan Update February 2022 Snohomish County PUD No. 1
Table 5-5 | Historical Population and Connection
Lake Stevens Integrated
Year Single-Family Multi-Family Non-Residential Total Retail Population
Meters GR Meters GR Meters GR Meters GR People GR
2010 18,144 - 230 - 414 - 18,788 - 53,809 -
2011 18,361 1.20% 299 30.00% 419 1.21% 19,079 1.55% 55,389 2.94%
2012 18,721 1.96% 300 0.33% 423 0.95% 19,444 1.91% 57,625 4.04%
2013 19,074 1.89% 300 0.00% 431 1.89% 19,805 1.86% 58,675 1.82%
2014 17,198 -9.84% 300 -0.33% 431 0.00% 17,928 -9.48% 56,562 -3.60%1
2015 17,519 1.87% 299 0.00% 436 1.16% 18,254 1.82% 57,498 1.65%
2016 18,047 3.01% 299 0.00% 442 1.38% 18,788 2.93% 59,003 2.62%
2017 18,264 1.20% 299 0.00% 457 3.39% 19,020 1.23% 59,809 1.37%
2018 18,565 1.65% 299 0.00% 468 2.41% 19,332 1.64% 60,781 1.62%
2019 18,966 2.16% 298 -0.33% 478 2.14% 19,742 2.12% 61,992 1.99%
5-Yr Annual Growth 1.98% -0.07% 2.09% 1.95% 1.85%
Storm Lake Ridge
Year Single-Family Total Retail Population
Meters GR Meters GR People GR
2010 190 - 190 - 509 -
2011 192 1.05% 192 1.05% 515 1.05%
2012 205 6.77% 205 6.77% 549 6.77%
2013 212 3.41% 212 3.41% 568 3.41%
2014 214 0.94% 214 0.94% 574 0.94%
2015 218 1.87% 218 1.87% 584 1.87%
2016 224 2.75% 224 2.75% 600 2.75%
2017 229 2.23% 229 2.23% 614 2.23%
2018 230 0.44% 230 0.44% 616 0.44%
2019 257 11.74% 257 11.74% 689 11.74%
5-Yr Annual Growth 3.81% 3.81% 3.81%

DRAFT
20-2733 Page 5-28 2021 Water System Plan Update February 2022 Snohomish County PUD No. 1
Creswell
Year Single-Family Total Retail Population
Meters GR Meters GR People GR
2010 16 - 16 - 43 -
2011 20 25.00% 20 25.00% 54 25.00%
2012 23 15.00% 23 15.00% 62 15.00%
2013 23 0.00% 23 0.00% 62 0.00%
2014 23 0.00% 23 0.00% 62 0.00%
2015 23 0.00% 23 0.00% 62 0.00%
2016 23 0.00% 23 0.00% 62 0.00%
2017 23 0.00% 23 0.00% 62 0.00%
2018 23 0.00% 23 0.00% 62 0.00%
2019 23 0.00% 23 0.00% 62 0.00%
5-Yr Annual Growth 0.0% 0.0% 0.0%
May Creek
Year Single-Family Non-Residential Total Retail Population
Meters GR Meters GR Meters GR People GR
2010 440 - 5 - 445 - 1,194 -
2011 442 0.45% 5 0.00% 447 0.45% 1,200 0.45%
2012 443 0.23% 5 0.00% 448 0.22% 1,202 0.22%
2013 446 0.68% 5 0.00% 451 0.67% 1,210 0.67%
2014 447 0.22% 5 0.00% 452 0.22% 1,213 0.22%
2015 450 0.67% 5 0.00% 455 0.66% 1,221 0.66%
2016 459 2.00% 6 20.00% 465 2.20% 1,248 2.22%
2017 475 3.49% 6 0.00% 481 3.44% 1,291 3.44%
2018 480 1.05% 6 0.00% 486 1.04% 1,304 1.04%
2019 491 2.29% 6 0.00% 497 2.26% 1,339 2.26%
5-Yr Annual Growth 1.90% 4.00% 1.92% 1.92%

DRAFT
20-2733 Page 5-29 2021 Water System Plan Update February 2022 Snohomish County PUD No. 1
Kayak
Year Single-Family Multi-Family Total Retail Population
Meters GR Meters GR Meters GR People GR
2010 364 - 1 - 365 - 981 -
2011 364 0.00% 1 0.00% 365 0.00% 981 0.00%
2012 365 0.27% 1 0.00% 366 0.27% 984 0.27%
2013 367 0.55% 1 0.00% 368 0.55% 989 0.54%
2014 367 0.00% 1 0.00% 368 0.00% 989 0.00%
2015 368 0.27% 1 0.00% 369 0.27% 992 0.27%
2016 373 1.36% 1 0.00% 374 1.36% 1,005 1.35%
2017 381 2.14% 1 0.00% 382 2.14% 1,026 2.13%
2018 385 1.05% 1 0.00% 386 1.05% 1,037 1.04%
2019 385 0.00% 1 0.00% 386 0.00% 1,037 0.00%
5-Yr Annual Growth 0.97% 0.00% 0.96% 0.96%
Skylite
Year Single-Family Total Retail Population
Meters GR Meters GR People GR
2010 152 - 152 - 407.36 -
2011 152 0.00% 152 0.00% 407.36 0.00%
2012 152 0.00% 152 0.00% 407.36 0.00%
2013 152 0.00% 152 0.00% 407.36 0.00%
2014 152 0.00% 152 0.00% 407.36 0.00%
2015 152 0.00% 152 0.00% 407.36 0.00%
2016 152 0.00% 152 0.00% 407.36 0.00%
2017 152 0.00% 152 0.00% 407.36 0.00%
2018 152 0.00% 152 0.00% 407.36 0.00%
2019 153 0.66% 153 0.66% 410.04 0.66%
5-Yr Annual Growth 0.13% 0.13% 0.13%

DRAFT
20-2733 Page 5-30 2021 Water System Plan Update February 2022 Snohomish County PUD No. 1
Warm Beach
Year Single-Family Multi-Family Non-Residential Total Retail Population
Meters GR Meters GR Meters GR Meters GR People GR
2014 574 - N/A1 - N/A - 574 - 1538.32 -
2015 589 2.61% N/A N/A N/A N/A 589 2.61% 1578.52 2.61%
2016 594 0.85% N/A N/A N/A N/A 594 0.85% 1591.92 0.85%
2017 603 1.52% N/A N/A N/A N/A 603 1.52% 1616.04 1.52%
2018 613 1.66% N/A N/A N/A N/A 613 1.66% 1642.84 1.66%
2019 604 -1.47% 8 0.00% 8 0.00% 620 1.14% 1658.72 0.97%
5-Yr Annual Growth 1.03% 0.00% 0.00% 1.56% 1.55%
Combined Warm Beach
Year Single-Family Multi-Family Non-Residential Total Retail Population
Meters GR Meters GR Meters GR Meters GR People GR
2014 941 - N/A - N/A - 941 - 2521.88 -
2015 957 1.70% N/A N/A N/A N/A 957 1.70% 2564.76 1.70%
2016 967 1.04% N/A N/A N/A N/A 967 1.04% 2591.56 1.04%
2017 984 1.76% N/A N/A N/A N/A 984 1.76% 2637.12 1.76%
2018 998 1.42% 1 N/A N/A N/A 999 1.52% 2680 1.63%
2019 989 -0.90% 9 N/A 8 N/A 1006 0.70% 2698.76 0.70%
5-Yr Annual Growth 1.00% N/A N/A 1.35% 1.37%

DRAFT
20-2733 Page 5-31 2021 Water System Plan Update February 2022 Snohomish County PUD No. 1
Sunday Lake
Year Single-Family Total Retail Population
Meters GR Meters GR People GR
2010 153 - 153 - 410.04 -
2011 155 1.31% 155 1.31% 415.4 1.31%
2012 155 0.00% 155 0.00% 415.4 0.00%
2013 156 0.65% 156 0.65% 418.08 0.65%
2014 161 3.21% 161 3.21% 431.48 3.21%
2015 170 5.59% 170 5.59% 455.6 5.59%
2016 177 4.12% 177 4.12% 474.36 4.12%
2017 187 5.65% 187 5.65% 501.16 5.65%
2018 194 3.74% 194 3.74% 519.92 3.74%
2019 194 0.00% 194 0.00% 519.92 0.00%
5-Yr Annual Growth 3.82% 3.82% 3.82%

DRAFT
20-2733 Page 5-32 2021 Water System Plan Update February 2022 Snohomish County PUD No. 1
5.4.3 Future Population and Connection Projections
Using these planning documents and historical trends, population and connection projections were developed for each water system.
Historical trends were calculated as the average annual water system growth rate for each water system based on the number of connections added to each system per year. The analysis calculated the average annual growth rate based on the last five years of data (2015-2019) in an effort to use the most recent and relevant data for projecting forward.
Growth projections were also calculated using PSRC’s VISION 2040 analysis for each water system’s RSA. PSRC’s VISION 2040 is broken down into forecast analysis zones (FAZ). Each FAZ represents a defined area that PSRC analyzes and creates an individual growth projection. The population projection for each system compared the area of FAZ to that of the retail water service area to calculate the percentage of the FAZ that was in the system’s RSA. This percentage was then multiplied by the FAZ’s projected population. The higher the percentage of FAZ in the RSA, the more accurate the PSRC projection. A map of the County FAZ boundaries is included in Appendix 5-2.
The comparison of the various growth rates is shown Table 5-6.
Table 5-6 | Comparative Population Projections by System
Water System Historical Growth 2015-
2019
PSRC's Est. Growth Rate 2015-2019
Lake Stevens Integrated 1.85% 1.90%
Storm Lake Ridge 3.81% -0.39%
Creswell 0.04% 1.97%
May Creek 1.92% 2.76%
Skylite 0.13% 2.76%
Kayak 0.96% 1.18%
Warm Beach 1.55% 1.18%
Combined WB 1.37% 1.18%
Sunday Lake 3.82% 1.90%
Otis 0.00% 2.31%
212 Market & Deli 0.00% -0.39%
Due to the many differences of the District’s various systems, different projection methods were used for different systems. In general, where historical trends were used to project future growth, the percentages were rounded up to the nearest quarter of a percent. The methods used for each system is discussed in further detail below. Projected growth rates for each system are summarized in Table 5-7.
The Lake Stevens Integrated system is the District’s largest system. Much of its service area is in and around Granite Falls and the City of Lake Stevens. Because of its size and location, the PSCR’s

DRAFT
20-2733 Page 5-33 2021 Water System Plan Update February 2022 Snohomish County PUD No. 1
FAZ boundaries closely aligned with the Lake Stevens RSA. The PSRC’s projections were also consistent with the growth seen between 2015 and 2019. Therefore, PSRC’s VISION 2040 analysis was determined to be the most accurate and informed population projection for its RSA and are used for its future projections.
The Storm Lake Ridge and Creswell systems are adjacent to Lake Stevens Integrated system and are planned to be integrated into that system during this 20-year planning period. Therefore, these two systems are assumed to experience the same growth rate as the Lake Stevens Integrated system. The population projections for these systems would be less accurate using the FAZ method described above since they are much smaller than the area of their corresponding FAZ.
Sunday Lake experienced significant development within the last five years, resulting in a higher historical growth rate. At this point, most of the new developments have been connected to the system and the District is not aware of further anticipated subdivisions in the Sunday Lake area in the coming years. Therefore, the District has elected to use PSRC’s growth projection for this system.
The remaining systems represented only a small percentage of their respective FAZs, and therefore, PSCR’s projections did not accurately represent the growth expected within their RSA. The projected growth for May Creek, Skylite, Kayak and Warm Beach will match the historical growth, rounded up to the nearest 0.05 percent.
Otis and 212 Market & Deli are not expected to grow during the planning period.
Table 5-7 | Summary of Growth Rates by System
System Historical Annual Growth Rate
Average Annual Growth Rate
2020-2025
2025-2030
2030-2035
2035-2040
Lake Stevens Integrated 1.85% 1.51% 1.31% 1.15% 1.16%
Storm Lake Ridge 3.81% 1.51% 1.31% 1.15% 1.16%
Creswell 0.04% 1.51% 1.31% 1.15% 1.16%
May Creek 1.92% 1.95%
Skylite 0.13% 0.15%
Kayak 0.96% 1.00%
Warm Beach 1.55% 1.60%
Combined Warm Beach 1.37% 1.37%
Sunday Lake 3.82% 1.90%
5.5 Future Water Demands
Table 5-8 summarizes how information presented earlier in this chapter is used to create the demand projections in Table 5-9. The capacity of the water systems will be evaluated in relation to these water demand projections as part of the System Capacity Analysis in Chapter 7. The

DRAFT
20-2733 Page 5-34 2021 Water System Plan Update February 2022 Snohomish County PUD No. 1
District recognizes that some of the water systems will reach capacity within the planning period, at which point it is prepared to halt further connections to such systems as described in Chapter 7.
Table 5-8 | Planning Values for Water Demand Projections
System ADD per ERU1
MDD:ADD Factor2
PHD:MDD Factor3
DSL4 Planned Growth5
Lake Stevens Integrated 173 2.09 1.53 5.5% 1.51% to 1.15%
Storm Lake Ridge 198 2.96 2.44 1.8% 1.51% to 1.15%
Creswell 243 3.34 4.34 1.5% 1.51% to 1.15%
May Creek 154 1.92 2.03 10.0% 1.95%
Skylite 151 1.84 2.75 9.1% 0.15%
Kayak 220 2.51 3.50 8.4% 1.00%
Warm Beach 137 2.70 2.48 10.0% 2.10%
Combined Warm Beach 166 2.61 2.96 9.4% 1.37%
Sunday Lake 178 2.87 2.53 3.5% 1.90% Note: 1. Per the average ADD/ERU between 2015-2019, per Table 5-2. Except for Warm Beach, the 2019 value is used. 2. Customer MDD:ADD Factor as shown in Table 5-4. 3. PHD:ADD Factor as shown in Table 5-5. 4. 3-year rolling average DSL as shown in Table 5-3. DSL reduced to 10% for systems currently above the standard. 5. Planned growth for each system as shown in Table 5-8.
Table 5-9 summarize projected water demands for each of the District’s water systems in the 10-year and 20-year planning periods. The projections include the wholesale water demands in addition to retail water demands. The 212 Market & Deli and Otis water systems are not included in Table 5-9 because these small systems will not expand beyond their existing facilities.
The expected water savings from conservation efforts and plumbing code improvements is described in Chapter 6.

DRAFT
20-2733 Page 5-35 2021 Water System Plan Update February 2022 Snohomish County PUD No. 1
Table 5-9 | Water Demand Projection
Lake Stevens Integrated
Base Year Current Year Ten-Year Planning Period 20-Yr Period
YEAR 2019 2020 2021 2022 2023 2024 2025 2026 2027 2028 2029 2030 2040
Retail ERU PROJECTIONS 22,013 22,345 22,681 23,023 23,370 23,722 24,032 24,346 24,664 24,986 25,312 25,602 28,713
Granite Falls ERU PROJECTIONS 1,989 2,099 2,194 2,293 2,397 2,506 2,619 2,738 2,862 2,991 3,127 3,268 5,090
Arlington ERU Projections 749 749 8,301 8,301 8,301 8,301 8,301 8,301 8,301 8,301 8,301 8,301 8,301
Snohomish ERU Projections 456 461 461 461 461 461 461 461 461 461 461 461 461
Total ERU Projections 24,752 25,193 33,176 33,617 34,068 34,529 34,952 35,385 35,826 36,278 36,740 37,172 42,104
Retail & Non-Rev. ADD (gpd) 3,915,890 3,876,204 3,934,616 3,993,912 4,054,107 4,115,213 4,168,937 4,223,365 4,278,507 4,334,373 4,390,971 4,441,333 4,980,900
Granite Falls (gpd) 345,094 364,059 380,549 397,787 415,806 434,640 454,328 474,908 496,419 518,905 542,410 566,980 883,005
Arlington (gpd) 130,000 130,000 1,440,000 1,440,000 1,440,000 1,440,000 1,440,000 1,440,000 1,440,000 1,440,000 1,440,000 1,440,000 1,440,000
Snohomish (gpd) 79,114 80,000 80,000 80,000 80,000 80,000 80,000 80,000 80,000 80,000 80,000 80,000 80,000
System Leakage 240,364 316,534 320,743 325,045 329,442 333,480 337,605 341,821 346,130 350,536 354,657 401,715
Total ADD (gpd) 4,470,098 4,690,628 6,151,699 6,232,443 6,314,958 6,399,295 6,476,744 6,555,878 6,636,747 6,719,408 6,803,917 6,882,970 7,785,620
Retail MDD (gpd) 7,628,710 8,093,337 8,215,298 8,339,106 8,464,789 8,592,376 8,704,549 8,818,193 8,933,327 9,049,972 9,168,147 9,273,299 10,399,892
Granite Falls (gpd) 720,541 760,139 794,569 830,561 868,184 907,508 948,616 991,586 1,036,500 1,083,450 1,132,527 1,183,828 1,843,674
Arlington (gpd) 130,000 130,000 1,440,000 1,440,000 1,440,000 1,440,000 1,440,000 1,440,000 1,440,000 1,440,000 1,440,000 1,440,000 1,440,000
Snohomish (gpd) 165,186 167,036 167,036 167,036 167,036 167,036 167,036 167,036 167,036 167,036 167,036 167,036 167,036
System Leakage 494,091 574,743 583,532 592,514 601,694 610,124 618,738 627,541 636,538 645,737 654,342 752,596
Total MDD (gpd) 8,644,437 9,644,603 11,191,646 11,360,235 11,532,523 11,708,615 11,870,325 12,035,553 12,204,404 12,376,996 12,553,448 12,718,506 14,603,199
Retail PHD (gpm) 8,028 8,575 8,704 8,835 8,969 9,104 9,223 9,343 9,465 9,589 9,714 9,825 11,019
Granite Falls (gpm) 763 805 842 880 920 962 1,005 1,051 1,098 1,148 1,200 1,254 1,953
Arlington (gpm) 90 90 1,000 1,000 1,000 1,000 1,000 1,000 1,000 1,000 1,000 1,000 1,000
Snohomish (gpm) 175 177 177 177 177 177 177 177 177 177 177 177 177
System Leakage 521 580 589 599 609 618 627 636 646 655 664 768
Total PHD (gpm) 9,057 10,168 11,303 11,482 11,664 11,851 12,022 12,197 12,376 12,559 12,746 12,921 14,918
Annual (1,000 gallons) 1,631,586 1,712,079 2,245,370 2,274,842 2,304,960 2,335,743 2,364,012 2,392,895 2,422,413 2,452,584 2,483,430 2,512,284 2,841,751
Annual (acre-ft) 5,007 5,255 6,891 6,982 7,074 7,169 7,255 7,344 7,435 7,527 7,622 7,710 8,722
Storm Lake Ridge
Base Year Current Year Ten-Year Planning Period 20-Yr Period
YEAR 2019 2020 2021 2022 2023 2024 2025 2026 2027 2028 2029 2030 2040
ERU PROJECTIONS 260 264 268 272 276 280 284 288 291 295 299 303 340
ADD (gpd) 46,823 53,193 53,999 54,816 55,647 56,489 57,230 57,981 58,742 59,512 60,293 60,987 68,429
MDD (gpd) 117,528 157,585 159,972 162,395 164,854 167,351 169,546 171,770 174,023 176,306 178,618 180,676 202,722
PHD (gpm) 198 267 271 275 279 283 287 291 295 299 303 306 343
Annual (1,000 gallons) 17,090 19,415 19,710 20,008 20,311 20,619 20,889 21,163 21,441 21,722 22,007 22,260 24,977
Annual (acre-ft) 52 60 60 61 62 63 64 65 66 67 68 68 77

DRAFT
20-2733 Page 5-36 2021 Water System Plan Update February 2022 Snohomish County PUD No. 1
Creswell
Base Year Current Year Ten-Year Planning Period 20-Yr Period
YEAR 2019 2020 2021 2022 2023 2024 2025 2026 2027 2028 2029 2030 2040
ERU PROJECTIONS 23 23 24 24 24 25 25 25 26 26 26 27 30
ADD (gpd) 5,546 5,765 5,852 5,941 6,031 6,122 6,202 6,283 6,366 6,449 6,534 6,609 7,415
MDD (gpd) 17,667 19,256 19,547 19,842 20,142 20,446 20,714 20,986 21,261 21,540 21,823 22,074 24,768
PHD (gpm) 54 58 59 60 61 62 62 63 64 65 66 67 75
Annual (1,000 gallons) 2,024 2,104 2,136 2,168 2,201 2,234 2,264 2,293 2,323 2,354 2,385 2,412 2,707
Annual (acre-ft) 6 6 7 7 7 7 7 7 7 7 7 7 8
May Creek
Base Year Current Year Ten-Year Planning Period 20-Yr Period
YEAR 2019 2020 2021 2022 2023 2024 2025 2026 2027 2028 2029 2030 2040
ERU PROJECTIONS 513 523 533 544 554 565 576 587 599 610 622 634 770
ADD (gpd) 86,100 88,619 90,347 92,109 93,905 95,736 97,603 99,506 101,446 103,425 105,441 107,498 130,398
MDD (gpd) 148,594 170,148 173,466 176,849 180,297 183,813 187,397 191,052 194,777 198,575 202,448 206,395 250,364
PHD (gpm) 204 240 245 249 254 259 264 269 275 280 285 291 353
Annual (1,000 gallons) 31,427 32,346 32,977 33,620 34,275 34,944 35,625 36,320 37,028 37,750 38,486 39,237 47,595
Annual (acre-ft) 96 99 101 103 105 107 109 111 114 116 118 120 146
Skylite
Base Year Current Year Ten-Year Planning Period 20-Yr Period
YEAR 2019 2020 2021 2022 2023 2024 2025 2026 2027 2028 2029 2030 2040
ERU PROJECTIONS 155 155 155 156 156 156 156 157 157 157 157 158 160
ADD (gpd) 24,450 25,558 25,597 25,635 25,673 25,712 25,750 25,789 25,828 25,867 25,905 25,944 26,336
MDD (gpd) 44,333 46,979 47,049 47,120 47,191 47,261 47,332 47,403 47,474 47,546 47,617 47,688 48,408
PHD (gpm) 89 90 90 90 90 90 90 91 91 91 91 91 92
Annual (1,000 gallons) 8,924 9,329 9,343 9,357 9,371 9,385 9,399 9,413 9,427 9,441 9,455 9,470 9,613
Annual (acre-ft) 27 29 29 29 29 29 29 29 29 29 29 29 30
Sunday Lake
Base Year Current Year Ten-Year Planning Period 20-Yr Period
YEAR 2019 2020 2021 2022 2023 2024 2025 2026 2027 2028 2029 2030 2040
ERU PROJECTIONS 199 203 207 211 215 219 223 227 231 236 240 245 295
ADD (gpd) 38,360 37,299 38,008 38,730 39,466 40,216 40,980 41,759 42,552 43,360 44,184 45,024 54,348
MDD (gpd) 103,526 107,176 109,212 111,287 113,402 115,556 117,752 119,989 122,269 124,592 126,959 129,371 156,164
PHD (gpm) 179 189 192 196 200 203 207 211 215 219 223 228 275
Annual (1,000 gallons) 14,001 13,614 13,873 14,136 14,405 14,679 14,958 15,242 15,531 15,827 16,127 16,434 19,837
Annual (acre-ft) 43 42 43 43 44 45 46 47 48 49 49 50 61

DRAFT
20-2733 Page 5-37 2021 Water System Plan Update February 2022 Snohomish County PUD No. 1
Kayak
Base Year Current Year Ten-Year Planning Period 20-Yr Period
YEAR 2019 2020 2021 2022 2023 2024 2025 2026 2027 2028 2029 2030 2040
ERU PROJECTIONS 386 390 394 398 402 406 410 414 418 422 426 431 476
ADD (gpd) 90,374 92,954 93,884 94,823 95,771 96,729 97,696 98,673 99,660 100,656 101,663 102,680 113,422
MDD (gpd) 220,627 233,614 235,950 238,309 240,692 243,099 245,530 247,985 250,465 252,970 255,500 258,055 285,053
PHD (gpm) 528 567 573 579 585 590 596 602 608 614 621 627 692
Annual (1,000 gallons) 32,987 33,928 34,268 34,610 34,956 35,306 35,659 36,016 36,376 36,740 37,107 37,478 41,399
Annual (acre-ft) 101 104 105 106 107 108 109 111 112 113 114 115 127
Warm Beach
Base Year Current Year Ten-Year Planning Period 20-Yr Period
YEAR 2019 2020 2021 2022 2023 2024 2025 2026 2027 2028 2029 2030 2040
ERU PROJECTIONS 637 647 658 668 679 690 701 712 723 735 747 759 889
ADD (gpd) 93,305 97,548 99,108 100,694 102,305 103,942 105,605 107,295 109,012 110,756 112,528 114,328 133,996
MDD (gpd) 192,693 263,379 267,593 271,874 276,224 280,644 285,134 289,696 294,331 299,041 303,825 308,686 361,788
PHD (gpm) 258 454 461 468 476 483 491 499 507 515 523 532 623
Annual (1,000 gallons) 34,056 35,605 36,175 36,753 37,341 37,939 38,546 39,163 39,789 40,426 41,073 41,730 48,908
Annual (acre-ft) 105 109 111 113 115 116 118 120 122 124 126 128 150
Combined Warm Beach and Kayak
Base Year Current Year Ten-Year Planning Period 20-Yr Period
YEAR 2019 2020 2021 2022 2023 2024 2025 2026 2027 2028 2029 2030 2040
ERU PROJECTIONS 1,023 1,037 1,051 1,066 1,081 1,095 1,111 1,126 1,141 1,157 1,173 1,189 1,365
ADD (gpd) 183,679 190,502 192,992 195,517 198,076 200,671 203,301 205,968 208,671 211,412 214,191 217,008 247,418
MDD (gpd) 413,320 496,992 503,542 510,183 516,916 523,743 530,664 537,682 544,797 552,011 559,325 566,741 646,841
PHD (gpm) 786 1,021 1,034 1,047 1,060 1,074 1,087 1,101 1,115 1,129 1,144 1,158 1,315
Annual (1,000 gallons) 67,043 69,533 70,442 71,364 72,298 73,245 74,205 75,178 76,165 77,165 78,180 79,208 90,308
Annual (acre-ft) 206 213 216 219 222 225 228 231 234 237 240 243 277

DRAFT
20-2733 Page 5-38 2021 Water System Plan Update February 2022 Snohomish County PUD No. 1
THIS PAGE INTENTIONALLY LEFT BLANK

DRAFT
20-2733 Page 5-39 2021 Water System Plan Update February 2022 Snohomish County PUD No. 1
5.6 Summary
This chapter reviewed the historical water supply and demand trends for each of the District’s water systems. The analysis first reviewed historical supply data for each system. It then looked at customer demands for each system as well as seasonal demand trends of the Lake Stevens Integrated system. Non-revenue usage and DSL percentages were analyzed, and peaking factors were calculated for each system.
Future growth projections were calculated by analyzing historical service connection growths as well as PSRC’s growth projections for each service area. Annual growth rates were chosen for each system using the District’s knowledge of the areas as well as regional growth projections and planning documents.
Future water demand projections were calculated using both the historical water supply and demand trends information as well as the growth projections for each system. These demand projections are used in later chapters to assess system capacity and inform when and where improvements will be needed to meet the District’s design criteria.

DRAFT
20-2733 Page 5-40 2021 Water System Plan Update February 2022 Snohomish County PUD No. 1
THIS PAGE INTENTIONALLY LEFT BLANK

Chapter 6

THIS PAGE INTENTIONALLY LEFT BLANK

DRAFT
20-2733 Page 6-1 2021 Water System Plan Update February 2022 Snohomish County PUD No. 1
Chapter 6
Water Use Efficiency
6.1 Introduction
The District is committed to water conservation and efficiency efforts. As stewards of the Spada Reservoir and associated watershed feeding into the Sultan River, the District has an interest in preserving long-term water supply for power generation, drinking water, and fish needs. Water conservation and water use efficiencies may also reduce water demand per capita, and therefore, preserve groundwater resources for the District’s satellite systems by extending water rights to serve people that would otherwise obtain water from permit exempt individual wells.
This chapter describes the goals for the 2020 Water Use Efficiency (WUE) Program. It also reviews the historical (2011) WUE Program and evaluate its success in meeting its goals.
6.2 Everett Water Utilities Committee
The District is a member of the EWUC and its conservation subcommittee. The subcommittee was formed in 1999 to coordinate water conservation efforts among systems that use water from Everett’s filtration plant. Prior to forming this regional committee, the District's conservation program was coordinated through its Water Resources Department. The District continues to participate in the EWUC regional water efficiency program. The District supplements this program with additional water efficiency measures for its water service area.
6.3 Water Use Efficiency Program Requirements
The State’s water conservation requirements are incorporated in the Water Use Efficiency Rule, which was finalized as WAC 246-290-800 in January 2007. The DOH published the first Water Use Efficiency Guidebook (Guidebook) in July 2007; the latest (third) edition of this guidance was released in January 2017. The District’s WUE program is consistent with the Guidebook and the WUE Rule.
Based on this Guidebook, municipal water suppliers must develop and implement WUE programs to achieve their goals by implementing cost-effective measures. It lists eleven items that must be included in WUE programs. Table 6-1 shows where the required program elements can be found in this WSP.
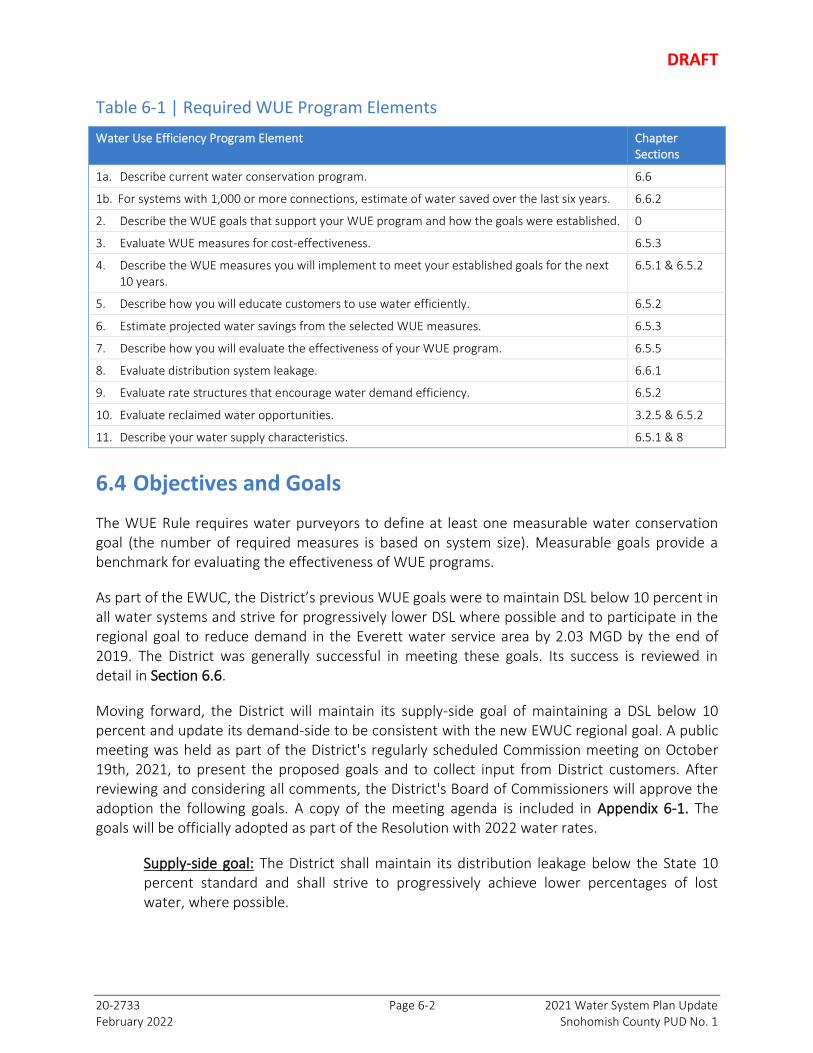
DRAFT
20-2733 Page 6-2 2021 Water System Plan Update February 2022 Snohomish County PUD No. 1
Table 6-1 | Required WUE Program Elements
Water Use Efficiency Program Element Chapter Sections
1a. Describe current water conservation program. 6.6
1b. For systems with 1,000 or more connections, estimate of water saved over the last six years. 6.6.2
2. Describe the WUE goals that support your WUE program and how the goals were established. 0
3. Evaluate WUE measures for cost-effectiveness. 6.5.3
4. Describe the WUE measures you will implement to meet your established goals for the next 10 years.
6.5.1 & 6.5.2
5. Describe how you will educate customers to use water efficiently. 6.5.2
6. Estimate projected water savings from the selected WUE measures. 6.5.3
7. Describe how you will evaluate the effectiveness of your WUE program. 6.5.5
8. Evaluate distribution system leakage. 6.6.1
9. Evaluate rate structures that encourage water demand efficiency. 6.5.2
10. Evaluate reclaimed water opportunities. 3.2.5 & 6.5.2
11. Describe your water supply characteristics. 6.5.1 & 8
6.4 Objectives and Goals
The WUE Rule requires water purveyors to define at least one measurable water conservation goal (the number of required measures is based on system size). Measurable goals provide a benchmark for evaluating the effectiveness of WUE programs.
As part of the EWUC, the District’s previous WUE goals were to maintain DSL below 10 percent in all water systems and strive for progressively lower DSL where possible and to participate in the regional goal to reduce demand in the Everett water service area by 2.03 MGD by the end of 2019. The District was generally successful in meeting these goals. Its success is reviewed in detail in Section 6.6.
Moving forward, the District will maintain its supply-side goal of maintaining a DSL below 10 percent and update its demand-side to be consistent with the new EWUC regional goal. A public meeting was held as part of the District's regularly scheduled Commission meeting on October 19th, 2021, to present the proposed goals and to collect input from District customers. After reviewing and considering all comments, the District's Board of Commissioners will approve the adoption the following goals. A copy of the meeting agenda is included in Appendix 6-1. The goals will be officially adopted as part of the Resolution with 2022 water rates.
Supply-side goal: The District shall maintain its distribution leakage below the State 10 percent standard and shall strive to progressively achieve lower percentages of lost water, where possible.

DRAFT
20-2733 Page 6-3 2021 Water System Plan Update February 2022 Snohomish County PUD No. 1
Demand-side goal: The District shall actively participate in the EWUC regional WUE Program to reduce regional water demand by approximately by 1.4 MGD between 2020 and 2029, or approximately a two percent reduction in the projected cumulative demand through 2029.
6.5 Water Use Efficiency Program for 2021 to 2030
The District’s WUE program was developed for the next 10 years (2021 to 2030) based on current EWUC and District WUE measures. These measures were evaluated for cost effectiveness and water savings. The following sections describe the program and the analyses which informed development of the 2021-2030 WUE program.
6.5.1 Supply-Side Measures
The District sources of supply include surface water purchased from Everett and groundwater supplies from the District’s own wells. Of the District’s nine existing systems, two are solely supplied by Everett’s surface water (Creswell and Storm Lake Ridge), seven systems are solely supplied by their own wells (May Creek, Skylite, Kayak, Warm Beach, Sunday Lake, 212 Market and Deli, and Otis), and one system uses both purchased and well water (Lake Stevens Integrated). A detailed description and analysis of the District’s supply sources is provided in Chapter 8.
Supply-side measures implemented at the utility level focus on activities the District implements to understand and control its water loss. These measures include replacing source and service meters, accounting for various types of authorized water usage, along with leak detection and repair. These activities do not count toward the District’s minimum number of measures. The supply-side measures that the District currently implements and will continue to use are described below.
Source Meters and Service Meters - The District has source meters for all water entering its systems and service meters for all water customers. Meter accuracy is maintained through inspection, maintenance, and replacement as described in Chapter 9 (Operations and Maintenance) of this WSP. In addition, the District intends to replace the majority of its retail service meters by 2025 through its ongoing Automated Metering Infrastructure (AMI) meter replacement program.
All of the District’s retail water services, source, and wholesale master meters are currently read monthly and with the implementation of the AMI program will provide the District with hourly reads at up to 6 hour intervals.
Accounting for Construction Water and Bulk Water Withdrawals - Water fill stations are installed strategically throughout the District’s service territory to meter water truck use and to improve cross connection control. Filling of water trucks is monitored through a permit system. A refundable deposit is required to obtain a key to access the designated water fill stations.

DRAFT
20-2733 Page 6-4 2021 Water System Plan Update February 2022 Snohomish County PUD No. 1
Permits are issued at flat rates for daily (2,500 gallons total), monthly (10,000 gallons total), or six-month (10,000 gallons per month) periods. Water usage is recorded, and the records are collected by District staff monthly. Usage over the allotted amount is charged to the permit holder.
Contractors are required to rent a “hydrant watchdog” from the District for the duration of water main construction projects. The “hydrant watchdog” is attached to a blow-off or hydrant and consists of a meter and backflow device. The meter is read monthly by District staff and the contractor billed.
Reporting by Fire Districts - To improve the accounting of non-revenue water, the District continues to work with the local fire districts on reporting water used from hydrants for firefighting activities.
Accounting for Flushing and Tank Cleaning - District staff estimate water used when flushing water mains, cleaning water tanks, and similar activities. Water used for operational activities are tracked in a spreadsheet.
Leak Detection - The annual budget contains an amount for water leak detection services. In 2007, staff purchased sounding equipment to improve detection of leaks in the distribution system. Devices are placed in service meter boxes to “listen” for leaks overnight. The District intends to expand the use of the leak detection equipment.
Tracking Water Main Breaks - The District tracks unplanned water shutdowns resulting from water main breaks and other occurrences. Main breaks caused by aging infrastructure are added to the District’s GIS database. This information is used in conjunction with input from staff to identify and prioritize water main replacement projects.
Water Main Replacement Program - A major portion of the District's ongoing improvement program is dedicated to replacement of aging water mains. The District's goal has been to replace the majority of its old AC, steel, and galvanized iron pipe by 2028.
6.5.2 Demand-Side Measures
Demand-side conservation is achieved through efforts at the customer level. The WUE Rule specifies that at least nine demand-side measures must be evaluated for cost-effectiveness for systems the size of Lake Stevens Integrated and one for each of the District's other water systems. Evaluated measures must be selected from three categories: (1) indoor residential, (2) outdoor, and (3) industrial/commercial/institutional.
Table 6-2 summarizes demand-side measures that have been evaluated for the District’s water systems. The “regional program” consists of measures evaluated by the EWUC subcommittee, as described in Everett’s 2020 WSP. The “local program” consists of measures implemented by the District beyond the regional program.

DRAFT
20-2733 Page 6-5 2021 Water System Plan Update February 2022 Snohomish County PUD No. 1
The WUE Rule’s instructions for counting evaluated measures goes as follows:
▪ Count one measure for each customer class in which the measure was evaluated.
▪ Each implemented measure automatically counts as having been evaluated.
▪ Any measure required to be implemented (marked in Table 6-2 as “RI”) does not count toward number of measures evaluated.
▪ Any measure required to be evaluated (marked in Table 6-2 as “RE”) does not count unless it is implemented.
As shown in Table 6-2, the District easily satisfies the minimum required WUE measures. These demand-side measures that the District evaluated in the regional and local programs are described in further detail immediately following the table.
Table 6-2 | Demand-Side Measures
Measure Name Implemented1 Counts as # of Measures Evaluated
SF MF C
Public Education Measures
Customer Education (RI) x x x 0
School Outreach
x 1
Regional Program Measures
Indoor Retrofit Kits
Toilets Leak Detection x x
2
Showerheads, 1.75 gpm x x
2
Bathroom Faucet Aerators 1.0 gpm x x
2
Kitchen Faucet Aerators 1.5 gpm x x
2
Outdoor Irrigation Kits x
1
Combined Indoor and Outdoor Audit
x 1
Local Program Measures
Bill Showing Consumption History x x x 3
Leak Adjustment x x x 3
Conservation Rate Structure (RE)
0
Reclaimed Water Opportunities (RE)
0
Total Implemented: 17 Note: 1. (SF) = Single-Family; (MF) = Multi-Family; (C) = Commercial
Customer Education (Single Family, Multi-Family, and Commercial) - The District contributes financially to promote the Everett regional conservation program. A primary effort uses billboards with conservation themes on Community Transit buses during the summer months. It is estimated these billboards are seen by over 75 percent of residents in the region each year.

DRAFT
20-2733 Page 6-6 2021 Water System Plan Update February 2022 Snohomish County PUD No. 1
The EWUC also participates in tri-county (Snohomish, King, and Pierce) water conservation marketing campaigns to broadcast radio and/or television messages.
In addition, Everett develops a summer lawn watering calendar encouraging customers to water every third day (staggered, based on street address). This helps reduce peak day demand by reducing the amount of watering on a given day. The District mails this calendar to all of its water customers each year.
In addition to the regional program’s customer education efforts, the District conducts its own educational program, including mailings, newsletters, brochures, bill inserts, a web page, contests, and local advertisement. In 2008, the District began including conservation performance in its annual Consumer Confidence Report.
School Outreach (Commercial) - The District participates in the regional school outreach program coordinated by Everett. Everett uses trained instructors for presentations to elementary, middle, and high school students.
In addition to the regional program’s customer education efforts, the District also has its own outreach program to public, private, and home schools within its water service territory. The selection of available offerings can be viewed on the Education page of the District’s website, www.snopud.com. These include classroom presentations, curricula, teacher workshops, tours, special programs, videos, books, and other support materials. Educators can subscribe to a mailing list to keep informed of special events, regular program offerings, and general information and updates about energy and water education. Current highlights include interactive storytelling for grades K-1 entitled “Exploring Water with Wanda Flipplefairy,” promotion of regional classroom presentations, mini-grants of up to $500 in the District’s water service territory for water education projects, materials and events, educator workshops, and a wide variety of free educational materials.
Indoor Retrofit Kits (Single and Multi-Family) - As part of the EWUC regional conservation program, the District distributes free indoor water conservation kits to single-family and multi-family retail customers. The indoor conservation kits are intended for homes built prior to 1993, when the National Plumbing Code of 1991 was adopted in the State.
Indoor kits are free to customers and currently include 1.75 gpm showerheads, 1.0 gpm bathroom faucet aerators, a brochure, and thread seal tape. Additionally, 1.5 gpm kitchen faucet aerators and toilet leak detection dye strips are offered separate from the packaged indoor kits. The showerheads, bathroom faucet aerators, and kitchen faucet aerators are more efficient than the maximum allowed under the plumbing code. As such, indoor kits are distributed to both existing and new customers.
Outdoor Irrigation Kits (Single Family) - As part of the EWUC regional conservation program, the District will continue to distribute its share of single-family outdoor conservation kits. Based on studies that show that most households overwater their landscape areas by 15 to 20 percent,
DRAFT
20-2733 Page 6-7 2021 Water System Plan Update February 2022 Snohomish County PUD No. 1
these kits are designed to encourage consumers to reduce watering and other outdoor water use.
The outdoor kits include devices and information to improve the irrigation efficiency of residential customers that manually irrigate their landscaping. Most recently the “kits” consisted of an automatic shut-off watering timer, a garden hose shut-off nozzle, and garden hose repair ends: female/male for 5/8” and ¾” hoses. The contents may remain similar in future years, although some fine-tuning could occur.
Indoor and Outdoor Audits (Commercial) - In partnership with the EWUC regional conservation program, the District provides free indoor and outdoor audits to large volume commercial customers. The audit focuses on efficiencies that could be achieved through hardware improvements, operational changes, or irrigation efficiency improvements. The audits are performed by a contracted professional auditor.
Bill Showing Consumption History (Single Family, Multi-Family, and Commercial) - The District provides as much consumption history as possible on water and electric bills. The current billing software is limited to comparing average use per day and average temperature per day between same time previous year as compared to current year. Due to limitations in the billing program, it is unable to show customers their consumption history in a graph format. With the implementation of the District’s AMI project customer’s billing history and the amount of data they will be able to review will be dramatically increased.
Leak Adjustment (Single Family and Multi-Family) - District meter readers observe for signs of leaks when reading retail water meters. Computer variance reports also flag high and low meter readings. When a leak is suspected, a staff person visits the site and contacts the customer if a potential problem is confirmed. As an incentive to fix qualifying service line leaks, the District allows for a water bill adjustment of 50 percent for the excess amount of water used during the eligible time frame. Once the customer’s meter has been replaced with a new AMI meter, the goal will be to notify the customer of a suspected leak within a couple of days compared to our current manually read process where a leak could go undetected for more than a month.
Evaluated Conservation Rate Structure - The WUE Rule requires purveyors to evaluate a rate structure that encourages conservation. The Guidebook classifies the District’s current water rate structure as a “uniform rate,” with the same charge per unit of water used. According to the Guidebook, this is better than a declining block rate or a flat rate but does not qualify as encouraging efficient water use.
The Guidebook instructs utilities with a uniform water rate to evaluate an inclining block rate or a seasonal rate structure. The District evaluated water rates in September 2018 and adopted its current water rates with Resolution Nos. 5829 and 5864.
A public meeting was held as part of the District's regularly scheduled Commission meeting on November 2nd, 2021, to present the proposed conservation goals and to collect input from District customers. As part of this meeting the Commissioners were asked if they would like staff

DRAFT
20-2733 Page 6-8 2021 Water System Plan Update February 2022 Snohomish County PUD No. 1
to explore different conservation rate structures such as an inclining block structure and/or a seasonal rate. The Commission was interested in looking more closely at conservation rate structures in the future; however, understood that it would be difficult to implement any new rate structure in 2022 due to the ongoing work to prepare for the District’s Automated Metering Infrastructure (AMI) project that is being implemented for both the Electric Utility and Water Utility. The Board also believed that the more detailed usage data that will be collected with the new system will be important in the development of any new conservation rate structure.
Evaluated Reclaimed Water Opportunities - Reclaimed water evaluations conducted by the Lake Stevens Sewer District, Granite Falls, Everett, and Marysville were summarized in Chapter 3, Section 3.2.5 of this WSP. These evaluations thoroughly cover the potential for reclaimed water within and near the District’s water service areas. Relevant pages from the referenced documents are provided in Appendix 3-1.
Lake Stevens Sewer District, Granite Falls, and Everett reuse water at their respective wastewater treatment plants. Each of these jurisdictions currently find reclaimed water cost prohibitive due to the cost of treatment and additional permitting, and do not have plans to use reclaimed water at this time.
6.5.3 Cost Effective Analysis
The EWUC planning effort used an avoided cost approach to evaluate the cost-effectiveness of potential conservation measures. It reviewed the costs associated with the water and wastewater systems that were avoided due to conservation. These avoided costs include operational costs such as chemical costs associated with water and wastewater treatment, energy costs associated with pump drinking water and wastewater, and capital costs associated with expanding the capacity of facilities to convey higher volumes of water or wastewater. The WUE measures where the implementation cost is less than the avoided cost was considered cost-effective. In total, the analysis founded that the total potential avoided cost of supply due to conservation is $0.41 per hundred cubic feet (ccf). A technical memorandum detailing the information gathered, the analysis methodology, and the results of the avoided cost of supply analysis can be found in Appendix K of the 2020 Everett Comprehensive Water Plan.
6.5.4 Conservation Impact on the Demand Forecast
Table 6-3 shows how the estimated savings in the District’s water systems. The District’s estimate assumes an additional 0.2 percent savings each year through 2029. This water savings includes both code changes (or houses being updated to meet current plumbing codes) and WUE program savings. Table 6-3 shows this combination of projected savings, which are factored into the District’s demand projections in Chapter 5.

DRAFT
20-2733 Page 6-9 2021 Water System Plan Update February 2022 Snohomish County PUD No. 1
Table 6-3 | District Projected Water Savings over the Next 10 Years
Year 2020 2021 2022 2023 2024 2025 2026 2027 2028 2029 2030
Demand w/o conservation (ADD, 1000 gpd)1
5,003 6,454 6,526 6,611 6,697 6,776 6,855 6,936 7,033 7,131 7,223
Demand w/conservation (ADD, 1000 gpd)
4,993 6,441 6,513 6,598 6,684 6,762 6,842 6,922 7,019 7,117 7,208
Conservation Savings (ADD, 1000 gpd)
10.0 12.9 13.1 13.2 13.4 13.6 13.7 13.9 14.1 14.3 14.4
Demand Reduction - Individual Year
0.20% 0.20% 0.20% 0.20% 0.20% 0.20% 0.20% 0.20% 0.20% 0.20% 0.20%
Demand Reduction - Cumulative
0.2% 0.4% 0.6% 0.8% 1.0% 1.2% 1.4% 1.6% 1.8% 2.0% 2.2%
Note: 1. Cumulative demand for Lake Stevens Integrated, Storm Lake Ridge, Creswell, May Creek, Skylite, combined Warm Beach, and Sunday Lake.
6.5.5 Evaluating Program Effectiveness
As pointed out by the WUE Guidebook, WUE programs change for a variety of reasons. The Guidebook mentions factors that contribute to shifts in water use patterns, including drought, budget constraints, changes in demographics, and climate change. Water purveyors should monitor the progress of their WUE programs and be prepared to adjust them to stay on track.
Everett and the EWUC conservation committee made several minor adjustments to the 2014 regional program, such as what is included in the Indoor Kits and the Outdoor Kits.
The regional program has also faced financial hurdles. The budget must be authorized each year by the Everett City Council, even though the program is largely funded from rates paid by the wholesale water customers. On at least one occasion, the EWUC supported city staff to make arguments for restoring funds that had been cut.
The progress of the regional program is monitored by Everett Public Works department on an ongoing basis. The EWUC conservation subcommittee meets a couple times per year. Regular updates and discussion about the program also occur at the monthly EWUC meetings.
6.5.6 Funding the WUE Program
The regional conservation program is funded from a portion of the water rates paid to Everett by its wholesale water purveyors. The goal for the 2020-2029 regional water conservation program

DRAFT
20-2733 Page 6-10 2021 Water System Plan Update February 2022 Snohomish County PUD No. 1
is to fund about $226,000 a year in regional water conservation activities. The program is also designed to meet, or exceed, the requirements of the MWL. Conservation efforts supplemented by the District are paid for by water rates.
6.6 Historical Water Use Efficiency Program
The District’s historical WUE was developed as part of the 2011 WSP update. After a public meeting on January 8, 2008, the District's Board of Commissioners adopted the following goals:
Supply-side goal: The District shall maintain its distribution leakage below the State 10 percent standard and shall strive to progressively achieve lower percentages of lost water, where possible.
Demand-side goal: The District shall actively participate in the EWUC regional conservation program to reduce the 2012 regional demand for water by 3 percent (1.97 MGD), while implementing additional WUE measures for the District's water systems.
The supply-side and demand-side measures are described in Section 6.5.1 and Section 6.5.2, respectively of this chapter, though the details of some measure have changed. The following sections analyze the success of the 2011 WUE Program’s goals.
6.6.1 Measuring Success – Supply-Side Goal
The District has been calculating DSL since 1996. The WUE Rule requires that DSL be reported in annual performance reports. Since July 1, 2011, all water systems were required to meet the 10 percent DSL standard as a 3-year average. Systems that do not meet the requirement must develop an action plan to identify steps and timelines to reduce leakage below the standard.
Table 6-4 summarizes distribution system leakage since 2015. The numbers shown in the table may differ from those reported annually to DOH. This difference is due to the timing of the reporting. Until 2018, the District reported annual water usage from March to February. The District changed from bi-monthly to monthly service meter reading starting in September 2015. After a few years examining the impact of this change on DSL calculations the District adjusted its reporting to show annual water usage from January to December.
The negative DSL shown in the Otis and 212 Market & Deli systems are due to the difference in timing between when the water was pumped and when it is used in the system. Due to the size of these systems, one to two gallons equates to about one percent of annual water usage most years. Therefore, the timing of when a gallon of water was pumped versus when it is used plays a noticeable effect in the WUE reports.

DRAFT
20-2733 Page 6-11 2021 Water System Plan Update February 2022 Snohomish County PUD No. 1
Table 6-4 | Reported DSL in Annual WUE Performance Reports
Water System 2015 2016 2017 2018 2019 3-year Average
Lake Stevens Integrated 3.8% 5.6% 5.4% 5.9% 5.1% 5.5%
Warm Beach1 10.1% 12.4% 13.7% 5.7% 6.5% 9.7%
Storm Lake Ridge 1.7% 4.9% 1.8% 1.5% 2.0% 1.8%
Kayak 5.0% 9.1% 8.0% 8.2% 8.8% 8.4%
May Creek 2.0% 8.8% 7.0% 13.9% 11.3% 10.7%
Sunday Lake 3.4% 5.3% 3.7% 2.8% 3.9% 3.5%
Skylite 14.0% 28.9% 16.8% 5.1% 5.6% 9.1%
Otis 7.4% -1.3% 1.2% -4.2% -0.5% -1.2%
212 Market & Deli -6.5% -0.6% 1.7% -8.7% -0.7% -2.6%
Creswell -1.7% 1.7% 1.3% 1.4% 2.0% 1.5% Note: 1. The 2018 DSL for Warm Beach is significantly different than what was reported due to the District finding additional customers that where not being counted when setting up accounts for billing.
The May Creek system does not meet the DSL standard. DSL in May Creek has increased since 2015; the District estimates a portion of this demand comes from unreported fire department usage. The District is working with the local fire department to improve reporting which should lower DSL in the future.
In the Warm Beach system, DSL significantly dropped since the District took over the system due to an increase in tracking all authorized water usage. In addition, the District plans on replacing the old AC pipe in the system to continue to reduce DSL.
The District is working to improve leak detection and repair turn around in the Skylite system, which is evidenced by the lower DSLs for 2018 and 2019; if this trend continues, the Skylite rolling average will decrease in 2020.
With the above action plan to address leakage in systems that exceed the standard, the District’s goal is to assure that the three-year average DSL for all systems is below 10 percent by the time of the next WSP update, which will be due in about ten years.
6.6.2 Measuring Success – Demand-Side Goal
Everett’s 2020 WSP estimates that the previous regional program reduced peak season demand by 1.08 MGD from 2014 to the end of 2019, which did not meet its lofty goal of reducing water usage regional by 2.03 MGD between 2014 and 2019. Table 6-5 shows District water savings for the six-year period from 2014 through 2019 by conservation measure.

DRAFT
20-2733 Page 6-12 2021 Water System Plan Update February 2022 Snohomish County PUD No. 1
Table 6-5 | Estimated Regional Water Savings from 2014-2019 (MGD)
Measure 2014 2015 2016 2017 2018 2019 Total
Education 0.60 0.60 0.60 0.60 0.60 0.60 0.60
Indoor Kits 0.02 0.05 0.04 0.04 0.06 0.04 0.25
Outdoor Kits 0.02 0.02 0.02 0.02 0.03 0.03 0.14
ICI Audits - - 0.04 0.05 0.00 - 0.09
Other 0.64 0.67 0.70 0.71 0.69 0.67 1.08
Totals - 0.71 0.81 0.92 1.01 1.08
Water systems that serve more than 1,000 customers are required to include an estimate of water saved over the last six years in their WSPs. Table 6-6 summarizes water savings by District systems, except 212 Market & Deli and Otis. Warm Beach, which was added to the District in 2018, is only shown in 2019 since that is the only complete year that the system was owned and operated by the District.
Table 6-6 | Water Savings by System
System 2015 WUE Goal1 2015 Actual Usage2
gpd/ERU Gallons gpd/ERU Gallons
Lake Stevens Integrated 182 1,975,211,669 184 1,502,956,6921
Storm Lake Ridge 262 18,808,424 217 17,245,798
Creswell 182 1,742,797 241 2,024,125
May Creek 173 34,155,334 156 26,482,140
Skylite 180 11,278,936 145 8,033,430
Sunday Lake 186 13,145,384 170 11,035,468
(Former) Kayak 240 36,719,750 247 33,449,8723
Note: 1. Actual population growth was less than projected, which is why actual usage went down.
System 2016 WUE Goal4 2016 Actual Usage2
gpd/ERU Gallons gpd/ERU Gallons
Lake Stevens Integrated 182 2,038,307,198 164 1,374,100,699
Storm Lake Ridge 261 19,049,509 177 14,435,555
Creswell 182 1,936,455 220 1,846,1243
May Creek 172 34,522,662 143 24,980,126
Skylite 180 11,297,204 150 8,322,255
Sunday Lake 187 13,801,591 177 10,739,575
(Former) Kayak 239 36,964,467 206 28,542,199

DRAFT
20-2733 Page 6-13 2021 Water System Plan Update February 2022 Snohomish County PUD No. 1
System 2017 WUE Goal3 2017 Actual Usage2
gpd/ERU Gallons gpd/ERU Gallons
Lake Stevens Integrated 181 2,101,402,727 179 1,544,182,600
Storm Lake Ridge 260 19,290,595 213 17,795,690
Creswell 181 2,130,114 270 2,269,963
May Creek 172 34,889,990 167 31,855,293
Skylite 179 11,315,471 155 8,588,012
Sunday Lake 189 14,457,798 187 12,072,713
(Former) Kayak 238 37,209,184 217 30,850,684
System 2018 WUE Goal3 2018 Actual Usage2
gpd/ERU Gallons gpd/ERU Gallons
Lake Stevens Integrated 181 2,164,498,255 173 1,551,896,387
Storm Lake Ridge 259 19,531,681 207 17,415,303
Creswell 181 2,323,773 249 2,089,6583
May Creek 171 35,257,318 155 28,214,844
Skylite 179 11,333,738 156 8,650,687
Sunday Lake 190 15,114,004 194 12,913,5093
(Former) Kayak 237 37,453,900 215 30,884,546
System 2019 WUE Goal1 2019 Actual Usage2
gpd/ERU Gallons gpd/ERU Gallons
Lake Stevens Integrated 180 2,227,593,784 167 1,542,866,292
Storm Lake Ridge 258 19,772,766 176 16,529,633
Creswell 180 2,517,432 236 1,982,2603
May Creek 170 35,624,646 149 27,755,901
Skylite 178 11,352,006 149 8,322,936
Sunday Lake 191 15,770,211 194 13,118,5513
(Former) Kayak 236 37,698,617 213 30,011,884
Warm Beach 137 31,147,348 Note: 1. 2015 and 2019 WUE Goals are from the 2011 WSP’s Table 5-8.. 2. Actual Usage values are from Table 5-2. 3. Growth was lower than projected; this explains why total usage is lower than projected while usage per ERU is higher than projected. 4. 2016, 2017, and 2018 WUE Goals are interpretated from 2015 and 2019 values stated in the 2011 WSP’s Table 5-8.
The goals from 2015 and 2019 reference the conservation values stated in the 2011 WSP’s Table 5-8. The goals from 2016 through 2018 are interpolated from the 2015 and 2019 values. The actual usage values are from this WSP’s Table 5-2.
Creswell is the only system that consistently did not meet its water usage per ERU conservation goal. Creswell’s water usage per ERU has significantly increased since the 2011 WSP. The 2011 WSP used a planning value of 188 gpd per ERU whereas the average ERU value between 2015 and 2019 was 243 gpd per ERU.

DRAFT
20-2733 Page 6-14 2021 Water System Plan Update February 2022 Snohomish County PUD No. 1
The remaining systems meet their WUE goals for most years. The summer of 2015 was a particularly hot and dry, which can be seen in the data as the ERU values for most systems increase during this year, and in addition to Creswell, both Lake Stevens Integrated and Kayak are slightly off their goal WUE ERU value for that year.
The 2011 WSP predicted that the ERU value for Sunday Lake would increase, whereas the ERU values for the other systems would decrease. This increase was expected because new customers built on larger lots and therefore used more water per ERU. This prediction turned out to be true, with the increase happening slightly faster than predicted. Therefore, Sunday Lake’s actual ERU value is slightly higher than its WUE goal ERU value in 2018 and 2019.

Chapter 7

THIS PAGE INTENTIONALLY LEFT BLANK

DRAFT
20-2733 Page 7-1 2021 Water System Plan Update February 2022 Snohomish County PUD No. 1
Chapter 7
Facility Analysis
This chapter describes the evaluations performed on the District’s water systems to identify deficiencies and associated improvements to meet the defined analysis criteria. This analysis evaluates Lake Stevens Integrated and the District’s larger satellite systems following similar procedures. The resulting project recommendations are combined in Chapter 11 to create a capital improvement program (CIP) designed to meet or exceed the District’s level of service standards. The analysis excludes the Otis and 212 Market & Deli systems, which will not grow beyond their current infrastructure or provide additional customer connections.
The District’s water facilities are evaluated in relation to the current (2020), 10-year (2030), and 20-year (2040) projected water demands that were developed in Chapter 5. The analyses use projected demands without additional water savings through conservation. Although the District will make its best effort to implement its water use efficiency program, this approach assures that the District adequately plans and funds improvements to support growth if conservation goals are not met. The District will periodically review actual water demands and growth patterns in comparison to estimates and will appropriately adjust the timeline of planned improvements as warranted.
7.1 System Analysis Criteria
Table 7-1 summarizes the criteria used for this system analysis, which is consistent with both DOH requirements and District standards. In this chapter, a “closed zone” refers to a pressure zone without storage and an “open zone” refers to a pressure zone with storage or with access to upstream storage through a PRV.
The Lake Stevens Integrated system supply and storage facilities were evaluated for their ability to provide 3,000 gpm fire flow to open pressure zones (zones with storage), though actual available fire flow throughout the distribution system is dependent on pipe sizes, looping, and elevations. In each storage analysis, fire suppression storage and standby storage are “nested”; the maximum component makes up the emergency storage volume for each system.
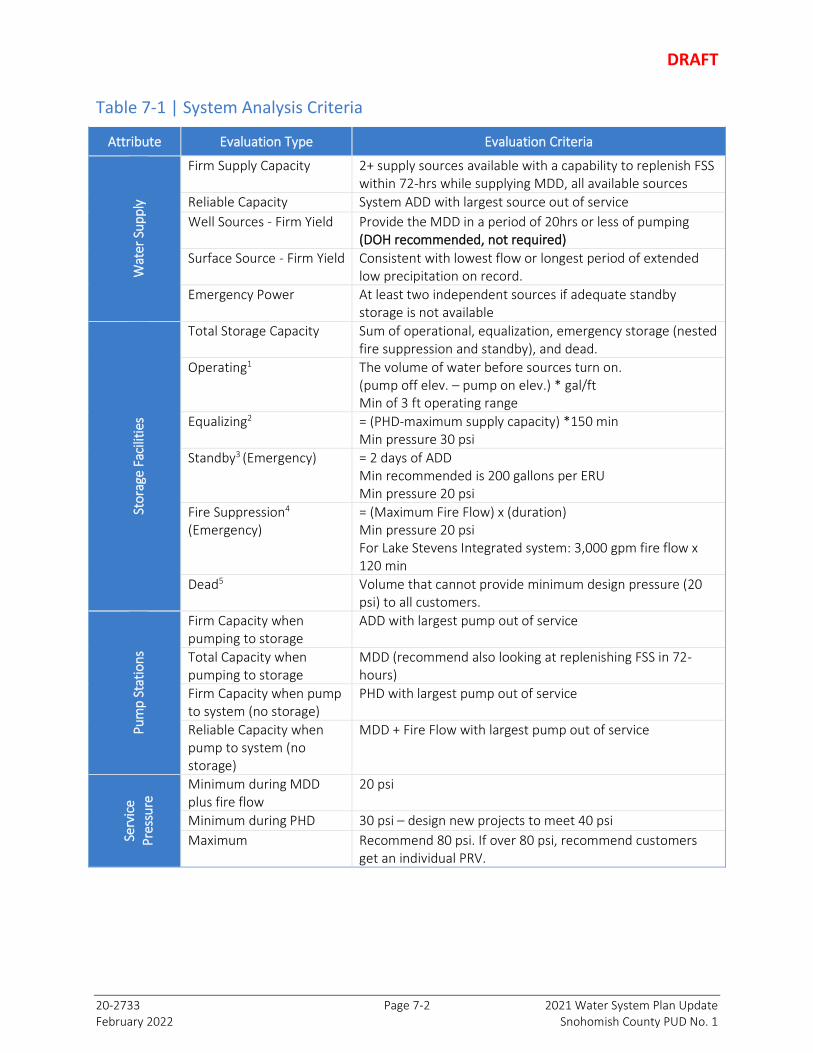
DRAFT
20-2733 Page 7-2 2021 Water System Plan Update February 2022 Snohomish County PUD No. 1
Table 7-1 | System Analysis Criteria
Attribute Evaluation Type Evaluation Criteria W
ater
Su
pp
ly
Firm Supply Capacity 2+ supply sources available with a capability to replenish FSS within 72-hrs while supplying MDD, all available sources
Reliable Capacity System ADD with largest source out of service Well Sources - Firm Yield Provide the MDD in a period of 20hrs or less of pumping
(DOH recommended, not required) Surface Source - Firm Yield Consistent with lowest flow or longest period of extended
low precipitation on record. Emergency Power At least two independent sources if adequate standby
storage is not available
Sto
rage
Fac
iliti
es
Total Storage Capacity Sum of operational, equalization, emergency storage (nested fire suppression and standby), and dead.
Operating1 The volume of water before sources turn on. (pump off elev. – pump on elev.) * gal/ft Min of 3 ft operating range
Equalizing2 = (PHD-maximum supply capacity) *150 min Min pressure 30 psi
Standby3 (Emergency) = 2 days of ADD Min recommended is 200 gallons per ERU Min pressure 20 psi
Fire Suppression4
(Emergency) = (Maximum Fire Flow) x (duration) Min pressure 20 psi For Lake Stevens Integrated system: 3,000 gpm fire flow x 120 min
Dead5 Volume that cannot provide minimum design pressure (20 psi) to all customers.
Pum
p S
tati
on
s
Firm Capacity when pumping to storage
ADD with largest pump out of service
Total Capacity when pumping to storage
MDD (recommend also looking at replenishing FSS in 72-hours)
Firm Capacity when pump to system (no storage)
PHD with largest pump out of service
Reliable Capacity when pump to system (no storage)
MDD + Fire Flow with largest pump out of service
Serv
ice
Pres
sure
Minimum during MDD plus fire flow
20 psi
Minimum during PHD 30 psi – design new projects to meet 40 psi Maximum Recommend 80 psi. If over 80 psi, recommend customers
get an individual PRV.

DRAFT
20-2733 Page 7-3 2021 Water System Plan Update February 2022 Snohomish County PUD No. 1
Attribute Evaluation Type Evaluation Criteria D
istr
ibu
tio
n
Pip
ing
Maximum Velocity during PHD
8 fps
Maximum Velocity during Fire Flow6
10 ps – design new projects to meet 8 fps
Notes: 1. Operating storage is used to supply the water system under normal demand conditions. The operational storage in all the District’s reservoirs is the volume of storage between the average water level of the reservoirs which signal a supply source to operate and the maximum water level (i.e., overflow elevation) of the reservoirs. 2. When the source pumping capacity cannot meet the periodic daily (or longer) peak demands placed on the water system, equalizing storage must be provided as a part of the total storage for the system, and must be available at 30 psi to all service connections. 3. Standby storage is the portion of the reservoir used to supply the water system under emergency conditions when supply facilities are out of service. 4. Fire flow storage is the portion of the reservoir with sufficient volume to supply water to the system at the maximum rate and duration required to extinguish a fire at the building with the highest fire flow requirement. 5. Dead storage is the bottom portion of the reservoir that cannot be used because water is stored at an elevation that is too low to provide sufficient pressure (below 20 psi at the highest elevation served by the reservoir). 6. Velocity criteria are primarily for designing pipe improvements and these criteria alone will not typically result in recommendations for existing system improvements.
7.2 Hydraulic Model
The current version of the hydraulic model was completed by another consultant in 2019 using InfoWater, a GIS-based modeling program developed by Innovyze. The 2019 work included calibrating the District’s existing steady-state model (Lake Stevens Integrated only) to be consistent with recent field flow tests. A memorandum titled “Hydraulic Model Update and Steady-State Calibration” by Sedaru Consulting summarizes the calibration effort and can be found in Appendix 7-1. The memorandum recommends a few additional flow tests in certain locations or an EPS calibration against SCADA to verify the model but concluded that “the District can confidently use the hydraulic model for planning purposes such as hydrant testing and potential pipe improvements”. However, the memorandum also noted that any analysis performed near Tests 1 (southern area of Lake Roesiger 811 Pressure Zone) and 3 (northeastern area of Granite Falls 726 Pressure Zone should be preceded by further validation of the model. An EPS calibration was completed as defined below.
Murraysmith also calibrated the May Creek and Storm Lake Ridge portions of the hydraulic model for steady-state analysis. The District provided flow tests for two representative hydrants in the May Creek water system and four representative hydrants in the Storm Lake Ridge water system. The hydraulic model was run under the same operational conditions (e.g., tank levels, PRV settings where applicable) and the pressure results compared to the pressures measured in the field during the flow tests. The model matched the field results within +\- 1 psi for static pressures and within +/- 8 psi for changes in residual pressures. Industry guidance is that differences lower than 5 psi between the model and the field are considered a high level of confidence in the hydraulic model, so a difference of +/- psi indicates the District can have a reasonable level of confidence in the hydraulic model.
DRAFT
20-2733 Page 7-4 2021 Water System Plan Update February 2022 Snohomish County PUD No. 1
For the May Creek, Sunday Lake, Warm Beach, and Skylite water systems, Murraysmith validated the model by simulating typical operating conditions and reviewed pressures and flows for any suspicious or unrealistic results, such as extreme pressure losses, flows that did not match pump ratings, or service pressures outside typical service pressure ranges. Any concerns were reviewed with the District to check the model setup. For small systems where the hydraulics are not complex, this validation effort provided a confidence in the hydraulic model.
Murraysmith calibrated the Lake Stevens Integrated portion of the District’s water model for extended period simulation (EPS) analysis. An EPS calibration assesses the model to ensure it matches the typical system behavior over time. To set up the calibration, two EPS scenarios in the water system model were configured (one for winter and one for summer) to match facility control schemes provided by the District. Murraysmith used real-time supervisory control and data acquisition (SCADA) records to define diurnal water use patterns over the course of the day. These diurnal patterns mimic the changes in water use from Lake Stevens Integrated customers over time. System behavior in the model was compared to the behavior shown in the SCADA records for a specific calibration period. Model boundary conditions such as pump status, pump curves, tank elevations, PRV settings, and tap HGLs were modified to match the SCADA for a typical summer and winter day. The calibration showed that the model’s summer and winter control schemes generally matched field conditions, thus the model can be used for extended period analyses.
Water demands are distributed in the model by assigning a unit demand for each meter to the nearest pipe junction. A global demand factor is then applied to adjust system-wide demands to match the supply-based ADD determined in Chapter 5. Peaking factors as described in Chapter 5 were applied to adjust the demand levels to MDD for the fire flow analysis and to PHD for the pressure analysis.
Future demands were projected by both multiplying demands inside the existing RSA by a future multiplier for each pressure zone. These future multipliers were developed from PSRC’s VISION 2040 growth projections for each FAZ. Lake Stevens Integrated is spread among six FAZs, each with unique growth projection.
Additional demand was added to areas of expected growth, per the District’s knowledge of its system. These areas included the northern border of the Lake Stevens Integrated Zone, the northwestern and southeastern edges of the Granite Falls 726 Pressure Zone, and the northern and southwestern edges of the Lake Roesiger 811 Pressure Zone. These boundaries encompass future retail area that is expected to grow and become part of the District’s retail area during the 20-year planning period.
7.3 Lake Stevens Integrated Facilities Analysis
The following section describes the Lake Stevens Integrated system’s ability to meet various capacity and regulatory requirements. The analysis reviews the system’s supply facilities, booster pump stations, distribution system, storage facilities, and total system capacity, as measured by

DRAFT
20-2733 Page 7-5 2021 Water System Plan Update February 2022 Snohomish County PUD No. 1
the total number of ERUs a system can support. The Lake Stevens Integrated system was divided into three service areas for purposes of the analysis: the Lake Roesiger service area, the Granite Falls service area, and the Lake Stevens service area. Each of these service areas’ supply and storage facilities were evaluated for their ability to provide 3,000 gpm fire flow to open zones, though actual available fire flow throughout the distribution system is dependent on pipe sizes, looping, and elevations.
The analysis is based on the demand distribution used in the hydraulic model, which is further discussed in Section 7.2 of this chapter. The individual demands of Arlington, Granite Falls, and the City of Snohomish were considered in terms of the amount of water the District is contractually obligated to provide. As described in the wholesale agreements, the District provides storage for Granite Falls, but not for Arlington.
7.3.1 Water Supply Facility Evaluation for the Lake Stevens Integrated
This section evaluates Lake Stevens Integrated supply facilities. Supply facilities must provide a sufficient quantity of water at pressures that reliably meet the requirements of shown in Table 7-1. The required quantity depends on whether the pressure zone is an open zone (i.e., has storage) or a closed zone (i.e., does not have storage). These requirements are summarized in Table 7-1.
The Lake Stevens Integrated system is primarily supplied by purchased water from Everett with additional supply coming from its wells. Figure 4-2 indicated the approximate location of taps for purchased water supply and Figure 4-3 illustrated how water is delivered from these taps into the District’s water systems. The majority of purchased water is supplied by pump stations. The remaining purchased supply is delivered directly from the transmission line taps. Table 4-3 listed details about each pump in the supply stations, including their rated capacities.
Table 7-2 shows the Lake Stevens Integrated system’s supply evaluation. It reviews the system’s ability to both provide MDD while replenishing fire suppression storage in 72 hours as well as its ability to meet ADD with the largest source out of service. As the table shows, the system has sufficient supply to meet existing and projected demands.

DRAFT
20-2733 Page 7-6 2021 Water System Plan Update February 2022 Snohomish County PUD No. 1
Table 7-2 | Lake Stevens Integrated System Supply Evaluation
Description Plan Yr 20201
10-Yr 2030
20-Yr 2040
Required Supply (gpm)
Fire Suppression Storage Replenished in 72 hours
83 83 83
Maximum Day Demand 6,598 8,993 10,4362
Average Day Demand 3,224 4,857 5,5452
Available Supply (gpm)
Largest Source (QL) 4,125 4,125 4,125
Total Capacity (Qs)3 19,150 19,150 19,150
Reliable Supply Capacity (ADD with largest source out of service)
Surplus / (Deficit) of Supply (gpm) 11,801 10,168 9,480
Firm Capacity (MDD + replenish FSS in 72-hours)
Surplus / (Deficit) of Supply (gpm) 12,468 10,074 8,631 Note: 1. 2020 “plan year” is a projection based on 2019 data but accounts for 2020 Granite Falls demand 2. The Creswell system will be connected to the Lake Roesiger 811 Pressure Zone by 2040, so Creswell demand is included in the 2040 analysis. 3. Total Capacity includes only sources that pump or gravity-flow directly into the Lake Stevens Pressure Zone
7.3.2 Boosted Pressure Zones within the Lake Stevens Integrated System
Booster pumps are used when serving higher elevation pressure zones where higher hydraulic grades are required to maintain adequate service pressures. Similar principles applied when sizing the water supply also apply to sizing booster pumps. These principles summarized in Table 7-1. If a booster station serves a zone containing equalizing storage (an open zone), it must supply at least the MDD. If the booster station pumps into a closed zone, it must supply the PHD. In addition, if the station supports fire flow, it should provide the fire flow under MDD with the largest pump out of service. The capacities of existing pumps in the booster stations were summarized in Table 4-3. The booster stations for Lake Stevens Integrated are evaluated individually below.
7.3.2.1 Granite Falls 726 Pressure Zone
The Granite Falls pump station serves the Granite Falls 726 Pressure Zone and eight other pressure zones that receive water through the Bosworth Pump Station and PRV stations from the Granite Falls zone. The wholesale master meters for the cities of Granite Falls and Arlington are also located in this zone. The Granite Falls zone is an open zone and contains equalizing storage, so the pumps only need to supply the MDD of this area. The pump station contains chlorination equipment to boost the chlorine residual to the northern extremes of the system.
The concrete masonry, metal roofed, three-room building housing the Granite Falls pumps was constructed in 1995. The station has separate rooms for a pad mounted generator and for the

DRAFT
20-2733 Page 7-7 2021 Water System Plan Update February 2022 Snohomish County PUD No. 1
chlorination facilities. In 2001, two new variable frequency drive (VFD) controlled pumps were installed (replacing one existing pump), and the electrical service was upgraded to increase the capacity. The other two pumps were replaced in 2006. The station now contains four identical pumps, each capable of supplying 1,000 gpm at 355 feet total dynamic head (TDH). The pumps alternate in pairs, so the station is considered to have a capacity of 2,000 gpm. District crews report that it is difficult to run three pumps in this station simultaneously due to high pressure on the discharge side of the pumps.
Table 7-3 shows the Granite Falls pump stations supply evaluation. It reviews the pump station’s ability to both provide maximum day demand while replenishing fire suppression storage in 72 hours as well as its ability to meet ADD with the largest source out of service. As the table shows, the system has sufficient supply to meet the projected demands through 2030, but additional pumping will be needed before 2040, which is part of the District’s 20-year CIP. The table shows capacity for only two out of the four pumps in the station due to the excessive discharge pressure produced by three or more pumps. The CIP includes a retrofit to the station in 2040 that will optimize the existing pumps to lower TDH so that all four pumps can be used. The need for an additional pump to reach the required capacity will be evaluated during pre-design.
Table 7-3 | Granite Falls 726 Pressure Zone Supply Evaluation
Description Plan Yr 2020
10-Yr 2030
20-Yr 2040
Required Supply (gpm)
Fire Suppression Storage Replenished in 72 hours 83 83 83
Maximum Day Demand 1,026 2,084 3,237
Average Day Demand 501 1,109 1,689
Available Supply (gpm)
Largest Pump (QL) 1,000 1,000 1,000
Total Pumping Capacity (Qs)1 2,000 2,000 2,000
Reliable Supply Capacity (ADD with largest pump out of service)
Surplus / (Deficit) of Supply (gpm) 1,499 891 311
Total Capacity (MDD + replenish FSS in 72-hours)
Surplus / (Deficit) of Supply (gpm) 891 (168) (1,320) Note: 1. Granite Falls pump station has four (4) 1,000 gpm; however, only 2 pumps can run at a time, or the max discharge pressure will be exceeded.
7.3.2.2 Lake Roesiger 811 Pressure Zone
The Lake Roesiger 811 Pressure Zone is served by the Lake Roesiger tap and BPS and the Bosworth pump station which was constructed in 1997. The Bosworth BPS is a fabricated steel, below-grade station that pumps water from the District’s Granite Falls 726 Pressure Zone to the Lake Roesiger 811 Pressure Zone through two end suction pumps. Water levels in the Bosworth tank trigger pump operation. A PRV at the Bosworth pump station is hydraulically activated to direct flow back into the Granite Falls 726 Pressure Zone as needed.

DRAFT
20-2733 Page 7-8 2021 Water System Plan Update February 2022 Snohomish County PUD No. 1
As was indicated in Table 4-3, the Lake Roesiger supply pump station contains two pumps that deliver water from Everett’s 3-Line. The station was completed in 1992 and is in good condition. Each pump is rated for 450 gpm at 280 feet TDH. The pumps normally alternate, with each pump supplying 410-440 gpm while pumping from the Everett 3-line through distribution to the tanks. Additionally, Table 4-3 indicates the capacity of the Bosworth pump station is 250 gpm at 120 feet of head with one pump running. The pumps alternate in a lead/lag configuration, and both pumps can run together if needed resulting in a total capacity of about 350 gpm.
The Lake Roesiger 811 Pressure Zone contains three tanks and is an open zone. Table 7-4 shows the Lake Roesiger 811 Pressure Zone supply evaluation. It reviews the Lake Roesiger and Bosworth pump stations’ ability to provide the required demand for the Lake Roesiger 811 Pressure Zone and the Sunset Ridge 700 Pressure Zone. The pump stations have the capacities to provide MDD while replenishing fire suppression storage in 72 hours as well as the ability to meet ADD with the largest source out of service. As Table 7-4 shows, the system has sufficient supply to meet the projected demands through 2040.
Table 7-4 | Lake Roesiger 811 Pressure Zone Supply Evaluation
Description Plan Yr 2020
10-Yr 2030
20-Yr 2040
Required Supply (gpm)
Fire Suppression Storage Replenished in 72 hours 83 83 83
Maximum Day Demand 215 372 5291
Average Day Demand 105 202 2801
Available Supply (gpm)
Lk Roesiger PS - Largest Pump (QL) 465 465 465
Lk Roesiger PS - Total Pumping Capacity (Qs) 700 700 700
Bosworth PS - Largest Pump (QL) 250 250 250
Bosworth PS - Total Pumping Capacity (Qs) 350 350 350
Reliable Supply Capacity (ADD with largest pump out of service)
Surplus / (Deficit) of Supply (gpm) 480 383 305
Total Capacity (MDD + replenish FSS in 72-hours)
Surplus / (Deficit) of Supply (gpm) 752 594 438 Note: 1. The Creswell system will be connected to the Lake Roesiger 811 Pressure Zone by 2040, so Creswell demand is included in the 2040 analysis.
7.3.2.3 Hillcrest 580 Pressure Zone
The Hillcrest 580 Pressure Zone is served by a combination of eight pumps in two pump stations. As was shown in Table 4-3 the Hillcrest and Glenwood Pump Stations have a capacity of 1,000 gpm and 2,500 gpm, respectively. No tanks float on this pressure zone and is therefore a “closed zone”.
The Hillcrest Pump Station is located adjacent to the Hillcrest Tanks. The concrete masonry block building is equipped with a PACO booster pump system and was constructed in 1982. The

DRAFT
20-2733 Page 7-9 2021 Water System Plan Update February 2022 Snohomish County PUD No. 1
control system was replaced in 2001 with the installation of the District’s Water SCADA system. The station maintains normal and high demand flows by staging five VFD pumps through a start on-pressure, stop on-flow control sequence. Hillcrest is the District’s second oldest pump station. However, the pumps and other station facilities are still in very good condition.
The District added new pumps in 2006 as part of the Glenwood Pump Station replacement project, based on the 2002 WSP which identified need for additional pumps to meet increasing demands in the Hillcrest 580 Pressure Zone. The three VFD Goulds pumps supply the Hillcrest 580 Pressure Zone directly from the Everett 3-line.
Table 7-5 shows the Hillcrest 580 Pressure Zone supply evaluation. It reviews the Hillcrest and Glenwood Pump Stations’ ability to provide the required demand for the Hillcrest 580 Pressure Zone. The combined pump stations’ capacities are adequate to provide MDD plus a 2,000-gpm fire flow as well as its ability to meet PHD, with the single largest pump out of service between the two facilities. As the table shows, the system has sufficient supply to meet the projected demands through 2040.
Table 7-5 | Hillcrest 580 Pressure Zone Supply Analysis
Description Plan Yr 2020
10-Yr 2030
20-Yr 2040
Required Supply (gpm)
Max Fire Flow 1,500 1,500 1,500
Maximum Day Demand 242 374 478
Peak Hour Demand 367 547 701
Available Supply (gpm)
Glenwood 3,4,5 - Largest Pump (QL) 1,000 1,000 1,000
Glenwood 3,4,5 - Total Pumping Capacity (Qs) 2,500 2,500 2,500
Hillcrest - Largest Pump (QL) 667 667 667
Hillcrest - Total Pumping Capacity (Qs) 1,000 1,000 1,000
Firm Supply Capacity (no storage) (PHD with largest pump out of service)
Surplus / (Deficit) of Supply (gpm) 2,133 1,953 1,799
Reliable Capacity (no storage) (MDD + Fire Flow with largest pump out of service)1
Surplus / (Deficit) of Supply (gpm) 758 626 522 Note: 1. Largest pump is considered to be the largest Glenwood Pump. All Hillcrest pumps are considered active.
7.3.2.4 Walker Hill 580 Pressure Zone
The Walker Hill Booster Station is located on the Walker Hill Tank site and serves the Walker Hill 580 Pressure Zone at the north end of Lake Stevens Integrated. The concrete masonry block building and booster pump system were constructed in 1990 to replace the old booster station located south of the tank site. A sixth pump was added in 1996 to increase fire flow capacity for the Lake Stevens School District, and a permanent pad mounted generator was installed in 1998. The pump control system was replaced in 2001 with the installation of the District’s Water

DRAFT
20-2733 Page 7-10 2021 Water System Plan Update February 2022 Snohomish County PUD No. 1
SCADA system. The booster station maintains normal and high demand flows by staging VFD six pumps through a start on-pressure, stop on-flow control sequence.
Table 7-6 shows the Walker Hill 580 Pressure Zone supply evaluation. The table assesses the pump stations’ capacities to provide MDD plus a 2,000-gpm fire flow and to meet PHD, at the design capacity of the pumps with the largest pump out of service. The tabular analysis indicates that the Walker Hill station does not have the pumping capacity to support the 2,000-gpm fire flow requirement at the school with the largest pump out of service; under typical pressure and head conditions (approximately 580 feet of head). The hydraulic model was used to evaluate the capacity of the pump station to provide a 2,000-gpm requirement at the lower, 20 psi pressure requirement during a fire. The hydraulic model analysis shows that the pumps operating at a lower head, higher flow condition provides sufficient fire flow to the zone at a lower 20 psi condition. This lowers the hydraulic grade line in the zone but maintains enough head so that all customers have sufficient pressure during a fire at the school (over 20 psi). Therefore, the pump station is considered to have adequate capacity to supply the school’s minimum required flow. A pump station upgrade is included in the CIP (Chapter 11) to improve overall service to the Walker Hill 580 Pressure Zone.
Table 7-6 | Walker Hill 580 Pressure Zone Supply Analysis
Description Plan Yr 2020
10-Yr 2030
20-Yr 2040
Required Supply (gpm)
Max Fire Flow 2,000 2,000 2,000
Maximum Day Demand 211 295 346
Peak Hour Demand 320 431 507
Available Supply (gpm)
Largest Pump (QL) 500 500 500
Total Pumping Capacity (Qs) 1,995 1,995 1,995
Firm Supply Capacity (no storage) (PHD with largest pump out of service)
Surplus / (Deficit) of Supply (gpm) 1,175 1,064 988
Reliable Capacity (no storage) (MDD + Fire Flow with largest pump out of service)
Surplus / (Deficit) of Supply (gpm) (716) (800) (851)
7.3.2.5 Lake Cassidy 580 Pressure Zone
Lake Cassidy Pump Station was placed into service in 2006 for the Preserve at Lake Cassidy. As was shown in Table 4-3, the Lake Cassidy station has a capacity of 2,000 gpm when one 1,200 gpm pump is held in reserve. Three of the five pumps are VFD and can modulate pressure to this closed zone.
Table 7-7 shows the Lake Cassidy 580 Pressure Zone supply evaluation. The table assesses the pump stations’ capacities to provide MDD plus a 500-gpm fire flow and to meet PHD, both with the largest pump out of service. As the table shows, the system has sufficient supply to meet the projected demands through 2040.

DRAFT
20-2733 Page 7-11 2021 Water System Plan Update February 2022 Snohomish County PUD No. 1
Table 7-7 | Lake Cassidy 580 Pressure Zone Supply Analysis
Description Plan Yr 2020
10-Yr 2030
20-Yr 2040
Required Supply (gpm)
Max Fire Flow 500 500 500
Maximum Day Demand 11 18 23
Peak Hour Demand 17 26 34
Available Supply (gpm)
Largest Pump (QL) 1,200 1,200 1,200
Total Pumping Capacity (Qs) 2,000 2,000 2,000
Firm Supply Capacity (no storage) (PHD with largest pump out of service)
Surplus / (Deficit) of Supply (gpm) 783 774 766
Reliable Capacity (no storage) (MDD + Fire Flow with largest pump out of service)
Surplus / (Deficit) of Supply (gpm) 289 282 277
7.3.2.6 Machias Ridge East 640 Pressure Zone
The 157th Avenue SE Booster Station serves about 30 homes in the Machias Ridge East 640 Pressure Zone (closed zone), which includes the Machias Ridge East and Panther Creek East developments. The VFD pump and controls are installed in a daylight-drained vault that was renovated in 2001 during the integration of the Machias Ridge East Water System. The District since added a backup pump and wired the station so it can be operated by a trailer mounted generator during power outages. The backup pump must be activated manually when needed.
Table 7-8 shows the 157th Street pump stations supply evaluation. It looks at the pump station’s capacity to provide MDD and to meet PHD, both with the largest pump out of service. Fire flow requirements were not considered because there are no fire hydrants in this pressure zone. As the table shows, the system has sufficient supply to meet the projected demands through 2040.

DRAFT
20-2733 Page 7-12 2021 Water System Plan Update February 2022 Snohomish County PUD No. 1
Table 7-8 | Machias Ridge East 640 Pressure Zone Supply Analysis
Description Plan Yr 2020
10-Yr 2030
20-Yr 2040
Required Supply (gpm)
Max Fire Flow 0 0 0
Maximum Day Demand 19 24 27
Peak Hour Demand 28 35 39
Available Supply (gpm)
Largest Pump (QL) 75 75 75
Total Pumping Capacity (Qs) 75 75 75
Firm Supply Capacity (no storage) (PHD with largest pump out of service)
Surplus / (Deficit) of Supply (gpm) 47 40 36
Reliable Capacity (no storage) (MDD + Fire Flow with largest pump out of service)
Surplus / (Deficit) of Supply (gpm) 56 51 48 Note: The District has an auxiliary pump at this pump station with a capacity of 75 gpm. The two pumps can be manually switched on, if necessary.
7.3.2.7 Dubuque Boosted 640 Pressure Zone
The 44th Street SE Booster Station serves about 40 homes on 144th Avenue SE, 143rd Avenue SE, and Brookside Place in the Dubuque Boosted 640 Pressure Zone (closed zone). This station is also located in a vault, as was the case when the District acquired the Dutch Hill System in 1997. The District upgraded the electric service for the station in January 2002 and installed new pumps in 2008. The pumps alternate and produce 125 gpm when operating at 120 feet TDH to maintain 40 psi at the highest residence.
Table 7-9 shows the 44th Street pump stations supply evaluation. It looks at the pump station capacity to provide MDD and to meet PHD, both with the largest pump out of service. Fire flow requirements were not considered because there are no fire hydrants in this pressure zone. As the table shows, the system has sufficient supply to meet the projected demands through 2040.

DRAFT
20-2733 Page 7-13 2021 Water System Plan Update February 2022 Snohomish County PUD No. 1
Table 7-9 | Dubuque Boosted 640 Pressure Zone Supply Analysis
Description Plan Yr 2020
10-Yr 2030
20-Yr 2040
Required Supply (gpm)
Max Fire Flow 0 0 0
Maximum Day Demand 23 30 33
Peak Hour Demand 35 44 48
Available Supply (gpm)
Largest Pump (QL) 125 125 125
Total Pumping Capacity (Qs) 250 250 250
Firm Supply Capacity (no storage) (PHD with largest pump out of service)
Surplus / (Deficit) of Supply (gpm) 90 81 77
Reliable Capacity (no storage) (MDD + Fire Flow with largest pump out of service)
Surplus / (Deficit) of Supply (gpm) 102 95 92
7.3.3 Distribution System Evaluation for the Lake Stevens Integrated System
The Lake Stevens Integrated distribution system must convey water from the sources of supply to customers and to/from the storage tanks. Murraysmith evaluated the Lake Stevens Integrated distribution systems using the District’s hydraulic model. Following is a description of the criteria, results, and recommendations for Lake Stevens Integrated. Recommended improvements for other systems will be presented later in this chapter.
7.3.3.1 Evaluation Criteria
As shown in Table 7-1, the criteria used as the basis for evaluating the distribution of all the District’s water systems include:
▪ Identifying areas with service pressures below 30 psi under existing and future PHD,
▪ Identifying areas where required fire flow cannot be met under existing or future MDD conditions while maintaining at least 20 psi throughout the water system, and
▪ Identifying pipe with velocities in excess of 8 feet per second during PHD.
Fire flow demands used for evaluating the distribution system are shown in Table 7-10 below. As noted above, the supply and storage facilities in the Lake Stevens Integrated system were evaluated for their ability to provide 3,000 gpm fire flow in open zones; however, the fire flow requirements in the table below were used to evaluate the distribution system itself.

DRAFT
20-2733 Page 7-14 2021 Water System Plan Update February 2022 Snohomish County PUD No. 1
Table 7-10 | Fire Flow Requirements
Water System Pressure Zone (PZ)/ Service Area (SA)
Fire Flow Evaluation Criteria
Lake Stevens Integrated Lk Stevens SA 1,000 to 1,500 gpm for 2 hours max
Granite Falls SA Granite Falls City
1,000 gpm for 2 hours 3,000 gpm for 2 hours
Lk Roesiger SA 1,000 gpm for 2 hours
Dubuque 640 PZ No fire flow required
Machias Ridge PZ No fire flow required
Walker Hill PZ 1,000 to 2,000 gpm for 2 hours
Lk Cassidy PZ 500 gpm for 1 hour
Hillcrest PZ 1,500 gpm for 2 hours
Storm Lake Ridge 760 PZ 500 to 1,000 gpm for 2 hours
850 PZ No fire flow required
Creswell 525 PZ 1,000 gpm for 2 hours
May Creek 392 PZ 500 gpm for 1 hour
Skylite 280 PZ No fire flow required
Sunday Lake 430 PZ 500 gpm for 1 hour
500 PZ 500 gpm for 1 hour
Warm Beach Kayak 535 PZ 500 gpm for 2 hours
Kayak 450 PZ 500 gpm for 2 hours
WB 370 PZ 500 gpm for 2 hours
WB 350 PZ 500 gpm for 2 hours
WB 450 PZ No fire flow required
WB 232 PZ 500 gpm for 2 hours
Murraysmith evaluated the Lake Stevens Integrated system for the above criteria based on 2020, and 2040 water demands. Murraysmith modeled fire flow for each hydraulic model node close to a hydrant for these systems. The resulting available fire flow from each hydrant node was compared to the fire flow requirement to determine any deficient areas that cannot provide the minimum requirement.
7.3.3.2 Analysis Results
The areas with fire flow or PHD pressure deficiencies are shown in Figure 7-1. There are very few PHD pressures below the criteria of 30 psi and a number of areas where fire flows did not meet the minimum requirement (see Table 7-10) under existing conditions or future demands. Improvements were identified and added to the model to address any existing deficiencies prior to doing the analysis on the 2040 timeframe. A future analysis then reviewed the projected 2040 water system, including projected demands and previously identified system improvements. Additional improvements were identified to address any future deficiencies. All improvements to address the deficiencies, both existing and future, are discussed in Chapter 11. Analysis results for the District’s other systems are presented later in this chapter.
DRAFT
20-2733 Page 7-15 2021 Water System Plan Update February 2022 Snohomish County PUD No. 1
7.3.4 Storage Evaluation for the Lake Stevens Integrated System
The District’s storage facilities provide a key system component for: maintaining pressure, controlling pumps, providing water for demands above MDD and during emergencies such as fires. Following is a description of the condition, capacity, and recommended improvements for storage in the Lake Stevens Integrated system. Lake Stevens Integrated storage facilities range from 11 to 48 years old. All the tanks are well maintained and are in good condition. No tanks are proposed for replacement within the 20-year planning period. The basic storage tank characteristics were listed in Table 4-2 and their approximate locations were shown in Figure 4-4A, 4-4B, and 4-4C.
▪ Walker Hill Reservoirs 1 and 2 – The Walker Hill Tanks are located at the north end of Lake Stevens Integrated and provide a combined capacity of 4 MG. These tanks supply the Lake Stevens 500 Pressure Zone by gravity and the Walker Hill 580 Pressure Zone through a BPS. The steel tanks are 70 feet in diameter and approximately 68 feet tall. Tank 1 was constructed in 1972 and Tank 2 was completed in 1990.
▪ Hillcrest Reservoirs 1 and 2 – The Hillcrest Reservoirs are located on the west side of Lake Stevens Integrated and provide the system with 6 MG of storage. The tanks supply the Lake Steven 500 Pressure Zone by gravity and the Hillcrest 580 Pressure Zone through a pump station. The steel tanks are 100 feet in diameter and 52 feet tall. Tank 1 was constructed in 1998 and Tank 2 was placed in service in 2009.
▪ Granite Falls Reservoir – The Granite Falls Reservoir is located northeast of Granite Falls near the Iron Mountain Quarry and provides the Granite Falls 726 Pressure Zone with 2.7 MG of storage. The steel tank is 120 feet in diameter and approximately 32 feet tall and was constructed in 1995.
▪ Bosworth Reservoir – The Bosworth Reservoir is located northwest of Lake Bosworth and provides the Bosworth 811 Pressure Zone with 1 MG of storage. The steel tank is 46 feet in diameter and approximately 83 feet tall and was constructed in 1996.
▪ Lake Reservoirs 1 and 2 - The Lake Roesiger Tanks are located northeast of Lake Roesiger and provide the system with 0.4 MG of combined storage. The two concrete tanks, constructed in 1992, are each 30 feet in diameter and approximately 45 feet tall.
From a planning perspective, steel tank interiors and exteriors should be re-coated every 15 years. Quarterly physical inspections are performed by operations and maintenance staff to check the seal and structural integrity. The staff also make note of the condition of the coatings to determine the specific timing for cleaning or re-coating. Ongoing cleaning and touch up painting are funded in the operations and maintenance budget. Full tank re-coats and required structural modifications are funded in the capital budget and discussed in Chapter 11.
Table 7-11, Table 7-12, and Table 7-13 show the Lake Stevens Integrated storage evaluation. It looks at the storage tank’s capacity to meet the needs of the system by breaking down the

DRAFT
20-2733 Page 7-16 2021 Water System Plan Update February 2022 Snohomish County PUD No. 1
storage volume by type. As mentioned in Table 7-1, the District nests standby and fire flow storage.
The storage analysis breaks the Lake Stevens Integrated system into three service areas to ensure that all areas of the system have sufficient storage. The service areas represent larger pressure zones that supply at least one additional pressure zone through a pressure valve or BPS. Any deficiencies in lower service areas can be supplemented by surpluses in higher service areas.
Table 7-11 shows the existing (2020) storage analysis. Table 7-12 shows the projected 10-year (2030) storage analysis.
Table 7-13 shows the projected 20-year (2040) storage analysis. Additional information on the storage analysis calculations can be found in Appendix 7-2. The tables below show a storage deficiency by 2030. This deficiency will be addressed by two proposed tanks listed in CIP projects 200 and 201, both of which are discussed in more detail in Section 7.3.4.1, below. A new tank in the Lake Roesiger service area is proposed to address the 2040 deficiency.
Table 7-11 | 2020 Storage Analysis
Description Lk Stevens Integrated
Service Area
Granite Service Area
Lk Roesiger Service Area
Total System
Usable Storage (MG)
Maximum Storage Capacity 9.69 2.62 1.37 13.69
Dead (Non-usable) Storage 1.06 0.04 0.57 1.68
Total Usable Storage 8.63 2.58 0.80 12.01
Required Storage (MG)
Operational Storage 0.88 0.59 0.23 1.70
Equalizing Storage 0.00 0.00 0.00 0.00
Standby Storage (Emergency) 7.54 0.83 0.30 8.67
Fire Flow Storage (Emergency) 0.36 0.36 0.36 1.08
Total Required Storage 8.42 1.42 0.59 10.43
Surplus Storage 0.21 1.16 0.21 1.58
Table 7-12 | 2030 Storage Analysis
Description Lk Stevens Integrated
Service Area
Granite Service Area
Lk Roesiger Service Area
Total System
Usable Storage (MG)
Maximum Storage Capacity 9.69 2.62 1.37 13.69
Dead (Non-usable) Storage 1.06 0.04 0.57 1.68
Total Usable Storage 8.63 2.58 0.80 12.01

DRAFT
20-2733 Page 7-17 2021 Water System Plan Update February 2022 Snohomish County PUD No. 1
Description Lk Stevens Integrated
Service Area
Granite Service Area
Lk Roesiger Service Area
Total System
Required Storage (MG)
Operational Storage 0.88 0.59 0.23 1.70
Equalizing Storage 0.00 0.16 0.00 -.16
Standby Storage (Emergency) 10.21 0.31 0.58 11.11
Fire Flow Storage (Emergency) 0.36 0.36 0.36 1.08
Total Required Storage 11.09 1.11 0.81 13.02
Surplus Storage -2.46 1.47 -0.01 -1.01
Table 7-13 | 2040 Storage Analysis
Description Lk Stevens Integrated
Service Area
Granite Service Area
Lk Roesiger Service Area
Total System
Usable Storage (MG)
Maximum Storage Capacity 9.69 2.62 1.37 13.69
Dead (Non-usable) Storage 1.06 0.04 0.57 1.68
Total Usable Storage 8.63 2.58 0.80 12.01
Required Storage (MG)
Operational Storage 0.88 0.59 0.23 1.70
Equalizing Storage 0.00 0.42 0.00 0.42
Standby Storage (Emergency) 10.3 1.98 0.79 13.07
Fire Flow Storage (Emergency) 0.36 0.36 0.36 1.08
Total Required Storage 11.18 3.00 1.02 15.20
Surplus Storage -2.55 -0.42 -0.22 -3.19
7.3.4.1 System Capacity Analysis
The preceding sections confirm that the Lake Stevens Integrated water facilities are sufficient for current customers and below is a plan of how the District will support projected growth for the next 20 years. DOH additionally requires that the water system physical capacity be determined by evaluating the capacity of each existing system component in terms of the number of ERUs that can be supported.
The system-wide analysis in Table 7-14 indicate that storage is the limiting factor for the Lake Stevens Integrated system. Based on the existing facilities, the system has sufficient capacity through 2030. The planned storage tanks described in Section 7.3.4.2 will provide the system sufficient capacity to support the planned growth beyond the 20-year planning period. The calculations represent the combined facilities for the entire Lake Stevens Integrated water system. A description of the analysis follows the table.
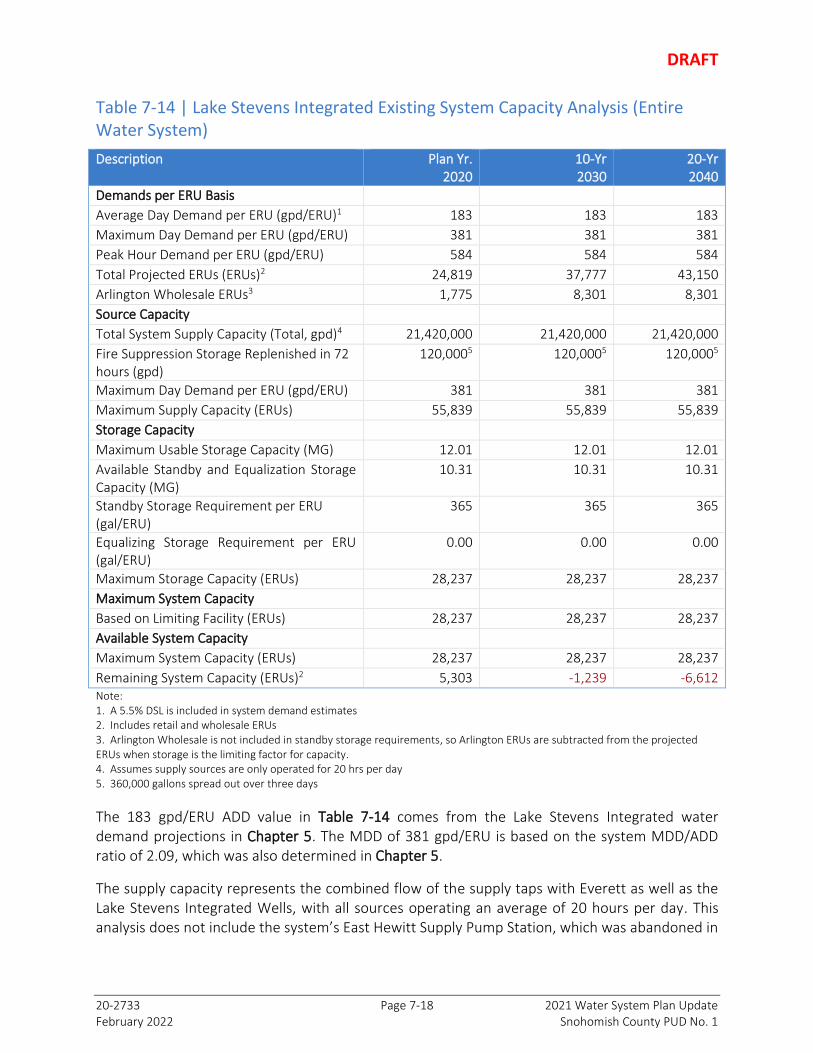
DRAFT
20-2733 Page 7-18 2021 Water System Plan Update February 2022 Snohomish County PUD No. 1
Table 7-14 | Lake Stevens Integrated Existing System Capacity Analysis (Entire Water System)
Description Plan Yr. 2020
10-Yr 2030
20-Yr 2040
Demands per ERU Basis
Average Day Demand per ERU (gpd/ERU)1 183 183 183
Maximum Day Demand per ERU (gpd/ERU) 381 381 381
Peak Hour Demand per ERU (gpd/ERU) 584 584 584
Total Projected ERUs (ERUs)2 24,819 37,777 43,150
Arlington Wholesale ERUs3 1,775 8,301 8,301
Source Capacity
Total System Supply Capacity (Total, gpd)4 21,420,000 21,420,000 21,420,000
Fire Suppression Storage Replenished in 72 hours (gpd)
120,0005 120,0005 120,0005
Maximum Day Demand per ERU (gpd/ERU) 381 381 381
Maximum Supply Capacity (ERUs) 55,839 55,839 55,839
Storage Capacity
Maximum Usable Storage Capacity (MG) 12.01 12.01 12.01
Available Standby and Equalization Storage Capacity (MG)
10.31 10.31 10.31
Standby Storage Requirement per ERU (gal/ERU)
365 365 365
Equalizing Storage Requirement per ERU (gal/ERU)
0.00 0.00 0.00
Maximum Storage Capacity (ERUs) 28,237 28,237 28,237
Maximum System Capacity
Based on Limiting Facility (ERUs) 28,237 28,237 28,237
Available System Capacity
Maximum System Capacity (ERUs) 28,237 28,237 28,237
Remaining System Capacity (ERUs)2 5,303 -1,239 -6,612 Note: 1. A 5.5% DSL is included in system demand estimates 2. Includes retail and wholesale ERUs 3. Arlington Wholesale is not included in standby storage requirements, so Arlington ERUs are subtracted from the projected ERUs when storage is the limiting factor for capacity. 4. Assumes supply sources are only operated for 20 hrs per day 5. 360,000 gallons spread out over three days
The 183 gpd/ERU ADD value in Table 7-14 comes from the Lake Stevens Integrated water demand projections in Chapter 5. The MDD of 381 gpd/ERU is based on the system MDD/ADD ratio of 2.09, which was also determined in Chapter 5.
The supply capacity represents the combined flow of the supply taps with Everett as well as the Lake Stevens Integrated Wells, with all sources operating an average of 20 hours per day. This analysis does not include the system’s East Hewitt Supply Pump Station, which was abandoned in

DRAFT
20-2733 Page 7-19 2021 Water System Plan Update February 2022 Snohomish County PUD No. 1
late 2020. This analysis shows that supply is not a limiting factor for the Lake Stevens Integrated system.
In relation to the supply capacity, it is also important to note that Everett determined that their water rights should be sufficient for regional growth through at least 2036. There is no contractual limit on the amount of water that the District can purchase from Everett.
This analysis reviews the available equalizing and standby storage (total storage minus dead storage and operational storage) for the Hillcrest, Walker Hill, Granite Falls, Bosworth, and Lake Roesiger Tanks. The storage requirement of 365 gpd/ERU is two times the ADD plus current equalizing storage requirements. The total number of ERUs that the system’s storage capacity can accommodate has increased since the 2011 WSP. This increase is due to the small reduction in water usage per ERU in the Lake Stevens Integrated system. As water usage per ERU decreases, the number of ERUs a system can support increases.
The existing number of ERUs in Table 7-14 includes the ERUs assigned for leakage and non-revenue water uses. Because the District does not supply storage for Arlington, the ERU equivalent for the Arlington supply is included in the source capacity evaluation but excluded from the storage evaluation.
7.3.4.2 Proposed Storage Improvements
Following is a description of the three proposed tanks that will add storage to the Lake Stevens Integrated system. More information about these proposed improvements is included in Chapter 11.
▪ North Lake Stevens Tank: This project replaces the Getchell Tank site mentioned in the 2011 WSP. The new site, which was purchased by the District in 2015, has a site elevation of approximately 460 feet instead of 405 feet. This change in elevation allows the tank(s) to be approximately 40 feet tall (overflow at 500 feet elevation), instead of 100 feet, and eliminates the need for dead storage. The tank diameter is assumed to be 129 feet in this analysis, for a total volume of 3.9 MG.
▪ Burn Road Tank: In 2004 the District purchased a site for future storage at the highest elevation along Burn Road, in the Granite Falls 726 Pressure Zone. The site elevation is approximately 600 feet, so tanks will be about 126 feet tall for an overflow at 726 feet elevation. For planning purposes, future tanks are assumed to be 70 feet in diameter, with a total volume of 3.6 MG per tank, of which about 2.3 MG would be available for equalizing and standby storage. Although the zone only has a small estimated deficiency by 2030, the timing for construction and sizing of this tank is primarily intended to give the District operational flexibility and redundancy to the one existing Granite Falls 726 storage tank, which is in need of a complete painting re-coat. The site is large enough to accommodate several tanks in the future. The Burn Road Tank will feature a mixing capability to manage its dead storage.

DRAFT
20-2733 Page 7-20 2021 Water System Plan Update February 2022 Snohomish County PUD No. 1
▪ Lake Roesiger Tank: This project will address the 2040 storage deficiency in the Lake Roesiger service area. The proposed tank will be sized similar to the existing 0.2 MG tanks and the project serves as a placeholder for replacing the tanks with a larger tank if they are nearing the end of their life in 2040.
7.4 Storm Lake Ridge Facilities Analysis
Storm Lake Ridge was originally designed to support up to 220 single family residences, but a re-evaluation of water use after the design showed it could support more users. It currently serves 257 homes. Even though the Storm Lake Ridge system has surpassed its original design capacity, it continues to have sufficient capacity to support its projected growth, as shown in the analyses below. This additional capacity is primarily due to a reduction in water usage per household. As noted in Table 7-10, the required fire flow for the Storm Lake Ridge water system is 1,000 gpm for 2 hours.
Fire flow was not a requirement at the time of the Storm Lake Ridge system design; therefore, some sections of this system, primarily the boosted pressure zone, do not have hydrants. However, the majority of the system does provide fire protection.
7.4.1 Water Supply Facility Evaluation for the Storm Lake Ridge System
This section evaluates Storm Lake Ridge’s supply capacity based on the requirements summarized in Table 7-1. The Storm Lake Ridge system is supplied by purchased water from Everett that is pumped into the system. The Storm Lake Ridge supply station contains two pumps, each rated for 250 gpm at 260-foot of head.
Table 7-15 shows the Storm Lake Ridge supply evaluation. It reviews the system’s ability to both provide MDD while replenishing fire suppression storage in 72 hours as well as its ability to meet ADD with the largest source out of service. As the table shows, the system has sufficient supply to meet the projected demands.

DRAFT
20-2733 Page 7-21 2021 Water System Plan Update February 2022 Snohomish County PUD No. 1
Table 7-15 | Storm Lake Ridge Supply Evaluation
Description Plan Yr 2020
10-Yr 2030
20-Yr 2040
Required Supply (gpm)
Fire Suppression Storage Replenished in 72 hours 28 28 28
Maximum Day Demand 109 125 141
Average Day Demand 37 42 48
Available Supply (gpm)
Largest Pump (QL) 250 250 250
Total Pumping Capacity (Qs) 500 500 500
Reliable Supply Capacity (ADD with largest pump out of service)
Surplus / (Deficit) of Supply (gpm) 213 208 202
Firm Capacity (MDD + replenish FSS in 72-hours)
Surplus / (Deficit) of Supply (gpm) 363 347 331
7.4.2 Boosted Pressure Zone within the Storm Lake Ridge Water System
The Storm Lake Ridge Booster Station is located at the reservoir site. It was re-built in 2001 to serve approximately 20 homes off 72nd Place SE at a grade of 860 feet. The station is a wood-framed, metal-roofed structure that houses a packaged VFD booster pump system with a capacity of approximately 100 gpm, a master meter, and the electrical controls. There is no plan to serve additional homes beyond the approved capacity of this pump station. Fire flow is not provided to this zone.
The station is currently operating at a set point correlating to 850-foot HGL, or at net head of 132-foot (57 psi) at the station elevation of 718-foot. This provides a static pressure ranging between 55 and 70 psi at service meters in the zone.
As was indicated in Table 4-3, the station contains three Grundfos pumps, each rated for 22 gpm at 143-foot. Under the current operating conditions, this allows 10 feet of head loss within the pump station.
Table 7-16 shows the BPS’s supply evaluation. It looks at the capacity to provide MDD as well as its ability to meet PHD, both with the largest pump out of service. As the table shows, the system has sufficient supply to meet the projected demands through 2040.

DRAFT
20-2733 Page 7-22 2021 Water System Plan Update February 2022 Snohomish County PUD No. 1
Table 7-16 | Boosted Pressure Zone within the Storm Lake Ridge Supply Analysis
Description Plan Yr 2020
10-Yr 2030
20-Yr 2040
Required Supply (gpm)
Max Fire Flow 0 0 0
Maximum Day Demand 5 6 7
Peak Hour Demand 13 15 16
Available Supply (gpm)
Largest Pump (QL) 22 22 22
Total Pumping Capacity (Qs) 66 66 66
Firm Supply Capacity (no storage) (PHD with largest pump out of service)
Surplus / (Deficit) of Supply (gpm) 31 29 28
Reliable Capacity (no storage) (MDD + Fire Flow with largest pump out of service)
Surplus / (Deficit) of Supply (gpm) 39 38 37
7.4.3 Distribution System Evaluation for the Storm Lake Ridge System
The Storm Lake Ridge System does not provide fire service to the boosted zone, but for the main Storm Lake Ridge Zone there are existing fire flow deficiencies as shown in Figure 7-1. The deficiencies are the result of long, dead-end pipes that increase in elevation at their ends resulting in low pressures when conveying fire flows. Improvements to address the deficiencies are discussed in Chapter 11.
The District has not experienced problems with the pipes installed in 1987, and they are not planned for replacement. The very low leakage in recent years (see Table 5-3) is further evidence that this pipe is holding up. If leaks and breaks begin to occur in the future, the District can add this pipe to the replacement program.
7.4.4 Storage Evaluation for the Storm Lake Ridge Water System
The Storm Lake Ridge Tank is located near 72nd Place SE and provides the system with 0.23 MG of storage. The concrete tank, constructed in 2000, is 26 feet in diameter and approximately 40 feet tall. The tank was sized in conjunction with the source and distribution facilities to support 220 residences and to provide a minimum of 500 gpm of fire flow.
Table 7-17 shows the Storm Lake Ridge storage evaluation. The analysis shows the storage tank’s capacity is adequate to meet the needs of the system by breaking down the storage volume by component. As mentioned previously, standby and fire flow storage are nested together into emergency storage. As the table shows, the system has sufficient storage to meet the projected demands through 2040.

DRAFT
20-2733 Page 7-23 2021 Water System Plan Update February 2022 Snohomish County PUD No. 1
Table 7-17 | Storm Lake Ridge Storage Analysis
Description Plan Yr 2020
10-Yr 2030
20-Yr 2040
Usable Storage (MG)
Maximum Storage Capacity 0.23 0.23 0.23
Dead (Non-usable) Storage 0.005 0.005 0.005
Total Usable Storage 0.23 0.23 0.23
Required Storage (MG)
Operational Storage 0.06 0.06 0.06
Equalizing Storage 0.00 0.00 0.00
Standby Storage (Emergency) 0.11 0.12 0.14
Fire Flow Storage (Emergency) 0.12 0.12 0.12
Total Required Storage 0.18 0.18 0.20
Surplus Storage 0.05 0.05 0.03
7.4.5 Remaining Physical Capacity in Existing Storm Lake Ridge Facilities
Table 7-18 presents the maximum capacity of the Storm Lake Ridge supply and storage facilities. Storage is clearly the most limiting factor, even when only one supply pump is considered in the analysis. This analysis shows that the system can support additional capacity. Because the system has surpassed the DOH approved limit of 220 ERUs, the District will use this system capacity analysis to ask DOH to increase the approved capacity.
Table 7-18 | Storm Lake Existing System Capacity Analysis
Description Plan Yr 2020
10-Yr 2030
20-Yr 2040
Demands (per ERU Basis)
Average Day Demand per ERU (gpd/ERU)1 202 202 202
Maximum Day Demand per ERU (gpd/ERU) 597 597 597
Peak Hour Demand per ERU (gpd/ERU) 1,456 1,456 1,456
Total Projected ERUs (ERUs) 264 303 340
Source Capacity
Total System Supply Capacity (Total, gpd) 720,000 720,000 720,000
Fire Suppression Storage Replenished in 72 hours (gpd)2
40,000 40,000 40,000
Maximum Day Demand per ERU (gpd/ERU) 597 597 597
Maximum Supply Capacity (ERUs) 1,139 1,139 1,139

DRAFT
20-2733 Page 7-24 2021 Water System Plan Update February 2022 Snohomish County PUD No. 1
Description Plan Yr 2020
10-Yr 2030
20-Yr 2040
Storage Capacity
Maximum Usable Storage Capacity (MG) 0.23 0.23 0.23
Available Standby and Equalization Storage Capacity (MG)
0.17 0.17 0.17
Standby Storage Requirement per ERU (gal/ERU) 403.07 403.07 403.07
Equalizing Storage Requirement per ERU (gal/ERU) 0.00 0.00 0.00
Maximum Storage Capacity (ERUs) 420 420 420
Maximum System Capacity
Based on Limiting Facility (ERUs) 420 420 420
Available System Capacity
Maximum System Capacity (ERUs) 420 420 420
Remaining System Capacity (ERUs) 156 117 80 Note: 1. A 1.8% DSL is included in system demand estimates 2. Fire storage volume is averaged over three days
7.5 Creswell Facilities Analysis
Creswell is a simple water system, with a single tap from the Everett 2/3 Lines and a 12-inch diameter water main forming the backbone of the system. As noted in Table 7-10, the fire flow requirement for the Creswell water system is 1,000 gpm for two hours.
7.5.1 Water Supply Facility Evaluation for the Creswell Water System
This section evaluates Creswell’s supply capacity based on the requirements summarized in Table 7-1. The Creswell system is supplied by purchased water from Everett. The capacity of the 8-inch diameter tap on the Everett 3-Line is about 1,500 gpm.
Table 7-19 shows the system’s supply evaluation. It reviews the system’s ability to both provide MDD while replenishing fire suppression storage in 72 hours as well as its ability to meet ADD with the largest source out of service. As the table shows, the system has sufficient supply to meet the projected demands. As noted below, the Creswell system will be connected to the Lake Stevens Integrated system by 2040, so Creswell demand is included in the Lake Stevens Integrated Analyses also.
Table 7-19 | Creswell System Supply Evaluation
Description Plan Yr 2020
10-Yr 2030
20-Yr 2040
Required Supply (gpm)
Fire Suppression Storage Replenished in 72 hours 28 28 28
Maximum Day Demand 13 15 17
Peak Hour Demand 58 67 75

DRAFT
20-2733 Page 7-25 2021 Water System Plan Update February 2022 Snohomish County PUD No. 1
Description Plan Yr 2020
10-Yr 2030
20-Yr 2040
Available Supply (gpm)
Butterfield Tap 1,500 1,500 1,500
Firm Supply Capacity (no storage) (PHD)
Surplus / (Deficit) of Supply (gpm) 1,442 1,433 1,425
Reliable Capacity (no storage) (MDD + Fire Flow with largest pump out of service)
Surplus / (Deficit) of Supply (gpm) 1,459 1,457 1,455
Therefore, the supply tap is capable of supporting the 1,000-gpm design fire flow plus MDD flow, as well as supporting the PHD. For reliability, this supply tap also has a backup connection on the Everett 2-Line.
7.5.2 Distribution System Evaluation for the Creswell Water System
There are no existing or future fire flow or pressure deficiencies in the Creswell system. The HGL of the Creswell Pressure Zone is approximately 525 feet, based on pressure at the Everett transmission line tap location.
The proposed future water main that will integrate the Creswell water system with the Lake Stevens Integrated System will connect to the 811 Lake Roesiger Pressure Zone and the Storm Lake Ridge 760 Pressure Zone through a PRV. At a maximum elevation of 590 feet and a minimum elevation of 260 feet, the pressures in the main are predicted to range between 74 and 216 psi at an HGL of 760 feet. Though the function of the main is primarily for water transmission, individual PRVs will be used at any service connections where pressure exceeds 80 psi, in accordance with the Uniform Plumbing Code. Pressure will be reduced at the connection to the Creswell system with a new PRV.
The hydraulic model was used to evaluate headloss in the transmission main during a fire in the Creswell system (1,000 gpm minimum required). The model predicted a total headloss of approximately 34 feet over the 12,500-foot transmission main, which allows for plenty of pressure at the upstream end of the proposed Creswell PRV. Pipe velocities during fire flow did not exceed the District standard of 8 feet per second.
7.5.3 Storage Evaluation for the Creswell Water System
Creswell is not currently connected to a system with available storage; however, the Improvement Plan as shown in Chapter 11 shows the District’s intent to connect the system to both the Storm Lake Ridge and LS Integrated system. The DOH defines standby storage as the volume of stored water available for use during a loss of source capacity, power, or similar short-term emergency. Standby storage would mainly be used when Everett’s filter plant is out of commission. This is an extremely rare circumstance because of redundancies built into the filter plant. Loss of power is not a concern for the Creswell system because it is served by gravity flow and will be served by the Lake Stevens Integrated storage tanks once it is connected.

DRAFT
20-2733 Page 7-26 2021 Water System Plan Update February 2022 Snohomish County PUD No. 1
The DOH Design Manual recommends standby storage to cover two average days of water demand for systems supplied by a single water source. The WAC 246-290-420(5) allows a lower standard if acceptable by the customers. Customer expectations can be established by a majority vote of the water system’s governing body.
Standby storage will become available when Creswell merges with the Storm Lake Ridge and Lake Stevens Integrated system as shown in Chapter 11.
By adopting this WSP through its standard public processes, the District’s Commission will satisfy the requirements of WAC 246-290-420(5) to confirm that it is acceptable for customers to temporarily forego standby storage in the Creswell system until it merges with the other water systems.
7.5.4 Remaining Physical Capacity in Existing Creswell Facilities
Table 7-20 shows that the Creswell supply facilities should be sufficient for up to 1,865 ERUs. This is more than enough capacity to support growth until the Creswell system merges with the adjacent water systems.
Table 7-20 | Creswell Existing System Capacity Analysis
Description Plan Yr 2020
10-Yr 2030
20-Yr 2040
Demands per ERU Basis
Average Day Demand per ERU (gpd/ERU)1 247 247 247
Maximum Day Demand per ERU (gpd/ERU) 825 825 825
Peak Hour Demand per ERU (gpd/ERU) 3,580 3,580 3,580
Total Projected ERUs (ERUs) 23 27 30
Source Capacity
Total System Supply Capacity (Total, gpd) 2,160,000 2,160,000 2,160,000
Fire Suppression Storage Replenished in 72 hours (gpd)2 40,000 40,000 40,000
Maximum Day Demand per ERU (gpd/ERU) 825 825 825
Maximum Supply Capacity (ERUs) 2,570 2,570 2,570
Storage Capacity N/A
Maximum System Capacity
Based on Limiting Facility (ERUs) 2,570 2,570 2,570
Available System Capacity
Maximum System Capacity (ERUs) 2,570 2,570 2,570
Remaining System Capacity (ERUs) 2,547 2,544 2,540 Note: 1. A 1.5% DSL is included in system demand estimates 2. Fire storage volume is averaged over three days

DRAFT
20-2733 Page 7-27 2021 Water System Plan Update February 2022 Snohomish County PUD No. 1
7.6 May Creek Facilities Analysis
May Creek was the first satellite water system designed and built by the District after establishing the Satellite Water System Program in 1980. It replaced a system originally constructed to serve the four divisions of May Creek Mountain View Tracts in the 1960s. May Creek is approved by DOH to serve an “unspecified” number of connections, which means the system can grow up to the number of connections justified by this WSP. As noted in Table 7-10, the minimum fire flow requirement for the May Creek water system is 500 gpm for 1 hour.
7.6.1 Water Supply Facility Evaluation for the May Creek System
This section evaluates May Creek’s supply capacity based on the requirements summarized in Table 7-1. May Creek is supplied by two wells. Well 1 well drilled in 1983 was intended to produce 300 gpm. Well 2 was drilled in 1994 to perfect the May Creek water right and is intended to produce 500 gpm. The wells are located at the same site and do not operate simultaneously.
In the May Creek system, the two wells supply the system by a control sequence so that the two wells alternate. Recorded flow indicates that Well 1 is delivering 277 gpm and Well 2 is delivering about 500 gpm when pumping through the 6-inch diameter fill pipe to the tanks.
Table 7-21 shows the system’s supply evaluation. It reviews the system’s ability to both provide MDD while replenishing fire suppression storage in 72 hours as well as its ability to meet ADD with the largest source out of service. As the table shows, the system has sufficient supply to meet the projected demands. An on-site propane powered generator is available to operate the wells during power outages.
Table 7-21 | May Creek System Supply Evaluation
Description Plan Yr 2020
10-Yr 2030
20-Yr 2040
Required Supply (gpm)
Fire Suppression Storage Replenished in 72 hours
7 7 7
Maximum Day Demand 118 143 174
Available Supply (gpm)
Total Pumping Capacity (Qs) 500 500 500
Total Water Right(Qi) 500 500 500
20-hr Pumping Capacity 417 417 417
Firm Supply Capacity (Provide the MDD in a period of 20hrs or less of pumping.)
Surplus / (Deficit) of Supply (gpm) 299 273 243
Reliable Capacity (MDD + replenish FSS in 72-hours)
Surplus / (Deficit) of Supply (gpm) 375 350 319

DRAFT
20-2733 Page 7-28 2021 Water System Plan Update February 2022 Snohomish County PUD No. 1
7.6.2 Distribution System Evaluation for the May Creek System
The existing May Creek Water System is comprised of a single pressure zone with a hydraulic grade level of 392 feet, determined by the overflow level of the tanks. The highest ground elevation in the May Creek RSA is 300 feet, which corresponds to a static pressure of 40 psi. The boundary of the “retail service area” was outlined in Figure 2-2. The highest currently active water service is at approximately 270 feet elevation, with a static pressure of about 50 psi. The lowest elevation in the service area is about 205 feet, so the high end of the pressure range is about 80 psi. There are no existing or future fire flow or low-pressure deficiencies within the existing service area.
A BPS will be needed to expand the May Creek system above 300 feet into the eastern portion of the future service area. If customer growth occurs above this elevation, the developer will be responsible for the cost to design and build the booster station.
7.6.3 Storage Evaluation for the May Creek System
The May Creek tanks are located east of the plat of May Creek Tracts and provide the system with 0.35 MG of combined storage. The two concrete tanks, constructed in 1984, are 26 feet in diameter and approximately 45 feet tall with a base elevation at 347 feet.
Table 7-22 shows May Creek storage evaluation, which assesses the storage tank’s capacity to meet the needs of the system by breaking down the storage volume by component. As mentioned previously, standby and fire flow storage are nested together into emergency storage. As the table shows, the system has sufficient storage to meet the projected demands through 2040.
Table 7-22 | May Creek Storage Analysis
Description Plan Yr 2020
10-Yr 2030
20-Yr 2040
Usable Storage (MG)
Maximum Storage Capacity 0.36 0.36 0.36
Dead (Non-usable) Storage 0.004 0.004 0.004
Total Usable Storage 0.35 0.35 0.35
Required Storage (MG)
Operational Storage 0.04 0.04 0.04
Equalizing Storage 0.00 0.00 0.00
Standby Storage (Emergency) 0.18 0.21 0.26
Fire Flow Storage (Emergency) 0.03 0.03 0.03
Total Required Storage 0.22 0.25 0.30
Surplus Storage 0.14 0.10 0.05

DRAFT
20-2733 Page 7-29 2021 Water System Plan Update February 2022 Snohomish County PUD No. 1
7.6.4 Remaining Physical Capacity in Existing May Creek Facilities
Table 7-23 shows that the existing May Creek facilities may be sufficient to serve about two times the current number of customers. Storage is currently the most limiting factor. The remaining capacity in the existing facilities appears to be sufficient for build-out of the future May Creek service area in accordance with current zoning.
The capacity analysis for the May Creek system includes a reference to the District’s 1999 agreement with the Tulalip tribe regarding groundwater withdrawal (see Section 8.3). Use of the entire May Creek water right for domestic consumption has been constrained as a condition of the Tribes’ dismissal of its objection to a proposed change application. The agreement stipulates that a portion of the groundwater pumped shall be returned to May Creek (as mitigation for groundwater withdrawal impact) when the peak daily groundwater withdrawal rate exceeds 277 gpm within any calendar day (398,880 gpd). The current average daily withdrawal rate is 60 gpm, and the estimated MDD for 2040 is 174 gpm. The system has source capacity to meet anticipated growth and demand without mitigation requirements being triggered through 2040.
Table 7-23 | May Creek Existing System Capacity Analysis
Description Plan Yr 2020
10-Yr 2030
20-Yr 2040
Demands per ERU Basis
Average Day Demand per ERU (gpd/ERU)1 169 169 169
Maximum Day Demand per ERU (gpd/ERU) 325 325 325
Peak Hour Demand per ERU (gpd/ERU) 660 660 660
Total Projected ERUs (ERUs) 523 634 770
Water Right - Instantaneous Capacity
Limiting Supply Rate (based on Qi) (gal/day) 720,000 720,000 720,000
Mitigation Trigger for MDD (gpd) 398,880 398,880 398,880
Maximum Day Demand per ERU (gpd/ERU) 325 325 325
Maximum Supply Capacity (ERU) 2,213 2,213 2,213
Maximum Supply Capacity without Mitigation (ERU) 1,226 1,226 1,226
Water Right - Annual Capacity
Limiting Supply Rate (based on Qa) (gal/day) 285,231 285,231 285,231
Average Day Demand per ERU (gpd/ERU) 169 169 169
Maximum Supply Capacity (ERU) 1,683 1,683 1,683
Source Capacity
Total System Supply Capacity (Total, gpd, 20hr pumping)
932,400 932,400 932,400
Fire Suppression Storage Replenished in 72 hours (gpd)2
10,000 10,000 10,000
Maximum Day Demand per ERU (gpd/ERU) 325 325 325
Maximum Supply Capacity (ERUs) 2,835 2,835 2,835

DRAFT
20-2733 Page 7-30 2021 Water System Plan Update February 2022 Snohomish County PUD No. 1
Description Plan Yr 2020
10-Yr 2030
20-Yr 2040
Storage Capacity
Maximum Usable Storage Capacity (MG) 0.35 0.35 0.35
Available Standby and Equalization Storage Capacity (MG)
0.31 0.31 0.31
Standby Storage Requirement per ERU (gal/ERU) 339 339 339
Equalizing Storage Requirement per ERU (gal/ERU) 0.00 0.00 0.00
Maximum Storage Capacity (ERUs) 926 926 926
Maximum System Capacity
Based on Limiting Facility (ERUs) 926 926 926
Available System Capacity
Maximum System Capacity (ERUs) 926 926 926
Remaining System Capacity (ERUs) 403 291 156 Note: 1. A 10% DSL is included in system demand estimates 2. Fire storage volume is averaged over three days
7.7 Skylite Water System Facilities Analysis
The District accepted ownership of the Skylite system from an association of Skylite Tracts property owners in 1992 (see Resolution 3756). Skylite was constructed in the 1960s and approved for 167 connections, based on consideration that the lots would be primarily recreational in nature (e.g., vacation homes). The system consisted of a single well containing two submersible pumps, a single 1,000-gallon pressure tank, and a distribution system comprised of approximately 9,700 feet of 4-inch and 2-inch diameter Class 160 PVC. Design shortcomings became apparent as recreational uses transitioned into residential occupancy.
The District’s first improvements to the system included locating all valves and returning them to operational condition, replacing the service lines, and installing meters. The District developed a spare parts inventory to facilitate emergency repairs on the distribution system with minimal interruption. To further improve reliability, the District moved the pump house electrical service to direct service from Mann Road, because power lines on Mann Road were often energized when lines in the tract were out due to limb or tree damage. For the next step, the District purchased and installed a propane-powered emergency generator with an automatic transfer feature.
The District built a 106,000-gallon concrete storage tank in 1997 and completed a booster pump system in 1999 to deliver water from the tank into the system. One fire hydrant is available for the local fire department to fill tanker trucks directly from the tank. These improvements included sprayers to aerate the water as it enters the tank. Aeration strips naturally occurring carbon dioxide and raises the pH to reduce the corrosiveness of the water toward copper plumbing. The aeration treatment successfully brought Skylite into compliance with the Lead and Copper Rule. The District subsequently began continuous chlorination in 2002.

DRAFT
20-2733 Page 7-31 2021 Water System Plan Update February 2022 Snohomish County PUD No. 1
In 2007, the District further modernized the Skylite Pump House. The booster pumps were replaced by VFD pumps, which enabled the removal of the large pressure tanks. This freed up space to replace the 11-kilowatt (kw) generator with a 47-kw generator and to move the chlorine equipment into a dedicated chemical feed room. The 2007 improvements also integrated Skylite with the District’s SCADA control system, which has been a significant operational advance.
As noted in Table 7-10, there is no minimum fire flow requirement for the Skylite system.
7.7.1 Water Supply Facility Evaluation for the Skylite System
This section evaluates Skylite’s supply capacity based on the requirements summarized in Table 7-1. The original well pumps were installed by the Skylite Tracts Association in 1982 and 1986, and the design intended each pump to provide 60 gpm at 150-foot TDH. In 2011 the older of the two pumps failed and the District replaced it with a new, more efficient pump and motor. The replacement pump provides approximately 55 gpm and the remaining original 1986 pump provides approximately 45 gpm. As part of an effort to purchase and have available replacement pumps, motors, and wire for each of its smaller standalone water systems, the District has ordered a new pump and motor capable of supplying 60 gpm consistent with the original design and maximized based on concerns of the well’s current capacity. As part of the process of replacing the 1986 era pump and motor, the District intends to look at the feasibility of running both new pumps together to achieve the 100 gpm water right during peak day system demands and in the process assess the potential impact to well drawdown and overall well capacity.
Skylite’s wells pump directly into its storage tank, which is then pumped through the system’s BPS to its customers. The well pump needs to provide sufficient supply to allow tanker trucks to fill directly from the tank for fire suppression.
Table 7-24 shows the system’s supply evaluation. It reviews the system’s ability to both provide MDD while replenishing fire suppression storage in 72 hours as well as its ability to meet ADD with the largest source out of service. As the table shows, the system has sufficient supply to meet the projected demands.
Table 7-24 | Skylite System Supply Evaluation
Description Plan Yr 2020
10-Yr 2030
20-Yr 2040
Required Supply (gpm)
Fire Suppression Storage Replenished in 72 hours 7 7 7
Maximum Day Demand 33 33 34
Available Supply (gpm)
Total Pumping Capacity (Qs) 100 100 100
Total Water Right (Qi) 100 100 100
20-hr Pumping Capacity 83 83 83
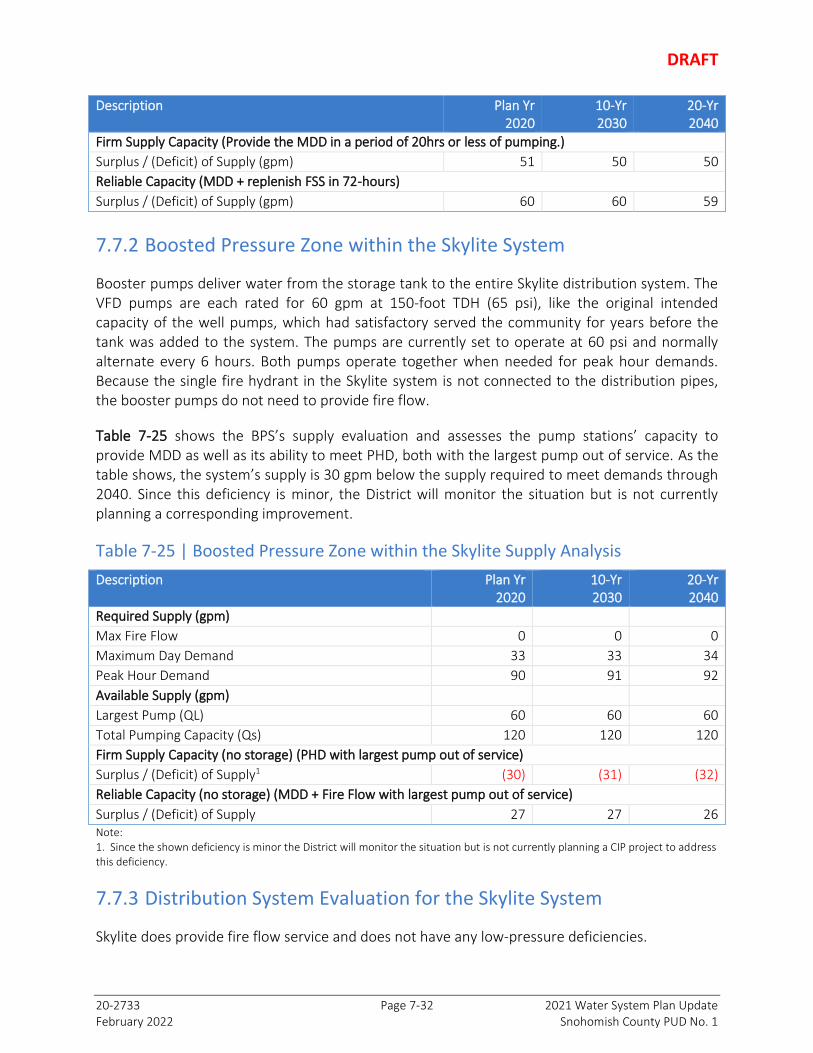
DRAFT
20-2733 Page 7-32 2021 Water System Plan Update February 2022 Snohomish County PUD No. 1
Description Plan Yr 2020
10-Yr 2030
20-Yr 2040
Firm Supply Capacity (Provide the MDD in a period of 20hrs or less of pumping.)
Surplus / (Deficit) of Supply (gpm) 51 50 50
Reliable Capacity (MDD + replenish FSS in 72-hours)
Surplus / (Deficit) of Supply (gpm) 60 60 59
7.7.2 Boosted Pressure Zone within the Skylite System
Booster pumps deliver water from the storage tank to the entire Skylite distribution system. The VFD pumps are each rated for 60 gpm at 150-foot TDH (65 psi), like the original intended capacity of the well pumps, which had satisfactory served the community for years before the tank was added to the system. The pumps are currently set to operate at 60 psi and normally alternate every 6 hours. Both pumps operate together when needed for peak hour demands. Because the single fire hydrant in the Skylite system is not connected to the distribution pipes, the booster pumps do not need to provide fire flow.
Table 7-25 shows the BPS’s supply evaluation and assesses the pump stations’ capacity to provide MDD as well as its ability to meet PHD, both with the largest pump out of service. As the table shows, the system’s supply is 30 gpm below the supply required to meet demands through 2040. Since this deficiency is minor, the District will monitor the situation but is not currently planning a corresponding improvement.
Table 7-25 | Boosted Pressure Zone within the Skylite Supply Analysis
Description Plan Yr 2020
10-Yr 2030
20-Yr 2040
Required Supply (gpm)
Max Fire Flow 0 0 0
Maximum Day Demand 33 33 34
Peak Hour Demand 90 91 92
Available Supply (gpm)
Largest Pump (QL) 60 60 60
Total Pumping Capacity (Qs) 120 120 120
Firm Supply Capacity (no storage) (PHD with largest pump out of service)
Surplus / (Deficit) of Supply1 (30) (31) (32)
Reliable Capacity (no storage) (MDD + Fire Flow with largest pump out of service)
Surplus / (Deficit) of Supply 27 27 26 Note: 1. Since the shown deficiency is minor the District will monitor the situation but is not currently planning a CIP project to address this deficiency.
7.7.3 Distribution System Evaluation for the Skylite System
Skylite does provide fire flow service and does not have any low-pressure deficiencies.

DRAFT
20-2733 Page 7-33 2021 Water System Plan Update February 2022 Snohomish County PUD No. 1
7.7.4 Storage Evaluation for the Skylite System
The Skylite Reservoir provides the system with 0.1 MG of storage as well as aerating the well water to reduce the levels of carbon dioxide in the ground water as a corrosion control measure. The concrete tank is 30 feet in diameter and approximately 20 feet tall and was constructed in 1997.
Table 7-26 shows Skylite storage evaluation which assesses the storage tank’s capacity to meet the needs of the system by breaking down the storage volume by type. As mentioned previously, standby and fire flow storage are nested together into emergency storage. For this system, fire flow is pulled directly from the tank to a tanker truck since the single fire hydrant in the Skylite system is not connected to the distribution pipes. As the table shows, the system has sufficient storage to meet the projected demands through 2040.
Table 7-26 | Skylite Storage Analysis
Description Plan Yr 2020
10-Yr 2030
20-Yr 2040
Usable Storage (MG)
Maximum Storage Capacity 0.106 0.106 0.106
Dead (Non-usable) Storage 0.003 0.003 0.003
Total Usable Storage 0.103 0.103 0.103
Required Storage (MG) Operational Storage 0.016 0.016 0.016
Equalizing Storage 0.000 0.000 0.000
Standby Storage (Emergency) 0.051 0.052 0.053
Fire Flow Storage (Emergency) 0.030 0.030 0.030
Total Required Storage 0.067 0.068 0.069
Surplus Storage 0.036 0.035 0.035
7.7.5 Remaining Physical Capacity in Existing Skylite Facilities
Table 7-27 evaluates the Skylite water rights and existing facilities to determine the maximum number of ERUs that can be served. As can be seen in the table, the system’s limiting factor is its annual water right withdrawal rate. Based on this projected growth, the system will be at capacity by 2040, and will not be able to support additional growth.

DRAFT
20-2733 Page 7-34 2021 Water System Plan Update February 2022 Snohomish County PUD No. 1
Table 7-27 | Skylite Existing System Capacity Analysis
Description Plan Yr 2020
10-Yr 2030
20-Yr 2040
Demands per ERU Basis
Average Day Demand per ERU (gpd/ERU)1 165 165 165
Maximum Day Demand per ERU (gpd/ERU) 303 303 303
Peak Hour Demand per ERU (gpd/ERU) 833 833 833
Total Projected ERUs (ERUs) 155 158 160
Water Right - Instantaneous Capacity
Limiting Supply Rate (based on Qi) (gal/day) 144,000 144,000 144,000
Maximum Day Demand per ERU (gpd/ERU) 303 303 303
Maximum Supply Capacity (ERU) 476 476 476
Water Right - Annual Capacity
Limiting Supply Rate (based on Qa) (gal/day) 26,514 26,514 26,514
Average Day Demand per ERU (gpd/ERU) 165 165 165
Maximum Supply Capacity (ERU) 161 161 161
Source Capacity
Total System Supply Capacity (Total, gpd, 20hr pumping) 120,000 120,000 120,000
Fire Suppression Storage Replenished in 72 hours (gpd)2 0 0 0
Maximum Day Demand per ERU (gpd/ERU) 303 303 303
Maximum Supply Capacity (ERUs) 397 397 397
Storage Capacity
Maximum Usable Storage Capacity (MG) 0.10 0.10 0.10
Available Standby and Equalization Storage Capacity (MG) 0.09 0.09 0.09
Standby Storage Requirement per ERU (gal/ERU) 329.29 329.29 329.29
Equalizing Storage Requirement per ERU (gal/ERU) 0.00 0.00 0.00
Maximum Storage Capacity (ERUs) 265 265 265
Maximum System Capacity
Based on Limiting Facility (ERUs) 161 161 161
Available System Capacity
Maximum System Capacity (ERUs) 161 161 161
Remaining System Capacity (ERUs) 6 3 1 Note: 1. A 9.1% DSL is included in system demand estimates 2. Fire storage volume is averaged over three days
7.8 Sunday Lake Water System Facilities Analysis
7.8.1 Water Supply Facility Evaluation for the Sunday Lake System
This section evaluates Sunday Lake’s supply capacity based on the requirements summarized in Table 7-1. Sunday Lake is served by a single well with a pump that can operate at 130 gpm to match the water rights limit.

DRAFT
20-2733 Page 7-35 2021 Water System Plan Update February 2022 Snohomish County PUD No. 1
Table 7-28 shows the system’s supply evaluation. It reviews the system’s ability to both provide MDD while replenishing fire suppression storage in 72 hours as well as its ability to meet ADD with the largest source out of service. As the table shows, the system has sufficient supply to meet the projected demands. As noted in Table 7-10, the minimum fire flow requirement for the Sunday Lake water system is 500 gpm for 1 hour.
Table 7-28 | Sunday Lake System Supply Evaluation
Description Plan Yr 2020
10-Yr 2030
20-Yr 2040
Required Supply (gpm)
Fire Suppression Storage Replenished in 72 hours 7 7 7
Maximum Day Demand 74 90 108
Available Supply (gpm)
Total Pumping Capacity (Qs) 130 130 130
Total Water Right (Qi) 130 130 130
20-hr Pumping Capacity 108 108 108
Firm Supply Capacity (Provide the MDD in a period of 20hrs or less of pumping.)
Surplus / (Deficit) of Supply (gpm) 34 18 (0)1
Reliable Capacity (MDD + replenish FSS in 72-hours)
Surplus / (Deficit) of Supply (gpm) 49 33 15 Note: 1. Note that the ability to provide MDD with 20 hours or less of pumping is a recommendation, not a requirement. Since the shown deficiency is minor, the District will monitor the situation and is not currently planning a CIP project to address this finding.
7.8.2 Boosted Pressure Zone within the Sunday Lake System
The Sunday Lake Booster Station was constructed in 2006 and is set to operate at a desired pressure of 110 psi. Pumps 1 and 2 have a 90-gpm capacity and are for ADD, MDD, and PHD. Pumps 3 and 4 have a 450-gpm capacity and are for high demand periods, such as fire flow demands. All four pumps are VFD.
Table 7-29 shows the BPS’s supply evaluation which assesses the pump station capacity to provide MDD plus a 500-gpm fire flow as well as its ability to meet PHD, both with the largest pump out of service. As the table shows, the system has sufficient supply to meet the projected demands through 2040.
Table 7-29 | Boosted Pressure Zone within the Sunday Lake Supply Analysis
Description Plan Yr 2020
10-Yr 2030
20-Yr 2040
Required Supply (gpm)
Max Fire Flow 500 500 500
Maximum Day Demand 74 90 108
Peak Hour Demand 189 228 275

DRAFT
20-2733 Page 7-36 2021 Water System Plan Update February 2022 Snohomish County PUD No. 1
Description Plan Yr 2020
10-Yr 2030
20-Yr 2040
Available Supply (gpm)
Largest Pump (QL) 450 450 450
Total Pumping Capacity (Qs) 1,080 1,080 1,080
Firm Supply Capacity (no storage) (PHD with largest pump out of service)
Surplus / (Deficit) of Supply (gpm) 441 402 355
Reliable Capacity (no storage) (MDD + Fire Flow with largest pump out of service)
Surplus / (Deficit) of Supply (gpm) 56 40 22
7.8.3 Distribution System Evaluation for the Sunday Lake System
Sunday Lake has low pressure deficiencies at customer meters very near the tank. Some customer owned service line booster pumps are required to provide adequate pressures to these customers.
7.8.4 Storage Evaluation for the Sunday Lake System
The Sunday Lake Reservoir is located west of 254th Street NW and provides the system with 0.2 MG of storage. The concrete tank is 26 feet in diameter, approximately 50 feet tall and was constructed in 1995.
Table 7-30 shows Sunday Lake storage evaluation which assesses the storage tank’s capacity to meet the needs of the system by breaking down the storage volume by type. As mentioned previously, standby and fire flow storage are nested together into emergency storage. As the table shows, the system has sufficient storage to meet the projected demands through 2040.
Table 7-30 | Sunday Lake Storage Analysis
Description Plan Yr 2020
10-Yr 2030
20-Yr 2040
Usable Storage (MG)
Maximum Storage Capacity 0.20 0.20 0.20
Dead (Non-usable) Storage 0.02 0.02 0.02
Total Usable Storage 0.17 0.17 0.17
Required Storage (MG)
Operational Storage 0.01 0.01 0.01
Equalizing Storage 0.01 0.01 0.02
Standby Storage (Emergency) 0.07 0.09 0.11
Fire Flow Storage (Emergency) 0.03 0.03 0.03
Total Required Storage 0.09 0.11 0.14
Surplus Storage 0.08 0.06 0.04

DRAFT
20-2733 Page 7-37 2021 Water System Plan Update February 2022 Snohomish County PUD No. 1
7.8.5 Remaining Physical Capacity in Existing Sunday Lake Facilities
Table 7-31 evaluates the Sunday Lake water rights and existing facilities to determine the maximum number of ERUs that can be served. As can be seen in the table, the system’s limiting factor is its supply capacity. The system has sufficient capacity for its projected growth.
Table 7-31 | Sunday Lake Existing System Capacity Analysis
Description Plan Yr 2020
10-Yr 2030
20-Yr 2040
Demands per ERU Basis
Average Day Demand per ERU (gpd/ERU)1 184 184 184
Maximum Day Demand per ERU (gpd/ERU) 529 529 529
Peak Hour Demand per ERU (gpd/ERU) 1,339 1,339 1,339
Total Projected ERUs (ERUs) 203 245 295
Water Right - Instantaneous Capacity
Limiting Supply Rate (based on Qi) (gal/day) 187,200 187,200 187,200
Maximum Day Demand per ERU (gpd/ERU) 529 529 529
Maximum Supply Capacity (ERU) 354 354 354
Water Right - Annual Capacity
Limiting Supply Rate (based on Qa) (gal/day) 89,721 89,721 89,721
Average Day Demand per ERU (gpd/ERU) 184 184 184
Maximum Supply Capacity (ERU) 488 488 488
Source Capacity
Total System Supply Capacity (Total, gpd, 20hr pumping) 187,200 187,200 187,200
Fire Suppression Storage Replenished in 72 hours (gpd) 10,000 10,000 10,000
Maximum Day Demand per ERU (gpd/ERU) 529 529 529
Maximum Supply Capacity (ERUs) 335 335 335
Storage Capacity
Maximum Usable Storage Capacity (MG) 0.174 0.174 0.174
Available Standby and Equalization Storage Capacity (MG) 0.166 0.166 0.166
Standby Storage Requirement per ERU (gal/ERU) 367.88 367.88 367.88
Equalizing Storage Requirement per ERU (gal/ERU) 43.34 59.84 73.51
Maximum Storage Capacity (ERUs) 404 389 377
Maximum System Capacity
Based on Limiting Facility (ERUs) 335 335 335
Available System Capacity
Maximum System Capacity (ERUs) 335 335 335
Remaining System Capacity (ERUs) 132 90 40 Note: 1. A 3.5% DSL is included in system demand estimates

DRAFT
20-2733 Page 7-38 2021 Water System Plan Update February 2022 Snohomish County PUD No. 1
7.9 Warm Beach System Facilities Analysis
The District is currently in the process of combining its Kayak and Warm Beach systems. The District became responsible for the Kayak system in October 2006 and the Warm Beach system in September 2018. As noted in Table 7-10, the minimum fire flow requirement for the Warm Beach water system is 500 gpm for 2 hours.
7.9.1 Water Supply Facility Evaluation for the Warm Beach System
The combined Warm Beach system has four active wells. The historical Kayak water system has two active wells. Kayak-Well 2 currently operates between 200 to 285 gpm and Kayak-Well 3 operates at 300 gpm. The wells currently alternate in operation. Since the 2011 WSP, the District transferred the water right from Well 1 to Wells 2 and 3, which increased the allowable withdrawal rate to 370 gpm. In 2009 the District constructed a treatment system for these two wells to remove manganese, iron, and hydrogen sulfide and provide free chlorine residual throughout the distribution system.
The historic Warm Beach water system also has two active wells. Warm Beach-Well 2 operates at 50 gpm and Warm Beach-Well 4 operates between 170-200 gpm. While Well 2 operates at its full water rights capacity, Well 4 currently operates under its 200 gpm water right capacity. The District replaced the pump, motor, 4” drop pipe, and wire at Well 4 under an emergency contract in August 2020 after the failure of the well’s submersible motor. Although consideration was made to complete the replacement in a manner that would maximize its water rights, expediency and availability of equipment was prioritized over selection of the optimum pump and motor combination. The new pump, however, does pump the 200-gpm Qi initially at start-up and then drops to between 170-180 gpm during its normal run. The District has ordered a new pump and motor with slightly higher head to maintain as a spare that should be sufficient to consistently run the well at the targeted 200 gpm; however, installation of that new pump and motor is not emergent at this time and would be delayed until the Kayak and Warm Beach systems are fully connected with planned improvements as discussed in Chapter 11 or as needed based on the ongoing performance of the newly installed pump and motor.
Table 7-32 shows the system’s supply evaluation. It reviews the system’s ability to both provide MDD while replenishing fire suppression storage in 72 hours as well as its ability to meet ADD with the largest source out of service. As the table shows, the system has sufficient supply to meet the projected demands.
Table 7-32 | Warm Beach System Supply Evaluation
Description Plan Yr 2020
10-Yr 2030
20-Yr 2040
Required Supply (gpm)
Fire Suppression Storage Replenished in 72 hours 14 14 14
Maximum Day Demand 345 394 449

DRAFT
20-2733 Page 7-39 2021 Water System Plan Update February 2022 Snohomish County PUD No. 1
Description Plan Yr 2020
10-Yr 2030
20-Yr 2040
Available Supply (gpm)
Total Pumping Capacity (Qs) 770 770 770
Total Water Right (Qi) 620 620 620
20-hr Pumping Capacity 517 517 517
Firm Supply Capacity (Provide the MDD in a period of 20hrs or less of pumping.)
Surplus / (Deficit) of Supply (gpm) 172 123 67
Reliable Capacity (MDD + replenish FSS in 72-hours)
Surplus / (Deficit) of Supply (gpm) 411 363 307
7.9.2 Boosted Pressure Zone within the Warm Beach System
The Warm Beach Booster Station was constructed in 1995 and is set to operate at a desired head of 140 feet. It has two pumps, each with a 65-gpm capacity. Pressure is modulated by six 86-gallon bladder tanks.
Table 7-33 shows the BPS’s supply evaluation, which assesses the pump station capacity to provide MDD as well as its ability to meet PHD, both with the largest pump out of service. As the table shows, the system has sufficient supply to meet the projected demands through 2040.
Table 7-33 | Boosted Pressure Zone within the Warm Beach Supply Analysis
Description Plan Yr 2020
10-Yr 2030
20-Yr 2040
Required Supply (gpm)
Max Fire Flow 0 0 0
Maximum Day Demand 10 11 13
Peak Hour Demand 29 33 37
Available Supply (gpm)
Largest Pump (QL) 65 65 65
Total Pumping Capacity (Qs) 130 130 130
Firm Supply Capacity (no storage) (PHD)
Surplus / (Deficit) of Supply (gpm) 36 32 28
Reliable Capacity (no storage) (MDD + Fire Flow with largest pump out of service)
Surplus / (Deficit) of Supply (gpm) 55 54 52
7.9.3 Distribution System Evaluation for the Warm Beach System
As shown in Figure 7-2, there are a significant number of existing fire flow deficiencies in the Warm Beach system due to storage capacity deficiencies and high elevation customers, particularly at the end of dead-end pipes. Connecting the Warm Beach and Kayak Systems along with some pipe upsizing improves the fire flow availability. Some service line booster pumps or

DRAFT
20-2733 Page 7-40 2021 Water System Plan Update February 2022 Snohomish County PUD No. 1
connecting customers to parallel higher-zone piping may be required. Specific improvements to address the deficiencies are discussed in Chapter 11.
7.9.4 Storage Evaluation for the Warm Beach System
The combined Warm Beach system has two storage tanks, the Kayak Tank and the Warm Beach Tank. The Kayak Tank provides the system with 0.3 MG of total storage, 0.2 MG of usable storage. The concrete tank is 26 feet in diameter, approximately 75 feet tall and was constructed in 2009. The Warm Beach Tank and provides the system with 0.2 MG of total and usable storage. The bolted steel tank is 33 feet in diameter, approximately 32 feet tall and was constructed in 1995.
Table 7-34 shows Warm Beach storage evaluation. It reviews the system’s storage capacity against its storage needs by breaking down the storage volume by type. As mentioned previously, standby and fire flow storage are nested together into emergency storage. The table below show an existing storage deficiency. This is due primarily to the District taking a more conservative approach to standby storage for the combined Warm Beach system than has been historically used. The table shows separate analyses for the existing Warm Beach and Kayak tanks. Though the tanks will be connected via a control valve at the completion of the proposed system improvements, the higher Kayak zones do not have gravity access to the existing Warm Beach tank storage (storage can only be utilized by the higher zones through a pump station), so it is more conservative to evaluate them separately.
The historic Warm Beach system has defined standby storage as 200 gpd per ERU and historic Kayak system has defined standby storage as the larger of two average days of demand with the largest source offline or 200 gpd per ERU. Because of the remoteness of this system, the District has decided to plan for added standby storage as part of this WSP update and has defined standby storage as two average days of demand.
To address this deficiency the District has proposed a new tank (located in the higher Kayak area of the system, so that it can address the entire deficiency) as noted in Chapter 11.

DRAFT
20-2733 Page 7-41 2021 Water System Plan Update February 2022 Snohomish County PUD No. 1
Table 7-34 | Warm Beach Storage Analysis
Description Plan Yr 2020
10-Yr 2030
20-Yr 2040
Existing Warm Beach Tank
Usable Storage (MG)
Maximum Storage Capacity 0.201 0.201 0.201
Dead (Non-usable) Storage 0.003 0.003 0.003
Total Usable Storage 0.198 0.198 0.198
Required Storage (MG)
Operational Storage 0.03 0.03 0.03
Equalizing Storage 0.05 0.06 0.07
Standby Storage (Emergency) 0.20 0.22 0.25
Fire Flow Storage (Emergency) 0.06 0.06 0.06
Total Required Storage 0.27 0.30 0.35
Surplus Storage -0.07 -0.11 -0.15
Existing Kayak Tank
Usable Storage (MG)
Maximum Storage Capacity 0.30 0.30 0.30
Dead (Non-usable) Storage 0.09 0.09 0.09
Total Usable Storage 0.21 0.21 0.21
Required Storage (MG)
Operational Storage 0.03 0.03 0.03
Equalizing Storage 0.02 0.03 0.04
Standby Storage (Emergency) 0.19 0.21 0.24
Fire Flow Storage (Emergency) 0.06 0.06 0.06
Total Required Storage 0.23 0.27 0.31
Surplus Storage -0.02 -0.06 -0.10
7.9.5 Remaining Physical Capacity in Existing Warm Beach Facilities
Table 7-35 evaluates the capacity of the existing Warm Beach water rights and existing facilities in terms of the maximum number of ERUs supported by each component. The result shows that the system has surpassed its capacity due to lack of storage. As discussed previously, this is due to the District taking a more conservative approach to standby storage for the combined Warm Beach system than has been historically used. To rectify this deficiency the District plans on constructing new storage for the system within the next five years.

DRAFT
20-2733 Page 7-42 2021 Water System Plan Update February 2022 Snohomish County PUD No. 1
Table 7-35 | Warm Beach System Capacity Analysis
Description Plan Yr 2020
10-Yr 2030
20-Yr 2040
Demands per ERU Basis
Average Day Demand per ERU (gpd/ERU) 184 184 184
Maximum Day Demand per ERU (gpd/ERU) 479 479 479
Peak Hour Demand per ERU (gpd/ERU) 1,417 1,417 1,417
Total Projected ERUs (ERUs) 1,037 1,189 1,365
Water Right - Instantaneous Capacity
Limiting Supply Rate (based on Qi) (gal/day) 892,800 892,800 892,800
Maximum Day Demand per ERU (gpd/ERU) 479 479 479
Maximum Supply Capacity (ERU) 1,863 1,863 1,863
Water Right - Annual Capacity
Limiting Supply Rate (based on Qa) (gal/day) 324,066 324,066 324,066
Average Day Demand per ERU (gpd/ERU) 184 184 184
Maximum Supply Capacity (ERU) 1,764 1,764 1,764
Source Capacity
Total System Supply Capacity (Total, gpd, 20hr pumping) 1,108,800 1,108,800 1,108,800
Fire Suppression Storage Replenished in 72 hours (gpd)1 20,000 20,000 20,000
Maximum Day Demand per ERU (gpd/ERU) 479 479 479
Maximum Supply Capacity (ERUs) 2,272 2,272 2,272
Storage Capacity
Maximum Usable Storage Capacity (MG) 0.41 0.41 0.41
Available Standby and Equalization Storage Capacity (MG) 0.35 0.35 0.35
Standby Storage Requirement per ERU (gal/ERU) 367.36 367.36 367.36
Equalizing Storage Requirement per ERU (gal/ERU) 62.32 71.68 79.71
Maximum Storage Capacity (ERUs) 819 801 787
Maximum System Capacity
Based on Limiting Facility (ERUs) 819 801 787
Available System Capacity
Maximum System Capacity (ERUs) 819 801 787
Remaining System Capacity (ERUs) -219 -388 -578 Note: 1. Fire storage volume is averaged over three days

Storm LakeRidge Tap
ButterfieldTap #2
ButterField Tap
East HewittPump
Station Tap
Soperwood PumpStation Tap
(Marysville JOA)
Machias PumpStation Tap
Machias Ridge East(157th Avenue SE Tap)
Dutch Hill Tap#2 (Dubuque)
Dutch Hill Tap#1 (Dubuque)
LakeRoesiger
Tap
123rd Avenue SETap (Kla-Ha-Ya)
Glenwood PumpStation Tap
Cavaleros PumpStation Tap
LakeStevensWell
Storm LakeRidge Tank
LakeBosworthTanks
HillcrestTanks
LakeRoseigerTanks
WalkerHill Tanks
GraniteFalls Tank
Storm LakeRidge BPS
MachiasRidge East BPS
Machias BPS
Hillcrest BPS
LakeBosworthBPS
Soperwood BPS
LakeCassidyBPS
EastHewitt BPS
WalkerHill BPS
Glenwood BPS
GraniteFalls BPS
44th BPS
LakeRoesigerBPS
LakeStevensWell
95thAve NE
9
130thSt NE
161stAve NE
87th
Ave N
E
157thAve SE
Newberg Rd
163rd
Ave S
E
Butler Rd
130thSt NE
E Lake
Bosworth Dr
160thSt NE
168th
St NE
MountainLoop Hwy
Marsh Rd
99th Pl SE
Scotty RdMenzel
Lake Rd
US Hwy 2 Dubuque Rd
143rd
Ave N
E
159th
Dr SE
142ndSt NE
9
BosworthDr
Jordan Rd
78th St NE
Stearn
s Rd
95th St SE
Moun
tain
Loop
Hwy
MountainLoop Hwy
152nd St NE
205thDr SE
LowellSnohomishRiver Rd
99thSt SE
EngebretsenRd
Mead
owLa
ke Rd
Parker Rd
S Mac
hias R
d
ChainLake Rd
24th Pl NE
Haines Rd
Mountain
Loop H
wy
N Carpente
r Rd
OilWell Rd
Jordan Rd
Quarry Rd
2
Dubuque
Rd
Alston
Rd
153rdDr SE
Badke Rd
Van B
owen
Rd
83rd
Ave N
E
Pilchuck
Tree Farm Rd
Wood
sCr
eek R
d
2
Menzel
Lake Rd9
Sunn
yside
Blvd
Dubuque Rd
203rd Ave NE
9
Pilchuck
Tree Farm Rd
Sanders Rd
175thAve NE
MenzelLake Rd
148th
St NE
W FlowingLake Rd
Dubuque Rd
9
123rd
Ave N
E
149th
Ave N
E
224th
Ave N
E
99th
Ave N
E
ForestGlade Rd
Pipeline Rd
Goebel Hill Rd
WoodsCreek Rd
164th
Ave N
E
Ok Mill Rd
MeadowLake Rd
Fobes Rd
Sexto
nRd
63rd
Ave S
E
9
Rivershore Rd
87th
Ave N
E
70th St NE
2
MeadowLake Rd
Old Pipeline Rd
Sunnyside Blvd
127th
Ave S
E
139thSt NE
153rdAve SE
Quarry Rd
79th Pl NE
Mountain Loop Hwy
147th
Ave N
E
StormLake Rd
158th St NE
Connors Rd
Newberg Rd
9
US Hwy 2
Foster Slough Rd
92
W La
keCo
chran
Rd
Meldahl Rd
9
Spada Rd
Burn Rd
Shou
lets R
d
Monroe Camp Rd
2
155th
Ave N
E
Fores
tGl
ade R
d
991
st Av
e NE
Skinner Rd
Menzel Lake Rd
108th St SE
132nd St NE
9
72nd
St N
E
N Carpenter Rd
9
River
Rd
Granite
Falls-Pilchuck Rd
Pilchuck
Tree Farm Rd
9
0 6,5003,250 Feet
20-2733 October 2021
LegendFire Flow Deficiencies
Existing-2040 Deficiency2040 Deficiency
Low Pressure Deficiencies@ Existing PHD pressure less than 30 psi@ 2040 PHD pressure less than 30 psi
FacilitiesUT Tank?> Well")M TapÎ $³ PRV[Ú Pump Station
Pipe Diameter< 6"6"8"10" -12"16" - 24"> 24"RailroadWaterbodyRoadMajor RoadHighway
K:\TAC_Projects\20\2733 - Snohomish County PUD - 2021 Water System Plan Update\CAD\GIS\Report Figures\Figure 7-1 LSI Model Results.mxd 10/2/2021 11:59:55 AM Elisheva.Walters
© Snohomish County PUD2021 Water System Plan Update
Figure 7-1Lake Stevens Integrated
and Storm Lake RidgeFire Flow and
PHD Deficiencies
Data Sources:SnoPUDSnohomish County Geospatial Data Clearinghouse.Coordinate System: NAD 1983 StatePlane Washington North FIPS 4601 FeetProjection: Lambert Conformal ConicDatum: North American 1983Disclaimer: Snohomish PUD makes no representations, express or implied,as to the accuracy, completeness and timeliness of the information displayed.This map is not suitable for legal, engineering, or surveying purposes. Notificationof any errors is appreciated.
DRAFT

Kayak Tank
Warm BeachTank
Kayak Well #2Kayak Well #3
Warm BeachWell 4 BPS
Warm BeachWell 2
174th St NW
Lakewood Rd
140th St NW
Kayak Point Rd
Stanwood Rd
89th
Ave N
W
View D
r
156th St NW
Marin
e Dr
167th Pl NW
Dayton St
Frank Waters Rd
63rd Ave NW
204th St NW
176th St NWClarence Ave
76th
Ave N
W180th St NW
96th
Ave N
W
11th A
ve N
62nd
Ave N
W
Warm
Beach
Rd
Olive Ave
Marine Dr80
th Av
e NW
McKees Beach Rd
70th
Ave N
W
66th
Ave N
W
0 1,600800 Feet
20-2733October 2021
LegendFire Flow Deficiencies
Existing DeficiencyLow Pressure Deficiencies@ Existing PHD pressure less than 30 psi?> Tap or WellÎ $³ PRVUT Tank[Ú Pump Station
Pipe Diameter< 6"6"8"10" -12"WaterbodyRoadMajor Road
K:\TAC_Projects\20\2733 - Snohomish County PUD - 2021 Water System Plan Update\CAD\GIS\Report Figures\Figure 7-2 Warm Beach Model Results.mxd 10/2/2021 11:59:43 AM Elisheva.Walters
© Snohomish County PUD2021 Water System Plan Update
Figure 7-2Warm Beach
Fire Flow and PHD Deficiencies
Data Sources:SnoPUDSnohomish County Geospatial Data Clearinghouse.Coordinate System: NAD 1983 StatePlane Washington North FIPS 4601 FeetProjection: Lambert Conformal ConicDatum: North American 1983Disclaimer: Snohomish PUD makes no representations, express or implied,as to the accuracy, completeness and timeliness of the information displayed.This map is not suitable for legal, engineering, or surveying purposes. Notificationof any errors is appreciated.
DRAFT

Chapter 8

THIS PAGE INTENTIONALLY LEFT BLANK
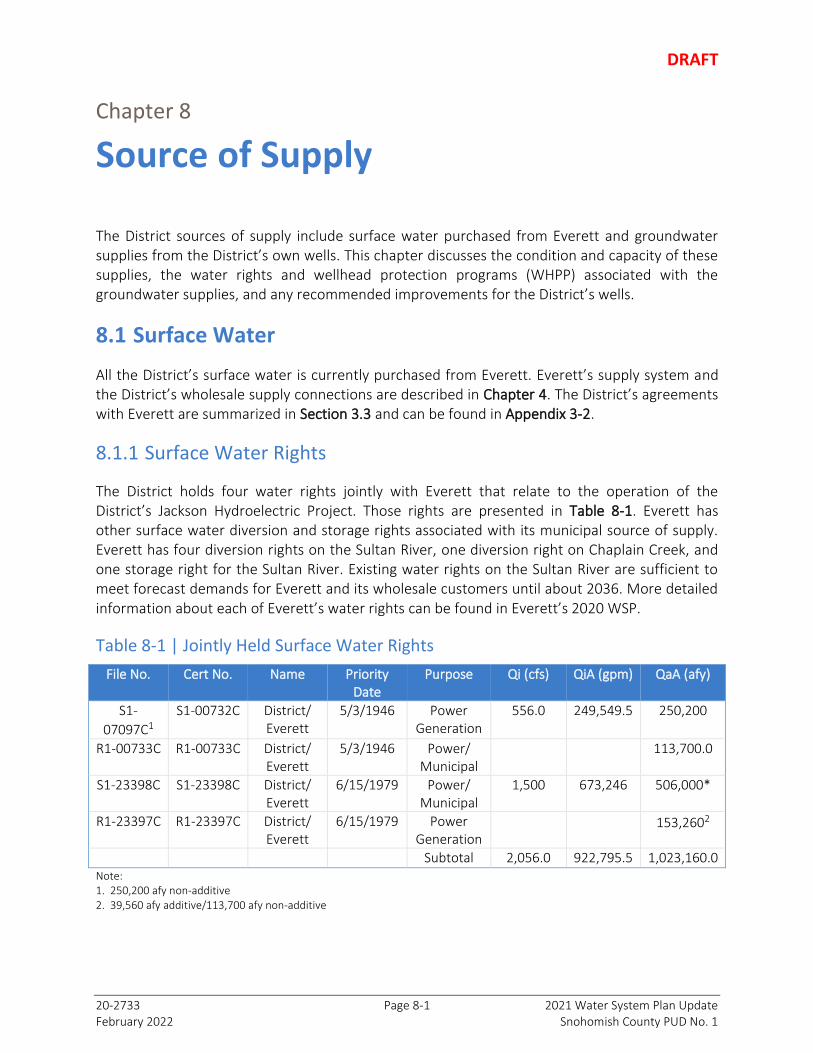
DRAFT
20-2733 Page 8-1 2021 Water System Plan Update February 2022 Snohomish County PUD No. 1
Chapter 8
Source of Supply
The District sources of supply include surface water purchased from Everett and groundwater supplies from the District’s own wells. This chapter discusses the condition and capacity of these supplies, the water rights and wellhead protection programs (WHPP) associated with the groundwater supplies, and any recommended improvements for the District’s wells.
8.1 Surface Water
All the District’s surface water is currently purchased from Everett. Everett’s supply system and the District’s wholesale supply connections are described in Chapter 4. The District’s agreements with Everett are summarized in Section 3.3 and can be found in Appendix 3-2.
8.1.1 Surface Water Rights
The District holds four water rights jointly with Everett that relate to the operation of the District’s Jackson Hydroelectric Project. Those rights are presented in Table 8-1. Everett has other surface water diversion and storage rights associated with its municipal source of supply. Everett has four diversion rights on the Sultan River, one diversion right on Chaplain Creek, and one storage right for the Sultan River. Existing water rights on the Sultan River are sufficient to meet forecast demands for Everett and its wholesale customers until about 2036. More detailed information about each of Everett’s water rights can be found in Everett’s 2020 WSP.
Table 8-1 | Jointly Held Surface Water Rights
File No. Cert No. Name Priority Date
Purpose Qi (cfs) QiA (gpm) QaA (afy)
S1-
07097C1
S1-00732C District/ Everett
5/3/1946 Power Generation
556.0 249,549.5 250,200
R1-00733C R1-00733C District/ Everett
5/3/1946 Power/ Municipal
113,700.0
S1-23398C S1-23398C District/ Everett
6/15/1979 Power/ Municipal
1,500 673,246 506,000*
R1-23397C R1-23397C District/ Everett
6/15/1979 Power Generation
153,2602
Subtotal 2,056.0 922,795.5 1,023,160.0 Note: 1. 250,200 afy non-additive 2. 39,560 afy additive/113,700 afy non-additive

DRAFT
20-2733 Page 8-2 2021 Water System Plan Update February 2022 Snohomish County PUD No. 1
The District also holds a certificated surface water right (S1-07584C) to divert water from Lake Stevens, which was the original water supply to the District’s Lake Stevens Integrated system. This surface water right, which qualifies a water right for municipal purposes under RCW 90.03.015, is listed with the District’s groundwater rights in Table 8-3, at the end of this chapter. The District has an ongoing interest in retaining this municipal water right to meet future demands within Lake Stevens Integrated.
8.1.2 Surface Water Supply Yield
Everett performed a detailed yield analysis as part of its 2020 WSP. The analysis showed that Everett’s surface and groundwater rights can meet maximum day demands until after 2040. The analysis also showed that climate change could have a negative impact on the safe yield available between now and 2075. Everett is considering operational changes to their system that would help mitigate this risk. The WSP notes that “these are long-term forecasts with great uncertainty, and the need for capital projects to improve supply reliability will be revisited in future plans”. A more detailed discussion of Everett’s yield analysis and alternative sources of supply may be found in Everett’s 2020 WSP.
8.1.3 Surface Water Shortage Response Plan
Everett has a Water Shortage Response Plan in the event of unplanned or projected water shortages. The Spada Reservoir has a one-year supply of water to meet retail and wholesale demands and the Chaplain Reservoir has sufficient water for 60 days of normal water use. Under emergency conditions, the Chaplain Reservoir could be extended to 120 days of supply. Everett’s complete Water Shortage Response Plan is provided in the appendices of its 2020 WSP.
In addition, the District has an Emergency Drought Response Plan (see Appendix 8-1 of this WSP). The District’s emergency plan identifies the range of demand and reduction actions that are available and defines the triggers by which decisions are made during a low-water event. The Emergency Drought Response Plan is designed to meet the needs of the District and its water customers, in addition to achieving three goals: 1) ensure an adequate supply of high-quality water is maintained throughout the event; 2) ensure adequate stream flows are maintained for fish and wildlife habitat; and 3) where feasible, maintain adequate storage in the Spada Reservoir for generation of hydroelectric power.
8.1.4 Watershed Plans
8.1.4.1 WRIA 5 - Stillaguamish Basin
Watershed planning has not been conducted in WRIA 5. However, in consultation with the State Department of Fish and Wildlife and the Tribes, Ecology developed recommendations for instream flows and closures. Ecology adopted the Instream Resources Protection and Water Resources Program Rule (Chapter 173-505 WAC) in August 2005. The rule established instream flows for 32 rivers or streams in the basin, reserved a limited amount of groundwater for future

DRAFT
20-2733 Page 8-3 2021 Water System Plan Update February 2022 Snohomish County PUD No. 1
domestic use, reserved a limited amount of water for stock watering, established maximum limits for withdrawals from nine water sources, closed lakes and ponds to new diversions, (except for domestic use), and closed numerous rivers and streams to new uses unless the use qualifies under identified exceptions.
The rule was developed by Ecology in conjunction with the Stillaguamish River Implementation Review Committee (SIRC). The SIRC members consisted of representatives from the Stillaguamish Indian Tribe, regional salmon recovery groups, federal, and local governments.
8.1.4.2 WRIA 7 – Snohomish Basin
8.1.4.2.1 Watershed Restoration Act Plan (ESSB 6091)
In January 2018, the Legislature passed the Streamflow Restoration law to help restore streamflow levels. Its purpose is to support robust, healthy, and sustainable salmon populations while providing water for homes in rural Washington. The law calls for local watershed planning and project implementation that improve streamflows. Ecology funds implementation through its competitive grant program. Specifically, the law directs Ecology to convene Watershed Restoration and Enhancement Committees in eight watersheds surrounding Puget Sound.
Each of these committees will develop a watershed restoration and enhancement plan (watershed plan). The watershed plan must identify projects that: offset the potential impacts future permit-exempt domestic groundwater withdrawals will have on streamflows; and provide a net ecological benefit (NEB) to the WRIA. All members of the WRIA 7 Watershed Restoration and Enhancement Committee must approve the watershed plan prior to submitting its plan to Ecology for review. Ecology must complete its review by June 30, 2021. If it meets the requirements of the law and guidance, Ecology will adopt the plan.
8.1.4.2.2 Committee Membership
The Streamflow Restoration law instructed Ecology to chair the WRIA 7 Watershed Restoration and Enhancement Committee and invite entities in the watershed to participate, including tribal governments, county governments, city governments, Department of Fish and Wildlife, the largest non-municipal water purveyor, the largest irrigation district, and interest groups. Local governments on the Committee selected organizations to represent agricultural interests, the residential construction industry, and environmental interests through a nomination process. The WRIA 7 Committee also added "ex officio" members, who were not listed in the law but provide valuable information and perspective.
Members include: Tulalip Tribes, Snoqualmie Indian Tribe, King County, Snohomish County, Arlington, City of Carnation, City of Duvall, Everett, Gold Bar, Town of Index, City of Lake Stevens, Marysville, Monroe, City of North Bend, City of Snohomish, City of Snoqualmie, City of Seattle - ex officio member, Department of Fish and Wildlife, Ecology, Snohomish Public Utility District, Washington Water Trust, Snohomish Conservation District, Master Builder Association of King and Snohomish Counties, Snoqualmie Valley, Watershed Improvement District Snoqualmie
DRAFT
20-2733 Page 8-4 2021 Water System Plan Update February 2022 Snohomish County PUD No. 1
Watershed Forum - ex officio member, and Snohomish Basin Salmon Recovery Forum - ex officio member.
8.1.4.2.3 Approval Overview
The WRIA 7 Committee and technical consultants started developing the plan in October 2018. The WRIA 7 Committee hoped to finalize the plan for local review and WRIA 7 approval in early 2021; however, a consensus was not reached by June 30, 2021. State law requires that all members of the WRIA 7 Committee must approve the plan prior to adoption by Ecology. In the absence of consensus approval, the Department of Ecology is required to prepare and adopt a WRIA 7 plan. Starting in July 2021, the Department of Ecology began to prepare a plan for adoption as directed by RCW 90.94.030(3)(h). For more details on plan finalization, please see Ecology’s streamflow restoration planning update.
8.1.4.2.4 Watershed Planning (RCW 90.82)
Watershed planning under RCW 90.82 has not been conducted in WRIA 7. A Phase 1 watershed grant application was prepared with the Tulalip Tribes and Everett as co-leads but was never perfected and grant funding was not awarded. The WRIA 7 is part of the Central Puget Sound Regional Unit.
8.1.5 General Hydrology / Fishery Conditions
Because of the size of the District’s retail and future service areas, its water systems and sources can be found in both the Snohomish and Stillaguamish River Basins.
8.1.5.1 Snohomish River Basin (WRIA 7)
The Snohomish River Basin, located on the western slope of the Cascade Mountains, has a total area of about 1,900 square miles in Snohomish and King Counties. The basin is bounded on the north by the Skagit and Stillaguamish River basins, and on the south by the Sammamish and Cedar River basins. The Snohomish River is formed by the confluence of the Skykomish and Snoqualmie Rivers near Monroe. The Snohomish River flows for 21 miles in northwesterly direction and discharges into Possession Sound. In the lower third of the valley, the river discharges into several distributary channels, principally Ebey, Steamboat, and Union Sloughs. The Pilchuck River joins the Snohomish River just upstream of the City of Snohomish and is the only sizeable tributary below the confluence of the Snoqualmie and Skykomish Rivers.
The Snoqualmie and Skykomish Rivers each host one population of threatened Chinook salmon. The Snohomish Watershed is also home to threatened bull trout, in addition to Skykomish and Snoqualmie River Coho. Populations of chum, pink, and sockeye salmon, as well as steelhead, also inhabit the Snohomish River system. Urbanization has resulted in loss of off-channel habitat, such as oxbows. Efforts are underway in the Snohomish River basin to reconnect off-channel habitat, restore bank edges, and riparian forests in strategic locations in order to improve salmonid population health and production.

DRAFT
20-2733 Page 8-5 2021 Water System Plan Update February 2022 Snohomish County PUD No. 1
8.1.5.2 Stillaguamish River Basin (WRIA 5)
The Stillaguamish Basin drains an area of approximately 700 square miles and includes more than 3,112 miles of river, streams, and marine shore habitat. The river enters Puget Sound at Stanwood, 16 miles north of Everett in northern Snohomish County. The basin/watershed drains into both Port Susan and Skagit Bay. It is also part of the Whidbey Basin, which includes Skagit Bay, Saratoga Passage, Port Susan, and Deception Pass. The Stillaguamish Basin can be divided into three general regions: North Fork, South Fork, and Lower Mainstem. The two forks join at Arlington, 18 river miles from the mouth. Pilchuck, Deer, Boulder, and Canyon Creeks are the four largest tributaries to the Stillaguamish River system.
Chinook salmon inhabit the mainstem, North Fork, and South Fork of the Stillaguamish River, as well as several of the basin’s larger tributaries (Pilchuck, Jim, Canyon, Squire, French, Deer, and Boulder Creeks). Two distinct coho salmon populations reside in the basin: the Stillaguamish and Deer Creek. The former is considered a mixture of native and non-native fish due to historic releases of hatchery coho salmon. In addition to Chinook and coho salmon populations, the Stillaguamish basin also hosts populations of Chum Salmon, Pink Salmon, Steelhead Trout, Sockeye Salmon, and Sea-Run Cutthroat Trout. Four local populations of bull trout reside in the Stillaguamish Basin: North Fork Stillaguamish, South Fork Stillaguamish River, Canyon Creek, and upper Deer Creek.
The Stillaguamish River has experienced deterioration in water quality from sources such as commercial and non-commercial farms, failing septic systems, land clearing, and road surface run-off. Multiple state, local, and federal agencies are working with the County to address water quality issues. In addition, the Stillaguamish Tribe has conducted significant monitoring efforts in the upper basin to document temperature, dissolved oxygen, turbidity, and other factors.
8.2 Groundwater
The District has 13 active wells that serve seven District-owned and operated retail/satellite water systems and Lake Stevens Integrated. The water rights associated with the District’s wells are authorized to provide municipal and community domestic water supply; however, the latter (i.e., community domestic) rights now qualify as water rights for municipal water supply purposes pursuant to RCW 90.03.015(4) (provide water to 15 or more residential connections). The District relies on the certificated and permitted water rights issued for these wells to meet the customer supply requirements of its satellite/retail service areas, with the exception of Lake Stevens Integrated which also has access to Everett’s wholesale water supply.
Overall, the District’s wells are in good condition. Aquifer levels and daily production records are collected, recorded, and reviewed for indications of reduced well efficiency. Well rehabilitation will be considered in the event of unacceptable losses of well efficiency. Well replacement will be considered if well rehabilitation is not appropriate or fails to improve a well’s efficiency.

DRAFT
20-2733 Page 8-6 2021 Water System Plan Update February 2022 Snohomish County PUD No. 1
The water rights and list of sources for each of the District’s water systems are presented in Table 8-3 at the end of this chapter. More detailed information about the wells can be found in Table 4-6 of Chapter 4. The District’s Water Right Self-Assessment (WRSA) forms documenting production and capacity can be found in Appendix 8-2. An overview of the wellhead protection program, source aquifer systems, basin planning status, and the water rights associated with each of the District’s wells follows.
8.2.1 Wellhead Protection Program
8.2.1.1 Wellhead Protection Program Requirements
The 1986 Amendment to the Federal Safe Drinking Water Act required that all states establish a WHPP. In the State, the program was officially adopted by DOH in July 1994. The WHPP requirement applies to all Group A public water systems that use wells or springs. The goal of the WHPP is to prevent contamination of groundwater sources used for drinking water. The strategy to attain this goal involved three main components:
▪ Delineation of wellhead protection areas (WHPAs) ▪ Inventory of potential contaminant sources ▪ Management of WHPAs to prevent contamination
The WAC 246-290 stipulates that every purveyor of public drinking water shall have a WHPP as part of its WSP or management program. The WHPP shall contain, at a minimum, seven elements for each individual well within a water system’s boundaries. These elements are:
▪ A completed susceptibility assessment
▪ Delineated WHPAs for each well with 1-, 5-, 10-year time of travel (TOT) boundaries
▪ A listing of known and potential groundwater contamination sources that may pose a threat to the water-bearing zone
▪ Documentation of purveyor’s notification to all owners/operators of known and potential sources of groundwater contamination within the WHPA
▪ Documentation of purveyor’s notification to all regulatory agencies and local governments of the WHPA boundaries and the finding of the WHPA inventory
▪ A contingency plan for providing an adequate supply of potable water in the event that groundwater contamination occurs in the temporary or permanent loss of main source of supply
▪ Documentation of coordination with local emergency responders, including notification of WHPA boundaries, results of susceptibility assessments, inventories of findings, and contingency plans
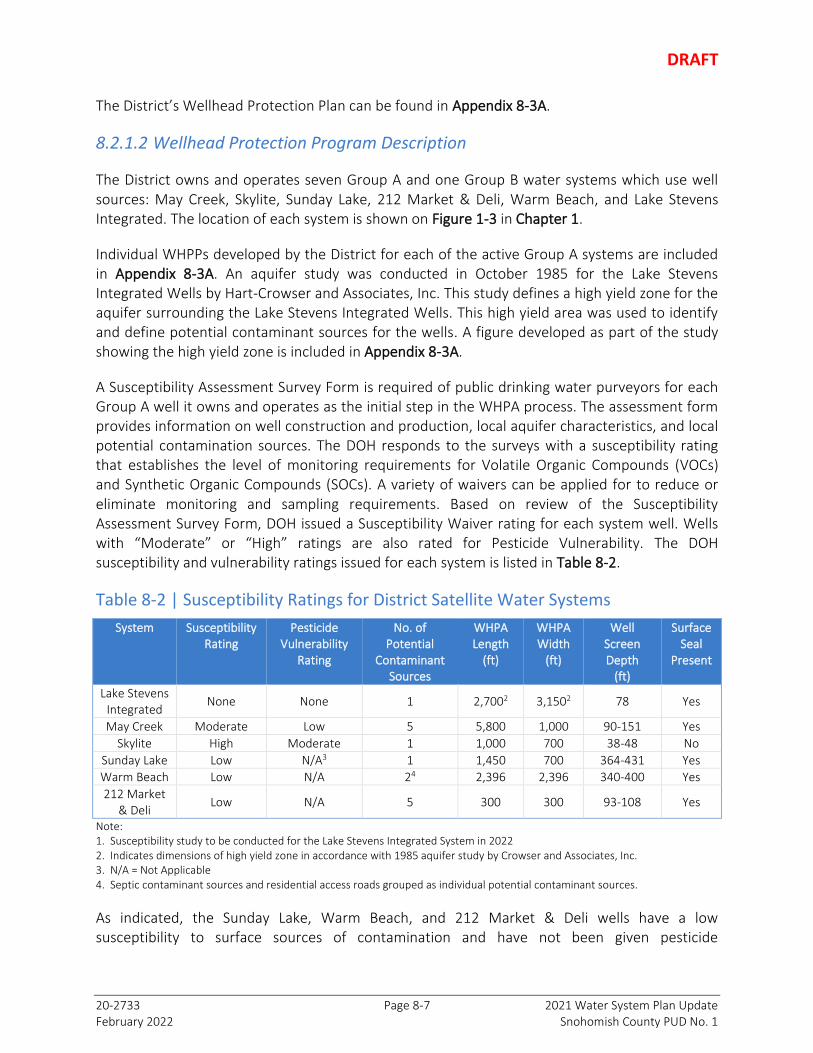
DRAFT
20-2733 Page 8-7 2021 Water System Plan Update February 2022 Snohomish County PUD No. 1
The District’s Wellhead Protection Plan can be found in Appendix 8-3A.
8.2.1.2 Wellhead Protection Program Description
The District owns and operates seven Group A and one Group B water systems which use well sources: May Creek, Skylite, Sunday Lake, 212 Market & Deli, Warm Beach, and Lake Stevens Integrated. The location of each system is shown on Figure 1-3 in Chapter 1.
Individual WHPPs developed by the District for each of the active Group A systems are included in Appendix 8-3A. An aquifer study was conducted in October 1985 for the Lake Stevens Integrated Wells by Hart-Crowser and Associates, Inc. This study defines a high yield zone for the aquifer surrounding the Lake Stevens Integrated Wells. This high yield area was used to identify and define potential contaminant sources for the wells. A figure developed as part of the study showing the high yield zone is included in Appendix 8-3A.
A Susceptibility Assessment Survey Form is required of public drinking water purveyors for each Group A well it owns and operates as the initial step in the WHPA process. The assessment form provides information on well construction and production, local aquifer characteristics, and local potential contamination sources. The DOH responds to the surveys with a susceptibility rating that establishes the level of monitoring requirements for Volatile Organic Compounds (VOCs) and Synthetic Organic Compounds (SOCs). A variety of waivers can be applied for to reduce or eliminate monitoring and sampling requirements. Based on review of the Susceptibility Assessment Survey Form, DOH issued a Susceptibility Waiver rating for each system well. Wells with “Moderate” or “High” ratings are also rated for Pesticide Vulnerability. The DOH susceptibility and vulnerability ratings issued for each system is listed in Table 8-2.
Table 8-2 | Susceptibility Ratings for District Satellite Water Systems
System Susceptibility Rating
Pesticide Vulnerability
Rating
No. of Potential
Contaminant Sources
WHPA Length
(ft)
WHPA Width
(ft)
Well Screen Depth
(ft)
Surface Seal
Present
Lake Stevens Integrated
None None 1 2,7002 3,1502 78 Yes
May Creek Moderate Low 5 5,800 1,000 90-151 Yes
Skylite High Moderate 1 1,000 700 38-48 No
Sunday Lake Low N/A3 1 1,450 700 364-431 Yes
Warm Beach Low N/A 24 2,396 2,396 340-400 Yes
212 Market & Deli
Low N/A 5 300 300 93-108 Yes
Note: 1. Susceptibility study to be conducted for the Lake Stevens Integrated System in 2022 2. Indicates dimensions of high yield zone in accordance with 1985 aquifer study by Crowser and Associates, Inc. 3. N/A = Not Applicable 4. Septic contaminant sources and residential access roads grouped as individual potential contaminant sources.
As indicated, the Sunday Lake, Warm Beach, and 212 Market & Deli wells have a low susceptibility to surface sources of contamination and have not been given pesticide

DRAFT
20-2733 Page 8-8 2021 Water System Plan Update February 2022 Snohomish County PUD No. 1
vulnerability ratings. This is primarily due to their relatively deep completions, verifiable presence of a surface seal, and local hydrogeologic conditions that help protect the aquifer from surface sources of contamination.
The May Creek System is moderately susceptible to surface sources of contamination and has low pesticide vulnerability. May Creek Wells have moderate completion depths, verifiable surface seals, and moderately protective overlying sediments.
The Skylite Well is highly susceptible to surface sources of contamination and is moderately vulnerable to pesticide contamination. It is completed between depths of 38 and 48 feet and has no record of a surface seal. Overlying sediments appear to be fine-grained glacial till, which to some degree, protect the underlying aquifer from surface sources of contamination. Without a verifiable surface seal, this well cannot be considered for sampling waiver reduction.
The WHPAs were delineated for each active system using the Environmental Protection Agency (EPA) WHPA (Code 2.2) module General Particle Tracking Module (GPTRAC). The purpose of the delineation is to describe the size and shape of that portion of an aquifer contributing groundwater to a well or well field. Maps of the delineated WHPAs are included with the WHPPs in Appendix 8-3A. The length and width of the delineated WHPAs are listed in Table 8-2.
Since no susceptibility rating has been developed for the Lake Stevens WHPA, the District will hire a hydrogeologist to review and update the WHPA and develop a corresponding susceptibility rating in 2022.
An inventory of potential contaminant sources within the delineated WHPAs was conducted by searching the EPA’s online geospatial database that identifies facilities subject to environmental regulation as well as Ecology’s online Neighborhood Cleanup Sites Database that identifies locations with potentially toxic substances. The number of potential contaminant sources identified within each delineated WHPA is listed on Table 8-2. The locations of the identified sources are shown on the WHPA maps.
One potential contaminant source has been identified for the high yield zone of the aquifer for the Lake Stevens Integrated Wells. The contaminant source is the now closed Barmon Door company, listed by the EPA as a site potentially facing environmental regulation and shown in Figure 8-1.
Three potential contaminant sources have been identified within the May Creek WHPA based on results from the field survey. They are disinfection facilities at the pump station, septic systems of nearby residences, and power transmission lines within the 10-year TOT area. Figure 8-2 also shows two potential contaminant sources from Ecology’s online database but these are outside May Creek’s WHPA.
The only contaminant sources identified within the Skylite and Sunday Lake WHPA are septic systems of nearby residences as identified by a field survey. The WHPAs are shown on Figure 8-4 and Figure 8-5, respectively.

DRAFT
20-2733 Page 8-9 2021 Water System Plan Update February 2022 Snohomish County PUD No. 1
Five potential contaminant sources have been identified within the 212 Market & Deli WHPA. They include two gas station/convenience stores with buried fuel tanks, nearby transportation routes, a septic system, and a buried tank used to hold water for fire protection purposes. All were identified by the field survey.
The WHPP completed for the Warm Beach system identifies septic systems and residential access roads as potential contaminant sources. Lots in the area are mostly five acres in size. The WHPP found that the 6-year TOT area overlapped eight lots and that the 1-year TOT overlapped 14 lots. Since becoming responsible for the Kayak system, the District removed a diesel storage tank from the well site but added storage of sodium hypochlorite and potassium permanganate in a new treatment building. Triple containment is provided for these chemicals, consisting of double-walled storage tanks inside concrete containment basins. The Warm Beach WHPA is shown in Figure 8-3.
Although a greater number of potential contaminants exist within the 212 Market & Deli WHPA, the most vulnerable of the District’s Group A satellite water systems is the Skylite system. This is due mainly to the well’s shallow completion and lack of surface seal. However, this well is surrounded by a concrete pad and located inside a building, which provides some measure of protection.
As required by the State’s WHPP, the District notified the owner of commercial property with potential contaminant sources of their presence within a WHPA. The contaminant source identified on Figure 8-3 is “Barmon Door & Plywood Inc.,” and is located at 2508 Hartford Drive. All federal, state, and local regulatory agencies with jurisdiction over the water systems have been advised regarding the delineated WHPAs and potential contaminant sources. Contingency and emergency response plans have been developed for each system to ensure availability of safe drinking water in the event contamination occurs within or near a WHPA.
8.2.1.3 Wellhead PFAS Testing/Monitoring
During 2019, the District conducted water quality testing at its well sites for the purpose of detecting potential per- and polyfluoroalkyl substance (PFAS) compounds in the source groundwater. During this sampling effort, the District detected no PFAS compounds at its well sites. The District will continue to engage in periodic testing as appropriate and is monitoring state and federal PFAS rules, statutes, and policies.
8.2.2 Snohomish County Hydrogeology
The geology within the County has been formed by processes related to glaciers and mountain building in western Washington. Many of the recent deposits are the result of continental glacial ice that advanced into the Puget Sound region several times during the Pleistocene Epoch (between 2 million and 10,000 years ago). The most recent period of glaciation, the Vashon Stade, began approximately 15,000 years ago.

DRAFT
20-2733 Page 8-10 2021 Water System Plan Update February 2022 Snohomish County PUD No. 1
Materials deposited during the Vashon glacial period are generally well-preserved and represent the principal hydrogeologic units associated with the District’s groundwater sources in terms of their importance as the primary aquifer and confining layers for groundwater supply purposes. Although groundwater occurs in all of the hydrogeologic units, groundwater is more readily transmitted within aquifer units, which are saturated permeable geologic units capable of transmitting a usable quantity of water. Confining units restrict the movement of groundwater.
Seven principle hydrogeologic units were defined within the County CWSP. The hydrologic units were defined based on the lithology of the unconsolidated materials and the stratigraphic and hydrologic relations between adjacent units. In general, the aquifers are comprised of coarse-grained deposits, and the confining layers are comprised of fine-grained, well-compacted deposits. The unconsolidated geologic deposits (which include all the glacial and interglacial deposits) were classified into four aquifers and two confining beds and the underlying rock was classified as a confining layer that is present at the base of the groundwater system.
The two upper aquifers are the Alluvium (Qal) and the Vashon Recessional Outwash (Qvr). In many areas, these two units are hydrologically continuous and act as a single aquifer. The confining unit underlying the recessional outwash is the Vashon Till (Qvt). Underlying the till is the Vashon Advance Outwash (Qva), which is the principal aquifer in the County in terms of areal extent and groundwater usage. The Transitional Beds (Qtb) are the confining unit that underlies Qva. Below the transitional beds is a unit of Undifferentiated Sediments (Qu). The Qu are heterogeneous and are not well defined but are generally course-grained and have been lumped together as a single aquifer unit. At the base of the Qu is the bedrock (tb) which acts as a confining layer below the unconsolidated deposits. The tb consists of a variety of rocks including volcanic, conglomerate, sandstone, limestone, and other types.
8.2.2.1 Snohomish County Topography
The County contains several plateaus that are separated by river valleys. This topography is typical of the Puget Sound region, reflecting glacial and river activity of the past. The primary river valleys are oriented in an east-west direction and are occupied by the Snohomish River, the north and south forks of the Stillaguamish River, and the Skykomish River. Other significant lowland areas include the Pilchuck River valley and the Marysville trough, of which are primarily oriented in a north-south direction.
8.2.3 District Aquifer Sources
As noted above, seven principle hydrogeologic units have been identified within the County and more specifically described in the County CWSP. The following section discusses those units where District groundwater wells are located.
8.2.3.1 East Stanwood Aquifer
The East Stanwood (ES) Aquifer occurs in the advance outwash deposits and extends from northeast of Stanwood to northwest of Arlington on the plateau above the Stillaguamish River.

DRAFT
20-2733 Page 8-11 2021 Water System Plan Update February 2022 Snohomish County PUD No. 1
The aquifer ranges in thickness from fifty to several hundred feet thick. Transmissivity and hydraulic conductivity range from 25,000 to 100,000 gallons per day per foot (gpd/ft) and 50 to 200 feet per day (ft/day) respectively. Individual wells in the aquifer may yield up to 1,000 gpm near the southern margins and less than 50 gpm towards the north. The direct surface recharge potential to most of the ES Aquifer is low except along the southern margins where the advance outwash deposits are exposed at the surface. The overlying till or underlying aquifers are the primary sources of recharge. Existing development of the aquifer is estimated at 3 MGD. Potential future development capacity is estimated to be 3 MGD. Overall groundwater quality is considered good.
The potential vulnerability of the ES Aquifer to contamination from land uses is generally low, except along the southern margins where the aquifer is exposed at the surface. The land above the ES Aquifer has been zoned Rural, except in the urbanized western area near Stanwood and Cedarhome. The District operates one Group A water system with a well that taps the Stanwood aquifer: the Sunday Lake Water System; and one Group B system; the 212 Street Market & Deli Water System.
8.2.3.2 Skykomish Aquifer
The Skykomish Aquifer (SkA) occurs in the alluvial deposits and extends east-west from Monroe to Gold Bar in the Skykomish River valley. Individual wells in the aquifer may yield up to 2,000 gpm. The aquifer ranges from 10 to 100 feet in thickness. The estimated transmissivity and hydraulic conductivity range from 50,000 to 300,000 gpd/ft and 1,000 to 1,500 ft/day, respectively. The direct surface recharge potential to most of the SkA is high. Induced recharge from the Skykomish River and other surface water bodies is a significant source of recharge during high river stages. The aquifer discharges water to the river during the summer months. Overall groundwater quality is considered good.
Existing development of the aquifer is estimated to be 6 MGD and potential future development capacity is estimated to be 4 to 9 MGD. The District operates two Group A water systems with wells that tap the Skykomish Aquifer: May Creek and Skylite.
8.2.3.3 Tulalip Aquifer
The Tulalip aquifer (TuA) occurs in the advance outwash deposits and extends from the south of Stanwood to northwest of Marysville in the Tulalip Plateau west of the Marysville Trough. The TuA has been studied for designation as a sole source aquifer. It is estimated to be from fifty to several hundred feet in thickness. Transmissivity and hydraulic conductivity are estimated to range from 25,000 to 100,000 gpd/ft and 50 to 200 ft/day respectively. The direct surface recharge potential to most of the TuA is low except along the margins where the advance outwash deposits are exposed at the surface. The overlying till or underlying aquifers are the primary sources of recharge.
Existing development of the aquifer is estimated at 2 MGD. Potential future development capacity is estimated to be one to 4 MGD. Overall, the groundwater quality of the TuA is good.

DRAFT
20-2733 Page 8-12 2021 Water System Plan Update February 2022 Snohomish County PUD No. 1
The District operates one Group A water system with wells that tap this aquifer: The Kayak Point Water System (acquired in 2006) and the Warm Beach System. See Section 8.4 for further discussion on how these two systems are being consolidated into a single Warm Beach System.
8.2.3.4 Getchell-Snohomish Aquifer
The Getchell-Snohomish Aquifer (GSA) occurs in the advance outwash of deposits and extends from south of Arlington to the City of Snohomish on the Getchell-Snohomish Plateau to the east of the Marysville Trough. The Pilchuck River valley forms the eastern boundary, although there may be some indirect hydraulic connections with the Lakes aquifer below the Pilchuck River. The aquifer ranges from fifty to several hundred feet thick. Transmissivity and hydraulic conductivity range from 25,000 to 100,000 gpd/ft and 50 to 200 ft/day respectively. The aquifer may produce well yields up to 1,200 gpm. The direct surface recharge potential to most of the GSA is low except along the western and southern margins where the advance outwash deposits are exposed at the surface. Induced recharge from surface water bodies are not a significant source of recharge. Overlying till or underlying aquifers are the primary sources of recharge.
Existing development of the aquifer is estimated at 0.5 MGD. Potential future development capacity is estimated to be 0.5 to 4.5 MGD. Overall, groundwater quality of the GSA is considered to be good. The District operates one Group A water system with wells that tap this aquifer: Lake Stevens Integrated; and a Group B System - Otis.
8.2.3.5 Lakes Aquifer
The Lakes Aquifer (LA) occurs in the advance outwash deposits and extends from south of Granite Falls to Monroe, bordered by the Pilchuck River valley on the west, and extending southeast to Gold Bar above the Skykomish River valley. The aquifer becomes thinner and discontinuous to the east and has an indefinite eastern boundary where depth to bedrock is shallow. There may be some indirect hydraulic connection with the GSA below the Pilchuck River. The Newburg sole source aquifer has been designated for the northern portion of the aquifer. The aquifer is estimated to be fifty to several hundred feet in thickness. Transmissivity and hydraulic conductivity are estimated at 25,000 to 200,000 gpd/ft and 100 to 500 ft/day, respectively. Wells completed in the aquifer may yield up to 1,200 gpm.
The direct surface recharge potential to most of the aquifer is low except along the western and southern margins where the advance outwash deposits are exposed at the surface. Recharge from the overlying till or underlying aquifers is the primary source of recharge. Overall groundwater quality is considered to be good. Existing development of the aquifer is unknown but is estimated to be .025 MGD. Potential future development capacity is estimated to be 1 to 3 MGD. The District operates one Group A water system with wells that tap this aquifer: the Pilchuck 10 Water System.

DRAFT
20-2733 Page 8-13 2021 Water System Plan Update February 2022 Snohomish County PUD No. 1
8.3 Retail Water Service Area / Forecast Water Rights
The District’s Retail Water Service Area, which is described in Chapter 2, includes six satellite systems served by groundwater and five systems in the Lake Stevens Integrated area that receive treated surface water purchased from Everett. The thirteen existing water rights of the sources serving the District’s RSA are shown in Table 8-3.
Water Right Self-Assessment forms are provided in Appendix 8-2. The existing and projected consumption in these tables is based on the projected water demands from the tables at the end of Chapter 5. The District currently operates the Skylite Water System to produce water near the annual water limit and is refraining from making further connections to the system.
District satellite/retail water systems Skylite and 212 Market & Deli are non-expanding systems, operating at or near their capacity under the applicable water right or current DOH regulations. May Creek is an expanding water system with sufficient capacity to serve several hundred additional connections under its authorized water right. Use of the entire May Creek water right for domestic consumption has been constrained somewhat by a settlement agreement entered into by the District and Tulalip Tribe in 1999 as a condition of the Tribes’ dismissal of its objection to a proposed change application. The agreement stipulates that a portion of the groundwater pumped shall be returned to May Creek (as mitigation for groundwater withdrawal impact) when the peak daily groundwater withdrawal rate exceeds 277 gpm within any calendar day (398,880 gpd). The current average daily withdrawal rate is 60 gpm, and the estimated MDD is 174 gpm for 2040. The system has source capacity to meet anticipated growth and demand without mitigation requirements being triggered through 2040.
8.4 Groundwater System Expansions / Additions
On December 16, 2020, the District received approval by the DOH for an ALOP WSP amendment, which authorized the District to consolidate its recently acquired Warm Beach Water System with its existing Kayak Water System. The consolidation of the two systems, which includes joint storage, new interconnections, and other capital facility improvements, shall enable the District to achieve greater system reliability, efficiency, and redundancy in the provision of water supply to the Warm Beach and Kayak communities. The resulting consolidated water system, which is more fully described in the 2020 ALOP, is now referred to by the District as the Warm Beach Water System. A brief history of the Warm Beach Water System is provided below.
8.4.1 Warm Beach Water Association (WBWA)
The Warm Beach Water Association (WBWA) was initially formed in 1928 as a not-for-profit water system for the purpose of serving 68 homes located along Soundview Drive, which is located approximately five miles south of Stanwood. In 1948, the WBWA was serving 90 connections and re-organized as a for profit entity. In 1992, the water system was re-organized again into a non-profit mutual water system. This allowed WBWA to pursue state and federal loan assistance to construct necessary system improvements.

DRAFT
20-2733 Page 8-14 2021 Water System Plan Update February 2022 Snohomish County PUD No. 1
Since its initial formation, the WBWA evolved from a small residential water system holding a single surface water right to the waters of Lake Martha, into an expanding and substantial community-owned, mutual water system. By 2016, the water system served 590 service connections and an estimated population of 1,475 people. At this time, the WBWA water system is approved by the DOH to serve 750 connections and is serving 620 service connections. With system improvements, the District projects that the WBWA water system could serve a build-out up to 1,000 single family homes within the limitations of its existing, inchoate water rights.
The WBWA was issued four groundwater rights (G1-00718C, G1-24266C, G1-24690C, and G1- 25686P) with a total Qi of 318 gpm, a total Qa of 135 afy, and two surface water rights with a total Qi of 0.3 cubic feet per second (cfs) or 135 gpm and total Qa of 216 afy. The Qa of the groundwater rights appear to be non-additive to WBWA’s additive surface water annual quantity total of 216 afy. The Q is held under the groundwater rights all appear to be additive/primary quantities. The WBWA’s Wells 1 and 3 are currently inactive. Well 3 was recently rehabilitated and is used as an emergency source only.
Pursuant to RCW 90.03.015 (Municipal Water Law), the community domestic water rights held by the District for its Warm Beach system qualify as water rights for “municipal water supply purposes” and are considered water rights in “good standing” under the water code RCW 90.03.330(3). The WBWA’s most recent WSP was approved by the DOH in 2016. During its review of the WSP, Ecology reviewed and confirmed the instantaneous and annual quantities of the WBWA rights referenced above.
In 2016, the District commenced work with the assistance of a DOH grant to study the feasibility of the District assuming ownership and operation of the WBWA (now the Warm Beach Water System), including the cost of related improvements and appropriate engineering actions by which the WBWA could be consolidated with the District’s adjacent Kayak Water System to improve system reliability, redundancy, operational integrity, and emergency water access.
The above work resulted in the District securing an extension for Warm Beach groundwater permit G1-25686 (approved July 9, 2019) to 2035, and the preparation of a limited water system plan amendment (ALOP) that was submitted to DOH in March, 2020 and approved on December 16, 2020. The ALOP includes a discussion of how the District’s Kayak Water System groundwater rights (G1-22415 and G1-25989C) may be applied to limited beneficial use (e.g., maintenance, repair, and emergency circumstances) within the WBWA service area in accordance with RCW 90.03.386(2).
8.4.2 Kayak Water System (now referred to as Warm Beach Water System)
On May 17, 2016, the District submitted a request that Ecology conform the groundwater right certificates for the Kayak Wells 2 and 3 (G1-24415C and G1-25989C) to “municipal water supply purposes” and issue superseding certificates reflecting such status in accordance with RCW 90.03.560. Ecology issued the superseding certificates on November 4, 2016.

DRAFT
20-2733 Page 8-15 2021 Water System Plan Update February 2022 Snohomish County PUD No. 1
As described in Section 2.3 and above, pursuant to its review of the District’s March 2020 ALOP WSP Amendment to consolidate the Warm Beach and Kayak water systems, the ALOP (and consolidation) were approved by DOH on December 16, 2020, which included a place of use expansion of two Kayak Water System groundwater rights (G1-22415 and G1-25989C) in accordance with RCW 90.03.386(2).
The ALOP includes a discussion of how the two Kayak system groundwater rights may be applied to limited beneficial use (e.g., maintenance, repair, and emergency circumstances) within the original Warm Beach Water System service area. Beyond such circumstance, water supply for customers located within the former Warm Beach and Kayak water service areas is provided by their respective original wells/supply sources.
The combined retail service area/place-of-use expansion is also described in Section 2.3. The water right/place-of-use expansion requests cited in the ALOP were determined by the District and Snohomish County to not be inconsistent with the 2015 County Comprehensive Land Use Plan, the applicable zoning regulations, and designated population allocation.

DRAFT
20-2733 Page 8-16 2021 Water System Plan Update February 2022 Snohomish County PUD No. 1
Table 8-3 | Existing and Forecast Groundwater Rights for Retail Service Area
Permit or Certificate No. Priority Date Source Name/ Well No.
Flow Rate (Qi) (cfs) or (gpm)
Annual Quantity (Qa) (acre-feet/yr)
Well Capacity (cfs) or (gpm)
Purpose of Use
Additive Or Non-Additive
May Creek G1-20625C 05/17/1973 Wells 1 & 2 200 319.5 500 Municipal Additive
May Creek G1-*09360C Cert.#6488-A
04/04/1968 Wells 1 & 2 300 15 500 Municipal Additive
Skylite G1-22033C 08/05/1974 Well 1 100 29.7 100 Community Domestic
Additive
Sunday Lake G1-27418C 02/09/1994 Well 3 100 40.5 130 Municipal Additive
Sunday Lake G1-*09636C Cert.#07295
08/06/1968 Well 3 30 60 130 Municipal Additive
Otis n/a Well 1 33 Exempt (5.6)1 33 Domestic Additive
212 Market & Deli n/a Well 1 4 Exempt (5.6)1 4 Domestic Additive
Kayak G1-23278C 12/20/1978 Well 1 70 72 70 Community Domestic
Additive
Kayak G1-24415C 12/14/1983 Well 2 57 42 300 Community Domestic
Additive
Kayak G1-25989C 11/29/1990 Wells 2 & 3 300 1562 300 Community Domestic
Additive Non-Add
Lake Stevens Integrated S1-*07584C
12/28/1946 Lake Stevens
Integrated 0.5 cfs
224 gpm 362 224 Domestic Additive
Lake Stevens Integrated G1-*00782C Cert. #168-A
03/23/1948 Well 1 1,200 700 1,200 Municipal Additive
Lake Stevens Integrated G1-*00783C Cert.#169-A
03/23/1948 Well 2 1,200 700 1,200 Municipal Additive
Warm Beach G1-24266C Well 2 50 80 50 Municipal Additive
Warm Beach G1-25686P Well 4 200 135 155 Municipal Additive
Total 3,774 gpm 2,502.1 afy Note:
1. Exempt well quantities are not included in water right table Qi/Qa calculations 2. 57 gpm and 42 afy out of the 300 gpm and 156 afy quantities are covered by GWC G1-24415C.

!
!Ø
Lake Stevens Integrated Well 1 & 2
BARMON DOOR & PLYWOOD SITE
N Machias Rd44th St NE
20th St NE
Grade Rd
28th St NE
16th St NE
4th St NE
139th
Ave N
E
117th
Ave N
E
26th St NE
36th St NE
32nd St NE
N Lakes
hore R
d
Hartford Dr NE
E Lake Stevens Rd
113th
Ave N
E
22nd St NE
Callow Rd
34th St NE
123rd
Ave N
E
Old Hartford Rd
127th
Dr N
ECatherine Dr
116th
Ave N
E
118th Ave NE
19th St NE
PVT
112th Dr NE
131s
t Ave
NE
114th
Dr N
E
25th Pl NE
E Lakes
hore D
r
Bryc
e Dr
12th St NE
5th St NE
30th St NE
114th
Ave N
E
8th St NE
130th
Dr N
E
18th St NE
3rd St NE
118th
Dr N
E
128th
Dr N
E
120th Dr NE
142nd Ave NE
127th
Ave N
E
121s
t Dr N
E
14th St NE
125th Ave NE
124th Ave NE
10th St NE
7th St NE
128th
Ave N
E
127th
Ave N
E (Ite
n Rd)
9th Pl NE
Purple Pennant Rd
Heron PlMeadow Dr
119th
Dr N
E
128th Dr NE PVT
24th Pl NE
N Ny
den F
arms R
d
29th Pl NE
120th
Ave N
E
12th Pl NE
28th Pl NE
17th St NE
29th St NE
27th Pl NE
13th Pl NE
21st Pl NE
33rd St NE
35th Pl NE
122nd Ave NE
17th Pl NE
5th Pl NE
21st St NE
22nd Pl NE
13th St NE PVT
33rd Pl NE
115th
Ave N
E
44th Ct NE
125th
Dr NE
PVT
Kelli Pl NE
Doe W
ay
1st Pl NE
122nd Ct NE
14th Pl NE
113th Dr NE
29th Ct NE
2nd Pl NE
127th
Dr NE
36th St NE
123rd
Ave N
E
28th St NE
28th Pl NE
29th Pl NE
123rd
Ave N
E
PVT
PVT
PVT
29th Pl NE
17th Pl NE
125th Ave NE
21st St NE
131s
t Ave
NE
7th St NE
30th St NE
118th
Dr N
E
21st Pl NE
21st Pl NE
0 2,0001,000 Feet
20-2733October 2021
Legend!Ø Well
High Yield Zone! Contaminant Site
RoadsWater Bodies
K:\TAC_Projects\20\2733 - Snohomish County PUD - 2021 Water System Plan Update\CAD\GIS\MXD\Wellhead_Protection_Figures\LakeStevens.mxd 2/8/2021 1:51:53 PM Elisheva.Walters
© Snohomish County PUD2021 Water System Plan Update
Wellhead Protection Area
Figure 8-1
Data Sources:SnoPUDSnohomish County Geospatial Data Clearinghouse.Coordinate System: NAD 1983 StatePlane Washington North FIPS 4601 FeetProjection: Lambert Conformal ConicDatum: North American 1983Disclaimer: Snohomish PUD makes no representations, express or implied,as to the accuracy, completeness and timeliness of the information displayed.This map is not suitable for legal, engineering, or surveying purposes. Notificationof any errors is appreciated.
OLD CEDAR MILL (COOPER LUMBER)
Lake Stevens

RIVER
Langsholt
Cascade Quarry Dyno Nobel Spill
May Creek Well 1 & 2
SKYKOMISH
WALLACE RIVER
WALLACE RIVER
MAY CREEK
May Creek Rd
Reiter Rd
Gunn Rd
Ley R
d
8th St
5th St
6th St
9th St
Dorman Rd
7th St
19th
St
10th S
t
399th
Ave S
E
415th
Ave S
E
13th
St
3rd St
Meagan
Ct 164th St SE
Shelb
y St
419th
Ave S
E
Amanda Ave
Linda Ave
Evergreen Way
429th
Ave S
E
Timbe
r Ln
Everg
reen P
l
418th
Ave S
E
May C
reek C
t
0 2,0001,000 Feet
20-2733
Legend!Ø Well
1 Year Travel Time10 Year Travel TimeEcology Contaminant SiteNon-Commercial Potential Contaminant SourceRoadsWater Bodies
K:\TAC_Projects\20\2733 - Snohomish County PUD - 2021 Water System Plan Update\CAD\GIS\MXD\Wellhead_Protection_Figures\SnoPUDTemplate_11x17P_10-5.mxd 2/9/2021 5:31:36 PM Elisheva.Walters
© Snohomish County PUD2021 Water System Plan Update
Wellhead Protection Area
Data Sources:SnoPUDSnohomish County Geospatial Data Clearinghouse.Coordinate System: NAD 1983 StatePlane Washington North FIPS 4601 FeetProjection: Lambert Conformal ConicDatum: North American 1983Disclaimer: Snohomish PUD makes no representations, express or implied,as to the accuracy, completeness and timeliness of the information displayed.This map is not suitable for legal, engineering, or surveying purposes. Notificationof any errors is appreciated.
Figure 8-2October 2021

Warm Beach Well 4
Warm Beach Well 2
Warm Beach (Kayak) Well 3Warm Beach (Kayak) Well 2 & 3
LAKE SHOECRAFT
LAKE MARTHA
LAKE GOODWIN
LAKE HOWARD
LAKEROWLAND
CUMMINS LAKE
Marine Dr
140th St NW
Lakewood Rd
Frank Waters Rd
Happy Hollow Rd
Kayak Point Rd
W La
ke G
oodw
in Rd
56th
Ave N
W
Olive Ave
52nd
Ave N
W
156th St NW
184th St NW
220th St NW
Soun
dview
Dr NW
96th
Ave N
W
176th St NW
164th St NW
192nd St NW
188th St NW
Clarence Ave
63rd Ave NW
200th St NW
50th
Ave N
W
60th
Ave N
W
196th St NW
Beach
Dr
76th
Ave N
W
172nd St NW
167th Pl NW
148th St NW
48th
Ave N
W
180th St NW
126th St NW
201st St NW
185th St NW
94th
Dr N
W
46th
Ave N
W
61st Dr NW
Bateman Ave
82nd Dr NW
81st
Ave N
W
176th Pl NW92nd
Ave N
E
63rd
Dr N
W
173rd Pl NW
92nd
Dr N
W
Lakeview Ave
172nd Pl NW
Sunn
y Sho
res R
d
157th Pl NW
179th Pl NW
53rd
Dr N
W
188th St NW
52nd
Ave N
W
60th
Ave N
W
52nd
Ave N
W
184th St NW
0 2,0001,000 Feet
20-2733
Legend!Ø Well
1 Year Travel Time10 Year Travel TimeRoadsWater Bodies
K:\TAC_Projects\20\2733 - Snohomish County PUD - 2021 Water System Plan Update\CAD\GIS\MXD\Wellhead_Protection_Figures\SnoPUDTemplate_11x17P_10-5.mxd 2/9/2021 5:31:36 PM Elisheva.Walters
© Snohomish County PUD2021 Water System Plan Update
Wellhead Protection Area
Data Sources:SnoPUDSnohomish County Geospatial Data Clearinghouse.Coordinate System: NAD 1983 StatePlane Washington North FIPS 4601 FeetProjection: Lambert Conformal ConicDatum: North American 1983Disclaimer: Snohomish PUD makes no representations, express or implied,as to the accuracy, completeness and timeliness of the information displayed.This map is not suitable for legal, engineering, or surveying purposes. Notificationof any errors is appreciated.
Figure 8-3October 2021

SkyliteWells 1 & 2
SKYKOMISH RIVER
WALLACE RIVERWALLACE RIVER
Mann Rd
Reese Rd
367th
Ave S
E
Sultan-Startup Rd
363rd
Ave S
E
Kellog
g Lake
Rd
144th St SE
143rd Pl SE
Old Sultan-Startup Rd
368th
Ave S
E36
8th D
r SE
366th
Ave S
E 369th Ave SE
363rd
Ave S
E
0 2,0001,000 Feet
20-2733
Legend!Ø Well
1 Year Travel Time10 Year Travel TimeRoadsWater Bodies
K:\TAC_Projects\20\2733 - Snohomish County PUD - 2021 Water System Plan Update\CAD\GIS\MXD\Wellhead_Protection_Figures\SnoPUDTemplate_11x17P_10-5.mxd 2/9/2021 5:31:36 PM Elisheva.Walters
© Snohomish County PUD2021 Water System Plan Update
Wellhead Protection Area
Data Sources:SnoPUDSnohomish County Geospatial Data Clearinghouse.Coordinate System: NAD 1983 StatePlane Washington North FIPS 4601 FeetProjection: Lambert Conformal ConicDatum: North American 1983Disclaimer: Snohomish PUD makes no representations, express or implied,as to the accuracy, completeness and timeliness of the information displayed.This map is not suitable for legal, engineering, or surveying purposes. Notificationof any errors is appreciated.
Figure 8-4October 2021
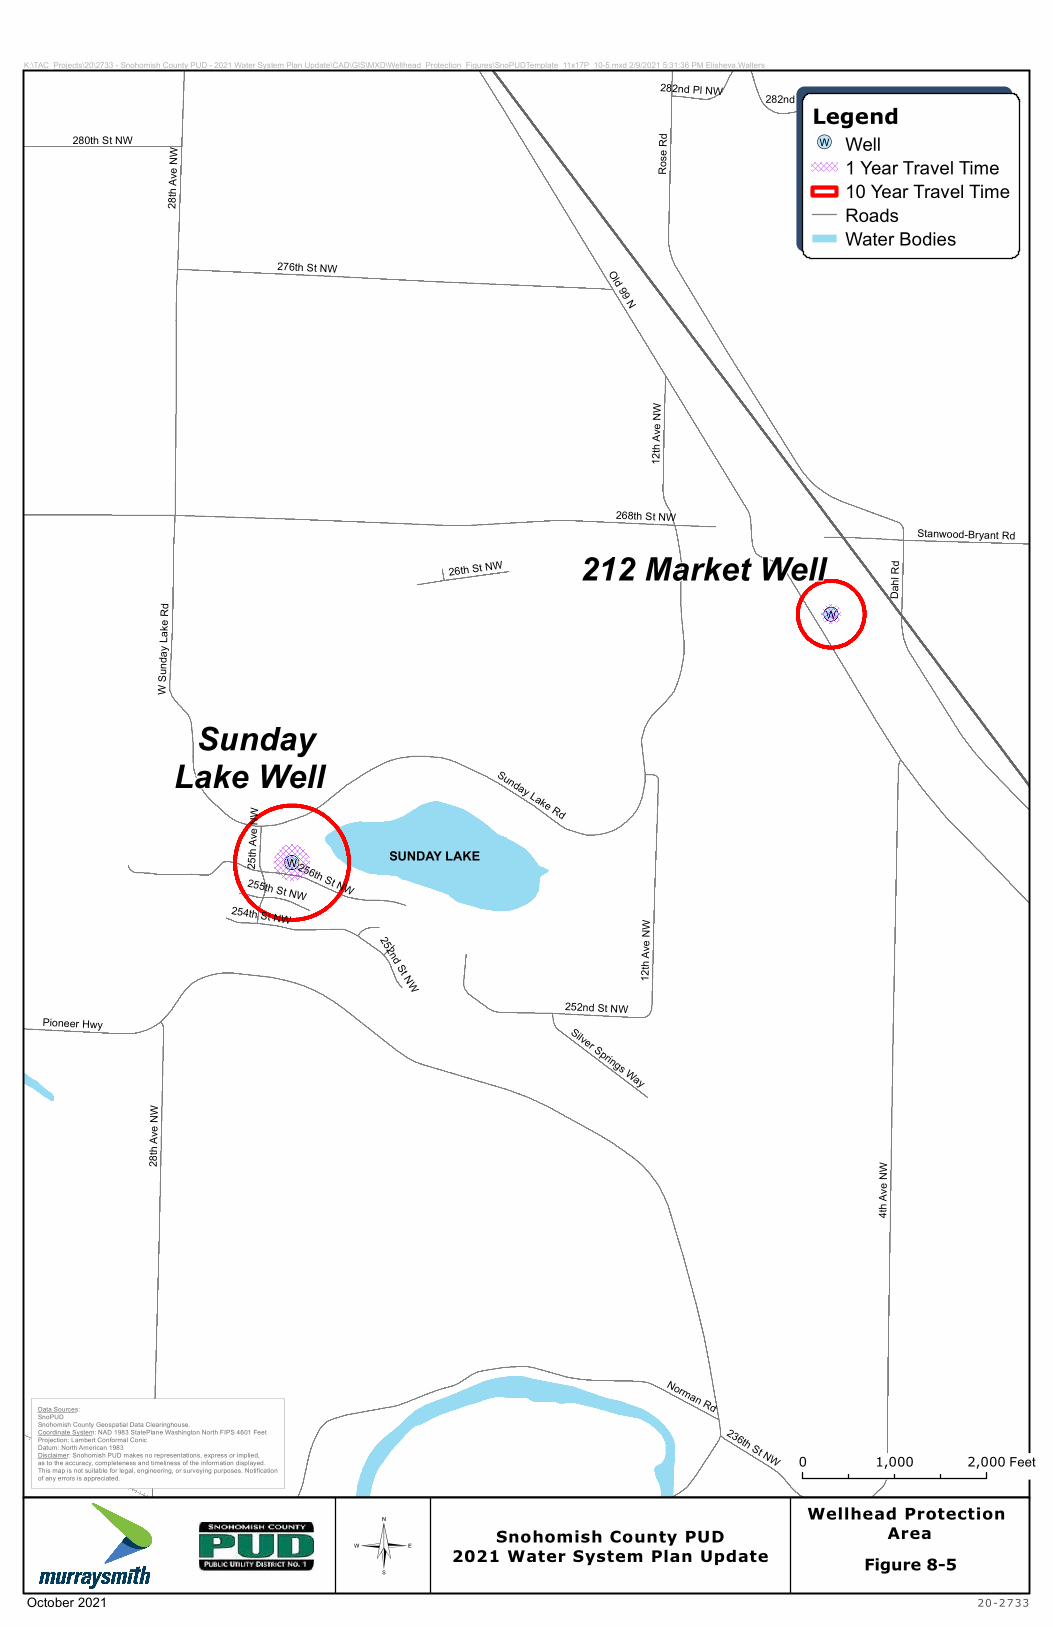
212 Market Well
Sunday Lake Well
SUNDAY LAKE
Old 99 N
Pioneer Hwy
4th Av
e NW
Rose
Rd
268th St NW
28th
Ave N
W
Norman Rd
Dahl
Rd
276th St NW
Sunday Lake Rd
256th St NW
12th
Ave N
W
252nd St NW
280th St NWW
Sund
ay La
ke R
d
254th St NW
7th Ave NW
Stanwood-Bryant Rd
236th St NW
25th
Ave N
W
Silver Springs Way
282nd Pl NW
255th St NW
26th St NW
12th
Ave N
W252nd St NW
28th
Ave N
W
282nd Pl NW
0 2,0001,000 Feet
20-2733
Legend!Ø Well
1 Year Travel Time10 Year Travel TimeRoadsWater Bodies
K:\TAC_Projects\20\2733 - Snohomish County PUD - 2021 Water System Plan Update\CAD\GIS\MXD\Wellhead_Protection_Figures\SnoPUDTemplate_11x17P_10-5.mxd 2/9/2021 5:31:36 PM Elisheva.Walters
© Snohomish County PUD2021 Water System Plan Update
Wellhead Protection Area
Data Sources:SnoPUDSnohomish County Geospatial Data Clearinghouse.Coordinate System: NAD 1983 StatePlane Washington North FIPS 4601 FeetProjection: Lambert Conformal ConicDatum: North American 1983Disclaimer: Snohomish PUD makes no representations, express or implied,as to the accuracy, completeness and timeliness of the information displayed.This map is not suitable for legal, engineering, or surveying purposes. Notificationof any errors is appreciated.
Figure 8-5October 2021

DRAFT
20-2733 Page 8-22 2021 Water System Plan Update February 2022 Snohomish County PUD No. 1
THIS PAGE INTENTIONALLY LEFT BLANK

Chapter 9

THIS PAGE INTENTIONALLY LEFT BLANK

DRAFT
20-2733 Page 9-1 2021 Water System Plan Update February 2022 Snohomish County PUD No. 1
Chapter 9
Operations and Maintenance
9.1 Operations Program
This chapter summarizes District goals and procedures to maintain water system reliability, performance, and water quality under routine and emergency conditions.
The goals and procedures referenced herein are reviewed periodically to respond to new or revised regulations; updated best management practices (BMPs); system modifications; and revisions in tools, equipment, and techniques. This chapter and referenced documents do not contain troubleshooting guidelines or manuals for individual pieces of equipment or treatment facilities. Such guidelines and manuals are retained at the District’s Water Operations Facility and at the site of the specific equipment or treatment facilities.
9.2 Organizational Structure and Responsibilities
The District organizational charts are shown in Figure 1-1 and Figure 1-2.
9.2.1 Assistant General Manager, Water Utility
The AGM of the Water Utility manages the operation, maintenance, engineering and related planning, design, and construction activities of the District’s water systems. This position manages the implementation of the capital improvement plans for the Water Utility including design, construction, inspection, land surveys, material requirements, and right-of-way acquisitions. In addition, this position serves as or supervises the licensed Operator-in-Charge of the District’s water systems. The current AGM has State certifications for Cross Connection Specialist (CCS), Water Treatment Plant Operator (WTPO)-1, Water Distribution Manager (WDM) -4, and is a registered professional Civil Engineer (CE) in the State.
9.2.2 Water Superintendent
The Water Superintendent manages daily activities related to the operation, maintenance, and related construction activities of the District’s water systems to ensure compliance with all state and federal regulations. This position can optionally serve as or supervise the licensed Operator-in-Charge of the District’s water systems in lieu of the AGM. The current Water Superintendent has State certifications for CCS, Water Distribution Specialist (WDS), and WDM-4, WTPO 2
This position also coordinates water quality testing, reporting, and record keeping ensuring compliance.

DRAFT
20-2733 Page 9-2 2021 Water System Plan Update February 2022 Snohomish County PUD No. 1
9.2.3 Water Crew Coordinator
The Water Crew Coordinator works under the direction of the Water Superintendent with the primary responsibility of providing direction, oversight, scheduling, permit coordination, and dispatch of the Water operations, maintenance, and construction activities performed by the operations staff for all of the District’s water systems.
9.2.4 Water Foremen
The Water Foremen work under the direct supervision of the Water Superintendent on tasks, projects, and priorities scheduled and dispatched by the Water Crew Coordinator. The Water Foreman position is responsible for leading the water crew in the completion of all water system operations, maintenance, and construction activities for the District’s Water systems. One of the Water Foremen is primarily responsible for the ongoing day-to-day operations and maintenance functions of the water systems and the other is primarily responsible for the larger construction related activities such as system repairs, installation of new water services, and maintenance projects that require a full crew and heavy equipment (vacuum excavator(s), dump truck(s), backhoe(s), etc.). The Water Foremen’s current certifications are listed in Table 9-1.
9.2.5 Water Maintenance and Operations Crew
Currently, the Water Operations Crew includes one Water Construction Inspector, one Water Electrician, eight journeyman Water Distribution Specialists, one Water Worker, and one Water Helper. Table 9-1 lists the current people on the water crew, including foremen and supervisors, their years of experience, current employment classifications and state certifications held.
The Water Operations crew, including the Water Foremen, perform routine and emergency maintenance, operations, repair, and construction of the District’s water systems, including collection of water quality samples and maintenance of all water treatment and pumping facilities. Crew members are available on a 24-hour/7-day basis to respond to emergencies (refer to Section 9.8.2.2 for a description of the District’s emergency on-call system).
While most of the crew members are journeymen, the District also has both the entry level Water Helper position which only progresses on District need and the Water Worker position, which is a two-year apprentice program that requires passing the State WDS-1 exam to progress into the WDS classification. When a person reaches the WDS classification, further progression from WDS-1 to WDS-6 is available through accumulating sufficient experience. Promotional opportunities within the same Journey level structure include the Water Construction Inspector, Water Foremen, Water Electrician, and Water Crew Coordinator.
The organization charts in Chapter 1 identify the structure of the Water Utility Division. Responsibilities for water system operations and maintenance are listed in Table 9-1.

DRAFT
20-2733 Page 9-3 2021 Water System Plan Update February 2022 Snohomish County PUD No. 1
Table 9-1 | Years of Experience and Waterworks Certifications
Name Title Years of Experience
Certifications1
Dale Aschenbrenner Water Crew Coordinator 37 CCS, WDS, WTPO-1, WDM-3
Arlee Barker Water Distribution Spec 28 CCS, WTPO-1, WDM-3
Thomas Blades Water Distribution Spec 6 CCS, WDM-2, WTPO-1
Jonathan Ebert Water Distribution Spec 5 CCS, WDM-1
Lee Ervin Water Construction
Inspector 14 CCS, WDM 2-, WTPO 1
Brett Gehrke Water Superintendent 28 CCS, WDS, WDM-4, WTPO 2
Jeff Ogilve Water Electrician 24 EL-01
Tom Heaphy Water Distribution Spec 25 CCS, WDS, WTPO-IT, WDM-3
Alan Luna Water Foreman 18 CCS, WDS, WDM-3, WTPO -1
Zach McKinney Water Foreman 22 CCS, WDS, WTPO-2, WDM-3
Tucker Nieman Water Distribution Spec 4 WDM 1
Kassidi Neal Water Helper < 1
Noah Rui Water Worker 3 WDM-1
Andrew Jacques Water Distribution Spec 3 WDS
Ron Sheppard Water Distribution Spec 4 CCS, , WDM 1
Monte Vitale Water Distribution Spec 6 WDM-1
Brant Wood Assistant General
Manager 29 CCS, WTPO-1, WDM-4, PE
Note: 1. BAT = Backflow Assembly Tester Certification
9.2.6 Engineering Staff
The District’s engineering staff include three principal engineers and two engineering technicians that are managed by the AGM of the Water Utility. The engineering staff responsibilities include water system project planning, design, and management, including project funding applications, permitting acquisition, and engineering services during construction.
9.2.7 Administrative Support
Administrative support is provided by one Senior Water Service Liaison, one Water Service Liaison, one Water Utility Administrator, one Water Utility Associate, and one Water Utility Specialist. Administrative support is led by the Manager of Water Business Services. These positions coordinate schedules and maintain PC-based records of the department’s activities. Job functions include maintaining daily operational records, documenting preventive maintenance work, generating work orders, responding to customer requests and complaints, payroll, accounts payable and receivable, and other administrative duties associated with maintenance and operation of the District’s water systems. Several of the Administrative staff hold WDM-1 State certification.
DRAFT
20-2733 Page 9-4 2021 Water System Plan Update February 2022 Snohomish County PUD No. 1
9.3 Personnel Certification
The WAC 248-55 requires public water systems to have a responsible state-certified Operator-in-Charge. The AGM serves as or supervises the licensed Operator-in-Charge of the District’s water systems. Certified personnel are required for positions that are in direct charge of public water systems or major segments of the system responsible for monitoring or improving water quality. Field personnel have one or more state certificates. A listing of personnel certifications can be found in Table 9-1.
All certified personnel must renew their certificates annually and demonstrate continued professional growth in the field by accumulating three related college credits, or Continuing Education Units (CEUs) every three years. The District’s Operations budget includes sufficient funding to ensure that all certified personnel meet CEU requirements.
9.4 Routine Operations and Preventive Maintenance
The District’s goal is to follow a routine schedule of operating, monitoring, and maintaining facilities within its water systems. The established schedule considers the features, use and critical role of each component, the number of customers served, failure or breakdown history, availability of staff resources and industry standards for maintenance.
If work schedules cannot be completed in a timely manner, the Water Superintendent evaluates established priorities, adjusts schedules, or revises staffing assignments to ensure that important work is completed. The District’s computerized maintenance management system tracks completion of work orders and any outstanding work. Exceptions are reviewed by the AGM.
In addition to visits by crew members, the District’s SCADA system electronically acquires data and monitors several status conditions at key pump stations, treatment facilities, master meters, and reservoirs. Key parameters at reservoirs include water level, rate of fill or draw, intrusion, high or low alarms, and status of electric power. At pump stations, key parameters include pump status, pressure, flows, intrusion, power failure, and chlorine residual where treatment is provided. At treatment facilities, key parameters include injection rates, chemical usage, pressure, flows, intrusion, power failure, and chlorine residual. When an alarm is received, a crew member is dispatched to evaluate and correct the problem. The District’s SCADA system is discussed in more detail in Section 9.4.10.
Refer to Table 9-2 for a summarized maintenance frequency description for each type of District facility.
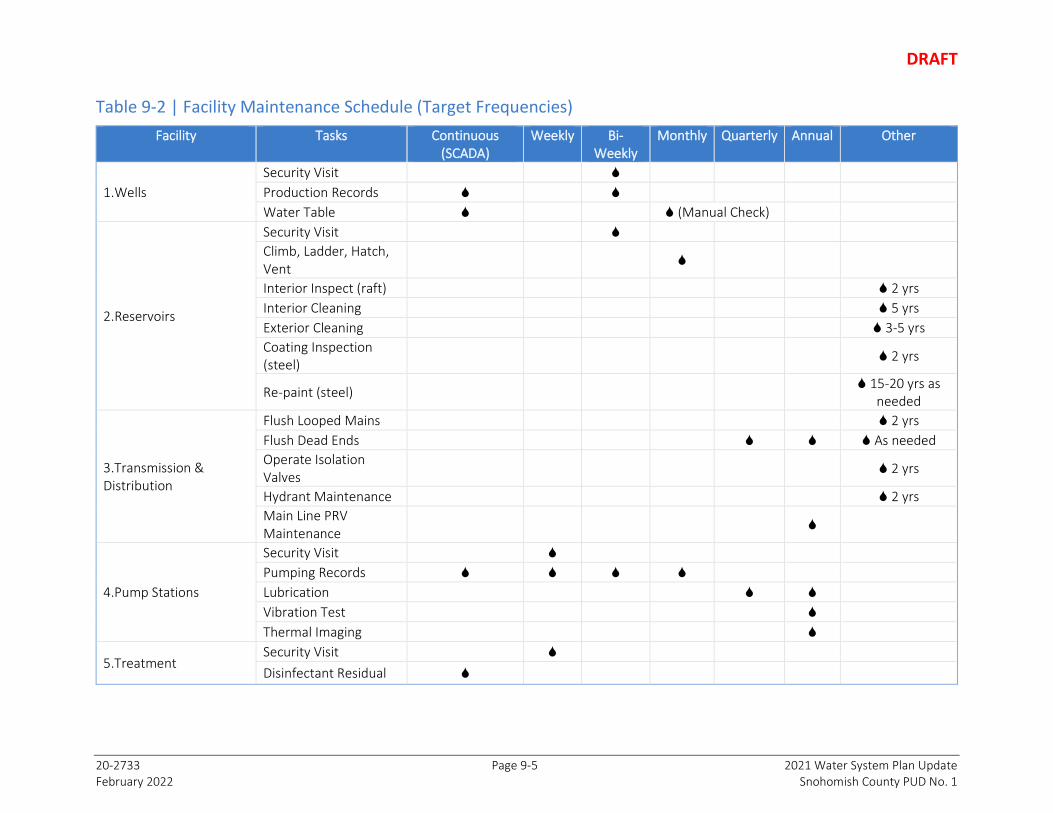
DRAFT
20-2733 Page 9-5 2021 Water System Plan Update February 2022 Snohomish County PUD No. 1
Table 9-2 | Facility Maintenance Schedule (Target Frequencies)
Facility Tasks Continuous (SCADA)
Weekly Bi-Weekly
Monthly Quarterly Annual Other
1.Wells
Security Visit
Production Records
Water Table (Manual Check)
2.Reservoirs
Security Visit
Climb, Ladder, Hatch, Vent
Interior Inspect (raft) 2 yrs
Interior Cleaning 5 yrs
Exterior Cleaning 3-5 yrs
Coating Inspection (steel)
2 yrs
Re-paint (steel) 15-20 yrs as
needed
3.Transmission & Distribution
Flush Looped Mains 2 yrs
Flush Dead Ends As needed
Operate Isolation Valves
2 yrs
Hydrant Maintenance 2 yrs
Main Line PRV Maintenance
4.Pump Stations
Security Visit
Pumping Records
Lubrication
Vibration Test
Thermal Imaging
5.Treatment Security Visit
Disinfectant Residual
DRAFT
20-2733 Page 9-6 2021 Water System Plan Update February 2022 Snohomish County PUD No. 1
9.4.1 Wells
The District operates wells at Sunday Lake, May Creek, Lake Stevens Integrated, 212 Market & Deli, Otis, Warm Beach, and Skylite. The goal is to visit wells twice weekly (see Table 9-2). Routine maintenance of wells includes monitoring production and regularly recording of depth to the water table. With the exception of Warm Beach Well 3, all wells are equipped with “submersible” pumps, which prevent any ongoing maintenance of the motor. All of the wells are metered. Pump flow rate well draw-down data, and ongoing measurements of voltage and amp draws can be compared to pump manufacturer’s data and well history to provide an indication of the pump and motor condition.
9.4.2 Reservoirs
The District’s goal is to visit each reservoir bi-weekly, including a “walk around” inspection for security and structural condition. The District’s construction standard for reservoirs includes a chain-link security fence and a climbing ladder with a lockable shield to prevent unauthorized access. If unusual activity is noticed during a routine visit, the reservoir is climbed to check the condition of the access hatch and vent.
Monthly, the goal is to climb each reservoir to observe the condition of the ladder, access hatch, vents, exterior coating, intrusion alarm, and other monitoring equipment. All access hatches are locked and designed to prevent entry of contaminants. Screens on the vents are checked at this time. The hatch is opened annually to allow a visual inspection of the interior coating, and to observe any unusual conditions.
Bi-annually, it is the goal to insert a sanitized raft into each steel reservoir, so that a more thorough inspection of the interior coating can be completed. It is desirable that on a five-year interval, each reservoir be taken out of service so the interior can be pressure-washed, and the condition of the reservoir and its coating can be closely inspected. However, this has not always been feasible where redundant reservoirs or water sources are not available. In these circumstances, firms are available to clean a reservoir while full of water. This WSP includes reservoir improvements to address redundancy in critical pressure zones, which will allow existing steel reservoirs to be taken out of service for recoating. It is anticipated that steel reservoirs will be recoated as needed on about a 15-20-year schedule.
9.4.3 Transmission and Distribution Pipelines
The District operates over 408 miles of pipelines, ranging in size from 3/4-inch to 30 inches in diameter. Materials include CI, AC, DI, PVC, and a small amount of galvanized and wrapped steel.
As water travels through the distribution system, its quality can be adversely affected. There are several factors that contribute to this, including: 1) water age (measured by the time it takes the water to travel from the source to the end user); 2) type and age of pipe (and associated corrosion by-products); 3) diminished disinfection residual, which contributes to bacteria growth

DRAFT
20-2733 Page 9-7 2021 Water System Plan Update February 2022 Snohomish County PUD No. 1
in pipelines; 4) formation of disinfection byproducts (DBPs); 5) cross-connections; and 6) methods used to repair main breaks.
Deterioration of water quality in the distribution system may be noticed and reported by customers as a “stale or musty” odor, an objectionable taste or color, or high turbidity (cloudiness). Water quality testing can also detect the formation of DBPs or bacterial contamination.
Common methods of dealing with these issues includes looping of piping to avoid “dead-end” mains, separating fill and outlet piping at reservoirs to circulate water, changing reservoir and pump “set points” seasonally, changing valving to occasionally “re-route” water, replacing corroded older mains, and routine main flushing where dead-ends or low-flow conditions cannot be avoided. In addition, a cross-connection control program and careful repair of broken mains are required.
The District’s routine main flushing program will focus on several parameters, including dead-end mains, areas with the longest travel times or “oldest water”, areas where routine monitoring shows low disinfectant residuals, and where water quality testing shows high results for Heterotrophic Plate Count (HPC) or DBPs. “Alert” and “Action” levels will be established for these parameters, to trigger remedial action to bring the factor into an acceptable range.
Flushing frequency is based on the water quality parameters; however, as a minimum the District’s goal is to flush every dead-end main annually and all mains bi-annually. For those areas needing more frequent flushing, use of automated blow-offs are under consideration.
The District employs methods for repairing main breaks that minimize the potential for contaminants entering the distribution system, such as maintaining positive pressure in the main whenever possible. Other techniques include use of a spray disinfectant, lowering the water table below the level of open pipes, flushing after the repair, and follow-up bacterial testing as needed.
Another goal for distribution system maintenance and repair is a reduction in the percentage of “unaccounted-for” water, including leakage. This effort includes replacing older service meters, coordination with the May Creek fire department on metering fire flow usage, AC pipe replacement, scheduled leak detection efforts, and prompt repair turnaround. Monthly production reports are routinely compared with total water sales to evaluate the effectiveness of these efforts.
9.4.4 Supply Pump Stations and Booster Pump Stations
In addition to continuous SCADA monitoring, supply and BPSs are visited weekly, depending upon the system and critical nature of the pump station. Routine checks include security, logging of pump condition, hourly meter readings and suction/discharge pressures. In larger pump stations, the District intends to begin annual vibration monitoring to better review and document the condition of the pumps. In addition, it is the District’s goal to scan the pumps and

DRAFT
20-2733 Page 9-8 2021 Water System Plan Update February 2022 Snohomish County PUD No. 1
control equipment bi-annually with thermal imaging scopes to look for electrical “hot spots” that may indicate loose connections, shorts, contamination, or deterioration of electrical components.
9.4.5 Treatment Facilities
All purchased surface water is treated at the Everett filtration plant, which includes filtration, disinfection, fluoridation, and pH/alkalinity adjustment. As such, the District is not responsible for operation of major treatment facilities; however, water treatment (iron and manganese removal and disinfection) is provided at several locations and may increase as additional remote/satellite water systems are assumed by the District.
Currently, the May Creek, 212 Market & Deli, and Skylite Water Systems are treated with sodium hypochlorite to maintain a free chlorine residual throughout the systems and facilities for injecting sodium hypochlorite have been provided at the Granite Falls Pump Station to ensure that chlorine residuals are maintained in the extremities of Lake Stevens Integrated system. These treatment facilities are checked routinely and are equipped with continuous chlorine residual monitors. In addition, the Granite Falls Pump Station includes a “feedback loop,” which adjusts the chlorine feed rate to maintain the desired amount. Records of chemical additions are retained, and copies are sent to the DOH monthly.
The Sunday Lake, Kayak and Warm Beach systems include treatment for removal of iron and manganese using sodium hypochlorite and potassium permanganate, followed by pressure filtration. These facilities are monitored continually by SCADA, and effectiveness of treatment is checked weekly at representative points in the distribution system. Monthly treatment reports are submitted to DOH.
9.4.6 Pressure Reducing Stations
The District has approximately 40 “main line” pressure reducing stations, and flow control valves between pressure zones. The District’s design standards include the provision of strainers ahead of the PRVs, which reduces malfunctions in the valves. The PRVs are checked and maintained on a set schedule.
9.4.7 Fire Hydrants
The District owns over 2,300 hydrants and the number increases annually due to acquisition of satellite systems, new developer construction, District initiated projects, and/or replacements of older systems. When new hydrants are installed or as existing hydrants are acquired as part of a satellite system, each is tested and entered into the District’s maintenance database.
Hydrants that are damaged, provide insufficient flow, or do not function properly are promptly repaired, upgraded, or removed from service. Non-operational hydrants are bagged, and the fire department is notified of the hydrant status and repair timeline. If the District is unable to
DRAFT
20-2733 Page 9-9 2021 Water System Plan Update February 2022 Snohomish County PUD No. 1
provide timely upgrades to an acquired satellite system having hydrants with deficient flows, the District contacts the applicable fire department to advise of the diminished flow, or the District may choose to remove the hydrant or disable the ‘steamer port’ until hydraulic improvements are made to increase the available flow (all other feasible alternatives are evaluated before the District removes a hydrant from service).
While the District’s goal is to exercise all hydrants annually (which would require operation and maintenance of over 190 hydrants per month), actual performance has not met this goal. To improve this, the District’s goal is to encourage fire districts to systematically inspect the District’s hydrants within their protection areas and report any deficiencies. In order to minimize damage from water hammer and to improve data provided from fire districts, the District’s goal is to routinely meet with the training officer from each fire district to provide information regarding proper hydrant use and possible adverse effects (water hammer), resulting from improper hydrant operation.
9.4.8 Valves
The District’s systems include over 6,772 “main line” valves, and as growth and development occur, dozens of new valves are added annually. All existing and new valves are included in the District’s mapping system and database. A structured valve maintenance program has been established, dedicating budgetary and staff resources to valve maintenance. The District also coordinates with state, county, and city road departments so that as pavement overlay projects are scheduled, valves are raised or adjusted to prevent valves from being ‘paved over’ and potentially ‘lost.’
While the District’s goal has been to routinely operate each valve at least every two years, this has not always been feasible. In addition, the District’s main flushing program incorporates operation of valves.
9.4.9 Main Flushing
The main flushing program was discussed under Section 9.4.3.
9.4.10 SCADA Network
The District’s SCADA system controls and monitors all supply and BPSs, wells, treatment facilities, master meters and reservoir sites within the District’s water service area. Radio-based status changes are transmitted from each site to a base station located at the Lake Stevens Integrated Water Operations Facility. The SCADA system also forces a poll of each site every hour to ensure that the site has not lost communication ability. Status conditions include information on pumps, rate of flow, power, security, pressure, water levels and more. If conditions do not match identified parameters, an alarm is sent, which immediately “pages” operations personnel. The operations person on-duty is provided with a laptop computer that, via modem, allows the operator to view the nature of the alarm and respond accordingly.

DRAFT
20-2733 Page 9-10 2021 Water System Plan Update February 2022 Snohomish County PUD No. 1
9.4.11 Staffing
Currently, the District has 20,026 water services with an operations crew of 15 people, for a ratio of one person for every 1335 services. As the population and number of systems grow, crew size will be evaluated and adjusted to ensure that proper operation, maintenance, and customer service is provided.
9.5 Water Quality Sampling
The provision of safe drinking water to the District’s customers is the issue that overrides all other tasks and functions. The water quality standards are established by the Federal EPA and are implemented and enforced by the DOH. The District is committed to working cooperatively with EPA and DOH to achieve compliance and ensure safe water for its customers. See Chapter 10 for additional details about the District’s water quality program.
9.6 Cross-Connection Control Program
Since cross-connections can result in contamination of drinking water, DOH has established the minimum requirements for a utility’s cross-connection control program. See Section 10.7 for additional details.
9.7 District Vehicles
The District’s vehicle fleet includes a number of vehicles and construction equipment used in operating, maintaining, and repairing water systems. It is the District’s goal to maintain sufficient staff, vehicles, and equipment to respond to two simultaneous emergencies, such as main breaks. If sufficient equipment is not available, the Water Utility can obtain additional equipment from the District’s Electric Utility or rent equipment from a number of firms in the area. The District also maintains an on-call emergency contract with a local contractor to deal with emergencies that cannot be handled with District personnel or vehicles.
9.8 Vulnerability Assessment and Emergency Procedure
The District has adopted both a Continuity of Operations Plan (COOP) (see Appendix 9-2), which is inclusive of all of the District’s departments, and a departmental specific Emergency Response Plan (ERP). The COOP uses a modified Incident Command Structure (ICS) corresponding to its normal organizational structure and reporting relationships. This modified ICS approach allows for the coordination of the District’s various departments, and the sharing of resources between the power, generation, and water utilities. The Water Utility’s ERP is a guide for personnel to identify the utility’s most vulnerable facilities, property, customers, and/or services. Included in the ERP are operating procedures, emergency alert rosters, equipment suppliers/technical representatives, adjacent facilities/utilities, and a contingency plan.

DRAFT
20-2733 Page 9-11 2021 Water System Plan Update February 2022 Snohomish County PUD No. 1
In the event of an emergency that exceeds the capabilities of the Water Operations and Maintenance (O&M) crews, staff from the District’s Water Engineering and Administration groups provide additional support. Further, under the COOP, the resources of the entire District (including the Electric Utility), are available to respond to an emergency. The Water Utility maintains a close relationship with other District departments such as Transportation (additional vehicles and mechanics), Facilities (carpenters and electricians), Communications (radio and portable communications), Customer Service and Dispatch Departments (dispatch during evenings and weekends), and the Electric System’s flagging crew. Key Water Utility staff receive training in both the Business Continuity Plan and the departmental specific ERP. Both the COOP and the Water Utility’s ERP are on file at the Water Operations Facility.
9.8.1 AWIA Risk and Resilience Assessment
A Risk and Resilience Assessment (RRA) was completed in accordance with the 2018 America’s Water Infrastructure Act (AWIA). The RRA considers the susceptibility of key water system components to damage, harm, or failure from a variety of potential sources and emergency conditions, including: 1) natural hazards (earthquakes, severe weather, floods, etc.); 2) dependency and proximity threats (loss of suppliers, loss of access roads, etc.); and 3) malevolent threats (vandalism, terrorism, etc.).
In addition, the RRA considers the magnitude of the potential impact on customers, availability of backup facilities and methods to detect the potential or actual failure. Finally, the RRA considers the probability of damage or harm, and plans should prioritize and address the most likely scenarios.
The major components of the District’s water systems were evaluated in the RRA, including: 1) sources of supply wells; 2) pump stations (supply and booster); 3) distribution system including mains and valves; 4) water treatment components; 5) reservoirs; and 6) operations infrastructure (ops buildings, SCADA systems, enterprise systems, and IT/Security systems). The results and recommendations of the RRA are provided in Appendix 9-1. The District’s ERP will be updated based on these recommendations.
9.8.2 Other Factors for Dealing with Emergencies
9.8.2.1 Security
Security must be in place to protect system integrity, deter or delay access, and alert personnel who will respond appropriately. All pumping and treatment facilities, control equipment and storage reservoirs are securely fenced and locked when they are unattended. The major facilities are equipped with intrusion sensors and intrusions are alarmed and monitored via SCADA. In addition, staff routinely visits facilities, and neighbors have been asked to report any unusual activity at the District’s facilities. The RRA provided in Appendix 9-1 includes recommendations for facility-specific security improvements that are intended to reduce the highest risks posed to the District.

DRAFT
20-2733 Page 9-12 2021 Water System Plan Update February 2022 Snohomish County PUD No. 1
9.8.2.2 Availability of Personnel
Trained staff is available to respond to emergencies 24 hours a day, 7 days a week. The District’s 24-7 Dispatch Center contacts the Water Utility’s on-call duty person, who then responds to after-hour emergencies. The Dispatch Center maintains lists of available specialized personnel; including engineering, warehousing, environmental, transportation and other support personnel if their assistance is needed in an emergency. If more people are needed, staff from the District’s Electric Utility would be available to assist (spill response, safety, heavy equipment operators, flaggers, etc.).
9.8.2.3 Communications
District staff utilize landline and cellular telephones, mobile radios, e-mail, or mail services to stay in contact with each other. A Corporate Communications Department is available to notify customers and the news media of emergency conditions in the water system. Mobile radios and telephones are installed in all vehicles. A personnel roster with assigned radio call numbers, pagers, home, and cell phone numbers has been provided for all staff. The District’s Dispatcher is equipped to communicate with all field personnel listed in the roster (see Table 9-3) by cellular phone, mobile radio, or landline.
Table 9-3 | Emergency Notification Numbers (Area Code is 425 Unless Indicated)
Name Title Office Phone Mobile Phone
City and County Agencies – Emergency Contacts During Business Hours
City of Lake Stevens 407-3970 N/A N/A
Snohomish County Sheriff 911 or 388-3393 N/A N/A
Snohomish County Emergency Management
388-5060 N/A N/A
Snohomish County Public Works 388-3488 N/A N/A
Snohomish County Health District
339-5200 N/A N/A
Snohomish County Fire Districts: 568-1954 N/A N/A
No. 4 – Snohomish 911 or 360-568-8787 N/A N/A
No. 5 – Sultan 911 or 360-793-1179
No. 8 – Lake Stevens 911 or 360-568-2141 N/A N/A
No. 12 – Marysville 911 or 360-363-8500 N/A N/A
No. 55 – May Creek 911 or 360-793-1335 N/A N/A
Lake Stevens Sewer District 334-8588 N/A N/A
DOH NW Regional Office 253-395-6750 N/A N/A

DRAFT
20-2733 Page 9-13 2021 Water System Plan Update February 2022 Snohomish County PUD No. 1
Name Title Office Phone Mobile Phone
Emergency Notification Roster – District Staff During Business Hours
Customer Service Day Time Number 783-1000 N/A
24- hour System Dispatch After Hours Number 783-8787 N/A
Water Operations Facility Day Time Number 397-3000 N/A
Brant Wood AGM 397-3003 425-903-1025
Brett Gehrke Water Superintendent 397-3003 750-3954
Christina True Roehl Manager, Water Business Services
397-3001 239-5576
Paul Federspiel Principal Engineer 397-3032 293-7218
Karen Heneghan Principal Engineer 397-3033 879-5580
Max Selin Principal Engineer 397-3037 206-841-9117
Dale Aschenbrenner Crew Coordinator 397-3005 359-0403
Alan Luna Maintenance and Operations Foreman
397-3052 239-0794
Zach McKinney Construction Foreman 397-3050 239-6471
Construction Inspector 397-3051 239-5763
Monte Vitale WDS 397-3038 339-6998
Arlee Barker WDS 397-3000 418-6830
Thomas Blades WDS 397-3000 238-3153
Jonathan Ebert WDS 397-3000 879-6704
Lee Ervin Crew Coordinator 397-3000 879-2464
WDS 397-3000 501-0596
WDS 397-3000 238-5279
Tom Heaphy WDS 397-3000 238-0897
Noah Rui Water Worker 397-3000 239-2651
Tucker Nieman Water Worker 397-3000 327-4499
Ron Sheppard Water Worker 397-3000 367-2017
Kevin Presler Engineering Tech III 397-3030 263-0022
Lillian Manley Engineering Tech I
Misty Stevens Water Service Liaison 397-3016 N/A
Lois Stone Water Service Liaison 397-3014 N/A
Amy Tonsgard Water Utility Specialist 397-3015 N/A
Tracy Boggs Water Utility Administrator 783-1704 N/A
9.8.2.4 Interties
The District maintains an emergency intertie in its May Creek system with Gold Bar that is located at May Creek Road. This intertie is available for mutual aid in the event of a major emergency. While the intertie is normally closed, the District has supplied water through the intertie in the past.

DRAFT
20-2733 Page 9-14 2021 Water System Plan Update February 2022 Snohomish County PUD No. 1
9.8.2.5 Auxiliary Power
As discussed previously, auxiliary power is available to all of the District’s critical facilities through the use of emergency generators:
▪ The Water Operations Facility is equipped with a standby generator, which is capable of providing power to the entire site. Telcom, computer, radio, and SCADA capabilities remain operational during power outage events. The site is equipped with an automatic transfer switch that transitions from normal line power to the standby generator during a power outage event.
▪ A stationary 100-kw diesel generator, stored at the Hillcrest BPS, normally acts as a direct standby power supply to the Hillcrest Pump Station. The site is equipped with an automatic transfer switch that transitions from normal line power to the standby generator during a power outage event.
▪ A stationary 100-kw diesel generator is stored at the Walker Hill Reservoir to serve the Walker Hill BPS. The site is equipped with an automatic transfer switch that transitions from normal line power to the standby generator during a power outage event.
▪ A trailer mounted 100-kw generator is stored at the Lake Roesiger Pump Station, and it would be available to serve other pump stations if needed. The site is equipped with an automatic transfer switch that transitions from normal line power to the standby generator during a power outage event.
▪ A 10-kw stationary propane-fueled generator supplies emergency power to the Skylite Water System. The site is equipped with an automatic transfer switch that transitions from normal line power to the generator standby during a power outage event.
▪ A 200-kw stationary diesel generator provides emergency power to the Granite Falls Pump Station. The site is equipped with an automatic transfer switch that transitions from normal line power to the generator standby during a power outage event.
▪ The Lake Stevens Integrated Well site has no emergency power backup but is equipped to accept connection to a mobile generator.
▪ The Warm Beach Well 4 has an existing standby generator that has insufficient capacity for both the well and booster pump. The District is planning to install a high-capacity generator to meet the entire facility electrical needs.
▪ The Warm Beach Well 2, Soperwood Supply Pump Station, Machias Pump Station, Glenwood BPS, Bosworth BPS, Storm Lake Ridge Supply Pump Station, Storm Lake Ridge BPS, and the May Creek and previously Kayak (now Warm Beach) well sites do not have emergency power backup on site but are equipped with a plug and transfer switch to rapidly accept power from a trailer-mounted generator.

DRAFT
20-2733 Page 9-15 2021 Water System Plan Update February 2022 Snohomish County PUD No. 1
▪ Two trailer-mounted 10-kw diesel generators are located at the Water Operations Facility and can be dispatched to various water sites as needed during power outage events.
▪ A trailer mounted 200-kw generator is stored at the Water Operations Facility which can be dispatched to various water sites as needed during power outage events. This generator is capable of supplying power to even the largest of the District’s pump stations, wells, and treatment facilities.
9.8.2.6 Materials, Supplies, and Technical Representatives
The District maintains a large inventory of routine and emergency materials and supplies at the Water Operations Facility and at strategic remote locations.
9.8.3 Contingency Plan
9.8.3.1 Emergency Roster
Emergency rosters listing contact phone numbers for District staff and other local/state agency personnel during business hours are included as Table 9-3. The District maintains a listing of personal telephone numbers should there be an emergency after regular business hours. A copy of these, with telephone numbers, is kept on file by District management and Electric System Dispatch personnel. Qualified field personnel can volunteer every 6 months to be on a list of employees who are assigned standby responsibilities on a rotating basis for after-hour callouts. Additional personnel are called as necessary based on the severity of the emergency.
9.8.3.2 Department of Health Notification
The AGM or designee will immediately notify DOH, in the event a water shutdown is required for more than 24 hours, or where water quality is determined to be unacceptable, or in any instance where public health is threatened.
9.8.3.3 Priorities
Where there is damage to District facilities, the AGM or designee will assess damages and prioritize operational efforts, repairs and/or reconstruction.
The order of priority includes:
1. Preservation of public health and safety: During an emergency, a water system serves a dual role of providing water for public health (consumption, sanitation, and food preparation), and public safety (fire protection). The District would strive to satisfy both roles; however, the District’s primary focus would be in support of public health.
2. Water quantity and quality: The District strives to provide a high-quality product at all times; however, during extreme conditions, “boil water” orders, or manual “dosing” of

DRAFT
20-2733 Page 9-16 2021 Water System Plan Update February 2022 Snohomish County PUD No. 1
chlorine in reservoirs could be used if water was available but its quality was unreliable. The priority would be to use the safest possible source of water and keep users informed.
3. Service delivery: The District would first focus on providing service to major population centers, hospitals, nursing homes, emergency centers (shelters, control centers). Subsequently, efforts would shift focus to less populated residential areas and businesses.
9.8.3.4 Location of Activities and Responsibilities
Large incidents or disasters may trigger the activation of the District’s Emergency Operations Center (EOC). The EOC will be located in the Commission Meeting Room at the Snohomish County PUD No. 1 Electric Headquarters building (2320 California Street, Everett WA 98201). Should the Electric Headquarters building be unavailable, the EOC will be located in the Central Conference Room at the District’s Operations Center (1802 75th Street SW, Everett WA 98203).
The District’s AGM, Water Utility will keep the General Manager and Board of Commissioners apprised of the current status of all emergency situations and as appropriate, may request the activation of the EOC.
In the event of a District-wide emergency (including the Electric Utility), the District’s AGM will convene as part of the Crisis Management Team and will:
▪ Analyze the situation and requests for assistance.
▪ Establish priorities for District response.
▪ Provide short-term planning (i.e., employee direction, return to work, restoration of work, media campaign).
▪ Receive and evaluate reports and assessments from the EOC.
▪ Structure requests for outside assistance.
▪ Provide for the continuation of business and the resumption of business.
The AGM will report to the Water Operations Facility, or if required, the EOC and will:
▪ Receive and record damage and injury assessments.
▪ Coordinate the engineering response.
▪ Coordinate the District’s activities with outside organizations and agencies.
▪ Coordinate requests for assistance from outside organizations and agencies.
▪ Coordinate the treatment and movement of the injured.

DRAFT
20-2733 Page 9-17 2021 Water System Plan Update February 2022 Snohomish County PUD No. 1
▪ Provide notification to and from families.
▪ Work with Corporate Communication to communicate with the media, the public, and with District employees.
▪ Direct damage mitigation, repair, and alternate site selection.
▪ Document the use of District resources during the emergency.
▪ Provide status summaries, as requested.
▪ Coordinate with the Crisis Management Team.
The Water Superintendent will report directly to the Water Operations Facility and will:
▪ Assess the disaster.
▪ Keep the Water staff informed.
▪ Direct emergency operations.
▪ Oversee repair operations.
▪ Work closely with the Water Crew Coordinator and Foremen for allocations of materials, equipment, and personnel.
The Water Crew Coordinator and Foremen will work closely with the Water Superintendent and will:
▪ Assess system damage.
▪ Make contact with end users regarding health and safety matters.
▪ Direct the water field crew in implementing and completing repairs and/or reconstruction.
▪ Document actions taken by the field crew.
▪ Work closely with the Warehouse Storekeeper for allocation of materials, equipment, and supplies.
The Water Field Crew will:
▪ Assist in assessing system damage and parts/supplies needed to effect repairs.
▪ Assess remaining, undamaged equipment and supplies.
▪ Execute repairs.

DRAFT
20-2733 Page 9-18 2021 Water System Plan Update February 2022 Snohomish County PUD No. 1
▪ Maintain contact with Water Foreman.
Warehouse Storekeeper will:
▪ Work closely with Water Foremen to ensure adequate materials, equipment, and supplies are allocated.
▪ Work closely with the District’s Warehouse Department to ensure sufficient materials, equipment, and supplies are available.
The Water Engineering Group will:
▪ Assist in assessing system damage.
▪ Assist in assessing remaining, undamaged equipment and supplies.
▪ Maintain contact with the AGM and Water Superintendent.
▪ Assess water quality and possible remediation.
▪ Assist Water Superintendent in establishing priorities.
The Water Administrative Services Group will:
▪ Answer the telephone at the Water Operations Facility.
▪ Maintain contact with the field crew using mobile radios, telephone, cellular phone, and/or pagers.
▪ Assist in documenting actions.
▪ Be responsible for keeping the District’s Customer Service Department informed.
▪ Assist in answering customer inquiries from the Electric Building.

Chapter 10

THIS PAGE INTENTIONALLY LEFT BLANK

DRAFT
20-2733 Page 10-1 2021 Water System Plan Update February 2022 Snohomish County PUD No. 1
Chapter 10
Water Quality and Compliance Introduction
10.1 Water Quality
The provision of a safe and reliable supply of water to District customers is of highest priority. All functions including administrative services, engineering design, and operations/maintenance serve to maintain and/or enhance water quality; all other functions are secondary to that task.
To provide for this, high quality facilities are constructed, operation and maintenance programs are implemented, and programs such as cross-connection control are put into place to protect and enhance water quality. Those topics have been discussed in other chapters of this WSP.
The purpose of this chapter is to discuss the program that is in place to monitor water quality. Since water quality can be adversely affected in a number of ways, the monitoring program is the final test of how well the systems have been designed, operated, and maintained. Further, this chapter identifies anticipated emerging water quality regulations so the District can continue to be a leader in responding to water quality issues before they become requirements.
10.2 Water Quality Monitoring - Integrated System
Drinking water quality is regulated in the United States by the EPA. Under provisions of the Safe Drinking Water Act (SDWA), the EPA may delegate primary enforcement responsibility for water quality control to each state. The State has primacy, and the DOH is the agency responsible for implementing drinking water regulations at least as stringent as the federally designated regulations. State drinking water regulations can be more stringent than federal regulations, but they cannot be less stringent. The current and future water quality regulations and their potential impact to the District are discussed in this section.
10.3 Current Regulations
The State, which maintains primacy over drinking water regulations, has published the Washington Administrative Code (WAC). The state drinking water regulations are contained in Chapter 246-290 of the WAC. Section 246-290-300(2)(a) specifies the following:
Source monitoring. Purveyors, with the exception of those that "wheel" water to their consumers (i.e., sell water that has passed through another purchasing purveyor's distribution system), shall conduct source monitoring under this chapter for the sources

DRAFT
20-2733 Page 10-2 2021 Water System Plan Update February 2022 Snohomish County PUD No. 1
under their control. The level of monitoring shall satisfy the monitoring requirements associated with the total population served by the source.
WAC 246-290-300(2)(b) specifies the following:
Distribution system monitoring. The purveyor of a system that receives and distributes water shall perform distribution-related monitoring requirements. Monitoring shall include, but not be limited to, the following:
(i) Collect coliform samples;
(ii) Collect disinfection by-product samples;
(iii) Perform the distribution system residual disinfectant concentration monitoring as required under WAC 246-290-451, 246-290-664, or 246-290-694;
(iv) Perform lead and copper monitoring under the Code of Federal Regulations (CFR) - 40 CFR 141.86, 141.87, and 141.88;
(v) Perform the distribution system monitoring in accordance with 40 CFR 141.23(b) for asbestos if applicable.
(vi) Other monitoring as required by the department.
As a wholesale customer of Everett, the Lake Stevens Integrated is required to comply with the specific drinking water regulations listed above. In general, the District must comply with regulations that apply to finished water impacts associated with chlorine in the distribution system. For the District’s purchased water supply, Everett is responsible for maintaining and documenting compliance with all requirements covering source water monitoring, maximum contaminant levels (MCLs) for specific compounds, filtered water quality, and disinfection contact time.
Provided in this chapter is the District’s compliance status for those regulations for which the District is responsible for demonstrating compliance within its Integrated System.
10.3.1 Revised Total Coliform Rule and Coliform Monitoring Plan
The District maintains two separate Coliform Monitoring Plans (CMPs), with the most recent updates in 2020. The first plan addresses the District’s Surface Water Systems, the second covers District-owned Groundwater Systems. Both plans can be viewed in Appendix 10-1A. The District is required to take no fewer than the minimum number of samples specified in Table 2 of WAC 246-290-300, Total Coliform Monitoring Frequency. Sites in both the Lake Stevens Integrated and other District water system areas were selected to ensure that representative sections of the distribution system are used for bacterial sampling. These same sites are used for monitoring of disinfection residuals in the distribution system. A subset of these sites is also used to monitor Disinfection By Products (DBPs) and Heterotrophic Plate Counts (HPCs).

DRAFT
20-2733 Page 10-3 2021 Water System Plan Update February 2022 Snohomish County PUD No. 1
The Revised Total Coliform Rule (RTCR) requires purveyors to periodically review and evaluate the potential need to change sample locations in order to account for distribution system changes that may have occurred, and/or are expected to occur over time. This approach will ensure that as a system expands representative monitoring will be achieved on an ongoing basis.
10.3.2 Disinfectants and Disinfection Byproduct Rule and Disinfection Byproduct Monitoring Plan
10.3.2.1 Disinfectants and Disinfection Byproduct Plan Stage 1
The District has been monitoring DBPs, including Trihalomethanes (THMs) and Haloacidic Acid 5 (HAA5) in the distribution system for many years to maintain compliance with the existing DBP standards. Total THM sample results, collected from the Lake Stevens Integrated System, have ranged in concentrations from 9.6 to 54.0 parts per billion (ppb), with an average concentration of 40.3 ppb (2016 through 2020). The HAA5 samples collected during the same time-period ranged from 9.0 to 48.1 ppb with an average concentration of 36.0 ppb. Therefore, the District has consistently met the current MCL of 80 ppb for Total THMs and 60 ppb for HAA5’s.
The District’s Stage 1 Disinfectants and Disinfection Byproducts (D/DBP) monitoring plan originally used four sites in the Lake Stevens Integrated System for DBP sampling. The sites are all located downstream of where water is re-chlorinated at the Granite Falls BPS. The plan was originally written in 2002.The monitoring plan includes Lake Stevens Integrated and monitoring locations within other District-owned water systems with DBP monitoring requirements. .
To select the Stage 1 sites within Lake Stevens Integrated, hydraulic modeling studies were conducted. “Time of travel” hydraulic modeling studies (up to 400 hours of residence time in the distribution system), indicated that the water age at all four sites is greater than 50 percent of the maximum residence time. The site with the maximum residence time is Site #25, 2020-155th Avenue NE, as shown in the coliform sampling plan. In addition to DBP monitoring, monthly chlorine residuals are collected at all 60 routine coliform monitoring sties, and an automatic, continuous chlorine residual analyzer is installed at the Granite Falls BPS.
In addition to Lake Stevens Integrated, the District is the owner of eight Group A Systems with varying DBP monitoring requirements. Provided in Table 10-1 is a summary of Stage 1 D/DBP results listing the range detected in 2019 and the five-year average of results (2016 to 2019).

DRAFT
20-2733 Page 10-4 2021 Water System Plan Update February 2022 Snohomish County PUD No. 1
Table 10-1 | Other Group A Water Systems D/DBP Monitoring Results
Surface Water Systems: 2020 Results: Five-year Average:
Lake Stevens Integrated, Arlington, HAA5: 8 – 48.1 ppb 36.0 ppb
and Granite Falls TTHM: 9.6 - 54 ppb 40.3 ppb
Creswell HAA5: 34.0 – 36.0 ppb 35.4 ppb
TTHM: 36.0 ppb 37.3 ppb
Storm Lake Ridge HAA5: -37.0 ppb 41.0 ppb TTHM: -30.0 ppb 33.9 ppb
Groundwater Systems:
May Creek HAA5: 0 - 0 ppb 1.2 ppb TTHM: 1.6 ppb 2.3ppb
Warm Beach HAA5: 5.1 ppb 6.8 ppb TTHM: 7.0 ppb 6.5 ppb
Kayak HAA5: 0.0 ppb 1.2 ppb
(part of Warm Beach water system area) TTHM: 7.2 ppb 9.6 ppb
Sunday Lake HAA5: 15.8 ppb 17.6 ppb TTHM: 31.0 ppb 31.4 ppb
Note: Disinfection of the Kayak part of Warm Beach water system area began in August of 2009.
10.3.2.2 Disinfectants and Disinfection Byproduct Rule Stage 2
The Stage 2 Disinfectants and Disinfection Byproducts Rule (DBPR) and the Long-Term 2 Enhanced Surface Water Treatment Rule (LT2) were both published in the Federal Registry in January 2006. The Stage 2 DBPR applies to all public water supplies that treat with a primary or residual disinfectant other than ultraviolet (UV). The rule requires all systems evaluate their distribution systems, identifying locations with high levels of disinfection byproducts that will become the sampling sites. The rule also requires systems to meet the MCLs for the Total THM and HAA5 as an average at each of the new monitoring locations instead of as a system-wide average as was allowed with the Stage 1 DBP. Due to the diversity of water systems owned by the District, multiple paths were followed in meeting the requirements of the Stage 2 DBPR. The District conducted system specific studies and obtained Very Small System (VSS) Waivers, where applicable. A summary of District’s Stage 2 requirements and monitoring schedules can be viewed in Appendix 10-2.
10.3.3 Surface Water Treatment Rule
Of the requirements stipulated by the Surface Water Treatment Rule (SWTR), only one requirement is applicable to the District. The majority of the burden of compliance with the SWTR lies with Everett, the water supplier.
Under the SWTR, the District is required to demonstrate detectable residual chlorine concentrations in at least 95 percent of the samples collected in a calendar month. With the adoption of the Group A WAC changes in January 2017, detectable residual disinfectant concentration has been defined and must be at least 0.2 mg/L. The District gathers information

DRAFT
20-2733 Page 10-5 2021 Water System Plan Update February 2022 Snohomish County PUD No. 1
on measured free chlorine residuals at the coliform sampling points, which are located throughout each of the District’s systems.
From the available data for surface water systems served by the District from 2016 to 2020, measured free chlorine residuals have ranged from 0.20 to 2.2 milligrams per liter (mg/L). Data for groundwater systems have measured 0.13 to 1.74 mg/L during the same time-period. Thus, the District has maintained compliance with the applicable requirement of the SWTR. Provided that no significant changes in water quality or chlorine dosing levels occur, the District will continue to comply with the requirement.
10.3.4 Lead and Copper
Everett organized and managed a group sampling effort to demonstrate compliance with the LCR. During a six-month period in 1992, a total of 26 water districts and cities participated in the Everett Consecutive System Sampling Plan. From the data for this period, the 90th percentile lead concentration was 0.013 mg/L and the 90th percentile copper concentration was 0.79 mg/L. Therefore, the results demonstrated compliance with both the lead and copper limits. The District continues to participate in the Everett Consecutive System Sampling Plan for Group A surface water systems until 2013, when it began the full time use of its Lake Stevens Wells Treatment Facility. Refer to Table 10-2 for historical 90th percentile results.
The LCR dictates that sampling for the District’s groundwater systems be conducted every third year. Sampling for the Kayak, May Creek, Skylite, and Sunday Lake systems have yielded results for lead in the range from Not Detected (ND) to 0.012 parts per million (ppm). Results for copper ranged from 0.009 to 0.404 ppm. All results were well below established MCLs.
Table 10-2 | Everett Regional Lead and Copper Monitoring Results
90th Percentile (mg/L)
Sample Period Lead Copper
1993 0.010 0.407
1996 0.008 0.371
1997 0.006 0.186
2000 0.003 0.130
2003 0.003 0.068
2006 0.003 0.072
2009 0.003 0.188
2012 0.002 0.109
2015 0.004 0.766
2018 0.002 0.936
10.4 Water Quality Monitoring – Other Group A Systems
The District samples and monitors water quality in accordance with the State Drinking Water Regulations for Group A Public Water Systems, Chapter 246-290 WAC. The water quality

DRAFT
20-2733 Page 10-6 2021 Water System Plan Update February 2022 Snohomish County PUD No. 1
monitoring requirements for the District are presented in Appendix 10-3. The monitoring requirements vary depending on the source of water for the specific system (Everett source or groundwater).
As source water supplier for Lake Stevens Integrated water system, Everett is responsible for the monitoring of any source water quality parameters. The District’s water quality monitoring requirements for surface water systems consist of asbestos, bacteriological monitoring, chlorine residual, lead and copper, DBPs, and other parameters as directed by the EPA or DOH. Groundwater monitoring consists of asbestos, bacteriological monitoring, chlorine residual, lead and copper, DBPs, VOCs, SOCs, Inorganic Contaminates (IOCs), radionuclides, and other parameters as directed by the EPA or DOH.
Based on the population served by each Group A system, the District is required to collect a minimum number of bacteriological samples monthly. These routine samples are collected throughout the District’s service area and are representative of water quality throughout the distribution system. Both the surface and groundwater plans can be viewed in Appendix 10-1A. Historic records of bacteriological monitoring samples are recorded and maintained on file for five years.
The DBP compliance monitoring is conducted in accordance with DOH WAC 246-290-300(6) and has been completed successfully by the District over the past several years. It is not anticipated that compliance status will change in the future.
10.5 Consumer Confidence Reports and Public Notification Rule
Under the SDWA 1996 Amendments, community water systems are required to provide an annual Consumer Confidence Report (CCR) on the source of their drinking water and levels of any contaminants found. The annual report must be supplied to all customers prior to July 1 of each year and must include:
▪ Information on the source of drinking water,
▪ A brief definition of terms,
▪ If regulated contaminants are detected, the MCL goal (MCLG), the MCL, and the level detected,
▪ Information on health effects if an MCL is violated,
▪ Information on levels of unregulated contaminants if the EPA requires it, and
▪ Arsenic education language (which applies to the Sunday Lake system only).

DRAFT
20-2733 Page 10-7 2021 Water System Plan Update February 2022 Snohomish County PUD No. 1
As a wholesale supplier, the District must also provide its wholesale customers with the necessary water quality data and other related information needed to prepare their own CCRs by April 1st of each year.
The District’s first CCR was distributed in 1999 and has been delivered to customers every year since. The District currently produces two separate CCRs. The first report addresses the Lake Stevens Integrated Water System. The second report is written for the satellite systems, including May Creek, Skylite, Sunday Lake, 212 Market & Deli, and Warm Beach. The 2019 CCR provided to customers is provided as Appendix 10-4.
While the CCR provides annual “state-of-the-water” reports, the Public Notification Rule directs utilities in notifying customers of non-acute and acute violations when they occur. In the event that District results for coliform or chlorine residual exceed a maximum contaminant level, the District is required to notify the Department of Health in accordance with WAC 246-290-480.
Public notification is designed to protect public health. As a public water supplier, the District is required by law to prepare and distribute public notification to consumers. Public notification is required by the District if any of the following conditions apply:
▪ The District violates a drinking water quality or monitoring requirement.
▪ The District is operating under a variance or exemption.
▪ The District has any situation that poses a public health risk, such as a disruption in service.
▪ The District receives an order from the Office of Drinking Water.
▪ The District fails to comply with an Office of Drinking Water order.
▪ The District receives a red operating permit.
Public notification timing and distribution requirements depend on the level of threat associated with the violation or event, such as:
Tier 1 (Immediate Notice, Within 24 Hours) Notice as soon as practical or within 24 hours via radio, TV, hand delivery, posting, or other method specified by the DOH, along with other methods if needed to reach persons served. The District must also initiate consultation with DOH within 24 hours. The DOH may establish additional requirements during consultation.
Tier 2 (Notice as Soon as Possible, Within 30 Days) Notice as soon as practical or within 30 days. Repeat notice every three months until violation is resolved. Notices shall be delivered via mail or direct delivery. The DOH may permit alternate methods. The District must use additional delivery methods reasonably calculated to reach other consumers not notified by the first method.

DRAFT
20-2733 Page 10-8 2021 Water System Plan Update February 2022 Snohomish County PUD No. 1
Tier 3 (Annual Notice) Notice within 12 months; repeated annually for unresolved violations. Notices for individual violations can be combined into an annual notice (including the CCR if public notification requirements can still be met). Notices shall be delivered via mail or direct delivery.
10.6 Emergency Response Program
Back-up facilities and safety procedures for the major elements of the water system were previously identified under Chapter 9 (Operations and Maintenance) of this WSP. A comprehensive ERP and COOP have been prepared by the District. The following elements are being included in the ERP:
▪ Risk and resilience assessment of major facilities; ▪ Emergency operations procedures; ▪ Inventory of material, supplies and chemicals; ▪ Emergency contacts and phone numbers; ▪ Interagency agreements.
10.7 Cross-Connection Control Program
The District Board of Commissioners adopted Resolution 2535 which declares cross-connections that endanger water quality to be unlawful, and which requires the installation of backflow prevention devices. This resolution adopts the State regulations and the American Water Works Association (AWWA) guidelines regarding cross-connection control. A copy of the resolution is contained in Appendix 10-5. A Senior Water Liaison in coordination with our Water Superintendent has been assigned the task of further developing and implementing this program.
10.8 Anticipated Water Quality Regulations
As drinking water regulations are continuously changing, it is important that District staff continue to anticipate and track the development of these regulations. A few regulations on the horizon are listed in the sections below.
10.8.1 Endocrine Disruptors
Endocrine disruptors are chemicals that interfere with the human (or animal) body’s endocrine, or hormone system. The Safe Drinking Water Act requires drinking water to be monitored or screened for endocrine disruptors but there are no regulatory limits on them. The EPA also requires pesticide manufacturers to document the presence of endocrine disruptors in their products. In 2015, the EPA published guidelines under Guideline Series 890 on how to perform tests that “determine if a chemical substance may pose a risk to human health or the environment due to the disruption of the endocrine system”. It is possible that regulations may evolve from EPA’s research on this topic in the future.

DRAFT
20-2733 Page 10-9 2021 Water System Plan Update February 2022 Snohomish County PUD No. 1
10.8.2 Radon
The EPA proposed new regulations to reduce the public health risks from radon on November 2, 1999, in the Federal Register (64 FR 59246). The proposed standards will apply to community water systems that regularly serve 25 or more people and that use groundwater or mixed ground and surface water (e.g., systems serving homes, apartments, and trailer parks). They will not apply to systems that rely on surface water where radon levels in the water are very low. The proposal will provide states flexibility in how to limit exposure to radon by allowing them to focus their efforts on the greatest radon risks - those in indoor air - while also reducing the risks from radon in drinking water.
The unique multimedia framework for this proposed regulation is outlined in the SDWA as amended in 1996. The proposed regulation offers two paths to compliance:
▪ First Option
The state can choose to develop enhanced state programs to address the health risks from radon in indoor air -- known as Multimedia Mitigation (MMM) programs -- while individual water systems reduce radon levels in drinking water to 4,000 picoCuries per liter (pCi/L), or lower. The EPA is encouraging states to adopt this option because it is the most cost-effective way to achieve the greatest radon risk reduction.
▪ Second Option
If a state chooses not to develop an MMM program, individual water systems in that state would be required to either reduce radon in their system's drinking water to 300 pCi/L or develop individual local MMM programs and reduce levels in drinking water to 4000 pCi/L. Water systems already at or below 300 pCi/L standard would not be required to treat their water for radon.
10.8.3 Proposed Revisions to the Lead and Copper Rule
In October 2019, the EPA published proposed changes to the LCR. These proposed changes include identifying the most impacted areas, strengthening treatment requirements, replacing lead service lines, increasing drinking water sampling reliability and improving risk communication to customers.
10.8.4 Future PFOA and PFOS Regulations
The EPA issued health advisories for Perfluorooctanoic Acid (PFOA) and Perfluorooctane Sulfonate (PFOS) in the spring of 2016. The PFOA, PFOS, and other PFASs are a family of chemicals used since the 1950s to manufacture stain-resistant, water-resistant, and non-stick products. Certain types of firefighting foam contain PFAS. These firefighting foams were historically used by the U.S. military, local fire departments, and airports.

DRAFT
20-2733 Page 10-10 2021 Water System Plan Update February 2022 Snohomish County PUD No. 1
Overtime, PFASs leached into groundwater and has contaminated drinking water. Exposure to PFAS over certain levels may result in adverse health effects. The current EPA health advisory level is at 70 parts per trillion.
The State Board of Health began rulemaking for PFAS in drinking water in late 2017. In November 2019, draft State Action Levels (SALs) were published. These draft SALs test for five PFAS as indicators to identify PFAS contamination in public drinking water supplies. Draft SALs are 10 nanograms per liter (ng/L) for PFOA, 15 ng/L for PFOS, 14 ng/L for perfluorononanoic acid (PFNA), 70 ng/L for perfluorohexanesulfonic acid (PFHxS), and 1,300 ng/L for perfluorobutanesulfonic acid (PFBS).
10.9 Laboratory Certification
The District uses state-certified laboratories for sample analyses.
10.10 Water Quality Sampling and Violation Response Procedures
Providing safe drinking water to the District’s customers is the issue that overrides all other tasks and functions. The water quality standards (MCLs) are established by the federal EPA and are implemented and enforced by the DOH. The District is committed to working cooperatively with EPA and DOH to achieve compliance and ensure safe water for its customers.
10.10.1 Monitoring
The frequency, number, and type of water quality tests required of the District’s different systems vary. The District’s coliform monitoring and DBP monitoring plans are found in Appendix 10-1A and Appendix 10-2, respectively, while other water quality monitoring requirements can be viewed in Appendix 10-3. As population growth occurs and as additional requirements are imposed, the District adjusts the quantity and frequency of samples collected to conform to regulatory requirements.
Monitoring is an especially challenging task for the District due to its number of satellite systems and their diversity in size, age, sources, and location. The District is working hard to make their monitoring program cohesive and effective across its systems.
10.10.2 Reporting and Public Notification
The results of required water quality testing are provided to the District and DOH by the testing laboratories. Annually, the District’s water customers are also informed of the test results through distribution of an annual CCR (see Appendix 10-4). The CCR lists results of the tests that have been performed, including any violations of MCLs.

DRAFT
20-2733 Page 10-11 2021 Water System Plan Update February 2022 Snohomish County PUD No. 1
10.10.3 Customer Inquiries and Record Keeping
The District is dedicated to providing good customer service and timely responses to customer inquiries. Inquiries are documented and tracked using a District-supported software system and the data is used to establish trends, focus maintenance and flushing efforts, and to obtain valuable feedback from customers. In addition, the District logs various inquiries relating to leaks, main breaks, pressure, and other service issues.
10.11 Treatment and Monitoring Violation Procedures
The District has established procedures in conformance with WAC 246-290-71001 (Public Notification) for cases when the system violates a primary water quality standard or fails to meet treatment, monitoring, and analytical testing requirements (see Appendix 10-6 for sample notifications).
Public notices must provide a clear explanation of the violation, adverse health effects, remedial action being taken, and steps the consumers should take to minimize risk. Notices are to be distributed by newspaper notice, by direct mail, or hand-delivery within specific time frames depending on the nature of the violation. If the violation is for acute coliform, nitrate, waterborne disease outbreak, or other acute violation determined by the DOH, there would be broadcast media announcements within 72 hours of the violation. The District closely coordinates all public notifications with DOH and the County Health Department.

DRAFT
20-2733 Page 10-12 2021 Water System Plan Update February 2022 Snohomish County PUD No. 1
THIS PAGE INTENTIONALLY LEFT BLANK

Chapter 11

THIS PAGE INTENTIONALLY LEFT BLANK
DRAFT
20-2733 Page 11-1 2021 Water System Plan Update February 2022 Snohomish County PUD No. 1
Chapter 11
Improvement Program
The intent of the District’s CIP is to maintain and/or improve water service over the next 20 years while accommodating planned growth. Recommended improvements identified in previous chapters form the basis of the CIP as described in Table 11-1, Figure 11-1, and Figure 11-2. Funding alternatives and potential rate impacts are discussed in Chapter 12.
The CIP includes major improvements but does not include site-specific improvements within individual developments, which are typically designed and funded by the developers. This chapter includes background information about the CIP, such as prioritization and basis for estimated cost, as well as a summary of the most significant improvements.
11.1 Prioritization
The District refines the CIP annually. During each annual update, all proposed CIP projects are evaluated, prioritized, funded, and scheduled accordingly. The planned improvements fall into several categories:
▪ Improvements driven and funded by development. These are initially scheduled based on growth projections but are implemented when specific developments are platted and approved.
▪ Rehabilitation and replacement of aging facilities. These improvements are initially scheduled based on the useful life of pipes and facilities. Further refinement of the replacement schedule is based on condition information provided by operators and specific facilities assessments. Additionally, the annual operation and maintenance costs, including staff time is reviewed to determine if replacement schedules should be adjusted further.
▪ Operational improvements that provide for redundancy and reliability of enhanced level of service.
11.2 Budget Level Cost Estimates
Budget level cost estimates were prepared for each recommended improvement based on 2021 dollars (ENR index 11,628, 20-City Average, January 2021) and a planning-level cost accuracy Class 5 estimate (+100 percent, -50 percent). A detailed description of the cost estimating methodology used is provided in the Appendix 11-1.

DRAFT
20-2733 Page 11-2 2021 Water System Plan Update February 2022 Snohomish County PUD No. 1
These estimates are intended to be used for informing revenue requirements and prioritization of the proposed improvements. Because all costs are provided in 2021 dollars, future costs must be adjusted at the time of construction to account for inflation and changing market conditions.
The final cost of each project is at a Class 5 estimate level and will depend on actual labor and material costs, site conditions, productivity, competitive market conditions, final project scope, implementation schedule, and other variables. As a result, final construction costs will differ from the presented estimates. Because of these factors, project feasibility and funding must be reviewed carefully prior to making specific financial decisions. Before final budgets are developed, the cost of the planned projects should be estimated using project-specific data.
11.3 Summary of Major Improvements
This section presents the recommended major CIP projects for each type of infrastructure project (both major and minor projects summarized in Figure 11-1 and Table 11-1). Current and previously defined District CIP projects are identified in this section as well.
11.3.1 Overall Water System
Improvements that will benefit the overall water system include:
▪ Control System (SCADA) Hardware and Software Upgrades. The computer systems used to monitor and operate valves, pump stations, reservoirs, supply connections, and treatment facilities should be upgraded on a regular basis as the hardware and software becomes outdated, more likely to be inoperable, and can no longer be cost-effectively maintained.
▪ Meter Replacement. A key element of ongoing maintenance is regular replacement of older meters to minimize lost water through malfunctioning or erroneous readings. As meters age, they tend to under-register, resulting in lower than actual consumption being measured. Additionally, the District is assessing the implementation of advanced metering infrastructure (AMI). This project is current still being assessed by the District but anticipated to begin in 2022 if the District decides to move forward.
▪ Vehicles and Equipment. Vehicles and major equipment must be replaced on a regular basis to maintain a reliable fleet.
11.3.2 Reservoirs
In addition to maintaining existing storage tanks, the District will construct new storage to meet the needs of planned growth. A second storage tank will be constructed in the Warm Beach Water System at the Kayak Tank site. Two more storage tanks will be constructed in the Lake Stevens Integrated Water System serving the Lake Stevens 500 PZ and the Granite Falls 726 PZ. The Burn Road Tank located along Burn Road in the vicinity of 150th Street NE will serve the

DRAFT
20-2733 Page 11-3 2021 Water System Plan Update February 2022 Snohomish County PUD No. 1
Granite Falls 726 PZ and the N Lake Stevens Tank located in the vicinity of 60th Street NE and 91st Avenue NE will serve the Lake Stevens 500 PZ. Additional Lake Roesiger 811 PZ storage capacity is planned for the 2040 CIP timeframe, and this effort may include replacement of the existing Lake Roesiger tanks. Additionally, a condition assessment and seismic analysis is included for existing storage tanks 200,000 gallons or larger and constructed in 2000 or earlier, which is a total of 12 water storage tanks.
11.3.3 Pump Stations
The District’s pump stations are operated daily. Normal wear on mechanical and electrical equipment results in the need for periodic rehabilitation and replacement of facilities. In addition to keeping up with existing demands, future growth will require that station capacities be increased through upgrades or replacements. The following is a summary of the planning pump station improvements over the 20-year planning period. The Granite Falls BPS will be retrofitted to meet 2040 demands. Approximately 1,000 gpm of capacity will be added to the Walker Hill BPS to meet increased fire flow demands. The District is also currently planning for improvements at the Machias BPS with the installation of pumps 4 and 5. The District is also planning to construct a new BPS in 2029 to replace the East Hewitt BPS that was removed in 2020 to allow for development.
11.3.4 Distribution
There are approximately 408 miles of pipeline in the District’s water systems ranging from ¾-inch to 30 inches in diameter and including steel, CI, AC, PVC, high-density polyethylene (HDPE), and DI.
Deficiencies with the piping will be addressed by either replacement through a specific CIP-funded project, through the District’s miscellaneous pipeline replacement program, or through developer upsizing required to serve new developments.
The planned water mains in Figure 11-1 and Figure 11-2 are grouped into the following three types of projects:
CIP Funded Projects – The new pipelines shown in green on the figures will be constructed by the District.
▪ Existing Deficiencies ▪ 2030 Deficiencies ▪ 2040 Deficiencies
Developer Funded Projects – The new pipelines shown in red on the figures have been sized to handle the anticipated 2040 water demands; however, funding for these projects will come solely from developers requiring water service from the District in these designated areas. Developers desiring to extend water to projects in these areas will be required to install pipelines

DRAFT
20-2733 Page 11-4 2021 Water System Plan Update February 2022 Snohomish County PUD No. 1
large enough to handle the anticipated needs of the future Integrated Service Area with no financial assistance from the District.
Miscellaneous Improvements, Relocations, and Pipeline Replacements – The District will replace existing pipes highlighted in orange. The District’s CIP targets approximately 99,000 feet of galvanized iron/steel and AC pipe that is substandard and reaching its useful life. The District’s goal is to replace all of these pipes by 2028. Project number 99 in Table 11-1 is the annual funding dedicated to achieving this goal.
Each year, the District reviews the status of its pipes to identify those to be replaced. Priority pipes for replacement typically experience the greatest number of breaks or leaks. The frequency of breaks is evaluated through a combination of input from District crews and records maintained in GIS which is typically correlated to specific pipe groups of age and material. The District also prioritizes replacements that resolve issues such as fire flow or pressure deficiencies as an additional benefit. The District finds it is better to go through this prioritization each year than to identify specific pipes for replacement in the CIP, because priorities often shift over the course of the planning period.
The District also has unplanned projects that come up each year, such as relocations for transportation or drainage projects and opportunities to include water mains in bridge projects. Project number 98 in Table 11-1 is an amount of money set aside every year to address the unplanned projects.

No. Description
Est Project
Cost
($1,000's) %GFC %RF %Other 2021 2022 2023 2024 2025 2026 2027 2028 2029 2030 2031 2032 2033 2034 2035 2036 2037 2038 2039 2040 Total
Water Mains:
1 Soperhill Road $821 0% 100% 0% $821 $821
2 91st Ave NE $1,777 100% 0% 0% $1,777 $1,777
3 139th Ave NE $764 100% 0% 0% $764 $764
4 44th St NE $1,015 100% 0% 0% $1,015 $1,015
5 N Machias Road $1,581 100% 0% 0% $1,581 $1,581
6 44th St SE $1,548 0% 100% 0% $1,548 $1,548
7 60th St NE $1,536 100% 0% 0% $1,536 $1,536
8
South Nyden Farms Road/2nd St SE / 123rd
Ave SE Intersection $606 0% 100% 0% $606 $606
9 99th Ave NE $1,249 100% 0% 0% $1,249 $1,249
10 153rd Ave SE $1,474 20% 80% 0% $1,474 $1,474
11 147th Ave SE $1,178 100% 0% 0% $1,178 $1,178
12 Bunk Foss Road $948 100% 0% 0% $948 $948
13 109th Ave SE $662 100% 0% 0% $662 $662
14 SR 204 Crossing at 4th St SE $539 100% 0% 0% $539 $539
15 Blue Spruce - 177th Ave/178th Dr NE Loop $375 0% 100% 0% $375 $375
16 101st Ave NE / 28th St NE $582 0% 100% 0% $582 $582
17 18th St SE $53 0% 100% 0% $53 $53
18 37th St SE $351 0% 100% 0% $351 $351
19 150th St NE $459 100% 0% 0% $459 $459
20 87th Avenue SE $863 100% 0% 0% $863 $863
21 139th Ave SE $741 0% 100% 0% $741 $741
22 72nd Pl SE $1,121 100% 0% 0% $1,121 $1,121
23 142nd Drive SE $703 0% 100% 0% $703 $703
24 103rd Ave SE $1,218 0% 100% 0% $1,218 $1,218
25 123rd Ave SE $794 0% 100% 0% $794 $794
26 Sunnyside Blvd $688 0% 100% 0% $688 $688
27 Dubuque Road 760 Zone Transmission $2,314 100% 0% 0% $2,314 $2,314
28 Dubuque Road 525 Zone Transmission $2,025 100% 0% 0% $2,025 $2,025
29 Lake Cassidy Transmission Main $3,406 100% 0% 0% $3,406 $3,406
30 Burn Road $783 100% 0% 0% $783 $783
31
West Engebretson Road (Includes Mainline
PRV) $2,253 100% 0% 0% $2,253 $2,253
32 57th Pl SE $318 0% 100% 0% $318 $318
33 18th St SE / 19th Pl SE $479 0% 100% 0% $479 $479
34 38th Pl SE / 101st Ave SE $674 0% 100% 0% $674 $674
35
Storm Lake Transmission Main - 211th Ave
SE Main Extension $2,310 100% 0% 0% $2,310 $2,310
43 32nd St SE SR9 Crossing $244 100% 0% 0% $244 $244
52
Warm Beach - Soundview Dr Main
Replacement $903 0% 0% 100% $903 $903
53 Warm Beach - Marine Dr Main Replacement $1,345 0% 0% 100% $1,345 $1,345
54
Warm Beach - Clarence Ave Main
Replacement $1,542 0% 0% 100% $154 $1,388 $1,542
55 A Warm Beach - 172nd St NW Main Extension $917 0% 0% 100% $917 $917
55 B Warm Beach - Kayak Intertie $213 0% 0% 100% $213 $213
56 18th St NE (Festival St) Main Extension $104 100% 0% 0% $104 $104
57
Warm Beach Misc Improvements (Add 10
Fire Hydrants) $94 0% 0% 100% $94 $94
98
Forced Right of Way Relocations /
Replacements $2,000 0% 100% 0% $100 $100 $100 $100 $100 $100 $100 $100 $100 $100 $100 $100 $100 $100 $100 $100 $100 $100 $100 $100 $2,000
99 Misc Main Replacement Program (2026-2040) $24,640 0% 100% 0% $4,213 $4,213 $4,208 $1,000 $1,000 $1,000 $1,000 $1,000 $1,000 $1,000 $1,000 $1,000 $1,000 $1,000 $1,000 $24,640Subtotal - Water Mains: $3,980 $4,473 $3,750 $1,288 $1,895 $4,313 $4,313 $4,308 $2,624 $3,802 $4,127 $3,249 $1,963 $2,649 $3,414 $3,125 $3,411 $5,756 $4,413 $3,353 $70,207
Table 11-1 - Snohomish County PUD - Capital Improvement Plan
cip2021_Dec2021_Add_LkRoe_Tank.xlsx Page 1

No. Description
Est Project
Cost
($1,000's) %GFC %RF %Other 2021 2022 2023 2024 2025 2026 2027 2028 2029 2030 2031 2032 2033 2034 2035 2036 2037 2038 2039 2040 Total
Table 11-1 - Snohomish County PUD - Capital Improvement Plan
Pump Stations
100
East Hewitt Improvements (3500 gpm total
capacity req) $1,535 100% 0% 0% $1,535 $1,535
101 Granite Falls BPS - Pump Retrofit $461 100% 0% 0% $461 $461
102
Walker Hill PS Improvements (add 1000 gpm
capacity) $307 100% 0% 0% $307 $307
103 Machias Pump Station Pump #4 $154 100% 0% 0% $154 $154
104 Machias Pump Station Pump #5 $154 100% 0% 0% $154 $154
107
Small System Well pump, motor, and wire
spare parts $284 0% 100% 0% $284 $284Subtotal - Pump Stations: $284 $0 $0 $307 $0 $0 $0 $0 $1,689 $0 $0 $0 $0 $154 $0 $0 $0 $0 $0 $461 $2,894
Reservoirs:
200 North LS Tank (500 Zone - 3.9MG) $5,987 100% 0% 0% $299 $5,687 $5,987
201 Burn Road 726 Reservoir (3.6 MG) $5,680 100% 0% 0% $284 $5,396 $5,680
202 Kayak Reservoir 2 (0.5 MG) $2,149 100% 0% 0% $43 $2,106 $2,149
203
Walker Hill Reservoir 1 Improvements and Re-
coat $1,483 0% 100% 0% $1,483 $1,483
204 Bosworth Reservoir Re-coat $732 0% 100% 0% $732 $732
205 Iron Mountain Reservoir Re-coat $1,300 0% 100% 0% $1,300 $1,300
206 Warm Beach Reservoir Re-coat $452 0% 100% 0% $452 $452
207 Hillcrest Reservoir 2 Re-coat $1,258 0% 100% 0% $1,258 $1,258
208 Walker Hill Reservoir 2 Re-coat $1,071 0% 100% 0% $1,071 $1,071
209 Hillcrest Reservoir 1 Re-coat $1,258 0% 100% $1,258 $1,258
210 Lake Roesiger 811 Reservoir (0.2MG) $860 100% 0% 0% $860 $860Subtotal - Reservoirs: $1,483 $43 $3,122 $5,396 $1,300 $0 $452 $0 $0 $0 $0 $0 $0 $0 $1,258 $1,071 $0 $299 $5,687 $2,118 $22,229
cip2021_Dec2021_Add_LkRoe_Tank.xlsx Page 2

No. Description
Est Project
Cost
($1,000's) %GFC %RF %Other 2021 2022 2023 2024 2025 2026 2027 2028 2029 2030 2031 2032 2033 2034 2035 2036 2037 2038 2039 2040 Total
Table 11-1 - Snohomish County PUD - Capital Improvement Plan
General:
300 Misc Meter Replacement (2021-2040) $1,306 0% 100% 0% $65 $65 $65 $65 $65 $65 $65 $65 $65 $65 $65 $65 $65 $65 $65 $65 $65 $65 $65 $65 $1,306
301 Vehicles & Equipment (WTR92) $7,788 0% 100% 0% $84 $468 $864 $396 $576 $468 $252 $132 $96 $84 $84 $1,302 $948 $342 $576 $468 $336 $132 $180 $0 $7,788
302 Power Operated Equipment (WTR96) $540 0% 100% 0% $6 $30 $30 $48 $0 $0 $0 $138 $18 $6 $0 $30 $30 $168 $0 $0 $0 $18 $18 $0 $540
303
New Capitalized Office Furniture and
Equipment (WTR 91) $133 0% 100% 0% $22 $0 $0 $0 $30 $0 $0 $0 $0 $30 $0 $22 $0 $0 $30 $0 $0 $0 $0 $0 $133
304 Misc. Tools and Equipment (WTR 98) $60 0% 100% 0% $0 $0 $12 $0 $12 $0 $0 $0 $0 $12 $0 $0 $12 $0 $12 $0 $0 $0 $0 $0 $60
305 New Services - (2021-2040) $6,398 0% 100% 0% $269 $274 $279 $284 $289 $294 $299 $305 $310 $315 $321 $327 $333 $339 $345 $351 $357 $363 $370 $376 $6,398
308 Water SCADA System PLC Upgrade $1,842 0% 100% 0% $461 $461 $461 $461 $1,842
309 Warm Beach Water Meter Replacement $435 0% 0% 100% $435 $435
310
Warm Beach Water Treatment and SCADA
Upgrades $1,714 0% 0% 100% $320 $1,394 $1,714
312
Lake Stevens Treatment Corrosion Control
Optimization $556 0% 100% 0% $100 $456 $556
313 Joint PUD Lake Stevens Decant Facility $2,456 0% 100% 0% $246 $2,210 $2,456
315 Water AMI Conversion $12,431 0% 100% 0% $2,822 $3,829 $5,780 $12,431
316
Security Improvements (Per RRA
Recommendations) $160 0% 100% 0% $160 $160
Subtotal - General: $866 $6,404 $5,539 $7,280 $3,643 $988 $617 $640 $489 $513 $470 $1,746 $1,388 $914 $1,028 $884 $758 $578 $633 $441 $35,819
GFC Total: $348 $1,822 $2,849 $5,703 $0 $0 $0 $0 $2,471 $2,702 $1,473 $2,148 $863 $154 $2,314 $2,025 $2,310 $4,955 $9,000 $3,573 $44,708
RF Total: $2,413 $5,787 $9,563 $8,568 $6,837 $5,301 $5,382 $4,948 $2,331 $1,613 $3,125 $2,846 $2,488 $3,563 $3,387 $3,055 $1,859 $1,679 $1,733 $2,800 $79,279
Other Total: $3,852 $3,311 $0 $0 $0 $0 $0 $0 $0 $0 $0 $0 $0 $0 $0 $0 $0 $0 $0 $0 $7,163
Total: $131,149 $6,613 $10,920 $12,412 $14,271 $6,837 $5,301 $5,382 $4,948 $4,802 $4,315 $4,598 $4,994 $3,351 $3,716 $5,700 $5,080 $4,169 $6,634 $10,733 $6,373 $131,149
cip2021_Dec2021_Add_LkRoe_Tank.xlsx Page 3

DRAFT
20-2733 Page 11-8 2021 Water System Plan Update February 2022 Snohomish County PUD No. 1
THIS PAGE INTENTIONALLY LEFT BLANK

UT
UT
UT
UT
UTUT
UT
UT
UT
UT
UT
UT
UT
UT
UT
UT
UT
!R
!R
!R
!R
!R!R
!R
!R
!R
!R
!R
!R
!R
!R
õ
16"
XY2013.6 M.G.
16"
16"
16"
XY2
16"
16"
XY29
12"
XY100
16" 12"
12"
12"
XY3XY5
8"12"
XY3012"
12"
XY4
XY102
12"
12"
726 ZONE(FUTURE PRV)470 ZONE
XY31
XY10
XY13
XY12XY6
XY11
XY1
16"
12"
XY8
XY15
XY18
XY17
XY16
XY7
12"
XY14
16"
XY2003.9 M.G.
XY19
XY9
XY43
XY312
XY56
XY203XY208
XY207XY209
XY204
XY205
XY313
XY26
XY20
XY24
XY33
XY25
XY32
XY23
XY34
XY21
XY101
XY28XY27
XY35
XY22
760 ZONE(FUTURE PRV)525 ZONE
XY104XY103
õ
811 ZONE(FUTURE PRV)760 ZONE
12"
12"
811 ZONE(FUTURE PUMP STATION)500 ZONE
726 ZONE(FUTURE PUMP STATION)500 ZONE
1
2 612
4
9
6
9
551
7 8
4
9
5
7
2
7
13
8 9
6
9
98
8
4
1
3
4
145
5
8
2
6
3 246
7
5
2
87
3
6 3
7
3
16
11
28
11
21 23
15
11
16
12
33
19
12
18
30
32
23
14
19
21
31
31
16
20
29
28
30
28
36
32
33
17
18
10
19
30
21
19
33
1617
34
16
17
33
27
32
28
29
13
26 25
18
35
29
22 20
2526
21
32
12
32
13
28
33
12
29
31
36
29
17
30
31
24
17
11
1514
29
35
20
34
23
28
14
25
1316
26
36
13
12
15
25
3536
17
10
36
20
24
3235
26
36
11
35
26
11
14
25
18
33
26
27
18
35
24
34
13
24
34
10
31
12
14
13
27
30
27
22
22
15
23
22
30
21
10
25
10
15
31
14
20
34
27
23
22
2124 19
15
20
10
24
27
34
23 19 22
24 19 23 2423 20 22 2121 19 20 22
3
18
27
34
22
15
10
2
18
22
3
27
11
14
34
10
15
23
22
27
Y:\WATER SYSTEM\GIS\MAPS\CIP\CIP_2022\CIP_2022.mxd
SNOHOMISH COUNTY PUD #12022 CAPITAL IMPROVEMENT PLAN
INTEGRATED SERVICE AREA - MASTER PLAN
´AGING PIPELINES FOR REPLACEMENT(NOT INCLUDED IN SPECIFIC IDENTIFIED PROJECTS)
NOTES:
LEGEND:UT EXISTING STEEL RESERVOIRUT
FUTURE STEEL RESERVOIREXISTING CONCRETE RESERVOIR
UTDEVELOPER FUNDED PROJECTSCIP FUNDED PROJECTSSYSTEM PIPEPIPE TO BE REPLACEDFUTURE PRV
Elisheva.Walters
Snapshot
Elisheva.Walters
Text Box
210
Elisheva.Walters
Snapshot

UTUT
UT
UT
UT
XY2020.5 M.G.
XY52
XY53
XY54
XY55B
XY206XY55A
Y:\WATER SYSTEM\GIS\MAPS\CIP\CIP_2022\CIP_WB_2022.mxd
CIP #57- for General FH Upgrades
CIP #309- Warm Beach Meter Box Replacement
SNOHOMISH COUNTY PUD #12022 CAPITAL IMPROVEMENT PLAN
WARM BEACH - MASTER PLAN
LEGEND:UT EXISTING STEEL RESERVOIRUT FUTURE STEEL RESERVOIRUT EXISTING CONCRETE RESERVOIR
DEVELOPER FUNDED PROJECTSCIP FUNDED PROJECTSSYSTEM PIPE
´AGING PIPELINES FOR REPLACEMENT(NOT INCLUDED IN SPECIFIC IDENTIFIED PROJECTS)
NOTES:
FUTURE PRV

Chapter 12

THIS PAGE INTENTIONALLY LEFT BLANK

DRAFT
19-2484 (FCS) Page 12-1 2021 Water System Plan Update February 2022 Snohomish County PUD No. 1
Chapter 12
Financial Plan
12.1 Introduction
This chapter was prepared by FCS GROUP to determine the total cost of providing water service to the customers of the District. The purpose of the financial plan is to demonstrate the financial viability of the water utility to meet the system needs outlined in the WSP update. This analysis considers historical performance, the sufficiency of utility revenues to meet current and future O&M needs, policy obligations, and the impact of executing the CIP. The following plan demonstrates the ability of the water utility to maintain sufficient funds to construct, operate, and manage the system on a continuing basis, in full compliance with federal, state, and local requirements through the end of the planning period.
12.2 Past Financial Performance
This section includes a historical summary of financial performance as reported by the District on fund resources and uses arising from cash transactions which is a useful indicator of the District’s financial position.
12.2.1 Comparative Financial Statements
The District legally owns and operates a water utility. Table 12-1 shows a summary of the utility fund resources and uses arising from cash transactions for the previous 6 years (2015 through 2020). Noteworthy findings and trends are discussed following the table to demonstrate the historical performance and condition of the District’s water fund.
Table 12-1 | Summary of Historical Fund Resources and Uses Arising From Cash Transactions
Description (millions) 2015 2016 2017 2018 2019 2020
Operating Revenues:
Sale of water $11.5 $11.7 $12.8 $13.1 $13.4 $13.7
Other operating revenues 0.3 0.3 0.3 0.4 0.4 0.4
Total Operating Revenues $11.8 $12.0 $13.1 $13.5 $13.8 $14.1

DRAFT
19-2484 (FCS) Page 12-2 2021 Water System Plan Update February 2022 Snohomish County PUD No. 1
Description (millions) 2015 2016 2017 2018 2019 2020
Operating Expenses:
Purchased water $2.0 $2.1 $2.6 $2.4 $2.6 $2.9
Operations and maintenance 4.2 4.8 5.2 5.1 5.2 5.8
Depreciation 2.9 2.8 2.9 2.9 3.0 3.2
Taxes 0.6 0.6 0.6 0.7 0.7 0.6
Total Operating Expenses $9.8 $10.3 $11.3 $11.2 $11.6 $12.6
Net Operating Income $2.0 $1.7 $1.8 $2.4 $2.2 $1.5
Interest Charges $0.8 $0.7 $0.7 $0.6 $0.7 $0.3
Other Income and Expense:
Interest income $0.2 $0.2 $0.2 $0.4 $0.6 $0.4
Net increase (decrease) in investments 0.01 0.01 (0.03) 0.05 0.06 (0.01)
Other income and expense, net 1.1 0.9 0.9 0 0.03 (0.02)
Total Other Income and Expense: $1.2 $1.1 $1.2 $0.5 $0.7 $0.3
Capital Contributions:
Cash contributions $1.6 $2.8 $2.1 $3.4 $4.3 $4.3
Non-cash contributions 0.8 0.7 1.6 2.3 4.2 $2.1
Total Capital Contributions $2.4 $3.5 $3.7 $5.7 $8.4 $6.4
Net Income $4.9 $5.7 $6.0 $7.9 $10.6 $7.9
Non-cash contributions ($0.8) ($0.7) ($1.6) ($2.3) ($4.2) ($2.1)
Interest charges 0.8 0.7 0.7 0.6 0.7 0.3
Depreciation 2.9 2.8 2.9 2.9 3.0 3.2
Settlement amortization (0.9) (0.9) (0.9) 0 0 0
Pension and OPEB liability adjustments 0.07 0.0 (0.2) (0.3) (0.4) (0.4)
Net increase (decrease) in investments 0.01 (0.01) 0.03 (0.5) (0.6) 0.1
Balance Available for Debt Coverage $6.8 $7.6 $6.9 $8.8 $9.8 $8.9
Parity Debt Service Costs:
Interest $0.9 $0.8 $0.8 $0.7 $0.6 $0.4
Principal 1.7 1.7 1.7 1.7 1.6 1.2
Total Parity Debt Service Costs 2.6 2.5 2.5 2.4 2.2 1.6
Less: Assessment payments received (0.1) (0.1) (0.1) (0.1) (0.03) (0.02)
Debt Service Paid from Revenues $2.5 $2.4 $2.4 $2.3 $2.2 $1.6
Parity Debt Service Coverage 2.7x 3.1x 2.9x 3.8x 4.4x 5.5x

DRAFT
19-2484 (FCS) Page 12-3 2021 Water System Plan Update February 2022 Snohomish County PUD No. 1
12.2.1.1 Findings and Trends
▪ The District’s sale of water charges increased from $11.5 million (M) in 2015 to $13.7M in 2020. The average annual increase is 3.6 percent per year, with a total increase of 19.1 percent from 2015 to 2020. 2017 saw the largest water sales increase of the six-year timeframe at 9.4 percent over 2016. Total operating expenses range from $9.8M in 2015 to $12.6M in 2020, showing increases every year, with the exception of 2018, where expenses decreased slightly under 1 percent. With an average increase of 5.2 percent, expenses have grown faster than revenues over the past 6 years and have increased 28.6 percent overall. While purchased water costs have contributed 32 percent of the total expense increase, the largest contributor to increases in expenses were operating and maintenance costs, accounting for 57 percent of the overall expense increase since 2015.
▪ The O&M Coverage Ratio (total operating revenues divided by total operating expenses) was 120 percent in 2015 and fluctuated between increases and decreases over the next six years, reaching a high of 121 percent in 2018 before ending at its lowest point of 112 percent in 2020. Despite the decrease between 2015 and 2020, a ratio of 100 percent or greater shows that revenue will successfully cover expenses, and the District has remained above this ratio for the past 6 years.
▪ Net Operating Income as a percent of Operating Revenue was 17 percent in 2015, fluctuating up and down and reaching a peak of 17.8 percent in 2018 before falling to the six-year low of 10.6 percent in 2020. Similar to the O&M Coverage Ratio, these trends help to show how successfully operating revenue actually covered operating expenses, with higher positive numbers being the best and negative numbers showing need for improvement.
▪ The Debt Service Coverage Ratio is to ensure the District is positioned to achieve favorable terms in the municipal bond market when issuing bonds for capital funding needs. The District’s governance policy requires a minimum bond debt service coverage factor of 1.75. This ratio is calculated by dividing cash operating income (revenues less expenses before depreciation) by annual revenue bond expenses. The District’s water utility had four outstanding revenue bonds over the last six years. The Debt Service Coverage Ratio for all outstanding debt ends 2015 at 2.70 and shows an upward trend thereafter, ending 2020 at 5.50. The year 2020 saw the largest increase in the debt coverage ratio as the District fully redeemed the 2006 revenue bonds and refunded one of the remaining revenue bonds. The ability of this ratio to remain at levels significantly higher than the District’s policy minimum of 1.75 indicates a stable capacity for new debt and will likely result in favorable terms when entering the bond market.
12.3 Current Financial Structure
This section summarizes the current financial structure used as the baseline for the capital financing strategy and financial forecast developed for this WSP.

DRAFT
19-2484 (FCS) Page 12-4 2021 Water System Plan Update February 2022 Snohomish County PUD No. 1
12.3.1 Financial Plan
The water utility is responsible for funding all of its costs. The primary source of funding is derived from ongoing monthly charges for service, with additional revenues coming from new service connections, property rentals, surcharge revenue, local utility district payments and other miscellaneous revenue. The District controls the level of user charges and, subject to the Board of Commissioners, can adjust user charges as needed to meet financial objectives.
The financial plan can only provide a qualified assurance of financial feasibility if it considers the total system costs of providing water services, both operating and capital. To meet these objectives, the following elements have been completed.
1. Capital Funding Plan. The District’s 20-year CIP, as detailed more fully in Chapter 11, identifies the total obligations of the planning period. The plan defines a strategy for funding the CIP, including an analysis of available resources from rate revenues, existing reserves, General Facilities Charges, debt financing, and any special resources that may be readily available (e.g., grants, developer contributions, etc.). The capital funding plan impacts the financial plan through the use of debt financing (resulting in annual debt service) and the assumed rate revenue available for capital funding.
2. Financial Forecast. Identifies future annual non-capital costs associated with the operation, maintenance, and administration of the water system. Included in the financial plan is a reserve analysis that forecasts cash flow and fund balance activity, along with testing for satisfaction of actual or recommended minimum fund balance policies. The financial plan ultimately evaluates the sufficiency of utility revenues in meeting all obligations, including cash uses such as operating expenses, debt service, capital outlays, and reserve contributions, as well as any coverage requirements associated with long-term debt. The plan also identifies the future adjustments required to fully fund all utility obligations in the planning period.
12.3.1.1 Capital Funding Plan
The CIP developed for this WSP identifies $87.0M in escalated project costs over the 10-year planning horizon. The 20-year period totals $172.1M in escalated project costs. Costs were escalated by 2.79 percent annually to the year of planned spending.
A summary of the 10-year and 20-year CIP is shown in Table 12-2. As shown, each year has varied capital cost obligations depending on construction schedules and infrastructure planning needs. Approximately 50 percent of the escalated capital costs are included in the 10-year planning period. Table 12-3 provides more detail for the 10-year CIP.

DRAFT
19-2484 (FCS) Page 12-5 2021 Water System Plan Update February 2022 Snohomish County PUD No. 1
Table 12-2 | 10- and 20-Year CIP
Year Capital Expenditures (escalated)
2021 $5.7
2022 $13.3
2023 $13.5
2024 $15.9
2025 $7.8
2026 $6.3
2027 $6.5
2028 $6.2
2029 $6.2
2030 $5.7
10-Year Total $87.0
2031-2040 $85.1
20-Year Total $172.1
Table 12-3 | 10 Year CIP (Escalated $)
Project 2021 2022 2023 2024 2025
2026
2027
2028
2029
2030
Total
Distribution $3.3 $4.2 $4.1 $1.4 $2.2 $5.1 $5.2 $5.4 $2.4 $2.9 $36.2
Transmission $0.0 $1.9 $0.0 $0.0 $0.0 $0.0 $0.0 $0.0 $1.0 $2.1 $5.0
Pumping $0.0 $0.2 $0.0 $0.3 $0.0 $0.0 $0.0 $0.0 $2.2 $0.0 $2.8
Storage $1.3 $0.0 $3.4 $6.0 $1.5 $0.0 $0.5 $0.0 $0.0 $0.0 $12.8
Meters & Services
$0.3 $3.8 $4.5 $6.8 $0.4 $0.4 $0.4 $0.5 $0.5 $0.5 $18.2
General $0.6 $3.1 $1.5 $1.3 $3.8 $0.7 $0.3 $0.3 $0.1 $0.2 $11.9
Total $5.7 $13.3 $13.5
$15.9
$7.8 $6.3 $6.5 $6.2 $6.2 $5.7 $87.0
12.3.1.2 Capital Financing Strategy
An ideal capital financing strategy would include the use of grants and low-cost loans when debt issuance is required. However, these resources are very limited and competitive in nature and do not provide a reliable source of funding for planning purposes. It is recommended that the District pursue these funding avenues but assume bond financing to meet the needs for which the District’s available cash resources are insufficient. Revenue bonds have been used as the debt funding instrument in this analysis. The capital financing strategy developed to fund the CIP identified in this WSP assumes the following funding resources:
▪ Accumulated cash reserves; ▪ Excess cash (over minimum balance targets) from the Water System Revenue Fund;

DRAFT
19-2484 (FCS) Page 12-6 2021 Water System Plan Update February 2022 Snohomish County PUD No. 1
▪ General Facilities Charge revenues; ▪ Interest earned on fund balances and other miscellaneous capital resources; and ▪ Revenue bond financing.
Based on information provided by the District, the water utility began 2021 with $24.6M in total funds.
The cash resources described above are anticipated to fund 55 percent of the 10-year CIP and 59 percent of the 20-year CIP. The remaining funding will come from new debt obligations of $70.1M over the twenty-year forecast period. Table 12-4 presents the corresponding 20-year capital financing strategy.
Table 12-4 | 20-Year Capital Funding Strategy
Year Capital Expenditures (escalated)
Revenue Bond Annual Funding
Cash Funding Total Financial Resources
2021 $5.7 $0.0 $5.7 $5.7
2022 $13.3 $0.0 $13.3 $13.3
2023 $13.5 $13.5 $0.0 $13.5
2024 $15.9 $2.8 $13.2 $15.9
2025 $7.8 $7.8 $0.0 $7.8
2026 $6.3 $2.3 $4.0 $6.3
2027 $6.5 $6.5 $0.0 $6.5
2028 $6.2 $3.6 $2.5 $6.2
2029 $6.2 $3.0 $3.2 $6.2
2030 $5.7 $0.0 $5.7 $5.7
Subtotal $87.0 $39.5 $47.5 $87.0
2031-2040 $85.1 $30.7 $54.5 $85.1
Total $172.1 $70.1 $102.0 $172.1
12.4 Available Funding Assistance and Financing Resources
Feasible long-term capital funding strategies must be defined to ensure that adequate resources are available to fund the CIP identified in this WSP. In addition to the District’s resources, such as accumulated cash reserves, capital revenues, and rate revenues designated for capital purposes, capital needs can be met from outside sources, such as grants, low-interest loans, and bond financing. The following is a summary of the District’s internal and external resources.
12.4.1 District Resources
Resources appropriate for funding capital needs include accumulated cash reserves in excess of minimum balance targets, rate revenues designated for capital spending purposes, and capital-related charges such as General Facilities Charge and Distribution System Charge revenues. The

DRAFT
19-2484 (FCS) Page 12-7 2021 Water System Plan Update February 2022 Snohomish County PUD No. 1
first two resources will be discussed in the Fiscal Policies section of the Financial Forecast. Capital-related charges are discussed below.
12.4.1.1 General Facilities Charge
The District’s General Facilities Charge (GFC) is a one-time charge imposed on new customers as a condition of connecting to the water system that is intended to finance new source, storage, and transmission related capital improvements. The purpose of the GFC is two-fold: 1) to promote equity between new and existing customers; and 2) to provide a source of revenue to fund capacity related capital projects. The GFC funds can only be used to fund specific capacity related capital projects or to pay debt service incurred to finance those projects. In 2021, the District charged all new customers a GFC of $3,645 per ERU.
12.4.1.2 Distribution System Charges
While the GFC is the manner in which new customers pay their share of capacity related plant investment costs, local facilities funding is used to pay the costs of local facilities that connect each property to the system’s infrastructure. Local facilities funding is often overlooked in rate forecasting because it is funded upfront by either connecting customers and developers, or through an assessment to properties, but never from rates.
A number of mechanisms can be considered toward funding local facilities. One of the following scenarios typically occurs: (a) the utility charges a connection fee based on the cost of the local facilities (under the same authority as the GFCs); (b) a developer funds an extension of the system to its development and turns those facilities over to the utility (contributed capital); or (c) a local assessment is set up called a Utility Local Improvement District (ULID/LID) or a Local Utility District (LUD), which collects tax revenue from benefited properties.
The Distribution System Charge (DSC) is a District-imposed charge to recover the cost related to service extension to local properties. Often called a front-footage charge and imposed on the basis of footage of the main “fronting” a particular property, it is usually implemented as a reimbursement mechanism to the District or third-party developer incurred for the cost of a local facility that directly serves a property. It is a form of connection charge and thus can accumulate up to 10 years of interest. It typically applies in instances when no developer-installed facilities are needed through developer extension due to the prior existence of available mains already serving the developing property. In 2021, the District applied a DSC of $4,210 per parcel for a single-family resident. Multi-family and commercial customers are charged a DSC of $38.00 per front foot.
The developer extension is a requirement that a developer install on-site and sometimes off-site improvements as a condition of extending service. These are in addition to the GFC required and must be built to District standards. Part of the agreement between the District and the developer planning to extend service might include a latecomer agreement, resulting in a latecomer charge to new connections for the developer extension.

DRAFT
19-2484 (FCS) Page 12-8 2021 Water System Plan Update February 2022 Snohomish County PUD No. 1
12.4.2 Outside Resources
This section outlines various grant, loan, and bond opportunities available to the District through federal and state agencies to fund the CIP identified in the WSP.
12.4.2.1 Grants and Low-Cost Loans
Historically, federal and state grant programs were available to local utilities for capital funding assistance. However, these assistance programs have been mostly eliminated, substantially reduced in scope and amount, or replaced by loan programs. Remaining miscellaneous grant programs are generally lightly funded and heavily subscribed. Nonetheless, even the benefit of low-interest loans makes the effort of applying worthwhile. Grants and low-cost loans for the State utilities are available from the Department of Commerce and DOH, including two assistance programs for which the District may be eligible. In addition, federal assistance is available through the Water Infrastructure Funding Innovation Act (WIFIA).
Public Works Board (PWB) – Cities, counties, special purpose districts, public utility districts, and quasi-municipal governments are eligible to receive loans from the PWB. Eligible projects include repair, replacement, and construction of infrastructure for domestic water, sanitary wastewater, stormwater, solid waste, road, and bridge projects that improve public health and safety, respond to environmental issues, promote economic development, or upgrade system performance.
The PWB loans are available at interest rates ranging from 0.23 percent to 0.94 percent depending on the repayment term, with reduced interest rates available for all projects located in communities that have been declared a natural disaster. The standard loan offer is 0.94 percent interest repaid over a 20-year term. All loan terms are subject to negotiation and Board approval. Currently, no local match is required, and the maximum loan amount is $10M per jurisdiction per biennium.
The PWB loan process typically begins annually in the summer.
Information regarding the application process, as well as rates and terms, are posted on the PWB website in early spring. Further detail is available at http://www.pwb.wa.gov.
Drinking Water State Revolving Fund (DWSRF) Loan Program – DWSRF funding historically targets protection of public health, compliance with drinking water regulations and assistance for small and disadvantaged communities and is administered by the DOH. Terms are up to 20 years to pay back, and in some cases, provide partial loan forgiveness. Interest rates are 1.25 to 1.75 percent and no local match is required.
Applicants need an approved water system plan, or plan amendment, containing the DWSRF project prior to submitting an application. All public water systems that receive a DWSRF loan must undergo an environmental review, a cultural review, and an Investment Grade Efficiency

DRAFT
19-2484 (FCS) Page 12-9 2021 Water System Plan Update February 2022 Snohomish County PUD No. 1
Audit (IGEA). The IGEA is an effort to apply energy efficiency to water systems and may be financed as part of the DWSRF loan.
The DWSRF takes applications annually in the fall. Further detail is available at http://www.doh.wa.gov.
Water Infrastructure Funding Innovation Act (WIFIA) – The WIFIA was established in 2014 as a federal credit program administered by the EPA for eligible water and wastewater infrastructure projects. Loans can be used on development phase activities, including preliminary engineering, design, revenue forecasting and other pre-construction activities, as well as construction activities, acquisition of real property and environmental mitigation.
Terms for repayment extend for up to 35 years with interest rates lower than market and the added benefit of repayment deferrals up to five years after substantial completion of the project. Additional information regarding funding availability and the application process can be found at https://www.epa.gov/wifia.
12.4.2.2 Bond Financing
General Obligation Bonds – General obligation (G.O.) bonds are bonds secured by the full faith and credit of the issuing agency, committing all available tax and revenue resources to debt repayment. With this high level of commitment, G.O. bonds have relatively low interest rates and few financial restrictions.
While bonding capacity can limit the availability of G.O. bonds for utility purposes, these can sometimes play a valuable role in project financing. A rate savings may be realized through two avenues: the lower interest rate and related bond costs; and the extension of repayment obligation to all tax-paying properties (not just developed properties) through the authorization of an ad valorem property tax levy.
Revenue Bonds – Revenue bonds are commonly used to fund utility capital improvements. The debt is secured by the revenues of the issuing utility. With this limited commitment, revenue bonds typically bear higher interest rates than G.O. bonds and also require security conditions related to the maintenance of dedicated reserves (a bond reserve) and financial performance (added bond debt service coverage). The District agrees to satisfy these requirements by resolution as a condition of bond sale.
Revenue bonds can be issued in Washington without a public vote. There is no bonding limit, except perhaps the practical limit of the utility’s ability to generate sufficient revenue to repay the debt and provide coverage. In some cases, poor credit might make issuing bonds problematic.

DRAFT
19-2484 (FCS) Page 12-10 2021 Water System Plan Update February 2022 Snohomish County PUD No. 1
12.5 Financial Forecast
The financial forecast, or revenue requirement analysis, forecasts the amount of annual revenue that needs to be generated by user rates. The analysis incorporates operating revenues, O&M expenses, debt service payments, rate-funded capital needs, and any other identified revenues or expenses related to operations. The objective of the financial forecast is to evaluate the sufficiency of the current level of rates. In addition to annual operating costs, the revenue needs also include debt covenant requirements and specific fiscal policies and financial goals of the District.
The analysis determines the amount of revenue needed in a given year to meet that year’s expected financial obligations. For this analysis, two revenue sufficiency tests have been developed to reflect the financial goals and constraints of the District: cash needs must be met; and debt coverage requirements must be realized. In order to operate successfully with respect to these goals, both tests of revenue sufficiency must be met.
Cash Test – The cash flow test identifies all known cash requirements for the District in each year of the planning period. Typically, these include O&M expenses, debt service payments, rate-funded system reinvestment funding or directly funded capital outlays, and any additions to specified reserve balances. The total annual cash needs of the District are then compared to projected cash revenues using the current rate structure. Any projected revenue shortfalls are identified, and the rate increases necessary to make up the shortfalls are established.
Coverage Test – The coverage test is based on a commitment made by the District when issuing revenue bonds and some other forms of long-term debt. For the purposes of this analysis, revenue bond debt is assumed for any needed debt issuance. As a security condition of issuance, the District would be required per covenant to agree that the revenue bond debt would have a higher priority for payment (a senior lien) compared to most other expenditures; the only outlays with a higher lien are O&M expenses. Debt service coverage is expressed as a multiplier of the annual revenue bond debt service payment. For example, a 1.00 coverage factor would imply that no additional cushion is required. A 1.75 coverage factor means revenue must be sufficient to pay O&M expenses, annual revenue bond debt service payments, and an additional 75 percent of annual revenue bond debt service payments. The excess cash flow derived from the added coverage, if any, can be used for any purpose, including funding capital projects. Targeting a higher coverage factor can help the District achieve a better credit rating and provide lower interest rates for future debt issues.
In determining the annual revenue requirement, both the cash and coverage sufficiency test must be met, and the test with the greatest deficiency drives the level of needed rate increase in any given year.

DRAFT
19-2484 (FCS) Page 12-11 2021 Water System Plan Update February 2022 Snohomish County PUD No. 1
12.5.1 Current Financial Structure
The District maintains a fund structure and implements financial policies that target management of a financially viable and fiscally responsible water system.
12.5.1.1 Financial Policies
A brief summary of the key financial policies employed by the District, as well as those recommended and incorporated in the financial program, are discussed below.
Water System Revenue Fund – The Water System Revenue Fund is an operating reserve. Operating reserves are designed to provide a liquidity cushion to ensure that adequate cash working capital will be maintained to deal with significant cash balance fluctuations, such as seasonal fluctuations in billings and receipts, unanticipated cash expenses, or lower than expected revenue collections. Like other types of reserves, operating reserves also serve another purpose: they help smooth rate increases over time. Target funding levels for an operating reserve are generally expressed as a certain number of days of O&M expenses, with the minimum requirement varying with the expected revenue volatility. Industry practice for utility operating reserves ranges from 30 days to 120 days of O&M expenses, with the lower end more appropriate for utilities with stable revenue streams and the higher end more appropriate for utilities with significant seasonal or consumption-based fluctuations. The District’s financial reserve policy requires a minimum balance in the Water System Revenue Fund equal to 90 days of O&M expenses for working capital.
General Facility Charge Reserve – The District retains funds from their GFC revenue in a separate fund. The District’s financial reserve policy guides the spending of the accumulated funds each year. Funds in this reserve are spent on capital projects related to providing water supply, storage, or transmission related projects. There is not a target level to be maintained within the fund, except the practical limit that the balance should never fall below zero.
System Reinvestment – System reinvestment funding promotes system integrity through reinvestment in the system. Target system reinvestment funding levels are commonly linked to annual depreciation expense as a measure of the decline in asset value associated with routine use of the system. Particularly for utilities that do not already have an explicit system reinvestment policy in place, implementing a funding level based on full depreciation expense could significantly impact rates. A common alternative benchmark is annual depreciation expense net of debt principal payments on outstanding debt. This approach recognizes that customers are still paying for certain assets through the debt component of their rate and intends to avoid simultaneously charging customers for an asset and its future replacement. The specific benchmark used to set system reinvestment funding targets is a matter of policy that must balance various objectives, including managing rate impacts, keeping long-term costs down, and promoting “generational equity” (i.e., not excessively burdening current customers with paying for facilities that will serve a larger group of customers in the future).

DRAFT
19-2484 (FCS) Page 12-12 2021 Water System Plan Update February 2022 Snohomish County PUD No. 1
The District’s approach to system reinvestment is to direct the remaining revenues after the O&M and debt service expenses have been satisfied to first fund the Water System Revenue Fund target and then capital needs. As a result, rate revenues do contribute to the funding of capital projects, but the level of funding can be inconsistent from year to year. Capital funding from rates is available to fund replacement/reinvestment CIP and varies from $421,000 to $2.3M depending on the year. Those funds not used to pay for CIP in any given year, remain in the capital fund for future replacement/reinvestment needs. The District may want to consider a dedicated system reinvestment transfer to the capital fund in the future as a long-term funding strategy to smooth the rate impacts of cash-funding the repair and replacement projects identified in the twenty-year CIP.
Debt Management – It is prudent to consider policies related to debt management as part of a broader utility financial policy structure. Debt management policies should be evaluated and formalized, including the level of acceptable outstanding debt, debt repayment, bond coverage, and total debt coverage targets. For any existing and future revenue bond assumptions, coverage is tested at the District’s governance policy target of 1.75.
12.5.1.2 Financial Forecast
The financial forecast is established from the 2021 budget documents along with other key factors and assumptions to develop a complete portrayal of the District’s annual financial obligations for the water utility. The following is a list of the key revenue and expense factors and assumptions used to develop the financial forecast.
▪ Revenue – The District has three general revenue sources: 1) water rate revenues 2) wholesale rate revenues and 3) miscellaneous (non-rate) revenue. In the event of a forecasted annual shortfall, water rate revenues can be increased to meet the annual revenue requirement. For the purpose of this financial forecast, water rate revenues are based on the 2021 budget values and increase with customer growth. Wholesale rate revenues are forecasted to increase with overall system growth. No wholesale rate increases are assumed in this forecast. Wholesale rates are currently being evaluated as part of a separate rate study effort and will be presented to the District for consideration at a later date. Non-rate revenues are forecast to increase with customer growth, demand growth, general cost inflation or not escalate depending on the nature of the revenue.
▪ Growth – Rate revenue is escalated based on the demand growth rates for the Lake Stevens Integrated System as detailed in Chapter 5, Planning Date and Demand Forecasting. The annual growth rate is projected to be 1.51 percent from 2021 through 2025, 1.31 percent from 2026 through 2030, 1.15 percent from 2031 through 2035, and 1.16 percent from 2036 through 2040.
▪ General Facilities Charge Revenue – The existing GFCs are applied to the projected new connections to forecast revenue. Based on the growth assumptions described above, the GFC will generate an average of $1.5M annually from 2021-2040. This equates to an

DRAFT
19-2484 (FCS) Page 12-13 2021 Water System Plan Update February 2022 Snohomish County PUD No. 1
average of 417 new connections per year. The GFC revenue is directed towards annual capital needs.
▪ Expenses – The O&M expense projections are based on the 2021 budget and forecasted to increase with general cost inflation of 2.30 percent, labor cost inflation of 3.00 percent, benefit cost inflation of 2.24 percent, Everett purchased water cost inflation averaging 2.40 percent, and union step increases of 1.20 percent.
▪ Existing Debt – The District currently has two outstanding revenue bonds, the 2011 Series revenue bond and the 2019 Series refunding revenue bond. Full repayment is planned for 2022 on the 2011 Series bond while the 2019 series bond will be fully repaid in 2031. In addition to revenue bonds the District has five Public Works Trust Fund (PWTF) loans and one DWSRF. Repayment on the low-interest loans ranges from 2022 to 2040. Annual debt service payments begin 2021 at $2.0M, falling to an average of $1.1M from 2023-2031 and finally dropping to an average of $194,000 annually through the end of the planning period.
▪ Future Debt – The capital funding strategy developed for this WSP forecasts the need for six debt issuances within the planning period: $16.24M in new debt proceeds in 2023, followed by $10.14M in 2025, $10.14M in 2027, $2.95M in 2029, $4.8M in 2031, $9.2M in 2033, $3.45M in 2036, and $13.2M in 2039. Annual new debt service payments are forecast to increase from $713,000 with the first issuance to a maximum of $5.7M with the eighth issuance in 2039. The analysis performed assumes revenue bond financing.
▪ Revenue Bond Assumptions – Future debt is assumed to be revenue bonds each with a 20-year term, a 4.00 percent interest rate and a 1.50 percent issuance cost. The 2023 revenue bond assumes one (1) year of interest only payment.
▪ Interfund Loan – The District plans to transfer $1.7M from the GFC Reserve to the Water System Revenue Fund in 2022. The Water System Revenue Fund will reimburse the GFC Reserve the full amount borrowed in 2023 including 0.5 percent of interest.
▪ Fund Balances – Any Water System Revenue Fund balance above the minimum requirement is assumed to be available to fund capital projects. The 2021 Water System Revenue Fund balance is expected to end the year above 90 days of O&M expenses at $6.8M, or $2.5M above target.
Although the financial plan is completed for the 20-year time horizon of this WSP, the rate strategy focuses on the shorter-term planning period of 2021 through 2030. As is the current practice, it is recommended that the District revisit the proposed rates each year to ensure that the rate projections developed remain adequate. Any significant changes should be incorporated into the financial plan and future rates should be adjusted as needed.
Table 12-5 summarizes the annual revenue requirements based on the forecast of revenues, expenditures, fund balances, and fiscal policies.

DRAFT
19-2484 (FCS) Page 12-14 2021 Water System Plan Update February 2022 Snohomish County PUD No. 1
Table 12-5 | 10-Year Financial Forecast
Revenue Requirement 2021 2022 2023 2024 2025 2026 2027 2028 2029 2030
Revenues (millions)
Rate Revenues (existing rates)
$13.8 $12.4 $12.6 $13.0 $13.4 $13.6 $13.8 $13.9 $14.1 $14.3
Wholesale Rate Revenues
$0.7 $0.5 $0.5 $0.5 $0.5 $0.5 $0.5 $0.5 $0.5 $0.6
Non-Rate Revenues $0.9 $1.4 $1.4 $1.5 $1.6 $1.7 $1.7 $1.8 $1.8 $1.8
Total Revenues $15.4 $14.3 $14.6 $15.0 $15.5 $15.8 $16.0 $16.2 $16.4 $16.6
Expenses (millions)
Cash Operating Expenses
$10.6 $11.4 $11.1 $11.0 $12.0 $12.4 $12.8 $13.4 $13.8 $14.6
Existing Debt Service $2.0 $2.2 $1.2 $1.2 $1.2 $1.2 $1.2 $1.1 $1.1 $1.0
New Debt Service $0.7 $1.4 $2.2 $2.2 $3.0 $3.0 $3.2 $3.2
Total Expenses $12.6 $13.6 $13.0 $13.6 $15.4 $15.7 $17.0 $17.6 $18.2 $18.9
Total Surplus (Deficiency)
$2.8 $0.7 $1.5 $1.5 ($0.2) ($0.1) ($1.0) ($1.3) ($1.8) ($2.3)
Proposed Rate Strategy 0.00% 1.75% 2.15% 2.15% 2.15% 2.15% 2.25% 2.25% 2.25% 2.25%
Cash Flow after Rate Increase
$2.8 $0.8 $2.0 $2.2 $1.2 $1.5 $0.8 $0.8 $0.7 $0.6
The financial forecast indicates that the utility is currently covering all financial obligations under existing rates, however as the District prepares to fund the $172.1M in needed capital improvements identified in the WSP, rates will need to increase annually to support the capital funding plan. The financial plan proposes the following rate increases and debt issuances to satisfy the identified future obligations of the utility, allowing for 59percent cash funding of future capital improvements:
▪ 1.75 percent in 2022, followed by 2.50 percent from 2023 through 2026, 2.25 percent from 2027 through 2031 and 3.15 percent from 2032 through 2040.
▪ Four new revenue bonds proposed in the ten-year planning period:
o $24M revenue bond in 2023, $10.14M revenue bond in 2025, $10.14M revenue bond in 2027, and a $2.95M revenue bond in 2029.
o Annual new debt service payments are forecast to increase from $713,000 with the first issuance to $3.2M by the third new debt issuance. Including this new debt, total debt service will increase from $2.0M in 2021 to $4.3M by 2030.

DRAFT
19-2484 (FCS) Page 12-15 2021 Water System Plan Update February 2022 Snohomish County PUD No. 1
12.5.1.3 District Funds and Reserves
Table 12-6 shows a summary of the projected Water System Revenue Fund and GFC fund ending balances through 2030 based on the rate forecasts presented above. The Water System Revenue Fund is maintained at a minimum of 90 days of O&M expenses.
Table 12-6 | Ending Cash Balance Summary
Ending Fund Balances
2021 2022 2023 2024 2025 2026 2027 2028 2029 2030
Water System Revenue Fund
$6.80 $3.40 $10.00 $3.30 $7.30 $3.10 $8.10 $3.30 $4.50 $3.60
General Facility Charge Fund
$16.70 $14.60 $14.90 $10.50 $12.50 $14.30 $16.30 $18.30 $17.20 $15.80
Total $23.50 $18.00 $25.00 $13.80 $19.80 $17.50 $24.30 $21.60 $21.80 $19.40
12.6 Current and Projected Rates
12.6.1 Current Rates
The existing water rates are composed of a fixed monthly charge per account and a variable consumption charge per ccf for all water usage. Charges are different for each customer class. Table 12-7 shows the existing rate schedule. The District also offers discounted rates for single family customers of between 25 and 50 percent of total bills dependent on a customer’s income level.
Table 12-7 | Existing Schedule of Rates
Existing Rates
Single Family Monthly Rates
Fixed (per acct) $22.98
Variable (per ccf) $3.52
Multi Family
Fixed (per acct) $23.09
Variable (per ccf) $3.34
Commercial
Fixed (per acct) $50.17
Variable (per ccf) $3.24
12.6.2 Projected Rates
The financial forecast discussed above indicates that the utility is currently covering all financial obligations under existing rates, however as the District prepares to fund the needed capital improvements identified in the WSP, rates will need to increase annually to support the capital funding plan. Rates are forecast to increase 1.75 percent in 2022, followed by 2.15 percent from

DRAFT
19-2484 (FCS) Page 12-16 2021 Water System Plan Update February 2022 Snohomish County PUD No. 1
2023 through 2026, 2.25 percent from 2027 through 2031, and 3.15 percent from 2032 through 2040. Table 12-8 shows the projected rates with increases applied uniformly to all rate components for all customer classes.
Table 12-8 | Projected Schedule of Rates
Class Existing Rates
Proposed Rates
2021 2022 2023 2024 2025 2026 2027 2028 2029 2030
Single Family
Fixed (per acct)
$22.98 $23.38 $23.88 $24.39 $24.91 $25.45 $26.02 $26.61 $27.21 $27.82
Variable (per ccf)
$3.52 $3.58 $3.66 $3.74 $3.82 $3.90 $3.99 $4.08 $4.17 $4.26
Multi Family
Fixed (per acct)
$23.09 $23.49 $24.00 $24.52 $25.05 $25.59 $26.17 $26.76 $27.36 $27.98
Variable (per ccf)
$3.34 $3.40 $3.47 $3.54 $3.62 $3.70 $3.78 $3.87 $3.96 $4.05
Commercial
Fixed (per acct)
$50.17 $51.05 $52.15 $53.27 $54.42 $55.59 $56.84 $58.12 $59.43 $60.77
Variable (per ccf)
$3.24 $3.30 $3.37 $3.44 $3.51 $3.59 $3.67 $3.75 $3.83 $3.92
In 2003 the Washington State Legislature passed the Municipal Water Supply Efficiency Requirements Act. The Water Use Efficiency rules went into effect on January 22, 2007, and typically apply to WSPs that each jurisdiction is required to develop every six to ten years. The RCW outlines the rules of this act, under RCW 70.119.180. In section 4(B), the RCW states that jurisdictions must perform an “evaluation of the feasibility of adopting and implementing water delivery rate structures that encourage water conservation.” A utility does not need to actually adopt such a rate structure, but is required to consider it, which is what the following analysis represents. Based on these guidelines a single-family tiered rate structure and a non-residential seasonal structure were developed as outlined in Table 12-9. The single-family tiered structure assesses fees per unit of consumption for use that falls into three tiers. Usage that falls below the class average will be charged the lowest amount per unit while rates will increase for customers that use more than the class average monthly. The non-residential seasonal structure will charge higher fees per unit of consumption during the summer months when supply is constrained.
One water conservation rate structure option for the District to consider in the future is separate rates for each of the District’s water systems. Individual rate structures for each system may provide more targeted conservation incentives based on the unique water use characteristics of each system.

DRAFT
19-2484 (FCS) Page 12-17 2021 Water System Plan Update February 2022 Snohomish County PUD No. 1
Table 12-9 | Conservation Based Rate Structure
Conservation Rate Structure
Single Family Monthly Rates
Fixed (per acct) $22.98
Tiered Variable Rates
Tier 1 (0-7 ccf) $3.25
Tier 2 (8-14 ccf) $3.90
Tier 3 (+ 15 ccf) $4.78
Multi Family
Fixed (per acct) $23.09
Seasonal Variable Rates
Winter (per ccf) $3.25
Summer (per ccf) $3.47
Commercial
Fixed (per acct) $50.17
Seasonal Variable Rates
Winter (per ccf) $3.15
Summer (per ccf) $3.36
12.7 Affordability
The DOH and the Department of Commerce Public Works Board use an affordability index to prioritize low-cost loan awards depending on whether rates exceed 2.50 percent of the median household income for the service area. The average median household income for Snohomish County was $86,691 between 2015 and 2019 according to the U.S. Census Bureau. The 2019 value is escalated based on the assumed 2.30 percent general cost inflation to show the median household income in future years. Table 12-10 presents the District’s rates projected to 2030, tested against the 2.50 percent monthly affordability threshold.
Table 12-10 | Affordability Test
Year Inflation Median Household Income
2.50% Monthly Threshold
Projected Monthly Bill1
% of HH Income
2019 $86,691
2020 2.30% $88,685
2021 2.30% $90,725 $189.01 $47.62 0.63%
2022 2.30% $92,811 $193.36 $48.45 0.63%
2023 2.30% $94,946 $197.80 $49.50 0.63%
2024 2.30% $97,130 $202.35 $50.56 0.62%
2025 2.30% $99,364 $207.01 $51.65 0.62%
2026 2.30% $101,649 $211.77 $52.76 0.62%
2027 2.30% $103,987 $216.64 $53.94 0.62%
2028 2.30% $106,379 $221.62 $55.16 0.62%
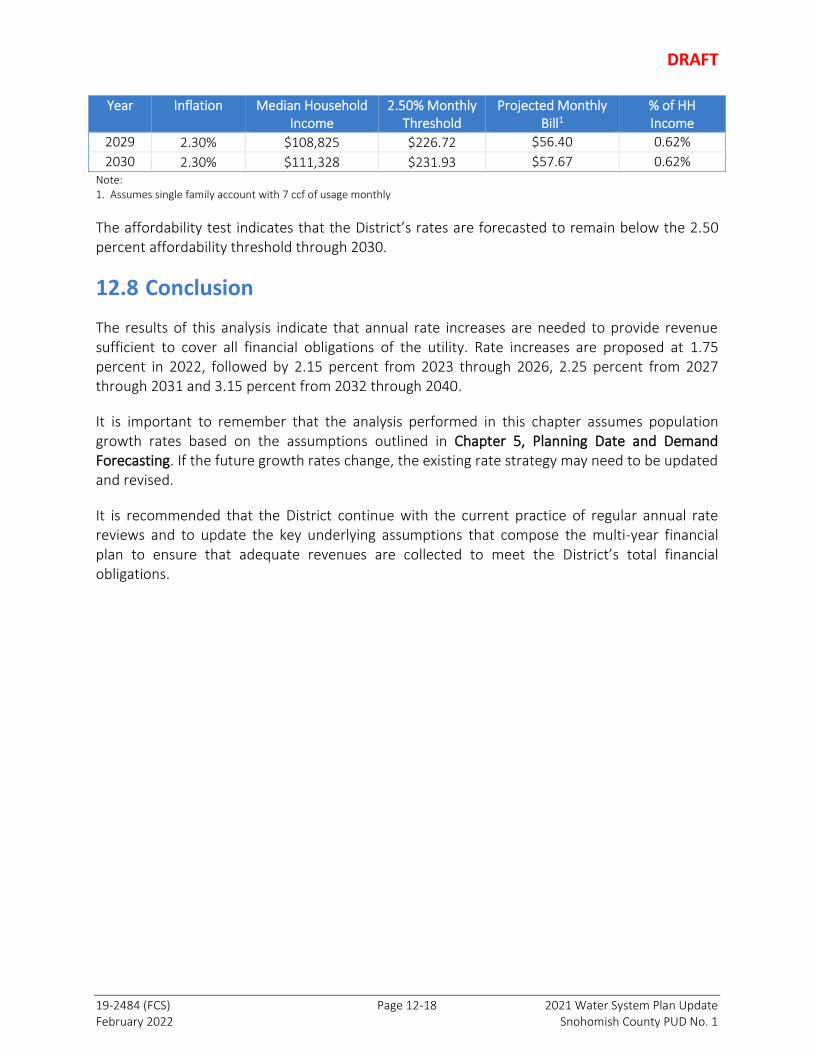
DRAFT
19-2484 (FCS) Page 12-18 2021 Water System Plan Update February 2022 Snohomish County PUD No. 1
Year Inflation Median Household Income
2.50% Monthly Threshold
Projected Monthly Bill1
% of HH Income
2029 2.30% $108,825 $226.72 $56.40 0.62%
2030 2.30% $111,328 $231.93 $57.67 0.62% Note: 1. Assumes single family account with 7 ccf of usage monthly
The affordability test indicates that the District’s rates are forecasted to remain below the 2.50 percent affordability threshold through 2030.
12.8 Conclusion
The results of this analysis indicate that annual rate increases are needed to provide revenue sufficient to cover all financial obligations of the utility. Rate increases are proposed at 1.75 percent in 2022, followed by 2.15 percent from 2023 through 2026, 2.25 percent from 2027 through 2031 and 3.15 percent from 2032 through 2040.
It is important to remember that the analysis performed in this chapter assumes population growth rates based on the assumptions outlined in Chapter 5, Planning Date and Demand Forecasting. If the future growth rates change, the existing rate strategy may need to be updated and revised.
It is recommended that the District continue with the current practice of regular annual rate reviews and to update the key underlying assumptions that compose the multi-year financial plan to ensure that adequate revenues are collected to meet the District’s total financial obligations.

THIS PAGE INTENTIONALLY LEFT BLANK

1102 BROADWAY PLAZA, SUITE #401
TACOMA, WA 98402
www.murraysmith.us