2021 Talent Trends Report | Michael Page India
79
INDIA EMPLOYMENT RECRUITMENT TALENT OUTLOOK TALENT TRENDS 20 21
-
Upload
khangminh22 -
Category
Documents
-
view
1 -
download
0
Transcript of 2021 Talent Trends Report | Michael Page India

INDIA
EMPLOYMENT
RECRUITMENT
TALENT OUTLOOK
T A L E N T T R E N D S
2 0 2 1

C O N T E N T S
A S I A P A C I F I C
Foreword 4Leading with impact 5Digital transformation 6Organisation (re)design 7Bridging skill gaps 8Rethinking workplace flexibility 9Assessing performance: What has changed? 10Leadership communication 11Mental health & wellbeing 12Women in leadership 13Diversity & inclusion 15
I N D I A
Market Highlights 17Hiring outlook 18Contracting / temporary recruitment 19Salary increases 20Expectations for bonuses 21Promotion 22 Talent attraction strategies 23Salary expectations 24Attracting & hiring talent 25Employer branding 26Candidate experience 27Talent attraction to retention 28Talent retention strategies 29Employee experience 30
S E C T O R S I N F O C U S
Technology 32Healthcare & Life Sciences 35Banking & Financial Services 38E-commerce 42Property & Construction 45
S A L A R Y T A B L E S
Banking & Financial Services 49Digital & Analytics 60Engineering & Manufacturing 61Finance & Accounting 63Healthcare & Life Sciences 65Human Resources 68Legal & Compliance 70Property & Construction 71Procurement & Supply Chain 72Technology 74Sales & Marketing 75
India Talent Trends 2021 2

A S I A P A C I F I C
India Talent Trends 2021 3

I am pleased to share our Talent Trends 2021 Report, which features insights and market sentiment in Asia Pacific on prominent recruitment and talent-related topics including digital readiness, organisational design, flexible work, leadership, performance management and diversity and inclusion. The results draw from a survey of 12 Asia Pacific markets, with over 5500 businesses and 21,000 employees providing responses, of which 3500-plus are directors or CXOs.
We are focused on four key areas as we look ahead to 2021 and these seem to be closely aligned to the feedback we’re hearing from the marketplace.
High potential, talented professionals remain in demand
While this fluctuates from market to market, and sector to sector, these individuals require significant incentive to move from their existing companies with ongoing concerns around job security. Many organisations are choosing to consolidate while protecting the shape of their business in the short-term, yet many are also focused on attracting talented people to allow for future growth.
Growing investment into Chinese companies
We are seeing encouraging signs of recovery across parts of Asia Pacific, particularly in China and Japan. Asian markets have a strong track record of rebounding quickly from past disruptions – and we’re beginning to see signs of that again. Business performance within China continues to improve while we also see a clear focus on strengthening relationships with Chinese-owned companies investing in markets outside of China.
Ongoing demand in Technology and Healthcare & Life Sciences
We witnessed strong demand in these areas pre-COVID-19 and throughout 2020. These have proven to be very resilient
areas in terms of recruitment activity. We expect to see ongoing growth and emphasis in these sectors across a variety of job types in 2021 and beyond.
Temporary work and contracting on the rise
This form of employment has been well-established in certain Asia Pacific markets for decades. However, it remains embryonic in several Asian markets with momentum steadily building. The impact of COVID-19 and the related market uncertainty has accelerated the demand for flexible staffing solutions.
At PageGroup, we continue to focus on protecting the shape of our business while having a real eye on the future and the exciting opportunities that exist across Asia Pacific. Encouragingly, many of our clients appear to be adopting the same approach.
This report provides insights into what businesses and employees experienced in 2020, practical learnings and what is expected in 2021. With a footprint across 27 offices and over 1400 people across the Asia Pacific region, we are in a position to interact and engage with thousands of clients and job seekers every day, which provides us with unique and exclusive insights. If you’d like to discuss what might be relevant in your market or have any other recruitment-related questions, please don’t hesitate to contact us.
All the best in 2021.
F O R E W O R D
ANTHONY THOMPSONRegional Managing Director, Asia Pacific Global Executive Board Director
India Talent Trends 2021 4

Driving employee engagement and motivation
Focusing on health and safety of employees
Reviving revenue generation
APAC OUTLOOK
L E A D I N G W I T H I M P A C T
2021 Top priorities for business leaders
KEY INSIGHTSThe COVID-19 pandemic dealt a major blow to the global economy across virtually all sectors and markets in 2020 - the impact varied across countries but all were affected in some way. Recruitment activity for PageGroup in terms of vacancies reduced by 8% to 35% depending on the location. Several businesses reported a much more conservative approach to their hiring strategy, choosing instead to freeze or even reduce their headcount in order to reduce costs. Others focused on maintaining their business shape with longer term growth in mind but always with an eye on the future.
A reduced rate of hiring does not necessarily mean that businesses are shutting their doors to qualified talent altogether. We saw very positive trends upward from Q2 to Q3 and Q4 versus Q3. Optimism certainly exists for 2021, as 42% of businesses said that they are already looking to increase headcount in the coming year.
While the global pandemic presents an unprecedented set of circumstances, business leaders across Asia Pacific responded to these global challenges by implementing:
1. Flexible and remote work policies2. Digital transformation initiatives to drive efficiency3. Steps to increase and improve internal communications
India Talent Trends 2021 5

of companies intend to increase investment in technology and digital tools in 202168%
Throughout the COVID-19 pandemic, digital transformation went from an industry buzzword to a top-of-mind priority for businesses across all sectors and markets. Our survey found that as communication and operations migrated online at a rapid pace, most businesses found ways to quickly adapt to the new normal. Productivity and effectiveness took some hit, at least in the short term, as businesses also reported some challenges with execution due to skills gaps and lack of training.
Benefits Benefits Benefits
Dashboards that visually showcase data
Improved messaging with automation
Efficiency enhanced by automation
COMMUNICATION TOOLS COLLABORATIVE SUITESCUSTOMER RELATIONSHIP
MANAGEMENT (CRM) TOOLS
Popular tools Popular tools Popular tools
APAC FUTURE WORKPLACE STRATEGIES
D I G I T A L T R A N S F O R M A T I O N
Streamlined communications
Company knowledge archive
Real-time crowdsourced content
Increased creative thinking
More flexibility in project direction
Increased learning possibilities
KEY INSIGHTS
TOP 3 INVESTMENT AREAS
Video and web conferencing, enterprise social networking services
Calendar sharing, file sharing, document synchronisation, cloud
storage, whiteboards
Operational CRM, analytical CRM, collaborative CRM, campaign
management CRM, strategic CRM
India Talent Trends 2021 6

APAC FUTURE WORKPLACE STRATEGIES
O R G A N I S A T I O N ( R E ) D E S I G N
of companies expect to undergo certain levels of restructuring in 2021 53%
21%Undecided
26% No38%
Yes, minor restructuring
15% Yes, major
restructuring
KEY INSIGHTSThe breakout of COVID-19 has adversely impacted revenue for many organisations and brought profound change for many companies in the long term. From our survey findings, adapting to the changing environment is a business priority. Many respondents felt that reviewing organisation design is a necessary focus for future business recovery and growth. According to Anthony Thompson, Regional Managing Director, Asia Pacific, this will impact existing employees, require the attraction of new ones and will see the implementation of a blend of staffing strategies involving permanent, temporary and outsourced solutions.
Our survey results indicate that only 26% of companies are confident that they will not have any form of restructuring in 2021. The way these changes are managed will have a major impact on the ability of these organisations to retain and also attract talent. Feedback from our candidate community in Asia Pacific indicates a strong desire for environments that are agile and progressive, but avoids constant change without a very clear and well-communicated purpose.
India Talent Trends 2021 7

APAC FUTURE WORKPLACE STRATEGIES
B R I D G I N G S K I L L G A P S
Under normal market conditions, contractors and temporary staff add value by covering critical skill gaps, permanent staffers’ holidays, important projects and parental leave — all without incurring substantial risks or certain headcount-related costs and issues. However, during the recovery phase, businesses will want even more staffing flexibility, which is where contractors and temporary staff come into play. Beyond the benefits mentioned above, our survey results found that employers believe contractors and temporary staff afford the freedom to increase or decrease headcount based on short-term business needs. Increasingly, there are specialist contractors preferring this form of employment.
Furthermore, certain business verticals will see a faster rebound than others within the same organisation. Businesses are taking the opportunity to assess the resources currently available, where their priorities truly lie, as well as how these resources can be better optimised and allocated.
Many businesses will focus on staffing flexibility to better optimise and allocate resources
KEY INSIGHTS
20%of companies would prioritise hiring short-term contractors/temporary professionals to bridge skill gaps arising from investment in digital tools and organisation redesign – this is an increase from 15% in 2019
increase seen by LinkedIn in contract/temporary job listings globally in 202058%
India Talent Trends 2021 8

APAC FUTURE WORKPLACE STRATEGIES
R E T H I N K I N G W O R K P L A C E F L E X I B I L I T Y
According to our survey, working from home, either some or most of the time, in 2021 will be increasingly adopted by companies. However, only 5% of employees in Asia Pacific prefer to work 100% remotely, citing a need for frequent social interaction. Most prefer a combination of working remotely and in a workplace, with 87% of employees in favour of blended flexibility, and having a choice.
Flexible working arrangements preferred by employees
Same total working hours across the same workdays but with flexible timing
Completely flexible at your discretion
My preference is still to have fixed start and end work timings across the weekdays
Compressed work week (4 days work week with extended hours)
52%
27%
13%
8%
KEY INSIGHTS
When professionals across Asia Pacific are forced to work remotely, with many grappling with the reality of working from home for extended periods of time, 1 in 5 employees found themselves less productive working at home. Past studies suggest that working from home actually makes professionals better at administrative tasks but cited greater challenges with collaboration. Working from home also requires strong technology support, being self-disciplined, and a comfortable working environment, The loss of any elements above may cause a decrease in productivity.
From our findings, it is clear there is no “one-size-fits-all” workplace to suit everyone. Good work can be carried out in different ways across multiple workplaces. Organisations have to recognise that flexible work arrangements should be tailored to individuals and setting a clear definition of flexible work would be the first step towards nurturing the motivation, performance and engagement levels of employees.
4 in 5employees feel equally or more productive working from home, only 5% prefer to work completely remote.
Instead, most employees prefer a blended combination of remote work and at the workplace, citing the need for frequent social interaction.
Our findings also show that employees prefer to have flexible work timings across the same workdays and total working hours.
Organisations are recognising that there is no “one-size-fits-all” workplace or work arrangement.
Even though
India Talent Trends 2021 9

ATTRIBUTES THAT COMPANIES VALUE IN EMPLOYEES DURING TIMES OF CRISIS
43% Initiative
21% Stress management
56% Agility
4% Conflict management
16% Fast learning
64% Collaboration
61% Resilience
5% Influencing
51%
KEY INSIGHTS
of organisations in Asia Pacific chose to re-establish new metrics to measure individual performance by placing greater importance on positive behaviours
Organisations considered the following points when evaluating individual performances:
Strive for balance and establish how far an individual’s personal challenges hampered their ability to complete a task or hit a target
Allow individuals to take the lead on explaining the outcome, to ensure accountability and ownership
Recognise positive behaviour change that are valuable to the team during times of crisis
APAC FUTURE WORKPLACE STRATEGIES
A S S E S S I N G P E R F O R M A N C E : W H A T H A S C H A N G E D ?
With most of the world experiencing some form of city or nation-wide lockdown, businesses have had to move parts of their communication and operations online. As employees migrated from an office setting to a home-based one, they also gained a significant amount of autonomy and trust in activity from their employers. For example, in Asia Pacific, 51% of businesses did not closely monitor their employees’ productivity as they have in the past, while they worked remotely.
The need to improve overall performance in a time of unprecedented business disruption became the next crucial challenge once workforces were set up to work from home.
Long-established strategies, plans and processes became redundant overnight, therefore almost all employees’ responsibilities were impacted by circumstances out of their control. Assessing them against KPIs that were put in place before COVID-19 became unbalanced, in some cases unrealistic and potentially demoralising.
Our findings indicate it’s important to create KPIs and measures relevant to the circumstances, with a key question here being: Will assessing performance revert back post-COVID-19 or is this a lasting change? Time will tell.
India Talent Trends 2021 10

APAC PEOPLE-FIRST STRATEGIES
L E A D E R S H I P C O M M U N I C A T I O N
80% of companies surveyed believed they increased transparency in the following areas:
33%
31%
56%
14%
Financial situation
People management
Business strategy
Salaries and bonuses
Our findings show both employers and their employees found openness and transparency key to effective internal communications
KEY INSIGHTS
53%
of businesses will maintain or even increase the frequency of communication and number of channels beyond emails in 2021 Townhalls and webinars will be staples for effective leadership communication
India Talent Trends 2021 11
APAC PEOPLE-FIRST STRATEGIES
M E N T A L H E A L T H & W E L L B E I N G
KEY INSIGHTSMental health is a subject that is receiving increased attention in the workplace. As the global pandemic continues, it further emphasises the importance of prioritising the mental health of people throughout any organisation.
Aside from simply being a part of overall health, the direct relationship between mental health and productivity is becoming clear, with multiple studies showing that those who are enjoying sound mental health being generally more productive. A study1 by the World Health Organisation found that for every US$1 invested in mental care programmes, there was a US$4 improvement in health and productivity. These results are pointing to a truth that a focus on mental health is good for both employees and a company’s performance.
From our survey, 9 in 10 employees agree that their top management has communicated more often with them during times of crisis, however, a large proportion of them indicated that workplace empathy had decreased, citing the following reasons:
1. Even though the frequency of leadership communications increased, some employees felt most messages delivered lack sincerity.
2. Most managers did enough to abide by their company’s health and wellbeing policies but respondents felt that lacked genuine concern and understanding of employees’ circumstances.
34%
21%
6%
43%
Employer
Employee
60%
36%
Employer
Employee
Employer
Employee
Regular pulse surveys with communication on results and actions that will be taken
The implementation of shadow boards and reverse mentoring programs driving communication upwards, as well as top down
Training and coaching courses for leaders on how to really connect. Tell stories and bring messages to life
Clarity and consistency but recognising each individual in the audience is different, with different motivators and emotional triggers
The emphasis needs to be what is understood and received, not just what is communicated
Level of empathy increased
Level of empathy remained the same
Level of empathy reduced
Our findings reveal a need for companies to focus on authentic, empathetic communication. This will help bridge the gap between perceived and real levels of empathy from business leaders
Empathetic Communication Strategies
Some approaches and views from our findings:
1 https://www.who.int/teams/mental-health-and-substance-use/mental-health-in-the-workplace
How would you rate workplace empathy in your company now compared to pre-pandemic?
India Talent Trends 2021 12

APAC GENDER DIVERSITY
W O M E N I N L E A D E R S H I P
% of senior executive1 job openings filled by females in 2020*
Top 3 sectors with highest number of
senior female appointments
Thailand
Hong Kong
Taiwan
China Mainland
Australia
Vietnam
Japan
Singapore
Indonesia
Malaysia
India
53%
45%
42%
36%
33%
31%
27%
24%
23%
23%
13%
Industrial & Manufacturing
Retail Internet
Top 3 job types with highest number of
senior female appointments
Legal Director
Chief Finance Officer
MarketingDirector
When Jane Fraser was appointed as the Chief Executive Officer of Citigroup in early 2020, she became the first ever female CEO of a Wall Street bank. Together with a few other senior female appointments, they pushed the number of female-led companies on Fortune 500 to 37 from 33 in 2019. In Asia Pacific, we saw a 3.5% increase* in the number of new female appointments for senior executive job openings over the last 24 months, reflecting a slow but steady increase in senior leadership diversity.
1 Senior executive refers to Director/VP level and above* Information based on PageGroup’s proprietary data
India Talent Trends 2021 13

APAC GENDER DIVERSITY
W O M E N I N L E A D E R S H I P
What are your thoughts around mentorship?
“When I mentor other people, I get the opportunity to share my learnings and help people navigate obstacles that they might be facing. On another level, when you are mentoring someone within your industry or organisation, you get to know some of the challenges that people are facing, and it gives you insights to the culture and obstacles. This feedback system allows you to drive change.”
Leanne Taylor, Chief Operating Officer, Asia Pacific & Japan at Citrix
“To me, a mentor doesn’t need to be very strong. You just need a listening heart and lend your ears in your daily work and in your life. People can see you for who you are. This shortens the distance between you and the mentee, so that you can build up mutual trust.”
Jingle Pang, Deputy General Manager & Chief Information Officer at Ping An Technology
“Build a support system and identify allies as you progress through an organisation. This is something that men are generally better at, and I think women can take a leaf from that.”
Anita Menon, Chief Risk Officer at Prudential BSN Takaful Berhad
“[It’s important to find] both men and women as allies, mentors and sponsors. Also, focus on the transition points in your careers. For example, if you are having kids, you are going to need more support, [so] having the right network is really critical.”
Davina Yeo, Chief of Staff at Microsoft Asia Pacific
“[Be] proud of being the only woman in the room. Over time, I understood what it meant to be there, how to leverage the opportunity and minimise the constraints that come with it. It’s about getting a seat at the table, remaining there and enjoying every minute of the rollercoaster.”
Anna Campagna, Director, Sales Transformation APAC at Heineken Asia Pacific
What is your tip for women to succeed in male-dominated industries?
As businesses in Asia Pacific recognise the benefits women leaders bring to the board, we expect that we will see increased focus and discussions around gender diversity. In a bid to find out more about women leaders, PageGroup launched a content series titled ‘Leading Women’ highlighting the professional challenges and life aspirations of female leaders in Asia Pacific.
5 traits many successful female leaders possess
KEY INSIGHTS
1. Authenticity They recognise that showing vulnerability not
only conveys transparency, it builds trust and relatability with the team at large, as well as confidence within themselves.
2. Strong belief in the power of mentorship They are enthusiastic not just to receive it from those that came before, but to pay it forward to others as well.
3. The ability to overcome negative voices and self-doubt Regardless of background or gender acknowledging their own skills and experience would define their potential to succeed.
4. Humility and curiosity for the new They are comfortable about not having the right answer all the time and are willing to learn from their teams.
5. Empathy They offer employees the opportunity to feel
heard, and that creates a collaborative and open environment where people are more open to alternative viewpoints and more willing to meet others halfway.
India Talent Trends 2021 14

APAC OTHER DIVERSITY & INCLUSION
D I V E R S I T Y & I N C L U S I O N
Businesses have to remember the vital role that senior leadership plays in driving inclusive cultures.
SARAH KIRK
Global Diversity & Inclusion Director at PageGroup
1 https://www.catalyst.org/research/why-diversity-and-inclusion-matter-financial-performance/
Organisations prioritise D&I strategies for various social reasons but also extremely compelling commercial ones. According to a report1 by Credit Suisse, companies, in which women held 20% or more management roles, generated 2.04% higher cash flow returns on investment than companies with 15% or less women in management roles. This was based off a study of 30,000 senior executives at over 3,000 businesses across the world.
High potential talent are also inclined to work for organisations with active D&I strategies, underpinned with current policies and a diverse workforce recognising the commercial returns that diversity brings.
It is clear that many businesses now embrace and implement strategies to reduce bias at the interview stage by designing questions with clarity and fairness based around behaviour and performance. This starts with identifying leaders who carry the right skill set for the position of talent management duties.
Even during the global pandemic, frequent communication, webinars, resources and personal stories continue to be shared across organisations to reinforce their commitment to a culture that takes pride in its focus on D&I and encourages inclusion without exception.
According to Sarah Kirk, Global Diversity & Inclusion Director at PageGroup, businesses have to remember the vital role that senior leadership plays in driving inclusive cultures. Employees can benefit from directly hearing senior executives talk about their career journeys and vision for an inclusive workplace.
India Talent Trends 2021 15

I N D I A

Entering 2020, India was riding on a high in terms of hiring activities, which was driven by the country’s burgeoning economy. However, the COVID-19 pandemic quickly put the brakes to India’s financial boom, and the world, to a standstill. Caution was top of mind as businesses remained in a holding position during the early months of the nation-wide lockdown. By mid-2020, it was clear that the pandemic, and the resulting economic downturn, was not going away anytime soon.
With that said, there were multiple bright spots to be had. Hiring activities among internet-based businesses, such as e-commerce and educational technology, remained relatively robust across India. By September, the mindsets of even the most traditional industries began to lean towards the positive, with businesses switching gears to recovery mode for 2021 and beyond. Some companies even saw 2020 as an opportunity to reassess their priorities and implement changes. For instance, in India, startups examined their core businesses and retrained their focus on profitability. Larger conglomerates, too, took the time to increase their reach and influence and establish new lines of business.
These positive movements have already spurred job-related activities across India. In fact, according to our internal data, activities have resumed to about 85% of pre-COVID levels by the end of 2020. With technology and healthcare sectors in India showing promising recovery signs, Michael Page India’s assignments will likely return to full capacity come Q2 2021.
Perhaps even more exciting is that Michael Page is celebrating its 10th anniversary in India this year. Since 2011, we have grown to 150 consultants across two distinct brands and three offices. I am immensely proud of the lives that we have changed in positive ways throughout the journey.
Together with your support, we have made a difference to over 7,000 people’s careers and we hope to achieve even more in the next 10 years.
We have also had over 250 internal promotions, bringing a significant number of our talent to the next rung of their career ladders. Despite all the movements, it is also extraordinary that the original 10 people who joined us in 2011 are still part our India family today. This is testament to not just the scale to which we have grown, but the resilience we have forged as a team.
Much of India’s economic miracles occurred within the same timeframe and from its rapidly developing technology and fintech sectors to the burgeoning role as a logistics and manufacturing hub. Michael Page is proud to have witnessed India’s progress through the years, supporting businesses with human resources needs. Besides growing from one to three offices, the Michael Page India team has also survived arguably the most grueling parts of the COVID-19 pandemic. The experience has made us more resilient, and I believe that the year ahead is going to be the best one yet.
I N D I A
Hiring activities among internet-based businesses, such as e-commerce and educational technology, remained relatively robust across India.
IMAGE TO BE CHANGED
NICOLAS DUMOULINManaging Director, India
India Talent Trends 2021 17

INDIA
H I R I N G O U T L O O K
Reducing
Remains the same
Increasing
The COVID-19 pandemic and the resulting economic downturn has had a significant impact across the Asia Pacific, and India was not spared. In terms of recruitment, hiring activities in the second-most populated country dipped 18% in 2020. With that said, optimism is already starting to show, with about 53% of companies in India looking to increase their headcounts in 2021.
TOP 5
Technology & E-commerce
Healthcare & Life Sciences
Fintech
Professional Services
Industrial & Manufacturing
Sectors with highest hiring activities TOP 5
Engineering & Data Scientists
Growth Hackers / Performance Marketing
Sales & Business Development
Research & Development
Legal Counsels
Job types with the highest hiring activity
11%
36%
53%
75% of those employed anticipate looking for new job opportunities in 2021
India Talent Trends 2021 18

C O N T R A C T I N G
INDIA
Investment in training of existing employees
Automation for basic processes
Full-time hires in key areas
Short-term contract hires
Third-party service providers/Outsourcing
Contracting has been widely adopted as a popular hiring solution by companies and a popular career option for professionals of all levels of experience across key countries in the Asia-Pacific region. According to The future of work – A journey to 2022, released by PwC, 46% of HR professionals expect at least 20% of their workforce to be made up of contractors or temporary workers by 2022. Contracting within the technology sector is one of the long-term growth areas in India, and according to a Michael Page survey conducted in 2018, 55% of professionals in India were interested in becoming a contractor.
Both employers and professionals are beginning to see the advantages of contracting. For professionals, it provides a lot of flexibility and a variety of experience in a short time. They can be well-paid and can build transferable and soft skills. Meanwhile, especially in the economic downturn, professionals are finding that even if there aren’t many full-time jobs available in their field, there are opportunities for contract work or project-based roles. And most importantly, if a professional tries contracting and finds that it isn’t right for any number of reasons, it’s fairly easy to find the way back to full-time employment.
There are many advantages to hire contract, interim or temporary workers as well. Contracting can be the solution to headcount limits or project hire, and can save cost and improve flexibility. Employers only pay for what they get, and that is according to the hours/days the candidates worked. Based on this, we can see more and more companies, over 22%, across APAC are seeking short-term contract hire for filling in skill gaps.
How will your company address skills gaps within your current workforce as you move into business recovery?
47%
34%
38%
23%
20%
India Talent Trends 2021 19

P R O J E C T E D A N N U A L S A L A R Y I N C R E A S E
INDIA
Although India registered its first economic recession for nearly 30 years, more than
Average annual salary increase by sector
Key sectors Average annual salary increase in 2021
Banking & Financial Services 6.8%
E-commerce / Internet 7.5%
Fast Moving Consumer Goods (FMCG) 7.6%
Healthcare & Life Sciences 8.0%
Industrial & Manufacturing 5.9%
Natural Resources & Energy 4.9%
Professional Services 6.7%
Property & Construction 5.3%
Retail 6.1%
Technology 7.3%
Transport & Distribution 6%
of employers intend to increase salaries in 2021
60%
Benchmark your salaryRetrieve the salary list for India here.
Does your company anticipate having an annual salary increase for your employees in 2021?
60% Yes
10% No
30% Undecided
India Talent Trends 2021 20

INDIA
P R O J E C T E D B O N U S P A Y O U T
of companies intend to give out bonus payments. Out of these companies, about 43% would give out more than one month’s worth of bonus.
55%
Less than one month
About one month
More than one month
10%
46%
44%
Professional Services
Property & Construction
Retail
Technology
Transport & Distribution
Banking & Financial Services
E-commerce / Internet
Fast Moving Consumer Goods (FMCG)
Healthcare & Life Sciences
Industrial & Manufacturing
61%
38%
40%
49%
38%
27%
33%
34%
60%
40%
Percentage of companies giving out more than one-month bonus by sector
India Talent Trends 2021 21
INDIA
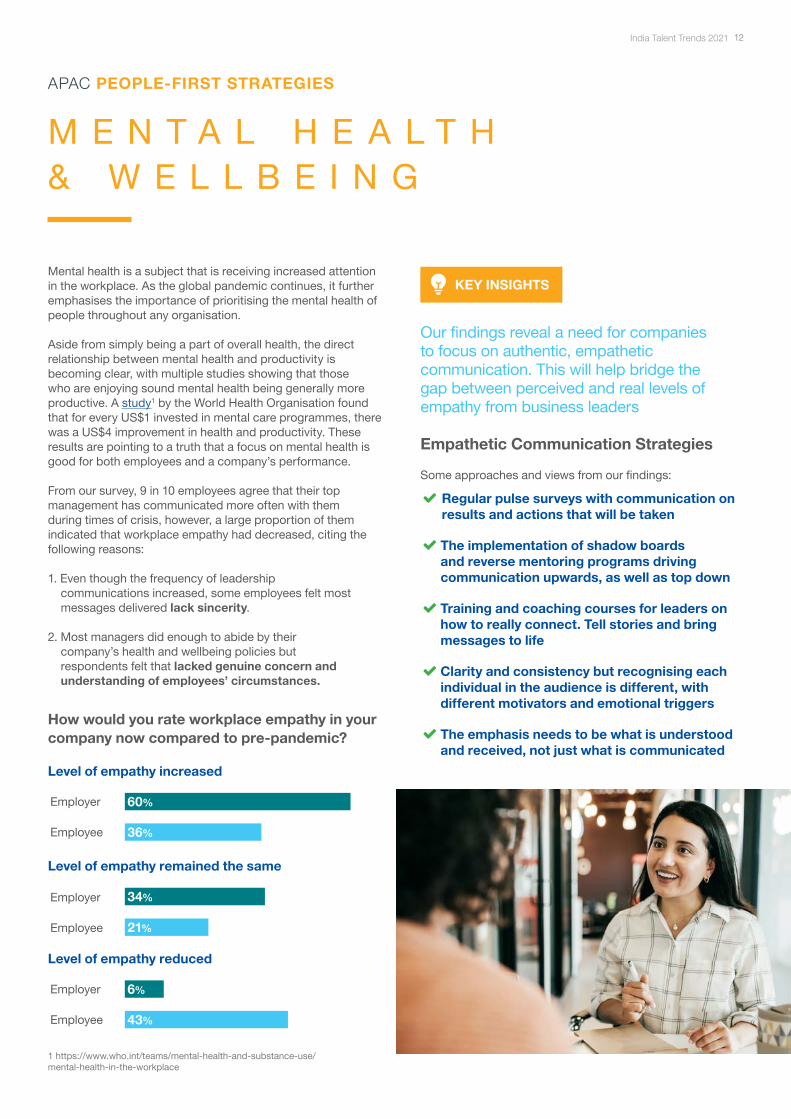
P R O M O T I O N A N D C A R E E R P R O G R E S S I O N
companies anticipate employee promotions to be postponed in 2021. Middle management employees are expected to be most impacted.
However,of the companies believe that things would change for the better from Q2 2021 onwards.
Does your company anticipate promotion / career progression plans for your employees to be significantly affected or postponed in 2021 due to the business impact of COVID-19?
49%
79%
44%
Entry-to junior-level
Middle management
Senior leadership
56%
1 in 3
Which job level(s) would promotion / career progression plans for your employees be affected?
42% No
35% Yes
23% Undecided
India Talent Trends 2021 22

Competitive remuneration and benefits package
Dynamic company culture
Professional development opportunities
Flexible work arrangements
Company’s reputation
Constant technology advancement
INDIA
T A L E N T A T T R A C T I O N S T R A T E G I E S
of respondents state remuneration and benefits as their top consideration when accepting a job offer60%
Remuneration and benefits
Job scope and responsibilities
Future internal growth opportunities
Work culture
Company brand and reputation
considerations when accepting a job offer TOP 5
Talent attraction strategies by companies in India
35%
41%
32%
30%
26%
19%
India Talent Trends 2021 23

INDIA
S A L A R Y E X P E C T A T I O N S
Average remuneration increases for potential new hires in 2021
Banking & Financial Services 13%
E-commerce / Internet 16%
Fast Moving Consumer Goods (FMCG) 14%
Healthcare & Life Sciences 15-20%
Industrial & Manufacturing 14%
Natural Resources & Energy 13%
Professional Services 14%
Property & Construction 11%
Retail 13%
Technology 15-25%
Transport & Distribution 11%
Job levelsAverage salary expectations in 2021
Non-managerial level 20% more than their current / last-drawn salary
Middle management 20% more than their current / last-drawn salary
Director / VP level 19% more than their current / last-drawn salary
CXO 19% more than their current / last-drawn salary
Jobseekers’ average salary expectations on a new job offer in 2021
expects zero increase from their current / last-drawn salary for a new offer in 2021
Benchmark your salaryRetrieve the salary list for India here.
1 in 10
India Talent Trends 2021 24

As companies begin to look beyond the pandemic, a question comes up: how will hiring evolve in response to changes in workplaces around the world? There are several trends already becoming clear, and these are likely to continue in the upcoming years.
INDIA
H I R I N G T A L E N T
Employers’ current concerns when recruiting talent
69%
Skill sets and experience
13%
Soft skills
48%
Cultural fit
31%
Headcount budget
12%
Location
Quality candidates will continue to command top salaries
Even though there may be many candidates on the market, those with the right combination of experience and soft skills will still command high salaries, and become even more in demand as the market returns to normal.
Contractors and temp staff in high demand
Contractors and temp staff give companies the flexibility needed during periods of uncertainty.
Focus on purpose and vision
Companies must clearly define their purpose and vision, and understand how to effectively communicate these key messages to stakeholders, clients and prospective employees
Emphasis placed on soft skills
Soft skills, such as communication, teamwork, relationship management and leadership will become the differentiating factors between good and great talent.
Focus on humans in the recruitment process
Considering the automation opportunities presented by AI and machine learning, the human side of the recruitment process, such as cultural fit, growth potential and evaluating soft skills will become even more important in relation to growth opportunities.
India Talent Trends 2021 25

INDIA
E M P L O Y E R B R A N D I N G
A strong and respectable brand message and reputation can make all the difference in a company’s ability to land top talent or lose out to the competition.
Mid-to-senior professionals consider company values when they plan their career progression. These prospective candidates strive to work in a business where company values are aligned with their goals, perspectives and personal branding. They see an employer branding as an extension of their branding.
Therefore, companies need to do more than publish a job description and present an offer when hiring. They have to communicate their brand values and promote themselves to candidates just as much as the other way around during the hiring process.
Along with the offer, candidates are also looking at working environment, brand purpose, diversity and inclusion, and environmental and corporate social responsibility initiatives.
Prospective candidates are also increasingly empowered by the wealth of information available, from review job sites, such as Glassdoor, and social media platforms. It is crucial to note that while employer branding is essential, the company’s reputation is just as vital.
Boomer Born in or before 1965
1 Healthy work culture
2 Company mission and values
3 Strong financial performance
Gen X & Y Born in or between 1966 and 1994
1 Healthy work culture
2 Possible career growth opportunities
3 Company mission and values
Gen Z Born in or after 1995
1 Healthy work culture
2 Possible career growth opportunities
3 Company mission and values
Factors that influence employer brand ranking by work generationTOP 3
1 Online job boards
2 LinkedIn jobs
3 Recruitment company’s webpages
Popular channels for job searches TOP 3
Platforms for research on companyTOP 3
Company websites
Social media
Review Sites
respondents say they do extensive research before applying for a job, while others do brief ones
2 in 5
Good employer branding includes the following elements:
A strong employee value proposition (EVP)
A good company website
Positive presence on social media and review sites
India Talent Trends 2021 26

INDIA
C A N D I D A T E E X P E R I E N C E
As competition for top talent gets fiercer, companies are adopting a candidate-first mentality and paying more attention to candidate experience to dramatically improve their recruitment process and win the talent race.
A great candidate experience is made up of several elements, such as: reducing friction and repetition in the application process; automating time-consuming, low-touch processes to speed up time to fill; having mechanisms to communicate with candidates and answer questions as close to real time as possible; following up with candidates who are passed over and letting them know of other relevant opportunities they might be interested in.
There are also best practices to improve candidate experience. For example: writing clear job descriptions; setting clear expectations about the recruiting process from pre-application to onboarding; active listening and communicating more often; knowledge, skills and experience deserves genuine consideration for the job to which candidate has applied; providing candidates with information about what to expect at in-person or video call interviews; and importantly, if you want to keep specific candidates in mind for future openings, keep track of them and regularly stay in touch.
Lack of follow-up
Lack of transparency on expectations and remunerations
Process is too long and tedious
have had frustrating experiences during interviews. 66% of
them say such frustrations would affect their decision to accept an offer.
5Step 1 Scrutinise your branding, employee value proposition and write better job descriptions to attract the right talent.
Step 2 Assess CVs and pay extra attention to skills and competencies rather than career fluidity.
Step 3 Adapt your communication with candidates by utilising video technology.
Step 4 Make a strong offer but remember that it isn’t just about the money.
Step 5 Close the loop with a remote onboarding process, which includes clear communication, as well as regular check-ins and feedback.
1
2
3
Common frustrations during the interview processTOP 3
steps to a successful remote hiring process
9 in 10
India Talent Trends 2021 27

INDIA
T A L E N T A T T R A C T I O N T O R E T E N T I O N
How a good talent attraction plan is the start of talent retention
When it comes to talent management, there is a fair bit of emphasis placed on talent retention within an organisation. However, many companies miss out on developing good talent attraction strategies to ensure they are making the right hires in the first place.
To ensure a match between candidate and organisation, companies should clearly define company culture and values, and be able to communicate it throughout the hiring process. Through smart hiring, companies will ensure continuity of culture and values throughout any challenges.
In addition to culture and values, top professionals will want to know how they can grow within an organisation, along with other factors such as the following: How diverse is the company?
What’s the peer group they will be working with?
What do the leaders stand for, especially in difficult times?
A company that can answer these questions definitively will be able to attract the right talent – and can then shift the focus to retaining them.
India Talent Trends 2021 28

INDIA
T A L E N T R E T E N T I O N S T R A T E G I E S
Talent retention is a vital element of a company’s long-term success and a strong indicator of the overall culture, values and effectiveness in bringing employees into an organisation. To improve talent retention, organisations must think beyond monetary benefits to provide an overall well-rounded experience for their employees. Here are several strategies to improve employee retention:
Provide frequent opportunities for learning and professional development.
Chart a clear path for career advancement that includes key behaviours, goals and KPIs.
Communicate transparently and as frequently as necessary.
Foster a positive work environment and culture
Seek out regular feedback often and use it to enact change as needed.
Offer non-monetary benefits that provide for a good work-life balance.
Ensure that culture, vision and values are embodied by management and leaders within your organisation.
Although job security is top of mind
of those employed anticipate themselves looking for new job opportunities72%
1 Better remuneration and benefits package from other offers
2 Lack of growth opportunities
3 Skills are underutilised
4 Company’s lack of concern for employees’ well-being
5 Lack of transparency in leadership communications
Reasons that would cause employees to leave their job voluntarily in 2021
TOP 5
Talent retention is a complicated, multi-faceted issue, as the reasons why people change jobs are as varied as the employees themselves. However, enacting strong talent retention strategies can help ensure that the time and resources invested in training new employees are well-rewarded.
72%
24%
4%
Yes, actively looking
Yes, passively open to new opportunities
Most probably not
India Talent Trends 2021 29
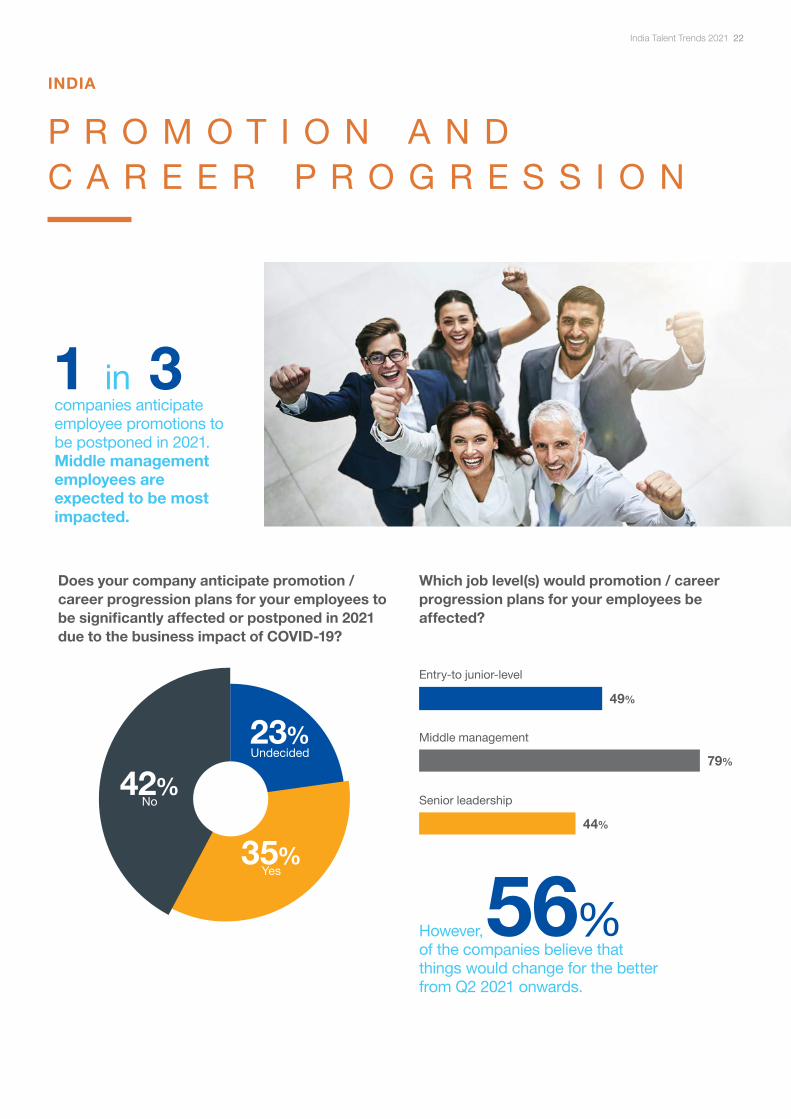
RecognitionTransparent leadership
communication
Professional development
plans
of those employed say their companies have room for improvement in employee experience90%
Areas of improvementTOP 3
INDIA
E M P L O Y E E E X P E R I E N C E
1 Mutual respect / Relationship with colleagues
2 Transparent leadership communication
3 Professional development plans
Important aspects of employee experience TOP 3
India Talent Trends 2021 30

S E C T O R S I N F O C U S
INDIA
T E C H N O L O G Y
H E A L T H C A R E & L I F E S C I E N C E S
B A N K I N G & F I N A N C I A L S E R V I C E S
E - C O M M E R C E
P R O P E R T Y & C O N S T R U C T I O N

S E C T O R T E C H N O L O G Y
of Technology companies in India expect a 14% increase in headcount in 202174%
What is happening in the space? As the world continues to deal with socio-economic impact of the COVID-19 crisis, India is emerging strong in the field of technology, specifically in tech investments.
There has been a sudden uptick in recruitment in the SaaS, health-tech, Ed-tech and gaming industries. Many companies have capitalised on the availability of Indian techies looking to return to India due to the COVID-19 pandemic. Start-ups are also providing flexibility to the right talent to work from any location or work in a hybrid model.
Artificial Intelligence (AI) and Machine Learning (ML) space are skills in key skills in demand. There has also been a high adoption & migration to cloud across public, private and hybrid models.
Larger organizations are building capabilities in Automation and Digital Transformation, with a specific focus on Industry 4.0 in manufacturing setups.
15-25%
7.3%
32%
Average annual salary increase in 2021
Bonus payout in 2021
Average salary offer for new hires in 2021
of Technology companies anticipate giving out more than one month of bonus
more from current / last-drawn salary
Remuneration increase for new potential hires across Technology sector in India1-5%
6-10%
11-20%
21-30%
30%+
33%
10%
4%
12%
39%
Architect (Cloud / Enterprise / Solution / software)
Engineers (Backend / Full stack / Mobile)
CTO / Head of Engineering
In-demand roles
CIO / Head of Technology
Chief Technology Officer
VP / Director Engineering
Digital Transformation
Enterprise Architect
Most applied for roles
India Talent Trends 2021 32

SECTOR TECHNOLOGY
T A L E N T A T T R A C T I O N S T R A T E G I E S
Talent attraction strategies by Technology companies in India
Competitive remuneration and benefits package
Remote/flexible work arrangements
Professional development opportunities
Dynamic company culture
Constant technology advancement
Company reputation
43%
47%
20%
22%
39%
14%1
2
3
of employed Technology professionals anticipate looking for new job opportunities while another 20% are passively open to new roles in 2021
of Technology professionals state remuneration and benefits as their top consideration when accepting a job offer
77%
70%
Remuneration and benefits
Job scope & responsibilities
Professional development opportunities
Reasons that would cause Technology professionals to leave their jobs voluntarily in 2021
Considerations for Technology professionals when accepting a job offer in 2021
TOP 3
TOP 3
Lack of growth opportunities
Looking for higher pay and better
benefits
Skills are underutilised
Tech professionals are currently in great demand. Hence, it is pertinent for employers to consider remote and hybrid working models to expand the candidate pool to attract the best talent. Entrepreneurs who have had a stellar track record are now looking to shut shop and explore new opportunities due to the impact of the Covid-19 pandemic. And with that, companies can look to hire these entrepreneurial talents for their growth startups.
India Talent Trends 2021 33

Biggest considerations for Technology hiring managers when employingnew talent
SECTOR TECHNOLOGY
H I R I N GF A C T O R S
Skill sets and experience
Soft skills 16%
71%
Cultural fit 47%
Headcount budget 22%
Discover more in-demand Tech skills and other Tech hiring trends from our Humans of Technology reports:
Humans of Artificial Intelligence (AI)
Humans of Blockchain
Humans of Cybersecurity
India Talent Trends 2021 34

S E C T O R H E A L T H C A R E & L I F E S C I E N C E S
42%The onset of the COVID-19 pandemic saw a record spike in hiring within vaccines companies. However, that has been challenging due to the limited talent pool in India. We expect continued high volume of recruitment in this space and nurturing existing talent in this segment to retain top talent.
Significant deal activity and interest in the healthcare market has led to increased PE/VC funding in pharmaceuticals, API and Diagnostic companies building and strengthening their leadership teams. Existing setups will also see ramping up of investment in Research & Development talent, among others.
The government’s focus on “Aatmanirbhar Bharat” or “Self-Reliant India Mission”, and its objective to roll out more conducive guidelines for API manufacturers will set the stage for this industry to grow in 2021 and through 2025. This will also lead to a rise in demand for manufacturing and International Sales and Marketing talent.
15-20%
8.0%
45%
Average annual salary increase in 2021
Bonus payout in 2021
Average salary offer for new hires in 2021
of Healthcare & Life Science companies anticipate giving out more than one month of bonus
more from current / last-drawn salary
of Healthcare & Life Science companies in India expect a 8% increase in headcount in 2021
What is happening in this space?
Remuneration increase to new potential hires across Healthcare & Life Sciences sector in India
Sales Director/ Business Unit Head
Digital Transformation / IT Head
Head Medical Affairs & Pharmacovigilence
In-demand roles
Marketing Manager
Business Unit Head
Medical Affairs
Clinical Operations
Site Head Vaccines
Most applied for roles
1-5%
6-10%
11-20%
21-30%
30+%
2%
17%
49%
30%
2%
India Talent Trends 2021 35

SECTOR HEALTHCARE & LIFE SCIENCES
T A L E N T A T T R A C T I O N S T R A T E G I E S
Talent attraction strategies by Healthcare & Life Sciences companies in India
of employed Healthcare & Life Sciences professionals anticipate looking for new job opportunities, while another 27% are passively open to new roles in 2021
of Healthcare & Life Sciences professionals state professional development opportunities as their top consideration when accepting a job offer in 2021
69%
49%
Remuneration and benefits
Job scope and responsibilities
Professional development opportunities
TOP 3
TOP 3
Lack of growth opportunities
Looking for higher pay and better
benefits
Competitive remuneration and benefits package
Remote/flexible work arrangements
Professional development opportunities
Dynamic company culture
Constant technology advancement
Company reputation
38%
23%
38%
47%
13%
26%
Skills are underutilised
Reasons that would cause H&LS professionals to leave their jobs voluntarily in 2021
considerations for H&LS professionals when accepting a job offer in 2021
1
2
3With the impact of COVID-19 on business, we have observed that candidates’ negotiation leverage had become higher than before. Most candidates have not been awarded as per their expectations when it came to bonuses or increments. Hence, they are giving more emphasis to the monetary gain than usual.. They are cautious of switching jobs that would require relocation and a wholly work-from-office arrangement. Here are our recommendations for employers looking to hire: 1) Employers need to be more creative when making offers. For instance, offering bonuses in 2 to 3 trenches, which compensates candidates for the loss of bonus, while making a switch and for employers acts as a retention tool at the same time. 2) Review flexible/WFH working arrangements. It is an essential consideration for most job seekers while switching jobs in this climate.
India Talent Trends 2021 36

Biggest considerations for Healthcare & Life Sciences hiring managers whenemploying new talent
Skill sets and experience
Soft skills 9%
74%
Cultural fit 45%
Headcount budget 40%
SECTOR HEALTHCARE & LIFE SCIENCES
H I R I N GF A C T O R S
India Talent Trends 2021 37

S E C T O R B A N K I N G & F I N A N C I A L S E R V I C E S
63%
Private Equity/Venture Capital (PE/VC): In addition to PE/VC, we expect other asset classes on buy-side like credit/distressed, hedge funds, public markets and impact funds to scale up in India significantly. This would mean existing players will further build up their teams, and new players will also set up operations locally. There has been an increased demand for hiring at the leadership level in 2020, and we expect this trend to continue in 2021.
Private Banking/Wealth Management: With several wealth management setups under stress in 2020, we expect some consolidation to happen across players. While the industry is bouncing back in terms of numbers, good talent will be keen to look at only a handful of quality setups and non-wealth management roles. Hiring is selectively picking up and should be on an upward trajectory in 2021. However, the quality candidate pool remains limited.
Banking/Non-Banking Financial Company (NBFC): The future of finance is data-driven. The pandemic has pushed the BFSI industry towards becoming completely digital. Organisations focused on branch models have shifted their focus to digital mode through co-lending arrangements with various Fintech firms. This radical shift in the business model has placed the business enablers at the forefront of hiring plans. Most of the NBFCs and Fintechs will focus on skill sets such as analytics-driven risk, digital marketing, strategy-driven portfolio management collections, alliances and partnerships.
Insurance: For insurance growth in 2021 will be driven by product innovation, leading to the development of newer distribution channels. Against the backdrop of stable investments within actuarial, digital, and technology in 2020, 2021 will see hiring as usual for India’s insurance companies and intermediaries. Even during the lockdown, insurance players continued to be consistent with their broader hiring plans.
of Banking & Financial Services companies in India expect headcount to increase by 11% in 2021
13%
6.8%
55%
Average annual salary increase in 2021
Bonus payout in 2021
Average salary offer for new hires in 2021
of Banking & Financial Services companies anticipate giving out more than one month of bonus
more from current / last-drawn salary
What is happening in this space?
India Talent Trends 2021 38

SECTOR BANKING & FINANCIAL SERVICES
I N - D E M A N D R O L E S
Remuneration increase for potential hires across Banking & Financial Services sector
1-5%
6-10%
11-20%
21-30%
3%
15%
52%
30%
Investment Professionals
CXO/Business Heads
Product Managers/Analytics/Digital
In-demand roles
Associate/Vice President
Business Heads
Fund raising
Product Specialists
CXO’s
Most applied-for roles
India Talent Trends 2021 39

Talent attraction strategies by Banking & Financial Services companies in India
Competitive remuneration and benefits package
Remote/flexible work arrangements
Professional development opportunities
Dynamic company culture
Constant technology advancement
Company reputation
40%
37%
37%
38%
19%
21%
of employed Banking & Financial Services professionals anticipate looking for new job opportunities while another 23% are passively open to new roles in 202173%
TOP 3
Lack of growth opportunities
Looking for higher pay and better benefits
SECTOR BANKING & FINANCIAL SERVICES
T A L E N T A T T R A C T I O N S T R A T E G I E S
Skills are underutilised
of Banking & Financial Services professionals state remuneration and benefits as their top consideration when accepting a job offer
70%
TOP 3
Reasons that would cause Banking & Financial Services professionals to leave their jobs voluntarily in 2021
Considerations for Banking & Financial Services professionals when accepting a job offer
Remuneration and benefits
Job scope and responsibilities
Professional development opportunities
1
2
3
In light of this year's Covid impact on business, we witnessed that candidates' negotiation leverage was higher than before. Most candidates have not been awarded as per their expectations when it came to bonuses or increments and in addition they are wary of switching jobs which require base relocation, 100% work from office etc. Hence they are giving more emphasis to the monetary gain than usual.
India Talent Trends 2021 40

SECTOR BANKING & FINANCIAL SERVICES
H I R I N GF A C T O R S
Skill sets and experience
Soft skills 79%
68%
Cultural fit 52%
Headcount budget 30%
Biggest considerations for Banking & Financial Services hiring managers whenemploying new talent
Michael Page maintains a proactive partnership with a diverse portfolio of clients, including investment banks, retail banks, private banks, family offices, hedge funds, asset management companies, as well as insurance companies. With long-established networks in the finance sector and a balance between global reach and niche local knowledge, Michael Page continues to be the leading recruitment choice for banking professionals.
Many of our consultants also come from the Banking and Financial Services industry. This means that they are able to understand the essential skill sets that clients look out for in their next successful hire. Market expertise, too, ensures only candidates of the highest quality are selected, all while maintaining consistent feedback and support throughout the hiring process. Finally, Michael Page consultants also provide value-added services, such as meetings and events through online and offline channels.
India Talent Trends 2021 41

S E C T O R E - C O M M E R C E
68%
16%
7.5%
30%
Average annual salary increase in 2021
Bonus payout in 2021
Average salary offer for new hires in 2021
of E-commerce companies anticipate giving out more than one month of bonus
more from current / last-drawn salary
of E-commerce companies in India expect a 12% increase in headcount in 2021
Growth in e-commerce has also led to growth of more tech enabled platforms in logistics and warehousing.
Essential delivery start-ups and hyperlocal start-ups have come up to cater to community needs which has increased the demand for P&L heads and product management professionals.
Lots of start-ups have focus on M&A as well as fund raising/investor relations which has led to increase in demand of such professionals.
What is happening in this space?
Remuneration increase for new potential hires across E-commerce in India
1-5%
6-10%
11-20%
21-30%
14%
41%
23%
23%
Product Management
Ad Sales
P&L/Business/Growth Head
In-demand roles
Strategy/Growth
Operations
Product
Sales
Digital Marketing
Most applied-for roles
India Talent Trends 2021 42

SECTOR E-COMMERCE
T A L E N T A T T R A C T I O N S T R A T E G I E S
Talent attraction strategies by E-commerce companies in India
of employed E-commerce professionals anticipate looking for new job opportunities while another 28% are passively open to new roles in 2021
of E-commerce professionals state professional development opportunities as their top consideration when accepting a job offer in 2021
66%
30%
TOP 3
TOP 3
Lack of growth opportunities
Looking for higher pay and better benefits
Competitive remuneration and benefits package
Remote/flexible work arrangements
Professional development opportunities
Dynamic company culture
Constant technology advancement
Company reputation
69%
46%
28%
23%
14%
9%
Skills are underutilised
Reasons that would cause E-commerce professionals to leave their jobs voluntarily in 2021
Remuneration and benefits
Work culture
Job scope and repsonsibilities
1
2
3
Considerations for E-commerce professionals when accepting a job offer in 2021
Most candidates join the E-commerce industry or digital startups for faster career progression. They look to develop skills for future growth, which may lead to better remunerations and stock options. Organisations should focus on that aspect to attract and retain top talents in the market.
India Talent Trends 2021 43
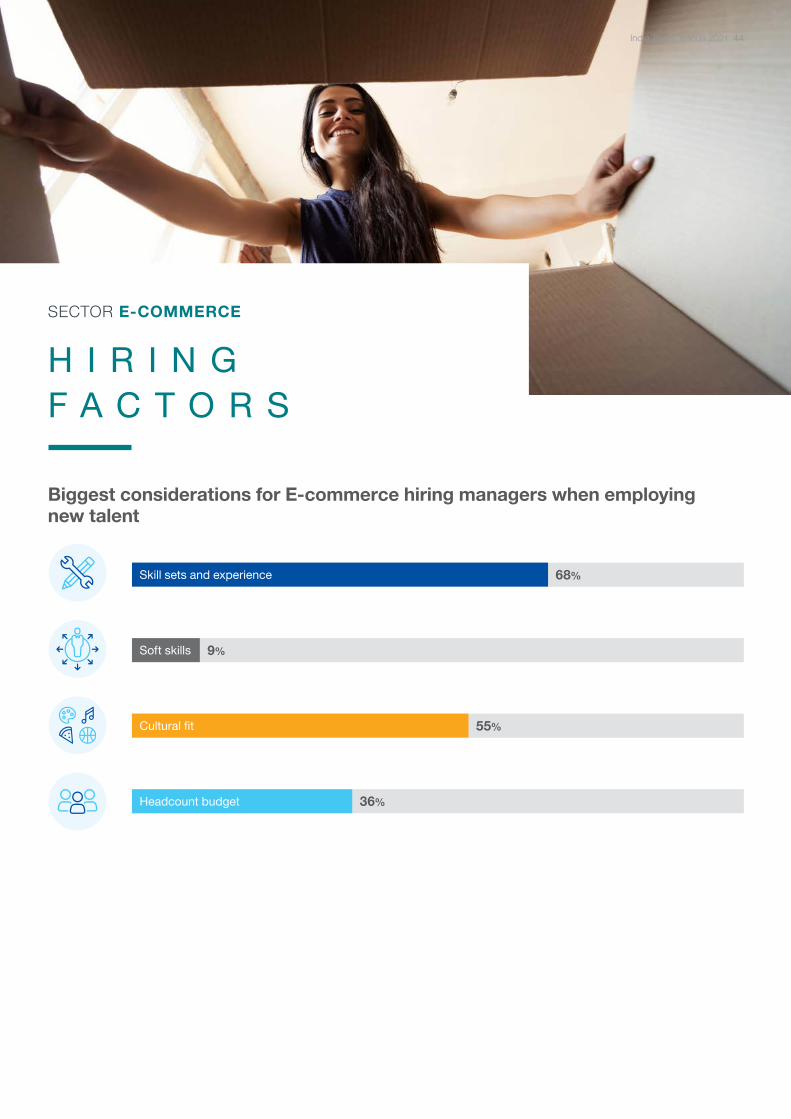
Biggest considerations for E-commerce hiring managers when employingnew talent
SECTOR E-COMMERCE
H I R I N GF A C T O R S
Skill sets and experience 68%
Soft skills 9%
Cultural fit 55%
Headcount budget 36%
India Talent Trends 2021 44

S E C T O R P R O P E R T Y & C O N S T R U C T I O N
of Property & Construction companies in India expect headcount to increase by 10% on average in 202144%
Corporates are focusing more on health, safety & hygiene of their work places, which would result into bigger focus on facilities management.
Continued focus/interest in industrial warehousing domain due to rise in e-commerce plays (especially, in pandemic times).
11%
5.3%
19%
Average annual salary increase in 2021
Bonus payout in 2021
Average salary offer for new hires in 2021
19% of Property & Construction companies anticipate giving out more than one month of bonus
more from current / last-drawn salary
What is happening in this space?
Remuneration increase for new potential hires across Property & Construction in India
0%
1-5%
6-10%
11-20%
21-30%
4%
16%
16%
48%
16%
Business/Vertical Heads
Leasing
Sales
In-demand roles
Project Management
Facilities Management
Residential Sales
Design
Business Development
Most applied-for roles
India Talent Trends 2021 45

SECTOR PROPERTY & CONSTRUCTION
T A L E N T A T T R A C T I O N S T R A T E G I E S
Talent attraction strategies by Property & Construction companies in India
of employed Property & Construction professionals anticipate looking for new job opportunities while another 23% are passively open to new roles in 2021
74%
92%
TOP 3
Lack of growth opportunities
Lack of transparency in leadership
communications
Looking for higher pay and better
benefits
Competitive remuneration and benefits package
Remote/flexible work arrangements
Professional development opportunities
Dynamic company culture
Company reputation
36%
24%
36%
32%
32%
of Property & Construction professionals state remuneration and benefits as their top consideration when accepting a job offer in 2021
Reasons that would cause Property & Construction professionals to leave their jobs voluntarily in 2021
TOP 3
Remuneration and benefits
Job scope and responsibilities
Work culture
1
2
3
Considerations for Property & Construction professionals when accepting a job offer in 2021
India Talent Trends 2021 46

Biggest considerations for Property & Construction hiring managers whenemploying new talent
SECTOR PROPERTY & CONSTRUCTION
H I R I N GF A C T O R S
Skill sets and experience 56%
Soft skills 16%
Cultural fit 64%
Headcount budget 16%
India Talent Trends 2021 47

S A L A R Y T A B L E S
INDIA
B A N K I N G & F I N A N C I A L S E R V I C E S
D I G I T A L & A N A L Y T I C S
E N G I N E E R I N G & M A N U F A C T U R I N G
F I N A N C E & A C C O U N T I N G
H E A L T H C A R E & L I F E S C I E N C E S
H U M A N R E S O U R C E S
L E G A L & C O M P L I A N C E
P R O P E R T Y & C O N S T R U C T I O N
P R O C U R E M E N T & S U P P L Y C H A I N
T E C H N O L O G Y
S A L E S & M A R K E T I N G

GeneralPrivate Equity & Venture Capital
Role / Seniority
Base salary range for 12 months (INR Lacs)
Associate VP Director Managing Director
Min Avg Max Min Avg Max Min Avg Max Min Avg Max
Global Fund 50 68 85 90 115 140 140 220 300 250 375 500
Fund Size USD 500M - USD 1B 35 50 65 65 80 95 100 125 150 150 200 250
Fund Size <USD 500M 25 35 45 45 55 65 65 80 100 100 125 150
Tier 1 Investment BankingMNC Banks
Role / Seniority
Base salary range for 12 months (INR Lacs)
Associate VP Director Managing Director
Min Avg Max Min Avg Max Min Avg Max Min Avg Max
Corporate Finance / Mergers & Acquisitions (M&A)
45 60 75 75 93 110 100 125 150 150 200 250
Tier 2 Investment BankingDomestic Financial Institutions
Role / Seniority
Base salary range for 12 months (INR Lacs)
Associate VP Director Managing Director
Min Avg Max Min Avg Max Min Avg Max Min Avg Max
Corporate Finance / Mergers & Acquisitions (M&A)
20 33 45 45 60 75 75 90 105 100 138 175
SALARY TABLES
B A N K I N G & F I N A N C I A L S E R V I C E S
India Talent Trends 2021 49

Private BankingMNC Banks
Role / Seniority
Base salary range for 12 months (INR Lacs)
Associate VP Director Managing Director
Min Avg Max Min Avg Max Min Avg Max Min Avg Max
Private Banker 15 23 30 30 50 70 50 75 120 130 178 225
Private BankingDomestic Financial Institutions
Role / Seniority
Base salary range for 12 months (INR Lacs)
Associate VP Director Managing Director
Min Avg Max Min Avg Max Min Avg Max Min Avg Max
Private Banker 10 20 30 25 43 60 45 68 90 100 140 180
Corporate Banking (Sales Function)
Role / Seniority
Base salary range for 12 months (INR Lacs)
AVP VP Director Managing Director
Min Avg Max Min Avg Max Min Avg Max Min Avg Max
MNC Banks 17 24 30 28 55 90 80 100 130 125 175 250
Domestic Banks 16 21 25 25 40 70 60 80 120 120 150 250
NBFCs 12 16 25 25 32 45 50 60 80 100 120 180
Corporate Banking (Risk Function)
Role / Seniority
Base salary range for 12 months (INR Lacs)
AVP VP Director Managing Director
Min Avg Max Min Avg Max Min Avg Max Min Avg Max
MNC Banks 15 22 28 25 45 80 70 80 110 100 150 180
Domestic Banks 14 18 25 22 35 65 55 75 100 100 125 180
NBFCs 13 16 24 24 28 35 50 60 80 90 110 180
SALARY TABLES BANKING & FINANCIAL SERVICES
India Talent Trends 2021 50
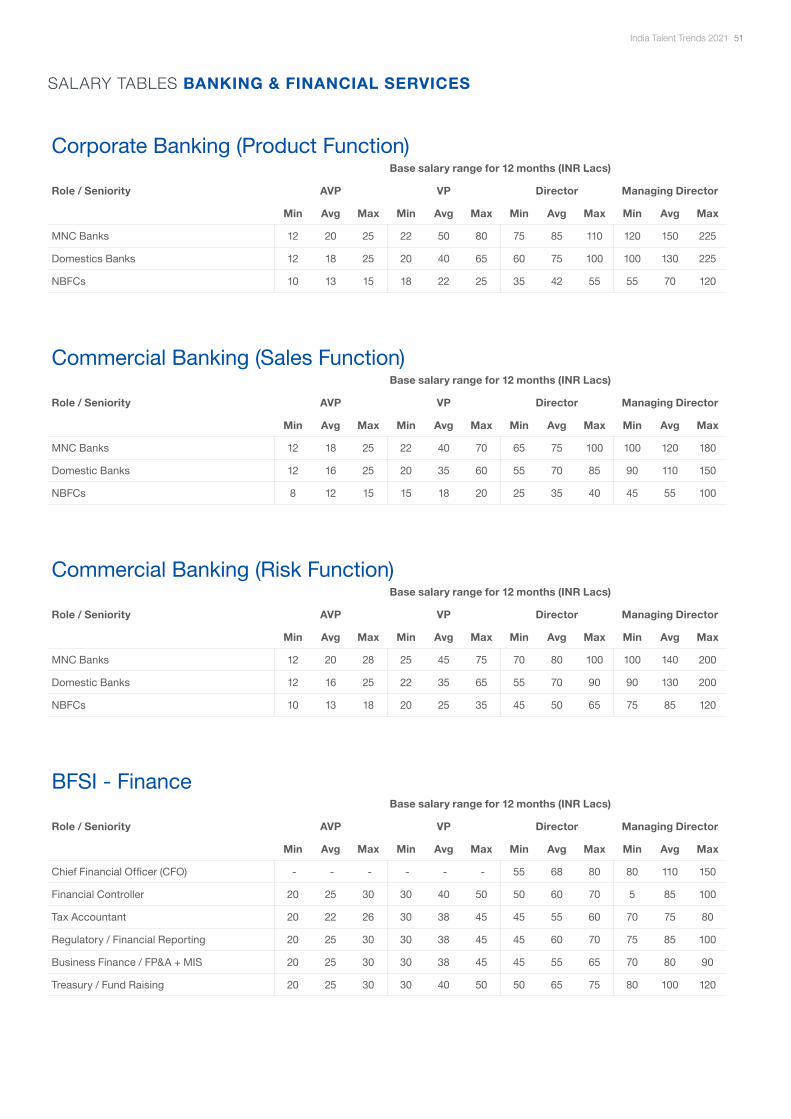
Corporate Banking (Product Function)
Role / Seniority
Base salary range for 12 months (INR Lacs)
AVP VP Director Managing Director
Min Avg Max Min Avg Max Min Avg Max Min Avg Max
MNC Banks 12 20 25 22 50 80 75 85 110 120 150 225
Domestics Banks 12 18 25 20 40 65 60 75 100 100 130 225
NBFCs 10 13 15 18 22 25 35 42 55 55 70 120
Commercial Banking (Sales Function)
Role / Seniority
Base salary range for 12 months (INR Lacs)
AVP VP Director Managing Director
Min Avg Max Min Avg Max Min Avg Max Min Avg Max
MNC Banks 12 18 25 22 40 70 65 75 100 100 120 180
Domestic Banks 12 16 25 20 35 60 55 70 85 90 110 150
NBFCs 8 12 15 15 18 20 25 35 40 45 55 100
Commercial Banking (Risk Function)
Role / Seniority
Base salary range for 12 months (INR Lacs)
AVP VP Director Managing Director
Min Avg Max Min Avg Max Min Avg Max Min Avg Max
MNC Banks 12 20 28 25 45 75 70 80 100 100 140 200
Domestic Banks 12 16 25 22 35 65 55 70 90 90 130 200
NBFCs 10 13 18 20 25 35 45 50 65 75 85 120
BFSI - Finance
Role / Seniority
Base salary range for 12 months (INR Lacs)
AVP VP Director Managing Director
Min Avg Max Min Avg Max Min Avg Max Min Avg Max
Chief Financial Officer (CFO) - - - - - - 55 68 80 80 110 150
Financial Controller 20 25 30 30 40 50 50 60 70 5 85 100
Tax Accountant 20 22 26 30 38 45 45 55 60 70 75 80
Regulatory / Financial Reporting 20 25 30 30 38 45 45 60 70 75 85 100
Business Finance / FP&A + MIS 20 25 30 30 38 45 45 55 65 70 80 90
Treasury / Fund Raising 20 25 30 30 40 50 50 65 75 80 100 120
SALARY TABLES BANKING & FINANCIAL SERVICES
India Talent Trends 2021 51

Tier 1 Audit, Compliance & RiskMNC Banks & Captives
Role / Seniority
Base salary range for 12 months (INR Lacs)
AVP VP Director Managing Director
Min Avg Max Min Avg Max Min Avg Max Min Avg Max
Internal Audit 22 27 32 32 46 60 50 70 100 80 100 130
Know Your Customer (KYC) / Anti Money Laundering (AML)
20 25 30 30 40 50 45 60 70 70 80 90
Regulatory Compliance 22 27 32 32 46 60 50 65 80 80 90 100
Market Risk 22 29 35 35 48 60 55 70 80 80 90 100
Credit Risk 22 27 32 32 41 50 50 65 80 80 90 100
Operational Risk 22 27 32 32 41 50 50 65 80 80 90 100
Tier 2 Audit, Compliance & RiskDomestic financial institutions & third party consulting companies providing solutions to banking clients
Role / Seniority
Base salary range for 12 months (INR Lacs)
Associate VP Director Managing Director
Min Avg Max Min Avg Max Min Avg Max Min Avg Max
Internal Audit 20 24 28 28 37 45 45 58 70 75 83 90
Know Your Customer (KYC) / Anti Money Laundering (AML)
22 27 32 32 41 50 50 65 80 80 85 90
Regulatory Compliance 20 24 28 28 37 45 45 58 70 75 83 90
Market Risk 22 27 32 32 41 50 50 65 80 80 85 90
Credit Risk 20 24 28 28 37 45 45 58 70 75 83 90
Operational Risk 20 24 28 28 37 45 45 58 70 80 85 90
SALARY TABLES BANKING & FINANCIAL SERVICES
India Talent Trends 2021 52

Tier 1 AnalyticsMNC Banks & Captives
Role / Seniority
Base salary range for 12 months (INR Lacs)
Associate VP Director Managing Director
Min Avg Max Min Avg Max Min Avg Max Min Avg Max
Marketing Analytics 23 29 35 35 44 52 52 66 80 85 93 100
Risk Analytics 23 29 35 35 44 52 52 66 80 85 93 100
Digital Analytics 23 29 35 35 44 52 52 66 80 85 93 100
Statistical Modelers 23 29 35 35 44 52 52 66 80 85 93 100
Analytics Consulting 25 31 37 38 45 52 55 68 80 85 93 100
Big Data / Machine Learning 25 33 40 40 50 60 60 80 100 100 110 120
Data Scientist 25 33 40 40 50 60 60 80 100 100 110 120
Tier 2 AnalyticsDomestic financial institutions & third party consulting companies providing solutions to banking clients
Role / Seniority
Base salary range for 12 months (INR Lacs)
AVP VP Director Managing Director
Min Avg Max Min Avg Max Min Avg Max Min Avg Max
Marketing Analytics 20 25 30 30 38 45 45 60 75 75 85 95
Risk Analytics 20 25 30 30 38 45 45 60 75 75 85 95
Digital Analytics 20 25 30 30 38 45 45 60 75 75 85 95
Statistical Modelers 20 25 30 30 38 45 45 60 75 80 90 100
Analytics Consulting 20 26 32 32 40 47 50 65 80 85 93 100
Big Data / Machine Learning 25 30 35 35 43 50 60 75 90 90 105 120
Data Scientist 25 30 35 35 43 50 60 75 90 90 105 120
SALARY TABLES BANKING & FINANCIAL SERVICES
India Talent Trends 2021 53

Tier 1 OperationsMNC Banks & Captives
Role / Seniority
Base salary range for 12 months (INR Lacs)
AVP VP Director Managing Director
Min Avg Max Min Avg Max Min Avg Max Min Avg Max
Head of Operations / Chief Operations Officer ( COO)
- - - - - - 60 75 90 90 105 120
Project Management 20 25 30 30 40 50 55 70 80 80 90 100
Quality 20 25 30 30 40 50 55 70 80 80 90 100
Transitions 20 25 30 30 40 50 55 70 80 80 90 100
Payments & Cash Management 20 25 30 30 40 50 55 70 80 80 90 100
Tier 2 OperationsDomestic financial institutions & third party consulting companies providing solutions to banking clients
Role / Seniority
Base salary range for 12 months (INR Lacs)
AVP VP Director Managing Director
Min Avg Max Min Avg Max Min Avg Max Min Avg Max
Head of Operations / Chief Operations Officer (COO)
- - - - - - 50 65 80 80 88 95
Project Management 18 23 28 28 34 40 45 55 70 65 73 80
Quality 18 23 28 28 34 40 45 55 65 65 73 80
Transitions 18 23 28 28 34 40 45 55 70 65 73 80
Payments & Cash Management 18 23 28 28 34 40 45 55 65 65 73 80
Tier 1 Operations (Middle Office)MNC Banks & Captives
Role / Seniority
Base salary range for 12 months (INR Lacs)
AVP VP Director Managing Director
Min Avg Max Min Avg Max Min Avg Max Min Avg Max
Client Servicing 20 24 28 28 37 45 45 58 70 70 80 90
Trade Support / Capture 20 24 28 28 37 45 45 58 70 70 80 90
Reference Data 20 24 28 28 37 45 45 58 70 70 80 90
Corporate Actions 20 24 28 28 37 45 45 58 70 70 80 90
Business Management 22 27 32 32 40 50 50 65 80 80 90 120
Change Management 22 27 32 32 40 50 50 65 80 80 90 100
Fund Administration 22 29 35 32 41 50 50 65 80 80 90 100
SALARY TABLES BANKING & FINANCIAL SERVICES
India Talent Trends 2021 54

Tier 2 Operations (Middle Office)Domestic financial institutions & third party consulting companies providing solutions to banking clients
Role / Seniority
Base salary range for 12 months (INR Lacs)
AVP VP Director Managing Director
Min Avg Max Min Avg Max Min Avg Max Min Avg Max
Client Servicing 18 23 28 28 34 40 45 55 65 65 73 80
Trade Support / Capture 18 23 28 28 34 40 45 55 65 65 73 80
Reference Data 18 23 28 28 34 40 45 55 65 65 73 80
Corporate Actions 18 23 28 28 34 40 45 55 65 65 73 80
Business Management 20 24 28 28 37 45 45 58 70 70 80 90
Change Management 20 24 28 28 37 45 45 58 70 70 80 90
Fund Administration 18 23 28 28 34 40 45 55 65 65 73 80
Tier 1 Operations (Back Office)MNC Banks & Captives
Role / Seniority
Base salary range for 12 months (INR Lacs)
AVP VP Director Managing Director
Min Avg Max Min Avg Max Min Avg Max Min Avg Max
Collection 20 24 28 28 37 45 45 58 70 70 80 90
Settlement 20 24 28 28 37 45 45 58 70 70 80 90
Reconciliation 20 24 28 28 37 45 45 58 70 70 80 90
Documentation 20 24 28 28 37 45 45 58 70 70 80 90
Collateral Management 20 24 28 28 37 45 45 58 70 70 80 90
International Swaps and Derivatives Association (ISDA) Documentation
20 24 28 28 37 45 45 58 70 70 80 90
Transaction Management 22 25 28 28 37 45 45 58 70 70 80 90
Trade Finance Operations 22 25 28 28 37 45 45 58 70 70 80 90
Credit Administration / Loan Operations 20 24 28 28 37 45 45 58 70 70 80 90
SALARY TABLES BANKING & FINANCIAL SERVICES
India Talent Trends 2021 55

Tier 2 Operations (Back Office)Domestic financial institutions & third party consulting companies providing solutions to banking clients
Role / Seniority
Base salary range for 12 months (INR Lacs)
AVP VP Director Managing Director
Min Avg Max Min Avg Max Min Avg Max Min Avg Max
Collection 18 23 28 28 34 40 45 55 65 70 80 90
Settlement 18 23 28 28 34 40 45 55 65 70 80 90
Reconciliation 18 23 28 28 34 40 45 55 65 70 80 90
Documentation 18 23 28 28 34 40 45 55 65 70 80 90
Collateral Management 18 23 28 28 34 40 45 55 65 70 80 90
International Swaps and Derivatives Association (ISDA) Documentation
18 23 28 28 34 40 45 55 65 70 80 90
Transaction Management 18 23 28 28 34 40 45 55 65 70 80 90
Trade Finance Operations 18 23 28 28 34 40 45 55 65 70 80 90
Credit Administration / Loan Operations 18 23 28 28 34 40 45 55 65 70 80 90
Tier 1 Finance (Finance Project)MNC Banks & Captives
Role / Seniority
Base salary range for 12 months (INR Lacs)
AVP VP Director Managing Director
Min Avg Max Min Avg Max Min Avg Max Min Avg Max
Business Analyst / Change Management 20 30 35 35 42 50 55 68 80 90 105 120
Tier 2 Finance (Finance Project)Domestic financial institutions & third party consulting companies providing solutions to banking clients
Role / Seniority
Base salary range for 12 months (INR Lacs)
AVP VP Director Managing Director
Min Avg Max Min Avg Max Min Avg Max Min Avg Max
Business Analyst / Change Management 18 21 25 25 35 40 45 55 65 65 73 80
SALARY TABLES BANKING & FINANCIAL SERVICES
India Talent Trends 2021 56

Tier 1 Finance (Product Control)MNC Banks & Captives
Role / Seniority
Base salary range for 12 months (INR Lacs)
AVP VP Director Managing Director
Min Avg Max Min Avg Max Min Avg Max Min Avg Max
Money Market 25 30 35 35 48 60 60 80 100 80 105 130
Equities 25 30 35 35 48 60 60 80 100 80 105 130
Commodities & Derivatives 25 30 35 35 48 60 60 80 100 80 105 130
Tier 2 Finance (Product Control)Domestic financial institutions & third party consulting companies providing solutions to banking clients
Role / Seniority
Base salary range for 12 months (INR Lacs)
AVP VP Director Managing Director
Min Avg Max Min Avg Max Min Avg Max Min Avg Max
Money Market 18 23 28 28 34 40 45 55 65 65 78 90
Equities 18 23 28 28 34 40 45 55 65 65 78 90
Commodities & Derivatives 18 23 28 28 34 40 45 55 65 65 78 90
SALARY TABLES BANKING & FINANCIAL SERVICES
India Talent Trends 2021 57

Insurance Companies
Role / Seniority
Base salary range for 12 months (INR Lacs)
AVP & Below VP SVPEVP /
Appointed Actuary
Min Avg Max Min Avg Max Min Avg Max Min Avg Max
Actuary 15 25 35 40 55 60 65 75 90 95 110 175
Role / Papers Cleared
Base salary range for 12 months (INR Lacs)
<5 5 - 10 10 - 12 Qualified
Min Avg Max Min Avg Max Min Avg Max Min Avg Max
Actuary 8 10 14 12 15 22 18 28 40 60 90 175
Role / Seniority
Base salary range for 12 months (INR Lacs)
Manager & Senior Manager
AVP DVP / VP SVP
Min Avg Max Min Avg Max Min Avg Max Min Avg Max
Product 9 13 18 18 22 25 30 38 45 50 60 75
Role / Seniority
Base salary range for 12 months (INR Lacs)
Manager & Senior Manager
AVP DVP / VP SVP
Min Avg Max Min Avg Max Min Avg Max Min Avg Max
Strategic Alliances 7 10 15 19 21 28 32 38 45 50 65 85
Role / Seniority
Base salary range for 12 months (INR Lacs)
Manager & Senior Manager
AVP DVP / VP SVP
Min Avg Max Min Avg Max Min Avg Max Min Avg Max
Key Account Management 10 12 16 15 19 25 27 33 39 45 52 70
Role / Seniority
Base salary range for 12 months (INR Lacs)
Area Manager Regional Manager Zonal Manager National Head
Min Avg Max Min Avg Max Min Avg Max Min Avg Max
Agency / Bancassurance Sales 10 11 15 13 16 21 20 27 40 60 80 100
Role / Seniority
Base salary range for 12 months (INR Lacs)
Manager & Senior Manager
AVP DVP / VP SVP
Min Avg Max Min Avg Max Min Avg Max Min Avg Max
Claims / Underwriting (UW) 8 10 14 16 18 22 25 33 38 45 65 80
SALARY TABLES BANKING & FINANCIAL SERVICES
India Talent Trends 2021 58

Insurance Broking
Role / Seniority
Base salary range for 12 months (INR Lacs)
Manager & Senior Manager
AVP DVP / VP SVP
Min Avg Max Min Avg Max Min Avg Max Min Avg Max
Claims / Underwriting (UW) 8 10 14 18 20 25 30 35 40 45 50 60
Claims / Underwriting (UW) 8 10 14 18 25 30 35 40 40 50 55 65
Role / Seniority
Base salary range for 12 months (INR Lacs)
Manager & Senior Manager
AVP DVP / VP SVP
Min Avg Max Min Avg Max Min Avg Max Min Avg Max
Servicing / Operations 8 10 14 16 18 22 25 33 38 40 45 50
SALARY TABLES BANKING & FINANCIAL SERVICES
India Talent Trends 2021 59

Tier 1 Digital & AnalyticsMNC banks, management consulting, product companies, e-commerce, and internet companies
Role / Years of experience
Base salary range for 12 months (INR Lacs)
3-6 years 6-10 years 10-15 years 15+ years
Min Avg Max Min Avg Max Min Avg Max Min Avg Max
Marketing Analytics 17 23 28 25 38 50 45 73 100 100 120 140
Risk Analytics 18 27 35 25 43 60 40 80 110 110 130 150
Digital Analytics 17 22 26 24 35 45 45 78 110 110 130 150
Analytics Consulting 18 23 27 25 38 50 50 80 110 110 130 150
Big Data / Data Engineering 16 23 30 25 40 55 50 70 90 75 108 140
Data Science / Machine Learning 25 32 38 30 48 65 65 108 150 140 160 180
Tier 2 Digital & AnalyticsDomestic financial institutions, third party consulting companies, and early stage start-ups
Role / Years of experience
Base salary range for 12 months (INR Lacs)
3 - 6 years 6 - 10 years 10 - 15 years 15+ years
Min Avg Max Min Avg Max Min Avg Max Min Avg Max
Marketing Analytics 16 21 25 20 33 45 41 66 90 90 108 126
Risk Analytics 17 24 30 23 37 50 45 70 95 95 115 135
Digital Analytics 16 20 24 23 32 40 38 64 90 90 113 135
Analytics Consulting 17 20 23 23 34 45 42 69 95 95 115 135
Big Data / Data Engineering 15 19 23 23 37 50 45 63 80 80 100 120
Data Science / Machine Learning 23 27 30 26 43 60 55 90 125 105 128 150
SALARY TABLES
D I G I T A L & A N A L Y T I C S
India Talent Trends 2021 60

Manufacturing
Role / Years of experience
Base salary sange for 12 months (INR Lacs)
3-5 years 5 - 10 years 10 - 15 years 15+ years
Min Avg Max Min Avg Max Min Avg Max Min Avg Max
Utilities and Controls 6 8 10 10 18 25 25 38 50 30 45 60+
Maintenance Manager 8 10 12 12 21 30 30 45 60 35 50 65+
Production Manager 10 15 20 18 29 40 40 55 70 - - -
Quality Assurance / Control 6 9 12 12 19 25 25 30 35 - - -
Quality Director - - - - - - 35 50 65 40 70 100+
Health, Safety and Environment (HSE) Manager / Head
5 8 12 12 18 24 25 37 50 50 100 150+
Process / Operational Excellence 10 15 20 18 32 45 45 60 75 50 75 100+
Plant / Site Head - - - - - - 45 60 75 50 100 150+
Head of Manufacturing / Operations / Chief Operations Officer (COO)
- - - - - - - - - 60 155 250+
Engineering
Role / Years of experience
Base salary range for 12 months (INR Lacs)
3-5 years 5-10 years 10-15 years 15+ years
Min Avg Max Min Avg Max Min Avg Max Min Avg Max
Construction Manager / Director 6 8 10 10 18 25 25 33 40 35 47 60+
Project Engineer 6 9 12 15 23 30 - - - - - -
Project / Program Director - - - - - - 30 45 60 60 93 125+
Civil / Electrical / Mechanical / Instrumentation Engineer
6 13 20 15 28 40 - - - - - -
Head of Department (Engineering) - - - - - - 35 48 60 45 83 120+
Project Director - - - - - - 45 60 75 50 100 150+
SALARY TABLES
E N G I N E E R I N G & M A N U F A C T U R I N G
India Talent Trends 2021 61

Projects / Technical Services
Role / Years of experience
Base salary range for 12 months (INR Lacs)
3 - 5 years 5 - 10 years 10 - 15 years 15+ years
Min Avg Max Min Avg Max Min Avg Max Min Avg Max
Field Service Engineer / Technician 6 9 12 - - - - - - - - -
Technical Sales Engineer 6 9 12 15 20 25 - - - - - -
Service Manager / Supervisor - - - 10 20 30 - - - - - -
Project Coordination - - - 20 28 35 30 40 50 40 53 65+
Research & Development (R&D)
Role / Years of experience
Base salary range for 12 months (INR Lacs)
3 - 5 years 5 - 10 years 10 - 15 years 15+ years
Min Avg Max Min Avg Max Min Avg Max Min Avg Max
Application Engineer 6 8 10 10 18 28 - - - - - -
Product Design Engineer 6 8 10 10 18 20 - - - - - -
Test Engineer 6 8 10 10 18 20 - - - - - -
Project Manager - - - 15 28 - 30 53 75 - - -
Head of R&D - - - - - - 35 55 75 60 155 250
SALARY TABLES ENGINEERING & MANUFACTURING
India Talent Trends 2021 62

General
Role / Years of experience
Base salary range for 12 months (INR Lacs)
3-5 years 5 - 10 years 10 - 15 years 15+ years
Min Avg Max Min Avg Max Min Avg Max Min Avg Max
CFO / Finance Director 10,000 Cr+ - - - - - - - - - 150 400 800
CFO / Finance Director 1,000 Cr - 10,000 Cr - - - - - - - - - 90 200 400
CFO / Finance Director 200 Cr - 1,000 Cr - - - - - - 50 75 100 50 120 200
CFO with Fund Raising / IPO - - - - - - 60 98 120 100 185 250
GM Finance / Financial Controller 10,000 Cr+
- - - - - - 50 75 90 90 120 150
GM Finance / Financial Controller 1,000 Cr - 10,000 Cr
- - - 25 35 45 35 60 80 50 95 120
Finance Manager 12 20 30 16 29 40 20 35 45 30 35 45
Specialist
Role / Years of experience
Base salary range for 12 months (INR Lacs)
3-5 years 5 - 10 years 10 - 15 years 15+ years
Min Avg Max Min Avg Max Min Avg Max Min Avg Max
Chief Investment Officer - Family Office - - - - - - 50 70 90 60 105 120
FP&A / Business Controller 12 19 30 22 34 45 35 58 75 60 100 125
Financial Analyst / Business Analyst / Strategy (Premier Business School MBA)
20 25 35 25 40 60 50 75 90 75 120 150
Corporate Finance - M&A, IR, Fund Raising 20 23 30 25 40 50 50 63 75 75 100 150
Treasury 12 16 25 15 25 45 30 55 70 50 85 120
Commercial - Sales, Supply Chain 15 18 20 15 30 40 30 50 60 65 85 100
Manufacturing / Plant Controller 12 16 20 15 23 30 25 35 45 40 58 75
Costing 8 10 14 12 16 25 20 28 40 30 50 65
Project Controlling 8 12 18 15 25 35 30 45 60 45 63 75
Financial Accounting / Consolidation / Statutory Reporting
12 17 25 22 35 40 35 48 65 50 75 90
Internal Audit / Controls / Risk 12 18 25 20 35 45 40 60 75 50 80 120
Tax - GST (Indirect) 12 15 25 15 28 45 38 49 60 45 70 80
Tax - Direct / International 12 17 25 20 34 45 40 58 75 50 85 100
Mixed Tax 15 20 25 25 35 45 40 58 75 75 98 200
SALARY TABLES
F I N A N C E & A C C O U N T I N G
India Talent Trends 2021 63

Shared Services
Role / Years of experience
Base salary sange for 12 months (INR Lacs)
3-5 years 5 - 10 years 10 - 15 years 15+ years
Min Avg Max Min Avg Max Min Avg Max Min Avg Max
Head - Finance Shared Services - - - - - - 50 65 80 80 115 200
Financial Accounting / Record to Report 12 17 25 15 28 40 30 50 75 50 65 120
MIS / Decision Support / FP&A 12 17 25 15 24 40 30 50 75 50 65 140
Accounts Receivable / Order to Cash 10 12 15 12 25 35 25 40 60 45 55 120
Accounts Payable / Procure to Pay 10 12 15 12 25 35 25 40 60 45 55 120
Finance Transformation / Change Management
12 15 25 20 30 45 30 50 70 40 65 100
Transitions 10 12 14 14 24 40 30 45 65 35 47 65
SALARY TABLES FINANCE & ACCOUNTING
India Talent Trends 2021 64

SalesPharmaceuticals
Role / Seniority
Base salary range for 12 months (INR Lacs)
3 - 5 years 5 - 10 years 10 - 15 years 15 - 25 years 25+ years
Min Avg Max Min Avg Max Min Avg Max Min Avg Max Min Avg Max
Sales 3 6 9 8 15 20 12 22 40 25 45 70 45 75 100
Sales (Candidates with pedigree) 10 15 20 20 40 65 50 75 110 85 95 130 130 150 270
Note: Details of candidates with 15+ years of experience ( 10+ years for those with pedigree) have been considered with a larger assumption that their progression usually is seen towards Business Head / General Management roles
Medical Devices
Role / Seniority
Base salary range for 12 months (INR Lacs)
3 - 5 years 5 - 10 years 10 - 15 years 15 - 25 years 25+ years
Min Avg Max Min Avg Max Min Avg Max Min Avg Max Min Avg Max
Sales 4 6 10 8 16 22 22 35 55 50 60 80 55 75 120
Sales (Candidates with pedigree) 12 15 25 25 30 80 75 95 130 100 120 150 140 180 300
Note: Details of candidates with 15+ years of experience ( 10+ years for those with pedigree) have been considered with a larger assumption that their progression usually is seen towards Business Head / General Management roles
MarketingPharmaceuticals
Role / Seniority
Base salary range for 12 months (INR Lacs)
3 - 5 years 5 - 10 years 10 - 15 years 15 - 25 years 25+ years
Min Avg Max Min Avg Max Min Avg Max Min Avg Max Min Avg Max
Marketing 7 9 14 12 25 40 25 35 60 35 50 70 40 65 75
Marketing (Candidates with pedigree)
12 16 22 22 30 55 40 50 70 60 85 120 100 125 150
Digital Marketing 5 11 17 15 24 30 28 35 50 40 50 65 -* -* -*
Market Access 7 12 20 18 20 35 26 32 45 40 50 65 -* -* -*
Communications and CSR 4 7 10 10 17 24 24 31 38 38 51 75 60 70 80
Note: Details of candidates with 15+ years of experience ( 10+ years for those with pedigree) have been considered with a larger assumption that their progression usually is seen towards Business Head / General Management roles
*Insufficient data to provide accurate range
SALARY TABLES
H E A L T H C A R E & L I F E S C I E N C E S
India Talent Trends 2021 65

Medical Devices / Life Sciences
Role / Seniority
Base salary range for 12 months (INR Lacs)
3 - 5 years 5 - 10 years 10 - 15 years 15 - 25 years 25+ years
Min Avg Max Min Avg Max Min Avg Max Min Avg Max Min Avg Max
Marketing 15 22 30 30 32 60 40 48 85 51 70 100 65 95 130
Digital Marketing 7 13 19 20 27 36 34 42 49 47 60 72 -* -* -*
Communications and CSR 6 9 11 11 17 24 24 30 37 38 51 75 60 70 80
Note: Details of candidates with 15+ years of experience have been considered with a larger assumption that their progression usually is seen towards Business Head / General Management roles.
*Insufficient data to provide accurate range
Healthcare Providers
Role / Seniority
Base salary range for 12 months (INR Lacs)
3 - 5 years 5 - 10 years 10 - 15 years 15 - 25 years 25+ years
Min Avg Max Min Avg Max Min Avg Max Min Avg Max Min Avg Max
Sales 4 7 12 10 35 65 20 50 100 45 60 130 45 70 250
Marketing 8 10 22 12 35 60 20 45 85 40 55 120 45 70 250
Since the healthcare provider market is more fragmented, we have taken sales & marketing overall which takes into consideration both pedigree & non-pedigree candidates
Note : Details of candidates with 15+ years of experience ( 10+ years for those with pedigree) have been considered with a larger assumption that their progression usually is seen towards Business Head / General Management roles
Others - Techno Commercial & TechnicalPharmaceuticals / Medical Devices / Life Sciences
Role / Seniority
Base salary range for 12 months (INR Lacs)
3 - 5 years 5 - 10 years 10 - 15 years 15 - 25 years 25+ years
Min Avg Max Min Avg Max Min Avg Max Min Avg Max Min Avg Max
Business Excellence / Strategy -* -* -* 12 20 35 25 40 85 45 70 100 60 90 150
SFE / SFA / Training 4 10 15 10 17 25 25 30 40 40 45 75 50 70 90
Medical / Regulatory Affairs 9 19 20 15 25 40 40 50 65 65 100 180 100 125 250
Government / Corporate Affairs -* -* -* -* -* -* 25 35 50 45 90 150 90 120 170
*Insufficient data to provide accurate range
Quality & Compliance
Role / Seniority
Base salary range for 12 months (INR Lacs)
3 - 5 years 5 - 10 years 10 - 15 years 15 - 25 years 25+ years
Min Avg Max Min Avg Max Min Avg Max Min Avg Max Min Avg Max
Corporate Quality Assurance - - - 12 20 28 15 24 35 35 55 75 60 90 150
Manufacturing Quality 6 9 12 10 17.5 25 15 24 30 40 52.5 65 55 64 95
Quality Assurance and Regulatory Affairs
- - - 12 20 28 18 29 40 38 49 60 50 60 75
Quality Control 5 9 12 10 16 22 14 21 28 30 45 60 52 62 85
SALARY TABLES HEALTHCARE & LIFE SCIENCES
India Talent Trends 2021 66

Operations
Role / Seniority
Base salary range for 12 months (INR Lacs)
3 - 5 years 5 - 10 years 10 - 15 years 15 - 25 years 25+ years
Min Avg Max Min Avg Max Min Avg Max Min Avg Max Min Avg Max
Production 6 10 13 12 27.5 28 25 35 45 40 55 75 65 92.5 120
Engineering 5 8 10 10 24 25 22 31 40 30 44 60 55 72.5 90
Environment, Health and Safety (EHS)
- - - 10 30 25 22 32 42 30 40 55 60 80 100
Operation Excellence - - - 10 20 28 20 27.5 35 28 37 50 50 65 80
Contract Manufacturing - - - 8 17.5 25 18 26.5 35 30 38 50 45 57.5 70
Procurement and Supply Chain
Role / Seniority
Base salary range for 12 months (INR Lacs)
3 - 5 years 5 - 10 years 10 - 15 years 15 - 25 years 25+ years
Min Avg Max Min Avg Max Min Avg Max Min Avg Max Min Avg Max
Direct Procurement - - 22 20 27.5 35 30 47.5 65 45 65 72 55 77.5 100
Indirect Procurement - - 20 18 24 30 25 36.5 48 35 51 60 50 67.5 85
Supply Chain 12 17 22 20 30 40 35 45 55 50 62 80 65 92.5 120
Logistics 6 10.5 15 15 20 25 25 30.5 36 35 45 50 45 52.5 60
Warehousing 5 7.5 10 15 17.5 20 20 25 30 - - - - - -
Distribution 6 10.5 15 16 19 22 18 26.5 35 - - - - - -
Planning 7 12.5 18 18 26.5 35 25 35 45 36 50 65 55 67.5 80
SALARY TABLES HEALTHCARE & LIFE SCIENCES
India Talent Trends 2021 67

Commerce & IndustryLarge & Middle Capital Companies / Listed Organisations
Role / Years of Experience
Base salary range for 12 months (INR Lacs)
3 - 5 years 5 - 10 years 10 - 15 years 15+ years
Min Avg Max Min Avg Max Min Avg Max Min Avg Max
Head of Human Resources (Large Companies)
- - - - - - - - - 100 150 200
Head of Human Resources (Small / Medium Sized Companies)
- - - 42 50 58 73 84 95 70 90 110
HR Generalist / Business Partner - - - 20 34 47 42 58 74 55 68 80
Learning & Development - - - 18 27 35 40 49 58 50 65 80
Compensation & Benefits - - - 30 40 50 42 58 73 60 90 120
Talent Acquisition - - - 21 27 32 42 48 53 50 80 110
Talent Management / Organisational Development (OD)
- - - 32 40 47 47 53 58 60 75 90
Industrial Relations - - - 21 27 32 37 48 58 55 65 75
HR Operations / Payroll / HRIS - - - 19 23 26 32 37 42 45 55 65
HR Consulting - - - 37 45 53 53 64 74 70 85 100
Small Capital Companies / Non-listed Organisations
Role / Years of Experience
Base salary range for 12 months (INR Lacs)
3 - 5 years 5 - 10 years 10 - 15 years 15+ years
Min Avg Max Min Avg Max Min Avg Max Min Avg Max
Head of Human Resources (Large Companies)
- - - - - - 50 55 60 60 90 120
Head of Human Resources (Small / Medium Sized Companies)
- - - 20 25 30 32 39 46 45 63 80
HR Generalist / Business Partner - - - 18 24 30 25 33 40 40 50 60
Learning & Development - - - 16 22 28 25 30 35 40 50 60
Compensation & Benefits - - - 21 27 33 25 34 42 45 55 65
Talent Acquisition - - - 18 24 30 28 33 38 40 50 60
Talent Management / Organisational Development (OD)
- - - 20 28 35 35 40 45 45 53 60
Industrial Relations - - - 15 18 20 15 20 25 25 40 55
HR Operations / Payroll / HRIS - - - 12 16 20 15 19 22 25 33 40
HR Consulting - - - 25 30 35 35 43 50 50 63 75
SALARY TABLES
H U M A N R E S O U R C E S
India Talent Trends 2021 68

Banking & Financial ServicesLarge & Middle Capital Companies / Listed Organisations
Role / Years of Experience
Base salary range for 12 months (INR Lacs)
3 - 5 years 5 - 10 years 10 - 15 years 15+ years
Min Avg Max Min Avg Max Min Avg Max Min Avg Max
Head of Human Resources (Large Companies)
- - - - - - - - - 100 150 200
Head of Human Resources (Small / Medium Sized Companies)
- - - - - - 55 63 70 70 95 120
HR Generalist / Business Partner - - - 25 33 40 40 50 60 60 80 100
Learning & Development - - - 25 30 35 35 40 45 45 63 80
Compensation & Benefits - - - 22 29 35 40 50 60 55 78 100
Employee Relations - - - 25 35 45 45 63 80 80 95 110
Talent Acquisition - - - 20 25 30 35 45 55 50 83 115
HR Operations / Payroll / HRIS - - - 18 22 25 30 35 40 45 58 70
Small Capital Companies / Non-listed Organisations
Role / Years of Experience
Base salary range for 12 months (INR Lacs)
3 - 5 years 5 - 10 years 10 - 15 years 15+ years
Min Avg Max Min Avg Max Min Avg Max Min Avg Max
Head of Human Resources (Large Companies)
- - - - - - - - - 60 73 85
Head of Human Resources (Small / Medium Sized Companies)
- - - - - - 30 40 50 50 63 75
HR Generalist / Business Partner - - - 20 23 25 25 33 40 50 63 75
Learning & Development - - - 16 21 25 25 33 40 40 50 60
Compensation & Benefits - - - 20 25 30 30 38 45 55 83 110
Talent Acquisition - - - 15 20 25 25 33 40 40 50 60
HR Operations / Payroll / HRIS - - - 15 18 20 20 25 30 30 40 50
HR Consulting - - - 25 30 35 35 43 50 50 63 75
SALARY TABLES HUMAN RESOURCES
India Talent Trends 2021 69

Lawyer - Inhouse
Role / Years of Experience
Base salary range for 12 months (INR Lacs)
3 - 5 years PQE 5 - 10 years PQE 10 - 15 years PQE 15+ years PQE
Min Avg Max Min Avg Max Min Avg Max Min Avg Max
Lawyer - In-house (All industries excluding Financial Services)
6 11 15 15 38 60 30 60 90 45 148 250
Lawyer - In-house (Financial Services) 8 14 18 18 34 65 50 60 75 70 135 250
Lawyer - Private Practice
Role / Years of Experience
Base salary range for 12 months (INR Lacs)
Associate Senior AssociatePrincipal Associate /
CounselAssociate Partner /
Partner
Min Avg Max Min Avg Max Min Avg Max Min Avg Max
Lawyer - Private Practice (Tier 1) 15 21 30 30 42 50 50 60 70 75 - -
Lawyer - Private Practice (Tier 2) 12 17 25 25 32 40 38 45 55 60 - -
Lawyer - Private Practice (Tier 3) 8 13 20 20 28 35 30 38 45 50 - -
Company Secretaries (In-house)
Role / Years of Experience
Base salary range for 12 months (INR Lacs)
3 - 5 years PQE 5 - 10 years PQE 10 - 15 years PQE 15+ years PQE*
Min Avg Max Min Avg Max Min Avg Max Min Avg Max
Company Secretary (Listed) 6 7 12 15 22 30 25 35 50 50 80 -
Company Secretary (Unlisted) 3 5 8 10 16 22 20 30 40 35 - -
Compliance - Ethics & Investigation Counsels (In-house)
Role / Years of Experience
Base salary range for 12 months (INR Lacs)
3 - 5 years PQE 5 - 10 years PQE 10 - 15 years PQE 15+ years PQE
Min Avg Max Min Avg Max Min Avg Max Min Avg Max
Ethics & Investigation Counsels 10 18 25 25 32 40 40 55 70 60 80 120
SALARY TABLES
L E G A L , C S & C O M P L I A N C E
India Talent Trends 2021 70

Business Management
Role / Seniority
Base salary range for 12 months (INR Lacs)
3 - 5 years 5 - 10 years 10 - 15 years 15 - 25 years 25+ years
Min Avg Max Min Avg Max Min Avg Max Min Avg Max Min Avg Max
P&L Management - - - 25 44 65 40 65 90 50 85 150 80 125 350
Sales - - - 13 25 50 23 45 75 41 75 150 60 95 300
Marketing - - - 11 24 40 22 45 70 27 70 150 50 90 250
BD / Land Acquisition - - - 10 25 55 20 45 75 30 70 150 50 85 200
Leasing - - - 12 22 40 15 45 65 25 50 150 50 90 250
P&L & Operations
Role / Seniority
Base salary range for 12 months (INR Lacs)
3 - 5 years 5 - 10 years 10 - 15 years 15 - 25 years 25+ years
Min Avg Max Min Avg Max Min Avg Max Min Avg Max Min Avg Max
Property & Asset Management 7 12 20 10 30 45 30 50 100 50 80 200 70 100 225
Strategy 15 22 35 20 40 60 35 65 100 60 100 170 - - -
Executive Assistance 12 22 35 15 30 40 30 50 60 50 70 120 - - -
Facilities Management - - - 10 20 30 15 30 40 30 50 80 50 80 150
CRM - - - 8 15 30 15 35 50 21 55 100 40 75 150
Technical
Role / Seniority
Base salary range for 12 months (INR Lacs)
3 - 5 years 5 - 10 years 10 - 15 years 15 - 25 years 25+ years
Min Avg Max Min Avg Max Min Avg Max Min Avg Max Min Avg Max
Architecture & Design - - - 8 12 25 15 25 40 25 40 90 40 75 200
Project Management - - - 8 15 20 20 25 35 35 45 100 45 70 200
MEP - - - 6 15 25 12 30 45 25 50 100 40 70 150
Health & Safety - - - 6 12 25 12 25 50 25 35 100 35 45 150
Quantity Surveying - - - 6 10 17 10 20 50 20 30 65 35 50 100
SALARY TABLES
P R O P E R T Y & C O N S T R U C T I O N
India Talent Trends 2021 71

FMCG / Retail & Healthcare / PharmaceuticalTop Business Graduates
Role / Years of Experience
Base salary range for 12 months (INR Lacs)
3 - 5 years 5 - 10 years 10 - 15 years 15+ years
Min Avg Max Min Avg Max Min Avg Max Min Avg Max
Procurement 15 23 30 30 50 70 50 75 100 80 140 200
Logistics (Including Transportation, Warehousing)
15 23 30 30 50 70 50 75 100 80 110 140
Supply Chain 15 23 30 30 50 70 50 75 100 80 140 200
Sourcing 15 23 30 30 50 70 50 75 100 80 100 120
Planning 15 23 30 30 50 70 50 75 100 80 100 120
Non-Business School Graduates
Role / Years of Experience
Base salary range for 12 months (INR Lacs)
3 - 5 years 5 - 10 years 10 - 15 years 15+ years
Min Avg Max Min Avg Max Min Avg Max Min Avg Max
Quality 8 12 15 15 25 35 25 38 50 45 68 90
Procurement 8 12 15 15 25 35 25 38 50 45 98 150
Logistics (Including Transportation, Warehousing)
8 12 15 15 25 35 25 38 50 45 83 120
Supply Chain 8 12 15 15 25 35 25 38 50 45 98 150
Sourcing 8 12 15 15 25 35 25 38 50 45 68 90
Planning 8 12 15 15 25 35 25 38 50 45 68 90
Captives / Shared Services
Role / Years of Experience
Base salary range for 12 months (INR Lacs)
3 - 5 years 5 - 10 years 10 - 15 years 15+ years
Min Avg Max Min Avg Max Min Avg Max Min Avg Max
Procurement Manager 16 18 20 20 30 40 30 40 50 40 50 60
Vendor / Supplier Relationship Manager 16 18 20 20 30 40 30 40 50 40 50 60
Strategic Sourcing Leader / Manager 16 18 20 20 30 40 30 40 50 40 50 60
Category / Commodity Manager 16 18 20 20 30 40 30 40 50 40 50 60
GM / Head of Procurement - - - - - - 50 60 70 60 80 100
CPO / Director P2P - - - - - - 50 60 70 60 80 100
SALARY TABLES
P R O C U R E M E N T & S U P P L Y C H A I N
India Talent Trends 2021 72

Industrial & Manufacturing
Role / Years of Experience
Base salary range for 12 months (INR Lacs)
3 - 5 years 5 - 10 years 10 - 15 years 15+ years
Min Avg Max Min Avg Max Min Avg Max Min Avg Max
Procurement Manager 14 22 30 20 32 45 35 55 75 - - -
Logistics (including transportation and warehousing)
14 20 25 20 30 30 30 43 55 40 65 90
Sourcing 14 22 30 20 32 45 35 55 75 75 98 120
Quality 10 13 15 15 25 35 25 43 60 50 70 90
Head of Procurement - - - 20 32 45 40 50 60 60 90 120
SALARY TABLES PROCUREMENT & SUPPLY CHAIN
India Talent Trends 2021 73

Corporate IT MNC & Domestic companies (Listed / Non - Listed)
Role / Years of Experience
Base salary range for 12 months (INR Lacs)
5 - 10 years 10 - 15 years 15+ years
Min Avg Max Min Avg Max Min Avg Max
CIO / IT Director - - - 45 63 80 65 100 150
Infrastructure / Cloud / Data Centre 20 30 40 40 55 70 65 75 85
Application / ERP 20 30 40 40 55 70 65 75 85
CISO / Information Security / Cyber Security 25 35 45 45 60 75 70 80 90
Service Delivery / IT Operations / Project Management
20 30 40 40 55 70 65 75 85
Development, Design & ArchitectureProduct companies, e-commerce and internet companies
Role / Years of Experience
Base salary range for 12 months (INR Lacs)
4 - 10 years 10 - 15 years 15+ years
Min Avg Max Min Avg Max Min Avg Max
CTO / Head of Engineering 30 45 60 60 105 150 80 130 180
Design & Architecture 30 45 60 60 75 90 90 105 120
Software Development 20 35 50 40 60 80 80 100 120
DevOps Engineering 20 35 50 40 60 80 80 100 120
Quality Assurance 15 25 40 40 55 70 60 75 95
Product Management 25 50 75 70 110 150 130 155 180
SALARY TABLES
T E C H N O L O G Y
India Talent Trends 2021 74

Consumer GoodsCandidates with pedigree
Role / Years of Experience
Base salary range for 12 months (INR Lacs)
3 - 5 years 5 - 10 years 10 - 15 years 15+ years
Min Avg Max Min Avg Max Min Avg Max Min Avg Max
Sales / Channel Management 20 26 32 30 50 70 40 70 100 80 140 200
Brand Management / Product Management 20 26 32 30 50 70 40 70 100 - - -
Trade Marketing 20 26 32 30 50 70 40 70 100 100 125 150
Category Management - - - 30 50 70 40 70 100 100 150 200
Communications / PR / CSR 13 17 20 20 30 40 30 43 55 60 105 150
Others
Role / Years of Experience
Base salary range for 12 months (INR Lacs)
3 - 5 years 5 - 10 years 10 - 15 years 15+ years
Min Avg Max Min Avg Max Min Avg Max Min Avg Max
Sales / Channel Management 12 14 15 15 25 35 30 40 50 50 75 100
Brand Management / Product Management 15 17 18 18 29 40 30 40 50 - - -
Trade Marketing 12 14 15 15 25 35 25 35 45 50 75 100
Category Management - - - 18 29 40 30 40 50 50 75 100
Communications / PR / CSR 12 15 18 15 23 30 20 30 40 35 68 100
Pharmaceuticals
Role / Years of Experience
Base salary range for 12 months (INR Lacs)
3 - 5 years 5 - 10 years 10 - 15 years 15+ years
Min Avg Max Min Avg Max Min Avg Max Min Avg Max
Sales (Candidates with pedigree) 8 14 20 18 29 40 25 50 75 60 90 120
Marketing (Candidates with pedigree) 8 14 20 18 29 40 25 43 60 50 75 100
Sales 5 9 12 10 15 20 15 23 30 25 50 75
Marketing 5 8 10 8 12 15 15 20 25 20 40 60
Regulatory Affairs / QA / RA 5 9 12 10 16 22 22 31 40 35 43 50
Communications & CSR 6 11 15 12 20 28 25 35 45 30 45 60
Medical Affairs 8 13 18 12 26 40 30 45 60 50 85 120
SALARY TABLES
S A L E S & M A R K E T I N G
India Talent Trends 2021 75

Medical Devices
Role / Years of Experience
Base salary range for 12 months (INR Lacs)
3 - 5 years 5 - 10 years 10 - 15 years 15+ years
Min Avg Max Min Avg Max Min Avg Max Min Avg Max
Sales (Candidates with pedigree) 12 19 25 18 29 40 35 48 60 50 100 150
Marketing (Candidates with pedigree) 12 19 25 30 38 45 45 53 60 60 78 95
Sales 8 14 20 12 21 30 25 43 60 50 100 150
Marketing 12 17 22 22 28 34 35 40 45 45 65 85
Regulatory Affairs / QA / RA 10 12 15 12 18 22 22 30 40 35 43 50
Clinical / Application / Product Specialist / Service
6 8 10 8 14 20 15 23 30 25 43 60
Building Materials & Technologies
Role / Years of Experience
Base salary range for 12 months (INR Lacs)
3 - 5 years 5 - 10 years 10 - 15 years 15+ years
Min Avg Max Min Avg Max Min Avg Max Min Avg Max
Sales (Candidates with pedigree) 12 19 25 20 33 45 30 53 75 60 90 120
Marketing (Candidates with pedigree) 12 16 20 18 29 40 25 43 60 60 80 100
Sales 6 9 12 10 18 25 20 33 45 30 55 80
Pre-Sales / Specifications 5 8 10 8 17 25 20 30 40 30 40 50
Product / Brand / Marketing 8 12 15 12 19 25 20 30 40 30 45 60
Marketing Communications / PR / Corporate Affairs
- - - 8 17 25 20 28 35 30 45 60
Education
Role / Years of Experience
Base salary range for 12 months (INR Lacs)
3 - 5 years 5 - 10 years 10 - 15 years 15+ years
Min Avg Max Min Avg Max Min Avg Max Min Avg Max
Sales Manager 8 12 16 14 21 28 25 35 45 - - -
Marketing Manager 10 14 18 15 22 28 24 35 45 40 53 65
Digital Marketing Manager 12 15 18 16 23 30 - - - - - -
Business Director - - - - - - 40 50 60 50 63 75
SALARY TABLES SALES & MARKETING
India Talent Trends 2021 76

Retail
Role / Years of Experience
Base salary range for 12 months (INR Lacs)
3 - 5 years 5 - 10 years 10 - 15 years 15+ years
Min Avg Max Min Avg Max Min Avg Max Min Avg Max
Sales Manager / Director 8 13 18 15 23 30 30 45 60 50 100 150
Marketing Manager / Director 5 10 15 10 18 25 20 40 60 50 70 90
E-commerce Manager / Head / Key Accounts Manager
5 9 12 10 15 20 20 35 50 40 65 90
Retail Business Development Manager / Head
5 8 10 10 15 20 20 35 50 40 65 90
Retail Operations Manager / Head of Retail 5 12 18 15 23 30 20 30 40 40 95 150
Industrial Goods & Solutions
Role / Years of Experience
Base salary range for 12 months (INR Lacs)
3 - 5 years 5 - 10 years 10 - 15 years 15+ years
Min Avg Max Min Avg Max Min Avg Max Min Avg Max
Sales (Candidates with pedigree) 10 15 20 15 23 30 25 53 80 50 85 120
Sales (Others) 7 11 15 10 18 25 20 35 50 40 60 80
Product Management / Marketing 6 9 12 10 18 25 20 35 50 40 50 60
Application / Technical 5 8 10 8 13 18 15 23 30 25 38 50
Marketing Communications / PR / Corporate Affairs
- - - 8 17 25 20 33 45 30 45 60
Chemicals
Role / Years of Experience
Base salary range for 12 months (INR Lacs)
3 - 5 years 5 - 10 years 10 - 15 years 15+ years
Min Avg Max Min Avg Max Min Avg Max Min Avg Max
Sales (Candidates with pedigree) 10 15 20 15 25 35 25 43 60 40 95 150
Sales 6 11 15 10 18 25 20 35 50 40 70 100
Brand / Product Management 6 8 10 10 18 25 15 28 40 30 53 75
Application / Technical 5 8 10 8 13 18 15 23 30 25 38 50
Marketing Communications / PR / Corporate Affairs
- - - 8 17 25 20 33 45 30 45 60
SALARY TABLES SALES & MARKETING
India Talent Trends 2021 77

India Talent Trends 2021 78

Michael Page International Recruitment Pvt Ltd
Mumbai 5th Floor, 2 North Avenue,Maker Maxity, Bandra-Kurla Complex, Bandra (E),Mumbai BKC 400051T +91 2242363300 | F +91 2242363301
Gurgaon Haryana 1st floor, Building 8, Tower A DLF Cybercity, DLF Phase-II Gurgaon Haryana 122002 T +91 1244525500 | F +91 244525555
Bengaluru 7th Floor, Spaces – The Fairway Business Park Next to Embassy Golf Link, Domlur, #10/1, 11/2 and 12/2BEmbassy Golf Links Business Park, ChallaghattaBengaluru Karnataka 560071T +91 806826 6800