2021 Edelman Trust Barometer_Singapore Country Report
47
Country Report Trust in Singapore
-
Upload
khangminh22 -
Category
Documents
-
view
5 -
download
0
Transcript of 2021 Edelman Trust Barometer_Singapore Country Report
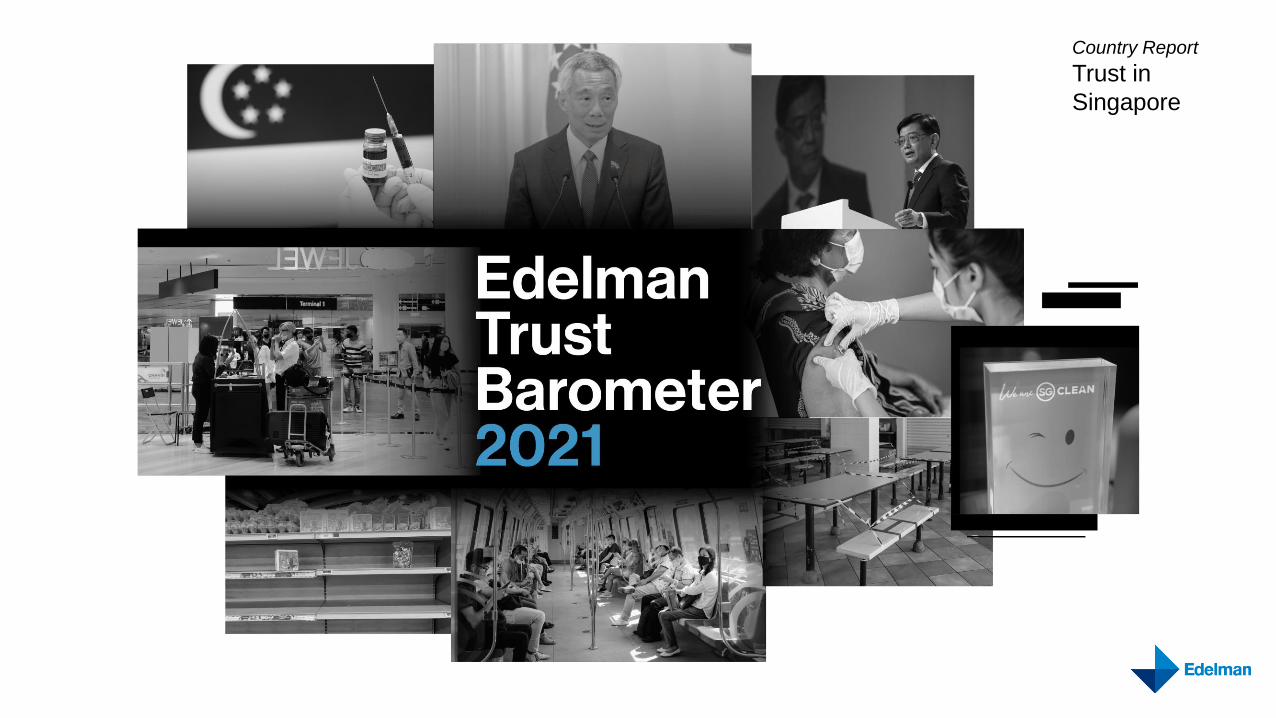
Country Report
Trust in
Singapore

2
27-market global data margin of error: General population +/- 0.6%
(N=31,050); informed public +/- 1.3% (N=6,000); mass population +/-
0.6% (N=25,050+); half-sample global general online population +/-
0.8% (N=15,525).
Country-specific data margin of error: General population +/- 2.9%
(N=1,150); informed public +/- 6.9% (N=min 200, varies by country),
except for China and U.S. +/- 4.4% (N=500) and Nigeria +/- 9.8%
(N=100); mass population +/- 3.0% to 3.6% (N=min 736, varies by
country), except for Nigeria +/- 2.9% (N=1,125).
U.S. Post-Election Supplement margin of error: +/- 2.5% (N=1,500).
U.S. Post-Election Supplement ethnicity-specific data margin of error:
Non-Hispanic White +/- 3.3% (N=894); all others +/- 4.0 (N=607).
Methodology
21st ANNUAL EDELMAN TRUST BAROMETER
General Online Population
1,150respondents per country
Ages
18+
All slides show general
online population data
unless otherwise noted
Informed Public
Mass Population
500 respondents in U.S. and China;
100 respondents in Nigeria;
200 in all other countries
Represents 17% of total global population
Must meet 4 criteria:
‣ Age 25-64
‣ College-educated
‣ In top 25% of household income
per age group in each country
‣ Report significant engagement in public
policy and business news
All population not including
informed public
Represents 83% of total global
population
*The 2021 Trust Barometer 27-market global averages (for
the general population, mass population and informed
public) do not include Nigeria
U.S. Post-Election Supplement
1,500 U.S. respondents, fielded December 14 to 18, 2020
Online survey in 28 countries*
33,000+ respondents
2021 Edelman Trust Barometer fieldwork
conducted from October 19 to November 18, 2020

3
21 YEARS OF TRUST
2001 2002 2003 2004 2005 2006 2007 2008 2009 2010 2011
Rising
Influence of
NGOs
Fall of the
Celebrity CEO
Earned Media
More Credible
Than
Advertising
U.S.
Companies in
Europe Suffer
Trust Discount
Trust
Shifts from
“Authorities”
to Peers
A “Person Like
Me” Emerges
as Credible
Spokesperson
Business More
Trusted Than
Government
and Media
Young People
Have More
Trust in
Business
Trust in
Business
Plummets
Performance
and
Transparency
Essential to
Trust
Business Must
Partner With
Government to
Regain Trust
2012 2013 2014 2015 2016 2017 2018 2019 2020 2021
Fall of
Government
Crisis of
Leadership
Business
to Lead
the Debate
for Change
Trust is
Essential to
Innovation
Growing
Inequality
of Trust
Trust in
Crisis
The Battle
for Truth
Trust
at Work
Trust:
Competence
and Ethics
Declaring
Information
Bankruptcy

4
56 Global 27
77 India
72 China
72 Indonesia
69 Saudi Arabia
68 Singapore
67 UAE
66 Malaysia
63 The Netherlands
61 Thailand
59 Australia
59 Kenya
59 Mexico
56 Canada
53 Germany
52 Italy
51 Brazil
50 Ireland
48 Colombia
48 France
48 S. Africa
48 U.S.
47 Argentina
47 S. Korea
45 Spain
45 UK
40 Japan
31 Russia
2021 Edelman Trust Barometer. The Trust Index is the average
percent trust in NGOs, business, government and media. TRU_INS.
Below is a list of institutions. For each one, please indicate how
much you trust that institution to do what is right. 9-point scale; top 4
box, trust. General population, 27-mkt avg.
Trust Index
TRUST INDEX IN SINGAPORE RISES BY 6 POINTS
54 Global 27
82 China
79 India
73 Indonesia
66 Thailand
65 UAE
62 Mexico
62 Singapore
61 Saudi Arabia
60 Malaysia
57 Kenya
57 The Netherlands
53 Canada
53 Colombia
51 Brazil
50 S. Korea
49 Argentina
49 Italy
47 Australia
47 U.S.
46 Germany
45 France
45 Ireland
45 Spain
44 S. Africa
42 Japan
42 UK
30 Russia
Greatest decline in China (-10);
greatest increase in Australia (+12)
16 countries gained trust,
9 countries lost trust
2020General population
2021General population
YtYChange
-2
0
-10
-1
+8
+6
+2
+6
+6
-5
+12
+2
-3
+3
+7
+3
+5
-5
+3
+4
+1
-2
-3
0
+3
-2
+1
+2
47
5348
43
U.S. Trust Index
-5
Record year-over-
year decline in
China’s Trust Index
Distrust
(1-49)
Neutral
(50-59)
Trust
(60-100)Change, 2020 to 2021
- 0 +

5
6157 53 51
l+2 -1 +3 +2
Business NGOs Government Media
2021 Edelman Trust Barometer. The Trust Index is the average percent trust in NGOs, business, government and media. TRU_INS. Below is a list of institutions. For each one, please indicate
how much you trust that institution to do what is right. 9-point scale; top 4 box, trust. General population, 27-mkt avg.
Percent trust
A STRONG TRUST ECOSYSTEM IN SINGAPORE,LED BY GOVERNMENT
Business more trusted
than government in
18 of 27 countries
Distrust Neutral Trust Change, 2020 to 2021
Change,
2020 to 2021
+2 pts56
GLOBAL TRUST
INDEX
- 0 +
Change,
2020 to 2021
68SG TRUST INDEX
+6 pts
Government NGOs Business Media
7670 65 62
+6 +6 +7 +7

-35
ETHICAL
35
UNETHICAL
- 50LESS COMPETENT 50 COMPETENT
6
(2, 17)
(9, 29)
(15, 13)
(11, 32)
(Competence score, net ethical score),
in Singapore
2021 Edelman Trust Barometer. The ethical scores are averages of nets based on INS_PER_DIM/1-4. Question asked of half of the sample. The competence score is a net based on
TRU_3D_INS/1. Depending on the question it was either asked of the full of half the sample. General population, Singapore. For full details regarding how this data was calculated and plotted,
please see the Technical Appendix.
IN SINGAPORE, ALL INSTITUTIONS SEEN AS BOTH COMPETENT AND ETHICAL
BusinessMedia
NGOs
2021
2020
Government
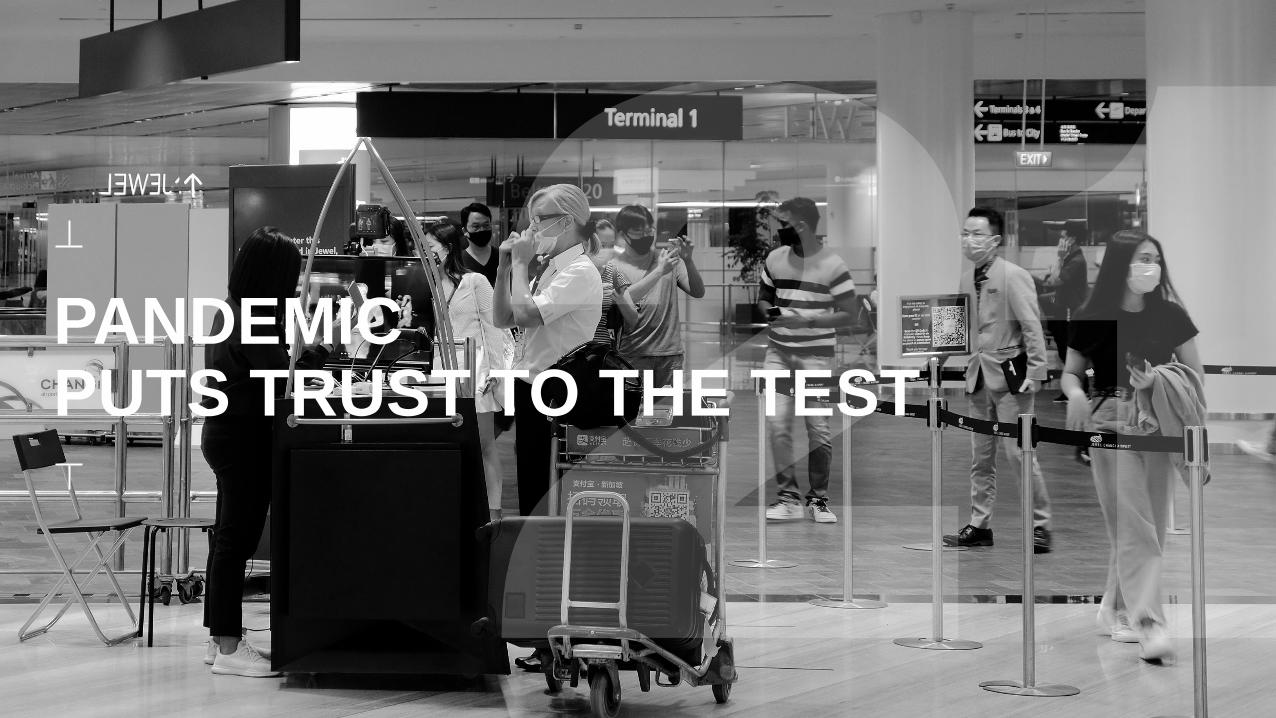
PANDEMIC PUTS TRUST TO THE TEST
8
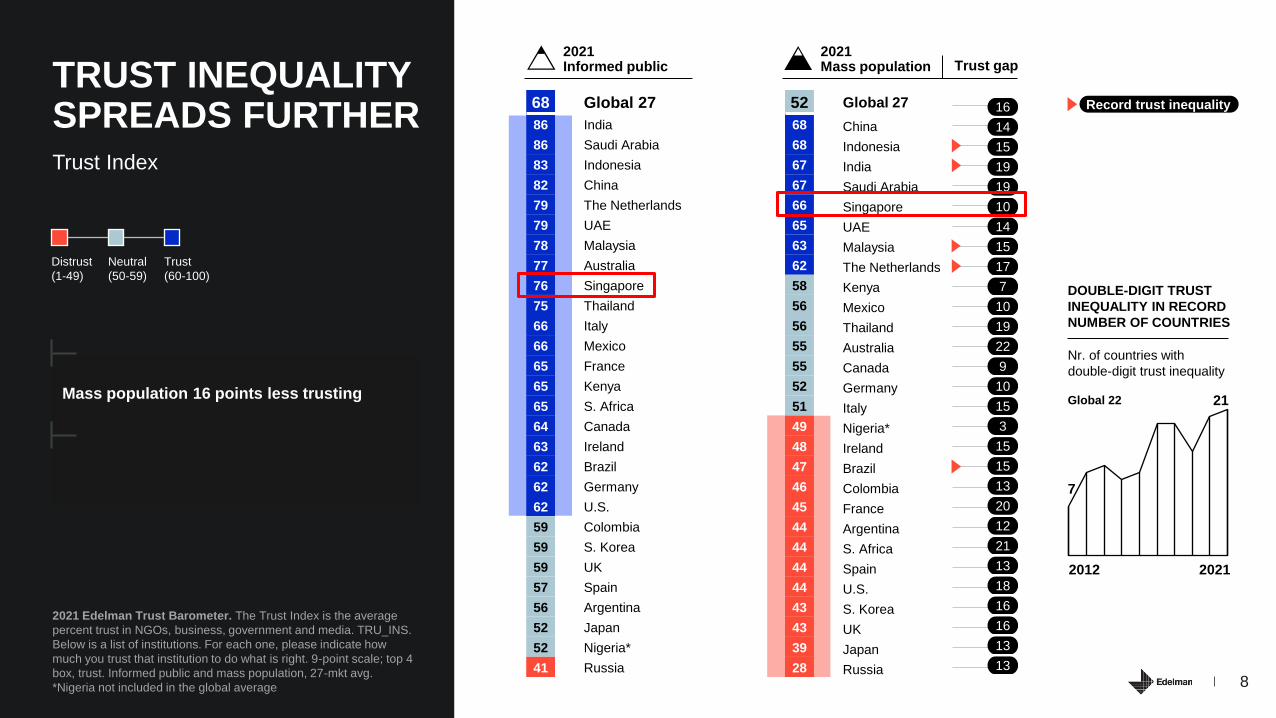
Mass population 16 points less trusting
68 Global 27
86 India
86 Saudi Arabia
83 Indonesia
82 China
79 The Netherlands
79 UAE
78 Malaysia
77 Australia
76 Singapore
75 Thailand
66 Italy
66 Mexico
65 France
65 Kenya
65 S. Africa
64 Canada
63 Ireland
62 Brazil
62 Germany
62 U.S.
59 Colombia
59 S. Korea
59 UK
57 Spain
56 Argentina
52 Japan
52 Nigeria*
41 Russia
2021 Edelman Trust Barometer. The Trust Index is the average
percent trust in NGOs, business, government and media. TRU_INS.
Below is a list of institutions. For each one, please indicate how
much you trust that institution to do what is right. 9-point scale; top 4
box, trust. Informed public and mass population, 27-mkt avg.
*Nigeria not included in the global average
Trust Index
TRUST INEQUALITY SPREADS FURTHER
Trust gap
16
14
15
19
19
10
14
15
17
7
10
19
22
9
10
15
3
15
15
13
20
12
21
13
18
16
16
13
13
2021Informed public
2021Mass population
Record trust inequality52 Global 27
68 China
68 Indonesia
67 India
67 Saudi Arabia
66 Singapore
65 UAE
63 Malaysia
62 The Netherlands
58 Kenya
56 Mexico
56 Thailand
55 Australia
55 Canada
52 Germany
51 Italy
49 Nigeria*
48 Ireland
47 Brazil
46 Colombia
45 France
44 Argentina
44 S. Africa
44 Spain
44 U.S.
43 S. Korea
43 UK
39 Japan
28 Russia
7
21
2012
DOUBLE-DIGIT TRUST
INEQUALITY IN RECORD
NUMBER OF COUNTRIES
Global 22
Nr. of countries with
double-digit trust inequality
Distrust
(1-49)
Neutral
(50-59)
Trust
(60-100)
2021

9
54
29 2926 25
90
7673
65 65
2021 Edelman Trust Barometer. POP_EMO. Some people say
they worry about many things while others say they have few
concerns. We are interested in what you worry about. Specifically,
how much do you worry about each of the following? 9-point scale;
top 4 box, worry; top 2 box, fear. Non-job loss attributes shown to
half of the sample. General population, Singapore. Job loss asked of
those who are an employee (Q43/1). Job loss is a net of attributes 1-
3, 5, and 22-24.
Percent who are concerned,
and percent who are fearful, in
Singapore
PANDEMIC ADDED TO PERSISTENT PERSONAL AND SOCIETAL FEARS
Job loss (net) Hackers and
cyber-attacks
Climate change Losing my
freedoms as a
citizen
Contracting
COVID-19
Percent who are concerned
Percent who are fearful

10
Percent who agree, in Singapore
PANDEMIC ACCELERATES JOB LOSS FEARS
2021 Edelman Trust Barometer. LAY_OFFS. Has the organization you work for had to lay-off or furlough any employees as a result of the economic impact of the pandemic? Code 1, yes, a large
percentage; code 2, yes, a small percentage. Question asked of those who are an employee (Q43/1). Total layoff/furlough percentage is a sum of code 1 and 2. SOC_AGR. Please indicate how much
you agree or disagree with the following statements. 9-point scale; top 4 box, agree. Question asked of half of the sample. General population, Singapore.
I worry that the pandemic will accelerate
the rate at which companies replace
human workers with AI and robots
62%23 40
63%
As a result of the pandemic,
a portion of our workforce has seen their
work hours reduced or their
jobs eliminated
A small percentage
A large percentage
11
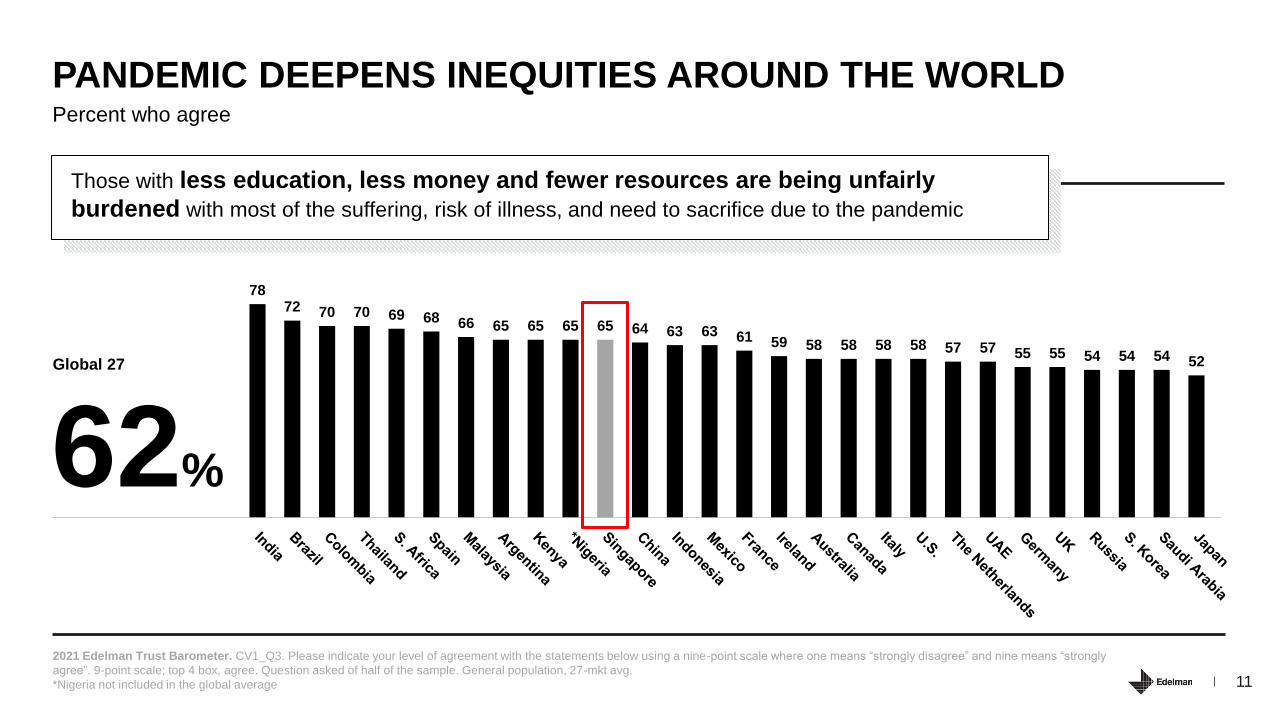
7872 70 70 69 68 66 65 65 65 65 64 63 63 61 59 58 58 58 58 57 57 55 55 54 54 54 52
Percent who agree
PANDEMIC DEEPENS INEQUITIES AROUND THE WORLD
2021 Edelman Trust Barometer. CV1_Q3. Please indicate your level of agreement with the statements below using a nine-point scale where one means “strongly disagree” and nine means “strongly
agree”. 9-point scale; top 4 box, agree. Question asked of half of the sample. General population, 27-mkt avg.
*Nigeria not included in the global average
Those with less education, less money and fewer resources are being unfairly
burdened with most of the suffering, risk of illness, and need to sacrifice due to the pandemic
62%
Global 27

12
54 56 5760 60 62
73
Percent trust, in Singapore
A LOSS OF TRUST IN PEOPLE IN MY LOCAL COMMUNITY
2021 Edelman Trust Barometer. TRU_PEP. Below is a list of groups of people. For each one, please indicate how much you trust that group of people to do what is right. 9-point scale; top 4
box, trust. Attributes shown to half of the sample; “My employer CEO” only shown to those that are an employee (Q43/1). General population, Singapore.
CEOs Journalists Religious leaders My employer CEOPeople in my local
communityGovernment leaders Scientists
Distrust Neutral Trust Change, 2020 to 2021
+3 +2 -1 n/a -9 -2 +1
- 0 +
Employer CEO
more trusted than
CEOs in general

13
Change in importance since last year
(more important minus less important)
INCREASED URGENCY TO ADDRESS FOUNDATIONAL PROBLEMS
2021 Edelman Trust Barometer. IMP_POL_PRIORITIES. For each of
the following issues and challenges, please indicate whether our
country addressing it has become more important to you, less
important to you, or has stayed the same in importance, since last year.
5-point scale; top 2 box; more important; bottom 2 box, less important.
General population, Singapore. Net change is the difference between
more and less important.
Net changeMore
Important
Less
Important
Improving our healthcare system +47 59 12
Addressing poverty in this country +41 54 13
Addressing climate change +39 54 15
Finding ways to combat fake news +39 53 14
Addressing discrimination, racism +34 48 14
Closing the economic and social divide +34 49 15
Protecting people's individual freedoms +33 48 15
Improving our education system +29 45 16
Change in importance since last
year, in Singapore

RAGING INFODEMICFEEDS MISTRUST

15
Percent who worry, in Singapore
CONCERN THAT SOCIETAL LEADERS COULD DELIBERATELY MISLEAD PEOPLE
2021 Edelman Trust Barometer. POP_EMO. Some people say they worry about many things while others say they have few concerns. We are interested in what you worry about. Specifically,
how much do you worry about each of the following? 9-point scale; top 4 box, worry. Attributes shown to half of the sample. General population, Singapore.
Business leaders are purposely trying to mislead people by saying things they know are false
or gross exaggerations
53%
Our government leaders are purposely trying to mislead
people by saying things they know are false
or gross exaggerations
50%

16
56 55 5551
45 44 4239 38
-5 -9 +5 +2 +3 -3 -4 +6 -6
2021 Edelman Trust Barometer. CRE_PPL. Below is a list of people. In general, when forming an opinion of a company, if you heard information about a company from each person, how
credible would the information be--extremely credible, very credible, somewhat credible, or not credible at all? 4-point scale; top 2 box, credible. Question asked of half of the sample. General
population, Singapore.
Percent who rate each as very/extremely credible
as a source of information about a company, in Singapore
CREDIBILITY OF EXPERTS AND COMPANY SPOKESPEOPLE DECLINES
Academic expert Company
technical expert
Government
official
A person like
yourself
NGO
representative
CEO Board of directors Journalist Regular employee
Change, 2020 to 2021- 0 + All-time low

17
Trusted (60-100)67
62 62
63 6462
6266
57
59
75
68 70
62 63 62
70 71
64
56
4945
48
43
4541
41
4845
43
55
45
46
47
4541
45
46
4142
2012 2013 2014 2015 2016 2017 2018 2019 2020 2021
Search engines*
Traditional media
Owned media
Social media
2021 Edelman Trust Barometer. COM_MCL. When looking for general news and information, how much would you trust each type of source for general news and information? 9-point scale;
top 4 box, trust. Question asked of half of the sample. General population, Singapore.
*From 2012-2015, “Online Search Engines” were included as a media type. In 2016, this was changed to “Search Engines.”
Percent trust in each source for general news and information, in Singapore
TRUST IN INFORMATION SOURCES NEARS RECORD LOWS
+2
+1
-8
-2
Change
2020-2021

18
Percent who agree, in Singapore
NEWS ORGANISATIONS SEEN AS BIASED
2021 Edelman Trust Barometer. POP_EMO. Some people say they worry about many things while others say they have few concerns. We are interested in what you worry about. Specifically, how
much do you worry about each of the following? 9-point scale; top 4 box, worry. Attributes shown to half of the sample. ATT_MED_AGR. Below is a list of statements. For each one, please rate how
much you agree or disagree with that statement. 9-point scale; top 4 box, agree. Question asked of half of the sample. PER_MED. How well do you feel the media is currently doing each of the
following? Please indicate your answer using the 5-point scale below. 5-point scale; bottom 3 box, not doing well. Question asked of half of the sample. General population, Singapore.
49%
Most news organisations
are more concerned with
supporting an ideology or
political position than with
informing the public
The media is not doing well at
being objective and non-
partisan
57%
Journalists and reporters
could be purposely trying
to mislead people by saying
things they know are false or
gross exaggerations
57%
19
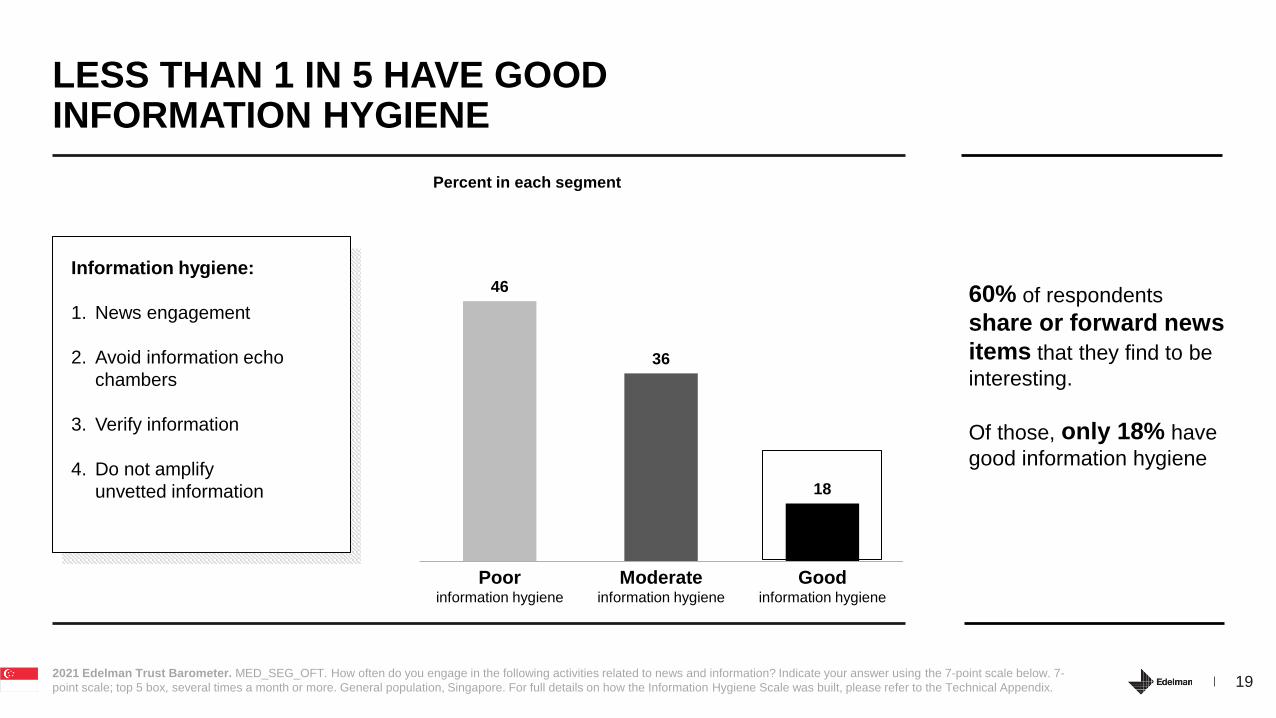
46
36
18
Poorinformation hygiene
Moderateinformation hygiene
Goodinformation hygiene
2021 Edelman Trust Barometer. MED_SEG_OFT. How often do you engage in the following activities related to news and information? Indicate your answer using the 7-point scale below. 7-
point scale; top 5 box, several times a month or more. General population, Singapore. For full details on how the Information Hygiene Scale was built, please refer to the Technical Appendix.
LESS THAN 1 IN 5 HAVE GOOD INFORMATION HYGIENE
Percent in each segment
60% of respondents
share or forward news
items that they find to be
interesting.
Of those, only 18% have
good information hygiene
Information hygiene:
1. News engagement
2. Avoid information echo
chambers
3. Verify information
4. Do not amplify
unvetted information

20
Change in importance since last year
(more important minus less important)
PRIORITIES SHIFT:MY INFORMATION LITERACY NOW MATTERS MORE
2021 Edelman Trust Barometer. IMP_VALUES. For each of the
following, please indicate whether it has become more important to
you, less important to you, or has stayed the same in importance, since
last year. 5-point scale; top 2 box; more important; bottom 2 box, less
important. Question asked of half of the sample. General population,
Singapore. Net change is the difference between more and less
important.
Net changeMore
Important
Less
Important
Prioritising my family and their needs +49 62 13
Increasing my media and
information literacy+37 49 12
Increasing my science literacy +37 49 12
Being politically aware +34 48 14
Speaking out when I see need for
changes and reforms+20 37 17
Change in importance since
the start of the year, in
Singapore...

A NEW MANDATE FOR BUSINESS
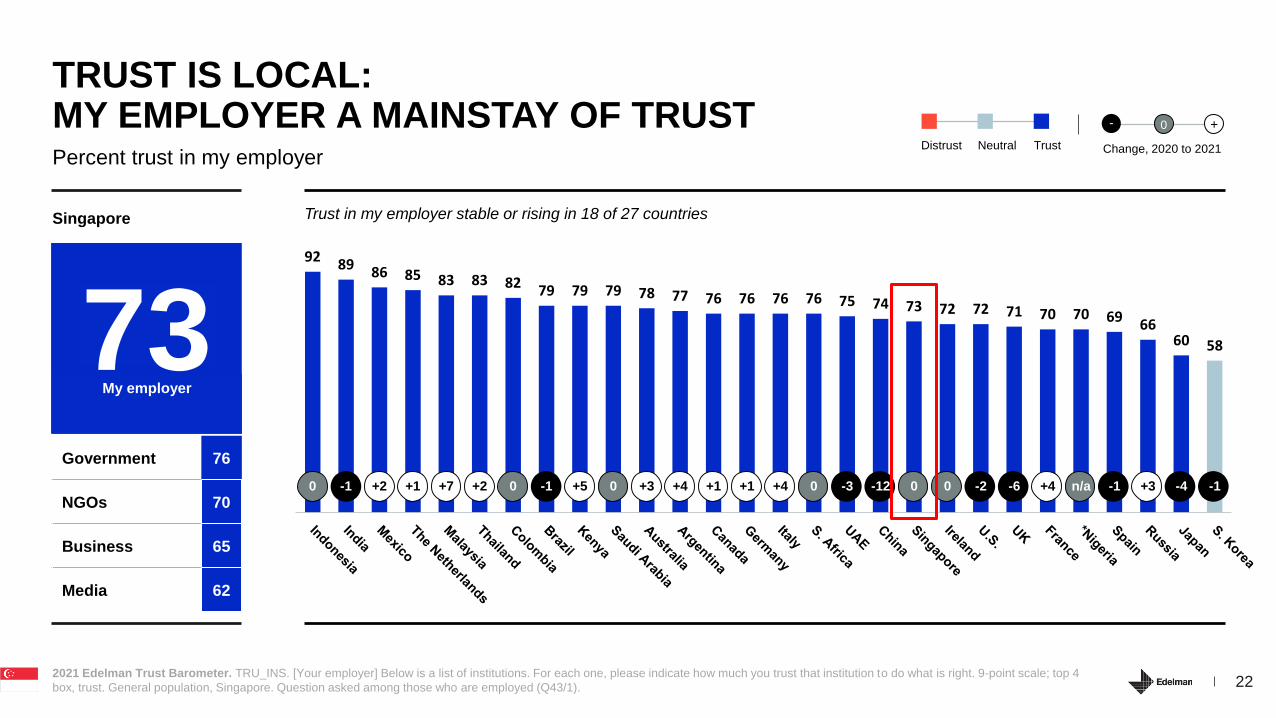
22
92 89 86 85 83 83 82 79 79 79 78 77 76 76 76 76 75 74 73 72 72 71 70 70 69 6660 58
Percent trust in my employer
TRUST IS LOCAL: MY EMPLOYER A MAINSTAY OF TRUST
2021 Edelman Trust Barometer. TRU_INS. [Your employer] Below is a list of institutions. For each one, please indicate how much you trust that institution to do what is right. 9-point scale; top 4
box, trust. General population, Singapore. Question asked among those who are employed (Q43/1).
Trust in my employer stable or rising in 18 of 27 countries
76%
Singapore
My employer more
trusted than institutions
Government 76
NGOs 70
Business 65
Media 62
73My employer
l l ll ll l ll0 -1 +2 +1 +7 +2 0 -1 +5 0 +3 +4 +1 +1 +4 0 -3 -12 0 0 -2 -6 +4 n/a -1 +3 -4 -1
Distrust Neutral Trust Change, 2020 to 2021
- 0 +

23
5 5 7 11 16 14 20
14 10 9 6 5 6 4
4750 49
4741 39
38
61 60 5853
46 4542
Percent who believe information from each source automatically, or after seeing it twice or
less, in Singapore
EMPLOYER MEDIA AMONG MOST BELIEVABLE SOURCES
2021 Edelman Trust Barometer. HEAR_TIME1. When you see a new piece of information or a news story in each of the following information sources, how many times do you need to see it or hear
it repeated in that same type of information source before you believe it is really true? Question asked of half of the sample. “Once or twice” is a sum of codes 2 and 3. General population, Singapore.
“Employer communications” only shown to those that are an employee (Q43/1).
If I see it here, I will
automatically assume it is true
Once or twice
Nr. of times they need to see
the information repeated
before believing it:
I will never believe it is true
if this is the only place I see it
National
government
My employer Media reports,
named source
Major
corporations
Advertising Media reports,
anonymous
source
My social mediaCommunications from…

24
Change in importance since last year
(more important minus less important)
EMPLOYEE EXPECTATIONS SHIFT: SAFETY AND UPSKILLING MATTER MORE
2021 Edelman Trust Barometer. EMP_IMP_VAL. When considering
an organization as a potential place of employment, please indicate
whether each of the following has become more important to you, less
important to you, or has stayed the same in importance since last year.
5-point scale; top 2 box; more important; bottom 2 box, less important.
Question asked of those who are an employee (Q43/1). General
population, Singapore. Net change is the difference between more and
less important.
Net changeMore
Important
Less
Important
Keep workers, customers safe +47 59 12
Having the option to WFH, even
after the pandemic is over+42 56 14
Job skills training programs +41 55 14
Regular employee communications +40 54 14
Diverse, representative workforce +40 52 12
Change in importance as an
employer attribute since the
start of the year in Singapore...

25
Percent who agree, in Singapore
CONSUMERS AND EMPLOYEES EXPECTED TO HAVE A SEAT AT THE TABLE
2021 Edelman Trust Barometer. TMA_SIE_SHV. Please indicate how much you agree or disagree with the following statements. 9-point scale; top 4 box, agree. Question asked of half of the
sample. EMP_ENG. Thinking about your current employer, to what extent do you agree with the following statements? 9-point scale; top 4 box, agree. Question asked of those who are an
employee (Q43/1). General population, Singapore.
have the power to force
corporations to change
67%Consumers …
63%Employees …
I am more likely now than a year
ago to voice my objections to
management or engage in
workplace protest
54% of those who
are employed

26
Percent who agree, in Singapore
CEOS EXPECTED TO BE ACCOUNTABLE TO THE PUBLIC, NOT JUST SHAREHOLDERS
2021 Edelman Trust Barometer. CEO_EXP. Below is a list of potential expectations that you might have for a company CEO. Thinking about CEOs in general, whether they are global CEOs or a
who oversees a particular country, how would you characterize each using the following three-point scale? 3-point scale, sum of codes 2 and 3. Question asked of half of the sample. CEO_AGR. Thinking about CEOs, how
strongly do you agree or disagree with the following statement? 9-point scale; top 4 box, trust. Question asked of half of the sample. General population, Singapore.
CEOs should take the lead on change rather than waiting
for government to impose change
on them
77% 71%
CEOs should step in when the government does not fix
societal problems
CEOs should hold
themselves accountable to
the public and not just to the
board of directors or stockholders
72%

27
CEOS MUST LEAD ON SOCIETAL ISSUES
2021 Edelman Trust Barometer. CEO_SPEAK. Looking at the topics listed below, please select the ones you expect CEOs to currently be speaking out about publicly. Select all that apply. Question
asked of half of the sample. General population, Singapore. CEO expectation to speak out is a net of attributes 1, 2, 5 and 7.
Percent in Singapore who expect CEOs to publicly speak out about one or more of these societal challenges
88%
Pandemic impact 52
Job automation 51
Local community issues 42
Societal issues 41
28
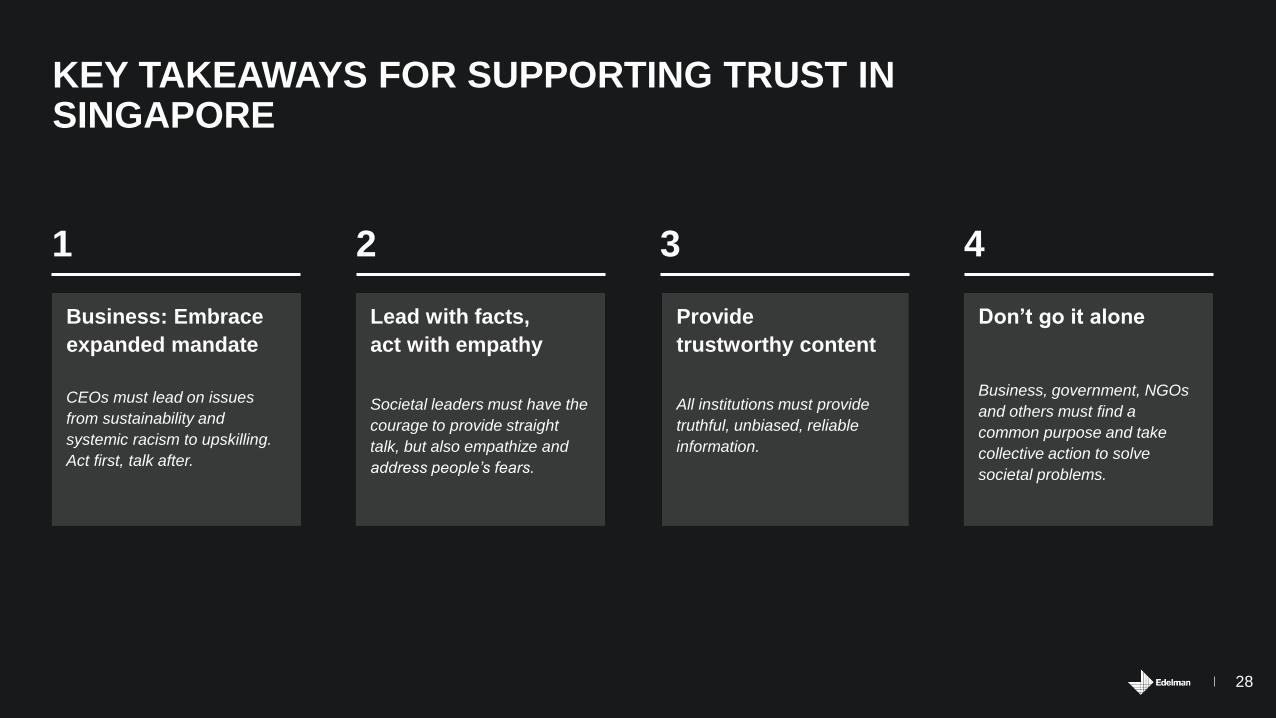
KEY TAKEAWAYS FOR SUPPORTING TRUST IN SINGAPORE
3 421
Provide
trustworthy content
All institutions must provide
truthful, unbiased, reliable
information.
Don’t go it alone
Business, government, NGOs
and others must find a
common purpose and take
collective action to solve
societal problems.
Lead with facts,
act with empathy
Societal leaders must have the
courage to provide straight
talk, but also empathize and
address people’s fears.
Business: Embrace
expanded mandate
CEOs must lead on issues
from sustainability and
systemic racism to upskilling.
Act first, talk after.

SUPPLEMENTAL DATA

30
72
59 58
42 41
Percent trust in companies headquartered in each country,
in Singapore
AMONG RESPONDENTS IN SINGAPORE,TRUST INCREASE FOR BRAND CHINA
2021 Edelman Trust Barometer. TRU_NAT. Now we would like to focus on global companies headquartered in specific countries. Please indicate how much you trust global companies
headquartered in the following countries to do what is right. 9-point scale; top 4 box, trust. Question asked of half of the sample. TRU_GOV. Please indicate how much you trust the national
government of each of the following countries to do what is right using a 9-point scale where one means that you “do not trust them at all” and nine means that you “trust them a great deal”. 9-
point scale; top 4 box, trust. Question asked of half of the sample. Respondents were not asked to rate their home country. General population, Singapore.
Percent trust in the national government of each
foreign country, in Singapore
Distrust
(1-49)
Neutral
(50-59)
Trust
(60-100)
7168 68 69
65
72
66 66
75
7169 69
66
75
64 65
70
66 65 65
59 60
55 54
31
2623
3134
36 35
44
78
73 7577 77
81 80
76
2014 2015 2016 2017 2018 2019 2020 2021

31
61
34
46 4750 51 52 54 54 55 56 56
59 61 61 62 63 63 65 67 67 68 69 69 70 71 7378
82
Percent trust
TRUST IN BUSINESS INCREASES IN 17 OF 27 COUNTRIES
2021 Edelman Trust Barometer. TRU_INS. [Business in general] Below is a list of institutions. For each one, please indicate how much you trust that institution to do what is right. 9-point scale;
top 4 box, trust. General population, 27-mkt avg.
*Nigeria not included in the global average
+2 -1 -3 +2 +3 +1 +2 +6 +4 +7 +4 +3 +2 -3 +3 n/a +11 -3 +7 -6 -1 +4 +6 +7 -12 -1 +8 -1 0
Trusted in 16 countries
Change, 2020 to 2021
- 0
+
Distrust Neutral Trust

32
57
25
4046 48 49 50 51 51 52 53 55 55 56 56
59 60 61 62 64 65 65 65 67 68 69 7074
78
Trusted in 13 countries
Percent trust
TRUST IN NGOS DECREASES IN 11 OF 27 COUNTRIES
2021 Edelman Trust Barometer. TRU_INS. [NGOs in general] Below is a list of institutions. For each one, please indicate how much you trust that institution to do what is right. 9-point scale; top
4 box, trust. General population, 27-mkt avg.
*Nigeria not included in the global average
-1 0 0 +3 -1 +1 0 -8 -6 -6 +3 0 +1 -3 -9 -10 +1 +7 +8 -2 -9 n/a +1 -6 0 +4 +6 +2 -2
Change, 2020 to 2021
- 0
+
Distrust Neutral Trust

33
53
2427
3033 34 34
37 38 3942 44 45
48 50 50 51 51
59 59 6165
69 7076
79 80 82 82
+3 n/a +7 -4 0 +1 +4 -6 +4 +2 +3 0 +9 +7 +15 -1 +10 -9 +9 +14 +17 +7 +10 -5 +6 -2 +4 -8 +4
Percent trust
TRUST IN GOVERNMENT INCREASES IN 18 OF 27 COUNTRIES
2021 Edelman Trust Barometer. TRU_INS. [Government in general] Below is a list of institutions. For each one, please indicate how much you trust that institution to do what is right. 9-point
scale; top 4 box, trust. General population, 27-mkt avg.
*Nigeria not included in the global average
Distrusted in 13 countries
Change, 2020 to 2021
- 0
+
Distrust Neutral Trust

34
51
2936 37 37 39 40 42 42 42 42 44 45
48 50 51 52 53 54 55 5660 61 61 62 62
69 70 72
+2 +1 -1 0 +2 -9 -3 0 +5 +2 0 n/a -3 +4 +1 +12 +3 -6 +1 -1 +3 +14 -3 +3 +9 +7 -4 -10 +3
Percent trust
TRUST IN MEDIA INCREASES IN 15 OF 27 COUNTRIES
2021 Edelman Trust Barometer. TRU_INS. [Media in general] Below is a list of institutions. For each one, please indicate how much you trust that institution to do what is right. 9-point scale; top
4 box, trust. General population, 27-mkt avg.
*Nigeria not included in the global average
Change, 2020 to 2021
- 0
+
Distrust Neutral Trust
Distrusted in 13 countries

35
3942 42 44
53 53 5460 62 63 65 66 66 67
7276
2021 Edelman Trust Barometer. TRU_NAT. Now we would like to focus on global companies headquartered in specific countries. Please indicate how much you trust global companies
headquartered in the following countries to do what is right. 9-point scale; top 4 box, trust. Question asked of half of the sample. General population, Singapore.
Trust in companies headquartered in each country, in Singapore
TRUST INCREASES IN 9 OF 16 COUNTRY BRANDS
+11 +8 +14 +9 +4 +8 -1 +4 -3 +6 +1 -1 0 -2 -2 -4
Change, 2020 to 2021
- 0
+
Distrust Neutral Trust
All-time low

36
64
60 61
58 58
5557 58
61
56
51
46
55
50
54
45
48
45
50 55
47
4953
47
53
51
41
52
49 51
52
46
51
43
50
36
4545
4744
33
27
39
35
33 39
2012 2013 2014 2015 2016 2017 2018 2019 2020 2021
Academic expert
Government official
A person like yourself
CEOs
Journalist
2021 Edelman Trust Barometer. CRE_PPL. Below is a list of people. In general, when forming an opinion of a company, if you heard information about a company from each person, how
credible would the information be--extremely credible, very credible, somewhat credible, or not credible at all? 4-point scale; top 2 box, credible. Question asked of half of the sample. General
population, Singapore.
Percent who rate each as very/extremely credible
as a source of information about a company, in Singapore
SPOKESPEOPLE CREDIBILITY OVER TIME
37
1521 24
18 1823
3226
33 3328 32 35 33 35
42
24 28
39 39 43 4535 39
4539
48 51
40
4952 54 54
58 58 59 5962
65 65 65 66 66 66 68 69 69 70 71 71 72 73 74 75 7680
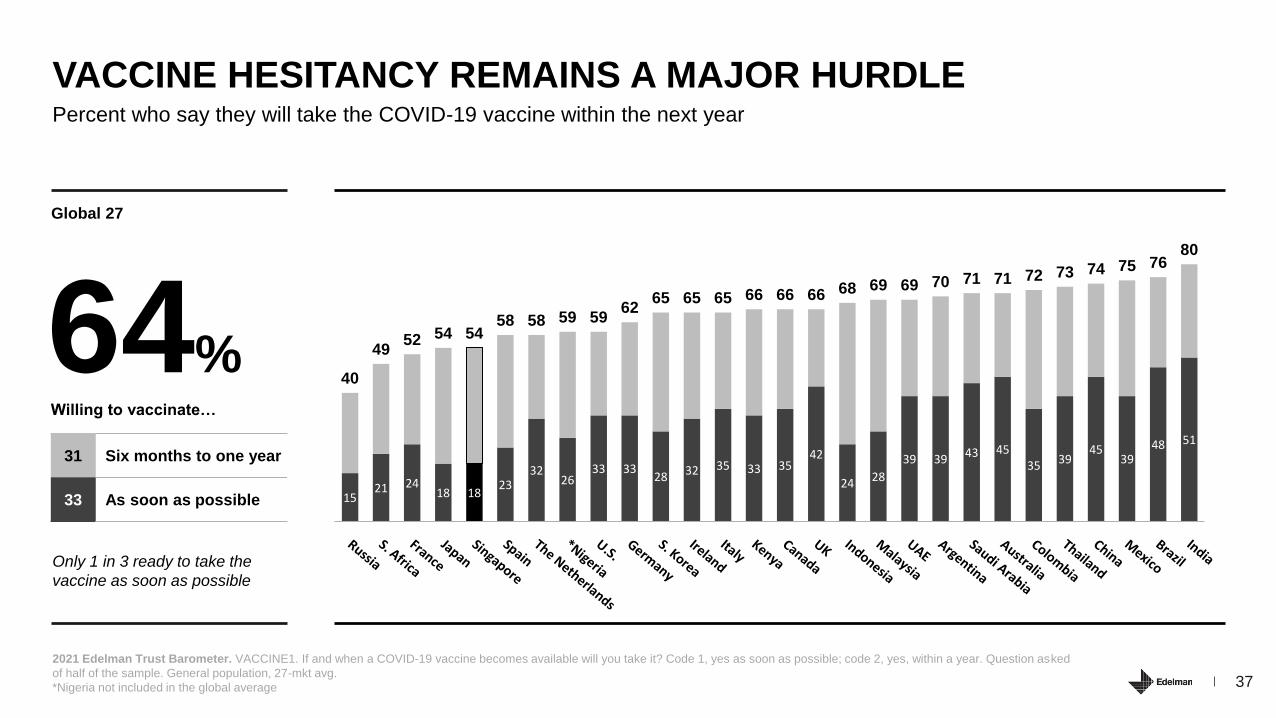
2021 Edelman Trust Barometer. VACCINE1. If and when a COVID-19 vaccine becomes available will you take it? Code 1, yes as soon as possible; code 2, yes, within a year. Question asked
of half of the sample. General population, 27-mkt avg.
*Nigeria not included in the global average
Percent who say they will take the COVID-19 vaccine within the next year
VACCINE HESITANCY REMAINS A MAJOR HURDLE
Global 27
64%
Only 1 in 3 ready to take the
vaccine as soon as possible
31 Six months to one year
33 As soon as possible
Willing to vaccinate…

38
26
34
23
36
29
55COVID-19 risk
while commuting/in office (net)
I am more productive
Enhanced work-life balance
My employer made me feel safe
I am more productive
Healthy work-life balance
Percent who say each reason is why they are choosing to work from home vs. choosing to return to the workplace, in
Singapore
PANDEMIC FEARS IMPEDE RETURN TO WORKPLACE
2021 Edelman Trust Barometer. WRK_CHOICE. Which of the following best describes your current working situation? Question asked of those who are an employee (Q43/1). Data among employees that have a choice of
working from home or their workplace. WHY_HOME. Why are you choosing to continue working from home even though you could return to the workplace if you wanted to? Select all that apply. Question asked of employees
that are choosing to work from home (Q43/1 AND WRK_CHOICE/3). WHY_OFFICE. Why are you choosing to work at an office or other workplace even though you could work remotely if you wanted to? Select all that apply.
Question asked of employees that are choosing to return to their workplace (Q43/1 AND WRK_CHOICE/4). General population, Singapore. COVID-19 risk while commuting / in office is a net of WHY_HOME/2-3.
71% choosing to work at home,
for the following reasons: 29% choosing to return to the office,
for the following reasons:

39
Percent who say they will take the COVID-19 vaccine within a year
POOR INFORMATION HYGIENE THREATENS PANDEMIC RECOVERY
2021 Edelman Trust Barometer. VACCINE1. If and when a COVID-19 vaccine becomes available will you take it? Code 1, yes as soon as possible; code 2, yes, within a year. Question asked
of half of the sample. General population, 27-mkt avg, by hygiene level. For full details on how the Information Hygiene Scale was built, please refer to the Technical Appendix.
80
6569
62
88
72 70
7872 73
56
63
77 78
6167
59
4852
46
72
56 55
6357 59
42
49
65 67
50
57
21 17 16 16 16 15 15 15 14 14 14 1217 11 1011
Gap,
willingness
to vaccinatewithin a year
Those with poorinformation hygiene
Those with goodinformation hygiene
70
59
11pts
Global 27
16 countries with double-digit gaps

TECHNICAL APPENDIX

41
2021 EDELMAN TRUST BAROMETER
SAMPLE SIZE, QUOTAS AND MARGIN OF ERROR
General Population Informed Public
Sample Size* Quotas Set On** Margin of Error Sample Size* Quotas Set On*** Margin of Error
Global 31,050 Age, Gender, Region+/- 0.6% total sample
+/- 0.8% half sample6,000
Age, Education,
Gender
+/- 1.3% total sample
+/- 1.8% half sample
China and
U.S. 1,150 Age, Gender, Region
+/- 2.9% total sample
+/- 4.1% half sample500
Age, Education,
Gender
+/- 4.4% total sample
+/- 6.2% half sample
Nigeria 1,150 Age, Gender, Region+/- 2.9% total sample
+/- 4.1% half sample100
Age, Education,
Gender
+/- 9.8% total sample
+/- 13.9% half sample
All other
countries1,150 Age, Gender, Region
+/- 2.9% total sample
+/- 4.1% half sample200
Age, Education,
Gender
+/- 6.9% total sample
+/- 9.8% half sample
Some questions were asked of only half of the sample. Please refer to the footnotes on each slide for details.
For the general population, there were additional quotas on ethnicity in the UK and U.S., and on nationality in the UAE and Saudi Arabia.
For the informed public, there were additional quotas on nationality in the UAE and Saudi Arabia.
*
**
***
NOTE: Questions that afforded respondents the opportunity to criticize their government were not asked in China, Russia and Thailand.
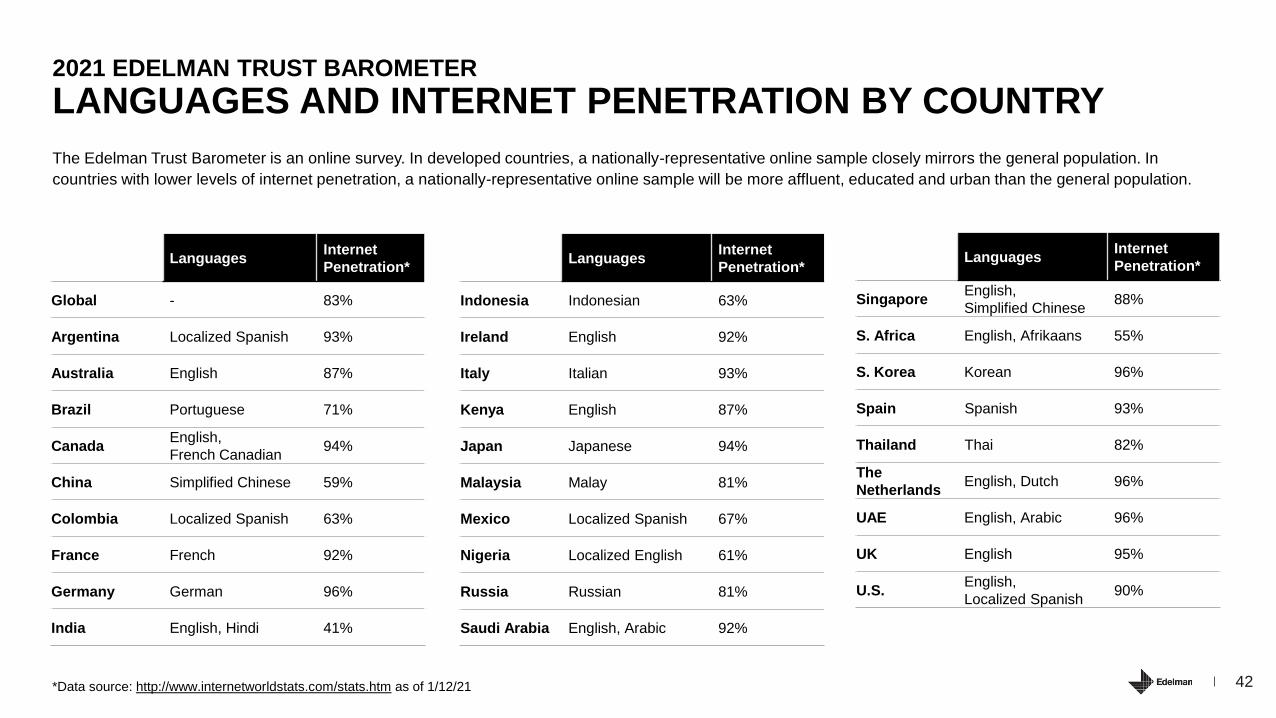
42
The Edelman Trust Barometer is an online survey. In developed countries, a nationally-representative online sample closely mirrors the general population. In
countries with lower levels of internet penetration, a nationally-representative online sample will be more affluent, educated and urban than the general population.
2021 EDELMAN TRUST BAROMETER
LANGUAGES AND INTERNET PENETRATION BY COUNTRY
LanguagesInternet
Penetration*
Global - 83%
Argentina Localized Spanish 93%
Australia English 87%
Brazil Portuguese 71%
CanadaEnglish,
French Canadian94%
China Simplified Chinese 59%
Colombia Localized Spanish 63%
France French 92%
Germany German 96%
India English, Hindi 41%
*Data source: http://www.internetworldstats.com/stats.htm as of 1/12/21
LanguagesInternet
Penetration*
Indonesia Indonesian 63%
Ireland English 92%
Italy Italian 93%
Kenya English 87%
Japan Japanese 94%
Malaysia Malay 81%
Mexico Localized Spanish 67%
Nigeria Localized English 61%
Russia Russian 81%
Saudi Arabia English, Arabic 92%
LanguagesInternet
Penetration*
SingaporeEnglish,
Simplified Chinese88%
S. Africa English, Afrikaans 55%
S. Korea Korean 96%
Spain Spanish 93%
Thailand Thai 82%
The
NetherlandsEnglish, Dutch 96%
UAE English, Arabic 96%
UK English 95%
U.S.English,
Localized Spanish90%

43
2021 EDELMAN TRUST BAROMETER
HOW WE MEASURED INFORMATION HYGIENE
1. News engagement (does one or more of these several times a week or more)
• “Read, view or listen to news and information produced by major news organizations or
publications at the original source” MED_SEG_OFTr1
• “Read news and information from major news organizations sent to me by others or pushed to
me on a news feed, social network platform or application” MED_SEG_OFTr2
• “Read, view or listen to news and information put out by major corporations regarding important
social and political issues and events” MED_SEG_OFTr16
• “Listen to podcasts or read newsletters or blog posts put out by independent individuals whom I
trust to keep me informed about important issues, but who do not work for a news media
company” MED_SEG_OFTr17
2. Avoiding information echo chambers (must say they do one or more of these)
• “How often do you read or listen to information or points of view from people, media sources or
organizations with whom you often disagree?” NEWS_DIS (weekly or more)
• “When someone you know sends you some information that supports a position that you do
NOT believe, which of the following do you typically do with it?” POS_DIS (study thoroughly)
3. Verify information (must say they do two or more of these)
• “Confirm that a news story is really true by looking across multiple information sources”
MED_SEG_OFTr15 (several times a week or more)
• “When someone you know sends you some information that supports a position you believe,
which of the following do you typically do with it?” POS_BEL (use fact-checking sites and/or
verify from people I know and/or go to original source material)
4. Do not amplify unvetted information (must never do this)
• “Pass on news and information to others without first checking its accuracy or the integrity of the
source” MED_SEG_OFTr18
To determine whether respondents practiced good
information hygiene, we measured four dimensions:
1. Regular engagement with news: Do they stay informed?
2. Engagement with differing points of view: Do they avoid
information echo chambers?
3. Information verification: Do they avoid assuming something
is true simply because it supports their point of view?
4. Avoids spreading misinformation: Do they check information
veracity before forwarding content to others?
Each respondent’s level of information hygiene was
categorized based on their performance across the four
dimensions:
• Good: Performs well on three or more dimensions
• Moderate: Performs well on any two dimensions
• Poor: Performs well on one or fewer dimensions

44
Respondents were asked:
In thinking about why you do or do not trust [INSTITUTION],
please specify where you think they fall on the scale
between the two opposing descriptions. (Please use the
slider to indicate where you think [INSTITUTION] falls
between the two extreme end points of each scale.)
2021 EDELMAN TRUST BAROMETER
HOW WE PLOTTED THE INSTITUTIONAL COMPETENCE AND ETHICS SCORES
The competence score (the x-axis of the plot): An institution’s competence score is a net of the top 3 box (AGREE) minus the bottom 3 box (DISAGREE) responses
to the question “To what extent do you agree with the following statement? [INSTITUTION] in general is good at what it does”. The resulting net score was then
subtracted by 50 so that the dividing line between more competent and less competent institutions crossed the y-axis at zero.
The net ethical score (the y-axis of the plot): The ethics dimension is defined by four separate items. For each item, a net score was calculated by taking the top 5
box percentage representing a positive ethical perception minus the bottom 5 box percentage representing a negative ethical perception. The y-axis value is an
average across those 4 net scores. Scores higher than zero indicate an institution that is perceived as ethical.
DIMENSION ETHICAL PERCEPTION UNETHICAL PERCEPTION
Purpose-Driven Highly effective agent of
positive change
Completely ineffective agent
of positive change
Honest Honest and fair Corrupt and biased
Vision Has a vision for the future
that I believe in
Does not have a vision for the
future that I believe in
Fairness Serves the interests of
everyone equally and fairly
Serves the interests of only
certain groups of people

45
2021 EDELMAN TRUST BAROMETER
HOW WE CALCULATED INCREASED LIKELIHOOD TO TRUST BUSINESS
Full list of behaviors examined (top 5 highlighted in bold)
1. Meeting your overall expectations for how they should be
responding to the health and public safety aspects of the
COVID-19 pandemic
2. Meeting your overall expectations for how they should be
responding to the economic consequences of the COVID-19
pandemic
3. Partnering with other organizations and societal institutions, even
if they might be competitors, to mount the strongest and most
effective responses possible to our societal challenges
4. Stepping in to fill leadership voids and policy gaps left by
government
5. Doing everything they can to ensure the safety and wellbeing of
our people and communities
6. Identifying and addressing systemic inequalities, unfair treatment,
and prejudices within society and in the business world
7. Shaping our culture for the better by inspiring positive change in
how we see and treat ourselves and each other
8. Developing new solutions to help address our country’s problems
9. Working to benefit their employees, customers, and local
community, in addition to their owners and shareholders
10. Putting people before profits
11. Being the guardian of information quality, working to ensure
that only true, verified information is being shared and
circulated
12. Driving the economic prosperity of our country
13. Working to ensure that our workers have the skills necessary to be
competitive in the global job market
14. Investing in the local communities where they are headquartered
or have large production facilities/offices
15. Taking a long-term perspective when making business
decisions versus focusing on short-term profits
16. Embracing sustainable practices across their business
Respondents were asked:
How well do you feel business is currently doing
each of the following? Please indicate your answer
using the 5-point scale below where 1 means the
institution is “failing at this” and 5 means the
institution is “doing this very well”.
Respondents were asked to evaluate the performance of business as an institution
against a variety of behavioral expectations. These performance scores were then
incorporated into a discrete choice analysis to determine which behaviors, if done
well, would provide the greatest boost to trust in business.
The top five performance drivers of trust, defined in terms of marginal effect on
likelihood to trust associated with doing that behavior well, are displayed on the
slide.

2021 EDELMAN TRUST BAROMETER TEAM
Edelman Intellectual Property
Executive Director Tonia E. Ries
Executive Advisors Richard Edelman
Kirsty Graham
Dave Samson
Global Marketing Vanessa Pymble
Mike Bush
Polly Mingledorff
Thom Holiday
Pamela Blandon
Executive Editor Nancy Jeffrey
VP of Operations Sarah Adkins
Sr. Project Manager Esther Choi
Project Coordinator Chloe Buckley
Design David Sookochoff
Brad Good
Edelman Data x Intelligence
Head of Thought
Leadership Research
David M. Bersoff, Ph.D.
Sr. Research Manager Cody Armstrong
Research Coordinators Nick Maxwell
Giuseppe Bovenzi
Abbey Fox
Data Processor John Zamites

47
Slide 14 Raging Infodemic Feeds MistrustA protester holds a placard during the Irish Freedom Party an anti-vaccination and anti-lockdown rally outside the Custom House, on day 39 of the nationwide Level 5 lockdown. On Saturday, November 28,
2020, in Dublin, Ireland: Artur Widak / NurPhoto via Getty Images
DIVIDER IMAGE CREDITS