2021 Annual Report - Building Long-term Wealth by Investing ...
95
Building Long-term Wealth by Investing in Private Companies Annual Report and Accounts 12 Months to 31 January 2021
-
Upload
khangminh22 -
Category
Documents
-
view
0 -
download
0
Transcript of 2021 Annual Report - Building Long-term Wealth by Investing ...

Building Long-term Wealth by Investing in Private CompaniesAnnual Report and Accounts 12 Months to 31 January 2021
Our PurposeHarbourVest Global Private Equity (“HVPE” or the “Company”) exists to provide easy access to a diversified global portfolio of high-quality private companies by investing in HarbourVest-managed funds, through which we help support innovation and growth in a responsible manner, creating value for all our stakeholders.
Investment ManagerOur Investment Manager, HarbourVest Partners,1 is an experienced and trusted global private markets asset manager. HVPE, through its investments in HarbourVest funds, helps to support innovation and growth in the global economy whilst seeking to promote improvement in environmental, social, and governance (“ESG”) standards.
Company OverviewHarbourVest Global Private Equity is a Guernsey incorporated, London listed, FTSE 250 Investment Company with assets of $2.9 billion and a market capitalisation of £1.5 billion as at 31 January 2021 (tickers: HVPE (£)/HVPD ($)). The Company provides access to investments in private companies and portfolios of private companies through funds managed by HarbourVest Partners (“HarbourVest” or the “Investment Manager”). Please see page 28 for more details on HarbourVest.
Focus and ApproachInvestment into private companies requires experience, skill, and expertise. Our focus is on building a comprehensive global portfolio of the highest-quality investments, in a proactive yet measured way, with the strength of our balance sheet underpinning everything we do.
Our multi-layered investment approach creates diversification, helping to spread risk, and is fundamental to our aim of creating a portfolio that no individual investor can replicate.
The ResultWe connect the everyday investor with a broad base of private markets experts. The result is a distinct single access point to HarbourVest Partners, and a prudently managed global private companies portfolio designed to navigate economic cycles as smoothly as possible whilst striving to deliver outperformance of the public markets over the long term.
Our Purpose in Detail
Where to find us:www.hvpe.com
1 Technically the Investment Manager of HVPE is HarbourVest Advisers L.P. which is an affiliate of HarbourVest Partners, LLC. However, we will refer to the Investment Manager as “HarbourVest Partners” throughout the report, being the firm’s recognised name.
Investment ObjectiveThe Company’s investment objective is to generate superior shareholder returns through long-term capital appreciation by investing primarily in a diversified portfolio of private markets investments.

Our Year in Numbers
Net Asset Value (“NAV”) per Share ($)
$35.9731 January 2020: $27.58
NAV per Share Growth ($)
+30.4%Year to 31 January 2020: +14.5%
Annualised Outperformance of Public Markets Since Inception ($)1
+4.0%Year to 31 January 2020: +3.4%
Share Price (£)
£18.7031 January 2020: £18.36
Share Price Growth (£)
+1.9%Year to 31 January 2020: +28.8%
Net Assets ($)
$2.9bn 31 January 2020: $2.2bn
Share Price Discount to Net Assets (£)2
-18.6%31 January 2020: -9.9%
Total New Commitments ($)
$194.9mYear to 31 January 2020: $570.0m
Net Investment ($)
$141.4m Year to 31 January 2020: $16.0m
Year to, or at, 31 January 2021 unless otherwise stated.
1 Inception is 2007. Public market benchmark is the FTSE All World Total Return Index.
2 The discount is calculated based on the NAV per share available to the market at the financial year end, that being the 31 December estimates, converted to sterling at the prevailing USD/GBP foreign exchange (“FX”) rate, compared with the share prices on 31 January 2021 and 2020. Please refer to the Alternative Performance Measures (“APMs”) on pages 87 to 89 for calculations.
Strategic Report1 Our Year in Numbers 2 KPIs and Investment Objective 4 Chair’s Statement and
First Impressions8 Business Model10 Investment Manager’s Report 16 Recent Events 17 Manager Q&A 19 Summary of Net Assets20 Stakeholder Engagement21 Section 172 Statement22 Managing the Balance Sheet 24 Managing Costs 26 Principal Risks and Uncertainties
Supporting Information28 About HarbourVest30 Our Value Creation Cycle31 The Phases34 Manager Spotlight36 Top Ten Direct Companies
Governance Report40 Board of Directors42 Directors’ Report49 Board Structure and Committees57 Directors’ Remuneration Report58 Statement of Compliance with the
AIC Code of Corporate Governance
Independent Auditor’s Reports60 Independent Auditor’s Report to the
Members of HarbourVest Global Private Equity Limited
66 Independent Auditor’s Report to the Directors of HarbourVest Global Private Equity Limited
Financial Statements67 Audited Consolidated
Financial Statements71 Consolidated Schedule of Investments75 Notes to Consolidated Financial
Statements
Supplementary84 Glossary of Private Market Terms87 Alternative Performance Measures90 Disclosures 92 Key Information
Share Price TradingHVPE has a single share class, which is quoted on the London Stock Exchange (“LSE”) in both sterling (ticker: HVPE) and US dollars (ticker: HVPD). The sterling quote has been in place since 9 September 2015, while the US dollar quote was introduced on 10 December 2018. HVPE has a US dollar-denominated NAV. The chart on the right-hand side shows the US dollar NAV per share converted into sterling at the prevailing daily FX rate.
Share price NAV
31 Jan2016
31 Jan2015
31 Jan2017
31 Jan2018
31 Jan2019
21 May2021
31 Jan2020
£0.00
£5.00
£10.00
£25.00
£20.00
£15.00
£8.71
£11.95 £12.52£14.26
£20.40£11.76
£8.47
£10.53
£14.68 £15.12£18.38
£18.36
£20.88£25.89
HVPE Annual Report and Accounts 2021 1
ST
RA
TE
GIC
RE
PO
RT
GO
VE
RN
AN
CE
RE
PO
RT
FIN
AN
CIA
L S
TAT
EM
EN
TS
SU
PP
LE
ME
NTA
RY
KPIs and Investment ObjectiveThe Company’s investment objective is to generate superior shareholder returns through long-term capital appreciation by investing primarily in a diversified portfolio of private markets investments.
KPIs Commentary
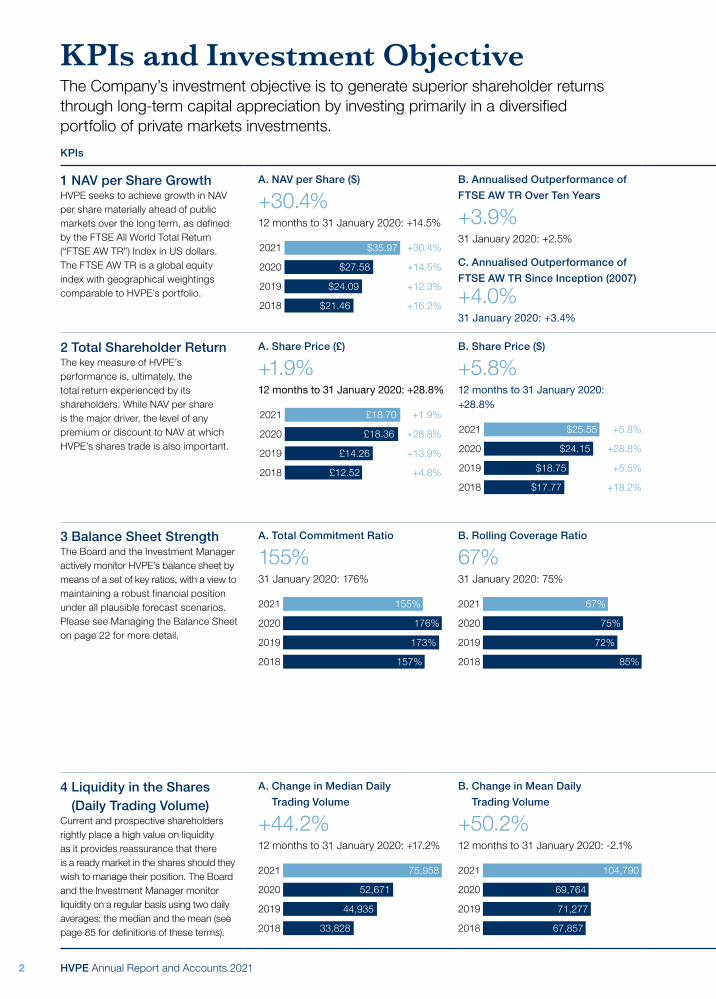
1 NAV per Share Growth HVPE seeks to achieve growth in NAV per share materially ahead of public markets over the long term, as defined by the FTSE All World Total Return (“FTSE AW TR”) Index in US dollars. The FTSE AW TR is a global equity index with geographical weightings comparable to HVPE’s portfolio.
A. NAV per Share ($)
+30.4%12 months to 31 January 2020: +14.5%
0.0 35.9
2021
2020
2019
2018
$35.97
$27.58
$24.09
$21.46
+30.4%
+14.5%
+12.3%
+16.2%
B. Annualised Outperformance of
FTSE AW TR Over Ten Years
+3.9%31 January 2020: +2.5%
C. Annualised Outperformance of
FTSE AW TR Since Inception (2007)
+4.0%31 January 2020: +3.4%
In the 12 months to 31 January 2021, HVPE outperformed the FTSE AW TR Index by 13.0%. However, over shorter time periods, the nature and timing of HVPE’s valuation process and the relative volatility of public markets can result in significant divergence from the FTSE AW TR Index in either direction, as demonstrated in prior years. In the preceding three financial years (2018 to 2020), performance relative to the FTSE AW TR Index has ranged from +19.3% to -12.0%. Looking at longer time horizons, over the last ten years and since inception, HVPE has outperformed the FTSE AW TR Index by 3.9% and 4.0%, respectively, on an annualised basis. Please refer to the Alternative Performance Measures on page 88 for these calculations. Further detail on the performance of HVPE’s NAV per share over the financial year can be found in the Investment Manager’s Report on pages 10 and 11.
2 Total Shareholder Return The key measure of HVPE’s performance is, ultimately, the total return experienced by its shareholders. While NAV per share is the major driver, the level of any premium or discount to NAV at which HVPE’s shares trade is also important.
A. Share Price (£)
+1.9%12 months to 31 January 2020: +28.8%
0.0 18.7
2021
2020
2019
2018
£18.70
£18.36
£14.26
£12.52
+1.9%
+28.8%
+13.9%
+4.8%
B. Share Price ($)
+5.8%12 months to 31 January 2020: +28.8%
0.00 25.55
2021
2020
2019
2018
+5.8%
+28.8%
+5.5%
+18.2%
$25.55
$24.15
$18.75
$17.77
Approximately 70% of HVPE’s shareholders are UK based, and the majority of trading volume is in sterling. The Total Shareholder Return in sterling is therefore an important figure. Despite the broad public market sell-off at the end of Q1 2020 following the onset of the COVID-19 pandemic (“COVID-19” or the “pandemic”), HVPE’s sterling price made a strong V-shaped recovery following its March 2020 nadir and increased by 1.9% over the financial year. The US dollar quote produced a 5.8% return over the same period. However, unlike the NAV per share which outperformed the FTSE AW TR Index by 13.0% over the financial year, the US dollar share price lagged the public market benchmark by 11.6% over the same period. In the preceding three financial years (2018 to 2020), the US dollar share price performance relative to the FTSE AW TR Index has ranged from +12.6% to -9.9%. Since 31 January 2021, HVPE’s share price has rebounded further, and at 21 May was trading at £20.40. This now represents an increase of approximately 360% over the last ten years.
The marginal share price growth against the larger NAV per share increase resulted in a significant widening of the discount1 over the reporting period from 9.9% at 31 January 2020 to 18.6% at 31 January 2021. Details of these calculations and other theoretical discounts can be found on page 87.
3 Balance Sheet Strength The Board and the Investment Manager actively monitor HVPE’s balance sheet by means of a set of key ratios, with a view to maintaining a robust financial position under all plausible forecast scenarios. Please see Managing the Balance Sheet on page 22 for more detail.
A. Total Commitment Ratio
155%31 January 2020: 176%
0 176
155%
176%
173%
157%
2021
2020
2019
2018
B. Rolling Coverage Ratio
67%31 January 2020: 75%
0 85
67%
75%
72%
85%
2021
2020
2019
2018
The Total Commitment Ratio as described on page 23 decreased in the 12 months ended 31 January 2021 as a result of a pause in new commitments during the period, combined with an increase in NAV. The ratio remains substantially below the upper limit set by the Board. The Rolling Coverage Ratio as described on page 23 also decreased due to a reduction in the cash balance and a downward adjustment to the next 12 months’ estimated realisations.
HVPE aims to be fully invested and to minimise the amount of cash held on the balance sheet. However, at times HVPE may build up cash on the balance sheet or sit in a net debt position depending on overall private equity cash flow cycles. The credit facility is utilised when required to bridge periods of negative cash flow. At the end of the financial year, HVPE had cash and cash equivalents of $98.4 million on the balance sheet, and the credit facility was $120.0 million drawn. The resulting net debt position of $21.6 million represented 0.8% as a percentage of NAV. This contrasts with a net cash position of 5.9% of NAV in the prior financial year. Net cash had been trending downwards from 31 January 2018, when the figure stood at 15.0%.
HarbourVest fund-level borrowing predominantly represents unfunded commitments that have yet to be called; the underlying HarbourVest funds have invested this capital using subscription credit lines and will call this capital over time. As at 31 January 2021, HarbourVest fund-level borrowing as a percentage of NAV was 13.2%, having fallen from 16.7% of NAV in the prior financial year. This is the lowest it has been since we first published this figure in 2018, at which point it stood at 13.9% of NAV. Prospective changes in fund-level borrowing are factored into HVPE’s cash flow modelling and scenario testing as presented regularly to the Board. For more detail on HarbourVest fund-level borrowing please refer to page 22.
4 Liquidity in the Shares (Daily Trading Volume)
Current and prospective shareholders rightly place a high value on liquidity as it provides reassurance that there is a ready market in the shares should they wish to manage their position. The Board and the Investment Manager monitor liquidity on a regular basis using two daily averages: the median and the mean (see page 85 for definitions of these terms).
A. Change in Median Daily
Trading Volume
+44.2%12 months to 31 January 2020: +17.2%
0.000 75.958
75,958
52,671
44,935
33,828
2021
2020
2019
2018
B. Change in Mean Daily
Trading Volume
+50.2%12 months to 31 January 2020: -2.1%
0.00 104.79
104,790
69,764
71,277
67,857
2021
2020
2019
2018
Daily liquidity, measured by median share trading volume, rose considerably in the 12 months to 31 January 2021 and stands at a multi-year high in terms of the median average. The median is the figure used by FTSE Russell for index assessment purposes. The mean daily trading volume also increased substantially over the period. The large uplift in share trading activity may be explained in part by the significant market volatility during the year.
HVPE Annual Report and Accounts 20212

HVPE uses a number of Key Performance Indicators (“KPIs”) that seek to support its investment objective. Figures labelled “2021” represent a position as at 31 January 2021 or movement in the 12 months ended 31 January 2021. Further commentary beyond the reporting date on the NAV per share and share price can be found under Recent Events on page 16.
KPIs Commentary
1 NAV per Share Growth HVPE seeks to achieve growth in NAV per share materially ahead of public markets over the long term, as defined by the FTSE All World Total Return (“FTSE AW TR”) Index in US dollars. The FTSE AW TR is a global equity index with geographical weightings comparable to HVPE’s portfolio.
A. NAV per Share ($)
+30.4%12 months to 31 January 2020: +14.5%
0.0 35.9
2021
2020
2019
2018
$35.97
$27.58
$24.09
$21.46
+30.4%
+14.5%
+12.3%
+16.2%
B. Annualised Outperformance of
FTSE AW TR Over Ten Years
+3.9%31 January 2020: +2.5%
C. Annualised Outperformance of
FTSE AW TR Since Inception (2007)
+4.0%31 January 2020: +3.4%
In the 12 months to 31 January 2021, HVPE outperformed the FTSE AW TR Index by 13.0%. However, over shorter time periods, the nature and timing of HVPE’s valuation process and the relative volatility of public markets can result in significant divergence from the FTSE AW TR Index in either direction, as demonstrated in prior years. In the preceding three financial years (2018 to 2020), performance relative to the FTSE AW TR Index has ranged from +19.3% to -12.0%. Looking at longer time horizons, over the last ten years and since inception, HVPE has outperformed the FTSE AW TR Index by 3.9% and 4.0%, respectively, on an annualised basis. Please refer to the Alternative Performance Measures on page 88 for these calculations. Further detail on the performance of HVPE’s NAV per share over the financial year can be found in the Investment Manager’s Report on pages 10 and 11.
2 Total Shareholder Return The key measure of HVPE’s performance is, ultimately, the total return experienced by its shareholders. While NAV per share is the major driver, the level of any premium or discount to NAV at which HVPE’s shares trade is also important.
A. Share Price (£)
+1.9%12 months to 31 January 2020: +28.8%
0.0 18.7
2021
2020
2019
2018
£18.70
£18.36
£14.26
£12.52
+1.9%
+28.8%
+13.9%
+4.8%
B. Share Price ($)
+5.8%12 months to 31 January 2020: +28.8%
0.00 25.55
2021
2020
2019
2018
+5.8%
+28.8%
+5.5%
+18.2%
$25.55
$24.15
$18.75
$17.77
Approximately 70% of HVPE’s shareholders are UK based, and the majority of trading volume is in sterling. The Total Shareholder Return in sterling is therefore an important figure. Despite the broad public market sell-off at the end of Q1 2020 following the onset of the COVID-19 pandemic (“COVID-19” or the “pandemic”), HVPE’s sterling price made a strong V-shaped recovery following its March 2020 nadir and increased by 1.9% over the financial year. The US dollar quote produced a 5.8% return over the same period. However, unlike the NAV per share which outperformed the FTSE AW TR Index by 13.0% over the financial year, the US dollar share price lagged the public market benchmark by 11.6% over the same period. In the preceding three financial years (2018 to 2020), the US dollar share price performance relative to the FTSE AW TR Index has ranged from +12.6% to -9.9%. Since 31 January 2021, HVPE’s share price has rebounded further, and at 21 May was trading at £20.40. This now represents an increase of approximately 360% over the last ten years.
The marginal share price growth against the larger NAV per share increase resulted in a significant widening of the discount1 over the reporting period from 9.9% at 31 January 2020 to 18.6% at 31 January 2021. Details of these calculations and other theoretical discounts can be found on page 87.
3 Balance Sheet Strength The Board and the Investment Manager actively monitor HVPE’s balance sheet by means of a set of key ratios, with a view to maintaining a robust financial position under all plausible forecast scenarios. Please see Managing the Balance Sheet on page 22 for more detail.
A. Total Commitment Ratio
155%31 January 2020: 176%
0 176
155%
176%
173%
157%
2021
2020
2019
2018
B. Rolling Coverage Ratio
67%31 January 2020: 75%
0 85
67%
75%
72%
85%
2021
2020
2019
2018
The Total Commitment Ratio as described on page 23 decreased in the 12 months ended 31 January 2021 as a result of a pause in new commitments during the period, combined with an increase in NAV. The ratio remains substantially below the upper limit set by the Board. The Rolling Coverage Ratio as described on page 23 also decreased due to a reduction in the cash balance and a downward adjustment to the next 12 months’ estimated realisations.
HVPE aims to be fully invested and to minimise the amount of cash held on the balance sheet. However, at times HVPE may build up cash on the balance sheet or sit in a net debt position depending on overall private equity cash flow cycles. The credit facility is utilised when required to bridge periods of negative cash flow. At the end of the financial year, HVPE had cash and cash equivalents of $98.4 million on the balance sheet, and the credit facility was $120.0 million drawn. The resulting net debt position of $21.6 million represented 0.8% as a percentage of NAV. This contrasts with a net cash position of 5.9% of NAV in the prior financial year. Net cash had been trending downwards from 31 January 2018, when the figure stood at 15.0%.
HarbourVest fund-level borrowing predominantly represents unfunded commitments that have yet to be called; the underlying HarbourVest funds have invested this capital using subscription credit lines and will call this capital over time. As at 31 January 2021, HarbourVest fund-level borrowing as a percentage of NAV was 13.2%, having fallen from 16.7% of NAV in the prior financial year. This is the lowest it has been since we first published this figure in 2018, at which point it stood at 13.9% of NAV. Prospective changes in fund-level borrowing are factored into HVPE’s cash flow modelling and scenario testing as presented regularly to the Board. For more detail on HarbourVest fund-level borrowing please refer to page 22.
4 Liquidity in the Shares (Daily Trading Volume)
Current and prospective shareholders rightly place a high value on liquidity as it provides reassurance that there is a ready market in the shares should they wish to manage their position. The Board and the Investment Manager monitor liquidity on a regular basis using two daily averages: the median and the mean (see page 85 for definitions of these terms).
A. Change in Median Daily
Trading Volume
+44.2%12 months to 31 January 2020: +17.2%
0.000 75.958
75,958
52,671
44,935
33,828
2021
2020
2019
2018
B. Change in Mean Daily
Trading Volume
+50.2%12 months to 31 January 2020: -2.1%
0.00 104.79
104,790
69,764
71,277
67,857
2021
2020
2019
2018
Daily liquidity, measured by median share trading volume, rose considerably in the 12 months to 31 January 2021 and stands at a multi-year high in terms of the median average. The median is the figure used by FTSE Russell for index assessment purposes. The mean daily trading volume also increased substantially over the period. The large uplift in share trading activity may be explained in part by the significant market volatility during the year.
1 The discount of 18.6% is calculated based on the NAV per share available to the market at 31 January 2021, that being the 31 December 2020 estimate of $31.47 (sterling equivalent of £22.96 when converted at the prevailing USD/GBP exchange rate of 0.7296 at 31 January 2021), compared with the share price of £18.70 on 31 January 2021.
HVPE Annual Report and Accounts 2021 3
ST
RA
TE
GIC
RE
PO
RT
GO
VE
RN
AN
CE
RE
PO
RT
FIN
AN
CIA
L S
TAT
EM
EN
TS
SU
PP
LE
ME
NTA
RY

“ I believe that private equity as an asset class will continue to thrive, further displacing public equity as a more dynamic source of returns for investors.”Read more about Ed Warner’s first impressions as Chair on page 7.
Chair’s Statement
+30.4%NAV per Share Growth ($)
+4.0%Annualised Outperformance of FTSE AW TR Since Inception (2007)
Dear ShareholderI am pleased to report that HVPE has delivered a NAV per share increase of 30.4% over the financial year – the largest 12-month increase in HVPE’s 13-year history. I reflect here on how HVPE has been able to deliver this extraordinary growth through a period of heightened market volatility and widespread disruption to the business environment, mindful also of the challenges that still lie ahead for the global economy and society at large.
Financial PerformanceWhile NAV per share finished the financial year strongly ahead, on a monthly basis performance fluctuated more than usual. Valuations declined in the early stages of COVID-19, but a strong rebound in the middle of the year recovered all of these losses. From this point, NAV per share continued to climb with a particularly strong gain in the final quarter. This resulted in a year-end NAV per share of $35.97 (31 January 2020: $27.58); equivalent to more than three-and-a-half times the opening value of $10.00 in December 2007.
Portfolio performance and the key drivers of this growth are covered in detail in the Investment Manager’s Report on pages 10 to 15. However, I am keen to remark on the resilience of the portfolio, which I believe is testament both to HVPE’s strategy and to the quality of the Investment Manager. Our steadfast, consistent approach to investing, and our Manager’s dedication to driving strong growth from a globally diversified private markets portfolio, continues to deliver outperformance for HVPE’s shareholders. We believe it is HVPE’s broadly spread, high-quality exposure to opportunities worldwide which has supported robust NAV per share growth over the last year and over the much longer term.
COVID-19 Timeline of Actions
April–May
April – Credit Facility $200 million drawdown to fund anticipated capital calls
April – Portfolio Risk Assessment I
May – Commitment Plan Temporarily placed on hold
HVPE Annual Report and Accounts 20214

Another core driver of performance has been HVPE’s 36% weighting to growth equity and venture companies, in particular the overweight exposure to the technology sector. There have been a number of large and high-profile Initial Public Offerings (“IPOs”) in the period, the aggregation of which contributed markedly to overall returns. HVPE has now outperformed the FTSE AW TR Index on an annualised basis by 4.0% since inception.
Despite this robust long-term NAV per share performance, it is important to acknowledge the volatility in our share price during the year. The pandemic-driven global sell-off in March 2020 drove the share prices of most investment companies sharply lower. The dedicated HVPE team at HarbourVest moved quickly to reassure us that our financial position remained robust and that there was no HVPE-specific issue driving the share price movement. I am pleased to say that the majority of our shareholders held firm and continued to support HVPE, helping the share price rebound sharply to reach a new all-time high in December. While it ended the financial year at £18.70, the share price has since continued to increase and on the 21 May closed at £20.40 – more than double its level of only five years ago.
Response to COVID-19As reported in my last statement, the Board worked closely with the Investment Manager to understand the potential impact of the pandemic on our underlying investments, and acted swiftly to assess any implications for the balance sheet. The insight gleaned from a thorough portfolio risk assessment, coupled with updated financial and NAV growth projections, fed into a set of updated forecast scenarios which are described on page 12.
As a prudent measure given the prevailing cash flow uncertainty, the Board drew down $200 million on its credit facility in April 2020. At the same time, the Investment Manager temporarily paused commitments to new HarbourVest funds. With careful consideration, the Board subsequently agreed to participate in an attractive secondary co-investment through its existing commitment to a secondary overflow fund. As cash flows stabilised, $80 million was repaid on the facility in July. Please refer to the timeline below to see the actions taken by the Board and Investment Manager during this period. The outcome for the full year has demonstrated that HVPE was well positioned strategically, and had the appropriate financial provisions in place, to see it through these turbulent times.
Balance SheetCareful balance sheet management is critical for a closed-ended vehicle with variable portfolio cash flows and a multi-year investment horizon. We took the necessary steps through the year to ensure the balance sheet could withstand any pressure from unusual cash flow patterns brought on by the pandemic. HVPE ended the year with $98.4 million of cash and cash equivalents. Noting the drawn balance on the credit facility of $120 million at 31 January 2021, this equates to a net debt position of $21.6 million, with $480 million remaining available on the facility.
June–August September–December
June – Opportunistic Commitment Secondary transaction
October – Portfolio Risk Assessment II
July – Credit Facility The Board approved an $80 million partial repayment
December – Commitment Plan Re-commenced
HVPE Annual Report and Accounts 2021 5
ST
RA
TE
GIC
RE
PO
RT
GO
VE
RN
AN
CE
RE
PO
RT
FIN
AN
CIA
L S
TAT
EM
EN
TS
SU
PP
LE
ME
NTA
RY

Chair’s Statement continued
Period Post Year End
Financial PerformanceSince the year end, HVPE has issued four NAV per share updates. The latest, published on 21 May, reported an estimated NAV per share of $36.62, an uplift of 1.8% from 31 January 2021, largely driven by increases in the publicly held companies within the portfolio. Further detail can be found under Recent Events on page 16.
Corporate Governance and Board ChangesThe Board is alive to the fact that strong corporate governance supports the smooth running of HVPE, whilst ensuring the highest possible standards for its stakeholders. To help fulfil our duties in this regard, the Board initiated the search for our first dedicated HVPE Head of Corporate Governance and duly appointed Alexandra Cornforth in April 2020.
The Board also maintains a robust succession planning programme to ensure Directors hold the necessary balance of skills to deliver the best stewardship of the assets for HVPE’s shareholders. As part of this process, I am pleased to announce the appointment of Ms Libby Burne, who joined the Board as an independent non-executive Director with effect from 1 March 2021. Libby brings with her 20 years’ experience with PwC and we welcome her to the Board in her first listed non-executive directorship. Libby replaces Andrew Moore, who will step down at the Annual General Meeting (“AGM”) in July. Andrew has provided excellent service to HVPE since its launch and he leaves with our gratitude and very best wishes.
The Board and ESGIt is with heightened focus that we consider all matters ESG at three levels: the Board, HarbourVest and investee companies. We are dedicated to promoting the highest standards which we believe foster higher-quality investments and improved returns. This year the Board has helped drive the ESG agenda and, with Carolina Espinal’s efforts as the HVPE Director responsible for ESG matters, further increased engagement levels with HarbourVest. In addition, we have formulated our approach to ESG, and are pleased to describe this in more detail on pages 44 and 45. We remain impressed by the persistent efforts by the Investment Manager in the pursuit of continuous improvement in ESG standards at the firm level and within the private equity managers with whom it invests on HVPE’s behalf. Details can be found on pages 13 to 15.
Annual General Meeting and Shareholder WebcastHVPE’s AGM will be held in Guernsey at 1.00 p.m. BST on 21 July 2021. Formal notice will be sent to registered shareholders in the week commencing 21 June 2021. Given ongoing travel restrictions on account of COVID-19, no Director other than the Guernsey residents Mr Moore and Ms Burne will be present in person. We hope that all registered shareholders will exercise their votes by proxy. Except for Mr Moore who will be stepping down at this AGM, all Directors will submit themselves for re-election. Similar to last year, in advance of the formal AGM, HVPE will hold a webcast on 10 June 2021 at 11.00 a.m. BST. Shareholders should contact HVPE at: [email protected] should they wish to participate.
OutlookAs we reflect just over one year on from the onset of the COVID-19 crisis, we cannot escape the magnitude of the situation we are all living through. Businesses have been challenged and pushed in new directions more rapidly than ever before; some have struggled while others have thrived. From an investment perspective, this year has reaffirmed the effectiveness of HVPE’s strategy. With renewed conviction we can herald the power of diversification and further demonstrate the benefits of investing with a high-calibre private markets manager. Our structure has enabled, through the existing uncalled commitments to HarbourVest funds, a steady pace of investment through the crisis. We thank shareholders, old and new, who have supported us through the challenging times experienced in 2020.
We look forward with cautious optimism, confident that HVPE is well placed to deliver a long-term private markets solution to many investors otherwise unable to access such high-quality and exciting private companies.
Ed Warner27 May 2021
HVPE Annual Report and Accounts 20216

Q. What were the Company’s key achievements in the last financial year to date? Our rapid yet well-considered response to
COVID-19 was certainly a key achievement. We took decisive steps at the onset of the crisis to safeguard the balance sheet as we headed into uncharted territory, working closely with HarbourVest to understand the portfolio impact. The progress that HVPE has made over the last year, delivering strong returns in an environment of widespread volatility and disruption, is a source of some pride. HVPE’s impressive NAV performance is testament to the merits of a well-established long-term investment strategy, the actions taken by both the Board and the Investment Manager to ensure that the Company was able to maintain its strong financial position, and the enduring quality of HarbourVest as a business. The Board has also made good headway on developing its approach to ESG; we know how important this is and I am pleased that we now have our own ESG policy.
Q. What do you think differentiates HVPE?In the listed private equity sector, HVPE stands apart for the sheer breadth and depth of the
private markets opportunity harnessed by the Investment Manager on behalf of our shareholders. The events of the last year have cast the virtues of HVPE’s structure into sharp relief. A steady pace of investment, even through downturns, is an inherent feature of the model, thanks to the presence of a large and diverse investment pipeline providing continuous exposure to the HarbourVest funds and, in turn, a host of high-quality underlying private markets managers. Simply put, HVPE democratises access to the broad HarbourVest platform, with global exposure across the firm’s core strategies. In the year just ended, a particular highlight has been the venture capital portfolio, from which have sprung a number of value-accretive IPOs. As we move forward, we may see other segments of the portfolio emerge as key growth drivers, thanks to the benefits of HVPE’s broad diversification.
Q. You have recently appointed a new member to the Board, Libby Burne. What do you hope she can bring to the role?
Effective succession planning is critical for any Board in order to keep challenging the status quo and to ensure that the aggregate skillset among Directors continues to deliver the best standard of governance for the Company’s stakeholders. We were excited to offer Libby her first listed non-executive directorship: not only does she have current recent executive experience from a well-regarded audit firm, she also brings with her a fresh perspective and a high level of engagement with the role.
Q. What are your views on the listed private equity sector and private equity in general?Despite much of the sector delivering continued
strong performance, listed private equity seems to be unfairly neglected by many investors. There remains something of a “hangover” from the Global Financial Crisis (“GFC”). It is a real shame that the sector still seems to be misunderstood by some. Listed private equity opens the door to an asset class that has long been the domain of large institutions that are able to access opportunities through private funds. While many investors drift ever further in the direction of passive funds, private equity is one of the most active forms of management available, with the potential to deliver material outperformance of the public market indices over the long term. Furthermore, private equity as an industry continually evolves and, as we have seen in the last year, responds well in times of crisis. The best managers are agile and adapt well to challenging situations, supporting their portfolio companies and engaging closely with management to drive value. I believe that private equity as an asset class will continue to thrive, further displacing public equity as a more dynamic source of returns for investors.
Q. Where do you see potential for HVPE in the near term?Over the 13 years since launch, HVPE’s long-term investment strategy has been tested
repeatedly and, in my view, has passed with flying colours. We have conviction in our asset allocation and our approach to investing through the HarbourVest funds. That said, we will continue to refine and optimise our model, and persistently challenge settled assumptions to ensure that HVPE is still delivering. We would love to close the discount and eventually raise more capital, like many newer players accessing similar opportunities have been able to do.
First Impressions Q&A with the Chair
HVPE Annual Report and Accounts 2021 7
ST
RA
TE
GIC
RE
PO
RT
GO
VE
RN
AN
CE
RE
PO
RT
FIN
AN
CIA
L S
TAT
EM
EN
TS
SU
PP
LE
ME
NTA
RY

Business ModelCreating Value at Every Level of our Business
Key Strengths and Sources of Value
Active Balance Sheet ManagementHVPE maintains a prudent approach to balance sheet management and invests within a set of defined financial ratios with the aim of ensuring that there is sufficient cash or credit available to meet its commitments, whilst also striving to avoid an excessive build-up of cash on the balance sheet.
Strategic Asset Allocation (“SAA”) HVPE takes a long-term view in building and maintaining its portfolio, working to a set of rolling five-year portfolio construction targets aimed at optimising long-term NAV growth. See page 13 for more details.
Investment in and Alongside HarbourVest FundsHarbourVest, the Investment Manager, is an independent, global private markets investment specialist, with over 35 years of experience and more than $76 billion of assets under management as at 31 March 2021.
Investment into Private CompaniesHVPE provides a complete private markets solution for public investors by actively managing the Investment Portfolio through four key phases of the private equity cycle: Commitment, Investment, Growth, and Maturity. The Company’s approach is to make future commitments to ensure continuous investment through the cycle.
Selectively Diversified Investment PortfolioResearch indicates that the dispersion of returns in private markets investing is greater than that typically observed in public equity portfolios.1 In some strategies, notably venture investing, HabourVest observes that a small number of funds deliver returns dramatically in excess of the median. This means that diversification across multiple funds and investments is critically important for optimising risk-adjusted returns. By following its SAA targets, HVPE has built a well-diversified portfolio as shown in the diagram below.
Multi-manager ApproachEffectively, HVPE provides exposure to approximately 30 individual HarbourVest fund managers, each expert in their strategy. Furthermore, within the HarbourVest fund-of-funds programmes, careful selection gives distinct exposure to many leading, or hard to access, external private equity managers, providing a broad spread of private markets expertise.
Profitable Realisations Grow NAV per Share and Become the Firepower for Future InvestmentsHVPE, in effect, provides part-ownership of a broad range of underlying private companies, spanning early stage to more mature businesses. It is the success of these which drives returns. HVPE is committed to delivering material long-term outperformance in NAV per share as compared with public markets. Ultimately, this is locked in via strong realisations, the proceeds of which are then reinvested into new private markets opportunities.
ESG Embedded in the HarbourVest Investment ProcessHarbourVest is driven by the belief that strong financial returns and positive social change can be accomplished in tandem. As such, it is committed to integrating ESG considerations into all stages of its investment activity. ESG-related risks are identified and taken into consideration as an integral part of its due diligence process, so that company-specific, broader manager-level, sector-level, and regional risks can be considered when reviewing investment opportunities.
Creating Value at Every Level of our Business
A strong balance sheet is vital in underpinning investment into private market funds given the cash flow profile of these investments. HVPE’s substantial credit facility gives it the flexibility to continue to invest at times when others may be unable to do so. Informed asset allocation and a steady, considered pace of investment through the cycle help to minimise volatility whilst providing broad diversification to help drive NAV performance over the long term.
HarbourVest’s global presence and deep network of longstanding relationships within private markets, as well as its integrated investment platform, have underpinned its consistent outperformance and helped to position it as a favoured investment partner. HVPE provides access to a broad range of private company investments mostly not available to all investors. These span all phases of the lifecycle, giving continued exposure to new, developing, and maturing investments.
The multi-manager approach adds value as there is less reliance on one key person to make investment decisions. The identification and assessment of these managers is key to HVPE’s value creation. Furthermore, no single external manager represents more than 3.0% of the underlying portfolio, which helps mitigate investment risk in a complex and demanding market. A well-diversified portfolio ensures that the downside risk arising from any single investment, geography, or strategy is limited, whilst offering the potential for consistent gains over time.
Value is generated for shareholders through growing NAV per share, with the share price broadly tracking this figure over time. HVPE has delivered 12 consecutive years of positive annual NAV returns. New investments are primarily funded by distributions from realised investments, enabling the cycle to continue over the long term. HVPE has established itself as one of the most highly diversified listed private equity companies with the scale and liquidity to appeal to a wide range of investors.
Investment Phase
Mature Phase
Growth Phase
HVPE Board and Investment
Manager
Commitment Phase
See pages 30 to 33
HVPE Annual Report and Accounts 20218

Key Strengths and Sources of Value
Active Balance Sheet ManagementHVPE maintains a prudent approach to balance sheet management and invests within a set of defined financial ratios with the aim of ensuring that there is sufficient cash or credit available to meet its commitments, whilst also striving to avoid an excessive build-up of cash on the balance sheet.
Strategic Asset Allocation (“SAA”) HVPE takes a long-term view in building and maintaining its portfolio, working to a set of rolling five-year portfolio construction targets aimed at optimising long-term NAV growth. See page 13 for more details.
Investment in and Alongside HarbourVest FundsHarbourVest, the Investment Manager, is an independent, global private markets investment specialist, with over 35 years of experience and more than $76 billion of assets under management as at 31 March 2021.
Investment into Private CompaniesHVPE provides a complete private markets solution for public investors by actively managing the Investment Portfolio through four key phases of the private equity cycle: Commitment, Investment, Growth, and Maturity. The Company’s approach is to make future commitments to ensure continuous investment through the cycle.
Selectively Diversified Investment PortfolioResearch indicates that the dispersion of returns in private markets investing is greater than that typically observed in public equity portfolios.1 In some strategies, notably venture investing, HabourVest observes that a small number of funds deliver returns dramatically in excess of the median. This means that diversification across multiple funds and investments is critically important for optimising risk-adjusted returns. By following its SAA targets, HVPE has built a well-diversified portfolio as shown in the diagram below.
Multi-manager ApproachEffectively, HVPE provides exposure to approximately 30 individual HarbourVest fund managers, each expert in their strategy. Furthermore, within the HarbourVest fund-of-funds programmes, careful selection gives distinct exposure to many leading, or hard to access, external private equity managers, providing a broad spread of private markets expertise.
Profitable Realisations Grow NAV per Share and Become the Firepower for Future InvestmentsHVPE, in effect, provides part-ownership of a broad range of underlying private companies, spanning early stage to more mature businesses. It is the success of these which drives returns. HVPE is committed to delivering material long-term outperformance in NAV per share as compared with public markets. Ultimately, this is locked in via strong realisations, the proceeds of which are then reinvested into new private markets opportunities.
ESG Embedded in the HarbourVest Investment ProcessHarbourVest is driven by the belief that strong financial returns and positive social change can be accomplished in tandem. As such, it is committed to integrating ESG considerations into all stages of its investment activity. ESG-related risks are identified and taken into consideration as an integral part of its due diligence process, so that company-specific, broader manager-level, sector-level, and regional risks can be considered when reviewing investment opportunities.
Creating Value at Every Level of our Business
A strong balance sheet is vital in underpinning investment into private market funds given the cash flow profile of these investments. HVPE’s substantial credit facility gives it the flexibility to continue to invest at times when others may be unable to do so. Informed asset allocation and a steady, considered pace of investment through the cycle help to minimise volatility whilst providing broad diversification to help drive NAV performance over the long term.
HarbourVest’s global presence and deep network of longstanding relationships within private markets, as well as its integrated investment platform, have underpinned its consistent outperformance and helped to position it as a favoured investment partner. HVPE provides access to a broad range of private company investments mostly not available to all investors. These span all phases of the lifecycle, giving continued exposure to new, developing, and maturing investments.
The multi-manager approach adds value as there is less reliance on one key person to make investment decisions. The identification and assessment of these managers is key to HVPE’s value creation. Furthermore, no single external manager represents more than 3.0% of the underlying portfolio, which helps mitigate investment risk in a complex and demanding market. A well-diversified portfolio ensures that the downside risk arising from any single investment, geography, or strategy is limited, whilst offering the potential for consistent gains over time.
Value is generated for shareholders through growing NAV per share, with the share price broadly tracking this figure over time. HVPE has delivered 12 consecutive years of positive annual NAV returns. New investments are primarily funded by distributions from realised investments, enabling the cycle to continue over the long term. HVPE has established itself as one of the most highly diversified listed private equity companies with the scale and liquidity to appeal to a wide range of investors.
Returns from investment realisations reinvested in the portfolio
ESG considerations apply across all investment activity See page 29 for details
Realisations and shareholder
returns
by stage by strategy
by phase/vintage
by industry
by currency
by geography by industry
Diversification directly driven by investment
strategy
Further diversification
within the portfolio
See pages 14 and 15
1 Cambridge Associates, 2020.
HVPE Annual Report and Accounts 2021 9
ST
RA
TE
GIC
RE
PO
RT
GO
VE
RN
AN
CE
RE
PO
RT
FIN
AN
CIA
L S
TAT
EM
EN
TS
SU
PP
LE
ME
NTA
RY

Investment Manager’s Report
Introductory NoteThis report presents a summary of HVPE’s performance in the 12 months to 31 January 2021. During this period, the outbreak of COVID-19 caused widespread disruption to society and economies around the world. While monetary and fiscal stimulus has since supported a recovery in financial markets, as at 27 May 2021, continued fallout from the pandemic poses ongoing challenges in many countries. For investment companies such as HVPE, its Investment Manager, and underlying portfolio companies, this has been an unsettling and difficult period. Acting quickly and decisively in the face of adversity has been paramount in order to protect the Company’s stakeholders. The timeline of actions taken by HVPE’s Board and the Investment Manager during this period can be seen on pages 4 and 5.
Portfolio Performance
NAV per Share – 12 Months to 31 January 2021HVPE’s portfolio generated a positive NAV per share return over the reporting period, increasing by 30.4% to $35.97 at 31 January 2021 from $27.58 at 31 January 2020.
Despite this being a record year for NAV per share growth, it is important to note that the onset of COVID-19 did lead to increased volatility in HVPE’s monthly estimated NAV per share performance throughout the financial year; a negative movement in May 2020, driven by a decline in Q1 valuations, was followed by three subsequent strongly positive quarters. The Q4 2020 valuations in particular revealed significant gains across all strategies. It is these Q4 2020 valuations which form the basis of the final 31 January 2021 NAV per share figure quoted in this report.
Most major equity market indices closed the year higher after rebounding strongly from sharp declines during Q1 2020. HVPE’s public market benchmark, the FTSE AW TR Index (in US dollars), increased by 17.4% in the 12 months to 31 January 2021. Although HVPE’s NAV per share growth of 30.4% outperformed this over the period, public markets tend to be more volatile especially during periods of uncertainty, and therefore short-term comparisons are less meaningful. Longer-term comparisons through the cycle are more reflective of HVPE’s relative performance, as described on page 3 of the KPIs section.
During the 12 months ended 31 January 2021 there was a $682.3 million net gain on investments, contributing to an overall increase in net assets of $669.8 million. Of the $682.3 million, the majority – 84% – came from unrealised growth within the portfolio. This compares with a $289.3 million
net gain on investments and an overall increase in net assets of $278.7 million for the 12 months to 31 January 2020.
The higher overall net gains in this reporting period compared with the same period last year reflect the strong performance of the underlying portfolio, particularly in overweight exposures such as technology and, to a lesser extent, healthcare (see the industry diversification chart on page 15). Despite these sector overweights, HVPE remains well diversified, as demonstrated by the pie charts on pages 14 and 15. We believe diversification remains essential to achieving consistently strong returns, as the various sub-sectors within the portfolio tend to outperform on a relative basis at different stages in the cycle. At 31 January 2021, the top 100 companies in the portfolio represented 35.3% of the Investment Portfolio and the top 1,000 companies represented 84.6%.
In percentage terms, the Primary portfolio was the best performing strategy, delivering value growth of 33.1% over the 12 months. Geographically, the strongest gains came from the European portfolio, which generated a value increase of 36.8%; this was followed by the US assets, which returned 24.3%. In terms of stage, Venture and Growth Equity was the strongest performer, growing 41.3% over the 12 months ended 31 January 2021. In the prior financial year, the best performers by geography, strategy and stage were the same as above. More information on the growth drivers for the year to 31 January 2021 can be found on page 33.
As at 31 January 2021, HVPE held investments in 51 HarbourVest funds and 10 secondary co-investments1 (compared with 49 and seven, respectively, at 31 January 2020). Of these, the largest drivers of NAV per share growth during the 12 months to 31 January 2021 are described below:
/ Fund X Venture, a US-focused venture fund-of-funds, was the largest contributor, adding $0.84 to NAV per share. With a vintage year of 2015, this fund is in the growth phase. This growth came predominantly from unrealised gains over the period.
/ Following closely behind this was Fund IX Venture, an earlier fund of the same strategy, adding $0.81 to NAV per share. This is a 2011 vintage fund now entering its mature phase. Nevertheless, this uplift was derived primarily from unrealised gains over the period.
/ Co-Investment IV, a global direct co-investment fund, added $0.66. This 2016 vintage fund is in the investment phase. As might be expected at this stage of the fund’s life, most of this growth was driven by unrealised gains.
1 These include five Secondary Overflow III investments, three Secondary Overflow IV investments; Absolute, referred to as “HVPE Avalon Co-Investment L.P.”, and Conversus, referred to as “HVPE Charlotte Co-Investment L.P.”, in the Audited Consolidated Schedule of Investments. Absolute has been fully realised; however, $474,898 remains in escrow.
HVPE Annual Report and Accounts 202110

/ HIPEP VII, a 2014 vintage international fund-of-funds, was the fourth largest contributor adding $0.50 to NAV per share over the period.
/ Fund X Buyout, a 2015 vintage US-focused buyout fund-of-funds, added $0.46 to NAV per share.
All of the remaining HarbourVest funds in the portfolio added an aggregate $5.34 to HVPE’s NAV per share over the financial year.
Portfolio Cash Flows and Balance Sheet HVPE was a net investor in the 12 months to 31 January 2021, following capital calls of $430.9 million into HarbourVest funds (12 months to 31 January 2020: $324.2 million) and cash distributions of $289.5 million (12 months to 31 January 2020: $308.2 million). This resulted in net investment of $141.4 million over the reporting period, driven by elevated capital calls during March and April. While this capital was deployed primarily into new opportunities, part of the total was used to support existing investments and to fund deals closed in the preceding months.
As reported in the Company’s Semi-Annual Report and Accounts 2020, elevated capital calls coincided with a sharp fall in distributions beginning in April and May, with the result that HVPE experienced significant cash outflow on a net basis during the early part of the year. As a prudent measure, on 9 April 2020, HVPE provided notice to its lenders, Credit Suisse and Mitsubishi UFJ, to draw down $200.0 million from the Company’s $600.0 million credit facility (the “Facility”). Subsequently, based on an updated cash flow analysis presented by the Investment Manager, the Board approved an $80.0 million partial repayment in July. At 31 January 2021, following this repayment, the Facility was $120.0 million drawn, leaving HVPE with access to the remaining $480.0 million.
Since September 2020, cash flows have normalised. However, in December, HVPE received a record level of distributions from HarbourVest funds in cash terms
indicating strong exit activity. While distributions in December were driven mostly from HarbourVest primary funds (71%), this was followed by direct co-investments at 16%, which included proceeds received from the sale of South Korean dry bulk and liquefied natural gas carrier H-Line Shipping (HVPE’s 12th largest underlying portfolio company at 31 January 2020). December 2020 also marked a record month for capital calls in cash terms, excluding non-routine investments. This is partly as a result of the larger Investment Pipeline at the beginning of 2020. However, December is typically a strong month for calls, and in Q4 2020, investment activity accelerated.
Overall, net negative cash flow including operating expenses in the period resulted in HVPE’s cash balance declining from $130.6 million at 31 January 2020 to $98.4 million at 31 January 2021 (noting that the closing cash position includes the contribution from the $120.0 million draw on the credit facility). The latest cash position is reported under Recent Events on page 16.
In the reporting period, the largest HarbourVest fund capital call ($55.0 million) came from Co-Investment V, a 2018 vintage global direct co-investment fund. Other large capital calls originated from Fund XI Buyout ($50.8 million) and Fund XI Venture ($48.5 million), both 2018 vintage funds currently in the investment phase and building out their portfolios. Following these were calls to fund investment activity from 2019 Global Fund ($30.0 million), Dover X ($28.8 million), and Fund X Buyout ($26.5 million).
Distributions in the HVPE portfolio were driven by a mix of HarbourVest funds across all strategies, with the largest total amount in the period ($24.8 million) received from Fund VIII Buyout, a US-focused buyout fund-of-funds in its mature phase, which distributed proceeds received from multiple underlying partnerships. Fund IX Venture, a US-focused venture fund-of-funds followed, with distributions totalling $24.1 million.
(0.15)(0.36)(0.24)
0.46
5.34 0.53 35.97
0.500.66
0.81
0.8427.58
NAV perShare at
31 Jan 2020
Fund X Venture
Co-Investment IV Fund IXVenture
HIPEP VIIPartnership
Fund XBuyout
Other HarbourVest
Funds2
ManagementFees3
ForeignCurrency
NAV perShare at
31 Jan 2021
Net OperatingExpenses4
Gross Realised Gain/Value Change1
Performance Fees
Double-digit NAV per Share Growth in the 12 Months to 31 January 2021
1 Realised and unrealised gains are shown net of management fees, performance fees and foreign currency in the Audited Consolidated Statements of Operations.
2 Realised gain/value changes from the balance of 46 other HarbourVest funds and ten secondary co-investments in the Investment Portfolio. 3 Management fees include management fees from HarbourVest Funds and secondary co-investments as shown in the Audited Consolidated
Statements of Operations ($761,976). 4 Operating expenses exclude management fees ($761,976) and are shown net of interest income ($1,483,780).
HVPE Annual Report and Accounts 2021 11
ST
RA
TE
GIC
RE
PO
RT
GO
VE
RN
AN
CE
RE
PO
RT
FIN
AN
CIA
L S
TAT
EM
EN
TS
SU
PP
LE
ME
NTA
RY

Investment Manager’s Report continued
HVPE has indirect exposure, on a look-through basis, to a pro rata share of borrowing carried on the balance sheets of some of the HarbourVest funds (referred to as HarbourVest fund-level borrowing) in which HVPE is a Limited Partner (“LP”). It is important to note that HVPE has no additional liability for these borrowings beyond its uncalled commitments to each fund. At 31 January 2021, HVPE’s share of HarbourVest fund-level borrowing on a look-through basis was $378.2 million, a net increase of $11.4 million from $366.8 million at 31 January 2020. Expressed as a percentage of NAV, the figure decreased from 16.7% to 13.2% over the 12-month period. In order to calculate a look-through gearing figure, an investor should take the fund-level borrowing of $378.2 million and factor in HVPE’s net cash/debt position at the Company level (net debt $21.6 million). As at 31 January 2021, the resulting net total borrowing figure of $399.8 million would translate to an approximate level of look-through gearing of 13.9%. More detail on the HarbourVest fund-level borrowing, and how we factor this into our balance sheet management, can be found under Managing the Balance Sheet on page 22.
Revisions to the Modelling in Light of COVID-19HVPE continuously refines the portfolio modelling and base case projections to reflect macro developments and other relevant factors. The advent of COVID-19 called for updates to the scenario models. The Investment Manager’s thorough risk analysis of the underlying Investment Portfolio and likely impact related to COVID-19 fed into the assumptions and in May 2020, the Investment Manager presented four revised five-year model scenarios to the Board: Optimistic, High Base, Low Base and Extreme Downside case. In the months that followed, we saw strong NAV growth and a recovery in the level of cash distributions, with the result that by the end of 2020 HVPE was running well ahead of even the Optimistic case. The four scenarios from May have since been superseded by new five-year projections formulated as part of the annual commitment planning process. These cover: Extreme Downside, Low, Base and Optimistic scenarios.
Portfolio Companies
COVID-19 Portfolio Risk AssessmentIn response to COVID-19, the Investment Manager embarked on two bottom-up assessments of the likely impact of COVID-19 on HVPE’s portfolio, in April and October. Companies were assessed directly or with the help of the applicable General Partner (“GP”), taking into consideration headquarter location, employee dislocation risk, end user/consumer sentiment sensitivity, person-to-person exposure, business model travel requirements, potential for supply side disruption, and liquidity and leverage profile, among other factors. As at 31 May 2020, approximately 80% of the portfolio by value had been
reviewed as part of this exercise. The results indicated that the majority of HVPE’s assessed portfolio by value had been deemed likely to experience only a limited or moderate impact, with a relatively small proportion expected to be materially impacted. By October 2020, the Investment Manager had completed a further second-round portfolio risk assessment. While broadly similar in methodology to the first, this most recent analysis focused on the larger positions within the portfolio. This assessment resulted in approximately 78% of HVPE’s portfolio by value being reviewed. HVPE’s portfolio composition evolves over time, so in order to make a valid comparison to the April results, we held the October sample set constant and re-calculated the equivalent April figures for that population, as shown below. These figures will differ from those reported in the Company’s Annual Report on 24 June 2020. As of October, 83% of the assessed portfolio was classified limited or moderate impact while only 6% was identified as high risk at that point in time as shown in the chart below.
Portfolio Risk Assessment: Latest Results
High
April 2020 October 2020
Heightened Moderate Limited
9% 6% 10% 11% 39% 41% 42% 42%
Risk Level DescriptionHigh Company currently experiencing material
disruption from COVID-19 pandemic
Heightened Company likely to experience significant disruption from COVID-19 pandemic
Moderate Company expected to experience some disruption, primarily due to general demand slowdown
Limited Company likely to be only moderately impacted, or may even see benefit in the current environment
Liquidity EventsDuring the period, the ten largest individual company realisations in order of HVPE’s share of proceeds generated total distributions of $74.0 million. A number of IPOs and Mergers and Acquisitions (“M&A”) transactions contributed significant amounts to NAV per share in the 12 months to
HVPE Annual Report and Accounts 202112

31 January 2021. This year, the weighted average uplift to pre-transaction carrying value for a large sample of liquidity events in the period was 153%. This unusually large uplift was driven by IPOs from within the venture and growth equity portfolio. A table of the top five largest contributors to NAV per share is displayed below. The top ten distributions by value are listed on page 32.
Top Five M&A transactions
(by contribution to HVPE NAV per share)
Ellie Mae $0.05
Thrive Earlier Detection $0.03
Advanced Instruments $0.02
KGH Customs Services $0.02
Process Sensing Technologies $0.01
Top Five IPOs (by contribution to HVPE NAV per share)
Snowflake Computing $0.27
Allegro $0.20
Affirm $0.15
Yatsen Holding Limited $0.10
Zoom Information $0.06
During the 12 months ended 31 January 2021, there were 270 liquidity events, down from 336 for the 12 months to 31 January 2020. This represents a decline of 20% compared with the last financial year. The lower volume of exit activity in 2020 resulted from the disruption and associated uncertainty caused by COVID-19, leading many GPs to suspend or delay exit processes. Approximately 67% (180) of the liquidity events in HVPE’s portfolio were trade sales or sponsor-to-sponsor transactions, with the remaining 33% (90) being IPOs. Notable IPOs during the period included Snowflake, Allegro, Affirm, Yatsen Holding Limited, and Dr. Martens.
Of HVPE’s total 270 liquidity events, 168, or 62%, related to venture-backed companies. This figure is representative of wider market trends as there were a considerable number of venture-related exits in the year, with the technology and healthcare sectors dominating this activity.
Breakdown of Liquidity Events
Buyout M&A 26%
Buyout IPO 12%
Venture M&A
40%Venture IPO 22%
40%
HVPE Activity
New Fund CommitmentsIn the 12 months ended 31 January 2021, HVPE made total commitments of $194.9 million across six HarbourVest funds (12 months to 31 January 2020: $570.0 million). This took total unfunded commitments to $1.6 billion at 31 January 2021. The comparatively low level of commitments made during the year was a result of a decision by the Board and the Investment Manager to place HVPE’s commitment plan, in respect of new HarbourVest funds, on hold for a period of seven months due to the outbreak of COVID-19. New fund commitments re-started in Q4 2020 while HarbourVest funds from the existing Investment Pipeline (unfunded commitments) continued to call capital for new investments throughout the year, enabling the Company to take advantage of attractive opportunities.
Of the total capital committed, the largest commitments were $50.0 million each to Dover X (a global secondary fund) and 2020 Global Fund (a global multi-strategy fund-of-funds). Other large commitments included $40.0 million to HIPEP IX (an international fund-of-funds) and a commitment of $37.8 million to a secondary transaction within Secondary Overflow IV. The remaining commitments included $12.8 million and $4.3 million to two further secondary transactions within Secondary Overflow IV.
These commitments are in line with the Company’s Strategic Asset Allocation targets and reflect the Investment Manager’s and Board’s current perspective on the most appropriate portfolio composition required to optimise long-term NAV growth for shareholders.
Strategic Asset AllocationThe Company’s SAA targets are reviewed annually and, in November 2020, the HVPE Board decided that these targets should remain unchanged. The current targets can be seen in the pie charts on page 14. The next review is scheduled to take place in November 2021.
Focus on ESG
HarbourVest PartnersThe prioritisation of ESG considerations and ethical business standards within HVPE’s portfolio is supported by the Investment Manager’s robust ESG due diligence and monitoring procedures which it applies across each of its investment strategies. The Investment Manager relies on two primary tools, its proprietary ESG Scorecard that it uses to evaluate GPs on their ESG processes and capabilities, and RepRisk®, an external database that supports both ESG analysis in due diligence and incident-monitoring of ESG and business conduct risks within the portfolio. HarbourVest seeks to use its influence to improve ESG standards in the HVPE portfolio through actively engaging with its GPs through the ESG Scorecard assessment and
HVPE Annual Report and Accounts 2021 13
ST
RA
TE
GIC
RE
PO
RT
GO
VE
RN
AN
CE
RE
PO
RT
FIN
AN
CIA
L S
TAT
EM
EN
TS
SU
PP
LE
ME
NTA
RY

Target %A 60%B 30%
C 10%
Actual %D 55%E 36%
F 9%
BuyoutVenture and Growth EquityMezzanine and Real Assets
A
D
C
F
B
E
STAGE
Target %A 60%B 18%C 17%D 5%
Actual %E 59%F 23%G 15%H 3%
USEuropeAsia PacificRest of World
A
E
C
D
G
H
B
F
GEOGRAPHY
Target %A 50%B 30%C 20%
Actual %D 48%E 30%F 22%
PrimarySecondaryDirect
A
D
CF
B
E
STRATEGY
feedback process and through the sharing of best practice. Further information on how ESG analysis is integrated into HarbourVest’s investment processes is set out on page 29.
HarbourVest’s ESG policy and latest digital ESG report for 2020 can be found on the HarbourVest website here: https://www.harbourvest.com/why-harbourvest/corporate-responsibility. Some highlights over the year include:
/ In 2020, HarbourVest added new indicators to its proprietary ESG Manager Scorecard to help better understand how GPs are managing, prioritising and disclosing on ESG risks and value creation opportunities.
/ HarbourVest was also proud to receive an A+ in governance in its UN Principles for Responsible Investment (“PRI”) rankings, and equally proud to be recognised by the British Private Equity & Venture Capital Association (“BVCA”) with its 2020 Excellence in ESG Award in the LP category.
/ HarbourVest updated its ESG Policy in early 2021 to reflect evolving ESG practices, and the firm’s deep commitment to responsible investing. The new Policy includes more detailed information on its ESG integration processes and reflects HarbourVest’s strategic commitments to climate change and diversity and inclusion.
Climate Change Strategy/ In last year’s ESG Report, HarbourVest announced plans
to develop its climate strategy around the Task Force on Climate-related Financial Disclosures (“TCFD”) recommendations. This year, HarbourVest is pleased to share in its ESG report its first progress update
around the TCFD’s four pillars: governance, strategy, risk management, and metrics and targets.
/ In addition to being a TCFD Supporter, HarbourVest also became a member of the Initiative Climate International (“iCI”) in 2020. The iCI is a practitioner-led initiative to develop tools and materials that aid private equity action on climate change.
/ In 2020, for the first time, HarbourVest committed to measuring and offsetting its carbon footprint, and is now, a certified CarbonNeutral® company in accordance with CarbonNeutral Protocol, the leading framework for carbon neutrality.
Diversity and Inclusion/ Internally, HarbourVest’s Diversity & Inclusion Council
accomplished much in 2020, taking on issues that were of most importance to the firm. By instituting key policies and delivering education, the Council helped the firm focus on creating more of a shared understanding, appreciation, and commitment to diversity and inclusion.
/ On the talent and hiring front, HarbourVest developed plans to launch its first-ever internship programme in conjunction with Sponsors for Educational Opportunity, which works to close the career opportunity gap in underserved communities. It also joined the #10000BlackInterns initiative in the UK.
Investment Manager’s Report continued
HVPE Portfolio Construction Targets vs Actual Diversification at 31 January 2021
(By underlying partnership as a percentage of NAV)
HVPE Annual Report and Accounts 202114

Investment 42%Growth 47%Mature 11%
42
47
11
PHASECURRENCYEXPOSURE
80
15
2 2 1
US dollar 80%Euro 15%Sterling 2%Other 2%Australian dollar 1%
31
14
14
11
11
10
5 4
INDUSTRY
Tech & Software 31%Consumer 14%Medical & Biotech 14%Business Services 11%Financial 11%Industrial & Transport 10%Media & Telecom 5%Energy & Cleantech 4%
Engaged Corporate Citizen/ HarbourVest’s Global Volunteering Group helped identify
and work with organisations that needed urgent help, focusing in particular on COVID-19 driven food insecurity and poverty. Employees donated generous amounts of both time and money – $2.4 million – to support these causes.
Market Perspectives and Outlook Entering 2020, global private markets were in an extended period of outperformance. However, in a span of months, there was a series of shocks, the quantum of which might typically be seen over decades.
Private equity has always invested in the technology, consumer, healthcare, education, and business services areas, but the pandemic has evolved or changed the paradigm – causing us to consider new business models, consumer behaviours, and social norms. This “new idea” environment is creating an investment landscape that we believe could be ripe for value-added investments. We expect to see continued acceleration in the adoption of technology and in the transformation of sectors, with GPs becoming more focused on highly technology-enabled businesses. Also, we anticipate that certain industries will evolve differently as a new market normal develops. For example, the restaurant, food service, and tourism industries have been, and are likely to continue to be, hard hit in the short term, while sectors such as collaboration software, tele-health and home health, online pharmacy, and telecom and internet will continue to carry this growth momentum over the long term.
In 2021, GPs are highly focused on evaluating market risk and are staying extra-vigilant, with many turning to their experience from past market dislocations that continue to resonate. Despite these defensive measures, history shows us that the industry’s strongest returns are often generated in challenging times, where disruption creates opportunity. Going forward GPs need to be selective when making new investments and identify attractive return profiles in light of prevailing risk levels.
At the same time, COVID-19 has accelerated trends and reinforced views among many high-quality GPs that the secondary market is an important liquidity tool in their toolkits.
The current co-investment climate continues to be one of high valuations and leverage, as well as low interest rates for high-quality businesses. As was the case prior to COVID-19, GPs have significant amounts of dry powder which should translate into high investment activity in 2021 and beyond.
Challenges clearly remain, but unprecedented times can also be a strong breeding ground for opportunity. HarbourVest’s investment teams around the globe certainly believe this to be the case for 2021 as they continue to balance ongoing risk assessment with strategic growth investing. HVPE’s ability to maintain a steady pace of investment in HarbourVest funds should allow it to participate in such opportunities and to emerge even more strongly positioned in the long term.
HVPE Annual Report and Accounts 2021 15
ST
RA
TE
GIC
RE
PO
RT
GO
VE
RN
AN
CE
RE
PO
RT
FIN
AN
CIA
L S
TAT
EM
EN
TS
SU
PP
LE
ME
NTA
RY

New CommitmentsBetween 1 February 2021 and 27 May 2021, HVPE committed $188.8 million to the HarbourVest funds outlined below.
HarbourVest Fund Date Committed Commitment ($m)
Co-Investment Fund VI 31 March 2021 $25.0
Fund XII Buyout 30 April 2021 $90.0
Fund XII Micro Buyout 30 April 2021 $15.0
Fund XII Venture 30 April 2021 $45.0
Secondary Overflow Fund IV 15, 16 April 2021
$13.8 (two transactions I & J)
Total $188.8
HVPE Estimated NAV At 30 April 2021 HVPE releases an estimated NAV on a monthly basis. These reports are available on the Company’s website, generally within 20 calendar days of the month end.
On 21 May, HVPE published an estimated NAV per share at 30 April 2021 of $36.62 (£26.49), an increase of $0.65 from the final 31 January 2021 NAV (US Generally Accepted Accounting Principles (“GAAP”)) figure of $35.97. This latest NAV per share is based on a valuation breakdown of: 16% as at 30 April 2021 (representing the public companies in the portfolio); 4% actual 31 March 2021; and 80% actual 31 December 2020. Consistent with previous estimated NAV reports, valuations are also adjusted for foreign exchange movements, cash flows, and any known material events to 30 April 2021.
The Investment Pipeline of unfunded commitments increased from $1,573.2 million at 31 January 2021 to $1,639.2 million at 30 April 2021, based on the new commitments, capital funded, and taking foreign exchange movements into account.
At the end of April HVPE’s borrowing on its own credit facility was $115.0 million. HVPE’s look-through exposure to borrowing at the HarbourVest fund level had decreased by $27.1m from 31 January 2021, to $351.1 million. The latest balance sheet ratios can be found in the factsheet on the HVPE website: www.hvpe.com.
Share Price Since 31 January 2021Since 31 January 2021, the share price has continued to strengthen. During the period 1 February to 21 May 2021, the share price increased from £18.70 to £20.40, or 9.1%.
The market capitalisation of the Company as at 21 May 2021 was £1.6 billion, and as of the same date HVPE was ranked 121st in the FTSE 250.
HVPE Annual Report and Accounts 202116
Recent Events
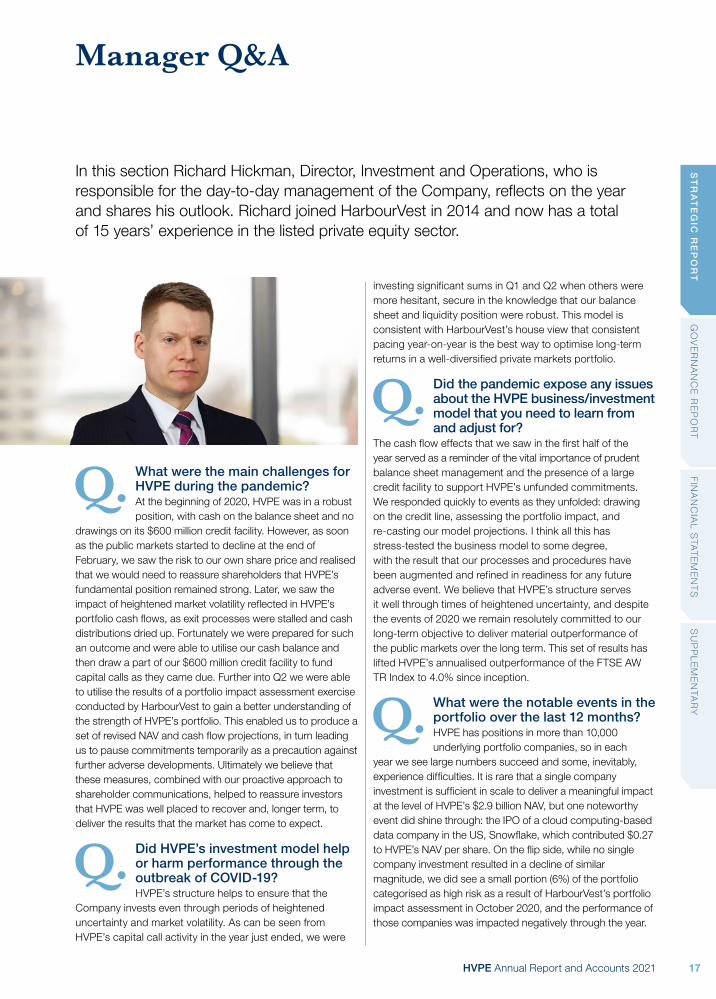
Manager Q&A
In this section Richard Hickman, Director, Investment and Operations, who is responsible for the day-to-day management of the Company, reflects on the year and shares his outlook. Richard joined HarbourVest in 2014 and now has a total of 15 years’ experience in the listed private equity sector.
Q. What were the main challenges for HVPE during the pandemic?At the beginning of 2020, HVPE was in a robust position, with cash on the balance sheet and no
drawings on its $600 million credit facility. However, as soon as the public markets started to decline at the end of February, we saw the risk to our own share price and realised that we would need to reassure shareholders that HVPE’s fundamental position remained strong. Later, we saw the impact of heightened market volatility reflected in HVPE’s portfolio cash flows, as exit processes were stalled and cash distributions dried up. Fortunately we were prepared for such an outcome and were able to utilise our cash balance and then draw a part of our $600 million credit facility to fund capital calls as they came due. Further into Q2 we were able to utilise the results of a portfolio impact assessment exercise conducted by HarbourVest to gain a better understanding of the strength of HVPE’s portfolio. This enabled us to produce a set of revised NAV and cash flow projections, in turn leading us to pause commitments temporarily as a precaution against further adverse developments. Ultimately we believe that these measures, combined with our proactive approach to shareholder communications, helped to reassure investors that HVPE was well placed to recover and, longer term, to deliver the results that the market has come to expect.
Q. Did HVPE’s investment model help or harm performance through the outbreak of COVID-19?HVPE’s structure helps to ensure that the
Company invests even through periods of heightened uncertainty and market volatility. As can be seen from HVPE’s capital call activity in the year just ended, we were
investing significant sums in Q1 and Q2 when others were more hesitant, secure in the knowledge that our balance sheet and liquidity position were robust. This model is consistent with HarbourVest’s house view that consistent pacing year-on-year is the best way to optimise long-term returns in a well-diversified private markets portfolio.
Q. Did the pandemic expose any issues about the HVPE business/investment model that you need to learn from and adjust for?
The cash flow effects that we saw in the first half of the year served as a reminder of the vital importance of prudent balance sheet management and the presence of a large credit facility to support HVPE’s unfunded commitments. We responded quickly to events as they unfolded: drawing on the credit line, assessing the portfolio impact, and re-casting our model projections. I think all this has stress-tested the business model to some degree, with the result that our processes and procedures have been augmented and refined in readiness for any future adverse event. We believe that HVPE’s structure serves it well through times of heightened uncertainty, and despite the events of 2020 we remain resolutely committed to our long-term objective to deliver material outperformance of the public markets over the long term. This set of results has lifted HVPE’s annualised outperformance of the FTSE AW TR Index to 4.0% since inception.
Q. What were the notable events in the portfolio over the last 12 months?HVPE has positions in more than 10,000 underlying portfolio companies, so in each
year we see large numbers succeed and some, inevitably, experience difficulties. It is rare that a single company investment is sufficient in scale to deliver a meaningful impact at the level of HVPE’s $2.9 billion NAV, but one noteworthy event did shine through: the IPO of a cloud computing-based data company in the US, Snowflake, which contributed $0.27 to HVPE’s NAV per share. On the flip side, while no single company investment resulted in a decline of similar magnitude, we did see a small portion (6%) of the portfolio categorised as high risk as a result of HarbourVest’s portfolio impact assessment in October 2020, and the performance of those companies was impacted negatively through the year.
HVPE Annual Report and Accounts 2021 17
ST
RA
TE
GIC
RE
PO
RT
GO
VE
RN
AN
CE
RE
PO
RT
FIN
AN
CIA
L S
TAT
EM
EN
TS
SU
PP
LE
ME
NTA
RY

Q. New commitments were lower than normal during 2020: did we miss out on good opportunities?HVPE makes commitments to a range of
HarbourVest funds, most of which are themselves fund-of-funds vehicles with protracted investment periods. This means that at any given time, HVPE has a substantial pipeline of unfunded commitments waiting to be called for investment by the underlying managers. Although we paused new commitments to HarbourVest funds, existing commitments continued to be called throughout the year, so there was no significant interruption in HVPE’s rate of investment at the underlying level. This is a valuable feature of the HVPE structure which has served the Company well during previous episodes of market volatility by ensuring that we benefit from a “dollar cost averaging” effect, whereby the average price paid for new investments is smoothed over time. This arises from steady and consistent investment into new private markets opportunities at varying price levels. Additionally, HVPE was able to take advantage of selected individual secondary co-investment opportunities through the year on a discretionary basis.
Q. What is your outlook for cash flow over the next 12 months?Following the heightened cash flow volatility of 2020, we expect a return to more consistent
patterns of capital calls and distributions in the current year. We do, however, take a prudent and cautious approach to managing HVPE’s balance sheet. Alongside our base case projection for NAV and cash flows through the year, we make reference to a set of model scenarios including an Extreme Downside case. Events at the macro level can be unpredictable and it is important always to hope for the best, yet prepare for the worst.
Q. HVPE’s technology investments have performed well: do you see downside risk to current valuations?Our portfolio is well diversified and comprises
a range of sectors and strategies, with a truly global reach. The technology sector is significant to HVPE as a result of our commitments to venture capital funds, and this part of the portfolio has performed particularly strongly in recent times. While there is always downside risk to valuations, many of the companies in our portfolio are disrupting established industries and adding real value to economies around the world. Furthermore, our portfolio construction approach is predicated on the notion that declines in one part of the portfolio are likely to be offset, at least partially, by gains in other areas, as evidenced by HVPE’s consistently strong NAV growth over the last decade. It is also important to bear in mind that HVPE is continually recycling capital from mature investments (via IPOs, trade sales and secondary transactions) into new opportunities, so the portfolio is dynamic and always changing from year to year.
Q. Do you view HVPE as a growth or value stock?In many ways it is both. The venture and growth equity portfolio (36% of NAV) is, naturally,
centred on growth opportunities, and this is also true to some extent in the buyout portfolio, particularly at the small and mid-cap end. Within the buyout funds, however, there are value-oriented investments in relatively mature companies that may, for various reasons, have been overlooked by other investors. On another level, we might argue that HVPE itself is a value opportunity: fundamentally a strong business whose shares trade at a discount to the net assets.
Q. What opportunities do you see in the Asia Pacific private equity market?HVPE raised its target allocation to Asia Pacific in 2019 from 12% to 17% of NAV, and I am
pleased to say we are now very close to the new target level at 15%. The decision to increase our allocation was made on the basis of continued strong growth in that market combined with the increasing breadth and maturity of the fund offerings available. HarbourVest has had a physical presence in the region since 1996 and was active as an investor there from the early 1980s, so we believe the firm has a strong competitive edge when seeking to identify attractive new investment opportunities. HarbourVest has identified a number of themes set to drive rapid growth in the region, including digital education and healthcare, luxury consumer goods, wellness, and entertainment.
Q. How can HVPE deliver on its ESG commitments given it has no direct relationships with the underlying fund managers?
HVPE entrusts HarbourVest to drive the ESG agenda in the Company’s portfolio. HarbourVest is a signatory to the PRI and applies rigorous screening processes and controls to address ESG issues both in the selection and oversight of investments. HarbourVest has integrated ESG into its investment processes, drives increased awareness and adoption externally, is committed to supporting diverse-led funds and being a diverse and inclusive organisation, and is focused on addressing the issue of climate change. During 2020, HarbourVest made a commitment to report in accordance with the recommendations of the TCFD and brought on additional resource to further enhance its monitoring and reporting capabilities. More details on HarbourVest’s ESG developments, with a link to its latest ESG report, can be found in the Investment Manager’s Report on pages 13 to 15.
HVPE Annual Report and Accounts 202118
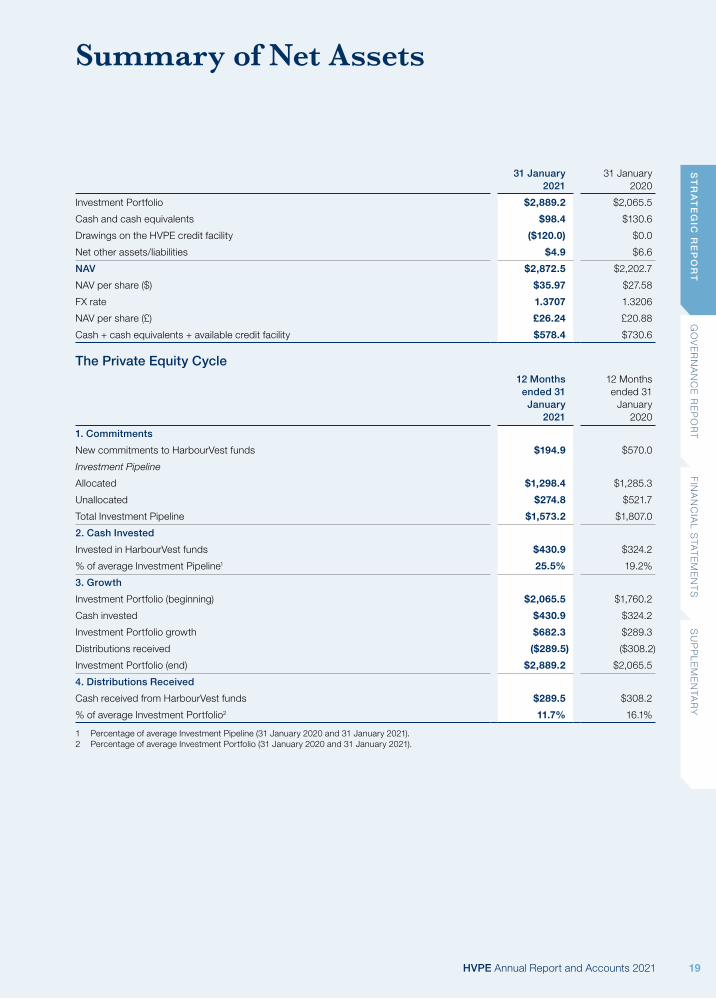
Summary of Net Assets
31 January 2021
31 January 2020
Investment Portfolio $2,889.2 $2,065.5
Cash and cash equivalents $98.4 $130.6
Drawings on the HVPE credit facility ($120.0) $0.0
Net other assets/liabilities $4.9 $6.6
NAV $2,872.5 $2,202.7
NAV per share ($) $35.97 $27.58
FX rate 1.3707 1.3206
NAV per share (£) £26.24 £20.88
Cash + cash equivalents + available credit facility $578.4 $730.6
The Private Equity Cycle12 Months ended 31
January2021
12 Months ended 31
January 2020
1. Commitments
New commitments to HarbourVest funds $194.9 $570.0
Investment Pipeline
Allocated $1,298.4 $1,285.3
Unallocated $274.8 $521.7
Total Investment Pipeline $1,573.2 $1,807.0
2. Cash Invested
Invested in HarbourVest funds $430.9 $324.2
% of average Investment Pipeline1 25.5% 19.2%
3. Growth
Investment Portfolio (beginning) $2,065.5 $1,760.2
Cash invested $430.9 $324.2
Investment Portfolio growth $682.3 $289.3
Distributions received ($289.5) ($308.2)
Investment Portfolio (end) $2,889.2 $2,065.5
4. Distributions Received
Cash received from HarbourVest funds $289.5 $308.2
% of average Investment Portfolio2 11.7% 16.1%
1 Percentage of average Investment Pipeline (31 January 2020 and 31 January 2021).2 Percentage of average Investment Portfolio (31 January 2020 and 31 January 2021).
HVPE Annual Report and Accounts 2021 19
ST
RA
TE
GIC
RE
PO
RT
GO
VE
RN
AN
CE
RE
PO
RT
FIN
AN
CIA
L S
TAT
EM
EN
TS
SU
PP
LE
ME
NTA
RY

Stakeholder Engagement
How the Board Engages with StakeholdersIt is important that the Board engages with stakeholders, and most pertinently its shareholders, to help ensure the long-term success of the Company. Reporting on this activity is in line with best practice under the 2019 AIC Code of Corporate Governance (the “AIC Code”). The Board has identified its key stakeholders below, and in this section their relevance is explained, alongside both why and how the Board engages with them. Importantly, on page 21 we highlight some of the principal decisions that have been made as a result of this engagement and subsequent Board discussions.
Stakeholder How the Board engages
Shareholders and Prospective InvestorsShareholders and prospective investors are today’s and tomorrow’s owners of the Company and are therefore at the core of every decision made by the Board. Support from this group of stakeholders is critical to the success of HVPE.
/ Receives investor relations updates from the Investment Manager at every Board Meeting, with a comprehensive report delivered twice a year
/ Accessible to shareholders, who may contact the Directors, including the Chairman and the Senior Independent Director through the Company Secretary at the following email address: [email protected] or write a letter to the registered office shown on the inside back cover of this report
/ Engages regularly with the corporate broker, and receives market and trading updates
/ Communicates with shareholders through the Investment Manager; financial reporting and monthly NAV updates are published on the Company’s website
/ Meets shareholders through HVPE’s annual Capital Markets Session (or virtual equivalent) or via the AGM
/ Holds strategy meetings to ensure the Board is acting in shareholders’ best interests to optimise the efficiency and performance of the vehicle
HarbourVest Partners (the Investment Manager)HarbourVest is fundamental to HVPE’s business model and overall strategy. As such, it is important that the Board maintains a strong relationship with its Investment Manager.
/ Maintains continuous dialogue, both written and verbal, and holds regular meetings with the Investment Manager
/ Has open and respectful interaction which allows for clear communication, constructive challenge and a strong partnership
/ Receives detailed monitoring of the investments and investment process/ Undertakes strategic planning with the common goal of helping
the Company fulfil its purpose and investment objective/ Visits the Investment Manager’s office to meet personnel, and
attends the Investment Manager’s annual investment conference/ During 2020 this was replaced with an increased level of virtual
engagement and collaboration/ Requests ad-hoc meetings and updates as necessary/ Works with the Investment Manager to evolve Board reports,
in order to receive greater insights
Community and EnvironmentDirectors fully support the importance and prominence of ESG which has become increasingly integral to the Board’s thinking. As such, ESG considerations and the impact of the Company on the community and environment are regular topics at Board meetings.
/ Receives updates on HarbourVest’s ESG initiatives twice a year/ Helps to drive the ESG agenda at HarbourVest through Carolina
Espinal, designated Director for ESG items/ Incorporates questions about service providers’ ESG policies and
initiatives as part of the annual Management Engagement and Service Provider Committee (“MESPC”) service provider review
More details on our approach to ESG can be found on pages 44 and 45.
Service ProvidersEffective relations with service providers help the Company to operate in a compliant and efficient manner and help support its purpose.
/ Regular interaction as part of the provision of services/ Reports from the core service providers tabled at Board meetings/ Formal service provider performance review conducted annually
by the MESPC/ Receives updates from the Investment Manager on dialogue with
credit facility lenders
HVPE Annual Report and Accounts 202120
Note: HVPE does not have any employees and therefore they are not referenced in this section as a stakeholder.

Section 172 Statement
During the year, some of the Board’s discussions and principal decisions included (but were by no means limited to) the items below. These have been selected as being illustrative of the ways in which the Board fulfilled its duties under Section 172(1) of the Companies Act 2006, in line with the AIC guidance, in addition to its engagement activities with stakeholders which are described on the previous page.
Examples of How Stakeholder Interests Have Influenced Board-level Decisions
Decision Impact on long-term success Stakeholder considerations and decisions made
Quick and decisive response to COVID-19
Minimising, as much as possible, the impacts from COVID-19 and ensuring frequent communication to the market amidst heightened uncertainty helps ensure the Company’s long-term success.
A number of key decisions were made as COVID-19 unfolded. Please refer to the timetable and response outline on pages 4 and 5.
Stakeholder considerationsShareholders: Took prompt action, including the following:
/ Immediately requesting updated financial modelling on the portfolio. See HVPE’s Annual Report to 31 January 2020 pages 4 to 6
/ Holding regular meetings with the Investment Manager to understand the status and outcomes of the reviews undertaken.
/ Drawing down on the facility to ensure strength of the balance sheet.
All stakeholders: Communicated a regular and consistent message from the Board and Investment Manager in the monthly NAV update:
/ Ensuring stakeholders were kept fully informed as to the actions being undertaken through regular communication to the market.
/ Increasing the frequency of Board updates to ensure Directors were in a position to keep stakeholders fully informed.
HarbourVest (as a business): Increased enquiries:
/ Made ongoing enquiries into what was being put in place both to enable employees to fulfil their functions and to address and ensure employee welfare.
Board succession planning
This allows for regular refreshment of the Board, and can help to increase diversity, both of which are necessary for the long-term success of the Company.
The Board places importance on boardroom diversity and has previously communicated its intention to improve diversity on the HVPE Board. Accordingly, when choosing a shortlist of candidates for the position of Director, the Board considers the existing balance of skills, and experience of Directors, as well as the diversity of the Board.
Ms Elizabeth (“Libby”) Burne joined the HVPE Board on 1 March 2021, after the financial year end.
The current Board composition meets the targets set out by the Hampton-Alexander and Parker Reviews.
Focus on ESG Helping contribute to wider society and increasing accountability at the Investment Manager level thereby improving the Company’s long-term ESG impact.
A considered focus on ESG supports future investment choices and helps to attract and retain talent at the Investment Manager.
/ Development of HVPE’s ESG Policy./ Increased regular monitoring of HarbourVest’s ESG performance./ Interaction with the Investment Manager about the development
of ESG strategies, processes and policies./ Incorporation of ESG considerations into HVPE’s oversight of its
service providers and the management of its own operations.
HVPE Annual Report and Accounts 2021 21
ST
RA
TE
GIC
RE
PO
RT
GO
VE
RN
AN
CE
RE
PO
RT
FIN
AN
CIA
L S
TAT
EM
EN
TS
SU
PP
LE
ME
NTA
RY
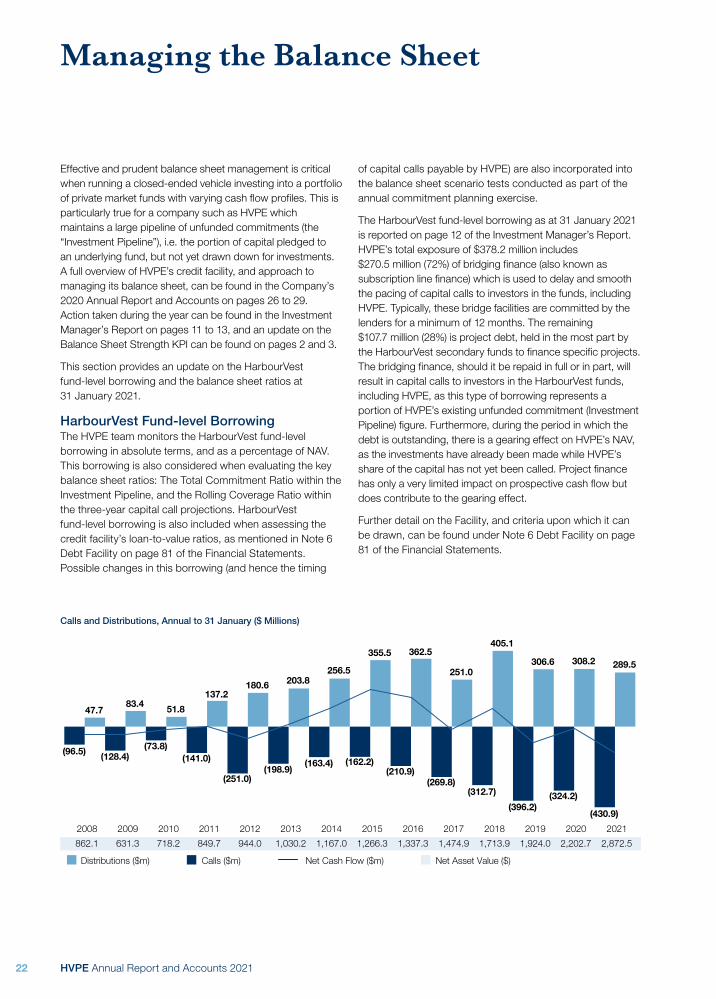
2020 2021201920182017201620152014201320122011201020092008
Net Cash Flow ($m)
(96.5) (128.4)
83.4
(73.8)
51.8
(141.0)
256.5
(210.9)
362.5
251.0
(324.2)(396.2)
308.2
Calls and Distributions, Annual to 31 January ($ Millions)
(430.9)
289.5306.6
47.7
137.2
(251.0)
180.6
(198.9)
203.8
(163.4) (162.2)
355.5
(269.8)(312.7)
405.1
Distributions ($m) Calls ($m) Net Asset Value ($)
2,202.7 2,872.51,924.01,713.91,474.91,337.31,266.31,167.01,030.2944.0849.7718.2631.3862.1
Managing the Balance Sheet
Effective and prudent balance sheet management is critical when running a closed-ended vehicle investing into a portfolio of private market funds with varying cash flow profiles. This is particularly true for a company such as HVPE which maintains a large pipeline of unfunded commitments (the “Investment Pipeline”), i.e. the portion of capital pledged to an underlying fund, but not yet drawn down for investments. A full overview of HVPE’s credit facility, and approach to managing its balance sheet, can be found in the Company’s 2020 Annual Report and Accounts on pages 26 to 29. Action taken during the year can be found in the Investment Manager’s Report on pages 11 to 13, and an update on the Balance Sheet Strength KPI can be found on pages 2 and 3.
This section provides an update on the HarbourVest fund-level borrowing and the balance sheet ratios at 31 January 2021.
HarbourVest Fund-level BorrowingThe HVPE team monitors the HarbourVest fund-level borrowing in absolute terms, and as a percentage of NAV. This borrowing is also considered when evaluating the key balance sheet ratios: The Total Commitment Ratio within the Investment Pipeline, and the Rolling Coverage Ratio within the three-year capital call projections. HarbourVest fund-level borrowing is also included when assessing the credit facility’s loan-to-value ratios, as mentioned in Note 6 Debt Facility on page 81 of the Financial Statements. Possible changes in this borrowing (and hence the timing
of capital calls payable by HVPE) are also incorporated into the balance sheet scenario tests conducted as part of the annual commitment planning exercise.
The HarbourVest fund-level borrowing as at 31 January 2021 is reported on page 12 of the Investment Manager’s Report. HVPE’s total exposure of $378.2 million includes $270.5 million (72%) of bridging finance (also known as subscription line finance) which is used to delay and smooth the pacing of capital calls to investors in the funds, including HVPE. Typically, these bridge facilities are committed by the lenders for a minimum of 12 months. The remaining $107.7 million (28%) is project debt, held in the most part by the HarbourVest secondary funds to finance specific projects. The bridging finance, should it be repaid in full or in part, will result in capital calls to investors in the HarbourVest funds, including HVPE, as this type of borrowing represents a portion of HVPE’s existing unfunded commitment (Investment Pipeline) figure. Furthermore, during the period in which the debt is outstanding, there is a gearing effect on HVPE’s NAV, as the investments have already been made while HVPE’s share of the capital has not yet been called. Project finance has only a very limited impact on prospective cash flow but does contribute to the gearing effect.
Further detail on the Facility, and criteria upon which it can be drawn, can be found under Note 6 Debt Facility on page 81 of the Financial Statements.
HVPE Annual Report and Accounts 202122

Balance Sheet RatiosCommitment Ratios1
The Board and the Investment Manager refer to three key ratios when assessing the Company’s commitment levels:
1. Total Commitment Ratio (“TCR”)The TCR provides a view of total exposure to private markets investments as a percentage of NAV. As such, this takes the sum of the current Investment Portfolio and the Investment Pipeline as the numerator. The level of the TCR is a key determinant of the Company’s total commitment capacity for new HarbourVest funds and co-investments within a given time period. This ratio decreased considerably from 176% at 31 January 2020 to 155% at 31 January 2021, largely as a result of the increase in NAV combined with a reduction in the Investment Pipeline due to the pause on new commitments.
2. Commitment Coverage RatioHVPE and many other listed private equity firms on the London Stock Exchange (the “peer group”2) use this metric as a measure of balance sheet risk. This ratio is calculated by taking the sum of cash and available credit, and dividing it by the total Investment Pipeline.
The nature of HVPE’s structure, whereby it commits to HarbourVest funds, most of which invest predominately in funds raised by other private equity managers, means that it typically takes longer for commitments to be drawn down compared with other listed private equity funds. As a result, to remain fully invested, HVPE has to maintain a larger pipeline of unfunded commitments. This means that HVPE’s Commitment Coverage Ratio may appear relatively low in comparison with the peer group. This ratio has declined from 40% at 31 January 2020 to 37% at 31 January 2021, resulting from the move to a marginally negative net cash position.
3. Rolling Coverage Ratio (“RCR”)HVPE’s Investment Manager uses this third specific metric to provide greater insight into the Company’s balance sheet position and a more relevant comparison with the Company’s peer group.2 This final measure reflects the sum of cash, the available credit facility, and the distributions expected during the current year, taken as a percentage of the forecast cash investment in HarbourVest funds over the current year plus the next two years. The latter is based on actual commitments made, plus those currently foreseen for the next three years. In considering forecast investments over a three-year period rather than the total Investment Pipeline, this calculation enables a more useful comparison of HVPE’s coverage ratio relative to its peers. This ratio has
decreased from 75% at 31 January 2020 to 67% at 31 January 2021. This is due to a downward adjustment to the current year’s estimated realisations and a reduction in the Company’s cash balance. Despite the reduction, the Investment Manager is comfortable with this ratio at 67%. The precise calculation approach that we use for the ratio is highly conservative. Most notably, the denominator is three years of projected capital calls. This figure is based on the cash flows expected to result from the current level of unfunded commitments and from new commitments planned for the following three years. Should actual cash flows turn markedly more negative than anticipated, the Investment Manager and Board have the option to place the commitment plan on hold, thereby shoring up the RCR.
Total Commitment Ratio (“TCR”)(Total exposure to private markets investments as a percentage of NAV)
Investment Portfolio + Investment Pipeline $4,462.4m
Divided by the NAV $2,872.5m
155% (176% at 31 January 2020)
Commitment Coverage Ratio(Short-term liquidity as a percentage of total Investment Pipeline)
Cash + available credit facility $578.4m
Divided by the Investment Pipeline $1,573.2m
37% (40% at 31 January 2020)
Rolling Coverage Ratio (“RCR”)(A measure of medium-term commitment coverage)
Cash + available credit facility (total $578.4m) + current year estimated distributions ($343.9m) $922.4m
Divided by the next three years’ estimated investments $1,372.0m
67% (75% at 31 January 2020)
In the short to medium term, in light of COVID-19 developments, these ratios may deviate from their longer-term ranges. The most recent ratios, at 30 April 2021, can be found within HVPE’s latest monthly factsheet on its website: www.hvpe.com.
Managing the Balance Sheet continued
HVPE Annual Report and Accounts 2021 23
ST
RA
TE
GIC
RE
PO
RT
GO
VE
RN
AN
CE
RE
PO
RT
FIN
AN
CIA
L S
TAT
EM
EN
TS
SU
PP
LE
ME
NTA
RY
1 These are considered as Alternative Performance Measures. More detail can be found on page 89.2 The peer group refers to the UK listed private equity fund-of-funds: BMO Private Equity Trust, ICG Enterprise Trust, JPEL Private Equity, Pantheon
International Plc, and Standard Life Private Equity.

2010
0
1
2
3
4
5
2011 2012 2013 2014 2015 2016 2017 2018 202120202019
Attributable Performance Fees Attributable Management Fee (Funds) Attributable Management Fee (Co-investment)
HVPE Net Recurring Operating Expenses HVPE Total Expense Ratio (“TER”)
HVPE Total Expense Ratio as a % of Average NAV
Managing Costs
Total Expense Ratio (“TER”)HVPE’s TER reflects the total cost incurred by the Company in assembling and maintaining its portfolio of HarbourVest funds and co-investments. The figure is broken down into four distinct categories of expense.
Firstly, there is the cost of running the Company in its own right, encompassing items such as maintenance of the Facility, Board fees and expenses, professional fees, marketing, financial reporting, dedicated team from the Investment Manager, and compliance costs. These costs, totalling 0.52% of average NAV in the 12 months to 31 January 2021 (12 months to 31 January 2020: 0.58%), are categorised as recurring operating expenses as shown in the first line of the table on page 25.
Secondly, operating costs relating to the HarbourVest funds amounted to a further 0.14% of average NAV in the 12-month period (12 months to 31 January 2020: 0.29%). The sharp decline compared to the prior period was driven by the lower volume of commitments made to new HarbourVest funds during the year, as the majority of these costs are incurred during the set-up process. The reduction is expected to be temporary, therefore, and will reverse as new commitments return to normal levels.
Thirdly, HVPE pays management fees to HarbourVest with respect to the funds in which it invests, and also for the secondary co-investment in Conversus3 made alongside the HarbourVest funds. The total of all management fees in the 12 months to 31 January 2021 was equivalent to 0.77% of average NAV (12 months to 31 January 2020: 0.86%).
Finally, performance fees are charged on secondary investments and direct co-investments. In total, this accounted for 1.13% of average NAV in the 12 months to 31 January 2021 (12 months to 31 January 2020: 0.98%). The performance fee figure varies from period to period and is driven by the performance achieved by the relevant HarbourVest funds. Growth during the period was predominantly driven by primary investments and direct investments. Primary investments do not incur performance fees.
Together, these four cost components add up to give a TER, net of interest income (0.06%), of 2.50% for the 12 months to 31 January 2021. This reflects the cost of providing a fully comprehensive private equity investment programme. It is important to note that, while the operating expenses and the management fees do not vary greatly from one year to the next, the performance fee figure will vary significantly depending on the returns delivered by the portfolio of eligible underlying HarbourVest funds. The TER for the 12 months to 31 January 2021 of 2.50% was 0.11% lower than the same period in the prior year (2.61%) owing to management fees and HVPE operating expenses coming down.
3 “HVPE Charlotte Co-Investment L.P.” in the Audited Consolidated Schedule of Investments.
HVPE Annual Report and Accounts 202124

12 Monthsto 31 January
2021
12 monthsto 31 January
2020
Operating expenses4 0.52% 0.58%
HarbourVest fund operating expenses5 0.14% 0.29%
Management fees6 0.77% 0.86%
Operating expense ratio 1.43% 1.73%
Interest income7 (0.06%) (0.10%)
Net operating expense ratio 1.37% 1.63%
Performance fees8 1.13% 0.98%
Total net expense ratio9 2.50% 2.61%
4 Operating expenses includes total expenses shown on the face of the Audited Consolidated Statements of Operations, excluding management fees (from the secondary co-investments) which are included in the management fees in this table.
5 HVPE’s share of fund-level operating expenses (professional fees and organisational costs) which are included in realised and unrealised gains (losses) on investments in the Audited Consolidated Statements of Operations.
6 This includes fund-level management fees payable to HarbourVest which are included in realised and unrealised gains (losses) on investments in the Audited Consolidated Statements of Operations, together with the management fees relating to secondary co-investments noted in 4 above.
7 This is shown as interest and dividends from cash and equivalents on the face of the Audited Consolidated Statements of Operations.8 This includes fund-level performance fees payable to HarbourVest which are included in realised and unrealised gains (losses) on investments in the
Audited Consolidated Statements of Operations.9 TERs are calculated using the average NAV over the respective periods ($2,537.6 million in the 12 months ended 31 January 2021 and
$2,063.3 million in the 12 months ended 31 January 2020).
HVPE Annual Report and Accounts 2021 25
ST
RA
TE
GIC
RE
PO
RT
GO
VE
RN
AN
CE
RE
PO
RT
FIN
AN
CIA
L S
TAT
EM
EN
TS
SU
PP
LE
ME
NTA
RY

Principal Risks and Uncertainties
Risk Factors and Internal ControlsThe Board is responsible for the Company’s risk management and internal control systems and actively monitors the risks faced by the Company, taking steps to mitigate and minimise these where possible. Further details on the Board’s governance and oversight can be found on pages 44 to 48.
Risk AppetiteThe Board’s investment risk appetite is to follow an over-commitment policy (as explained in the Directors’ Report on page 42) that allows balanced, regular investment through economic and investment cycles whilst ensuring that it has access to sufficient funding for any potential negative cash flow situations, including under an Extreme Downside scenario. At the same time, the funding available to the Company by way of cash balances and lending facilities is managed to ensure that its cost, by way of interest, facility fees or cash drag, is reasonable. When considering other risks, the Board’s risk appetite is effectively governed by a cost benefit analysis when assessing mitigation measures; however, at all times the Board will seek to follow best practice and remain compliant with all applicable laws, rules and regulations.
Principal RisksAs recommended by the Audit and Risk Committee, the Directors have adopted a risk management framework to govern how the Board identifies existing and emerging risks, determines risk appetite, identifies mitigation and controls, assesses, monitors and measures risk, and reports on risks.
The Board reviews risks at least twice a year and receives deep-dive reports on specific risks as recommended by the Audit and Risk Committee (see the report of the activities of that Committee on pages 52 to 54). At the start of the year under review the Board had identified 12 main risks which have a higher probability and a significant potential impact on performance, strategy, reputation, or operations (Category A risks). From these, the five risk categories identified below were considered the principal risks faced by the Company where the combination of probability and impact was assessed as being most significant. The Board also considered that there were 20 existing or emerging risks (Category B risks), which are monitored on a watch list.
As the pandemic took hold early in 2020, the Board and the Audit and Risk Committee considered the impact that the situation would have on the Company’s business and its service providers. As a result, the Board elevated risks relating to the Company’s loan facility, key personnel, communication with shareholders and valuation from Category B to Category A, and downgraded risks relating to fund expenses and MIFID II from Category A to Category B. Due to the material impact that the pandemic has had on society and the economy, and in turn, the Company, the principal risks below continue to be considered through the lens of COVID-19. Brexit was not considered likely to have a major impact on the Company or the Investment Manager, and was deemed to be a Category B risk by the Board. No issues for the Company actually arose when the UK left the EU or at the end of the transition period.
Risk Description Mitigation with current COVID-19 comment
Balance Sheet Risks
The Company’s balance sheet strategy and its policy for the utilisation of leverage are described on page 43. The Company continues to maintain an overcommitment strategy and may draw on its credit facility to bridge periods of negative cash flow when capital calls on investments are greater than distributions. The level of potential borrowing available under the credit facility could be negatively affected by declining NAVs. In a period of declining NAVs, reduced realisations, and rapid substantial cash calls, the Company’s net leverage ratio could increase beyond an appropriate level, resulting in a need to sell assets. A reduction in the availability or utilisation of borrowing at the HarbourVest fund level, or accelerated repayment thereof, could result in an increase in capital calls to a level in excess of the modelled scenarios.
The size and term of the Company’s credit facility helps to mitigate this risk. The Board has put a monitoring programme in place, determined with reference to portfolio models, in order to mitigate against the requirement to sell assets at a discount during any periods of NAV decline. The monitoring programme also considers the level of borrowing at the HarbourVest fund level which is factored into the credit facility loan-to-value ratio covenants. Both the Board and the Investment Manager will continue to monitor these metrics actively as the pandemic progresses and will take appropriate action as required, such as pausing further commitments, to attempt to mitigate these risks. Please also see the Going Concern and Viability Statement on page 47 for information on the scenarios that are considered by the Board on an ongoing basis.
HVPE Annual Report and Accounts 202126

Risk Description Mitigation with current COVID-19 comment
Popularity of Listed Private Equity Sector
Investor sentiment may change towards the Listed Private Equity sector, resulting in a widening of the Company’s share price discount relative to NAV per share.
HVPE sought to communicate the potential impact of the pandemic on private markets with shareholders as quickly as it could.
Following the onset of the pandemic, there were significant falls in public markets. As a consequence, and in common with the majority of its peers, HVPE’s discount to NAV per share initially widened. This was partly due to negative sentiment regarding equities in general but also because the exact level and timing of the impact that COVID-19 would have on either the global economy as a whole or private companies in particular was not yet known. Subsequently, as public markets have recovered, and the impact of the pandemic has become clearer, the discounts relating to listed private equity companies have narrowed.
Public Market Risks
The Company makes venture capital and buyout investments in companies where operating performance is affected by the broader economic environment within the countries in which those companies carry out business. While these companies are generally privately owned, their valuations are, in most cases, influenced by public market comparables. In addition, approximately 13% of the Company’s portfolio is made up of publicly traded securities whose values increase or decrease in response to market movements. When global public markets decline or the economic situation deteriorates, the Company’s NAV is usually negatively affected.
Normally the Company’s exposure to individual public markets is partially mitigated by the geographical diversification of the portfolio. While COVID-19 is having an impact on the global economy, the severity appears to vary by geography and industry sector. HVPE’s diversified fund-of-funds portfolio has helped to mitigate the effect on the Company’s NAV per share.
In previous downturns private market valuations have not been impacted as much as public markets and there has been a dampened effect on volatility.
Public markets have returned to pre-COVID-19 levels, but more uncertainty lies ahead as some countries face a third wave of the pandemic as vaccines are rolled out.
Performance of HarbourVest
The Company is dependent on its Investment Manager and HarbourVest’s investment professionals. With the exception of ten co-investments, all of the Company’s assets, save for cash balances and short-term liquid investments, are invested in HarbourVest funds. Significant reliance is placed by the Company on HarbourVest’s control environment.
HarbourVest has a long-term track record in managing its investment portfolios through past crises.
As at the date of this report, HarbourVest is continuing to operate flexible working arrangements with the majority of staff working from home. HarbourVest is confident that its business continuity processes are robust and that they can continue to provide services to the Company to the usual high standard.
The Board is satisfied that the strength and depth of the HarbourVest team is sufficient to manage absences of, or turnover in, staff responsible for HVPE.
Trading Liquidity and Price
Public market movements over the period under review have increased volatility in HVPE’s share price, and it is currently trading at a price which represents a discount to its NAV per share. Any ongoing discount to NAV per share that is materially different to the Company’s peer group has the potential to damage the Company’s reputation and to cause shareholder dissatisfaction.
During periods of short-term market stress, supply and demand for shares can be impacted. If demand decreases or supply increases disproportionately, the bid/offer spread could widen, resulting in less attractive pricing for investors seeking to buy or sell shares in the short term.
The five largest shareholders represent approximately 38% of the Company’s shares in issue. This may contribute to a lack of liquidity and widening discount. Also, in the event that a substantial shareholder chooses to exit the share register, this may have an effect on the Company’s share price and consequently the discount to NAV per share.
Since the Company’s shares trade on the Main Market of the London Stock Exchange, this provides increased liquidity and accessibility to a wide range of potential shareholders.
In addition, the Board continues to monitor the discount to NAV per share and will consider appropriate solutions to address any ongoing or substantial discount to NAV per share. The Board has overseen the allocation of additional investor relations resource in recent years and the Company has attracted new shareholders.
The HVPE Board through the activities of the Investment Manager, HarbourVest Partners, seeks to drive improved liquidity over the medium to long term by promoting the Company’s shares to a broad range of prospective investors. This has continued throughout the pandemic.
HVPE Annual Report and Accounts 2021 27
ST
RA
TE
GIC
RE
PO
RT
GO
VE
RN
AN
CE
RE
PO
RT
FIN
AN
CIA
L S
TAT
EM
EN
TS
SU
PP
LE
ME
NTA
RY
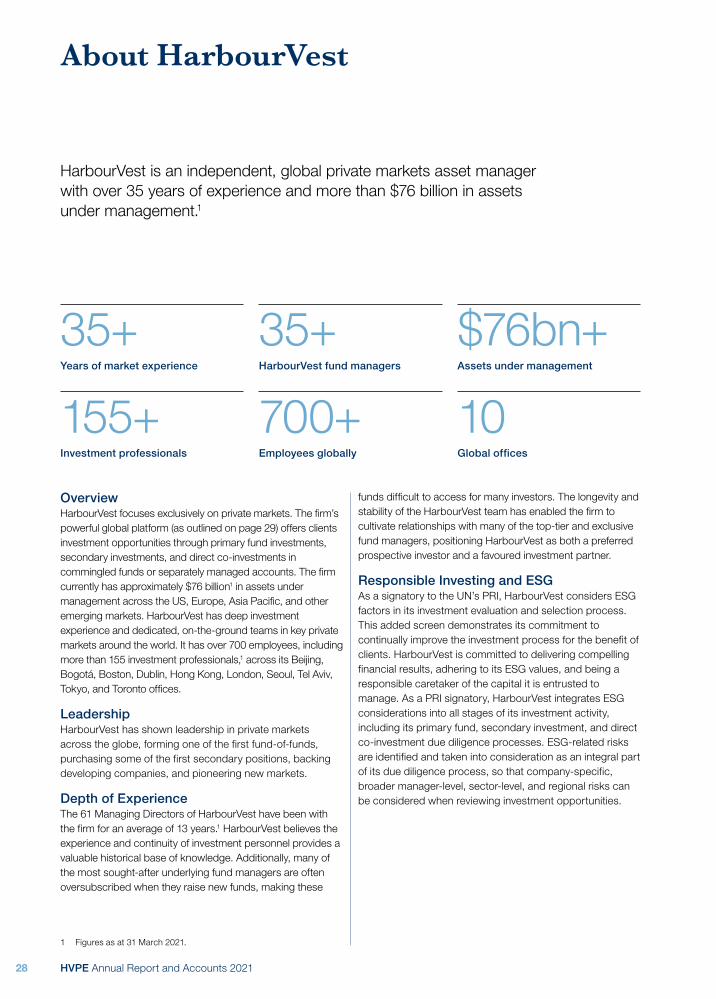
About HarbourVest
HarbourVest is an independent, global private markets asset manager with over 35 years of experience and more than $76 billion in assets under management.1
OverviewHarbourVest focuses exclusively on private markets. The firm’s powerful global platform (as outlined on page 29) offers clients investment opportunities through primary fund investments, secondary investments, and direct co-investments in commingled funds or separately managed accounts. The firm currently has approximately $76 billion1 in assets under management across the US, Europe, Asia Pacific, and other emerging markets. HarbourVest has deep investment experience and dedicated, on-the-ground teams in key private markets around the world. It has over 700 employees, including more than 155 investment professionals,1 across its Beijing, Bogotá, Boston, Dublin, Hong Kong, London, Seoul, Tel Aviv, Tokyo, and Toronto offices.
LeadershipHarbourVest has shown leadership in private markets across the globe, forming one of the first fund-of-funds, purchasing some of the first secondary positions, backing developing companies, and pioneering new markets.
Depth of ExperienceThe 61 Managing Directors of HarbourVest have been with the firm for an average of 13 years.1 HarbourVest believes the experience and continuity of investment personnel provides a valuable historical base of knowledge. Additionally, many of the most sought-after underlying fund managers are often oversubscribed when they raise new funds, making these
funds difficult to access for many investors. The longevity and stability of the HarbourVest team has enabled the firm to cultivate relationships with many of the top-tier and exclusive fund managers, positioning HarbourVest as both a preferred prospective investor and a favoured investment partner.
Responsible Investing and ESGAs a signatory to the UN’s PRI, HarbourVest considers ESG factors in its investment evaluation and selection process. This added screen demonstrates its commitment to continually improve the investment process for the benefit of clients. HarbourVest is committed to delivering compelling financial results, adhering to its ESG values, and being a responsible caretaker of the capital it is entrusted to manage. As a PRI signatory, HarbourVest integrates ESG considerations into all stages of its investment activity, including its primary fund, secondary investment, and direct co-investment due diligence processes. ESG-related risks are identified and taken into consideration as an integral part of its due diligence process, so that company-specific, broader manager-level, sector-level, and regional risks can be considered when reviewing investment opportunities.
35+Years of market experience
35+HarbourVest fund managers
$76bn+Assets under management
155+Investment professionals
700+Employees globally
10Global offices
1 Figures as at 31 March 2021.
HVPE Annual Report and Accounts 202128

HVPE Investment CommitteeHarbourVest has established the HVPE Investment Committee (the “HVPE IC” or the “Committee”) as a dedicated body to provide investment recommendations to the HVPE Board.
The HVPE IC meets regularly and is the key decision-making entity through which HarbourVest fulfils its obligations to HVPE under the Investment Management Agreement. The Committee is responsible for monitoring and reviewing the Company’s SAA targets and for recommending any changes, thereby seeking to optimise the risk-adjusted performance of HVPE’s portfolio. On an annual basis, the Committee proposes a commitment plan for consideration by the HVPE Board and, once approved, is responsible for executing against this plan. During the year, the Committee also reviews and recommends specific investment opportunities to the HVPE Board as they arise.
The HVPE IC comprises two Managing Directors of HarbourVest Partners: John Toomey and Greg Stento. John is a senior member of HarbourVest’s investment team and is a member of the firm’s Executive Management Committee. Greg is also a senior member of the investment team and chairs other investment committees across HarbourVest’s global operation. Richard Hickman represents HVPE on the HVPE IC, providing recommendations for consideration by the Committee.
The HarbourVest PlatformPrimaries, Secondaries, and Direct Co-investments
HVPE invests in private companies and portfolios of private companies through funds managed by HarbourVest. The HarbourVest platform encompasses the three complementary strategies described below, which underpin HVPE’s portfolio.
Primary InvestmentsCommitments to newly-formed funds being raised by experienced managers
/ Access to leading private equity funds
/ Comprehensive foundation of a private equity programme
/ Potential driver of long-term performance
ESG process: When conducting due diligence on primary investments, HarbourVest evaluates the GP’s approach and capabilities on ESG by using its proprietary ESG Manager Scorecard. Evaluation criteria is aligned with industry standards; the resulting assessment is generated by proprietary weightings and provides an overall ESG rating for the GP, and individual scores for efforts on climate change and diversity and inclusion.
Secondary InvestmentsPurchases of private equity assets in existing funds or portfolios of direct investments
/ Attractive pricing opportunities/ Diversification across prior
vintage years/ Potential for J-curve mitigation
(positive returns may be achieved more rapidly)
ESG process: The type of ESG diligence performed for secondary investments depends on whether the opportunity is a traditional investment or a complex investment. For traditional secondary deals, HarbourVest seeks to examine the existing portfolio of assets to identify any ESG concerns and assess the ESG policies or procedures of the manager(s). For complex investments, HarbourVest screens the portfolio through RepRisk®.
Direct Co-investmentsInvestments directly into operating companies alongside other GPs
/ Direct exposure to private equity-backed companies
/ Lower cost than obtaining the equivalent interest in a private company through a traditional direct manager via a primary fund
ESG process: For HarbourVest-sourced direct co-investments, HarbourVest generally works with the lead sponsor to analyse opportunity-specific ESG considerations based on a given company’s business model, domicile, historical business practice, and sector. In addition, HarbourVest analyses the company’s RepRisk® rating and any related ESG incidents that have been reported by this database.
Greg Stento Managing DirectorGreg joined HarbourVest in 1998 and serves as Head of Investments for the firm. He is a member of the Strategy Investment Committees, the Portfolio Construction Committee, and also serves on the advisory boards of several private equity partnerships.
John Toomey Managing DirectorJohn is one of two members of the firm’s Executive Management Committee, and a member of the Portfolio Construction Committee. He serves on the advisory boards of a number of private equity partnerships.
HVPE Annual Report and Accounts 2021 29
ST
RA
TE
GIC
RE
PO
RT
GO
VE
RN
AN
CE
RE
PO
RT
FIN
AN
CIA
L S
TAT
EM
EN
TS
SU
PP
LE
ME
NTA
RY

Our Value Creation Cycle
Investing in private markets requires a considered, long-term approach. HVPE provides a complete private equity solution for public investors by managing the portfolio through four phases of the private equity cycle: Commitment, Investment, Growth, and Maturity.
The phases
Investment PhaseThe HarbourVest funds invest HVPE’s
commitments over a period of approximately four years.
Read more on page 33
Growth PhaseDuring years five to nine, most HarbourVest funds are fully invested, and managers are
actively driving growth. The majority of value accretion typically takes place during
this phase.
Read more on page 33
Mature Phase Within approximately seven to ten years,
managers are typically realising investments.
Read more on page 32
Commitment PhaseThe Investment Manager and the Board consider a number of factors before new commitments are made:
/ Current unfunded commitment levels (“Investment Pipeline”)
/ Anticipated rate of investment (capital calls) / Future expected distributions (proceeds receivable)
/ The economic environment / The available credit facility
/ Commitment and coverage ratios / Existing portfolio and strategy
Read more on page 32
HVPE Annual Report and Accounts 202130
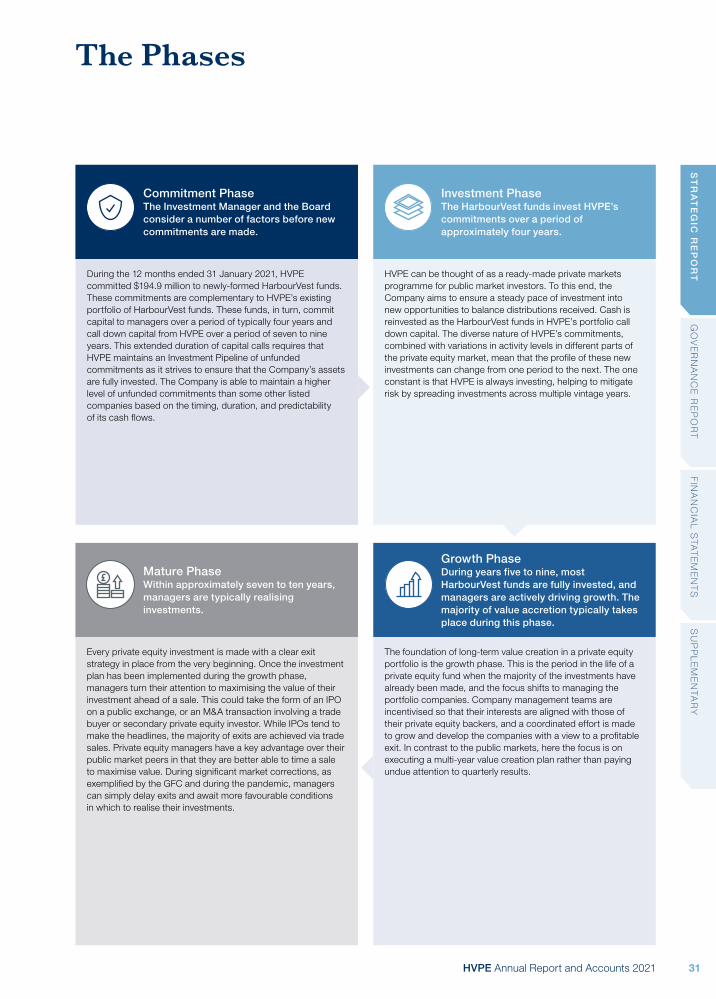
Growth Phase During years five to nine, most HarbourVest funds are fully invested, and managers are actively driving growth. The majority of value accretion typically takes place during this phase.
Mature Phase Within approximately seven to ten years, managers are typically realising investments.
Commitment PhaseThe Investment Manager and the Board consider a number of factors before new commitments are made.
Investment Phase The HarbourVest funds invest HVPE’s commitments over a period of approximately four years.
During the 12 months ended 31 January 2021, HVPE committed $194.9 million to newly-formed HarbourVest funds. These commitments are complementary to HVPE’s existing portfolio of HarbourVest funds. These funds, in turn, commit capital to managers over a period of typically four years and call down capital from HVPE over a period of seven to nine years. This extended duration of capital calls requires that HVPE maintains an Investment Pipeline of unfunded commitments as it strives to ensure that the Company’s assets are fully invested. The Company is able to maintain a higher level of unfunded commitments than some other listed companies based on the timing, duration, and predictability of its cash flows.
HVPE can be thought of as a ready-made private markets programme for public market investors. To this end, the Company aims to ensure a steady pace of investment into new opportunities to balance distributions received. Cash is reinvested as the HarbourVest funds in HVPE’s portfolio call down capital. The diverse nature of HVPE’s commitments, combined with variations in activity levels in different parts of the private equity market, mean that the profile of these new investments can change from one period to the next. The one constant is that HVPE is always investing, helping to mitigate risk by spreading investments across multiple vintage years.
Every private equity investment is made with a clear exit strategy in place from the very beginning. Once the investment plan has been implemented during the growth phase, managers turn their attention to maximising the value of their investment ahead of a sale. This could take the form of an IPO on a public exchange, or an M&A transaction involving a trade buyer or secondary private equity investor. While IPOs tend to make the headlines, the majority of exits are achieved via trade sales. Private equity managers have a key advantage over their public market peers in that they are better able to time a sale to maximise value. During significant market corrections, as exemplified by the GFC and during the pandemic, managers can simply delay exits and await more favourable conditions in which to realise their investments.
The foundation of long-term value creation in a private equity portfolio is the growth phase. This is the period in the life of a private equity fund when the majority of the investments have already been made, and the focus shifts to managing the portfolio companies. Company management teams are incentivised so that their interests are aligned with those of their private equity backers, and a coordinated effort is made to grow and develop the companies with a view to a profitable exit. In contrast to the public markets, here the focus is on executing a multi-year value creation plan rather than paying undue attention to quarterly results.
The Phases
HVPE Annual Report and Accounts 2021 31
ST
RA
TE
GIC
RE
PO
RT
GO
VE
RN
AN
CE
RE
PO
RT
FIN
AN
CIA
L S
TAT
EM
EN
TS
SU
PP
LE
ME
NTA
RY
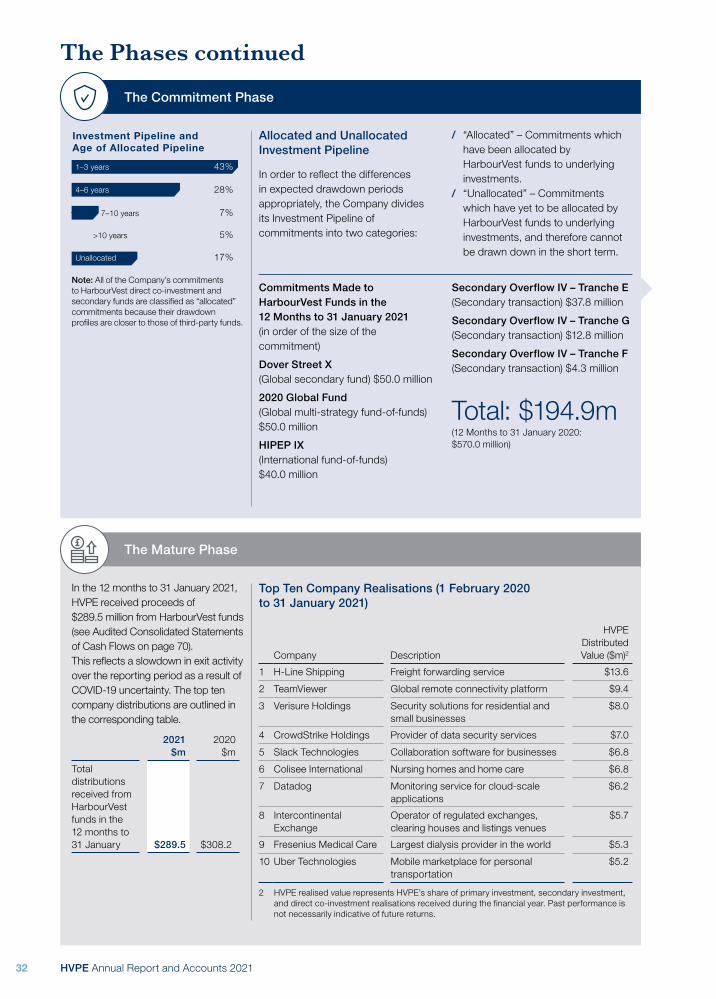
The Phases continued
The Commitment Phase
The Mature Phase
1–3 years
4–6 years
Unallocated
7–10 years
>10 years
43%
28%
7%
5%
17%
Investment Pipeline and Age of Allocated Pipeline
Note: All of the Company’s commitments to HarbourVest direct co-investment and secondary funds are classified as “allocated” commitments because their drawdown profiles are closer to those of third-party funds.
Allocated and Unallocated Investment Pipeline
In order to reflect the differences in expected drawdown periods appropriately, the Company divides its Investment Pipeline of commitments into two categories:
/ “Allocated” – Commitments which have been allocated by HarbourVest funds to underlying investments.
/ “Unallocated” – Commitments which have yet to be allocated by HarbourVest funds to underlying investments, and therefore cannot be drawn down in the short term.
Top Ten Company Realisations (1 February 2020 to 31 January 2021)
Company Description
HVPE Distributed
Value ($m)2
1 H-Line Shipping Freight forwarding service $13.6
2 TeamViewer Global remote connectivity platform $9.4
3 Verisure Holdings Security solutions for residential and small businesses
$8.0
4 CrowdStrike Holdings Provider of data security services $7.0
5 Slack Technologies Collaboration software for businesses $6.8
6 Colisee International Nursing homes and home care $6.8
7 Datadog Monitoring service for cloud-scale applications
$6.2
8 Intercontinental Exchange
Operator of regulated exchanges, clearing houses and listings venues
$5.7
9 Fresenius Medical Care Largest dialysis provider in the world $5.3
10 Uber Technologies Mobile marketplace for personaltransportation
$5.2
2 HVPE realised value represents HVPE’s share of primary investment, secondary investment, and direct co-investment realisations received during the financial year. Past performance is not necessarily indicative of future returns.
In the 12 months to 31 January 2021, HVPE received proceeds of $289.5 million from HarbourVest funds (see Audited Consolidated Statements of Cash Flows on page 70). This reflects a slowdown in exit activity over the reporting period as a result of COVID-19 uncertainty. The top ten company distributions are outlined in the corresponding table.
2021 $m
2020 $m
Total distributions received from HarbourVest funds in the 12 months to 31 January $289.5 $308.2
Commitments Made to HarbourVest Funds in the 12 Months to 31 January 2021(in order of the size of the commitment)
Dover Street X(Global secondary fund) $50.0 million
2020 Global Fund(Global multi-strategy fund-of-funds) $50.0 million
HIPEP IX(International fund-of-funds) $40.0 million
Secondary Overflow IV – Tranche E(Secondary transaction) $37.8 million
Secondary Overflow IV – Tranche G(Secondary transaction) $12.8 million
Secondary Overflow IV – Tranche F(Secondary transaction) $4.3 million
Total: $194.9m(12 Months to 31 January 2020: $570.0 million)
HVPE Annual Report and Accounts 202132

The Investment Phase
The Growth Phase
Top Ten Primary Managers by Amount Invested ($m)
Manager Strategy Geography ($m)
1 Hellman & Friedman Buyout North America $6.8
2 TA Associates Venture North America $6.7
3 ABRY Partners Buyout North America $6.6
4 Index Ventures Venture Europe $6.1
5 Insight Venture Management
Venture North America $5.6
6 Summit Partners Venture North America $5.2
7 Nautic Partners Buyout North America $5.1
8 Sun Capital Buyout North America $5.0
9 SK Capital Partners Buyout North America $4.5
10 HgCapital Buyout Europe $4.4
In the 12 months to 31 January 2021, the Investment Portfolio grew by $682.3 million (see Audited Consolidated Statements of Operations on page 68). The major growth drivers in the portfolio are summarised in the Investment Manager’s Report on pages 10 and 11. Movements by stage, geography, and strategy are outlined below (% gain over the 12 months adjusted for new investments over the period) with corresponding commentary.
Buyout
Venture and Growth Equity
Other
21.7%
41.1%
5.1%
US
Europe
Asia Pacific
Rest of World8.6%
24.3%
36.8%
21.5%
Primary
Secondary
Direct Co-investment
33.1%
15.4%
27.2%
Growth by Stage
The Venture and Growth Equity stage (36% of Investment Portfolio NAV) delivered the largest percentage gain over the reporting period, with an increase of 41.1%, driven by particularly strong performance in the European growth equity and venture portion of the portfolio. This gain followed strong performance and realisations in the US and European venture and growth equity markets. Buyouts (55% of Investment Portfolio NAV) followed with a 21.7% gain whilst Other, which comprises predominantly real assets and mezzanine investments, grew 5.1% over the year.
Growth by Geography
Europe (23% of Investment Portfolio NAV) was the strongest geographical region, with a 36.8% gain over the 12 months to 31 January 2021, driven largely by European growth equity and venture investments. Foreign currency gains also drove a portion of the European returns as the euro appreciated by 9% over the period. US (59% of Investment Portfolio NAV) followed closely with a 24.3% return driven by US primary partnerships and venture investments. Asia Pacific (15% of Investment Portfolio NAV) grew 21.5% over the period.
Growth by Strategy
The Primary strategy (48% of Investment Portfolio NAV) was the strongest performer over the 12 months to 31 January 2021, growing 33.1%, largely due to the high performance of venture investments in Europe and the US. This was followed by 27.2% growth from Direct Investments (22% of Investment Portfolio NAV), driven mainly by particularly strong growth equity performance in Europe.
In the 12 months to 31 January 2021, HVPE invested $430.9 million into HarbourVest funds (see Audited Consolidated Statements of Cash Flows on page 70). Looking through to the underlying portfolio, the majority of investments were into primaries at 72%, followed by direct co-investments at 17%, and secondaries at 11%.
2021 $m
2020 $m
Total invested into HarbourVest funds in the 12 months to 31 January $430.9 $324.2
HVPE Annual Report and Accounts 2021 33
ST
RA
TE
GIC
RE
PO
RT
GO
VE
RN
AN
CE
RE
PO
RT
FIN
AN
CIA
L S
TAT
EM
EN
TS
SU
PP
LE
ME
NTA
RY

Manager Spotlight
Top Ten Managers1 across all strategies at 31 January 2021 held within HVPE’s underlying portfolio.
1 IDG Capital Partners 2 Insight Venture Management
Venture investment in companies located in China, with a focus on technology-enabled consumer, enterprise solutions, and artificial intelligence sectors. IDG has a strong and consistent investment track record, evidenced by its funding of Pinduoduo and Yuanfudao.
Insight invests in growth-stage technology companies in the software, software-enabled services, and internet spaces, primarily based in the US. The Manager leverages its deep in-house sourcing and operating resources to execute on its growth strategy, which has resulted in consistent strong performance across fund cycles.
3.0% $87.2m 2.6% $75.2m% of Investment Portfolio at 31 January 2021
Investment value at 31 January 2021
% of Investment Portfolio at 31 January 2021
Investment value at 31 January 2021
3 Corsair Capital Infrastructure Partners
4 Index Ventures
Investment across key infrastructure sub-sectors, with a focus on high-quality transportation and logistics assets. Corsair’s current portfolio includes a Spanish toll road platform, Australian ports business and a North American airport developer and operator. This is held within the HVPE-seeded real assets vehicle.
Venture and growth equity investments in companies located in Europe and the US, primarily, with a focus on disruptive technology and innovative business models in the fintech, enterprise software, online marketplaces, and gaming/entertainment sectors. Index has a strong investment track record; its portfolio companies include Adyen, Datadog, Roblox, Robinhood, Farfetch and Revolut.
2.6% $74.8m 2.1% $60.9m% of Investment Portfolio at 31 January 2021
Investment value at 31 January 2021
% of Investment Portfolio at 31 January 2021
Investment value at 31 January 2021
1 One manager cannot be disclosed and has been removed from this list.
HVPE Annual Report and Accounts 202134
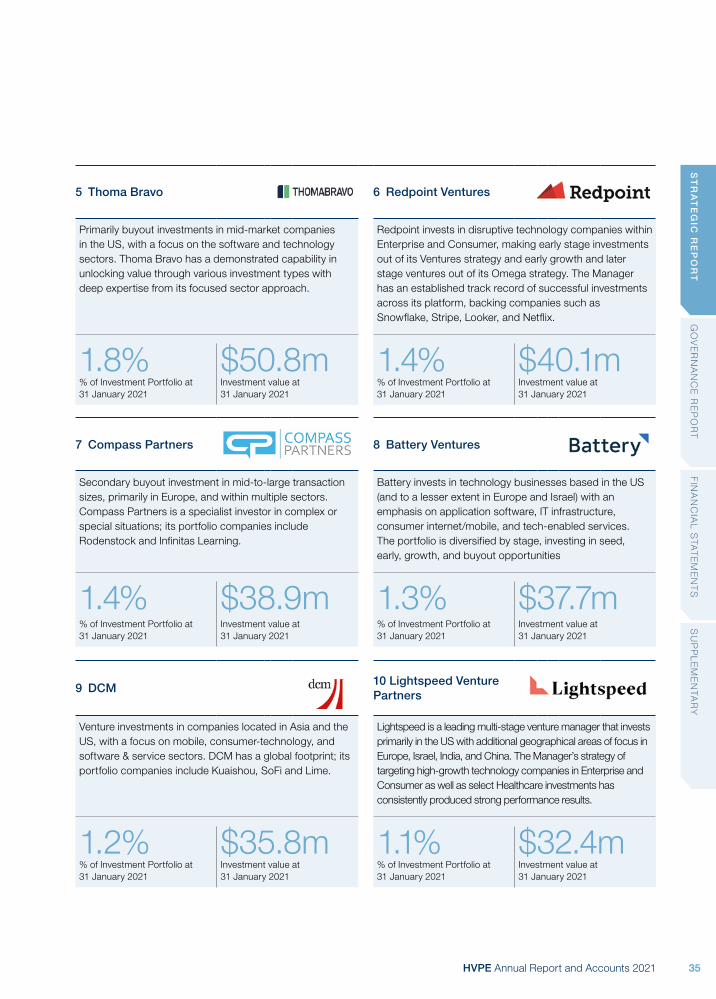
5 Thoma Bravo 6 Redpoint Ventures
Primarily buyout investments in mid-market companies in the US, with a focus on the software and technology sectors. Thoma Bravo has a demonstrated capability in unlocking value through various investment types with deep expertise from its focused sector approach.
Redpoint invests in disruptive technology companies within Enterprise and Consumer, making early stage investments out of its Ventures strategy and early growth and later stage ventures out of its Omega strategy. The Manager has an established track record of successful investments across its platform, backing companies such as Snowflake, Stripe, Looker, and Netflix.
1.8% $50.8m 1.4% $40.1m% of Investment Portfolio at 31 January 2021
Investment value at 31 January 2021
% of Investment Portfolio at 31 January 2021
Investment value at 31 January 2021
7 Compass Partners 8 Battery Ventures
Secondary buyout investment in mid-to-large transaction sizes, primarily in Europe, and within multiple sectors. Compass Partners is a specialist investor in complex or special situations; its portfolio companies include Rodenstock and Infinitas Learning.
Battery invests in technology businesses based in the US (and to a lesser extent in Europe and Israel) with an emphasis on application software, IT infrastructure, consumer internet/mobile, and tech-enabled services. The portfolio is diversified by stage, investing in seed, early, growth, and buyout opportunities
1.4% $38.9m 1.3% $37.7m% of Investment Portfolio at 31 January 2021
Investment value at 31 January 2021
% of Investment Portfolio at 31 January 2021
Investment value at 31 January 2021
9 DCM10 Lightspeed Venture Partners
Venture investments in companies located in Asia and the US, with a focus on mobile, consumer-technology, and software & service sectors. DCM has a global footprint; its portfolio companies include Kuaishou, SoFi and Lime.
Lightspeed is a leading multi-stage venture manager that invests primarily in the US with additional geographical areas of focus in Europe, Israel, India, and China. The Manager’s strategy of targeting high-growth technology companies in Enterprise and Consumer as well as select Healthcare investments has consistently produced strong performance results.
1.2% $35.8m 1.1% $32.4m% of Investment Portfolio at 31 January 2021
Investment value at 31 January 2021
% of Investment Portfolio at 31 January 2021
Investment value at 31 January 2021
HVPE Annual Report and Accounts 2021 35
ST
RA
TE
GIC
RE
PO
RT
GO
VE
RN
AN
CE
RE
PO
RT
FIN
AN
CIA
L S
TAT
EM
EN
TS
SU
PP
LE
ME
NTA
RY

Top Ten Direct Companies
Top Ten disclosable1 companies at 31 January 2021 held within HVPE’s direct co-investment portfolio.
Klarna
Stage: Growth EquityLocation: Sweden
Online consumer payments solutionsProvider of eCommerce payment solutions to merchants and payment financing products to consumers. HarbourVest co-invested with Permira, a private equity investment firm with a growth-orientated strategy. Since the initial investment, Klarna has performed exceptionally well, demonstrating an ability to capitalize on a fast-growing market with secular tailwinds. The Investment Manager likes the investment as the company is a leader in a large market with structural growth drivers that has demonstrated resilience during the pandemic and therefore seen significant strategic interest at premium valuations.
1.6%% of Investment Portfolio at 31 January 2021
$45.2mInvestment value at 31 January 2021
Preston Hollow Capital
Stage: Small BuyoutLocation: US
Speciality municipal finance merchant bank focused on niche underwriting and opportunistic investing. HarbourVest co-invested with Stone Point Capital, a finance-focused GP with deep experience in the credit underwriting arena. Since the initial investment, Preston Hollow Capital has demonstrated strong performance. The Investment Manager likes the investment as the company has an impressive management team track record and operates within a large, fragmented municipal bond market which presents various business opportunities.
1.2%% of Investment Portfolio at 31 January 2021
$33.1mInvestment value at 31 January 2021
1 Some direct holdings cannot be disclosed due to confidentiality agreements in place.
HVPE Annual Report and Accounts 202136

Knowlton Development Corporation (“KDC”)
Stage: Small BuyoutLocation: Canada
Contract ManufacturerContract manufacturer of personal care and beauty products providing both custom formulation and packaging solutions and services. HarbourVest co-invested with Cornell Capital, a private investment firm focused on the consumer, industrial and financial services sector. Since the initial investment, KDC has completed three acquisitions including HCT Group, reinforcing its position as a critical partner to brand; increasing its global coverage and scale. The Investment Manager likes the investment as KDC benefits from supportive consumer/retail trends, has an attractive financial profile, and has multiple upside levers to create value.
0.6%% of Investment Portfolio at 31 January 2021
$16.8mInvestment value at 31 January 2021
Lytx
Stage: Large BuyoutLocation: US
Driver risk management softwareProvider of telematics software and services to fleets that improve driver behaviour and reduce collision-related expenses by delivering event-based video and driver analytics. HarbourVest originally invested in the Company in 2018 alongside Clearlake Capital Group and subsequently participated in the Permira-led 2020 recapitalization of the company as well, becoming the second largest shareholder in the company. The Investment Manager likes the investment as the company is a clear market leader in telematics with dominant market share, competitive advantages, and visibility on consistent subscriber growth.
0.5%% of Investment Portfolio at 31 January 2021
$14.7mInvestment value at 31 January 2021
AllFunds Bank
Stage: Large BuyoutLocation: Spain
European B2B fund distribution platformAllFunds Bank is among the leading B2B WealthTech platforms, operating a world-class open-architecture platform that provides a marketplace and digital solutions for asset management products. HarbourVest co-invested with Hellman & Friedman, a private equity company focusing on investments in the developed markets. Since the initial investment, AllFunds Bank has completed two transformative M&A transactions, allowing it to more than double its assets and expand into key markets such as Germany, Switzerland, and France. The Investment Manager likes the investment as the company is a market leader in an industry with high barriers to entry and has the potential to create value through geographic expansion, synergistic acquisitions, and new product offerings.
0.5%% of Investment Portfolio at 31 January 2021
$13.3mInvestment value at 31 January 2021
HVPE Annual Report and Accounts 2021 37
ST
RA
TE
GIC
RE
PO
RT
GO
VE
RN
AN
CE
RE
PO
RT
FIN
AN
CIA
L S
TAT
EM
EN
TS
SU
PP
LE
ME
NTA
RY
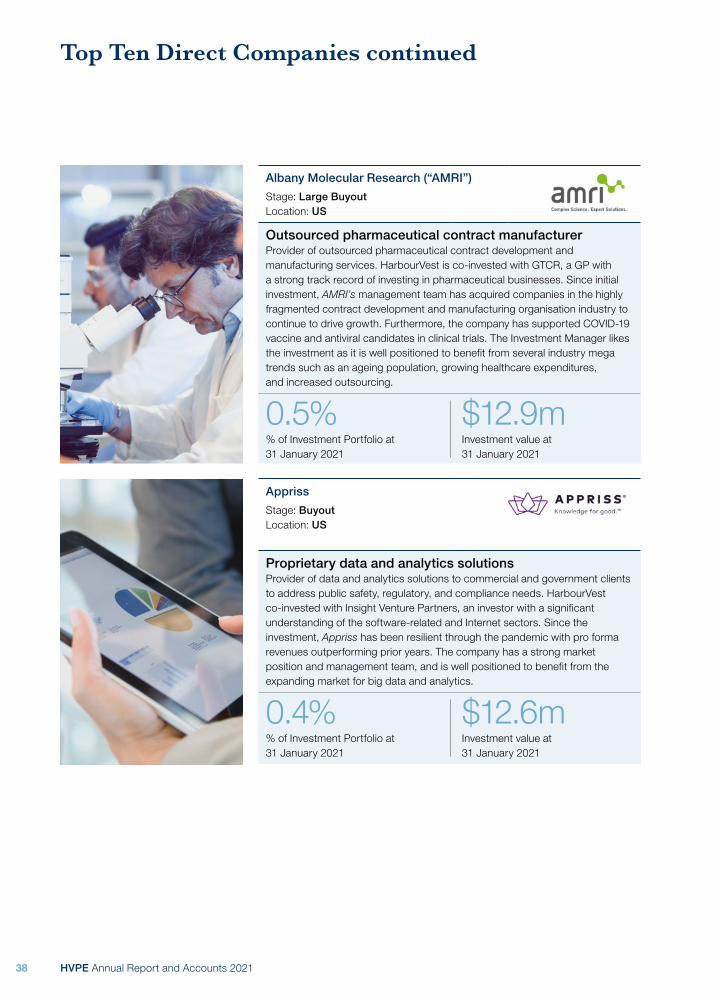
Albany Molecular Research (“AMRI”)
Stage: Large BuyoutLocation: US
Outsourced pharmaceutical contract manufacturerProvider of outsourced pharmaceutical contract development and manufacturing services. HarbourVest is co-invested with GTCR, a GP with a strong track record of investing in pharmaceutical businesses. Since initial investment, AMRI’s management team has acquired companies in the highly fragmented contract development and manufacturing organisation industry to continue to drive growth. Furthermore, the company has supported COVID-19 vaccine and antiviral candidates in clinical trials. The Investment Manager likes the investment as it is well positioned to benefit from several industry mega trends such as an ageing population, growing healthcare expenditures, and increased outsourcing.
0.5%% of Investment Portfolio at 31 January 2021
$12.9mInvestment value at 31 January 2021
Appriss
Stage: BuyoutLocation: US
Proprietary data and analytics solutionsProvider of data and analytics solutions to commercial and government clients to address public safety, regulatory, and compliance needs. HarbourVest co-invested with Insight Venture Partners, an investor with a significant understanding of the software-related and Internet sectors. Since the investment, Appriss has been resilient through the pandemic with pro forma revenues outperforming prior years. The company has a strong market position and management team, and is well positioned to benefit from the expanding market for big data and analytics.
0.4%% of Investment Portfolio at 31 January 2021
$12.6mInvestment value at 31 January 2021
Top Ten Direct Companies continued
HVPE Annual Report and Accounts 202138

SolarWinds
Stage: Large BuyoutLocation: US
IT Management Software Provider of easy to implement, low-cost enterprise-class IT and infrastructure management software to IT professionals. HarbourVest co-invested with Thoma Bravo, a GP with deep experience of the infrastructure software industry. Since the investment, SolarWinds acquired LogicNow becoming the largest managed service provider (“MSP”) solution provider in the market. The company was listed on the New York Stock Exchange in an October 2018 IPO. The Investment Manager likes the investment as it offers a service well positioned to benefit from technology-related mega trends within a growing market.
0.4%% of Investment Portfolio at 31 January 2021
$12.4mInvestment value at 31 January 2021
Ssangyong Cement & Environment
Stage: Medium BuyoutLocation: South Korea
Integrated Cement Manufacturer and DistributorLargest integrated cement company by production capacity and sales volume in South Korea. Ssangyong is publicly listed on the Korean Stock Exchange. HarbourVest co-invested with Hahn & Co, a private equity company specialised in buyouts and corporate restructuring in South Korea. Since the investment, Ssangyong has enhanced its strategic value and profitability generating a strong operating performance. The Investment Manager likes the investment as the company’s scale and production capabilities give it a competitive advantage in the market, there is good visibility on near-term demand, and potential for further operational improvements.
0.4%% of Investment Portfolio at 31 January 2021
$12.2mInvestment value at 31 January 2021
Edelman Financial Engines
Stage: Large BuyoutLocation: US
Wealth Management Services ProviderA robo-advising firm providing financial planning and investment services. Alongside Hellman & Friedman, HarbourVest supported the acquisition of Financial Engines and its merger with Edelman Financial Services, a portfolio company of Hellman & Friedman. The Investment Manager likes the investment as the merger brought together two leading wealth management services providers addressing complementary sub-sets of the asset management market, creating an opportunity to realise cost and revenue synergies. The combined entity is well-positioned to continue driving strong growth across multiple market and strategy vectors, due to tailwinds stemming from the massive US asset management market and a growing preference towards low-fee products, as well as an opportunity to continue expanding AUM through new recordkeeper relationships and plan sponsor penetration.
0.4%% of Investment Portfolio at 31 January 2021
$12.1mInvestment value at 31 January 2021
HVPE Annual Report and Accounts 2021 39
ST
RA
TE
GIC
RE
PO
RT
GO
VE
RN
AN
CE
RE
PO
RT
FIN
AN
CIA
L S
TAT
EM
EN
TS
SU
PP
LE
ME
NTA
RY

Board of Directors
Edmond (“Ed”) Warner
Chair, Independent Non-Executive Director, appointed August 2019
Francesca Barnes
Independent Non-Executive Director, appointed April 2017
Elizabeth (“Libby”) Burne
Independent Non-Executive Director, appointed March 2021
Carolina Espinal
Non-Executive Director, appointed July 2019
Key relevant skills:/ Leadership skills/ Investment strategist / Extensive financial services
experience
Ed Warner has extensive financial services experience from years spent in senior positions at several investment banks and financial institutions, including IFX Group, Old Mutual plc, NatWest Markets, and Dresdner Kleinwort Benson.
He also has considerable PLC experience and has chaired the boards at a range of prominent organisations. He is currently Chair of Air Partner PLC, an aviation services business, online derivatives exchange LMAX, and the BlackRock Energy and Resources Income Trust. Prior chairman roles include Grant Thornton UK LLP, Standard Life Private Equity Trust, and Panmure Gordon & Co.
Committees: Chair of the Nomination Committee and Member of the Management Engagement and Service Provider, and Inside Information Committees.
Key relevant skills:/ Extensive private equity
investment experience/ Nine years’ governance
experience on public and private company boards
/ Risk management experience
Francesca Barnes is a Non-Executive Director of NatWest Holdings Limited, Coutts & Company and a number of NatWest Group’s other ring-fenced bank boards, as well as Capvis private equity. She is a member of the University of Southampton council and recently stood down as Chair of Trustees for Penny Brohn UK. Previously, Francesca spent 16 years at UBS AG. For the latter seven of these she served as Global Head of Private Equity, following on from senior positions in restructuring and loan portfolio management. Prior to this, she spent 11 years with Chase Manhattan UK and US, in roles spanning commodity finance, financial institutions, and private equity.
Committees: Chair of the Management Engagement and Service Provider Committee and Member of the Audit and Risk, and Nomination Committees.
Key relevant skills:/ Chartered Certified
accountant/ Extensive audit and risk
management experience/ 20 years’ experience of
working with Guernsey regulated, listed, closed-ended investment structures
Libby Burne joined the Board of Directors on 1 March 2021. Prior to her appointment Libby was an audit director at PwC in the Channel Islands and, previously, PwC Australia. Over her career Libby has worked with countless global clients on strategic, financial, risk, and corporate governance matters. As an audit director she led the audits of investment vehicles listed on the London Stock Exchange and Australian Stock Exchange as well as many private alternative asset structures and insurance companies. Libby is a Fellow of the Association of Chartered Certified Accountants, holds a degree in Applied Accounting, and is a Guernsey resident, as such bringing recent and relevant financial and sector experience.
Committees: Member of the Audit and Risk, Nomination, and Management Engagement and Service Provider Committees.
Key relevant skills:/ 18 years’ private equity
investment experience/ Responsibility for strategy
and business development of European and global primary businesses
/ Lead Director for ESG factors
Carolina Espinal joined HarbourVest in 2004 to focus on partnership investments in Europe and other emerging markets and became a Managing Director in 2015. Carolina focuses on managing European venture capital and buyout partnership investments and has collaborated with the secondary and co-investment groups on several investment opportunities. As a HarbourVest executive she currently serves on the advisory boards of funds managed by Abénex Capital, ECI, Inflexion, and Advent International.
Her previous experience includes two years as a financial analyst with the Merrill Lynch Energy and Power M&A team in Houston.
Carolina graduated from Rice University with a BA in Managerial Studies, Policy Studies, and Economics in 2000. She received an MSc in Finance from the London Business School in 2003.
Committees: None (as a HarbourVest executive)
HVPE Annual Report and Accounts 202140

Alan Hodson
Senior Independent Non-Executive Director, appointed April 2013
Andrew Moore
Independent Non-Executive Director, appointed October 2007
Steven Wilderspin
Independent Non-Executive Director, appointed May 2018
Peter Wilson
Non-Executive Director, appointed May 2013
Key relevant skills:/ Knowledge of listed
equity markets/ Experience on several
investment company boards/ Strong background in
governance and risk management
Alan Hodson is Chairman of Charity Bank. Alan joined Rowe and Pitman (subsequently SG Warburg, SBC, and UBS) in 1984 and worked in a range of roles, all related to listed equity markets. He became Global Head of Equities in April 2001 and was a member of the Executive Committee of UBS Investment Bank and of the UBS AG Group Managing Board. He retired from UBS in June 2005 and has since held positions on a variety of commercial and charity boards.
Committees: Member of the Audit and Risk, Nomination, and Management Engagement and Service Provider Committees.
Key relevant skills:/ Extensive experience as an
executive and non-executive director of regulated entities
/ Risk management experience
/ Former head of a fund administration business
Andrew Moore is Group Chairman of Cherry Godfrey Holdings Limited, Group Chairman of Sumo Limited and a Director of Sumo Acquisitions Limited and Sumo Holdings Limited. Andrew joined Williams & Glyns Bank, which subsequently became The Royal Bank of Scotland, after obtaining a diploma in business studies. He moved to Guernsey to establish and act as Managing Director of a trust company for The Royal Bank of Scotland in 1985. During his career, Andrew held a range of senior management positions, including acting as head of corporate trust and fund administration businesses for The Royal Bank of Scotland in Guernsey, Jersey, and the Isle of Man, which provided services to many offshore investment structures holding a wide variety of asset classes. Andrew has over 30 years of experience as both an executive and non-executive director of companies including investment funds and banks.
Committees: Member of the Audit and Risk, Nomination, and Management Engagement and Service Provider Committees.
Key relevant skills:/ Chartered accountant,
qualified in audit/ Extensive governance
experience on public and private company boards
Steven Wilderspin has more than ten years’ experience as a Non-Executive Director on the boards of private equity partnerships and listed investment companies. Steven, a qualified Chartered Accountant, has provided independent directorship services since April 2007. He has served on a number of private equity, property, and hedge fund boards as well as commercial companies. Steven currently serves as the Chairman of the risk committee of Blackstone Loan Financing Limited and Chairman of the audit and risk committee of GCP Infrastructure Investments Limited. In December 2017 Steven stepped down from the Board of 3i Infrastructure plc, where he was Chairman of the Audit and Risk committee, after ten years’ service. From 2001 until 2007, Steven was a Director of fund administrator Maples Finance Jersey Limited, where he was responsible for fund and securitisation structures. Steven has recent and relevant financial and sector experience.
Committees: Chair of the Audit and Risk Committee, and Member of the Inside Information, Nomination, and Management Engagement and Service Provider Committees.
Key relevant skills:/ Member of HarbourVest’s
two-person Executive Management Committee (“EMC”), including responsibility for HarbourVest’s corporate strategy
/ 24 years’ private equity industry knowledge and experience
Peter Wilson joined HarbourVest’s London team in 1996 and is one of two members of the firm’s EMC. He co-leads secondary investment activity in Europe and is a member of the HarbourVest Europe Investment Committee. He serves on the advisory committees for partnerships managed by Baring Vostok Capital Partners, CVC Capital Partners, Holtzbrinck Ventures, and Index Venture Management. He also served as founding Chair of the Board of Trustees of City Year UK Limited.
Prior to joining the firm, he spent three years working for the European Bank for Reconstruction and Development, where he originated and managed two regional venture capital funds in Russia. Peter also spent two years at the Monitor Company, a strategy consulting firm based in Cambridge, Massachusetts.
He received a BA (with honours) from McGill University in 1985 and an MBA from Harvard Business School in 1990.
Committees: None (as a HarbourVest executive)
ST
RA
TE
GIC
RE
PO
RT
GO
VE
RN
AN
CE
RE
PO
RT
FIN
AN
CIA
L S
TAT
EM
EN
TS
SU
PP
LE
ME
NTA
RY
HVPE Annual Report and Accounts 2021 41

Directors’ Report
Annual Report and Audited Consolidated Financial StatementsThe Directors present their report and the Audited Consolidated Financial Statements (the “Financial Statements” or “Accounts”) for the year ended 31 January 2021.
A description of important events and principal activities which have occurred during the financial year and their impact on the performance of the Company, as shown in the Financial Statements, is provided in the Strategic Report, beginning with the Chair’s Statement on page 4. A description of the emerging and principal risks and uncertainties facing the Company, together with an indication of the Company’s likely future development and the important events that have occurred since the end of the financial year, is also provided in the Strategic Report and referenced in the notes to the Financial Statements. Combined, all sections in this document constitute the “Annual Report”.
Corporate SummaryThe Company is a closed-ended investment company incorporated in Guernsey on 18 October 2007 with an unlimited life. The Company currently has one class of shares (the “Ordinary Shares”) and these shares are admitted to trading on the Main Market of the London Stock Exchange.
With effect from 10 December 2018, the Company introduced an additional US dollar market quotation which operates alongside the Company’s existing sterling quotation, allowing shares to be traded in either currency.
Investment Objective and Investment Policy The Company’s investment objective is to generate superior shareholder returns through long-term capital appreciation by investing primarily in a diversified portfolio of private equity investments. The Company may also make investments in private market assets other than private equity where it identifies attractive opportunities.
The Company seeks to achieve its investment objective primarily by investing in investment funds managed by HarbourVest, which invests in or alongside third-party managed investment funds (“HarbourVest Funds”). HarbourVest Funds are broadly of three types: (i) “Primary HarbourVest Funds”, which make limited partner commitments to underlying private market funds prior to final closing; (ii) “Secondary HarbourVest Funds”, which make purchases of private market assets by acquiring positions in existing private market funds or by acquiring portfolios of investments made by such private market funds; and (iii) “Direct HarbourVest Funds”, which invest into operating companies, projects, or assets alongside other investors.
In addition, the Company may, on an opportunistic basis, make investments (generally at the same time and on substantially the same terms) alongside HarbourVest Funds (“Co-investments”) and in closed-ended listed private equity funds not managed by HarbourVest (“Third-Party Funds”). Co-investments made by the Company may, inter alia, include investments in transactions structured by other HarbourVest vehicles including, but not limited to, commitments to private market funds or operating companies in which other HarbourVest funds have invested.
Cash at any time not held in such longer-term investments will, pending such investment, be held in cash, cash equivalents, money market instruments, government securities, asset-backed securities, and other investment-grade securities and interests in any private equity vehicle that is listed or traded on any securities exchange (‘‘Temporary Investments’’).
The Company uses an over-commitment strategy in order to remain as fully invested as possible. To achieve this objective, the Company has undrawn capital commitments to HarbourVest Funds and Co-investments which exceed its liquid funding resources, but uses its best endeavours to maintain capital resources which, together with anticipated cash flows, will be sufficient to enable the Company to satisfy such commitments as they are called.
Diversification and Investment Guidelines The Company will, by investing in a range of HarbourVest Funds, Co-investments, and Third-Party Funds, seek to achieve portfolio diversification in terms of:
/ geography: providing exposure to assets in the US, Europe, Asia, and other markets;
/ stage of investment: providing exposure to investments at different stages of development such as early stage, balanced and late stage venture capital, small and middle-market businesses or projects, large capitalisation investments, mezzanine investments, and special situations such as restructuring of funds or distressed debt;
/ strategy: providing exposure to primary, secondary, and direct co-investment strategies;
/ vintage year: providing exposure to investments made across many years; and
/ industry: with investments exposed, directly or indirectly, to a large number of different companies across a broad array of industries.
HVPE Annual Report and Accounts 202142
In addition, the Company will observe the following investment restrictions:
/ With the exception, at any time, of not more than one HarbourVest Fund or Co-investment to which up to 40% of the Company’s Gross Assets (see page 84 for the definition) may be committed or in which up to 40% of the Company’s Gross Assets may be invested, no more than 20% of the Company’s Gross Assets will be invested in or committed at any time to a single HarbourVest Fund or Co-investment.
/ No more than 10% of the Company’s Gross Assets will be invested (in aggregate) in Third-Party Funds.
/ The Investment Manager will use its reasonable endeavours to ensure that no more than 20% of the Company’s Gross Assets, at the time of making the commitment, will be committed to or invested in, directly or indirectly, whether by way of a Co-investment or through a HarbourVest Fund, (a) any single ultimate underlying investment, or (b) one or more collective investment undertakings which may each invest more than 20% of the Company’s Gross Assets in other collective investment undertakings (ignoring, for these purposes, appreciations and depreciations in the value of assets, fluctuations in exchange rates, and other circumstances affecting every holder of the relevant asset).
/ Any commitment to a single Co-investment which exceeds 5% of the Company’s NAV (calculated at the time of making such commitment) shall require prior Board approval, provided however that no commitment shall be made to any single Co-investment which, at the time of making such commitment, represents more than 10% (or, in the case of a Co-investment that is an investment into an entity which is not itself a collective investment undertaking (a “Direct Investment”), 5%) of the aggregate of: (a) the Company’s NAV at the time of the commitment; and (b) undrawn amounts available to the Company under any credit facilities.
/ The Company will not, without the prior approval of the Board, acquire any interest in any HarbourVest Fund from a third party in a secondary transaction for a purchase price that:
(i) exceeds 5% of the Company’s NAV; or(ii) is greater than 105% of the most recently reported NAV
of such interest (adjusted for contributions made to and distributions made by such HarbourVest Fund since such date).
Save for cash awaiting investment which may be invested in Temporary Investments, the Company will invest only in HarbourVest Funds (either by subscribing for an interest during the initial offering period of the relevant fund or by acquiring such an interest in a secondary transaction), in Co-investments or in Third-party Funds.
Company’s Right to Invest in HarbourVest FundsPursuant to contractual arrangements with HarbourVest, the Company has the right to invest in each new HarbourVest Fund, subject to the following conditions:
/ Unless the Board agrees otherwise, no capital commitment to any HarbourVest Fund may, at the time of making the commitment, represent more than 35% or less than 5% of the aggregate total capital commitments to such HarbourVest Fund from all its investors.
/ Unless HarbourVest agrees otherwise, the Company shall not have a right to make an investment in, or a commitment to, any HarbourVest Fund to which ten or fewer investors (investors who are associates being treated as one investor for these purposes) make commitments.
LeverageThe Company does not intend to have on its balance sheet aggregate leverage outstanding at Company level for investment purposes at any time in excess of 20% of the Company’s NAV. At 31 January 2021, HVPE’s drawings on the credit facility for cash management purposes represented approximately 4% of NAV. As at 27 May 2021 the amount drawn remained at approximately 4% of NAV. The Company may use additional borrowings for cash management purposes, or in the event of a material downturn. These borrowings could be for extended periods of time depending on market conditions.
Principal Risks and UncertaintiesThe principal risks the Board has reviewed are disclosed on pages 26 and 27 of the Strategic Report.
Results and DividendThe results for the financial year ended 31 January 2021 are set out in the Consolidated Statements of Operations within the Financial Statements on page 68. In accordance with the investment objective of the Company to generate superior shareholder returns through long-term capital appreciation, the Directors did not declare any dividends during the year under review and the Directors do not recommend the payment of dividends as at the date of this report.
ST
RA
TE
GIC
RE
PO
RT
GO
VE
RN
AN
CE
RE
PO
RT
FIN
AN
CIA
L S
TAT
EM
EN
TS
SU
PP
LE
ME
NTA
RY
HVPE Annual Report and Accounts 2021 43
Directors’ Report continued
DirectorsThe Directors as shown on pages 40 and 41 all held office throughout the entire reporting period, except for Ms Burne who was appointed with effect from 1 March 2021. All Directors listed were in place at the date of signature of this Annual Report. Ms Espinal and Mr Wilson are Managing Directors of HarbourVest Partners (UK) Limited, a subsidiary of HarbourVest Partners, LLC. All Directors, other than Ms Espinal and Mr Wilson, are considered to be independent. Mr Hodson is the Senior Independent Director. Further details of the Board composition and rationale for one Director having served more than nine years (Mr Moore) can be found on page 51, noting, however, that he will be stepping down at HVPE’s upcoming AGM.
Save as disclosed in this Annual Report, the Company is not aware of any other potential conflicts of interest between any duty of any of the Directors owed to it and their respective private interests.
Directors’ Interests in Shares31 January
202131 January
2020
Francesca Barnes 4,200 2,000
Carolina Espinal 1,6961 696
Alan Hodson 30,000 30,000
Andrew Moore 14,400 14,400
Ed Warner 8,000 3,000
Steven Wilderspin 1,300 1,300
Peter Wilson 25,000 25,000
1 Of the total shares held, 696 shares were split equally between Carolina’s three children, with Carolina holding 1,000 shares.
Ms Burne was appointed as a Director with effect from 1 March 2021. At the date of her appointment she held 786 HVPE shares; this amount remains unchanged as at 27 May 2021.
There have been the following changes in Directors’ interests between 31 January 2021 and the date of signing of this report.
Changes to Directors’ Interests in Shares27 May
202131 January
2021
Carolina Espinal 2,4462 1,696
2 Of the total shares held, 1,446 shares were split equally between Carolina’s three children, with Carolina holding 1,000 shares.
Substantial ShareholdersThe table that follows shows the interests of major shareholders based on the best available information provided by the analysis of the Company’s share register, incorporating any disclosures provided to the Company in accordance with Disclosure Guidance and Transparency Rule (“DTR”) 5 in the period under review and up to 5 May 2021.
% of Voting Rights
31 January 2021
% of Voting Rights5 May2021
Quilter PLC 12.85 12.79
State Teachers Retirement System of Ohio 9.82 7.25
M&G (Prudential) 9.31 8.37
City of Edinburgh Council 5.55 5.55
Total 37.53 33.96
Corporate GovernanceThe Board recognises the importance of sound corporate governance and follows best-practice requirements wherever possible. The Company complies with the AIC Code published in February 2019, which is endorsed by the Financial Reporting Council (“FRC”). A Statement of Compliance with the AIC Code is provided on page 58 and further details about how our Corporate Governance framework operates can be found throughout this Governance Report.
Corporate ResponsibilityThe Board considers the ongoing interests of stakeholders and investors through open and regular dialogue with the Investment Manager. The Board receives regular updates outlining regulatory and statutory developments and responds as appropriate.
Approach to ESGThe Board recognises the critical importance of ESG considerations to many investors. It acknowledges that ESG issues can present both opportunities and threats to long-term investment performance and is committed to responsible and sustainable investing. The Board also believes that HVPE will benefit from the continued evolution of HarbourVest’s ESG practices and standards.
The Board is aware that as an investment company, its approach to ESG matters is materially informed by the strategy of the Investment Manager and accordingly the Board is committed to ensuring that it has appointed an Investment Manager that applies the highest standards of ESG practice and has the skill and vision to respond to ongoing developments. It is confident that in HarbourVest it has such an Investment Manager.
HVPE Annual Report and Accounts 202144

The Board is reliant on the Investment Manager’s screening processes, controls and priorities to address ESG matters within the investment portfolio in both the selection and oversight of investments. The Board believes that engagement with management of investee companies and funds is an effective way of driving meaningful change and takes considerable comfort from the extent of the Investment Manager’s activity in this area, which is described on pages 13 to 15.
The Board receives regular updates from the Investment Manager on the development and implementation of its ESG policies and processes and the Board will continue to monitor those closely. These updates include information on the levels of engagement with investee companies and ESG issues in respect of their monitoring and selection of holdings in the Company’s portfolio. This provides a valuable opportunity for the Board to confirm and challenge the Investment Manager to demonstrate that it is continuing to apply the highest standards of ESG practice across its investments and operations.
The Board recognises that the Investment Manager has been a signatory to the UN Principles for Responsible Investment (”PRI”) since 2013, that it is committed to considering the potential impact that its investment and operational decisions could have, and that it encourages the GPs with which it invests to adopt the PRI. With regard to environmental and climate disclosures, the Investment Manager has started to report annually on its progress through its ESG report in line with the Recommendations of the TCFD. The Board has noted that the Investment Manager is a CarbonNeutral® company in accordance with The CarbonNeutral Protocol, a leading framework for carbon neutrality. The Investment Manager’s offsetting programme delivers finance to emission reduction projects, supporting the transition to a low carbon economy. Finally, the Board also reviews the Investment Manager’s approach to promoting diversity, social responsibility, and projects to combat social exclusion and enhance opportunities.
The Board is committed to incorporating ESG oversight across the Company’s outsourced providers and within its own operations. Ms Espinal is the HVPE Director responsible for ESG matters. She helps to promote closer monitoring and further development in this area for the Company.
The Company’s oversight of outsourced providers has been expanded to include questions and confirmations in respect of their ESG policies as part of its annual review of providers.
As an investment company with no direct employees, the core of the Company’s ESG initiatives is derived from its oversight of its service providers, most importantly the Investment Manager. However, the Board also considers the application of ESG standards to its own activities as an Investment Company, including the following:
/ Carbon Footprint: The Board has initiated a project to calculate its own carbon footprint with a view to achieving Carbon Neutral status, and will provide an update to shareholders in due course.
/ Relations with Stakeholders: The Board will extend its interaction with its shareholders and other stakeholders to include a consideration of ESG matters. The Board has noted the governance and environmental benefits of broader shareholder participation facilitated by virtual shareholder events and will explore continuing to offer remote access where possible.
/ Diversity and Inclusion: The Board’s approach to diversity and inclusion is set out on page 51 and is reflected in the activities of the Nomination Committee. 43% of the Directors who are being proposed for re-election at the AGM are female, a figure well above the level recommended in the Hampton-Alexander Review. While it does not have a diversity target in mind, given the range of factors that this term necessarily covers, the Board will consider actively prioritising diversity in its next recruitment process.
/ Position on Modern Slavery: The Board recognises the importance of the issues which the UK Modern Slavery Act 2015 is designed to address. It will expand its oversight of outsourced providers, including the Investment Manager, to include questions relating to their policies to combat Modern Slavery.
Significant Votes Against Policy The Directors have adopted a policy whereby should 20% or more of votes be cast against a recommendation made by the Board for a resolution, the Company shall:
/ explain, when announcing voting results, what actions it intends to take to consult shareholders in order to understand the reasons behind the result;
/ no later than six months after the shareholder meeting publish an update on the views received from shareholders and actions taken; and
/ provide a final summary in the Annual Report and, if applicable, in the explanatory notes to resolutions at the next shareholder meeting state what impact the feedback has had on the decisions the Board has taken and any actions or resolutions proposed.
No significant votes were received against any Board recommended resolution at the 2020 AGM.
ST
RA
TE
GIC
RE
PO
RT
GO
VE
RN
AN
CE
RE
PO
RT
FIN
AN
CIA
L S
TAT
EM
EN
TS
SU
PP
LE
ME
NTA
RY
HVPE Annual Report and Accounts 2021 45

Directors’ Report continued
Anti-bribery PolicyThe Directors have undertaken to operate the business in an honest and ethical manner, and accordingly take a zero-tolerance approach to bribery and corruption, including the facilitation of corporate tax evasion. The key components of this approach are implemented as follows:
/ The Board is committed to acting professionally, fairly and with integrity in all its business dealings and relationships.
/ The Company implements and enforces effective procedures to counter bribery.
/ The Company requires all its service providers and advisers to adopt equivalent or similar principles.
Disclosures Required Under LR 9.8.4R The Financial Conduct Authority’s Listing Rule 9.8.4R requires that the Company includes certain information relating to arrangements made between a controlling shareholder and the Company, waivers of Directors’ fees, and long-term incentive schemes in force. The Directors confirm that there are no disclosures to be made in this regard.
Investment ManagerA description of how the Company has invested its assets, including a quantitative analysis, may be found on pages 1 to 39, with further information disclosed in the Notes to the Financial Statements on pages 75 to 83. The Board has considered the appointment of the Investment Manager and, in the opinion of the Directors, the continuing appointment of the Investment Manager on the terms agreed is in the interests of its shareholders as a whole.
In considering this appointment, the Board has reviewed the past performance of the Investment Manager, the engagement of the Investment Manager with shareholders and the Board, and the strategic plan presented to the Board by the Investment Manager.
The Investment Manager is HarbourVest Advisers L.P. and the principal contents of the Investment Management Agreement (“IMA”) are as follows:
/ to manage the assets of the Company (subject always to control and supervision by the Board and subject both to the investment policy of the Company and any restrictions contained in any prospectuses published by the Company);
/ to assist the Company with shareholder liaison;/ to monitor compliance with the Investment Policy on
a regular basis; and/ to nominate up to two Board representatives for election by
shareholders at the Company’s AGM.
The Investment Manager is not entitled to any direct remuneration (save expenses incurred in the performance of its duties) from the Company, instead deriving its fees from the management fees and carried interest payable by the
Company on its investments in underlying HarbourVest Funds. The IMA, which was amended and restated on 30 July 2019, may be terminated by either party by giving 12 months’ notice. In the event of termination within ten years and three months of the date of the listing on the Main Market, the Company would be required to pay a contribution, which would have been $3.9 million at 31 January 2021 and $3.7 million as at 30 April 2021, as reimbursement of the Investment Manager’s remaining unamortised IPO costs. In addition, the Company would be required to pay a fee to the Investment Manager equal to the aggregate of the management fees for the underlying investments payable over the course of the 12-month period preceding the effective date of such termination.
Delegation of ResponsibilitiesUnder the IMA, the Board has delegated to the Investment Manager substantial authority for carrying out the day-to-day management and operations of the Company, including making specific investment decisions, subject at all times to the control of, and review by, the Board. In particular, the IMA provides that the Board and the Investment Manager shall agree a strategy mandate which sets out a rolling five-year plan for the Company. The Board is responsible for the overall leadership of the Company and the setting of its values and standards. This includes setting the investment and business strategy and ongoing review of the Company’s investment objective and investment policy, along with recommending to shareholders the approval of alterations thereto. Matters reserved for the Board include areas such as the Board and Committee membership, including the review and authorisation of any conflicts of interest arising. Areas such as approval of the raising of new capital, major financing facilities, and approval of contracts that are not in the ordinary course of business are also reserved for the Board, together with any governance and regulatory requirements. Any changes in relation to the capital structure of the Company, including the allotment and issuance of shares, are the responsibility of the Board.
Share Repurchase ProgrammeAt the 2020 AGM, held on 22 July 2020, the Directors were granted authority to repurchase 11,971,387 Ordinary Shares (being equal to 14.99% of the aggregate number of Ordinary Shares in issue at the date of the AGM) for cancellation, or to be held as treasury shares. This authority, which has not been used, will expire at the upcoming AGM. The Directors intend to seek annual renewal of this authority from shareholders.
HVPE Annual Report and Accounts 202146

Introduction to the Going Concern and Viability StatementSince the inception of HVPE, the Directors have relied upon model scenarios to manage the Company’s liquidity requirements and balance sheet risk more generally. This modelling also allows the Directors to evaluate whether the Company is a Going Concern, as well as assess its Viability. While the modelling process has been refined over the years, it has provided a consistent approach through which the Directors have been able to make these assessments, as demonstrated through the GFC and the more recent COVID-19 pandemic. The Investment Manager typically updates the model scenarios annually in November, projecting NAV growth and cash flow for the subsequent five-year period. As highlighted on page 12, the onset of COVID-19 and the subsequent portfolio assessment undertaken by the Investment Manager, led the Company to also revise its models in May 2020. For the purpose of assessing the Going Concern and the Viability Statements over the respective assessment periods, the Investment Manager utilised the four model scenarios (Extreme Downside, Low, Base and Optimistic) presented to the Board in November 2020, which extend over the next five-year period through to 31 December 2025, and reflect the unexpectedly fast rebound following the initial COVID-19 shock. These were updated to reflect actual cash flows through to December 2020.
Going ConcernAfter due consideration, the Directors are satisfied that it is appropriate to continue to adopt the going concern basis in preparing the Financial Statements. This has been concluded following a review of the model scenarios presented by the Investment Manager compared to actual cash flows to date, making due enquiries of the Investment Manager, and being mindful of the closed-ended structure of the Company with no fixed life, as well as the nature of its investments. On this basis, the Directors consider that the Company is able to continue in operation for at least the next 12 months from the approval date of the Financial Statements. The Board monitors and manages its ongoing commitments via the criteria set out on pages 42 and 43 and reviews reports from the Investment Manager detailing ongoing commitments and the Investment Pipeline.
Furthermore, the Board, as part of its regular review of the Consolidated Statement of Assets and Liabilities and debt position, regularly considers the model scenario outputs that are based on a look-through to the anticipated underlying fund and portfolio cash flows.
Viability StatementPursuant to the UK Corporate Governance Code 2018 and the AIC Code, the Board has assessed the viability of the Company over the period from 31 January 2021 to 31 December 2025, which aligns with the timing of the Investment Manager’s current five-year model scenarios. Whilst the Board has no reason to believe that the Company will not be viable over a longer period, it has chosen this period as it aligns with the Board’s strategic horizon and is within the term of the Company’s credit facility.
The Company’s investment objective is to generate superior shareholder returns through long-term capital appreciation by investing primarily in a diversified portfolio of private markets investments. The majority of the Company’s investments are in HarbourVest managed private equity fund-of-funds, which have fund lives of 10 to 14 years.
While the Company’s investment lifecycle spans a time period of ten years or more, the Board currently focuses on a time period extending through to 31 December 2025 when considering the strategic planning of the Company. The strategic planning centres on building a portfolio of long-term assets through capital allocation into a set of rolling five-year calendar year end portfolio construction targets defined by investment stage, geography, and strategy. This rolling five-year process allows the Board a medium-term view of potential growth, projected cash flow and potential future commitments under various economic scenarios.
As part of its strategic planning, the Board considered model scenarios as explained above assuming varying degrees of impact on the portfolio. The Board primarily focused on two scenarios, the Base and Extreme Downside, the latter of which is a worst-case scenario that assumes large NAV declines and a material reduction in realisations from the underlying investment portfolio. Based on the unexpectedly robust recovery following the initial shock related to COVID-19, the Board concluded that the Company’s cash balance and available credit facility would be sufficient to cover capital requirements under even the Extreme Downside scenario. The results of this modelling showed that the Company would be viable in the face of these scenarios occurring over the period ending 31 December 2025.
ST
RA
TE
GIC
RE
PO
RT
GO
VE
RN
AN
CE
RE
PO
RT
FIN
AN
CIA
L S
TAT
EM
EN
TS
SU
PP
LE
ME
NTA
RY
HVPE Annual Report and Accounts 2021 47

Statement of Directors’ Responsibilities in Respect of the Financial Statements
The Directors are required to prepare Financial Statements for each financial year which give a true and fair view of the assets, liabilities, financial position, and profit or loss of the Company in accordance with US GAAP at the end of the financial year and of the gain or loss for that period. In preparing those Financial Statements, the Directors are required to:
/ select suitable accounting policies and apply them consistently;
/ make judgements and estimates that are reasonable and prudent;
/ state whether applicable accounting standards have been followed subject to any material departures disclosed and explained in the Financial Statements; and
/ prepare the Financial Statements on the going concern basis unless it is inappropriate to presume that the Company will continue in business.
The Directors are responsible for keeping proper accounting records which disclose with reasonable accuracy at any time the financial position of the Company and enable them to ensure that the Financial Statements have been properly prepared in accordance with The Companies (Guernsey) Law, 2008. They are also responsible for safeguarding the assets of the Company and hence for taking reasonable steps for the prevention and detection of fraud and other irregularities.
The Directors are responsible for ensuring that the Annual Report and Financial Statements include the information required by the Listing Rules and the Disclosure Guidance and Transparency Rules of the Financial Conduct Authority (together “the Rules”). They are also responsible for ensuring that the Company complies with the provisions of the Rules which, with regard to corporate governance, require the Company to disclose how it has applied the principles, and complied with the provisions, of the corporate governance code applicable to the Company.
Disclosure of Information to the AuditorSo far as each of the Directors is aware, there is no relevant audit information of which the Company’s auditor is unaware, and each has taken all the steps they ought to have taken as a Director to make themselves aware of any relevant audit information and to establish that the Company’s auditor is aware of that information.
Responsibility StatementThe Board of Directors, as identified on pages 40 and 41, jointly and severally confirm that, to the best of their knowledge:
/ the Financial Statements, prepared in accordance with US GAAP, give a true and fair view of the assets, liabilities, financial position, and profits of the Company and its undertakings;
/ this report includes a fair review of the development and performance of the business and the position of the Company and the undertakings included in the consolidation taken as a whole, together with a description of the principal risks and uncertainties that they face; and
/ the Annual Report and Financial Statements taken as a whole are fair, balanced, and understandable and provide the information necessary for shareholders to assess the Company and its undertakings’ position, performance, business model, and strategy.
Signed on behalf of the Board by:
Ed Warner Chair
27 May 2021
Directors’ Report continued
HVPE Annual Report and Accounts 202148
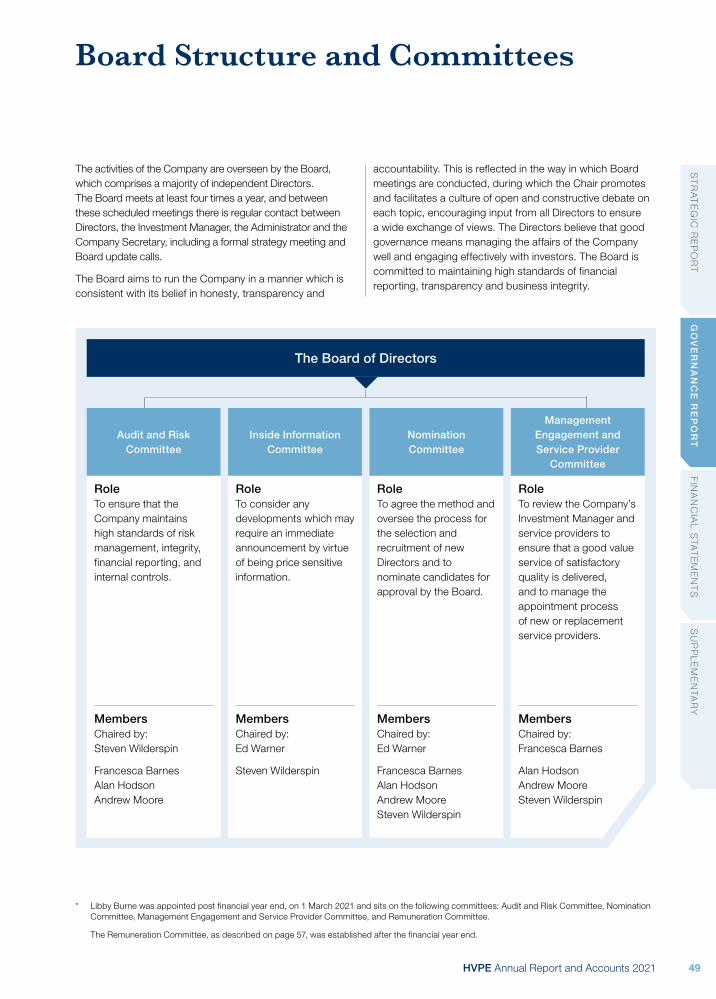
Board Structure and Committees
The activities of the Company are overseen by the Board, which comprises a majority of independent Directors. The Board meets at least four times a year, and between these scheduled meetings there is regular contact between Directors, the Investment Manager, the Administrator and the Company Secretary, including a formal strategy meeting and Board update calls.
The Board aims to run the Company in a manner which is consistent with its belief in honesty, transparency and
accountability. This is reflected in the way in which Board meetings are conducted, during which the Chair promotes and facilitates a culture of open and constructive debate on each topic, encouraging input from all Directors to ensure a wide exchange of views. The Directors believe that good governance means managing the affairs of the Company well and engaging effectively with investors. The Board is committed to maintaining high standards of financial reporting, transparency and business integrity.
Audit and Risk Committee
Management Engagement and Service Provider
Committee
Nomination Committee
Inside Information Committee
Role To ensure that the Company maintains high standards of risk management, integrity, financial reporting, and internal controls.
Role To review the Company’s Investment Manager and service providers to ensure that a good value service of satisfactory quality is delivered, and to manage the appointment process of new or replacement service providers.
Role To agree the method and oversee the process for the selection and recruitment of new Directors and to nominate candidates for approval by the Board.
Role To consider any developments which may require an immediate announcement by virtue of being price sensitive information.
The Board of Directors
Members Chaired by: Steven Wilderspin
Francesca BarnesAlan Hodson Andrew Moore
Members Chaired by: Francesca Barnes
Alan Hodson Andrew Moore Steven Wilderspin
Members Chaired by: Ed Warner
Francesca BarnesAlan HodsonAndrew Moore Steven Wilderspin
Members Chaired by: Ed Warner
Steven Wilderspin
* Libby Burne was appointed post financial year end, on 1 March 2021 and sits on the following committees: Audit and Risk Committee, Nomination Committee, Management Engagement and Service Provider Committee, and Remuneration Committee.
The Remuneration Committee, as described on page 57, was established after the financial year end.
ST
RA
TE
GIC
RE
PO
RT
GO
VE
RN
AN
CE
RE
PO
RT
FIN
AN
CIA
L S
TAT
EM
EN
TS
SU
PP
LE
ME
NTA
RY
HVPE Annual Report and Accounts 2021 49
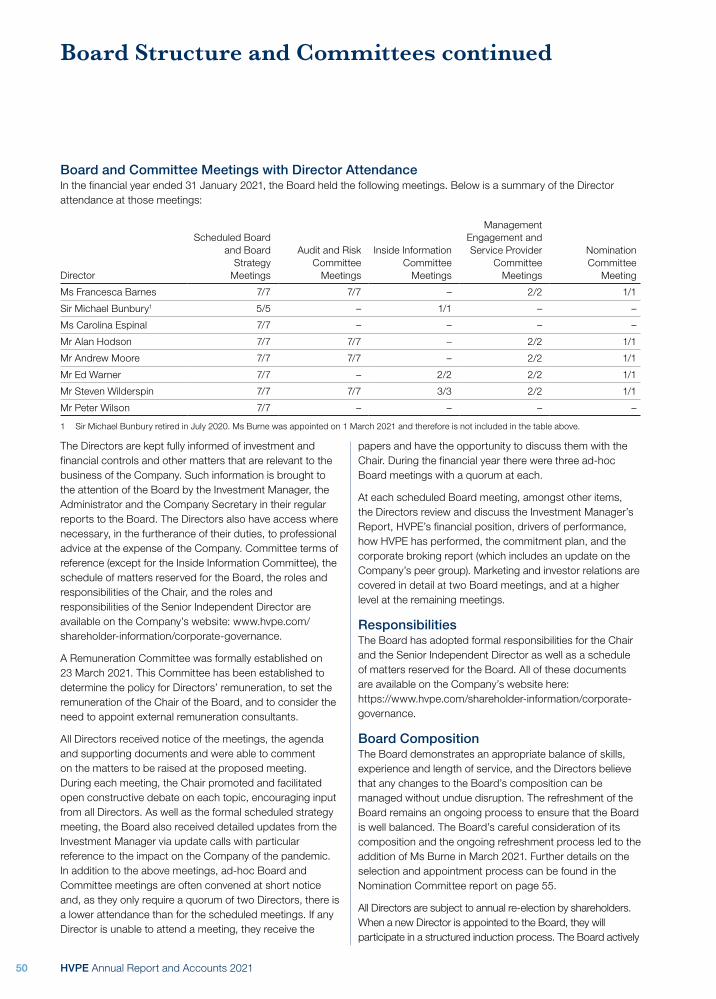
Board and Committee Meetings with Director AttendanceIn the financial year ended 31 January 2021, the Board held the following meetings. Below is a summary of the Director attendance at those meetings:
Director
Scheduled Board and Board
Strategy Meetings
Audit and Risk Committee
Meetings
Inside Information Committee
Meetings
Management Engagement and Service Provider
Committee Meetings
Nomination Committee
Meeting
Ms Francesca Barnes 7/7 7/7 – 2/2 1/1
Sir Michael Bunbury1 5/5 – 1/1 – –
Ms Carolina Espinal 7/7 – – – –
Mr Alan Hodson 7/7 7/7 – 2/2 1/1
Mr Andrew Moore 7/7 7/7 – 2/2 1/1
Mr Ed Warner 7/7 – 2/2 2/2 1/1
Mr Steven Wilderspin 7/7 7/7 3/3 2/2 1/1
Mr Peter Wilson 7/7 – – – –
1 Sir Michael Bunbury retired in July 2020. Ms Burne was appointed on 1 March 2021 and therefore is not included in the table above.
The Directors are kept fully informed of investment and financial controls and other matters that are relevant to the business of the Company. Such information is brought to the attention of the Board by the Investment Manager, the Administrator and the Company Secretary in their regular reports to the Board. The Directors also have access where necessary, in the furtherance of their duties, to professional advice at the expense of the Company. Committee terms of reference (except for the Inside Information Committee), the schedule of matters reserved for the Board, the roles and responsibilities of the Chair, and the roles and responsibilities of the Senior Independent Director are available on the Company’s website: www.hvpe.com/shareholder-information/corporate-governance.
A Remuneration Committee was formally established on 23 March 2021. This Committee has been established to determine the policy for Directors’ remuneration, to set the remuneration of the Chair of the Board, and to consider the need to appoint external remuneration consultants.
All Directors received notice of the meetings, the agenda and supporting documents and were able to comment on the matters to be raised at the proposed meeting. During each meeting, the Chair promoted and facilitated open constructive debate on each topic, encouraging input from all Directors. As well as the formal scheduled strategy meeting, the Board also received detailed updates from the Investment Manager via update calls with particular reference to the impact on the Company of the pandemic. In addition to the above meetings, ad-hoc Board and Committee meetings are often convened at short notice and, as they only require a quorum of two Directors, there is a lower attendance than for the scheduled meetings. If any Director is unable to attend a meeting, they receive the
papers and have the opportunity to discuss them with the Chair. During the financial year there were three ad-hoc Board meetings with a quorum at each.
At each scheduled Board meeting, amongst other items, the Directors review and discuss the Investment Manager’s Report, HVPE’s financial position, drivers of performance, how HVPE has performed, the commitment plan, and the corporate broking report (which includes an update on the Company’s peer group). Marketing and investor relations are covered in detail at two Board meetings, and at a higher level at the remaining meetings.
ResponsibilitiesThe Board has adopted formal responsibilities for the Chair and the Senior Independent Director as well as a schedule of matters reserved for the Board. All of these documents are available on the Company’s website here: https://www.hvpe.com/shareholder-information/corporate-governance.
Board CompositionThe Board demonstrates an appropriate balance of skills, experience and length of service, and the Directors believe that any changes to the Board’s composition can be managed without undue disruption. The refreshment of the Board remains an ongoing process to ensure that the Board is well balanced. The Board’s careful consideration of its composition and the ongoing refreshment process led to the addition of Ms Burne in March 2021. Further details on the selection and appointment process can be found in the Nomination Committee report on page 55.
All Directors are subject to annual re-election by shareholders. When a new Director is appointed to the Board, they will participate in a structured induction process. The Board actively
Board Structure and Committees continued
HVPE Annual Report and Accounts 202150

engaged with the Investment Manager and Company Secretary to ensure that Ms Burne was given a detailed induction process comprising of multiple meetings with the Chair of the Board and Chair of the Audit and Risk Committee, key individuals within the Investment Manager, and other service providers.
With specific reference to Mr Moore’s tenure, which has exceeded nine years, the Board is of the view that Directors can continue beyond this period, noting that they will be subject to continuing scrutiny as to their effectiveness and independence, and, as for all Directors, subject to annual re-election. The Board also believes there is strong value gained by there being a Director on the Board who has served since inception and has a complete historical working knowledge of HVPE. The Board confirms that Mr Moore remains independent of the Investment Manager with no other interests or conflicts with HarbourVest Partners, notwithstanding his years’ service. This is evidenced by his continued constructive challenge of the Investment Manager. However, Mr Moore will step down from the Board at the upcoming AGM.
If a Director wishes to undertake additional external appointments, approval is sought from the Chair in order to confirm that the Director will be able to continue to dedicate sufficient time to carry out their duties as a Director of the Company and to assess any potential conflicts of interest and independence issues.
Tenure PolicyWhen considering its composition, the Board is strongly committed to striking the correct balance between the benefits of continuity, experience and knowledge and those that come from the introduction of Directors with diversity of perspectives and skills. Since the year end the Board has adopted a Tenure Policy confirming its intention that each Director will retire at the AGM immediately following the completion of their ninth year on the Board.
It is acknowledged that there could be unusual circumstances in which a short extension of that time period could be appropriate. In that event, a comprehensive explanation of the circumstances would be provided to stakeholders.
Board and Committees Evaluation The Board undertakes a formal annual evaluation of its performance. This includes the Chair carrying out an individual review with each Director of their performance and contribution, and the Senior Independent Director leading an annual evaluation of the performance of the Chair.
The annual evaluation for the year was conducted internally by way of completion of detailed questionnaires and subsequent one-to-one conversations between the Chair and individual Directors and between the Senior Independent Director and the Chair. The key recommendations arising
from the annual evaluation were then discussed at a Board meeting, and all identified actions are being progressed.
An externally facilitated Board evaluation occurs every three years and is next scheduled to take place in 2022.
Policy on Diversity and InclusionThe Board and Nomination Committee actively consider the diversity of the Board when considering future appointments. The Board is pleased that, with the appointment of Ms Burne, it has exceeded the Hampton-Alexander Review target for 33% female representation on FTSE 350 company boards. The Company has no employees. As noted last year, the Board has also achieved the targeted ethnic diversity by the Parker Review ahead of the 2024 recommendation, with one of its seven Directors seeking re-election at the AGM being from an ethnic minority background.
The Board also recognises that diversity includes racial, socio-economic and other factors such as physical ability, and that different backgrounds and experiences can bring real value to the Company in terms of decision making. While it does not have any specific diversity target in mind, given the range of factors that this term necessarily covers, the Board will consider actively prioritising diversity in its next recruitment process.
27 May 20213 Women5 Men
31 January 20212 Women5 Men
27 May 20211 Black, Asian and minority ethnic7 White
31 January 20211 Black, Asian and minority ethnic6 White
Gender diversity
Ethnicity diversity
ST
RA
TE
GIC
RE
PO
RT
GO
VE
RN
AN
CE
RE
PO
RT
FIN
AN
CIA
L S
TAT
EM
EN
TS
SU
PP
LE
ME
NTA
RY
HVPE Annual Report and Accounts 2021 51

Audit and Risk Committee
About the CommitteeThe Audit and Risk Committee members are outlined on page 49. Ms Barnes, Mr Hodson and Mr Moore each held senior banking roles for a number of years as described in their biographies on pages 40 and 41. Mr Wilderspin is a qualified Chartered Accountant and has over ten years’ experience as an executive and non-executive director on a number of private and listed fund boards as well as commercial companies. Ms Burne became a member of this Committee on 1 March 2021 and is a former auditor with 20 years’ experience. Members are deemed by the Board to have recent and relevant financial and sector experience.
The Audit and Risk Committee is responsible for the review of the Company’s accounting policies, periodic Financial Statements and auditor engagement. The Committee is also responsible for both making appropriate recommendations to the Board, including that the Financial Statements are fair, balanced, and understandable, and for ensuring that the Company complies to the best of its ability with applicable laws and regulations while also adhering to the tenet of generally accepted codes of conduct. The Committee’s terms of reference were extended in 2018 to incorporate responsibility for overseeing the Company’s risk management framework and regulatory compliance.
All of the Company’s management and administration functions are delegated to independent third parties or the Investment Manager and it is therefore felt that it would not be practical or cost effective for the Company to have its own internal audit facility. This matter is reviewed annually. The Audit and Risk Committee does have the power to commission third-party assurance work if it sees fit, but did not do so in the year under review.
Activities of the CommitteeAudit and Risk Committee MeetingsIn the financial year ended 31 January 2021, the Audit and Risk Committee met seven times. A summary of Director attendance is included in the “Board and Committee Meetings with Director Attendance” section on page 50. In these meetings, the Committee considered the following matters:
Independent AuditorThe Audit and Risk Committee reviewed the effectiveness of the external audit process during the year, including audit quality, objectivity (level of challenge and professional scepticism), and independence. This included discussions with the Company’s auditor, Investment Manager, and Company Secretary to review how well the previous year’s audit had gone. The main conclusion from this review was that the audit process had gone well considering the additional problems brought by the pandemic. The extra time allowed by authorities to complete the audit had been
helpful. The Committee was pleased with the engagement with the auditor regarding its work to gain comfort on the Directors’ statements on going concern and viability, and the treatment of these matters in its report. The Committee concluded that Ernst & Young LLP’s appointment as the Company’s auditor should be continued.
The Company’s auditor has been appointed to the Company since 2007 and was reappointed following a competitive tender process in May 2017. The partner responsible for the audit, Mr David Moore, will rotate off HVPE following the audit of these Financial Statements after having served five years, to comply with rotation requirements. The Company’s auditor performed the audit of the Company’s Financial Statements, prepared in accordance with applicable law, US GAAP and audited under both relevant US generally accepted auditing standards (“US GAAS”) and International Standards on Auditing (UK). The audit approach remained substantially unchanged relative to the prior year.
Auditor IndependenceThe Audit and Risk Committee understands the importance of auditor independence and, during the year, the Committee reviewed the independence and objectivity of the Company’s auditor. The Audit and Risk Committee received a report from the external auditor describing its independence, controls and current practices to safeguard and maintain auditor independence. The auditor reported one independence breach relating to a person closely associated with an associate partner of EY in the UK, outside the audit practice, holding a non-material direct financial interest in the Company. This financial interest was disposed of immediately after EY’s compliance procedures picked the matter up. While disappointed, the Audit and Risk Committee was satisfied that the matter was dealt with by EY from a disciplinary and regulatory point of view, and the circumstances of the breach did not compromise the overall assessment that the auditor is independent. Other than fees paid for conducting a review of the Interim Financial Statements, there were no other non-audit fees paid to the auditor by the Company. The Committee has previously adopted a non-audit services policy, due to the adoption of the new Crown Dependency audit rules and guidance. In all cases the Committee reviews the potential engagement of the auditor in advance to ensure that the auditor is the most appropriate party to deliver the proposed services and to put in place safeguards, where appropriate, to manage any threats to auditor independence. This policy was revised after the year end to reflect the fact that the applicable provisions are now mandatory for the Company, and it now includes a cap on the cost of any non-audit services at 70% of the average of the previous three years’ audit fees.
HVPE Annual Report and Accounts 202152

Terms of EngagementThe Audit and Risk Committee reviewed the audit scope and fee proposal set out by the auditor in its audit planning report and discussed the same with the auditor at an Audit and Risk Committee meeting. The Committee considered the proposed fees for Ernst & Young LLP’s audit and interim review work of £212,000 for 2021. Whilst this is an 8.7% increase on the fee quote for its 2020 work, it is a reduction on final 2020 fees of £233,500. The 2020 fees were higher than quoted due to the additional work carried out by the auditor relating to COVD-19 factors, in particular regarding going concern and viability. The auditor made the case that the increase in quote for 2021 is justified because of additional procedures due to changes in auditing standards and the ongoing impact of COVID-19. Having been satisfied by the scope of the engagement letter and fee proposal, the Committee recommended that the Board should approve the fee proposal and letter of engagement.
Internal ControlsThe internal control systems (including those related to cyber security) are designed to meet the Company’s particular needs and the risks to which it is exposed. Accordingly, the internal control systems are designed to manage rather than eliminate the risk of failure to achieve business objectives and by their nature can only provide reasonable and not absolute assurance against misstatement and loss. The Company places reliance on the control environment of its service providers, including its independent Administrator and the Investment Manager. In order to satisfy itself that the controls in place at the Investment Manager are adequate, the Audit and Risk Committee has reviewed the Private Equity Fund Administration Report on Controls Placed in Operation and Tests of Operating Effectiveness (“Type II SOC I Report”) for the period from 1 October 2019 to 30 September 2020 (a bridging letter covers the period 1 October 2020 to 31 January 2021), detailing the controls environment in place at the Investment Manager, as well as ISAE 3402 Reports on Fund Administration, Global and Local Custody Services, Securities Lending Services and Listed Derivatives Clearing Services for the period 1 October 2019 to 30 September 2020 detailing the controls environment in place at the Administrator and Company Secretary. In both of these reports there were minor findings, but the Committee is satisfied that the identified weaknesses were not material to the affairs of the Company, and that the respective service providers had taken action to improve controls in the identified areas. In addition, during the year, the MESPC conducted a detailed review of the performance of the Company’s service providers, including the Investment Manager and Administrator.
The Investment Manager’s Type II SOC I Report describes the internal controls in the HarbourVest Accounting group, which is responsible for maintaining the Company’s accounting records and the production of the accounts contained in the Company’s Financial Statements. The main features of the controls are: clearly documented valuation policies; detailed review of financial reporting from underlying limited partnerships and investee companies; detailed reconciliation of capital accounts in underlying limited partnerships; monthly reconciliation of bank accounts; and a multi-layered review of financial reporting to ensure compliance with accounting standards and other reporting obligations.
Risk ManagementThe Audit and Risk Committee reviewed the Company’s risk management framework during the year, including the impact of COVID-19 on the Company and confirmed it was satisfied that it was appropriate for the Company’s requirements. Further details of the principal risks and uncertainties facing the Company are given on pages 26 and 27. This is in accordance with relevant best practice as detailed in the FRC’s guidance on Risk Management, Internal Control and Related Financial and Business Reporting. During the year, the Committee also considered emerging and topical risks and a “deep-dive” review of balance sheet risk was presented to the Board. The review of balance sheet risk included an analysis of the use of HarbourVest fund-level borrowing and the structural and policy constraints on the amount of such borrowing. Enhanced reporting to the Board was identified and implemented. An annual review of the Company’s credit facility and lenders was also recommended.
Financial RisksThe Company is funded from equity balances, comprising issued Ordinary Share capital, as detailed in Note 1 to the Financial Statements, and retained earnings. The Company has access to borrowings pursuant to the credit facility of up to $600.0 million. As at 27 May 2021 $115.0 million was drawn down. Although the Company’s currency exposure is currently not hedged, the Company’s approach to hedging is kept under periodic review by the Audit and Risk Committee.
The Investment Manager and the Directors ensure that all investment activity is performed in accordance with the investment guidelines. The Company’s investment activities expose it to various types of risks that are associated with the financial instruments and markets in which it invests. Risk is inherent in the Company’s activities and it is managed through a process of ongoing identification, measurement, and monitoring. The financial risks to which the Company is exposed include market risk, credit risk, liquidity risk, and cash flow risk.
ST
RA
TE
GIC
RE
PO
RT
GO
VE
RN
AN
CE
RE
PO
RT
FIN
AN
CIA
L S
TAT
EM
EN
TS
SU
PP
LE
ME
NTA
RY
HVPE Annual Report and Accounts 2021 53

Regulatory ComplianceThe Audit and Risk Committee has engaged with the Administrator’s compliance team to ensure that the Company fulfils its regulatory obligations. A Compliance Monitoring Plan is in place and is regularly reviewed by the Committee.
Audited Financial Statements and Significant Reporting MattersAs part of the 31 January 2021 year-end audit, the Audit and Risk Committee reviewed and discussed the most relevant issues for the Company, most notably the risk of misstatement or manipulation of the valuation of its investments in underlying HarbourVest funds, and the impact of COVID-19, specifically with regard to the Board’s statements on going concern and viability.
The Audit and Risk Committee remains satisfied that the valuation techniques used are appropriate for the Company’s investments and consistent with the requirements of US GAAP. The Audit and Risk Committee ensures the Board is kept regularly informed of relevant updates/changes to US GAAP that impact the Company, including but not limited to valuation principles.
During the year the Audit and Risk Committee kept the risks associated with the pandemic and the measures adopted by HarbourVest and other service providers under review, to ensure continuity of service to the Company. The Committee also reviewed all of the Company’s risks through the lens of COVID-19 and recommended changes to the Company’s risk matrix. These are reflected in the Principal Risks and Uncertainties section on pages 26 and 27.
Corporate GovernanceThe Audit and Risk Committee continues to monitor the Board’s assessment of the Company’s compliance with the AIC Code of Corporate Governance for Investment Companies (the 2019 edition). As outlined in the Chair’s Statement, during the financial year the Board initiated a search for its first dedicated HVPE Head of Corporate Governance and Alexandra Cornforth was appointed in April 2020.
Governance and EffectivenessOn 24 February 2021 the Committee conducted an internal review of its activities against its constitution and terms of reference in respect of the year under review and concluded that all requisite activities had been undertaken. Minor amendments to the terms of reference were proposed and approved. The Board evaluation process included a consideration of its Committees and concluded that they were used effectively.
Other MattersThe Audit and Risk Committee is currently considering the UK Government consultation on “Restoring trust in audit and corporate governance” which contains far-reaching proposals for reform. It will be assessing the implications of the proposals for the Company and will submit a response in due course.
In the current financial year, the Audit and Risk Committee will also be developing further the Company’s risk management methodology.
In presenting this report, I have set out for the Company’s shareholders the key areas that the Committee focuses on. If any shareholders would like any further information about how the Committee operates and its review process, I, or any of the other members of the Audit and Risk Committee, would be pleased to meet and discuss this with them.
Steven Wilderspin Chair of the Audit and Risk Committee
27 May 2021
Audit and Risk Committee continued
HVPE Annual Report and Accounts 202154
Nomination Committee and Management Engagement and Service Provider CommitteeNomination CommitteeAbout the CommitteeThe Nomination Committee was established on 24 November 2015 and is chaired by the Chair of the Company. Its members are outlined on page 49.
There was one scheduled meeting held during the year. All members attended the meeting held. The mandate of the Nomination Committee is to consider issues related to the identification and appointment of Directors to the Board.
Activities of the CommitteeChanges to Board CompositionIn accordance with the approach to succession planning outlined below, Ms Libby Burne was appointed as a Director with effect from 1 March 2021. Sir Michael Bunbury retired in July 2020.
Approach to Succession PlanningTo help facilitate an orderly succession process, the Nomination Committee considered the composition requirements of the Board to ensure the requisite skills, knowledge, experience, and diversity were appropriate. Following this it prepared a role profile for a new Director and engaged Thomas & Dessain, recruitment consultants, to undertake the search. The Committee reviewed a long list of candidates, selected suitable candidates for first round interviews and proposed successful candidates for interview by the entire Board. In February 2021 the Committee made a formal recommendation to the Board that Libby Burne be appointed as a Director. The Board agreed with this recommendation and Ms Burne was appointed with effect from 1 March 2021.
Thomas & Dessain has no connections to the Company or its Directors.
Governance and EffectivenessDuring the year, the Nomination Committee conducted a review of its activities against its constitution and terms of reference in respect of the year under review and concluded that it had satisfactorily complied with all of its terms of reference.
Management Engagement and Service Provider CommitteeAbout the CommitteeThe MESPC was established on 24 November 2015 and is chaired by Ms Barnes. The members are outlined on page 49. The other Directors of the Company may attend by invitation of the Committee.
The MESPC held two meetings in the year under review and all members of the Committee attended the meetings.
Activities of the CommitteeIn the course of the year under review, the MESPC conducted a review of the Company’s service providers to ensure the safe and accurate management and administration of the Company’s affairs and business under terms which were competitive and reasonable for the shareholders.
Investment Manager ReviewDue to the travel restrictions imposed by COVID-19, the annual Investment Manager review was undertaken virtually, in July 2020, rather than in person. As part of this review the Board received presentations from the investment committee, as well as various operational teams and the senior management of the Investment Manager regarding investment strategy and other matters relating to the Company’s affairs, and discussed the conclusions of this review with the Investment Manager. The Board and MESPC Committee are satisfied with the performance of the Investment Manager with respect to investment returns and the overall level of service provided to the Company. It is anticipated that when the easing of travel restrictions allow, the Board as a whole will undertake visits to the Investment Manager’s offices in Boston and London. In accordance with its terms of reference, the MESPC carries out a formal review of the Investment Management Agreement every three years and following that review will recommend any changes to the Board for consideration.
MESPC ReviewThe MESPC met in November 2020 and conducted a detailed review of the performance of all key service providers to the Company for the year to January 2021 against the following criteria:
/ scope of service;/ key personnel;/ key results achieved for the Company;/ fees charged to the Company;/ breaches and errors in the year under review;/ ESG policies and initiatives;/ cyber security and IT controls environment; and/ General Data Protection Regulation (“GDPR”) compliance.
Governance and EffectivenessIn November 2020, the MESPC conducted a review of its activities against its constitution and terms of reference in respect of the year under review and concluded that it had satisfactorily complied with all of its terms of reference.
ST
RA
TE
GIC
RE
PO
RT
GO
VE
RN
AN
CE
RE
PO
RT
FIN
AN
CIA
L S
TAT
EM
EN
TS
SU
PP
LE
ME
NTA
RY
HVPE Annual Report and Accounts 2021 55

Remuneration Committee and Inside Information Committee
Remuneration CommitteeAbout the CommitteeThe Remuneration Committee was established on 23 March 2021 and will be chaired by Mr Hodson, as the Senior Independent Director of the Company. The members are Ms Barnes, Ms Burne, Mr Moore, Mr Warner and, Mr Wilderspin. The other Directors of the Company may attend by invitation of the Committee.
The Remuneration Committee has delegated responsibility for determining the policy for Directors’ remuneration and setting the remuneration of the Chair of the Board. The Committee will also make recommendations to the Board for the Directors’ remuneration levels which shall be determined in accordance with the Company’s Articles of Association. Remuneration will not include performance-related elements. The Committee terms of reference can be found on the HVPE website here: www.hvpe.com/shareholder-information/corporate-governance.
The Committee will meet at least once a year. No meeting has been held to date but will take place later in 2021.
Inside Information CommitteeAbout the CommitteeThe Committee was formed on 12 July 2016 to consider information which may need to be made public in order for the Company to comply with its obligations under the UK Market Abuse Regulation (“UK MAR”). It met three times during the year and issued two flash NAV per share updates as a result of the meetings. The terms of reference for this Committee were updated to reflect post-Brexit regulation.
HVPE Annual Report and Accounts 202156

Directors’ Remuneration Report
An ordinary resolution for the approval of this Directors’ Remuneration Report will be put to shareholders at the forthcoming AGM to be held in 2021.
There are no long-term incentive schemes provided by the Company and no performance fees are paid to Directors. Directors affiliated to HarbourVest do not receive any fees.
No Director has a service contract with the Company; however, each Director is appointed by a letter of appointment which sets out the terms of the appointment.
Directors are remunerated in the form of fees, payable quarterly in arrears to the Director personally. The table below details the fees paid to each Director of the Company for the years ended 31 January 2020 and 31 January 2021. The Company’s Articles limit the aggregate fees payable to Directors to a maximum of £550,000 per annum. The Board reviewed remuneration in the year and no changes were made.
Under the Company’s Articles, Directors are entitled to additional ad-hoc remuneration for project work outside of the scope of their ordinary duties. No such payments were made in the year ended 31 January 2021.
Director Role
Fees Paid for the
12 Months Ended
31 January 2021
Fees Paid for the
12 Months Ended
31 January 2020
Sir Michael Bunbury1 Chair, Independent Director £66,703 £140,000Francesca Barnes Independent Director £54,000 £51,000Libby Burne2 Independent Director n/a n/aKeith Corbin Independent Director Nil £22,921Carolina Espinal Director Nil NilAlan Hodson Independent Director £54,000 £51,000Andrew Moore Independent Director £54,000 £51,000Ed Warner1 Chair, Independent Director £75,127 £21,856Steven Wilderspin Audit and Risk Committee Chair £64,000 £59,750Peter Wilson Director Nil NilTotal £367,830 £397,527
Role
Director fees payable with
effect from 1 October
2019 (annualised)
Chair, Independent Director £100,0003
Audit and Risk Committee Chair £64,000 Senior Independent Director £54,000 Independent Director £54,000
1 Sir Michael Bunbury was the Chair until 22 July 2020 when Mr Ed Warner was appointed to this role.2 Ms Burne was appointed with effect from 1 March 2021.3 Reduced from £140,000 to £100,000 with effect from 22 July 2020.
Signed on behalf of the Board by:
Ed WarnerChair
Steven WilderspinChair of the Audit and Risk Committee
27 May 2021
ST
RA
TE
GIC
RE
PO
RT
GO
VE
RN
AN
CE
RE
PO
RT
FIN
AN
CIA
L S
TAT
EM
EN
TS
SU
PP
LE
ME
NTA
RY
HVPE Annual Report and Accounts 2021 57

Statement of Compliance with the AIC Code of Corporate Governance
The Directors place a large degree of importance on ensuring that high standards of corporate governance are maintained and aim to comply as much as possible with the provisions of the AIC Code published in February 2019.
The Board has considered the principles and provisions of the AIC Code. The AIC Code addresses all the principles and provisions set out in the 2018 UK Corporate Governance Code (the “UK Code”), as well as setting out additional provisions on issues that are of specific relevance to the Company. The AIC Code has been endorsed by the Financial Reporting Council (“FRC”) and the Guernsey Financial Services Commission (“GFSC”). By reporting against the AIC Code, the Company is meeting its obligations under the UK Code, the 2011 GFSC Finance Sector Code of Corporate Governance and the associated disclosure requirements set out under paragraph 9.8.6R of the Financial Conduct Authority’s (“FCA’s”) Listing Rules. The Board considers that reporting against the principles and provisions of the AIC Code provides more relevant information to stakeholders. The AIC Code is available on the AIC website: www.theaic.co.uk.
The Company complied with all the principles and provisions of the AIC Code during the year ended 31 January 2021 except for two items which were resolved after the year end but prior to publication of the Annual Accounts and an additional difference relating to the duties of the Nomination Committee. Details on these three exceptions are outlined below.
Policy on the Tenure of the Chair The Board did not have a formal policy on tenure, including the tenure of the Chair, until March 2021 when such a policy was established.
Remuneration CommitteeDuring the period under review, the entire Board acted as the Remuneration Committee. The Board established a separate Remuneration Committee on 23 March 2021. Terms of reference are available on the Company’s website.
The following item is an ongoing exception to one of the principles of the AIC Code:
The Duties of the Nomination CommitteeAs set out on page 55, the Board has established a Nomination Committee, but it has chosen to limit its remit to focus purely on the identification and nomination of Board candidates to fill Independent Director Board vacancies as and when they arise. Other matters relating to the structure, size and composition of the Board and plans in respect of tenure and succession for Independent Directors form part of the matters reserved for the entire Board. The Directors believe that their deliberations in relation to these matters benefit from the input from all the Directors, including those appointed by HarbourVest.
HVPE Annual Report and Accounts 202158
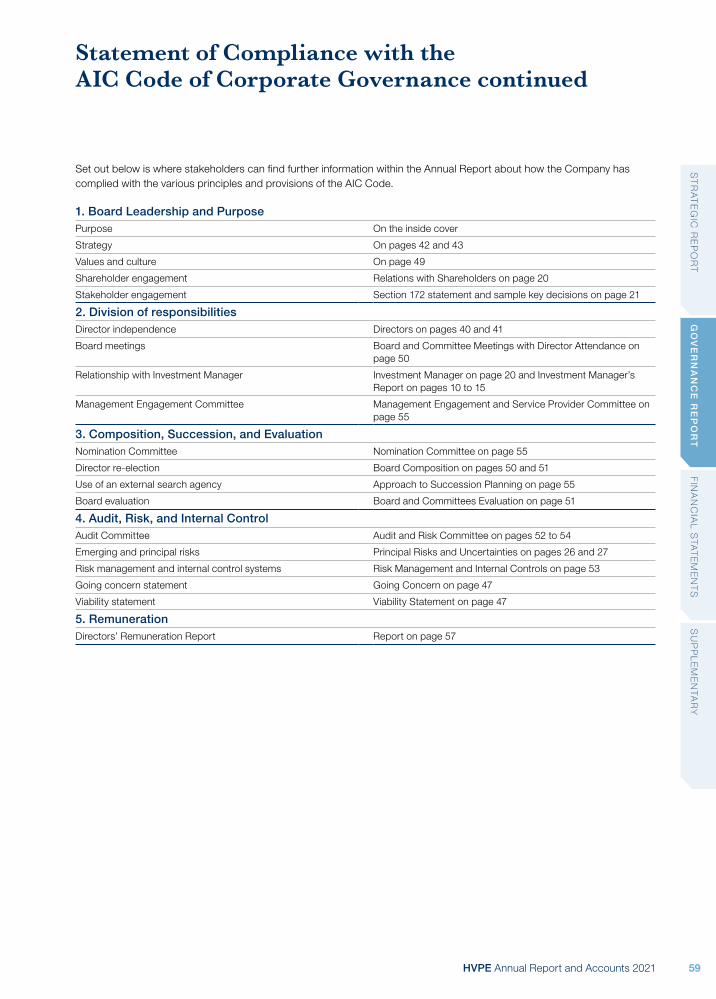
Set out below is where stakeholders can find further information within the Annual Report about how the Company has complied with the various principles and provisions of the AIC Code.
1. Board Leadership and PurposePurpose On the inside cover
Strategy On pages 42 and 43
Values and culture On page 49
Shareholder engagement Relations with Shareholders on page 20
Stakeholder engagement Section 172 statement and sample key decisions on page 21
2. Division of responsibilitiesDirector independence Directors on pages 40 and 41
Board meetings Board and Committee Meetings with Director Attendance on page 50
Relationship with Investment Manager Investment Manager on page 20 and Investment Manager’s Report on pages 10 to 15
Management Engagement Committee Management Engagement and Service Provider Committee on page 55
3. Composition, Succession, and EvaluationNomination Committee Nomination Committee on page 55
Director re-election Board Composition on pages 50 and 51
Use of an external search agency Approach to Succession Planning on page 55
Board evaluation Board and Committees Evaluation on page 51
4. Audit, Risk, and Internal ControlAudit Committee Audit and Risk Committee on pages 52 to 54
Emerging and principal risks Principal Risks and Uncertainties on pages 26 and 27
Risk management and internal control systems Risk Management and Internal Controls on page 53
Going concern statement Going Concern on page 47
Viability statement Viability Statement on page 47
5. RemunerationDirectors’ Remuneration Report Report on page 57
Statement of Compliance with the AIC Code of Corporate Governance continued
ST
RA
TE
GIC
RE
PO
RT
GO
VE
RN
AN
CE
RE
PO
RT
FIN
AN
CIA
L S
TAT
EM
EN
TS
SU
PP
LE
ME
NTA
RY
HVPE Annual Report and Accounts 2021 59

Independent Auditor’s Reportto the Members of HarbourVest Global Private Equity Limited
OpinionWe have audited the consolidated financial statements (the “Financial Statements”) of HarbourVest Global Private Equity Limited (the ”Company”) and its subsidiaries (together the ”Group”) for the year ended 31 January 2021 which comprise the Consolidated Statements of Assets and Liabilities, the Consolidated Statements of Operations, the Consolidated Statements of Changes in Net Assets, the Consolidated Statement of Cash Flows, the Consolidated Schedule of Investments, and the related notes 1 to 11, including a summary of significant accounting policies. The financial reporting framework that has been applied in their preparation is applicable law and United States Generally Accepted Accounting Principles (“US GAAP”).
In our opinion, the Financial Statements:
/ give a true and fair view of the state of the Group’s affairs as at 31 January 2021 and of its profit for the year then ended;
/ have been properly prepared in accordance with US GAAP; and
/ have been properly prepared in accordance with the requirements of the Companies (Guernsey) Law, 2008.
Basis for opinion We conducted our audit in accordance with International Standards on Auditing (UK) (“ISAs (UK)”) and applicable law. Our responsibilities under those standards are further described in the “Auditor’s responsibilities for the audit of the Financial Statements” section of our report. We are independent of the Group in accordance with the ethical requirements that are relevant to our audit of the Financial Statements, including the UK FRC’s Ethical Standard as applied to listed entities, and we have fulfilled our other ethical responsibilities in accordance with these requirements.
We believe that the audit evidence we have obtained is sufficient and appropriate to provide a basis for our opinion.
Conclusions relating to going concern In auditing the Financial Statements, we have concluded that the Directors’ use of the going concern basis of accounting in the preparation of the Financial Statements is appropriate. Our evaluation of the Directors’ assessment of the Group’s ability to continue to adopt the going concern basis of accounting included:
/ We discussed with the Directors their assessment of going concern, which included four scenario analysis models, including the ‘Base Case’ and ‘Extreme Downside’ scenarios, the ‘Base Case’ being considered by the Directors to be the most likely scenario;
/ We ascertained that the going concern assessment covered a period up until 30 June 2022 from the date of approval of the financial statements;
/ We reviewed the arithmetical accuracy of the ‘Base Case’ and ‘Extreme Downside’ scenario models;
/ For the ‘Base Case’ scenario we reviewed the working capital documentation which supports the Directors’ assessment of going concern;
/ We considered the estimation uncertainty of the prior year’s most likely scenario by comparing it to the Group’s actual performance to date, discussed the material movements with the Board and the Investment Manager, and obtained the required supporting documentation;
/ For the ‘Extreme Downside’ scenario we challenged the sensitivities and assumptions used in the forecast through reverse stress testing to understand how severe the downside scenario would have to be to result in the elimination of liquidity headroom or a covenant breach;
/ We selected judgementally a sample of underlying transactions and discussed the associated Cashflow Curve assumptions with the Investment Manager, including relevant supporting evidence;
/ We held discussions with the Audit Committee and Investment Manager to determine whether, in their opinion, there is any material uncertainty regarding the Company’s ability to pay liabilities and commitments as they fall due. Through these discussions we considered and challenged the options available to the Company if it were in a stressed scenario. These options included but were not limited to the use of credit facilities and sales in the secondary market;
HVPE Annual Report and Accounts 202160
/ We assessed whether the commitments made to underlying investments casted significant doubt over the going concern status of the Group and compared the historical calls made by underlying investments as a % of the total commitments made, including a discussion with the Investment Manager regarding the possibility for uncalled commitments to be called;
/ We confirmed available bank facility balances to understand the potential impact of the leverage in the underlying funds;
/ At year end, we recalculated the 3 covenant ratios applicable to the bank facility; the 35% Total Asset Ratio, the 47% Total Asset Ratio, and the Total Commitment Ratio (alternatively known as the Bank Test Ratio);
/ We considered whether the Directors’ assessment of going concern as included in the Annual Report is appropriate and consistent with the disclosure in the viability statement; and
/ We evaluated the disclosures made in the Annual Report and Consolidated Financial Statements regarding going concern to ascertain that they are in accordance with US GAAP and have complied with, or explained reasons for non-compliance, with all the AIC Code of Corporate Governance provisions.
Based on the work we have performed, we have not identified any material uncertainties relating to events or conditions that, individually or collectively, may cast significant doubt on the Group’s ability to continue as a going concern over a period from the date of approval of the Financial Statements up until 30 June 2022.
In relation to the Group’s reporting on how they have applied the UK Corporate Governance Code, we have nothing material to add or draw attention to in relation to the Directors’ statement in the Financial Statements about whether the Directors considered it appropriate to adopt the going concern basis of accounting.
Our responsibilities and the responsibilities of the Directors with respect to going concern are described in the relevant sections of this report. However, because not all future events or conditions can be predicted, this statement is not a guarantee as to the Group’s ability to continue as a going concern.
Overview of our audit approach
Key audit matters
Risk of misstatement or manipulation of the valuation of the Group’s investments in the underlying Primary or Secondary HarbourVest funds, together the “HarbourVest investment funds”.
Materiality Overall Group materiality of $57.5m which represents 2% (2020: 2%) of net assets.
An overview of the scope of our audit Tailoring the scopeOur assessment of audit risk, our evaluation of materiality and our allocation of performance materiality determine our audit scope for each Company within the Group. Taken together, this enables us to form an opinion on the Financial Statements. We take into account size, risk profile, the organisation of the Group and effectiveness of controls, including changes in the business environment when assessing the level of work to be performed.
The audit was led from Guernsey and utilised audit team members from the Boston office of Ernst & Young LLP in the US. We operated as an integrated audit team across the two jurisdictions and we performed audit procedures and responded to the risk identified as described below.
The Group comprises the Company and its five wholly owned subsidiaries as explained in note 2 to the Financial Statements. The Company, each subsidiary and the consolidation are subject to full scope audit procedures. Other than the investments which the Company holds directly, the subsidiaries own the investments, which are set out in the Consolidated Schedule of Investments, and on which we performed our work on valuation.
Key audit matters Key audit matters are those matters that, in our professional judgement, were of most significance in our audit of the Financial Statements of the current period and include the most significant assessed risks of material misstatement (whether or not due to fraud) that we identified. These matters included those which had the greatest effect on: the overall audit strategy, the allocation of resources in the audit, and directing the efforts of the engagement team. These matters were addressed in the context of our audit of the Financial Statements as a whole, and in our opinion thereon, and we do not provide a separate opinion on these matters.
ST
RA
TE
GIC
RE
PO
RT
GO
VE
RN
AN
CE
RE
PO
RT
FIN
AN
CIA
L S
TA
TE
ME
NT
SS
UP
PL
EM
EN
TAR
Y
HVPE Annual Report and Accounts 2021 61
Independent Auditor’s Report continued
Risk Misstatement or manipulation of the valuation of the Group’s investments in the underlying Primary or Secondary HarbourVest funds, together the “HarbourVest investment funds” ($2,889 million; 2020 $2,066 million).
Refer to the Accounting policies and Note 4 of the Financial Statements.
There is a risk that the valuation of the Group’s investments at 31 January 2021, which comprise 100.6% (2020: 93.8%) of net assets is materially misstated.
The valuation of the investments is the principal driver of the Group’s NAV and hence incorrect valuations would have a significant impact on the NAV and performance of the Group.
Our response to the risk
Our response comprised the performance of the following procedures:
/ Confirmed and documented our understanding of the Group’s processes and methodologies for valuing investments held by the Group in the HarbourVest investment funds, including the use of the practical expedient as set out in Accounting Standard Codification (ASC) Topic 820 Fair Value Measurement
/ Agreed the individual fair values of each HarbourVest investment fund the Group has invested into to its underlying audited Net Asset Value in the corresponding financial statements as at 31 December 2020 which, prior to adjustments, formed the basis for the Group’s carrying amount as at 31 January 2021;
/ Obtained a schedule of all adjustments made to those audited Net Asset Values between 1 January 2021 and 31 January 2021, and:/ Verified foreign exchange rate changes to independent third-party sources, and their application
to any HarbourVest investment funds denominated in foreign currencies;/ Recalculated a sample of accrued management fees in the HarbourVest investment funds
based on the terms of the signed management agreements and agreed terms to relevant supporting documents;
/ Where applicable, recalculated the impact of any carried interest taken by the GP of the underlying HarbourVest investment funds on the gains and losses allocated to the Group for the period from 1 January 2021 to 31 January 2021;
/ Independently sourced third-party prices and verified fair value changes on publicly traded securities held in the HarbourVest investment funds; and
/ Verified contributions and withdrawals made to/from the HarbourVest investment funds to supporting bank statements.
/ We judgementally selected a sample of direct investments held by the HarbourVest investment funds based on materiality, complexity in valuation methodology, and sensitivity of inputs, and:/ Engaged EY internal valuation specialists to independently re-value and conclude on their
values as at 31 December 2020, and roll forward to 31 January 2021;/ Identified key inputs to the valuations and performed sensitivity analysis around them; and/ Considered whether there were changes in market conditions during the period 1 January 2021 to
31 January 2021 that could have had a material impact when applied to the key sensitive inputs to the valuations of the direct investments of the HarbourVest investment funds selected in our sample.
/ Obtained and examined direct investment transaction reports post 31 December 2020 for material changes in the direct portfolio investments held in the HarbourVest investment funds; and
/ Obtained any post-closing adjustments from the Investment Manager and validated that there were no material changes to the Net Asset Values subsequent to the HarbourVest investment funds’ finalized financial reporting process.
Key observations communicated to the Audit Committee
We reported to the Audit Committee that we did not identify any instances of the use of inappropriate methodologies and that the valuation of the Group’s investments in the HarbourVest investment funds were not materially misstated.
HVPE Annual Report and Accounts 202162

Our application of materiality We apply the concept of materiality in planning and performing the audit, in evaluating the effect of identified misstatements on the audit and in forming our audit opinion.
Materiality“Materiality” is the magnitude of an omission or misstatement that, individually or in the aggregate, could reasonably be expected to influence the economic decisions of the users of the financial statements. Materiality provides a basis for determining the nature and extent of our audit procedures.
We determined materiality for the Group to be $57.5 million (2020: $44.0 million), which is 2% (2020: 2%) of net assets. We believe that net assets provide us with a basis for determining the nature, timing and extent of risk assessment procedures, identifying and assessing the risk of material misstatement and determining the nature, timing and extent of further audit procedures. We used the net assets as a basis for determining planning materiality because the Group’s primary performance measures for internal and external reporting are based on net assets as we consider it is the measure most relevant to the stakeholders of the Group.
We calculated materiality during the planning stage of the audit and during the course of our audit we reassessed initial materiality based on 31 January 2021 net assets.
Performance materiality“Performance materiality” is the application of materiality at the individual account or balance level. It is set at an amount to reduce to an appropriately low level the probability that the aggregate of uncorrected and undetected misstatements exceeds materiality.
On the basis of our risk assessments, together with our assessment of the Group’s overall control environment, our judgement was that performance materiality was 75% (2020: 75%) of our planning materiality, namely $43.1m (2020: $33.0m). Our objective in adopting this approach was to ensure that total uncorrected and undetected audit differences in the Financial Statements did not exceed our materiality level. We have set performance materiality at this percentage given that there is no history of material misstatements, the likelihood of misstatement in the future is deemed low, we have a strong understanding of the control environment, there were no changes in circumstances (such as a change in accounting personnel or events out of the normal course of business) and it is not a close monitored audit, and hence we consider 75% to be reasonable.
Reporting threshold“Reporting threshold” is an amount below which identified misstatements are considered as being clearly trivial.
We agreed with the Audit Committee that we would report to them all uncorrected audit differences in excess of $2.9m (2020: $2.2m), which is set at 5% of planning materiality, as well as differences below that threshold that, in our view, warranted reporting on qualitative grounds.
We evaluate any uncorrected misstatements against both the quantitative measures of materiality discussed above and in light of other relevant qualitative considerations in forming our opinion.
Other informationThe other information comprises the information included in the annual report, other than the Financial Statements and our auditor’s report thereon. The Directors are responsible for the other information contained within the annual report.
Our opinion on the Financial Statements does not cover the other information and, except to the extent otherwise explicitly stated in this report, we do not express any form of assurance conclusion thereon.
Our responsibility is to read the other information and, in doing so, consider whether the other information is materially inconsistent with the Financial Statements or our knowledge obtained in the course of the audit or otherwise appears to be materially misstated. If we identify such material inconsistencies or apparent material misstatements, we are required to determine whether there is a material misstatement in the Financial Statements themselves. If, based on the work we have performed, we conclude that there is a material misstatement of the other information, we are required to report that fact.
We have nothing to report in this regard.
Matters on which we are required to report by exceptionWe have nothing to report in respect of the following matters in relation to which the Companies (Guernsey) Law, 2008 requires us to report to you if, in our opinion:
/ proper accounting records have not been kept by the Company; or
/ the Financial Statements are not in agreement with the Company’s accounting records and returns; or
/ we have not received all the information and explanations we require for our audit.
ST
RA
TE
GIC
RE
PO
RT
GO
VE
RN
AN
CE
RE
PO
RT
FIN
AN
CIA
L S
TA
TE
ME
NT
SS
UP
PL
EM
EN
TAR
Y
HVPE Annual Report and Accounts 2021 63

Independent Auditor’s Report continued
Corporate Governance StatementThe Listing Rules require us to review the Directors’ statement in relation to going concern, longer-term viability and that part of the Corporate Governance Statement relating to the Group’s compliance with the provisions of the UK Corporate Governance Code specified for our review.
Based on the work undertaken as part of our audit, we have concluded that each of the following elements of the Corporate Governance Statement is materially consistent with the Financial Statements or our knowledge obtained during the audit:
/ Directors’ statement with regards to the appropriateness of adopting the going concern basis of accounting and any material uncertainties identified set out on page 47;
/ Directors’ explanation as to its assessment of the Company’s prospects, the period this assessment covers and why the period is appropriate set out on page 47;
/ Directors’ statement on fair, balanced and understandable set out on page 48;
/ Board’s confirmation that it has carried out a robust assessment of the emerging and principal risks set out on pages 26 and 27;
/ The section of the annual report that describes the review of effectiveness of risk management and internal control systems set out on page 53; and
/ The section describing the work of the audit committee set out on page 52.
Responsibilities of directorsAs explained more fully in the Statement of Directors’ Responsibilities set out on page 48, the Directors are responsible for the preparation of the Financial Statements and for being satisfied that they give a true and fair view, and for such internal control as the Directors determine is necessary to enable the preparation of Financial Statements that are free from material misstatement, whether due to fraud or error.
In preparing the Financial Statements, the Directors are responsible for assessing the Group’s ability to continue as a going concern, disclosing, as applicable, matters related to going concern and using the going concern basis of accounting unless the Directors either intend to liquidate the Group or to cease operations, or have no realistic alternative but to do so.
Auditor’s responsibilities for the audit of the financial statements Our objectives are to obtain reasonable assurance about whether the Financial Statements as a whole are free from material misstatement, whether due to fraud or error, and to issue an auditor’s report that includes our opinion. Reasonable assurance is a high level of assurance, but is not a guarantee that an audit conducted in accordance with ISAs (UK) will always detect a material misstatement when it exists. Misstatements can arise from fraud or error and are considered material if, individually or in the aggregate, they could reasonably be expected to influence the economic decisions of users taken on the basis of these Financial Statements.
HVPE Annual Report and Accounts 202164
Explanation as to what extent the audit was considered capable of detecting irregularities, including fraud Irregularities, including fraud, are instances of non-compliance with laws and regulations. We design procedures in line with our responsibilities, outlined above, to detect irregularities, including fraud. The risk of not detecting a material misstatement due to fraud is higher than the risk of not detecting one resulting from error, as fraud may involve deliberate concealment by, for example, forgery or intentional misrepresentations, or through collusion. The extent to which our procedures are capable of detecting irregularities, including fraud is detailed below.
However, the primary responsibility for the prevention and detection of fraud rests with both those charged with governance of the Group and management. Our approach was as follows:
/ We obtained an understanding of the legal and regulatory frameworks that are applicable to the Group and determined that the most significant are:/ Financial Conduct Authority (“FCA”) Listing Rules;/ Disclosure Guidance and Transparency Rules (“DTR”)
of the FCA;/ The 2018 UK Corporate Governance Code;/ The 2019 AIC Code of Corporate Governance;/ The Companies (Guernsey) Law, 2008,
as amended; and/ The Protection of Investors (Bailiwick of Guernsey)
Law 1987, as amended.
/ We understood how the Group is complying with those frameworks by:/ Discussing the processes and procedures used by the
Directors, the Investment Manager, the Company Secretary and Administrator to ensure compliance with the relevant frameworks;
/ Inspecting the Group’s relevant documented policies, processes and procedures; and
/ Reviewing internal reports that evidence compliance testing.
/ We assessed the susceptibility of the Group’s Financial Statements to material misstatement, including how fraud might occur by undertaking the audit procedures set out in the Key Audit Matters section above, and reading the Financial Statements to check that the disclosures are consistent with the relevant regulatory requirements; and
/ Based on this understanding we designed our audit procedures to identify non-compliance with such laws and regulations. Our procedures involved:/ Having discussions with those charged with
governance, the Investment Manager, the Company Secretary and Administrator to obtain an understanding of how instances of non-compliance with relevant laws and regulations are identified;
/ Reviewing Board minutes and internal compliance reporting;
/ Inspecting correspondence with regulators;/ Reviewing the Financial Statements to check that
they comply with the reporting requirements of the Group; and
/ Obtaining relevant written representations from the Board of Directors.
A further description of our responsibilities for the audit of the Financial Statements is located on the Financial Reporting Council’s website at: https://www.frc.org.uk/auditors responsibilities. This description forms part of our auditor’s report.
Use of our reportThis report is made solely to the Company’s members, as a body, in accordance with Section 262 of the Companies (Guernsey) Law 2008. Our audit work has been undertaken so that we might state to the Company’s members those matters we are required to state to them in an auditor’s report and for no other purpose. To the fullest extent permitted by law, we do not accept or assume responsibility to anyone other than the Company and the Company’s members as a body, for our audit work, for this report, or for the opinions we have formed.
David Robert John Moore, ACAFor and on behalf of Ernst & Young LLP Guernsey
27 May 2021
Notes:
1 The maintenance and integrity of the Company’s website is the sole responsibility of the Directors; the work carried out by the auditors does not involve consideration of these matters and, accordingly, the auditor accepts no responsibility for any changes that may have occurred to the Financial Statements since they were initially presented on the website.
2 Legislation in Guernsey governing the preparation and dissemination of financial statements may differ from legislation in other jurisdictions.
ST
RA
TE
GIC
RE
PO
RT
GO
VE
RN
AN
CE
RE
PO
RT
FIN
AN
CIA
L S
TA
TE
ME
NT
SS
UP
PL
EM
EN
TAR
Y
HVPE Annual Report and Accounts 2021 65
Independent Auditor’s Reportto the Directors of HarbourVest Global Private Equity Limited
We have audited the accompanying Consolidated Financial Statements (“Financial Statements”) of HarbourVest Global Private Equity Limited (the “Company”) and its subsidiaries (together the “Group”), which comprise the Consolidated Statement of Assets and Liabilities as at 31 January 2021, and the related Consolidated Statement of Operations, the Consolidated Statements of Changes in Net Assets, the Consolidated Statements of Cash Flows, the Consolidated Schedule of Investments, and the related notes 1 to 11 to the Financial Statements.
Management’s Responsibility for the Financial StatementsManagement is responsible for the preparation and fair presentation of these Financial Statements in conformity with United States Generally Accepted Accounting Principles (‘US GAAP’). This includes the design, implementation, and maintenance of internal control relevant to the preparation and fair presentation of Financial Statements that are free of material misstatement, whether due to fraud or error.
Auditor’s ResponsibilityOur responsibility is to express an opinion on these Financial Statements based on our audit. We conducted our audit in accordance with auditing standards generally accepted in the United States of America. Those standards require that we plan and perform the audit to obtain reasonable assurance about whether the Financial Statements are free of material misstatement.
An audit involves performing procedures to obtain audit evidence about the amounts and disclosures in the Financial Statements. The procedures selected depend on the auditor’s judgment, including the assessment of the risks of material misstatement of the Financial Statements, whether due to fraud or error. In making those risk assessments, the auditor considers internal controls relevant to the Company’s preparation and fair presentation of the Financial Statements in order to design audit procedures that are appropriate in the circumstances, but not for the purpose of expressing an opinion on the effectiveness of the Company’s internal control. Accordingly, we express no such opinion. An audit also includes evaluating the appropriateness of accounting policies used and the reasonableness of significant accounting estimates made by management, as well as evaluating the overall presentation of the Financial Statements.
We believe that the audit evidence we have obtained is sufficient and appropriate to provide a basis for our audit opinion.
OpinionIn our opinion, the Financial Statements referred to above present fairly, in all material respects, the financial position of HarbourVest Global Private Equity Limited at 31 January 2021, and the results of its operations, changes in net assets, and its cash flows for the year then ended, in conformity with US GAAP.
Ernst & Young LLPGuernsey, Channel Islands
27 May 2021
HVPE Annual Report and Accounts 202166

Consolidated Statements of Assets and LiabilitiesAt 31 January 2021 and 2020
In US Dollars 2021 2020
Assets
Investments (Note 4) 2,889,177,693 2,065,519,797
Cash and equivalents 98,415,503 130,616,160
Other assets 7,062,662 8,445,852
Total assets 2,994,655,858 2,204,581,809
Liabilities
Amounts due under the credit facility (Note 6) 120,000,000 –
Accounts payable and accrued expenses 2,072,770 1,802,505
Accounts payable to HarbourVest Advisers L.P. (Note 9) 72,500 92,281
Total liabilities 122,145,270 1,894,786
Commitments (Note 5)
Net assets $2,872,510,588 $2,202,687,023
Net assets consist of
Shares, unlimited shares authorised, 79,862,486 shares issued and outstanding at 31 January 2021 and 2020, no par value 2,872,510,588 2,202,687,023
Net assets $2,872,510,588 $2,202,687,023
Net asset value per share $35.97 $27.58
The accompanying notes are an integral part of the Financial Statements.
The Financial Statements on pages 67 to 83 were approved by the Board on 27 May 2021 and were signed on its behalf by:
Ed WarnerChair
Steven WilderspinChair of the Audit and Risk Committee
ST
RA
TE
GIC
RE
PO
RT
GO
VE
RN
AN
CE
RE
PO
RT
FIN
AN
CIA
L S
TA
TE
ME
NT
SS
UP
PL
EM
EN
TAR
Y
HVPE Annual Report and Accounts 2021 67
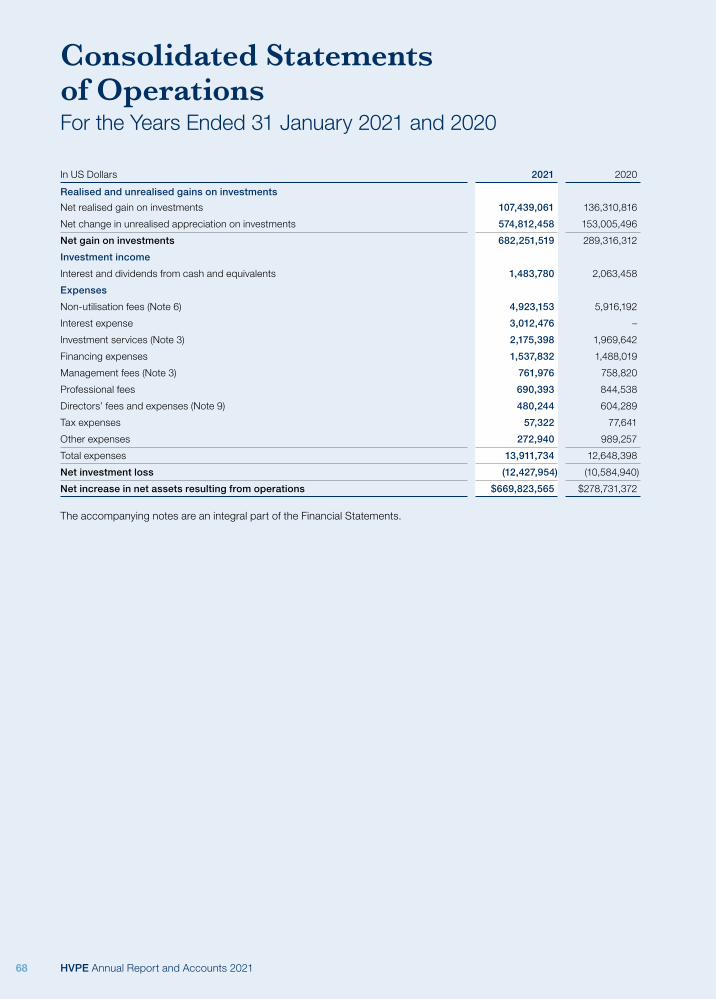
Consolidated Statements of OperationsFor the Years Ended 31 January 2021 and 2020
In US Dollars 2021 2020
Realised and unrealised gains on investments
Net realised gain on investments 107,439,061 136,310,816
Net change in unrealised appreciation on investments 574,812,458 153,005,496
Net gain on investments 682,251,519 289,316,312
Investment income
Interest and dividends from cash and equivalents 1,483,780 2,063,458
Expenses
Non-utilisation fees (Note 6) 4,923,153 5,916,192
Interest expense 3,012,476 –
Investment services (Note 3) 2,175,398 1,969,642
Financing expenses 1,537,832 1,488,019
Management fees (Note 3) 761,976 758,820
Professional fees 690,393 844,538
Directors’ fees and expenses (Note 9) 480,244 604,289
Tax expenses 57,322 77,641
Other expenses 272,940 989,257
Total expenses 13,911,734 12,648,398
Net investment loss (12,427,954) (10,584,940)
Net increase in net assets resulting from operations $669,823,565 $278,731,372
The accompanying notes are an integral part of the Financial Statements.
HVPE Annual Report and Accounts 202168
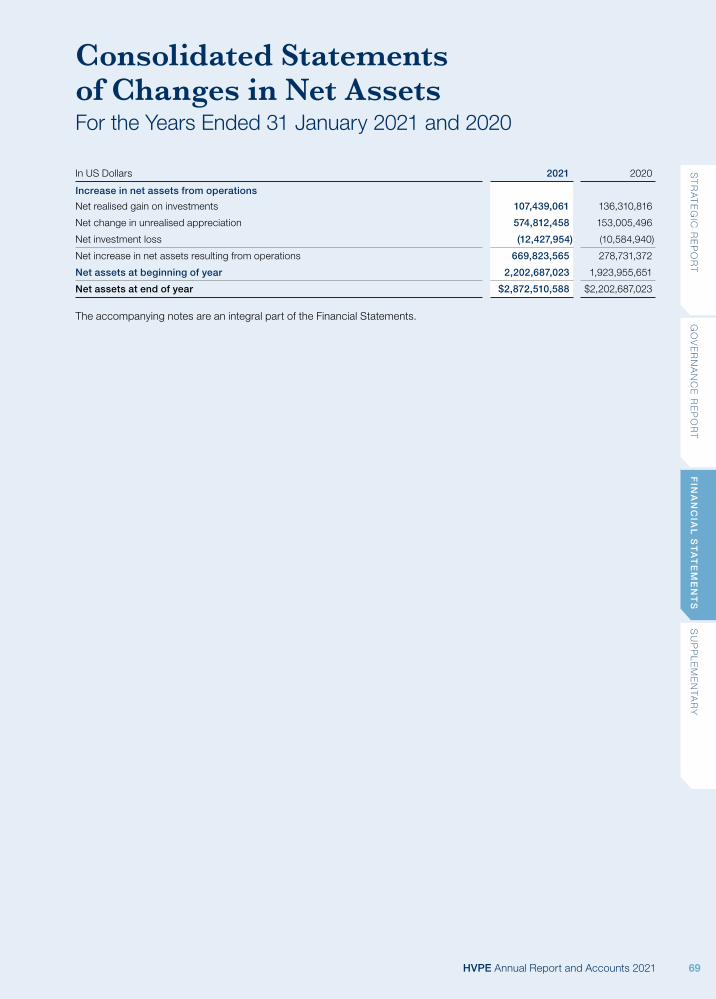
Consolidated Statements of Changes in Net AssetsFor the Years Ended 31 January 2021 and 2020
In US Dollars 2021 2020
Increase in net assets from operations
Net realised gain on investments 107,439,061 136,310,816
Net change in unrealised appreciation 574,812,458 153,005,496
Net investment loss (12,427,954) (10,584,940)
Net increase in net assets resulting from operations 669,823,565 278,731,372
Net assets at beginning of year 2,202,687,023 1,923,955,651
Net assets at end of year $2,872,510,588 $2,202,687,023
The accompanying notes are an integral part of the Financial Statements.
ST
RA
TE
GIC
RE
PO
RT
GO
VE
RN
AN
CE
RE
PO
RT
FIN
AN
CIA
L S
TA
TE
ME
NT
SS
UP
PL
EM
EN
TAR
Y
HVPE Annual Report and Accounts 2021 69
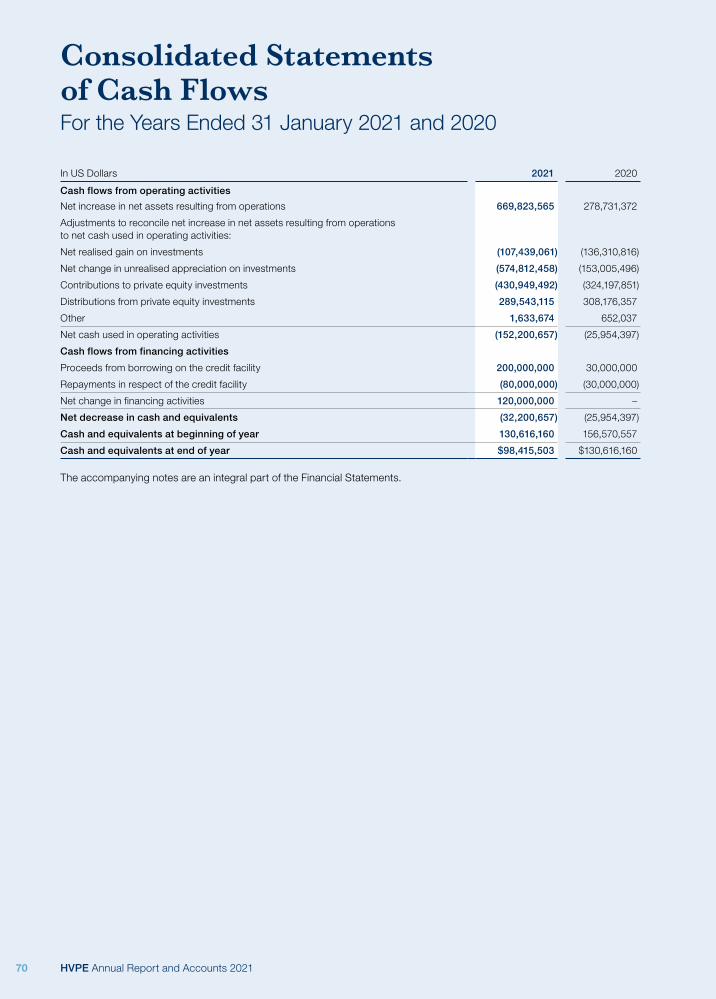
Consolidated Statements of Cash FlowsFor the Years Ended 31 January 2021 and 2020
In US Dollars 2021 2020
Cash flows from operating activities
Net increase in net assets resulting from operations 669,823,565 278,731,372
Adjustments to reconcile net increase in net assets resulting from operations to net cash used in operating activities:
Net realised gain on investments (107,439,061) (136,310,816)
Net change in unrealised appreciation on investments (574,812,458) (153,005,496)
Contributions to private equity investments (430,949,492) (324,197,851)
Distributions from private equity investments 289,543,115 308,176,357
Other 1,633,674 652,037
Net cash used in operating activities (152,200,657) (25,954,397)
Cash flows from financing activities
Proceeds from borrowing on the credit facility 200,000,000 30,000,000
Repayments in respect of the credit facility (80,000,000) (30,000,000)
Net change in financing activities 120,000,000 –
Net decrease in cash and equivalents (32,200,657) (25,954,397)
Cash and equivalents at beginning of year 130,616,160 156,570,557
Cash and equivalents at end of year $98,415,503 $130,616,160
The accompanying notes are an integral part of the Financial Statements.
HVPE Annual Report and Accounts 202170
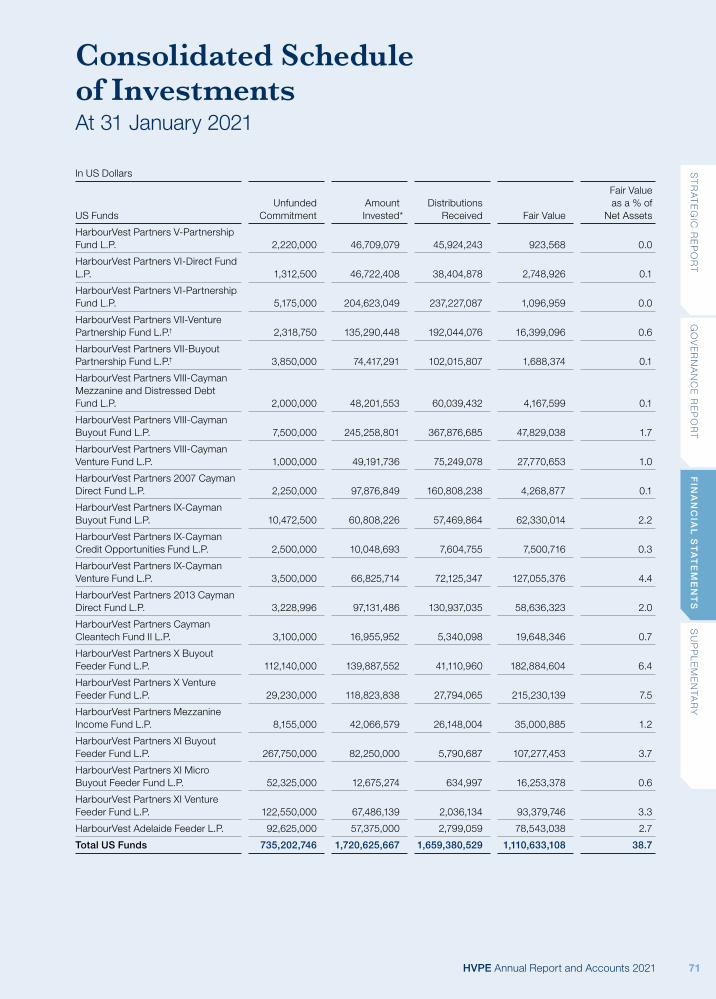
Consolidated Schedule of InvestmentsAt 31 January 2021
In US Dollars
US FundsUnfunded
CommitmentAmountInvested*
Distributions Received Fair Value
Fair Value as a % of
Net Assets
HarbourVest Partners V-Partnership Fund L.P. 2,220,000 46,709,079 45,924,243 923,568 0.0
HarbourVest Partners VI-Direct Fund L.P. 1,312,500 46,722,408 38,404,878 2,748,926 0.1
HarbourVest Partners VI-Partnership Fund L.P. 5,175,000 204,623,049 237,227,087 1,096,959 0.0
HarbourVest Partners VII-Venture Partnership Fund L.P.† 2,318,750 135,290,448 192,044,076 16,399,096 0.6
HarbourVest Partners VII-Buyout Partnership Fund L.P.† 3,850,000 74,417,291 102,015,807 1,688,374 0.1
HarbourVest Partners VIII-Cayman Mezzanine and Distressed Debt Fund L.P. 2,000,000 48,201,553 60,039,432 4,167,599 0.1
HarbourVest Partners VIII-Cayman Buyout Fund L.P. 7,500,000 245,258,801 367,876,685 47,829,038 1.7
HarbourVest Partners VIII-Cayman Venture Fund L.P. 1,000,000 49,191,736 75,249,078 27,770,653 1.0
HarbourVest Partners 2007 Cayman Direct Fund L.P. 2,250,000 97,876,849 160,808,238 4,268,877 0.1
HarbourVest Partners IX-Cayman Buyout Fund L.P. 10,472,500 60,808,226 57,469,864 62,330,014 2.2
HarbourVest Partners IX-Cayman Credit Opportunities Fund L.P. 2,500,000 10,048,693 7,604,755 7,500,716 0.3
HarbourVest Partners IX-Cayman Venture Fund L.P. 3,500,000 66,825,714 72,125,347 127,055,376 4.4
HarbourVest Partners 2013 Cayman Direct Fund L.P. 3,228,996 97,131,486 130,937,035 58,636,323 2.0
HarbourVest Partners Cayman Cleantech Fund II L.P. 3,100,000 16,955,952 5,340,098 19,648,346 0.7
HarbourVest Partners X Buyout Feeder Fund L.P. 112,140,000 139,887,552 41,110,960 182,884,604 6.4
HarbourVest Partners X Venture Feeder Fund L.P. 29,230,000 118,823,838 27,794,065 215,230,139 7.5
HarbourVest Partners Mezzanine Income Fund L.P. 8,155,000 42,066,579 26,148,004 35,000,885 1.2
HarbourVest Partners XI Buyout Feeder Fund L.P. 267,750,000 82,250,000 5,790,687 107,277,453 3.7
HarbourVest Partners XI Micro Buyout Feeder Fund L.P. 52,325,000 12,675,274 634,997 16,253,378 0.6
HarbourVest Partners XI Venture Feeder Fund L.P. 122,550,000 67,486,139 2,036,134 93,379,746 3.3
HarbourVest Adelaide Feeder L.P. 92,625,000 57,375,000 2,799,059 78,543,038 2.7
Total US Funds 735,202,746 1,720,625,667 1,659,380,529 1,110,633,108 38.7
ST
RA
TE
GIC
RE
PO
RT
GO
VE
RN
AN
CE
RE
PO
RT
FIN
AN
CIA
L S
TA
TE
ME
NT
SS
UP
PL
EM
EN
TAR
Y
HVPE Annual Report and Accounts 2021 71

International/Global FundsUnfunded
CommitmentAmountInvested*
Distributions Received Fair Value
Fair Value as a % of
Net Assets
HarbourVest International Private Equity Partners III-Partnership Fund L.P. 3,450,000 147,728,557 148,439,622 442,876 0.0
HarbourVest International Private Equity Partners IV-Direct Fund L.P. – 61,452,400 53,436,349 1,635,509 0.1
HIPEP V-2007 Cayman European Buyout Companion Fund L.P.§ 1,727,131 63,880,350 83,848,022 1,504,646 0.1
Dover Street VII Cayman L.P.‡ 4,413,862 95,586,138 128,606,761 7,518,106 0.3
HIPEP VI-Cayman Partnership Fund L.P.** 6,066,500 117,844,925 108,820,644 122,569,689 4.3
HIPEP VI-Cayman Asia Pacific Fund L.P. 2,500,000 47,687,431 41,011,086 45,060,203 1.6
HIPEP VI-Cayman Emerging Markets Fund L.P. – 30,059,489 8,702,301 31,787,223 1.1
HVPE Avalon Co-Investment L.P. 1,643,962 85,135,136 124,138,700 474,898 0.0
Dover Street VIII Cayman L.P. 16,200,000 163,924,389 199,884,842 71,110,782 2.5
HVPE Charlotte Co-Investment L.P. – 93,894,011 146,161,426 17,509,766 0.6
HarbourVest Global Annual Private Equity Fund L.P. 12,300,000 87,701,202 67,209,555 114,804,290 4.0
HIPEP VII Partnership Feeder Fund L.P. 23,750,000 101,250,000 25,844,129 160,445,781 5.6
HIPEP VII Asia Pacific Feeder Fund L.P. 2,850,000 27,150,000 7,409,639 42,470,503 1.5
HIPEP VII Emerging Markets Feeder Fund L.P. 4,800,000 15,200,000 2,668,611 20,099,873 0.7
HIPEP VII Europe Feeder Fund L.P.†† 16,051,959 56,716,801 17,715,296 84,559,194 2.9
HarbourVest Canada Parallel Growth Fund L.P.‡‡ 8,256,470 16,285,245 4,294,018 26,842,723 0.9
HarbourVest 2015 Global Fund L.P. 17,000,000 83,017,309 41,801,990 107,210,533 3.7
HarbourVest 2016 Global AIF L.P. 30,500,000 69,526,107 34,008,380 81,601,321 2.8
HarbourVest Partners Co-Investment IV AIF L.P. 7,000,006 92,999,994 21,945,041 150,039,672 5.2
Dover Street IX Cayman L.P. 20,000,000 80,000,000 39,038,520 87,915,960 3.1
HarbourVest Real Assets III Feeder L.P. 7,000,000 43,000,000 5,917,231 36,451,275 1.3
HarbourVest 2017 Global AIF L.P. 40,000,000 60,020,959 12,204,384 84,131,975 2.9
HIPEP VIII Partnership AIF L.P. 114,750,000 55,250,000 6,791,735 75,751,098 2.6
Secondary Overflow Fund III L.P. 26,989,722 67,771,090 27,071,891 84,579,047 2.9
HarbourVest Asia Pacific VIII AIF Fund L.P. 23,000,000 27,005,566 2,717,733 32,503,062 1.1
HarbourVest 2018 Global Feeder Fund L.P. 32,200,000 37,800,000 894,925 47,740,364 1.7
HarbourVest Partners Co-Investment V Feeder Fund L.P. 30,000,000 70,048,219 – 100,012,084 3.5
HarbourVest Real Assets IV Feeder L.P. 50,000,000 – – 1,332,836 0.0
HarbourVest 2019 Global Feeder Fund L.P. 65,000,000 35,006,832 216,003 45,434,644 1.6
HarbourVest Credit Opportunities Fund II L.P. 33,500,000 16,500,000 – 17,158,429 0.6
Dover Street X Feeder Fund L.P. 116,250,000 33,768,169 3,509,063 41,769,601 1.5
Secondary Overflow Fund IV L.P. 35,815,786 19,063,986 3,722,088 29,757,064 1.0
HIPEP IX Feeder Fund L.P. 40,000,000 – – 299,496 0.0
HarbourVest 2020 Global Feeder Fund L.P. 45,000,000 5,001,332 – 6,020,062 0.2
Total International/Global Funds 838,015,398 2,007,275,637 1,368,029,985 1,778,544,585 61.9
Total Investments $1,573,218,144 $3,727,901,304 $3,027,410,514 $2,889,177,693 100.6
* Includes purchase of limited partner interests for shares and cash at the time of HVPE’s IPO.† Includes ownership interests in HarbourVest Partners VII-Cayman Partnership entities.‡ Includes ownership interest in Dover Street VII (AIV 1) Cayman L.P.§ Fund denominated in euros. Commitment amount is €47,450,000.** Fund denominated in euros. Commitment amount is €100,000,000.†† Fund denominated in euros. Commitment amount is €63,000,000.‡‡ Fund denominated in Canadian dollars. Commitment amount is C$32,000,000.
As of 31 January 2021, the cost basis of partnership investments is $1,890,413,031.
The accompanying notes are an integral part of the Financial Statements.
HVPE Annual Report and Accounts 202172

Consolidated Schedule of InvestmentsAt 31 January 2020
In US Dollars
US FundsUnfunded
CommitmentAmountInvested*
Distributions Received Fair Value
Fair Value as a % of
Net Assets
HarbourVest Partners V-Partnership Fund L.P. 2,220,000 46,709,079 45,924,243 1,115,289 0.0
HarbourVest Partners VI-Direct Fund L.P. 1,312,500 46,722,408 38,404,878 3,611,410 0.2
HarbourVest Partners VI-Partnership Fund L.P. 5,175,000 204,623,049 237,137,870 1,430,428 0.1
HarbourVest Partners VII-Venture Partnership Fund L.P.† 2,318,750 135,290,448 185,923,470 23,788,214 1.1
HarbourVest Partners VII-Buyout Partnership Fund L.P.† 3,850,000 74,417,291 101,688,184 2,221,758 0.1
HarbourVest Partners VIII-Cayman Mezzanine and Distressed Debt Fund L.P. 2,000,000 48,201,553 59,331,422 5,634,823 0.2
HarbourVest Partners VIII-Cayman Buyout Fund L.P. 11,250,000 241,508,801 343,051,209 61,525,909 2.8
HarbourVest Partners VIII-Cayman Venture Fund L.P. 1,000,000 49,191,736 68,026,931 25,647,479 1.2
HarbourVest Partners 2007 Cayman Direct Fund L.P. 2,250,000 97,876,849 160,808,238 4,423,302 0.2
HarbourVest Partners IX-Cayman Buyout Fund L.P. 12,247,500 59,033,226 45,422,100 57,619,201 2.6
HarbourVest Partners IX-Cayman Credit Opportunities Fund L.P. 3,125,000 9,423,693 6,135,379 8,218,265 0.4
HarbourVest Partners IX-Cayman Venture Fund L.P. 3,500,000 66,825,714 48,003,773 86,896,032 3.9
HarbourVest Partners 2013 Cayman Direct Fund L.P. 3,228,996 97,131,486 111,969,614 76,990,456 3.5
HarbourVest Partners Cayman Cleantech Fund II L.P. 4,300,000 15,755,952 3,545,869 15,844,249 0.7
HarbourVest Partners X Buyout Feeder Fund L.P. 138,600,000 113,427,552 36,413,397 125,158,592 5.7
HarbourVest Partners X Venture Feeder Fund L.P. 52,910,000 95,143,838 11,816,651 141,682,599 6.4
HarbourVest Partners Mezzanine Income Fund L.P. 8,155,000 42,066,579 19,963,861 39,670,509 1.8
HarbourVest Partners XI Buyout Feeder Fund L.P. 318,500,000 31,500,000 – 36,490,456 1.7
HarbourVest Partners XI Micro Buyout Feeder Fund L.P. 63,050,000 1,950,274 – 2,332,052 0.1
HarbourVest Partners XI Venture Feeder Fund L.P. 171,000,000 19,036,139 – 21,829,412 1.0
HarbourVest Adelaide Feeder L.P. 76,125,000 73,875,000 – 88,168,052 4.0
Total US Funds 886,117,746 1,569,710,667 1,523,567,089 830,298,487 37.7
ST
RA
TE
GIC
RE
PO
RT
GO
VE
RN
AN
CE
RE
PO
RT
FIN
AN
CIA
L S
TA
TE
ME
NT
SS
UP
PL
EM
EN
TAR
Y
HVPE Annual Report and Accounts 2021 73

International/Global FundsUnfunded
CommitmentAmountInvested*
Distributions Received Fair Value
Fair Value as a % of
Net Assets
HarbourVest International Private Equity Partners III-Partnership Fund L.P. 3,450,000 147,728,557 148,439,622 459,648 0.0
HarbourVest International Private Equity Partners IV-Direct Fund L.P. – 61,452,400 53,436,349 1,889,946 0.1
HIPEP V-2007 Cayman European Buyout Companion Fund L.P.§ 1,579,087 63,880,350 81,216,511 4,205,570 0.2
Dover Street VII Cayman L.P.‡ 4,413,862 95,586,138 127,101,279 8,718,149 0.4
HIPEP VI-Cayman Partnership Fund L.P.** 5,546,500 117,844,925 86,215,226 114,737,162 5.2
HIPEP VI-Cayman Asia Pacific Fund L.P. 3,000,000 47,187,431 34,360,314 41,735,529 1.9
HIPEP VI-Cayman Emerging Markets Fund L.P. – 30,059,489 7,122,156 30,298,326 1.4
HVPE Avalon Co-Investment L.P. 1,643,962 85,135,136 124,138,700 480,180 0.0
Dover Street VIII Cayman L.P. 16,200,000 163,924,389 190,959,375 69,693,642 3.2
HVPE Charlotte Co-Investment L.P. – 93,894,011 140,207,934 19,779,480 0.9
HarbourVest Global Annual Private Equity Fund L.P. 16,800,000 83,201,202 47,245,006 97,606,581 4.4
HIPEP VII Partnership Feeder Fund L.P. 35,312,500 89,687,500 17,955,847 112,520,808 5.1
HIPEP VII Asia Pacific Feeder Fund L.P. 5,625,000 24,375,000 4,389,847 30,417,420 1.4
HIPEP VII Emerging Markets Feeder Fund L.P. 6,600,000 13,400,000 2,308,611 15,641,946 0.7
HIPEP VII Europe Feeder Fund L.P.†† 20,266,911 51,024,594 14,359,231 58,519,964 2.6
HarbourVest Canada Parallel Growth Fund L.P.‡‡ 11,919,759 12,453,815 3,168,802 15,992,657 0.7
HarbourVest 2015 Global Fund L.P. 26,500,000 73,517,309 26,468,961 87,191,775 4.0
HarbourVest 2016 Global AIF L.P. 37,000,000 63,026,107 28,338,280 63,808,770 2.9
HarbourVest Partners Co-Investment IV AIF L.P. 7,000,006 92,999,994 14,371,425 110,299,577 5.0
Dover Street IX Cayman L.P. 28,000,000 72,000,000 26,024,411 77,528,510 3.5
HarbourVest Real Assets III Feeder L.P. 13,000,000 37,000,000 5,917,231 37,630,862 1.7
HarbourVest 2017 Global AIF L.P. 51,500,000 48,520,959 9,704,384 51,943,094 2.3
HIPEP VIII Partnership AIF L.P. 136,000,000 34,000,000 3,704,597 38,227,782 1.7
Secondary Overflow III Tranche B 489,717 9,668,120 1,935,926 19,121,362 0.9
HarbourVest Asia Pacific VIII AIF Fund L.P. 34,750,000 15,255,566 609,439 15,839,846 0.7
Secondary Overflow III Tranche C 1,335,088 8,267,887 6,016,969 5,791,878 0.3
Secondary Overflow III Tranche F 13,213,541 16,786,459 3,385,267 19,792,090 0.9
Secondary Overflow III Tranche G 2,368,597 12,631,403 3,242,588 12,731,479 0.6
Secondary Overflow III Tranche H 11,572,647 18,427,353 1,956,022 22,215,879 1.0
HarbourVest 2018 Global Feeder Fund L.P. 50,750,000 19,250,000 – 21,834,119 1.0
HarbourVest Partners Co-Investment V Feeder Fund L.P. 85,000,000 15,048,219 – 15,012,230 0.7
HarbourVest Real Assets IV Feeder L.P. 50,000,000 – – 1,556,224 0.1
HarbourVest 2019 Global Feeder Fund L.P. 95,000,000 5,006,832 – 5,691,795 0.3
HarbourVest Credit Opportunities Fund II L.P. 50,000,000 – – (49,383) (0.0)
Dover Street X Feeder Fund L.P. 95,000,000 5,000,000 – 6,356,413 0.3
Total International/Global Funds 920,837,177 1,727,241,145 1,214,300,310 1,235,221,310 56.1
Total Investments $1,806,954,923 $3,296,951,812 $2,737,867,399 $2,065,519,797 93.8
* Includes purchase of limited partner interests for shares and cash at the time of HVPE’s IPO.† Includes ownership interests in HarbourVest Partners VII-Cayman Partnership entities.‡ Includes ownership interest in Dover Street VII (AIV 1) Cayman L.P.§ Fund denominated in euros. Commitment amount is €47,450,000.** Fund denominated in euros. Commitment amount is €100,000,000.†† Fund denominated in euros. Commitment amount is €63,000,000.‡‡ Fund denominated in Canadian dollars. Commitment amount is C$32,000,000.
As of 31 January 2020, the cost basis of partnership investments is $1,641,567,593.
The accompanying notes are an integral part of the Financial Statements.
HVPE Annual Report and Accounts 202174
Notes to Consolidated Financial Statements
Note 1 Company Organisation and Investment ObjectiveHarbourVest Global Private Equity Limited (the “Company” or “HVPE”) is a closed-ended investment company registered with the Registrar of Companies in Guernsey under The Companies (Guernsey) Law, 2008. The Company’s registered office is BNP Paribas House, St Julian’s Avenue, St Peter Port, Guernsey GY1 1WA.
The Company was incorporated and registered in Guernsey on 18 October 2007. HVPE is designed to offer shareholders long-term capital appreciation by investing in a diversified portfolio of private equity investments. The Company invests in private equity through private equity funds and may make co-investments or other opportunistic investments. The Company is managed by HarbourVest Advisers L.P. (the “Investment Manager”), an affiliate of HarbourVest Partners, LLC (“HarbourVest”), a private equity fund-of-funds manager. The Company is intended to invest in and alongside existing and newly-formed HarbourVest funds. HarbourVest is a global private equity fund-of-funds manager and typically invests capital in primary partnerships, secondary investments, and direct investments across vintage years, geographies, industries, and strategies.
Operations of the Company commenced on 6 December 2007, following the initial global offering of the Class A Ordinary Shares.
Share CapitalAt 31 January 2021, the Company’s shares were listed on the London Stock Exchange under the symbol “HVPE”. At 31 January 2021, there were 79,862,486 shares issued and outstanding. The shares are entitled to the income and increases and decreases in the net asset value (“NAV”) of the Company, and to any dividends declared and paid, and have full voting rights. Dividends may be declared by the Board of Directors and paid from available assets subject to the Directors being satisfied that the Company will, immediately after payment of the dividend, satisfy the statutory solvency test prescribed by The Companies (Guernsey) Law, 2008.
Dividends will be paid to shareholders pro rata to their shareholdings.
The shareholders must approve any amendment to the Memorandum and Articles of Incorporation. The approval of 75% of the shares is required in respect of any changes that are administrative in nature, any material change from the investment strategy and/or investment objective of the Company, or any material change to the terms of the Investment Management Agreement.
There is no minimum statutory capital requirement under Guernsey law.
Investment Manager, Company Secretary, and AdministratorThe Directors have delegated certain day-to-day operations of the Company to the Investment Manager and the Company Secretary and Administrator, under advice to the Directors, pursuant to service agreements with those parties, within the context of the strategy set by the Board. The Investment Manager is responsible for, among other things, selecting, acquiring, and disposing of the Company’s investments, carrying out financing, cash management, and risk management activities, providing investment advisory services, including with respect to HVPE’s investment policies and procedures, and arranging for personnel and support staff of the Investment Manager to assist in the administrative and executive functions of the Company.
DirectorsThe Directors are responsible for the determination of the investment policy of the Company on the advice of the Investment Manager and have overall responsibility for the Company’s activities. This includes the periodic review of the Investment Manager’s compliance with the Company’s investment policies and procedures, and the approval of certain investments. A majority of Directors must be independent Directors and not affiliated with HarbourVest or any affiliate of HarbourVest.
ST
RA
TE
GIC
RE
PO
RT
GO
VE
RN
AN
CE
RE
PO
RT
FIN
AN
CIA
L S
TA
TE
ME
NT
SS
UP
PL
EM
EN
TAR
Y
HVPE Annual Report and Accounts 2021 75

Notes to Consolidated Financial Statements continued
Note 2 Summary of Significant Accounting Policies The following accounting policies have been applied consistently in dealing with items which are considered material in relation to the Company’s consolidated financial statements (“Financial Statements”).
Basis of PreparationThe Company maintains an overcommitment strategy in an attempt to remain fully invested over time (refer to Note 5 on page 81 for further details on unfunded commitments). HarbourVest prepares forecasts and predictions to provide assurance that the Company has sufficient resources to meet its ongoing requirements. The unprecedented nature of the COVID-19 outbreak has resulted in uncertain financial markets and disruption of global commerce. In response, HarbourVest conducted a rigorous bottom-up risk assessment of the Company’s underlying portfolio in an attempt to quantify the impact of COVID-19. The majority of HVPE’s portfolio by value was deemed likely to experience a low or moderate impact, while only a small proportion was expected to be materially impacted. This portfolio risk assessment was used as the basis for the creation of four revised model scenarios with varying degrees of decline in investment value and investment distributions, with the worst being an Extreme Downside scenario representing an impact to the portfolio that is worse than that experienced during the GFC. All four models verified that the Company has enough resources to meet the Company’s upcoming financial obligations. However, in all circumstances HVPE can take steps to limit or mitigate the impact on the Consolidated Statements of Assets and Liabilities, namely drawing on the credit facility, pausing new commitments, raising additional credit or capital, and selling assets to increase liquidity and reduce outstanding commitments. As a result, the Company’s Financial Statements have been prepared on a going concern basis.
Basis of PresentationThe Financial Statements include the accounts of HarbourVest Global Private Equity Limited and its five wholly owned subsidiaries: HVGPE – Domestic A L.P., HVGPE – Domestic B L.P., HVGPE – Domestic C L.P., HVGPE – International A L.P., and HVGPE – International B L.P. (together “the undertakings”). Each of the subsidiaries is a Cayman Islands limited partnership formed to facilitate the purchase of certain investments. All intercompany accounts and transactions have been eliminated in consolidation.
Method of AccountingThe Financial Statements are prepared in conformity with US generally accepted accounting principles (“US GAAP”), The Companies (Guernsey) Law, 2008, and the Principal Documents. Under applicable rules of Guernsey law implementing the EU Transparency Directive, the Company is allowed to prepare its financial statements in accordance with US GAAP instead of International Financial Reporting Standards (“IFRS”).
The Company is an investment company following the accounting and reporting guidance of the Financial Accounting Standards Boards (“FASB”) Accounting Standards Codification (“ASC”) Topic 946 – Financial Services – Investment Companies.
EstimatesThe preparation of the Financial Statements in conformity with US GAAP requires management to make estimates and assumptions that affect the amounts reported in the Financial Statements and accompanying notes. Actual results could differ from those estimates.
HVPE Annual Report and Accounts 202176

InvestmentsInvestments are stated at fair value in accordance with the Company’s investment valuation policy. The inputs used to determine fair value include financial statements provided by the investment partnerships which typically include fair market value capital account balances. In reviewing the underlying financial statements and capital account balances, the Company considers compliance with ASC Topic 820 – Fair Value Measurement, the currency in which the investment is denominated, and other information deemed appropriate.
The fair value of the Company’s investments is primarily based on the most recently reported NAV provided by the underlying Investment Manager as a practical expedient under ASC Topic 820. This fair value is then adjusted for known investment operating expenses and subsequent transactions, including investments, realisations, changes in foreign currency exchange rates, and changes in value of private and public securities. This valuation does not necessarily reflect amounts that might ultimately be realised from the investment and the difference can be material.
Securities for which a public market does exist are valued by the Company at quoted market prices at the year-end date. Generally, the partnership investments have a defined term and cannot be transferred without the consent of the GP of the limited partnership in which the investment has been made.
Foreign Currency TransactionsThe currency in which the Company operates is US dollars, which is also the presentation currency. Transactions denominated in foreign currencies are recorded in the local currency at the exchange rate in effect at the transaction dates. Foreign currency investments, investment commitments, cash and equivalents, and other assets and liabilities are translated at the rates in effect at the year-end date. Foreign currency translation gains and losses are included in realised and unrealised gains (losses) on investments as incurred. The Company does not segregate that portion of realised or unrealised gains and losses attributable to foreign currency translation on investments.
Cash and EquivalentsThe Company considers all highly liquid investments with an original maturity of three months or less to be cash equivalents. The carrying amount included in the Consolidated Statements of Assets and Liabilities for cash and equivalents approximates their fair value. The Company maintains bank accounts denominated in US dollars, in euros, and in pounds sterling. The Company may invest excess cash balances in highly liquid instruments such as certificates of deposit, sovereign debt obligations of certain countries, and money market funds that are highly rated by the credit rating agencies. The associated credit risk of the cash and equivalents is monitored by the Board and the Investment Manager on a regular basis. The Board has authorised the Investment Manager to manage the cash balances on a daily basis according to the terms set out in the treasury policies created by the Board.
Investment IncomeInvestment income includes interest from cash and equivalents, dividends, and interest received from certain investments due to subsequent fund closings. Dividends are recorded when they are declared, and interest is recorded when earned. During the year ended 31 January 2021, the Company received $1,149,712 from HarbourVest Adelaide L.P. related to interest received from limited partners that participated in subsequent fund closings.
Operating ExpensesOperating expenses include amounts directly incurred by the Company as part of its operations, and do not include amounts incurred from the operations of the investment entities.
Net Realised Gains and Losses on InvestmentsFor investments in private equity funds, the Company records its share of realised gains and losses as reported by the Investment Manager including fund-level related expenses and management fees, and is net of any carry allocation. Realised gains and losses are calculated as the difference between proceeds received and the related cost of the investment.
ST
RA
TE
GIC
RE
PO
RT
GO
VE
RN
AN
CE
RE
PO
RT
FIN
AN
CIA
L S
TA
TE
ME
NT
SS
UP
PL
EM
EN
TAR
Y
HVPE Annual Report and Accounts 2021 77

Notes to Consolidated Financial Statements continued
Note 2 Summary of Significant Accounting Policies continuedNet Change in Unrealised Appreciation and Depreciation on InvestmentsFor investments in private equity funds, the Company records its share of change in unrealised gains and losses as reported by the Investment Manager as an increase or decrease in unrealised appreciation or depreciation of investments and is net of any carry allocation. When an investment is realised, the related unrealised appreciation or depreciation is recognised as realised.
Income TaxesThe Company is registered in Guernsey as a tax exempt company. The States of Guernsey Income Tax Authority has granted the Company exemption from Guernsey income tax under the provision of the Income Tax (Exempt Bodies) (Guernsey) Ordinance 1989 and the Company will be charged an annual exemption fee of £1,200 included as other expenses in the Consolidated Statements of Operations. Income may be subject to withholding taxes imposed by the US or other countries, which will impact the Company’s effective tax rate.
Investments made in entities that generate US source income may subject the Company to certain US federal and state income tax consequences. A US withholding tax at the rate of 30% may be applied on the distributive share of any US source dividends and interest (subject to certain exemptions) and certain other income that is received directly or through one or more entities treated as either partnerships or disregarded entities for US federal income tax purposes. Furthermore, investments made in entities that generate income that is effectively connected with a US trade or business may also subject the Company to certain US federal and state income tax consequences. The US requires withholding on effectively connected income for corporate partners at the rate of 21%. In addition, the Company may also be subject to a branch profits tax which can be imposed at a rate of up to 30% of any after-tax, effectively connected income associated with a US trade or business. However, no amounts have been accrued.
The Company accounts for income taxes under the provisions of ASC Topic 740 – Income Taxes. This standard establishes consistent thresholds as it relates to accounting for income taxes. It defines the threshold for recognising the benefits of tax-return positions in the financial statements as “more-likely-than-not” to be sustained by the taxing authority and requires measurement of a tax position meeting the more-likely-than-not criterion, based on the largest benefit that is more than 50% likely to be realised. For the year ended 31 January 2021, the Investment Manager has analysed the Company’s inventory of tax positions taken with respect to all applicable income tax issues for all open tax years (in each respective jurisdiction), and has concluded that no provision for income tax is required in the Company’s Financial Statements.
Shareholders in certain jurisdictions may have individual tax consequences from ownership of the Company’s shares. The Company has not included the impact of these tax consequences on the shareholders in these Financial Statements.
Market and Other Risk FactorsThe Company’s investments are subject to various risk factors including market price, credit, interest rate, liquidity, and currency risk. Investments are based primarily in the US, Europe, and Asia Pacific, and thus have concentrations in such regions. The Company’s investments are also subject to the risks associated with investing in leveraged buyout and venture capital transactions that are illiquid and non-publicly traded. Such investments are inherently more sensitive to declines in revenues and to increases in expenses that may occur due to general downward swings in the world economy or other risk factors including increasingly intense competition, rapid changes in technology, changes in federal, state and foreign regulations, and limited capital investments.
The Company is subject to credit and liquidity risk to the extent any financial institution with which it conducts business is unable to fulfil contracted obligations on its behalf. Management monitors the financial condition of those financial institutions and does not anticipate any losses from these counterparties.
HVPE Annual Report and Accounts 202178

Note 3 Material Agreements and Related FeesAdministrative AgreementThe Company retained BNP Paribas (“BNP”) as Company Secretary and Administrator beginning 11 May 2018. Fees for these services are paid as invoiced by BNP and include an administration fee of £50,000 per annum, a secretarial fee of £50,000 per annum, a compliance services fee of £15,000 per annum, ad-hoc service fees, and reimbursable expenses. During the years ended 31 January 2021 and 2020, fees of $171,188 and $212,459, respectively, were incurred to BNP and are included as other expenses in the Consolidated Statements of Operations.
RegistrarThe Company has retained Link Asset Services (formerly “Capita”) as share registrar. Fees for this service include a base fee of £23,090, plus other miscellaneous expenses. During the years ended 31 January 2021 and 2020, registrar fees of $46,773 and $48,677, respectively, were incurred and are included as other expenses in the Consolidated Statements of Operations.
Independent Auditor’s FeesFor the years ended 31 January 2021 and 2020, auditor fees of $336,394 and $256,398 were accrued, respectively, and are included in professional fees in the Consolidated Statements of Operations. The 31 January 2021 figure includes $201,493 relating to the 31 January 2021 annual audit fee and $47,817 relating to the prior financial year’s audit fee. The 31 January 2020 figure includes $170,983 relating to the 31 January 2020 annual audit fee and $6,802 relating to the prior financial year’s audit fee. In addition, the 31 January 2021 and 2020 figures include fees of $87,084 and $78,613, respectively, for audit-related services due to the Auditor, Ernst & Young LLP, conducting a review of the Interim Financial Statements for each period end. There were no other non-audit fees paid to the Auditor by the Company during the years ended 31 January 2021 and 2020.
Investment Management AgreementThe Company has retained HarbourVest Advisers L.P. as the Investment Manager. The Investment Manager is reimbursed for costs and expenses incurred on behalf of the Company in connection with the management and operation of the Company. The Investment Manager does not directly charge HVPE management fees or performance fees other than with respect to parallel investments. However, as an investor in the HarbourVest funds, HVPE is charged the same management fees and is subject to the same performance allocations as other investors in such HarbourVest funds. During the years ended 31 January 2021 and 2020, reimbursements for services provided by the Investment Manager were $2,175,398 and $1,969,642, respectively.
On 30 July 2019, HVPE approved a revised Investment Management Agreement, which has been updated for legal and regulatory changes, and other minor amendments.
During the years ended 31 January 2021 and 2020, HVPE had two parallel investments: HarbourVest Acquisition S.à.r.l. (via HVPE Avalon Co-Investment L.P.) and HarbourVest Structured Solutions II, L.P. (via HVPE Charlotte Co-Investment L.P.). Management fees paid for the parallel investments made by the Company were consistent with the fees charged by the funds alongside which the parallel investments were made during the years ended 31 January 2021 and 2020. The HVPE Avalon Co-Investment L.P. management fee was terminated on 30 September 2017.
Management fees included in the Consolidated Statements of Operations are shown in the table below:
2021 2020
HVPE Charlotte Co-Investment L.P. $761,976 $758,820
For the years ended 31 January 2021 and 2020, management fees on the HVPE Charlotte Co-Investment L.P. investment were calculated based on a weighted average effective annual rate of 0.89% and 0.90%, respectively, on capital originally committed (0.88% and 0.87%, respectively, on committed capital net of management fee offsets) to the parallel investment.
ST
RA
TE
GIC
RE
PO
RT
GO
VE
RN
AN
CE
RE
PO
RT
FIN
AN
CIA
L S
TA
TE
ME
NT
SS
UP
PL
EM
EN
TAR
Y
HVPE Annual Report and Accounts 2021 79

Notes to Consolidated Financial Statements continued
Note 4 InvestmentsIn accordance with the authoritative guidance on fair value measurements and disclosures under generally accepted accounting principles in the US, the Company discloses the fair value of its investments in a hierarchy that prioritises the inputs to valuation techniques used to measure the fair value. The hierarchy gives the highest priority to unadjusted quoted prices in active markets for identical assets or liabilities (Level 1 measurements) and the lowest priority to unobservable inputs (Level 3 measurements). The guidance establishes three levels of the fair value hierarchy as follows:
Level 1 – Inputs that reflect unadjusted quoted prices in active markets for identical assets or liabilities that the Company has the ability to access at the measurement date;
Level 2 – Inputs other than quoted prices that are observable for the asset or liability either directly or indirectly, including inputs in markets that are not considered to be active; and
Level 3 – Inputs that are unobservable.
Level 3 investments include limited partnership interests in HarbourVest funds which report under US generally accepted accounting principles. Inputs used to determine fair value are primarily based on the most recently reported NAV provided by the underlying investment manager as a practical expedient under ASC Topic 820. The fair value is then adjusted for known investment operating expenses and subsequent transactions, including investments, realisations, changes in foreign currency exchange rates, and changes in value of private and public securities.
Income derived from investments in HarbourVest funds is recorded using the equity pick-up method. Under the equity pick-up-method of accounting, the Company’s proportionate share of the net income (loss) and net realised gains (losses), as reported by the HarbourVest funds, is reflected in the Consolidated Statements of Operations as net realised gain (loss) on investments. The Company’s proportionate share of the aggregate increase or decrease in unrealised appreciation (depreciation), as reported by the HarbourVest funds, is reflected in the Consolidated Statements of Operations as net change in unrealised appreciation (depreciation) on investments.
Because of the inherent uncertainty of these valuations, the estimated fair value may differ significantly from the value that would have been used had a ready market for this security existed, and the difference could be material.
During the years ended 31 January 2021 and 2020, the Company made contributions of $430,949,492 and $324,197,851, respectively, to Level 3 investments and received distributions of $289,543,115 and $308,176,357, respectively, from Level 3 investments. As of 31 January 2021, $2,889,177,693 of the Company’s investments are classified as Level 3. As of 31 January 2020, $2,065,519,797 of the Company’s investments were classified as Level 3.
The Company recognises transfers at the current value at the transfer date. There were no transfers during the years ended 31 January 2021 and 2020. Investments include limited partnership interests in private equity partnerships, all of which carry restrictions on redemption. The investments are non-redeemable and the Investment Manager estimates an average remaining life of 10 years with a range of 1 to 32 years remaining.
As of 31 January 2021, the Company had invested $3,919,906,457, or 71.4%, of the Company’s committed capital in investments and had received $3,239,981,084 in cumulative distributions (including dividends from the formerly held investment HarbourVest Senior Loans Europe).
There were no investment transactions during the years ended 31 January 2021 and 2020 in which an investment was acquired and disposed of during the year.
HVPE Annual Report and Accounts 202180

Note 5 CommitmentsAs of 31 January 2021, the Company had unfunded investment commitments to other limited partnerships of $1,573,218,144 which are payable upon notice by the partnerships to which the commitments have been made. Unfunded investment commitments of $1,541,116,084 are denominated in US dollars, $23,845,590 are denominated in euros, and $8,256,470 are denominated in Canadian dollars.
As of 31 January 2020, the Company had unfunded investment commitments to other limited partnerships of $1,806,954,923. Unfunded investment commitments of $1,767,642,666 were denominated in US dollars, $27,392,498 were denominated in euros, and $11,919,759 were denominated in Canadian dollars.
The Investment Manager is not entitled to any direct remuneration (save expenses incurred in the performance of its duties) from the Company, instead deriving its fees from the management fees and carried interest payable by the Company on its investments in underlying HarbourVest Funds. The Investment Management Agreement (the “IMA”), which was amended and restated on 30 July 2019, may be terminated by either party by giving 12 months’ notice. In the event of termination within ten years and three months of the date of the listing on the Main Market on 9 September 2015, the Company would be required to pay a contribution, which would have been $3.9 million at 31 January 2021 and $4.7 million at 31 January 2020, as reimbursement of the Investment Manager’s remaining unamortised IPO costs. In addition, the Company would be required to pay a fee equal to the aggregate of the management fees for the underlying investments payable over the course of the 12-month period preceding the effective date of such termination to the Investment Manager.
Note 6 Debt FacilityAs of 31 January 2021, and 2020, the Company had an agreement with Mitsubishi UFJ Trust and Banking Corporation (“MUFG”) and Credit Suisse for the provision of a multi-currency revolving credit facility (the “Facility”) for an aggregate amount up to $600 million with a termination date no earlier than January 2026, subject to usual covenants. The MUFG commitment was $300 million, and the Credit Suisse commitment was $300 million.
Amounts borrowed against the Facility accrue interest at an aggregate rate of the LIBOR/EURIBOR, a margin, and, under certain circumstances, a mandatory minimum cost. The Facility is secured by the private equity investments and cash and equivalents of the Company, as defined in the agreement. Availability of funds under the Facility and interim repayments of amounts borrowed are subject to certain loan-to-value ratios and portfolio diversity tests applied to the Investment Portfolio of the Company. At 31 January 2021, there was $120 million debt outstanding against the Facility. At 31 January 2020, there was no debt outstanding. For the years ended 31 January 2021 and 2020, interest of $3,012,476 and $16,973, respectively, was incurred and is included as other expenses in the Consolidated Statements of Operations. Included in other assets at 31 January 2021 and 2020 are deferred financing costs of $6,629,115 and $7,976,171, respectively, related to refinancing the Facility. The deferred financing costs are amortised on the terms of the Facility. The Company is required to pay a non-utilisation fee of 100 basis points per annum for the Credit Suisse commitment and 90 basis points per annum for the MUFG commitment. For the years ended 31 January 2021 and 2020, $4,923,153 and $5,916,192, respectively, in non-utilisation fees have been incurred.
ST
RA
TE
GIC
RE
PO
RT
GO
VE
RN
AN
CE
RE
PO
RT
FIN
AN
CIA
L S
TA
TE
ME
NT
SS
UP
PL
EM
EN
TAR
Y
HVPE Annual Report and Accounts 2021 81

Notes to Consolidated Financial Statements continued
Note 7 Financial HighlightsFor the Years Ended 31 January 2021 and 2020
In US Dollars 2021 2020
Shares
Per share operating performance:
Net asset value, beginning of year $27.58 $24.09
Net realised and unrealised gains 8.54 3.62
Net investment loss (0.15) (0.13)
Total from investment operations 8.39 3.49
Net asset value, end of year $35.97 $27.58
Market value, end of year $25.55* $24.15*
Total return at net asset value 30.4% 14.5%
Total return at market value 5.8% 28.8%
Ratios to average net assets
Expenses† 0.55% 0.61%
Net investment loss (0.49)% (0.51)%
* Represents the US dollar-denominated share price.† Does not include operating expenses of underlying investments.
HVPE Annual Report and Accounts 202182
Note 8 Publication and Calculation of Net Asset ValueThe NAV of the Company is equal to the value of its total assets less its total liabilities. The NAV per share is calculated by dividing the net asset value by the number of shares in issue on that day. The Company publishes the NAV per share of the shares as calculated, monthly in arrears, at each month end, generally within 20 days.
Note 9 Related Party TransactionsOther amounts payable to HarbourVest Advisers L.P. of $72,500 and $92,281 represent expenses of the Company incurred in the ordinary course of business, which have been paid by and are reimbursable to HarbourVest Advisers L.P. at 31 January 2021 and 2020, respectively.
Board-related expenses, primarily compensation, of $480,244 and $604,289 were incurred during the years ended 31 January 2021 and 2020, respectively.
Note 10 IndemnificationsGeneral IndemnificationsIn the normal course of business, the Company may enter into contracts that contain a variety of representations and warranties and which provide for general indemnifications. The Company’s maximum exposure under these arrangements is unknown, as this would involve future claims that may be made against the Company that have not yet occurred. Based on the prior experience of the Investment Manager, the Company expects the risk of loss under these indemnifications to be remote.
Investment Manager IndemnificationsConsistent with standard business practices in the normal course of business, the Company has provided general indemnifications to the Investment Manager, any affiliate of the Investment Manager and any person acting on behalf of the Investment Manager or such affiliate when they act in good faith, in the best interest of the Company. The Company is unable to develop an estimate of the maximum potential amount of future payments that could potentially result from any hypothetical future claim but expects the risk of having to make any payments under these general business indemnifications to be remote.
Directors’ and Officers’ IndemnificationsThe Company’s Articles of Incorporation provide that the Directors, managers or other officers of the Company shall be fully indemnified by the Company from and against all actions, expenses, and liabilities which they may incur by reason of any contract entered into or any act in or about the execution of their offices, except such (if any) as they shall incur by or through their own negligence, default, breach of duty, or breach of trust, respectively.
Note 11 Subsequent EventsIn the preparation of the Financial Statements, the Company has evaluated the effects, if any, of events occurring after 31 January 2021 to 27 May 2021, the date that the Financial Statements were issued.
On 31 March 2021, the Company committed $25 million to HarbourVest Partners Co-Investment VI Feeder Fund L.P.
During April 2021, the Company closed an additional $13.8 million to Secondary Overflow Fund IV L.P.
On 30 April 2021, the Company committed $90 million to HarbourVest Partners XII Buyout Feeder Fund L.P., $45 million to HarbourVest Partners XII Venture Feeder Fund L.P., and $15 million to HarbourVest Partners XII Micro Buyout Feeder Fund L.P.
There were no other events or material transactions subsequent to 31 January 2021 that required recognition or disclosure in the Financial Statements.
ST
RA
TE
GIC
RE
PO
RT
GO
VE
RN
AN
CE
RE
PO
RT
FIN
AN
CIA
L S
TA
TE
ME
NT
SS
UP
PL
EM
EN
TAR
Y
HVPE Annual Report and Accounts 2021 83

Glossary of Private Market Terms
Term Definition
Allocated Investments Commitments made to HarbourVest funds that have been allocated to, and can be called by, an underlying General Partner
Bridge Financing An interim financing option used by private equity funds to delay or aggregate capital calls. A given investment is financed using a bridging loan, typically for a period of six to 12 months, with a capital call required only once the bridging loan is due to be repaid
Buyout An investment strategy that involves acquiring controlling stakes in mature companies and generating returns by selling them at a profit after operational efficiencies, expansion and/or financial improvements
Called Capital Total amount of capital called for use by the General Partner
Capital Call or Drawdown A request made by the General Partner for a portion of the capital committed by a Limited Partner
Carried Interest, Carry or Performance Fee
The share of profits due to a General Partner once the Limited Partner’s commitment to a fund plus a defined hurdle rate is reached
Co-investment (sometimes Direct Co-investment)
A minority investment, made directly into an operating company, alongside a fund or other private equity investor
Commingled Fund A fund structure that pools investments from multiple investors into a single fund
Commitment Period or Investment Period
The period of time within which a fund can make investments as established in the Limited Partnership Agreement
Committed Capital or Commitment
The capital a Limited Partner has agreed to commit to a fund across its lifespan
Contributed Capital or Paid-In Capital
The total amount of capital paid into a fund at a specific point in time
Cost (Current, Realised, Total) Current: The cost of current underlying companiesRealised: The cost of underlying companies from which the fund has fully or partially exitedTotal: The cost of underlying companies, both current and fully or partially exited
Discount An investment company trades at a discount if the share price is lower than the net asset value per share. The discount is shown as the percentage difference between the share price and NAV per share
Discount (Notional) As of the date of this report, the audited 31 January 2021 NAV per share is known and available to the market. This information was not available on 31 January 2021 and market participants could not have used it as a reference when making an investment decision. The discount calculated by comparing the 31 January 2021 share price with the audited 31 January 2021 NAV is, therefore, a notional/retrospective discount
Distributed or Distributions The total amount of cash and stock that has been returned to a fund and/or Limited Partners
Distributed to Paid-In Capital (“DPI”) or Realisation Multiple
Total distributions to a fund and/or Limited Partners divided by paid-in capital
Dry Powder Capital that has been raised, but not yet invested
Due Diligence The process undertaken to confirm the accuracy of all data relating to a fund, company, or product prior to an investment. This can also refer to the investigation of a buyer by a seller
Earnings Before Interest, Taxes, Depreciation and Amortisation (“EBITDA”)
A measure of earnings before interest and taxes that exclude non-cash expenses. Valuation methods are commonly based on a comparison of private and public companies’ value as a multiple of EBITDA
Fund-level Borrowing Exposure to leverage in underlying private equity funds. In the context of HVPE, this refers to the Company’s look-through exposure to borrowings at the HarbourVest fund-level
Funded Capital The amount of contributed capital that has been invested by the fund, or capital invested by a fund in a third-party investment
Fund-of-funds (sometimes referred to as Primaries)
An investment strategy of holding a portfolio of third-party private equity funds and/or other investments rather than investing directly in companies
General Partner (“GP”) The manager of a fund
Gross Assets All of the assets of the Company accounted for under US GAAP before deducting any liabilities
Growth Capital or Growth Equity Investment in newly mature companies looking to raise funds, often to expand or restructure operations, enter new markets, or finance an acquisition
HVPE Annual Report and Accounts 202184
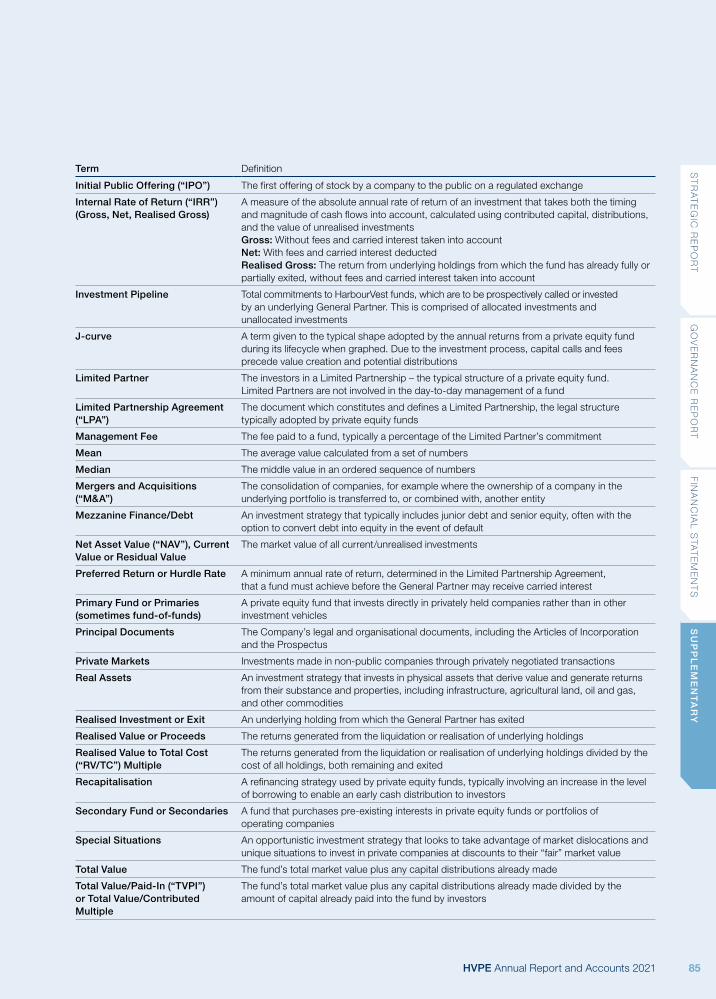
Term Definition
Initial Public Offering (“IPO”) The first offering of stock by a company to the public on a regulated exchange
Internal Rate of Return (“IRR”) (Gross, Net, Realised Gross)
A measure of the absolute annual rate of return of an investment that takes both the timing and magnitude of cash flows into account, calculated using contributed capital, distributions, and the value of unrealised investmentsGross: Without fees and carried interest taken into accountNet: With fees and carried interest deductedRealised Gross: The return from underlying holdings from which the fund has already fully or partially exited, without fees and carried interest taken into account
Investment Pipeline Total commitments to HarbourVest funds, which are to be prospectively called or invested by an underlying General Partner. This is comprised of allocated investments and unallocated investments
J-curve A term given to the typical shape adopted by the annual returns from a private equity fund during its lifecycle when graphed. Due to the investment process, capital calls and fees precede value creation and potential distributions
Limited Partner The investors in a Limited Partnership – the typical structure of a private equity fund. Limited Partners are not involved in the day-to-day management of a fund
Limited Partnership Agreement (“LPA”)
The document which constitutes and defines a Limited Partnership, the legal structure typically adopted by private equity funds
Management Fee The fee paid to a fund, typically a percentage of the Limited Partner’s commitment
Mean The average value calculated from a set of numbers
Median The middle value in an ordered sequence of numbers
Mergers and Acquisitions (“M&A”)
The consolidation of companies, for example where the ownership of a company in the underlying portfolio is transferred to, or combined with, another entity
Mezzanine Finance/Debt An investment strategy that typically includes junior debt and senior equity, often with the option to convert debt into equity in the event of default
Net Asset Value (“NAV”), Current Value or Residual Value
The market value of all current/unrealised investments
Preferred Return or Hurdle Rate A minimum annual rate of return, determined in the Limited Partnership Agreement, that a fund must achieve before the General Partner may receive carried interest
Primary Fund or Primaries (sometimes fund-of-funds)
A private equity fund that invests directly in privately held companies rather than in other investment vehicles
Principal Documents The Company’s legal and organisational documents, including the Articles of Incorporation and the Prospectus
Private Markets Investments made in non-public companies through privately negotiated transactions
Real Assets An investment strategy that invests in physical assets that derive value and generate returns from their substance and properties, including infrastructure, agricultural land, oil and gas, and other commodities
Realised Investment or Exit An underlying holding from which the General Partner has exited
Realised Value or Proceeds The returns generated from the liquidation or realisation of underlying holdings
Realised Value to Total Cost (“RV/TC”) Multiple
The returns generated from the liquidation or realisation of underlying holdings divided by the cost of all holdings, both remaining and exited
Recapitalisation A refinancing strategy used by private equity funds, typically involving an increase in the level of borrowing to enable an early cash distribution to investors
Secondary Fund or Secondaries A fund that purchases pre-existing interests in private equity funds or portfolios of operating companies
Special Situations An opportunistic investment strategy that looks to take advantage of market dislocations and unique situations to invest in private companies at discounts to their “fair” market value
Total Value The fund’s total market value plus any capital distributions already made
Total Value/Paid-In (“TVPI”) or Total Value/Contributed Multiple
The fund’s total market value plus any capital distributions already made divided by the amount of capital already paid into the fund by investors
ST
RA
TE
GIC
RE
PO
RT
GO
VE
RN
AN
CE
RE
PO
RT
FIN
AN
CIA
L S
TAT
EM
EN
TS
SU
PP
LE
ME
NT
AR
Y
HVPE Annual Report and Accounts 2021 85

Glossary of Private Market Terms continued
Term Definition
Total Value/Total Cost (“TV/TC”) Multiple
The total value divided by the total cost to date
Unallocated Investments Commitments made to HarbourVest funds that have not been allocated to, and cannot be called by, an underlying General Partner
Unfunded The portion of investors’ capital commitment that has yet to be “drawn down” or called by a fund manager
Uplift Increase in value received upon realisation of an investment relative to its carrying value prior to realisation
Valuation Multiple The market value of an asset relative to a key financial metric
Venture Capital An investment strategy that generates returns by backing start-up and early stage companies that are believed to have long-term growth potential
Vintage Year Usually the year in which capital is first called by a particular fund, though definitions can vary based on the type of fund or investment
HVPE Annual Report and Accounts 202186

Alternative Performance Measures
Reconciliation of Share Price Discount to Net Asset Value per ShareThe share price discount to NAV per share will vary depending on which NAV per share figure is used. The discount referred to elsewhere in this report is calculated using the live NAVs per share available in the market as at 31 January 2020 and 31 January 2021, those being the 31 December 2019 and 31 December 2020 estimates of $26.92 (sterling equivalent £20.31) and $31.47 (sterling equivalent £23.02), respectively, adjusted for USD/GBP foreign exchange movement, against share prices of £18.36 at 31 January 2020 and £18.70 at 31 January 2021.
The table below outlines the notional discounts to the share price at 31 January 2021, based on the NAVs per share published after this date (31 January 2021 estimate and final). Movements between the published NAVs per share for the same calendar date largely arise as further underlying fund valuations are received, and as adjustments are made for public markets, foreign exchange, and operating expenses.
Date of NAV (estimate and final) NAV per Share
NAV Converted at 31 January
2021 GBP/USD Exchange Rate
(1.3707)
Share Price at 31 January
2021
Discount to NAV
at 31 January 2021
Estimated NAV at 31 December 2020 (published 20 January 2021) $31.47 £22.96 £18.70 18.6%
Estimated NAV at 31 January 2021 (published 18 February) $31.86 £23.24 £18.70 19.5%
Final NAV (US GAAP) at 31 January 2021 (published 28 May) $35.97 £26.24 £18.70 28.7%
KPIs (pages 2 and 3)The KPI metrics show the movement between the NAV per share (in US dollars) and the share price in sterling and translated into US dollars. Relative to the FTSE AW TR index, this is the difference in movement between the year-on-year change of this index vs the particular HVPE KPI. Overleaf the calculations for the balance sheet ratio are provided.
Nav Per Share ($)
Date of NAV (estimate and final) NAV per SharePeriod-on-
period ChangeFTSE AW TR
index MovementHVPE’s Relative
Difference
31 January 2016 $16.75
31 January 2017 $18.47 +10.3% +18.8% -8.5%
31 January 2018 $21.46 +16.2% +28.2% -12.0%
31 January 2019 $24.09 +12.3% -7.1% +19.4%
31 January 2020 $27.58 +14.5% +16.7% -2.2%
31 January 2021 $35.97 +30.4% +17.4% +13.0%
ST
RA
TE
GIC
RE
PO
RT
GO
VE
RN
AN
CE
RE
PO
RT
FIN
AN
CIA
L S
TAT
EM
EN
TS
SU
PP
LE
ME
NT
AR
Y
HVPE Annual Report and Accounts 2021 87

Alternative Performance Measures continued
Annualised Outperformance of FTSE AW TR Index Since Inception (2007)
NAV (US dollar) Compound Annual Growth Rate (“CAGR”)
07/12/2007 $10.00
31/01/2021 $35.97
Elapsed time (years) 13.2
US dollar CAGR 10.2%
FTSE AW TR Index (US dollar) CAGR
07/12/2007 269.9
31/01/2021 596.5
Elapsed time (years) 13.2
FTSE AW TR Index CAGR 6.2%
Annualised outperformance of FTSE AW TR Index since inception (2007) calculation
10.2% minus 6.2% 4.0%
Annualised Outperformance of FTSE AW TR Index Over Ten Years
NAV (US dollar) Compound Annual Growth Rate (“CAGR”)
31/01/2011 $10.24
31/01/2021 $35.97
Elapsed time (years) 10.0
US dollar CAGR 13.4%
FTSE AW TR Index (US dollar) CAGR
31/01/2011 240.7
31/01/2021 596.5
Elapsed time (years) 10.0
FTSE AW TR Index CAGR 9.5%
Annualised outperformance of FTSE AW TR Index over Ten years calculation
13.4% minus 9.5% 3.9%
Total Shareholder Return (£)
Date Share Price (£)Period-on-
period Change
31 January 2017 £11.95 +37.2%
31 January 2018 £12.52 +4.8%
31 January 2019 £14.26 +13.9%
31 January 2020 £18.36 +28.8%
31 January 2021 £18.70 +1.9%
HVPE Annual Report and Accounts 202188

Total Shareholder Return ($)
YearShare Price
($ Converted)Period-on-
period ChangeFTSE AW TR
Index MovementHVPE’s Relative
Difference
31 January 2016 $12.41
31 January 2017 $15.03 +21.1% +18.8% +2.4%
31 January 2018 $17.77 +18.2% +28.2% -9.9%
31 January 2019* $18.75 +5.5% -7.1% +12.6%
31 January 2020* $24.15 +28.8% +16.7% +12.1%
31 January 2021* $25.55 +5.8% +17.4% -11.6%
* HVPE introduced an additional US dollar share price on 10 December 2018; from this date onwards, the actual US dollar share price, as reported by the London Stock Exchange, has been used. Prior to this date, the US dollar share price had been converted from the sterling share price at the prevailing exchange rate.
Managing the Balance SheetTotal Commitment Ratio
(Total exposure to private markets investments as a percentage of NAV)31 January
202131 January
2020
Investment Portfolio $2,889.2 $2,065.5
Investment Pipeline $1,573.2 $1,807.0
Total $4,462.4 $3,872.5
NAV $2,872.5 $2,202.7
Total Commitment Ratio 155% 176%
Commitment Coverage Ratio
(Short-term liquidity as a percentage of Total Investment Pipeline)31 January
202131 January
2020
Cash $98.4 $130.6
Available credit facility $480.0 $600.0
Total sources $578.4 $730.6
Investment Pipeline $1,573.2 $1,807.0
Commitment Coverage Ratio 37% 40%
Rolling Coverage Ratio
(A measure of medium-term commitment coverage)31 January
202131 January
2020
Cash $98.4 $130.6
Available credit facility $480.0 $600.0
Current year estimated realisations $343.9 $403.7
Total sources $922.3 $1,134.3
Next three years’ estimated investments $1,372.0 $1,512.9
Rolling Coverage Ratio 67% 75%
ST
RA
TE
GIC
RE
PO
RT
GO
VE
RN
AN
CE
RE
PO
RT
FIN
AN
CIA
L S
TAT
EM
EN
TS
SU
PP
LE
ME
NT
AR
Y
HVPE Annual Report and Accounts 2021 89
Disclosures
InvestmentsThe companies represented within this report are provided for illustrative purposes only, as example portfolio holdings. There are over 10,000 individual companies in the HVPE portfolio, with no one company comprising more than 1.6% of the entire portfolio.
The deal summaries, General Partners (managers), and/or companies shown within the report are intended for illustrative purposes only. While they may represent an actual investment or relationship in the HVPE portfolio, there is no guarantee they will remain in the portfolio in the future.
Past performance is no guarantee of future returns.
Forward-looking StatementsThis report contains certain forward-looking statements. Forward-looking statements relate to expectations, beliefs, projections, future plans and strategies, anticipated events or trends, and similar expressions concerning matters that are not historical facts. In some cases, forward-looking statements can be identified by terms such as “anticipate”, “believe”, “could”, “estimate”, “expect”, “intend”, “may”, “plan”, “potential”, “should”, “will”, and “would”, or the negative of those terms, or other comparable terminology. The forward-looking statements are based on the Investment Manager’s beliefs, assumptions, and expectations of future performance and market developments, taking into account all information currently available. These beliefs, assumptions, and expectations can change as a result of many possible events or factors, not all of which are known or are within the Investment Manager’s control. If a change occurs, the Company’s business, financial condition, liquidity, and results of operations may vary materially from those expressed in forward-looking statements.
By their nature, forward-looking statements involve known and unknown risks and uncertainties because they relate to events, and depend on circumstances, that may or may not occur in the future. Forward-looking statements are not guarantees of future performance. Any forward-looking statements are only made as at the date of this document, and the Investment Manager neither intends nor assumes any obligation to update forward-looking statements set forth in this document whether as a result of new information, future events, or otherwise, except as required by law or other applicable regulation.
In light of these risks, uncertainties, and assumptions, the events described by any such forward-looking statements might not occur. The Investment Manager qualifies any and all of its forward-looking statements by these cautionary factors.
Please keep this cautionary note in mind while reading this report.
Some of the factors that could cause actual results to vary from those expressed in forward-looking statements include, but are not limited to:
/ the factors described in this report;/ the rate at which HVPE deploys its capital in investments
and achieves expected rates of return;/ HarbourVest’s ability to execute its investment strategy,
including through the identification of a sufficient number of appropriate investments;
/ the ability of third-party managers of funds in which the HarbourVest funds are invested and of funds in which the Company may invest through parallel investments to execute their own strategies and achieve intended returns;
/ the continuation of the Investment Manager as manager of the Company’s investments, the continued affiliation with HarbourVest of its key investment professionals, and the continued willingness of HarbourVest to sponsor the formation of and capital raising by, and to manage, new private equity funds;
/ HVPE’s financial condition and liquidity, including its ability to access or obtain new sources of financing at attractive rates in order to fund short-term liquidity needs in accordance with the investment strategy and commitment policy;
/ changes in the values of, or returns on, investments that the Company makes;
/ changes in financial markets, interest rates or industry, general economic, or political conditions; and
/ the general volatility of the capital markets and the market price of HVPE’s shares.
Publication and Calculation of Net Asset ValueThe NAV of the Company is equal to the value of its total assets less its total liabilities. The NAV per share is calculated by dividing the NAV of the Company by the number of shares in issue. The Company intends to publish the estimated NAV per share as calculated, monthly in arrears, as at each month end, generally within 20 days.
HVPE Annual Report and Accounts 202190

Regulatory InformationHVPE is required to comply with the Listing Rules, Disclosure Guidance and Transparency Rules of the Financial Conduct Authority in the United Kingdom (the “LDGT Rules”). It is also authorised by the Guernsey Financial Services Commission as an authorised closed-end investment scheme under the Protection of Investors (Bailiwick of Guernsey) Law, 1987, as amended (the “POI Law”). HVPE is subject to certain ongoing requirements under the LDGT Rules and the POI Law and certain rules promulgated thereunder relating to the disclosure of certain information to investors, including the publication of annual and half-yearly financial reports.
Valuation PolicyValuations Represent Fair Value Under US GAAPHVPE’s 31 January 2021 NAV is based on the 31 December 2020 NAV of each HarbourVest fund, Absolute1, and Conversus, adjusted for changes in the value of public securities, foreign currency, known material events, cash flows, and operating expenses during January 2021. The valuation of each HarbourVest fund is presented on a fair value basis in accordance with US generally accepted accounting principles (“US GAAP”). See Note 4 in the Notes to the Financial Statements on page 80.
The Investment Manager typically obtains financial information from 90% or more of the underlying investments for each of HVPE’s HarbourVest funds to calculate the NAV. For each fund, the accounting team reconciles investments, distributions, and unrealised/realised gains and losses to the Financial Statements. The team also reviews underlying partnership valuation policies.
Management of Foreign Currency ExposureThe Investment Portfolio includes three euro-denominated HarbourVest funds and a Canadian dollar-denominated fund. 15.2% of underlying portfolio holdings are denominated in euros. The euro-denominated Investment Pipeline is €19.7 million.
/ 2.2% of underlying portfolio holdings are denominated in sterling. There is no sterling-denominated Investment Pipeline.
/ 1.3% of underlying portfolio holdings are denominated in Australian dollars. There is no Australian dollar-denominated Investment Pipeline.
/ 0.5% of underlying portfolio holdings are denominated in Canadian dollars. The Canadian dollar-denominated Investment Pipeline is C$10.6 million.
HVPE has exposure to foreign currency movement through foreign currency-denominated assets within the Investment Portfolio and through its Investment Pipeline of unfunded commitments, which are long term in nature. The Company’s most significant currency exposure is to euros. The Company does not actively use derivatives or other products to hedge the currency exposure.
1 Absolute, referred to as “HVPE Avalon Co-Investment L.P.” in the Audited Condensed Interim Consolidated Schedule of Investments, has been fully realised. However, $474,898 remains in escrow.
ST
RA
TE
GIC
RE
PO
RT
GO
VE
RN
AN
CE
RE
PO
RT
FIN
AN
CIA
L S
TAT
EM
EN
TS
SU
PP
LE
ME
NT
AR
Y
HVPE Annual Report and Accounts 2021 91
Key Information
ExchangeLondon Stock Exchange (Main Market)
TickerHVPE (£)/HVPD ($)
Listing date9 September 2015 (LSE Main Market)
2 May 2010 (LSE Specialist Fund Segment – since migrated to LSE Main Market)
6 December 2007 (Euronext – since delisted)
Fiscal year end31 January
Base currencyUS dollars
Sterling quote London Stock Exchange
US dollar quote London Stock Exchange
ISINGG00BR30MJ80
ISINGG00BR30MJ80
SEDOLBR30MJ8
SEDOLBGT0LX2
TIDMHVPE LN
TIDMHVPD LN
Investment ManagerHarbourVest Advisers L.P. (affiliate of HarbourVest Partners, LLC)
Registration Financial Conduct Authority
Fund consent Guernsey Financial Services Commission
Outstanding shares 79,862,486 Ordinary Shares
2020/21 CalendarMonthly NAV estimate: Generally within 20 days of month end
Annual General Meeting 2021: 21 July 2021
Semi-Annual Report and Unaudited Condensed Interim Consolidated Financial Statements: October 2021
Company Advisers Investment Manager HarbourVest Advisers L.P. c/o HarbourVest Partners, LLC One Financial Center Boston MA 02111 Tel +1 617 348 3707
AuditorErnst & Young LLP Royal Chambers St Julian’s Avenue St Peter Port Guernsey GY1 4AF Tel +44 1481 717 400
Company Secretary and Administrator BNP Paribas Securities ServicesBNP Paribas House St Julian’s Avenue St Peter Port Guernsey GY1 1WA Tel +44 1481 750 800 www.bnpparibas.je
Registrar Link Group The Registry 34 Beckenham Road Beckenham Kent BR3 4TU Tel +44 (0)871 664 0300 Tel +44 (0)20 8369 3399 (outside UK)
Swiss Paying Agent Banque Cantonale de Genève 17 Quai de l’Ile 1211 Geneva 2 Switzerland
HVPE Annual Report and Accounts 202192

Company Advisers Continued
Joint Corporate Brokers Jefferies Hoare Govett Vintners Place 68 Upper Thames Street London EC4V 3BJ Tel +44 20 7029 8000
J.P. Morgan Cazenove* 25 Bank Street Canary Wharf London E14 5JP Tel +44 20 7314 7361
* J.P. Morgan Securities Ltd., which conducts its UK investment banking activities as J.P. Morgan Cazenove.
Registered OfficeHarbourVest Global Private Equity Limited Company Registration Number: 47907 BNP Paribas House St Julian’s Avenue St Peter Port Guernsey GY1 1WA Tel +44 1481 750 800
ST
RA
TE
GIC
RE
PO
RT
GO
VE
RN
AN
CE
RE
PO
RT
FIN
AN
CIA
L S
TAT
EM
EN
TS
SU
PP
LE
ME
NT
AR
Y
HVPE Annual Report and Accounts 2021 93