2019 Budget Policy Statement - The National Treasury
135
REPUBLIC OF KENYA THE NATIONAL TREASURY AND PLANNING MEDIUM TERM 2019 BUDGET POLICY STATEMENT CREATING JOBS, TRANSFORMING LIVES – HARNESSING “THE BIG FOUR” FEBRUARY 2019
-
Upload
khangminh22 -
Category
Documents
-
view
0 -
download
0
Transcript of 2019 Budget Policy Statement - The National Treasury
REPUBLIC OF KENYA
THE NATIONAL TREASURY AND PLANNING
MEDIUM TERM
2019 BUDGET POLICY
STATEMENT
CREATING JOBS, TRANSFORMING LIVES –
HARNESSING “THE BIG FOUR”
FEBRUARY 2019
ii 2019 Budget Policy Statement
© Budget Policy Statement (BPS) 2019
To obtain copies of the BPS, please contact:
The National Treasury and Planning
Treasury Building
P. O. Box 30007-00100
NAIROBI, KENYA
Tel: +254-20-2252-299
Fax: +254-20-341-082
The document is also available on the website at: www.treasury.go.ke
iii 2019 Budget Policy Statement
Foreword
The 2019 Budget Policy Statement (BPS) is prepared against a background of a
weakening global economy. Global growth is projected to slow down to 3.5 percent
in 2019 from an estimate of 3.7 percent in 2018 occasioned by weaker economic
activities in both the advanced and emerging market economies. However, the sub-
Saharan Africa region is expected to register stronger growth of 3.5 percent in 2019
from an estimated 2.9 percent in 2018 largely due to improved commodity prices
and capital markets access.
On the domestic scene, economic growth has remained strong and resilient. The
economy is estimated to grow by 6.0 percent in 2018 up from 4.9 percent in 2017
and further to 6.2 percent in 2019. Growth continues to be supported by strong
agricultural and manufacturing activities underpinned by favourable weather
conditions, strong service sector, stable macroeconomic environment, ongoing
public infrastructural investments and sustained business confidence.
The policy outlined in this BPS draws from the national development agenda as
outlined in the Third Medium Term Plan (MTP III) of the Vision 2030 and targets
to attain the Sustainable Development Goals (SDGs) of the United Nations. The
policy prioritizes investments in “The Big Four” Plan, that is: manufacturing for
job creation; food and nutrition security; Universal Health Coverage; and
affordable housing. In addition, the policy prioritizes creation of a conducive
business environment under all the enablers of the “Big Four” Plan.
Notable progress has been made on the implementation of the “Big Four” Plan
across the four strategic areas. To support growth of the manufacturing sector, the
Government has scaled up reforms to encourage investment in the sector. In
particular, the Government has heightened the fight against illicit trade and
contrabands to protect genuine businesses and traders. To enhance food and
nutrition security, the Government has aligned all policies under the agriculture
sector towards increasing food production, boosting smallholder productivity and
reducing the cost of food. To make Universal Health Coverage a reality, the
Government has launched the pilot phase of the universal health programme in four
Counties namely, Kisumu, Machakos, Nyeri and Isiolo. Finally, on housing, the
Government has established the National Housing Development Fund which will
be responsible for mobilizing capital to finance the affordable housing project.
Additionally, the Government has established the Kenya Mortgage Refinance
Company (KMRC) to leverage funds from Development partners and the private
sector and provide secure long-term funding to financial institutions thereby
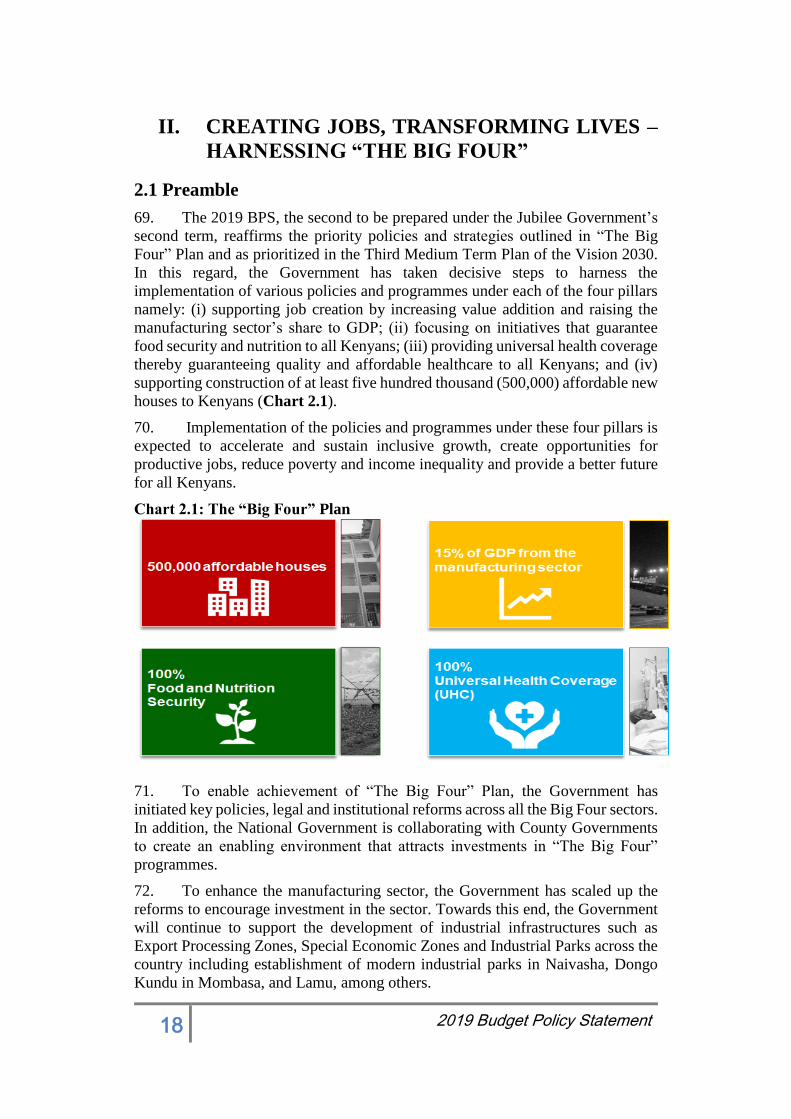
increasing the availability and affordability of mortgage loans to Kenyans.
The fiscal framework contained in this BPS supports the fiscal consolidation plan.
The plan will see a gradual reduction of fiscal deficit from 7.2 percent of GDP in
the FY 2017/18 to 3.1 percent of GDP over the medium term. The consolidation
will be supported by enhanced revenue mobilization and rationalization of
recurrent expenditure while protecting capital expenditure. This will ultimately
reduce public debt and create fiscal space over the medium term. In order to
increase efficiency and effectiveness of public spending, we have established the
Public Investment and Management (PIM) Unit and adopted Public Investment
iv 2019 Budget Policy Statement
Guidelines that will guide appraisal of all projects before their inclusion in the
budget.
Finalization of this BPS has benefitted from the guidance and wise counsel of H.E.
The President and H.E. The Deputy President both of whom I thank most sincerely.
My sincere gratitude also goes to my Cabinet colleagues, the staff of the National
Treasury and Planning as well as other Government officials, for their
contributions. Equally, I am grateful to the stakeholders and the general public who
provided useful comments to reshape the policy in this document especially during
the Public Sector hearings. Indeed, we have incorporated most of the suggestions
while finalizing this document.
HENRY K. ROTICH, EGH
CABINET SECRETARY/ NATIONAL TREASURY & PLANNING
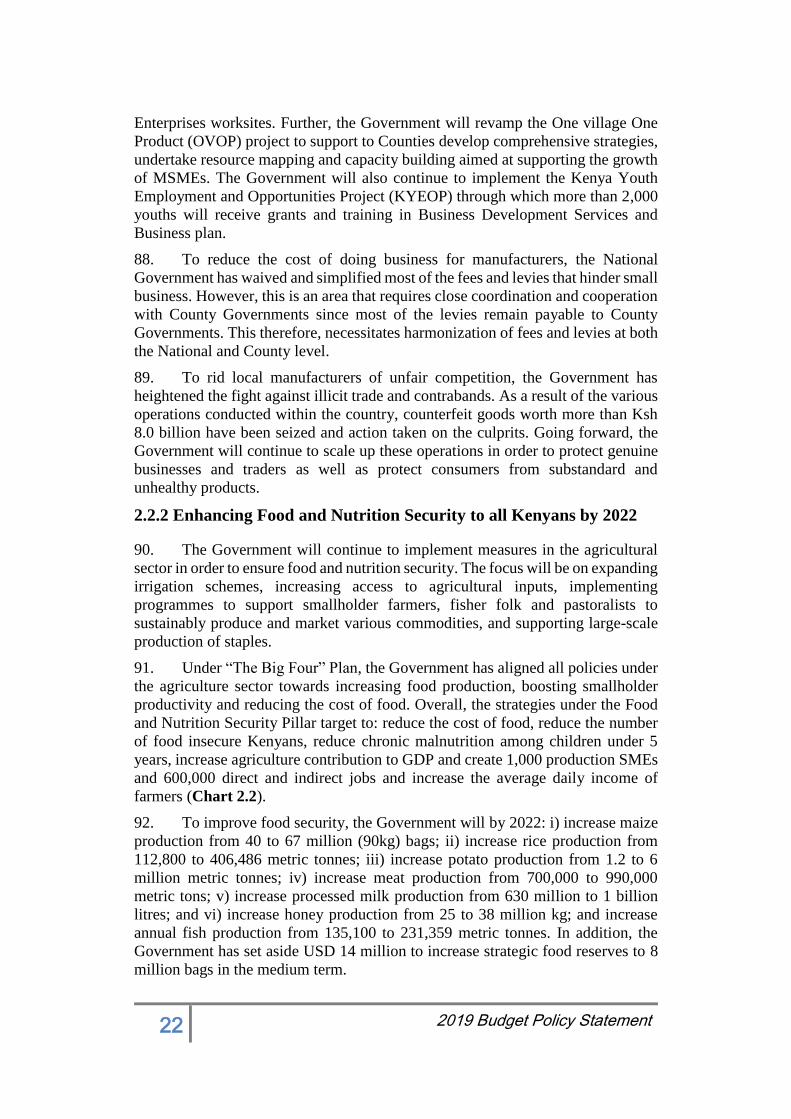
v 2019 Budget Policy Statement
Acknowledgement
The 2019 Budget Policy Statement is prepared in compliance with the provisions
of the Public Finance Management Act, 2012. It outlines the current state of the
economy, provides macro-fiscal outlook over the medium term and specifies the
set strategic priorities and policy goals together with a summary of Government
spending plans, as a basis of the FY 2019/20 budget. The document is expected to
improve the public’s understanding of Kenya’s public finances and guide public
debate on economic and development matters.
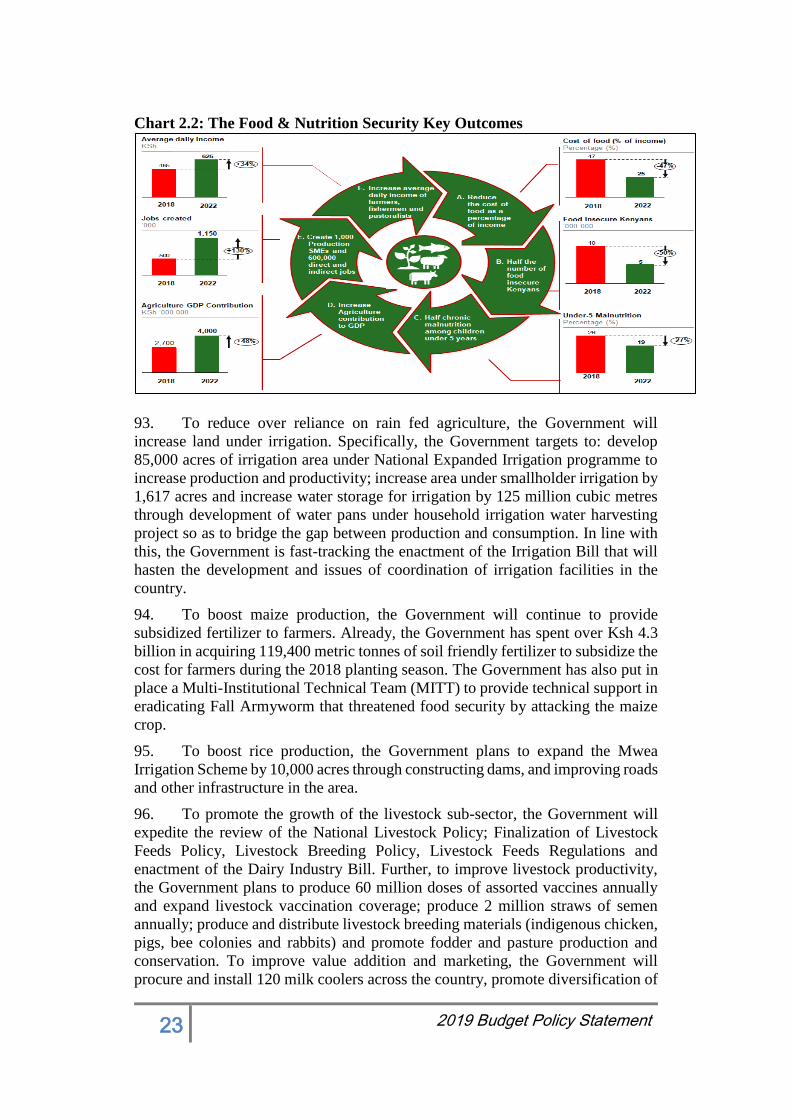
The Government is keen on fostering prudent management of public resources in
order to support inclusive economic growth and development. In this respect, while
preparing this budget, we carefully scrutinized budget programs to ensure their
optimal alignment with the National Development Agenda as outlined the Third
Medium Term Plan (MTP III) of the Vision 2030, the Sustainable Development
Goals and the Government priorities under the “Big Four” Plan. In this exercise,
we have curtailed resources going to lower-priority areas following the zero-based
budgeting approach that we have adopted while all new projects have been frozen
until completion of ongoing ones in order to improve efficiency of our public
investment, streamline spending and reduce wastage.
The policy measures outlined in this BPS are expected to improve economy-wide
efficiencies for sustainable and inclusive growth. In particular, the policies are
designed to create an enabling environment that supports growth in businesses and
investment as well as enhance the wellbeing of all Kenyans. To further enhance
the business climate, we will continue to implement business regulatory reforms
that will reduce the time and cost associated with opening and operating a business
in the country. To further enhance the welfare of Kenyans, we will continue to
enhance pro-poor expenditures in health, education and protect the vulnerable.
The completion of this policy statement was as a result of collective effort by
various Government Ministries, Departments and Agencies (MDAs) who provided
valuable information. We are grateful for their contributions. We are also grateful
for the inputs we received while preparing this document from the Macro Working
Group; stakeholders and the general public during the Public Sector Hearings
December 2018. A dedicated team in the National Treasury spent substantial
amount of time putting together this BPS. We are particularly grateful to them for
their tireless efforts and dedication.
DR. KAMAU THUGGE, CBS
PRINCIPAL SECRETARY/NATIONAL TREASURY
vi 2019 Budget Policy Statement
Table of Contents
Foreword ............................................................................................................................. iii
Acknowledgement ......................................................................................................................... v
I. RECENT ECONOMIC DEVELOPMENTS AND MEDIUM-TERM OUTLOOK........... 1 1.1 Overview ............................................................................................................................... 1
1.2 Recent Economic Developments and Outlook ...................................................................... 2
1.3 Fiscal Performance .............................................................................................................. 12
1.4 Fiscal Policy ........................................................................................................................ 14
1.5 Economic Outlook ............................................................................................................... 16
1.6 Risks to the Economic Outlook ........................................................................................... 17
II. CREATING JOBS, TRANSFORMING LIVES – HARNESSING “THE BIG FOUR” . 18 2.1 Preamble .............................................................................................................................. 18
2.2 “The Big Four” Plan ............................................................................................................ 19
2.2.1 Supporting Value Addition and Raising the Share of Manufacturing Sector to GDP . 19
2.2.2 Enhancing Food and Nutrition Security to all Kenyans by 2022 ................................. 22
2.2.3 Providing Universal Health Coverage to Guarantee Quality and Affordable Healthcare
to All Kenyans ...................................................................................................................... 24
2.2.4 Provision of Affordable and Decent Housing for All Kenyans ................................... 26
2.3 Enablers for the “The Big Four” Plan.................................................................................. 28
2.3.1 Conducive Business Environment for Investment and Job Creation ........................... 28
2.3.2 Investing in Infrastructure Development to Unlock Growth Potential and Drive “The
Big Four” Plan ...................................................................................................................... 32
2.3.3 Investing in Sectoral Transformation for Broad Based Sustainable Economic Growth
.............................................................................................................................................. 35
2.3.4 Enhancing Service Delivery through Devolution ........................................................ 37
2.3.5 Investing in Kenyans for a Shared Prosperity .............................................................. 38
2.3.6 Entrenching Structural Reforms to Support “The Big Four” Plan ............................... 40
III. BUDGET FOR FY 2019/20 AND THE MEDIUM TERM ............................................... 44 3.1 Fiscal Framework Summary ................................................................................................ 44
3.2 Budgetary Allocations for the FY 2019/20 and the Medium Term ..................................... 45
3.3 Details of Sector Priorities ................................................................................................... 47
IV. COUNTY FINANCIAL MANAGEMENT AND DIVISION OF REVENUE ................ 56 4.1 Fiscal Performance of County Governments in FY 2017/18 ............................................... 56
4.1.1 County Governments’ Own-Source Revenue .............................................................. 56
4.1.2 County Governments’ Budget Absorption .................................................................. 59
4.2 County Governments’ Compliance with Fiscal Responsibility Principles .......................... 59
4.2.1 Compliance with the Requirement for Development Spending Allocations ............... 59
4.2.2 Compliance with the Requirement for Expenditure on Wages .................................... 60
4.3 Prudent Management of Fiscal Risks .................................................................................. 61
4.3.1 Pending Bills ................................................................................................................ 61
4.3.2 Other Risks Identified in County Financial Reports .................................................... 61
4.3.3 Status of Transfer of Devolved Functions ................................................................... 62
vii 2019 Budget Policy Statement
4.4 Division of Revenue between the Two Levels of Government ........................................... 63
4.4.1 Underperformance in Revenue Raised Nationally ....................................................... 63
4.4.2 Implications for Vertical Revenue Division ................................................................ 64
4.4.3 Measures to Forestall Further Deterioration in the Vertical Fiscal Balance ................ 64
4.5 Horizontal Allocation of Revenue among the County Governments .................................. 66
4.6 Emerging Issues .................................................................................................................. 68
ANNEX 1: ADHERENCE TO FISCAL RESPONSIBILITY PRINCIPLES ........................ 69
ANNEX 2: STATEMENT OF SPECIFIC FISCAL RISKS .................................................... 72 Annex Table 1: Macroeconomic Indicators .............................................................................. 88
Annex Table 2: Government Fiscal Operations, Ksh Billion .................................................... 89
Annex Table 3: Government Fiscal Operations, Percent of GDP ............................................. 90
Annex Table 4a: Summary of Expenditure by Programmes, 2019/20 - 2021/22 (Ksh Million)
................................................................................................................................................... 91
Annex Table 5: Public Private Partnership (PPP) Projects – Kenya, Government’s support
measures and Termination Terms............................................................................................ 100
Annex Table 6: Summary of Public Participation Highlights ................................................. 108
Annex Table 7: Summary of Comments from Stakeholders and Public on 2019 BPS ........... 116

viii 2019 Budget Policy Statement
About the Budget Policy Statement
The Budget Policy Statement (BPS) is a Government policy document that sets out
the broad strategic priorities and policy goals that will guide the National
Government and the County Governments in preparing their budgets both for the
following financial year and over the medium term.
In the document, adherence to the fiscal responsibility principles demonstrates
prudent and transparent management of public resources in line with the
Constitution and the Public Finance Management (PFM) Act, 2012.
Section 25 of the PFM Act, 2012, provides that the National Treasury shall prepare
and submit to Cabinet the BPS for approval. Subsequently, the approved BPS is
submitted to Parliament, by the 15th of February each year. Parliament shall, not
later than 14 days after the BPS is submitted, table and discuss a report containing
its recommendations and pass a resolution to adopt it with or without amendments.
The Cabinet Secretary shall take into account resolutions passed by Parliament in
finalizing the budget for the FY 2019/20.
The Budget Policy Statement contains:
(a) an assessment of the current state of the economy including macroeconomic
forecasts;
(b) the financial outlook with respect to Government revenue, expenditures and
borrowing for the next financial year and over the medium term;
(c) the proposed expenditure ceilings for the National Government, including
those of Parliament and the Judiciary and indicative transfers to County
Governments;
(d) the fiscal responsibility principles and financial objectives over the medium-
term including limits on total annual debt; and
(e) Statement of Specific Fiscal Risks.
The preparation of the BPS is a consultative process that involves seeking and
taking into account the views of: The Commission on Revenue Allocation; County
Governments; Controller of Budget; Parliamentary Service Commission; Judicial
Service Commission; Ministries, Departments and Agencies; the public; and any
other interested persons or groups.
1 2019 Budget Policy Statement
I. RECENT ECONOMIC DEVELOPMENTS AND
MEDIUM-TERM OUTLOOK
1.1 Overview
1. The Kenyan economy remains resilient and grew by 5.8 percent, 6.2
percent and 6.0 percent in the first, second and third quarters of 2018 respectively,
up from 4.7 percent in similar quarters in 2017. Growth for the first three quarters
of 2018 averaged 6.0 percent and is estimated to grow by 6.0 percent in 2018up
from 4.9 percent in 2017, reflecting improved rains, better business sentiments and
easing of political uncertainty Growth is projected to improve further to 6.2 percent
in 2019 supported by a strong rebound in agricultural output, steadily recovering
industrial activity, and robust performance in the services sector.
2. The economy continues to register macroeconomic stability with low and
stable interest rates and a competitive exchange rate to support exports. Month-on-
month overall inflation remained stable and within the 5 percent target in 2018
largely due to lower food prices following favourable weather conditions,
reduction in electricity tariffs and a decline in fuel prices. Overall inflation declined
to 4.7 percent in January 2019 from 5.7 percent in December 2018 and 4.8 percent
in January 2018. Inflation is expected to remain within target in 2019, largely due
to lower energy prices and expected stability in food prices.
3. The foreign exchange market remains stable supported by a continued
narrowing in the current account deficit. The current account deficit is estimated at
5.2 percent of GDP in 2018 and is expected to narrow to 5.1 percent of GDP in
2019. This narrowing reflects strong growth in diaspora remittances and tourism
receipts, higher tea and horticultural exports, slower growth in imports due to lower
food and SGR–related equipment imports and the decline in international oil prices
4. Over the medium term, economic growth is expected to rise gradually to
7.0 percent per annum due to investments in strategic areas under the “Big Four”
Plan that aim to increase job creation through the manufacturing sector, ensure
food security and improved nutrition, achieve universal health coverage and
provide affordable houses to Kenyans. These efforts will support the business
environment, create jobs and ultimately promote broad based inclusive growth.
5. Kenya continues to be ranked favorably in the ease of doing business and
as a top investment destination. In the 2019 World Bank’s Doing Business Report,
Kenya was ranked position 61 in 2018 moving 19 places from position 80 in 2017.
2 2019 Budget Policy Statement
1.2 Recent Economic Developments and Outlook
Global and Regional Economic Developments
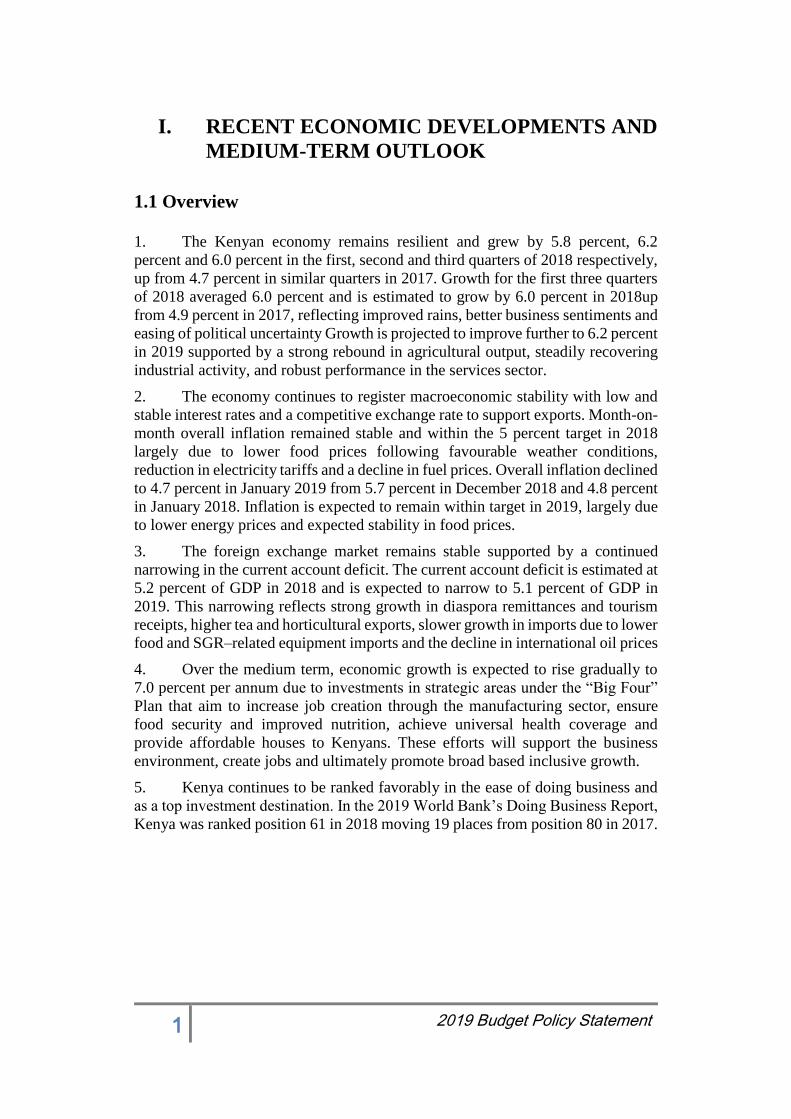
6. Global growth is projected to slow down to 3.5 percent in 2019 from an
estimated 3.7 percent growth in 2018 (Table 1.1). The slowdown is as a result of
weakening growth rate in both the advanced and emerging market economies
mainly due to the negative effects of trade tensions between the United States and
China.
Table 1.1: Global Economic Growth, Percent
Source: January 2019 WEO; *Projections by the National Treasury
7. In advanced economies, growth is expected to ease to 2.0 percent in 2019
from an estimated 2.3 percent in 2018 mainly due to trade tensions between the
U.S. and China, Brexit negotiations, the partial shutdown of the U.S. government,
and the pace of normalization of monetary policy in the advanced economies.
8. Among emerging markets and developing economies, growth is expected
to decline from an estimated 4.6 percent in 2018 and to 4.5 percent in 2019
reflecting contractions in Argentina and Turkey, as well as the impact of trade
actions on China and other Asian economies. However, India’s economy is poised
to pick up in 2019, benefiting from lower oil prices and a slower pace of monetary
tightening than previously expected, as inflation pressures ease.
9. Growth prospects for sub-Saharan Africa continue to strengthen. Growth is
expected to improve from 2.9 percent in 2018 to 3.5 percent in 2019, supported by
higher commodity prices, improved capital market access and contained fiscal
imbalances in many countries.
10. Growth in the East African Community (EAC) region is estimated to
improve from 5.9 percent in 2018 to 6.3 percent in 2019 supported by a stable
macroeconomic environment, rebound in agricultural activities on the backdrop of
favourable weather conditions, ongoing infrastructure investments, and strong
private consumption.

3 2019 Budget Policy Statement
Domestic Economic Developments
11. Kenya’s economic growth has remained strong and resilient even under
emerging global challenges, supported by strong public and private sector
investment and appropriate economic and financial policies. The broad-based
economic growth has averaged 5.6 percent for the last five years (2013 to 2017)
outperforming the average growth rate of 4.7 percent in the period 2008 to 2012
and 4.6 percent in the period 2002 to 2007. Growth is projected at 6.2 percent in
2019 from an estimated growth of 6.0 percent in 2018 (Chart 1.1 a).
Chart 1.1a: Trends in Kenya’s Economic Growth Rates, Percent
Source of Data: Kenya National Bureau of Statistics
12. The value of goods and services produced raised Per Capita Income from
Ksh 113,539 in 2013 to an estimated Ksh 190,521 in 2018, a 67.8 percent increase.
This enabled generation of around 840,000 new jobs per year in the period 2013-
2018 up from 656,500 new jobs per year in the period 2008-2012 (Chart 1.1b)
Chart 1.1b: Trends in Per Capita Income and Job Created (2002 - 2018)
Source of Data: Kenya National Bureau of Statistics
4 2019 Budget Policy Statement
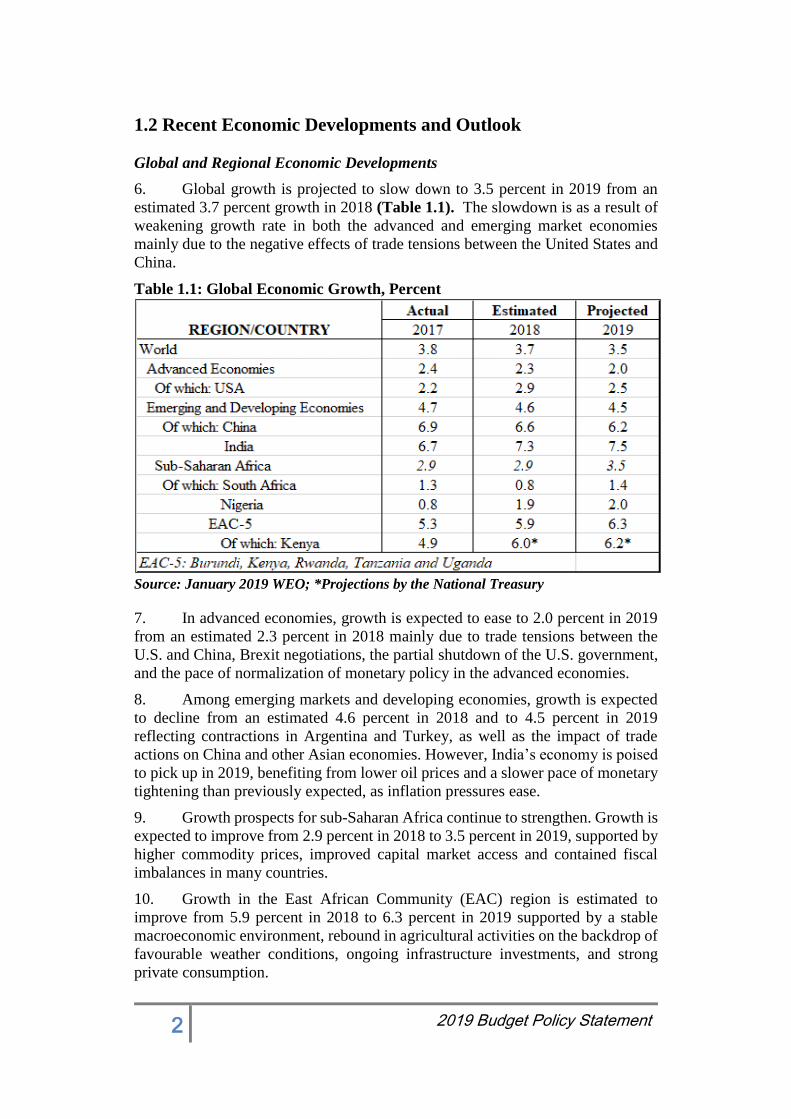
13. The rebound in economic activity in 2018 is a reflection of improved
weather conditions, resilient service sector, better business environment and easing
of political uncertainty. The economy grew by 6.0 percent in the third quarter of
2018 and 6.2 percent in the second quarter of 2018 up from 5.8 percent in the first
quarter of 2018, averaging 6.0 percent in the first three quarters of 2018. Growth
is projected at 6.0 percent in 2018 up from 4.9 percent in 2017, which is in line
with the 2018 Budget Review and Outlook Paper (BROP) projection (Table 1.2).
Table 1.2: Sectoral Real GDP Growth Rates, Percent
Source of Data: Kenya National Bureau of Statistics
14. In the third quarter of 2018, the economy grew by 6.0 percent compared to
a growth of 4.7 percent in a similar quarter in 2017, mainly supported by improved
weather conditions which led to increased agricultural production and agro
processing activity in the manufacturing sector. In addition, this growth was
supported by pickup in activities of accommodation and food services, electricity
and water supply and construction sectors.
15. Agriculture sector recovered and recorded growth of 5.2 percent in the third
quarter of 2018 compared to a growth of 3.7 percent in a similar quarter of 2017,
supported by improved weather conditions. This enabled the agriculture sector to
contribute 1.0 percentage points to GDP growth in the third quarter of 2018
compared to 0.7 percentage points in the same period in 2017. The current recovery
in the agriculture sector is broad-based and reflected in the expansion of output of
key food and cash crops such as tea, coffee and fruits (Chart 1.2).
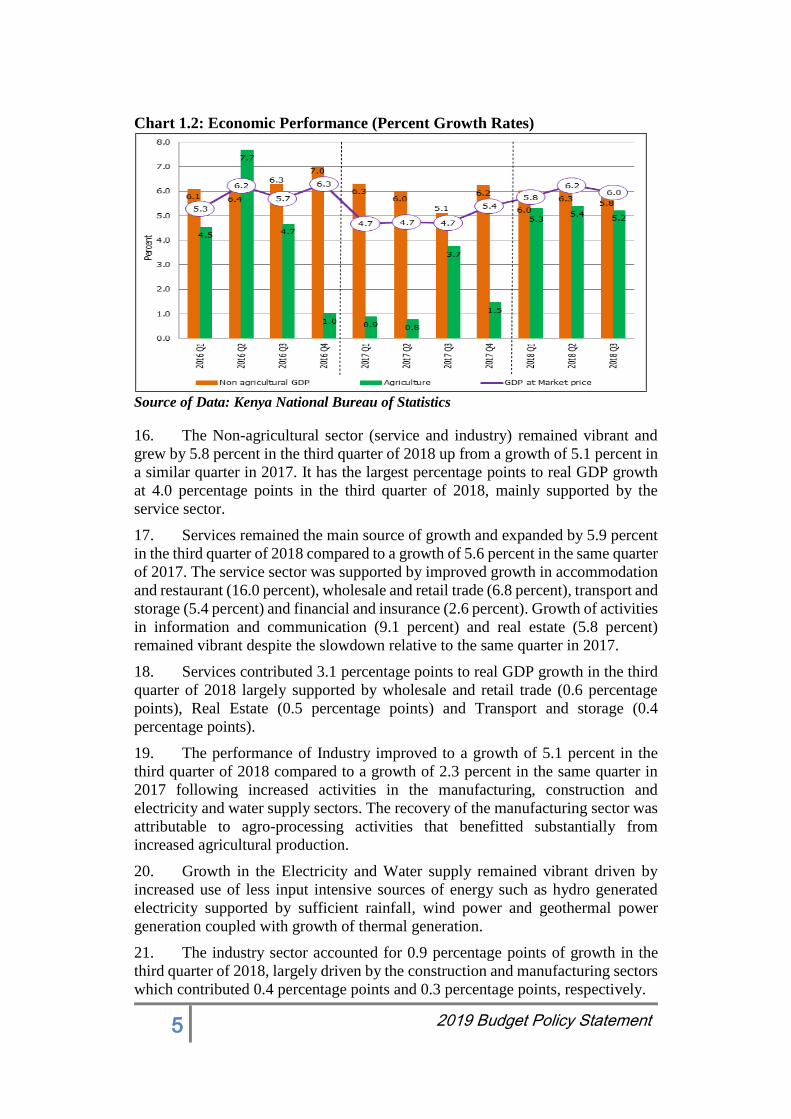
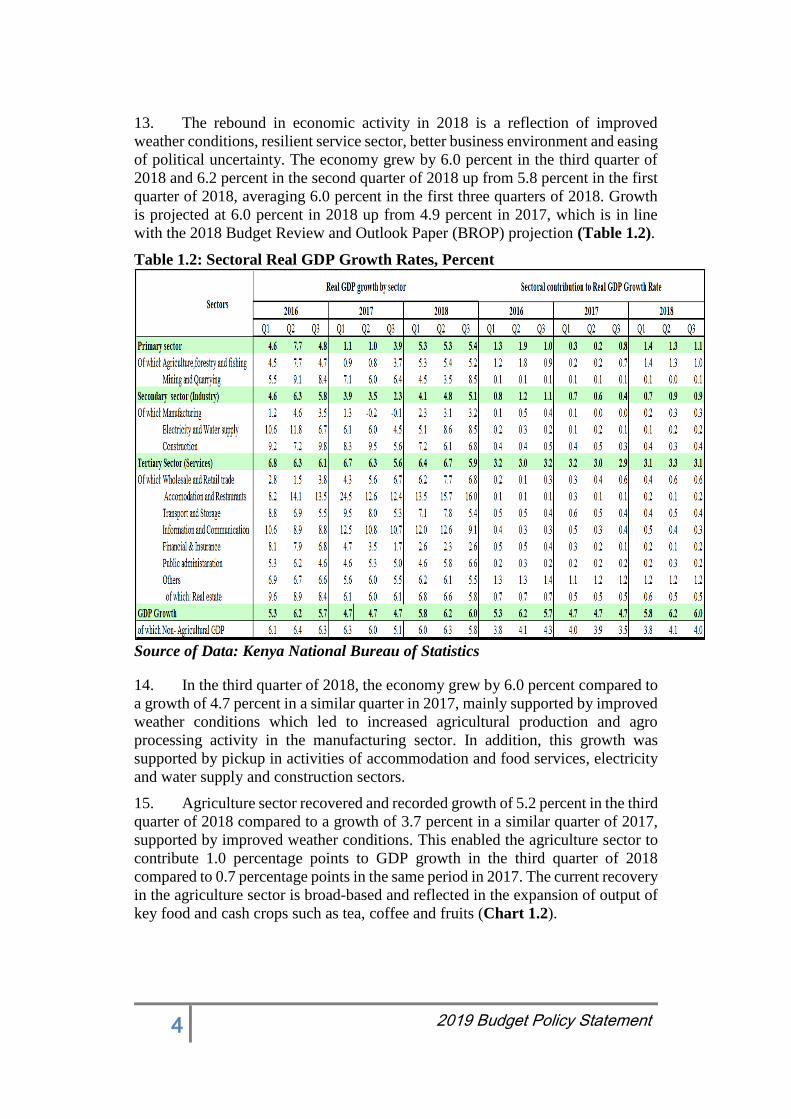
5 2019 Budget Policy Statement
Chart 1.2: Economic Performance (Percent Growth Rates)
Source of Data: Kenya National Bureau of Statistics
16. The Non-agricultural sector (service and industry) remained vibrant and
grew by 5.8 percent in the third quarter of 2018 up from a growth of 5.1 percent in
a similar quarter in 2017. It has the largest percentage points to real GDP growth
at 4.0 percentage points in the third quarter of 2018, mainly supported by the
service sector.
17. Services remained the main source of growth and expanded by 5.9 percent
in the third quarter of 2018 compared to a growth of 5.6 percent in the same quarter
of 2017. The service sector was supported by improved growth in accommodation
and restaurant (16.0 percent), wholesale and retail trade (6.8 percent), transport and
storage (5.4 percent) and financial and insurance (2.6 percent). Growth of activities
in information and communication (9.1 percent) and real estate (5.8 percent)
remained vibrant despite the slowdown relative to the same quarter in 2017.
18. Services contributed 3.1 percentage points to real GDP growth in the third
quarter of 2018 largely supported by wholesale and retail trade (0.6 percentage
points), Real Estate (0.5 percentage points) and Transport and storage (0.4
percentage points).
19. The performance of Industry improved to a growth of 5.1 percent in the
third quarter of 2018 compared to a growth of 2.3 percent in the same quarter in
2017 following increased activities in the manufacturing, construction and
electricity and water supply sectors. The recovery of the manufacturing sector was
attributable to agro-processing activities that benefitted substantially from
increased agricultural production.
20. Growth in the Electricity and Water supply remained vibrant driven by
increased use of less input intensive sources of energy such as hydro generated
electricity supported by sufficient rainfall, wind power and geothermal power
generation coupled with growth of thermal generation.
21. The industry sector accounted for 0.9 percentage points of growth in the
third quarter of 2018, largely driven by the construction and manufacturing sectors
which contributed 0.4 percentage points and 0.3 percentage points, respectively.
6 2019 Budget Policy Statement
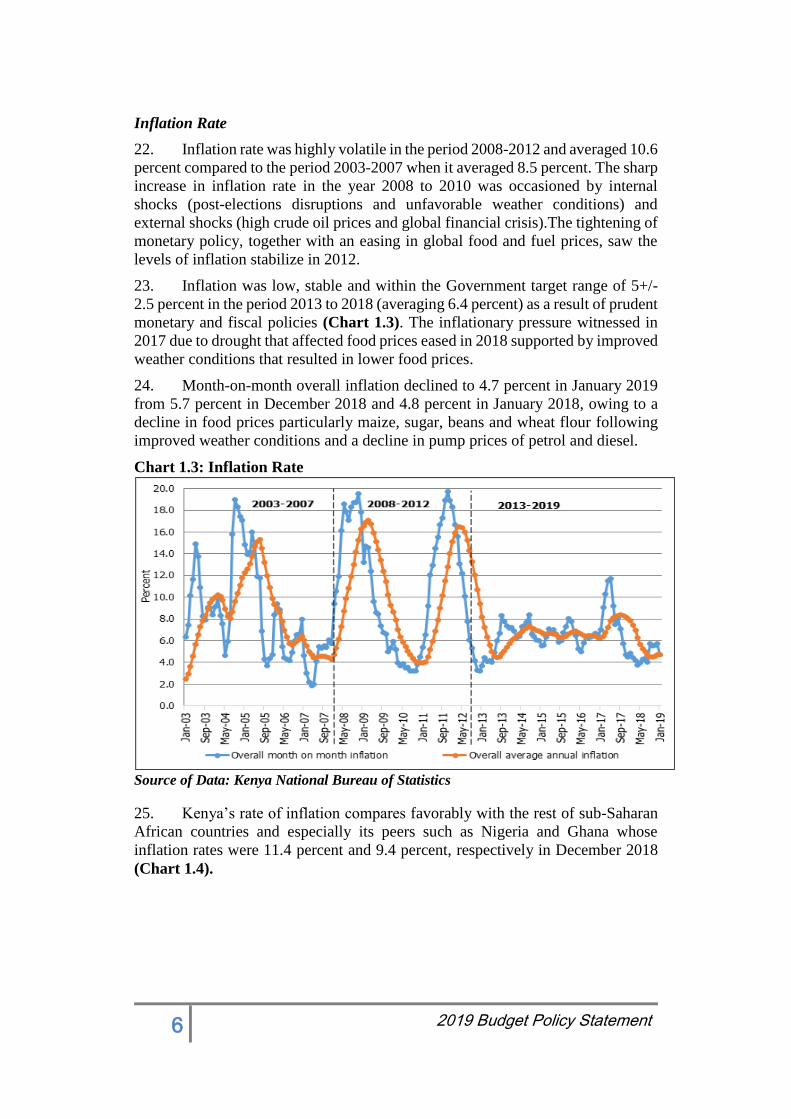
Inflation Rate
22. Inflation rate was highly volatile in the period 2008-2012 and averaged 10.6
percent compared to the period 2003-2007 when it averaged 8.5 percent. The sharp
increase in inflation rate in the year 2008 to 2010 was occasioned by internal
shocks (post-elections disruptions and unfavorable weather conditions) and
external shocks (high crude oil prices and global financial crisis).The tightening of
monetary policy, together with an easing in global food and fuel prices, saw the
levels of inflation stabilize in 2012.
23. Inflation was low, stable and within the Government target range of 5+/-
2.5 percent in the period 2013 to 2018 (averaging 6.4 percent) as a result of prudent
monetary and fiscal policies (Chart 1.3). The inflationary pressure witnessed in
2017 due to drought that affected food prices eased in 2018 supported by improved
weather conditions that resulted in lower food prices.
24. Month-on-month overall inflation declined to 4.7 percent in January 2019
from 5.7 percent in December 2018 and 4.8 percent in January 2018, owing to a
decline in food prices particularly maize, sugar, beans and wheat flour following
improved weather conditions and a decline in pump prices of petrol and diesel.
Chart 1.3: Inflation Rate
Source of Data: Kenya National Bureau of Statistics
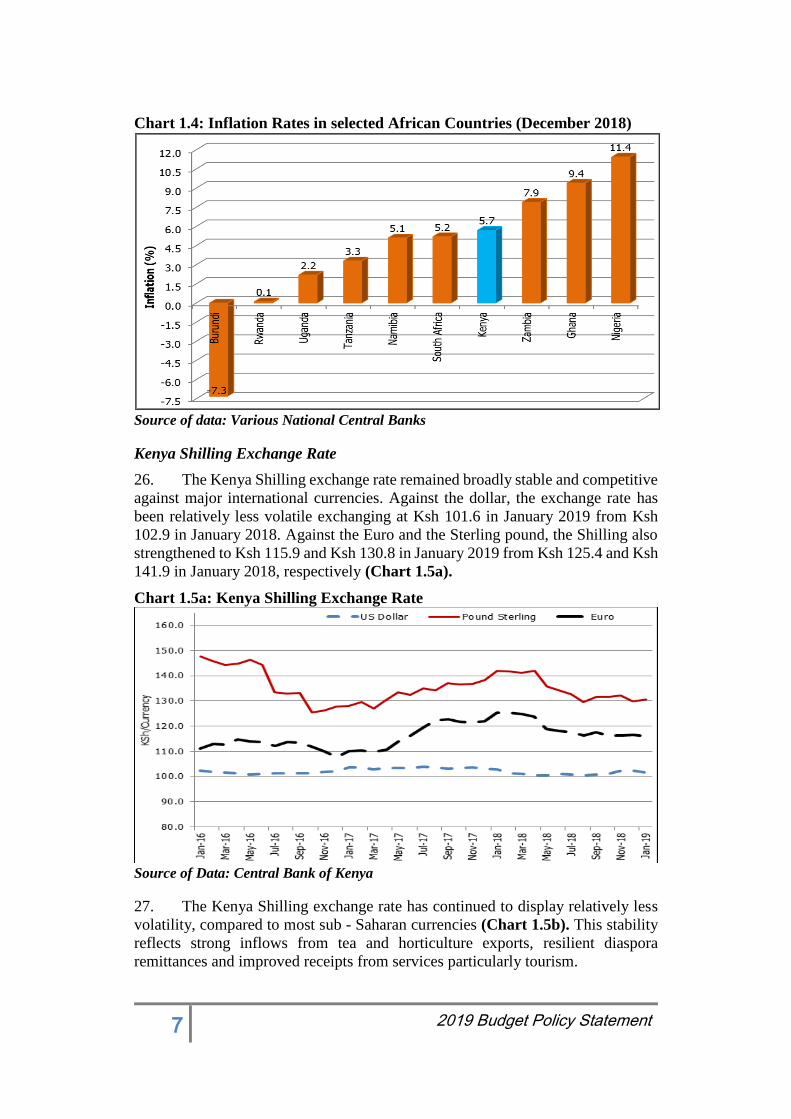
25. Kenya’s rate of inflation compares favorably with the rest of sub-Saharan
African countries and especially its peers such as Nigeria and Ghana whose
inflation rates were 11.4 percent and 9.4 percent, respectively in December 2018
(Chart 1.4).
7 2019 Budget Policy Statement
Chart 1.4: Inflation Rates in selected African Countries (December 2018)
Source of data: Various National Central Banks
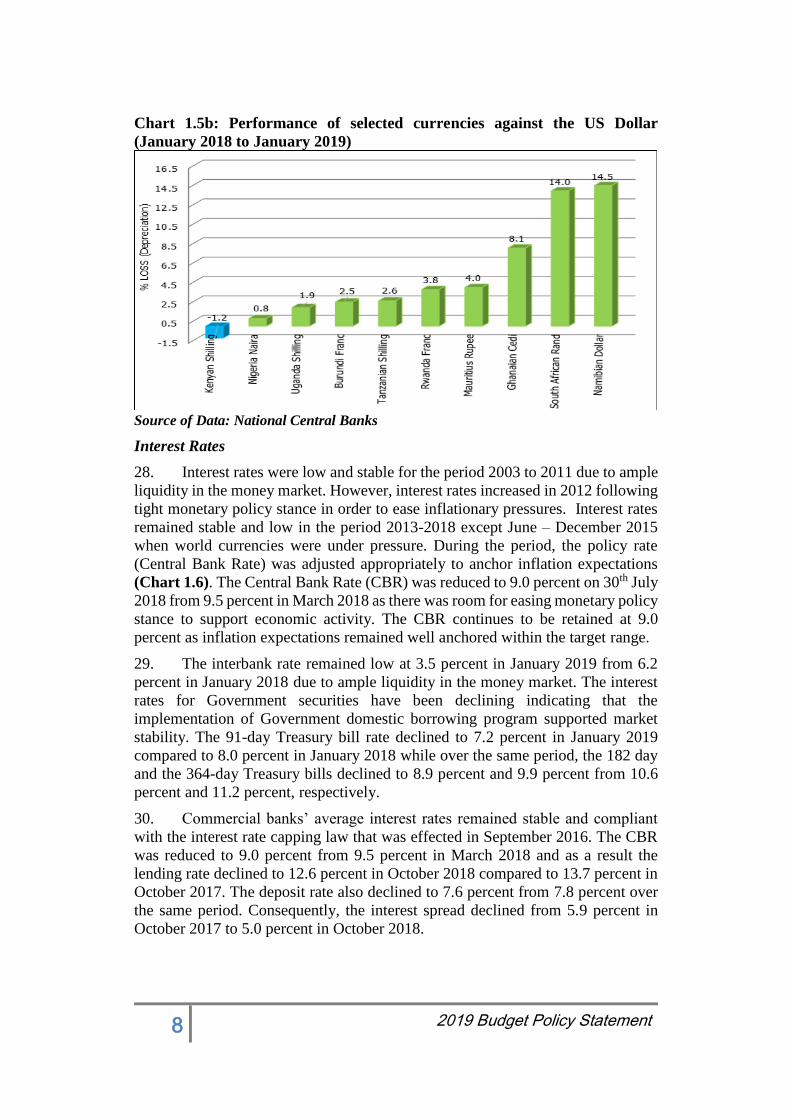
Kenya Shilling Exchange Rate
26. The Kenya Shilling exchange rate remained broadly stable and competitive
against major international currencies. Against the dollar, the exchange rate has
been relatively less volatile exchanging at Ksh 101.6 in January 2019 from Ksh
102.9 in January 2018. Against the Euro and the Sterling pound, the Shilling also
strengthened to Ksh 115.9 and Ksh 130.8 in January 2019 from Ksh 125.4 and Ksh
141.9 in January 2018, respectively (Chart 1.5a).
Chart 1.5a: Kenya Shilling Exchange Rate
Source of Data: Central Bank of Kenya
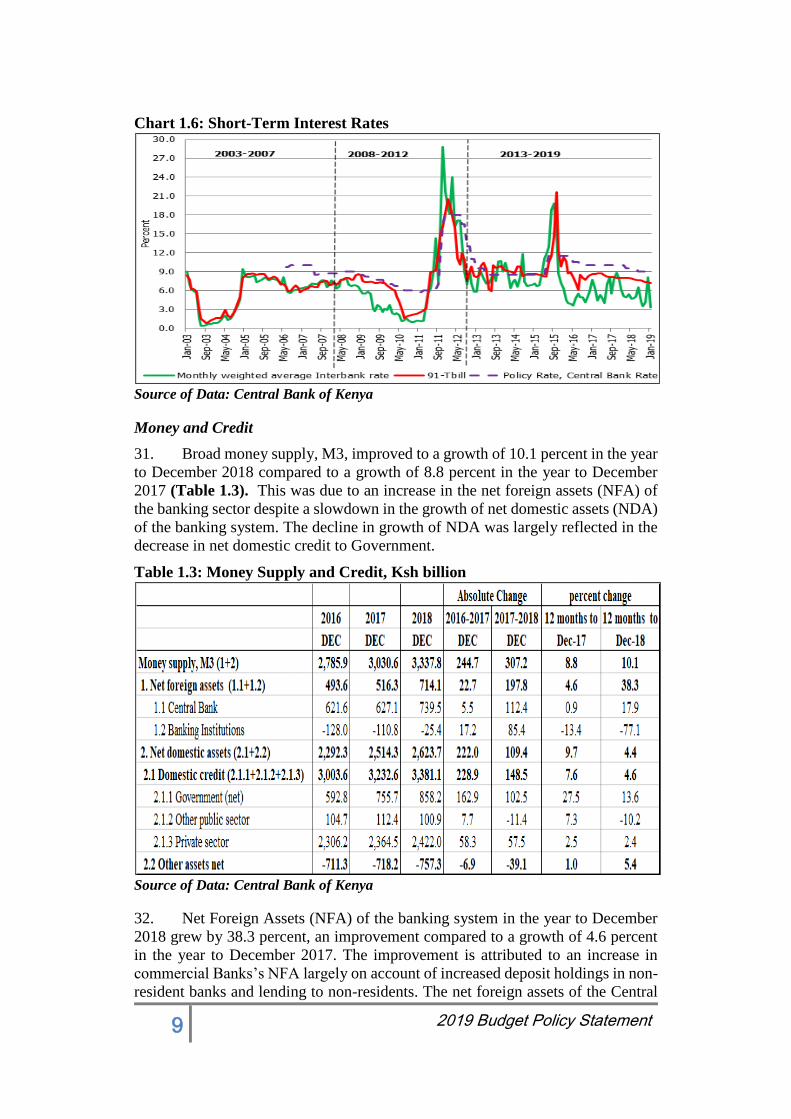
27. The Kenya Shilling exchange rate has continued to display relatively less
volatility, compared to most sub - Saharan currencies (Chart 1.5b). This stability
reflects strong inflows from tea and horticulture exports, resilient diaspora
remittances and improved receipts from services particularly tourism.
8 2019 Budget Policy Statement
Chart 1.5b: Performance of selected currencies against the US Dollar
(January 2018 to January 2019)
Source of Data: National Central Banks
Interest Rates
28. Interest rates were low and stable for the period 2003 to 2011 due to ample
liquidity in the money market. However, interest rates increased in 2012 following
tight monetary policy stance in order to ease inflationary pressures. Interest rates
remained stable and low in the period 2013-2018 except June – December 2015
when world currencies were under pressure. During the period, the policy rate
(Central Bank Rate) was adjusted appropriately to anchor inflation expectations
(Chart 1.6). The Central Bank Rate (CBR) was reduced to 9.0 percent on 30th July
2018 from 9.5 percent in March 2018 as there was room for easing monetary policy
stance to support economic activity. The CBR continues to be retained at 9.0
percent as inflation expectations remained well anchored within the target range.
29. The interbank rate remained low at 3.5 percent in January 2019 from 6.2
percent in January 2018 due to ample liquidity in the money market. The interest
rates for Government securities have been declining indicating that the
implementation of Government domestic borrowing program supported market
stability. The 91-day Treasury bill rate declined to 7.2 percent in January 2019
compared to 8.0 percent in January 2018 while over the same period, the 182 day
and the 364-day Treasury bills declined to 8.9 percent and 9.9 percent from 10.6
percent and 11.2 percent, respectively.
30. Commercial banks’ average interest rates remained stable and compliant
with the interest rate capping law that was effected in September 2016. The CBR
was reduced to 9.0 percent from 9.5 percent in March 2018 and as a result the
lending rate declined to 12.6 percent in October 2018 compared to 13.7 percent in
October 2017. The deposit rate also declined to 7.6 percent from 7.8 percent over
the same period. Consequently, the interest spread declined from 5.9 percent in
October 2017 to 5.0 percent in October 2018.
9 2019 Budget Policy Statement
Chart 1.6: Short-Term Interest Rates
Source of Data: Central Bank of Kenya
Money and Credit
31. Broad money supply, M3, improved to a growth of 10.1 percent in the year
to December 2018 compared to a growth of 8.8 percent in the year to December
2017 (Table 1.3). This was due to an increase in the net foreign assets (NFA) of
the banking sector despite a slowdown in the growth of net domestic assets (NDA)
of the banking system. The decline in growth of NDA was largely reflected in the
decrease in net domestic credit to Government.
Table 1.3: Money Supply and Credit, Ksh billion
Source of Data: Central Bank of Kenya
32. Net Foreign Assets (NFA) of the banking system in the year to December
2018 grew by 38.3 percent, an improvement compared to a growth of 4.6 percent
in the year to December 2017. The improvement is attributed to an increase in
commercial Banks’s NFA largely on account of increased deposit holdings in non-
resident banks and lending to non-residents. The net foreign assets of the Central
10 2019 Budget Policy Statement
Bank also increased during the period due to a pick-up in foreign exchange
reserves.
33. Meanwhile, the Net Domestic Assets (NDA) slowed down to a growth of
4.4 percent in the year to December 2018 from a growth of 9.7 percent over a
similar period in 2017. This largely reflects reduced net credit flows to government
on account of increased government deposits due to quarterly tax collections.
34. Annual growth of credit to the private sector grew by 2.4 percent in the year
to December 2018, compared to a growth of 2.5 percent in the year to December
2017. In particular, lending to finance and insurance, consumer durables, business
services, private households and manufacturing sectors grew by 17.5 percent, 11.0
percent, 8.3 percent, 6.8 percent and 6.0 percent, respectively. This offset the
substantial loan repayments recorded in the mining, transport and communication
and agriculture sectors in the year to December 2018. Private sector credit growth
is expected to strengthen in 2019 relative to 2018, with the anticipated higher
economic activity and easing credit risk.
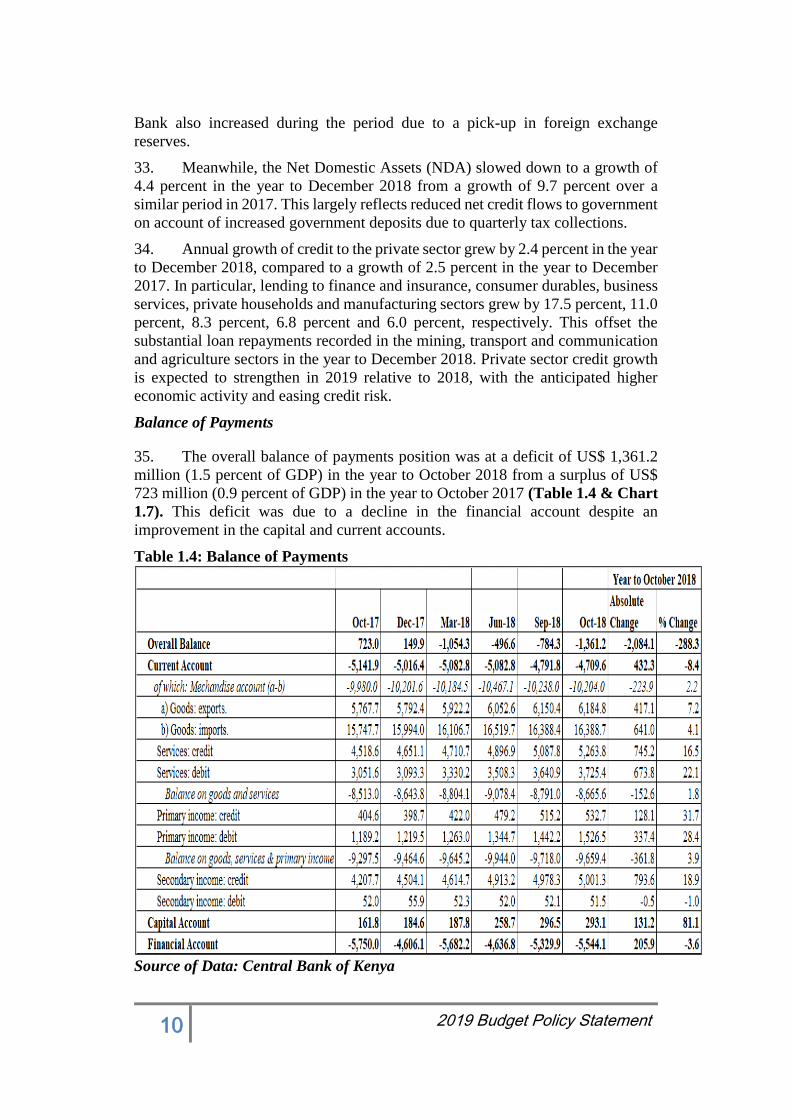
Balance of Payments
35. The overall balance of payments position was at a deficit of US$ 1,361.2
million (1.5 percent of GDP) in the year to October 2018 from a surplus of US$
723 million (0.9 percent of GDP) in the year to October 2017 (Table 1.4 & Chart
1.7). This deficit was due to a decline in the financial account despite an
improvement in the capital and current accounts.
Table 1.4: Balance of Payments
Source of Data: Central Bank of Kenya
11 2019 Budget Policy Statement
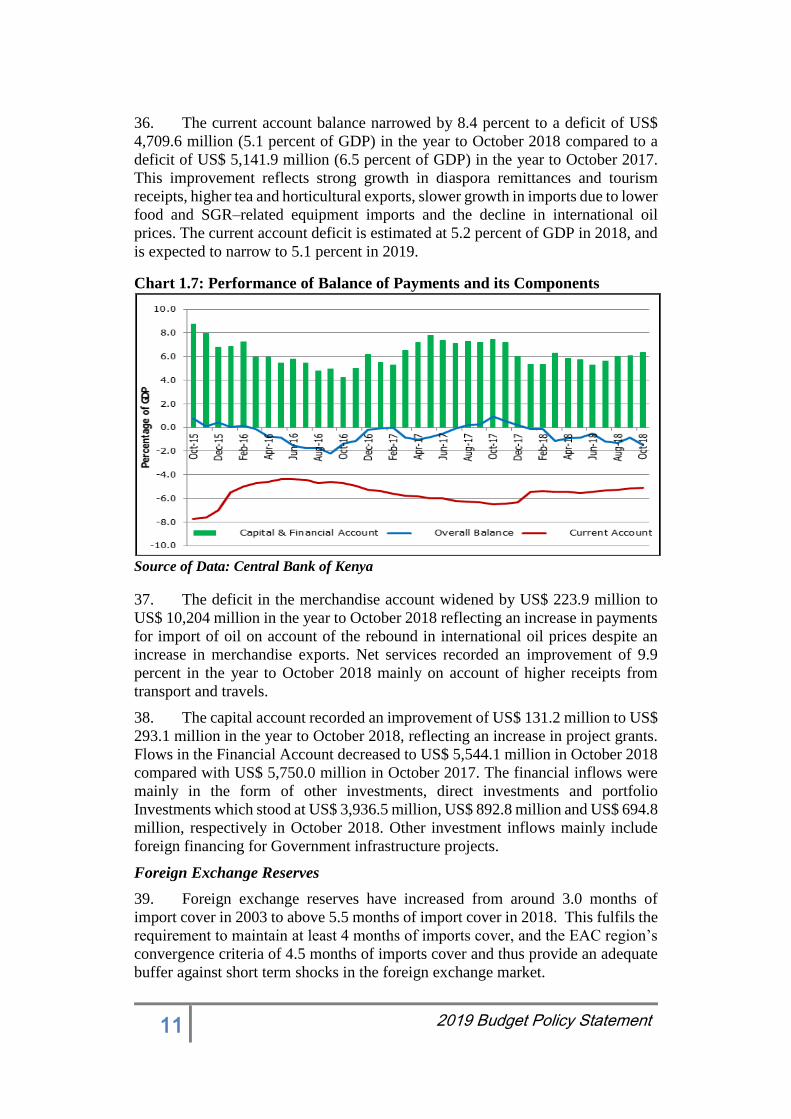
36. The current account balance narrowed by 8.4 percent to a deficit of US$
4,709.6 million (5.1 percent of GDP) in the year to October 2018 compared to a
deficit of US$ 5,141.9 million (6.5 percent of GDP) in the year to October 2017.
This improvement reflects strong growth in diaspora remittances and tourism
receipts, higher tea and horticultural exports, slower growth in imports due to lower
food and SGR–related equipment imports and the decline in international oil
prices. The current account deficit is estimated at 5.2 percent of GDP in 2018, and
is expected to narrow to 5.1 percent in 2019.
Chart 1.7: Performance of Balance of Payments and its Components
Source of Data: Central Bank of Kenya
37. The deficit in the merchandise account widened by US$ 223.9 million to
US$ 10,204 million in the year to October 2018 reflecting an increase in payments
for import of oil on account of the rebound in international oil prices despite an
increase in merchandise exports. Net services recorded an improvement of 9.9
percent in the year to October 2018 mainly on account of higher receipts from
transport and travels.
38. The capital account recorded an improvement of US$ 131.2 million to US$
293.1 million in the year to October 2018, reflecting an increase in project grants.
Flows in the Financial Account decreased to US$ 5,544.1 million in October 2018
compared with US$ 5,750.0 million in October 2017. The financial inflows were
mainly in the form of other investments, direct investments and portfolio
Investments which stood at US$ 3,936.5 million, US$ 892.8 million and US$ 694.8
million, respectively in October 2018. Other investment inflows mainly include
foreign financing for Government infrastructure projects.
Foreign Exchange Reserves
39. Foreign exchange reserves have increased from around 3.0 months of
import cover in 2003 to above 5.5 months of import cover in 2018. This fulfils the
requirement to maintain at least 4 months of imports cover, and the EAC region’s
convergence criteria of 4.5 months of imports cover and thus provide an adequate
buffer against short term shocks in the foreign exchange market.
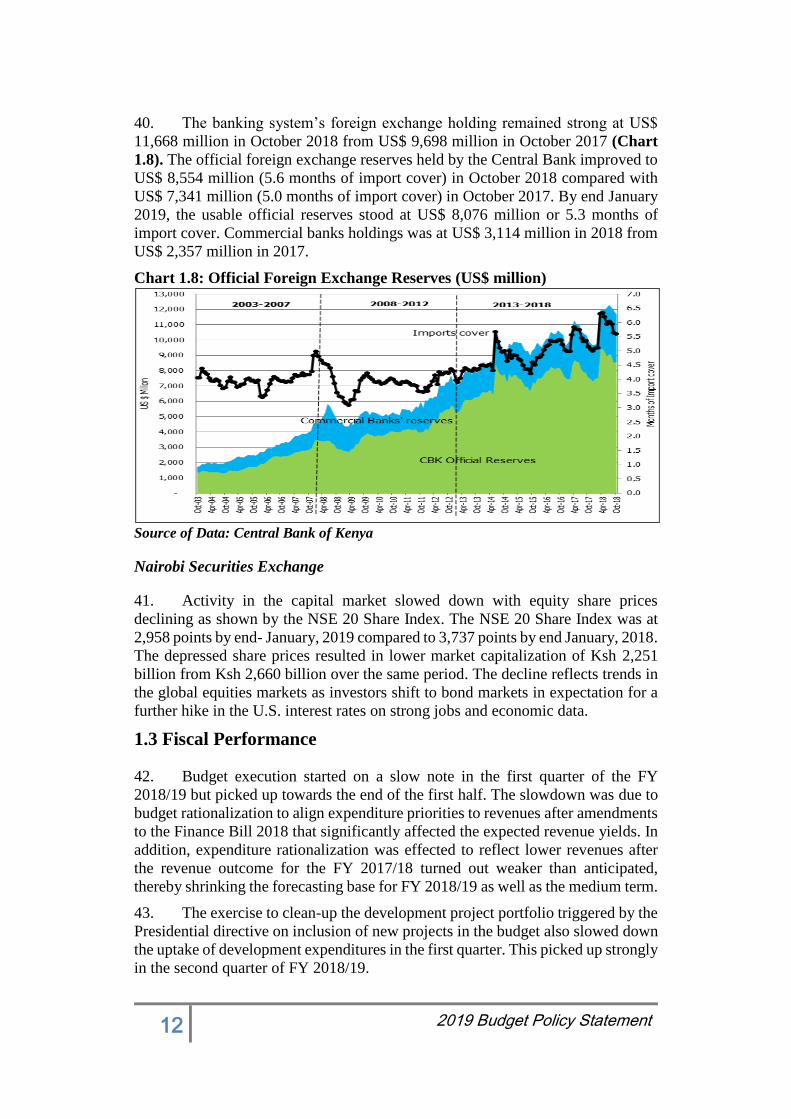
12 2019 Budget Policy Statement
40. The banking system’s foreign exchange holding remained strong at US$
11,668 million in October 2018 from US$ 9,698 million in October 2017 (Chart
1.8). The official foreign exchange reserves held by the Central Bank improved to
US$ 8,554 million (5.6 months of import cover) in October 2018 compared with
US$ 7,341 million (5.0 months of import cover) in October 2017. By end January
2019, the usable official reserves stood at US$ 8,076 million or 5.3 months of
import cover. Commercial banks holdings was at US$ 3,114 million in 2018 from
US$ 2,357 million in 2017.
Chart 1.8: Official Foreign Exchange Reserves (US$ million)
Source of Data: Central Bank of Kenya
Nairobi Securities Exchange
41. Activity in the capital market slowed down with equity share prices
declining as shown by the NSE 20 Share Index. The NSE 20 Share Index was at
2,958 points by end- January, 2019 compared to 3,737 points by end January, 2018.
The depressed share prices resulted in lower market capitalization of Ksh 2,251
billion from Ksh 2,660 billion over the same period. The decline reflects trends in
the global equities markets as investors shift to bond markets in expectation for a
further hike in the U.S. interest rates on strong jobs and economic data.
1.3 Fiscal Performance
42. Budget execution started on a slow note in the first quarter of the FY
2018/19 but picked up towards the end of the first half. The slowdown was due to
budget rationalization to align expenditure priorities to revenues after amendments
to the Finance Bill 2018 that significantly affected the expected revenue yields. In
addition, expenditure rationalization was effected to reflect lower revenues after
the revenue outcome for the FY 2017/18 turned out weaker than anticipated,
thereby shrinking the forecasting base for FY 2018/19 as well as the medium term.
43. The exercise to clean-up the development project portfolio triggered by the
Presidential directive on inclusion of new projects in the budget also slowed down
the uptake of development expenditures in the first quarter. This picked up strongly
in the second quarter of FY 2018/19.
13 2019 Budget Policy Statement
44. The expenditure rationalization was to ensure sustainable fiscal position in
the FY 2018/19 and the medium term, and reaffirm the Government’s commitment
to its fiscal consolidation plan and to prudent fiscal management in general.
Revenue Performance
45. Revenue collection to December 2018 grew by 9.3 percent compared to the
same period in the FY 2017/18. This growth is driven in part by a rebound effect,
after the poor performance in the previous financial year as well as the effect of the
tax policy measures introduced in the Finance Act 2018. Despite the growth,
cumulative ordinary revenue fell short of the December target by Ksh 52.7 billion.
The shortfall was in all broad categories of ordinary revenues with income tax
recording the highest shortfall on account of depressed performance in corporation
tax.
46. This shortfall is expected to close in the second half of the financial year as
the yields from the full impact of the revenue policy measures take effect and as
the roll out of the Revenue Enhancement Initiatives (REI) being put in place by the
Kenya Revenue Authority (KRA) is finalized.
47. As the financial year progresses, we will closely monitor the performance
of Income Tax from individuals, (P.A.Y.E), Excise taxes and taxes from
International Trade and Transactions (Import duty) which performed below the
cumulative December 2018 targets. Income tax from corporations is expected to
bounce back to target levels by the third quarter due to the strong performance
recorded in the economy in the first half of the financial year. Value Added Tax
(VAT) remained largely on target and is expected to remain on course into the
second half of the year.
48. In nominal terms, total revenue collection including Appropriation in Aid
(A.i.A) by December 2018 amounted to Ksh 794.7 billion (equivalent to 8.0
percent of GDP) against a target of Ksh 855.7 billion (equivalent to 8.5 percent of
GDP). The recorded shortfall of Ksh 61.0 billion was due to underperformance in
ordinary revenue by Ksh 52.7 billion and A.i.A amounting to Ksh 8.3 billion.
Expenditure Performance
49. Total expenditure and net lending for the period ending December 2018
amounted to Ksh 1,075.5 billion which was below the projected amount by Ksh
55.2 billion. Recurrent spending amounted to Ksh 643.9 billion while development
expenditures and transfer to County Governments (Equitable share only) were Ksh
311.9 billion and Ksh 101.3 billion, respectively.
50. Recurrent spending was below the projected target by Ksh 124.7 billion
mainly on account of lower than targeted interest payments (domestic and foreign)
and pension payments. The shortfall in pensions & other Consolidated Fund
Services was due to slower than targeted processing of pension payments in
recurrent category.
51. However, development expenditures were above target by Ksh 77.6 billion
on account of higher than targeted absorption for development partners’
(externally) funded programmes/projects and SGR phase I disbursement not being
factored in the target.
14 2019 Budget Policy Statement
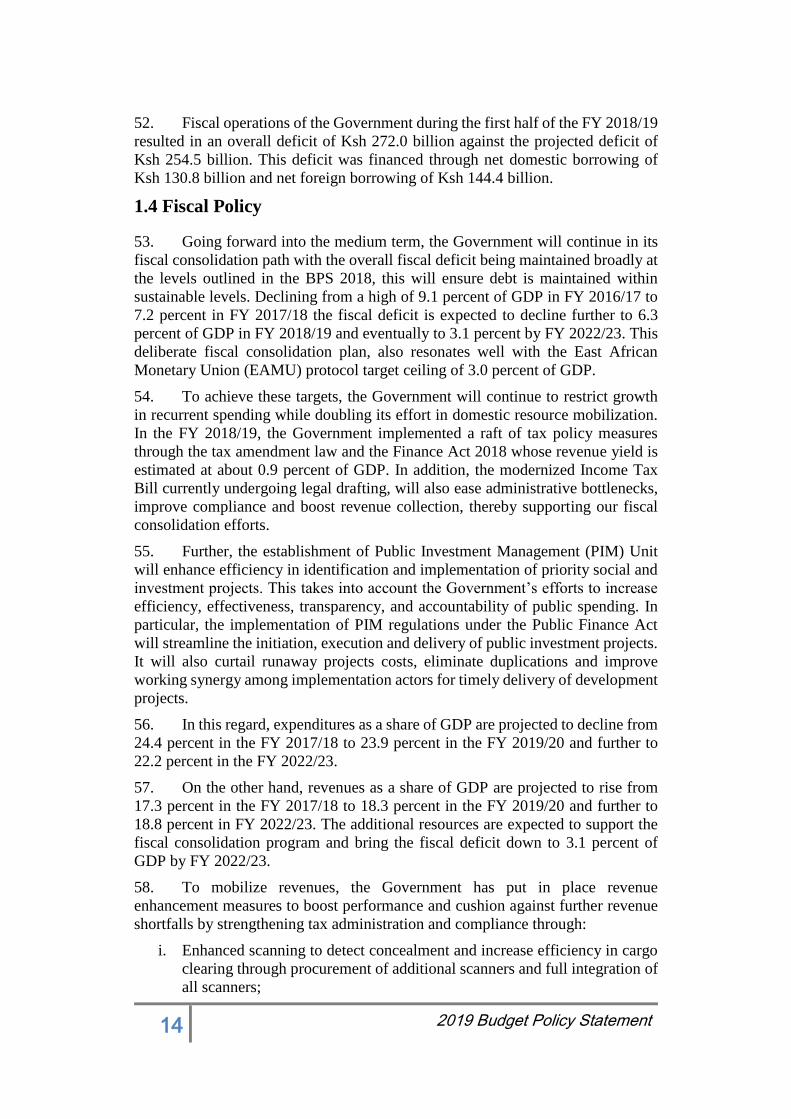
52. Fiscal operations of the Government during the first half of the FY 2018/19
resulted in an overall deficit of Ksh 272.0 billion against the projected deficit of
Ksh 254.5 billion. This deficit was financed through net domestic borrowing of
Ksh 130.8 billion and net foreign borrowing of Ksh 144.4 billion.
1.4 Fiscal Policy
53. Going forward into the medium term, the Government will continue in its
fiscal consolidation path with the overall fiscal deficit being maintained broadly at
the levels outlined in the BPS 2018, this will ensure debt is maintained within
sustainable levels. Declining from a high of 9.1 percent of GDP in FY 2016/17 to
7.2 percent in FY 2017/18 the fiscal deficit is expected to decline further to 6.3
percent of GDP in FY 2018/19 and eventually to 3.1 percent by FY 2022/23. This
deliberate fiscal consolidation plan, also resonates well with the East African
Monetary Union (EAMU) protocol target ceiling of 3.0 percent of GDP.
54. To achieve these targets, the Government will continue to restrict growth
in recurrent spending while doubling its effort in domestic resource mobilization.
In the FY 2018/19, the Government implemented a raft of tax policy measures
through the tax amendment law and the Finance Act 2018 whose revenue yield is
estimated at about 0.9 percent of GDP. In addition, the modernized Income Tax
Bill currently undergoing legal drafting, will also ease administrative bottlenecks,
improve compliance and boost revenue collection, thereby supporting our fiscal
consolidation efforts.
55. Further, the establishment of Public Investment Management (PIM) Unit
will enhance efficiency in identification and implementation of priority social and
investment projects. This takes into account the Government’s efforts to increase
efficiency, effectiveness, transparency, and accountability of public spending. In
particular, the implementation of PIM regulations under the Public Finance Act
will streamline the initiation, execution and delivery of public investment projects.
It will also curtail runaway projects costs, eliminate duplications and improve
working synergy among implementation actors for timely delivery of development
projects.
56. In this regard, expenditures as a share of GDP are projected to decline from
24.4 percent in the FY 2017/18 to 23.9 percent in the FY 2019/20 and further to
22.2 percent in the FY 2022/23.
57. On the other hand, revenues as a share of GDP are projected to rise from
17.3 percent in the FY 2017/18 to 18.3 percent in the FY 2019/20 and further to
18.8 percent in FY 2022/23. The additional resources are expected to support the
fiscal consolidation program and bring the fiscal deficit down to 3.1 percent of
GDP by FY 2022/23.
58. To mobilize revenues, the Government has put in place revenue
enhancement measures to boost performance and cushion against further revenue
shortfalls by strengthening tax administration and compliance through:
i. Enhanced scanning to detect concealment and increase efficiency in cargo
clearing through procurement of additional scanners and full integration of
all scanners;
15 2019 Budget Policy Statement
ii. Use of Regional Electronic Cargo Tracking System (RECTS) to ensure all
goods reach the desired destinations and avoid dumping;
iii. Use of third-party information to identify non-compliant property
developers and ensure they are included in the tax base; and
iv. Detection of non-compliance through i-Tax data matching.
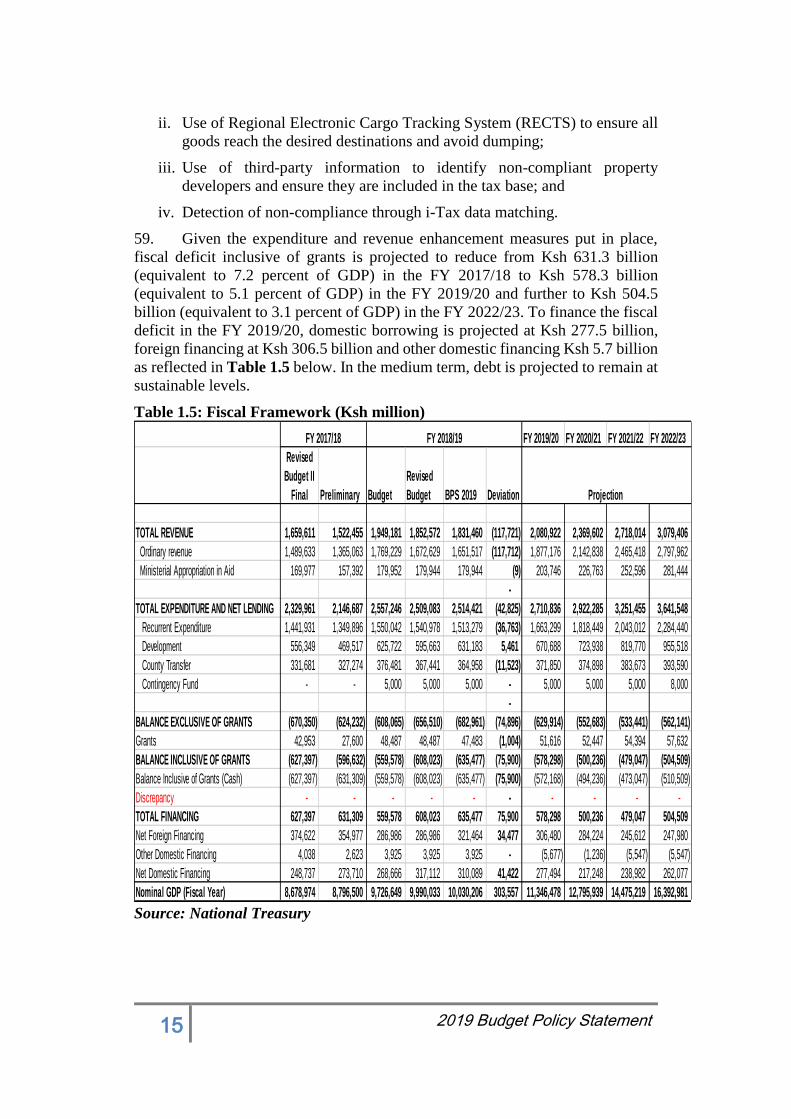
59. Given the expenditure and revenue enhancement measures put in place,
fiscal deficit inclusive of grants is projected to reduce from Ksh 631.3 billion
(equivalent to 7.2 percent of GDP) in the FY 2017/18 to Ksh 578.3 billion
(equivalent to 5.1 percent of GDP) in the FY 2019/20 and further to Ksh 504.5
billion (equivalent to 3.1 percent of GDP) in the FY 2022/23. To finance the fiscal
deficit in the FY 2019/20, domestic borrowing is projected at Ksh 277.5 billion,
foreign financing at Ksh 306.5 billion and other domestic financing Ksh 5.7 billion
as reflected in Table 1.5 below. In the medium term, debt is projected to remain at
sustainable levels.
Table 1.5: Fiscal Framework (Ksh million)
Source: National Treasury
FY 2019/20 FY 2020/21 FY 2021/22 FY 2022/23
Revised
Budget II
Final Preliminary Budget
Revised
Budget BPS 2019 Deviation
TOTAL REVENUE 1,659,611 1,522,455 1,949,181 1,852,572 1,831,460 (117,721) 2,080,922 2,369,602 2,718,014 3,079,406
Ordinary revenue 1,489,633 1,365,063 1,769,229 1,672,629 1,651,517 (117,712) 1,877,176 2,142,838 2,465,418 2,797,962
Ministerial Appropriation in Aid 169,977 157,392 179,952 179,944 179,944 (9) 203,746 226,763 252,596 281,444
-
TOTAL EXPENDITURE AND NET LENDING 2,329,961 2,146,687 2,557,246 2,509,083 2,514,421 (42,825) 2,710,836 2,922,285 3,251,455 3,641,548
Recurrent Expenditure 1,441,931 1,349,896 1,550,042 1,540,978 1,513,279 (36,763) 1,663,299 1,818,449 2,043,012 2,284,440
Development 556,349 469,517 625,722 595,663 631,183 5,461 670,688 723,938 819,770 955,518
County Transfer 331,681 327,274 376,481 367,441 364,958 (11,523) 371,850 374,898 383,673 393,590
Contingency Fund - - 5,000 5,000 5,000 - 5,000 5,000 5,000 8,000
-
BALANCE EXCLUSIVE OF GRANTS (670,350) (624,232) (608,065) (656,510) (682,961) (74,896) (629,914) (552,683) (533,441) (562,141)
Grants 42,953 27,600 48,487 48,487 47,483 (1,004) 51,616 52,447 54,394 57,632
BALANCE INCLUSIVE OF GRANTS (627,397) (596,632) (559,578) (608,023) (635,477) (75,900) (578,298) (500,236) (479,047) (504,509)
Balance Inclusive of Grants (Cash) (627,397) (631,309) (559,578) (608,023) (635,477) (75,900) (572,168) (494,236) (473,047) (510,509)
Discrepancy - - - - - - - - - -
TOTAL FINANCING 627,397 631,309 559,578 608,023 635,477 75,900 578,298 500,236 479,047 504,509
Net Foreign Financing 374,622 354,977 286,986 286,986 321,464 34,477 306,480 284,224 245,612 247,980
Other Domestic Financing 4,038 2,623 3,925 3,925 3,925 - (5,677) (1,236) (5,547) (5,547)
Net Domestic Financing 248,737 273,710 268,666 317,112 310,089 41,422 277,494 217,248 238,982 262,077
Nominal GDP (Fiscal Year) 8,678,974 8,796,500 9,726,649 9,990,033 10,030,206 303,557 11,346,478 12,795,939 14,475,219 16,392,981
FY 2017/18
Projection
FY 2018/19
16 2019 Budget Policy Statement
1.5 Economic Outlook
60. Kenya’s economic growth projections take into account global growth
outlook and the emerging challenges. The projections also takes into account the
policies and strategies outlined in “The Big Four” plan as prioritized in the Third
Medium Term Plan (2018-2022) of Vision 2030.
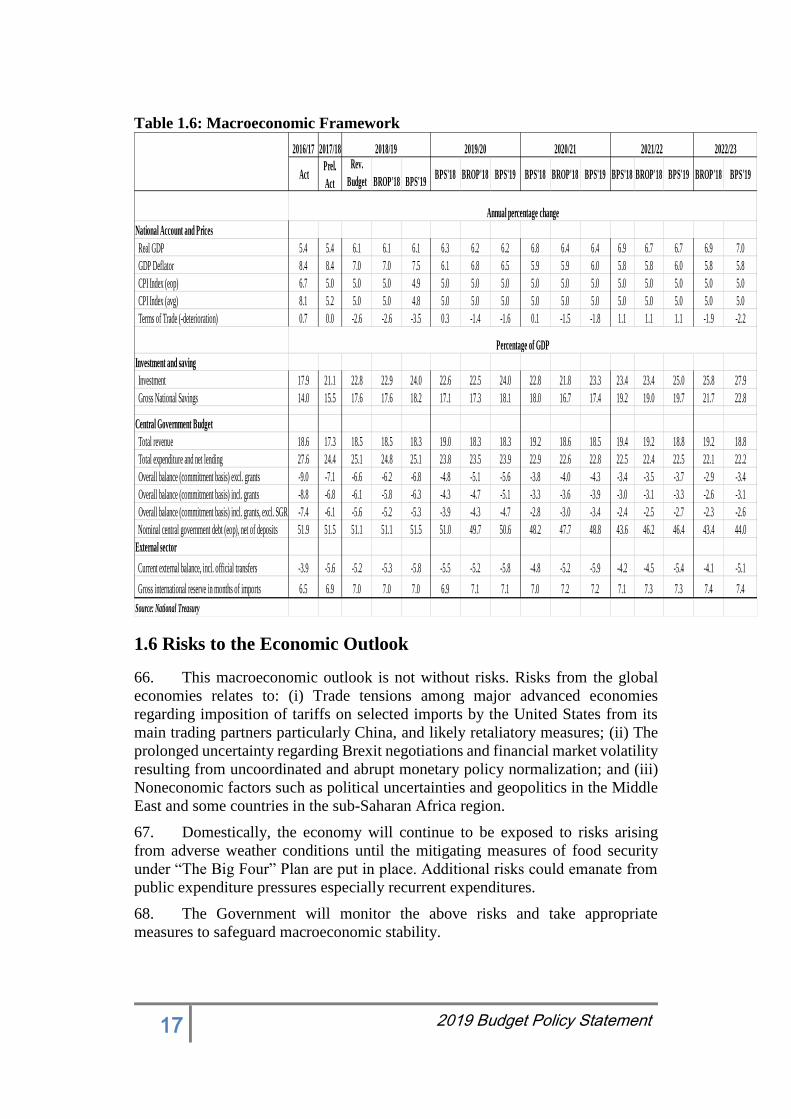
61. Economic growth is projected to expand by 6.1 percent in FY 2018/2019,
6.2 percent in FY 2019/2020, 6.4 percent in FY 2020/21 and 7.0 percent by FY
2022/23 (Table 1.6 and Annex Table 1). This growth will be supported by a
pickup in agricultural and manufacturing activities underpinned by improved
weather conditions, strong service sector, stable macroeconomic environment,
ongoing public infrastructural investments and sustained business and consumer
confidence.
62. In addition, measures being undertaken by the Government under “The Big
Four” Plan to boost the manufacturing sector; enhance food security and nutrition;
build affordable housing; and achieve Universal Health Coverage are expected to
enhance growth, create jobs and promote inclusive growth.
63. Inflation is currently within the Government’s target range largely due to
lower food prices and muted demand-driven inflationary pressures. It is expected
to remain within target in the medium term mainly due to expected lower food
prices reflecting favorable weather conditions, the decline in international oil
prices, and the recent downward revision in electricity tariffs. The recent excise tax
adjustment on voice calls and internet services is expected to have a marginal
impact on inflation. Interest rates are expected to remain low and stable over the
medium term supported by improved liquidity conditions, and the ongoing fiscal
consolidation.
64. Kenya’s external position is projected to strengthen over the medium term
supported by a narrower current account deficit. The narrowing of the current
account deficit is largely due to increased exports of tea and horticulture, increased
diaspora remittances, strong receipts from tourism, increased foreign direct
investment in infrastructure and lower imports of food and SGR-related equipment.
The current account deficit is estimated at 5.2 percent of GDP in 2018 from 6.3
percent of GDP in 2017, and is expected to narrow further to 5.1 percent in 2019.
65. The Government policies aims at supporting the fiscal consolidation
agenda which will bolster debt sustainability position and give flexibility for
counter cyclical fiscal policy interventions whenever appropriate. The programme
targets to achieve a fiscal deficit including grants of 3.1 percent of GDP by FY
2022/23 down from the projected 6.3 percent of GDP in FY 2018/19. This is in
line with the EAC convergence ceiling of 3.0 percent of GDP.
17 2019 Budget Policy Statement
Table 1.6: Macroeconomic Framework
1.6 Risks to the Economic Outlook 66. This macroeconomic outlook is not without risks. Risks from the global
economies relates to: (i) Trade tensions among major advanced economies
regarding imposition of tariffs on selected imports by the United States from its
main trading partners particularly China, and likely retaliatory measures; (ii) The
prolonged uncertainty regarding Brexit negotiations and financial market volatility
resulting from uncoordinated and abrupt monetary policy normalization; and (iii)
Noneconomic factors such as political uncertainties and geopolitics in the Middle
East and some countries in the sub-Saharan Africa region.
67. Domestically, the economy will continue to be exposed to risks arising
from adverse weather conditions until the mitigating measures of food security
under “The Big Four” Plan are put in place. Additional risks could emanate from
public expenditure pressures especially recurrent expenditures.
68. The Government will monitor the above risks and take appropriate
measures to safeguard macroeconomic stability.
ActPrel.
Act
Rev.
Budget BROP'18 BPS'19BPS'18 BROP'18 BPS'19 BPS'18 BROP'18 BPS'19 BPS'18 BROP'18 BPS'19 BROP'18 BPS'19
National Account and Prices
Real GDP 5.4 5.4 6.1 6.1 6.1 6.3 6.2 6.2 6.8 6.4 6.4 6.9 6.7 6.7 6.9 7.0
GDP Deflator 8.4 8.4 7.0 7.0 7.5 6.1 6.8 6.5 5.9 5.9 6.0 5.8 5.8 6.0 5.8 5.8
CPI Index (eop) 6.7 5.0 5.0 5.0 4.9 5.0 5.0 5.0 5.0 5.0 5.0 5.0 5.0 5.0 5.0 5.0
CPI Index (avg) 8.1 5.2 5.0 5.0 4.8 5.0 5.0 5.0 5.0 5.0 5.0 5.0 5.0 5.0 5.0 5.0
Terms of Trade (-deterioration) 0.7 0.0 -2.6 -2.6 -3.5 0.3 -1.4 -1.6 0.1 -1.5 -1.8 1.1 1.1 1.1 -1.9 -2.2
Investment and saving
Investment 17.9 21.1 22.8 22.9 24.0 22.6 22.5 24.0 22.8 21.8 23.3 23.4 23.4 25.0 25.8 27.9
Gross National Savings 14.0 15.5 17.6 17.6 18.2 17.1 17.3 18.1 18.0 16.7 17.4 19.2 19.0 19.7 21.7 22.8
Central Government Budget
Total revenue 18.6 17.3 18.5 18.5 18.3 19.0 18.3 18.3 19.2 18.6 18.5 19.4 19.2 18.8 19.2 18.8
Total expenditure and net lending 27.6 24.4 25.1 24.8 25.1 23.8 23.5 23.9 22.9 22.6 22.8 22.5 22.4 22.5 22.1 22.2
Overall balance (commitment basis) excl. grants -9.0 -7.1 -6.6 -6.2 -6.8 -4.8 -5.1 -5.6 -3.8 -4.0 -4.3 -3.4 -3.5 -3.7 -2.9 -3.4
Overall balance (commitment basis) incl. grants -8.8 -6.8 -6.1 -5.8 -6.3 -4.3 -4.7 -5.1 -3.3 -3.6 -3.9 -3.0 -3.1 -3.3 -2.6 -3.1
Overall balance (commitment basis) incl. grants, excl. SGR -7.4 -6.1 -5.6 -5.2 -5.3 -3.9 -4.3 -4.7 -2.8 -3.0 -3.4 -2.4 -2.5 -2.7 -2.3 -2.6
Nominal central government debt (eop), net of deposits 51.9 51.5 51.1 51.1 51.5 51.0 49.7 50.6 48.2 47.7 48.8 43.6 46.2 46.4 43.4 44.0
External sector
Current external balance, incl. official transfers -3.9 -5.6 -5.2 -5.3 -5.8 -5.5 -5.2 -5.8 -4.8 -5.2 -5.9 -4.2 -4.5 -5.4 -4.1 -5.1
Gross international reserve in months of imports 6.5 6.9 7.0 7.0 7.0 6.9 7.1 7.1 7.0 7.2 7.2 7.1 7.3 7.3 7.4 7.4
Source: National Treasury
2016/17 2017/18 2018/19 2020/21
Percentage of GDP
Annual percentage change
2021/22 2022/232019/20
18 2019 Budget Policy Statement
II. CREATING JOBS, TRANSFORMING LIVES –
HARNESSING “THE BIG FOUR”
2.1 Preamble
69. The 2019 BPS, the second to be prepared under the Jubilee Government’s
second term, reaffirms the priority policies and strategies outlined in “The Big
Four” Plan and as prioritized in the Third Medium Term Plan of the Vision 2030.
In this regard, the Government has taken decisive steps to harness the
implementation of various policies and programmes under each of the four pillars
namely: (i) supporting job creation by increasing value addition and raising the
manufacturing sector’s share to GDP; (ii) focusing on initiatives that guarantee
food security and nutrition to all Kenyans; (iii) providing universal health coverage
thereby guaranteeing quality and affordable healthcare to all Kenyans; and (iv)
supporting construction of at least five hundred thousand (500,000) affordable new
houses to Kenyans (Chart 2.1).
70. Implementation of the policies and programmes under these four pillars is
expected to accelerate and sustain inclusive growth, create opportunities for
productive jobs, reduce poverty and income inequality and provide a better future
for all Kenyans.
Chart 2.1: The “Big Four” Plan
71. To enable achievement of “The Big Four” Plan, the Government has
initiated key policies, legal and institutional reforms across all the Big Four sectors.
In addition, the National Government is collaborating with County Governments
to create an enabling environment that attracts investments in “The Big Four”
programmes.
72. To enhance the manufacturing sector, the Government has scaled up the
reforms to encourage investment in the sector. Towards this end, the Government
will continue to support the development of industrial infrastructures such as
Export Processing Zones, Special Economic Zones and Industrial Parks across the
country including establishment of modern industrial parks in Naivasha, Dongo
Kundu in Mombasa, and Lamu, among others.
19 2019 Budget Policy Statement
73. To enhance food and nutrition security, the Government has aligned its
policies, programmes and projects under the agriculture sector towards increasing
food production, boosting smallholder productivity, and reducing post-harvest
losses and the cost of food.
74. To make universal health coverage a reality, the Government launched the
pilot phase of the universal health programme in four Counties namely, Kisumu,
Machakos, Nyeri and Isiolo. The representative sample of four Counties will
generate the required feedback to guide the countrywide rollout of the universal
health programme.
75. On housing, the Government has established the Kenya Mortgage
Refinance Company (KMRC), whose purpose is to address funding constraints
hindering the growth of the primary mortgage market and reducing the funding
cost of residential mortgages and availability of housing finance to Kenyans.
KMRC will therefore provide secure long-term funding to financial institutions
thereby increasing the availability and affordability of mortgage loans to Kenyans.
The Government has also set up the National Housing Development Fund which
will be responsible for mobilizing capital to finance the affordable housing project.
76. To finance “The Big Four” Plan programmes, the Government has engaged
both the private sector players and development partners. Significant progress has
been made in this respect, with private sector and development partners coming on
board to fund Big Four projects and programmes. Already, the Government has
registered 150 new investment proposals thanks to improved ease of doing
business. To further lock in private sector investment, the Government has
provided a number of incentives which include investing heavily in power
generation, modern roads and railway, education and health. This will make it
easier for business to be conducted in Kenya. The Government is also in the process
of setting up a one-stop Centre for Investment Information at Ken Invest. This
Centre is 70 percent complete and already operational.
77. Finally, to further enable achievement of the outlined programmes under
“The Big Four” Plan, the Government will continue to implement various policies
under the Economic Transformation Agenda. These will be centered on five key
pillars namely: (i) creating a conducive business environment; (ii) investing in
sectoral transformation; (iii) infrastructure expansion; (iv) investing in quality and
accessible social services; and (v) consolidating gains made in devolution.
Significant achievements have been realized on all the five pillars.
2.2 “The Big Four” Plan
2.2.1 Supporting Value Addition and Raising the Share of
Manufacturing Sector to GDP
78. The Government will continue to support job creation by increasing the
manufacturing base and supporting innovation across the entire value chain –
whether in buying new solutions, building their own, or partnering with others to
innovate. Towards this end, over the next four years, a number of initiatives will
be implemented under the various sub-sectors. Principally, the Government will
continue to support the development of industrial infrastructure such as Export
20 2019 Budget Policy Statement
Processing Zones, Special Economic Zones and Industrial Parks across the country
including establishment of modern industrial parks in Naivasha, Dongo Kundu in
Mombasa, and Lamu among others. Further, to enhance the export of our
manufactured products, the Government will implement the National Exports
Strategy to broaden our products range and diversify our export markets including
penetrating new markets alongside exploiting traditional markets.
79. To expand the manufacturing base, the Government will scale up reforms
in the following areas: textile industries and leather parks; agro-processing; the
blue economy; the automotive sector and manufacture of pharmaceutical products.
Other important sub-sectors will include production of construction materials; oil,
gas, and mining; iron and steel; and ICT.
80. To support the textile industries, the Government has approved
commercialization of genetically modified cotton such as Bacillus Thuringiensis
(BT) cotton seeds to be availed to farmers. The hybrid BT cotton will boost
production due to its resistance to bollworm which has adversely affected yields
from the traditional breeds in the past. In addition, revival of conventional cotton
will be supported in 21 cotton growing counties targeting 549,000 acres to ensure
self-sufficiency in cotton for our textile industries. The Government has also
allocated 100,000 acres at the Galana Kulalu Complex and the National Irrigation
farm to National Youth Service to revive the cotton sector. Further, the
Government is in the process of improving infrastructure at the Athi River textile
hub, KIRDI Kisumu, South B Branches, and Rivatex East Africa Limited. Rivatex
East African Limited is being modernized to enhance its competitiveness to absorb
local cotton and produce high quality textiles.
81. To support the leather industry, the Government will put in place a legal
and policy framework to the leather value chain to increase the sector’s
contribution to GDP through development of leather industrial parks,
establishment of Leather Products Production Centres and Centres of Excellence,
improve hides and skins quality and training and capacity building of
manufacturing MSMEs. The Government will also improve the infrastructure at
Kinanie Leather Park, Kariokor Common Manufacturing Facility for leather, and
the Training and Production Centre for Shoe Industry (TPSCI) in Thika.
82. On agro-processing, the Government will continue to invest in value
addition for tea; coffee; cotton; meat; milk; hides, skins and leather; fruits; nuts and
oils. Other areas will include investments in warehousing and cold chains,
aquaculture, fish feed mills and fish processing industries. Towards this end, the
Government will work with TradeMark East Africa (TMEA) to develop Trade and
Logistics Clusters (TLCs) for the Coastal Region to facilitate industrial
investments targeting high value sectors for local and export market. Further, the
Government has advanced Ksh 514 million to 15 agro-processing projects.
83. On the blue economy, the successful hosting of the Sustainable Blue
Economy Conference in November 2018 paved way for investment in the blue
economy which is expected to create thousands of marine related jobs and support
efforts to realize food and nutrition security as well as enhance environmental
sustainability. To further support the blue economy, the Government
operationalized the Liwatoni Fishing Complex and created the Kenya Coast Guard
21 2019 Budget Policy Statement
Service which will guard Kenya’s territorial waters against illegal fishing at the
exclusive economic zone and from criminals. In addition, the Government
submitted a fishing fleet development plan to the Ocean Tuna Commission which
will see Kenya flag off vessels that will enable Kenyans to harvest fish from its
Exclusive Economic Zone (EEZ). Through a Public Private Partnership (PPP)
arrangement, the Government will develop a domestic fishing fleet by allocating
fishing access rights and supporting joint venture and licensing. All these
Government efforts are geared towards expanding fishing to 231,359 metric tonnes
from the current average of 135,100 metric tonnes.
84. To revitalize the local automotive sector, the Government will finalize and
implement the National Automotive Policy to address challenges in the sector
which include age limits for used imported vehicles and regulatory framework for
the motorcycle subsector. The Numerical Machining Complex (NMC) will also be
restructured to efficiently and effectively serve as a premier national and regional
engineering hub and focal point for development of integrated iron & steel
initiative.
85. To promote local manufacture of pharmaceutical products including
vaccines, the Government will develop and implement Kenya Pharmaceutical
Manufacturing Plan of Action to promote competitive and efficient pharmaceutical
production; facilitate increased investment in pharmaceutical production;
strengthen pharmaceutical regulatory capacity; develop appropriate skills,
knowledge and technology transfer for the subsector; utilize and mainstream
innovation, research and development within the pharmaceutical industry. All
these efforts will lessen the county’s dependency on imported medicaments and
support vaccines and immunization programme as well as create job opportunities
for Kenyans.
86. As the Government transforms the manufacturing sector, new job
opportunities that require deeper skills and knowledge will be created. To meet this
demand, the Government has heavily invested in Technical and Vocational
Education and Training (TVET) in each of the 290 constituencies. The objective is
to enhance the quality of TVET graduates to meet the local industrial needs and
become internationally competitive. Already, significant progress has been
reported in student enrolment in TVETs and Kenya Industrial Technical Institutes
(KITI) in addition to increased number of applications for patent utility models and
industrial designs. Further, the Government has signed financing agreement for the
Kenya Industry and Entrepreneurship Project (KIEP) aimed at strengthening
innovation and entrepreneurship.
87. To further support the manufacturing sector, the Government has scaled up
reforms in order to address the challenges that have continued to hamper the growth
of manufacturing firms in the country. These challenges have included but not
limited to: limited access to credit, high cost of production and unfair competition
occasioned by illicit trade and contrabands. In this regard, to expand access to
credit, the Government is promoting provision of financial support and credit to
Micro, Small and Medium Enterprises (MSMEs) and increasing the number of
MSMEs supported through Technology Incubation and Common Manufacturing
Facilities. Already, the Government has refurbished 13 Micro and Small
22 2019 Budget Policy Statement
Enterprises worksites. Further, the Government will revamp the One village One
Product (OVOP) project to support to Counties develop comprehensive strategies,
undertake resource mapping and capacity building aimed at supporting the growth
of MSMEs. The Government will also continue to implement the Kenya Youth
Employment and Opportunities Project (KYEOP) through which more than 2,000
youths will receive grants and training in Business Development Services and
Business plan.
88. To reduce the cost of doing business for manufacturers, the National
Government has waived and simplified most of the fees and levies that hinder small
business. However, this is an area that requires close coordination and cooperation
with County Governments since most of the levies remain payable to County
Governments. This therefore, necessitates harmonization of fees and levies at both
the National and County level.
89. To rid local manufacturers of unfair competition, the Government has
heightened the fight against illicit trade and contrabands. As a result of the various
operations conducted within the country, counterfeit goods worth more than Ksh
8.0 billion have been seized and action taken on the culprits. Going forward, the
Government will continue to scale up these operations in order to protect genuine
businesses and traders as well as protect consumers from substandard and
unhealthy products.
2.2.2 Enhancing Food and Nutrition Security to all Kenyans by 2022
90. The Government will continue to implement measures in the agricultural
sector in order to ensure food and nutrition security. The focus will be on expanding
irrigation schemes, increasing access to agricultural inputs, implementing
programmes to support smallholder farmers, fisher folk and pastoralists to
sustainably produce and market various commodities, and supporting large-scale
production of staples.
91. Under “The Big Four” Plan, the Government has aligned all policies under
the agriculture sector towards increasing food production, boosting smallholder
productivity and reducing the cost of food. Overall, the strategies under the Food
and Nutrition Security Pillar target to: reduce the cost of food, reduce the number
of food insecure Kenyans, reduce chronic malnutrition among children under 5
years, increase agriculture contribution to GDP and create 1,000 production SMEs
and 600,000 direct and indirect jobs and increase the average daily income of
farmers (Chart 2.2).
92. To improve food security, the Government will by 2022: i) increase maize
production from 40 to 67 million (90kg) bags; ii) increase rice production from
112,800 to 406,486 metric tonnes; iii) increase potato production from 1.2 to 6
million metric tonnes; iv) increase meat production from 700,000 to 990,000
metric tons; v) increase processed milk production from 630 million to 1 billion
litres; and vi) increase honey production from 25 to 38 million kg; and increase
annual fish production from 135,100 to 231,359 metric tonnes. In addition, the
Government has set aside USD 14 million to increase strategic food reserves to 8
million bags in the medium term.
23 2019 Budget Policy Statement
Chart 2.2: The Food & Nutrition Security Key Outcomes
93. To reduce over reliance on rain fed agriculture, the Government will
increase land under irrigation. Specifically, the Government targets to: develop
85,000 acres of irrigation area under National Expanded Irrigation programme to
increase production and productivity; increase area under smallholder irrigation by
1,617 acres and increase water storage for irrigation by 125 million cubic metres
through development of water pans under household irrigation water harvesting
project so as to bridge the gap between production and consumption. In line with
this, the Government is fast-tracking the enactment of the Irrigation Bill that will
hasten the development and issues of coordination of irrigation facilities in the
country.
94. To boost maize production, the Government will continue to provide
subsidized fertilizer to farmers. Already, the Government has spent over Ksh 4.3
billion in acquiring 119,400 metric tonnes of soil friendly fertilizer to subsidize the
cost for farmers during the 2018 planting season. The Government has also put in
place a Multi-Institutional Technical Team (MITT) to provide technical support in
eradicating Fall Armyworm that threatened food security by attacking the maize
crop.
95. To boost rice production, the Government plans to expand the Mwea
Irrigation Scheme by 10,000 acres through constructing dams, and improving roads
and other infrastructure in the area.
96. To promote the growth of the livestock sub-sector, the Government will
expedite the review of the National Livestock Policy; Finalization of Livestock
Feeds Policy, Livestock Breeding Policy, Livestock Feeds Regulations and
enactment of the Dairy Industry Bill. Further, to improve livestock productivity,
the Government plans to produce 60 million doses of assorted vaccines annually
and expand livestock vaccination coverage; produce 2 million straws of semen
annually; produce and distribute livestock breeding materials (indigenous chicken,
pigs, bee colonies and rabbits) and promote fodder and pasture production and
conservation. To improve value addition and marketing, the Government will
procure and install 120 milk coolers across the country, promote diversification of
24 2019 Budget Policy Statement
livestock products and establish 36 feed lots. In addition, the Government will
sustain Tsetese and Trypanomiasis control in 5 tsetse belts and suppress in 4 new
areas.
97. To increase fish production, the Government will expedite the review of
the National Oceans and Fisheries Policy, 2008; develop regulations to
operationalize the Fisheries Management and Development Act (FMDA), 2016;
develop the necessary fisheries infrastructure and Fish Ports (Fish processing and
cold storage facilities, jetties, Fish landing sites, Market and Auction Centres);
build capacity for deep sea fishing; enhance capacity for fisheries and marine
research; enhance fish quality assurance through accreditation of fish quality
laboratories in Nairobi, Mombasa and Kisumu; promote aquaculture innovations
and technology transfer; and provide regulatory and institutional framework for the
coordination and development of the blue economy. The Government will also
operationalize the institutions established by the FMDA, 2016 namely: the Kenya
Fisheries Services (KeFS); the Kenya Fish Marketing Authority (KFMA); the Fish
Levy Trust Fund (FLTF); the Kenya Fisheries Advisory Council; and the Kenya
Fishing Industries Corporation Order, 2018. Most importantly, coordinate the
developments and investments in the blue economy.
98. To mitigate losses among smallholder farmers and boost their productivity,
the Government will upscale crop and livestock insurance with the goal of
cushioning farmers against climate related risks. This will also contribute to
stabilization of farmers’ incomes, increased investment in agriculture through
leveraged access to finance and enhanced farmers’ risk mitigation.
99. To reduce the cost of food, the Government will play its role by: providing
affordable energy to reduce the cost of production; enhancing market distribution
infrastructure to reduce losses by use of cold storage for production and storage of
seeds; and availing incentives for post-harvest technologies to reduce post-harvest
losses. The Government will also work with other stakeholders in the agriculture
sector to ensure that Kenyans from all walks of life enjoy their favourite meals at
affordable prices.
2.2.3 Providing Universal Health Coverage to Guarantee Quality and
Affordable Healthcare to All Kenyans
100. Over the next four years, the Government will implement policies and
programmes under the Universal Health Coverage Pillar. The primary goal of these
initiatives is to increase access to quality health care and reduce medical costs
incurred by Kenyans (Chart 2.3).
101. Already, the Government has developed guiding documents for Universal
Health Coverage including the Universal Health Coverage roadmap and the
Universal Health Coverage pilot framework. Notably, the Government has rolled
out the pilot project for configuring the National Hospital Insurance Fund (NHIF)
to align with the Universal Health Coverage in four Counties namely; Machakos,
Nyeri, Isiolo, and Kisumu. The residents of these Counties will receive free health
care services in all health facilities from their local health centres all the way to the
referral facilities. The Government will use the lessons learnt from this pilot to
25 2019 Budget Policy Statement
refine and scale up the programme to the rest of the Counties over the next 18
months.
Chart 2.3: Achieving 100 percent Universal Health Coverage
102. To increase the uptake of NHIF, the Government has expanded the
programme to cater for comprehensive medical cover for students in public
secondary schools, elderly and vulnerable persons in all the NHIF-accredited
mission and private hospitals. The Government will also continue to implement
and improve the Linda Mama Programme. By the year 2022, the Government
targets to have covered 1.36 million women under this Programme.
103. Further, the Government will enhance and modernize NHIF systems to
increase its uptake, improve its governance structure and service delivery. To
increase enrolment and retention of NHIF, the Government will use customer-
centric distribution system including religious organizations, Self-Help Groups,
Ajira Agent Platforms and Banks, among others.
104. Human resources are very crucial to attainment of the Universal Health
Coverage. Thus, the Government through the Transforming Health Systems for
Universal Care Project (THS-UCP) has sponsored more than 1,200 students from
Arid and Semi-Arid who are taking a course in Enrolled Community Health
Nursing (ECHN). These students are expected upon graduation to provide critical
primary healthcare both at medical facilities and in their communities. The
Government has also increased Kenya Medical Training Colleges from 45 to 67
which are strategically spread across 44 Counties.
105. To increase specialized treatment, the Government will continue to avail
and improve specialized medical equipment and infrastructure to hospitals across
the country. Kenyatta National Hospital (KNH) has already recorded
commendable improvement in its infrastructure through the construction of the
Cancer Centre of Excellence and improvement in its Renal Unit. Moi Teaching and
Referral Hospital (MTRH) has also benefitted through construction of the
Chandaria Cancer and Chronic Disease Centre, Shoe4Africa Children’s Hospital,
Cardiac Care Unit, Mental Health and Rehabilitation Centre, and expansion and
equipping of the General ICU and Neurosurgery Centre.
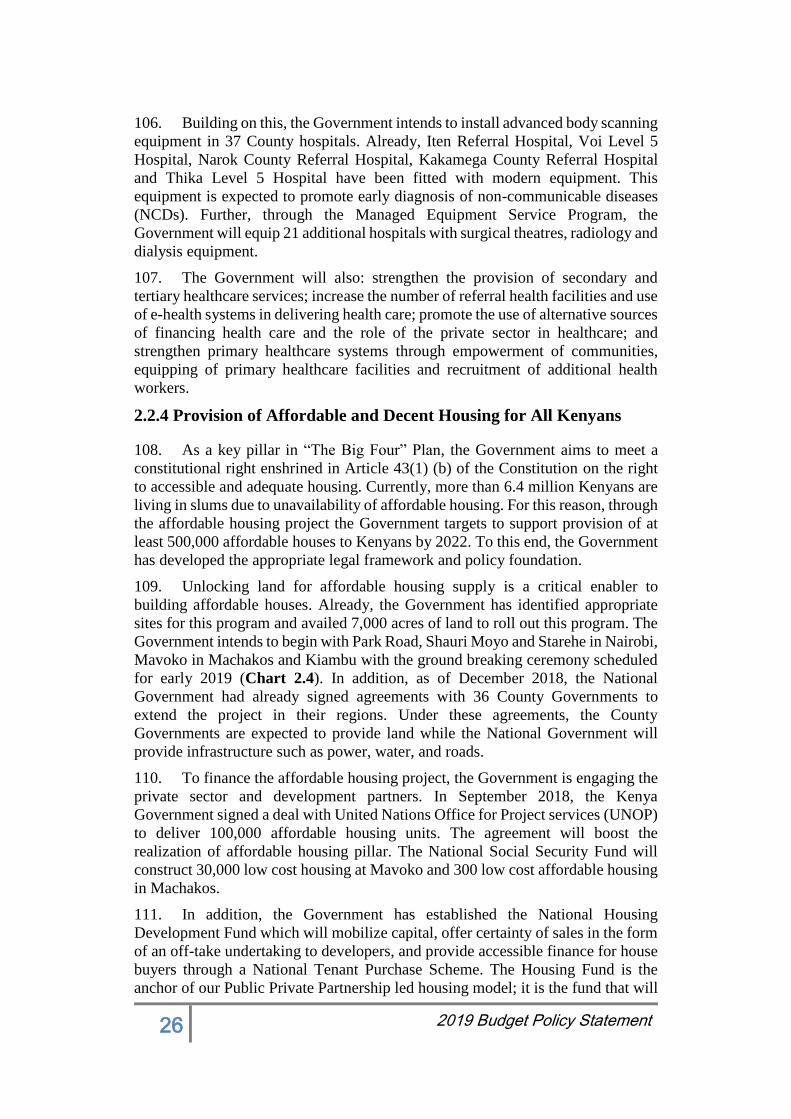
26 2019 Budget Policy Statement
106. Building on this, the Government intends to install advanced body scanning
equipment in 37 County hospitals. Already, Iten Referral Hospital, Voi Level 5
Hospital, Narok County Referral Hospital, Kakamega County Referral Hospital
and Thika Level 5 Hospital have been fitted with modern equipment. This
equipment is expected to promote early diagnosis of non-communicable diseases
(NCDs). Further, through the Managed Equipment Service Program, the
Government will equip 21 additional hospitals with surgical theatres, radiology and
dialysis equipment.
107. The Government will also: strengthen the provision of secondary and
tertiary healthcare services; increase the number of referral health facilities and use
of e-health systems in delivering health care; promote the use of alternative sources
of financing health care and the role of the private sector in healthcare; and
strengthen primary healthcare systems through empowerment of communities,
equipping of primary healthcare facilities and recruitment of additional health
workers.
2.2.4 Provision of Affordable and Decent Housing for All Kenyans
108. As a key pillar in “The Big Four” Plan, the Government aims to meet a
constitutional right enshrined in Article 43(1) (b) of the Constitution on the right
to accessible and adequate housing. Currently, more than 6.4 million Kenyans are
living in slums due to unavailability of affordable housing. For this reason, through
the affordable housing project the Government targets to support provision of at
least 500,000 affordable houses to Kenyans by 2022. To this end, the Government
has developed the appropriate legal framework and policy foundation.
109. Unlocking land for affordable housing supply is a critical enabler to
building affordable houses. Already, the Government has identified appropriate
sites for this program and availed 7,000 acres of land to roll out this program. The
Government intends to begin with Park Road, Shauri Moyo and Starehe in Nairobi,
Mavoko in Machakos and Kiambu with the ground breaking ceremony scheduled
for early 2019 (Chart 2.4). In addition, as of December 2018, the National
Government had already signed agreements with 36 County Governments to
extend the project in their regions. Under these agreements, the County
Governments are expected to provide land while the National Government will
provide infrastructure such as power, water, and roads.
110. To finance the affordable housing project, the Government is engaging the
private sector and development partners. In September 2018, the Kenya
Government signed a deal with United Nations Office for Project services (UNOP)
to deliver 100,000 affordable housing units. The agreement will boost the
realization of affordable housing pillar. The National Social Security Fund will
construct 30,000 low cost housing at Mavoko and 300 low cost affordable housing
in Machakos.
111. In addition, the Government has established the National Housing
Development Fund which will mobilize capital, offer certainty of sales in the form
of an off-take undertaking to developers, and provide accessible finance for house
buyers through a National Tenant Purchase Scheme. The Housing Fund is the
anchor of our Public Private Partnership led housing model; it is the fund that will
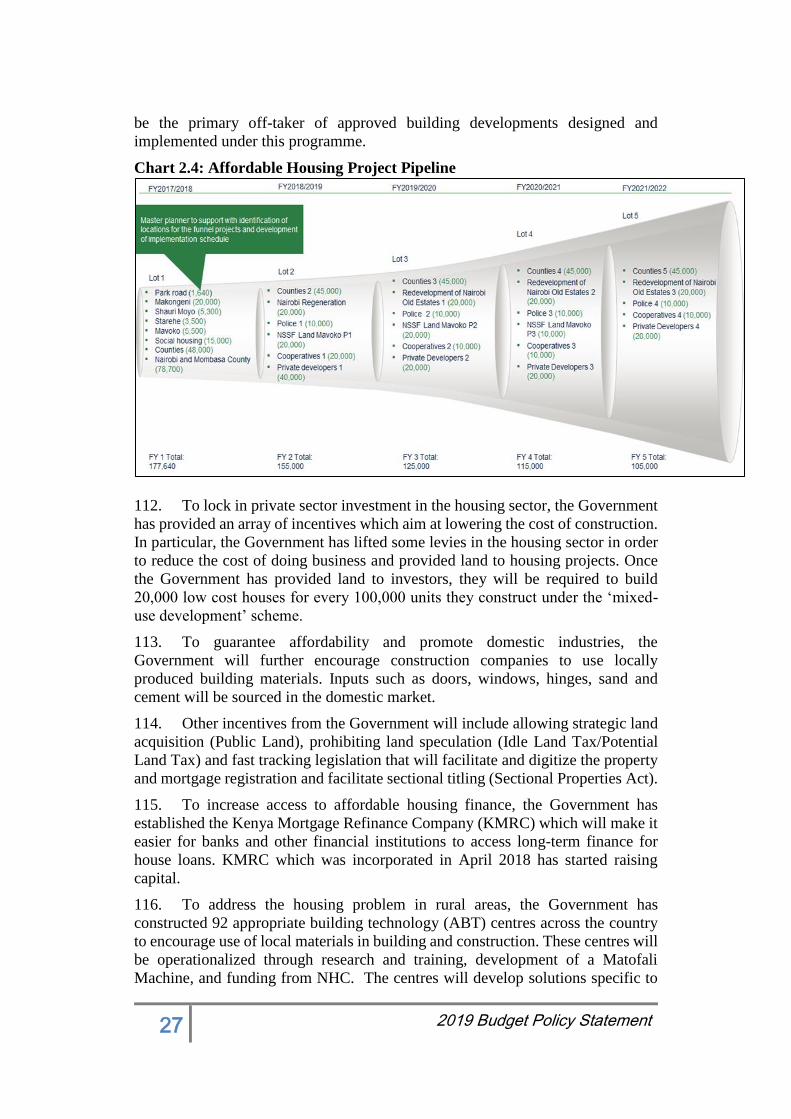
27 2019 Budget Policy Statement
be the primary off-taker of approved building developments designed and
implemented under this programme.
Chart 2.4: Affordable Housing Project Pipeline
112. To lock in private sector investment in the housing sector, the Government
has provided an array of incentives which aim at lowering the cost of construction.
In particular, the Government has lifted some levies in the housing sector in order
to reduce the cost of doing business and provided land to housing projects. Once
the Government has provided land to investors, they will be required to build
20,000 low cost houses for every 100,000 units they construct under the ‘mixed-
use development’ scheme.
113. To guarantee affordability and promote domestic industries, the
Government will further encourage construction companies to use locally
produced building materials. Inputs such as doors, windows, hinges, sand and
cement will be sourced in the domestic market.
114. Other incentives from the Government will include allowing strategic land
acquisition (Public Land), prohibiting land speculation (Idle Land Tax/Potential
Land Tax) and fast tracking legislation that will facilitate and digitize the property
and mortgage registration and facilitate sectional titling (Sectional Properties Act).
115. To increase access to affordable housing finance, the Government has
established the Kenya Mortgage Refinance Company (KMRC) which will make it
easier for banks and other financial institutions to access long-term finance for
house loans. KMRC which was incorporated in April 2018 has started raising
capital.
116. To address the housing problem in rural areas, the Government has
constructed 92 appropriate building technology (ABT) centres across the country
to encourage use of local materials in building and construction. These centres will
be operationalized through research and training, development of a Matofali
Machine, and funding from NHC. The centres will develop solutions specific to
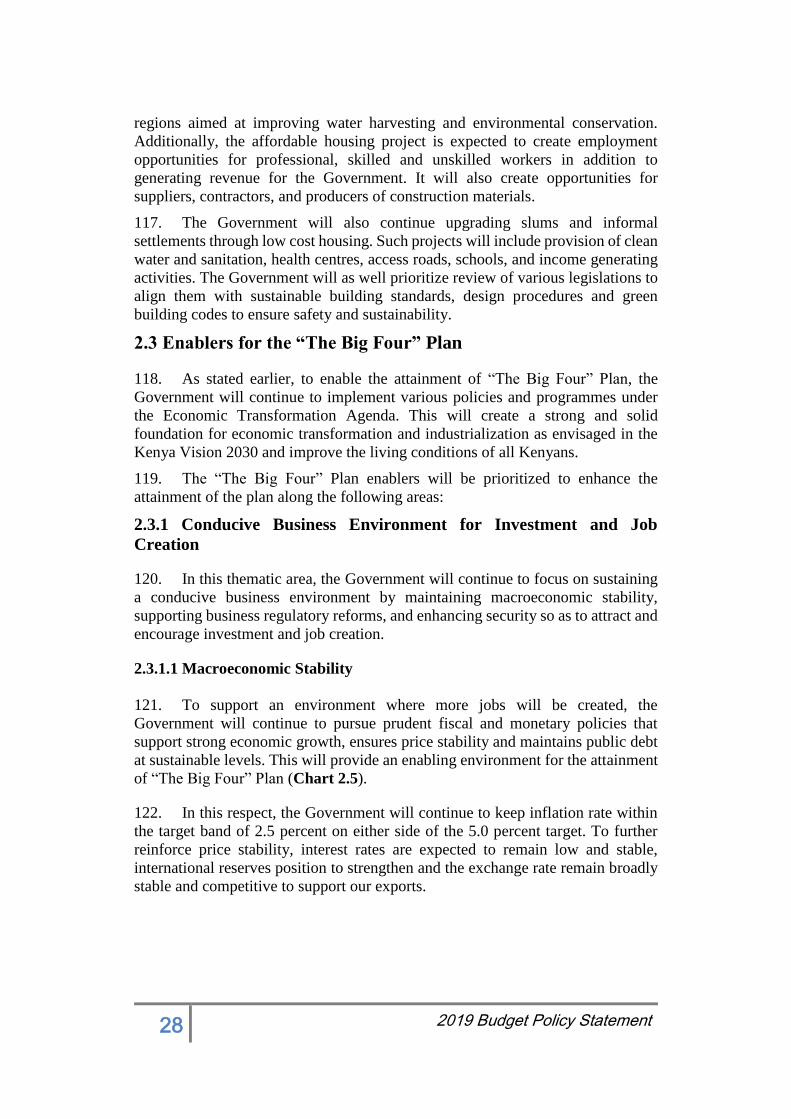
28 2019 Budget Policy Statement
regions aimed at improving water harvesting and environmental conservation.
Additionally, the affordable housing project is expected to create employment
opportunities for professional, skilled and unskilled workers in addition to
generating revenue for the Government. It will also create opportunities for
suppliers, contractors, and producers of construction materials.
117. The Government will also continue upgrading slums and informal
settlements through low cost housing. Such projects will include provision of clean
water and sanitation, health centres, access roads, schools, and income generating
activities. The Government will as well prioritize review of various legislations to
align them with sustainable building standards, design procedures and green
building codes to ensure safety and sustainability.
2.3 Enablers for the “The Big Four” Plan
118. As stated earlier, to enable the attainment of “The Big Four” Plan, the
Government will continue to implement various policies and programmes under
the Economic Transformation Agenda. This will create a strong and solid
foundation for economic transformation and industrialization as envisaged in the
Kenya Vision 2030 and improve the living conditions of all Kenyans.
119. The “The Big Four” Plan enablers will be prioritized to enhance the
attainment of the plan along the following areas:
2.3.1 Conducive Business Environment for Investment and Job
Creation
120. In this thematic area, the Government will continue to focus on sustaining
a conducive business environment by maintaining macroeconomic stability,
supporting business regulatory reforms, and enhancing security so as to attract and
encourage investment and job creation.
2.3.1.1 Macroeconomic Stability
121. To support an environment where more jobs will be created, the
Government will continue to pursue prudent fiscal and monetary policies that
support strong economic growth, ensures price stability and maintains public debt
at sustainable levels. This will provide an enabling environment for the attainment
of “The Big Four” Plan (Chart 2.5).
122. In this respect, the Government will continue to keep inflation rate within
the target band of 2.5 percent on either side of the 5.0 percent target. To further
reinforce price stability, interest rates are expected to remain low and stable,
international reserves position to strengthen and the exchange rate remain broadly
stable and competitive to support our exports.
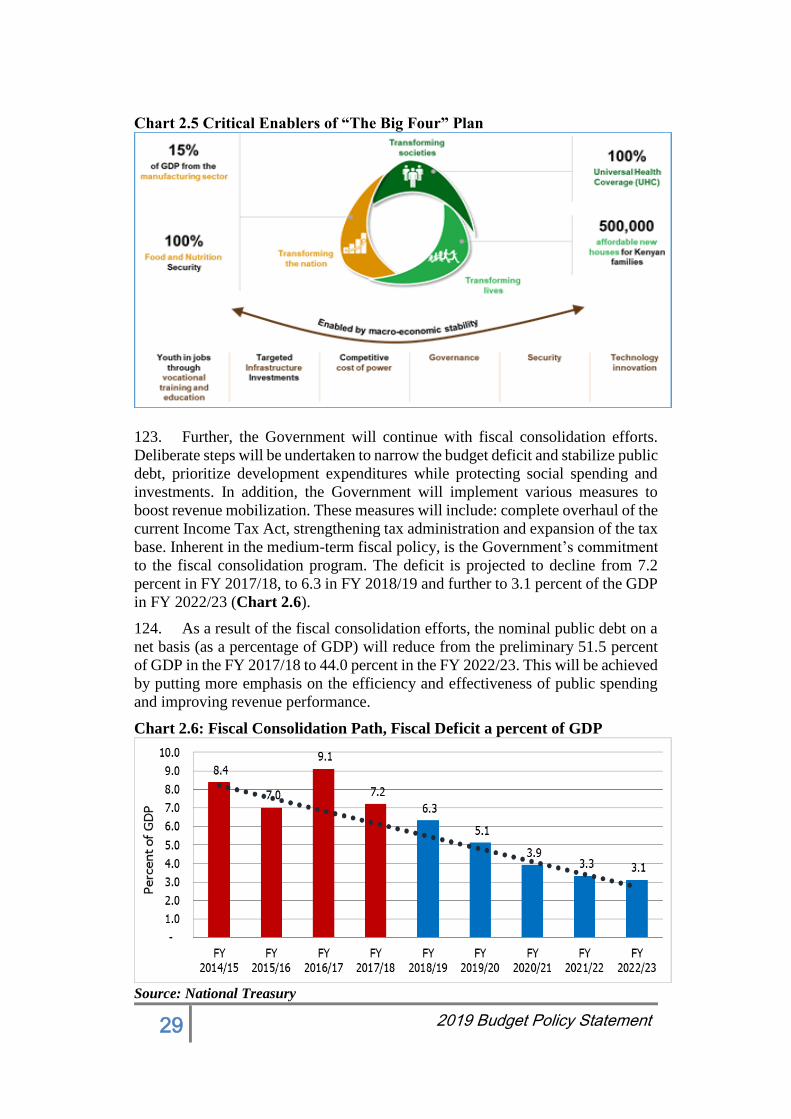
29 2019 Budget Policy Statement
Chart 2.5 Critical Enablers of “The Big Four” Plan
123. Further, the Government will continue with fiscal consolidation efforts.
Deliberate steps will be undertaken to narrow the budget deficit and stabilize public
debt, prioritize development expenditures while protecting social spending and
investments. In addition, the Government will implement various measures to
boost revenue mobilization. These measures will include: complete overhaul of the
current Income Tax Act, strengthening tax administration and expansion of the tax
base. Inherent in the medium-term fiscal policy, is the Government’s commitment
to the fiscal consolidation program. The deficit is projected to decline from 7.2
percent in FY 2017/18, to 6.3 in FY 2018/19 and further to 3.1 percent of the GDP
in FY 2022/23 (Chart 2.6).
124. As a result of the fiscal consolidation efforts, the nominal public debt on a
net basis (as a percentage of GDP) will reduce from the preliminary 51.5 percent
of GDP in the FY 2017/18 to 44.0 percent in the FY 2022/23. This will be achieved
by putting more emphasis on the efficiency and effectiveness of public spending
and improving revenue performance.
Chart 2.6: Fiscal Consolidation Path, Fiscal Deficit a percent of GDP
Source: National Treasury
30 2019 Budget Policy Statement
2.3.1.2 Deficit Financing Policy
125. The main sources of funding for the Government are from domestic and
external official creditors. Thus, the Government will continue to diversify the
sources of financial resources over the medium term by maintaining a presence in
the international capital markets. The Government also intends to explore other
sources of possible financing options, such as the Islamic financing instruments,
Green bonds, Samurai and Panda bonds and diaspora bonds over the medium term.
126. The Government will utilize and maximize the official external sources for
loans on concessional terms. However, since Kenya`s graduation to lower middle-
income economy, access to concessional funding is slowing down. For this reason,
the will continue to access commercial windows of multilateral institutions as well
as Export Credit Arrangements (ECAs). These non-concessional and commercial
loans will be limited to development projects with high financial and economic
returns and in line with Vision 2030 and “The Big Four” Plan. Further, the
Government will ensure future loans from Development Partners have a grant
element of 35 percent to ensure sustainable level.
127. Kenya’s domestic debt market remains a key source of funding to the
Government, financing about half of the deficit. Through financial reforms
spearheaded by a Joint Technical Working Group, the domestic market is
deepening and is expected to be more vibrant. The Government will continue
playing a key role in domestic debt market through issuance of Treasury Bills and
Bonds. As a way of ensuring financial inclusion and cultivate the saving culture in
the economy, the Government will continue issuing retail products targeting the
small retail investors as a way of providing an opportunity to invest and save in
building the economy. To ensure efficiency and transparency in the domestic debt
market, the Government will continue to implement other reforms aimed at
improving the market including issuing the borrowing calendar.
2.3.1.3 Business Regulatory Reforms
128. Reducing cost of doing business and encouraging private sector innovation
and entrepreneurship is a key prerequisite to a strong and sustained high growth,
poverty reduction and the attainment of “The Big Four” Plan. As such, the
Government has continued to develop and implement various business reform
strategies.
129. These strategies have borne dividend, with Kenya’s ease of doing business
improving from position 80 in 2017 to position 61 in 2018 according to the latest
World Bank’s Ease of Doing Business report. In addition, for three consecutive
years (2016, 2017 and 2018), Kenya emerged as the third best in sub-Saharan
Africa. Among the business regulatory reforms that Kenya made in 2018 include:
strengthening access to credit, protecting minority investors and easing payment of
taxes by merging all permits into a single unified business permit. Notably, Kenya
was ranked position 8 globally for making it easier to access credit.
130. Kenya also made resolving insolvency easier by facilitating the
continuation of the debtor’s business during insolvency proceedings, providing for
31 2019 Budget Policy Statement
equal treatment of creditors in reorganization proceedings and granting creditors
greater participation in the insolvency proceedings.
131. Going forward, the Government will focus on measures to improve
Kenya’s ranking to be among the top 50 nations in the world in the ease of doing
business. Particular focus will be on specific indicators of interest to small
businesses and ordinary Kenyans. In this regard, the Government will continue to
cut down the number of licenses at both National and County levels, as well as the
processing times of licenses and permits; automate business registration processes;
and put in place a wide range of attractive incentives to investors including: tax
incentives, and protect private property against expropriation. In addition, the
Government will put in place a business investment observatory to fast track
processing of policy, regulatory and administrative challenges that are adversely
affecting the productivity and global competitiveness of business operations. The
Government will also continue to implement the Local Content Policy in order to
enhance investments that utilize more local resources to spur economic growth and
development.
2.3.1.4 Improving National Security
132. The Government will continue to implement reforms targeted at boosting
security forces’ welfare and guaranteeing Kenyans safety. Therefore, the strategy
on security for the medium-term lays emphasis on improving police welfare,
strengthening coordination among security agencies, scaling up investments
towards modernization, enhancing security operations and investigations, building
professional capacity of the force and strengthening partnership with communities.
133. In this regard, the Government will continue to modernize the National
Police Service in order to ensure the lives and property of Kenyans are adequately
protected. Already, the Government has enrolled new National Police Service
Standing Orders, career progression guidelines and basic training curriculum for
police officers. The Government has also improved the welfare of police and prison
officers’ through acquisition of 3,071 housing units for National police service and
590 for the Kenya Prisons Service and provision of comprehensive insurance cover
and medical insurance.
134. To modernize security, the Government has in the recent years invested in
better equipment, training and working tools as well as strengthened coordination
among security agencies. To further enhance security for all Kenyans, the
Government will build on the on-going security reforms by scaling-up investments
in security infrastructures such as installation of surveillance and control system in
major cities and towns, equipping of the forensic laboratory, and provision of
police patrol vehicles.
135. Going forward, the Government will facilitate research on informed ways
of fighting crime by identifying ways of combating emerging forms of crime that
are technologically aided such as cybercrime, money laundering, terrorism
financing, human trafficking, conflicts around the discovery of natural resources
and international organized crime.
32 2019 Budget Policy Statement
2.3.2 Investing in Infrastructure Development to Unlock Growth
Potential and Drive “The Big Four” Plan
136. Infrastructure investment is key to Government’s efforts to grow the
economy, create jobs, empower small businesses and provide services to Kenyans.
For this reason, the Government has invested heavily in new roads, rails, marine,
air, power stations, and ICT. Expanding infrastructure will support the
achievement of “The Big Four” Plan and in turn ensure that Kenyans enjoy the
benefits of expanded infrastructure facilities.
2.3.2.1 Further Expanding Road Network
137. To further expand the road network, the Government intends to construct
8,245km of new roads, construct 150 bridges, and rehabilitate 763 km of existing
roads and maintain 114,131 km of existing roads in the medium term which will
help to open up the rural areas to enable farmers to get their produce to markets
faster and cheaply. In addition, the Government has initiated the construction of
the Mombasa-Nairobi six lane expressway which will improve connectivity and
enhance movement of people and goods between the two cities.
138. In addition, the Government will focus on developing urban roads to
decongest cities and major towns. For instance, the Government has launched Ksh
2.7 billion project for reconstruction of roads in 11 constituencies in Nairobi’s
Eastlands amid complaints of the poor state of infrastructure in the city’s most
populous estates. The upgrade, which is part of the Nairobi Regeneration
Programme, will see the repair of more than 80 kilometers of roads in the first
phase. The roads covered by the project include Komarock Road, Harambee Estate
Sacco roads, Eastern Bypass, Kayole Spine Road, Donholm Phase V and VIII
roads, Eldoret Road and Nyasa Road.
2.3.2.2 Rail, Marine and Air Transport
Standard Gauge Railway
139. Phase I of the Standard Gauge Railway (SGR) from Mombasa to Nairobi
has improved the movement of Kenyans and cargo across the two cities. After a
year in operation, Madaraka Express has ferried more than 1.3 million passengers
along the Mombasa-Nairobi route. To date, the SGR freight service has transported
more than 213,559 metric tonnes.
140. Building on these gains, the Government embarked on the construction of
Phase 2A (Nairobi to Naivasha) of SGR. Already, 85 percent of Phase 2A has been
done. Further, financing negotiations and detailed designs for the construction of
Phase 2B (Naivasha to Kisumu) have been done. Once Phase 2B is completed, it
will connect Kisumu city with the newly established Naivasha Inland Container
Depot to ease cargo freight through to Mombasa. This will in turn boost fish export
and agricultural commodities in the Western region.
33 2019 Budget Policy Statement
Sea Ports
141. To enhance cargo handling and storage and reduce the time to clear cargo,
the Government will continue to develop several commercial sea ports. Currently,
the Government is constructing Phase II of the second container terminal at the
port of Mombasa. This will create additional berth which will assist in the
discharge and loading of vessels. In addition, the construction of the first three
berths at the port of Lamu (LAPSSET Project) is 47 percent complete. This facility
will open up an alternative corridor linking the upper part of Africa, the Middle
East and Europe.
142. Further, the Government will develop a free port under the Dongo Kundu
Special Economic Zone, and the Kisumu Port in order to harness opportunities for
inter-country transport and trade among the East African countries around Lake
Victoria.
Airports
143. The recent launch of the direct flight from Jomo Kenyatta International
Airport (JKIA) in Nairobi to New York City in the United States reflects the
Government’s commitment to cement Kenya’s position as the regional aviation
hub. Today, passengers are flying more conveniently between the two cities. These
direct flights have opened up immense business, investment and tourism
opportunities that shall significantly boost our economic growth. The flights
present major opportunities especially for our horticultural industry, where transit
of flower exports to this lucrative market has now been cut to almost one working
day. This will also ensure that our textiles and apparel exports reach market in time.
144. After completing the construction of three new terminals (Terminal 1A,
Terminal 1E, and Terminal 2A) at JKIA, the Government has embarked on
remodeling and upgrading JKIA’s Terminal 1B, C and D to raise its total passenger
handling capacity to 10 million by the end of 2020.
145. Further, the Government will continue to develop a number of airstrips to
connect various parts of the country as well as enhance connectivity of Kenya with
neighboring countries.
2.3.2.3 Enhancing Access to Adequate, Affordable and Reliable Energy
Supply
146. Access to stable, reliable and affordable energy supply is critical to
uplifting the welfare of Kenyans, enhancing productivity of businesses and
accelerating the realization of “The Big Four” Plan. In this regard, priority will be
placed on increasing the energy mix through exploiting locally available energy
sources including the vast potential of renewable energy. In addition, the
Government will continue to invest in increasing access to electricity through
enhanced transmission and distribution of energy, especially under the rural
electrification programme.
147. With the rapid growth of connections to electricity, millions of Kenyan
homes are now lit up. Today, more than 6.7 million households have been
34 2019 Budget Policy Statement
connected to electricity compared to the 2.3 million connected in 2013. The
Government’s target is to expand the access to affordable and reliable energy to
100 percent by the year 2022.
148. To realize this, the Government will continue to invest in the construction
of more electricity substations, transmission lines and distribution of transformers
to boost the availability of electricity and to sustain demand. The Government will
also continue to support the exploration and distribution of oil and gas in the
country and explore alternative sources of energy including solar, wind and small
community hydro-power generation.
2.3.2.4 Promoting the use of Information, Communication and Technology
(ICT)
149. Attainment of “The Big Four” Plan and prosperity as a nation is dependent
on our ability to take full advantage of both the rapid technological change and the
domestic potential to innovate in Information, Communication and Technology
(ICT). Indeed, ICT is important as a means of reducing the cost of doing business
enhancing efficiency in service delivery, and opening new frontiers for
employment creation and business opportunities.
150. As Kenya moves to the next level of a knowledge-based economy, we need
to further develop our capabilities in the areas of science, technology and
innovation. Leading in this drive, and with the goal of increasing access to and
reducing cost of information by all Kenyans, the Government has spearheaded
major ICT investments including the expansion of Optic Fibre Backbone
Infrastructure across the Counties which has facilitated reliable high-speed
networks and supported e-Government service and innovation among businesses.
151. Building on the progress made in ICT, the Government is keen on
positioning Kenya to reap the most out of the global digital revolution. To this end,
the Government will set up a taskforce on Blockchain and Internet of Things (IoT)
technologies that will study the benefits and challenges associated with the latest
digital innovation trends.
152. Digital revolution exposes us to risks such as cybercrimes and fraud which
may result to data corruption or loss. Given these risks, strengthening the fight
against cybercrimes is critical. Towards this end, the Computer Misuse and
Cybercrimes Act, 2018 was enacted which criminalizes abuse of persons on social
media, removing the legal lacuna that existed. In addition, the Government is in
the final stages of enacting the Data Protection Bill, 2018.
153. The Computer Misuse and Cybercrimes Act 2018 establishes the National
Computer and Cybercrimes Coordination Committee and facilitates international
co-operation in dealing with computer and cybercrime matters. The Act also spells
out stiff punishment to cybercriminals - provides for timely and effective detection,
prohibition, prevention, response, investigation and prosecution of computer and
cybercrimes. The Data Protection Bill 2018 proposes to establish the Office of the
Data Protection Commissioner to enforce safe handling of data.
154. Going forward, the Government will continue to invest in ICT projects
closely linked with the achievement of “The Big Four” Plan. In particular, the
35 2019 Budget Policy Statement
Government will continue to invest in Konza Technopolis and creation of
technological hubs in each constituency.
2.3.3 Investing in Sectoral Transformation for Broad Based Sustainable
Economic Growth
2.3.3.1 Promoting Environmental Conservation and Water Supply 155. The Government remains committed to the provision of a clean, secure and
sustainable environment and adequate drinking water for all Kenyans. For this
reason, the Government has developed policy measures including; development of
the National Water Policy and Trans-boundary Water Bill; development of the
National Wildlife Strategy, completion of Reports for Mapping of ground water
resources in Marsabit and South Turkana; implementation of Sub-catchment
Management Plans (SCMPs) and establishment of Hydro met stations.
156. To increase access to safe drinking water, in May 2018, the Government
unveiled plans to implement the strategic water storage program that will increase
the number of Kenyans connected to safe piped water by 9 million people by 2022.
The massive country-wide program will additionally increase the proportion of
households with access to safe drinking water from 60 to 80 per cent in the next
five years with a special focus on informal settlements and arid areas.
157. To enhance environmental sustainability, the Government continues to
implement the Green Economy Strategy. Notably, over the last three years, the
Government in collaboration with key stakeholders locally and internationally has
been developing green bonds market with a view to mobilize adequate resources
to support the implementation of Vision 2030, National Policy on Climate Finance,
National Climate Change Action Plan and the Green Economy Implementation
Strategy. The process has allowed domestic banks and corporates to better deliver
green investments in Kenya - renewable energy, low-carbon transport, water
infrastructure, climate smart/sustainable agriculture and local capacity building.
158. Indeed, Kenya is at an advanced stage in the issuance of Green Bonds. The
Green Bond initiative is intended to mobilize resources from the private sector to
reinforce public resources in accelerating green investments in Kenya.
159. Going forward, the Government will scale up investments to ensure
optimal, effective and seamless linkages with all other sectors of the economy. The
focus will be on conservation and management of forest, wildlife resources, water
catchments and management of wetlands, water resources management, increase
access to water and sanitation and mitigation and adaptation of the effects of
climate change. There will also be continuous monitoring, compliance
enforcement and stakeholders’ engagement on the total ban on use, manufacture
and importation of plastic bags.
2.3.3.2 Stimulating Tourism Recovery, Sports, Culture, and Arts
160. Tourism, Sports, Culture, and Arts sub-sectors are critical enablers of “The
Big Four” Plan. They also unlock employment opportunities and generate foreign
exchange which is important for enhancing the welfare of Kenyans. For this reason,
36 2019 Budget Policy Statement
the Government has continued to support sports development, tourism promotion
activities, film industry development, nurturing of talents and arts, and preservation
of national heritage and cultural identity.
161. Great progress has been realized along these areas including the
refurbishment of major stadia including Kasarani and Nyayo National Stadium. In
addition, the Government is in the process of completing construction of the Kenya
Academy of Sports Phase 1 which will further enhance sports training. Going
forward, the Government will construct and rehabilitate more sports stadia,
strengthen the anti- doping education programme and sports sector policy and legal
framework, promote sports tourism, increase international cooperation in sports
and develop an international convention center and sports museum. In order to
have a sustainable financing for sports, arts and culture, the Government has
established under Public Finance Management Act a Fund with financing mainly
from betting taxes and winning.
162. Tourism also provides our country with incredible opportunities to shine in
the world and generate new jobs. Strategies to revive the tourism sector have borne
fruit, with the sector recording robust growth and post increased earnings. The
Government is keen on enhancing the growth of the sector and will thus continue
to support and develop emerging tourism businesses.
163. In this regard, the Government will continue to market Kenya in key
tourism markets as a top tourist destination, enhance the quality of tourism training,
improve tourism service, re-engineer the Kenya Utalii College, and complete
construction of the Ronald Ngala Utalii College in Kilifi County. Other initiatives
will include: operationalizing Tourism Transformation Fund, developing tourism
infrastructure, developing tourism research institute under the Kenya Utalii
College, reviewing the National Tourism Policy and Tourism Act 2011,
establishing the National Convention Bureau, Baraza Kenya, Beach Management
Board, and Tourism Council.
164. To promote arts and culture, the Government will establish an international
arts and culture centre that will develop youth potential and nurture their talents in
music, arts and theatres. The Government will also ensure documentation,
preservation and dissemination of music and dance heritage of Kenya, promote
talent in music and dance, establish County Heritage and Community Cultural
Centres, empower artists and cultural practitioners. In the filming sub-sector, the
Government will expand the Kenya Film School and modernize filming
equipment.
2.3.3.3 Sustainable Management of Land for Social-Economic Development
165. Sustainable management of land is vital for the attainment of Vision 2030
and “The Big Four” Plan. Notwithstanding, land is susceptible to increasing
population pressure, environment pollution, and climate change. For this reason,
the Government has continued to scale-up investment towards policies and
programs covering land use, security of tenure, access to land title, transparent and
secure land registration system. By doing this, the Government has increased the
scope for enhanced food and nutrition security, growth in investments and
industries and increased household incomes from agriculture.
37 2019 Budget Policy Statement
166. Tremendous progress has already been realized in the lands sector
including: enactment of Land Laws (Amendment) Act 2016; development of the
National Land Use Policy which has been approved by Cabinet, development of
the Physical Planning Bill 2017 which will be submitted shortly to Parliament for
approval, development of National Land Reforms Information Management
Guidelines, launch of the National Spatial Plan (2015 – 2045) and investigation
and adjudication of historical land injustice.
167. Going forward, the Government will finalize Physical Planning Bill 2017
and regulations, review the Physical Planner’s Registration Act and align Rating
Act, Valuation for Rating Act and Survey Act to the Constitution. In addition, the
Government will continue to invest in land registration, processing and issuance of
tittle deeds, implement National Land Management Information System by
digitizing the remaining 39 land registries for effective and efficient access to land
data.
168. Further, the Kenya National Spatial Data Infrastructure Policy, will be
implemented to facilitate higher productivity through efficient allocation of land,
equity and sustainability in land use and better access to land and territorial space.
The National Land Value Index will be finalized to guide taxation.
2.3.4 Enhancing Service Delivery through Devolution
169. The National Government’s strategy over the last five years has involved
ensuring that County Governments are sufficiently funded and supported through
provision of technical capacity to enable them to govern and effectively deliver
services that matter to residents the most. Fiscal transfers to the Counties have been
significantly enhanced; including payments made in FY 2017/18, cumulative
transfers to the Counties exceed 1.3 trillion, of which 95 percent has been from the
equitable revenue share.
170. Beginning FY 2019/20 and into the medium-term, the Government will
deepen its devolution support strategy, while also responding to new issues
evolving from Kenya’s fiscal decentralization. For instance, funding for towns and
cities -- the engines of economic growth within the Counties -- will be enhanced
through the Kenya Urban Support Programme (KUSP). The programme aims to
incentivize establishment and strengthening of urban institutions in accordance
with the Urban Areas and Cities Act, 2011. The programme also aims to support
formation of urban development plans as well as initial preparation of urban
infrastructure investments. Accordingly, enhanced funding for towns and cities is
expected to further deepen service delivery at sub-County level.
171. To unlock County Governments’ huge own-source revenue (OSR)
potential, the National Treasury is embarking on implementation of a policy
framework that generally aims at: strengthening the legal underpinnings for
locally-generated revenue collection and its link with policy objectives; achieving
efficiency in revenue administration; enhancing governance and promoting
transparency; and, making public participation more effective. As part of this
policy framework, a range of national-level legislative reforms will be initiated
38 2019 Budget Policy Statement
encompassing property and entertainment tax as well as other imposts relating to
trade, tourism and agricultural services.
172. In FY 2017/18, the Government launched the ‘Big Four’ plan which has
been prioritized in the Third Medium Term Plan. In FY 2019/20, the Government
will seek to foster close partnership between the two levels of Government to
ensure speedy and efficient implementation of the plan. Towards this end, the
Government has established 47 County Development Implementation
Coordination Committees, whose functions include coordination of National
Government will develop a framework for collaborating in as well as coordinating
implementation and monitoring of the plan.
173. Improvements in delivery of devolved services will be sustained only if
County Governments adhere to existing fiscal rules. For this reason, beginning FY
2019/20, the National Treasury will renew its focus on enforcing compliance with
the Fiscal Responsibility Principles -- particularly legal thresholds for wage bill
and development spending -- as well as regulations to do with prudent management
of fiscal risks, financial reporting, public procurement and management of public
funds, among other existing legal guidelines. Voluntary compliance with these
guidelines is of course, preferred.
2.3.5 Investing in Kenyans for a Shared Prosperity
174. Human capital development is a critical enabler of “The Big Four” Plan
and a means of ensuring that all Kenyans share the benefits of an expanded
economy. Our human capital index has improved over time as a result of continued
investment in all social sectors. In 2018, the World Bank ranked Kenya at position
94 globally and 4 in Africa (out of 157 countries) with a Human Capital Index
score of 0.52. The index is a measure of productivity of the next generation of
workers relative to the benchmark of complete education and full health.
175. To further develop our human capital, the Government will continue to
invest in quality and relevant education, scale up social safety nets and support
initiatives that empower youth, women and persons with disabilities. In particular,
to equip staff with the required skills for effective implementation of the
programmes under “The Big Four” areas, the Government will continue to design
human resource management and development policies, rules and regulations in
the Public Service. More efforts will be made to design organizational structures
that maximize staff deployment for optimal gains.
176. To improve the efficiency of labour in delivering on “The Big Four” Plan,
the Government is reviewing the labour laws to respond to emerging issues and
challenges in the labour market; establishing an Alternative Dispute Resolution
Mechanism to provide conciliation and mediation services necessary for settlement
of labour disputes to reduce industrial strikes and lockouts; developing an
integrated National Wages and Remuneration Policy to provide a framework and
necessary guidance on wage levels, wage formation and adjustment mechanisms
and other wage administration issues to be applicable in the country.

39 2019 Budget Policy Statement
2.3.5.1 Investing in Quality and Relevant Education for all Kenyans
177. The Government continues to invest in expanding access to quality basic
education and improving the outcomes of our public schools. These investments
have seen increased enrolment in both primary and tertiary education levels,
improved examination administration and teacher-development.
178. With the start of free day secondary education, a hundred percent transition
from primary to secondary school for all learners is now a reality. This has
significantly reduced the burden on parents of educating their children. To ensure
secondary schools have the capacity to accommodate more students, the
Government continues to expand school infrastructure, recruit additional
teachers and improve teacher training.
179. On curriculum reforms, as from January 2019, the Government started the
phased roll out of the competency based curriculum effective in pre-primary I and
II and Grades 1, 2 and 3. The roll out came immediately after a careful piloting
stage that involved the training of all teachers, refining of the curriculum content,
development of a framework for testing, and preparation of teaching and learning
materials. The new curriculum will develop the competencies and develop quality
and relevant skills for the next generation of innovators, entrepreneurs and labor
force.
180. Kenya grows by the intelligence and ingenuity of Kenyans - especially
young Kenyans. However, quite often the skills of young people have not matched
the opportunities open to them. That’s the one reason why the Government has
been especially keen on reforming our technical institutions. Indeed, as the country
forge towards industrialisation, the technical training institutes will become
indispensable for developing skills needed in the industrial sector.
2.3.5.2 Strengthening the Social Safety Nets
181. Social grants remain a vital lifeline for millions of our people living in
poverty. We have taken decisive steps to care for and share with the community by
enhancing support for the disadvantaged and enabling members of the public to
enjoy the fruits of our economic success. Today, we are currently investing more
than 0.3 percent of our GDP on social protection through cash transfer programmes
to the vulnerable groups.
182. Going forward, the Government will continue to extend cash transfers to
vulnerable groups including older persons, Orphans and Vulnerable Children
(OVCs) and Persons with Severe Disabilities (PWDs) under the National Safety
Net (Inua Jamii) Programme.
2.3.5.3 Empowering Youth, Women and Persons with Disabilities
183. Kenya’s most grave and most pressing challenge is youth unemployment.
It is critical therefore, to draw all young people in far greater numbers into
productive economic activity. To this end, the Government has consistently
dedicated resources for youth empowerment initiatives and sought to put in place
policies that will create opportunities for our young people.
40 2019 Budget Policy Statement
184. Working in partnership with business, organized labour and community
representatives, the Government is creating opportunities for young people to be
exposed to the world of work through internships, apprenticeships, mentorship and
entrepreneurship. In particular under the Ajira Programme, the Government has
trained about 11,000 youths on online jobs. In addition, 1,200 interns have been
trained under the Presidential Digital Talent Programme.
185. To enhance skills for Youth and Women in Textile and Apparel sectors, the
Government through the National Industrial Training Authority (NITA) will train
50,000 Youth and Women engaged in the sector with a view to increasing export
and job opportunities. To ensure compliance with the Building Codes and enhance
the Government’s plan for low cost housing, basic training will be offered to
66,000 workers in various trade including: masonry, plumbing, tile laying,
electrical engineering, painting, carpentry and scaffolding. In addition, 15,000
workers, especially the youth, will be certified to be in compliance with the
National Construction Authority requirement for skilled workers in the building
trades.
186. To further support the youths, women and people with disabilities, the
Government is in the process of reforming and consolidating affirmative action
funds such as Uwezo Fund, Women Enterprise Fund, into one robust Fund whose
objective is to support enterprises owned by youth, women and persons with
disabilities. The Government will also continue to avail the 30 percent preferential
Access to Government Procurement Opportunities. Further, The Government will
continue to create a conducive environment for micro, small and medium size
enterprises (MSMEs) to thrive as they are the pillar to create jobs for our youth and
women.
187. Going forward, to empower youths, the Government will undertake
paramilitary training and service regimentation through recruitment of youth into
the National Youth Service; undertake vocational training and social
transformation; enterprise development to promoting youth economy; formulate,
implement, monitor and review youth development policies, strategies and
programmes; mainstream youth issues in all aspects of national development; and
provide technical advice to stakeholders on matters pertaining to youth
development. The Government will also undertake research on youth development
issues, disseminate research findings and design and implement appropriate
mitigation programmes; promote youth participation in environmental protection,
preservation, conservation and improvement; and establish, operationalize and
manage youth empowerment centers.
2.3.6 Entrenching Structural Reforms to Support “The Big Four” Plan
2.3.6.1 Strengthening Governance and the Fight against Corruption
188. The Government has scaled up the fight against corruption by
implementing various legal, policy and institutional reforms in order to seal the
loopholes used to embezzle public funds. To succeed in the fight against graft, the
Government has strengthened all the institutions mandated to fight against
corruption so that they may bring all corruption suspects to book in record time,
41 2019 Budget Policy Statement
instill good governance and recover corruptly acquired assets. In particular, the
Government has transformed the Judiciary by building and improving court
infrastructure across the country and recruiting more judges and magistrates.
189. To rid the public service from corruption, the Government has plugged the
gaps in procurement by aligning the public procurement processes through the
Public Procurement and Disposals Act. In addition, the Government vetted all
Procurement Heads and Heads of Accounts, to rid it off the corrupt officials in
procurement, accounting and the approval chain.
190. The Government has also extended the crackdown on corruption to all
public officers in line Ministries and State Corporations. The recent arrests and
prosecutions of persons including senior Government officials, business persons,
and ordinary Kenyans alike send a strong message that engaging in corruption
attracts dire consequences.
191. Further, the Government conducted lifestyle audits on all public officers
complementing it with a robust wealth declaration system for routine asset
disclosures. This is in line with Section 26(1) of the Public Officer Ethics Act,
which states that each state or public officer is required to bi-annually, submit to
their relevant responsible commission a declaration of income, assets and liabilities
of him/herself, spouse(s) and dependent children under the age of 18 years. In this
regard, the Government is strengthening compliance with this provision and is
putting in place mechanisms, aided by technology, for easy processing and follow
up of wealth declarations.
192. To further fight graft, the Government has improved governance across all
public institutions. The improvement in governance was also reaffirmed by the Mo
Ibrahim Index of African Governance which was released in October 2018. In the
release, Kenya was ranked position 11 in Africa and among the top 3 most
improved economies in Africa. Remarkable improvements were mainly registered
in the three categories namely: sustainable economic opportunity; human
development participation; and independence of the Judiciary.
193. Going forward, the Government will continue to strengthen various
institutions that are mandated to fight corruption in the country, support new
governance institutions at both the National and County levels, and support civic
education, transparency and accountability and the rule of law.
2.3.6.2 Deepening Public Financial Management Reforms
194. Achievement of “The Big Four” Plan hinges on prudent management of the
available public resources. As such, the Government will continue to strengthen
expenditure control and improve the efficiency of public spending through public
financial management reforms.
195. In particular, the Government will continue to curtail resources going to
lower-priority areas using the adopted zero-based budgeting approach. These
resources will be redirected to support “The Big Four” Plan programmes and other
critical sectors such as education, infrastructure, energy and social protection.
42 2019 Budget Policy Statement
196. To improve project selection, budgeting and management, a new Public
Investment Management (PIM) Unit was recently created at the National Treasury,
with the aim of establishing a framework for public investment management that
accounting units in national and county governments shall adhere to before projects
are selected for budgeting and implementation. This will ensure that priority
projects are selected and implemented on time and within budget. The PIM Unit
shall independently review large projects before they are included in the budget.
197. The PIM process will be automated to ensure operational effectiveness of
the public investment management workflow. User requirements for the Public
Investment Management Information System are currently being developed to
automate the public investment management processes. Moreover, the Cabinet is
expected to approve the PIM Regulations consistent with the recently adopted PIM
guidelines by end-June 2019.
198. Use of the Public Investment Management Information System (PIMIS)
will be mandatory for the 2020/21 budget preparation and execution. The PIM
Regulations, as a minimum, will require that all projects ideas/concepts are
subjected to the same quality assurance processes set out in the guidelines, thus
ensuring all projects selected for funding have undergone an appraisal.
Additionally, projects that have received financing will be required to adhere to
budget and timelines for delivering the expected outputs. Monitoring and
evaluation of projects will therefore be key in ensuring that service delivery is
improved, value for money is realized, and lessons documented to improve future
policy. The PIM Regulations will also require that all multi-year agreements be
subjected to a fiscal space test and be approved by the Cabinet Secretary, National
Treasury and Planning before they are included in the budget.
199. Upon approval, the Public Investment Management Regulations will be
gazetted and will require that Accounting Officers seek prior approval from the
National Treasury before entering into multi-year contracts. To improve
governance and transparency of public investments the PIMIS will generate project
data and increase dissemination of information on the award and implementation
of public investment projects in the country.
200. The Government has also revamped the public procurement process, in
order to effectively and efficiently manage public resources as provided for in the
Constitution. Already, guidelines have been issued to all Government entities,
requiring all Accounting Officers of MDAs and Parastatals to publish and publicize
all procurement contracts on their websites, the State portal and tender notice
boards.
201. Going forward, the Government will continue to fast-track consideration of
reports on budget implementation, audited accounts of the National Government,
County Governments and State Corporations; expansion of automation of public
service delivery systems; digitization of all payments for public services; review
of taxation, duty and customs frameworks to ensure predictable, fairer and
transparent tax system. These activities will go a long way in entrenching good
governance in our institutions and ensuring accountability of public resources.
43 2019 Budget Policy Statement
2.3.6.3 Fostering Financial Sector Developments and Reforms
202. The Government continues to implement measures and reforms aimed at
further deepening financial markets, enhancing access to financial services and
improving efficiency while maintaining financial stability.
203. To entrench Kenya’s position as a regional financial hub, the Government
will fast track the operationalization of Nairobi International Financial Centre
(NIFC). Towards this end, the Government is in the process of forming a Board of
Directors that will oversee the operations of the NIFC Authority. The Government
will also formulate the NIFC Regulations to implement the NIFC Act.
204. To strengthen bank supervision and regulatory framework, the Government
will strengthen implementation of risk-based supervision to enable regulators to
cope with new risks; further extend the credit reporting framework to include credit
providers from outside the financial sector; strengthen the Financial Reporting
Centre (FRC) which is critical in fighting money laundering and terrorism
financing.
205. To deepen the capital markets, the Government will continue to diversify
products and services, implement the derivatives market, commodities exchange
market, strengthen capital markets infrastructure and institutions, promote cross
border trade and lay down a framework to enable State Corporations and County
Governments to raise funds through the capital markets.
206. To exploit Kenya’s established lead in digital finance, the Government will
expedite the creation of a ‘digital money grid’ as a form of national infrastructure.
The ‘digital money grid’ will unleash a new wave of innovation to provide financial
solutions across all parts of the economy. Further, a study will be carried out on
digital finance initiatives whose recommendations will help in developing a
National Digital Finance Policy.
207. To enhance access to credit, the Government will expedite the development
of a Credit Guarantee Scheme which will enhance access to credit by Micro, Small
and Medium Enterprises and marginalized groups and regions. In view of this, the
Government will finalize the policy on Credit Guarantee Scheme to provide a
framework to guide structured implementation and development of a vibrant Credit
Guarantee Scheme that embraces a Public Private Partnership Structure. To further
enhance access to credit, the Government will expedite the full implementation of
the Movable Property Security Rights Act, 2017 to facilitate the use of movable
assets as collateral for credit facilities. The Government will also speed up the
creation of a Collateral Registry System for movable assets for the Business
Registration Services.
208. To protect consumers of financial products, the government will initiate
reforms aimed at establishing new frameworks for financial consumer protection.
This includes extending coverage of market conduct regulation to include currently
unregulated and under-regulated providers of financial products and services. The
objective is to make credit more accessible and at the same time support financial
innovation and competition.
44 2019 Budget Policy Statement
III. BUDGET FOR FY 2019/20 AND THE MEDIUM
TERM
3.1 Fiscal Framework Summary
209. The FY 2019/20 Budget framework will continue with the fiscal
consolidation policy to strengthen our debt sustainability position. With the fiscal
consolidation strategy, MDAs will have to adopt the culture of doing more with
less that is available with a view to promote sustainability and affordability.
210. Sustainability, affordability and strict prioritization are therefore expected
to be the norm rather than an exception under this strategy. To achieve this, we
need to ensure that:
Spending is directed towards the most critical needs of the country and is
well utilized;
More outputs and outcomes are achieved with existing or lower level of
resources; and
MDAs request for resources are realistic and take into account the resource
constraints, in light of the Government’s fiscal consolidation policy.
211. The fiscal framework for the FY 2019/20 Budget is based on the
Government’s policy priorities and macroeconomic policy framework set out in
Chapter I and Chapter II.
Revenue Projections
212. In the FY 2019/20 revenue collection including Appropriation-in-Aid
(A.i.A) is projected to increase to Ksh 2,080.9 billion (18.3 percent of GDP) up
from Ksh 1,831.5 billion (18.3 percent of GDP) in the FY 2018/19 (Annex Tables
2 and 3). This revenue performance will be underpinned by on-going reforms in
tax policy and revenue administration. Ordinary revenues will amount to Ksh
1,877.2 billion (16.5 percent of GDP) in FY 2019/20 up from Ksh 1,651.5 billion
(16.5 percent of GDP) in FY 2018/19.
Expenditure Projections
213. Overall expenditure and net lending for FY 2019/20 are projected at Ksh
2,710.8 billion (23.9 percent of GDP) from the estimated Ksh 2,514.4 billion (25.1
percent of GDP) in the FY 2018/19 revised budget. These expenditures comprise
among others, recurrent of Ksh 1,663.3 billion (14.7 percent of GDP) and
development of Ksh 670.7 billion (5.9 percent of GDP).
214. In terms of percentage of GDP, the wages and salaries bill for teachers and
civil servants including the police is expected to reduce to 4.1 percent of GDP in
the FY 2019/20 from 4.2 percent in the FY 2018/19. Domestic interest payments
are expected to decline to 2.5 percent of GDP in the FY 2019/20 from 2.7 percent
of GDP in FY 2018/19.
215. The ceiling for development expenditures (inclusive of conditional
transfers to county governments) including foreign financed projects (excluding
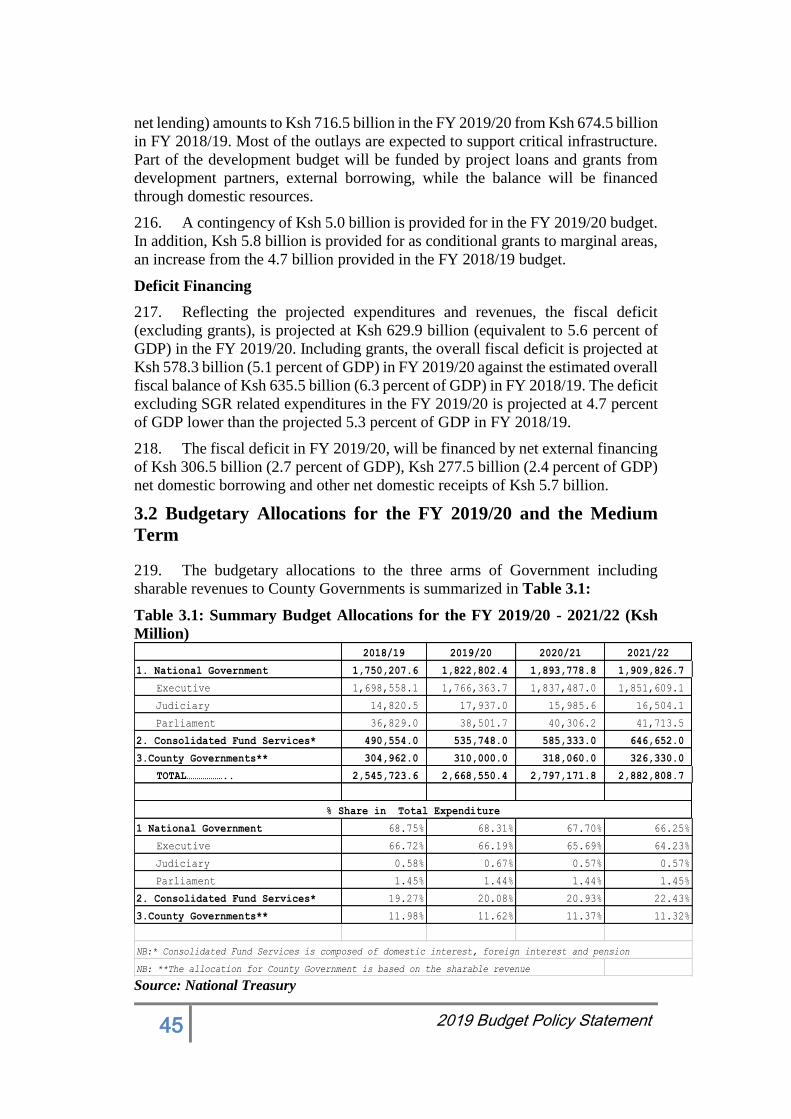
45 2019 Budget Policy Statement
net lending) amounts to Ksh 716.5 billion in the FY 2019/20 from Ksh 674.5 billion
in FY 2018/19. Most of the outlays are expected to support critical infrastructure.
Part of the development budget will be funded by project loans and grants from
development partners, external borrowing, while the balance will be financed
through domestic resources.
216. A contingency of Ksh 5.0 billion is provided for in the FY 2019/20 budget.
In addition, Ksh 5.8 billion is provided for as conditional grants to marginal areas,
an increase from the 4.7 billion provided in the FY 2018/19 budget.
Deficit Financing
217. Reflecting the projected expenditures and revenues, the fiscal deficit
(excluding grants), is projected at Ksh 629.9 billion (equivalent to 5.6 percent of
GDP) in the FY 2019/20. Including grants, the overall fiscal deficit is projected at
Ksh 578.3 billion (5.1 percent of GDP) in FY 2019/20 against the estimated overall
fiscal balance of Ksh 635.5 billion (6.3 percent of GDP) in FY 2018/19. The deficit
excluding SGR related expenditures in the FY 2019/20 is projected at 4.7 percent
of GDP lower than the projected 5.3 percent of GDP in FY 2018/19.
218. The fiscal deficit in FY 2019/20, will be financed by net external financing
of Ksh 306.5 billion (2.7 percent of GDP), Ksh 277.5 billion (2.4 percent of GDP)
net domestic borrowing and other net domestic receipts of Ksh 5.7 billion.
3.2 Budgetary Allocations for the FY 2019/20 and the Medium
Term
219. The budgetary allocations to the three arms of Government including
sharable revenues to County Governments is summarized in Table 3.1:
Table 3.1: Summary Budget Allocations for the FY 2019/20 - 2021/22 (Ksh
Million)
Source: National Treasury
2018/19 2019/20 2020/21 2021/22
1. National Government 1,750,207.6 1,822,802.4 1,893,778.8 1,909,826.7
Executive 1,698,558.1 1,766,363.7 1,837,487.0 1,851,609.1
Judiciary 14,820.5 17,937.0 15,985.6 16,504.1
Parliament 36,829.0 38,501.7 40,306.2 41,713.5
2. Consolidated Fund Services* 490,554.0 535,748.0 585,333.0 646,652.0
3.County Governments** 304,962.0 310,000.0 318,060.0 326,330.0
TOTAL……………….. 2,545,723.6 2,668,550.4 2,797,171.8 2,882,808.7
1 National Government 68.75% 68.31% 67.70% 66.25%
Executive 66.72% 66.19% 65.69% 64.23%
Judiciary 0.58% 0.67% 0.57% 0.57%
Parliament 1.45% 1.44% 1.44% 1.45%
2. Consolidated Fund Services* 19.27% 20.08% 20.93% 22.43%
3.County Governments** 11.98% 11.62% 11.37% 11.32%
NB:* Consolidated Fund Services is composed of domestic interest, foreign interest and pension
NB: **The allocation for County Government is based on the sharable revenue
% Share in Total Expenditure
46 2019 Budget Policy Statement
Key Priorities for the 2019/20 Medium Term Budget
220. The Medium-Term Budget 2019/20 – 2021/22 will further support the
ongoing priorities for the achievement of the “Big Four” Plan taking into account:
Responsible management of public resources;
Building a resilient, more productive and competitive green economy;
Delivering better public services within a tight fiscal environment; and
The need to deepen governance, anti-corruption and public financial
management reforms to guarantee transparency, accountability and
efficiency in public spending.
Allocation Baseline Ceilings
221. The baseline estimates reflect the current ministerial spending levels in
sector programmes. In the recurrent expenditure category, non-discretionary
expenditures take first charge. These include payment of public debts and interest
therein, salaries for Constitutional office holder and pensions.
222. Development expenditures have been shared out on the basis of the flagship
projects in Vision 2030, “The Big Four” Plan and the MTP III priorities. The
following criteria was used in apportioning capital budget:
On-going projects: emphasis was given to completion of on-going capital
projects and in particular infrastructure projects with high impact on
poverty reduction, equity and employment creation.
Counterpart funds: priority was also given to adequate allocations for
donor counterpart funds which is the portion that the Government must
finance in support of the projects financed by development partners.
Strategic policy interventions: further priority was given to policy
interventions covering the entire nation, regional integration, social equity
and environmental conservation.
Finalization of Spending Plans
223. The finalization of the detailed budgets will entail thorough scrutiny to
curtail spending on non-productive areas and ensure resources are directed to
priority programmes. Since detailed budgets are scrutinized and the resource
envelope firmed up, in the event that additional resources become available,
Government will utilize them to accommodate key national strategic priorities.
Specifically, the following will receive priority:
Interventions identified during the stakeholders consultation for the FY
2019/20 budget and over the medium term
Strategic interventions in the areas of manufacturing, food security
enhancing programmes, affordable housing, health coverage and public
facilities and other policy interventions to enhance regional integration and
social equity; and
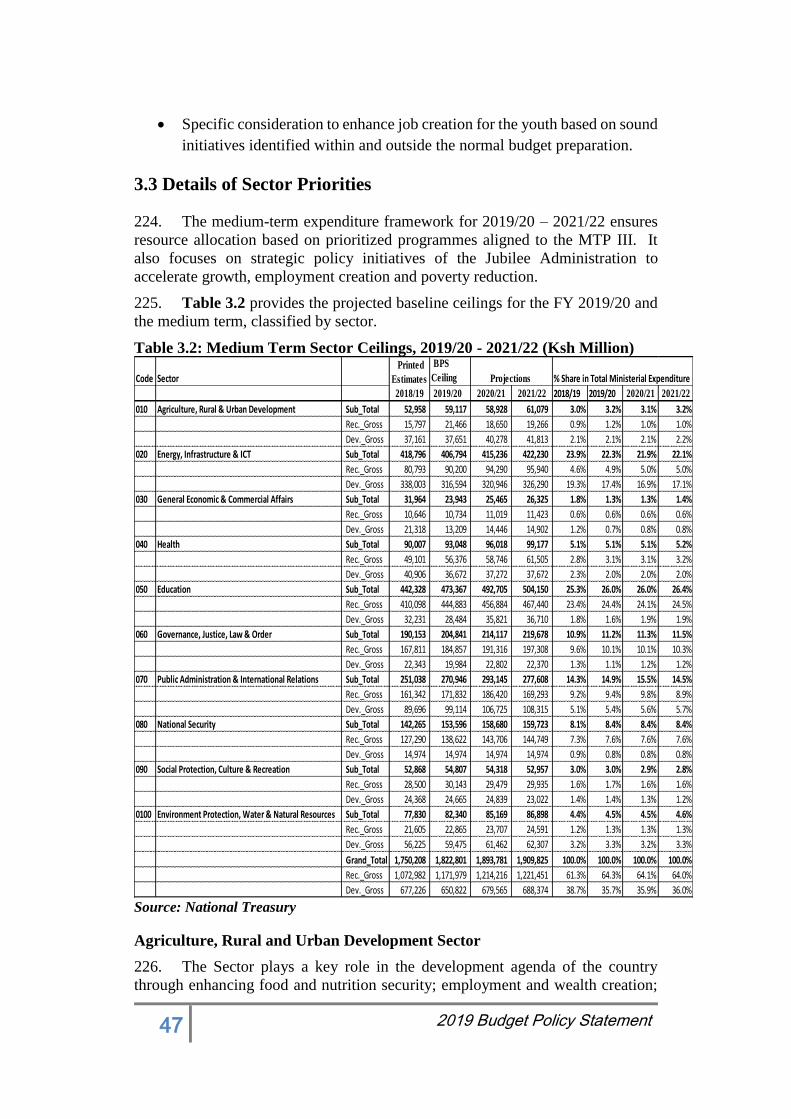
47 2019 Budget Policy Statement
Specific consideration to enhance job creation for the youth based on sound
initiatives identified within and outside the normal budget preparation.
3.3 Details of Sector Priorities
224. The medium-term expenditure framework for 2019/20 – 2021/22 ensures
resource allocation based on prioritized programmes aligned to the MTP III. It
also focuses on strategic policy initiatives of the Jubilee Administration to
accelerate growth, employment creation and poverty reduction.
225. Table 3.2 provides the projected baseline ceilings for the FY 2019/20 and
the medium term, classified by sector.
Table 3.2: Medium Term Sector Ceilings, 2019/20 - 2021/22 (Ksh Million)
Source: National Treasury
Agriculture, Rural and Urban Development Sector
226. The Sector plays a key role in the development agenda of the country
through enhancing food and nutrition security; employment and wealth creation;
Code Sector
BPS
Ceiling % Share in Total Ministerial Expenditure
2019/20 2020/21 2021/22 2018/19 2019/20 2020/21 2021/22
010 Agriculture, Rural & Urban Development Sub_Total 52,958 59,117 58,928 61,079 3.0% 3.2% 3.1% 3.2%
Rec._Gross 15,797 21,466 18,650 19,266 0.9% 1.2% 1.0% 1.0%
Dev._Gross 37,161 37,651 40,278 41,813 2.1% 2.1% 2.1% 2.2%
020 Energy, Infrastructure & ICT Sub_Total 418,796 406,794 415,236 422,230 23.9% 22.3% 21.9% 22.1%
Rec._Gross 80,793 90,200 94,290 95,940 4.6% 4.9% 5.0% 5.0%
Dev._Gross 338,003 316,594 320,946 326,290 19.3% 17.4% 16.9% 17.1%
030 General Economic & Commercial Affairs Sub_Total 31,964 23,943 25,465 26,325 1.8% 1.3% 1.3% 1.4%
Rec._Gross 10,646 10,734 11,019 11,423 0.6% 0.6% 0.6% 0.6%
Dev._Gross 21,318 13,209 14,446 14,902 1.2% 0.7% 0.8% 0.8%
040 Health Sub_Total 90,007 93,048 96,018 99,177 5.1% 5.1% 5.1% 5.2%
Rec._Gross 49,101 56,376 58,746 61,505 2.8% 3.1% 3.1% 3.2%
Dev._Gross 40,906 36,672 37,272 37,672 2.3% 2.0% 2.0% 2.0%
050 Education Sub_Total 442,328 473,367 492,705 504,150 25.3% 26.0% 26.0% 26.4%
Rec._Gross 410,098 444,883 456,884 467,440 23.4% 24.4% 24.1% 24.5%
Dev._Gross 32,231 28,484 35,821 36,710 1.8% 1.6% 1.9% 1.9%
060 Governance, Justice, Law & Order Sub_Total 190,153 204,841 214,117 219,678 10.9% 11.2% 11.3% 11.5%
Rec._Gross 167,811 184,857 191,316 197,308 9.6% 10.1% 10.1% 10.3%
Dev._Gross 22,343 19,984 22,802 22,370 1.3% 1.1% 1.2% 1.2%
070 Public Administration & International Relations Sub_Total 251,038 270,946 293,145 277,608 14.3% 14.9% 15.5% 14.5%
Rec._Gross 161,342 171,832 186,420 169,293 9.2% 9.4% 9.8% 8.9%
Dev._Gross 89,696 99,114 106,725 108,315 5.1% 5.4% 5.6% 5.7%
080 National Security Sub_Total 142,265 153,596 158,680 159,723 8.1% 8.4% 8.4% 8.4%
Rec._Gross 127,290 138,622 143,706 144,749 7.3% 7.6% 7.6% 7.6%
Dev._Gross 14,974 14,974 14,974 14,974 0.9% 0.8% 0.8% 0.8%
090 Social Protection, Culture & Recreation Sub_Total 52,868 54,807 54,318 52,957 3.0% 3.0% 2.9% 2.8%
Rec._Gross 28,500 30,143 29,479 29,935 1.6% 1.7% 1.6% 1.6%
Dev._Gross 24,368 24,665 24,839 23,022 1.4% 1.4% 1.3% 1.2%
0100 Environment Protection, Water & Natural Resources Sub_Total 77,830 82,340 85,169 86,898 4.4% 4.5% 4.5% 4.6%
Rec._Gross 21,605 22,865 23,707 24,591 1.2% 1.3% 1.3% 1.3%
Dev._Gross 56,225 59,475 61,462 62,307 3.2% 3.3% 3.2% 3.3%
Grand_Total 1,750,208 1,822,801 1,893,781 1,909,825 100.0% 100.0% 100.0% 100.0%
Rec._Gross 1,072,982 1,171,979 1,214,216 1,221,451 61.3% 64.3% 64.1% 64.0%
Dev._Gross 677,226 650,822 679,565 688,374 38.7% 35.7% 35.9% 36.0%
Projections
Printed
Estimates
2018/19
48 2019 Budget Policy Statement
foreign exchange earnings; security of land tenure and land management. In 2017,
it is estimated that the Sector contributed 29.7 percent of the GDP valued about at
about Ksh 2.342 trillion through linkages with manufacturing, distribution and
other service-related sectors.
227. Key achievements in the Sector during the 2015/16 – 2017/18 Medium-
Term period were: provision of 486,426 metric tonnes of subsidized fertilizer that
benefitted 1.9 million farmers; building up of reserves by 5.1 million metric tonnes
of grains and 1,289 metric tonnes of powdered milk; acquiring and distribution of
78 tractors with associated implements, cumulatively 10 technologies on
conservation agriculture and release of 176 tested crop varieties in the crops sub-
Sector; development and enactment of the Fisheries Management and
Development Act 2016; reflagging of five deep sea fishing vessels including the
Offshore Patrol Vessel (PV Doria) for surveillance of deep sea fishing,
construction of fish quality control laboratories in Nairobi, Kisumu and Mombasa.
228. Key outcomes expected to be achieved in period 2019/20-2021/22 include:
improved land management for sustainable development; enhanced livestock
resource management and development; increase agricultural productivity and
outputs; increased food security and income; conducive environment for
sustainable development of the blue economy; increased per capita water storage
capacity for irrigation; and improved agricultural research for socio-economic
development and industrialization.
229. To realize these outcomes, the Sector has been allocated Ksh 59.1 billion,
58.9 billion and Ksh. 61.1 billion in FY 2019/20, FY 2020/21 and FY 2021/22,
respectively. The Sector has also prioritized implementation of “The Big Four”
Plan initiatives.
Energy, Infrastructure and Information, Communication and Technology
Sector
230. The Sector aims to sustain and expand cost-effective public utility
infrastructure facilities and services in the areas of energy, maritime, transport,
petroleum, ICT in line with the priorities in the Constitution of Kenya and the MTP
III. Sustaining and expanding physical infrastructure is geared towards the
realization of “The Big Four” Plan.
231. During the period under review, some of the key achievements in the Sector
include; construction of 2,388 km of new roads, rehabilitation of 359 km of roads,
and construction of 62 bridges; 100 percent completion of the Standard Gauge
Railway (SGR) Phase 1 and 85 percent completion of SGR Phase 2A, completion
of JKIA Terminal 1A, 1E and Terminal 2; new Ferry at Likoni Mombasa procured
(MV Jambo); 47 percent completion of the First three Berths (LAPSSET Project)
at port of Lamu and conducted 2 awareness campaigns on the opportunities in the
maritime sector. The Sector also laid 2,100 km of fiber optic under National Optic
Fibre Backbone Infrastructure (NOFBI) Phase II, trained 11,000 youths under
Ajira Kenya Initiative, and 1,200 interns under the Presidential Digital Talent
Programme. Further, the Sector generated 25MW geothermal energy, completed
11,803 km of transmission lines, completed 55 distribution substations, installed
49 2019 Budget Policy Statement
113,204 street lighting points, and connected 3,173,684 customers to electricity;
and trucked 4,217 barrels of crude oil from Turkana to Kipevu.
232. Over the 2019/20-2021/22 MTEF period: the Sector plans to construct of
500,000 housing units; construct of 8,245 km of roads, 150 bridges, rehabilitate
763km of roads, and maintenance of 114,131 km of roads; complete the first 3
berths at Lamu Port; completion of SGR Phase 2A; rehabilitate 1 workshop of
Bandari Collage; fast track completion of the Phase 2 of the Second Container
Terminal at Mombasa Port and projects in the LAPSSET corridor, speed-up
implementation of the Integrated Security System in Kenya Ferry Services and
restructuring of the Kenya National Shipping Line, and fast track implementation
of 2nd Generation Smart Card Driving License and expand airstrips. The Sector
also targets to generate 649.5 MW of power; construct 1,432km of electricity
transmission lines; connect 2 million new customers to electricity, install 5,398
new transformers; drill 270 oil wells, produce 600,000 barrels of oil, distribute
20,482 metric tonnes of oil and gas and construct Kipevu Oil Terminal (KOT).
Further, the Sector will complete the laying of fibre under NoFBI Phase II
Expansion; complete Konza Complex; and implementation of Horizontal
Infrastructure in Phase 1 at Konza Technopolis.
233. In order to implement the prioritized programs, the Sector has been
allocated Ksh 406.8 billion, Ksh 415.2 billion and Ksh 422.2 billion for the FY
2019/20, FY 2020/21 and FY 2021/22 respectively.
General Economic and Commerce Affairs Sector
234. The Sector is mandated to promote, co-ordinate and implement integrated
socio-economic policies and programmes for a rapidly industrializing economy.
235. During the FY 2015/16 - 2017/18 MTEF, key achievements realized in the
Sector included; increased farm earnings from Ksh 23 to Ksh 35 per liter of milk;
facilitated the growth in value of exports from Ksh 581.04 billion in 2015 to Ksh
594 billion in 2017; enforced Anti-Counterfeit measures in the major towns of
Nairobi, Mombasa and Kisumu; international arrivals grew by 13.5 percent from
1.18 million in 2015 to stand at 1.45 million in 2017 thereby increasing tourism
earnings by 20.3 percent from Ksh 84.6 billion in 2015 to Ksh 119.9 billion in
2017; harmonized EAC Regional Standards to facilitate trade; successfully
negotiated and finalized Bills on establishment of EAC Monetary Institute and
EAC Statistics Bureau; and commissioned the Keroka Water Supply project that
supplies water to residents of Nyamira and Kisii Counties.
236. In the 2019/20 - 2021/22 MTEF period, the Sector plans to among others:
acquire equipment and machinery for the New KCC; expand dairy processing
plants (powdered milk); implement the Co-operative Management Information
System; further improve on the ease of doing business; acquire the Regional Anti-
Counterfeit Agency Exhibit Warehouses; and establish the Commodities Exchange
Platform. The Sector will also develop the Kinanie Leather Industrial Park;
complete and operationalize of Ewaso Ng’iro Tannery and Leather Factory with
processing capacity of 4000 Tons of hides & skins annually; establish Leather
Products Production Centre and Centres of Excellence; develop Athi River Textile
hub; construct Industrial Research Laboratories in Kisumu and South B; provide
50 2019 Budget Policy Statement
credit to MSMEs in manufacturing Sector; and construct Constituency Industrial
Development Centers. Further, the Sector will: promote tourism; improve
implementation of the EAC Customs Union, Common Market and Monetary
Union Protocols; and operationalize Regional Integration Centres (RICs) at One
Stop Border Posts in Malaba, Taita Taveta and Isebania
237. In order to implement the prioritized programmes, the Sector has been
allocated Ksh 23.9 billion, Ksh 25.5 billion and Ksh 26.3 billion in the FY 2019/20,
FY 2020/21 and FY 2021/22 respectively.
Health Sector
238. Health is a shared function between the National Government and County
Governments. The Sector is responsible for the provision and coordination of the
health services which contributes to the overall productivity and economic
development of the country.
239. For the 2015/16-2017/18 MTEF period, the Sector realized the following
achievements among others; implemented interventions to control the spread of
HIV/AIDS, malaria and tuberculosis in the country which has seen 84 percent of
public health facilities been equipped with diagnostic capacity for malaria and an
increase in the number of tuberculosis cases notified. Similarly, there was an
increase in the diagnosis of non-communicable diseases including hypertension,
diabetes and cancer. Other achievements include: completion of the construction
of Phase I of the Cancer Centre of Excellence and 95 percent completion of the
Surgical Day Care Centre at the Kenyatta National Hospital (KNH); construction
of the Chandaria Cancer and Chronic Diseases Centre at the Moi Teaching and
Referral Hospital (MTRH); and upgraded 98 public hospitals by installing
diagnostic and treatment equipment to improve access to specialized services
countrywide. The Government has also expanded social health protection by
implementing the Linda Mama Programme targeting maternal deliveries and their
infants.
240. During the 2019/20-2021/22 MTEF period, the Sector will prioritize
provision of the universal health coverage to all Kenyans. Particular emphasis will
be placed on the reduction of the health financial burden to the households to
enable them attain the highest standard of health care. To achieve this, the Sector
will scale up universal health initiatives including the Linda Mama, subsidies for
the poor, elderly and vulnerable groups, persons with mental illness, secondary
school children and the informal Sector. The Sector will also continue to expand
the health infrastructure including: expanding specialized medical equipment and
establish centers of excellence in health, health commodity storage centers, new
specialized health facilities and laboratories throughout the country.
241. In order to implement the prioritized programmes, the Sector has been
allocated Ksh 93.0 billion, Ksh 96.0 billion and Ksh 99.2billion for the FY
2019/2020, FY 2020/2021 and FY 2021/2022 respectively.
Education Sector
242. The Sector is committed to the provision of quality education, training,
science, technology, research and skills development to all Kenyans, in order to
51 2019 Budget Policy Statement
contribute to the building of a just and cohesive society that enjoys inclusive and
equitable social-economic development.
243. During the FY 2015/16 - 2017/18 MTEF period, the Sector made several
achievements including: increased completion rate at primary level from 82.7
percent in 2015 to 84 percent in 2017 and increased the transition rate from primary
to secondary school level from 81.9 percent in 2015 to 88 percent in 2018 January.
On curriculum reforms, the Sector developed 30 curriculum designs for grade 1&2
preprimary and grade 1, 2, & 3 in lower primary in 2016/17; developed 31
curriculum designed and adopted 21 designs for Special Needs Education (SNE)
2017/18; piloted phase 1& 2 in 470 schools across the country; and finalized
Competence Based Education and Training (CBET) curriculum development
standards framework and developed 41 CBET curricula.
244. For the FY 2019/20 - 2021/22 MTEF period, the Sector has prioritized
several programmes for implementation including: recruitment of additional
teachers to support the 100 percent transition policy of the Government; continued
support to Free Primary Education and Free Day Secondary Education through
increased capitation; continued support to Special Needs Education (SNE) through
increased capitation to SNE learners; provision of Examination Fees for all
students in KCPE and KCSE. The Sector will also complete the ongoing
construction and equipment of TTIs and support university education in public and
private universities in order to equip the youth with relevant skills required to drive
the industrialization agenda.
245. In order to implement the prioritized programmes, the Sector has been
allocated Ksh 473.4 billion, Ksh 492.7 billion and Ksh 504.2 billion for the FY
2019/2020, FY 2020/2021 and FY 2021/2022, respectively.
Governance, Justice, Law and Order Sector
246. The Sector plays a key role by establishing and maintaining a favorable
environment for economic, social and political development of the country as
expressed in the political pillar of the Kenya Vision 2030.
247. During the 2015/16 - 2017/18 MTEF, the Sector recorded notable
achievements including: the acquisition of assorted security equipment;
construction of the national forensic laboratory; provision of housing units for
police and prison officers; execution of the 2017 General Elections; enhanced
mobility for police and administrative officers; enhanced surveillance system
especially in Nairobi and Mombasa & their environs and prisons; corruption
prevention and asset recovery, prosecution of criminal offences and expansion of
courts in Counties. The Sector also facilitated drafting various legislations to
harmonize existing laws with the Constitution and continued to promote national
values and cohesion.
248. For the FY 2019/20 - 2021/22 MTEF period, some of the key outputs
planned include: implementation of police reforms; equipping of the Forensic Lab;
acquisition of additional assorted security equipment; installation of CCTV
cameras in Nairobi, Mombasa and its environs, Kisumu, Nakuru and Eldoret;
52 2019 Budget Policy Statement
improved population management system and production of 3rd generation ID
cards, enhancement of accountability and governance structures.
249. To achieve this, the Sector has been allocated Ksh 204.8 billion, Ksh 214.1
billion and Ksh 219.7 billion for FY 2019/20, FY 2020/21 and FY 2021/22,
respectively. This includes allocation for the Judiciary.
Public Administration and International Relations Sector
250. The Sector provides overall policy direction and leadership to the country,
oversee the human resource function in the public service, coordinate national
policy formulation and implementation, resource mobilization, allocation and
management, strengthening the devolved system of government, coordinating
implementation of youth policy and mainstreaming in national development,
implementation of the Kenya foreign policy as well as oversight, monitoring,
evaluation and reporting on the use of public resources and service delivery.
251. A total of 32 programmes were implemented within the sector during the
MTEF period 2015/16 - 2017/18. Tremendous progress was made in achievement
of the sector’s set targets. These include the following among others: development
of country's medium term development plans; preparation of various statistical
publications and reports; operationalization of new embassies; provision of
capacity building and technical assistance to county governments, resource
mobilisation, allocation and oversight in the public sector; established and
operationalized Huduma centres; implementation of performance management
systems, continued improvement of civil servants welfare, ensuring equitable
revenue sharing between National and County Governments and among county
governments; and resolving of public complaints on maladministration
252. In the FY 2019/20 and the medium term, the Sector will focus on enhancing
advisory on public policy for effective management of public affairs; and
continued implementation and strengthening of the devolved system of
government to promote harmonious inter- and intra-governmental relations;
strengthening management of humanitarian support services; promoting foreign
relations for stronger diplomatic engagements and improvement on international
trade and Foreign Direct Investments; managing the Government’s finances
efficiently and effectively for macroeconomic stability and economic growth;
strengthening oversight on management of public resources for effective service
delivery; providing reliable and effective Monitoring and Evaluation system to
track implementation of development policies, strategies, programmes and
projects; strengthening linkages between policy formulation, planning and
budgeting at all levels; enhancing empowerment and participation of youth and
other vulnerable groups in all aspects of national development; and strengthening
Human Resource Management and Development in the public service among
others.
253. In order to achieve its targets in the financial year 2019/20 and the medium
term the sector has been allocated Ksh 270.9 billion, Ksh 293.1billion and Ksh
277.6 billion for FY 2019-20, FY 2020/2021 and FY 2021/2022 respectively. This
includes allocation for the Parliament.
53 2019 Budget Policy Statement
National Security
254. The Sector is key in creating a secure and conducive environment for socio-
economic and political development. The sector entails promoting a cohesive,
egalitarian, technologically efficient and progressive society with a good quality of
life. It is therefore a critical enabler in the realization of the “Big Four” Plan.
255. The Sector will continue to address contemporary and emerging threats to
national security that undermine peace and development. These include terrorism,
radicalization, human and drug trafficking, money laundering, cyber-crime and
other socio-economic and political challenges.
256. In order to implement the prioritized programmes and minimize the above
mentioned threats, the sector has been allocated Ksh 153.6 billion, Ksh 158.7
billion and Ksh 159.7 billion in FY 2019/20, FY 2020/21 and FY 2021/22
respectively.
Social Protection, Culture and Recreation Sector
257. The Sector is mandated to promote sustainable employment, best labour
practices, sports, gender equity, empowerment of communities and vulnerable
groups, diverse cultures, heritage and arts.
258. During the FY 2015/16 – 2017/18 MTEF period, the key achievements in
the Sector included; provision of 74,400 metric tonnes of relief food to 3.5 million
food insecure persons in 23 ASAL Counties; provision of cash transfers to 100,000
households (600,000 beneficiaries) annually under regular Hunger and Safety Net
Programme (HSNP); provision of cash transfers to 1,233,000 households annually
(833,000 older persons 353,000, orphans and vulnerable children and 47,000
person with severe disabilities) under the Inua Jamii Programme; provision of 2.9
million school girls with sanitary towels to reduce girls absenteeism in schools;
trained 2,927 duty bearers and stakeholders in response and prevention of Gender
Based Violence.
259. The Sector also upgraded Moi Sports Stadium-Kasarani and Nyayo
National stadium; presented 120 teams in international and regional sports
competitions where Kenya won 289 medals and hosted 17 international
competitions; trained 3,157 talented youth on various sports disciplines, registered
83 sports organization and licensed 20 professional sports persons; carried out
2,231 anti-doping tests and sensitized 61,448 athletes on anti-doping; empowered
1,712 cultural practitioners to improve access to markets for enhanced livelihood;
honored 390 heroes and heroines; and nurtured 2,230 youth in music and dance for
self-reliance. Further, the Sector established Labour Attachee offices in Qatar,
United Arabs Emirates and Saudi Arabia; developed and launched the Kenya
Labour Market Information System (KLMIS); trained 104,804 people in relevant
industrial skills; and certified 144,905 trade test candidates
260. In the 2019/20 – 2021/22 MTEF period, the Sector will implement various
initiatives including: carry out 1,700 drought resilience and preparedness projects
in ASAL Counties; support 130,000 vulnerable and drought prone households
through cash transfers annually; provide sanitary towels to 11.1 million school
54 2019 Budget Policy Statement
going girls to reduce absenteeism in school; host and participate in national,
regional and international sports competitions; continue developing and upgrading
sports infrastructure (national and regional stadia); empower 7,500 cultural artists/
practitioners; honor 480 heroes and heroines; nurture 3,300 youth in music and
dance; establish an Alternative Dispute Resolution (ADR) Mechanism for labour
and employment related disputes; and sensitize 303,500 people in prevention and
response to Gender Based Violence and FGM.
261. In order to implement the prioritized programmes, the Sector has been
allocated Ksh 54.8 billion, Ksh 54.3 billion and Ksh 52.9 billion for the FY
2019/2020, FY 2020/2021 and FY 2021/2022, respectively.
Environment Protection, Water and Natural Resources
262. The Sector plays a crucial role in the economy as it contribute immensely
to life support systems by providing goods and services that are critical enablers
for the realization of the “Big Four” Plan. Investment in this Sector also ensures
the delivery of direct and indirect goods and services that are the backbone for the
main productive Sectors namely agriculture, tourism, energy and manufacturing.
263. For the 2018/19 to 2020/21 MTEF period, the Sector has prioritized
programmes intended to; provide policy and legal framework for efficient and
effective management of the environment (Green Economy Strategy Plan, National
Climate Change Action Plan and National Biodiversity Strategy and Action Plan);
sustainably manage and conserve environment and water resources; provide
reliable weather and climate information for decision making; sustainably manage
and conserve forests and water towers; sustainably conserve and manage Kenya’s
wildlife; provide policy and legal framework for efficient and effective
management of the natural resources; increase availability of safe and adequate
water resources; enhance accessibility of water and sewerage services; enhance
utilization of land through irrigation, drainage and land reclamation; and increase
per capita water storage capacity for irrigation and other uses.
264. In order to implement the prioritized programmes, the Sector has been
allocated Ksh 82.3 billion, Ksh 85.2 billion and Ksh 86.9 billion for the FY
2018/2019, FY 2019/2020 and FY 2020/2021, respectively.
Programme Performance Information for 2019/20 - 2021/22 MTEF Period
265. Annex Table 4a of this BPS provides a summary of expenditures by
programmes for the 2019/20 – 2021/22 period
266. Annex Table 4b of this BPS provides a detailed report with information on
programmes outputs, key performance indicators, and the set targets for the
2019/20 – 2021/22 period.
55 2019 Budget Policy Statement
3.4 Public Participation/ Sector Hearings and Involvement of Stakeholders 267. The law requires that the input of the public be taken into account before
the Budget proposals are firmed up. In this regard, Public Hearings for the FY
2019/20 Budget were held between 4th and 6th December 2018. Annex Table 6
provides a summary of policy issues raised during the Public Hearings and the
responses.
268. Further, as required by the Public Finance Management (PFM) Act, 2012
this BPS was shared with various stakeholders and the public for comments before
finalization. Annex Table 7 provides a summary of the comments received and
the actions taken and or response given.
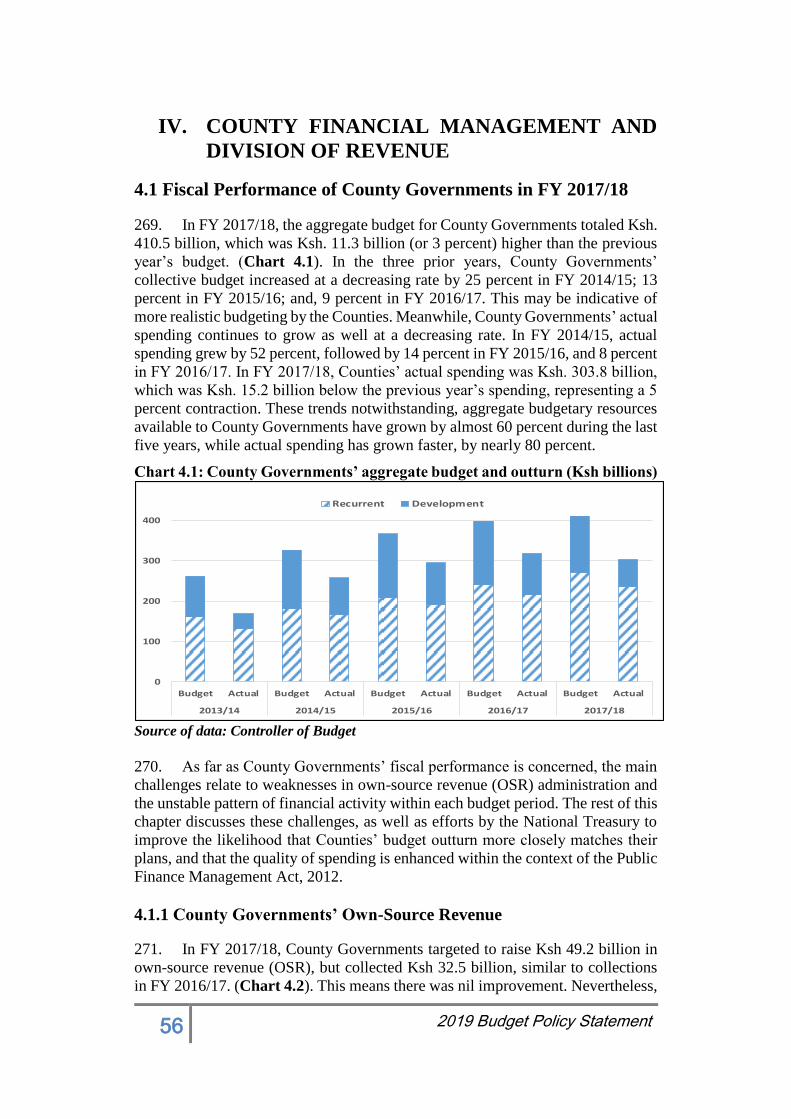
56 2019 Budget Policy Statement
IV. COUNTY FINANCIAL MANAGEMENT AND
DIVISION OF REVENUE
4.1 Fiscal Performance of County Governments in FY 2017/18
269. In FY 2017/18, the aggregate budget for County Governments totaled Ksh.
410.5 billion, which was Ksh. 11.3 billion (or 3 percent) higher than the previous
year’s budget. (Chart 4.1). In the three prior years, County Governments’
collective budget increased at a decreasing rate by 25 percent in FY 2014/15; 13
percent in FY 2015/16; and, 9 percent in FY 2016/17. This may be indicative of
more realistic budgeting by the Counties. Meanwhile, County Governments’ actual
spending continues to grow as well at a decreasing rate. In FY 2014/15, actual
spending grew by 52 percent, followed by 14 percent in FY 2015/16, and 8 percent
in FY 2016/17. In FY 2017/18, Counties’ actual spending was Ksh. 303.8 billion,
which was Ksh. 15.2 billion below the previous year’s spending, representing a 5
percent contraction. These trends notwithstanding, aggregate budgetary resources
available to County Governments have grown by almost 60 percent during the last
five years, while actual spending has grown faster, by nearly 80 percent.
Chart 4.1: County Governments’ aggregate budget and outturn (Ksh billions)
Source of data: Controller of Budget
270. As far as County Governments’ fiscal performance is concerned, the main
challenges relate to weaknesses in own-source revenue (OSR) administration and
the unstable pattern of financial activity within each budget period. The rest of this
chapter discusses these challenges, as well as efforts by the National Treasury to
improve the likelihood that Counties’ budget outturn more closely matches their
plans, and that the quality of spending is enhanced within the context of the Public
Finance Management Act, 2012.
4.1.1 County Governments’ Own-Source Revenue
271. In FY 2017/18, County Governments targeted to raise Ksh 49.2 billion in
own-source revenue (OSR), but collected Ksh 32.5 billion, similar to collections
in FY 2016/17. (Chart 4.2). This means there was nil improvement. Nevertheless,
0
100
200
300
400
Budget Actual Budget Actual Budget Actual Budget Actual Budget Actual
2013/14 2014/15 2015/16 2016/17 2017/18
Recurrent Development
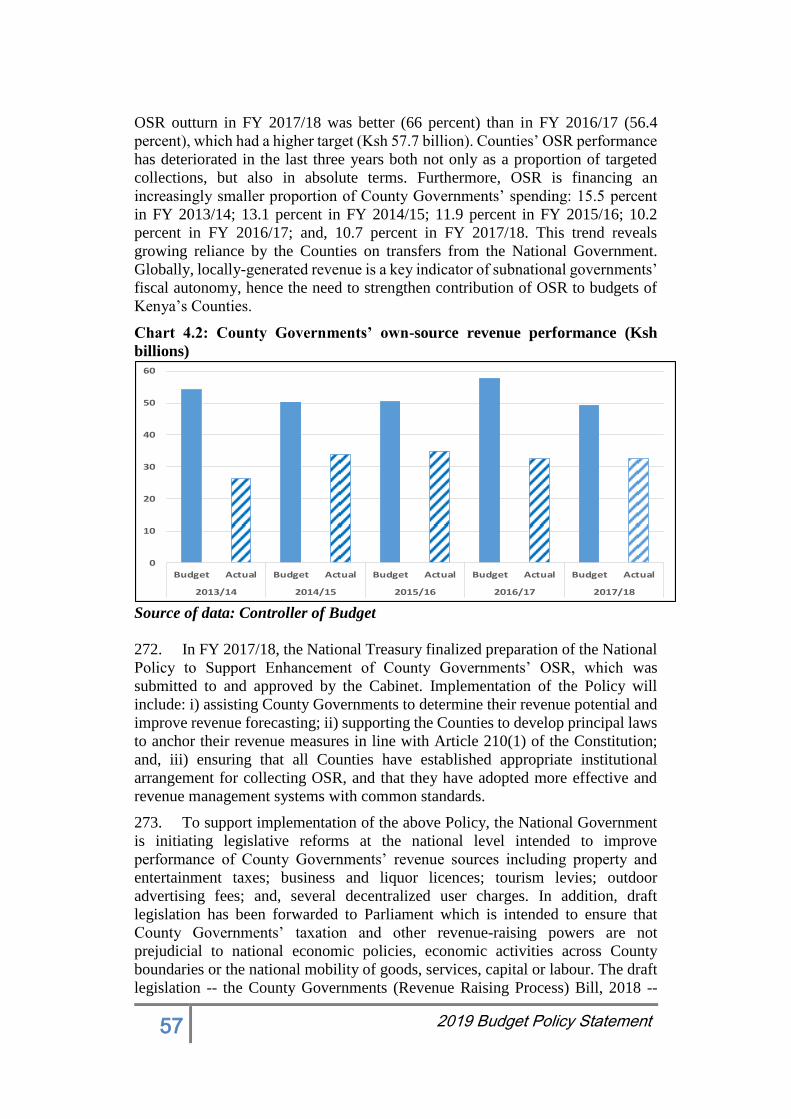
57 2019 Budget Policy Statement
OSR outturn in FY 2017/18 was better (66 percent) than in FY 2016/17 (56.4
percent), which had a higher target (Ksh 57.7 billion). Counties’ OSR performance
has deteriorated in the last three years both not only as a proportion of targeted
collections, but also in absolute terms. Furthermore, OSR is financing an
increasingly smaller proportion of County Governments’ spending: 15.5 percent
in FY 2013/14; 13.1 percent in FY 2014/15; 11.9 percent in FY 2015/16; 10.2
percent in FY 2016/17; and, 10.7 percent in FY 2017/18. This trend reveals
growing reliance by the Counties on transfers from the National Government.
Globally, locally-generated revenue is a key indicator of subnational governments’
fiscal autonomy, hence the need to strengthen contribution of OSR to budgets of
Kenya’s Counties.
Chart 4.2: County Governments’ own-source revenue performance (Ksh
billions)
Source of data: Controller of Budget
272. In FY 2017/18, the National Treasury finalized preparation of the National
Policy to Support Enhancement of County Governments’ OSR, which was
submitted to and approved by the Cabinet. Implementation of the Policy will
include: i) assisting County Governments to determine their revenue potential and
improve revenue forecasting; ii) supporting the Counties to develop principal laws
to anchor their revenue measures in line with Article 210(1) of the Constitution;
and, iii) ensuring that all Counties have established appropriate institutional
arrangement for collecting OSR, and that they have adopted more effective and
revenue management systems with common standards.
273. To support implementation of the above Policy, the National Government
is initiating legislative reforms at the national level intended to improve
performance of County Governments’ revenue sources including property and
entertainment taxes; business and liquor licences; tourism levies; outdoor
advertising fees; and, several decentralized user charges. In addition, draft
legislation has been forwarded to Parliament which is intended to ensure that
County Governments’ taxation and other revenue-raising powers are not
prejudicial to national economic policies, economic activities across County
boundaries or the national mobility of goods, services, capital or labour. The draft
legislation -- the County Governments (Revenue Raising Process) Bill, 2018 --
0
10
20
30
40
50
60
Budget Actual Budget Actual Budget Actual Budget Actual Budget Actual
2013/14 2014/15 2015/16 2016/17 2017/18
58 2019 Budget Policy Statement
which fulfils Article 209(5) of the Constitution, was approved by Cabinet
alongside the Policy mentioned above, and has been submitted to Parliament.
274. In FY 2017/18, the National Treasury undertook an Own-Source Revenue
Potential and Tax Gap Study of Kenya’s County Governments. The study aimed
to: i) map out Counties’ local revenue base and potential; ii) support more credible
OSR projections; and, iii) develop a framework for monitoring improvements in
OSR performance by Counties. Building on the 2015 County Revenue Baseline
Study undertaken by the CoB, National Treasury’s study estimates how much
revenue each County could generate from key OSR streams if available fiscal
instruments were effectively utilized, administrative inefficiencies resolved and
evasion addressed. The study’s main policy finding is that Counties should focus
revenue improvement efforts on streams with a strong policy rationale, significant
revenue potential and are cost-effective to collect. Not all revenue streams are
suitable for revenue enhancement effort. In general, user charges are based on fee
payment for accessing a service, and health services for instance, should not be
targeted for revenue enhancement in case they make crucial healthcare
inaccessible. Table 4.1 shows estimated ‘low scenario’ OSR potential from key
streams, the policy rationale and legal basis of each stream. The study also finds a
clear disconnect between Counties’ revenue collection and policy objectives. To
deal with the current proliferation of rates, bases and OSR administration
approaches across County jurisdictions, the study recommends that common
frameworks be established which, while ensuring countrywide consistency, will
permit individual Counties to exercise discretion within their local contexts.
Table 4.1: County Governments’ estimated own-source revenue potential by
stream (Low scenario) Revenue
stream
Policy rationale Legal basis Computed
potential* (Ksh billions)
Property
tax
Closely linked to benefits of local goods
and service provision, and to household
wealth; main revenue source for
subnational governments worldwide
Constitutional assignment
(Article 209 (3)) 66.2
Business
licences
Broadening the tax base and appropriating
share of profits given that national income
tax system is still evolving and business
formalization is still low
County function (7. Trade
development and regulation,
incl. trade licences)
23.4
Vehicle
parking fees
Effective use of County property; basic
congestion charge to correct for negative
externalities from traffic
County function (5. County
transport, incl. traffic and
parking)
12.6
Liquor
licences
Correcting for negative externalities from
alcohol consumption, including on health,
public safety and waste pollution
County function (4. (…)
public entertainment (…)
incl. liquor licensing)
10.2
Outdoor
advertising
charges
Effective use of County property; limiting
of outdoor ‘visual pollution’
County function (3. Control
of (…) outdoor advertising) 6.3
Building
permits
Appropriating share of ‘windfall’ profits
from building construction; compliance
with building codes for public health and
safety, construction quality and easier
property valuation
County function (8. County
planning and development) 6.0
TOTAL 124.7
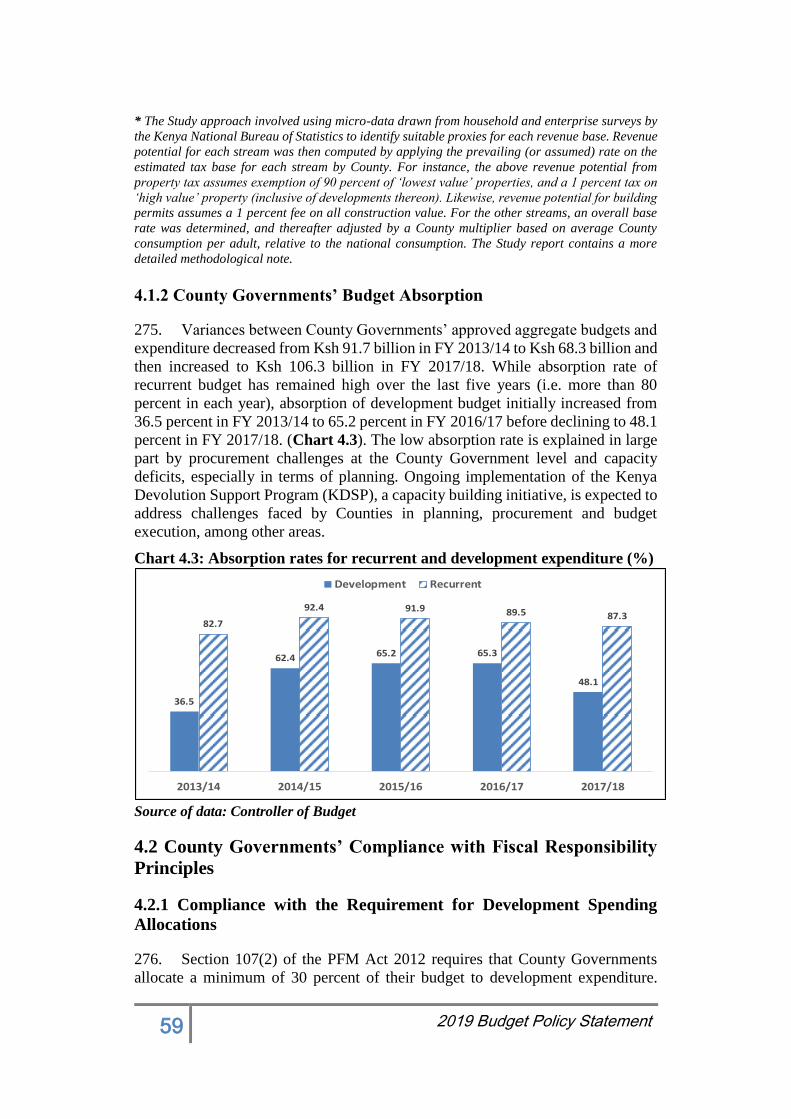
59 2019 Budget Policy Statement
* The Study approach involved using micro-data drawn from household and enterprise surveys by
the Kenya National Bureau of Statistics to identify suitable proxies for each revenue base. Revenue
potential for each stream was then computed by applying the prevailing (or assumed) rate on the
estimated tax base for each stream by County. For instance, the above revenue potential from
property tax assumes exemption of 90 percent of ‘lowest value’ properties, and a 1 percent tax on
‘high value’ property (inclusive of developments thereon). Likewise, revenue potential for building
permits assumes a 1 percent fee on all construction value. For the other streams, an overall base
rate was determined, and thereafter adjusted by a County multiplier based on average County
consumption per adult, relative to the national consumption. The Study report contains a more
detailed methodological note.
4.1.2 County Governments’ Budget Absorption
275. Variances between County Governments’ approved aggregate budgets and
expenditure decreased from Ksh 91.7 billion in FY 2013/14 to Ksh 68.3 billion and
then increased to Ksh 106.3 billion in FY 2017/18. While absorption rate of
recurrent budget has remained high over the last five years (i.e. more than 80
percent in each year), absorption of development budget initially increased from
36.5 percent in FY 2013/14 to 65.2 percent in FY 2016/17 before declining to 48.1
percent in FY 2017/18. (Chart 4.3). The low absorption rate is explained in large
part by procurement challenges at the County Government level and capacity
deficits, especially in terms of planning. Ongoing implementation of the Kenya
Devolution Support Program (KDSP), a capacity building initiative, is expected to
address challenges faced by Counties in planning, procurement and budget
execution, among other areas.
Chart 4.3: Absorption rates for recurrent and development expenditure (%)
Source of data: Controller of Budget
4.2 County Governments’ Compliance with Fiscal Responsibility
Principles
4.2.1 Compliance with the Requirement for Development Spending
Allocations
276. Section 107(2) of the PFM Act 2012 requires that County Governments
allocate a minimum of 30 percent of their budget to development expenditure.
36.5
62.4 65.2 65.3
48.1
82.7
92.4 91.9 89.5 87.3
2013/14 2014/15 2015/16 2016/17 2017/18
Development Recurrent
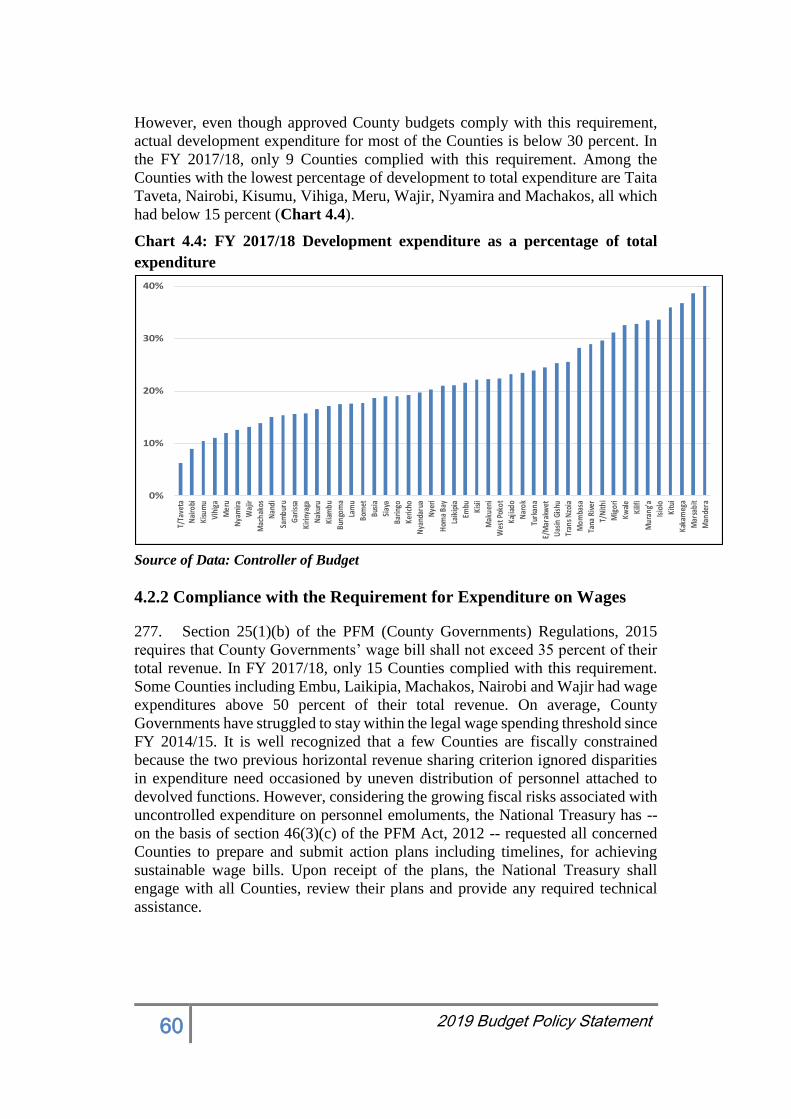
60 2019 Budget Policy Statement
However, even though approved County budgets comply with this requirement,
actual development expenditure for most of the Counties is below 30 percent. In
the FY 2017/18, only 9 Counties complied with this requirement. Among the
Counties with the lowest percentage of development to total expenditure are Taita
Taveta, Nairobi, Kisumu, Vihiga, Meru, Wajir, Nyamira and Machakos, all which
had below 15 percent (Chart 4.4).
Chart 4.4: FY 2017/18 Development expenditure as a percentage of total
expenditure
Source of Data: Controller of Budget
4.2.2 Compliance with the Requirement for Expenditure on Wages
277. Section 25(1)(b) of the PFM (County Governments) Regulations, 2015
requires that County Governments’ wage bill shall not exceed 35 percent of their
total revenue. In FY 2017/18, only 15 Counties complied with this requirement.
Some Counties including Embu, Laikipia, Machakos, Nairobi and Wajir had wage
expenditures above 50 percent of their total revenue. On average, County
Governments have struggled to stay within the legal wage spending threshold since
FY 2014/15. It is well recognized that a few Counties are fiscally constrained
because the two previous horizontal revenue sharing criterion ignored disparities
in expenditure need occasioned by uneven distribution of personnel attached to
devolved functions. However, considering the growing fiscal risks associated with
uncontrolled expenditure on personnel emoluments, the National Treasury has --
on the basis of section 46(3)(c) of the PFM Act, 2012 -- requested all concerned
Counties to prepare and submit action plans including timelines, for achieving
sustainable wage bills. Upon receipt of the plans, the National Treasury shall
engage with all Counties, review their plans and provide any required technical
assistance.
0%
10%
20%
30%
40%
T/Ta
veta
Nai
robi
Kisu
mu
Vihi
ga
Mer
u
Nya
mira
Waj
ir
Mac
hako
s
Nan
di
Sam
buru
Gar
issa
Kirin
yaga
Nak
uru
Kiam
bu
Bung
oma
Lam
u
Bom
et
Busi
a
Siay
a
Barin
go
Keric
ho
Nya
ndar
ua
Nye
ri
Hom
a Ba
y
Laik
ipia
Embu
Kisii
Mak
ueni
Wes
t Pok
ot
Kajia
do
Nar
ok
Turk
ana
E/M
arak
wet
Uas
in G
ishu
Tran
s Nzo
ia
Mom
basa
Tana
Riv
er
T/N
ithi
Mig
ori
Kwal
e
Kilif
i
Mur
ang'
a
Isio
lo
Kitu
i
Kaka
meg
a
Mar
sabi
t
Man
dera
61 2019 Budget Policy Statement
4.3 Prudent Management of Fiscal Risks
4.3.1 Pending Bills
278. According to the CoB, County Governments had as at June 2018,
accumulated pending bills worth Ksh. 108.4 billion, including unremitted statutory
deductions, salary arrears, outstanding payments to contractors and suppliers as
well as to utilities. Three-quarters of the pending bills is recurrent in nature; 16
Counties have bills exceeding Ksh 1 billion; and, Nairobi County accounts for
nearly 60 percent of the total. Based on section 94(1) of the PFM Act, such failure
by County Governments to make payments as and when due, or default on
financial obligations may indicate material breach of legally-established measures.
Therefore, in line with section 96(3) of the PFM Act, the National Treasury has
requested the Auditor-General to undertake a special audit to assess the financial
state of concerned Counties and determine reasons for the possible breach. It is
expected that the audit will be finalized before the end of FY 2018/19. If any
County is in breach, this will trigger the National Government’s intervention as per
Article 225 of the Constitution. In general, pending payments older than 90 days
constitute a fiscal risk with major potential consequences to the economy, and
County Accounting Officers are legally required to update the National Treasury
on a monthly basis.
279. Meanwhile, the cash accounting method currently applied by County
Governments presents challenges in terms of monthly and annual financial
reporting on pending bills and other liabilities (as well as assets). This is due to the
fact that cash accounting does not require recognition of liabilities as well as assets;
rather, only their associated cash inflows and outflows. To deal with this challenge,
the National Treasury and the Public Sector Accounting Standards Board (PSASB)
have initiated a review of the Standard Chart of Accounts as well as development
of policy guidelines on management of assets and liabilities. These are preparatory
steps for a possible future migration to accrual accounting which PSASB has
indicated to commence in FY 2020/2021. This will further enhance closer
monitoring of County Governments’ pending bills as they will have to be
recognized on the face of financial statements. Adequate documentation of pending
bills and assets will also facilitate their handover between County Government
regimes.
4.3.2 Other Risks Identified in County Financial Reports
280. In order to better understand evolving intergovernmental fiscal relations
issues and improve formulation and enforcement of policy measures, the National
Treasury has been analysing County Governments’ budgets, their financial
statements and audit opinions over the last five years. Findings of the analyses have
been consolidated into the County Governments’ Fiscal Performance Report,
which is hinged on the National Treasury’s mandate in section 12(1)(a) of the PFM
Act, 2012. In addition to issues already highlighted in this chapter, the above report
mentions the following among recurring issues, which the National Treasury is
addressing primarily through enhanced capacity building for the Counties and
more stringent enforcement:
62 2019 Budget Policy Statement
a) Lack of reconciliation between financial statements and balances in the IFMIS,
which arises when County Governments fail to post all their transactions on
the system;
b) Procurement irregularities including unjustified single sourcing and contract
variations, inflation of contract prices and undocumented purchases of assets;
c) Failure to establish public funds in line with section 116 of the PFM Act, 2012,
which mainly undermines the legality of County Governments’ mortgage and
car loan schemes;
d) Weak human resource management practices, including ineffectiveness of
County Public Service Boards, which contributes to uncontrolled hiring of non-
core personnel outside approved staff establishments and remuneration
guidelines;
e) Delayed submission of financial reports by County Accounting Officers and
County public fund administrators contrary to sections 166(4) and 168(3) of
the PFM Act, 2012; and,
f) Absence and/or ineffectiveness of internal audit committees in line with part
XIII of the PFM (County Governments) Regulations, 2015.
4.3.3 Status of Transfer of Devolved Functions
281. In FY 2017/18, the Intergovernmental Relations Technical Committee
(IGRTC) assessed the status of transfer of devolved functions. The objective is to:
i) eliminate risks associated with duplication between the two levels of
Government; ii) identify budgetary resources to be assigned to either Government;
iii) facilitate division of revenue raised nationally; and, iv) streamline funds flow
with regards to conditional allocations. According to IGRTC’s assessment, there
are two categories of functions as follows:
a) Functions that have been transferred but not fully operationalized at the
County level: These include: libraries; statistics; land survey, mapping and
housing; cooperatives, mechanical and transport equipment; ferries and
harbours. Some of these functions (e.g. libraries) are still being undertaken
nationally due to administrative complexities (e.g. harmonization of salaries
and pension schemes of personnel). Moreover, devolved libraries exist in only
33 Counties, hence mechanisms are required to achieve their equitable
decentralization. Other functions (e.g. statistics, and ferries and harbours) are
undergoing unbundling due to their concurrent nature. For these, legal regimes,
standards and norms are needed to enable delivery by both levels of
Government. Responsibility for museums will be legally transferred to County
Governments in FY 2019/20, along with attendant budgetary resources.
b) Functions that are either overlapping or being duplicated: These include:
water (protection, reticulation and related services); agriculture (licensing,
imposition of levies and charges); and, betting, casinos and gambling. For these
functions, legislative amendments are required to align each function and
institutional role with the Constitution. Also required are regulations and or
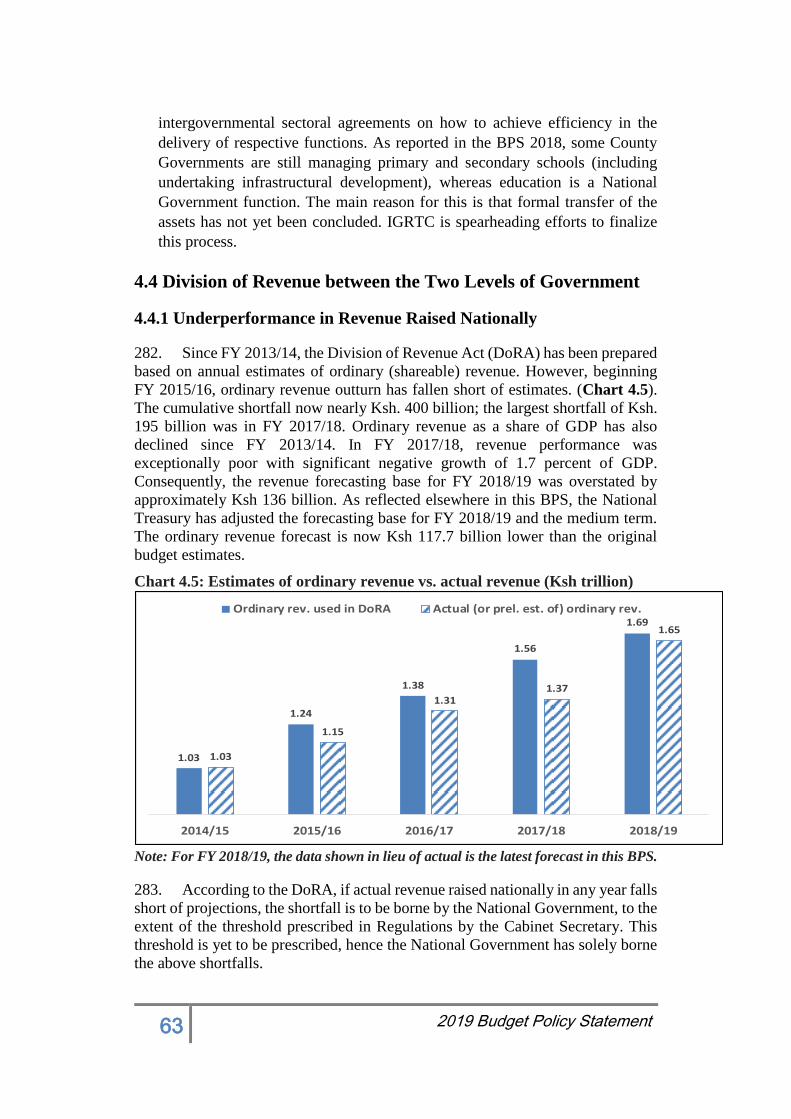
63 2019 Budget Policy Statement
intergovernmental sectoral agreements on how to achieve efficiency in the
delivery of respective functions. As reported in the BPS 2018, some County
Governments are still managing primary and secondary schools (including
undertaking infrastructural development), whereas education is a National
Government function. The main reason for this is that formal transfer of the
assets has not yet been concluded. IGRTC is spearheading efforts to finalize
this process.
4.4 Division of Revenue between the Two Levels of Government
4.4.1 Underperformance in Revenue Raised Nationally
282. Since FY 2013/14, the Division of Revenue Act (DoRA) has been prepared
based on annual estimates of ordinary (shareable) revenue. However, beginning
FY 2015/16, ordinary revenue outturn has fallen short of estimates. (Chart 4.5).
The cumulative shortfall now nearly Ksh. 400 billion; the largest shortfall of Ksh.
195 billion was in FY 2017/18. Ordinary revenue as a share of GDP has also
declined since FY 2013/14. In FY 2017/18, revenue performance was
exceptionally poor with significant negative growth of 1.7 percent of GDP.
Consequently, the revenue forecasting base for FY 2018/19 was overstated by
approximately Ksh 136 billion. As reflected elsewhere in this BPS, the National
Treasury has adjusted the forecasting base for FY 2018/19 and the medium term.
The ordinary revenue forecast is now Ksh 117.7 billion lower than the original
budget estimates.
Chart 4.5: Estimates of ordinary revenue vs. actual revenue (Ksh trillion)
Note: For FY 2018/19, the data shown in lieu of actual is the latest forecast in this BPS.
283. According to the DoRA, if actual revenue raised nationally in any year falls
short of projections, the shortfall is to be borne by the National Government, to the
extent of the threshold prescribed in Regulations by the Cabinet Secretary. This
threshold is yet to be prescribed, hence the National Government has solely borne
the above shortfalls.
1.03
1.24
1.38
1.56
1.69
1.03
1.15
1.311.37
1.65
2014/15 2015/16 2016/17 2017/18 2018/19
Ordinary rev. used in DoRA Actual (or prel. est. of) ordinary rev.
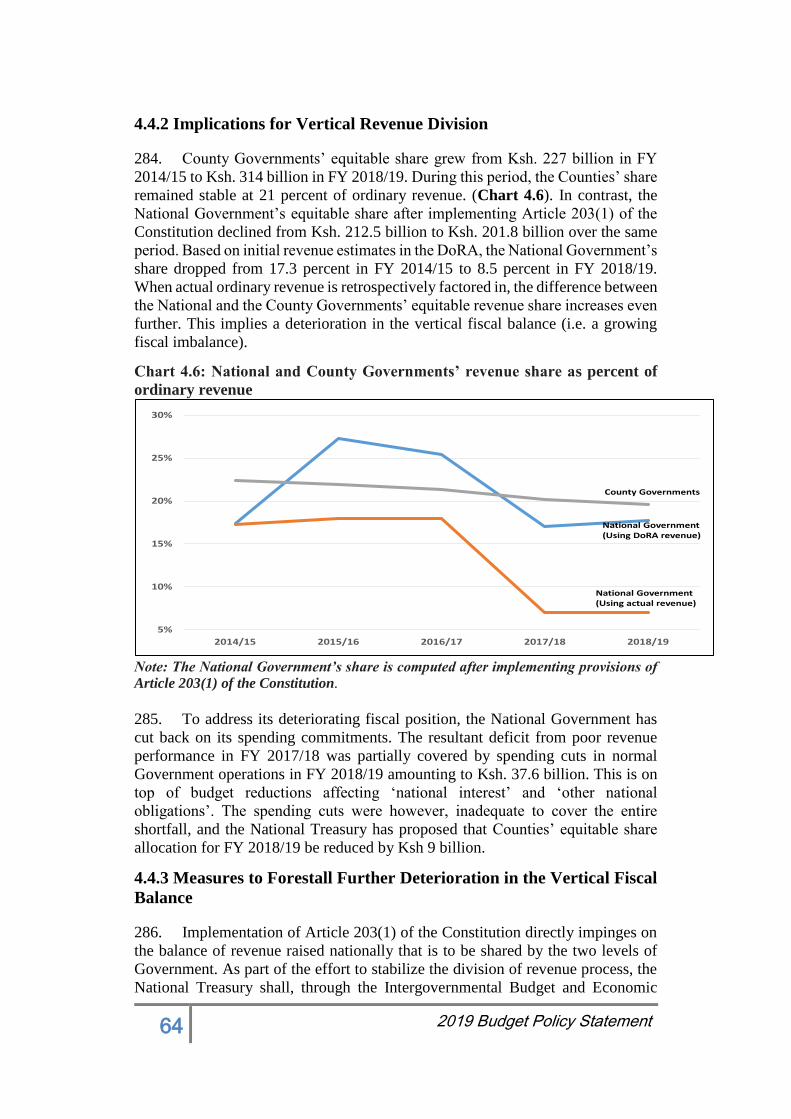
64 2019 Budget Policy Statement
4.4.2 Implications for Vertical Revenue Division
284. County Governments’ equitable share grew from Ksh. 227 billion in FY
2014/15 to Ksh. 314 billion in FY 2018/19. During this period, the Counties’ share
remained stable at 21 percent of ordinary revenue. (Chart 4.6). In contrast, the
National Government’s equitable share after implementing Article 203(1) of the
Constitution declined from Ksh. 212.5 billion to Ksh. 201.8 billion over the same
period. Based on initial revenue estimates in the DoRA, the National Government’s
share dropped from 17.3 percent in FY 2014/15 to 8.5 percent in FY 2018/19.
When actual ordinary revenue is retrospectively factored in, the difference between
the National and the County Governments’ equitable revenue share increases even
further. This implies a deterioration in the vertical fiscal balance (i.e. a growing
fiscal imbalance).
Chart 4.6: National and County Governments’ revenue share as percent of
ordinary revenue
Note: The National Government’s share is computed after implementing provisions of
Article 203(1) of the Constitution.
285. To address its deteriorating fiscal position, the National Government has
cut back on its spending commitments. The resultant deficit from poor revenue
performance in FY 2017/18 was partially covered by spending cuts in normal
Government operations in FY 2018/19 amounting to Ksh. 37.6 billion. This is on
top of budget reductions affecting ‘national interest’ and ‘other national
obligations’. The spending cuts were however, inadequate to cover the entire
shortfall, and the National Treasury has proposed that Counties’ equitable share
allocation for FY 2018/19 be reduced by Ksh 9 billion.
4.4.3 Measures to Forestall Further Deterioration in the Vertical Fiscal
Balance
286. Implementation of Article 203(1) of the Constitution directly impinges on
the balance of revenue raised nationally that is to be shared by the two levels of
Government. As part of the effort to stabilize the division of revenue process, the
National Treasury shall, through the Intergovernmental Budget and Economic
5%
10%
15%
20%
25%
30%
2014/15 2015/16 2016/17 2017/18 2018/19
County Governments
National Government (Using DoRA revenue)
National Government (Using actual revenue)

65 2019 Budget Policy Statement
Council (IBEC) seek constitutional interpretation as well as consensus among key
actors on how best to treat ‘national interest’ and ‘other national obligations’.
Through IBEC, the National Treasury will also continue to pursue compromise
around a more fiscally sustainable method for adjusting upwards County
Governments’ annual equitable share. Against the backdrop of revenue
underperformance, the current approach (which uses average month-on-month
inflation for three years) as well as the earlier one (which used a composite index
of revenue and GDP growths) are likely to introduce risks in the overall fiscal
framework. Finally, the National Treasury proposes to involve more stakeholders,
particularly the Commission on Revenue Allocation (CRA) in preparation of the
fiscal framework, which involves projection of revenues and expenditures.
287. The National Treasury proposes that County Governments be allocated an
equitable share of revenue raised nationally of Ksh 310 billion in the FY 2019/20,
and that the National Government be allocated Ksh 1,561.4 billion. For County
Governments, this will translate into a Ksh 5.04 billion growth vis-à-vis the FY
2018/19 allocation of Ksh 304.96 billion as per the BROP 2018. (Table 4.2).
Table 4.2: County Governments’ Equitable Revenue Share (Ksh Million)
*County Governments’ equitable share for FY 2018/19 (Ksh 304,962 million) is based on
the Budget Review and Outlook Paper (BROP) 2018.
288. In addition to the above equitable share, County Governments will receive
additional funds as conditional grants. These include the following:
From the National Governments’ equitable revenue share, Ksh 13.91 billion
for: i) level-5 hospitals; ii) rehabilitation of village polytechnics; iii) leasing of
medical equipment; iv) compensation for foregone user fees; and, v)
construction of County headquarters (Table 4.3).
Equalization Fund to the marginalized areas amounting to Ksh 5.76 billion;
Ksh 8.98 billion from the Road Maintenance Fuel Levy Fund (RMLF). As in
previous years, this is calculated at 15 percent of projected FY 2018/19
collections by the Kenya Roads Board (KRB); and
Budget item 2015/16 2016/17 2017/18 2018/19 2019/20
Baseline (i.e. allocation in the previous FY) 226,660.0 259,774.5 280,300.0 302,000.0 304,962.0
Baseline adjustments:
1. Baseline adjustments (Due to additional functions) 2,946.0
Adjusted baseline: 229,606.0 259,774.5 280,300.0 302,000.0 304,962.0
Additional revenue measures
1. Adjustment for revenue growth 23,902.0 20,525.2 21,700.0 2,962.0 5,038.0
2. Other adjustments 4,500.0
3. Adjustments negotiated in Parliament post-BPS 1,766.5
Computed equitable revenue share allocation 259,774.5 280,300.0 302,000.0 304,962.0 310,000.0
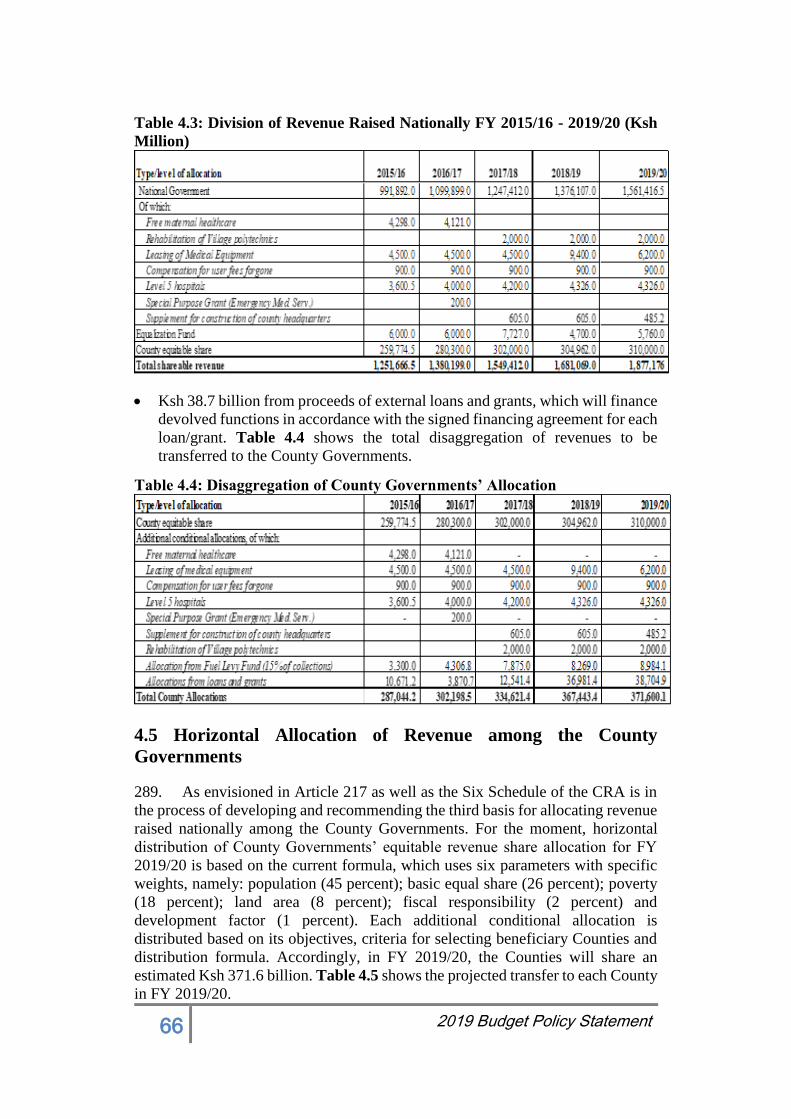
66 2019 Budget Policy Statement
Table 4.3: Division of Revenue Raised Nationally FY 2015/16 - 2019/20 (Ksh
Million)
Ksh 38.7 billion from proceeds of external loans and grants, which will finance
devolved functions in accordance with the signed financing agreement for each
loan/grant. Table 4.4 shows the total disaggregation of revenues to be
transferred to the County Governments.
Table 4.4: Disaggregation of County Governments’ Allocation
4.5 Horizontal Allocation of Revenue among the County
Governments
289. As envisioned in Article 217 as well as the Six Schedule of the CRA is in
the process of developing and recommending the third basis for allocating revenue
raised nationally among the County Governments. For the moment, horizontal
distribution of County Governments’ equitable revenue share allocation for FY
2019/20 is based on the current formula, which uses six parameters with specific
weights, namely: population (45 percent); basic equal share (26 percent); poverty
(18 percent); land area (8 percent); fiscal responsibility (2 percent) and
development factor (1 percent). Each additional conditional allocation is
distributed based on its objectives, criteria for selecting beneficiary Counties and
distribution formula. Accordingly, in FY 2019/20, the Counties will share an
estimated Ksh 371.6 billion. Table 4.5 shows the projected transfer to each County
in FY 2019/20.
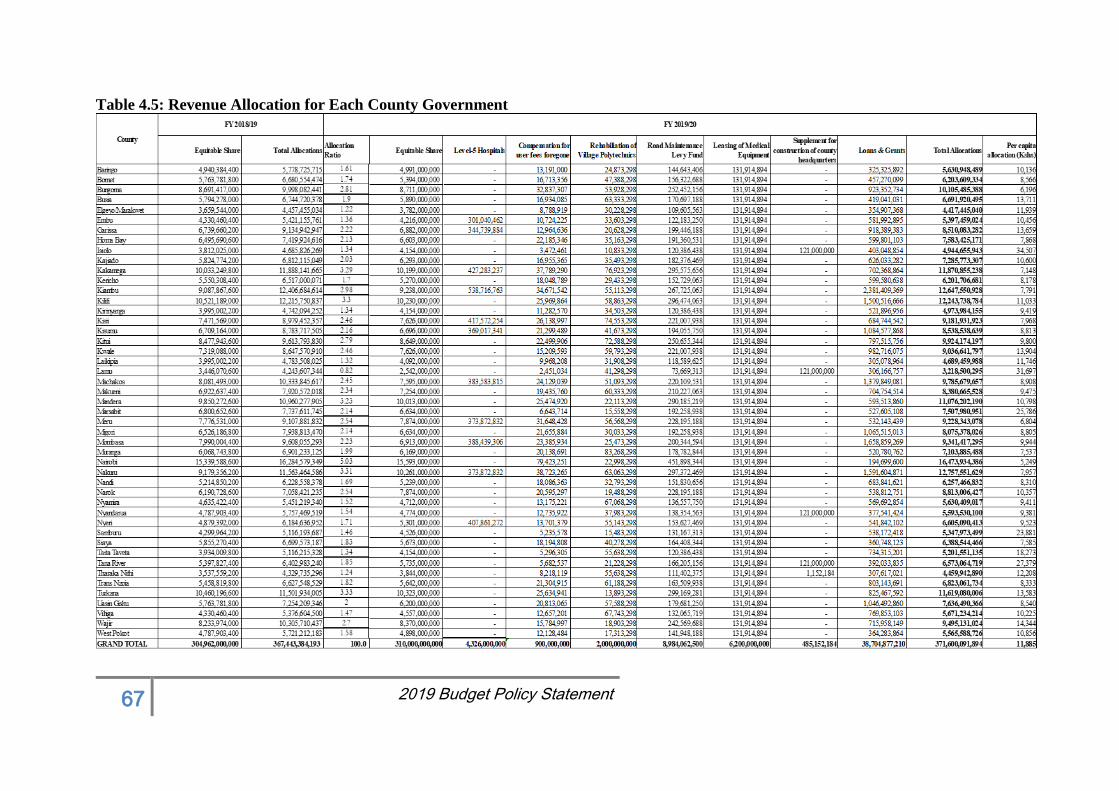
67 2019 Budget Policy Statement
Table 4.5: Revenue Allocation for Each County Government
68 2019 Budget Policy Statement
4.6 Emerging Issues
290. In November 2018, the National Treasury and Planning launched the Third
Medium Plan 2018 - 2022 of the Kenya Vision 2030 that focusses on transforming
lives through advancing socio-economic development through the “Big Four”. The
third MTP advocates for the strengthening of intergovernmental relations between
the National and County Governments as key towards ensuring efficient and
effective service delivery.
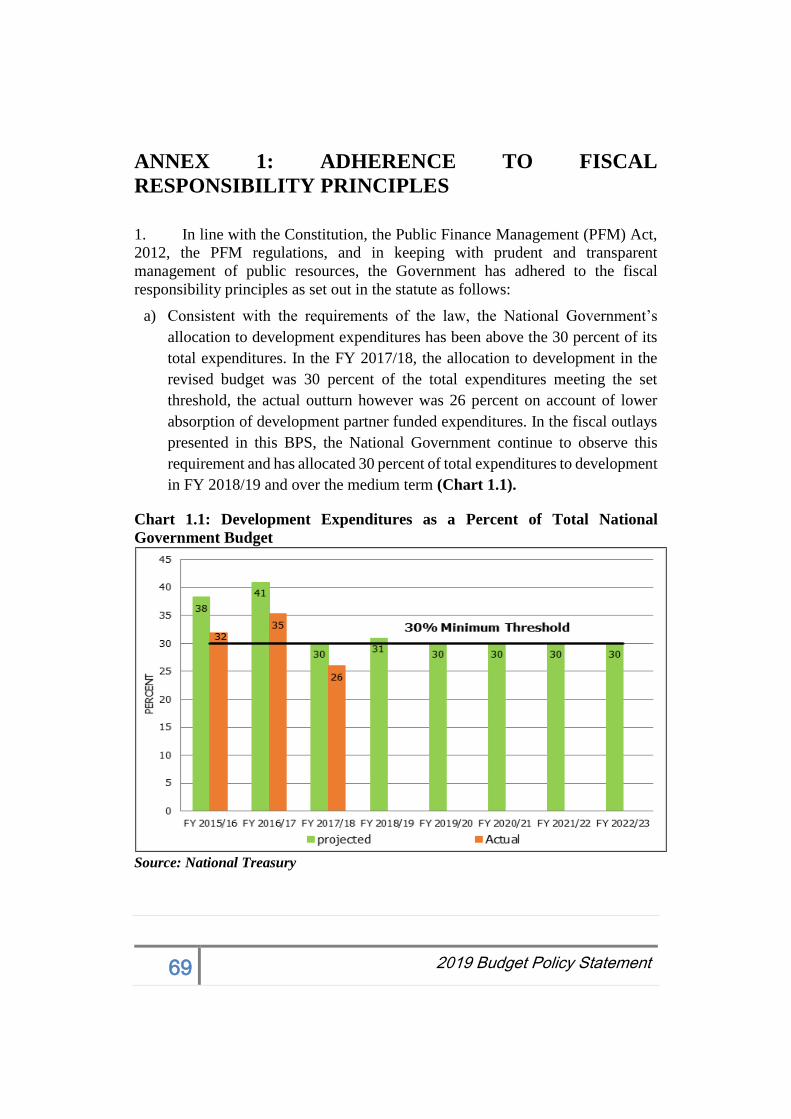
69 2019 Budget Policy Statement
ANNEX 1: ADHERENCE TO FISCAL
RESPONSIBILITY PRINCIPLES
1. In line with the Constitution, the Public Finance Management (PFM) Act,
2012, the PFM regulations, and in keeping with prudent and transparent
management of public resources, the Government has adhered to the fiscal
responsibility principles as set out in the statute as follows:
a) Consistent with the requirements of the law, the National Government’s
allocation to development expenditures has been above the 30 percent of its
total expenditures. In the FY 2017/18, the allocation to development in the
revised budget was 30 percent of the total expenditures meeting the set
threshold, the actual outturn however was 26 percent on account of lower
absorption of development partner funded expenditures. In the fiscal outlays
presented in this BPS, the National Government continue to observe this
requirement and has allocated 30 percent of total expenditures to development
in FY 2018/19 and over the medium term (Chart 1.1).
Chart 1.1: Development Expenditures as a Percent of Total National
Government Budget
Source: National Treasury
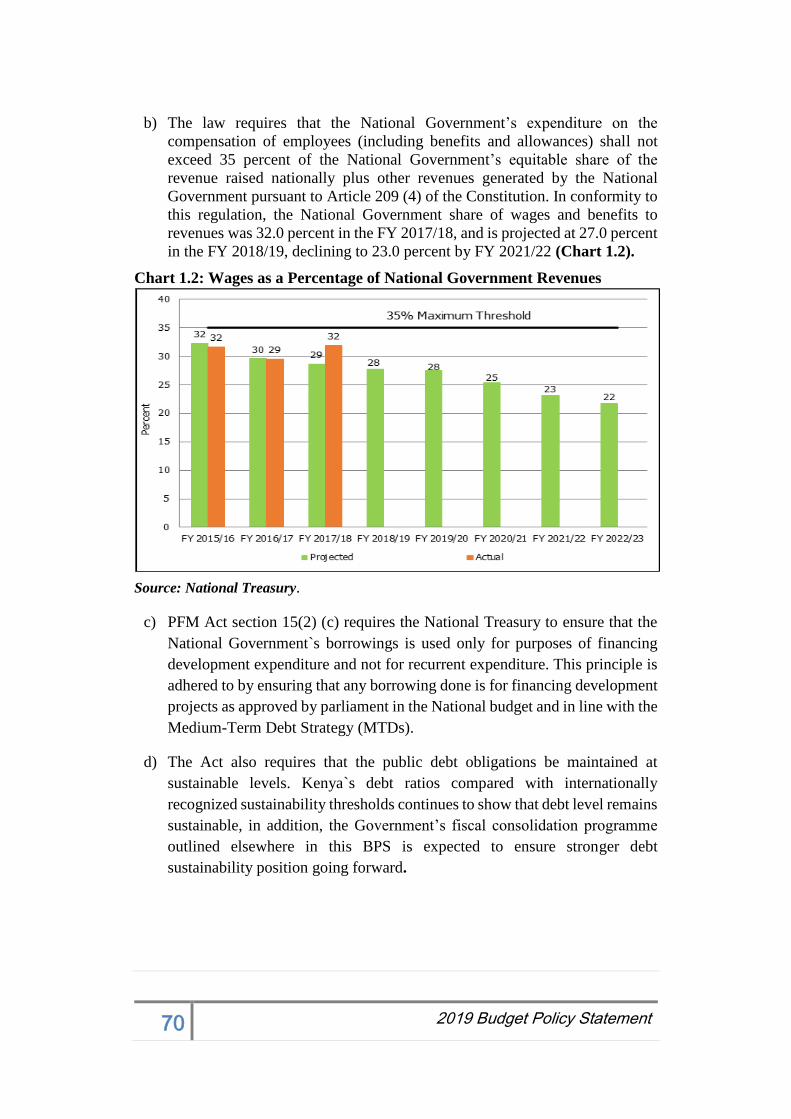
70 2019 Budget Policy Statement
b) The law requires that the National Government’s expenditure on the
compensation of employees (including benefits and allowances) shall not
exceed 35 percent of the National Government’s equitable share of the
revenue raised nationally plus other revenues generated by the National
Government pursuant to Article 209 (4) of the Constitution. In conformity to
this regulation, the National Government share of wages and benefits to
revenues was 32.0 percent in the FY 2017/18, and is projected at 27.0 percent
in the FY 2018/19, declining to 23.0 percent by FY 2021/22 (Chart 1.2).
Chart 1.2: Wages as a Percentage of National Government Revenues
Source: National Treasury.
c) PFM Act section 15(2) (c) requires the National Treasury to ensure that the
National Government`s borrowings is used only for purposes of financing
development expenditure and not for recurrent expenditure. This principle is
adhered to by ensuring that any borrowing done is for financing development
projects as approved by parliament in the National budget and in line with the
Medium-Term Debt Strategy (MTDs).
d) The Act also requires that the public debt obligations be maintained at
sustainable levels. Kenya`s debt ratios compared with internationally
recognized sustainability thresholds continues to show that debt level remains
sustainable, in addition, the Government’s fiscal consolidation programme
outlined elsewhere in this BPS is expected to ensure stronger debt
sustainability position going forward.
71 2019 Budget Policy Statement
e) Kenya’s risk to debt distress has been raised from low to moderate on account
of refinancing risks on external debt. This is expected to be short term as the
Government continues with its fiscal consolidation plan and implements the
Government liability management strategy so as to restructure short term
commercial loans by replacing them with long dated maturities. The liability
management strategy also aims at limiting non-concessional loans to projects
with high economic and social returns to stimulate growth and exports which
will improve the debt sustainability ratios.
f) To manage fiscal risks prudently as required, the Government has improved
its macroeconomic forecasts and regularly reviews the impact of
macroeconomic projections and their implications on the budget. Potential
fiscal risks arising from contingent liabilities, including from Public Private
Partnership projects among others are taken into account and a contingency
provision made to cushion the economy from unforeseeable shocks.
g) On the principle of maintaining a reasonable degree of predictability with
respect to the level of tax rates and tax bases, the Government continues to
carry out tax reforms through modernizing and simplifying tax laws. In order
to lock in predictability and enhance compliance with tax system, the
Government through the Finance Act, 2018, amended the Income Tax Act,
Excise Duty Act, VAT Act and the Tax Procedures Act.
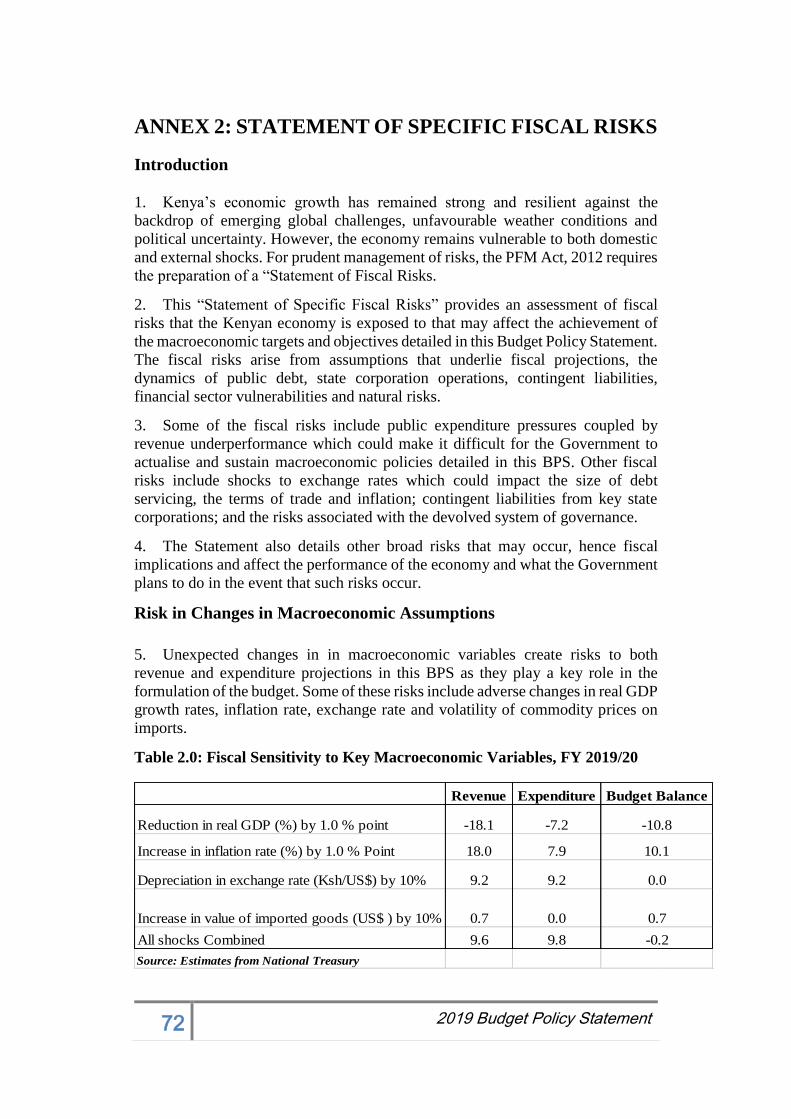
72 2019 Budget Policy Statement
ANNEX 2: STATEMENT OF SPECIFIC FISCAL RISKS
Introduction
1. Kenya’s economic growth has remained strong and resilient against the
backdrop of emerging global challenges, unfavourable weather conditions and
political uncertainty. However, the economy remains vulnerable to both domestic
and external shocks. For prudent management of risks, the PFM Act, 2012 requires
the preparation of a “Statement of Fiscal Risks.
2. This “Statement of Specific Fiscal Risks” provides an assessment of fiscal
risks that the Kenyan economy is exposed to that may affect the achievement of
the macroeconomic targets and objectives detailed in this Budget Policy Statement.
The fiscal risks arise from assumptions that underlie fiscal projections, the
dynamics of public debt, state corporation operations, contingent liabilities,
financial sector vulnerabilities and natural risks.
3. Some of the fiscal risks include public expenditure pressures coupled by
revenue underperformance which could make it difficult for the Government to
actualise and sustain macroeconomic policies detailed in this BPS. Other fiscal
risks include shocks to exchange rates which could impact the size of debt
servicing, the terms of trade and inflation; contingent liabilities from key state
corporations; and the risks associated with the devolved system of governance.
4. The Statement also details other broad risks that may occur, hence fiscal
implications and affect the performance of the economy and what the Government
plans to do in the event that such risks occur.
Risk in Changes in Macroeconomic Assumptions
5. Unexpected changes in in macroeconomic variables create risks to both
revenue and expenditure projections in this BPS as they play a key role in the
formulation of the budget. Some of these risks include adverse changes in real GDP
growth rates, inflation rate, exchange rate and volatility of commodity prices on
imports.
Table 2.0: Fiscal Sensitivity to Key Macroeconomic Variables, FY 2019/20
Revenue Expenditure Budget Balance
Reduction in real GDP (%) by 1.0 % point -18.1 -7.2 -10.8
Increase in inflation rate (%) by 1.0 % Point 18.0 7.9 10.1
Depreciation in exchange rate (Ksh/US$) by 10% 9.2 9.2 0.0
Increase in value of imported goods (US$ ) by 10% 0.7 0.0 0.7
All shocks Combined 9.6 9.8 -0.2
Source: Estimates from National Treasury
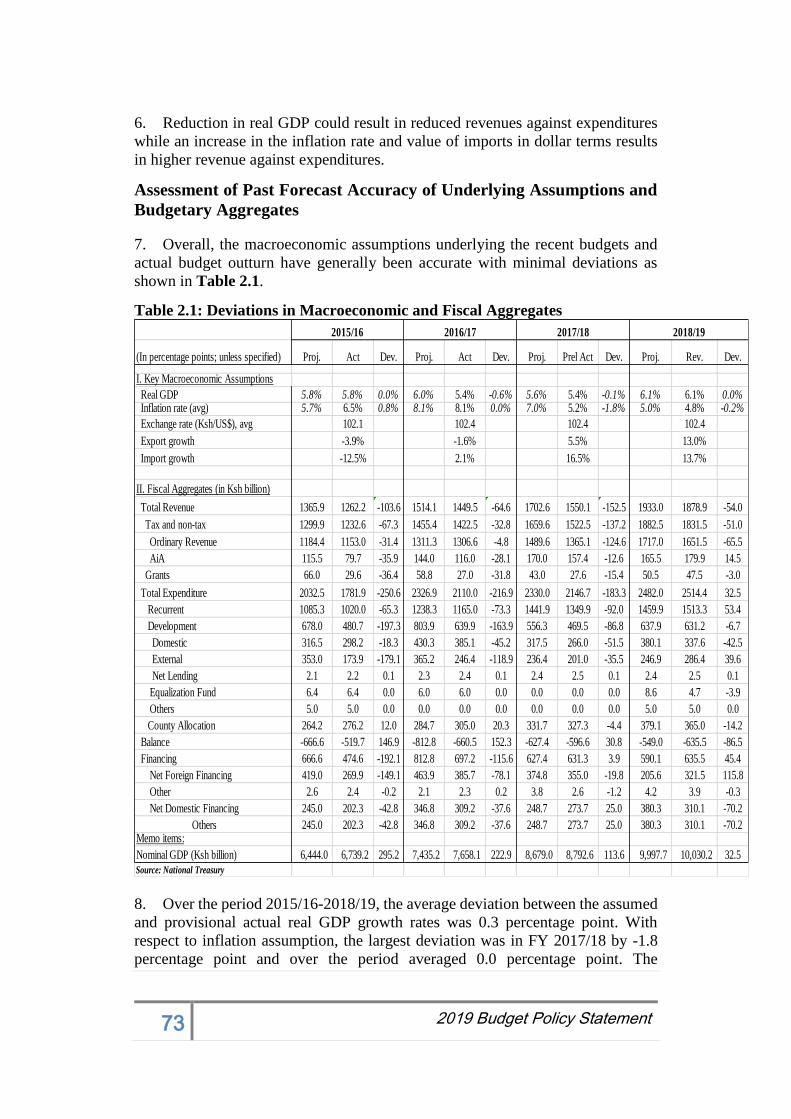
73 2019 Budget Policy Statement
6. Reduction in real GDP could result in reduced revenues against expenditures
while an increase in the inflation rate and value of imports in dollar terms results
in higher revenue against expenditures.
Assessment of Past Forecast Accuracy of Underlying Assumptions and
Budgetary Aggregates
7. Overall, the macroeconomic assumptions underlying the recent budgets and
actual budget outturn have generally been accurate with minimal deviations as
shown in Table 2.1.
Table 2.1: Deviations in Macroeconomic and Fiscal Aggregates
8. Over the period 2015/16-2018/19, the average deviation between the assumed
and provisional actual real GDP growth rates was 0.3 percentage point. With
respect to inflation assumption, the largest deviation was in FY 2017/18 by -1.8
percentage point and over the period averaged 0.0 percentage point. The
(In percentage points; unless specified) Proj. Act Dev. Proj. Act Dev. Proj. Prel Act Dev. Proj. Rev. Dev.
I. Key Macroeconomic Assumptions
Real GDP 5.8% 5.8% 0.0% 6.0% 5.4% -0.6% 5.6% 5.4% -0.1% 6.1% 6.1% 0.0%Inflation rate (avg) 5.7% 6.5% 0.8% 8.1% 8.1% 0.0% 7.0% 5.2% -1.8% 5.0% 4.8% -0.2%
Exchange rate (Ksh/US$), avg 102.1 102.4 102.4 102.4
Export growth -3.9% -1.6% 5.5% 13.0%
Import growth -12.5% 2.1% 16.5% 13.7%
II. Fiscal Aggregates (in Ksh billion)
Total Revenue 1365.9 1262.2 -103.6 1514.1 1449.5 -64.6 1702.6 1550.1 -152.5 1933.0 1878.9 -54.0
Tax and non-tax 1299.9 1232.6 -67.3 1455.4 1422.5 -32.8 1659.6 1522.5 -137.2 1882.5 1831.5 -51.0
Ordinary Revenue 1184.4 1153.0 -31.4 1311.3 1306.6 -4.8 1489.6 1365.1 -124.6 1717.0 1651.5 -65.5
AiA 115.5 79.7 -35.9 144.0 116.0 -28.1 170.0 157.4 -12.6 165.5 179.9 14.5
Grants 66.0 29.6 -36.4 58.8 27.0 -31.8 43.0 27.6 -15.4 50.5 47.5 -3.0
Total Expenditure 2032.5 1781.9 -250.6 2326.9 2110.0 -216.9 2330.0 2146.7 -183.3 2482.0 2514.4 32.5
Recurrent 1085.3 1020.0 -65.3 1238.3 1165.0 -73.3 1441.9 1349.9 -92.0 1459.9 1513.3 53.4
Development 678.0 480.7 -197.3 803.9 639.9 -163.9 556.3 469.5 -86.8 637.9 631.2 -6.7
Domestic 316.5 298.2 -18.3 430.3 385.1 -45.2 317.5 266.0 -51.5 380.1 337.6 -42.5
External 353.0 173.9 -179.1 365.2 246.4 -118.9 236.4 201.0 -35.5 246.9 286.4 39.6
Net Lending 2.1 2.2 0.1 2.3 2.4 0.1 2.4 2.5 0.1 2.4 2.5 0.1
Equalization Fund 6.4 6.4 0.0 6.0 6.0 0.0 0.0 0.0 0.0 8.6 4.7 -3.9
Others 5.0 5.0 0.0 0.0 0.0 0.0 0.0 0.0 0.0 5.0 5.0 0.0
County Allocation 264.2 276.2 12.0 284.7 305.0 20.3 331.7 327.3 -4.4 379.1 365.0 -14.2
Balance -666.6 -519.7 146.9 -812.8 -660.5 152.3 -627.4 -596.6 30.8 -549.0 -635.5 -86.5
Financing 666.6 474.6 -192.1 812.8 697.2 -115.6 627.4 631.3 3.9 590.1 635.5 45.4
Net Foreign Financing 419.0 269.9 -149.1 463.9 385.7 -78.1 374.8 355.0 -19.8 205.6 321.5 115.8
Other 2.6 2.4 -0.2 2.1 2.3 0.2 3.8 2.6 -1.2 4.2 3.9 -0.3
Net Domestic Financing 245.0 202.3 -42.8 346.8 309.2 -37.6 248.7 273.7 25.0 380.3 310.1 -70.2
Others 245.0 202.3 -42.8 346.8 309.2 -37.6 248.7 273.7 25.0 380.3 310.1 -70.2Memo items:
Nominal GDP (Ksh billion) 6,444.0 6,739.2 295.2 7,435.2 7,658.1 222.9 8,679.0 8,792.6 113.6 9,997.7 10,030.2 32.5
Source: National Treasury
2016/172015/16 2017/18 2018/19
74 2019 Budget Policy Statement
depreciation of the Kenyan Shilling exchange rate against major international
currencies since the FY 2015/2016 was due to the strengthening of the US dollar
but has since stabilized with less volatility.
9. The actual performance of fiscal aggregates vis-à-vis target was below target.
Total revenue between FY 2015/16 and FY 2018/19 underperformed its target by
an average of Ksh 95.6 billion while ordinary revenue was below target by an
average of Ksh 56.2 billion. The underperformance in A-i-A largely reflects the
under reporting from the relevant ministries/departments.
10. The average deviation of total expenditure and net lending between FY
2015/16 and FY 2018/19 was an underspending of Ksh 115.2 billion. This shortfall
was attributed to lower absorption of both development expenditures and recurrent
expenditures of Ksh 87.9 billion and Ksh 30.6 billion, respectively.
11. The slower-than-programmed spending on development budget poses a risk
to the fiscal program, going forward. In order to prevent this risk from
materializing and improve efficiency of public investments, the National Treasury
froze initiation of new capital projects until the completion of the ongoing ones.
The National Treasury has established the Public Investment Management Unit
which is responsible for ensuring that all capital projects are planned, appraised
and evaluated before funds are finally committed in the budget.
SPECIFIC FISCAL RISKS
12. This section covers specific fiscal risk that Kenya faces. Most of these risks
have a linkage to infrastructure expansion in the country, a critical priority for the
Government, which elevates the importance of effective risk management. The
specific fiscal risks include:
i. The sustainability of public debt;
ii. Explicit Contingent Liabilities
iii. Implicit Contingent Liabilities
iv. Fiscal Risks Related to Devolution
Sustainability of Public Debt
13. The sustainability of Kenya’s public debt depends on macroeconomic
performance and prudent debt management. External financing on both
concessional and non-concessional terms pose foreign exchange risk which may
worsen the present value (PV) of debt. Contracting of new debt on short term
maturities increases the refinancing risk. However, with the present fiscal
consolidation efforts, the Government aims to contain the pace of borrowing and
hence reduce the debt ratios. To reduce the refinancing risk, the Government’s
strategy is to restructure existing public and publicly guaranteed loans using
external and domestic loans of longer-term maturities.
14. The above notwithstanding, the Government recognizes the importance of
managing public debt in a prudent way to ensure the debt burden is shared equally
75 2019 Budget Policy Statement
between the current and future generations. The latest Debt Sustainability Analysis
(DSA) for Kenya indicates that Kenya’s debt is sustainable.
15. Kenya is rated as a strong policy performer and a low middle income country
as per the World Bank`s Country Policy and Institutional Assessment (CPIA)
Index which classifies countries into three performance categories i.e. Strong,
Medium and Poor. Each category has different indicative thresholds for debt
burdens depending on the country`s policies and institutions and thus Kenya is
subject to the threshold a 70 percent on the Present Value of Debt to GDP. In this
respect, Kenya is well within the 70 percent threshold.
Explicit Contingent Liabilities
State Corporations/State Owned Enterprises
Governance
16. The Government continues to undertake reforms aimed at addressing systemic
weaknesses in State Corporations/State Owned Enterprises and other Government
investments as well as specific challenges facing individual entities. The
Government together with other stakeholders undertook a successful restructuring
of Kenya Airways. It is envisaged that the Airline will play a critical role in making
Nairobi an international travel hub in the region. Some of the State Corporations
undergoing restructuring include;
i. Reforming the Agricultural Finance Corporation (AFC) to help deliver
on its mandate of ensuring food and nutrition security within “The Big
Four” Plan; and
ii. Merging of the Industrial and Commercial Development Corporation
(ICDC), the Industrial Development Bank (IDB) and the Tourism
Finance Corporation (TFC) to create the Kenya Development Bank with
enhanced capacity to offer affordable credit to boost manufacturing
under “The Big Four” Plan.
17. The unbundling of regulatory functions in the ICT sector has unlocked great
potential in the techno and financial sectors that are major drivers of the economy.
These reforms premised on Government policy of a private sector led economy
resulted in privatization of some Corporations like Kenya Commercial Bank which
is now a major driver in the banking industry. Further, this led to the establishment
of Safaricom by Government in partnership with private sector players. Safaricom
has played a significant role in the economy by creating employment opportunities,
remitting reasonable dividends to the national exchequer and tax revenues
18. In efforts to strengthen good corporate governance of State Corporations, the
Government issued the Mwongozo guidelines for effective guidance on
governance and oversight of State Corporations. This, together with the
establishment and operationalization of audit committees and risk management
76 2019 Budget Policy Statement
frameworks for Government entities including State Corporations under the PFM
Act/Regulations are geared towards enhancing capacity for effective delivery of
strategic objectives on behalf of the Government. In addition the Capital Market
Authority has issued Regulations under the Capital Market Act (Cap 486) on code
of governance requirements to be observed by companies listed at the NSE. This
will enhance accountability, transparency and full disclosure by Companies listed
in NSE which include Government-linked entities.
Public Debt
19. Under various enabling legislations establishing State Corporations, the
Corporations are legal entities with the capacity to borrow or contract debts and
other liabilities for purposes of furthering their mandate on behalf of the
Government. The process of contracting debts and other liabilities by State
Corporations are spelt out in the PFM Act/Regulation and the State Corporations
Act with clear approval requirements. State Corporations with strong balance
sheets can contract debts and other liabilities only with relevant approvals from the
line Ministries and the National Treasury to finance projects that are viable and
will enhance the revenue stream to service all obligation arising from the debts
without reverting to the national exchequer for bailout.
20. On the other hand, the Government through the National Treasury can procure
loans on concessional terms from bilateral/multilateral sources and other financial
institutions to implement strategic infrastructure projects that require huge capital
outlays like in energy/petroleum, roads, airports, rail, and sea ports. The
concessional loans are on-lent to respective State Corporations implementing the
strategic infrastructure projects. The on-lent concessional loans constitute public
debts and are sustainable as they are procured by the Government as per the
Medium-Term Debt Management Strategy and are within the required thresholds
with respect to Kenya’s public indebtedness.
21. Government, for strategic reasons historically has a stake in State Owned
Enterprises (SOEs) and other Government investments. While contracted debts
and other liabilities by SOEs and other companies where Government has a stake
are backed by their balance sheets and revenue streams, they may constitute a
potential source of fiscal risk. Due to economic downturns and fortunes as a result
of vagaries of the weather, global economic shocks, new technology, competition,
change of law as a result of domesticating regional treaties, and change of policies,
SOEs and other companies where Government has a stake may face challenges and
financial distress. Consequently, their balance sheets and revenue streams may be
adversely impacted and hence impair their capacity to honour obligations arising
from contracted debts and other liabilities.
22. Due to the strategic nature of those SOEs and other companies where
Government has a stake and the overall importance to the economy, the
Government may be obligated to intervene through various measures. This may
include underwriting/guaranteeing contracted debts and other liabilities, and/or
direct cash bailout through provision of budgetary resources and this poses
77 2019 Budget Policy Statement
potential fiscal risks. The Government will continue to put in place measures
including appropriate legislations and policy directives to monitor and mitigate any
potential fiscal risks as a result of Government’s stake in SOEs and other
companies that are of strategic importance.
Management of Government Assets
23. The National Government has established a National assets and Liabilities
management department mandated to develop, through a consultative process, an
overarching Assets and Liabilities Management framework. In addition, the
Government will develop policies, guidelines and standards with the objective of
ensuring that;
i. All Government Public entities maintains a complete and accurate
register of assets and liabilities. The entities’ registers will then inform
the national register for the government of Kenya.
ii. All Government entities put in place consistent and seamless processes
of managing Assets and Liabilities so that there is reduced mis- use and
underutilization of Government Assets.
iii. There is a Rollout of standardized reporting tools on assets and
liabilities management to all government entities.
iv. The Government undertake continuous research on global trends in
assets and liability guidelines, legislation and regulations for the
purpose of undertaking the assets and liabilities polities and Register.
v. There is identification of user requirements in relation to acquiring an
efficient and integrated assets and liabilities management information
system.
vi. Risk management and mitigation register for assets and liabilities is
developed.
vii. There is adequate sensitization of all Government entities on the risks
associated with acquisition of assets.
viii. Develop a framework for fleet management in National and County
Governments.
Unfunded Pension Liabilities
24. Under current pension arrangements, the Government funds its pension
liabilities from the current budget based on projections of those entering retirement
from the public service. The legal retirement window ranges from 50 years to 60
years, where 50 years is the voluntary retirement age while 60 years is mandatory.
Unfunded pension liabilities arise as a fiscal risk as the projected voluntary retirees’
pension liabilities have yet to be quantified and the Government has not set aside
a fund or scheme to cover for these. Were the proportion of voluntary retirees to
78 2019 Budget Policy Statement
all claim pension, the Government would face a larger pension liability putting a
burden on the current budget.
Public Private Partnership (PPP) Projects
25. Since 1996 and as a result of progressive legal, regulatory and institutional
reforms of the economy, Kenya has attracted private investments into the country’s
economic infrastructure sectors including telecommunications, energy, transport,
water and sewerage. The frontrunner sector to lock in private participation in
public infrastructure development is the energy sector – which witnessed its first
Independent Power Producers (IPPs) in electricity generation starting from 1996.
26. Currently, all of the country’s generated electricity is private sector-led, with
fifteen (15) active IPPs that generate a total of 695MW out a total of 2,278 MW
effective capacity (contracted output from the stations under normal operating
conditions) in Kenya as documented by the Kenya Power in its annual report for
the year ended 30th June 2018. In addition, the transmission line evacuating the
300MW Lake Turkana Wind Power Project (LTWP) is complete and in use. The
project is already injecting into the National Grid. At full capacity, it will be 300
MW of wind energy added onto the National Grid. The greatest economic impact
from this new addition is expected to be seen in electricity tariff reduction for
consumers.
Planned Infrastructure PPP Projects in Kenya
27. Following the adoption of the PPP Policy in 2011, and the enactment of the
PPP Act in 2013, as well as the establishment and operationalization of critical PPP
institutions (the PPP Committee, the PPP Unit and the Petition Committee), there
has been a steady growth in the quality and size of the PPP pipeline of projects,
drawn from diverse economic sectors and County Governments. A total of 76
projects are in the National Priority List of PPP projects as of December 2018.
These projects are in various sectors i.e. Transport and Infrastructure, Energy,
Health, Education, Water and Environment, Housing, Tourism, Manufacturing,
Agriculture and Livestock (Annex Table 5). Table 2.2 below highlights some of
the projects that are currently at advanced stages of the PPP process.
Table 2.2: Planned PPP projects for the period 2019-2021
Sector
Roads
PPP Toll Road Projects:
Procurement is ongoing for the following projects
o 2nd Nyali Bridge
o Nairobi-Nakuru-Mau Summit road
The following projects are ready for tender
o Nairobi-Mombasa road
o O&M Nairobi-Thika road
79 2019 Budget Policy Statement
Sector
Road Annuity Phase 1
PPP projects at construction phase
o Lot 33 (Ngong-Kiserian-Isinya Road, and Kajiado-Mashuru-Isara Road)- 90.55 KM
PPP Project agreements have been signed for;
o Lot 3 (Modogashe-Habaswein-Wajir and El Wak-Rhamu-Mandera Roads)- 143 KM
Project agreements for the following projects are ready for signing;
o Lot 15 (select urban roads in Nyeri, Kirinyaga, Murang'a, Embu, Tharaka Nithi
and Laikipia Counties)- 45.12 KM
o Lot 18 (select urban roads in Kakamega, Vihiga, Bungoma and Busia Counties)
- 35.1 KM
Contract negotiations with private party have been concluded for the following
projects;
o Lot 32 (Illasit - Njukini – Taveta)- 66.5 KM
Contract negotiations with private party are ongoing for the following projects;
o Lot 8 (Bomas – Kiserian – Magadi , Bomas- Karen - Dagoret – Ruiru, Uplands-
Githunguri-Ngewa-Ruiru)- 71.46 KM
o Lot 10 (Nanyuki- Gwa Kungu, Laisamis-Ngurunit-Nursery (South Horr)- 219.6
KM
Transport
o Likoni Aerial Cable Car- PPP project agreements have been signed for the
following projects and conditions precedent to Financial Close are being
addressed.
o Shimoni Port- feasibility study has been completed
Energy
PPP project agreements have been signed for the following projects and conditions
precedent to Financial Close are being addressed
o 1050MW Coal Power Plant in Lamu
o 105 MW Menengai Phase 1 (35 MW Sosian Menengai Geothermal Power Plant, 35
MW Quantum Menengai Geothermal Power Plant)
Contract negotiations ongoing for the following project
o 105 MW Menengai Phase 1 (35 MW Ormat Orpower Geothermal Power Plant)
Feasibility study report has been completed for the following project
o 140 MW Geothermal PPP project at Olkaria
LAPSSET
Negotiations with private party are ongoing for the following projects
o O&M of Lamu Port (1st three berths)-
o Lamu – Garissa- Isiolo Highway- Negotiations with private party ongoing
Health
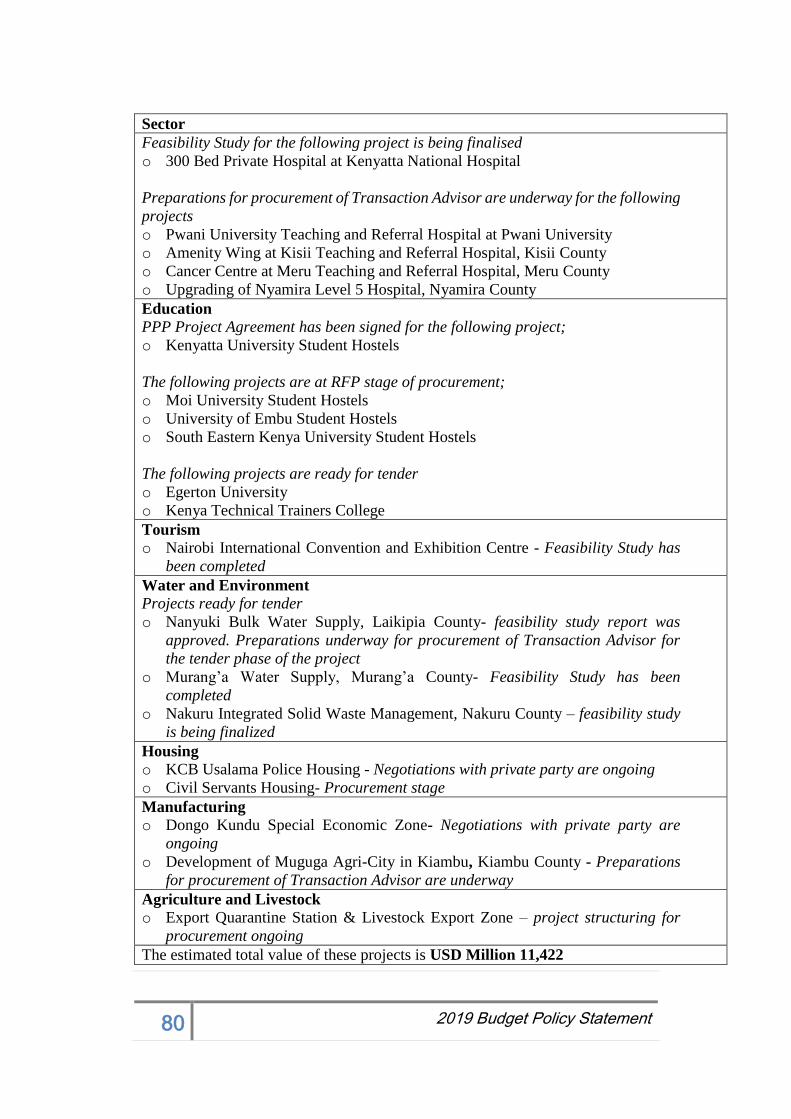
80 2019 Budget Policy Statement
Sector
Feasibility Study for the following project is being finalised
o 300 Bed Private Hospital at Kenyatta National Hospital
Preparations for procurement of Transaction Advisor are underway for the following
projects
o Pwani University Teaching and Referral Hospital at Pwani University
o Amenity Wing at Kisii Teaching and Referral Hospital, Kisii County
o Cancer Centre at Meru Teaching and Referral Hospital, Meru County
o Upgrading of Nyamira Level 5 Hospital, Nyamira County
Education
PPP Project Agreement has been signed for the following project;
o Kenyatta University Student Hostels
The following projects are at RFP stage of procurement;
o Moi University Student Hostels
o University of Embu Student Hostels
o South Eastern Kenya University Student Hostels
The following projects are ready for tender
o Egerton University
o Kenya Technical Trainers College
Tourism
o Nairobi International Convention and Exhibition Centre - Feasibility Study has
been completed
Water and Environment
Projects ready for tender
o Nanyuki Bulk Water Supply, Laikipia County- feasibility study report was
approved. Preparations underway for procurement of Transaction Advisor for
the tender phase of the project
o Murang’a Water Supply, Murang’a County- Feasibility Study has been
completed
o Nakuru Integrated Solid Waste Management, Nakuru County – feasibility study
is being finalized
Housing
o KCB Usalama Police Housing - Negotiations with private party are ongoing
o Civil Servants Housing- Procurement stage
Manufacturing
o Dongo Kundu Special Economic Zone- Negotiations with private party are
ongoing
o Development of Muguga Agri-City in Kiambu, Kiambu County - Preparations
for procurement of Transaction Advisor are underway
Agriculture and Livestock
o Export Quarantine Station & Livestock Export Zone – project structuring for
procurement ongoing
The estimated total value of these projects is USD Million 11,422
81 2019 Budget Policy Statement
28. The Government understands that any PPP project comprises roles and
responsibilities for both the public and private sector. In particular and based on
specific project needs, the public sector’s contributions to the “partnership” of
PPPs would typically include the use of multiple instruments of support and credit
enhancement measures such as project development funding, Viability Gap
Funding such as upfront capital grants contribution and operational grants or
subsidies or unitary payments, as well as various forms of revenue guarantees,
Partial Risk Guarantees (PRG), among others. The Government has finalized and
is already implementing a policy on the issuance of Government Support Measures
(GSM) with an objective of providing a clear structure and process for the issuance
of Government Support instruments for public infrastructure projects. The GSM
policy document is available at www.treasury.go.ke
29. In accordance with Section 7(1) of the PPP Act, the PPP Committee has
adopted a Fiscal Commitments and Contingent Liabilities (FCCL) Management
Framework to ensure approval of, and fiscal accountability in, the management of
financial and any other form of Government support granted in the implementation
of the country’s PPP programme.
30. To implement the FCCL Framework, an FCCL Unit has been established
under the Directorate of Public Debt Management within the National Treasury
and Planning and the Unit is responsible for: mandatory evaluation of all proposed
PPP projects for financial risks and contingent liabilities as a condition of project
approval; confirmation of this initial approval at feasibility stage, as well as at
preferred bidder stage and also after the final negotiated project structure is
secured; regular monitoring of all support measures for any amendment(s) or
variation(s) to a project agreement’s terms and conditions during the
implementation period of the project, as well as oversight of FCCL-impacting
aspects of a project’s overall outputs or any variations to the project agreement.
Currently, the Government is in the process of strengthening the staffing levels of
the FCCL Unit to make it fit for purpose
31. All Government Support Measures and other security instruments provided
under the PPP Plan, together with all other contingent liabilities are integrated into
the national debt management process. As part of the Annual Debt Report,
published under Article 201 of the Constitution by the National Treasury, all
FCCLs are disclosed and reported on. In addition, as part of increasing
accountability and transparency within the PPP space, the PPP Unit in
collaboration with the World Bank finalized and unveiled a PPP Disclosure
Framework in June 2018. The Disclosure Portal is available at www.pppunit.go.ke
and will be routinely updated to ensure it serves the purposes for which it was set
up.
32. To support PPP project implementation, the PPP Project Facilitation Fund
(PFF) (a multi-purpose revolving fund) established under the PPP Act became
operational in June 2018 and provides a good Governance Framework for the more
efficient development of the PPP programme in Kenya. The Fund is dedicated to
four fundamental project-related functions: firstly, to support project preparation,
82 2019 Budget Policy Statement
secondly, to provide Viability Gap Funding for PPP projects, thirdly, to provide a
source of liquidity for the management of Contingent Liabilities arising from PPP
project implementation, and fourthly to support the technical mandate of the PPP
Unit.
33. To entrench better outcomes in fiscal risk management in PPP projects, the
National Treasury is also placing a lot of emphasis in project financial models, with
the view to ensuring that project financial structured are optimized to achieve a
balance between efficient and affordable project-debt repayment and equity pay-
out, but more importantly, to ensure greater project-level transparency for more
effective contract management structures for PPP projects. This way, overall fiscal
exposure of Government is potentially lowered.
Implicit Contingent Liabilities
Natural Disasters and Man-made Hazards
34. The post-disaster needs assessment by the Government indicates that the
natural disasters experienced in the recent past have adversely impacted Kenya’s
key sectors of the economy. For instance, the drought in the 2016-2017 period
adversely affected the growth of the agricultural sector thereby lowering economic
growth with huge budgetary implications. Furthermore, the floods experienced in
2018 impacted on agriculture, infrastructure such as electricity poles and
transformers, roads, bridges and therefore affect households both directly and
indirectly.
35. Beside the natural disasters, the Government is concerned about the rise in and
intensity of man-made hazards, structural collapses and developments in energy
and petroleum sector and their implications on lives and properties.
36. Once a disaster occurs the Government is always obligated to prevent social
welfare reduction by incurring cost of returning normalcy. This in turn has fiscal
implications. Therefore, to mitigate against this fiscal risk, the Government has
prioritized disaster risk management. In this course, the Government has been
sensitizing both the National Government and County Governments’ staff on the
five HYOGO Framework of Actions. The Government has also been implementing
the Sendai Framework for Disaster Risk Reduction (SFDRR) 2015-2030 in order
to address the increasing potential losses. Through this framework, the
Government intends to substantially reduce disaster risks and loss of lives,
livelihoods and health across the country.
37. The Government has also embarked on the development of the National Policy
on Disaster Risk Management (DRM) and the Disaster Risk Management Bill in
order to increase the understanding of disaster risk, strengthen disaster risk
governance aimed at reducing disaster risk, enhance disaster preparedness for
effective response, enhance coordination with all the 47 Counties DRM, and
rebuild better recovery, rehabilitation and reconstruction.
83 2019 Budget Policy Statement
38. To fully operationalize the DRM framework, the Government will develop an
effective multi-hazard early warning system and preparedness, operationalize the
National Drought Emergency Fund, develop DRM information database and
hazard and risk mapping in the country, conduct capacity building and civic
education on DRM, mainstreaming DRM in other sectors and set up a monitoring
and evaluation framework for DRM. Further, the Government will implement the
Disaster Risk Financing Strategy to enable the government to improve its response
to the impact of natural disasters and improve efficiency and effectiveness of
budget allocation and execution.
Climate Change Related Fiscal Risks to the Economy
39. The world is expected to get warmer majorly due to human activity and natural
variability. Climate risks pose grave threats to Kenya’s development goals through
physical consequences that include changed precipitation patterns, rise in sea level,
more intense and frequent extreme weather events, and increased prevalence of
vector-borne diseases as well as catastrophic events, such as prolonged droughts
and flooding in many Counties.
40. Kenya’s economy is largely dependent on rain-fed agriculture and tourism
which are susceptible to climate variability and extreme weather events. Increasing
inter-seasonal variability and declining rainfall in the rainy seasons have resulted
into reduced agricultural yields in recent years. Recurrent droughts and floods
which are worsened by increasing temperatures, heavy rainfall events and sea level
rise, lead to severe crop and livestock losses, famine and displacement. The
expanding informal settlements as a result of high population growth in urban areas
are also at risk of water scarcity, flooding and heat.
41. Climate change impacts bring with them fiscal implications which affect the
fiscal position by lowering tax revenues and increasing public spending to mitigate
the resulting natural disasters. In particular, climate change results to substantial
reallocation of resources towards mitigation, adaptation to climate change and
addressing emergence of natural disasters. For example, the severe drought of mid-
2016 and 2017 and floods in early 2018 let to reallocation of substantial funds to
the affected areas.
42. In recognition of the serious threats posed by climate change, the Government
has been leading the process of developing instruments for climate proofing
vulnerable sectors of the economy through enhancing mitigation and adaptation
measures. This includes the continued facilitation of adherence to the Climate
Change Act, 2016; mainstreaming Climate Change actions in development
planning, budgeting and implementation process through National Climate Change
Action Plan (NCCAP); and setting up mechanisms to track climate change finances
through Climate Change Budget Coding.
43. The Government is also implementing a Green Economy Strategy which seeks
to guide development actors to adopt pathways with higher green growth. Further,
the National Government is partnering with County Governments to implement
84 2019 Budget Policy Statement
climate change initiatives at the County level which include development of
Climate Change Bills and policies in various Counties and Sectorial Climate
Change Policies and initiatives. Further, the Government will operationalize the
Kenya Climate Change Fund (CCF), increase mobilization of climate finances
from the Green Climate Fund (GCF) and Green Bonds in order to finance
mitigation and adaptation initiatives at the National and County Governments.
Evolving Acts of Terrorism (Violent Extremism)
44. The risk of terrorist attacks may hinder economic development through direct
costs such as loss of labour and capital, and diversion of funds to counter terrorism.
Other consequences include restriction of movement of people, religious
animosity, and reduction in investments and tourism which is a great earner for
Kenya.
45. The repercussions of terrorist attacks negatively impact on Government
expenditure by increasing Government spending on security and peace restoration
as well as redeeming the country’s image and, hence, is a risk to the Government’s
fiscal framework.
46. Privy to the serious threats posed by terrorism, the Government is
continuously prioritizing reforms that enhance security and sustain a conducive
business environment. These reforms include development of counter-terrorism
strategies that involve cooperation among all security agencies, enhanced
specialised training and use of technology by security agencies specific to changing
trends in crime, increasing collaboration with local communities on security
matters, security modernization involving acquisition of modern security
equipment, and raising awareness to potential threats.
Technological Disaster
47. Information, Communication and Technology (ICT) remains a key sector for
the achievement of “The Big Four” Plan and the Kenya Vision 2030. It links
strongly with all other sectors and plays a catalytic role in enhancing productivity
and lowering the cost of achieving financial intermediation, e-commerce and
governance. The sector also continues to be vital as the Government pursues to
attain a knowledge-based society.
48. The number of mobile, internet and mobile money subscribers has increased
sharply in the recent past signifying that more Kenyans have access to efficient
financial services. Owing to the success of mobile money, various financial
products have been leveraged on this payment channel increasing the inter linkages
between this technology and the banking sector. The Government is also using the
technology to provide services and receive payments online using products such
as the IFMIS, GHRIS, and IPPD, iTax, e-procurement, Huduma centres and e-
citizen. In this regard, large volumes of money are transacted through the mobile
money systems, being payments to Government for services offered as well as
payments to the private sector.
85 2019 Budget Policy Statement
49. Therefore, given the importance of ICT in service delivery in the country,
cybercrime, fraud and the disruption of the mobile money would lead to data
corruption and substantial loss of potential Government revenue, customer
deposits and market confidence. The Government might therefore, be under
pressure to compensate losses and hence should be considered as a plausible fiscal
risk.
50. Recognizing the possibility of occurrence of these threats, the Government is
continuously sensitizing all users on the importance of enhancing cyber security.
The Government has also established the Kenya Computer Incidence Response
Team, the Cyber Command and Incidence Response Centre and developed the
Information Security Policy to guide secure use of ICT in Government.
51. To secure the ICT Sector, the Government will implement the National
Information Security programme by enhancing Government Common Core
Network (GCCN) security, implementing security policies and deploying firewall
at all the gateways, developing and implementing security framework of the entire
Government cloud and establishing cyber security Research Institute.
Financial Integrity
52. To combat terrorism and money laundering, the Government established the
Financial Reporting Centre (FRC) under the Proceeds of Crime and Anti-Money
Laundering Act (POCAMLA) 2009. Further, the Government established the
Kenya Depository Insurance Corporation (KDIC) through an Act of Parliament to
provide deposit insurance scheme for depositors of member institutions. Prior to
the establishment of KDIC, deposit insurance was being handled by the Deposit
Protection Fund under the Central Bank of Kenya.
53. KDIC together with Central Bank of Kenya, FRC and other Government
agencies are mandated to undertake joint monitoring and surveillance of financial
institutions and suspicious financial transactions to detect any governance gaps,
financial malpractices and challenges to institute early interventions to prevent
major corporate scandals that have seen some financial institutions placed under
receivership.
54. The establishment of FRC & KDIC together with Government efforts to
enhance good corporate governance will go a long way in building public trust and
investors' confidence in corporate bodies operating in the country. With enhanced
public trust and investors' confidence in corporate bodies, the country will attract
and retain the much-needed foreign direct investments to spur economic growth
and development.
Fiscal Risks Related to Devolution
55. Below is a summary of the main risks that have emerged from Kenya’s fiscal
decentralization, as well as the mitigation measures which are being put in place to
address the risks:
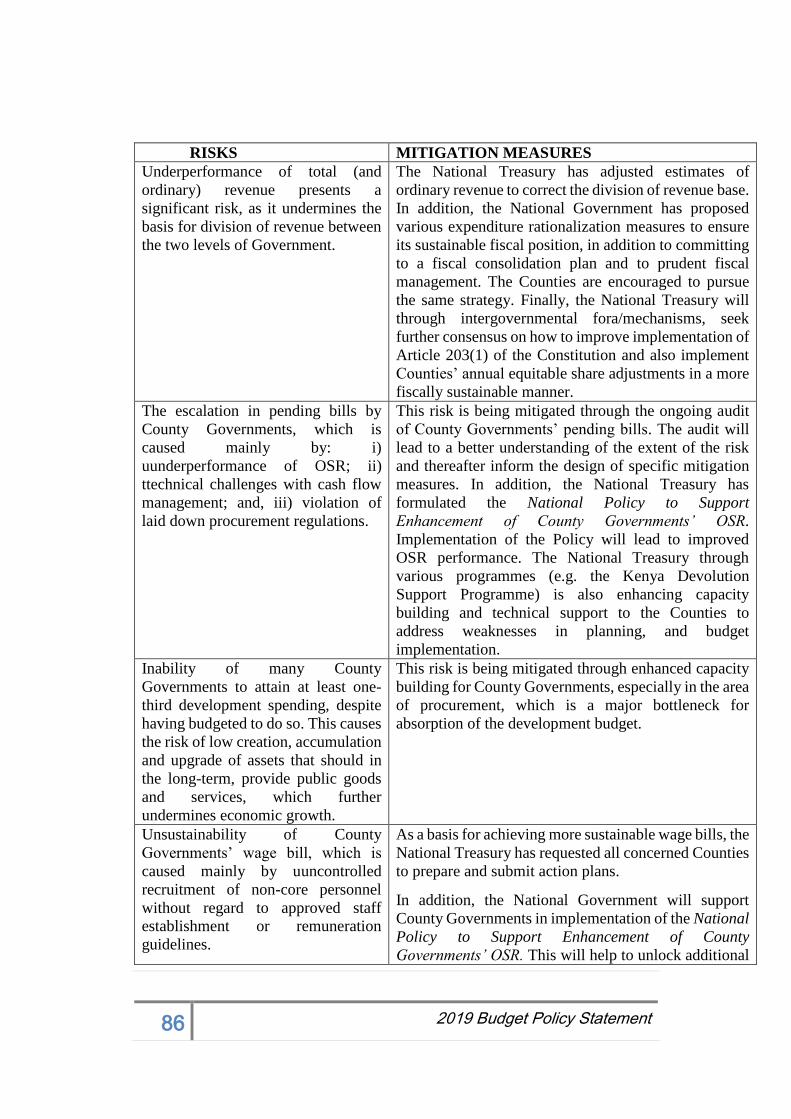
86 2019 Budget Policy Statement
RISKS MITIGATION MEASURES
Underperformance of total (and
ordinary) revenue presents a
significant risk, as it undermines the
basis for division of revenue between
the two levels of Government.
The National Treasury has adjusted estimates of
ordinary revenue to correct the division of revenue base.
In addition, the National Government has proposed
various expenditure rationalization measures to ensure
its sustainable fiscal position, in addition to committing
to a fiscal consolidation plan and to prudent fiscal
management. The Counties are encouraged to pursue
the same strategy. Finally, the National Treasury will
through intergovernmental fora/mechanisms, seek
further consensus on how to improve implementation of
Article 203(1) of the Constitution and also implement
Counties’ annual equitable share adjustments in a more
fiscally sustainable manner.
The escalation in pending bills by
County Governments, which is
caused mainly by: i)
uunderperformance of OSR; ii)
ttechnical challenges with cash flow
management; and, iii) violation of
laid down procurement regulations.
This risk is being mitigated through the ongoing audit
of County Governments’ pending bills. The audit will
lead to a better understanding of the extent of the risk
and thereafter inform the design of specific mitigation
measures. In addition, the National Treasury has
formulated the National Policy to Support
Enhancement of County Governments’ OSR.
Implementation of the Policy will lead to improved
OSR performance. The National Treasury through
various programmes (e.g. the Kenya Devolution
Support Programme) is also enhancing capacity
building and technical support to the Counties to
address weaknesses in planning, and budget
implementation.
Inability of many County
Governments to attain at least one-
third development spending, despite
having budgeted to do so. This causes
the risk of low creation, accumulation
and upgrade of assets that should in
the long-term, provide public goods
and services, which further
undermines economic growth.
This risk is being mitigated through enhanced capacity
building for County Governments, especially in the area
of procurement, which is a major bottleneck for
absorption of the development budget.
Unsustainability of County
Governments’ wage bill, which is
caused mainly by uuncontrolled
recruitment of non-core personnel
without regard to approved staff
establishment or remuneration
guidelines.
As a basis for achieving more sustainable wage bills, the
National Treasury has requested all concerned Counties
to prepare and submit action plans.
In addition, the National Government will support
County Governments in implementation of the National
Policy to Support Enhancement of County
Governments’ OSR. This will help to unlock additional
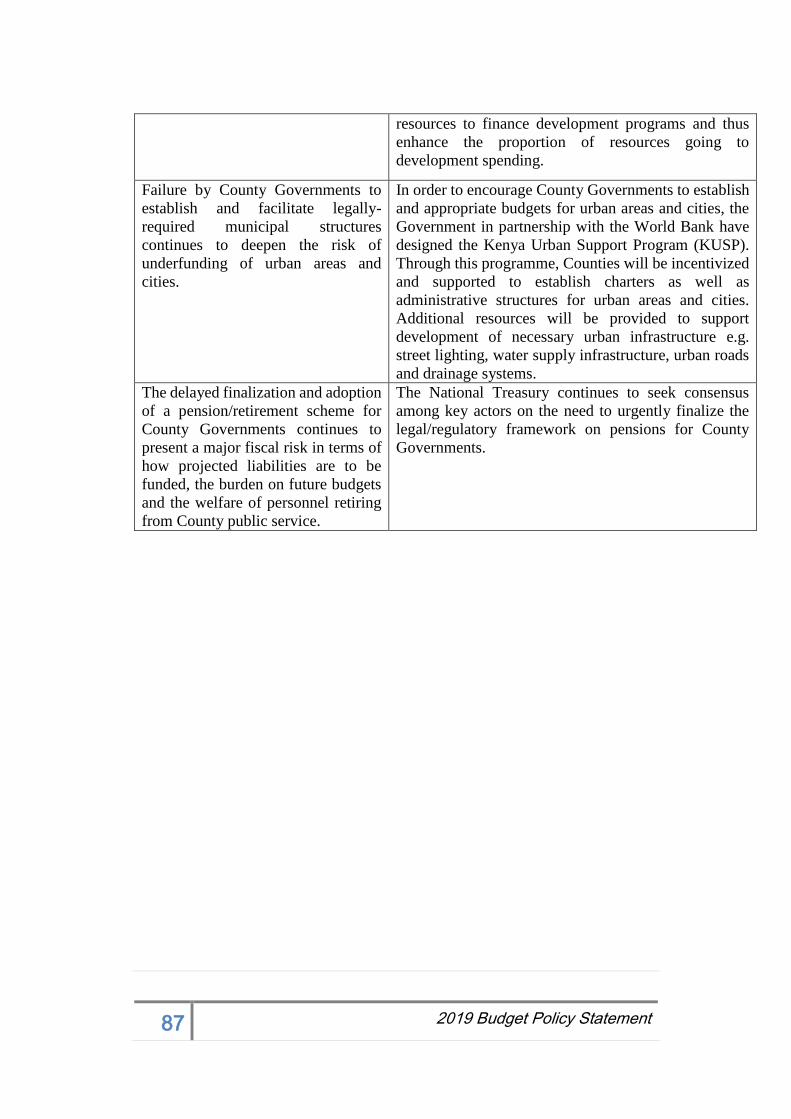
87 2019 Budget Policy Statement
resources to finance development programs and thus
enhance the proportion of resources going to
development spending.
Failure by County Governments to
establish and facilitate legally-
required municipal structures
continues to deepen the risk of
underfunding of urban areas and
cities.
In order to encourage County Governments to establish
and appropriate budgets for urban areas and cities, the
Government in partnership with the World Bank have
designed the Kenya Urban Support Program (KUSP).
Through this programme, Counties will be incentivized
and supported to establish charters as well as
administrative structures for urban areas and cities.
Additional resources will be provided to support
development of necessary urban infrastructure e.g.
street lighting, water supply infrastructure, urban roads
and drainage systems.
The delayed finalization and adoption
of a pension/retirement scheme for
County Governments continues to
present a major fiscal risk in terms of
how projected liabilities are to be
funded, the burden on future budgets
and the welfare of personnel retiring
from County public service.
The National Treasury continues to seek consensus
among key actors on the need to urgently finalize the
legal/regulatory framework on pensions for County
Governments.

88 2019 Budget Policy Statement
Annex Table 1: Macroeconomic Indicators
Act Prel. Act
Rev.
Budget BROP'18 BPS'19 BPS'18 BROP'18 BPS'19 BPS'18 BROP'18 BPS'19 BPS'18 BROP'18 BPS'19 BROP'18 BPS'19
National Account and Prices
Real GDP 5.4 5.4 6.1 6.1 6.1 6.3 6.2 6.2 6.8 6.4 6.4 6.9 6.7 6.7 7.0
GDP deflator 8.4 8.4 7.0 7.0 7.5 6.1 6.8 6.5 5.9 5.9 6.0 5.8 5.8 6.0 6.9 5.8
CPI Index (eop) 6.7 5.0 5.0 5.0 4.9 5.0 5.0 5.0 5.0 5.0 5.0 5.0 5.0 5.0 5.8 5.0
CPI Index (avg) 8.1 5.2 5.0 5.0 4.8 5.0 5.0 5.0 5.0 5.0 5.0 5.0 5.0 5.0 5.0 5.0
Terms of trade (-deterioration) 0.7 0.0 -2.6 -2.6 -3.5 0.3 -1.4 -1.6 0.1 -1.5 -1.8 1.1 1.1 1.1 5.0 -2.2
Money and Credit (end of period)
Net domestic assets 3.9 8.4 18.2 18.3 18.4 19.2 12.1 11.7 16.6 13.4 13.3 14.5 11.9 11.9 11.1
Net domestic credit to the Government 15.3 15.3 17.3 16.7 17.3 10.6 15.2 13.2 7.4 12.9 9.1 7.4 12.7 9.2 11.3 9.2
Credit to the rest of the economy 1.5 4.3 14.0 14.2 14.0 14.7 11.2 11.5 21.8 13.5 14.6 15.5 11.9 13.0 10.2 12.1
Broad Money, M3 (percent change) 6.0 10.5 13.5 13.6 14.1 19.8 13.5 13.1 13.7 12.7 12.8 13.8 13.0 13.1 12.0 13.2
Reserve money (percent change) 2.4 7.4 11.6 11.7 12.2 19.1 12.8 12.4 13.0 12.1 12.1 13.1 12.3 12.4 13.2 12.6
Investment and Saving
Investment 17.9 21.1 22.8 22.9 24.0 22.6 22.5 24.0 22.8 21.8 23.3 23.4 23.4 25.0 25.8 27.9
Central Government 8.2 5.3 6.1 5.9 6.5 5.9 6.1 6.1 5.8 5.8 5.9 6.0 5.8 5.8 5.8 6.0
Other 9.6 15.8 16.7 17.0 17.5 16.7 16.4 17.9 17.0 16.1 17.4 17.4 17.7 19.2 20.0 21.9
Gross National Saving 14.0 15.5 17.6 17.6 18.2 17.1 17.3 18.1 18.0 16.7 17.4 19.2 19.0 19.7 21.7 22.8
Central Government 3.3 1.7 3.1 3.2 3.1 4.6 4.1 3.6 5.2 4.6 4.3 5.5 5.0 4.8 5.4 5.0
Other 10.7 13.8 14.4 14.4 15.0 12.5 13.2 14.5 12.9 12.0 13.1 13.7 13.9 14.9 16.3 17.9
Central Government Budget
Total revenue 18.6 17.3 18.5 18.5 18.3 19.0 18.3 18.3 19.2 18.6 18.5 19.4 19.2 18.8 19.2 18.8
Total expenditure and net lending 27.6 24.4 25.1 24.8 25.1 23.8 23.5 23.9 22.9 22.6 22.8 22.5 22.4 22.5 22.1 22.2
Overall balance (commitment basis) excl. grants -9.0 -7.1 -6.6 -6.2 -6.8 -4.8 -5.1 -5.6 -3.8 -4.0 -4.3 -3.4 -3.5 -3.7 -2.9 -3.4
Overall balance (commitment basis) incl. grants -8.8 -6.8 -6.1 -5.8 -6.3 -4.3 -4.7 -5.1 -3.3 -3.6 -3.9 -3.0 -3.1 -3.3 -2.6 -3.1
Overall balance (commitment basis) incl. grants exl SGR -7.4 -6.1 -5.6 -5.2 -5.3 -3.9 -4.3 -4.7 -2.8 -3.0 -3.4 -2.4 -2.5 -2.7 -2.3 -2.6
Primary budget balance -5.3 -3.1 -2.1 -1.8 -2.5 -0.9 -1.3 -1.3 0.1 -0.2 -0.3 0.4 0.3 0.2 0.4 0.2
Net domestic borrowing 4.0 3.1 3.2 3.0 3.1 2.8 2.8 2.4 3.7 3.7 1.7 4.0 4.0 1.7 1.9 1.6
Total external support (grant & loans) 3.3 2.4 2.8 2.7 3.2 2.8 2.7 2.7 2.7 2.6 2.5 2.7 2.5 2.5 2.5 2.5
External Sector
Exports value, goods and services 15.4 14.4 14.5 14.6 14.4 17.6 14.8 14.6 17.7 15.2 14.9 17.9 16.3 16.0 17.2 16.8
Imports value, goods and services 22.9 23.2 22.5 22.6 23.0 25.9 22.4 22.8 25.0 22.6 23.0 24.4 22.8 23.3 23.2 23.7
Current external balance, including official transfers -3.9 -5.6 -5.2 -5.3 -5.8 -5.5 -5.2 -5.8 -4.8 -5.2 -5.9 -4.2 -4.5 -5.4 -4.1 -5.1
Gross international reserve coverage in months of next
year imports (end of period) 5.1 6.1 6.2 6.2 6.2 6.3 6.2 6.2 6.3 6.3 6.3 6.3 6.4 6.3 6.4 6.4
Gross international reserve coverage in months of this
year's imports (end of period) 6.5 6.9 7.0 7.0 7.0 6.9 7.1 7.1 7.0 7.2 7.2 7.1 7.3 7.3 7.4 7.4
Public debt
Nominal central government debt (eop), net of deposits 51.9 51.5 51.1 51.1 51.5 51.0 49.7 50.6 48.2 47.7 48.8 43.6 46.2 46.4 43.4 44.0
Domestic (gross) 27.6 28.2 27.8 27.8 27.8 27.3 27.3 27.0 25.5 26.7 25.7 23.9 26.0 24.3 24.9 23.1
Domestic (net) 21.9 22.4 22.7 22.7 22.7 23.4 22.8 22.5 22.1 22.7 21.7 20.8 22.5 20.8 21.8 20.0
External 30.0 29.1 28.4 28.4 28.7 27.6 26.9 28.1 26.1 25.0 27.1 22.8 23.7 25.6 21.6 24.1
Memorandum Items:
Nominal GDP (in Ksh Billion) 7,658 8,793 10,043 9,990 10,030 11,101 11,336 11,346 12,621 12,780 12,796 14,364 14,439 14,475 16,342 16,393
Nominal GDP (in US$ Million) 74,816 85,894 98,398 97,883 97,985 107,575 111,056 111,109 122,166 124,546 124,638 138,627 139,967 140,251 157,236 157,655
Source: National Treasury
Notes: BPS = Budget Policy Statement; BROP = Budget Review & Outlook Paper; SGR = Standard Gauge Railway
in percentage of GDP, unless otherwise indicated
2018/192017/182016/17
annual percentage change, unless otherwise indicated
2022/232019/20 2020/21 2021/22
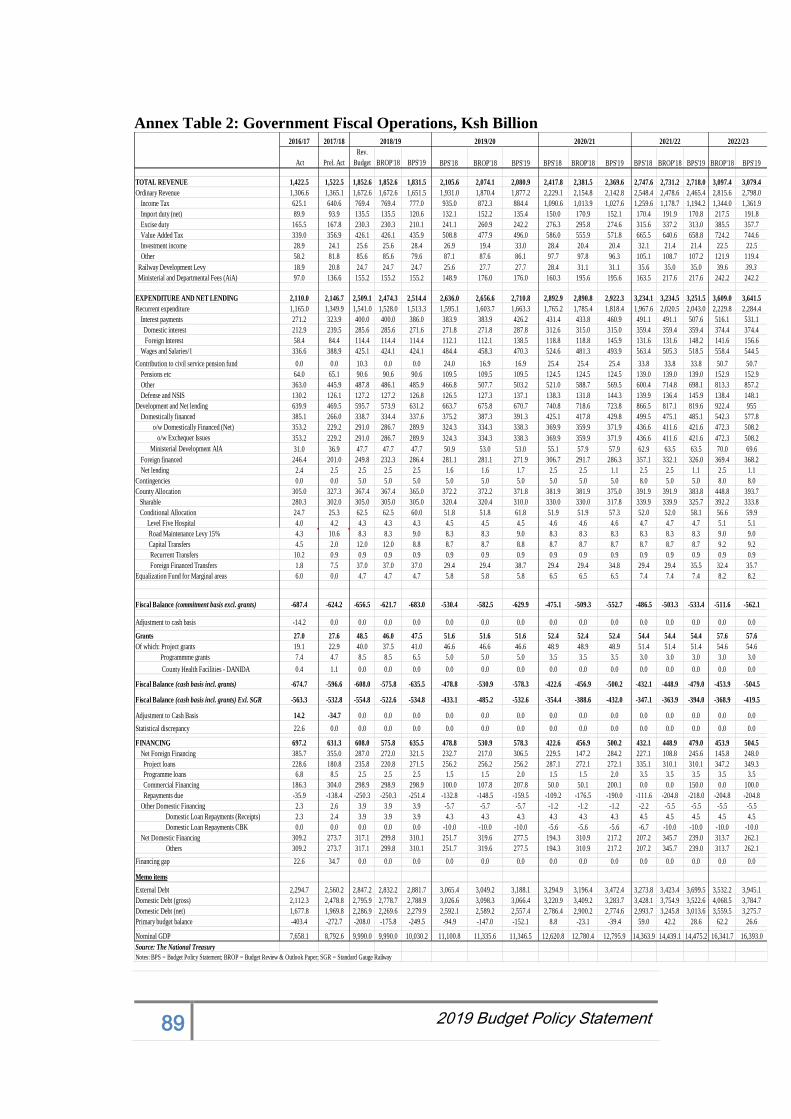
89 2019 Budget Policy Statement
Annex Table 2: Government Fiscal Operations, Ksh Billion
Act Prel. Act
Rev.
Budget BROP'18 BPS'19 BPS'18 BROP'18 BPS'19 BPS'18 BROP'18 BPS'19 BPS'18 BROP'18 BPS'19 BROP'18 BPS'19
TOTAL REVENUE 1,422.5 1,522.5 1,852.6 1,852.6 1,831.5 2,105.6 2,074.1 2,080.9 2,417.8 2,381.5 2,369.6 2,747.6 2,731.2 2,718.0 3,097.4 3,079.4
Ordinary Revenue 1,306.6 1,365.1 1,672.6 1,672.6 1,651.5 1,931.0 1,870.4 1,877.2 2,229.1 2,154.8 2,142.8 2,548.4 2,478.6 2,465.4 2,815.6 2,798.0
Income Tax 625.1 640.6 769.4 769.4 777.0 935.0 872.3 884.4 1,090.6 1,013.9 1,027.6 1,259.6 1,178.7 1,194.2 1,344.0 1,361.9
Import duty (net) 89.9 93.9 135.5 135.5 120.6 132.1 152.2 135.4 150.0 170.9 152.1 170.4 191.9 170.8 217.5 191.8
Excise duty 165.5 167.8 230.3 230.3 210.1 241.1 260.9 242.2 276.3 295.8 274.6 315.6 337.2 313.0 385.5 357.7
Value Added Tax 339.0 356.9 426.1 426.1 435.9 508.8 477.9 496.0 586.0 555.9 571.8 665.5 640.6 658.8 724.2 744.6
Investment income 28.9 24.1 25.6 25.6 28.4 26.9 19.4 33.0 28.4 20.4 20.4 32.1 21.4 21.4 22.5 22.5
Other 58.2 81.8 85.6 85.6 79.6 87.1 87.6 86.1 97.7 97.8 96.3 105.1 108.7 107.2 121.9 119.4
Railway Development Levy 18.9 20.8 24.7 24.7 24.7 25.6 27.7 27.7 28.4 31.1 31.1 35.6 35.0 35.0 39.6 39.3
Ministerial and Departmental Fees (AiA) 97.0 136.6 155.2 155.2 155.2 148.9 176.0 176.0 160.3 195.6 195.6 163.5 217.6 217.6 242.2 242.2
EXPENDITURE AND NET LENDING 2,110.0 2,146.7 2,509.1 2,474.3 2,514.4 2,636.0 2,656.6 2,710.8 2,892.9 2,890.8 2,922.3 3,234.1 3,234.5 3,251.5 3,609.0 3,641.5
Recurrent expenditure 1,165.0 1,349.9 1,541.0 1,528.0 1,513.3 1,595.1 1,603.7 1,663.3 1,765.2 1,785.4 1,818.4 1,967.6 2,020.5 2,043.0 2,229.8 2,284.4
Interest payments 271.2 323.9 400.0 400.0 386.0 383.9 383.9 426.2 431.4 433.8 460.9 491.1 491.1 507.6 516.1 531.1
Domestic interest 212.9 239.5 285.6 285.6 271.6 271.8 271.8 287.8 312.6 315.0 315.0 359.4 359.4 359.4 374.4 374.4
Foreign Interest 58.4 84.4 114.4 114.4 114.4 112.1 112.1 138.5 118.8 118.8 145.9 131.6 131.6 148.2 141.6 156.6
Wages and Salaries/1 336.6 388.9 425.1 424.1 424.1 484.4 458.3 470.3 524.6 481.3 493.9 563.4 505.3 518.5 558.4 544.5
Contribution to civil service pension fund 0.0 0.0 10.3 0.0 0.0 24.0 16.9 16.9 25.4 25.4 25.4 33.8 33.8 33.8 50.7 50.7
Pensions etc 64.0 65.1 90.6 90.6 90.6 109.5 109.5 109.5 124.5 124.5 124.5 139.0 139.0 139.0 152.9 152.9
Other 363.0 445.9 487.8 486.1 485.9 466.8 507.7 503.2 521.0 588.7 569.5 600.4 714.8 698.1 813.3 857.2
Defense and NSIS 130.2 126.1 127.2 127.2 126.8 126.5 127.3 137.1 138.3 131.8 144.3 139.9 136.4 145.9 138.4 148.1
Development and Net lending 639.9 469.5 595.7 573.9 631.2 663.7 675.8 670.7 740.8 718.6 723.8 866.5 817.1 819.6 922.4 955
Domestically financed 385.1 266.0 338.7 334.4 337.6 375.2 387.3 391.3 425.1 417.8 429.8 499.5 475.1 485.1 542.3 577.8
o/w Domestically Financed (Net) 353.2 229.2 291.0 286.7 289.9 324.3 334.3 338.3 369.9 359.9 371.9 436.6 411.6 421.6 472.3 508.2
o/w Exchequer Issues 353.2 229.2 291.0 286.7 289.9 324.3 334.3 338.3 369.9 359.9 371.9 436.6 411.6 421.6 472.3 508.2
Ministerial Development AIA 31.0 36.9 47.7 47.7 47.7 50.9 53.0 53.0 55.1 57.9 57.9 62.9 63.5 63.5 70.0 69.6
Foreign financed 246.4 201.0 249.8 232.3 286.4 281.1 281.1 271.9 306.7 291.7 286.3 357.1 332.1 326.0 369.4 368.2
Net lending 2.4 2.5 2.5 2.5 2.5 1.6 1.6 1.7 2.5 2.5 1.1 2.5 2.5 1.1 2.5 1.1
Contingencies 0.0 0.0 5.0 5.0 5.0 5.0 5.0 5.0 5.0 5.0 5.0 8.0 5.0 5.0 8.0 8.0
County Allocation 305.0 327.3 367.4 367.4 365.0 372.2 372.2 371.8 381.9 381.9 375.0 391.9 391.9 383.8 448.8 393.7
Sharable 280.3 302.0 305.0 305.0 305.0 320.4 320.4 310.0 330.0 330.0 317.8 339.9 339.9 325.7 392.2 333.8
Conditional Allocation 24.7 25.3 62.5 62.5 60.0 51.8 51.8 61.8 51.9 51.9 57.3 52.0 52.0 58.1 56.6 59.9
Level Five Hospital 4.0 4.2 4.3 4.3 4.3 4.5 4.5 4.5 4.6 4.6 4.6 4.7 4.7 4.7 5.1 5.1
Road Maintenance Levy 15% 4.3 10.6 8.3 8.3 9.0 8.3 8.3 9.0 8.3 8.3 8.3 8.3 8.3 8.3 9.0 9.0
Capital Transfers 4.5 2.0 12.0 12.0 8.8 8.7 8.7 8.8 8.7 8.7 8.7 8.7 8.7 8.7 9.2 9.2
Recurrent Transfers 10.2 0.9 0.9 0.9 0.9 0.9 0.9 0.9 0.9 0.9 0.9 0.9 0.9 0.9 0.9 0.9
Foreign Financed Transfers 1.8 7.5 37.0 37.0 37.0 29.4 29.4 38.7 29.4 29.4 34.8 29.4 29.4 35.5 32.4 35.7
Equalization Fund for Marginal areas 6.0 0.0 4.7 4.7 4.7 5.8 5.8 5.8 6.5 6.5 6.5 7.4 7.4 7.4 8.2 8.2
Fiscal Balance (commitment basis excl. grants) -687.4 -624.2 -656.5 -621.7 -683.0 -530.4 -582.5 -629.9 -475.1 -509.3 -552.7 -486.5 -503.3 -533.4 -511.6 -562.1
Adjustment to cash basis -14.2 0.0 0.0 0.0 0.0 0.0 0.0 0.0 0.0 0.0 0.0 0.0 0.0 0.0 0.0 0.0
Grants 27.0 27.6 48.5 46.0 47.5 51.6 51.6 51.6 52.4 52.4 52.4 54.4 54.4 54.4 57.6 57.6
Of which: Project grants 19.1 22.9 40.0 37.5 41.0 46.6 46.6 46.6 48.9 48.9 48.9 51.4 51.4 51.4 54.6 54.6
Programmme grants 7.4 4.7 8.5 8.5 6.5 5.0 5.0 5.0 3.5 3.5 3.5 3.0 3.0 3.0 3.0 3.0
County Health Facilities - DANIDA 0.4 1.1 0.0 0.0 0.0 0.0 0.0 0.0 0.0 0.0 0.0 0.0 0.0 0.0 0.0 0.0
Fiscal Balance (cash basis incl. grants) -674.7 -596.6 -608.0 -575.8 -635.5 -478.8 -530.9 -578.3 -422.6 -456.9 -500.2 -432.1 -448.9 -479.0 -453.9 -504.5
Fiscal Balance (cash basis incl. grants) Exl. SGR -563.3 -532.8 -554.8 -522.6 -534.8 -433.1 -485.2 -532.6 -354.4 -388.6 -432.0 -347.1 -363.9 -394.0 -368.9 -419.5
Adjustment to Cash Basis 14.2 -34.7 0.0 0.0 0.0 0.0 0.0 0.0 0.0 0.0 0.0 0.0 0.0 0.0 0.0 0.0
Statistical discrepancy 22.6 0.0 0.0 0.0 0.0 0.0 0.0 0.0 0.0 0.0 0.0 0.0 0.0 0.0 0.0 0.0
FINANCING 697.2 631.3 608.0 575.8 635.5 478.8 530.9 578.3 422.6 456.9 500.2 432.1 448.9 479.0 453.9 504.5
Net Foreign Financing 385.7 355.0 287.0 272.0 321.5 232.7 217.0 306.5 229.5 147.2 284.2 227.1 108.8 245.6 145.8 248.0
Project loans 228.6 180.8 235.8 220.8 271.5 256.2 256.2 256.2 287.1 272.1 272.1 335.1 310.1 310.1 347.2 349.3
Programme loans 6.8 8.5 2.5 2.5 2.5 1.5 1.5 2.0 1.5 1.5 2.0 3.5 3.5 3.5 3.5 3.5
Commercial Financing 186.3 304.0 298.9 298.9 298.9 100.0 107.8 207.8 50.0 50.1 200.1 0.0 0.0 150.0 0.0 100.0
Repayments due -35.9 -138.4 -250.3 -250.3 -251.4 -132.8 -148.5 -159.5 -109.2 -176.5 -190.0 -111.6 -204.8 -218.0 -204.8 -204.8
Other Domestic Financing 2.3 2.6 3.9 3.9 3.9 -5.7 -5.7 -5.7 -1.2 -1.2 -1.2 -2.2 -5.5 -5.5 -5.5 -5.5
Domestic Loan Repayments (Receipts) 2.3 2.4 3.9 3.9 3.9 4.3 4.3 4.3 4.3 4.3 4.3 4.5 4.5 4.5 4.5 4.5
Domestic Loan Repayments CBK 0.0 0.0 0.0 0.0 0.0 -10.0 -10.0 -10.0 -5.6 -5.6 -5.6 -6.7 -10.0 -10.0 -10.0 -10.0
Net Domestic Financing 309.2 273.7 317.1 299.8 310.1 251.7 319.6 277.5 194.3 310.9 217.2 207.2 345.7 239.0 313.7 262.1
Others 309.2 273.7 317.1 299.8 310.1 251.7 319.6 277.5 194.3 310.9 217.2 207.2 345.7 239.0 313.7 262.1
Financing gap 22.6 34.7 0.0 0.0 0.0 0.0 0.0 0.0 0.0 0.0 0.0 0.0 0.0 0.0 0.0 0.0
Memo items
External Debt 2,294.7 2,560.2 2,847.2 2,832.2 2,881.7 3,065.4 3,049.2 3,188.1 3,294.9 3,196.4 3,472.4 3,273.8 3,423.4 3,699.5 3,532.2 3,945.1
Domestic Debt (gross) 2,112.3 2,478.8 2,795.9 2,778.7 2,788.9 3,026.6 3,098.3 3,066.4 3,220.9 3,409.2 3,283.7 3,428.1 3,754.9 3,522.6 4,068.5 3,784.7
Domestic Debt (net) 1,677.8 1,969.8 2,286.9 2,269.6 2,279.9 2,592.1 2,589.2 2,557.4 2,786.4 2,900.2 2,774.6 2,993.7 3,245.8 3,013.6 3,559.5 3,275.7
Primary budget balance -403.4 -272.7 -208.0 -175.8 -249.5 -94.9 -147.0 -152.1 8.8 -23.1 -39.4 59.0 42.2 28.6 62.2 26.6
Nominal GDP 7,658.1 8,792.6 9,990.0 9,990.0 10,030.2 11,100.8 11,335.6 11,346.5 12,620.8 12,780.4 12,795.9 14,363.9 14,439.1 14,475.2 16,341.7 16,393.0
Source: The National Treasury
Notes: BPS = Budget Policy Statement; BROP = Budget Review & Outlook Paper; SGR = Standard Gauge Railway
2022/232021/222020/212016/17 2018/19 2019/202017/18
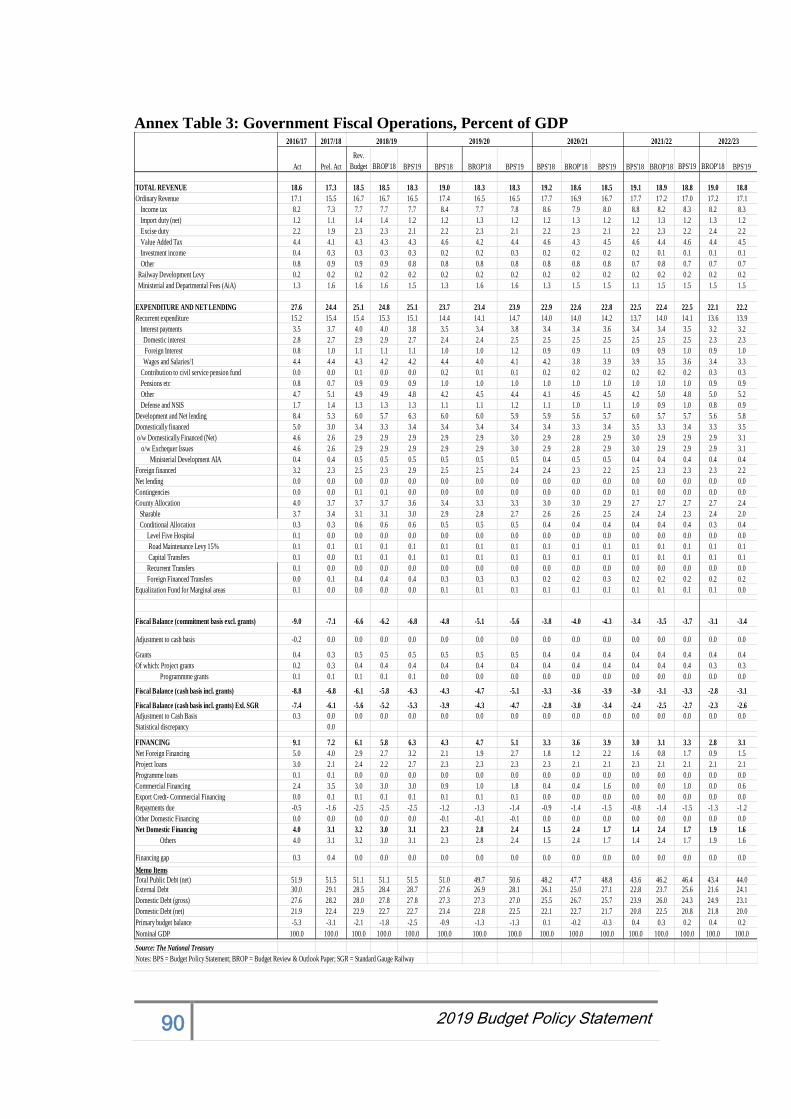
90 2019 Budget Policy Statement
Annex Table 3: Government Fiscal Operations, Percent of GDP
Act Prel. Act
Rev.
Budget BROP'18 BPS'19 BPS'18 BROP'18 BPS'19 BPS'18 BROP'18 BPS'19 BPS'18 BROP'18 BPS'19 BROP'18 BPS'19
TOTAL REVENUE 18.6 17.3 18.5 18.5 18.3 19.0 18.3 18.3 19.2 18.6 18.5 19.1 18.9 18.8 19.0 18.8
Ordinary Revenue 17.1 15.5 16.7 16.7 16.5 17.4 16.5 16.5 17.7 16.9 16.7 17.7 17.2 17.0 17.2 17.1
Income tax 8.2 7.3 7.7 7.7 7.7 8.4 7.7 7.8 8.6 7.9 8.0 8.8 8.2 8.3 8.2 8.3
Import duty (net) 1.2 1.1 1.4 1.4 1.2 1.2 1.3 1.2 1.2 1.3 1.2 1.2 1.3 1.2 1.3 1.2
Excise duty 2.2 1.9 2.3 2.3 2.1 2.2 2.3 2.1 2.2 2.3 2.1 2.2 2.3 2.2 2.4 2.2
Value Added Tax 4.4 4.1 4.3 4.3 4.3 4.6 4.2 4.4 4.6 4.3 4.5 4.6 4.4 4.6 4.4 4.5
Investment income 0.4 0.3 0.3 0.3 0.3 0.2 0.2 0.3 0.2 0.2 0.2 0.2 0.1 0.1 0.1 0.1
Other 0.8 0.9 0.9 0.9 0.8 0.8 0.8 0.8 0.8 0.8 0.8 0.7 0.8 0.7 0.7 0.7
Railway Development Levy 0.2 0.2 0.2 0.2 0.2 0.2 0.2 0.2 0.2 0.2 0.2 0.2 0.2 0.2 0.2 0.2
Ministerial and Departmental Fees (AiA) 1.3 1.6 1.6 1.6 1.5 1.3 1.6 1.6 1.3 1.5 1.5 1.1 1.5 1.5 1.5 1.5
EXPENDITURE AND NET LENDING 27.6 24.4 25.1 24.8 25.1 23.7 23.4 23.9 22.9 22.6 22.8 22.5 22.4 22.5 22.1 22.2
Recurrent expenditure 15.2 15.4 15.4 15.3 15.1 14.4 14.1 14.7 14.0 14.0 14.2 13.7 14.0 14.1 13.6 13.9
Interest payments 3.5 3.7 4.0 4.0 3.8 3.5 3.4 3.8 3.4 3.4 3.6 3.4 3.4 3.5 3.2 3.2
Domestic interest 2.8 2.7 2.9 2.9 2.7 2.4 2.4 2.5 2.5 2.5 2.5 2.5 2.5 2.5 2.3 2.3
Foreign Interest 0.8 1.0 1.1 1.1 1.1 1.0 1.0 1.2 0.9 0.9 1.1 0.9 0.9 1.0 0.9 1.0
Wages and Salaries/1 4.4 4.4 4.3 4.2 4.2 4.4 4.0 4.1 4.2 3.8 3.9 3.9 3.5 3.6 3.4 3.3
Contribution to civil service pension fund 0.0 0.0 0.1 0.0 0.0 0.2 0.1 0.1 0.2 0.2 0.2 0.2 0.2 0.2 0.3 0.3
Pensions etc 0.8 0.7 0.9 0.9 0.9 1.0 1.0 1.0 1.0 1.0 1.0 1.0 1.0 1.0 0.9 0.9
Other 4.7 5.1 4.9 4.9 4.8 4.2 4.5 4.4 4.1 4.6 4.5 4.2 5.0 4.8 5.0 5.2
Defense and NSIS 1.7 1.4 1.3 1.3 1.3 1.1 1.1 1.2 1.1 1.0 1.1 1.0 0.9 1.0 0.8 0.9
Development and Net lending 8.4 5.3 6.0 5.7 6.3 6.0 6.0 5.9 5.9 5.6 5.7 6.0 5.7 5.7 5.6 5.8
Domestically financed 5.0 3.0 3.4 3.3 3.4 3.4 3.4 3.4 3.4 3.3 3.4 3.5 3.3 3.4 3.3 3.5
o/w Domestically Financed (Net) 4.6 2.6 2.9 2.9 2.9 2.9 2.9 3.0 2.9 2.8 2.9 3.0 2.9 2.9 2.9 3.1
o/w Exchequer Issues 4.6 2.6 2.9 2.9 2.9 2.9 2.9 3.0 2.9 2.8 2.9 3.0 2.9 2.9 2.9 3.1
Ministerial Development AIA 0.4 0.4 0.5 0.5 0.5 0.5 0.5 0.5 0.4 0.5 0.5 0.4 0.4 0.4 0.4 0.4
Foreign financed 3.2 2.3 2.5 2.3 2.9 2.5 2.5 2.4 2.4 2.3 2.2 2.5 2.3 2.3 2.3 2.2
Net lending 0.0 0.0 0.0 0.0 0.0 0.0 0.0 0.0 0.0 0.0 0.0 0.0 0.0 0.0 0.0 0.0
Contingencies 0.0 0.0 0.1 0.1 0.0 0.0 0.0 0.0 0.0 0.0 0.0 0.1 0.0 0.0 0.0 0.0
County Allocation 4.0 3.7 3.7 3.7 3.6 3.4 3.3 3.3 3.0 3.0 2.9 2.7 2.7 2.7 2.7 2.4
Sharable 3.7 3.4 3.1 3.1 3.0 2.9 2.8 2.7 2.6 2.6 2.5 2.4 2.4 2.3 2.4 2.0
Conditional Allocation 0.3 0.3 0.6 0.6 0.6 0.5 0.5 0.5 0.4 0.4 0.4 0.4 0.4 0.4 0.3 0.4
Level Five Hospital 0.1 0.0 0.0 0.0 0.0 0.0 0.0 0.0 0.0 0.0 0.0 0.0 0.0 0.0 0.0 0.0
Road Maintenance Levy 15% 0.1 0.1 0.1 0.1 0.1 0.1 0.1 0.1 0.1 0.1 0.1 0.1 0.1 0.1 0.1 0.1
Capital Transfers 0.1 0.0 0.1 0.1 0.1 0.1 0.1 0.1 0.1 0.1 0.1 0.1 0.1 0.1 0.1 0.1
Recurrent Transfers 0.1 0.0 0.0 0.0 0.0 0.0 0.0 0.0 0.0 0.0 0.0 0.0 0.0 0.0 0.0 0.0
Foreign Financed Transfers 0.0 0.1 0.4 0.4 0.4 0.3 0.3 0.3 0.2 0.2 0.3 0.2 0.2 0.2 0.2 0.2
Equalization Fund for Marginal areas 0.1 0.0 0.0 0.0 0.0 0.1 0.1 0.1 0.1 0.1 0.1 0.1 0.1 0.1 0.1 0.0
Fiscal Balance (commitment basis excl. grants) -9.0 -7.1 -6.6 -6.2 -6.8 -4.8 -5.1 -5.6 -3.8 -4.0 -4.3 -3.4 -3.5 -3.7 -3.1 -3.4
Adjustment to cash basis -0.2 0.0 0.0 0.0 0.0 0.0 0.0 0.0 0.0 0.0 0.0 0.0 0.0 0.0 0.0 0.0
Grants 0.4 0.3 0.5 0.5 0.5 0.5 0.5 0.5 0.4 0.4 0.4 0.4 0.4 0.4 0.4 0.4
Of which: Project grants 0.2 0.3 0.4 0.4 0.4 0.4 0.4 0.4 0.4 0.4 0.4 0.4 0.4 0.4 0.3 0.3
Programmme grants 0.1 0.1 0.1 0.1 0.1 0.0 0.0 0.0 0.0 0.0 0.0 0.0 0.0 0.0 0.0 0.0
Fiscal Balance (cash basis incl. grants) -8.8 -6.8 -6.1 -5.8 -6.3 -4.3 -4.7 -5.1 -3.3 -3.6 -3.9 -3.0 -3.1 -3.3 -2.8 -3.1
Fiscal Balance (cash basis incl. grants) Exl. SGR -7.4 -6.1 -5.6 -5.2 -5.3 -3.9 -4.3 -4.7 -2.8 -3.0 -3.4 -2.4 -2.5 -2.7 -2.3 -2.6
Adjustment to Cash Basis 0.3 0.0 0.0 0.0 0.0 0.0 0.0 0.0 0.0 0.0 0.0 0.0 0.0 0.0 0.0 0.0
Statistical discrepancy 0.0
FINANCING 9.1 7.2 6.1 5.8 6.3 4.3 4.7 5.1 3.3 3.6 3.9 3.0 3.1 3.3 2.8 3.1
Net Foreign Financing 5.0 4.0 2.9 2.7 3.2 2.1 1.9 2.7 1.8 1.2 2.2 1.6 0.8 1.7 0.9 1.5
Project loans 3.0 2.1 2.4 2.2 2.7 2.3 2.3 2.3 2.3 2.1 2.1 2.3 2.1 2.1 2.1 2.1
Programme loans 0.1 0.1 0.0 0.0 0.0 0.0 0.0 0.0 0.0 0.0 0.0 0.0 0.0 0.0 0.0 0.0
Commercial Financing 2.4 3.5 3.0 3.0 3.0 0.9 1.0 1.8 0.4 0.4 1.6 0.0 0.0 1.0 0.0 0.6
Export Credt- Commercial Financing 0.0 0.1 0.1 0.1 0.1 0.1 0.1 0.1 0.0 0.0 0.0 0.0 0.0 0.0 0.0 0.0
Repayments due -0.5 -1.6 -2.5 -2.5 -2.5 -1.2 -1.3 -1.4 -0.9 -1.4 -1.5 -0.8 -1.4 -1.5 -1.3 -1.2
Other Domestic Financing 0.0 0.0 0.0 0.0 0.0 -0.1 -0.1 -0.1 0.0 0.0 0.0 0.0 0.0 0.0 0.0 0.0
Net Domestic Financing 4.0 3.1 3.2 3.0 3.1 2.3 2.8 2.4 1.5 2.4 1.7 1.4 2.4 1.7 1.9 1.6
Others 4.0 3.1 3.2 3.0 3.1 2.3 2.8 2.4 1.5 2.4 1.7 1.4 2.4 1.7 1.9 1.6
Financing gap 0.3 0.4 0.0 0.0 0.0 0.0 0.0 0.0 0.0 0.0 0.0 0.0 0.0 0.0 0.0 0.0
Memo Items
Total Public Debt (net) 51.9 51.5 51.1 51.1 51.5 51.0 49.7 50.6 48.2 47.7 48.8 43.6 46.2 46.4 43.4 44.0
External Debt 30.0 29.1 28.5 28.4 28.7 27.6 26.9 28.1 26.1 25.0 27.1 22.8 23.7 25.6 21.6 24.1
Domestic Debt (gross) 27.6 28.2 28.0 27.8 27.8 27.3 27.3 27.0 25.5 26.7 25.7 23.9 26.0 24.3 24.9 23.1
Domestic Debt (net) 21.9 22.4 22.9 22.7 22.7 23.4 22.8 22.5 22.1 22.7 21.7 20.8 22.5 20.8 21.8 20.0
Primary budget balance -5.3 -3.1 -2.1 -1.8 -2.5 -0.9 -1.3 -1.3 0.1 -0.2 -0.3 0.4 0.3 0.2 0.4 0.2
Nominal GDP 100.0 100.0 100.0 100.0 100.0 100.0 100.0 100.0 100.0 100.0 100.0 100.0 100.0 100.0 100.0 100.0
Source: The National Treasury
Notes: BPS = Budget Policy Statement; BROP = Budget Review & Outlook Paper; SGR = Standard Gauge Railway
2022/232021/222016/17 2018/19 2019/20 2020/212017/18
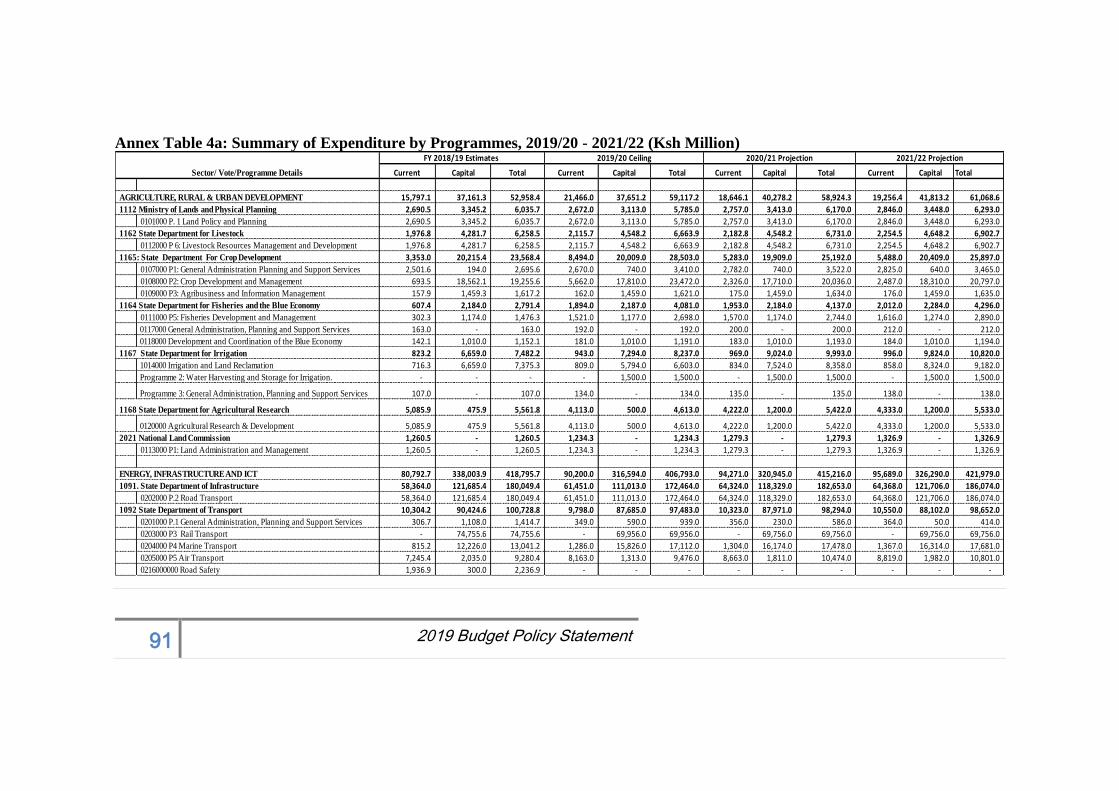
91 2019 Budget Policy Statement
Annex Table 4a: Summary of Expenditure by Programmes, 2019/20 - 2021/22 (Ksh Million)
Current Capital Total Current Capital Total Current Capital Total Current Capital Total
AGRICULTURE, RURAL & URBAN DEVELOPMENT 15,797.1 37,161.3 52,958.4 21,466.0 37,651.2 59,117.2 18,646.1 40,278.2 58,924.3 19,256.4 41,813.2 61,068.6
1112 Ministry of Lands and Physical Planning 2,690.5 3,345.2 6,035.7 2,672.0 3,113.0 5,785.0 2,757.0 3,413.0 6,170.0 2,846.0 3,448.0 6,293.0
0101000 P. 1 Land Policy and Planning 2,690.5 3,345.2 6,035.7 2,672.0 3,113.0 5,785.0 2,757.0 3,413.0 6,170.0 2,846.0 3,448.0 6,293.0
1162 State Department for Livestock 1,976.8 4,281.7 6,258.5 2,115.7 4,548.2 6,663.9 2,182.8 4,548.2 6,731.0 2,254.5 4,648.2 6,902.7
0112000 P 6: Livestock Resources Management and Development 1,976.8 4,281.7 6,258.5 2,115.7 4,548.2 6,663.9 2,182.8 4,548.2 6,731.0 2,254.5 4,648.2 6,902.7
1165: State Department For Crop Development 3,353.0 20,215.4 23,568.4 8,494.0 20,009.0 28,503.0 5,283.0 19,909.0 25,192.0 5,488.0 20,409.0 25,897.0
0107000 P1: General Administration Planning and Support Services 2,501.6 194.0 2,695.6 2,670.0 740.0 3,410.0 2,782.0 740.0 3,522.0 2,825.0 640.0 3,465.0
0108000 P2: Crop Development and Management 693.5 18,562.1 19,255.6 5,662.0 17,810.0 23,472.0 2,326.0 17,710.0 20,036.0 2,487.0 18,310.0 20,797.0
0109000 P3: Agribusiness and Information Management 157.9 1,459.3 1,617.2 162.0 1,459.0 1,621.0 175.0 1,459.0 1,634.0 176.0 1,459.0 1,635.0
1164 State Department for Fisheries and the Blue Economy 607.4 2,184.0 2,791.4 1,894.0 2,187.0 4,081.0 1,953.0 2,184.0 4,137.0 2,012.0 2,284.0 4,296.0
0111000 P5: Fisheries Development and Management 302.3 1,174.0 1,476.3 1,521.0 1,177.0 2,698.0 1,570.0 1,174.0 2,744.0 1,616.0 1,274.0 2,890.0
0117000 General Administration, Planning and Support Services 163.0 - 163.0 192.0 - 192.0 200.0 - 200.0 212.0 - 212.0
0118000 Development and Coordination of the Blue Economy 142.1 1,010.0 1,152.1 181.0 1,010.0 1,191.0 183.0 1,010.0 1,193.0 184.0 1,010.0 1,194.0
1167 State Department for Irrigation 823.2 6,659.0 7,482.2 943.0 7,294.0 8,237.0 969.0 9,024.0 9,993.0 996.0 9,824.0 10,820.0
1014000 Irrigation and Land Reclamation 716.3 6,659.0 7,375.3 809.0 5,794.0 6,603.0 834.0 7,524.0 8,358.0 858.0 8,324.0 9,182.0
Programme 2: Water Harvesting and Storage for Irrigation. - - - - 1,500.0 1,500.0 - 1,500.0 1,500.0 - 1,500.0 1,500.0
Programme 3: General Administration, Planning and Support Services 107.0 - 107.0 134.0 - 134.0 135.0 - 135.0 138.0 - 138.0
1168 State Department for Agricultural Research 5,085.9 475.9 5,561.8 4,113.0 500.0 4,613.0 4,222.0 1,200.0 5,422.0 4,333.0 1,200.0 5,533.0
0120000 Agricultural Research & Development 5,085.9 475.9 5,561.8 4,113.0 500.0 4,613.0 4,222.0 1,200.0 5,422.0 4,333.0 1,200.0 5,533.0
2021 National Land Commission 1,260.5 - 1,260.5 1,234.3 - 1,234.3 1,279.3 - 1,279.3 1,326.9 - 1,326.9
0113000 P1: Land Administration and Management 1,260.5 - 1,260.5 1,234.3 - 1,234.3 1,279.3 - 1,279.3 1,326.9 - 1,326.9
ENERGY, INFRASTRUCTURE AND ICT 80,792.7 338,003.9 418,795.7 90,200.0 316,594.0 406,793.0 94,271.0 320,945.0 415,216.0 95,689.0 326,290.0 421,979.0
1091. State Department of Infrastructure 58,364.0 121,685.4 180,049.4 61,451.0 111,013.0 172,464.0 64,324.0 118,329.0 182,653.0 64,368.0 121,706.0 186,074.0
0202000 P.2 Road Transport 58,364.0 121,685.4 180,049.4 61,451.0 111,013.0 172,464.0 64,324.0 118,329.0 182,653.0 64,368.0 121,706.0 186,074.0
1092 State Department of Transport 10,304.2 90,424.6 100,728.8 9,798.0 87,685.0 97,483.0 10,323.0 87,971.0 98,294.0 10,550.0 88,102.0 98,652.0
0201000 P.1 General Administration, Planning and Support Services 306.7 1,108.0 1,414.7 349.0 590.0 939.0 356.0 230.0 586.0 364.0 50.0 414.0
0203000 P3 Rail Transport - 74,755.6 74,755.6 - 69,956.0 69,956.0 - 69,756.0 69,756.0 - 69,756.0 69,756.0
0204000 P4 Marine Transport 815.2 12,226.0 13,041.2 1,286.0 15,826.0 17,112.0 1,304.0 16,174.0 17,478.0 1,367.0 16,314.0 17,681.0
0205000 P5 Air Transport 7,245.4 2,035.0 9,280.4 8,163.0 1,313.0 9,476.0 8,663.0 1,811.0 10,474.0 8,819.0 1,982.0 10,801.0
0216000000 Road Safety 1,936.9 300.0 2,236.9 - - - - - - - - -
FY 2018/19 Estimates 2019/20 Ceiling 2020/21 Projection 2021/22 Projection
Sector/ Vote/Programme Details
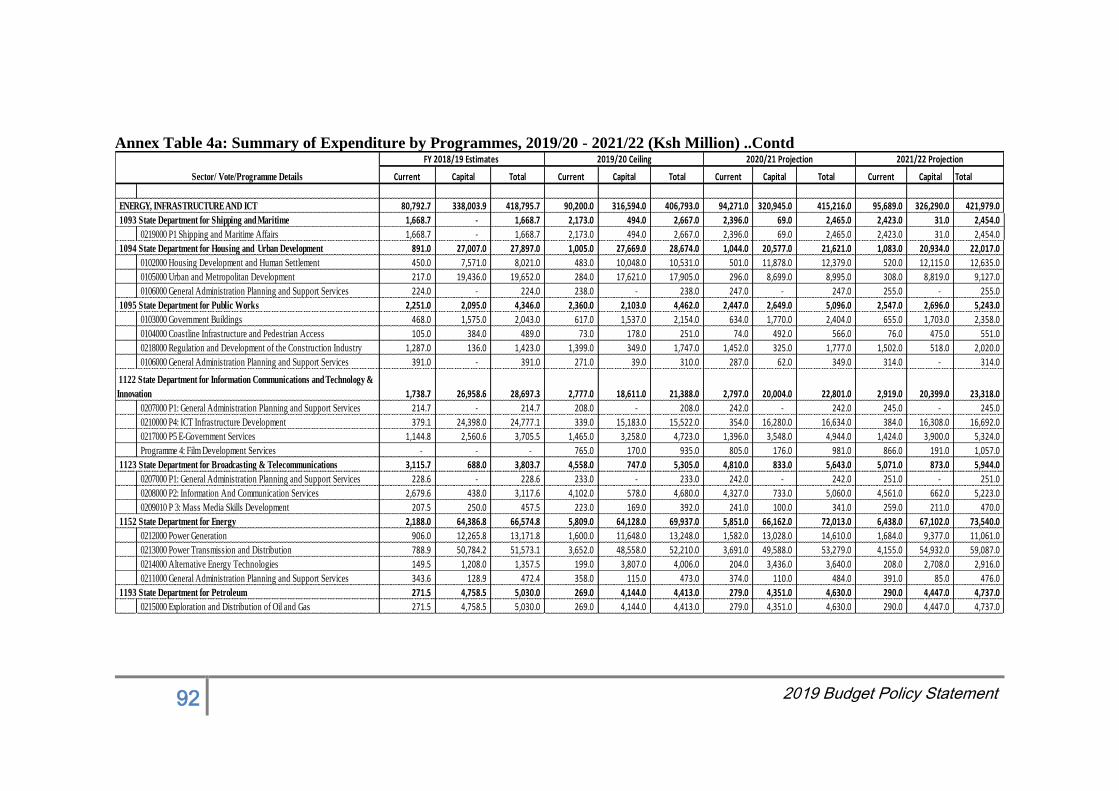
92 2019 Budget Policy Statement
Annex Table 4a: Summary of Expenditure by Programmes, 2019/20 - 2021/22 (Ksh Million) ..Contd
Current Capital Total Current Capital Total Current Capital Total Current Capital Total
ENERGY, INFRASTRUCTURE AND ICT 80,792.7 338,003.9 418,795.7 90,200.0 316,594.0 406,793.0 94,271.0 320,945.0 415,216.0 95,689.0 326,290.0 421,979.0
1093 State Department for Shipping and Maritime 1,668.7 - 1,668.7 2,173.0 494.0 2,667.0 2,396.0 69.0 2,465.0 2,423.0 31.0 2,454.0
0219000 P1 Shipping and Maritime Affairs 1,668.7 - 1,668.7 2,173.0 494.0 2,667.0 2,396.0 69.0 2,465.0 2,423.0 31.0 2,454.0
1094 State Department for Housing and Urban Development 891.0 27,007.0 27,897.0 1,005.0 27,669.0 28,674.0 1,044.0 20,577.0 21,621.0 1,083.0 20,934.0 22,017.0
0102000 Housing Development and Human Settlement 450.0 7,571.0 8,021.0 483.0 10,048.0 10,531.0 501.0 11,878.0 12,379.0 520.0 12,115.0 12,635.0
0105000 Urban and Metropolitan Development 217.0 19,436.0 19,652.0 284.0 17,621.0 17,905.0 296.0 8,699.0 8,995.0 308.0 8,819.0 9,127.0
0106000 General Administration Planning and Support Services 224.0 - 224.0 238.0 - 238.0 247.0 - 247.0 255.0 - 255.0
1095 State Department for Public Works 2,251.0 2,095.0 4,346.0 2,360.0 2,103.0 4,462.0 2,447.0 2,649.0 5,096.0 2,547.0 2,696.0 5,243.0
0103000 Government Buildings 468.0 1,575.0 2,043.0 617.0 1,537.0 2,154.0 634.0 1,770.0 2,404.0 655.0 1,703.0 2,358.0
0104000 Coastline Infrastructure and Pedestrian Access 105.0 384.0 489.0 73.0 178.0 251.0 74.0 492.0 566.0 76.0 475.0 551.0
0218000 Regulation and Development of the Construction Industry 1,287.0 136.0 1,423.0 1,399.0 349.0 1,747.0 1,452.0 325.0 1,777.0 1,502.0 518.0 2,020.0
0106000 General Administration Planning and Support Services 391.0 - 391.0 271.0 39.0 310.0 287.0 62.0 349.0 314.0 - 314.0
1,738.7 26,958.6 28,697.3 2,777.0 18,611.0 21,388.0 2,797.0 20,004.0 22,801.0 2,919.0 20,399.0 23,318.0
0207000 P1: General Administration Planning and Support Services 214.7 - 214.7 208.0 - 208.0 242.0 - 242.0 245.0 - 245.0
0210000 P4: ICT Infrastructure Development 379.1 24,398.0 24,777.1 339.0 15,183.0 15,522.0 354.0 16,280.0 16,634.0 384.0 16,308.0 16,692.0
0217000 P5 E-Government Services 1,144.8 2,560.6 3,705.5 1,465.0 3,258.0 4,723.0 1,396.0 3,548.0 4,944.0 1,424.0 3,900.0 5,324.0
Programme 4: Film Development Services - - - 765.0 170.0 935.0 805.0 176.0 981.0 866.0 191.0 1,057.0
1123 State Department for Broadcasting & Telecommunications 3,115.7 688.0 3,803.7 4,558.0 747.0 5,305.0 4,810.0 833.0 5,643.0 5,071.0 873.0 5,944.0
0207000 P1: General Administration Planning and Support Services 228.6 - 228.6 233.0 - 233.0 242.0 - 242.0 251.0 - 251.0
0208000 P2: Information And Communication Services 2,679.6 438.0 3,117.6 4,102.0 578.0 4,680.0 4,327.0 733.0 5,060.0 4,561.0 662.0 5,223.0
0209010 P 3: Mass Media Skills Development 207.5 250.0 457.5 223.0 169.0 392.0 241.0 100.0 341.0 259.0 211.0 470.0
1152 State Department for Energy 2,188.0 64,386.8 66,574.8 5,809.0 64,128.0 69,937.0 5,851.0 66,162.0 72,013.0 6,438.0 67,102.0 73,540.0
0212000 Power Generation 906.0 12,265.8 13,171.8 1,600.0 11,648.0 13,248.0 1,582.0 13,028.0 14,610.0 1,684.0 9,377.0 11,061.0
0213000 Power Transmission and Distribution 788.9 50,784.2 51,573.1 3,652.0 48,558.0 52,210.0 3,691.0 49,588.0 53,279.0 4,155.0 54,932.0 59,087.0
0214000 Alternative Energy Technologies 149.5 1,208.0 1,357.5 199.0 3,807.0 4,006.0 204.0 3,436.0 3,640.0 208.0 2,708.0 2,916.0
0211000 General Administration Planning and Support Services 343.6 128.9 472.4 358.0 115.0 473.0 374.0 110.0 484.0 391.0 85.0 476.0
1193 State Department for Petroleum 271.5 4,758.5 5,030.0 269.0 4,144.0 4,413.0 279.0 4,351.0 4,630.0 290.0 4,447.0 4,737.0
0215000 Exploration and Distribution of Oil and Gas 271.5 4,758.5 5,030.0 269.0 4,144.0 4,413.0 279.0 4,351.0 4,630.0 290.0 4,447.0 4,737.0
FY 2018/19 Estimates 2019/20 Ceiling 2020/21 Projection 2021/22 Projection
1122 State Department for Information Communications and Technology &
Innovation
Sector/ Vote/Programme Details
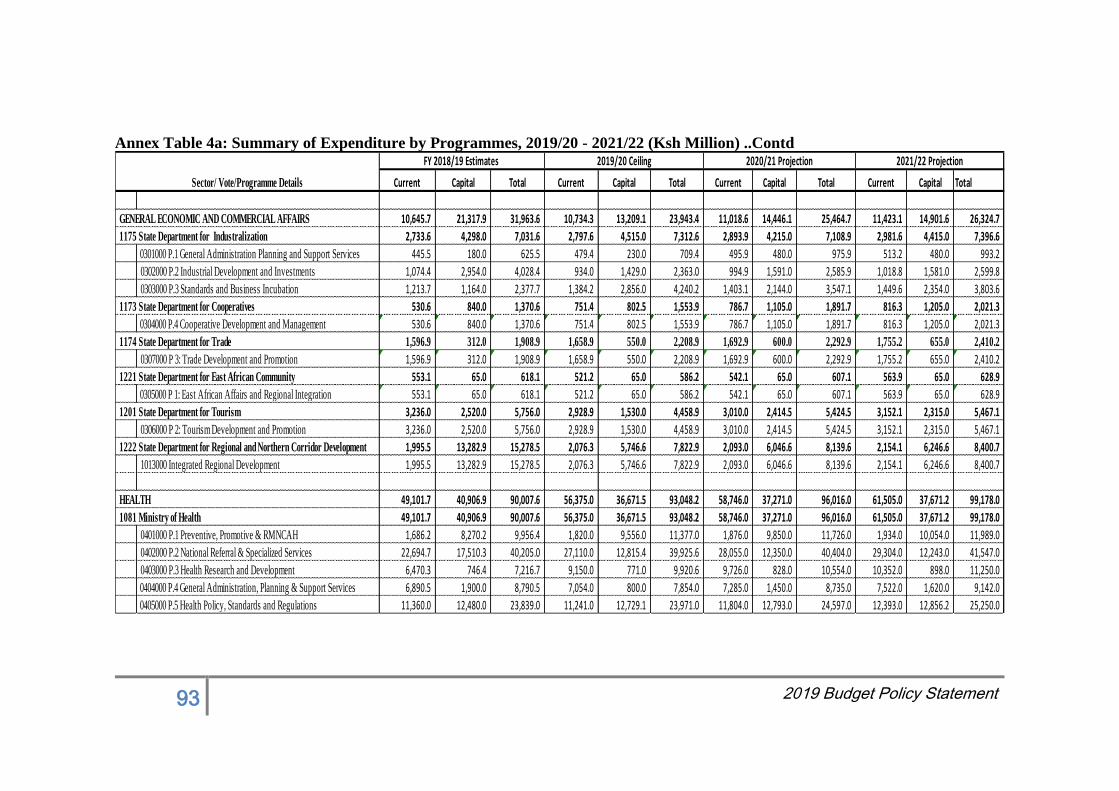
93 2019 Budget Policy Statement
Annex Table 4a: Summary of Expenditure by Programmes, 2019/20 - 2021/22 (Ksh Million) ..Contd
Current Capital Total Current Capital Total Current Capital Total Current Capital Total
GENERAL ECONOMIC AND COMMERCIAL AFFAIRS 10,645.7 21,317.9 31,963.6 10,734.3 13,209.1 23,943.4 11,018.6 14,446.1 25,464.7 11,423.1 14,901.6 26,324.7
1175 State Department for Industralization 2,733.6 4,298.0 7,031.6 2,797.6 4,515.0 7,312.6 2,893.9 4,215.0 7,108.9 2,981.6 4,415.0 7,396.6
0301000 P.1 General Administration Planning and Support Services 445.5 180.0 625.5 479.4 230.0 709.4 495.9 480.0 975.9 513.2 480.0 993.2
0302000 P.2 Industrial Development and Investments 1,074.4 2,954.0 4,028.4 934.0 1,429.0 2,363.0 994.9 1,591.0 2,585.9 1,018.8 1,581.0 2,599.8
0303000 P.3 Standards and Business Incubation 1,213.7 1,164.0 2,377.7 1,384.2 2,856.0 4,240.2 1,403.1 2,144.0 3,547.1 1,449.6 2,354.0 3,803.6
1173 State Department for Cooperatives 530.6 840.0 1,370.6 751.4 802.5 1,553.9 786.7 1,105.0 1,891.7 816.3 1,205.0 2,021.3
0304000 P.4 Cooperative Development and Management 530.6 840.0 1,370.6 751.4 802.5 1,553.9 786.7 1,105.0 1,891.7 816.3 1,205.0 2,021.3
1174 State Department for Trade 1,596.9 312.0 1,908.9 1,658.9 550.0 2,208.9 1,692.9 600.0 2,292.9 1,755.2 655.0 2,410.2
0307000 P 3: Trade Development and Promotion 1,596.9 312.0 1,908.9 1,658.9 550.0 2,208.9 1,692.9 600.0 2,292.9 1,755.2 655.0 2,410.2
1221 State Department for East African Community 553.1 65.0 618.1 521.2 65.0 586.2 542.1 65.0 607.1 563.9 65.0 628.9
0305000 P 1: East African Affairs and Regional Integration 553.1 65.0 618.1 521.2 65.0 586.2 542.1 65.0 607.1 563.9 65.0 628.9
1201 State Department for Tourism 3,236.0 2,520.0 5,756.0 2,928.9 1,530.0 4,458.9 3,010.0 2,414.5 5,424.5 3,152.1 2,315.0 5,467.1
0306000 P 2: Tourism Development and Promotion 3,236.0 2,520.0 5,756.0 2,928.9 1,530.0 4,458.9 3,010.0 2,414.5 5,424.5 3,152.1 2,315.0 5,467.1
1222 State Department for Regional and Northern Corridor Development 1,995.5 13,282.9 15,278.5 2,076.3 5,746.6 7,822.9 2,093.0 6,046.6 8,139.6 2,154.1 6,246.6 8,400.7
1013000 Integrated Regional Development 1,995.5 13,282.9 15,278.5 2,076.3 5,746.6 7,822.9 2,093.0 6,046.6 8,139.6 2,154.1 6,246.6 8,400.7
HEALTH 49,101.7 40,906.9 90,007.6 56,375.0 36,671.5 93,048.2 58,746.0 37,271.0 96,016.0 61,505.0 37,671.2 99,178.0
1081 Ministry of Health 49,101.7 40,906.9 90,007.6 56,375.0 36,671.5 93,048.2 58,746.0 37,271.0 96,016.0 61,505.0 37,671.2 99,178.0
0401000 P.1 Preventive, Promotive & RMNCAH 1,686.2 8,270.2 9,956.4 1,820.0 9,556.0 11,377.0 1,876.0 9,850.0 11,726.0 1,934.0 10,054.0 11,989.0
0402000 P.2 National Referral & Specialized Services 22,694.7 17,510.3 40,205.0 27,110.0 12,815.4 39,925.6 28,055.0 12,350.0 40,404.0 29,304.0 12,243.0 41,547.0
0403000 P.3 Health Research and Development 6,470.3 746.4 7,216.7 9,150.0 771.0 9,920.6 9,726.0 828.0 10,554.0 10,352.0 898.0 11,250.0
0404000 P.4 General Administration, Planning & Support Services 6,890.5 1,900.0 8,790.5 7,054.0 800.0 7,854.0 7,285.0 1,450.0 8,735.0 7,522.0 1,620.0 9,142.0
0405000 P.5 Health Policy, Standards and Regulations 11,360.0 12,480.0 23,839.0 11,241.0 12,729.1 23,971.0 11,804.0 12,793.0 24,597.0 12,393.0 12,856.2 25,250.0
FY 2018/19 Estimates 2019/20 Ceiling 2020/21 Projection 2021/22 Projection
Sector/ Vote/Programme Details
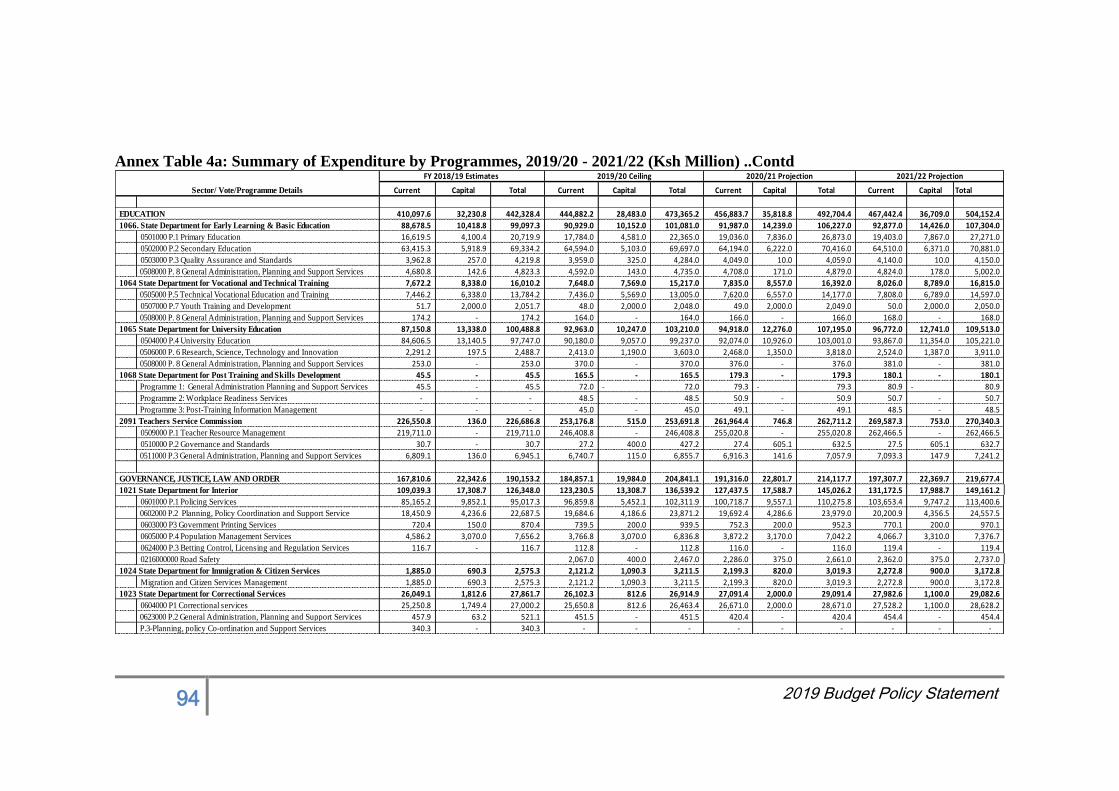
94 2019 Budget Policy Statement
Annex Table 4a: Summary of Expenditure by Programmes, 2019/20 - 2021/22 (Ksh Million) ..Contd
Current Capital Total Current Capital Total Current Capital Total Current Capital Total
EDUCATION 410,097.6 32,230.8 442,328.4 444,882.2 28,483.0 473,365.2 456,883.7 35,818.8 492,704.4 467,442.4 36,709.0 504,152.4
1066. State Department for Early Learning & Basic Education 88,678.5 10,418.8 99,097.3 90,929.0 10,152.0 101,081.0 91,987.0 14,239.0 106,227.0 92,877.0 14,426.0 107,304.0
0501000 P.1 Primary Education 16,619.5 4,100.4 20,719.9 17,784.0 4,581.0 22,365.0 19,036.0 7,836.0 26,873.0 19,403.0 7,867.0 27,271.0
0502000 P.2 Secondary Education 63,415.3 5,918.9 69,334.2 64,594.0 5,103.0 69,697.0 64,194.0 6,222.0 70,416.0 64,510.0 6,371.0 70,881.0
0503000 P.3 Quality Assurance and Standards 3,962.8 257.0 4,219.8 3,959.0 325.0 4,284.0 4,049.0 10.0 4,059.0 4,140.0 10.0 4,150.0
0508000 P. 8 General Administration, Planning and Support Services 4,680.8 142.6 4,823.3 4,592.0 143.0 4,735.0 4,708.0 171.0 4,879.0 4,824.0 178.0 5,002.0
1064 State Department for Vocational and Technical Training 7,672.2 8,338.0 16,010.2 7,648.0 7,569.0 15,217.0 7,835.0 8,557.0 16,392.0 8,026.0 8,789.0 16,815.0
0505000 P.5 Technical Vocational Education and Training 7,446.2 6,338.0 13,784.2 7,436.0 5,569.0 13,005.0 7,620.0 6,557.0 14,177.0 7,808.0 6,789.0 14,597.0
0507000 P.7 Youth Training and Development 51.7 2,000.0 2,051.7 48.0 2,000.0 2,048.0 49.0 2,000.0 2,049.0 50.0 2,000.0 2,050.0
0508000 P. 8 General Administration, Planning and Support Services 174.2 - 174.2 164.0 - 164.0 166.0 - 166.0 168.0 - 168.0
1065 State Department for University Education 87,150.8 13,338.0 100,488.8 92,963.0 10,247.0 103,210.0 94,918.0 12,276.0 107,195.0 96,772.0 12,741.0 109,513.0
0504000 P.4 University Education 84,606.5 13,140.5 97,747.0 90,180.0 9,057.0 99,237.0 92,074.0 10,926.0 103,001.0 93,867.0 11,354.0 105,221.0
0506000 P. 6 Research, Science, Technology and Innovation 2,291.2 197.5 2,488.7 2,413.0 1,190.0 3,603.0 2,468.0 1,350.0 3,818.0 2,524.0 1,387.0 3,911.0
0508000 P. 8 General Administration, Planning and Support Services 253.0 - 253.0 370.0 - 370.0 376.0 - 376.0 381.0 - 381.0
1068 State Department for Post Training and Skills Development 45.5 - 45.5 165.5 - 165.5 179.3 - 179.3 180.1 - 180.1
Programme 1: General Administration Planning and Support Services 45.5 - 45.5 72.0 - 72.0 79.3 - 79.3 80.9 - 80.9
Programme 2: Workplace Readiness Services - - - 48.5 - 48.5 50.9 - 50.9 50.7 - 50.7
Programme 3: Post-Training Information Management - - - 45.0 - 45.0 49.1 - 49.1 48.5 - 48.5
2091 Teachers Service Commission 226,550.8 136.0 226,686.8 253,176.8 515.0 253,691.8 261,964.4 746.8 262,711.2 269,587.3 753.0 270,340.3
0509000 P.1 Teacher Resource Management 219,711.0 - 219,711.0 246,408.8 - 246,408.8 255,020.8 - 255,020.8 262,466.5 - 262,466.5
0510000 P.2 Governance and Standards 30.7 - 30.7 27.2 400.0 427.2 27.4 605.1 632.5 27.5 605.1 632.7
0511000 P.3 General Administration, Planning and Support Services 6,809.1 136.0 6,945.1 6,740.7 115.0 6,855.7 6,916.3 141.6 7,057.9 7,093.3 147.9 7,241.2
GOVERNANCE, JUSTICE, LAW AND ORDER 167,810.6 22,342.6 190,153.2 184,857.1 19,984.0 204,841.1 191,316.0 22,801.7 214,117.7 197,307.7 22,369.7 219,677.4
1021 State Department for Interior 109,039.3 17,308.7 126,348.0 123,230.5 13,308.7 136,539.2 127,437.5 17,588.7 145,026.2 131,172.5 17,988.7 149,161.2
0601000 P.1 Policing Services 85,165.2 9,852.1 95,017.3 96,859.8 5,452.1 102,311.9 100,718.7 9,557.1 110,275.8 103,653.4 9,747.2 113,400.6
0602000 P.2 Planning, Policy Coordination and Support Service 18,450.9 4,236.6 22,687.5 19,684.6 4,186.6 23,871.2 19,692.4 4,286.6 23,979.0 20,200.9 4,356.5 24,557.5
0603000 P3 Government Printing Services 720.4 150.0 870.4 739.5 200.0 939.5 752.3 200.0 952.3 770.1 200.0 970.1
0605000 P.4 Population Management Services 4,586.2 3,070.0 7,656.2 3,766.8 3,070.0 6,836.8 3,872.2 3,170.0 7,042.2 4,066.7 3,310.0 7,376.7
0624000 P.3 Betting Control, Licensing and Regulation Services 116.7 - 116.7 112.8 - 112.8 116.0 - 116.0 119.4 - 119.4
0216000000 Road Safety 2,067.0 400.0 2,467.0 2,286.0 375.0 2,661.0 2,362.0 375.0 2,737.0
1024 State Department for Immigration & Citizen Services 1,885.0 690.3 2,575.3 2,121.2 1,090.3 3,211.5 2,199.3 820.0 3,019.3 2,272.8 900.0 3,172.8
Migration and Citizen Services Management 1,885.0 690.3 2,575.3 2,121.2 1,090.3 3,211.5 2,199.3 820.0 3,019.3 2,272.8 900.0 3,172.8
1023 State Department for Correctional Services 26,049.1 1,812.6 27,861.7 26,102.3 812.6 26,914.9 27,091.4 2,000.0 29,091.4 27,982.6 1,100.0 29,082.6
0604000 P1 Correctional services 25,250.8 1,749.4 27,000.2 25,650.8 812.6 26,463.4 26,671.0 2,000.0 28,671.0 27,528.2 1,100.0 28,628.2
0623000 P.2 General Administration, Planning and Support Services 457.9 63.2 521.1 451.5 - 451.5 420.4 - 420.4 454.4 - 454.4
P.3-Planning, policy Co-ordination and Support Services 340.3 - 340.3 - - - - - - - - -
FY 2018/19 Estimates 2019/20 Ceiling 2020/21 Projection 2021/22 Projection
Sector/ Vote/Programme Details
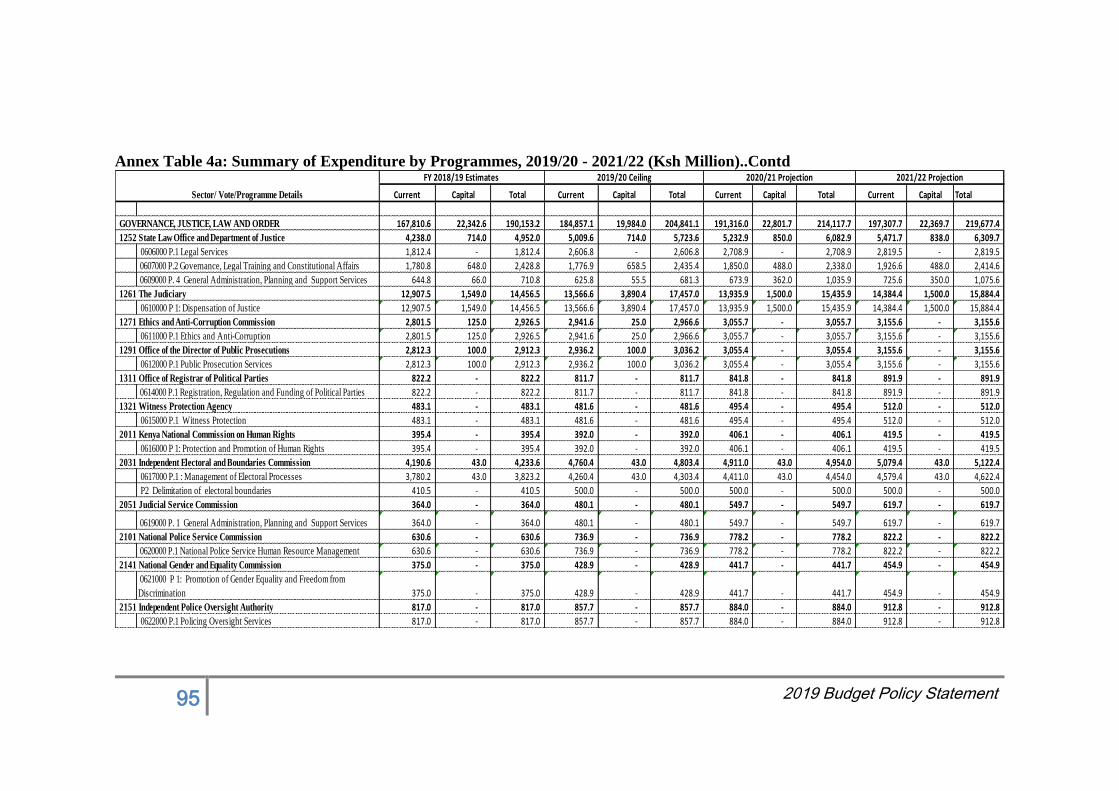
95 2019 Budget Policy Statement
Annex Table 4a: Summary of Expenditure by Programmes, 2019/20 - 2021/22 (Ksh Million)..Contd
Current Capital Total Current Capital Total Current Capital Total Current Capital Total
GOVERNANCE, JUSTICE, LAW AND ORDER 167,810.6 22,342.6 190,153.2 184,857.1 19,984.0 204,841.1 191,316.0 22,801.7 214,117.7 197,307.7 22,369.7 219,677.4
1252 State Law Office and Department of Justice 4,238.0 714.0 4,952.0 5,009.6 714.0 5,723.6 5,232.9 850.0 6,082.9 5,471.7 838.0 6,309.7
0606000 P.1 Legal Services 1,812.4 - 1,812.4 2,606.8 - 2,606.8 2,708.9 - 2,708.9 2,819.5 - 2,819.5
0607000 P.2 Governance, Legal Training and Constitutional Affairs 1,780.8 648.0 2,428.8 1,776.9 658.5 2,435.4 1,850.0 488.0 2,338.0 1,926.6 488.0 2,414.6
0609000 P. 4 General Administration, Planning and Support Services 644.8 66.0 710.8 625.8 55.5 681.3 673.9 362.0 1,035.9 725.6 350.0 1,075.6
1261 The Judiciary 12,907.5 1,549.0 14,456.5 13,566.6 3,890.4 17,457.0 13,935.9 1,500.0 15,435.9 14,384.4 1,500.0 15,884.4
0610000 P 1: Dispensation of Justice 12,907.5 1,549.0 14,456.5 13,566.6 3,890.4 17,457.0 13,935.9 1,500.0 15,435.9 14,384.4 1,500.0 15,884.4
1271 Ethics and Anti-Corruption Commission 2,801.5 125.0 2,926.5 2,941.6 25.0 2,966.6 3,055.7 - 3,055.7 3,155.6 - 3,155.6
0611000 P.1 Ethics and Anti-Corruption 2,801.5 125.0 2,926.5 2,941.6 25.0 2,966.6 3,055.7 - 3,055.7 3,155.6 - 3,155.6
1291 Office of the Director of Public Prosecutions 2,812.3 100.0 2,912.3 2,936.2 100.0 3,036.2 3,055.4 - 3,055.4 3,155.6 - 3,155.6
0612000 P.1 Public Prosecution Services 2,812.3 100.0 2,912.3 2,936.2 100.0 3,036.2 3,055.4 - 3,055.4 3,155.6 - 3,155.6
1311 Office of Registrar of Political Parties 822.2 - 822.2 811.7 - 811.7 841.8 - 841.8 891.9 - 891.9
0614000 P.1 Registration, Regulation and Funding of Political Parties 822.2 - 822.2 811.7 - 811.7 841.8 - 841.8 891.9 - 891.9
1321 Witness Protection Agency 483.1 - 483.1 481.6 - 481.6 495.4 - 495.4 512.0 - 512.0
0615000 P.1 Witness Protection 483.1 - 483.1 481.6 - 481.6 495.4 - 495.4 512.0 - 512.0
2011 Kenya National Commission on Human Rights 395.4 - 395.4 392.0 - 392.0 406.1 - 406.1 419.5 - 419.5
0616000 P 1: Protection and Promotion of Human Rights 395.4 - 395.4 392.0 - 392.0 406.1 - 406.1 419.5 - 419.5
2031 Independent Electoral and Boundaries Commission 4,190.6 43.0 4,233.6 4,760.4 43.0 4,803.4 4,911.0 43.0 4,954.0 5,079.4 43.0 5,122.4
0617000 P.1 : Management of Electoral Processes 3,780.2 43.0 3,823.2 4,260.4 43.0 4,303.4 4,411.0 43.0 4,454.0 4,579.4 43.0 4,622.4
P2 Delimitation of electoral boundaries 410.5 - 410.5 500.0 - 500.0 500.0 - 500.0 500.0 - 500.0
2051 Judicial Service Commission 364.0 - 364.0 480.1 - 480.1 549.7 - 549.7 619.7 - 619.7
0619000 P. 1 General Administration, Planning and Support Services 364.0 - 364.0 480.1 - 480.1 549.7 - 549.7 619.7 - 619.7
2101 National Police Service Commission 630.6 - 630.6 736.9 - 736.9 778.2 - 778.2 822.2 - 822.2
0620000 P.1 National Police Service Human Resource Management 630.6 - 630.6 736.9 - 736.9 778.2 - 778.2 822.2 - 822.2
2141 National Gender and Equality Commission 375.0 - 375.0 428.9 - 428.9 441.7 - 441.7 454.9 - 454.9
0621000 P 1: Promotion of Gender Equality and Freedom from
Discrimination 375.0 - 375.0 428.9 - 428.9 441.7 - 441.7 454.9 - 454.9
2151 Independent Police Oversight Authority 817.0 - 817.0 857.7 - 857.7 884.0 - 884.0 912.8 - 912.8
0622000 P.1 Policing Oversight Services 817.0 - 817.0 857.7 - 857.7 884.0 - 884.0 912.8 - 912.8
FY 2018/19 Estimates 2019/20 Ceiling 2020/21 Projection 2021/22 Projection
Sector/ Vote/Programme Details
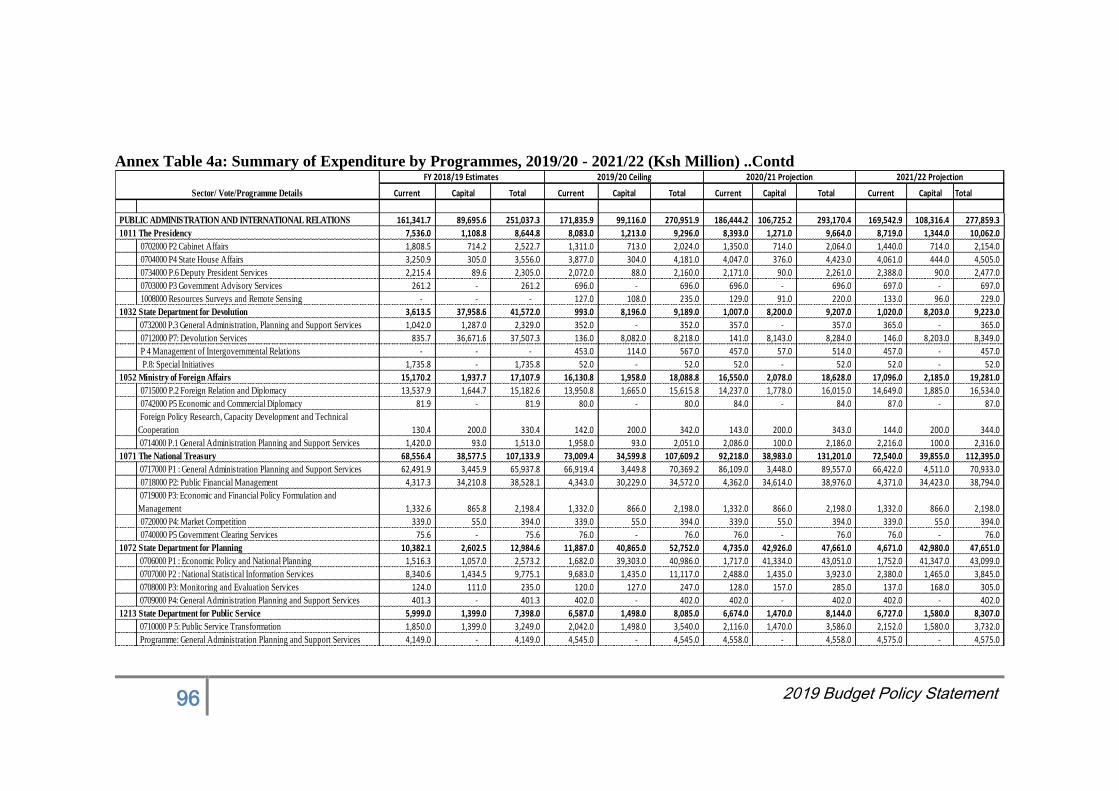
96 2019 Budget Policy Statement
Annex Table 4a: Summary of Expenditure by Programmes, 2019/20 - 2021/22 (Ksh Million) ..Contd
Current Capital Total Current Capital Total Current Capital Total Current Capital Total
PUBLIC ADMINISTRATION AND INTERNATIONAL RELATIONS 161,341.7 89,695.6 251,037.3 171,835.9 99,116.0 270,951.9 186,444.2 106,725.2 293,170.4 169,542.9 108,316.4 277,859.3
1011 The Presidency 7,536.0 1,108.8 8,644.8 8,083.0 1,213.0 9,296.0 8,393.0 1,271.0 9,664.0 8,719.0 1,344.0 10,062.0
0702000 P2 Cabinet Affairs 1,808.5 714.2 2,522.7 1,311.0 713.0 2,024.0 1,350.0 714.0 2,064.0 1,440.0 714.0 2,154.0
0704000 P4 State House Affairs 3,250.9 305.0 3,556.0 3,877.0 304.0 4,181.0 4,047.0 376.0 4,423.0 4,061.0 444.0 4,505.0
0734000 P.6 Deputy President Services 2,215.4 89.6 2,305.0 2,072.0 88.0 2,160.0 2,171.0 90.0 2,261.0 2,388.0 90.0 2,477.0
0703000 P3 Government Advisory Services 261.2 - 261.2 696.0 - 696.0 696.0 - 696.0 697.0 - 697.0
1008000 Resources Surveys and Remote Sensing - - - 127.0 108.0 235.0 129.0 91.0 220.0 133.0 96.0 229.0
1032 State Department for Devolution 3,613.5 37,958.6 41,572.0 993.0 8,196.0 9,189.0 1,007.0 8,200.0 9,207.0 1,020.0 8,203.0 9,223.0
0732000 P.3 General Administration, Planning and Support Services 1,042.0 1,287.0 2,329.0 352.0 - 352.0 357.0 - 357.0 365.0 - 365.0
0712000 P7: Devolution Services 835.7 36,671.6 37,507.3 136.0 8,082.0 8,218.0 141.0 8,143.0 8,284.0 146.0 8,203.0 8,349.0
P 4 Management of Intergovernmental Relations - - - 453.0 114.0 567.0 457.0 57.0 514.0 457.0 - 457.0
P.8: Special Initiatives 1,735.8 - 1,735.8 52.0 - 52.0 52.0 - 52.0 52.0 - 52.0
1052 Ministry of Foreign Affairs 15,170.2 1,937.7 17,107.9 16,130.8 1,958.0 18,088.8 16,550.0 2,078.0 18,628.0 17,096.0 2,185.0 19,281.0
0715000 P.2 Foreign Relation and Diplomacy 13,537.9 1,644.7 15,182.6 13,950.8 1,665.0 15,615.8 14,237.0 1,778.0 16,015.0 14,649.0 1,885.0 16,534.0
0742000 P5 Economic and Commercial Diplomacy 81.9 - 81.9 80.0 - 80.0 84.0 - 84.0 87.0 - 87.0
Foreign Policy Research, Capacity Development and Technical
Cooperation 130.4 200.0 330.4 142.0 200.0 342.0 143.0 200.0 343.0 144.0 200.0 344.0
0714000 P.1 General Administration Planning and Support Services 1,420.0 93.0 1,513.0 1,958.0 93.0 2,051.0 2,086.0 100.0 2,186.0 2,216.0 100.0 2,316.0
1071 The National Treasury 68,556.4 38,577.5 107,133.9 73,009.4 34,599.8 107,609.2 92,218.0 38,983.0 131,201.0 72,540.0 39,855.0 112,395.0
0717000 P1 : General Administration Planning and Support Services 62,491.9 3,445.9 65,937.8 66,919.4 3,449.8 70,369.2 86,109.0 3,448.0 89,557.0 66,422.0 4,511.0 70,933.0
0718000 P2: Public Financial Management 4,317.3 34,210.8 38,528.1 4,343.0 30,229.0 34,572.0 4,362.0 34,614.0 38,976.0 4,371.0 34,423.0 38,794.0
0719000 P3: Economic and Financial Policy Formulation and
Management 1,332.6 865.8 2,198.4 1,332.0 866.0 2,198.0 1,332.0 866.0 2,198.0 1,332.0 866.0 2,198.0
0720000 P4: Market Competition 339.0 55.0 394.0 339.0 55.0 394.0 339.0 55.0 394.0 339.0 55.0 394.0
0740000 P5 Government Clearing Services 75.6 - 75.6 76.0 - 76.0 76.0 - 76.0 76.0 - 76.0
1072 State Department for Planning 10,382.1 2,602.5 12,984.6 11,887.0 40,865.0 52,752.0 4,735.0 42,926.0 47,661.0 4,671.0 42,980.0 47,651.0
0706000 P1 : Economic Policy and National Planning 1,516.3 1,057.0 2,573.2 1,682.0 39,303.0 40,986.0 1,717.0 41,334.0 43,051.0 1,752.0 41,347.0 43,099.0
0707000 P2 : National Statistical Information Services 8,340.6 1,434.5 9,775.1 9,683.0 1,435.0 11,117.0 2,488.0 1,435.0 3,923.0 2,380.0 1,465.0 3,845.0
0708000 P3: Monitoring and Evaluation Services 124.0 111.0 235.0 120.0 127.0 247.0 128.0 157.0 285.0 137.0 168.0 305.0
0709000 P4: General Administration Planning and Support Services 401.3 - 401.3 402.0 - 402.0 402.0 - 402.0 402.0 - 402.0
1213 State Department for Public Service 5,999.0 1,399.0 7,398.0 6,587.0 1,498.0 8,085.0 6,674.0 1,470.0 8,144.0 6,727.0 1,580.0 8,307.0
0710000 P 5: Public Service Transformation 1,850.0 1,399.0 3,249.0 2,042.0 1,498.0 3,540.0 2,116.0 1,470.0 3,586.0 2,152.0 1,580.0 3,732.0
Programme: General Administration Planning and Support Services 4,149.0 - 4,149.0 4,545.0 - 4,545.0 4,558.0 - 4,558.0 4,575.0 - 4,575.0
FY 2018/19 Estimates 2019/20 Ceiling 2020/21 Projection 2021/22 Projection
Sector/ Vote/Programme Details
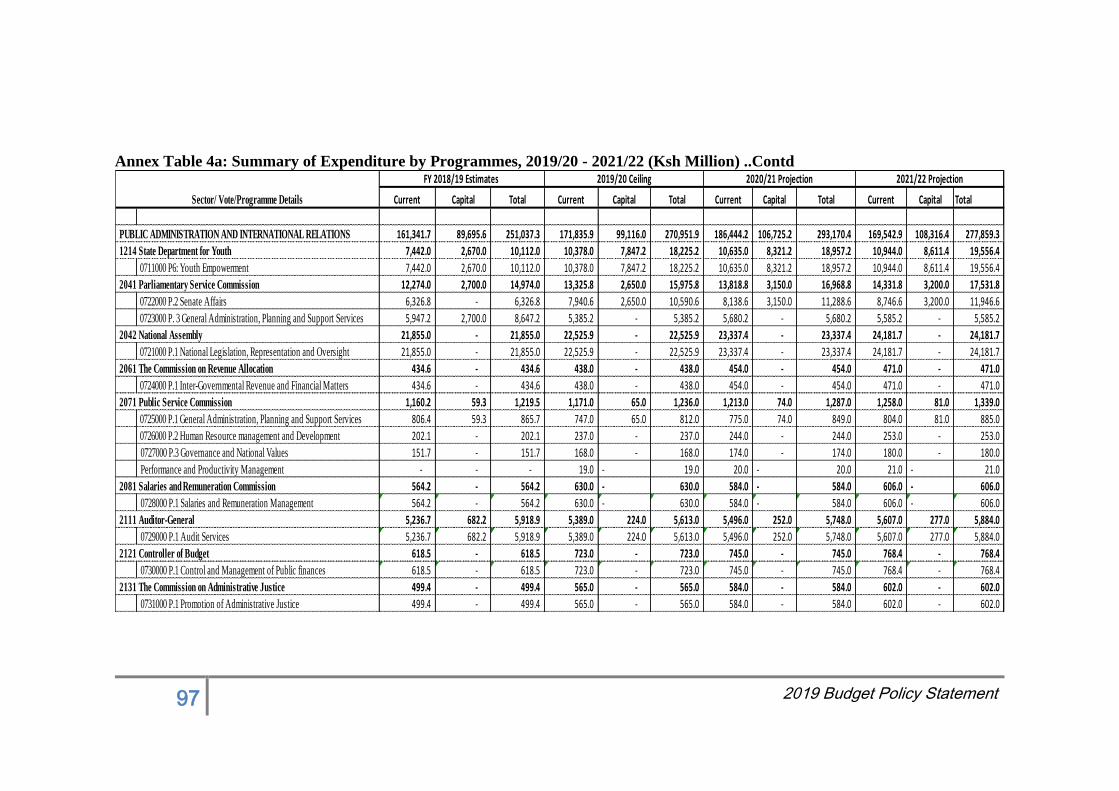
97 2019 Budget Policy Statement
Annex Table 4a: Summary of Expenditure by Programmes, 2019/20 - 2021/22 (Ksh Million) ..Contd
Current Capital Total Current Capital Total Current Capital Total Current Capital Total
PUBLIC ADMINISTRATION AND INTERNATIONAL RELATIONS 161,341.7 89,695.6 251,037.3 171,835.9 99,116.0 270,951.9 186,444.2 106,725.2 293,170.4 169,542.9 108,316.4 277,859.3
1214 State Department for Youth 7,442.0 2,670.0 10,112.0 10,378.0 7,847.2 18,225.2 10,635.0 8,321.2 18,957.2 10,944.0 8,611.4 19,556.4
0711000 P6: Youth Empowerment 7,442.0 2,670.0 10,112.0 10,378.0 7,847.2 18,225.2 10,635.0 8,321.2 18,957.2 10,944.0 8,611.4 19,556.4
2041 Parliamentary Service Commission 12,274.0 2,700.0 14,974.0 13,325.8 2,650.0 15,975.8 13,818.8 3,150.0 16,968.8 14,331.8 3,200.0 17,531.8
0722000 P.2 Senate Affairs 6,326.8 - 6,326.8 7,940.6 2,650.0 10,590.6 8,138.6 3,150.0 11,288.6 8,746.6 3,200.0 11,946.6
0723000 P. 3 General Administration, Planning and Support Services 5,947.2 2,700.0 8,647.2 5,385.2 - 5,385.2 5,680.2 - 5,680.2 5,585.2 - 5,585.2
2042 National Assembly 21,855.0 - 21,855.0 22,525.9 - 22,525.9 23,337.4 - 23,337.4 24,181.7 - 24,181.7
0721000 P.1 National Legislation, Representation and Oversight 21,855.0 - 21,855.0 22,525.9 - 22,525.9 23,337.4 - 23,337.4 24,181.7 - 24,181.7
2061 The Commission on Revenue Allocation 434.6 - 434.6 438.0 - 438.0 454.0 - 454.0 471.0 - 471.0
0724000 P.1 Inter-Governmental Revenue and Financial Matters 434.6 - 434.6 438.0 - 438.0 454.0 - 454.0 471.0 - 471.0
2071 Public Service Commission 1,160.2 59.3 1,219.5 1,171.0 65.0 1,236.0 1,213.0 74.0 1,287.0 1,258.0 81.0 1,339.0
0725000 P.1 General Administration, Planning and Support Services 806.4 59.3 865.7 747.0 65.0 812.0 775.0 74.0 849.0 804.0 81.0 885.0
0726000 P.2 Human Resource management and Development 202.1 - 202.1 237.0 - 237.0 244.0 - 244.0 253.0 - 253.0
0727000 P.3 Governance and National Values 151.7 - 151.7 168.0 - 168.0 174.0 - 174.0 180.0 - 180.0
Performance and Productivity Management - - - 19.0 - 19.0 20.0 - 20.0 21.0 - 21.0
2081 Salaries and Remuneration Commission 564.2 - 564.2 630.0 - 630.0 584.0 - 584.0 606.0 - 606.0
0728000 P.1 Salaries and Remuneration Management 564.2 - 564.2 630.0 - 630.0 584.0 - 584.0 606.0 - 606.0
2111 Auditor-General 5,236.7 682.2 5,918.9 5,389.0 224.0 5,613.0 5,496.0 252.0 5,748.0 5,607.0 277.0 5,884.0
0729000 P.1 Audit Services 5,236.7 682.2 5,918.9 5,389.0 224.0 5,613.0 5,496.0 252.0 5,748.0 5,607.0 277.0 5,884.0
2121 Controller of Budget 618.5 - 618.5 723.0 - 723.0 745.0 - 745.0 768.4 - 768.4
0730000 P.1 Control and Management of Public finances 618.5 - 618.5 723.0 - 723.0 745.0 - 745.0 768.4 - 768.4
2131 The Commission on Administrative Justice 499.4 - 499.4 565.0 - 565.0 584.0 - 584.0 602.0 - 602.0
0731000 P.1 Promotion of Administrative Justice 499.4 - 499.4 565.0 - 565.0 584.0 - 584.0 602.0 - 602.0
FY 2018/19 Estimates 2019/20 Ceiling 2020/21 Projection 2021/22 Projection
Sector/ Vote/Programme Details
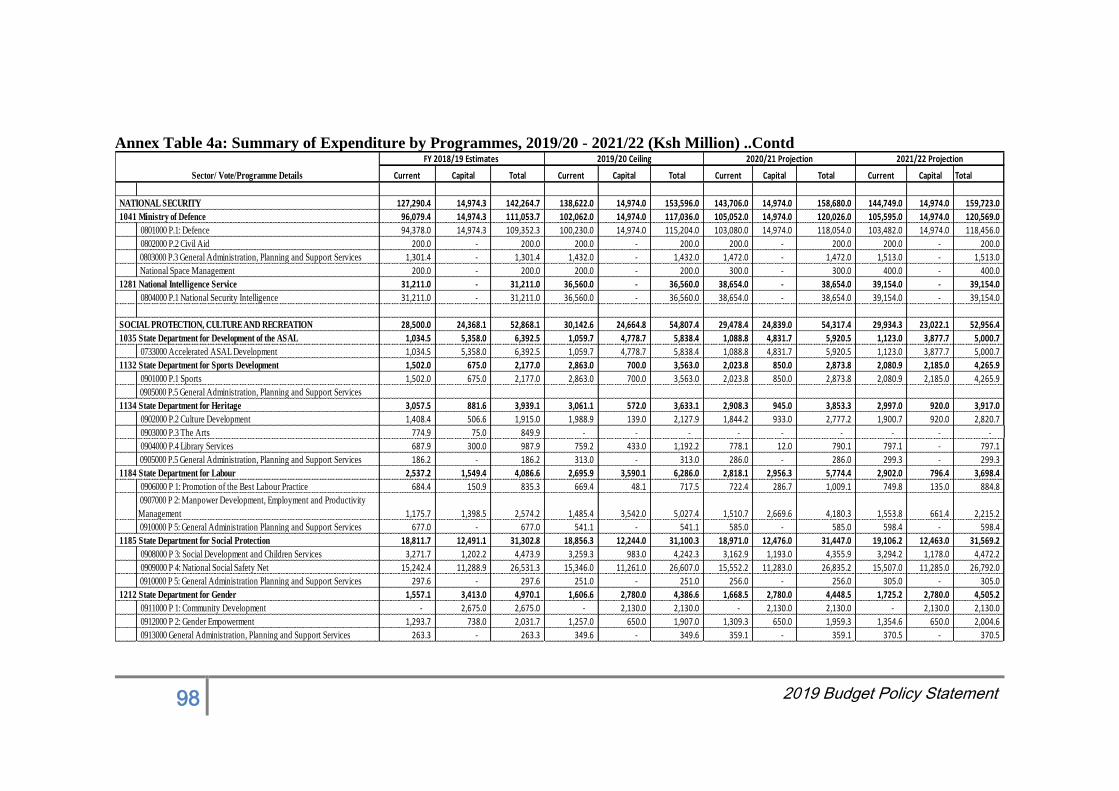
98 2019 Budget Policy Statement
Annex Table 4a: Summary of Expenditure by Programmes, 2019/20 - 2021/22 (Ksh Million) ..Contd
Current Capital Total Current Capital Total Current Capital Total Current Capital Total
NATIONAL SECURITY 127,290.4 14,974.3 142,264.7 138,622.0 14,974.0 153,596.0 143,706.0 14,974.0 158,680.0 144,749.0 14,974.0 159,723.0
1041 Ministry of Defence 96,079.4 14,974.3 111,053.7 102,062.0 14,974.0 117,036.0 105,052.0 14,974.0 120,026.0 105,595.0 14,974.0 120,569.0
0801000 P.1: Defence 94,378.0 14,974.3 109,352.3 100,230.0 14,974.0 115,204.0 103,080.0 14,974.0 118,054.0 103,482.0 14,974.0 118,456.0
0802000 P.2 Civil Aid 200.0 - 200.0 200.0 - 200.0 200.0 - 200.0 200.0 - 200.0
0803000 P.3 General Administration, Planning and Support Services 1,301.4 - 1,301.4 1,432.0 - 1,432.0 1,472.0 - 1,472.0 1,513.0 - 1,513.0
National Space Management 200.0 - 200.0 200.0 - 200.0 300.0 - 300.0 400.0 - 400.0
1281 National Intelligence Service 31,211.0 - 31,211.0 36,560.0 - 36,560.0 38,654.0 - 38,654.0 39,154.0 - 39,154.0
0804000 P.1 National Security Intelligence 31,211.0 - 31,211.0 36,560.0 - 36,560.0 38,654.0 - 38,654.0 39,154.0 - 39,154.0
SOCIAL PROTECTION, CULTURE AND RECREATION 28,500.0 24,368.1 52,868.1 30,142.6 24,664.8 54,807.4 29,478.4 24,839.0 54,317.4 29,934.3 23,022.1 52,956.4
1035 State Department for Development of the ASAL 1,034.5 5,358.0 6,392.5 1,059.7 4,778.7 5,838.4 1,088.8 4,831.7 5,920.5 1,123.0 3,877.7 5,000.7
0733000 Accelerated ASAL Development 1,034.5 5,358.0 6,392.5 1,059.7 4,778.7 5,838.4 1,088.8 4,831.7 5,920.5 1,123.0 3,877.7 5,000.7
1132 State Department for Sports Development 1,502.0 675.0 2,177.0 2,863.0 700.0 3,563.0 2,023.8 850.0 2,873.8 2,080.9 2,185.0 4,265.9
0901000 P.1 Sports 1,502.0 675.0 2,177.0 2,863.0 700.0 3,563.0 2,023.8 850.0 2,873.8 2,080.9 2,185.0 4,265.9
0905000 P.5 General Administration, Planning and Support Services
1134 State Department for Heritage 3,057.5 881.6 3,939.1 3,061.1 572.0 3,633.1 2,908.3 945.0 3,853.3 2,997.0 920.0 3,917.0
0902000 P.2 Culture Development 1,408.4 506.6 1,915.0 1,988.9 139.0 2,127.9 1,844.2 933.0 2,777.2 1,900.7 920.0 2,820.7
0903000 P.3 The Arts 774.9 75.0 849.9 - - - - - - - - -
0904000 P.4 Library Services 687.9 300.0 987.9 759.2 433.0 1,192.2 778.1 12.0 790.1 797.1 - 797.1
0905000 P.5 General Administration, Planning and Support Services 186.2 - 186.2 313.0 - 313.0 286.0 - 286.0 299.3 - 299.3
1184 State Department for Labour 2,537.2 1,549.4 4,086.6 2,695.9 3,590.1 6,286.0 2,818.1 2,956.3 5,774.4 2,902.0 796.4 3,698.4
0906000 P 1: Promotion of the Best Labour Practice 684.4 150.9 835.3 669.4 48.1 717.5 722.4 286.7 1,009.1 749.8 135.0 884.8
0907000 P 2: Manpower Development, Employment and Productivity
Management 1,175.7 1,398.5 2,574.2 1,485.4 3,542.0 5,027.4 1,510.7 2,669.6 4,180.3 1,553.8 661.4 2,215.2
0910000 P 5: General Administration Planning and Support Services 677.0 - 677.0 541.1 - 541.1 585.0 - 585.0 598.4 - 598.4
1185 State Department for Social Protection 18,811.7 12,491.1 31,302.8 18,856.3 12,244.0 31,100.3 18,971.0 12,476.0 31,447.0 19,106.2 12,463.0 31,569.2
0908000 P 3: Social Development and Children Services 3,271.7 1,202.2 4,473.9 3,259.3 983.0 4,242.3 3,162.9 1,193.0 4,355.9 3,294.2 1,178.0 4,472.2
0909000 P 4: National Social Safety Net 15,242.4 11,288.9 26,531.3 15,346.0 11,261.0 26,607.0 15,552.2 11,283.0 26,835.2 15,507.0 11,285.0 26,792.0
0910000 P 5: General Administration Planning and Support Services 297.6 - 297.6 251.0 - 251.0 256.0 - 256.0 305.0 - 305.0
1212 State Department for Gender 1,557.1 3,413.0 4,970.1 1,606.6 2,780.0 4,386.6 1,668.5 2,780.0 4,448.5 1,725.2 2,780.0 4,505.2
0911000 P 1: Community Development - 2,675.0 2,675.0 - 2,130.0 2,130.0 - 2,130.0 2,130.0 - 2,130.0 2,130.0
0912000 P 2: Gender Empowerment 1,293.7 738.0 2,031.7 1,257.0 650.0 1,907.0 1,309.3 650.0 1,959.3 1,354.6 650.0 2,004.6
0913000 General Administration, Planning and Support Services 263.3 - 263.3 349.6 - 349.6 359.1 - 359.1 370.5 - 370.5
FY 2018/19 Estimates 2019/20 Ceiling 2020/21 Projection 2021/22 Projection
Sector/ Vote/Programme Details

99 2019 Budget Policy Statement
Annex Table 4a: Summary of Expenditure by Programmes, 2019/20 - 2021/22 (Ksh Million) ..Contd
Current Capital Total Current Capital Total Current Capital Total Current Capital Total
ENVIRONMENT PROTECTION, WATER AND NATURAL RESOURCES 21,605.2 56,225.4 77,830.6 22,864.0 59,475.0 82,339.0 23,706.0 61,462.0 85,168.0 24,591.0 62,307.0 86,898.0
1107 Ministry of Water and Sanitation 4,143.1 48,771.4 52,914.5 4,319.0 52,309.0 56,628.0 4,449.0 53,034.0 57,483.0 4,562.0 53,646.0 58,208.0
1001000 P.2 General Administration, Planning and Support Services 374.9 - 374.9 379.0 34.0 413.0 400.0 70.0 470.0 412.0 60.0 472.0
1004000 P.3 Water Resources Management 1,221.1 5,786.0 7,007.1 1,269.0 5,752.0 7,021.0 1,305.0 5,921.0 7,226.0 1,362.0 5,200.0 6,562.0
1017000 P4. Water and Sewerage Infrastructure Development 2,452.2 32,586.4 35,038.6 2,576.0 36,586.0 39,162.0 2,649.0 36,692.0 39,341.0 2,693.0 37,957.0 40,650.0
1015000 P.1 Water Storage and Flood Control 45.0 10,394.0 10,439.0 45.0 9,932.0 9,977.0 45.0 10,346.0 10,391.0 45.0 10,424.0 10,469.0
1014000 P.4 Irrigation and Land Reclamation 49.9 5.0 54.9 50.0 5.0 55.0 50.0 5.0 55.0 50.0 5.0 55.0
1108 Ministry of Environment and Forestry 10,096.9 6,003.0 16,099.9 10,085.0 5,759.0 15,844.0 10,106.0 6,209.0 16,315.0 10,162.0 6,384.0 16,546.0
1012000 P.3 Meteorological Services 1,074.1 1,082.3 2,156.4 1,144.0 1,044.0 2,188.0 1,152.0 1,237.0 2,389.0 1,191.0 1,287.0 2,478.0
1002000 P.2 Environment Management and Protection 1,483.6 1,724.7 3,208.3 1,483.0 1,623.0 3,106.0 1,484.0 1,780.0 3,264.0 1,492.0 1,835.0 3,327.0
1010000 P.1 General Administration, Planning and Support Services 321.8 - 321.8 375.0 - 375.0 386.0 - 386.0 394.0 - 394.0
Programme 4: Forests and Water Towers Conservation 7,084.9 3,012.0 10,096.9 7,083.0 3,092.0 10,175.0 7,084.0 3,192.0 10,276.0 7,085.0 3,262.0 10,347.0
1008000 Resources Surveys and Remote Sensing 132.5 184.0 316.5
1119 Ministry of Mining 971.2 325.0 1,296.2 654.0 313.0 967.0 697.0 763.0 1,460.0 725.0 779.0 1,504.0
1007000 P.1 General Administration Planning and Support Services 706.0 25.0 731.0 393.0 - 393.0 364.0 - 364.0 370.0 - 370.0
Programme 1: Geological Surveys and Geo information - - - 87.0 103.0 190.0 123.0 493.0 616.0 134.0 508.0 642.0
1009000 Mineral Resources Management 265.2 300.0 565.2 174.0 210.0 384.0 210.0 270.0 480.0 221.0 271.0 492.0
1203 State Department for Wildlife 6,394.0 1,126.0 7,520.0 7,806.0 1,094.0 8,900.0 8,454.0 1,456.0 9,910.0 9,142.0 1,498.0 10,640.0
Programme 1: Wildlife Conservation and Management 6,394.0 1,126.0 7,520.0 7,806.0 1,094.0 8,900.0 8,454.0 1,456.0 9,910.0 9,142.0 1,498.0 10,640.0
Total 1,072,982.8 677,226.9 1,750,207.6 1,171,979.1 650,822.6 1,822,802.4 1,214,215.9 679,561.0 1,893,778.8 1,221,450.7 688,374.2 1,909,826.7
FY 2018/19 Estimates 2019/20 Ceiling 2020/21 Projection 2021/22 Projection
Sector/ Vote/Programme Details
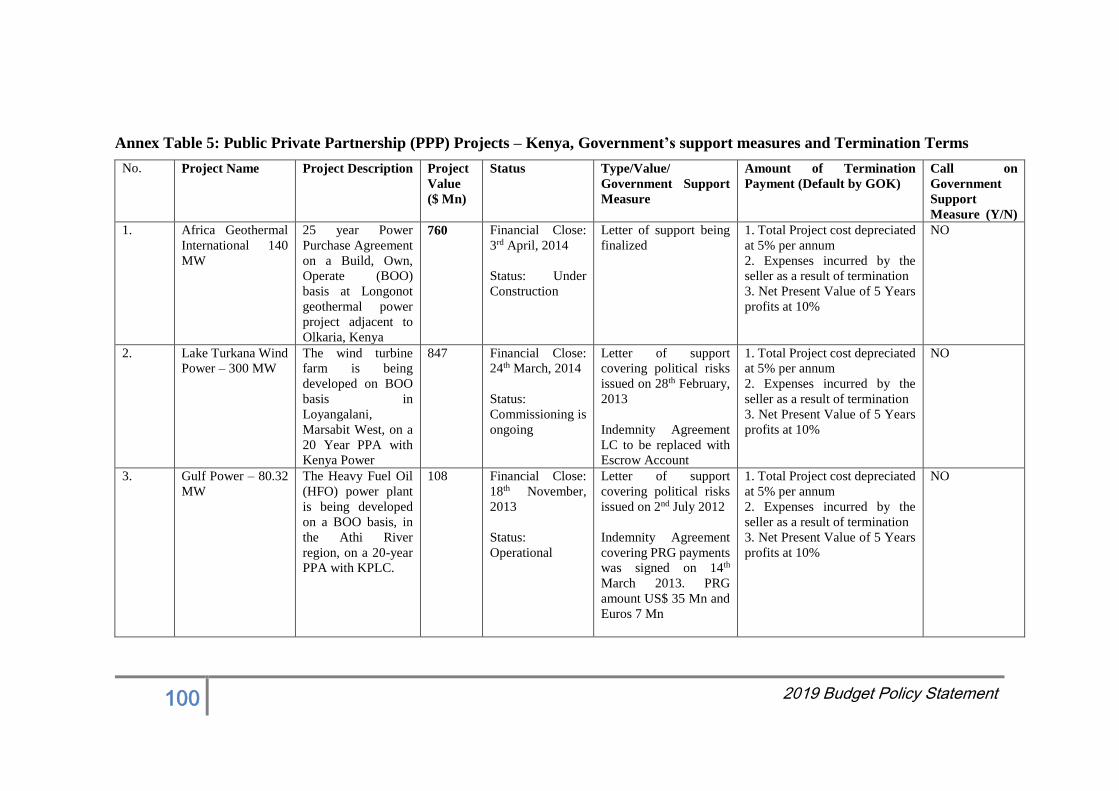
100 2019 Budget Policy Statement
Annex Table 5: Public Private Partnership (PPP) Projects – Kenya, Government’s support measures and Termination Terms
No. Project Name Project Description Project
Value
($ Mn)
Status Type/Value/
Government Support
Measure
Amount of Termination
Payment (Default by GOK)
Call on
Government
Support
Measure (Y/N)
1. Africa Geothermal
International 140
MW
25 year Power
Purchase Agreement
on a Build, Own,
Operate (BOO)
basis at Longonot
geothermal power
project adjacent to
Olkaria, Kenya
760 Financial Close:
3rd April, 2014
Status: Under
Construction
Letter of support being
finalized
1. Total Project cost depreciated
at 5% per annum
2. Expenses incurred by the
seller as a result of termination
3. Net Present Value of 5 Years
profits at 10%
NO
2. Lake Turkana Wind
Power – 300 MW
The wind turbine
farm is being
developed on BOO
basis in
Loyangalani,
Marsabit West, on a
20 Year PPA with
Kenya Power
847 Financial Close:
24th March, 2014
Status:
Commissioning is
ongoing
Letter of support
covering political risks
issued on 28th February,
2013
Indemnity Agreement
LC to be replaced with
Escrow Account
1. Total Project cost depreciated
at 5% per annum
2. Expenses incurred by the
seller as a result of termination
3. Net Present Value of 5 Years
profits at 10%
NO
3. Gulf Power – 80.32
MW
The Heavy Fuel Oil
(HFO) power plant
is being developed
on a BOO basis, in
the Athi River
region, on a 20-year
PPA with KPLC.
108 Financial Close:
18th November,
2013
Status:
Operational
Letter of support
covering political risks
issued on 2nd July 2012
Indemnity Agreement
covering PRG payments
was signed on 14th
March 2013. PRG
amount US$ 35 Mn and
Euros 7 Mn
1. Total Project cost depreciated
at 5% per annum
2. Expenses incurred by the
seller as a result of termination
3. Net Present Value of 5 Years
profits at 10%
NO
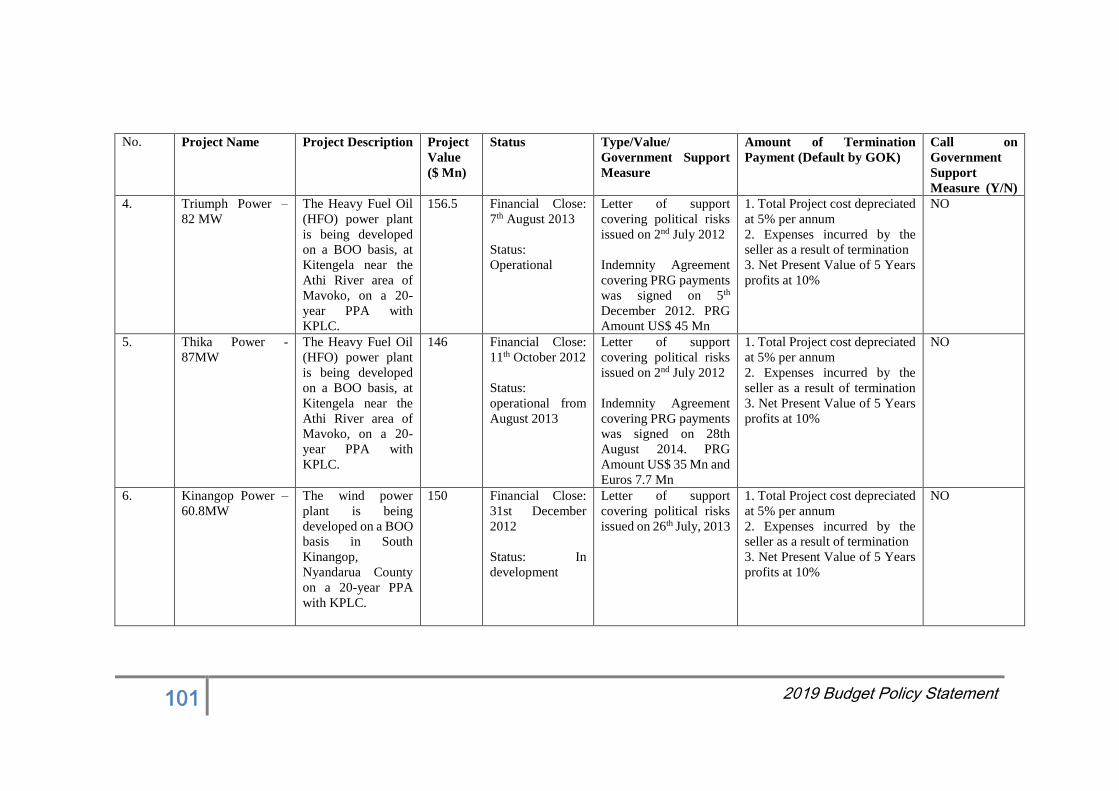
101 2019 Budget Policy Statement
No. Project Name Project Description Project
Value
($ Mn)
Status Type/Value/
Government Support
Measure
Amount of Termination
Payment (Default by GOK)
Call on
Government
Support
Measure (Y/N)
4. Triumph Power –
82 MW
The Heavy Fuel Oil
(HFO) power plant
is being developed
on a BOO basis, at
Kitengela near the
Athi River area of
Mavoko, on a 20-
year PPA with
KPLC.
156.5 Financial Close:
7th August 2013
Status:
Operational
Letter of support
covering political risks
issued on 2nd July 2012
Indemnity Agreement
covering PRG payments
was signed on 5th
December 2012. PRG
Amount US$ 45 Mn
1. Total Project cost depreciated
at 5% per annum
2. Expenses incurred by the
seller as a result of termination
3. Net Present Value of 5 Years
profits at 10%
NO
5. Thika Power -
87MW
The Heavy Fuel Oil
(HFO) power plant
is being developed
on a BOO basis, at
Kitengela near the
Athi River area of
Mavoko, on a 20-
year PPA with
KPLC.
146 Financial Close:
11th October 2012
Status:
operational from
August 2013
Letter of support
covering political risks
issued on 2nd July 2012
Indemnity Agreement
covering PRG payments
was signed on 28th
August 2014. PRG
Amount US$ 35 Mn and
Euros 7.7 Mn
1. Total Project cost depreciated
at 5% per annum
2. Expenses incurred by the
seller as a result of termination
3. Net Present Value of 5 Years
profits at 10%
NO
6. Kinangop Power –
60.8MW
The wind power
plant is being
developed on a BOO
basis in South
Kinangop,
Nyandarua County
on a 20-year PPA
with KPLC.
150 Financial Close:
31st December
2012
Status: In
development
Letter of support
covering political risks
issued on 26th July, 2013
1. Total Project cost depreciated
at 5% per annum
2. Expenses incurred by the
seller as a result of termination
3. Net Present Value of 5 Years
profits at 10%
NO
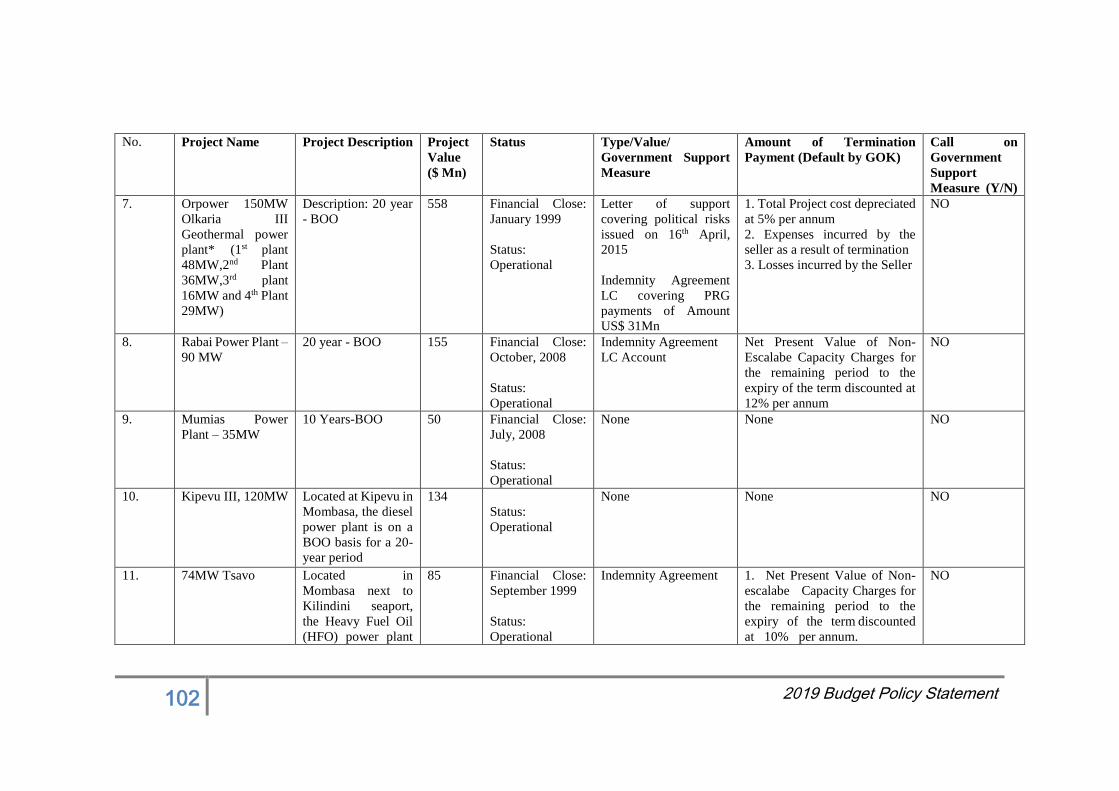
102 2019 Budget Policy Statement
No. Project Name Project Description Project
Value
($ Mn)
Status Type/Value/
Government Support
Measure
Amount of Termination
Payment (Default by GOK)
Call on
Government
Support
Measure (Y/N)
7. Orpower 150MW
Olkaria III
Geothermal power
plant* (1st plant
48MW,2nd Plant
36MW,3rd plant
16MW and 4th Plant
29MW)
Description: 20 year
- BOO
558 Financial Close:
January 1999
Status:
Operational
Letter of support
covering political risks
issued on 16th April,
2015
Indemnity Agreement
LC covering PRG
payments of Amount
US$ 31Mn
1. Total Project cost depreciated
at 5% per annum
2. Expenses incurred by the
seller as a result of termination
3. Losses incurred by the Seller
NO
8. Rabai Power Plant –
90 MW
20 year - BOO 155 Financial Close:
October, 2008
Status:
Operational
Indemnity Agreement
LC Account
Net Present Value of Non-
Escalabe Capacity Charges for
the remaining period to the
expiry of the term discounted at
12% per annum
NO
9. Mumias Power
Plant – 35MW
10 Years-BOO 50 Financial Close:
July, 2008
Status:
Operational
None None NO
10. Kipevu III, 120MW Located at Kipevu in
Mombasa, the diesel
power plant is on a
BOO basis for a 20-
year period
134
Status:
Operational
None
None NO
11. 74MW Tsavo Located in
Mombasa next to
Kilindini seaport,
the Heavy Fuel Oil
(HFO) power plant
85 Financial Close:
September 1999
Status:
Operational
Indemnity Agreement 1. Net Present Value of Non-
escalabe Capacity Charges for
the remaining period to the
expiry of the term discounted
at 10% per annum.
NO
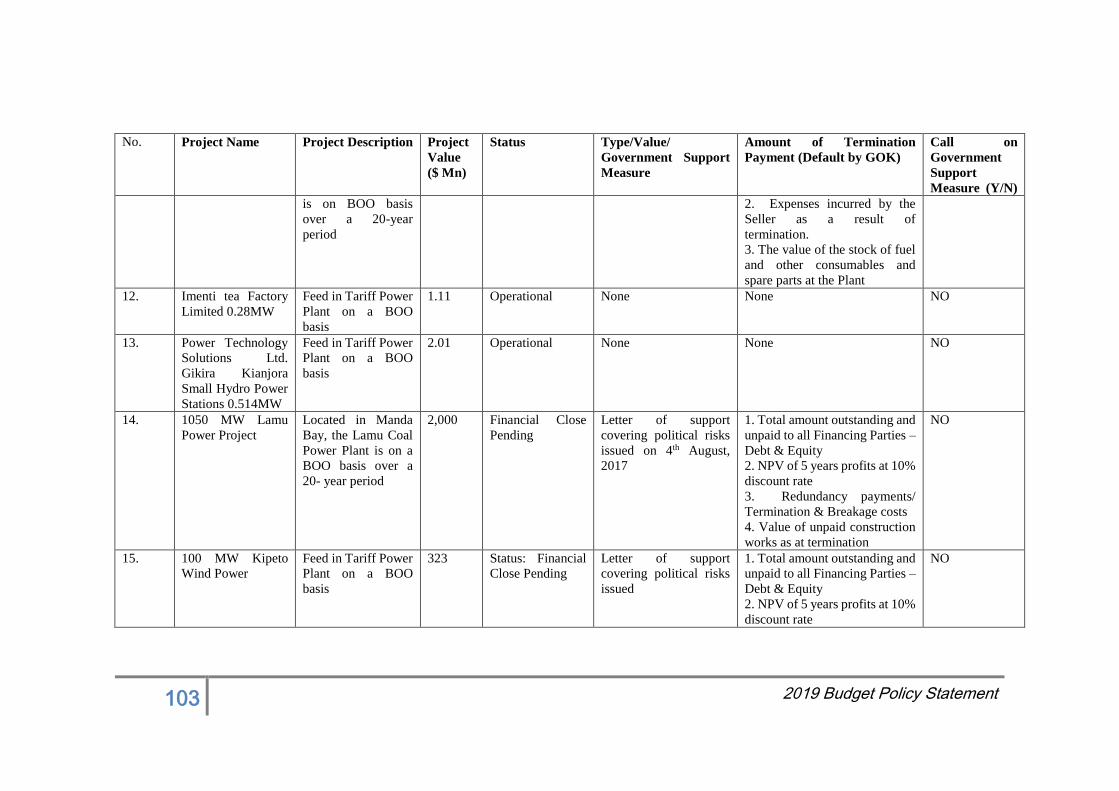
103 2019 Budget Policy Statement
No. Project Name Project Description Project
Value
($ Mn)
Status Type/Value/
Government Support
Measure
Amount of Termination
Payment (Default by GOK)
Call on
Government
Support
Measure (Y/N)
is on BOO basis
over a 20-year
period
2. Expenses incurred by the
Seller as a result of
termination.
3. The value of the stock of fuel
and other consumables and
spare parts at the Plant
12. Imenti tea Factory
Limited 0.28MW
Feed in Tariff Power
Plant on a BOO
basis
1.11 Operational None None NO
13. Power Technology
Solutions Ltd.
Gikira Kianjora
Small Hydro Power
Stations 0.514MW
Feed in Tariff Power
Plant on a BOO
basis
2.01 Operational None None NO
14. 1050 MW Lamu
Power Project
Located in Manda
Bay, the Lamu Coal
Power Plant is on a
BOO basis over a
20- year period
2,000 Financial Close
Pending
Letter of support
covering political risks
issued on 4th August,
2017
1. Total amount outstanding and
unpaid to all Financing Parties –
Debt & Equity
2. NPV of 5 years profits at 10%
discount rate
3. Redundancy payments/
Termination & Breakage costs
4. Value of unpaid construction
works as at termination
NO
15. 100 MW Kipeto
Wind Power
Feed in Tariff Power
Plant on a BOO
basis
323 Status: Financial
Close Pending
Letter of support
covering political risks
issued
1. Total amount outstanding and
unpaid to all Financing Parties –
Debt & Equity
2. NPV of 5 years profits at 10%
discount rate
NO
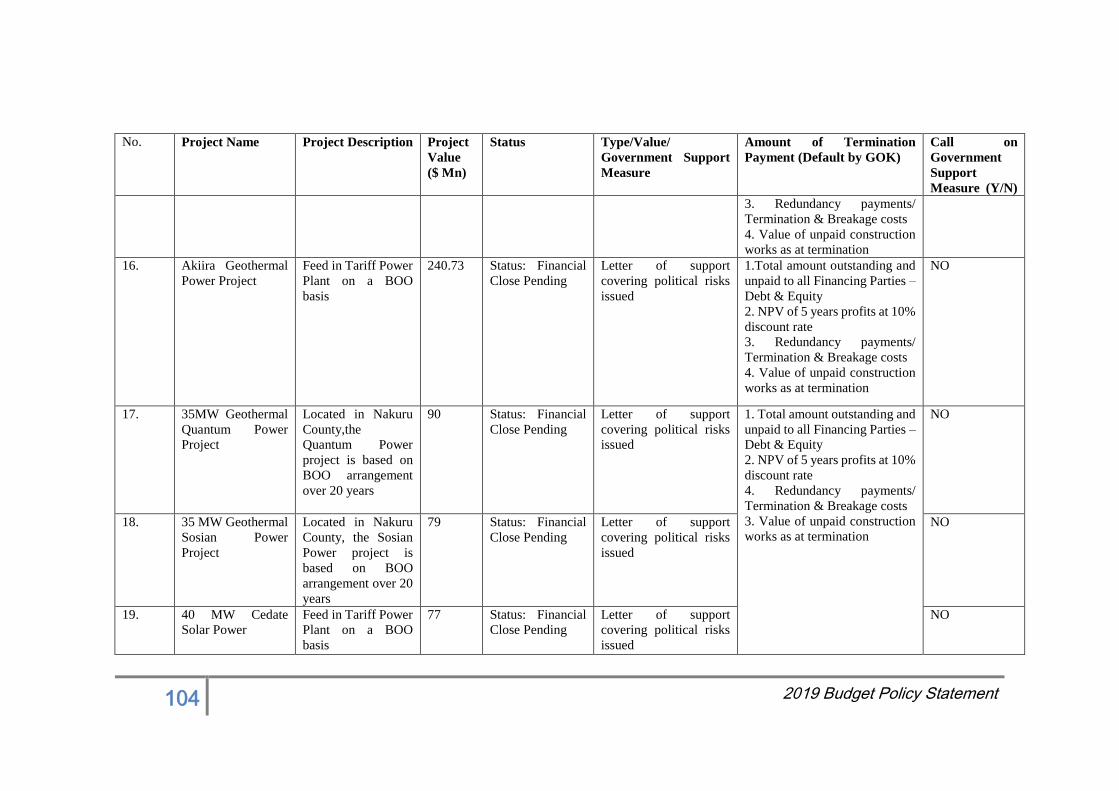
104 2019 Budget Policy Statement
No. Project Name Project Description Project
Value
($ Mn)
Status Type/Value/
Government Support
Measure
Amount of Termination
Payment (Default by GOK)
Call on
Government
Support
Measure (Y/N)
3. Redundancy payments/
Termination & Breakage costs
4. Value of unpaid construction
works as at termination
16. Akiira Geothermal
Power Project
Feed in Tariff Power
Plant on a BOO
basis
240.73
Status: Financial
Close Pending
Letter of support
covering political risks
issued
1.Total amount outstanding and
unpaid to all Financing Parties –
Debt & Equity
2. NPV of 5 years profits at 10%
discount rate
3. Redundancy payments/
Termination & Breakage costs
4. Value of unpaid construction
works as at termination
NO
17. 35MW Geothermal
Quantum Power
Project
Located in Nakuru
County,the
Quantum Power
project is based on
BOO arrangement
over 20 years
90 Status: Financial
Close Pending
Letter of support
covering political risks
issued
1. Total amount outstanding and
unpaid to all Financing Parties –
Debt & Equity
2. NPV of 5 years profits at 10%
discount rate
4. Redundancy payments/
Termination & Breakage costs
3. Value of unpaid construction
works as at termination
NO
18. 35 MW Geothermal
Sosian Power
Project
Located in Nakuru
County, the Sosian
Power project is
based on BOO
arrangement over 20
years
79 Status: Financial
Close Pending
Letter of support
covering political risks
issued
NO
19. 40 MW Cedate
Solar Power
Feed in Tariff Power
Plant on a BOO
basis
77 Status: Financial
Close Pending
Letter of support
covering political risks
issued
NO
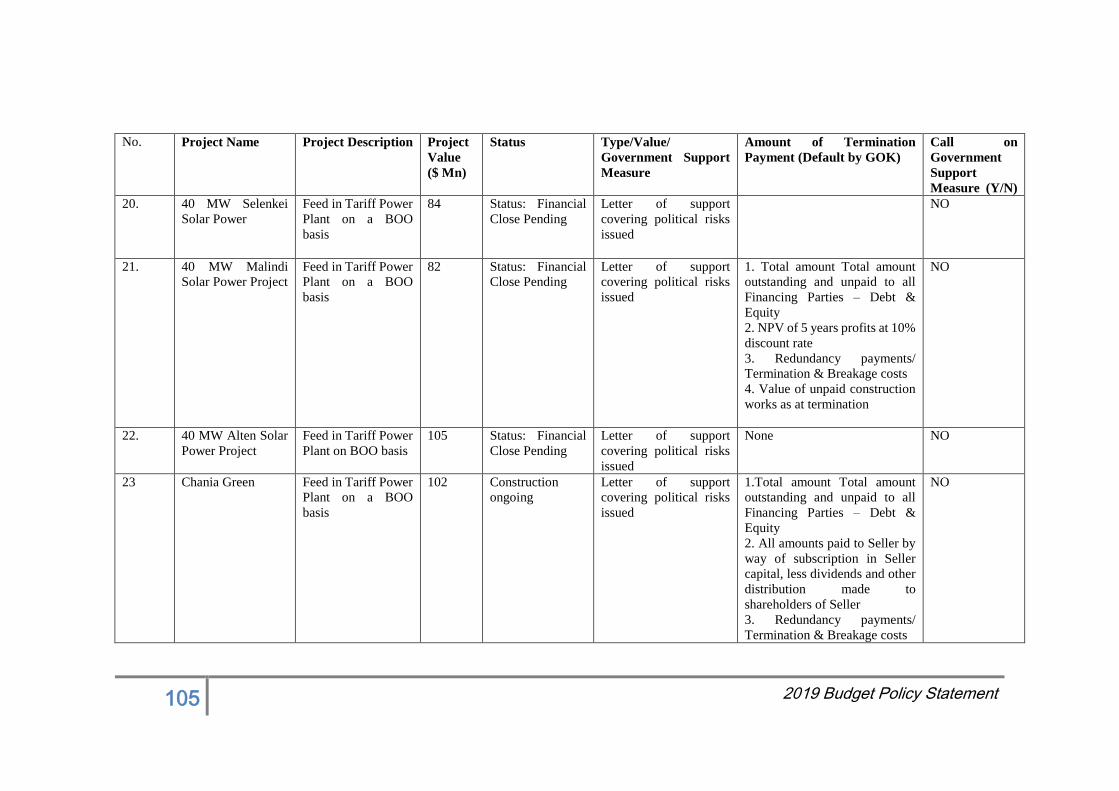
105 2019 Budget Policy Statement
No. Project Name Project Description Project
Value
($ Mn)
Status Type/Value/
Government Support
Measure
Amount of Termination
Payment (Default by GOK)
Call on
Government
Support
Measure (Y/N)
20. 40 MW Selenkei
Solar Power
Feed in Tariff Power
Plant on a BOO
basis
84 Status: Financial
Close Pending
Letter of support
covering political risks
issued
NO
21. 40 MW Malindi
Solar Power Project
Feed in Tariff Power
Plant on a BOO
basis
82 Status: Financial
Close Pending
Letter of support
covering political risks
issued
1. Total amount Total amount
outstanding and unpaid to all
Financing Parties – Debt &
Equity
2. NPV of 5 years profits at 10%
discount rate
3. Redundancy payments/
Termination & Breakage costs
4. Value of unpaid construction
works as at termination
NO
22. 40 MW Alten Solar
Power Project
Feed in Tariff Power
Plant on BOO basis
105 Status: Financial
Close Pending
Letter of support
covering political risks
issued
None NO
23 Chania Green Feed in Tariff Power
Plant on a BOO
basis
102 Construction
ongoing
Letter of support
covering political risks
issued
1.Total amount Total amount
outstanding and unpaid to all
Financing Parties – Debt &
Equity
2. All amounts paid to Seller by
way of subscription in Seller
capital, less dividends and other
distribution made to
shareholders of Seller
3. Redundancy payments/
Termination & Breakage costs
NO
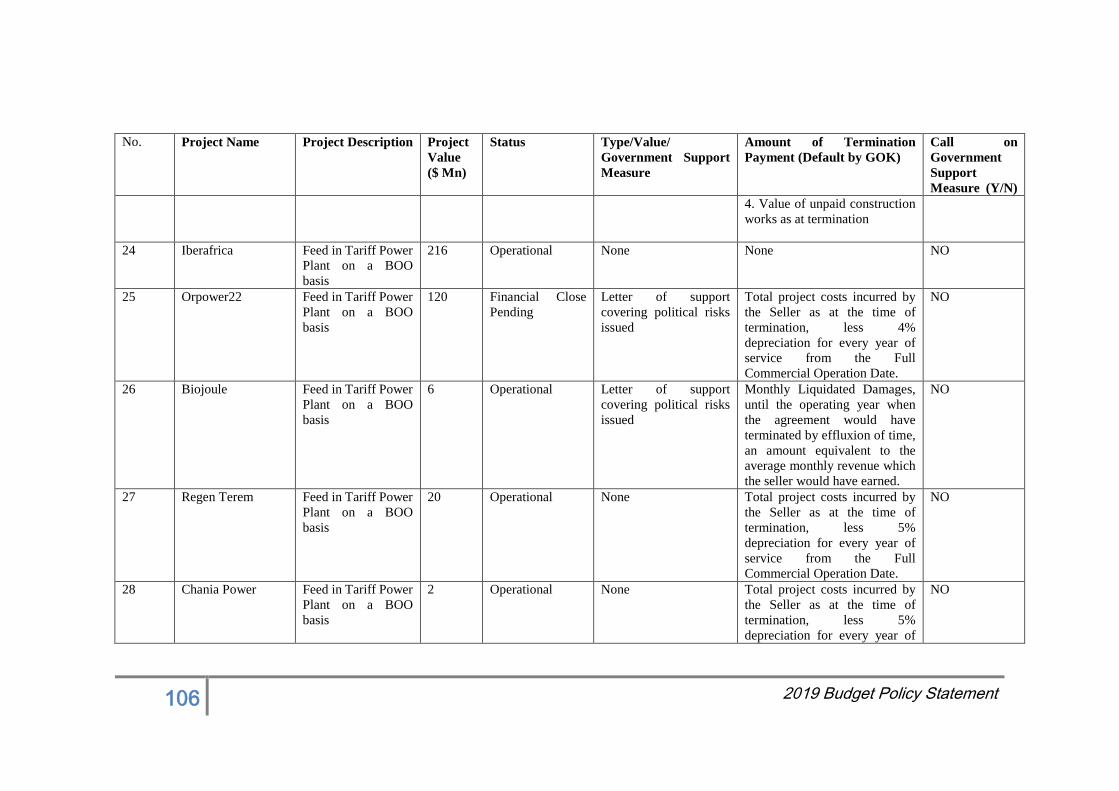
106 2019 Budget Policy Statement
No. Project Name Project Description Project
Value
($ Mn)
Status Type/Value/
Government Support
Measure
Amount of Termination
Payment (Default by GOK)
Call on
Government
Support
Measure (Y/N)
4. Value of unpaid construction
works as at termination
24 Iberafrica Feed in Tariff Power
Plant on a BOO
basis
216 Operational None None NO
25 Orpower22 Feed in Tariff Power
Plant on a BOO
basis
120 Financial Close
Pending
Letter of support
covering political risks
issued
Total project costs incurred by
the Seller as at the time of
termination, less 4%
depreciation for every year of
service from the Full
Commercial Operation Date.
NO
26 Biojoule Feed in Tariff Power
Plant on a BOO
basis
6 Operational Letter of support
covering political risks
issued
Monthly Liquidated Damages,
until the operating year when
the agreement would have
terminated by effluxion of time,
an amount equivalent to the
average monthly revenue which
the seller would have earned.
NO
27 Regen Terem Feed in Tariff Power
Plant on a BOO
basis
20 Operational None Total project costs incurred by
the Seller as at the time of
termination, less 5%
depreciation for every year of
service from the Full
Commercial Operation Date.
NO
28 Chania Power Feed in Tariff Power
Plant on a BOO
basis
2 Operational None Total project costs incurred by
the Seller as at the time of
termination, less 5%
depreciation for every year of
NO
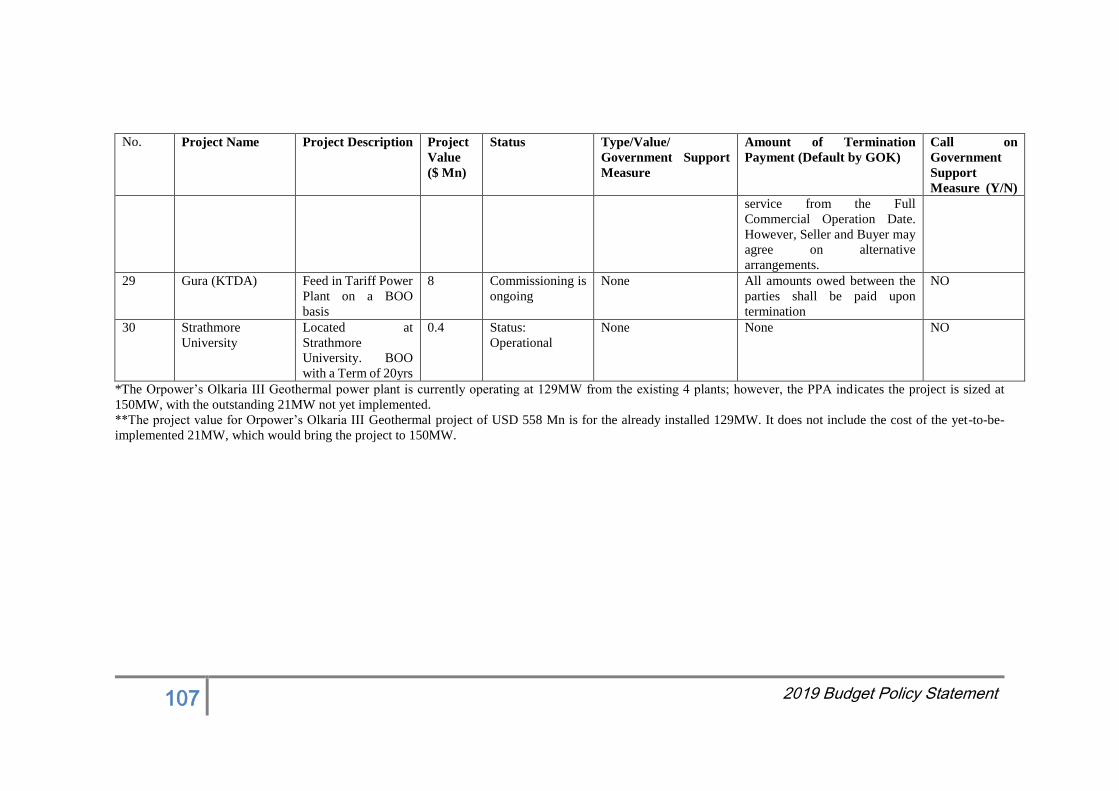
107 2019 Budget Policy Statement
No. Project Name Project Description Project
Value
($ Mn)
Status Type/Value/
Government Support
Measure
Amount of Termination
Payment (Default by GOK)
Call on
Government
Support
Measure (Y/N)
service from the Full
Commercial Operation Date.
However, Seller and Buyer may
agree on alternative
arrangements.
29 Gura (KTDA) Feed in Tariff Power
Plant on a BOO
basis
8 Commissioning is
ongoing
None All amounts owed between the
parties shall be paid upon
termination
NO
30 Strathmore
University
Located at
Strathmore
University. BOO
with a Term of 20yrs
0.4 Status:
Operational
None None NO
*The Orpower’s Olkaria III Geothermal power plant is currently operating at 129MW from the existing 4 plants; however, the PPA indicates the project is sized at
150MW, with the outstanding 21MW not yet implemented.
**The project value for Orpower’s Olkaria III Geothermal project of USD 558 Mn is for the already installed 129MW. It does not include the cost of the yet-to-be-
implemented 21MW, which would bring the project to 150MW.
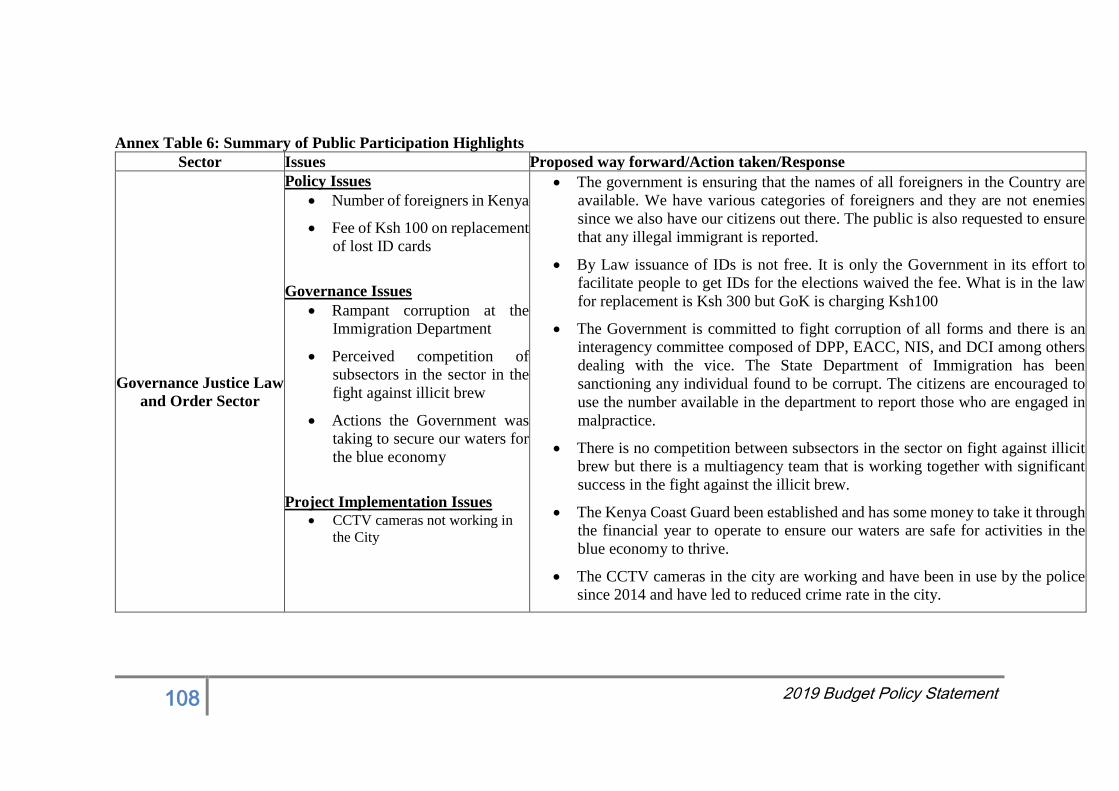
108 2019 Budget Policy Statement
Annex Table 6: Summary of Public Participation Highlights
Sector Issues Proposed way forward/Action taken/Response
Governance Justice Law
and Order Sector
Policy Issues
Number of foreigners in Kenya
Fee of Ksh 100 on replacement
of lost ID cards
Governance Issues
Rampant corruption at the
Immigration Department
Perceived competition of
subsectors in the sector in the
fight against illicit brew
Actions the Government was
taking to secure our waters for
the blue economy
Project Implementation Issues
CCTV cameras not working in
the City
The government is ensuring that the names of all foreigners in the Country are
available. We have various categories of foreigners and they are not enemies
since we also have our citizens out there. The public is also requested to ensure
that any illegal immigrant is reported.
By Law issuance of IDs is not free. It is only the Government in its effort to
facilitate people to get IDs for the elections waived the fee. What is in the law
for replacement is Ksh 300 but GoK is charging Ksh100
The Government is committed to fight corruption of all forms and there is an
interagency committee composed of DPP, EACC, NIS, and DCI among others
dealing with the vice. The State Department of Immigration has been
sanctioning any individual found to be corrupt. The citizens are encouraged to
use the number available in the department to report those who are engaged in
malpractice.
There is no competition between subsectors in the sector on fight against illicit
brew but there is a multiagency team that is working together with significant
success in the fight against the illicit brew.
The Kenya Coast Guard been established and has some money to take it through
the financial year to operate to ensure our waters are safe for activities in the
blue economy to thrive.
The CCTV cameras in the city are working and have been in use by the police
since 2014 and have led to reduced crime rate in the city.
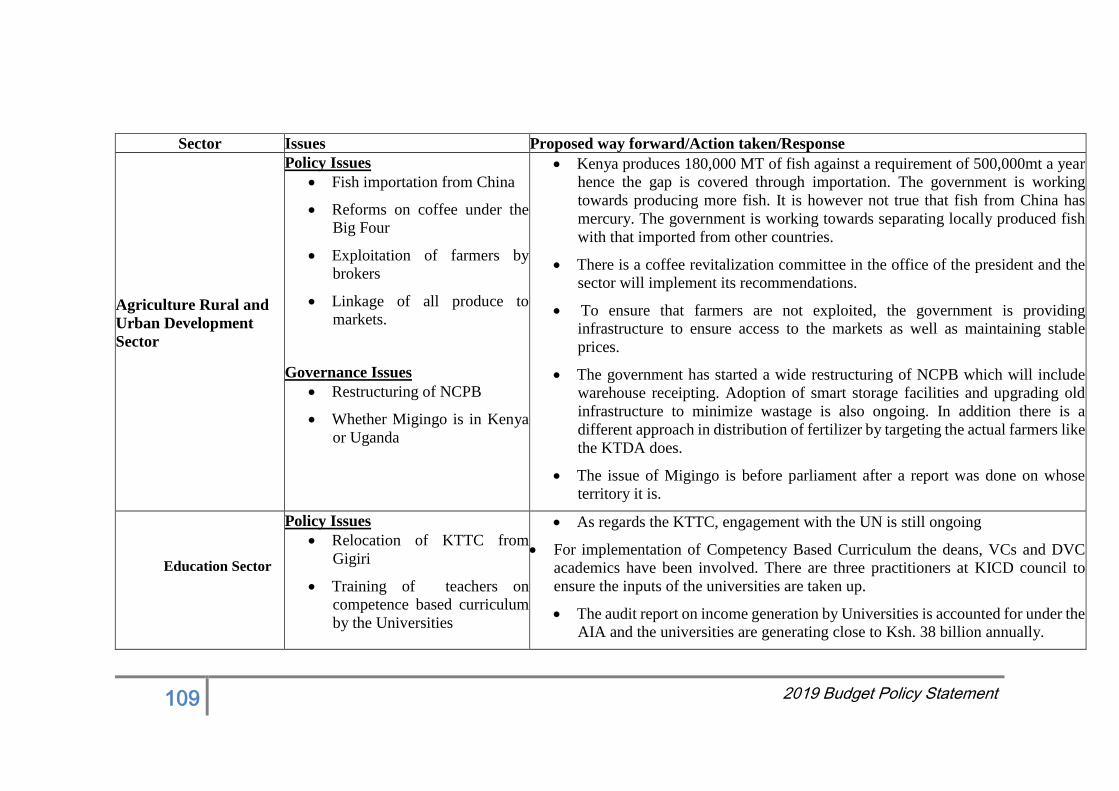
109 2019 Budget Policy Statement
Sector Issues Proposed way forward/Action taken/Response
Agriculture Rural and
Urban Development
Sector
Policy Issues
Fish importation from China
Reforms on coffee under the
Big Four
Exploitation of farmers by
brokers
Linkage of all produce to
markets.
Governance Issues
Restructuring of NCPB
Whether Migingo is in Kenya
or Uganda
Kenya produces 180,000 MT of fish against a requirement of 500,000mt a year
hence the gap is covered through importation. The government is working
towards producing more fish. It is however not true that fish from China has
mercury. The government is working towards separating locally produced fish
with that imported from other countries.
There is a coffee revitalization committee in the office of the president and the
sector will implement its recommendations.
To ensure that farmers are not exploited, the government is providing
infrastructure to ensure access to the markets as well as maintaining stable
prices.
The government has started a wide restructuring of NCPB which will include
warehouse receipting. Adoption of smart storage facilities and upgrading old
infrastructure to minimize wastage is also ongoing. In addition there is a
different approach in distribution of fertilizer by targeting the actual farmers like
the KTDA does.
The issue of Migingo is before parliament after a report was done on whose
territory it is.
Education Sector
Policy Issues
Relocation of KTTC from
Gigiri
Training of teachers on
competence based curriculum
by the Universities
As regards the KTTC, engagement with the UN is still ongoing
For implementation of Competency Based Curriculum the deans, VCs and DVC
academics have been involved. There are three practitioners at KICD council to
ensure the inputs of the universities are taken up.
The audit report on income generation by Universities is accounted for under the
AIA and the universities are generating close to Ksh. 38 billion annually.
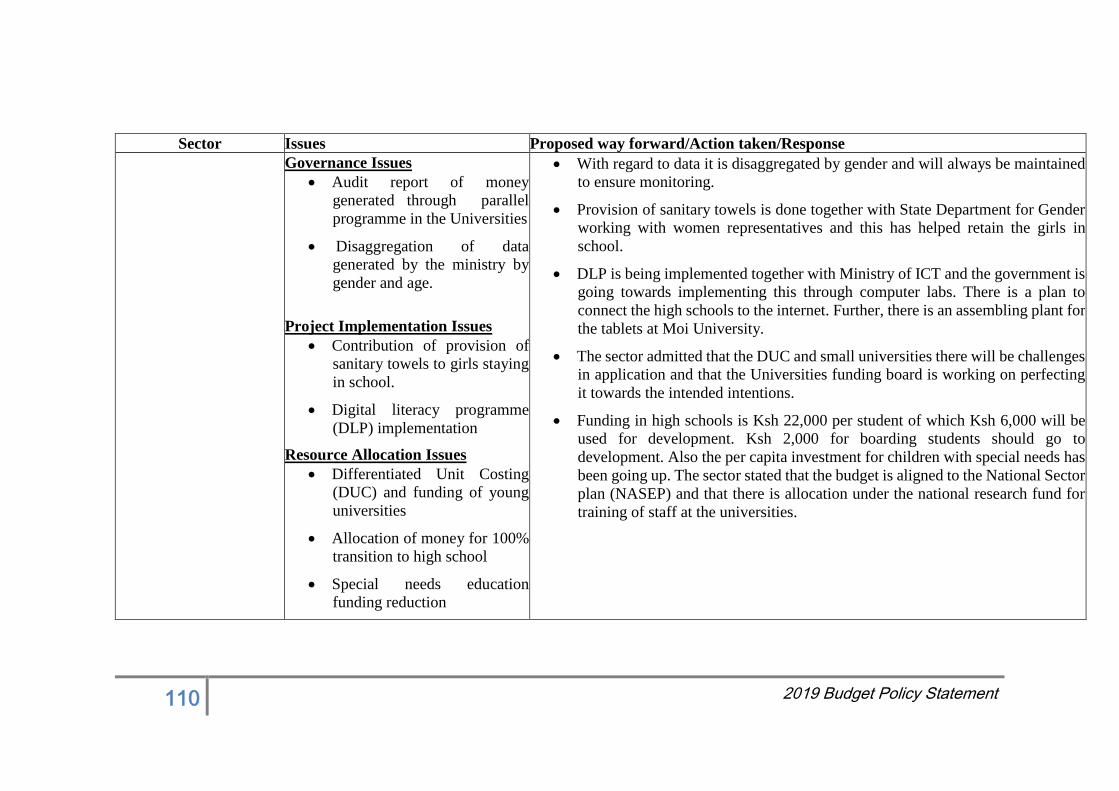
110 2019 Budget Policy Statement
Sector Issues Proposed way forward/Action taken/Response
Governance Issues
Audit report of money
generated through parallel
programme in the Universities
Disaggregation of data
generated by the ministry by
gender and age.
Project Implementation Issues
Contribution of provision of
sanitary towels to girls staying
in school.
Digital literacy programme
(DLP) implementation
Resource Allocation Issues
Differentiated Unit Costing
(DUC) and funding of young
universities
Allocation of money for 100%
transition to high school
Special needs education
funding reduction
With regard to data it is disaggregated by gender and will always be maintained
to ensure monitoring.
Provision of sanitary towels is done together with State Department for Gender
working with women representatives and this has helped retain the girls in
school.
DLP is being implemented together with Ministry of ICT and the government is
going towards implementing this through computer labs. There is a plan to
connect the high schools to the internet. Further, there is an assembling plant for
the tablets at Moi University.
The sector admitted that the DUC and small universities there will be challenges
in application and that the Universities funding board is working on perfecting
it towards the intended intentions.
Funding in high schools is Ksh 22,000 per student of which Ksh 6,000 will be
used for development. Ksh 2,000 for boarding students should go to
development. Also the per capita investment for children with special needs has
been going up. The sector stated that the budget is aligned to the National Sector
plan (NASEP) and that there is allocation under the national research fund for
training of staff at the universities.
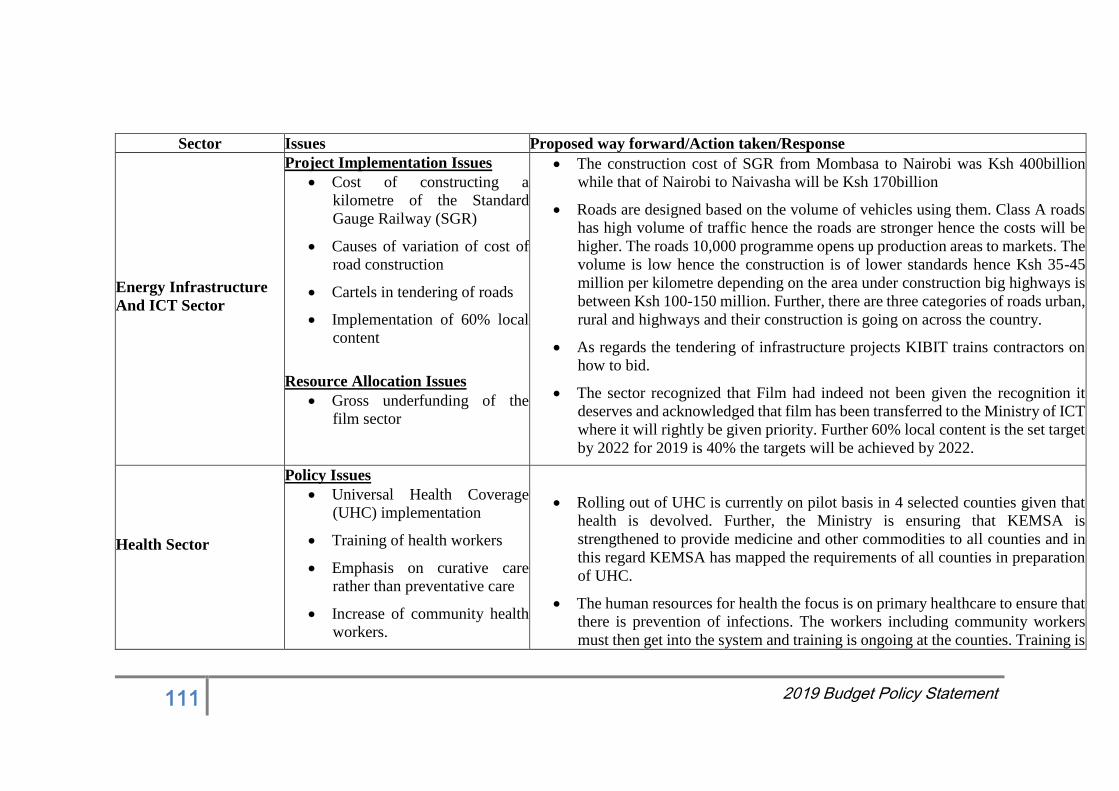
111 2019 Budget Policy Statement
Sector Issues Proposed way forward/Action taken/Response
Energy Infrastructure
And ICT Sector
Project Implementation Issues
Cost of constructing a
kilometre of the Standard
Gauge Railway (SGR)
Causes of variation of cost of
road construction
Cartels in tendering of roads
Implementation of 60% local
content
Resource Allocation Issues
Gross underfunding of the
film sector
The construction cost of SGR from Mombasa to Nairobi was Ksh 400billion
while that of Nairobi to Naivasha will be Ksh 170billion
Roads are designed based on the volume of vehicles using them. Class A roads
has high volume of traffic hence the roads are stronger hence the costs will be
higher. The roads 10,000 programme opens up production areas to markets. The
volume is low hence the construction is of lower standards hence Ksh 35-45
million per kilometre depending on the area under construction big highways is
between Ksh 100-150 million. Further, there are three categories of roads urban,
rural and highways and their construction is going on across the country.
As regards the tendering of infrastructure projects KIBIT trains contractors on
how to bid.
The sector recognized that Film had indeed not been given the recognition it
deserves and acknowledged that film has been transferred to the Ministry of ICT
where it will rightly be given priority. Further 60% local content is the set target
by 2022 for 2019 is 40% the targets will be achieved by 2022.
Health Sector
Policy Issues
Universal Health Coverage
(UHC) implementation
Training of health workers
Emphasis on curative care
rather than preventative care
Increase of community health
workers.
Rolling out of UHC is currently on pilot basis in 4 selected counties given that
health is devolved. Further, the Ministry is ensuring that KEMSA is
strengthened to provide medicine and other commodities to all counties and in
this regard KEMSA has mapped the requirements of all counties in preparation
of UHC.
The human resources for health the focus is on primary healthcare to ensure that
there is prevention of infections. The workers including community workers
must then get into the system and training is ongoing at the counties. Training is
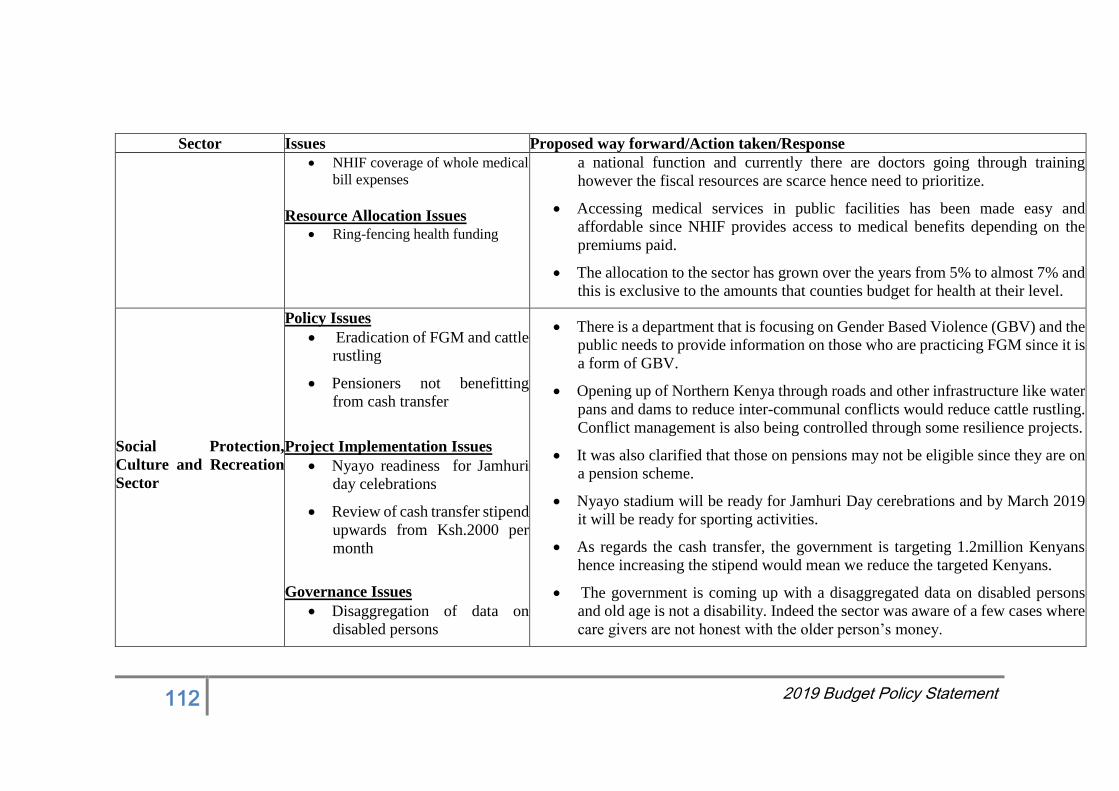
112 2019 Budget Policy Statement
Sector Issues Proposed way forward/Action taken/Response
NHIF coverage of whole medical
bill expenses
Resource Allocation Issues Ring-fencing health funding
a national function and currently there are doctors going through training
however the fiscal resources are scarce hence need to prioritize.
Accessing medical services in public facilities has been made easy and
affordable since NHIF provides access to medical benefits depending on the
premiums paid.
The allocation to the sector has grown over the years from 5% to almost 7% and
this is exclusive to the amounts that counties budget for health at their level.
Social Protection,
Culture and Recreation
Sector
Policy Issues
Eradication of FGM and cattle
rustling
Pensioners not benefitting
from cash transfer
Project Implementation Issues
Nyayo readiness for Jamhuri
day celebrations
Review of cash transfer stipend
upwards from Ksh.2000 per
month
Governance Issues
Disaggregation of data on
disabled persons
There is a department that is focusing on Gender Based Violence (GBV) and the
public needs to provide information on those who are practicing FGM since it is
a form of GBV.
Opening up of Northern Kenya through roads and other infrastructure like water
pans and dams to reduce inter-communal conflicts would reduce cattle rustling.
Conflict management is also being controlled through some resilience projects.
It was also clarified that those on pensions may not be eligible since they are on
a pension scheme.
Nyayo stadium will be ready for Jamhuri Day cerebrations and by March 2019
it will be ready for sporting activities.
As regards the cash transfer, the government is targeting 1.2million Kenyans
hence increasing the stipend would mean we reduce the targeted Kenyans.
The government is coming up with a disaggregated data on disabled persons
and old age is not a disability. Indeed the sector was aware of a few cases where
care givers are not honest with the older person’s money.
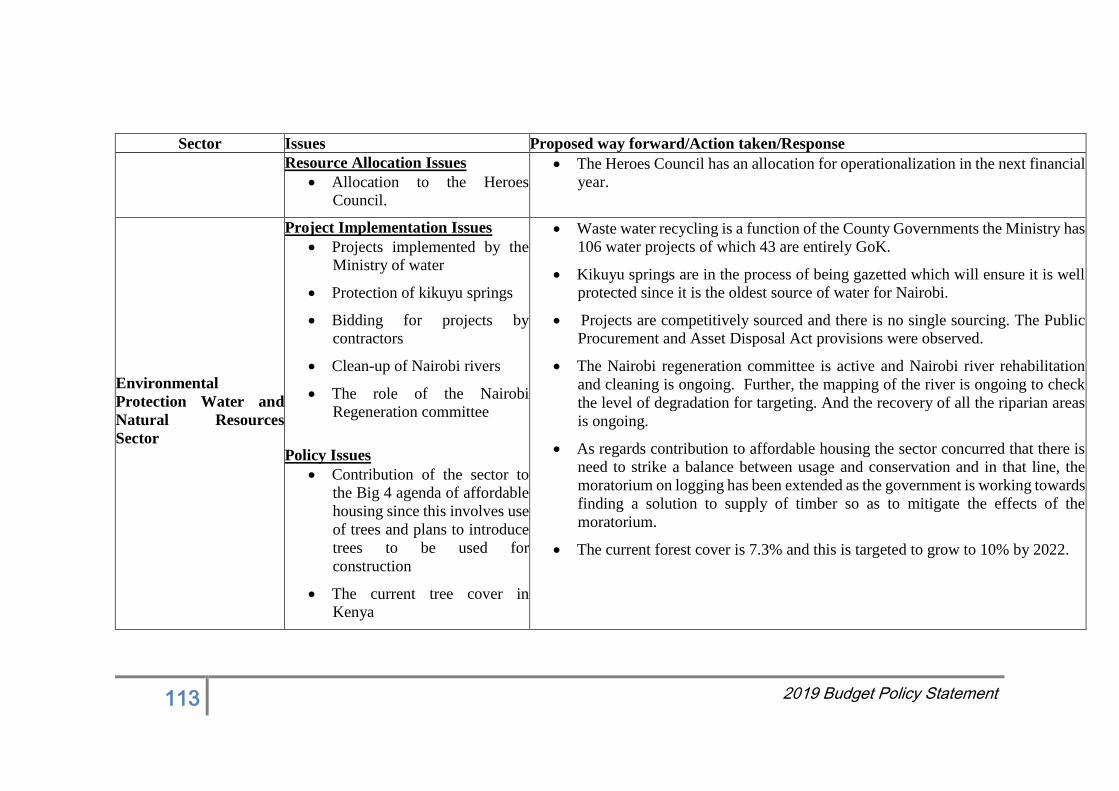
113 2019 Budget Policy Statement
Sector Issues Proposed way forward/Action taken/Response
Resource Allocation Issues
Allocation to the Heroes
Council.
The Heroes Council has an allocation for operationalization in the next financial
year.
Environmental
Protection Water and
Natural Resources
Sector
Project Implementation Issues
Projects implemented by the
Ministry of water
Protection of kikuyu springs
Bidding for projects by
contractors
Clean-up of Nairobi rivers
The role of the Nairobi
Regeneration committee
Policy Issues
Contribution of the sector to
the Big 4 agenda of affordable
housing since this involves use
of trees and plans to introduce
trees to be used for
construction
The current tree cover in
Kenya
Waste water recycling is a function of the County Governments the Ministry has
106 water projects of which 43 are entirely GoK.
Kikuyu springs are in the process of being gazetted which will ensure it is well
protected since it is the oldest source of water for Nairobi.
Projects are competitively sourced and there is no single sourcing. The Public
Procurement and Asset Disposal Act provisions were observed.
The Nairobi regeneration committee is active and Nairobi river rehabilitation
and cleaning is ongoing. Further, the mapping of the river is ongoing to check
the level of degradation for targeting. And the recovery of all the riparian areas
is ongoing.
As regards contribution to affordable housing the sector concurred that there is
need to strike a balance between usage and conservation and in that line, the
moratorium on logging has been extended as the government is working towards
finding a solution to supply of timber so as to mitigate the effects of the
moratorium.
The current forest cover is 7.3% and this is targeted to grow to 10% by 2022.
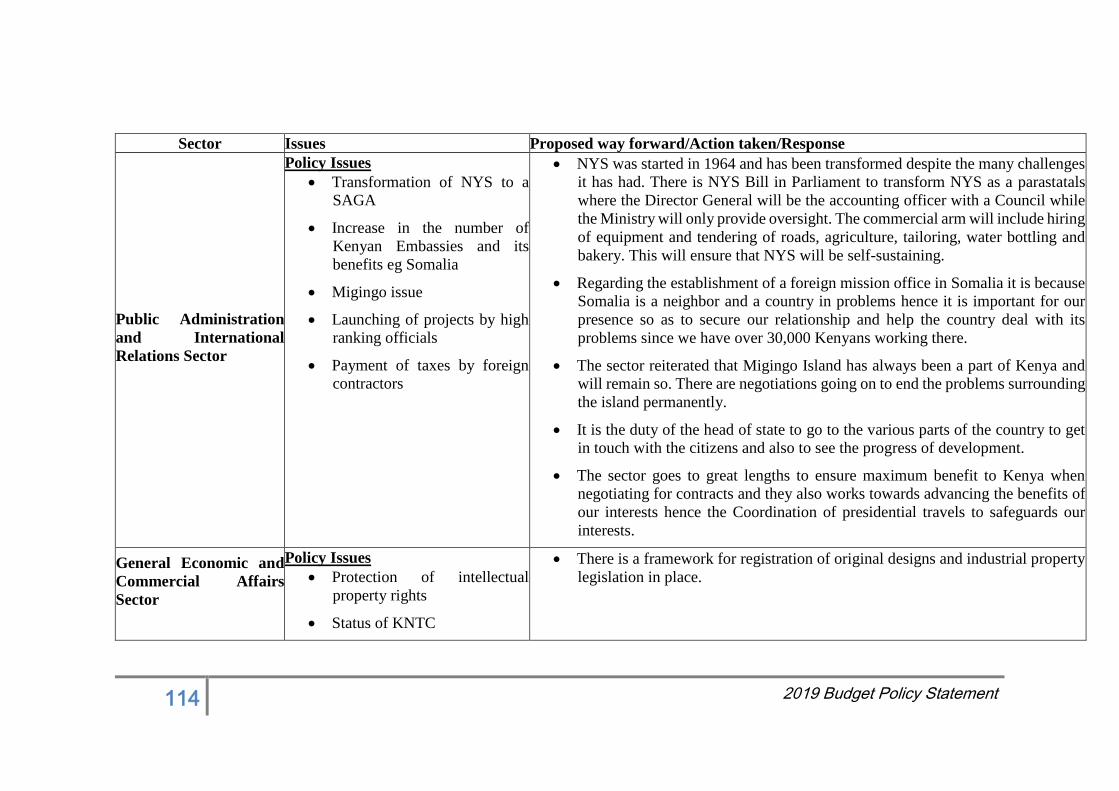
114 2019 Budget Policy Statement
Sector Issues Proposed way forward/Action taken/Response
Public Administration
and International
Relations Sector
Policy Issues
Transformation of NYS to a
SAGA
Increase in the number of
Kenyan Embassies and its
benefits eg Somalia
Migingo issue
Launching of projects by high
ranking officials
Payment of taxes by foreign
contractors
NYS was started in 1964 and has been transformed despite the many challenges
it has had. There is NYS Bill in Parliament to transform NYS as a parastatals
where the Director General will be the accounting officer with a Council while
the Ministry will only provide oversight. The commercial arm will include hiring
of equipment and tendering of roads, agriculture, tailoring, water bottling and
bakery. This will ensure that NYS will be self-sustaining.
Regarding the establishment of a foreign mission office in Somalia it is because
Somalia is a neighbor and a country in problems hence it is important for our
presence so as to secure our relationship and help the country deal with its
problems since we have over 30,000 Kenyans working there.
The sector reiterated that Migingo Island has always been a part of Kenya and
will remain so. There are negotiations going on to end the problems surrounding
the island permanently.
It is the duty of the head of state to go to the various parts of the country to get
in touch with the citizens and also to see the progress of development.
The sector goes to great lengths to ensure maximum benefit to Kenya when
negotiating for contracts and they also works towards advancing the benefits of
our interests hence the Coordination of presidential travels to safeguards our
interests.
General Economic and
Commercial Affairs
Sector
Policy Issues
Protection of intellectual
property rights
Status of KNTC
There is a framework for registration of original designs and industrial property
legislation in place.
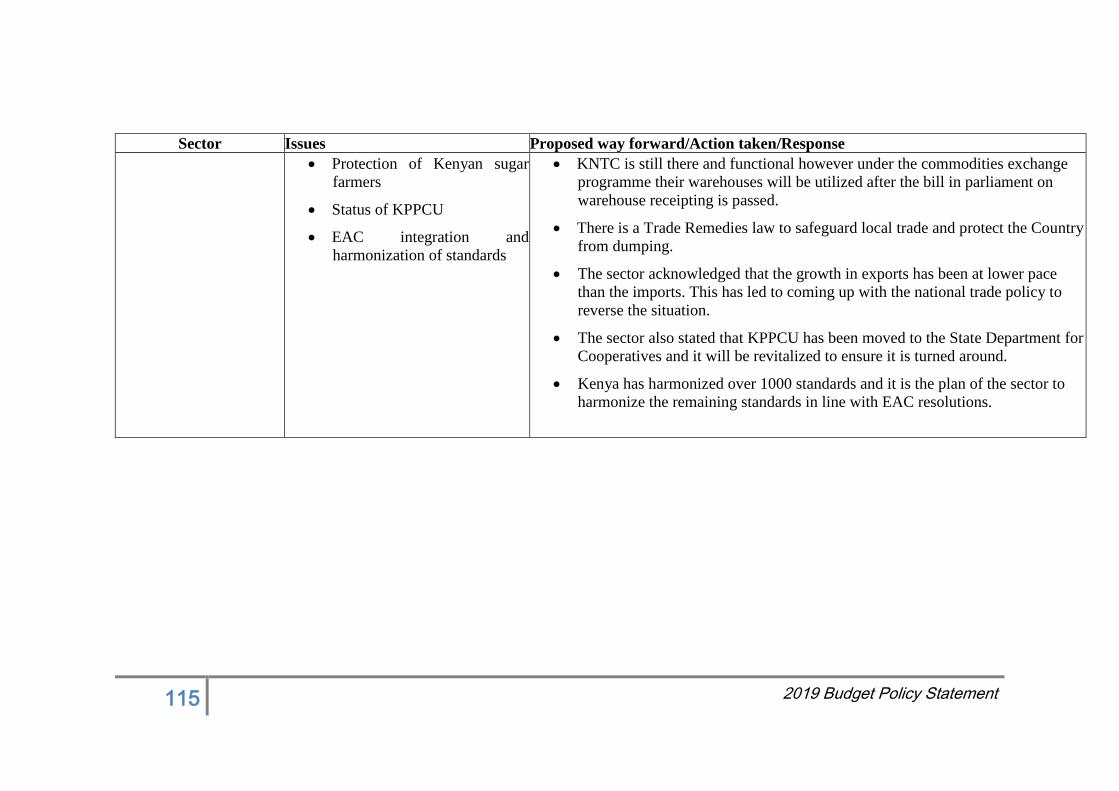
115 2019 Budget Policy Statement
Sector Issues Proposed way forward/Action taken/Response
Protection of Kenyan sugar
farmers
Status of KPPCU
EAC integration and
harmonization of standards
KNTC is still there and functional however under the commodities exchange
programme their warehouses will be utilized after the bill in parliament on
warehouse receipting is passed.
There is a Trade Remedies law to safeguard local trade and protect the Country
from dumping.
The sector acknowledged that the growth in exports has been at lower pace
than the imports. This has led to coming up with the national trade policy to
reverse the situation.
The sector also stated that KPPCU has been moved to the State Department for
Cooperatives and it will be revitalized to ensure it is turned around.
Kenya has harmonized over 1000 standards and it is the plan of the sector to
harmonize the remaining standards in line with EAC resolutions.
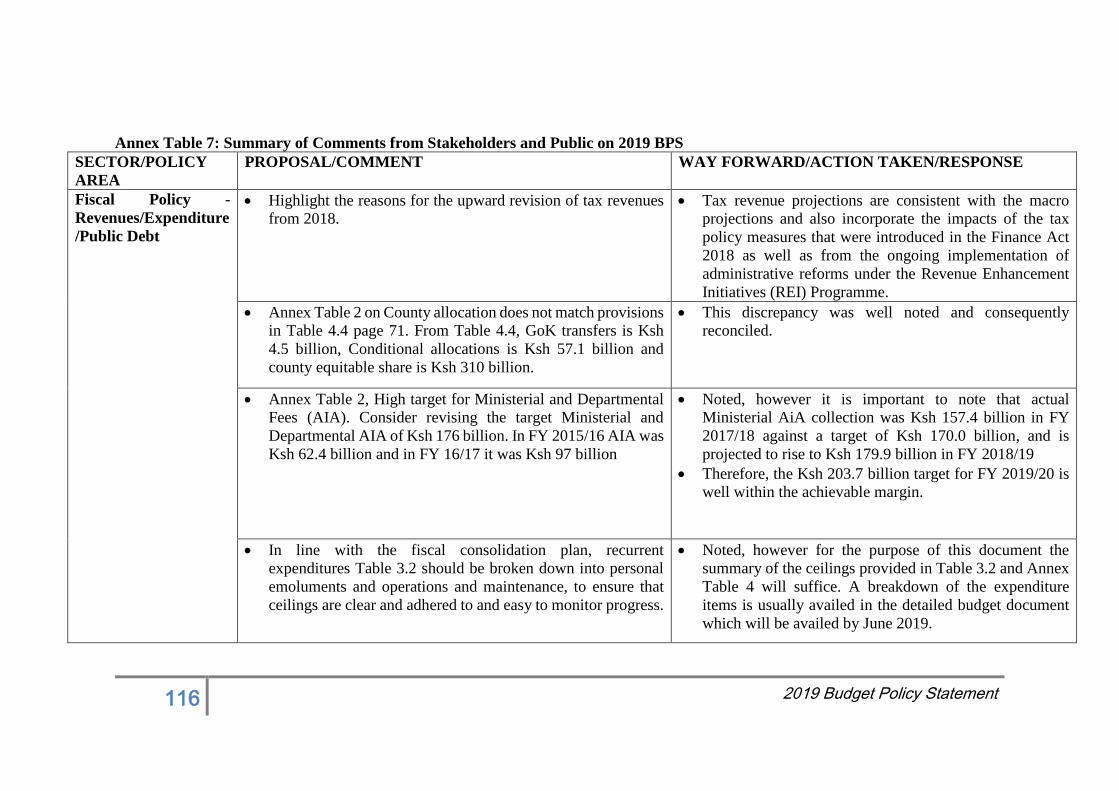
116 2019 Budget Policy Statement
Annex Table 7: Summary of Comments from Stakeholders and Public on 2019 BPS
SECTOR/POLICY
AREA
PROPOSAL/COMMENT WAY FORWARD/ACTION TAKEN/RESPONSE
Fiscal Policy -
Revenues/Expenditure
/Public Debt
Highlight the reasons for the upward revision of tax revenues
from 2018.
Tax revenue projections are consistent with the macro
projections and also incorporate the impacts of the tax
policy measures that were introduced in the Finance Act
2018 as well as from the ongoing implementation of
administrative reforms under the Revenue Enhancement
Initiatives (REI) Programme.
Annex Table 2 on County allocation does not match provisions
in Table 4.4 page 71. From Table 4.4, GoK transfers is Ksh
4.5 billion, Conditional allocations is Ksh 57.1 billion and
county equitable share is Ksh 310 billion.
This discrepancy was well noted and consequently
reconciled.
Annex Table 2, High target for Ministerial and Departmental
Fees (AIA). Consider revising the target Ministerial and
Departmental AIA of Ksh 176 billion. In FY 2015/16 AIA was
Ksh 62.4 billion and in FY 16/17 it was Ksh 97 billion
Noted, however it is important to note that actual
Ministerial AiA collection was Ksh 157.4 billion in FY
2017/18 against a target of Ksh 170.0 billion, and is
projected to rise to Ksh 179.9 billion in FY 2018/19
Therefore, the Ksh 203.7 billion target for FY 2019/20 is
well within the achievable margin.
In line with the fiscal consolidation plan, recurrent
expenditures Table 3.2 should be broken down into personal
emoluments and operations and maintenance, to ensure that
ceilings are clear and adhered to and easy to monitor progress.
Noted, however for the purpose of this document the
summary of the ceilings provided in Table 3.2 and Annex
Table 4 will suffice. A breakdown of the expenditure
items is usually availed in the detailed budget document
which will be availed by June 2019.
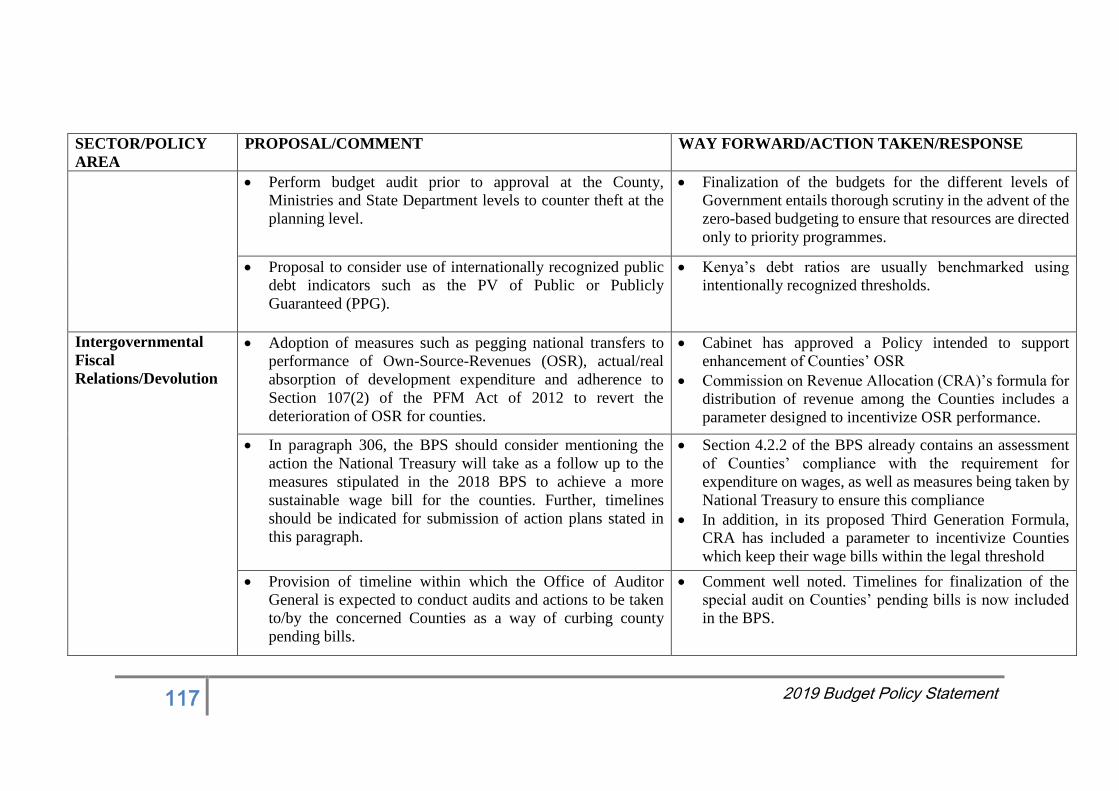
117 2019 Budget Policy Statement
SECTOR/POLICY
AREA
PROPOSAL/COMMENT WAY FORWARD/ACTION TAKEN/RESPONSE
Perform budget audit prior to approval at the County,
Ministries and State Department levels to counter theft at the
planning level.
Finalization of the budgets for the different levels of
Government entails thorough scrutiny in the advent of the
zero-based budgeting to ensure that resources are directed
only to priority programmes.
Proposal to consider use of internationally recognized public
debt indicators such as the PV of Public or Publicly
Guaranteed (PPG).
Kenya’s debt ratios are usually benchmarked using
intentionally recognized thresholds.
Intergovernmental
Fiscal
Relations/Devolution
Adoption of measures such as pegging national transfers to
performance of Own-Source-Revenues (OSR), actual/real
absorption of development expenditure and adherence to
Section 107(2) of the PFM Act of 2012 to revert the
deterioration of OSR for counties.
Cabinet has approved a Policy intended to support
enhancement of Counties’ OSR
Commission on Revenue Allocation (CRA)’s formula for
distribution of revenue among the Counties includes a
parameter designed to incentivize OSR performance.
In paragraph 306, the BPS should consider mentioning the
action the National Treasury will take as a follow up to the
measures stipulated in the 2018 BPS to achieve a more
sustainable wage bill for the counties. Further, timelines
should be indicated for submission of action plans stated in
this paragraph.
Section 4.2.2 of the BPS already contains an assessment
of Counties’ compliance with the requirement for
expenditure on wages, as well as measures being taken by
National Treasury to ensure this compliance
In addition, in its proposed Third Generation Formula,
CRA has included a parameter to incentivize Counties
which keep their wage bills within the legal threshold
Provision of timeline within which the Office of Auditor
General is expected to conduct audits and actions to be taken
to/by the concerned Counties as a way of curbing county
pending bills.
Comment well noted. Timelines for finalization of the
special audit on Counties’ pending bills is now included
in the BPS.
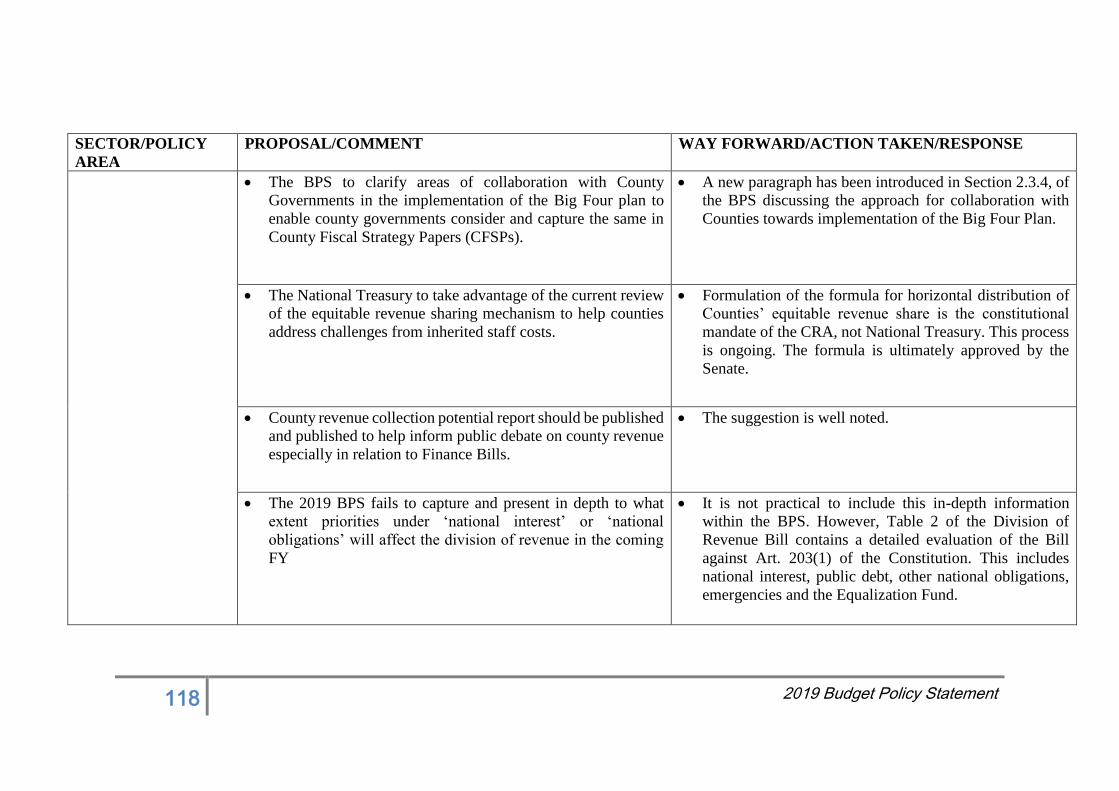
118 2019 Budget Policy Statement
SECTOR/POLICY
AREA
PROPOSAL/COMMENT WAY FORWARD/ACTION TAKEN/RESPONSE
The BPS to clarify areas of collaboration with County
Governments in the implementation of the Big Four plan to
enable county governments consider and capture the same in
County Fiscal Strategy Papers (CFSPs).
A new paragraph has been introduced in Section 2.3.4, of
the BPS discussing the approach for collaboration with
Counties towards implementation of the Big Four Plan.
The National Treasury to take advantage of the current review
of the equitable revenue sharing mechanism to help counties
address challenges from inherited staff costs.
Formulation of the formula for horizontal distribution of
Counties’ equitable revenue share is the constitutional
mandate of the CRA, not National Treasury. This process
is ongoing. The formula is ultimately approved by the
Senate.
County revenue collection potential report should be published
and published to help inform public debate on county revenue
especially in relation to Finance Bills.
The suggestion is well noted.
The 2019 BPS fails to capture and present in depth to what
extent priorities under ‘national interest’ or ‘national
obligations’ will affect the division of revenue in the coming
FY
It is not practical to include this in-depth information
within the BPS. However, Table 2 of the Division of
Revenue Bill contains a detailed evaluation of the Bill
against Art. 203(1) of the Constitution. This includes
national interest, public debt, other national obligations,
emergencies and the Equalization Fund.
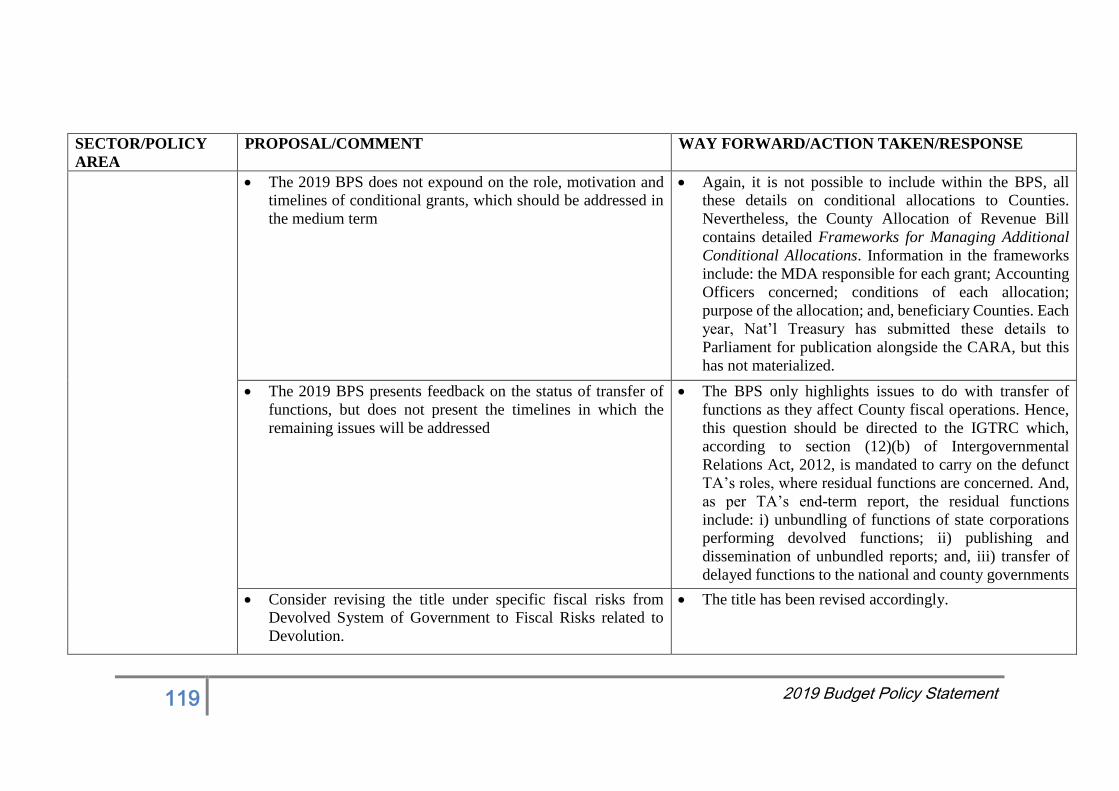
119 2019 Budget Policy Statement
SECTOR/POLICY
AREA
PROPOSAL/COMMENT WAY FORWARD/ACTION TAKEN/RESPONSE
The 2019 BPS does not expound on the role, motivation and
timelines of conditional grants, which should be addressed in
the medium term
Again, it is not possible to include within the BPS, all
these details on conditional allocations to Counties.
Nevertheless, the County Allocation of Revenue Bill
contains detailed Frameworks for Managing Additional
Conditional Allocations. Information in the frameworks
include: the MDA responsible for each grant; Accounting
Officers concerned; conditions of each allocation;
purpose of the allocation; and, beneficiary Counties. Each
year, Nat’l Treasury has submitted these details to
Parliament for publication alongside the CARA, but this
has not materialized.
The 2019 BPS presents feedback on the status of transfer of
functions, but does not present the timelines in which the
remaining issues will be addressed
The BPS only highlights issues to do with transfer of
functions as they affect County fiscal operations. Hence,
this question should be directed to the IGTRC which,
according to section (12)(b) of Intergovernmental
Relations Act, 2012, is mandated to carry on the defunct
TA’s roles, where residual functions are concerned. And,
as per TA’s end-term report, the residual functions
include: i) unbundling of functions of state corporations
performing devolved functions; ii) publishing and
dissemination of unbundled reports; and, iii) transfer of
delayed functions to the national and county governments
Consider revising the title under specific fiscal risks from
Devolved System of Government to Fiscal Risks related to
Devolution.
The title has been revised accordingly.
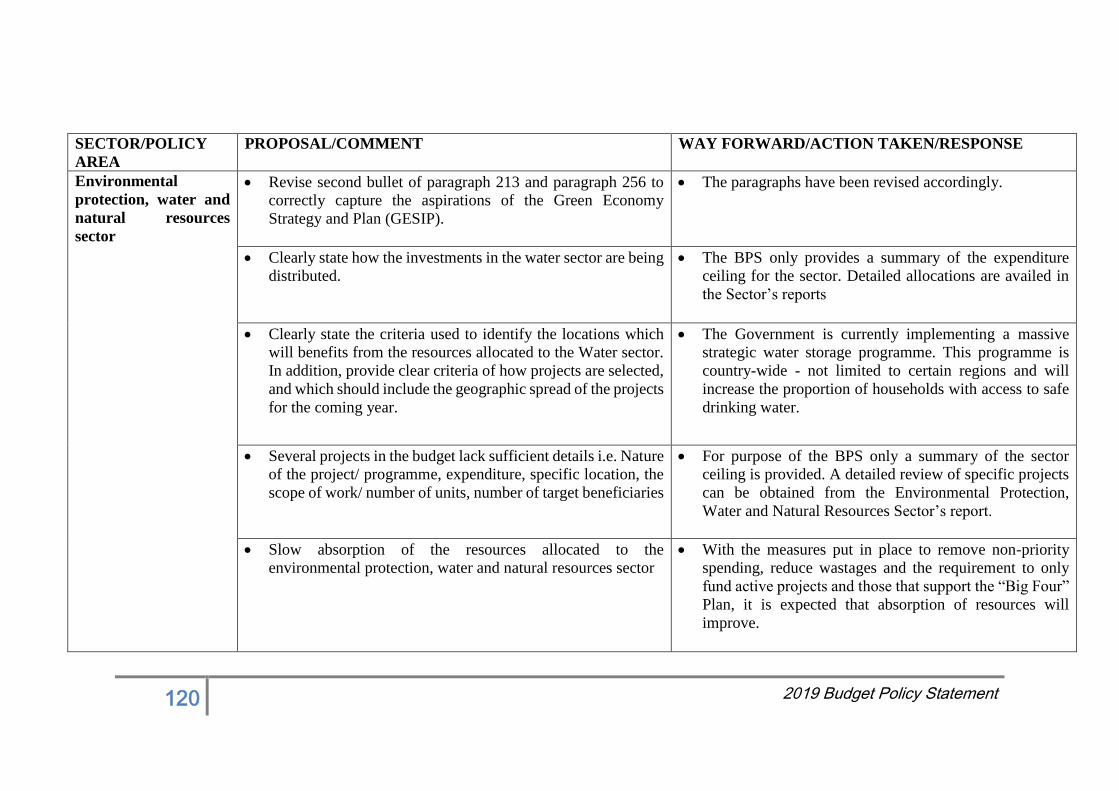
120 2019 Budget Policy Statement
SECTOR/POLICY
AREA
PROPOSAL/COMMENT WAY FORWARD/ACTION TAKEN/RESPONSE
Environmental
protection, water and
natural resources
sector
Revise second bullet of paragraph 213 and paragraph 256 to
correctly capture the aspirations of the Green Economy
Strategy and Plan (GESIP).
The paragraphs have been revised accordingly.
Clearly state how the investments in the water sector are being
distributed.
The BPS only provides a summary of the expenditure
ceiling for the sector. Detailed allocations are availed in
the Sector’s reports
Clearly state the criteria used to identify the locations which
will benefits from the resources allocated to the Water sector.
In addition, provide clear criteria of how projects are selected,
and which should include the geographic spread of the projects
for the coming year.
The Government is currently implementing a massive
strategic water storage programme. This programme is
country-wide - not limited to certain regions and will
increase the proportion of households with access to safe
drinking water.
Several projects in the budget lack sufficient details i.e. Nature
of the project/ programme, expenditure, specific location, the
scope of work/ number of units, number of target beneficiaries
For purpose of the BPS only a summary of the sector
ceiling is provided. A detailed review of specific projects
can be obtained from the Environmental Protection,
Water and Natural Resources Sector’s report.
Slow absorption of the resources allocated to the
environmental protection, water and natural resources sector
With the measures put in place to remove non-priority
spending, reduce wastages and the requirement to only
fund active projects and those that support the “Big Four”
Plan, it is expected that absorption of resources will
improve.
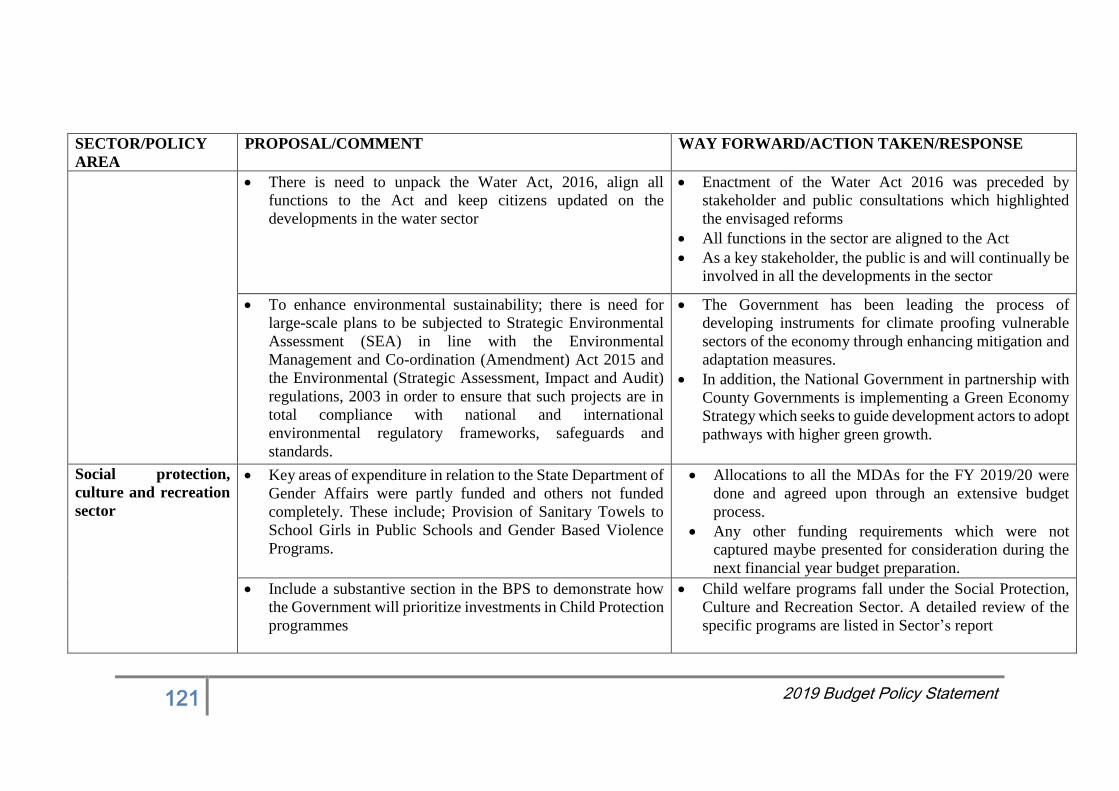
121 2019 Budget Policy Statement
SECTOR/POLICY
AREA
PROPOSAL/COMMENT WAY FORWARD/ACTION TAKEN/RESPONSE
There is need to unpack the Water Act, 2016, align all
functions to the Act and keep citizens updated on the
developments in the water sector
Enactment of the Water Act 2016 was preceded by
stakeholder and public consultations which highlighted
the envisaged reforms
All functions in the sector are aligned to the Act
As a key stakeholder, the public is and will continually be
involved in all the developments in the sector
To enhance environmental sustainability; there is need for
large-scale plans to be subjected to Strategic Environmental
Assessment (SEA) in line with the Environmental
Management and Co-ordination (Amendment) Act 2015 and
the Environmental (Strategic Assessment, Impact and Audit)
regulations, 2003 in order to ensure that such projects are in
total compliance with national and international
environmental regulatory frameworks, safeguards and
standards.
The Government has been leading the process of
developing instruments for climate proofing vulnerable
sectors of the economy through enhancing mitigation and
adaptation measures.
In addition, the National Government in partnership with
County Governments is implementing a Green Economy
Strategy which seeks to guide development actors to adopt
pathways with higher green growth.
Social protection,
culture and recreation
sector
Key areas of expenditure in relation to the State Department of
Gender Affairs were partly funded and others not funded
completely. These include; Provision of Sanitary Towels to
School Girls in Public Schools and Gender Based Violence
Programs.
Allocations to all the MDAs for the FY 2019/20 were
done and agreed upon through an extensive budget
process.
Any other funding requirements which were not
captured maybe presented for consideration during the
next financial year budget preparation.
Include a substantive section in the BPS to demonstrate how
the Government will prioritize investments in Child Protection
programmes
Child welfare programs fall under the Social Protection,
Culture and Recreation Sector. A detailed review of the
specific programs are listed in Sector’s report
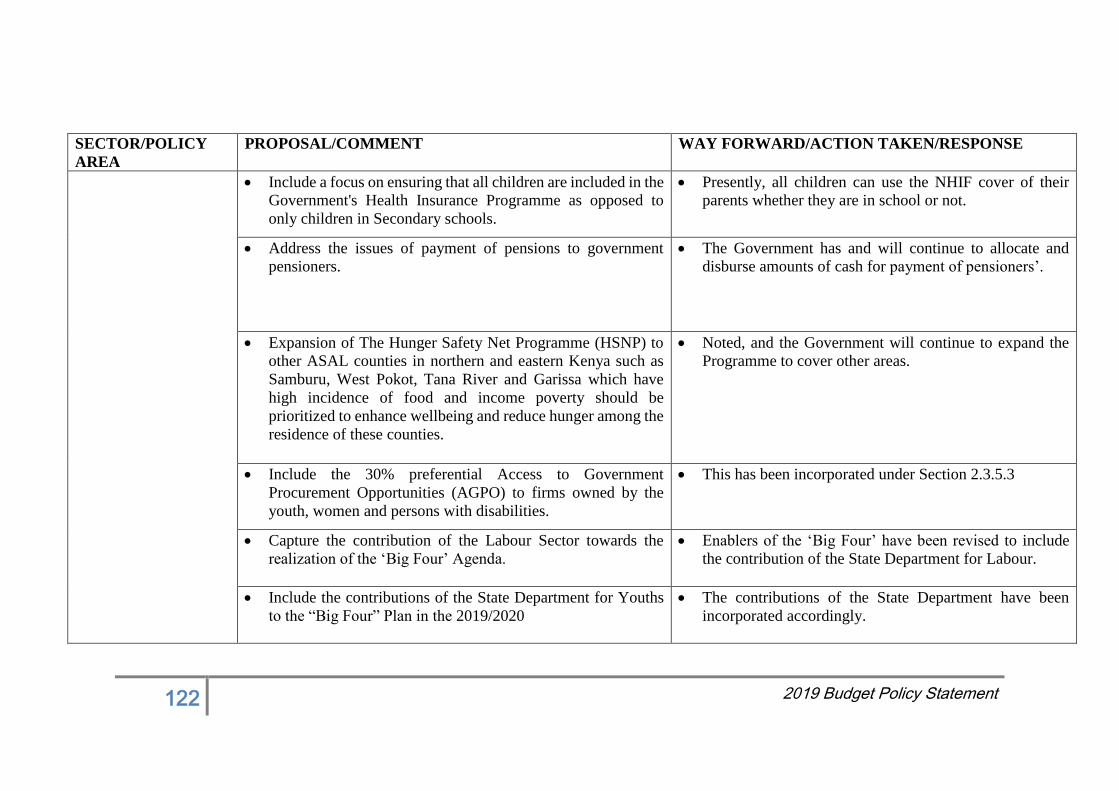
122 2019 Budget Policy Statement
SECTOR/POLICY
AREA
PROPOSAL/COMMENT WAY FORWARD/ACTION TAKEN/RESPONSE
Include a focus on ensuring that all children are included in the
Government's Health Insurance Programme as opposed to
only children in Secondary schools.
Presently, all children can use the NHIF cover of their
parents whether they are in school or not.
Address the issues of payment of pensions to government
pensioners.
The Government has and will continue to allocate and
disburse amounts of cash for payment of pensioners’.
Expansion of The Hunger Safety Net Programme (HSNP) to
other ASAL counties in northern and eastern Kenya such as
Samburu, West Pokot, Tana River and Garissa which have
high incidence of food and income poverty should be
prioritized to enhance wellbeing and reduce hunger among the
residence of these counties.
Noted, and the Government will continue to expand the
Programme to cover other areas.
Include the 30% preferential Access to Government
Procurement Opportunities (AGPO) to firms owned by the
youth, women and persons with disabilities.
This has been incorporated under Section 2.3.5.3
Capture the contribution of the Labour Sector towards the
realization of the ‘Big Four’ Agenda.
Enablers of the ‘Big Four’ have been revised to include
the contribution of the State Department for Labour.
Include the contributions of the State Department for Youths
to the “Big Four” Plan in the 2019/2020
The contributions of the State Department have been
incorporated accordingly.

123 2019 Budget Policy Statement
SECTOR/POLICY
AREA
PROPOSAL/COMMENT WAY FORWARD/ACTION TAKEN/RESPONSE
Public Administration
and International
Relations sector
Include the role of the State Department for Public Service in
enhancing the capacity of the civil servants for the
implementation of the “Big Four” initiative.
The role of the State Department has been captured
accordingly.
Education Consider extending capitation to all students both in public and
private schools and providing loans at preferential rates to
Investors in private education.
Consider all classifying private schools into National and
County categories and supporting training of teachers in
private schools.
Noted. The Government will continue to streamline
education policy in order to support education at all levels.
Energy, Infrastructure
and ICT Include: Kipevu Oil Terminal, 2nd Generation Smart Driving
License; implementation of Integrated Security System in
Kenya Ferry Services; Kenya National Shipping Line; and
LAPSSET projects that will be in the 2019/20 – 2021/22
MTEF period.
The projects have been incorporated accordingly.
Include an achievement and target that relate to the State
department for Shipping and Maritime.
An achievement and target relating to the State
Department for Shipping and Maritime has been
incorporated.
Rename the State Department to read State Department for
Shipping and Maritime in line with Executive Order No. 1 of
2018
The State Department has been renamed in the document
accordingly.
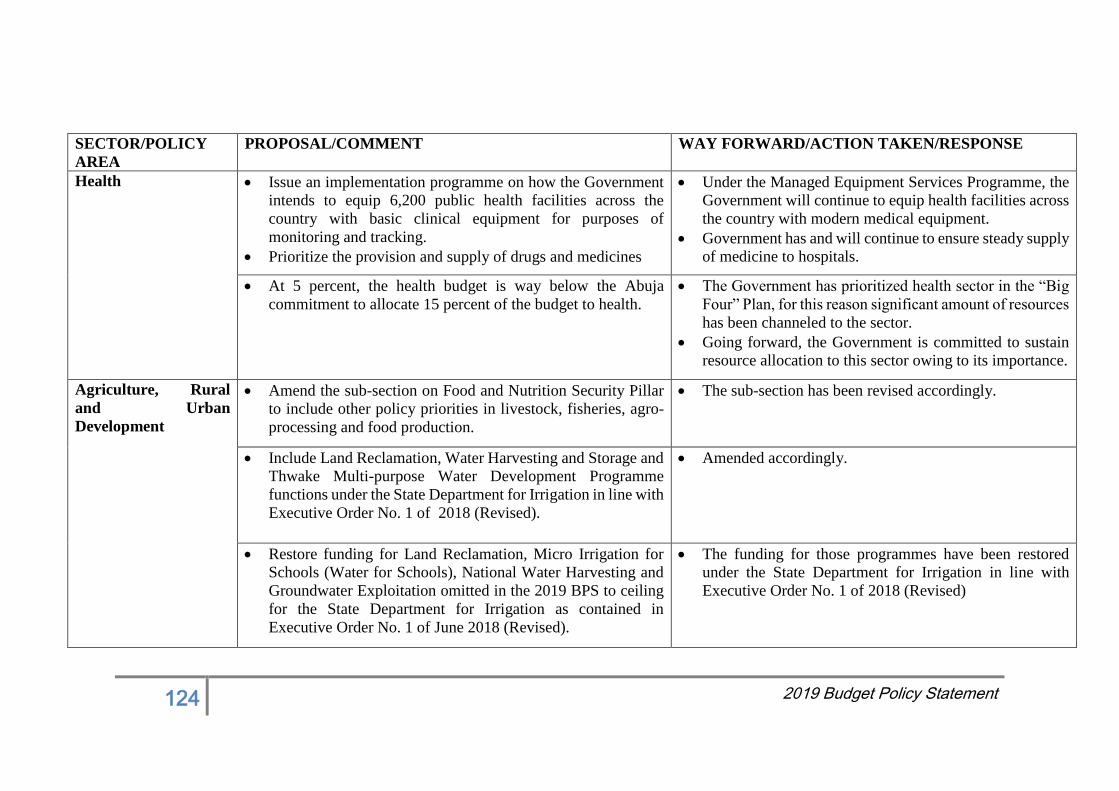
124 2019 Budget Policy Statement
SECTOR/POLICY
AREA
PROPOSAL/COMMENT WAY FORWARD/ACTION TAKEN/RESPONSE
Health Issue an implementation programme on how the Government
intends to equip 6,200 public health facilities across the
country with basic clinical equipment for purposes of
monitoring and tracking.
Prioritize the provision and supply of drugs and medicines
Under the Managed Equipment Services Programme, the
Government will continue to equip health facilities across
the country with modern medical equipment.
Government has and will continue to ensure steady supply
of medicine to hospitals.
At 5 percent, the health budget is way below the Abuja
commitment to allocate 15 percent of the budget to health.
The Government has prioritized health sector in the “Big
Four” Plan, for this reason significant amount of resources
has been channeled to the sector.
Going forward, the Government is committed to sustain
resource allocation to this sector owing to its importance.
Agriculture, Rural
and Urban
Development
Amend the sub-section on Food and Nutrition Security Pillar
to include other policy priorities in livestock, fisheries, agro-
processing and food production.
The sub-section has been revised accordingly.
Include Land Reclamation, Water Harvesting and Storage and
Thwake Multi-purpose Water Development Programme
functions under the State Department for Irrigation in line with
Executive Order No. 1 of 2018 (Revised).
Amended accordingly.
Restore funding for Land Reclamation, Micro Irrigation for
Schools (Water for Schools), National Water Harvesting and
Groundwater Exploitation omitted in the 2019 BPS to ceiling
for the State Department for Irrigation as contained in
Executive Order No. 1 of June 2018 (Revised).
The funding for those programmes have been restored
under the State Department for Irrigation in line with
Executive Order No. 1 of 2018 (Revised)
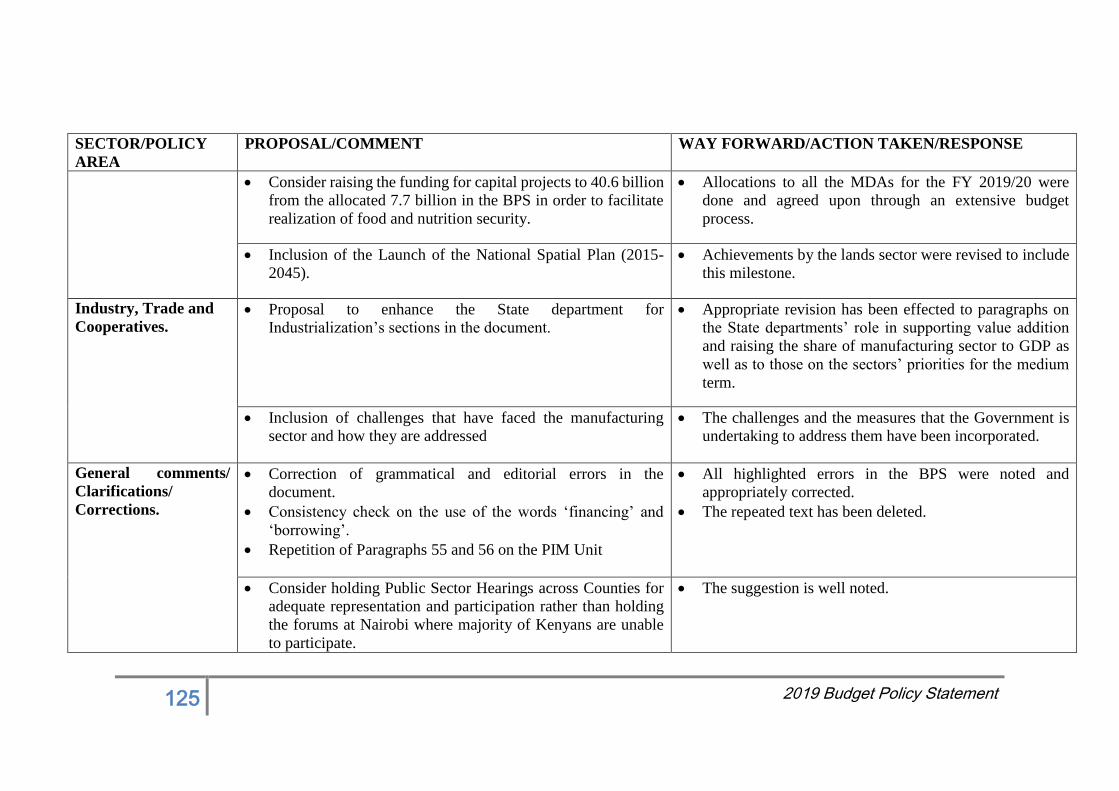
125 2019 Budget Policy Statement
SECTOR/POLICY
AREA
PROPOSAL/COMMENT WAY FORWARD/ACTION TAKEN/RESPONSE
Consider raising the funding for capital projects to 40.6 billion
from the allocated 7.7 billion in the BPS in order to facilitate
realization of food and nutrition security.
Allocations to all the MDAs for the FY 2019/20 were
done and agreed upon through an extensive budget
process.
Inclusion of the Launch of the National Spatial Plan (2015-
2045).
Achievements by the lands sector were revised to include
this milestone.
Industry, Trade and
Cooperatives. Proposal to enhance the State department for
Industrialization’s sections in the document.
Appropriate revision has been effected to paragraphs on
the State departments’ role in supporting value addition
and raising the share of manufacturing sector to GDP as
well as to those on the sectors’ priorities for the medium
term.
Inclusion of challenges that have faced the manufacturing
sector and how they are addressed
The challenges and the measures that the Government is
undertaking to address them have been incorporated.
General comments/
Clarifications/
Corrections.
Correction of grammatical and editorial errors in the
document.
Consistency check on the use of the words ‘financing’ and
‘borrowing’.
Repetition of Paragraphs 55 and 56 on the PIM Unit
All highlighted errors in the BPS were noted and
appropriately corrected.
The repeated text has been deleted.
Consider holding Public Sector Hearings across Counties for
adequate representation and participation rather than holding
the forums at Nairobi where majority of Kenyans are unable
to participate.
The suggestion is well noted.
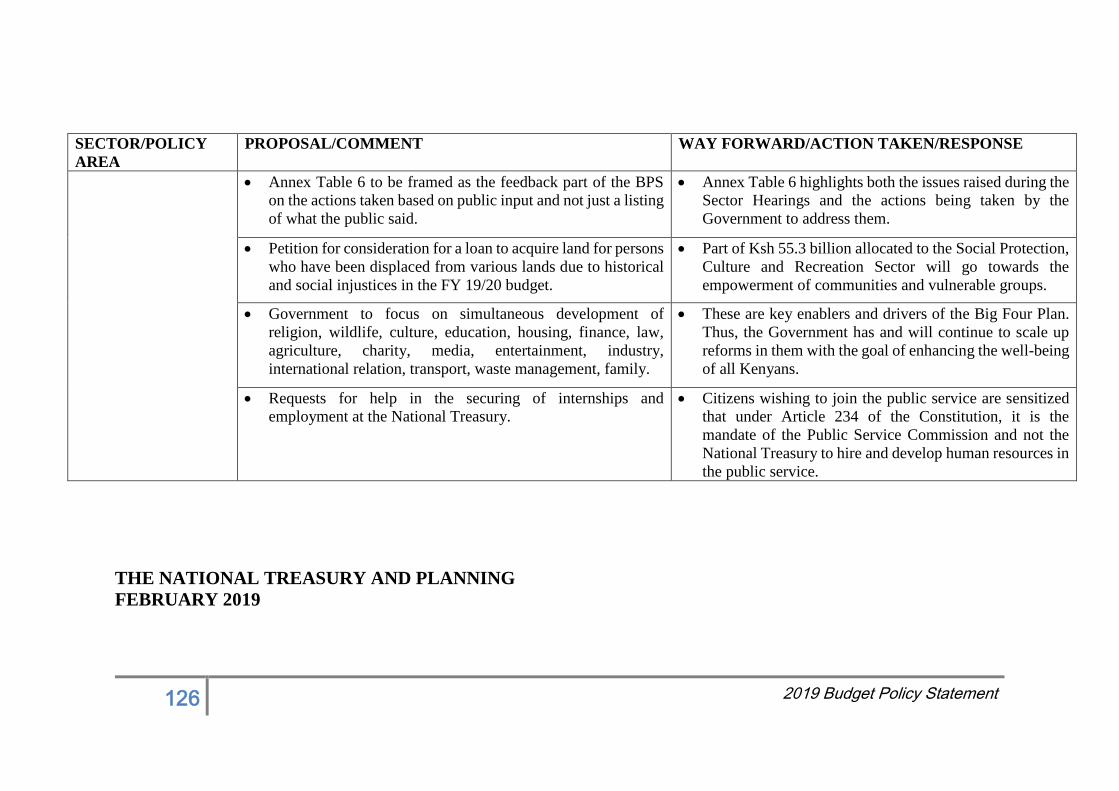
126 2019 Budget Policy Statement
SECTOR/POLICY
AREA
PROPOSAL/COMMENT WAY FORWARD/ACTION TAKEN/RESPONSE
Annex Table 6 to be framed as the feedback part of the BPS
on the actions taken based on public input and not just a listing
of what the public said.
Annex Table 6 highlights both the issues raised during the
Sector Hearings and the actions being taken by the
Government to address them.
Petition for consideration for a loan to acquire land for persons
who have been displaced from various lands due to historical
and social injustices in the FY 19/20 budget.
Part of Ksh 55.3 billion allocated to the Social Protection,
Culture and Recreation Sector will go towards the
empowerment of communities and vulnerable groups.
Government to focus on simultaneous development of
religion, wildlife, culture, education, housing, finance, law,
agriculture, charity, media, entertainment, industry,
international relation, transport, waste management, family.
These are key enablers and drivers of the Big Four Plan.
Thus, the Government has and will continue to scale up
reforms in them with the goal of enhancing the well-being
of all Kenyans.
Requests for help in the securing of internships and
employment at the National Treasury.
Citizens wishing to join the public service are sensitized
that under Article 234 of the Constitution, it is the
mandate of the Public Service Commission and not the
National Treasury to hire and develop human resources in
the public service.
THE NATIONAL TREASURY AND PLANNING
FEBRUARY 2019
127 2019 Budget Policy Statement