2018 Wasted Food Report
42
2018 Wasted Food Report Estimates of generation and management of wasted food in the United States in 2018 EPA 530-R-20-004 November 2020 Office of Resource Conservation and Recovery
-
Upload
khangminh22 -
Category
Documents
-
view
1 -
download
0
Transcript of 2018 Wasted Food Report

2018 Wasted Food Report Estimates of generation and management of wasted food in the United States in 2018
EPA 530-R-20-004 November 2020 Office of Resource Conservation and Recovery

1
Contents Executive Summary ............................................................................................................................................. 4
1 Background .................................................................................................................................................. 6
2 Scope and Terminology ................................................................................................................................ 6
3 Generation of Wasted Food ......................................................................................................................... 8
4 Management of Wasted Food .................................................................................................................... 15
4.1 Sector-by-Sector Summary ................................................................................................................. 20
4.1.1 Industrial Sector.......................................................................................................................... 20
4.1.2 Residential Sector ....................................................................................................................... 21
4.1.3 Commercial Sector...................................................................................................................... 21
4.1.4 Institutional Sector ..................................................................................................................... 23
4.1.5 Food Banks ................................................................................................................................. 23
4.2 Overall Summary of Generation and Management of Wasted Food.................................................... 24
5 Caveats and Uncertainties .......................................................................................................................... 26
6 References ................................................................................................................................................. 27
7 Appendix.................................................................................................................................................... 29
7.1 Glossary ............................................................................................................................................. 29
7.2 Sector-Specific References.................................................................................................................. 31
7.2.1 Industrial Sector.......................................................................................................................... 31
7.2.2 Residential Sector ....................................................................................................................... 31
7.2.3 Food Retail/Wholesale Sector ..................................................................................................... 34
7.2.4 Hospitality Sector........................................................................................................................ 35
7.2.5 Institutional Sector ..................................................................................................................... 36
7.3 Detailed Generation and Management Estimates of Wasted Food ..................................................... 40

2
List of Tables Table 1. Newly Added Generation Factors for 2018 Estimates.............................................................................. 9 Table 2. Average Wasted Food Generation Factors (2018) ................................................................................... 9 Table 3. Extrapolation Bases for Wasted Food Generation Estimates (2018) ...................................................... 10 Table 4. Estimated Annual Wasted Food Generation (2018)............................................................................... 13 Table 5. Quantity of Wasted Food Managed Based on Revised Management Profile (2018)............................... 19 Table 7. Generation and Management Estimates of Wasted Food by Sector (2018) ........................................... 40

3
List of Figures Figure 1. Percentage Distribution of Wasted Food Generation, Including the Industrial Sector (2018)................ 14 Figure 2. Percentage Distribution of Wasted Food Generation, Excluding the Industrial Sector (2018) ............... 15 Figure 3. Percentage Distribution of Wasted Food Management, Including the Industrial Sector (2018) ............ 19 Figure 4. Percentage Distribution of Wasted Food Management, Excluding the Industrial Sector (2018) ............ 20 Figure 5. Industrial Sector Wasted Food Management Profile (2018) ................................................................. 21 Figure 6. Residential Sector Wasted Food Management Profile (2018)............................................................... 21 Figure 7. Retail/Wholesale Sector Wasted Food Management Profile (2018) ..................................................... 22 Figure 8. Hospitality Sector Wasted Food Management Profile (2018) ............................................................... 23 Figure 9. Institutional Sector Wasted Food Management Profile (2018) ............................................................. 23 Figure 10. Food Bank Food Waste Management Profile (2018) .......................................................................... 24 Figure 11. Summary of Wasted Food Generation and Management Flows (2018) (Including Industrial Sector) .. 25 Figure 12. Summary of Wasted Food Generation and Management Flows (2018) (Excluding Industrial Sector) .. 25

4
E XEC UTIVE SUMMARY
In 2017, the U.S. Environmental Protection Agency (EPA) set out to revise its food measurement methodology to more fully capture flows of wasted food (i.e., excess food and food waste)1 throughout the food system, and to provide more granular annual estimates of generation and management of wasted food to the public. EPA developed an enhanced methodology to calculate sector-specific estimates of wasted food generation, as well as estimates of how much wasted food was sent to each management pathway. EPA’s “Wasted Food Measurement Methodology Scoping Memo” (EPA, 2020b) describes the enhanced methodology that EPA developed between 2017 and 2019, the studies used, and how EPA planned to use the enhanced methodology to calculate its annual estimates for the “Advancing Sustainable Materials Management: Facts and Figures” report (hereafter referred to as the “Facts and Figures Report”).
EPA has collected and reported data on the generation and management of municipal solid waste (MSW) in the United States for more than 30 years. EPA publishes estimates of wasted food generation and management in the United States annually in its “Facts and Figures Report”. The 2018 “Facts and Figures Report” is the first annual report that uses the enhanced methodology to calculate wasted food estimates.2
EPA’s enhanced wasted food measurement methodology has a broader scope than the “Facts and Figures Report” methodology had in the past. On the generation side, the enhanced methodology includes the industrial sector, as well as additional commercial and institutional sectors, including office buildings, military bases, sports venues, food banks, and certain classes of retailers. On the management side, the enhanced methodology includes several additional management pathways.
EPA included the following generating sectors in the enhanced methodology:
• the industrial sector, which is comprised of the food and beverage manufacturing and processing sectors;
• the residential sector; • the commercial sector, which includes:
o food retail/wholesale sectors, including supermarkets, supercenters, and food wholesalers; o hospitality sectors, including restaurants/food services, hotels, and sports venues;
• the institutional sector, including hospitals, nursing homes, military installations, office buildings, correctional facilities, colleges and universities, and K-12 schools; and
• food banks.
EPA’s enhanced methodology aims to capture the various methods in which wasted food is managed and to align with the Food Loss and Waste Accounting and Reporting Standard (or “FLW Standard”), which is a global standard that provides requirements and guidance for quantifying and reporting on the weight of food and/or associated inedible parts removed from the food supply chain (Food Loss and Waste Protocol, 2016). EPA’s
1 The term “excess food” refers to food that is donated to feed people, while the term “food waste” refers to food such as plate waste (i.e., food that has been served but not eaten), spoiled food, or peels and rinds considered inedible that are managed in a variety of methods other than donation to feed people. The term “wasted food” is an overarching term that refers to both excess food and food waste. Section 7.1 contains a glossary of terms used throughout this report. 2 https://www.epa.gov/facts-and-figures-about-materials-waste-and-recycling/advancing-sustainable-materials-management
5
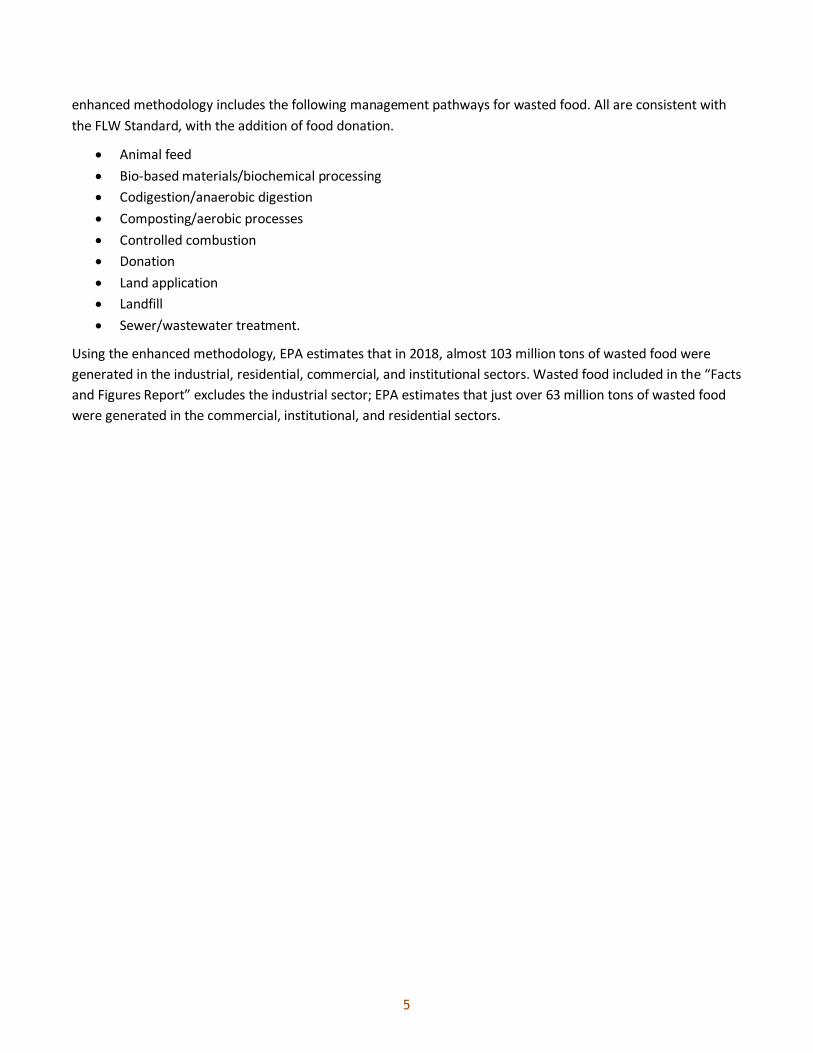
enhanced methodology includes the following management pathways for wasted food. All are consistent with the FLW Standard, with the addition of food donation.
• Animal feed • Bio-based materials/biochemical processing • Codigestion/anaerobic digestion • Composting/aerobic processes • Controlled combustion • Donation • Land application • Landfill • Sewer/wastewater treatment.
Using the enhanced methodology, EPA estimates that in 2018, almost 103 million tons of wasted food were generated in the industrial, residential, commercial, and institutional sectors. Wasted food included in the “Facts and Figures Report” excludes the industrial sector; EPA estimates that just over 63 million tons of wasted food were generated in the commercial, institutional, and residential sectors.

6
1 BAC KG ROUND
Wasted food is a growing problem in our society—but also an untapped opportunity. EPA estimates that more food reaches landfills than any other material in our municipal solid waste (MSW), making up over 24 percent of MSW sent to landfills (U.S. EPA, 2020a). Wasted food is generated from households, food manufacturers, numerous commercial establishments (e.g., restaurants), and various public institutions (e.g., schools, correctional facilities).
When food is wasted, it also wastes the resources – such as the land, water, energy and labor – that go into growing, storing, processing, distributing, and preparing that food. Through its Sustainable Management of Food efforts, EPA is identifying ways to reduce wasted food and thereby limit its negative environmental consequences. The approach takes a life-cycle perspective, targeting waste generation at all points in the food supply chain, and promoting greater efficiency and more creative and beneficial management strategies. The benefits of such an approach are wide-ranging. Environmental benefits include resource conservation and reduction of greenhouse gas emissions. Socioeconomic benefits include improved efficiency in the food supply system, resulting in better distribution to hungry people, and financial savings. To support wasted food reduction strategies, identify current practices, and identify opportunities, EPA publishes annual estimates of how much wasted food is generated and managed nationally.
EPA, with support from Industrial Economics, Incorporated (IEc), updated its wasted food measurement methodology to build on and expand prior efforts. The enhanced methodology and resulting 2016 estimates are detailed in “Wasted Food Measurement Methodology Scoping Memo” (U.S. EPA, 2020b). The enhanced methodology was developed through a comprehensive assessment of the literature supporting the measurement of wasted food generation and management, coupled with a sector-specific data collection and characterization effort. EPA used this enhanced methodology to calculate its annual published estimates of wasted food generation and management for the first time in “Advancing Sustainable Materials Management: 2018 Fact Sheet” (U.S. EPA, 2020a) (“2018 Facts and Figures Report”). The 2018 Wasted Food Report was developed to accompany the “2018 Facts and Figures Report”, and provides detailed estimates by sector and management pathway, along with other relevant information about the 2018 wasted food estimates.
2 SC OPE AND TER MINOLOGY
This report summarizes the 2018 wasted food estimates for the following sectors:
• Industrial (i.e., food and beverage manufacturing/processing) • Residential • Commercial:
o Food retail/wholesale: Supermarkets and supercenters Food wholesale
o Hospitality: Hotels Restaurants/food services (full and limited service) Sports venues

7
• Institutional: o Hospitals o Nursing homes o Military installations o Office buildings o Correctional facilities o Colleges and universities o K-12 schools
• Food banks
This report also summarizes 2018 wasted food estimates for the following management pathways3:
• Animal feed • Bio-based materials/biochemical processing • Codigestion/anaerobic digestion • Composting/aerobic processes • Controlled combustion • Donation • Land application • Landfill • Sewer/wastewater treatment
While EPA’s enhanced methodology for estimating wasted food generation and management includes the industrial sector, that sector is not included in EPA’s “Facts and Figures Report”. The “Facts and Figures Report” includes MSW from the commercial, residential and institutional sectors only. The industrial sector, i.e., industrial process waste from food manufacturers and processors, is out of scope. However, the industrial sector is an important part of the U.S. food system, so those estimates are presented in this report. As a result, this report includes two sets of wasted food estimates for 2018 – one includes estimates from the industrial sector and the other excludes estimates from the industrial sector.4 EPA’s enhanced methodology also does not include food loss from the agriculture sector. “Food loss” refers to unused product from the agricultural sector, such as unharvested crops.
EPA MSW estimates and the wasted food enhanced methodology do not distinguish between “food” and “inedible parts”.5 EPA’s goal is to make the best use of not only food that was intended for human consumption, but also the associated inedible parts. Throughout this document, EPA uses the term “food” as a shorthand to refer to both food and inedible parts. EPA uses the overarching term “wasted food” to describe food that was not used for its intended purpose and is managed in a variety of ways, such as donation to feed people, creation
3 These management pathways are consistent with the “FLW Standard” destinations (Food Loss and Waste Protocol, n.d.), with the addition of food donation. 4 For more information about EPA’s integration of EPA’s enhanced methodology into the “Facts & Figures Report”, please see Section 4 of “Wasted Food Measurement Methodology Scoping Memo” (U.S. EPA, 2020b). 5 EPA uses the definition of “food” and “inedible parts” from the FLW Standard (Food Loss and Waste Protocol, n.d.). Please see section 7.1 for a glossary of terms.

8
of animal feed, composting, anaerobic digestion, or sending to landfills or combustion facilities. Examples include unsold food from retail stores; plate waste, uneaten prepared food, or kitchen trimmings from restaurants, cafeterias, and households; or by-products from food and beverage processing facilities. The term “excess food” specifically refers to food that is donated to feed people, while the term “food waste” refers to food that is managed by a variety of methods other than donation to feed people. Examples of “food waste” include plate waste, spoiled food, or peels and rinds. When referring to both “excess food” and “food waste”, EPA uses the term “wasted food” as an overall term that includes both. Section 7.1 contains a glossary of terms used throughout this report.
3 GE NE RATION OF WASTE D FOOD
Generation estimates rely on studies conducted by state and municipal governments, industry groups, universities, and other groups that measure wasted food generated at facilities in various sectors. Estimates are correlated to facility-specific characteristics (e.g., revenue or the number of employees) to establish equations expressing generation factors (e.g., 3,000 lbs of wasted food generated/employee/year in grocery stores). There are multiple studies, and therefore multiple generation factors, available for most sectors. EPA scaled up these rates by applying national, sector-specific statistics (e.g., U.S. Census-reported store sales, number of employees in restaurants, number of patients in hospitals, number of inmates in correctional facilities), which resulted in multiple generation estimates per sector. An average annual generation estimate was then calculated for each sector, and these values were summed to calculate overall estimates of excess food and food waste generated nationally.
To calculate national wasted food generation estimates for 2018, EPA started with a literature search update. The literature search sought to determine whether any new articles or studies had been published since 2017 (the most recent year for which a comprehensive literature search was conducted) that offer updated generation factors or data on generation for 2018 estimates. EPA’s literature search considered a variety of criteria when evaluating the usefulness and reliability of different information sources. These criteria included the following:
• The depth and level of detail provided by the data sources; • The availability/accessibility of the data in terms of implicit and/or explicit acquisition costs; • The reliability of the data in terms of the quality of the methods applied; and • The scope of the data (e.g., whether the study considers wasted food generation at hospitals in one
state or hospitals nationwide).
Next, EPA used the results of the literature search to update the generation factor data. EPA closely reviewed 17 studies published since the last literature search was conducted and identified two studies with updated generation factor data. One study resulted in an update to the residential generation factor (ODEQ, 2019) and the other study resulted in an update to the K-12 schools generation factor (WWF, 2019). Table 1 lists the new generation factors for these two sectors (all other sectors retained the same generation factors as were used to calculate 2016 estimates in EPA’s “Wasted Food Measurement Methodology Scoping Memo” (EPA, 2020b)), and Table 2 summarizes the generation factors applied to each sector.

9
Table 1. Newly Added Generation Factors for 2018 Estimates
SECTOR
2016 GENERATION
FACTOR
2018 GENERATION
FACTOR UNITS Residential 340 338 Lbs/household/year K-12 Schools 22 26.3 Lbs/student/year
Table 2. Average Wasted Food Generation Factors (2018)
HIGH LEVEL SECTOR CATEGORY SECTOR
GENERATION FACTOR UNITS
Industrial N/A Manufacturing/ Processing 0.095 Lbs/sales $/year
Residential N/A Residential 338 Lbs/household/year 17 Percent food waste (of total household waste)
Commercial
Food Retail/Wholesale
Supermarkets 2.04 Tons/employee/year 0.38 Tons/employee/year
104.88 Tons/establishment/year Supercenters 10.00 lbs/thousand $ revenue/year
Food Wholesale 120.68 Tons/facility/year
0.01 Tons/thousand $ revenue/year
Hospitality
Hotels 1,137.83 Lbs/employee/year Restaurants/Food Services (full service)
3,050.67 Lbs/employee/year 39.13 Tons/facility/year 33.00 Lbs/thousand $ revenue/year
Restaurants/Food Services (limited service)
2,751.33 Lbs/employee/year 40.91 Tons/facility/year 33.00 Lbs/thousand $ revenue/year
Sports Venues 0.31 Lbs/visitor/year
Institutional N/A
Hospitals 653.14 Lbs/bed/year
0.47 Lbs/meal
Nursing Homes 657.00 Lbs/bed/year
0.55 Lbs/meal Military Installations 105.27 Lbs/person/year
Office Buildings 169.85 Lbs/employee/year
0.22 Tons/1000 sq ft/year Correctional Facilities 1.12 Lbs/inmate/day
Colleges and Universities
0.36 Lbs/student/meal 0.44 Lbs/student/meal 0.01 Tons/student/year
K-12 Schools 26.3 Lbs/student/year 0.43 Lbs/meal
N/A N/A Food Banks 327 Tons/establishment/year
After updating the generation factor data for select sectors, EPA updated the extrapolation sector-specific statistics to reflect 2018 data. Table 3 summarizes the 2018 extrapolation basis value for each generation sector and the associated data source.

10
Table 3. Extrapolation Bases for Wasted Food Generation Estimates (2018)
SECTOR GENERATION FACTOR UNITS
EXTRAPOLATION BASIS VALUE
EXTRAPOLATION BASIS UNITS SOURCE
Manufacturing/Processing Lbs/sales $/year $840,254,964,207 Sales $
United States Census Bureau. December 2017. 2016 Annual Survey of Manufactures. Available: https://www.census.gov/programs-surveys/asm.html & United States Census Bureau. November 2017. County Business Patterns. Available: https://www.census.gov/programs-surveys/cbp.html
Residential
Lbs/household/year 127,590,000 Households Statista. 2020. Number of Households in the U.S. from 1960 to 2019. Available: https://www.statista.com/statistics/183635/number-of-households-in-the-us/
Percent food waste (of total household waste) 157,895,000
Tons of total MSW
U.S. EPA. November 2019. Advancing Sustainable Materials Management: 2017 Fact Sheet. Available: https://www.epa.gov/sites/production/files/2019-11/documents/2017_facts_and_figures_fact_sheet_final.pdf
Supermarkets and Supercenters
Tons/employee/year (supermarkets) 2,959,499 Employees United States Census Bureau. November 2017. County Business Patterns.
Available: https://www.census.gov/programs-surveys/cbp.html Tons/employee/year
(supercenters) 1,792,676 Employees United States Census Bureau. November 2017. County Business Patterns. Available: https://www.census.gov/programs-surveys/cbp.html
Tons/establishment/year 115,729 Establishments United States Census Bureau. November 2017. County Business Patterns. Available: https://www.census.gov/programs-surveys/cbp.html
Lbs/thousand $ revenue/year $687,768,000,000 Revenue
United States Census Bureau. February 2020. Annual Retail Trade Survey: 2018. Available: https://www.census.gov/data/tables/2018/econ/arts/annual-report.html
Food Wholesale Tons/facility/year 35,506 Facilities United States Census Bureau. November 2017. County Business Patterns.
Available: https://www.census.gov/programs-surveys/cbp.html Tons/thousand $
revenue/year $667,008,000,000 Revenue United States Census Bureau. March 2020. Monthly Wholesale Trade. Available: https://www.census.gov/wholesale/index.html
Hotels Lbs/employee/year 2,143,717 Employees United States Census Bureau. November 2017. County Business Patterns. Available: https://www.census.gov/programs-surveys/cbp.html
Restaurants/ Food Services (full service)
Lbs/employees/year 5,760,390 Employees United States Census Bureau. March 2020. 2017 SUSB Annual Data tables by Establishment Industry. Available: https://www.census.gov/data/tables/2017/econ/susb/2017-susb-annual.html
Tons/facility/year 268,396 Facilities United States Census Bureau. March 2020. 2017 SUSB Annual Data tables by Establishment Industry. Available: https://www.census.gov/data/tables/2017/econ/susb/2017-susb-annual.html
Lbs/thousand $ revenue/year $286,311,139 Revenue
National Restaurant Association. October 2018. Restaurant Industry Outlook. Available: https://ttra.com/wp-content/uploads/2018/11/Restaurant-Industry-Outlook_2019.pdf
Restaurants/ Food Services (limited service)
Lbs/employees/year 5,190,738 Employees United States Census Bureau. March 2020. 2017 SUSB Annual Data tables by Establishment Industry. Available: https://www.census.gov/data/tables/2017/econ/susb/2017-susb-annual.html

11
SECTOR GENERATION FACTOR UNITS
EXTRAPOLATION BASIS VALUE
EXTRAPOLATION BASIS UNITS SOURCE
Tons/facility/year 321,396 Facilities United States Census Bureau. March 2020. 2017 SUSB Annual Data tables by Establishment Industry. Available: https://www.census.gov/data/tables/2017/econ/susb/2017-susb-annual.html
Lbs/thousand $ revenue/year
$284,335,402 Revenue National Restaurant Association. October 2018. Restaurant Industry Outlook. Available: https://ttra.com/wp-content/uploads/2018/11/Restaurant-Industry-Outlook_2019.pdf
Sports Venues Lbs/visitor/year 246,196,038 Visitors Annual attendance statistics from professional and college league organizations
Hospitals
Lbs/bed/year 931,203 Beds American Hospital Association. January 2019. Fast Facts for U.S. Hospitals. Available: https://www.aha.org/system/files/2019-01/2019-aha-hospital-fast-facts.pdf
Lbs/meal 1,268,975,936 Meals
U.S. Centers for Disease Control, National Center for Health Statistics. 2017. Table 89. Hospitals, beds, and occupancy rates, by type of ownership and size of hospital: United States, selected years 1975–2015. Available: https://www.cdc.gov/nchs/data/hus/2017/089.pdf
Nursing Homes
Lbs/bed/year 1,660,400 Beds National Center for Health Statistics. February 2019. Long-Term Care Providers and Services Users in the United States: 2015-2016. Available: https://www.cdc.gov/nchs/data/series/sr_03/sr03_43-508.pdf
Lbs/meal 1,475,622,000 Meals National Center for Health Statistics. February 2019. Long-Term Care Providers and Services Users in the United States: 2015-2016. Available: https://www.cdc.gov/nchs/fastats/nursing-home-care.htm
Military Installations Lbs/person/year 1,166,003 Active duty
military in U.S. DMDC. December 2018. Military and Civilian Personnel by Service/Agency by State/Country. Available: https://www.dmdc.osd.mil/appj/dwp/dwp_reports.jsp
Office Buildings Lbs/employee/year 54,845,400 Employees
U.S. Bureau of Labor Statistics. September 2019. Employment Projections - Employment by Major Industry, Table 2.1. Available: https://www.bls.gov/emp/tables/employment-by-major-industry-sector.htm
Tons/1000 sq ft/year 15,952,000 1,000 sq ft U.S. Energy Information Administration. Commercial Buildings Energy Consumption Survey. Available: https://www.eia.gov/consumption/commercial/
Correctional Facilities Lbs/inmate/day 2,162,400 Inmates U.S. Bureau of Justice Statistics. April 2018. Correctional Populations in the United States Series. Available: https://www.bjs.gov/index.cfm?ty=pbse&sid=5
Colleges and Universities
Lbs/student/meal 3,320,160,142 Students
National Center for Education Statistics. Table 303.60. Total fall enrollment in degree-granting postsecondary institutions, by level of enrollment, sex of student, level and control of institution, and attendance status of student: 2018. Available: https://nces.ed.gov/programs/digest/d19/tables/dt19_303.60.asp
Tons/student/year 19,645,918 Students
National Center for Education Statistics. Table 303.60. Total fall enrollment in degree-granting postsecondary institutions, by level of enrollment, sex of student, level and control of institution, and attendance status of student: 2018. Available: https://nces.ed.gov/programs/digest/d19/tables/dt19_303.60.asp
K-12 Schools Lbs/student/year 56,518,000 Students National Center for Education Statistics. Table 105.20. Enrollment in elementary, secondary, and degree-granting postsecondary institutions, by level and control

12
SECTOR GENERATION FACTOR UNITS
EXTRAPOLATION BASIS VALUE
EXTRAPOLATION BASIS UNITS SOURCE
of institution, enrollment level, and attendance status and sex of student: Selected years, fall 1990 through fall 2028 Available: https://nces.ed.gov/programs/digest/d18/tables/dt18_105.20.asp
Lbs/meal 9,214,581,684 Meals https://catalog.data.gov/dataset/national-school-lunch-assistance-program-participation-and-meals-served-data
Food Banks Tons/establishment/year 1,304 Establishments Hoovers. 2018. Community Food Services.

13
To arrive at generation estimates for each generation sector, EPA then multiplied generation factors by the corresponding updated extrapolation basis value and averaged annual generation for sectors with multiple generation estimates.
Table 4 summarizes annual wasted food generation estimates for each of the sectors, as well as contextual information on each sector. First, for each sector, the table identifies, where appropriate, the NAICS codes used to define the sector. Second, the table lists the number of unique empirical studies on which the generation estimate is based. Finally, the table provides estimated generation in tons per year, as well as the percent of all generation that the sector represents. Two percentage estimates are provided, one including the industrial sector and the other excluding the industrial sector.
EPA estimates that in 2018, approximately 103 million tons of wasted food were generated in the industrial, residential, commercial and institutional sectors. Excluding the industrial sector, and aligning with the scope of the “Facts & Figures Report”, approximately 63 million tons of wasted food were generated in 2018. As shown in Table 4 and Figure 1, the industrial sector accounts for more than one-third of estimated generation. Several other sectors, however, are also significant contributors to overall generation. The residential sector accounts for roughly one quarter of total generation. Restaurants/food services and supermarkets and supercenters are also major generators, followed by office buildings, food wholesale, K-12 schools, and hotels. The remaining sectors, mostly in the institutional sector, have annual generation below one million tons. These trends hold true when the industrial sector is excluded from the total but percentages change accordingly, as detailed in Table 4 and Figure 2.
Table 4. Estimated Annual Wasted Food Generation (2018)
HIGH LEVEL SECTOR CATEGORY SECTOR NAICS CODES
NUMBER OF STUDIES
INFORMING GENERATION
RATE
ESTIMATED ANNUAL
GENERATION (TONS PER
YEAR)
PERCENT OF TOTAL
(INCLUDING INDUSTRIAL
SECTOR)
PERCENT OF TOTAL
(EXCLUDING INDUSTRIAL
SECTOR) Industrial N/A Manufacturing/
Processing 311 and 3121 (excluding 311111, 311119, 312112, and 312113)
3 39,821,247 38.68% N/A
Residential N/A Residential N/A 12 24,954,863 24.24% 39.53%
Commercial
Food Retail/ Wholesale
Supermarkets and Supercenters
445110, 445120, 445210, 445220, 445230, 445291, 445292, 445299, 452311
9 8,683,093 8.43% 13.75%
Food Wholesale 424410, 424420, 424430, 424440, 424450, 424460, 424470, 424480, 424490
3 3,968,229 3.85% 6.29%
Hospitality
Hotels 7211, 713210 4 1,219,595 1.18% 1.93%
Restaurants/ Food Services (full and limited service)
722511, 722320, 722514, 722513, 722330, 722515 8 17,090,835 16.60% 27.07%

14
HIGH LEVEL SECTOR CATEGORY SECTOR NAICS CODES
NUMBER OF STUDIES
INFORMING GENERATION
RATE
ESTIMATED ANNUAL
GENERATION (TONS PER
YEAR)
PERCENT OF TOTAL
(INCLUDING INDUSTRIAL
SECTOR)
PERCENT OF TOTAL
(EXCLUDING INDUSTRIAL
SECTOR) Sports Venues N/A 3 38,154 0.04% 0.06%
Institutional N/A
Hospitals 6221 6 301,576 0.29% 0.48% Nursing Homes 6239, 6233, 6232,
62311 3 451,124 0.44% 0.71%
Military Installations
N/A 2 61,373 0.06% 0.10%
Office Buildings N/A 3 4,065,145 3.95% 6.44% Correctional Facilities
922140, 5612101 6 440,679 0.43% 0.70%
Colleges and Universities
N/A 10 613,106 0.60% 0.97%
K-12 Schools N/A 6 1,244,353 1.21% 1.97% N/A N/A Food Banks2 624210 1 426,057 N/A N/A
TOTAL GENERATION (INCLUDING INDUSTRIAL SECTOR) 102,953,370 N/A N/A TOTAL GENERATION (EXCLUDING INDUSTRIAL SECTOR) 63,132,123 N/A N/A
1 In several instances (e.g. hospitals, nursing homes, correctional facilities), the sector has a NAICS code, but the extrapolation data are not strictly delineated by NAICS code as with Census data. For instance, nursing homes are aligned with several NAICS codes, but data on nursing home populations are compiled by CDC, not by the Census Bureau. 2 Food waste from food banks is not added to total generation because it would represent “double counting,” i.e., it is already accounted for in Total Generation, because total generation includes excess food that was donated to food banks (and some food donated to food banks inevitably is wasted).
Figure 1. Percentage Distribution of Wasted Food Generation, Including the Industrial Sector (2018)
Industrial (39%)
Residential(24%)
Office Buildings(4%)
K-12 Schools(1%)
Restaurants/Food Services
(17%)
Supermarkets and Supercenters
(8%)
Food Wholesale(4%)
Other(3%)

15
Figure 2. Percentage Distribution of Wasted Food Generation, Excluding the Industrial Sector (2018)
4 MANAG E ME NT OF WASTED FOOD
The characterization of management pathways for wasted food involves two phases: (1) an initial characterization based on percentage distributions reported in the literature; and (2) a revised characterization based on detailed data for several key pathways.
EPA developed the initial management characterization for each sector as part of the generation analysis. The management pathways were selected to align with the “FLW Standard” destinations (Food Loss and Waste Protocol, n.d.), with the addition of donation of excess food to food banks. EPA includes the following management pathways (please see Section 7.1 for a glossary):
• Animal feed, • Bio-based materials/biochemical processing, • Codigestion/anaerobic digestion, • Composting/aerobic processes, • Controlled combustion, • Donation, • Land application, • Landfill, and • Sewer/wastewater treatment.
Residential(40%)
Office Buildings(6%)K-12 Schools
(2%)
Restaurants/Food Services
(27%)
Supermarkets and Supercenters
(14%)
Food Wholesale(6%)
Other(5%)

16
The initial analysis drew on sector-specific literature that provided a percentage distribution across the management pathways (i.e., an estimate of the percent of excess food or food waste destined for each major management pathway).6
• Industrial, retail/wholesale, and restaurants/food services: Annual surveys performed by Business for Social Responsibility (BSR) in 2013 and 2014 and the Food Waste Reduction Alliance (FWRA) in 2016 provided the management distribution. These three studies surveyed generators in the manufacturing/processing, retail/wholesale, and restaurants/food services sectors and provide detail on how those sectors manage their wasted food.7
• Residential: EPA developed a distribution based on a variety of studies examining composting rates in different geographic locations, as well as studies on the use of household food waste disposers (e.g., in-sink disposals). EPA then assumed that the remaining food waste is either landfilled or combusted, with the proportion based on various literature sources.
• Remaining sectors (institutional sectors, hotels, sports venues, and food banks): the initial management characterization relied on the general wasted food management distribution estimated in “Advancing Sustainable Materials Management: 2017 Fact Sheet” (EPA, 2019a).8
To develop a revised management profile, subsequent analyses incorporated more detailed data on three management pathways, leading to revised estimates of the landfill and controlled combustion pathways:
• Composting/aerobic processes: EPA developed estimates of food waste composted by summarizing state-specific data available from state environmental agency websites and published reports, and comparing reported values with EPA’s State Data Measurement Sharing Program (SMP). EPA did not extrapolate these data to account for activity in the remaining states, tribes, and territories for which data were not available. MSW compost, which is compost of the organic fraction of MSW, was also included in the total compost estimate and reflected production from all known sources based on published literature. Data compiled suggest that about 2.6 million tons of food waste were managed through composting/aerobic processes in 2018. Note that these estimates do not include food waste composted from the industrial sector. To estimate food waste composted from the industrial sector, EPA used the results of surveys conducted by BSR and the FWRA of food manufacturers around the nation as noted above.
• Codigestion/anaerobic digestion: EPA arrived at estimates for food waste codigested/anaerobically digested using EPA’s nationwide survey of anaerobic digestion facilities (U.S. EPA, 2019b). In its latest
6 For more detailed explanation on the initial management percentage methodology and distributions, please refer to “Food Waste Measurement Methodology Scoping Memo” (EPA, 2020b). 7 The annual surveys performed by FWRA reports a minimal amount of food waste managed by an “other” category, however, the surveys do not define “other”. As a result, EPA zeroed out the “other” category and redistributed the management percentage to the other management pathways. 8 In developing the initial waste management characterization, EPA refined the default distribution in two minor institutional sectors. In the case of military installations and correctional facilities, qualitative evidence suggested that internal waste management policies may result in higher rates of composting/aerobic processes and codigestion/anaerobic digestion. Military installations were assigned a composting/aerobic process rate of 25 percent and a codigestion/anaerobic digestion rate of 5 percent; correctional facilities were assigned a composting/aerobic process rate of 15 percent.

17
report, EPA conducted a nationwide survey of anaerobic digestion facilities in the U.S. in 2018, the results of which reflect 2016 data and were published in 2019. Of the 232 surveys distributed to codigestion/anaerobic digestion facilities, 134 were returned by operational facilities. Another 64 facilities are believed to be operating, for a total of 198, resulting in a survey response rate of 67 percent. Of the 134 facilities who responded to the survey, 126 facilities provided information about the amount of food waste they processed. These facilities reported a total of 10.7 million tons of food waste managed by anaerobic digestion annually in 2016 (U.S. EPA, 2019b). Because survey results were not yet available for 2018, this analysis assumes the same 10.7 million tons of food waste codigested/anaerobically digested for 2018.
• Donation: EPA’s estimation method is primarily based on a 2018 annual report from Feeding America (Feeding America, 2018), the largest domestic hunger relief organization with a nationwide network of more than 200 food banks. Feeding America secures food from corporate manufacturers, retailers, and produce suppliers nationwide; stores excess food temporarily in warehouses; and then distributes the excess food to families and individuals through food assistance agencies such as youth or senior centers, shelters, and food pantries. EPA calculated the total quantity of excess food received by Feeding America food banks (i.e., food that would have otherwise been thrown away by the establishments donating the food, but which was instead donated to Feeding America food banks), and then developed an estimate of excess food managed per Feeding America food bank. While Feeding America is the largest national network of food banks, there are hundreds more food bank establishments in the United States, so EPA multiplied excess food received per Feeding America food bank by the total number of food bank establishments nationwide to estimate total excess food managed through donation. The number of food banks in the United States is based on data available from Hoovers, a research company that provides information on companies and industries. Analysis and extrapolation of data from Feeding America suggests that approximately 7.8 million tons of excess food are managed by the donation system annually when including the industrial sector, or 5.2 million tons when excluding the industrial sector.
In order to integrate the composting/aerobic processes, codigestion/anaerobic digestion, and donation estimates into the overall analysis of management pathways and arrive at landfilling and controlled combustion figures, EPA associated the aggregate figures with specific generator sectors (i.e., determined where the food waste and excess food originated). The analysis incorporated the following assumptions:
• Composting/aerobic processes: The quantity of food waste flowing to composting is reduced when using the aggregate based on state data (3.4 million tons) in place of the initial estimate (4.8 million tons). The analysis retains the relative proportion of the generation sectors contributing to composting/aerobic processes, but transfers the net quantity (4.8 - 3.4 = 1.4 million tons) to landfilling and controlled combustion.
• Codigestion/anaerobic digestion: Relative to the initial characterization, the revised characterization significantly increases the quantity of food waste managed through codigestion/anaerobic digestion. The revised estimate of 10.7 million tons must be associated with generator sectors. EPA’s analysis assumes that the food waste originates in all generator sectors except the residential sector, and assigns the quantities to each generator sector in proportion to the sector’s contribution to the overall

18
generation profile.9 For all generator sectors other than industrial, the amount is netted out of the sector’s landfill and controlled combustion quantity. For the industrial sector, the analysis assumes that the codigestion/anaerobic digestion quantity is netted out of the two largest management pathways used by the sector (land application and animal feed), as well as from landfilling. The quantity is netted out in proportion to the original percentage distribution established for these three management pathways.
• Donation: Relative to the initial characterization, the revised characterization points to a larger quantity of excess food being recovered for donation. The newly estimated 7.8 million tons is assumed to originate from sectors identified in the original generation profile. Specifically, EPA assumes that one-third of the excess food is from restaurants/food services, one-third from industrial, and one-third from food retail/wholesale. The one-third associated with food retail/wholesale is split between the two sectors in proportion to their generation. In the food retail/wholesale and restaurants/food services sectors, the increase in excess food donation amounts are netted out of landfilling and controlled combustion. In the industrial sector, the increase is netted out of land application and animal feed.
Of the almost 103 million tons of wasted food generated in the industrial, residential, commercial and institutional sectors, EPA estimates that 35.6% is sent to landfill, 21.3% is sent to animal feed, 10.4% is managed by codigestion/anaerobic digestion, and smaller amounts are managed by other management pathways. When excluding the industrial sector, EPA estimates that 55.9% of wasted food is sent to landfill, 12.0% is managed by controlled combustion, 8.3% is managed by codigestion/anaerobic digestion, and smaller amounts are managed by other management pathways. Table 5 presents the revised profile of wasted food management, and Figures 3 and 4 depict the percentage distribution to each management pathway. It is important to note that the estimates for donation in Table 5 exclude the small share of excess food that is donated but which food banks cannot distribute (i.e., 426,057 tons) and therefore becomes food waste that is routed to other management pathways. This tonnage is included in the four management pathways (i.e., landfilling, controlled combustion, composting/aerobic processes, and codigestion/anaerobic digestion) where that food waste is sent.
9 Although respondents to EPA’s anaerobic digestion survey (U.S. EPA, 2019b) identified the generator sectors where their feedstock originates, the quantity of feedstock received was not reported. Therefore, the data cannot be used to associate codigestion/anaerobic digestion quantities with generator sectors.

19
Table 5. Quantity of Wasted Food Managed Based on Revised Management Profile (2018)
MANAGEMENT PATHWAY
QUANTITY MANAGED (TONS)
PERCENTAGE MANAGED
QUANTITY MANAGED (TONS)
PERCENTAGE MANAGED
INCLUDING INDUSTRIAL SECTOR EXCLUDING INDUSTRIAL SECTOR
Donation1 7,394,096 7.2% 4,787,378 7.6%
Animal Feed 21,978,346 21.3% 1,814,984 2.9% Bio-based Materials/Biochemical Processing
2,186,873 2.1% 1,841,411 2.9%
Codigestion/Anaerobic Digestion
10,691,756 10.4% 5,262,857 8.3%
Composting/Aerobic Processes 3,455,273 3.4% 2,592,566 4.1%
Land Application 9,144,093 8.9% 259,448 0.4%
Controlled Combustion 7,747,441 7.5% 7,552,705 12.0%
Landfill 36,612,263 35.6% 35,277,543 55.9% Sewer/Wastewater Treatment 3,743,229 3.6% 3,743,229 5.9%
TOTAL 102,953,370 100% 63,132,123 100% 1 These figures exclude the small share of excess food (426,057 tons) that food banks cannot distribute and is therefore food waste that is routed to other management pathways. The food waste fraction is managed through conventional means (landfilling, controlled combustion, composting/aerobic processes, and codigestion/anaerobic digestion).
Figure 3. Percentage Distribution of Wasted Food Management, Including the Industrial Sector (2018)
Donation(7%)
Animal Feed(21%)
Bio-based Materials/
Biochemical Processing
(2%)
Codigestion/ Anaerobic Digestion
(10%)Composting/
Aerobic Processes
(3%)
Land Application(9%)
Controlled Combustion
(8%)
Landfill(36%)
Sewer/ Wastewater Treatment
(4%)

20
Figure 4. Percentage Distribution of Wasted Food Management, Excluding the Industrial Sector (2018)
4. 1 SEC TOR- BY- SEC TOR SUMMARY
4.1.1 In dustr ial Secto r
The industrial sector, which is comprised of food and beverage manufacturers and processors, was estimated to generate 39.8 million tons of wasted food in 2018. About half (51%) of the industrial sector’s wasted food was managed by animal feed, 22% by land application, 14% by codigestion/anaerobic digestion, with smaller proportions managed by other methods. Food and beverage manufacturing/processing industries are unique from the other sectors EPA analyzed in the methods they use to manage their wasted food (i.e., a much higher percentage going to animal feed and land application, and a lower percentage going to landfill, than the commercial, institutional and residential sectors). Figure 5 depicts the proportion of the industrial sector’s wasted food managed by each pathway.
Donation (8%) Animal Feed (3%) Bio-based Materials/
Biochemical Processing (3%)
Codigestion/ Anaerobic
Digestion (8%)
Composting/ Aerobic
Processes (4%)
Land Application(0%)
Controlled Combustion
(12%)
Landfill (56%)
Sewer/ Wastewater
Treatment (6%)

21
Figure 5. Industrial Sector Wasted Food Management Profile (2018)
4 .1 .2 Res id ential Secto r
The residential sector, which includes single family and multi-family dwellings, was estimated to generate 25 million tons of wasted food. The majority (66%) of the residential sector’s wasted food was landfilled; 15% was combusted, and 15% was sent to sewer/wastewater treatment. Only 3% was composted. Figure 6 depicts the proportion of the residential sector’s wasted food managed by each pathway.
Figure 6. Residential Sector Wasted Food Management Profile (2018)
4 .1 .3 Co mmerc ial Secto r
The commercial sector includes food retail/wholesale (supermarkets, supercenters, and food wholesale) and hospitality (restaurants/food services, hotels, and sports venues). The food retail/wholesale sector was estimated to generate 12.7 million tons of wasted food (8.7 million tons from supermarkets and supercenters, and 4 million tons from food wholesale). About one third (33%) of the food retail/wholesale sector’s wasted
0 5 10 15 20 25
Sewer/Wastewater Treatment
Landfill
Controlled combustion
Land application
Composting/Aerobic Processes
Codigestion/Anaerobic Digestion
Bio-based Materials/Biochemical Processing
Animal Feed
Food Donation
Million Tons
0 5 10 15 20
Sewer/Wastewater Treatment
Landfill
Controlled combustion
Land application
Composting/Aerobic Processes
Codigestion/Anaerobic Digestion
Bio-based Materials/Biochemical Processing
Animal Feed
Food Donation
Million Tons

22
food was landfilled, about one quarter (21%) was donated, 14% was sent to animal feed, 14% was sent to codigestion/anaerobic digestion, and smaller proportions were managed by other methods. Figure 7 depicts the proportion of the food retail/wholesale sector’s wasted food managed by each pathway.
Figure 7. Retail/Wholesale Sector Wasted Food Management Profile (2018)
The hospitality sector was estimated to generate 18.3 million tons of wasted food. Restaurants/food services accounts for 17.1 million tons, or 93%, of the wasted food generated in the hospitality sector; hotels account for 1.2 million tons and sports venues account for approximately 38,000 tons. Half (52%) of the wasted food generated in the hospitality sector was landfilled, 14% was donated, 14% was sent to codigestion/anaerobic digestion, and smaller proportions were managed by other methods. Figure 8 depicts the proportion of the hospitality sector’s wasted food managed by each pathway.
0 1 2 3 4 5
Sewer/Wastewater Treatment
Landfill
Controlled combustion
Land application
Composting/Aerobic Processes
Codigestion/Anaerobic Digestion
Bio-based Materials/Biochemical…
Animal Feed
Food Donation
Million Tons
Retail

23
Figure 8. Hospitality Sector Wasted Food Management Profile (2018)
4 .1 .4 Ins t itu t ion al Secto r
The institutional sector includes hospitals, nursing homes, military institutions, office buildings, correctional facilities, colleges and universities, and K-12 schools. The institutional sector was estimated to generate 7.2 million tons of wasted food. Office buildings account for 4.1 million tons, or 57%, of the wasted food generated in the institutional sector; K-12 schools account for 1.2 million tons and all other sectors account for less than one million tons each. About two thirds (66%) of the wasted food generated in the institutional sector was landfilled, 16% was combusted, 14% was sent to codigestion/anaerobic digestion, and 5% was composted. Figure 9 depicts the proportion of the institutional sector’s wasted food managed by each pathway.
Figure 9. Institutional Sector Wasted Food Management Profile (2018)
4 .1 .5 Fo od Ban ks
0 2 4 6 8 10
Sewer/Wastewater Treatment
Landfill
Controlled combustion
Land application
Composting/Aerobic Processes
Codigestion/Anaerobic Digestion
Bio-based Materials/Biochemical…
Animal Feed
Food Donation
Million Tons
0 1 2 3 4 5
Sewer/Wastewater Treatment
Landfill
Controlled combustion
Land application
Composting/Aerobic Processes
Codigestion/Anaerobic Digestion
Bio-based Materials/Biochemical…
Animal Feed
Food Donation
Million Tons
24
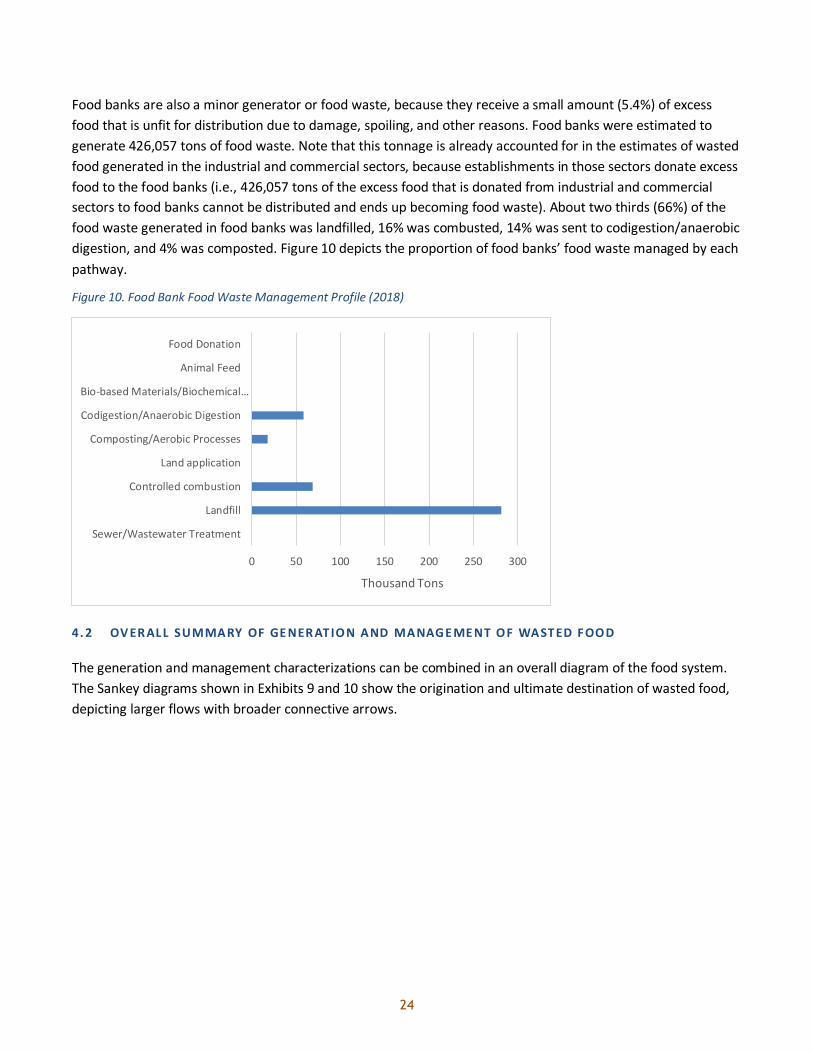
Food banks are also a minor generator or food waste, because they receive a small amount (5.4%) of excess food that is unfit for distribution due to damage, spoiling, and other reasons. Food banks were estimated to generate 426,057 tons of food waste. Note that this tonnage is already accounted for in the estimates of wasted food generated in the industrial and commercial sectors, because establishments in those sectors donate excess food to the food banks (i.e., 426,057 tons of the excess food that is donated from industrial and commercial sectors to food banks cannot be distributed and ends up becoming food waste). About two thirds (66%) of the food waste generated in food banks was landfilled, 16% was combusted, 14% was sent to codigestion/anaerobic digestion, and 4% was composted. Figure 10 depicts the proportion of food banks’ food waste managed by each pathway.
Figure 10. Food Bank Food Waste Management Profile (2018)
4. 2 OV ER ALL SUMMARY OF GE NER ATION AND MANAGE ME NT OF WASTED FOOD
The generation and management characterizations can be combined in an overall diagram of the food system. The Sankey diagrams shown in Exhibits 9 and 10 show the origination and ultimate destination of wasted food, depicting larger flows with broader connective arrows.
0 50 100 150 200 250 300
Sewer/Wastewater Treatment
Landfill
Controlled combustion
Land application
Composting/Aerobic Processes
Codigestion/Anaerobic Digestion
Bio-based Materials/Biochemical…
Animal Feed
Food Donation
Thousand Tons

25
Figure 11. Summary of Wasted Food Generation and Management Flows (2018) (Including Industrial Sector)
Figure 12. Summary of Wasted Food Generation and Management Flows (2018) (Excluding Industrial Sector)
26
5 C AV EATS AND UNCE RTAINTIES
There are caveats and uncertainties associated with the estimates provided in this report, which include the following:10
• EPA sought to incorporate original, empirical studies of generation factors. In several sectors, however, the research highlights a shortage of literature providing such generation factors. Instead, many generation studies rely upon a relatively small set of widely-cited empirical studies. Relative to their role in overall generation, key sectors with a lack of empirical data include industrial, supercenters (distinct from supermarkets), food wholesalers, and office buildings.
• In recent years, states and municipalities have introduced rules banning landfilling of organics (including food) or mandating that organic wastes be recycled. These laws have been enacted in California, Connecticut, Massachusetts, Rhode Island, and Vermont, and the cities of Austin, Boulder, Minneapolis, New York City, San Francisco, and Seattle. Many of the generation studies applied in the methodology precede some of these bans. Therefore, to the extent that bans encourage source reduction on the part of generators, the methodology may overstate current generation, and may become increasingly biased over time.
• EPA’s methodology is limited to sectors for which original generation rate studies exist, and those sectors likely account for the majority of wasted food in the U.S. However, it is possible that non-negligible quantities of wasted food originate in sectors not addressed, including theme parks, fairs, and exposition centers.
• Composting/aerobic processes and codigestion/anaerobic digestion represent growing alternatives to conventional food waste disposal in landfills and combustion facilities. Although new survey data allow improved characterization of composting/aerobic processes and codigestion/anaerobic digestion quantities, uncertainties remain. EPA did not extrapolate to account for states that do not publicly provide food waste composting estimates, nor do the estimates account for backyard and community composting, so the national composting estimate is likely an underestimate. Codigestion/anaerobic digestion quantities may also be understated given that only 134 of the 198 codigestion/anaerobic digestion facilities nationwide responded to EPA’s survey (U.S. EPA, 2019b), and EPA did not extrapolate to account for the additional facilities. Also, uncertainties exist in the exact sector distribution from generation amounts to codigestion/anaerobic digestion. This is due to the fact that there is not quantitative information in EPA’s survey on specific feedstock sources.
• There is some uncertainty in the specific amounts of excess food flowing from individual generation sectors to food banks. As discussed above, this analysis assumes one third of the excess food managed by food banks originates in each of the following sectors: industrial, food retail/wholesale, and restaurants/food services sectors.
10 For detailed caveats and limitations associated with each sector, please refer to “Wasted Food Measurement Methodology Scoping Memo” (EPA, 2020b).

27
• The amount of food waste being sent to sewer/wastewater treatment facilities remains poorly characterized. Few studies provide information on the prevalence of in-sink disposals in households and restaurants, or on in-sink disposal usage behavior. In addition, biosolids generated at treatment plants are often subsequently managed through land application or codigestion/anaerobic digestion, suggesting that the sewer/wastewater treatment plants may be best viewed as temporary collection points rather than a true management destination for food waste. Given the lack of specific data on the routing of food waste from the sewer/wastewater pathway to other management sectors, EPA did not revise the amount of food waste initially estimated to go to sewer/wastewater treatment facilities.
6 R EFERE NC ES
Business for Social Responsibility. (2013). Analysis of U.S. Food Waste Among Food Manufacturers, Retailers, and Wholesalers. http://www.kbcsandbox3.com/fw/wp-content/uploads/2013/06/FWRA_BSR_Tier2_FINAL.pdf
Business for Social Responsibility. (2014). Analysis of U.S. Food Waste Among Food Manufacturers, Retailers, and Restaurants. http://www.foodwastealliance.org/wp-content/uploads/2014/11/FWRA_BSR_Tier3_FINAL.pdf
Feeding America. (2018). 2018 Feeding America Annual Report: Solving Hunger Today, Ending Hunger Tomorrow. https://www.feedingamerica.org/sites/default/files/2018-12/2018%20Feeding%20America%20Annual%20Report_0.pdf
Food Loss and Waste Protocol. (2016). Food Loss and Waste Accounting and Reporting Standard. https://flwprotocol.org/wp-content/uploads/2017/05/FLW_Standard_final_2016.pdf
Food Loss and Waste Protocol. (n.d.). Terms & Definitions. https://flwprotocol.org/flw-standard/tools-resources/terms-definitions/
Food Waste Reduction Alliance. (2016). Analysis of U.S. Food Waste Among Food Manufacturers, Retailers, and Restaurants. http://www.foodwastealliance.org/wp-content/uploads/2013/05/FWRA-Food-Waste-Survey-2016-Report_Final.pdf
Oregon Department of Environmental Quality. (2019). Wasted Food Measurement Study – Oregon Households. https://www.oregon.gov/deq/mm/food/Pages/Wasted-Food-Study.aspx
U.S. Environmental Protection Agency. (2019a). Advancing Sustainable Materials Management: 2017 Fact Sheet. https://www.epa.gov/sites/production/files/2019-11/documents/2017_facts_and_figures_fact_sheet_final.pdf
U.S. Environmental Protection Agency. (2019b). Anaerobic Digestion Facilities Processing Food Waste in the United States (2016). https://www.epa.gov/sites/production/files/2019-09/documents/ad_data_report_v10_-_508_comp_v1.pdf
U.S. Environmental Protection Agency. (2020a). Advancing Sustainable Materials Management: 2018 Fact Sheet. https://www.epa.gov/facts-and-figures-about-materials-waste-and-recycling/advancing-sustainable-materials-management

28
U.S. Environmental Protection Agency. (2020b). Wasted Food Measurement Methodology Scoping Memo. https://www.epa.gov/sites/production/files/2020-06/documents/food_measurement_methodology_scoping_memo-6-18-20.pdf
World Wildlife Fund. (2019). Food Waste Warriors - A Deep Dive into Food Waste in U.S. Schools. https://c402277.ssl.cf1.rackcdn.com/publications/1271/files/original/FoodWasteWarriorR_CS_121819.pdf?1576689275

29
7 APPE ND IX
7. 1 GLOSSARY
Animal Feed: Diverting material from the food supply chain (directly or after processing) to animals (excludes crops intentionally grown for bioenergy, animal feed, seed, or industrial use). (Food Loss and Waste Protocol, n.d.)
Bio-based Materials / Biochemical Processing: Converting material into industrial products. Examples include creating fibers for packaging material, creating bioplastics (e.g., polylactic acid), making “traditional” materials such as leather or feathers (e.g., for pillows), and rendering fat, oil, or grease into a raw material to make products such as soaps, biodiesel, or cosmetics. “Biochemical processing” does not refer to anaerobic digestion or production of bioethanol through fermentation. (Food Loss and Waste Protocol, n.d.)
Codigestion/anaerobic digestion: Breaking down material via bacteria in the absence of oxygen. This process generates biogas and nutrient-rich matter. Codigestion refers to the simultaneous anaerobic digestion of food loss and waste and other organic material in one digester. This destination includes fermentation (converting carbohydrates—such as glucose, fructose, and sucrose—via microbes into alcohols in the absence of oxygen to create products such as biofuels). (Food Loss and Waste Protocol, n.d.) Often referred to as “anaerobic digestion” or “AD”.
Composting/aerobic processes: Breaking down material via bacteria in oxygen-rich environments. Composting refers to the production of organic material (via aerobic processes) that can be used as a soil amendment. (Food Loss and Waste Protocol, n.d.) Often referred to as simply “composting”.
Controlled combustion: Sending material to a facility that is specifically designed for combustion in a controlled manner, which may include some form of energy recovery (this may also be referred to as incineration). (Food Loss and Waste Protocol, n.d.)
Excess food: food that is donated to feed people.
Food: Any substance—whether processed, semi-processed, or raw—that is intended for human consumption. “Food” includes drink, and any substance that has been used in the manufacture, preparation, or treatment of food. “Food” also includes material that has spoiled and is therefore no longer fit for human consumption. It does not include cosmetics, tobacco, or substances used only as drugs. It does not include processing agents used along the food supply chain, for example, water to clean or cook raw materials in factories or at home. (Food Loss and Waste Protocol, n.d.). Throughout this document, EPA uses the term “food” as a shorthand to refer to both “food” and “inedible parts”.
Food donation: collection and redistribution of unspoiled excess food to feed people through food pantries, food banks and other food rescue programs.
Food loss: unused product from the agricultural sector, such as unharvested crops.
Food waste: food such as plate waste (i.e., food that has been served but not eaten), spoiled food, or peels and rinds considered inedible.
30
Inedible parts: Components associated with a food that, in a particular food supply chain, are not intended to be consumed by humans. Examples of inedible parts associated with food could include bones, rinds, and pits/stones. “Inedible parts” do not include packaging. What is considered inedible varies among users (e.g., chicken feet are consumed in some food supply chains but not others), changes over time, and is influenced by a range of variables including culture, socio-economic factors, availability, price, technological advances, international trade, and geography. (Food Loss and Waste Protocol, n.d.)
Land Application: Spreading, spraying, injecting, or incorporating organic material onto or below the surface of the land to enhance soil quality. (Food Loss and Waste Protocol, n.d.)
Landfill: Sending material to an area of land or an excavated site that is specifically designed and built to receive wastes. (Food Loss and Waste Protocol, n.d.)
Sewer/wastewater treatment: Sending material down the sewer (with or without prior treatment), including that which may go to a facility designed to treat wastewater. (Food Loss and Waste Protocol, n.d.)
Wasted food: food that was not used for its intended purpose and is managed in a variety of ways, such as donation to feed people, creation of animal feed, composting, anaerobic digestion, or sending to landfills or combustion facilities. Examples include unsold food from retail stores; plate waste, uneaten prepared food, or kitchen trimmings from restaurants, cafeterias, and households; or by-products from food and beverage processing facilities.

31
7. 2 SEC TOR- SPEC IF IC RE FE RE NC ES
The following is a list of references used for each sector. For more information on generation factors and studies used to estimate generation, please refer to “Wasted Food Measurement Methodology” (U.S. EPA, 2020b), Section 6.2.
7 .2.1 In dustr ial Secto r
Title Author or Agency Publication Year Weblink
Identifying, Quantifying, and Mapping Food Residuals from Connecticut Business and Institutions
Connecticut DEP (Draper/Lennon Inc. and Atlantic Geoscience Corp.)
Connecticut DEP 2001 https://portal.ct.gov/-/media/DEEP/compost/ssomfile/ssomreportpdf.pdf?la=en
Analysis of U.S. Food Waste Among Food Manufacturers, Retailers, and Restaurants
Food Waste Reduction Alliance (BSR) BSR 2014 http://www.foodwastealliance.org/wp-
content/uploads/2014/11/FWRA_BSR_Tier3_FINAL.pdf Identification, characterization, and mapping of food waste and food waste generators in Massachusetts
Massachusetts DEP (Draper/Lennon Inc.)
Massachusetts DEP
2002 https://www.mass.gov/doc/study-identification-characterization-mapping-of-food-waste-generators-in-massachusetts-2002/download
2014 Generator-Based Characterization of Commercial Sector Disposal and Diversion in California
CalRecycle (Cascadia Consulting Group) CalRecycle 2015 https://www2.calrecycle.ca.gov/Publications/Details/154
3
Analysis of U.S. Food Waste Among Food Manufacturers, Retailers, and Wholesalers
BSR BSR 2013 http://www.kbcsandbox3.com/fw/wp-content/uploads/2013/06/FWRA_BSR_Tier2_FINAL.pdf
2014 ICI Waste Characterization Program Tetra Tech for Metro Vancouver Metro Vancouver 2015
http://www.metrovancouver.org/services/solid-waste/SolidWastePublications/FinalReport-2014ICIWasteCharacterizationProgram3-Jun-15.pdf
Analysis of U.S. Food Waste Among Food Manufacturers, Retailers, and Restaurants (2016)
Food Waste Reduction Alliance
Food Waste Reduction Alliance
2016 http://www.foodwastealliance.org/wp-content/uploads/2013/05/FWRA-Food-Waste-Survey-2016-Report_Final.pdf
7.2.2 Res id ential Secto r
Title Author or Agency Publication Year Weblink
State of Vermont Waste Composition Study
Vermont DEC (DSM Environmental Services, MidAtlantic Solid Waste Consultants)
Vermont DEC 2013 https://dec.vermont.gov/sites/dec/files/wmp/SolidWaste/Documents/finalreportvermontwastecomposition13may2013.pdf
King County Solid Waste Division: Organics Study
King County Department of Natural Resources and Parks (Cascadia Consulting Group)
King County Department of Natural
2009 https://kingcounty.gov/~/media/depts/dnrp/solid-waste/garbage-recycling/documents/Organics-Study-2009-final-report.ashx?la=en

32
Title Author or Agency Publication Year Weblink Resources and Parks
Best Management Practices in Food Scraps Program
U.S. EPA Region 5 (Juri Freeman and Lisa Skumatz, Econservation Institute)
U.S. EPA Region 5 2011
http://www.foodscrapsrecovery.com/EPA_FoodWasteReport_EI_Region5_v11_Final.pdf
2011 Iowa Statewide Waste Characterization Study
Iowa Department of Natural Resources (MSW Consultants)
Iowa Department of Natural Resources
2011 www.iowadnr.gov/Portals/idnr/uploads/waste/wastecharacterization2011.pdf
Montgomery County Waste Composition Study: Summary of Results
Montgomery County Division of Solid Waste Services (Prepared by SCS Engineers)
Montgomery County Division of Solid Waste Services
2013 https://www.montgomerycountymd.gov/sws/resources/files/studies/waste-composition-study-130726.pdf
City of San Diego Waste Characterization Study 2012-2013
City of San Diego (Cascadia Consulting Group)
City of San Diego 2014 https://www.sandiego.gov/sites/default/files/legacy/environmental-services/pdf/recycling/CompMultiFam.pdf
2014 Residential Waste Stream Composition Study: Final Report
Seattle Public Utilities (prepared by Cascadia Consulting Group)
Seattle Public Utilities 2014
http://www.seattle.gov/util/cs/groups/public/@spu/@garbage/documents/webcontent/1_043661.pdf
2014 Generator-Based Characterization of Commercial Sector Disposal and Diversion in California
CalRecycle (Cascadia Consulting Group)
CalRecycle 2015 https://www2.calrecycle.ca.gov/Publications/Details/1543
Source separated residential composting in the U.S. Yepsen, R., Goldstein, N. BioCycle 2007
https://www.biocycle.net/2007/12/19/source-separated-residential-composting-in-the-u-s/
Residential food waste collection in the U.S. Yepsen, R. BioCycle 2013 https://www.biocycle.net/2013/03/19/residential-food-waste-collection-in-the-u-s-biocycle-nationwide-survey/
Potentials for food waste minimization and effects on potential biogas production through anaerobic digestion
Schott, A. B. S., Vukicevic, S., Bohn, I., & Andersson, T.
Waste Management & Research
2013 https://www.ncbi.nlm.nih.gov/pubmed/23681829
Total and per capita value of food loss in the United States Buzby, J.C., Hyman, J. Food Policy 2012
http://www.sciencedirect.com/science/article/pii/S0306919212000693
Assessing U.S. food wastage and opportunities for reduction
Dou, Z., Ferguson, J.D., Galligan, D.T., Kelly, A.M., Finn, S.M., Giegengack, R.
Global Food Security 2016 https://www.sciencedirect.com/science/article/pii/S2211
912415300195
BioCycle nationwide survey: Residential food waste collection in the U.S.
Yepsen, R. BioCycle 2012 https://www.biocycle.net/2012/01/12/residential-food-waste-collection-in-the-u-s/
Food waste collection innovations Goldstein, N. BioCycle 2014 https://www.biocycle.net/2014/07/15/food-waste-collection-innovations/
Getting the public tuned in to food waste reduction Johnston, M. BioCycle 2013
https://www.biocycle.net/2013/11/18/getting-the-public-tuned-in-to-food-waste-reduction/
Residential food waste collection in the U.S. Yepsen, R. BioCycle 2015 https://www.biocycle.net/2015/01/15/residential-food-waste-collection-in-the-u-s-2/
33
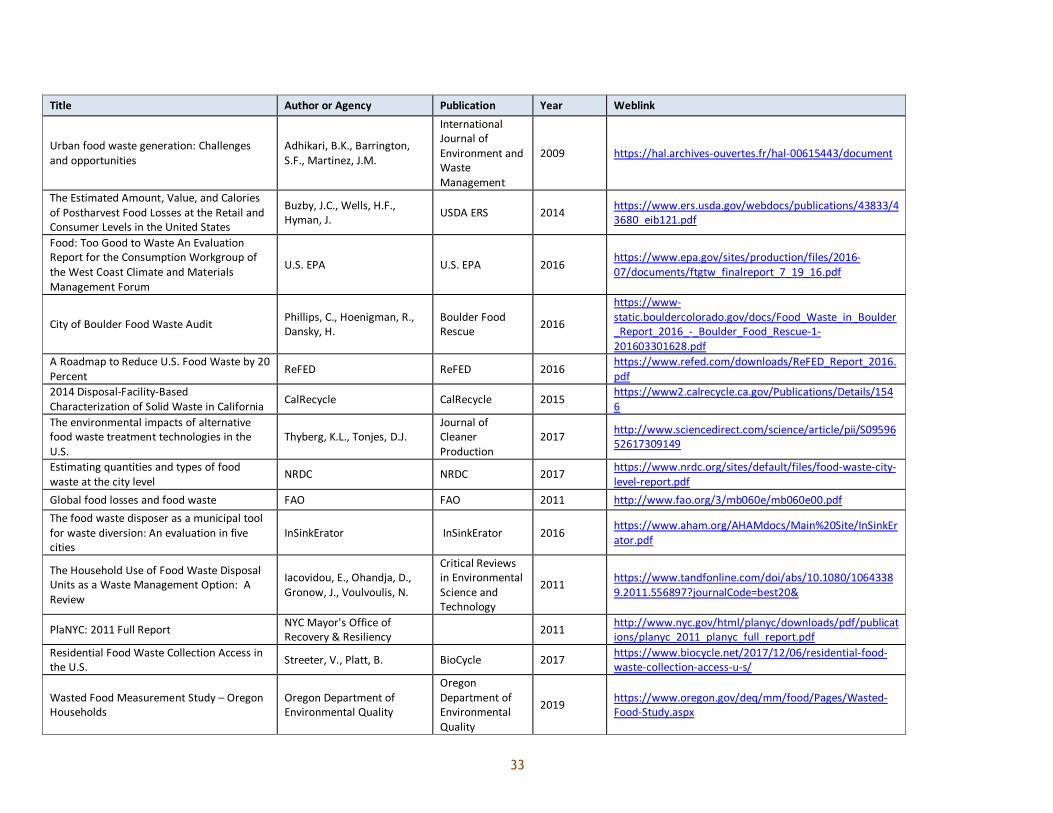
Title Author or Agency Publication Year Weblink
Urban food waste generation: Challenges and opportunities
Adhikari, B.K., Barrington, S.F., Martinez, J.M.
International Journal of Environment and Waste Management
2009 https://hal.archives-ouvertes.fr/hal-00615443/document
The Estimated Amount, Value, and Calories of Postharvest Food Losses at the Retail and Consumer Levels in the United States
Buzby, J.C., Wells, H.F., Hyman, J. USDA ERS 2014 https://www.ers.usda.gov/webdocs/publications/43833/4
3680_eib121.pdf
Food: Too Good to Waste An Evaluation Report for the Consumption Workgroup of the West Coast Climate and Materials Management Forum
U.S. EPA U.S. EPA 2016 https://www.epa.gov/sites/production/files/2016-07/documents/ftgtw_finalreport_7_19_16.pdf
City of Boulder Food Waste Audit Phillips, C., Hoenigman, R., Dansky, H.
Boulder Food Rescue 2016
https://www-static.bouldercolorado.gov/docs/Food_Waste_in_Boulder_Report_2016_-_Boulder_Food_Rescue-1-201603301628.pdf
A Roadmap to Reduce U.S. Food Waste by 20 Percent ReFED ReFED 2016
https://www.refed.com/downloads/ReFED_Report_2016.pdf
2014 Disposal-Facility-Based Characterization of Solid Waste in California CalRecycle CalRecycle 2015
https://www2.calrecycle.ca.gov/Publications/Details/1546
The environmental impacts of alternative food waste treatment technologies in the U.S.
Thyberg, K.L., Tonjes, D.J. Journal of Cleaner Production
2017 http://www.sciencedirect.com/science/article/pii/S0959652617309149
Estimating quantities and types of food waste at the city level
NRDC NRDC 2017 https://www.nrdc.org/sites/default/files/food-waste-city-level-report.pdf
Global food losses and food waste FAO FAO 2011 http://www.fao.org/3/mb060e/mb060e00.pdf The food waste disposer as a municipal tool for waste diversion: An evaluation in five cities
InSinkErator InSinkErator 2016 https://www.aham.org/AHAMdocs/Main%20Site/InSinkErator.pdf
The Household Use of Food Waste Disposal Units as a Waste Management Option: A Review
Iacovidou, E., Ohandja, D., Gronow, J., Voulvoulis, N.
Critical Reviews in Environmental Science and Technology
2011 https://www.tandfonline.com/doi/abs/10.1080/10643389.2011.556897?journalCode=best20&
PlaNYC: 2011 Full Report NYC Mayor's Office of Recovery & Resiliency 2011 http://www.nyc.gov/html/planyc/downloads/pdf/publicat
ions/planyc_2011_planyc_full_report.pdf Residential Food Waste Collection Access in the U.S. Streeter, V., Platt, B. BioCycle 2017 https://www.biocycle.net/2017/12/06/residential-food-
waste-collection-access-u-s/
Wasted Food Measurement Study – Oregon Households
Oregon Department of Environmental Quality
Oregon Department of Environmental Quality
2019 https://www.oregon.gov/deq/mm/food/Pages/Wasted-Food-Study.aspx

34
7 .2 .3 Fo od Retai l/Who lesale Secto r
Title Author or Agency Publication Year Weblink Identifying, Quantifying, and Mapping Food Residuals from Connecticut Business and Institutions
Connecticut DEP (Draper/Lennon Inc. and Atlantic Geoscience Corp.)
Connecticut DEP 2001 https://portal.ct.gov/-/media/DEEP/compost/ssomfile/ssomreportpdf.pdf?la=en
Analysis of U.S. Food Waste Among Food Manufacturers, Retailers, and Restaurants
Food Waste Reduction Alliance (BSR)
BSR 2014 http://www.foodwastealliance.org/wp-content/uploads/2014/11/FWRA_BSR_Tier3_FINAL.pdf
Targeted statewide waste characterization study: Waste disposal and diversion findings for selected industry groups
California EPA (Cascadia Consulting Group) CalRecycle 2006 https://www2.calrecycle.ca.gov/Publications/Details/118
4
Mecklenburg County Food Waste Diversion Study
Mecklenburg County Solid Waste (Kessler Consulting, Inc.)
Mecklenburg County Solid Waste
2012 http://www.waste.ccacoalition.org/file/1780/download?token=aRA8psh0
2014 Generator-Based Characterization of Commercial Sector Disposal and Diversion in California
CalRecycle (Cascadia Consulting Group) CalRecycle 2015 https://www2.calrecycle.ca.gov/Publications/Details/154
3
Characterization of food waste generators: A Hawaii case study
Okazaki, W.K., Turn, S.Q., Flachsbart, P.G.
Waste Management
2008 https://pubmed.ncbi.nlm.nih.gov/18375111/
North Carolina 2012 Food Waste Generation Study
North Carolina Department of Environment and Natural Resources
NC Department of Environment and Natural Resources
2012 https://files.nc.gov/ncdeq/North%20Carolina%202012%20Food%20Waste%20Generation%20Study.pdf
A Roadmap to Reduce U.S. Food Waste by 20 Percent ReFED ReFED 2016
https://www.refed.com/downloads/ReFED_Report_2016.pdf
Summary Analysis of Massachusetts Commercial/Institutional Food Waste Generation Data
EPA Region 1 U.S. EPA Region 1 2011 https://www.mass.gov/doc/summary-analysis-massachusetts-commercialinstitutional-food-waste-generation-data-2011/download
Estimating quantities and types of food waste at the city level
NRDC NRDC 2017 https://www.nrdc.org/sites/default/files/food-waste-city-level-report.pdf
Analysis of U.S. Food Waste Among Food Manufacturers, Retailers, and Wholesalers BSR BSR 2013
http://www.kbcsandbox3.com/fw/wp-content/uploads/2013/06/FWRA_BSR_Tier2_FINAL.pdf
Analysis of U.S. Food Waste Among Food Manufacturers, Retailers, and Restaurants (2016)
Food Waste Reduction Alliance
Food Waste Reduction Alliance
2016 http://www.foodwastealliance.org/wp-content/uploads/2013/05/FWRA-Food-Waste-Survey-2016-Report_Final.pdf

35
7.2.4 Ho sp ital i ty Secto r
Sector Title Author or Agency Publication Year Weblink
Restaurants/ Food services
Analysis of U.S. Food Waste Among Food Manufacturers, Retailers, and Restaurants
Food Waste Reduction Alliance (BSR)
BSR 2014 http://www.foodwastealliance.org/wp-content/uploads/2014/11/FWRA_BSR_Tier3_FINAL.pdf
Targeted statewide waste characterization study: Waste disposal and diversion findings for selected industry groups
California EPA (Cascadia Consulting Group)
CalRecycle 2006 https://www2.calrecycle.ca.gov/Publications/Details/1184
Identification, characterization, and mapping of food waste and food waste generators in Massachusetts
Massachusetts DEP (Draper/Lennon Inc.)
Massachusetts DEP 2002
https://www.mass.gov/doc/study-identification-characterization-mapping-of-food-waste-generators-in-massachusetts-2002/download
2014 Generator-Based Characterization of Commercial Sector Disposal and Diversion in California
CalRecycle (Cascadia Consulting Group)
CalRecycle 2015 https://www2.calrecycle.ca.gov/Publications/Details/1543
Characterization of food waste generators: A Hawaii case study
Okazaki, W.K., Turn, S.Q., Flachsbart, P.G.
Waste Management 2008 https://pubmed.ncbi.nlm.nih.gov/18375111/
North Carolina 2012 Food Waste Generation Study
North Carolina Department of Environment and Natural Resources
North Carolina Department of Environment and Natural Resources
2012 https://files.nc.gov/ncdeq/North%20Carolina%202012%20Food%20Waste%20Generation%20Study.pdf
Summary Analysis of Massachusetts Commercial/Institutional Food Waste Generation Data
EPA Region 1 U.S. EPA Region 1 2011
https://www.mass.gov/doc/summary-analysis-massachusetts-commercialinstitutional-food-waste-generation-data-2011/download
Feasibility Study on Food Waste Generated in Columbia, South Carolina Battelle 2015
Hotels
Targeted statewide waste characterization study: Waste disposal and diversion findings for selected industry groups
California EPA (Cascadia Consulting Group)
CalRecycle 2006 https://www2.calrecycle.ca.gov/Publications/Details/1184
2014 Generator-Based Characterization of Commercial Sector Disposal and Diversion in California
CalRecycle (Cascadia Consulting Group) CalRecycle 2015 https://www2.calrecycle.ca.gov/Publications/Details/1543
Characterization of food waste generators: A Hawaii case study
Okazaki, W.K., Turn, S.Q., Flachsbart, P.G.
Waste Management
2008 https://pubmed.ncbi.nlm.nih.gov/18375111/
2014 ICI Waste Characterization Program Tetra Tech for Metro Vancouver
Metro Vancouver 2015
http://www.metrovancouver.org/services/solid-waste/SolidWastePublications/FinalReport-2014ICIWasteCharacterizationProgram3-Jun-15.pdf

36
Sector Title Author or Agency Publication Year Weblink
Sports venues
Targeted statewide waste characterization study: Waste disposal and diversion findings for selected industry groups
California EPA (Cascadia Consulting Group)
CalRecycle 2006 https://www2.calrecycle.ca.gov/Publications/Details/1184
2014 Generator-Based Characterization of Commercial Sector Disposal and Diversion in California
CalRecycle (Cascadia Consulting Group) CalRecycle 2015 https://www2.calrecycle.ca.gov/Publications/Details/1543
Achieving sustainability beyond zero waste: A case study from a college football stadium
Costello, C., McGarvey, R.G., Birisci, E.
Sustainability 2017 https://www.mdpi.com/2071-1050/9/7/1236
7.2.5 Ins t itu t ion al Secto r
Sector Title Author or Agency Publication Year Weblink
Hospitals
Identifying, Quantifying, and Mapping Food Residuals from Connecticut Business and Institutions
Connecticut DEP (Draper/Lennon Inc. and Atlantic Geoscience Corp.)
Connecticut DEP 2001 https://portal.ct.gov/-
/media/DEEP/compost/ssomfile/ssomreportpdf.pdf?la=en
Collection of Recyclables from Multifamily Housing and Business
Walsh, P. Pferdehirt, W., & O’Leary, P. Waste Age 1993 https://p2infohouse.org/ref/08/07954.pdf
Identification, characterization, and mapping of food waste and food waste generators in Massachusetts
Massachusetts DEP (Draper/Lennon Inc.)
Massachusetts DEP 2002
https://www.mass.gov/doc/study-identification-characterization-mapping-of-food-waste-generators-in-massachusetts-2002/download
2014 Generator-Based Characterization of Commercial Sector Disposal and Diversion in California
CalRecycle (Cascadia Consulting Group) CalRecycle 2015 https://www2.calrecycle.ca.gov/Publications/Details/1543
Practical Plan For Hospital Food Waste Recovery
Chardoul, N., Coddington, B. BioCycle 2012 https://www.biocycle.net/practical-plan-for-hospital-food-
waste-recovery/
North Carolina 2012 Food Waste Generation Study
North Carolina Department of Environment and Natural Resources
North Carolina Department of Environment and Natural Resources
2012 https://files.nc.gov/ncdeq/North%20Carolina%202012%20Food%20Waste%20Generation%20Study.pdf
Food Scrap Generator Database Calculations Vermont Agency of Natural Resources
Vermont Agency of Natural Resources
2018 http://dec.vermont.gov/sites/dec/files/wmp/SolidWaste/Documents/Universal-Recycling/FoodScrapVolume_Estimator.pdf
Comparing Food Provided and Wasted before and after Implementing Measures against Food Waste in Three Healthcare Food Service Facilities
Strotmann, C., Friedrich, S., Kreyenschmidt, J., Teitscheid, P., Ritter, G.
Sustainability 2017 www.mdpi.com/2071-1050/9/8/1409/pdf

37
Sector Title Author or Agency Publication Year Weblink
Nursing Homes
Identification, characterization, and mapping of food waste and food waste generators in Massachusetts
Massachusetts DEP (Draper/Lennon Inc.)
Massachusetts DEP 2002
https://www.mass.gov/doc/study-identification-characterization-mapping-of-food-waste-generators-in-massachusetts-2002/download
Comparing Food Provided and Wasted before and after Implementing Measures against Food Waste in Three Healthcare Food Service Facilities
Strotmann, C., Friedrich, S., Kreyenschmidt, J., Teitscheid, P., Ritter, G.
Sustainability 2017 www.mdpi.com/2071-1050/9/8/1409/pdf
Comparison of waste composition in a continuing-care retirement community
Kim, T., Shanklin, C. W., Su, A. Y., Hackes, B. L., & Ferris, D.
1997 https://pubmed.ncbi.nlm.nih.gov/9120193/
Military Installations
Feasibility Study on Food Waste Generated in Columbia, South Carolina Battelle 2015
Integrating food waste diversion into food systems planning: A case study of the Mississippi Gulf Coast
Evans-Cowley, J.S., Arroyo-Rodríguez, A. 2013 https://www.foodsystemsjournal.org/index.php/fsj/article/vie
w/179
Office Buildings
Targeted statewide waste characterization study: Waste disposal and diversion findings for selected industry groups
California EPA (Cascadia Consulting Group)
CalRecycle 2006 https://www2.calrecycle.ca.gov/Publications/Details/1184
2014 Generator-Based Characterization of Commercial Sector Disposal and Diversion in California
CalRecycle (Cascadia Consulting Group)
CalRecycle 2015 https://www2.calrecycle.ca.gov/Publications/Details/1543
2014 ICI Waste Characterization Program Tetra Tech for Metro Vancouver
Metro Vancouver 2015
http://www.metrovancouver.org/services/solid-waste/SolidWastePublications/FinalReport-2014ICIWasteCharacterizationProgram3-Jun-15.pdf
Correctional facilities
Identifying, Quantifying, and Mapping Food Residuals from Connecticut Business and Institutions
CT DEP (Draper/Lennon Inc. and Atlantic Geoscience Corp.)
Connecticut DEP 2001 https://portal.ct.gov/-
/media/DEEP/compost/ssomfile/ssomreportpdf.pdf?la=en
New York State Department of Correctional Services (DOCS) U.S. EPA U.S. EPA 1998 https://nepis.epa.gov/Exe/ZyPURL.cgi?Dockey=P1004U0A.TXT
Waste Reduction and Recycling Guide for Florida Correctional Facilities
FL DEP (Kessler Consulting Inc.) Florida DEP 2004
http://www.businessperformance.org/sites/default/files/finalprisonguide-72ppi.pdf
Composting 12,000 tons of food residuals per year Marion, J. BioCycle 2000
Food Waste at Correctional Facilities CalRecycle CalRecycle 2018 https://www.calrecycle.ca.gov/StateAgency/AgencyType/Correctional
Correctional Facility Composting In Washington State Mendrey, K. BioCycle 2013 https://www.biocycle.net/correctional-facility-composting-in-
washington-state/ Food Scraps to Orchard Amendment at Philadelphia Prison Goldstein, N. BioCycle 2015 https://www.biocycle.net/2015/09/17/food-scraps-to-orchard-
amendment-at-philadelphia-prison-complex/
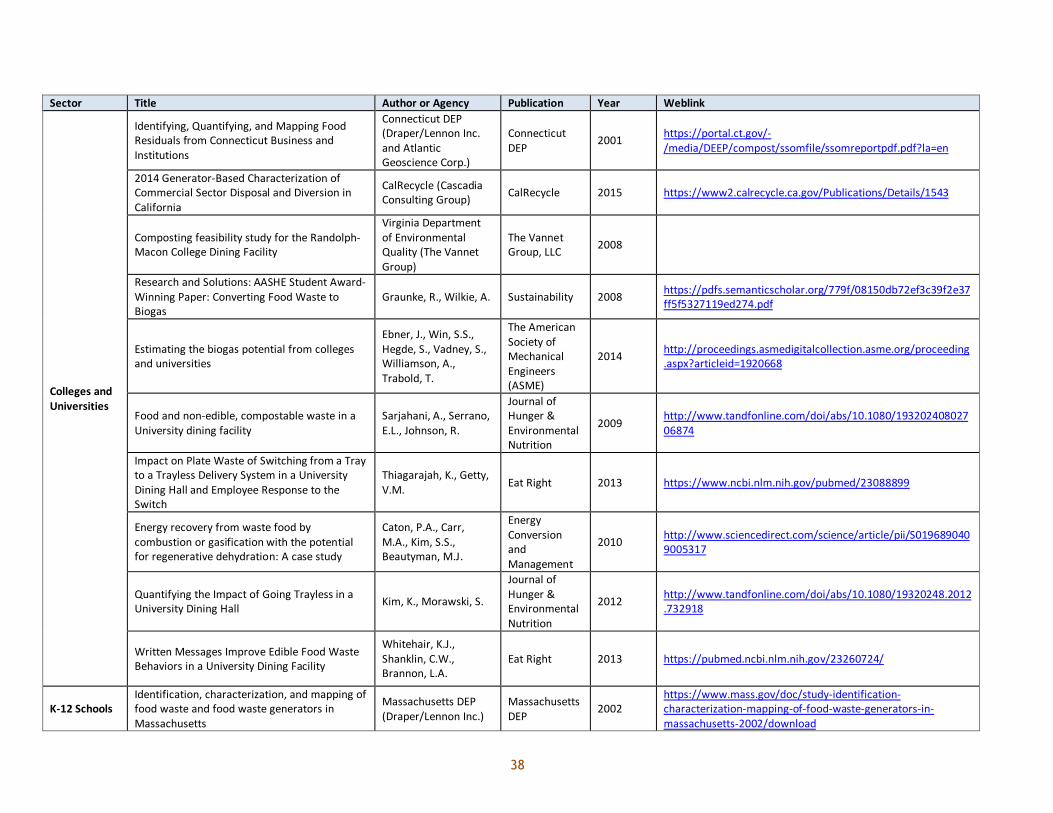
38
Sector Title Author or Agency Publication Year Weblink
Colleges and Universities
Identifying, Quantifying, and Mapping Food Residuals from Connecticut Business and Institutions
Connecticut DEP (Draper/Lennon Inc. and Atlantic Geoscience Corp.)
Connecticut DEP
2001 https://portal.ct.gov/-/media/DEEP/compost/ssomfile/ssomreportpdf.pdf?la=en
2014 Generator-Based Characterization of Commercial Sector Disposal and Diversion in California
CalRecycle (Cascadia Consulting Group) CalRecycle 2015 https://www2.calrecycle.ca.gov/Publications/Details/1543
Composting feasibility study for the Randolph-Macon College Dining Facility
Virginia Department of Environmental Quality (The Vannet Group)
The Vannet Group, LLC 2008
Research and Solutions: AASHE Student Award-Winning Paper: Converting Food Waste to Biogas
Graunke, R., Wilkie, A. Sustainability 2008 https://pdfs.semanticscholar.org/779f/08150db72ef3c39f2e37ff5f5327119ed274.pdf
Estimating the biogas potential from colleges and universities
Ebner, J., Win, S.S., Hegde, S., Vadney, S., Williamson, A., Trabold, T.
The American Society of Mechanical Engineers (ASME)
2014 http://proceedings.asmedigitalcollection.asme.org/proceeding.aspx?articleid=1920668
Food and non-edible, compostable waste in a University dining facility
Sarjahani, A., Serrano, E.L., Johnson, R.
Journal of Hunger & Environmental Nutrition
2009 http://www.tandfonline.com/doi/abs/10.1080/19320240802706874
Impact on Plate Waste of Switching from a Tray to a Trayless Delivery System in a University Dining Hall and Employee Response to the Switch
Thiagarajah, K., Getty, V.M. Eat Right 2013 https://www.ncbi.nlm.nih.gov/pubmed/23088899
Energy recovery from waste food by combustion or gasification with the potential for regenerative dehydration: A case study
Caton, P.A., Carr, M.A., Kim, S.S., Beautyman, M.J.
Energy Conversion and Management
2010 http://www.sciencedirect.com/science/article/pii/S0196890409005317
Quantifying the Impact of Going Trayless in a University Dining Hall Kim, K., Morawski, S.
Journal of Hunger & Environmental Nutrition
2012 http://www.tandfonline.com/doi/abs/10.1080/19320248.2012.732918
Written Messages Improve Edible Food Waste Behaviors in a University Dining Facility
Whitehair, K.J., Shanklin, C.W., Brannon, L.A.
Eat Right 2013 https://pubmed.ncbi.nlm.nih.gov/23260724/
K-12 Schools Identification, characterization, and mapping of food waste and food waste generators in Massachusetts
Massachusetts DEP (Draper/Lennon Inc.)
Massachusetts DEP
2002 https://www.mass.gov/doc/study-identification-characterization-mapping-of-food-waste-generators-in-massachusetts-2002/download

39
Sector Title Author or Agency Publication Year Weblink 2014 Generator-Based Characterization of Commercial Sector Disposal and Diversion in California
CalRecycle (Cascadia Consulting Group) CalRecycle 2015 https://www2.calrecycle.ca.gov/Publications/Details/1543
Food Waste Auditing at Three Florida Schools Wilkie, A., Graunke, R., & Cornejo, C.
Sustainability 2015 http://www.mdpi.com/2071-1050/7/2/1370
Food Waste Estimation Guide Recycling Works Massachusetts
Recycling Works Massachusetts
2013 https://recyclingworksma.com/food-waste-estimation-guide/
Food Waste in a School Nutrition Program After Implementation of New Lunch Program Guidelines
Byker, C., Farris, A.R., Marcenelle, M., Davis, G.C., & Serrano, E.L.
Journal of Nutrition Education and Behavior
2014 https://pubmed.ncbi.nlm.nih.gov/24857599/
Identifying, Quantifying, and Mapping Food Residuals from Connecticut Business and Institutions
Connecticut DEP (Draper/Lennon Inc. and Atlantic Geoscience Corp.)
Connecticut DEP 2001 https://portal.ct.gov/-
/media/DEEP/compost/ssomfile/ssomreportpdf.pdf?la=en
Estimating quantities and types of food waste at the city level
NRDC NRDC 2017 https://www.nrdc.org/sites/default/files/food-waste-city-level-report.pdf
Food Waste Warriors- A Deep Dive into Food Waste in US Schools WWF WWF 2019
https://c402277.ssl.cf1.rackcdn.com/publications/1271/files/original/FoodWasteWarriorR_CS_121819.pdf?1576689275

40
7. 3 D ETAILED G E NE RATION AND MANAGE ME NT EST IMATES OF WASTED FOOD
Table 7 contains estimates of the amount of food waste and excess food generated by each sector, and the amount managed by each management pathway, per sector.
Table 6. Generation and Management Estimates of Wasted Food by Sector (2018)
EXCESS FOOD AND FOOD WASTE MANAGED BY SECTOR (TONS)
MAN
AGEM
ENT
PATH
WAY
MAN
UFA
CTU
RIN
G/
PRO
CESS
ING
RESI
DEN
TIAL
RETA
IL
WH
OLE
SALE
HO
TELS
REST
AURA
NTS
/ FO
OD
SER
VICE
S
SPO
RTS
VEN
UES
HO
SPIT
ALS
NU
RSIN
G H
OM
ES
MIL
ITAR
Y IN
STAL
LATI
ON
S
OFF
ICE
BUIL
DIN
GS
CORR
ECTI
ON
AL F
ACIL
ITIE
S
COLL
EGES
& U
NIV
ERSI
TIES
K-12
SCH
OO
LS
FOO
D B
ANKS
INTE
RMED
IATE
AM
OU
NT
MAN
AGED
1
TOTA
L M
ANAG
ED B
Y EA
CH P
ATH
WAY
2
Food Donation 2,606,718 - 1,789,091 817,626 - 2,606,718 - - - - - - - - - 7,820,153 1 7,394,096
Animal Feed 20,163,362 - 1,243,572 568,321 - 3,091 - - - - - - - - - 21,978,346 21,978,346
Codigestion/ Anaerobic Digestion
5,428,899 - 1,183,781 540,996 166,269 2,330,023 5,202 41,114 61,502 8,367 554,208 60,079 83,586 169,645 58,085 10,633,6711 10,691,7562
Composting/ Aerobic Processes
862,707 830,469 797,591 364,504 56,079 194,219 1,754 13,867 20,744 2,822 186,923 20,263 28,192 57,218 17,919 3,437,353 1 3,455,273 2
Bio-based Materials/
Biochemical Processing
345,461 - 382,054 174,601 - 1,284,757 - - - - - - - - - 2,186,873 2,186,873
Land Application 8,884,645 - 178,070 81,379 - - - - - - - - - - - 9,144,093 9,144,093
Sewer/ Wastewater Treatment
- 3,743,229 - - - - - - - - - - - - - 3,743,229 3,743,229

41
EXCESS FOOD AND FOOD WASTE MANAGED BY SECTOR (TONS)
MAN
AGEM
ENT
PATH
WAY
MAN
UFA
CTU
RIN
G/
PRO
CESS
ING
RESI
DEN
TIAL
RETA
IL
WH
OLE
SALE
HO
TELS
REST
AURA
NTS
/ FO
OD
SER
VICE
S
SPO
RTS
VEN
UES
HO
SPIT
ALS
NU
RSIN
G H
OM
ES
MIL
ITAR
Y IN
STAL
LATI
ON
S
OFF
ICE
BUIL
DIN
GS
CORR
ECTI
ON
AL F
ACIL
ITIE
S
COLL
EGES
& U
NIV
ERSI
TIES
K-12
SCH
OO
LS
FOO
D B
ANKS
INTE
RMED
IATE
AM
OU
NT
MAN
AGED
1
TOTA
L M
ANAG
ED B
Y EA
CH P
ATH
WAY
2
Landfill 1,334,720 16,585,172 2,858,671 1,306,431 803,725 8,687,030 25,144 198,742 297,295 40,445 2,678,972 290,412 404,043 820,041 281,420 36,330,843 1 36,612,263 2
Controlled Combustion
194,736 3,795,992 250,263 114,372 193,520 1,984,997 6,054 47,853 71,583 9,738 645,041 69,925 97,285 197,449 68,632 7,678,809 1 7,747,441 2
Total Food Waste & Excess Food
39,821,247 24,954,863 8,683,093 3,968,229 1,219,595 17,090,835 38,154 301,576 451,124 61,373 4,065,145 440,679 613,106 1,244,353 426,057 102,953,370 102,953,370
Percent of Total 38.68% 24.24% 8.43% 3.85% 1.18% 16.60% 0.04% 0.29% 0.44% 0.06% 3.95% 0.43% 0.60% 1.21% n/a
Note:
1 Although an estimated 7,820,153 tons of excess food are donated to food banks, food banks are not able to distribute all the food that is donated to them due to spoilage, expiration, or other reasons. Therefore, approximately 426,057 tons of the 7,820,153 tons ends up being managed as food waste via codigestion/anaerobic digestion, composting/aerobic processes, landfill, and controlled combustion. In the Intermediate Amount Managed column, the estimates of food waste do not yet distribute the 426,057 tons to those four pathways.
2 Although an estimated 7,820,153 tons of excess food are donated to food banks, food banks are not able to distribute all the food that is donated to them due to spoilage, expiration, or other reasons. Therefore, approximately 426,057 tons of the 7,820,153 tons ends up being managed as food waste via codigestion/anaerobic digestion, composting/aerobic processes, landfill, and controlled combustion. In the Total Managed by Each Pathway column, the estimates of food waste generated by food banks are included in the management pathway estimates for those four pathways.