2018 Nevada National Security Site Environmental Report.pdf
264
SM National Nuclear Security Administration
-
Upload
khangminh22 -
Category
Documents
-
view
6 -
download
0
Transcript of 2018 Nevada National Security Site Environmental Report.pdf
SM
National Nuclear Security Administration

ii Nevada National Security Site Environmental Report 2018
THIS PAGE INTENTIONALLY LEFT BLANK
Acknowledgements
Nevada National Security Site Environmental Report 2018 iii
Acknowledgements
The Environmental, Safety and Health (ES&H) group of Mission Support and Test Services, LLC (MSTS), is responsible for producing this document for the U.S. Department of Energy, National Nuclear Security Administration Nevada Field Office (NNSA/NFO). Each year, the production of the annual Nevada National Security Site Environmental Report (NNSSER) requires the knowledge, skill, experience, and cooperation of many people and organizations.
Contributing Subject Matter Experts
More than 30 individuals are subject matter experts from across multiple organizations and authored, co-authored, or contributed information to the chapters within this NNSSER. They are thanked and acknowledged for their support, and are identified at the beginning of each chapter.
Contributing Organizations
MSTS
Multiple departments and groups within MSTS provided subject matter experts across multiple departments to contribute text and data on the annual activities related to onsite radiological and non-radiological monitoring of air, water, and biota; radiological dose assessments; waste management; hazardous materials management; ecological monitoring; site sustainability; and occurrence reporting. MSTS subject matter experts also provided the descriptions of the hydrology, geology, ecology, and cultural resources of the NNSS, which are included in Attachment A: Site Description on the compact disc of this report.
Navarro Research and Engineering, Inc. (Navarro)
Navarro provided data and discussion in Chapters 5 and 11 regarding their design, sampling, and analysis results associated with the NNSS Integrated Groundwater Sampling Plan, which addresses the legacy contamination of historical nuclear underground test areas (UGTAs). In Chapter 11, Navarro provided summary information of their characterization and remediation work towards state-approved closure of UGTA, Industrial, and Soils corrective action sites, and post-closure monitoring of Soil corrective action sites. In Chapter 14, Navarro provided data quality assurance information related to collected and analyzed UGTA groundwater samples. In Chapter 10, Navarro provided a description of their activities to verify that a designated percentage of mixed waste and classified hazardous materials and waste are appropriately packaged for receipt at the NNSS.
Desert Research Institute (DRI)
The Division of Hydrologic Sciences of DRI authored Chapters 7 and 15, reporting on their offsite radiological monitoring of air and groundwater within communities surrounding the NNSS, and on their data quality assurance program. The Division of Hydrologic Sciences reported in Chapter 11 on their newly initiated post-closure monitoring of the Frenchman Flat UGTA corrective action unit. Also in Chapter 11, the DRI divisions of Hydrologic Sciences and Atmospheric Sciences reported on their soil and meteorological monitoring at two NNSS Soils corrective action units. The Division of Earth and Ecosystem Sciences of DRI authored Chapter 12,
summarizing their annual activities managing cultural resources on the NNSS. Harold Drollinger of the Division of Earth and Ecosystem Sciences provided the synoptic description of the prehistory and history of the NNSS, which is included in Attachment A: Site Description on the compact disc of this report.
Nye County
Nye County provided the discussion in Chapter 7 of their sampling of wells under the Nye County Tritium Sampling and Monitoring Program.
Acknowledgements
iv Nevada National Security Site Environmental Report 2018
National Oceanic and Atmospheric Administration Air Resources Laboratory, Special Operations and
Research Division (ARL/SORD)
ARL/SORD provided summary descriptions of the NNSS climate that are included in Attachment A: Site Description on the compact disc of this report.
U.S. Geological Survey (USGS)
The USGS provided discussion and data in Chapter 5 regarding their monitoring of NNSS groundwater levels and usage.
EnviroStat
Charles Davis of EnviroStat provided the statistical analyses, interpretation, and graphical presentations of the environmental radiological monitoring data collected by ES&H.
ES&H Support Staff
The following individuals within MSTS ES&H are responsible for the numerous tasks that are integral to the collection, quality assurance, and quality control of much of the environmental data provided in this NNSSER.
Elizabeth Burns was responsible for radiological monitoring data verification, validation, and review; quality
assurance oversight; administration of the data management system; and she assisted with field sampling.
Martin D. Cavanaugh, Xianan Liu, and Matthew O. Weaver conducted field sampling and supported work
requested from other agencies/departments.
Catherine D. Castaneda was responsible for sample management supporting the sub-contracting of environmental analytical services.
Lynn N. Jaussi managed laboratory operations for sample screening and processing.
Theodore J. Redding provided oversight for radiological monitoring data verification, validation, and review; quality assurance; and sample management.
MSTS Report Production and Distribution Support Personnel
The following individuals were responsible for improving the quality, appearance, and timely production and distribution of this NNSSER.
Ashley Burns and Chad Ricks worked with all the authors to produce the high-quality GIS-generated maps and figures (provided in map projection: Universal Transverse Mercator (Zone 11, meters) North American Datum 1983).
Thomas Breene provided a thorough review of this document to ensure spelling, format, grammar, references,
tables, figures, acronyms, table of contents, etc., were all in order.
Katina Loo designed the NNSSER cover, CD label, and the layout of the NNSSER Summary.
Pablo Mendez, Jeff Li, and Mark Shaw produced high-quality hard copies and compact discs of the NNSSER
and the NNSSER Summary under a tight production schedule.
Margaret Townsend conducted the necessary classification review of this document, and in the process, made
numerous improvements to its clarity, readability, and accuracy.
Table of Contents
Nevada National Security Site Environmental Report 2018 v
Table of Contents
Acknowledgements............................................................................................................................................. iii List of Figures ................................................................................................................................................... xii List of Tables .................................................................................................................................................... xiv
Chapter 1: Introduction and Helpful Information .................................................................................................. 1
1.1 Site Location .............................................................................................................................. 1
1.2 Environmental Setting ................................................................................................................ 1
1.3 Site History ................................................................................................................................ 1
1.4 Site Mission................................................................................................................................ 4
1.5 Primary Facilities and Activities ................................................................................................. 5
1.6 Scope of this Environmental Report ............................................................................................ 5
1.7 Populations Near the NNSS ........................................................................................................ 7
1.8 Understanding Data in this Report .............................................................................................. 7 1.8.1 Scientific Notation ........................................................................................................ 7 1.8.2 Unit Prefixes................................................................................................................. 7 1.8.3 Units of Radioactivity ................................................................................................... 8 1.8.4 Radiological Dose Units ............................................................................................... 8 1.8.5 International System of Units for Radioactivity and Dose.............................................. 8 1.8.6 Radionuclide Nomenclature .......................................................................................... 9 1.8.7 Units of Measurement ................................................................................................... 9 1.8.8 Measurement Variability............................................................................................... 9 1.8.9 Mean and Standard Deviation ..................................................................................... 10 1.8.10 Standard Error of the Mean ......................................................................................... 10 1.8.11 Median, Maximum, and Minimum Values .................................................................. 10 1.8.12 Less Than (<) Symbol................................................................................................. 11 1.8.13 Negative Radionuclide Concentrations ........................................................................ 11
1.9 References ................................................................................................................................ 11
Chapter 2: Compliance Summary....................................................................................................................... 13
2.1 Compliance with Requirements ................................................................................................ 14
2.2 Environmental Permits ............................................................................................................. 23
2.3 National Environmental Policy Act Assessments ...................................................................... 25
2.4 Hazardous Materials Control and Management ......................................................................... 26 2.4.1 Hazardous Substance Inventory .................................................................................. 26 2.4.2 Polychlorinated Biphenyls .......................................................................................... 26 2.4.3 Pesticides.................................................................................................................... 26 2.4.4 Release and Inventory Reporting ................................................................................ 27
2.4.4.1 The Emergency Planning and Community Right-to-Know Act .................... 27 2.4.4.2 Nevada Chemical Catastrophe Prevention Act ........................................... 28 2.4.4.3 Continuous Releases .................................................................................. 28
2.5 Environmental Occurrences ...................................................................................................... 29
2.6 Environmental Reports Submitted to Regulators ....................................................................... 29
2.7 References ................................................................................................................................ 31
Table of Contents
vi Nevada National Security Site Environmental Report 2018
Chapter 3: Environmental Management System ................................................................................................. 33
3.1 Environmental Policy ............................................................................................................... 33
3.2 Legal and Other Requirements .................................................................................................. 33
3.3 Environmental Management System Programs ......................................................................... 34 3.3.1 Sustainability Program ................................................................................................ 34 3.3.2 Pollution Prevention and Waste Minimization (P2/WM) ............................................. 37
3.4 EMS Competence, Training, and Awareness ............................................................................. 38
3.5 Audits and Operational Assessments ......................................................................................... 38
3.6 EMS Effectiveness and Reporting ............................................................................................. 38
3.7 Awards, Recognition, and Outreach .......................................................................................... 38
3.8 References ................................................................................................................................ 39
Chapter 4: Air Monitoring.................................................................................................................................. 41
4.1 Radiological Air Monitoring and Assessment ........................................................................... 41 4.1.1 Monitoring System Design ......................................................................................... 43 4.1.2 Air Particulate and Tritium Sampling Methods ........................................................... 45 4.1.3 Presentation of Air Sampling Data .............................................................................. 45 4.1.4 Air Sampling Results .................................................................................................. 46
4.1.4.1 Gross Alpha and Gross Beta ...................................................................... 46 4.1.4.2 Americium-241 ......................................................................................... 47 4.1.4.3 Cesium-137 ............................................................................................... 48 4.1.4.4 Cobalt-60 .................................................................................................. 50 4.1.4.5 Plutonium Isotopes .................................................................................... 50 4.1.4.6 Uranium Isotopes ...................................................................................... 53 4.1.4.7 Tritium ...................................................................................................... 53
4.1.5 Emission Evaluations for Planned Projects .................................................................. 56 4.1.6 Unplanned Releases .................................................................................................... 56 4.1.7 Estimate of Total NNSS Radiological Atmospheric Releases ...................................... 56 4.1.8 Radiological Emissions Compliance ........................................................................... 58
4.2 Nonradiological Air Quality Monitoring and Assessment .......................................................... 60 4.2.1 Permitted NNSS Facilities .......................................................................................... 60 4.2.2 Permit Maintenance Activities .................................................................................... 60 4.2.3 Emissions of Criteria Air Pollutants and Hazardous Air Pollutants .............................. 61 4.2.4 Performance Emission Testing and State Inspection .................................................... 62 4.2.5 Opacity Readings........................................................................................................ 63 4.2.6 Chemical Releases and Detonations Reporting ............................................................ 63 4.2.7 Ozone-Depleting Substances Recordkeeping............................................................... 63 4.2.8 Asbestos Abatement ................................................................................................... 63 4.2.9 Fugitive Dust Control ................................................................................................. 64 4.2.10 Environmental Impact of Nonradiological Emissions .................................................. 64
4.3 References ................................................................................................................................ 64
Chapter 5: Water Monitoring.............................................................................................................................. 65
5.1 Radiological Monitoring ........................................................................................................... 65 5.1.1 NNSA/NFO and EM Nevada Program Groundwater Sampling Design ....................... 66
5.1.1.1 Analytes .................................................................................................... 67 5.1.1.2 Sample Collection Methods ....................................................................... 69 5.1.1.3 Detection Limits ........................................................................................ 70
5.1.2 Presentation of Water Sampling Data .......................................................................... 70
Table of Contents
Nevada National Security Site Environmental Report 2018 vii
5.1.3 Discussion of 2018 Sample Results ............................................................................. 75 5.1.3.1 Characterization Wells .............................................................................. 75 5.1.3.2 Source/Plume Wells .................................................................................. 76 5.1.3.3 Early Detection Wells ................................................................................ 77 5.1.3.4 Distal Wells............................................................................................... 78 5.1.3.5 Community Wells/Springs ......................................................................... 78 5.1.3.6 NNSS Public Water System Wells ............................................................. 79 5.1.3.7 Compliance Wells/Groundwater Discharges .............................................. 79 5.1.3.8 Underground Test Area Inactive Wells/Sampling Locations ...................... 80
5.2 Nonradiological Drinking Water and Wastewater Monitoring ................................................... 81 5.2.1 Drinking Water Monitoring ........................................................................................ 81
5.2.1.1 2018 Results of Public Water System and Water-Hauling Truck Monitoring ................................................................................................ 83
5.2.1.2 State Inspections........................................................................................ 83 5.2.2 Domestic Wastewater Monitoring ............................................................................... 85 5.2.3 Industrial Wastewater Monitoring ............................................................................... 85
5.2.3.1 Quarterly and Annual Influent Monitoring ................................................. 85 5.2.3.2 Sewage System Inspections ....................................................................... 86
5.2.4 E Tunnel Waste Water Disposal System Monitoring .................................................... 86
5.3 Water Level and Usage Monitoring........................................................................................... 88
5.4 Water Monitoring Conclusions ................................................................................................. 89
5.5 References ................................................................................................................................ 90
Chapter 6: Direct Radiation Monitoring ............................................................................................................. 93
6.1 Measurement of Direct Radiation.............................................................................................. 93
6.2 Thermoluminescent Dosimetry Surveillance Network Design ................................................... 94 6.2.1 Data Quality ............................................................................................................... 96 6.2.2 Data Reporting ........................................................................................................... 96
6.3 Results...................................................................................................................................... 96 6.3.1 Background Exposure ................................................................................................. 96 6.3.2 Potential Exposure to the Public along the NNSS Boundary .......................................100 6.3.3 Exposures from NNSS Operational Activities ............................................................101 6.3.4 Exposures from Radioactive Waste Management Sites...............................................101 6.3.5 Exposures to NNSS Plants and Animals.....................................................................103 6.3.6 Exposure Patterns in the Environment over Time .......................................................103
6.4 Environmental Impact..............................................................................................................104
6.5 References ...............................................................................................................................104
Chapter 7: Community-Based Offsite Monitoring .............................................................................................105
7.1 CEMP Air Monitoring .............................................................................................................106 7.1.1 Air Monitoring Equipment .........................................................................................106 7.1.2 Air Sampling Methods ...............................................................................................108 7.1.3 Air Sampling Results .................................................................................................108
7.1.3.1 Gross Alpha and Gross Beta .....................................................................108 7.1.3.2 Gamma Spectroscopy ...............................................................................111
7.1.4 Thermoluminescent Dosimetry Results ......................................................................111 7.1.5 Pressurized Ion Chamber Results ...............................................................................112 7.1.6 Environmental Impact................................................................................................113

Table of Contents
viii Nevada National Security Site Environmental Report 2018
7.2 CEMP Groundwater Monitoring ..............................................................................................114 7.2.1 Sample Locations and Methods..................................................................................114 7.2.2 Results of Groundwater Monitoring ...........................................................................115
7.3 Nye County Tritium Sampling and Monitoring Program ..........................................................117
7.4 References ...............................................................................................................................120
Chapter 8: Radiological Biota Monitoring .........................................................................................................121
8.1 Species Selection .....................................................................................................................121
8.2 Site Selection ...........................................................................................................................122
8.3 2018 Sampling and Analysis ....................................................................................................124 8.3.1 Plants ........................................................................................................................125 8.3.2 Animals .....................................................................................................................126
8.4 Data Assessment......................................................................................................................127
8.5 References ...............................................................................................................................127
Chapter 9: Radiological Dose Assessment .........................................................................................................129
9.1 Dose to the Public ....................................................................................................................129 9.1.1 Dose from Possible Exposure Pathways .....................................................................129
9.1.1.1 Dose from NNSS Air Emissions ...............................................................130 9.1.1.2 Dose from Ingestion of Game Animals from the NNSS ............................131 9.1.1.3 Dose from Ingestion of Plants from the NNSS ..........................................132 9.1.1.4 Dose from Drinking Contaminated Groundwater ......................................133 9.1.1.5 Dose from Direct Radiation Exposure along NNSS Borders .....................133
9.1.2 Dose from Waste Operations .....................................................................................133 9.1.3 Total Offsite Dose to the Public from All Pathways ...................................................133 9.1.4 Collective Population Dose ........................................................................................135 9.1.5 Release of Property Containing Residual Radioactive Material ..................................135
9.2 Dose to Aquatic and Terrestrial Biota ......................................................................................136 9.2.1 2018 Site-Specific Biota Dose Assessment ................................................................136
9.3 Dose Assessment Summary .....................................................................................................137
9.4 References ...............................................................................................................................137
Chapter 10: Waste Management ........................................................................................................................139
10.1 Radioactive Waste Management ..............................................................................................139 10.1.1 Area 5 Radioactive Waste Management Site ..............................................................139 10.1.2 Waste Examination Facility .......................................................................................142 10.1.3 Area 3 Radioactive Waste Management Site ..............................................................143
10.2 Waste Characterization ............................................................................................................144 10.2.1 Mixed Waste and Classified Non-Radioactive Hazardous Matter Verification ............144
10.3 Annual Performance Assessments and Composite Analyses .....................................................144 10.3.1 Groundwater Protection Assessment ..........................................................................145 10.3.2 Vadose Zone Assessment...........................................................................................146
10.4 Assessment of Radiological Dose to the Public ........................................................................146 10.4.1 Dose from Air and Direct Radiation ...........................................................................146 10.4.2 Dose from Groundwater ............................................................................................147
10.5 Hazardous Waste Management ................................................................................................147 10.5.1 Hazardous Waste Activities .......................................................................................148
Table of Contents
Nevada National Security Site Environmental Report 2018 ix
10.6 Underground Storage Tank (UST) Management ......................................................................148
10.7 Solid and Sanitary Waste Management ....................................................................................149
10.8 References ...............................................................................................................................149
Chapter 11: Environmental Corrective Actions ..................................................................................................151
11.1 Underground Test Area Sites ...................................................................................................151 11.1.1 Underground Test Area Corrective Action Unit Corrective Action Activities .............155
11.1.1.1 Frenchman Flat Corrective Action Unit 98................................................155 11.1.1.2 Central and Western Pahute Mesa Corrective Action Units 101
and 102 ....................................................................................................155 11.1.1.3 Rainier Mesa/Shoshone Mountain Corrective Action Unit 99 ...................156 11.1.1.4 Yucca Flat/Climax Mine Corrective Action Unit 97 ..................................157
11.1.2 Post-Closure Monitoring of Frenchman Flat...............................................................157 11.1.3 Quality Assurance .....................................................................................................158 11.1.4 Other Activities and Studies .......................................................................................159 11.1.5 Underground Test Area Publications ..........................................................................161
11.2 Industrial Sites .........................................................................................................................162
11.3 Soils ........................................................................................................................................163 11.3.1 Monitoring Activities at Soils Corrective Action Units ...............................................163
11.4 Post-Closure Monitoring and Inspections .................................................................................165
11.5 Corrective Actions Progress under the Federal Facility Agreement and Consent Order .............166
11.6 Environmental Management Nevada Program Public Outreach ................................................167
11.7 References ...............................................................................................................................168
Chapter 12: Historic Preservation and Cultural Resources Management ............................................................173
12.1 Cultural Resources Inventories and NRHP Eligibility Evaluations ...........................................173
12.2 Mercury Modernization ...........................................................................................................176
12.3 Other Cultural Resources Projects ............................................................................................178
12.4 Curation ..................................................................................................................................179
12.5 American Indian Consultation Program ...................................................................................179
12.6 References ...............................................................................................................................182
Chapter 13: Ecological Monitoring ...................................................................................................................185
13.1 Desert Tortoise Compliance Program .......................................................................................185 13.1.1 Desert Tortoise Surveys and Compliance ...................................................................187 13.1.2 Desert Tortoise Conservation Projects........................................................................188
13.2 Biological Surveys at Proposed Project Sites............................................................................188
13.3 Important Species and Ecosystem Monitoring ..........................................................................188
13.4 Habitat Restoration Program ....................................................................................................190 13.4.1 CAU 110, U-3ax/bl, Closure Cover............................................................................191 13.4.2 CAU 111, 92-Acre Site, Closure Covers ....................................................................192 13.4.3 Double Tracks ...........................................................................................................192 13.4.4 Clean Slate I, II, and III .............................................................................................192
13.5 Wildland Fire Hazard Assessment............................................................................................192
13.6 References ...............................................................................................................................193
Table of Contents
x Nevada National Security Site Environmental Report 2018
Chapter 14: Quality Assurance Program ............................................................................................................195
14.1 Sampling and Analysis Plan .....................................................................................................196 14.1.1 Precision....................................................................................................................196 14.1.2 Accuracy ...................................................................................................................196 14.1.3 Representativeness.....................................................................................................196 14.1.4 Comparability ............................................................................................................197
14.2 Environmental Sampling..........................................................................................................197 14.2.1 Training and Qualification .........................................................................................197 14.2.2 Procedures and Methods ............................................................................................197 14.2.3 Field Documentation .................................................................................................197 14.2.4 Inspection and Acceptance Testing ............................................................................197
14.3 Laboratory Analyses ................................................................................................................198 14.3.1 Procurement ..............................................................................................................198 14.3.2 Initial and Continuing Assessment .............................................................................198 14.3.3 Data Evaluation .........................................................................................................199
14.4 Data Review ............................................................................................................................199 14.4.1 Data Verification .......................................................................................................199 14.4.2 Data Validation..........................................................................................................199 14.4.3 Data Quality Assessment (DQA) ...............................................................................200
14.5 Assessments ............................................................................................................................200 14.5.1 Programmatic ............................................................................................................200 14.5.2 Measurement Data .....................................................................................................200
14.5.2.1 Field Duplicates .......................................................................................200 14.5.2.2 Laboratory Control Samples (LCSs) .........................................................202 14.5.2.3 Blank Analysis .........................................................................................203 14.5.2.4 Matrix Spike Analysis ..............................................................................204 14.5.2.5 Proficiency Testing Program Participation ................................................204
14.6 References ...............................................................................................................................206
Chapter 15: Quality Assurance Program for the Community Environmental Monitoring Program .....................207
15.1 Data Quality Objectives (DQOs) ..............................................................................................207
15.2 Measurement Quality Objectives (MQOs) ...............................................................................207
15.3 Sampling Quality Assurance Program ......................................................................................207
15.4 Laboratory QA Oversight ........................................................................................................208 15.4.1 Procurement ..............................................................................................................208 15.4.2 Initial and Continuing Assessment .............................................................................208 15.4.3 Laboratory QA Program ............................................................................................209
15.5 Data Review ............................................................................................................................209
15.6 QA Program Assessments ........................................................................................................209
15.7 2018 Sample QA Results .........................................................................................................210 15.7.1 Field Duplicates (Precision) .......................................................................................210 15.7.2 Laboratory Control Samples (Accuracy) ....................................................................210 15.7.3 Blank Analysis ..........................................................................................................211 15.7.4 Inter-laboratory Comparison Studies ..........................................................................211
15.8 References ...............................................................................................................................212
Table of Contents
Nevada National Security Site Environmental Report 2018 xi
Appendix A. Las Vegas Area Support Facilities ........................................................................................... A-i Appendix B. Glossary of Terms ...................................................................................................................B-1 Appendix C. Acronyms and Abbreviations ...................................................................................................C-1
Library Distribution List ................................................................................................................................ DL-1
Table of Contents
xii Nevada National Security Site Environmental Report 2018
List of Figures
Figure 1-1. NNSS vicinity map ........................................................................................................................ 2 Figure 1-2. Major topographic features, calderas, and hydrographic subbasins of the NNSS ............................. 3 Figure 1-3. NNSS operational areas, principal facilities, and past nuclear testing areas ..................................... 6 Figure 4-1. Sources of radiological air emissions on the NNSS in 2018 .......................................................... 42 Figure 4-2. Radiological air sampling network on the NNSS in 2018 ............................................................. 44 Figure 4-3. Concentrations of 241Am in air samples collected in 2018 ............................................................. 48 Figure 4-4. Concentrations of 137Cs in air samples collected in 2018 ............................................................... 49 Figure 4-5. Concentrations of 238Pu in air samples collected in 2018 ............................................................... 51 Figure 4-6. Concentrations of 239+240Pu in air samples collected in 2018.......................................................... 52 Figure 4-7. Average trends in 239+240Pu in air annual means, 1971–2018 ......................................................... 53 Figure 4-8. Concentrations of 3H in air samples collected in 2018 with the average air temperature near
the Schooner sampler during the collection period........................................................................ 54 Figure 4-9. Concentrations of 3H in air and precipitation during the sample collection period
at Schooner .................................................................................................................................. 55 Figure 4-10. Average trend lines for annual mean 3H air concentrations for Area groups, 1999–2018 ............... 55 Figure 5-1. NNSA/NFO and EM Nevada Program water sampling network ................................................... 68 Figure 5-2. Tritium concentration categories at NNSA/NFO and EM Nevada Program
sampling locations ....................................................................................................................... 71 Figure 5-3. Water supply wells and drinking water systems on the NNSS ...................................................... 82 Figure 5-4. Active permitted sewage disposal systems on the NNSS .............................................................. 87 Figure 5-5. Annual withdrawals from the NNSS, 1951 to 2018 ...................................................................... 89 Figure 6-1. Locations of TLDs on the NNSS .................................................................................................. 95 Figure 6-2. 2018 annual exposures on the NNSS, by location type, and off the NNSS at CEMP stations........100 Figure 6-3. Correlation between 2018 annual exposures at NNSS Background and CEMP TLD
locations and altitude ..................................................................................................................100 Figure 6-4. 2018 annual exposures in and around the Area 3 RWMS and at background locations.................102 Figure 6-5. 2018 annual exposures around the Area 5 RWMS and at background locations ...........................103 Figure 6-6. Trends in direct radiation exposure measured at TLD locations ...................................................104 Figure 7-1. 2018 CEMP Air Surveillance Network........................................................................................107 Figure 7-2. CEMP Station in Delta, Utah ......................................................................................................108 Figure 7-3. Historical trend for gross alpha analysis for all CEMP stations ....................................................109 Figure 7-4. Historical trend for gross beta analysis for all CEMP stations ......................................................110 Figure 7-5. Historical trend for TLD analysis for all CEMP stations ..............................................................112 Figure 7-6. An example of the effect of meteorological phenomena on background gamma readings at
the Alamo, Nevada CEMP station ...............................................................................................114 Figure 7-7. 2018 CEMP water monitoring locations ......................................................................................116 Figure 7-8. 2018 Nye County TSaMP water monitoring locations .................................................................118 Figure 8-1. Radiological biota monitoring sites on the NNSS ........................................................................123 Figure 9-1. Comparison of radiation dose to the MEI from the NNSS and natural background
(% of total) .................................................................................................................................134 Figure 10-1. Waste Disposal Facilities on the NNSS .......................................................................................140 Figure 10-2. Area 5 RWMC facilities..............................................................................................................141 Figure 10-3. Disposal Cells of the Area 3 RWMS ...........................................................................................143
Table of Contents
Nevada National Security Site Environmental Report 2018 xiii
Figure 11-1. UGTA CAUs on the NNSS .........................................................................................................153 Figure 11-2. Groundwater flow systems of the NNSS .....................................................................................154 Figure 11-3. Frenchman Flat CAU post-closure monitoring network ...............................................................160 Figure 11-4. Annual cumulative totals of FFACO CAS closures .....................................................................167 Figure 12-1. Overview of a segment of the vegetation abatement project area (DRI 2018). ..............................175 Figure 12-2. Operation Teapot instrument station. Inset shows a close-up of a calorimeter mount ...................176 Figure 12-3. Overview of 1950s men’s dormitories. The view is to the northeast with the corner of
Buster Street and Greenhouse Avenue in the lower left. The 23-B, 23-C, and 23-D dormitories are highlighted in green. ...........................................................................................177
Figure 12-4. An early overview of Dell Frenzi Park at Mercury ......................................................................178 Figure 12-5. CGTO representatives on a 2018 NNSS site visit to Ammonia Tanks (DRI 2018) .......................181 Figure 13-1. Desert tortoise distribution and abundance ..................................................................................186 Figure 13-2. Desert tortoise taking shelter in a burrow ....................................................................................187 Figure 13-3. U3ax/bl closure cover (left) and reference site (right) ..................................................................191
Table of Contents
xiv Nevada National Security Site Environmental Report 2018
List of Tables
Table 1-1. Unit prefixes .................................................................................................................................. 7 Table 1-2. Units of radioactivity ..................................................................................................................... 8 Table 1-3. Units of radiological dose .............................................................................................................. 8 Table 1-4. Conversion table for SI units .......................................................................................................... 8 Table 1-5. Radionuclides and their half-lives (in alphabetical order by symbol) .............................................. 9 Table 1-6. Metric and U.S. customary unit equivalents ................................................................................. 10 Table 2-1. Federal, state, and local environmental laws and regulations applicable to NNSA/NFO ................ 14 Table 2-2. Environmental permits for NNSA/NFO operations at NNSS, NLVF, and RSL-Nellis .................. 23 Table 2-3. NNSS NEPA compliance activities .............................................................................................. 25 Table 2-4. Emergency Planning and Community Right-to-Know Act reporting criteria ................................. 27 Table 2-5. Compliance with EPCRA reporting requirements ......................................................................... 27 Table 2-6. Summary of reported releases at the NNSS subject to EPCRA Section 313 .................................. 28 Table 2-7. List of environmental reports submitted to regulators for activities in 2018 .................................. 29 Table 3-1. DOE sustainability goals and performance in FY 2018 ................................................................. 35 Table 4-1. Regulatory concentration limits for radionuclides in air ................................................................ 43 Table 4-2. Gross alpha radioactivity in air samples collected in 2018 ............................................................ 46 Table 4-3. Gross beta radioactivity in air samples collected in 2018 .............................................................. 46 Table 4-4. Concentrations of 241Am in air samples collected in 2018 ............................................................. 48 Table 4-5. Concentrations of 137Cs in air samples collected in 2018 ............................................................... 49 Table 4-6. Concentrations of 238Pu in air samples collected in 2018 ............................................................... 51 Table 4-7. Concentrations of 239+240 Pu in air samples collected in 2018 ......................................................... 52 Table 4-8. Concentrations of 3H in air samples collected in 2018 .................................................................. 54 Table 4-9. Total estimated NNSS radionuclide emissions for 2018................................................................ 57 Table 4-10. Radiological atmospheric releases from the NNSS for 2018 ......................................................... 58 Table 4-11. Sum of fractions of compliance levels for man-made radionuclides at critical receptor
samplers in 2018 .......................................................................................................................... 59 Table 4-12. Criteria air pollutant emissions released on the NNSS from operational permitted facilities .......... 62 Table 4-13. Criteria air pollutants and HAPs released on the NNSS over the past 11 years .............................. 62 Table 5-1. Definitions and objectives for radiological water sample types ..................................................... 66 Table 5-2. CAU-specific Contaminants of Concern and Contaminants of Potential Concern ......................... 69 Table 5-3. Tritium concentration categories .................................................................................................. 70 Table 5-4. Tritium concentrations for the most recent sample at wells in the NNSA/NFO and
EM Nevada Program sample network. ......................................................................................... 72 Table 5-5. Sample analysis results from NNSS PWS wells and Compliance wells/surface waters. ................ 74 Table 5-6. Current sampling requirements for permitted NNSS PWSs and water-hauling trucks ................... 83 Table 5-7. Water quality analysis results for NNSS PWSs ............................................................................ 84 Table 5-8. Water quality and flow monitoring results for NNSS sewage lagoon influent waters in 2018 ........ 86 Table 5-9. Nonradiological results for Well ER-12-1 groundwater and E Tunnel Waste Water Disposal
System discharge samples ............................................................................................................ 88 Table 6-1. Annual direct radiation exposures measured at TLD locations on the NNSS in 2018 .................... 97 Table 6-2. Summary statistics for 2018 mean annual direct radiation exposures by TLD location type .......... 99 Table 6-3. Summary statistics for exposure history of background TLD stations ........................................... 99 Table 7-1. Gross alpha results for the CEMP offsite ASN in 2018 ................................................................109 Table 7-2. Gross beta results for the CEMP offsite ASN in 2018..................................................................110 Table 7-3. TLD monitoring results for the CEMP offsite ASN in 2018 ........................................................111
Table of Contents
Nevada National Security Site Environmental Report 2018 xv
Table 7-4. PIC monitoring results for the CEMP offsite ASN in 2018 ..........................................................113 Table 7-5. Average natural background radiation (excluding radon) for selected U.S. cities .........................113 Table 7-6. CEMP water monitoring locations sampled in 2018 ....................................................................114 Table 7-7. Nye County TSaMP water monitoring locations, results, and dates sampled ................................119 Table 8-1. NNSS animals monitored for radionuclides .................................................................................122 Table 8-2. Plant samples collected in 2018...................................................................................................125 Table 8-3. Concentrations of man-made radionuclides in plants sampled in 2018 .........................................125 Table 8-4. Animal samples collected in 2018 ...............................................................................................126 Table 8-5. Concentrations of man-made radionuclides in animals sampled during routine monitoring
in 2018 .......................................................................................................................................126 Table 9-1. Distance between critical receptor air monitoring stations and nearest points of interest...............130 Table 9-2. Hypothetical CEDE from ingesting game animals sampled in 2018 .............................................132 Table 9-3. Maximum CEDEs to a person hypothetically ingesting NNSS game animals sampled
from 2001--2018 .........................................................................................................................132 Table 9-4. Estimated radiological dose to a hypothetical MEI of the general public from 2018
NNSS activities ..........................................................................................................................134 Table 9-5. Allowable total residual surface contamination for property released off the NNSS .....................135 Table 9-6. Site-specific dose assessment for terrestrial plants and animals sampled in 2018 .........................137
Table 10-1. Total waste volumes received and disposed at the Area 5 RWMS in 2018 ...................................142 Table 10-2. Total waste volumes received and disposed at the Area 3 RWMS in 2018 ...................................143 Table 10-3. Key documents required for Area 3 RWMS and Area 5 RWMS disposal operations ...................145 Table 10-4. Groundwater monitoring results for Cell 18 ................................................................................146 Table 10-5. Highest annual mean concentrations of radionuclides detected at Area 3 and Area 5 RWMS .......147 Table 10-6. Hazardous waste managed at the NNSS ......................................................................................148 Table 10-7. Quantity of solid wastes disposed in NNSS landfills ...................................................................149 Table 11-1. UGTA publications published prior to June 2019 ........................................................................161 Table 11-2. Soils Sites closed in 2018 ............................................................................................................163 Table 11-3. Other Soils Sites where work was conducted in 2018 ..................................................................163 Table 11-4. Historical RCRA closure sites and their post-closure monitoring requirements ............................165 Table 11-5. FFACO milestones for 2018 (sorted by due date, in ascending order) ..........................................166 Table 12-1. 2018 cultural resources inventories and NRHP eligibility evaluations..........................................174 Table 12-2. 2018 buildings and structures evaluated for individual NRHP eligibility and mitigated
pursuant to the Mercury Programmatic Agreement ......................................................................177 Table 12-3. Other 2018 cultural resources projects.........................................................................................179 Table 12-4. AICP reports ...............................................................................................................................181 Table 13-1. Cumulative totals (2009–2018) and permit limits for take of desert tortoise and habitat ...............187 Table 13-2. Activities conducted in 2018 for important species and ecosystem monitoring on the NNSS .......189 Table 14-1. Summary of field duplicate samples for 2018 ..............................................................................201 Table 14-2. Summary of laboratory control samples for 2018 ........................................................................202 Table 14-3. Summary of laboratory method blank samples for 2018 ..............................................................203 Table 14-4. Summary of matrix spike samples for 2018 .................................................................................204 Table 14-5. Summary of 2018 Mixed Analyte Performance Evaluation Program reports ................................205 Table 14-6. Summary of inter-laboratory comparison TLD samples (UD-802 dosimeters) for 2018 ...............205 Table 15-1. Summary of 2018 field duplicate samples for CEMP monitoring.................................................210 Table 15-2. Summary of 2018 laboratory control samples (LCSs) for CEMP monitoring ...............................211
Table of Contents
xvi Nevada National Security Site Environmental Report 2018
Table 15-3. Summary of 2018 laboratory blank samples for CEMP monitoring .............................................211 Table 15-4. Summary of 2018 inter-laboratory comparison samples of the subcontract radiochemistry
and tritium laboratories for CEMP monitoring ............................................................................211 Table 15-5. Summary of 2018 inter-laboratory comparison TLD samples of the subcontract dosimetry
group for CEMP monitoring .......................................................................................................212
Introduction and Helpful Information
Nevada National Security Site Environmental Report 2018 1
1.0 Ch1
Chapter 1: Introduction and Helpful Information
Patricia R. Hardesty
Mission Support and Test Services, LLC Charles B. Davis
EnviroStat
1.1 Site Location
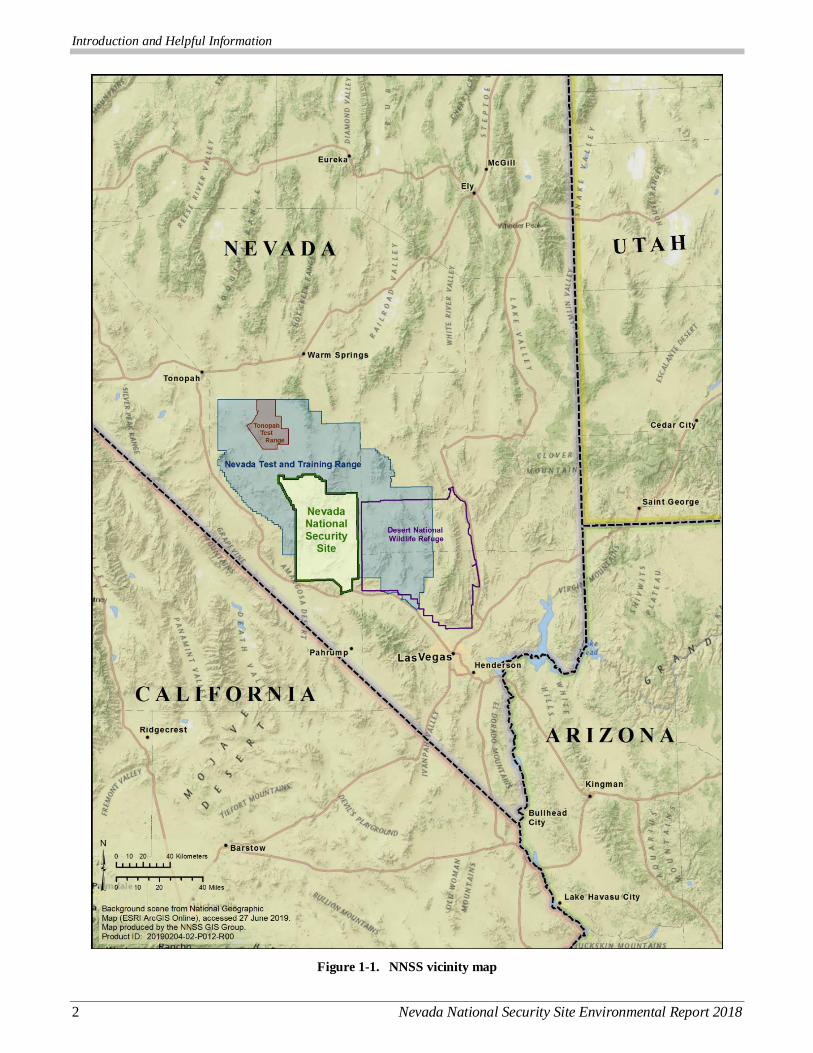
The U.S. Department of Energy (DOE), National Nuclear Security Administration Nevada Field Office (NNSA/NFO) directs the management and operation of the Nevada National Security Site (NNSS). The NNSS is located in Nye County in south-central Nevada (Figure 1-1). The southeast corner of the NNSS is about 88 kilometers (km) (55 miles [mi]) northwest of the center of Las Vegas in Clark County. By highway, it is about 105 km (65 mi) from the center of Las Vegas to Mercury. Mercury, at the southern end of the NNSS, is the main
base camp for worker housing and administrative operations at the NNSS.
The NNSS encompasses about 3,522 km2 (1,360 mi2) based on the most recent land survey. It varies from 46 to 56 km (28 to 35 mi) in width from west to east and from 64 to 88 km (40 to 55 mi) from north to south. The NNSS is surrounded on all sides by lands managed by the federal government. It is bordered on the west and north by the Nevada Test and Training Range (NTTR), on the east by an area used by both the NTTR and the Desert National Wildlife Refuge, and on the south and southwest by lands managed by the Bureau of Land Management. The combination of the NTTR and the NNSS represents one of the largest unpopulated land areas in the United States,
comprising some 14,200 km2 (5,470 mi2).
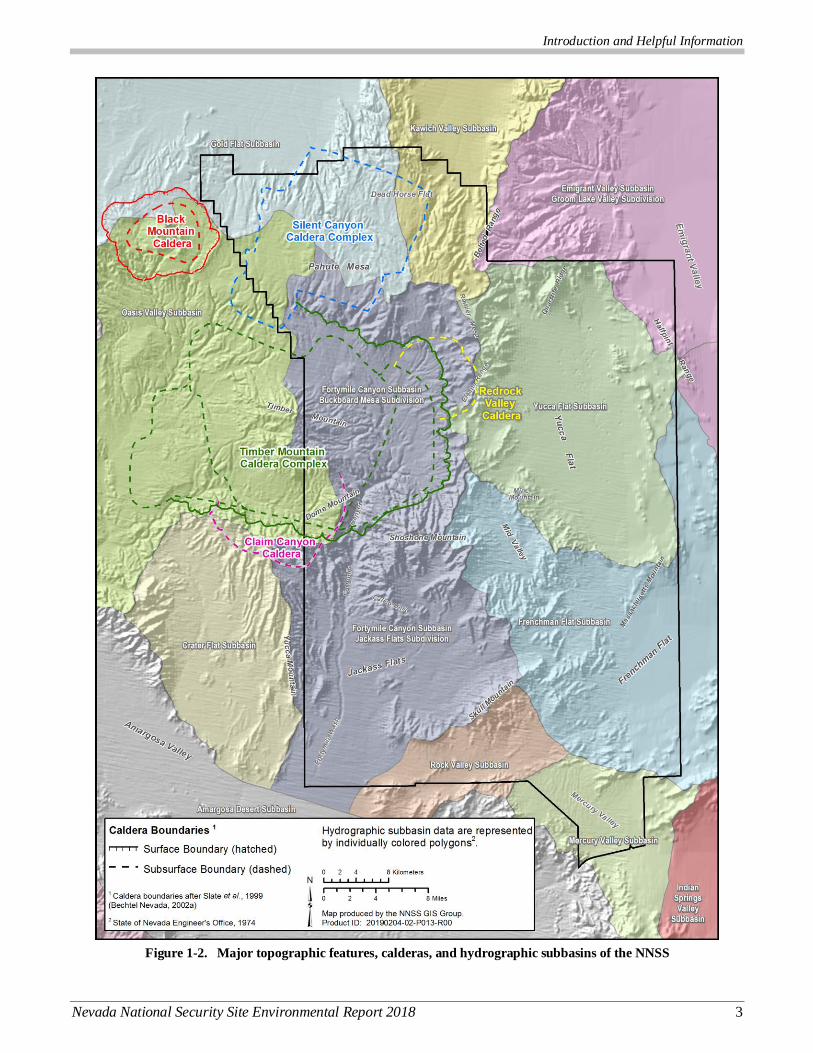
1.2 Environmental Setting
The NNSS is located in the southern part of the Great Basin, the northern-most subprovince of the Basin and Range Physiographic Province. NNSS terrain is typical of the Basin and Range Physiographic Province, characterized by generally north–south trending mountain ranges and intervening valleys. These mountain ranges and valleys,
however, are modified on the NNSS by very large volcanic calderas. The principal valleys are Frenchman Flat, Yucca Flat, and Jackass Flats (Figure 1-2). Yucca and Frenchman Flat are topographically and hydrographically closed and contain dry lake beds, or playas, at their lowest elevations. Jackass Flats is topographically and hydrographically open, and surface water from this basin flows off the NNSS to the south via the Fortymile Wash. The dominant highlands are Pahute Mesa and Rainier Mesa (high volcanic plateaus), Timber Mountain (a resurgent dome of the Timber Mountain caldera complex), and Shoshone Mountain. In general, the highland areas are steep and dissected, and the slopes in the lowland areas are gentle.
The lowest elevation on the NNSS is 823 meters (m) (2,700 feet [ft]) in Jackass Flats in the southeast, and the highest elevation is 2,341 m (7,680 ft) on Rainier Mesa in the north-central region.
The topography of the NNSS has been altered by historical DOE actions, particularly underground nuclear testing. The principal effect of testing was the creation of numerous collapse sinks (craters), the majority of which are in the Yucca Flat basin with fewer in the Pahute and Rainier mesas. Shallow detonations that created surface
disruptions were also performed during the Plowshare Program to explore the potential uses of nuclear devices for large-scale excavation.
The reader is directed to Attachment A: Site Description, a file on the compact disc of this report, where the geology, hydrology, climatology, ecology, and cultural resources of the NNSS are described.
1.3 Site History
The history of the NNSS and its current missions direct the focus and design of environmental monitoring and surveillance activities on and near the site. Between 1940 and 1950, the area known as the NNSS was under the jurisdiction of Nellis Air Force Base and was part of the Nellis Bombing and Gunnery Range. In 1950, the site was established as the primary location for testing the nation’s nuclear explosive devices. It was named the Nevada Test Site (NTS) in 1951 and supported nuclear testing from 1951 to 1992.
Throughout this docu-
ment, the definition of
word(s) in bold italics
may be found by
clicking on the word in
the electronic version or
by referencing the
Glossary, Appendix B.
To return from the
Glossary, right click and
select Previous View.
Introduction and Helpful Information
2 Nevada National Security Site Environmental Report 2018
Figure 1-1. NNSS vicinity map
Introduction and Helpful Information
Nevada National Security Site Environmental Report 2018 3
Figure 1-2. Major topographic features, calderas, and hydrographic subbasins of the NNSS
Introduction and Helpful Information
4 Nevada National Security Site Environmental Report 2018
The types of tests conducted during this period are briefly described below. In 2010, the NTS was renamed the NNSS to reflect the diversity of nuclear, energy, and homeland security activities now conducted at the site. Nuclear experiments conducted at the NNSS are currently limited to subcritical experiments.
Atmospheric Tests – The first test, an atmospheric nuclear explosive test, was conducted on the NTS in 1951. Tests conducted through the 1950s were predominantly atmospheric tests. They involved a nuclear explosive device detonated either on the ground surface, on a steel tower, suspended from tethered balloons, dropped from an
aircraft, or placed on a rocket. Several tests, categorized as “safety experiments” and “storage-transportation tests,” involved the destruction of a nuclear device with non-nuclear explosives. Some of these resulted in the dispersion of plutonium in the test vicinity. One of these test areas lies just north of the NNSS boundary at the south end of the NTTR, and four others are at the north end of the NTTR. The last above-ground test occurred in 1962.
Underground Tests – The first underground nuclear explosive test was a cratering test conducted in 1951. The first contained underground test was in 1957. Testing was discontinued during a bilateral moratorium that began October 1958, but was resumed in September 1961, after the Union of Soviet Socialist Republics resumed nuclear testing. After late 1962, nearly all tests were conducted in sealed vertical shafts drilled into Yucca Flat and Pahute Mesa or in horizontal tunnels mined into Rainier Mesa and Shoshone Mountain. From 1951 to 1992, a total of 828 underground nuclear tests were conducted at the NNSS. Approximately one-third of them were detonated
near or in the saturated zone.
Cratering Tests – Five earth-cratering (shallow-burial) nuclear explosive tests were conducted from 1962
through 1968 as part of the Plowshare Program that explored peaceful uses of nuclear explosives. The first and highest yield Plowshare crater test, Sedan, was detonated at the northern end of Yucca Flat. The second highest yield crater test was Schooner, located on Pahute Mesa. Mixed fission products, tritium, and plutonium from these tests were entrained in the soil ejected from the craters and deposited on the ground surrounding the craters.
Other Tests – Other nuclear-related experiments at the NNSS have included the BREN [Bare Reactor Experiment–Nevada] series in the early 1960s, conducted in Area 4. These tests were performed with a 14-million electron volt neutron generator mounted on a 465 m (1,527 ft) steel tower to produce neutron and gamma radiation for the purpose of estimating the radiation doses received by survivors of Hiroshima and Nagasaki. The tower was moved in 1966 to Area 25 and used for conducting Operation HENRE [High-Energy Neutron Reactions Experiment], jointly funded by the U.S. Department of Defense (DoD) and the Atomic Energy
Commission (AEC) to provide information for the AEC’s Division of Biology and Medicine. From 1959 through 1973, open-air nuclear reactor, nuclear engine, and nuclear furnace tests were conducted in Area 25, and tests with a nuclear ramjet engine were conducted in Area 26. Erosion of metal cladding on the reactor fuel released some fuel particles that caused negligible deposition of radionuclides on the ground. Most of the radiation released from these tests were gaseous radioactive fission products.
Fact sheets on many of the historical tests mentioned above can be found at http://www.nnss.gov/pages/resources/library/FactSheets.html. All nuclear device tests are listed in United States Nuclear Tests, July 1945 through September 1992 (NNSA/NFO 2015).
1.4 Site Mission
NNSA/NFO directs facility management and program operations at the NNSS North Las Vegas Facility (NLVF) and the Remote Sensing Laboratory–Nellis (RSL-Nellis) in Nevada and as well as selected operations at four sites outside of Nevada: RSL-Andrews in Maryland, Livermore Operations in California, Los Alamos Operations in New Mexico, and the Special Technologies Laboratory in California. Los Alamos National Laboratory, Lawrence Livermore National Laboratory, and Sandia National Laboratories are the principal organizations that sponsor and implement the nuclear weapons programs at the NNSS. Mission Support and Test Services, LLC, is the
Management and Operating Contractor accountable for the successful execution of work and ensuring compliance with environmental regulations. The three major NNSS missions currently include National Security/Defense, Environmental Management, and Nondefense. The programs that support these missions are listed in the following text box.
Introduction and Helpful Information
Nevada National Security Site Environmental Report 2018 5
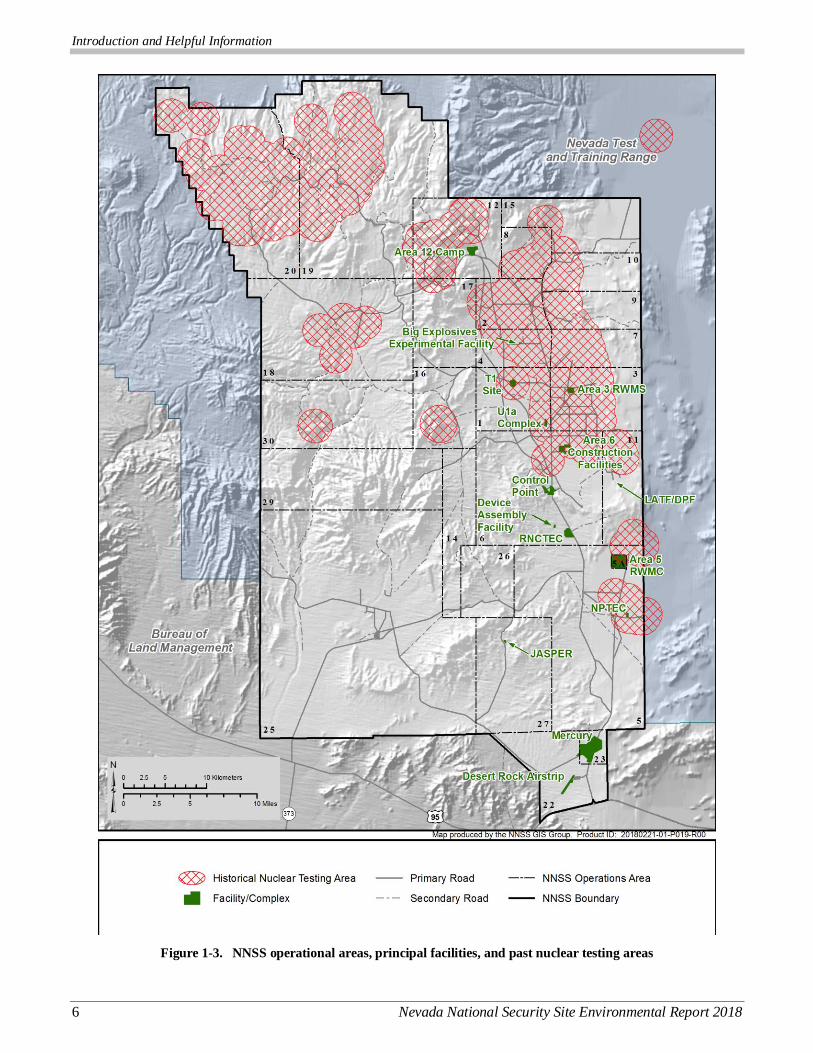
1.5 Primary Facilities and Activities
NNSS facilities and centers that support the National Security/Defense missions include the U1a Complex, Big Explosives Experimental Facility (BEEF), Device Assembly Facility (DAF), Dense Plasma Focus (DPF) Facility (located within the Los Alamos Technical Facility [LATF]), Joint Actinide Shock Physics Experimental Research
(JASPER) Facility, Nonproliferation Test and Evaluation Complex (NPTEC), the National Criticality Experiments Research Center (NCERC) (located within the DAF), the Radiological/Nuclear Countermeasures Test and Evaluation Complex (RNCTEC), and the Radiological/Nuclear Weapons of Mass Destruction Incident Exercise Site (known as the T-1 Site). NNSS facilities that support Environmental Management missions include the currently active Area 5 Radioactive Waste Management Complex (RWMC) and the Area 3 Radioactive Waste Management Site (RWMS), which is in cold standby (Figure 1-3).
The primary NNSS activity in 2018 continued to be ensuring that the U.S. stockpile of nuclear weapons remains safe and reliable. Other 2018 NNSS activities included experiments aimed at improving arms control and nonproliferation treaty verification; weapons of mass destruction first responder training; the controlled release of hazardous material at NPTEC; remediation of legacy contamination sites; processing of waste destined for the
Waste Isolation Pilot Plant in Carlsbad, New Mexico, or the Idaho National Laboratory in Idaho Falls, Idaho; and
disposal of low-level and mixed low-level radioactive waste.
1.6 Scope of this Environmental Report
This report summarizes the NNSA/NFO environmental protection and monitoring programs data and the compliance status for calendar year 2018 at the NNSS and at its two support facilities, the NLVF and RSL-Nellis. This report also addresses environmental restoration projects conducted by the Environmental Management Nevada Program Office at the Tonopah Test Range (TTR).
NNSS Missions and Programs
National Security/Defense Missions
Stockpile Stewardship and Management Program – Conducts high-hazard operations in support of defense-related nuclear
and national security experiments and maintains the capability to resume underground nuclear weapons testing, if directed.
Nuclear Emergency Response, Nonproliferation, and Counterterrorism Programs – Provides support facilities, training
facilities, and capabilities for government agencies involved in emergency response, nonproliferation technology
development, national security technology development, and counterterrorism activities.
Strategic Partnership Projects – Provides support facilities and capabilities for other DOE programs and federal
agencies/organizations involved in defense-related activities.
Environmental Management Missions
Environmental Restoration Program – Characterizes and remediates the environmental legacy of nuclear explosive and
other testing at NNSS and NTTR locations, and develops and deploys technologies that enhance environmental
restoration.
Waste Management Program – Manages and safely disposes of low-level waste, mixed low-level waste, and classified
waste/matter received from DOE- and DoD-approved facilities throughout the U.S. and wastes generated in Nevada by
NNSA/NFO. Safely manages and characterizes hazardous and transuranic wastes for offsite disposal.
Nondefense Missions
General Site Support and Infrastructure Program – Maintains the buildings, roads, utilities, and facilities required to
support all NNSS programs and to provide a safe environment for NNSS workers.
Conservation and Renewable Energy Programs – Operates the pollution prevention program and supports renewable
energy and conservation initiatives at the NNSS.
Other Research and Development – Provides support facilities and NNSS access to universities and organizations
conducting environmental and other research unique to the regional setting.
Introduction and Helpful Information
6 Nevada National Security Site Environmental Report 2018
Figure 1-3. NNSS operational areas, principal facilities, and past nuclear testing areas
Introduction and Helpful Information
Nevada National Security Site Environmental Report 2018 7
The Environmental Management Nevada Program office is responsible for addressing environmental restoration sites on the NTTR and TTR if they are listed in the Federal Facility Compliance Act Order (FFACO). The DOE, National Nuclear Security Administration Sandia Field Office produces the TTR annual site environmental reports, which are posted at http://www.sandia.gov/news/publications/environmental/index.html.
1.7 Populations Near the NNSS
The population of the area surrounding the NNSS is predominantly rural. The most recent population estimates for Nevada communities are for 2018 and are provided by the Nevada State Demographer’s Office (2019). The most recent population estimate for Nye County is 47,856, and the largest Nye County community is Pahrump (40,473), located approximately 80 km (50 mi) south of the NNSS Control Point facility (near the center of the NNSS). Other Nye County communities include Tonopah (2,311), Amargosa (1,327), Beatty (974), Round Mountain (768), Gabbs (220), and Manhattan (128). Lincoln County to the east of the NNSS includes a few small
communities, including Caliente (1,084), Pioche (797), Panaca (810), and Alamo (684). Clark County, southeast of the NNSS, is the major population center of Nevada and has an estimated population of 2,251,175. The total annual population estimate for all Nevada counties, cities, and towns is 3,057,582.
The Mojave Desert, which includes Death Valley National Park, lies along the southwestern border of Nevada. This area is still predominantly rural; however, tourism at Death Valley National Park swells the population to more than 5,000 on any particular day during holiday periods when the weather is mild.
The extreme southwestern region of Utah is more developed than the adjacent portion of Nevada. The latest population estimates for Utah communities are for 2018 taken from the U.S. Census Bureau (2019) of the U.S. Department of Commerce. Southern Utah’s largest community is St. George, located 220 km (137 mi) east of the NNSS, with an estimated population of 87,178. The next largest town, Cedar City, is located 280 km (174 mi) east-northeast of the NNSS and has an estimated population of 33,055.
The northwestern region of Arizona is mostly rangeland except for that portion in the Lake Mead recreation area. In addition, several small communities lie along the Colorado River. The largest towns in the area are Bullhead City, 165 km (103 mi) south-southeast of the NNSS, with an estimated population of 40,804, and Kingman, 280 km (174 mi) southeast of the NNSS, with an estimated population of 30,600 (Arizona Department of
Administration 2019).
1.8 Understanding Data in this Report
1.8.1 Scientific Notation
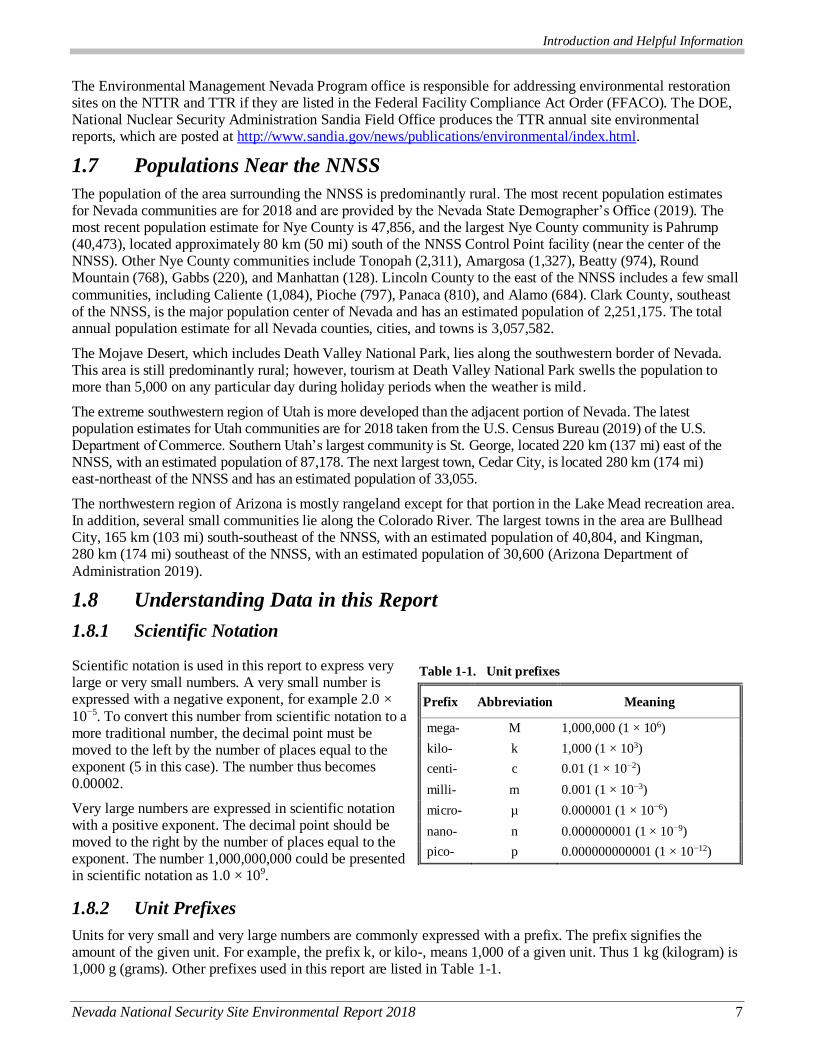
Scientific notation is used in this report to express very large or very small numbers. A very small number is expressed with a negative exponent, for example 2.0 ×
10−5. To convert this number from scientific notation to a more traditional number, the decimal point must be moved to the left by the number of places equal to the exponent (5 in this case). The number thus becomes 0.00002.
Very large numbers are expressed in scientific notation with a positive exponent. The decimal point should be moved to the right by the number of places equal to the exponent. The number 1,000,000,000 could be presented in scientific notation as 1.0 × 10⁹.
1.8.2 Unit Prefixes
Units for very small and very large numbers are commonly expressed with a prefix. The prefix signifies the amount of the given unit. For example, the prefix k, or kilo-, means 1,000 of a given unit. Thus 1 kg (kilogram) is 1,000 g (grams). Other prefixes used in this report are listed in Table 1-1.
Table 1-1. Unit prefixes
Prefix Abbreviation Meaning
mega- M 1,000,000 (1 × 10⁶)
kilo- k 1,000 (1 × 10³)
centi- c 0.01 (1 × 10⁻²)
milli- m 0.001 (1 × 10⁻³)
micro- µ 0.000001 (1 × 10⁻⁶)
nano- n 0.000000001 (1 × 10⁻⁹)
pico- p 0.000000000001 (1 × 10⁻¹²)
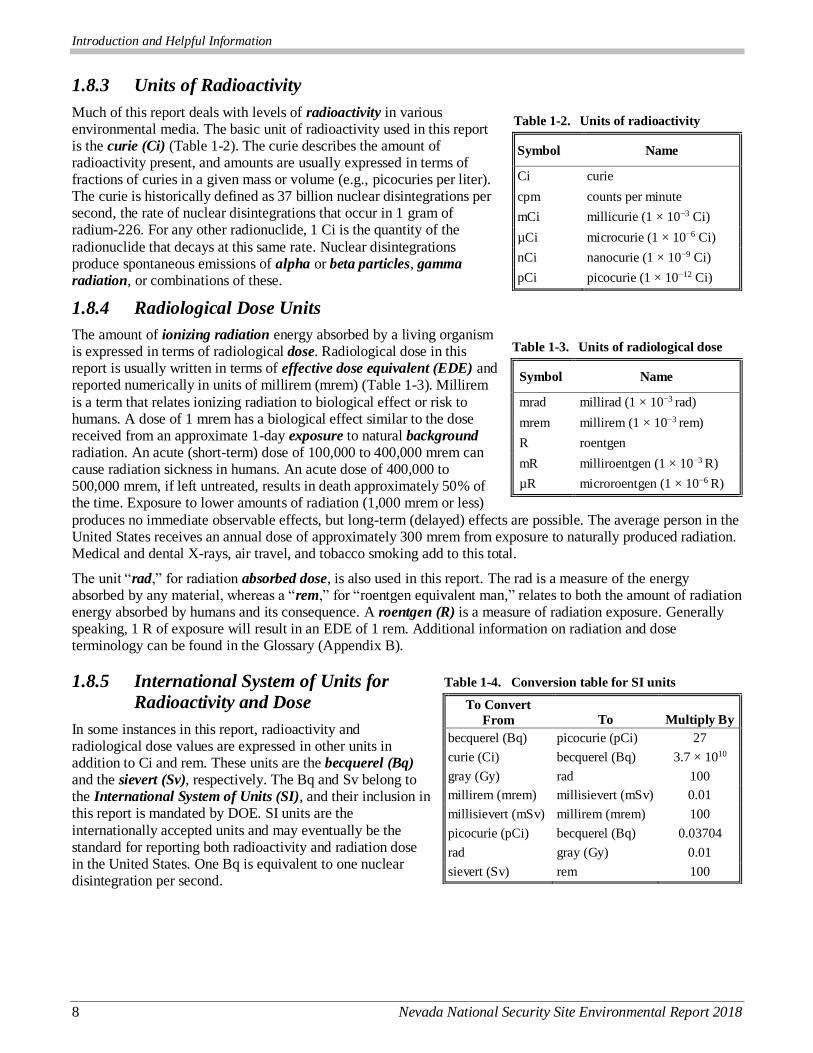
Introduction and Helpful Information
8 Nevada National Security Site Environmental Report 2018
1.8.3 Units of Radioactivity
Much of this report deals with levels of radioactivity in various environmental media. The basic unit of radioactivity used in this report is the curie (Ci) (Table 1-2). The curie describes the amount of radioactivity present, and amounts are usually expressed in terms of fractions of curies in a given mass or volume (e.g., picocuries per liter). The curie is historically defined as 37 billion nuclear disintegrations per second, the rate of nuclear disintegrations that occur in 1 gram of radium-226. For any other radionuclide, 1 Ci is the quantity of the
radionuclide that decays at this same rate. Nuclear disintegrations produce spontaneous emissions of alpha or beta particles, gamma
radiation, or combinations of these.
1.8.4 Radiological Dose Units
The amount of ionizing radiation energy absorbed by a living organism is expressed in terms of radiological dose. Radiological dose in this report is usually written in terms of effective dose equivalent (EDE) and reported numerically in units of millirem (mrem) (Table 1-3). Millirem
is a term that relates ionizing radiation to biological effect or risk to humans. A dose of 1 mrem has a biological effect similar to the dose received from an approximate 1-day exposure to natural background
radiation. An acute (short-term) dose of 100,000 to 400,000 mrem can cause radiation sickness in humans. An acute dose of 400,000 to 500,000 mrem, if left untreated, results in death approximately 50% of the time. Exposure to lower amounts of radiation (1,000 mrem or less)
produces no immediate observable effects, but long-term (delayed) effects are possible. The average person in the United States receives an annual dose of approximately 300 mrem from exposure to naturally produced radiation. Medical and dental X-rays, air travel, and tobacco smoking add to this total.
The unit “rad,” for radiation absorbed dose, is also used in this report. The rad is a measure of the energy absorbed by any material, whereas a “rem,” for “roentgen equivalent man,” relates to both the amount of radiation energy absorbed by humans and its consequence. A roentgen (R) is a measure of radiation exposure. Generally speaking, 1 R of exposure will result in an EDE of 1 rem. Additional information on radiation and dose terminology can be found in the Glossary (Appendix B).
1.8.5 International System of Units for
Radioactivity and Dose
In some instances in this report, radioactivity and radiological dose values are expressed in other units in addition to Ci and rem. These units are the becquerel (Bq) and the sievert (Sv), respectively. The Bq and Sv belong to the International System of Units (SI), and their inclusion in this report is mandated by DOE. SI units are the
internationally accepted units and may eventually be the standard for reporting both radioactivity and radiation dose in the United States. One Bq is equivalent to one nuclear disintegration per second.
Table 1-2. Units of radioactivity
Symbol Name
Ci curie
cpm counts per minute
mCi millicurie (1 × 10⁻³ Ci)
µCi microcurie (1 × 10⁻⁶ Ci)
nCi nanocurie (1 × 10⁻⁹ Ci)
pCi picocurie (1 × 10⁻¹² Ci)
Table 1-3. Units of radiological dose
Symbol Name
mrad millirad (1 × 10⁻³ rad)
mrem millirem (1 × 10⁻³ rem)
R roentgen
mR milliroentgen (1 × 10⁻³ R)
µR microroentgen (1 × 10⁻⁶ R)
Table 1-4. Conversion table for SI units
To Convert
From To Multiply By
becquerel (Bq) picocurie (pCi) 27
curie (Ci) becquerel (Bq) 3.7 × 10¹⁰
gray (Gy) rad 100
millirem (mrem) millisievert (mSv) 0.01
millisievert (mSv) millirem (mrem) 100
picocurie (pCi) becquerel (Bq) 0.03704
rad gray (Gy) 0.01
sievert (Sv) rem 100

Introduction and Helpful Information
Nevada National Security Site Environmental Report 2018 9
The unit of radiation absorbed dose (rad) has a corresponding SI unit called the gray (Gy). The roentgen measure of radiation exposure has no SI equivalent. Table 1-4 provides the multiplication factors for converting to and from SI units.
1.8.6 Radionuclide Nomenclature
Radionuclides are frequently expressed with the one- or two-letter chemical symbol for the element. Radionuclides may have many different isotopes, which are shown by a superscript to the left of
the symbol. This number is the atomic weight of the isotope (the number of protons and neutrons in the nucleus of the atom). Radionuclide symbols, many of which are used in this report, are shown in Table 1-5 along with the half-life of each radionuclide. The half-life is the time required for one-half of the radioactive atoms in a given amount of material to decay. For example, after one half-life, half of the original atoms will have decayed; after
two half-lives, three-fourths of the original atoms will have decayed; and, after three half-lives, seven-eighths of the original atoms will have decayed, and so on. The notation 226+228Ra and similar notations in this report (e.g., 239+240Pu) are used when the analytical method does not distinguish between the isotopes, but reports the total amount of both.
1.8.7 Units of Measurement
Both metric and non-metric units of measurement are used in this
report. Metric system and U.S. customary units and their respective equivalents are shown in Table 1-6 on the following page.
1.8.8 Measurement Variability
There is always uncertainty associated with the measurement of environmental contaminants. For radioactivity, a major source of uncertainty is the inherent randomness of radioactive decay events.
Uncertainty in analytical measurements is also a consequence of variability related to collecting and analyzing the samples. This variability is associated with reading or recording the result,
handling or processing the sample, calibrating the counting instrument, and numerical rounding.
The uncertainty of a measurement is denoted by following the result with an uncertainty value, which is preceded by the plus-or-minus symbol, ±. This uncertainty value gives information on what the measurement might be if the same sample were analyzed again under identical conditions. The uncertainty value implies that approximately 95% of the time, the average of many measurements would give a value somewhere between the
reported value minus the uncertainty value and the reported value plus the uncertainty value. If the reported concentration of a given constituent is smaller than its associated uncertainty (e.g., 40 ± 200), then the sample may not contain that constituent.
Table 1-5. Radionuclides and their
half-lives (in alphabetical order
by symbol)
Symbol Radionuclide Half-Life (a) 241Am americium-241 432.2 yr 7Be beryllium-7 53.22 d 14C carbon-14 5.70 × 10³ yr 36Cl chlorine-36 3.01 × 10⁵ yr 134Cs cesium-134 2.1 yr 137Cs cesium-137 30.2 yr 51Cr chromium-51 27.7 d 60Co cobalt-60 5.3 yr 152Eu europium-152 13.5 yr 154Eu europium-154 8.6 yr 155Eu europium-155 4.8 yr 3H tritium 12.3 yr 129I iodine-129 1.6 × 10⁷ yr 131I iodine-131 8 d 40K potassium-40 1.3 × 10⁸yr 85Kr krypton-85 10.8 yr 212Pb lead-212 10.6 hr 238Pu plutonium-238 87.7 yr 239Pu plutonium-239 2.4 × 10⁴ yr 240Pu plutonium-240 6.5 × 10³ yr 241Pu plutonium-241 14.4 yr 226Ra radium-226 1.6 × 10³ yr 228Ra radium-228 5.75 yr 220Rn radon-220 56 s 222Rn radon-222 3.8 d 103Ru ruthenium-103 39.3 d 106Ru ruthenium-106 373.6 d 125Sb antimony-125 2.8 yr 113Sn tin-113 115 d 90Sr strontium-90 28.8 yr 99Tc technetium-99 2.1 × 10⁵ yr 232Th thorium-232 1.4 × 10¹⁰ yr
U (b) uranium total - - - (c) 234U uranium-234 2.4 × 10⁵ yr 235U uranium-235 7 × 10⁸ yr 238U uranium-238 4.5 × 10⁹ yr 65Zn zinc-65 244.1 d 95Zr zirconium-95 63.98 d
(a) Source: International Commission on
Radiological Protection (2008).
(b) Total uranium may also be indicated by U-natural (U-nat) or U-mass.
(c) Natural uranium is a mixture dominated by 238U; thus, the half-life is approximately 4.5 × 10⁹ years.
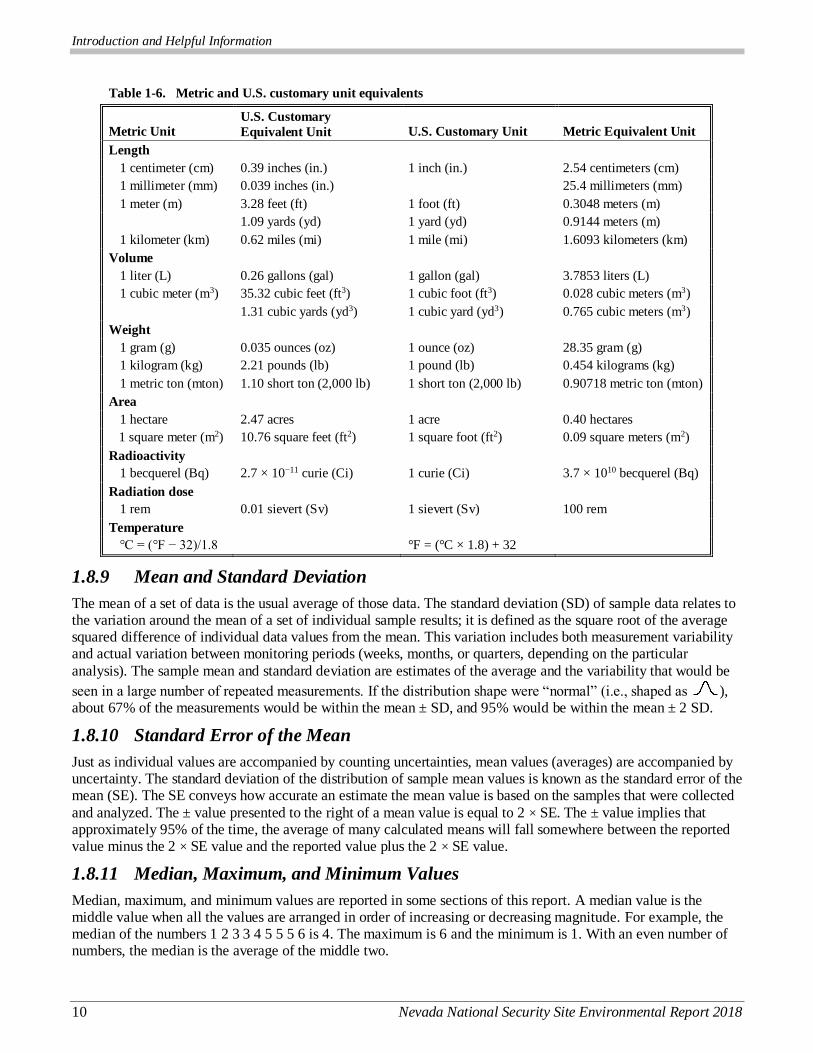
Introduction and Helpful Information
10 Nevada National Security Site Environmental Report 2018
1.8.9 Mean and Standard Deviation
The mean of a set of data is the usual average of those data. The standard deviation (SD) of sample data relates to the variation around the mean of a set of individual sample results; it is defined as the square root of the average squared difference of individual data values from the mean. This variation includes both measurement variability and actual variation between monitoring periods (weeks, months, or quarters, depending on the particular
analysis). The sample mean and standard deviation are estimates of the average and the variability that would be
seen in a large number of repeated measurements. If the distribution shape were “normal” (i.e., shaped as ), about 67% of the measurements would be within the mean ± SD, and 95% would be within the mean ± 2 SD.
1.8.10 Standard Error of the Mean
Just as individual values are accompanied by counting uncertainties, mean values (averages) are accompanied by uncertainty. The standard deviation of the distribution of sample mean values is known as the standard error of the mean (SE). The SE conveys how accurate an estimate the mean value is based on the samples that were collected
and analyzed. The ± value presented to the right of a mean value is equal to 2 × SE. The ± value implies that approximately 95% of the time, the average of many calculated means will fall somewhere between the reported value minus the 2 × SE value and the reported value plus the 2 × SE value.
1.8.11 Median, Maximum, and Minimum Values
Median, maximum, and minimum values are reported in some sections of this report. A median value is the middle value when all the values are arranged in order of increasing or decreasing magnitude. For example, the median of the numbers 1 2 3 3 4 5 5 5 6 is 4. The maximum is 6 and the minimum is 1. With an even number of numbers, the median is the average of the middle two.
Table 1-6. Metric and U.S. customary unit equivalents
Metric Unit U.S. Customary
Equivalent Unit U.S. Customary Unit Metric Equivalent Unit
Length
1 centimeter (cm) 0.39 inches (in.) 1 inch (in.) 2.54 centimeters (cm)
1 millimeter (mm) 0.039 inches (in.) 25.4 millimeters (mm)
1 meter (m) 3.28 feet (ft) 1 foot (ft) 0.3048 meters (m)
1.09 yards (yd) 1 yard (yd) 0.9144 meters (m)
1 kilometer (km) 0.62 miles (mi) 1 mile (mi) 1.6093 kilometers (km)
Volume
1 liter (L) 0.26 gallons (gal) 1 gallon (gal) 3.7853 liters (L)
1 cubic meter (m3) 35.32 cubic feet (ft3) 1 cubic foot (ft3) 0.028 cubic meters (m3)
1.31 cubic yards (yd3) 1 cubic yard (yd3) 0.765 cubic meters (m3)
Weight
1 gram (g) 0.035 ounces (oz) 1 ounce (oz) 28.35 gram (g)
1 kilogram (kg) 2.21 pounds (lb) 1 pound (lb) 0.454 kilograms (kg)
1 metric ton (mton) 1.10 short ton (2,000 lb) 1 short ton (2,000 lb) 0.90718 metric ton (mton)
Area
1 hectare 2.47 acres 1 acre 0.40 hectares
1 square meter (m2) 10.76 square feet (ft2) 1 square foot (ft2) 0.09 square meters (m2)
Radioactivity
1 becquerel (Bq) 2.7 × 10⁻¹¹ curie (Ci) 1 curie (Ci) 3.7 × 10¹⁰ becquerel (Bq)
Radiation dose
1 rem 0.01 sievert (Sv) 1 sievert (Sv) 100 rem
Temperature
°C = (°F − 32)/1.8 °F = (°C × 1.8) + 32
Introduction and Helpful Information
Nevada National Security Site Environmental Report 2018 11
1.8.12 Less Than (<) Symbol
The “less than” symbol (<) indicates that the measured value is smaller than the number given. For example, <0.09 would indicate that the measured value is less than 0.09. In this report, < is often used in reporting the amounts of nonradiological contaminants in a sample when the measured amounts are less than the analytical
laboratory’s reporting limit for that contaminant in that sample. For example, if a measurement of benzene in sewage lagoon pond water is reported as <0.005 milligrams per liter, this implies that the measured amount of benzene present, if any, was not found to be above this level. For some constituents the notation “ND” is used to indicate that the constituent in question was not detected. For organic constituents in particular, this could mean that the compound could not be clearly identified, the level (if any) was lower than the reporting limit, or (as often happens) both. In (many chapters of) this report measurements of radionuclide concentrations are reported whether or not they are below the usual reporting limit called the minimum detectable concentration.
1.8.13 Negative Radionuclide Concentrations
There is always a small amount of natural radiation in the environment. The instruments used in the laboratory to measure radioactivity in environmental media are sensitive enough to measure the natural, or background, radiation along with any contaminant radiation in a sample. To obtain an unbiased measure of the contaminant level in a sample, the natural, or background, radiation level must be subtracted from the total amount of radioactivity measured by an instrument. Because of the randomness of radioactive emissions and the very low concentrations of some contaminants, it is possible to obtain a background measurement that is larger than the actual contaminant measurement. When the larger background measurement is subtracted from the smaller contaminant measurement, a negative result is generated. Negative results are reported because they are useful
when conducting statistical evaluations of the data.
1.9 References
Arizona Department of Administration, 2019. July 1, 2018 Population Estimates for Arizona’s Counties, Incorporated Places and Unincorporated Balance of Counties. Office of Economic Opportunity. Available at https://population.az.gov/sites/default/files/documents/files/pop-estimates2018-04pla.pdf, as
accessed on June 10, 2019.
International Commission on Radiological Protection (ICRP), 2008. Nuclear Decay Data for Dosimetric Calculations. ICRP Publication 107. Ann. ICRP 38 (3).
Nevada State Demographer’s Office, 2019. Governor Certified Population Estimates of Nevada’s Counties, Cities, and Towns 2000 to 2018. Nevada State Demographer, Nevada Department of Taxation. Available at: https://tax.nv.gov/uploadedFiles/taxnvgov/Content/TaxLibrary/Certified-Population-Nevada-Counties-Incorp-Cities-Unincorporated-Towns-2018.pdf, as accessed on June 10, 2019.
U.S. Census Bureau, 2019. State & County QuickFacts. U.S. Department of Commerce. Available at:
https://www.census.gov/quickfacts/fact/table/cedarcitycityutah,stgeorgecityutah,US/PST045218, as accessed on June 10, 2019.
U.S. Department of Energy, National Nuclear Security Administration Nevada Field Office, 2015. United States Nuclear Tests, July 1945 through September 1992. DOE/NV--209, Rev. 16, Las Vegas, NV. Available at: http://www.nnss.gov/docs/docs_LibraryPublications/DOE_NV-209_Rev16.pdf, as accessed on May 8, 2017.
Introduction and Helpful Information
12 Nevada National Security Site Environmental Report 2018
THIS PAGE INTENTIONALLY LEFT BLANK

Compliance Summary
Nevada National Security Site Environmental Report 2018 13
2.0 Ch2
Chapter 2: Compliance Summary
Troy S. Belka, John Wong, Louis B. Gregory, Delane P. Fitzpatrick-Maul, Andrea L. Gile,
Kevin E. Olsen, Nikolas J. Taranik, Phyllis M. Radack, Ronald W. Warren, and Patricia R.
Hardesty
Mission Support and Test Services, LLC
Environmental regulations pertinent to operations at the Nevada National Security Site (NNSS), the North Las Vegas Facility (NLVF), and the Remote Sensing Laboratory–Nellis (RSL-Nellis) include federal, state, and local environmental regulations; site-specific permits; and binding interagency agreements. The environmental regulations dictate how the U.S. Department of Energy, National Nuclear Security Administration Nevada Field Office (NNSA/NFO) conducts operations to ensure the protection of the environment and the public. In 2018,
NNSA/NFO operated in compliance with most of the requirements defined in this framework. Instances of noncompliance are reported to regulatory agencies and corrected; they are also reported in this chapter.
As in previous years, radiological air emissions from NNSA/NFO current and past operations were well below the U.S. Environmental Protection Agency (EPA) dose1 limit set for the public, and the U.S. Department of Energy (DOE) dose limits set for the public and for plants and animals on or adjacent to the NNSS. Emissions of non-radiological air pollutants from permitted equipment/facilities at NNSS, NLVF, and RSL-Nellis were within permit limits.
No man-made radionuclides were detected in any of the three state-permitted public water systems (PWSs) on the NNSS. Water samples from the NNSS PWSs met National Primary Drinking Water Standards (health standards) and met all Nevada Secondary Drinking Water Standards (related to taste, odor, and visual aspects).
Required groundwater monitoring at three NNSS wells near the Area 5 Radioactive Waste Management
Complex (RWMC) continued to demonstrate that groundwater quality is not affected by disposal of low-level radioactive waste (LLW), mixed low-level radioactive waste (MLLW), and classified waste that may or may not contain hazardous and/or radioactive constituents. All wastewater discharges at NNSS, NLVF, and RSL-Nellis met site-specific state permit requirements, including those of a National Pollutant Discharge Elimination System
(NPDES) permit issued for groundwater pumping activities at the NLVF.
In 2017, the Nevada Division of Environmental Protection (NDEP) issued a Finding of Alleged Violation and
Order to NNSA/NFO for the receipt and burial of 93 containers of MLLW at the Area 5 RWMC, which had been received from Nuclear Fuel Services in Tennessee but mislabeled. In May 2018, NDEP issued a Final Findings and Draft Settlement Agreement. The Environmental Management (EM) Nevada Program, NDEP, and NNSA/NFO discussed a proposed Supplemental Environmental Project that would be undertaken in lieu of paying a penalty associated with the violation. The proposed Supplemental Environmental Project was sent to NDEP in October 2018 for approval and incorporation into a formal Administrative Settlement Agreement. NDEP signed the agreement in April, 2019.
Twenty-three hazardous substance spills occurred in 2018: 21 at the NNSS, 1 at the NLVF, and 1 at RSL-Nellis. The spills were small-volume releases either to containment areas or to other surfaces. All spills were cleaned up. None of these spills were of sufficient quantities to require reporting to regulatory agencies.
Nine environmental inspections were conducted in 2018 by external regulatory agencies. These inspections included the NNSS hazardous waste (HW) management and disposal facilities, NLVF hazardous waste
management facility, RSL and NNSS underground storage tanks, NNSS solid waste landfills, NLVF air quality, NNSS drinking water and wastewater facilities, and one NNSS facility registered under Nevada’s Chemical Accident Prevention Program. No incidences of regulatory non-compliance were noted during the inspections.
1 The definition of word(s) in bold italics may be found by clicking on the word in electronic version or by referencing the Glossary,
Appendix B. To return from the Glossary, right click and select Previous View.
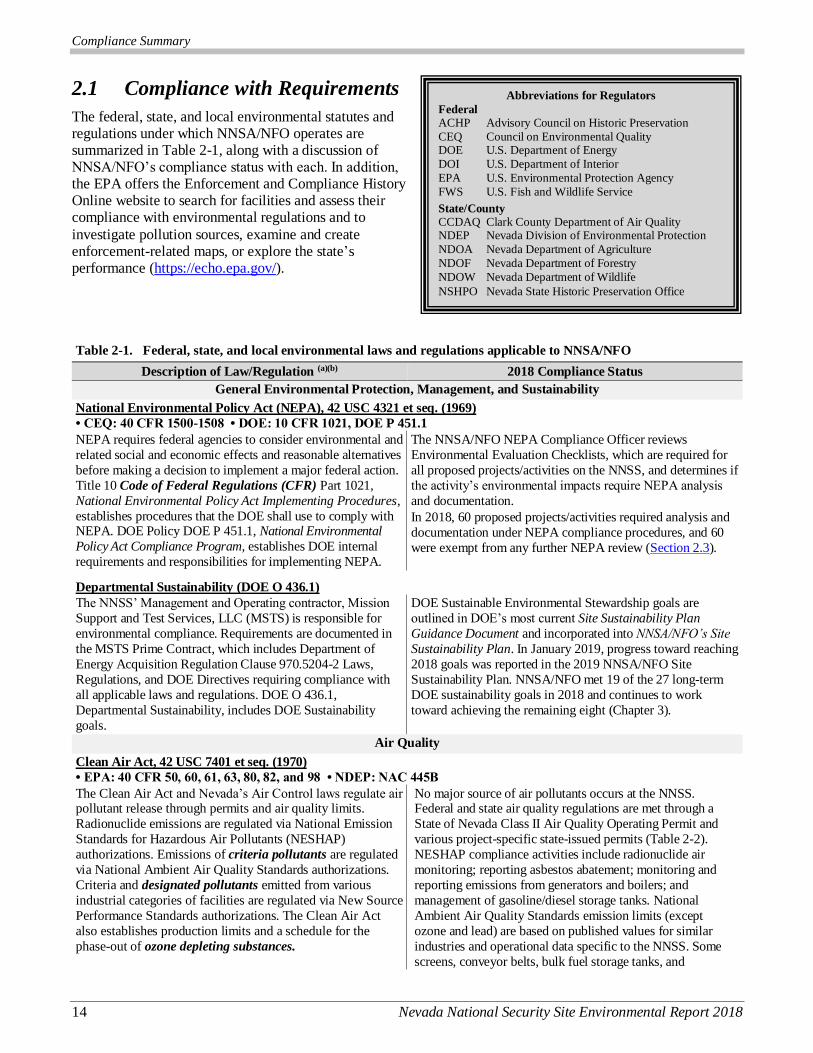
Compliance Summary
14 Nevada National Security Site Environmental Report 2018
2.1 Compliance with Requirements
The federal, state, and local environmental statutes and regulations under which NNSA/NFO operates are summarized in Table 2-1, along with a discussion of NNSA/NFO’s compliance status with each. In addition, the EPA offers the Enforcement and Compliance History Online website to search for facilities and assess their compliance with environmental regulations and to
investigate pollution sources, examine and create enforcement-related maps, or explore the state’s performance (https://echo.epa.gov/).
Table 2-1. Federal, state, and local environmental laws and regulations applicable to NNSA/NFO
Description of Law/Regulation (a)(b) 2018 Compliance Status
General Environmental Protection, Management, and Sustainability
National Environmental Policy Act (NEPA), 42 USC 4321 et seq. (1969)
• CEQ: 40 CFR 1500-1508 • DOE: 10 CFR 1021, DOE P 451.1
NEPA requires federal agencies to consider environmental and
related social and economic effects and reasonable alternatives
before making a decision to implement a major federal action.
Title 10 Code of Federal Regulations (CFR) Part 1021,
National Environmental Policy Act Implementing Procedures,
establishes procedures that the DOE shall use to comply with NEPA. DOE Policy DOE P 451.1, National Environmental
Policy Act Compliance Program, establishes DOE internal
requirements and responsibilities for implementing NEPA.
The NNSA/NFO NEPA Compliance Officer reviews
Environmental Evaluation Checklists, which are required for
all proposed projects/activities on the NNSS, and determines if
the activity’s environmental impacts require NEPA analysis
and documentation.
In 2018, 60 proposed projects/activities required analysis and
documentation under NEPA compliance procedures, and 60
were exempt from any further NEPA review (Section 2.3).
Departmental Sustainability (DOE O 436.1)
The NNSS’ Management and Operating contractor, Mission
Support and Test Services, LLC (MSTS) is responsible for
environmental compliance. Requirements are documented in
the MSTS Prime Contract, which includes Department of
Energy Acquisition Regulation Clause 970.5204-2 Laws,
Regulations, and DOE Directives requiring compliance with
all applicable laws and regulations. DOE O 436.1,
Departmental Sustainability, includes DOE Sustainability
goals.
DOE Sustainable Environmental Stewardship goals are
outlined in DOE’s most current Site Sustainability Plan
Guidance Document and incorporated into NNSA/NFO’s Site
Sustainability Plan. In January 2019, progress toward reaching
2018 goals was reported in the 2019 NNSA/NFO Site
Sustainability Plan. NNSA/NFO met 19 of the 27 long-term
DOE sustainability goals in 2018 and continues to work
toward achieving the remaining eight (Chapter 3).
Air Quality
Clean Air Act, 42 USC 7401 et seq. (1970)
• EPA: 40 CFR 50, 60, 61, 63, 80, 82, and 98 • NDEP: NAC 445B
The Clean Air Act and Nevada’s Air Control laws regulate air pollutant release through permits and air quality limits.
Radionuclide emissions are regulated via National Emission
Standards for Hazardous Air Pollutants (NESHAP)
authorizations. Emissions of criteria pollutants are regulated
via National Ambient Air Quality Standards authorizations.
Criteria and designated pollutants emitted from various
industrial categories of facilities are regulated via New Source
Performance Standards authorizations. The Clean Air Act
also establishes production limits and a schedule for the
phase-out of ozone depleting substances.
No major source of air pollutants occurs at the NNSS. Federal and state air quality regulations are met through a
State of Nevada Class II Air Quality Operating Permit and
various project-specific state-issued permits (Table 2-2).
NESHAP compliance activities include radionuclide air
monitoring; reporting asbestos abatement; monitoring and
reporting emissions from generators and boilers; and
management of gasoline/diesel storage tanks. National
Ambient Air Quality Standards emission limits (except
ozone and lead) are based on published values for similar
industries and operational data specific to the NNSS. Some
screens, conveyor belts, bulk fuel storage tanks, and
Abbreviations for Regulators
Federal
ACHP Advisory Council on Historic Preservation
CEQ Council on Environmental Quality DOE U.S. Department of Energy
DOI U.S. Department of Interior
EPA U.S. Environmental Protection Agency
FWS U.S. Fish and Wildlife Service
State/County
CCDAQ Clark County Department of Air Quality NDEP Nevada Division of Environmental Protection
NDOA Nevada Department of Agriculture
NDOF Nevada Department of Forestry
NDOW Nevada Department of Wildlife
NSHPO Nevada State Historic Preservation Office
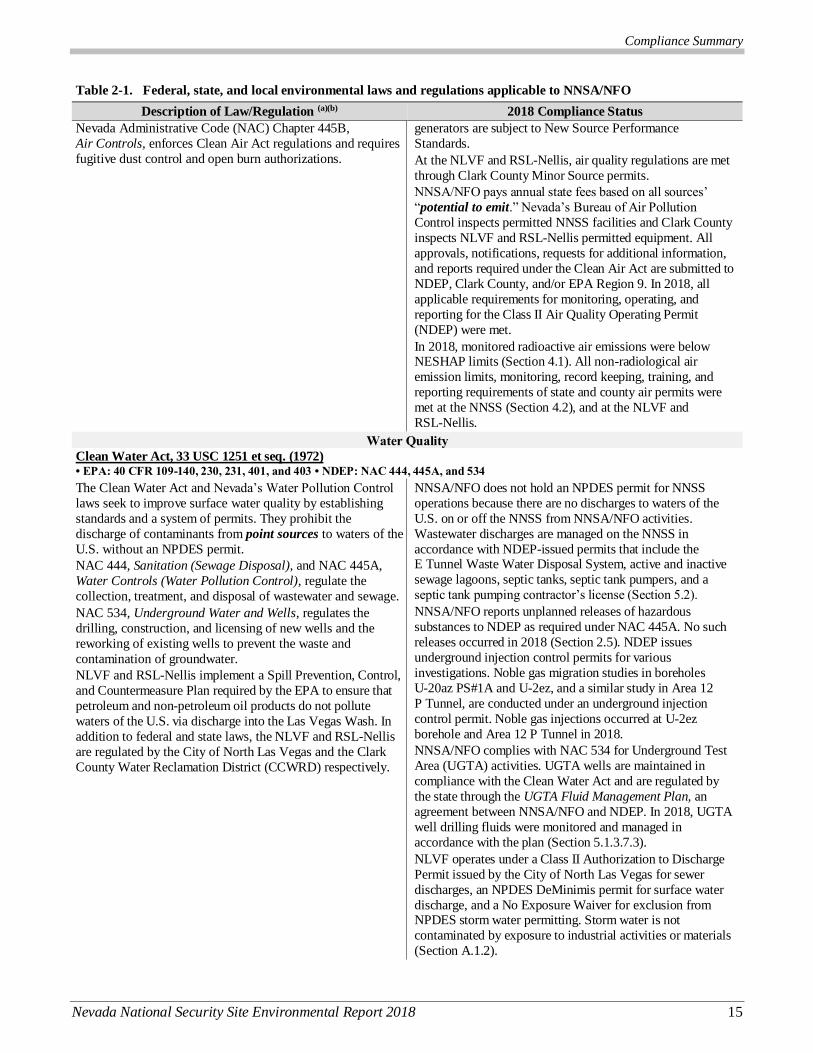
Compliance Summary
Nevada National Security Site Environmental Report 2018 15
Table 2-1. Federal, state, and local environmental laws and regulations applicable to NNSA/NFO
Description of Law/Regulation (a)(b) 2018 Compliance Status
Nevada Administrative Code (NAC) Chapter 445B,
Air Controls, enforces Clean Air Act regulations and requires
fugitive dust control and open burn authorizations.
generators are subject to New Source Performance
Standards.
At the NLVF and RSL-Nellis, air quality regulations are met
through Clark County Minor Source permits.
NNSA/NFO pays annual state fees based on all sources’
“potential to emit.” Nevada’s Bureau of Air Pollution
Control inspects permitted NNSS facilities and Clark County
inspects NLVF and RSL-Nellis permitted equipment. All
approvals, notifications, requests for additional information,
and reports required under the Clean Air Act are submitted to
NDEP, Clark County, and/or EPA Region 9. In 2018, all
applicable requirements for monitoring, operating, and
reporting for the Class II Air Quality Operating Permit
(NDEP) were met.
In 2018, monitored radioactive air emissions were below NESHAP limits (Section 4.1). All non-radiological air
emission limits, monitoring, record keeping, training, and
reporting requirements of state and county air permits were
met at the NNSS (Section 4.2), and at the NLVF and
RSL-Nellis.
Water Quality
Clean Water Act, 33 USC 1251 et seq. (1972) • EPA: 40 CFR 109-140, 230, 231, 401, and 403 • NDEP: NAC 444, 445A, and 534
The Clean Water Act and Nevada’s Water Pollution Control
laws seek to improve surface water quality by establishing
standards and a system of permits. They prohibit the
discharge of contaminants from point sources to waters of the
U.S. without an NPDES permit.
NAC 444, Sanitation (Sewage Disposal), and NAC 445A,
Water Controls (Water Pollution Control), regulate the
collection, treatment, and disposal of wastewater and sewage.
NAC 534, Underground Water and Wells, regulates the
drilling, construction, and licensing of new wells and the
reworking of existing wells to prevent the waste and
contamination of groundwater.
NLVF and RSL-Nellis implement a Spill Prevention, Control,
and Countermeasure Plan required by the EPA to ensure that
petroleum and non-petroleum oil products do not pollute
waters of the U.S. via discharge into the Las Vegas Wash. In
addition to federal and state laws, the NLVF and RSL-Nellis
are regulated by the City of North Las Vegas and the Clark
County Water Reclamation District (CCWRD) respectively.
NNSA/NFO does not hold an NPDES permit for NNSS
operations because there are no discharges to waters of the
U.S. on or off the NNSS from NNSA/NFO activities.
Wastewater discharges are managed on the NNSS in
accordance with NDEP-issued permits that include the E Tunnel Waste Water Disposal System, active and inactive
sewage lagoons, septic tanks, septic tank pumpers, and a
septic tank pumping contractor’s license (Section 5.2).
NNSA/NFO reports unplanned releases of hazardous
substances to NDEP as required under NAC 445A. No such
releases occurred in 2018 (Section 2.5). NDEP issues
underground injection control permits for various
investigations. Noble gas migration studies in boreholes
U-20az PS#1A and U-2ez, and a similar study in Area 12
P Tunnel, are conducted under an underground injection
control permit. Noble gas injections occurred at U-2ez
borehole and Area 12 P Tunnel in 2018.
NNSA/NFO complies with NAC 534 for Underground Test
Area (UGTA) activities. UGTA wells are maintained in
compliance with the Clean Water Act and are regulated by
the state through the UGTA Fluid Management Plan, an
agreement between NNSA/NFO and NDEP. In 2018, UGTA
well drilling fluids were monitored and managed in
accordance with the plan (Section 5.1.3.7.3).
NLVF operates under a Class II Authorization to Discharge
Permit issued by the City of North Las Vegas for sewer
discharges, an NPDES DeMinimis permit for surface water
discharge, and a No Exposure Waiver for exclusion from NPDES storm water permitting. Storm water is not
contaminated by exposure to industrial activities or materials
(Section A.1.2).
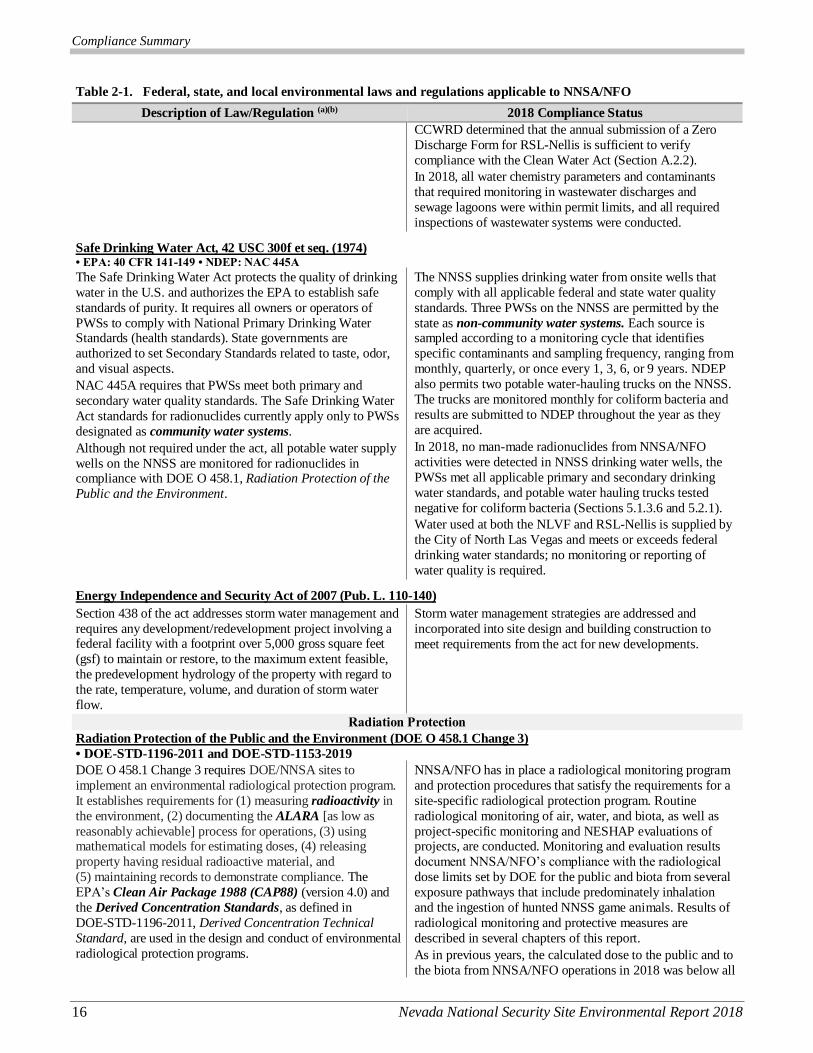
Compliance Summary
16 Nevada National Security Site Environmental Report 2018
Table 2-1. Federal, state, and local environmental laws and regulations applicable to NNSA/NFO
Description of Law/Regulation (a)(b) 2018 Compliance Status
CCWRD determined that the annual submission of a Zero
Discharge Form for RSL-Nellis is sufficient to verify
compliance with the Clean Water Act (Section A.2.2).
In 2018, all water chemistry parameters and contaminants
that required monitoring in wastewater discharges and
sewage lagoons were within permit limits, and all required
inspections of wastewater systems were conducted.
Safe Drinking Water Act, 42 USC 300f et seq. (1974) • EPA: 40 CFR 141-149 • NDEP: NAC 445A
The Safe Drinking Water Act protects the quality of drinking
water in the U.S. and authorizes the EPA to establish safe
standards of purity. It requires all owners or operators of
PWSs to comply with National Primary Drinking Water Standards (health standards). State governments are
authorized to set Secondary Standards related to taste, odor,
and visual aspects.
NAC 445A requires that PWSs meet both primary and
secondary water quality standards. The Safe Drinking Water
Act standards for radionuclides currently apply only to PWSs
designated as community water systems.
Although not required under the act, all potable water supply
wells on the NNSS are monitored for radionuclides in compliance with DOE O 458.1, Radiation Protection of the
Public and the Environment.
The NNSS supplies drinking water from onsite wells that
comply with all applicable federal and state water quality
standards. Three PWSs on the NNSS are permitted by the
state as non-community water systems. Each source is sampled according to a monitoring cycle that identifies
specific contaminants and sampling frequency, ranging from
monthly, quarterly, or once every 1, 3, 6, or 9 years. NDEP
also permits two potable water-hauling trucks on the NNSS.
The trucks are monitored monthly for coliform bacteria and
results are submitted to NDEP throughout the year as they
are acquired.
In 2018, no man-made radionuclides from NNSA/NFO
activities were detected in NNSS drinking water wells, the
PWSs met all applicable primary and secondary drinking
water standards, and potable water hauling trucks tested
negative for coliform bacteria (Sections 5.1.3.6 and 5.2.1).
Water used at both the NLVF and RSL-Nellis is supplied by
the City of North Las Vegas and meets or exceeds federal
drinking water standards; no monitoring or reporting of
water quality is required.
Energy Independence and Security Act of 2007 (Pub. L. 110-140)
Section 438 of the act addresses storm water management and
requires any development/redevelopment project involving a federal facility with a footprint over 5,000 gross square feet
(gsf) to maintain or restore, to the maximum extent feasible,
the predevelopment hydrology of the property with regard to
the rate, temperature, volume, and duration of storm water
flow.
Storm water management strategies are addressed and
incorporated into site design and building construction to
meet requirements from the act for new developments.
Radiation Protection
Radiation Protection of the Public and the Environment (DOE O 458.1 Change 3)
• DOE-STD-1196-2011 and DOE-STD-1153-2019
DOE O 458.1 Change 3 requires DOE/NNSA sites to
implement an environmental radiological protection program.
It establishes requirements for (1) measuring radioactivity in
the environment, (2) documenting the ALARA [as low as
reasonably achievable] process for operations, (3) using mathematical models for estimating doses, (4) releasing
property having residual radioactive material, and
(5) maintaining records to demonstrate compliance. The
EPA’s Clean Air Package 1988 (CAP88) (version 4.0) and
the Derived Concentration Standards, as defined in
DOE-STD-1196-2011, Derived Concentration Technical
Standard, are used in the design and conduct of environmental
radiological protection programs.
NNSA/NFO has in place a radiological monitoring program
and protection procedures that satisfy the requirements for a
site-specific radiological protection program. Routine
radiological monitoring of air, water, and biota, as well as
project-specific monitoring and NESHAP evaluations of projects, are conducted. Monitoring and evaluation results
document NNSA/NFO’s compliance with the radiological
dose limits set by DOE for the public and biota from several
exposure pathways that include predominately inhalation
and the ingestion of hunted NNSS game animals. Results of
radiological monitoring and protective measures are
described in several chapters of this report.
As in previous years, the calculated dose to the public and to
the biota from NNSA/NFO operations in 2018 was below all
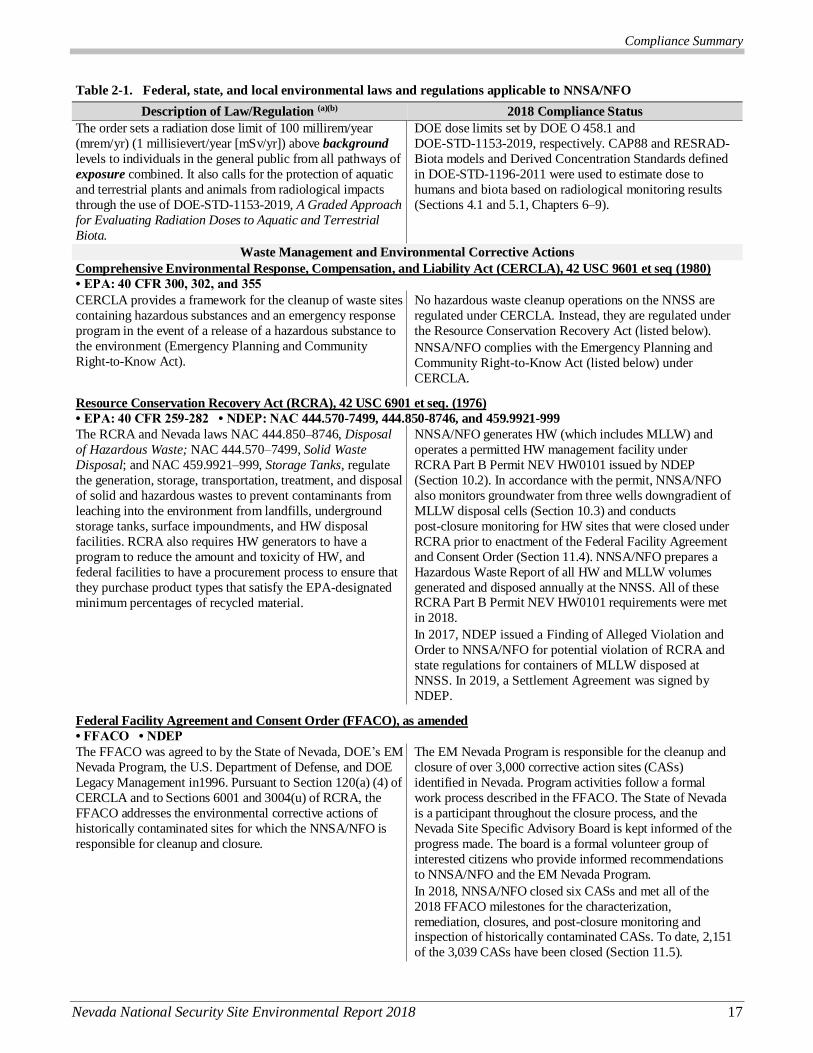
Compliance Summary
Nevada National Security Site Environmental Report 2018 17
Table 2-1. Federal, state, and local environmental laws and regulations applicable to NNSA/NFO
Description of Law/Regulation (a)(b) 2018 Compliance Status
The order sets a radiation dose limit of 100 millirem/year
(mrem/yr) (1 millisievert/year [mSv/yr]) above background
levels to individuals in the general public from all pathways of
exposure combined. It also calls for the protection of aquatic
and terrestrial plants and animals from radiological impacts
through the use of DOE-STD-1153-2019, A Graded Approach
for Evaluating Radiation Doses to Aquatic and Terrestrial
Biota.
DOE dose limits set by DOE O 458.1 and
DOE-STD-1153-2019, respectively. CAP88 and RESRAD-
Biota models and Derived Concentration Standards defined
in DOE-STD-1196-2011 were used to estimate dose to
humans and biota based on radiological monitoring results
(Sections 4.1 and 5.1, Chapters 6–9).
Waste Management and Environmental Corrective Actions
Comprehensive Environmental Response, Compensation, and Liability Act (CERCLA), 42 USC 9601 et seq (1980)
• EPA: 40 CFR 300, 302, and 355
CERCLA provides a framework for the cleanup of waste sites
containing hazardous substances and an emergency response
program in the event of a release of a hazardous substance to
the environment (Emergency Planning and Community
Right-to-Know Act).
No hazardous waste cleanup operations on the NNSS are
regulated under CERCLA. Instead, they are regulated under
the Resource Conservation Recovery Act (listed below).
NNSA/NFO complies with the Emergency Planning and
Community Right-to-Know Act (listed below) under
CERCLA.
Resource Conservation Recovery Act (RCRA), 42 USC 6901 et seq. (1976)
• EPA: 40 CFR 259-282 • NDEP: NAC 444.570-7499, 444.850-8746, and 459.9921-999
The RCRA and Nevada laws NAC 444.850–8746, Disposal
of Hazardous Waste; NAC 444.570–7499, Solid Waste
Disposal; and NAC 459.9921–999, Storage Tanks, regulate
the generation, storage, transportation, treatment, and disposal
of solid and hazardous wastes to prevent contaminants from
leaching into the environment from landfills, underground
storage tanks, surface impoundments, and HW disposal
facilities. RCRA also requires HW generators to have a
program to reduce the amount and toxicity of HW, and
federal facilities to have a procurement process to ensure that
they purchase product types that satisfy the EPA-designated
minimum percentages of recycled material.
NNSA/NFO generates HW (which includes MLLW) and
operates a permitted HW management facility under
RCRA Part B Permit NEV HW0101 issued by NDEP
(Section 10.2). In accordance with the permit, NNSA/NFO
also monitors groundwater from three wells downgradient of
MLLW disposal cells (Section 10.3) and conducts
post-closure monitoring for HW sites that were closed under
RCRA prior to enactment of the Federal Facility Agreement
and Consent Order (Section 11.4). NNSA/NFO prepares a
Hazardous Waste Report of all HW and MLLW volumes
generated and disposed annually at the NNSS. All of these RCRA Part B Permit NEV HW0101 requirements were met
in 2018.
In 2017, NDEP issued a Finding of Alleged Violation and
Order to NNSA/NFO for potential violation of RCRA and
state regulations for containers of MLLW disposed at
NNSS. In 2019, a Settlement Agreement was signed by
NDEP.
Federal Facility Agreement and Consent Order (FFACO), as amended
• FFACO • NDEP
The FFACO was agreed to by the State of Nevada, DOE’s EM
Nevada Program, the U.S. Department of Defense, and DOE
Legacy Management in1996. Pursuant to Section 120(a) (4) of
CERCLA and to Sections 6001 and 3004(u) of RCRA, the
FFACO addresses the environmental corrective actions of
historically contaminated sites for which the NNSA/NFO is
responsible for cleanup and closure.
The EM Nevada Program is responsible for the cleanup and
closure of over 3,000 corrective action sites (CASs)
identified in Nevada. Program activities follow a formal
work process described in the FFACO. The State of Nevada
is a participant throughout the closure process, and the
Nevada Site Specific Advisory Board is kept informed of the
progress made. The board is a formal volunteer group of
interested citizens who provide informed recommendations
to NNSA/NFO and the EM Nevada Program.
In 2018, NNSA/NFO closed six CASs and met all of the
2018 FFACO milestones for the characterization,
remediation, closures, and post-closure monitoring and inspection of historically contaminated CASs. To date, 2,151
of the 3,039 CASs have been closed (Section 11.5).

Compliance Summary
18 Nevada National Security Site Environmental Report 2018
Table 2-1. Federal, state, and local environmental laws and regulations applicable to NNSA/NFO
Description of Law/Regulation (a)(b) 2018 Compliance Status
Radioactive Waste Management (DOE O 435.1, Change 1)
• DOE M 435.1-1, Change 2
DOE O 435.1, Change 1 requires all DOE radioactive waste
be managed in a manner that is protective of the worker, public health and safety, and the environment. It directs how
radioactive waste management operations are conducted on
the NNSS.
DOE M 435.1-1, Change 2, Radioactive Waste Management
Manual, specifies that operations at radioactive waste
management facilities must not contribute a dose to the
general public in excess of 10 mrem/yr through the air
pathway and 25 mrem/yr through all exposure pathways.
The Area 3 and Area 5 Radioactive Waste Management Sites
(RWMSs) operate as Category II Non-Reactor Nuclear Facilities. Both are designed and operated to manage and
safely dispose of LLW, MLLW, classified non-radioactive
waste, and classified non-radioactive hazardous waste
generated by NNSA/NFO, other DOE and selected U.S.
Department of Defense operations, and to manage and safely
store transuranic and mixed transuranic wastes generated on
the NNSS for eventual shipment to the Waste Isolation Pilot
Plant in New Mexico.
In accordance with this order, Performance Assessments and
Composite Analyses for both RWMSs are reviewed annually
to assess their adequacy, and results are submitted annually
to the DOE Office of Environmental Management. The
Disposal Authorization Statements for both RWMSs also require annual reviews to track secondary or minor
unresolved issues to resolution. Waste Acceptance Criteria
for wastes disposed at the RWMSs are maintained and the
volumes are tracked. Although not required by this DOE
order, vadose zone monitoring at both RWMSs is performed
to validate the performance assessment criteria of the
RWMSs.
In 2018, all key documents and analyses were current and all
required management practices were followed (Section 10.1).
The radiological dose to the public in 2018 from the Area 3
and 5 RWMSs from all pathways was negligible (Section
10.1.9).
Hazardous Materials Control and Management
Emergency Planning and Community Right-to-Know Act (EPCRA), 42 USC 11001 et seq. (1986)
• EPA: 40 CFR 300, 302, 355, 370, and 372
EPCRA requires that federal, state, and local emergency
planning authorities be provided information regarding the
presence and storage of hazardous substances and their
planned and unplanned environmental releases, including
provisions and plans for responding to emergency situations
involving hazardous materials. EPCRA identifies the
threshold quantities of chemicals released or stored, which
trigger the reporting of this information to these authorities.
Some NNSA/NFO facilities store or use chemicals in
quantities exceeding threshold quantities under EPCRA.
NNSA/NFO complies with all reporting and emergency
planning requirements under EPCRA and with the
requirements of several state-issued hazardous materials
permits: a site-wide NNSS permit, one for the
Nonproliferation Test and Evaluation Complex (NPTEC) on
the NNSS, one for NLVF, and one for RSL-Nellis.
In 2018, NNSA/NFO adhered to all EPCRA reporting
requirements (Section 2.4.4.1). The Nevada Combined
Agency Report, containing updated chemical inventories for
NNSA/NFO facilities, was submitted to the State Fire
Marshal, and a Toxic Release Inventory Report was
submitted to EPA identifying the types and quantities of
toxic chemicals that were either released by NNSA/NFO
operations into the environment or released for disposal or
recycling. Toxic chemicals released from the NNSS in 2018
included lead, mercury, nitromethane, polychlorinated
biphenyls (PCBs), and polycyclic aromatic hydrocarbons
(PACs) (Section 2.4.4.1). No releases at NLVF or
RSL-Nellis exceeded reportable thresholds in 2018
(Sections A.1.5 and A.2.4).
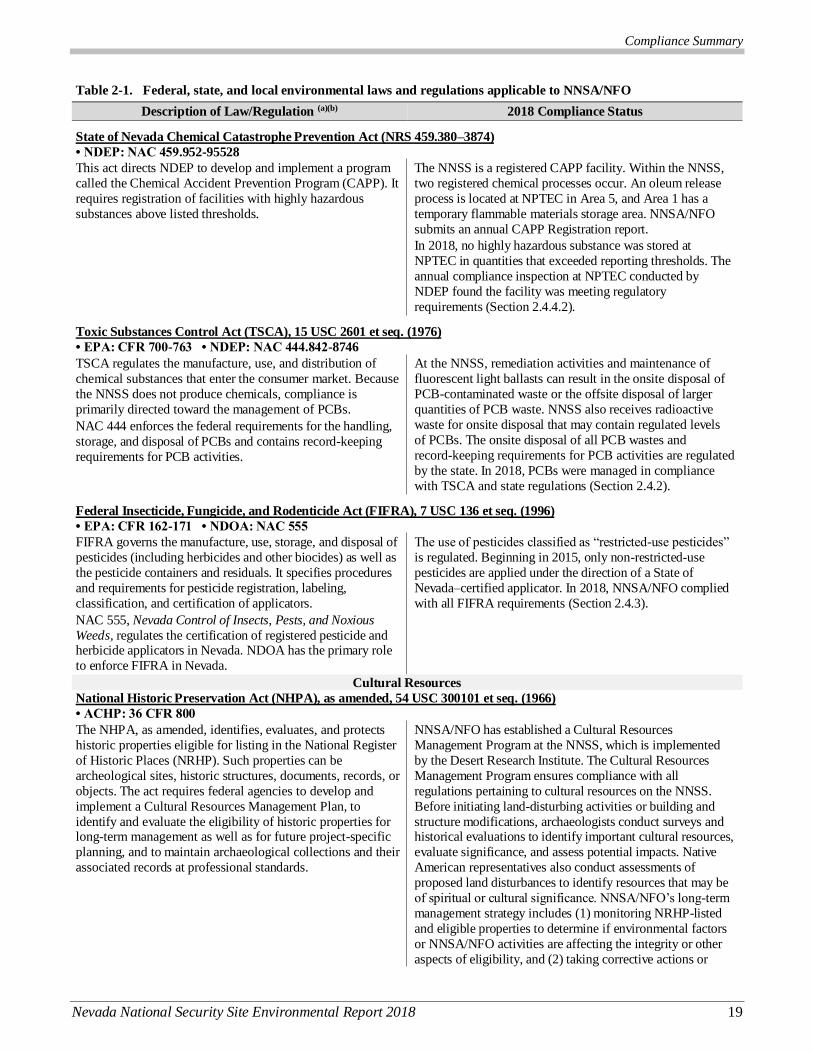
Compliance Summary
Nevada National Security Site Environmental Report 2018 19
Table 2-1. Federal, state, and local environmental laws and regulations applicable to NNSA/NFO
Description of Law/Regulation (a)(b) 2018 Compliance Status
State of Nevada Chemical Catastrophe Prevention Act (NRS 459.380–3874)
• NDEP: NAC 459.952-95528
This act directs NDEP to develop and implement a program
called the Chemical Accident Prevention Program (CAPP). It
requires registration of facilities with highly hazardous
substances above listed thresholds.
The NNSS is a registered CAPP facility. Within the NNSS,
two registered chemical processes occur. An oleum release
process is located at NPTEC in Area 5, and Area 1 has a
temporary flammable materials storage area. NNSA/NFO
submits an annual CAPP Registration report.
In 2018, no highly hazardous substance was stored at
NPTEC in quantities that exceeded reporting thresholds. The
annual compliance inspection at NPTEC conducted by
NDEP found the facility was meeting regulatory
requirements (Section 2.4.4.2).
Toxic Substances Control Act (TSCA), 15 USC 2601 et seq. (1976)
• EPA: CFR 700-763 • NDEP: NAC 444.842-8746
TSCA regulates the manufacture, use, and distribution of
chemical substances that enter the consumer market. Because
the NNSS does not produce chemicals, compliance is
primarily directed toward the management of PCBs.
NAC 444 enforces the federal requirements for the handling,
storage, and disposal of PCBs and contains record-keeping
requirements for PCB activities.
At the NNSS, remediation activities and maintenance of
fluorescent light ballasts can result in the onsite disposal of
PCB-contaminated waste or the offsite disposal of larger
quantities of PCB waste. NNSS also receives radioactive
waste for onsite disposal that may contain regulated levels
of PCBs. The onsite disposal of all PCB wastes and
record-keeping requirements for PCB activities are regulated
by the state. In 2018, PCBs were managed in compliance
with TSCA and state regulations (Section 2.4.2).
Federal Insecticide, Fungicide, and Rodenticide Act (FIFRA), 7 USC 136 et seq. (1996)
• EPA: CFR 162-171 • NDOA: NAC 555
FIFRA governs the manufacture, use, storage, and disposal of
pesticides (including herbicides and other biocides) as well as
the pesticide containers and residuals. It specifies procedures
and requirements for pesticide registration, labeling,
classification, and certification of applicators.
NAC 555, Nevada Control of Insects, Pests, and Noxious
Weeds, regulates the certification of registered pesticide and herbicide applicators in Nevada. NDOA has the primary role
to enforce FIFRA in Nevada.
The use of pesticides classified as “restricted-use pesticides”
is regulated. Beginning in 2015, only non-restricted-use
pesticides are applied under the direction of a State of
Nevada–certified applicator. In 2018, NNSA/NFO complied
with all FIFRA requirements (Section 2.4.3).
Cultural Resources
National Historic Preservation Act (NHPA), as amended, 54 USC 300101 et seq. (1966)
• ACHP: 36 CFR 800
The NHPA, as amended, identifies, evaluates, and protects
historic properties eligible for listing in the National Register
of Historic Places (NRHP). Such properties can be
archeological sites, historic structures, documents, records, or
objects. The act requires federal agencies to develop and
implement a Cultural Resources Management Plan, to
identify and evaluate the eligibility of historic properties for long-term management as well as for future project-specific
planning, and to maintain archaeological collections and their
associated records at professional standards.
NNSA/NFO has established a Cultural Resources
Management Program at the NNSS, which is implemented
by the Desert Research Institute. The Cultural Resources
Management Program ensures compliance with all
regulations pertaining to cultural resources on the NNSS.
Before initiating land-disturbing activities or building and
structure modifications, archaeologists conduct surveys and historical evaluations to identify important cultural resources,
evaluate significance, and assess potential impacts. Native
American representatives also conduct assessments of
proposed land disturbances to identify resources that may be
of spiritual or cultural significance. NNSA/NFO’s long-term
management strategy includes (1) monitoring NRHP-listed
and eligible properties to determine if environmental factors
or NNSA/NFO activities are affecting the integrity or other
aspects of eligibility, and (2) taking corrective actions or
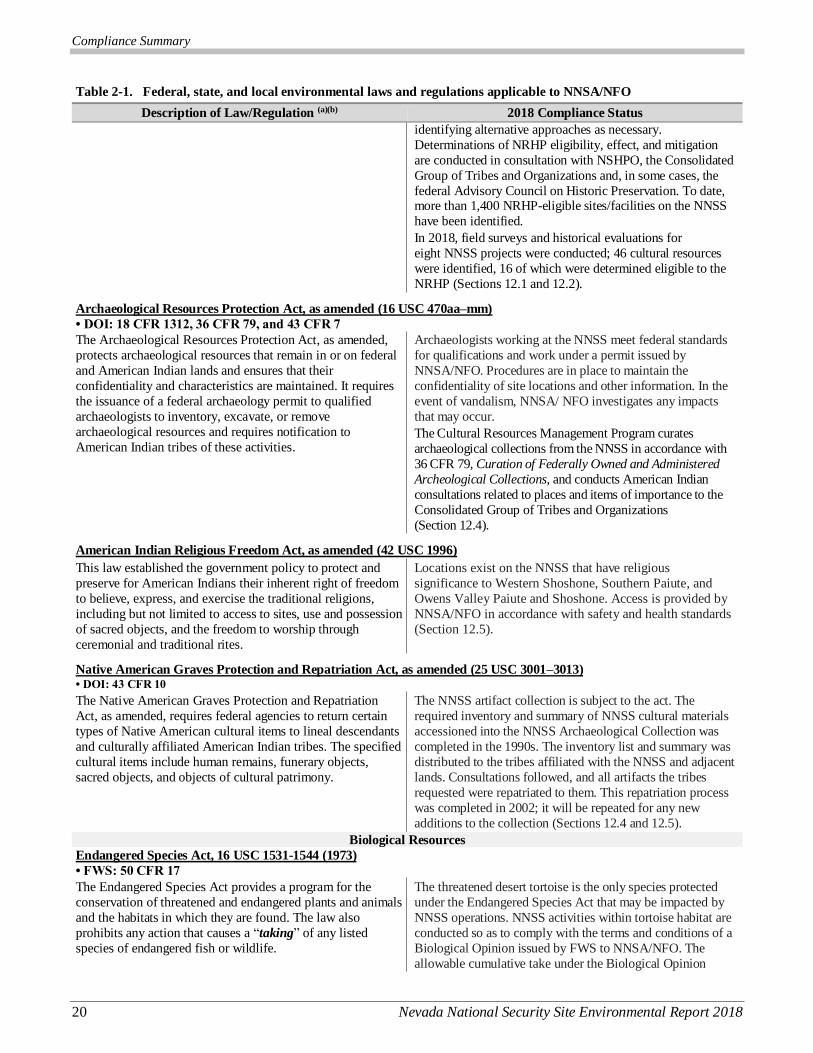
Compliance Summary
20 Nevada National Security Site Environmental Report 2018
Table 2-1. Federal, state, and local environmental laws and regulations applicable to NNSA/NFO
Description of Law/Regulation (a)(b) 2018 Compliance Status
identifying alternative approaches as necessary.
Determinations of NRHP eligibility, effect, and mitigation
are conducted in consultation with NSHPO, the Consolidated
Group of Tribes and Organizations and, in some cases, the
federal Advisory Council on Historic Preservation. To date, more than 1,400 NRHP-eligible sites/facilities on the NNSS
have been identified.
In 2018, field surveys and historical evaluations for
eight NNSS projects were conducted; 46 cultural resources
were identified, 16 of which were determined eligible to the
NRHP (Sections 12.1 and 12.2).
Archaeological Resources Protection Act, as amended (16 USC 470aa–mm)
• DOI: 18 CFR 1312, 36 CFR 79, and 43 CFR 7
The Archaeological Resources Protection Act, as amended,
protects archaeological resources that remain in or on federal
and American Indian lands and ensures that their
confidentiality and characteristics are maintained. It requires
the issuance of a federal archaeology permit to qualified
archaeologists to inventory, excavate, or remove
archaeological resources and requires notification to
American Indian tribes of these activities.
Archaeologists working at the NNSS meet federal standards
for qualifications and work under a permit issued by
NNSA/NFO. Procedures are in place to maintain the
confidentiality of site locations and other information. In the
event of vandalism, NNSA/ NFO investigates any impacts
that may occur.
The Cultural Resources Management Program curates
archaeological collections from the NNSS in accordance with
36 CFR 79, Curation of Federally Owned and Administered
Archeological Collections, and conducts American Indian
consultations related to places and items of importance to the
Consolidated Group of Tribes and Organizations
(Section 12.4).
American Indian Religious Freedom Act, as amended (42 USC 1996)
This law established the government policy to protect and
preserve for American Indians their inherent right of freedom
to believe, express, and exercise the traditional religions,
including but not limited to access to sites, use and possession
of sacred objects, and the freedom to worship through
ceremonial and traditional rites.
Locations exist on the NNSS that have religious
significance to Western Shoshone, Southern Paiute, and
Owens Valley Paiute and Shoshone. Access is provided by
NNSA/NFO in accordance with safety and health standards
(Section 12.5).
Native American Graves Protection and Repatriation Act, as amended (25 USC 3001–3013) • DOI: 43 CFR 10
The Native American Graves Protection and Repatriation
Act, as amended, requires federal agencies to return certain
types of Native American cultural items to lineal descendants
and culturally affiliated American Indian tribes. The specified
cultural items include human remains, funerary objects,
sacred objects, and objects of cultural patrimony.
The NNSS artifact collection is subject to the act. The
required inventory and summary of NNSS cultural materials
accessioned into the NNSS Archaeological Collection was
completed in the 1990s. The inventory list and summary was
distributed to the tribes affiliated with the NNSS and adjacent
lands. Consultations followed, and all artifacts the tribes
requested were repatriated to them. This repatriation process
was completed in 2002; it will be repeated for any new
additions to the collection (Sections 12.4 and 12.5).
Biological Resources
Endangered Species Act, 16 USC 1531-1544 (1973)
• FWS: 50 CFR 17
The Endangered Species Act provides a program for the
conservation of threatened and endangered plants and animals
and the habitats in which they are found. The law also
prohibits any action that causes a “taking” of any listed
species of endangered fish or wildlife.
The threatened desert tortoise is the only species protected
under the Endangered Species Act that may be impacted by
NNSS operations. NNSS activities within tortoise habitat are
conducted so as to comply with the terms and conditions of a
Biological Opinion issued by FWS to NNSA/NFO. The
allowable cumulative take under the Biological Opinion

Compliance Summary
Nevada National Security Site Environmental Report 2018 21
Table 2-1. Federal, state, and local environmental laws and regulations applicable to NNSA/NFO
Description of Law/Regulation (a)(b) 2018 Compliance Status
(2009-2019) is 22 tortoises killed/injured, 194 moved, and
2,710 acres of habitat disturbed. In 2018, cumulative take
totals were 12 killed on roads, 185 moved out of harm’s way,
and 66 acres disturbed. All requirements of the Biological
Opinion were met (Section 13.1).
Nevada Department of Wildlife
• NDOW: NAC 503 •NDOF: NAC 527
NDOW regulations identify protected and unprotected Nevada
animal species and prohibits the harm of protected species
without special permit. NAC 503, Hunting, Fishing and
Trapping; Miscellaneous Protective Measures, also identifies
game animals, which are managed by the state. Nevada
Department of Forestry (NDOF) regulations prohibits removal
or destruction of state protected plants without special permit.
Other state-managed and state-protected species are
monitored under the Ecological Monitoring and Compliance
(EMAC) Program. Some species are collected for ecological
studies under an NDOW scientific collection permit. In 2018,
monitoring of raptors, wild horses, and mule deer was
conducted. NNSS biologists assisted other agency biologists
with desert bighorn and mountain lion studies on and near the
NNSS (Section 13.3).
Migratory Bird Treaty Act (MBTA), 16 USC 703-712 (1918)
• FWS: 50 CFR 21 •NDOW: NRS 503.050
The MBTA implements various treaties and conventions
between the U.S. and Canada, Japan, Mexico, and the former
Soviet Union for the protection of migratory birds. It
prohibits the purposeful harming of any migratory bird, their
nest, or eggs without authorization by the Secretary of the
Interior. Memorandum M-37050 issued December 22, 2017
by the U.S. Department of the Interior, Office of the Solicitor,
ruled that the incidental harm to migratory birds from
otherwise legal activities do not violate this act.
Nevada wildlife laws protect birds included under the MBTA
from purposeful harm.
Although not required under the MBTA, the EMAC Program
reviews construction and demolition projects and conducts
field surveys to reduce any incidental harm to migratory birds
and their nests/eggs. Biologists periodically collect game birds
for radiological analysis under an FWS-issued migratory bird
scientific collection permit.
Migratory birds found injured or dead are reported to
regulators. Biologists transfer injured raptors, upon direction
from the FWS, to a licensed rehabilitator, and mitigation
measures to reduce accidental mortalities are pursued. In 2018,
12 migratory birds were found dead; 10 of the deaths were due to human activities (e.g., electrocution on power lines)
(Section 13.3).
Responsibilities of Federal Agencies to Protect Migratory Birds
• E.O. 13186
This E.O. directs federal agencies to take certain actions to
further implement the MBTA if agencies have, or are likely to
have, a measurable negative effect on migratory bird
populations. It also directs federal agencies to conduct
actions, as practicable, to benefit the health of migratory bird
populations.
The Power Group installed bird guards, protective covers, and
other retrofits on power poles to reduce avian mortality.
Biologists finalized an Avian Protection Plan in cooperation
with the FWS. The focus of the plan is to reduce operational
and avian risks from avian interactions with electric
transmission and distribution lines on the NNSS as well as
other non-electric sources of mortality (e.g., vehicle collisions,
habitat disturbance) (Section 13.3).
The Bald and Golden Eagle Protection Act, 16 USC 668a-d, 703-712
• FWS: 50 CFR 22 •NDOW: NRS 503.050
The Bald and Golden Eagle Protection Act prohibits any form
of possession or taking of both bald and golden eagles.
Eagles are also protected under Nevada wildlife laws.
Compliance with the act is documented under the EMAC
Program. Eagles that are occasionally electrocuted on NNSS
powerlines are transferred to the FWS under an FWS special
purpose possession permit. Four golden eagles and three
other birds were electrocuted in 2018 (Section 13.3).
Wild Free-Roaming Horses and Burros Act (Pub. L. 92–195)
This act makes it unlawful to harm wild horses and burros. It
directs the U.S. Bureau of Land Management (BLM) and the
U.S. Forest Service to protect, manage, and control wild
horses and burros on lands administered by BLM and the
The NNSS is not within a BLM active herd management
area. A Five-Party Cooperative Agreement exists, however,
between NNSA/NFO, the Nevada Test and Training Range
(NTTR), FWS, BLM, and the State of Nevada, which calls for
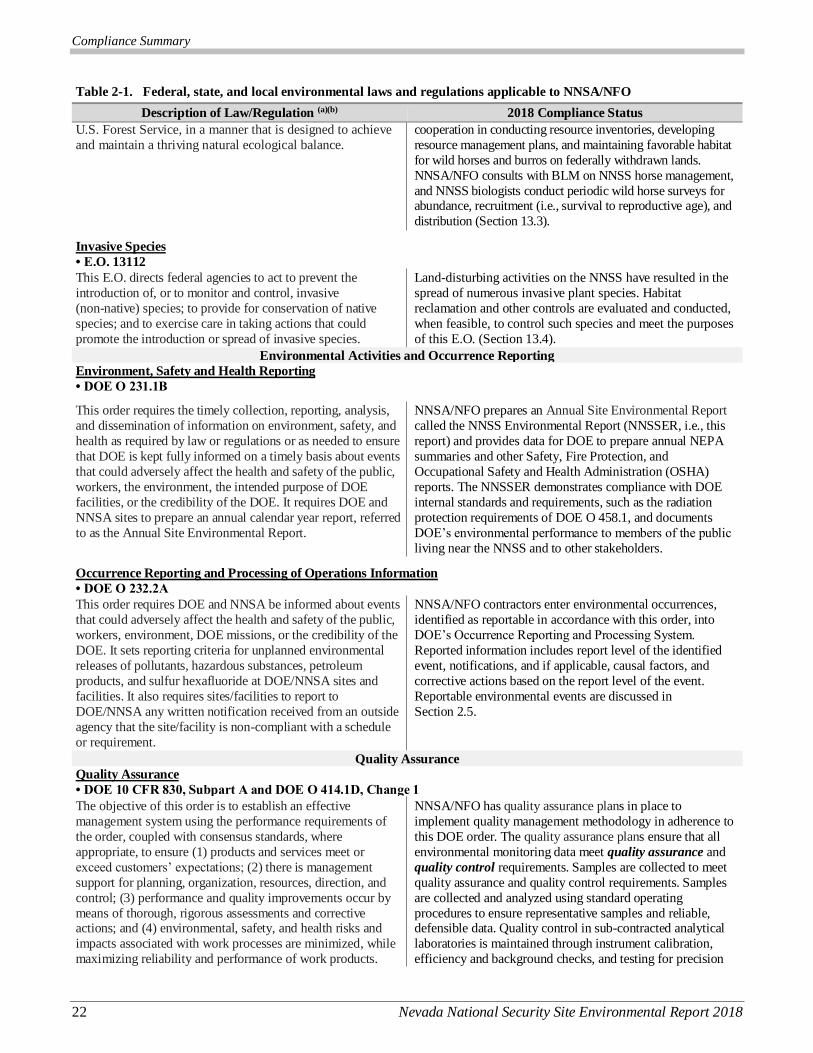
Compliance Summary
22 Nevada National Security Site Environmental Report 2018
Table 2-1. Federal, state, and local environmental laws and regulations applicable to NNSA/NFO
Description of Law/Regulation (a)(b) 2018 Compliance Status
U.S. Forest Service, in a manner that is designed to achieve
and maintain a thriving natural ecological balance.
cooperation in conducting resource inventories, developing
resource management plans, and maintaining favorable habitat
for wild horses and burros on federally withdrawn lands.
NNSA/NFO consults with BLM on NNSS horse management,
and NNSS biologists conduct periodic wild horse surveys for abundance, recruitment (i.e., survival to reproductive age), and
distribution (Section 13.3).
Invasive Species
• E.O. 13112
This E.O. directs federal agencies to act to prevent the
introduction of, or to monitor and control, invasive
(non-native) species; to provide for conservation of native
species; and to exercise care in taking actions that could
promote the introduction or spread of invasive species.
Land-disturbing activities on the NNSS have resulted in the
spread of numerous invasive plant species. Habitat
reclamation and other controls are evaluated and conducted,
when feasible, to control such species and meet the purposes
of this E.O. (Section 13.4).
Environmental Activities and Occurrence Reporting
Environment, Safety and Health Reporting
• DOE O 231.1B
This order requires the timely collection, reporting, analysis,
and dissemination of information on environment, safety, and
health as required by law or regulations or as needed to ensure
that DOE is kept fully informed on a timely basis about events
that could adversely affect the health and safety of the public,
workers, the environment, the intended purpose of DOE
facilities, or the credibility of the DOE. It requires DOE and
NNSA sites to prepare an annual calendar year report, referred
to as the Annual Site Environmental Report.
NNSA/NFO prepares an Annual Site Environmental Report
called the NNSS Environmental Report (NNSSER, i.e., this
report) and provides data for DOE to prepare annual NEPA
summaries and other Safety, Fire Protection, and
Occupational Safety and Health Administration (OSHA)
reports. The NNSSER demonstrates compliance with DOE
internal standards and requirements, such as the radiation
protection requirements of DOE O 458.1, and documents
DOE’s environmental performance to members of the public
living near the NNSS and to other stakeholders.
Occurrence Reporting and Processing of Operations Information
• DOE O 232.2A
This order requires DOE and NNSA be informed about events
that could adversely affect the health and safety of the public,
workers, environment, DOE missions, or the credibility of the
DOE. It sets reporting criteria for unplanned environmental
releases of pollutants, hazardous substances, petroleum
products, and sulfur hexafluoride at DOE/NNSA sites and
facilities. It also requires sites/facilities to report to
DOE/NNSA any written notification received from an outside
agency that the site/facility is non-compliant with a schedule
or requirement.
NNSA/NFO contractors enter environmental occurrences,
identified as reportable in accordance with this order, into
DOE’s Occurrence Reporting and Processing System.
Reported information includes report level of the identified
event, notifications, and if applicable, causal factors, and
corrective actions based on the report level of the event.
Reportable environmental events are discussed in
Section 2.5.
Quality Assurance
Quality Assurance
• DOE 10 CFR 830, Subpart A and DOE O 414.1D, Change 1
The objective of this order is to establish an effective
management system using the performance requirements of
the order, coupled with consensus standards, where
appropriate, to ensure (1) products and services meet or
exceed customers’ expectations; (2) there is management
support for planning, organization, resources, direction, and
control; (3) performance and quality improvements occur by
means of thorough, rigorous assessments and corrective actions; and (4) environmental, safety, and health risks and
impacts associated with work processes are minimized, while
maximizing reliability and performance of work products.
NNSA/NFO has quality assurance plans in place to
implement quality management methodology in adherence to
this DOE order. The quality assurance plans ensure that all
environmental monitoring data meet quality assurance and
quality control requirements. Samples are collected to meet
quality assurance and quality control requirements. Samples
are collected and analyzed using standard operating
procedures to ensure representative samples and reliable, defensible data. Quality control in sub-contracted analytical
laboratories is maintained through instrument calibration,
efficiency and background checks, and testing for precision
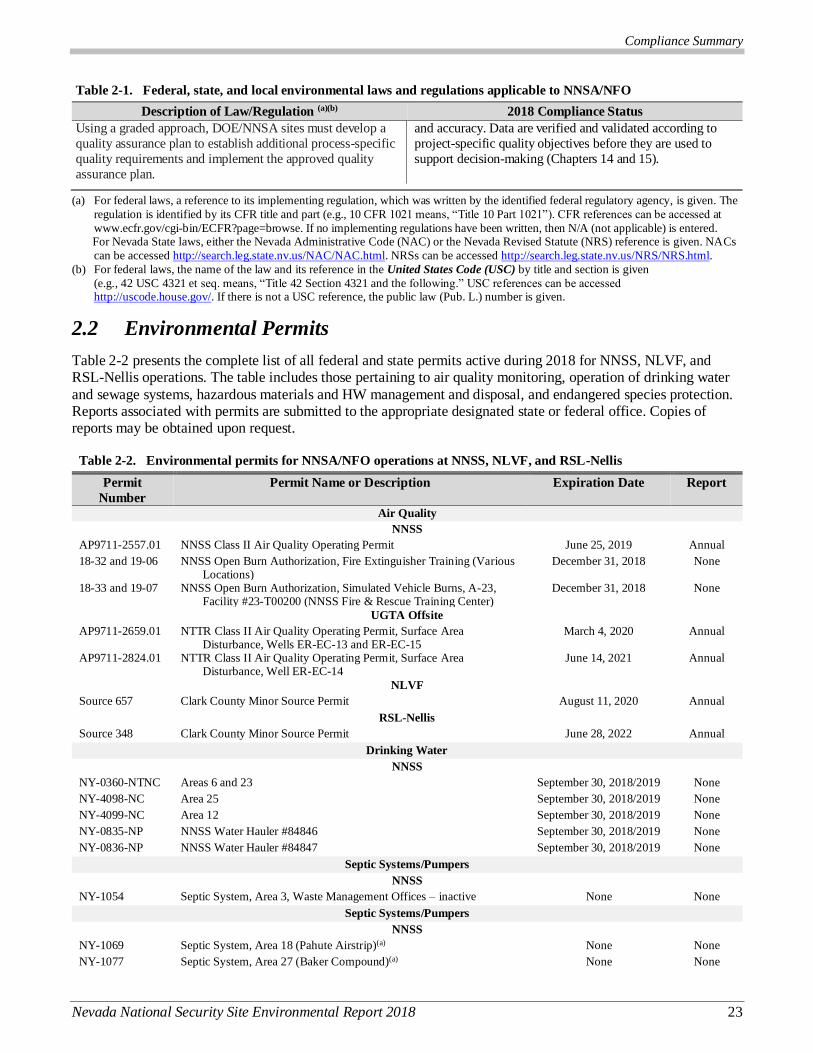
Compliance Summary
Nevada National Security Site Environmental Report 2018 23
Table 2-1. Federal, state, and local environmental laws and regulations applicable to NNSA/NFO
Description of Law/Regulation (a)(b) 2018 Compliance Status
Using a graded approach, DOE/NNSA sites must develop a
quality assurance plan to establish additional process-specific
quality requirements and implement the approved quality
assurance plan.
and accuracy. Data are verified and validated according to
project-specific quality objectives before they are used to
support decision-making (Chapters 14 and 15).
(a) For federal laws, a reference to its implementing regulation, which was written by the identified federal regulatory agency, is given. The
regulation is identified by its CFR title and part (e.g., 10 CFR 1021 means, “Title 10 Part 1021”). CFR references can be accessed at
www.ecfr.gov/cgi-bin/ECFR?page=browse. If no implementing regulations have been written, then N/A (not applicable) is entered. For Nevada State laws, either the Nevada Administrative Code (NAC) or the Nevada Revised Statute (NRS) reference is given. NACs
can be accessed http://search.leg.state.nv.us/NAC/NAC.html. NRSs can be accessed http://search.leg.state.nv.us/NRS/NRS.html.
(b) For federal laws, the name of the law and its reference in the United States Code (USC) by title and section is given
(e.g., 42 USC 4321 et seq. means, “Title 42 Section 4321 and the following.” USC references can be accessed http://uscode.house.gov/. If there is not a USC reference, the public law (Pub. L.) number is given.
2.2 Environmental Permits
Table 2-2 presents the complete list of all federal and state permits active during 2018 for NNSS, NLVF, and RSL-Nellis operations. The table includes those pertaining to air quality monitoring, operation of drinking water
and sewage systems, hazardous materials and HW management and disposal, and endangered species protection. Reports associated with permits are submitted to the appropriate designated state or federal office. Copies of reports may be obtained upon request.
Table 2-2. Environmental permits for NNSA/NFO operations at NNSS, NLVF, and RSL-Nellis
Permit
Number
Permit Name or Description Expiration Date Report
Air Quality
NNSS
AP9711-2557.01 NNSS Class II Air Quality Operating Permit June 25, 2019 Annual
18-32 and 19-06 NNSS Open Burn Authorization, Fire Extinguisher Training (Various Locations)
December 31, 2018 None
18-33 and 19-07 NNSS Open Burn Authorization, Simulated Vehicle Burns, A-23, Facility #23-T00200 (NNSS Fire & Rescue Training Center)
December 31, 2018 None
UGTA Offsite
AP9711-2659.01 NTTR Class II Air Quality Operating Permit, Surface Area Disturbance, Wells ER-EC-13 and ER-EC-15
March 4, 2020 Annual
AP9711-2824.01 NTTR Class II Air Quality Operating Permit, Surface Area Disturbance, Well ER-EC-14
June 14, 2021 Annual
NLVF
Source 657 Clark County Minor Source Permit August 11, 2020 Annual
RSL-Nellis
Source 348 Clark County Minor Source Permit June 28, 2022 Annual
Drinking Water
NNSS
NY-0360-NTNC Areas 6 and 23 September 30, 2018/2019 None
NY-4098-NC Area 25 September 30, 2018/2019 None
NY-4099-NC Area 12 September 30, 2018/2019 None
NY-0835-NP NNSS Water Hauler #84846 September 30, 2018/2019 None
NY-0836-NP NNSS Water Hauler #84847 September 30, 2018/2019 None
Septic Systems/Pumpers
NNSS
NY-1054 Septic System, Area 3, Waste Management Offices – inactive None None
Septic Systems/Pumpers
NNSS
NY-1069 Septic System, Area 18 (Pahute Airstrip)(a) None None
NY-1077 Septic System, Area 27 (Baker Compound)(a) None None
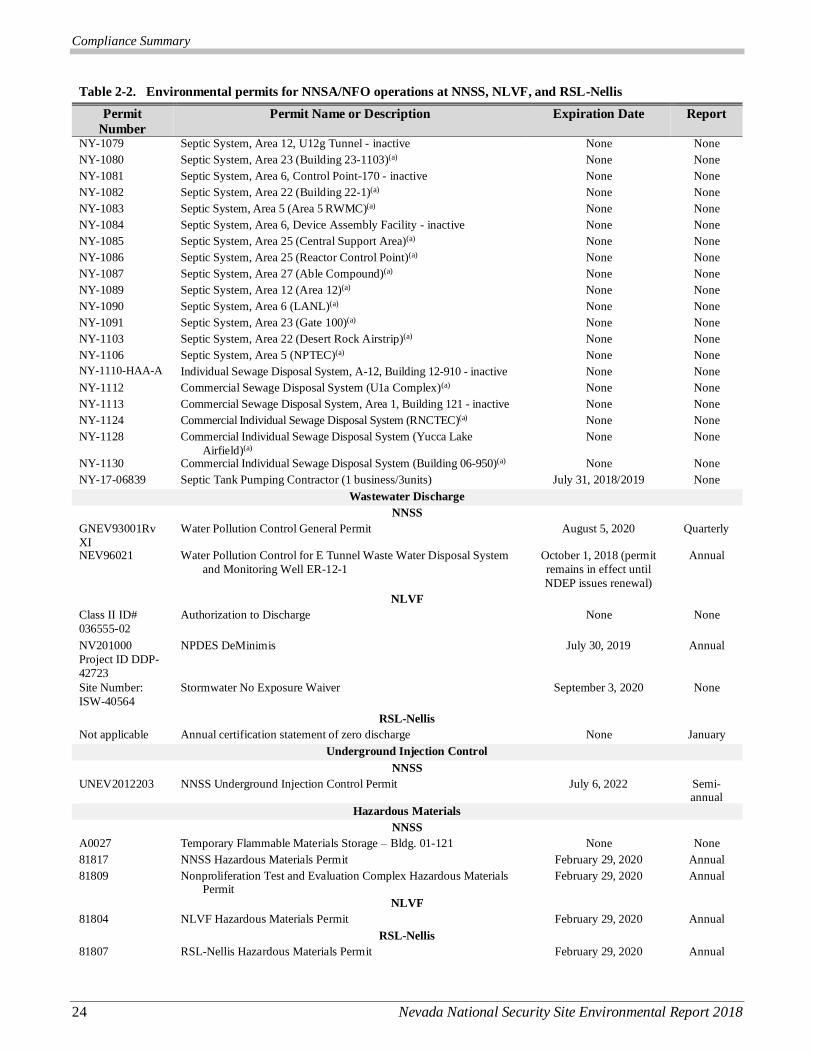
Compliance Summary
24 Nevada National Security Site Environmental Report 2018
Table 2-2. Environmental permits for NNSA/NFO operations at NNSS, NLVF, and RSL-Nellis
Permit
Number
Permit Name or Description Expiration Date Report
NY-1079 Septic System, Area 12, U12g Tunnel - inactive None None
NY-1080 Septic System, Area 23 (Building 23-1103)(a) None None
NY-1081 Septic System, Area 6, Control Point-170 - inactive None None
NY-1082 Septic System, Area 22 (Building 22-1)(a) None None
NY-1083 Septic System, Area 5 (Area 5 RWMC)(a) None None
NY-1084 Septic System, Area 6, Device Assembly Facility - inactive None None
NY-1085 Septic System, Area 25 (Central Support Area)(a) None None
NY-1086 Septic System, Area 25 (Reactor Control Point)(a) None None
NY-1087 Septic System, Area 27 (Able Compound)(a) None None
NY-1089 Septic System, Area 12 (Area 12)(a) None None
NY-1090 Septic System, Area 6 (LANL)(a) None None
NY-1091 Septic System, Area 23 (Gate 100)(a) None None
NY-1103 Septic System, Area 22 (Desert Rock Airstrip)(a) None None
NY-1106 Septic System, Area 5 (NPTEC)(a) None None
NY-1110-HAA-A Individual Sewage Disposal System, A-12, Building 12-910 - inactive None None
NY-1112 Commercial Sewage Disposal System (U1a Complex)(a) None None
NY-1113 Commercial Sewage Disposal System, Area 1, Building 121 - inactive None None
NY-1124 Commercial Individual Sewage Disposal System (RNCTEC)(a) None None
NY-1128 Commercial Individual Sewage Disposal System (Yucca Lake
Airfield)(a)
None None
NY-1130 Commercial Individual Sewage Disposal System (Building 06-950)(a) None None
NY-17-06839 Septic Tank Pumping Contractor (1 business/3units) July 31, 2018/2019 None
Wastewater Discharge
NNSS
GNEV93001Rv
XI
Water Pollution Control General Permit August 5, 2020 Quarterly
NEV96021 Water Pollution Control for E Tunnel Waste Water Disposal System
and Monitoring Well ER-12-1
October 1, 2018 (permit
remains in effect until
NDEP issues renewal)
Annual
NLVF
Class II ID#
036555-02
Authorization to Discharge None None
NV201000
Project ID DDP-
42723
NPDES DeMinimis July 30, 2019 Annual
Site Number:
ISW-40564
Stormwater No Exposure Waiver September 3, 2020 None
RSL-Nellis
Not applicable Annual certification statement of zero discharge None January
Underground Injection Control
NNSS
UNEV2012203 NNSS Underground Injection Control Permit July 6, 2022 Semi-annual
Hazardous Materials
NNSS
A0027 Temporary Flammable Materials Storage – Bldg. 01-121 None None
81817 NNSS Hazardous Materials Permit February 29, 2020 Annual
81809 Nonproliferation Test and Evaluation Complex Hazardous Materials Permit
February 29, 2020 Annual
NLVF
81804 NLVF Hazardous Materials Permit February 29, 2020 Annual
RSL-Nellis
81807 RSL-Nellis Hazardous Materials Permit February 29, 2020 Annual
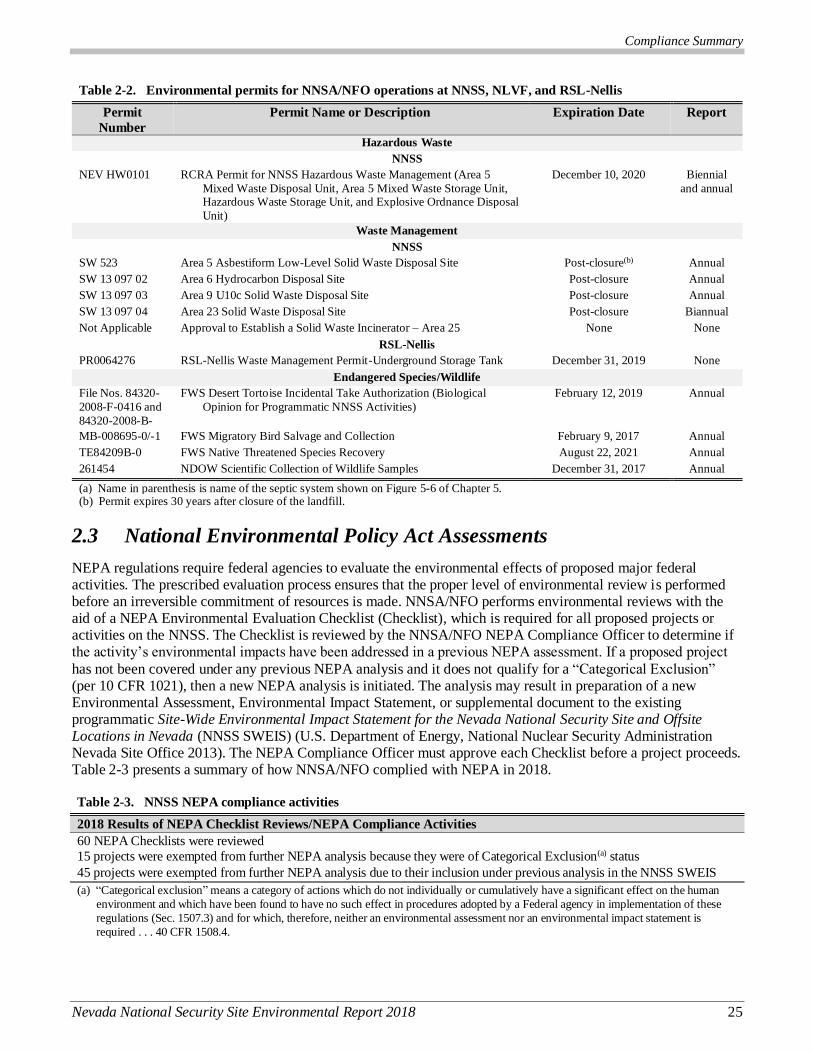
Compliance Summary
Nevada National Security Site Environmental Report 2018 25
Table 2-2. Environmental permits for NNSA/NFO operations at NNSS, NLVF, and RSL-Nellis
Permit
Number
Permit Name or Description Expiration Date Report
Hazardous Waste
NNSS
NEV HW0101 RCRA Permit for NNSS Hazardous Waste Management (Area 5
Mixed Waste Disposal Unit, Area 5 Mixed Waste Storage Unit, Hazardous Waste Storage Unit, and Explosive Ordnance Disposal
Unit)
December 10, 2020 Biennial
and annual
Waste Management
NNSS
SW 523 Area 5 Asbestiform Low-Level Solid Waste Disposal Site Post-closure(b) Annual
SW 13 097 02 Area 6 Hydrocarbon Disposal Site Post-closure Annual
SW 13 097 03 Area 9 U10c Solid Waste Disposal Site Post-closure Annual
SW 13 097 04 Area 23 Solid Waste Disposal Site Post-closure Biannual
Not Applicable Approval to Establish a Solid Waste Incinerator – Area 25 None None
RSL-Nellis
PR0064276 RSL-Nellis Waste Management Permit-Underground Storage Tank December 31, 2019 None
Endangered Species/Wildlife
File Nos. 84320-
2008-F-0416 and
84320-2008-B-0015
FWS Desert Tortoise Incidental Take Authorization (Biological
Opinion for Programmatic NNSS Activities)
February 12, 2019 Annual
MB-008695-0/-1 FWS Migratory Bird Salvage and Collection February 9, 2017
January 31, 2020
Annual
TE84209B-0 FWS Native Threatened Species Recovery August 22, 2021 Annual
261454 NDOW Scientific Collection of Wildlife Samples December 31, 2017 Annual
(a) Name in parenthesis is name of the septic system shown on Figure 5-6 of Chapter 5. (b) Permit expires 30 years after closure of the landfill.
2.3 National Environmental Policy Act Assessments
NEPA regulations require federal agencies to evaluate the environmental effects of proposed major federal activities. The prescribed evaluation process ensures that the proper level of environmental review is performed before an irreversible commitment of resources is made. NNSA/NFO performs environmental reviews with the aid of a NEPA Environmental Evaluation Checklist (Checklist), which is required for all proposed projects or activities on the NNSS. The Checklist is reviewed by the NNSA/NFO NEPA Compliance Officer to determine if the activity’s environmental impacts have been addressed in a previous NEPA assessment. If a proposed project
has not been covered under any previous NEPA analysis and it does not qualify for a “Categorical Exclusion” (per 10 CFR 1021), then a new NEPA analysis is initiated. The analysis may result in preparation of a new Environmental Assessment, Environmental Impact Statement, or supplemental document to the existing programmatic Site-Wide Environmental Impact Statement for the Nevada National Security Site and Offsite Locations in Nevada (NNSS SWEIS) (U.S. Department of Energy, National Nuclear Security Administration Nevada Site Office 2013). The NEPA Compliance Officer must approve each Checklist before a project proceeds. Table 2-3 presents a summary of how NNSA/NFO complied with NEPA in 2018.
Table 2-3. NNSS NEPA compliance activities
2018 Results of NEPA Checklist Reviews/NEPA Compliance Activities
60 NEPA Checklists were reviewed
15 projects were exempted from further NEPA analysis because they were of Categorical Exclusion(a) status
45 projects were exempted from further NEPA analysis due to their inclusion under previous analysis in the NNSS SWEIS
(a) “Categorical exclusion” means a category of actions which do not individually or cumulatively have a significant effect on the human
environment and which have been found to have no such effect in procedures adopted by a Federal agency in implementation of these
regulations (Sec. 1507.3) and for which, therefore, neither an environmental assessment nor an environmental impact statement is
required . . . 40 CFR 1508.4.
Compliance Summary
26 Nevada National Security Site Environmental Report 2018
2.4 Hazardous Materials Control and Management
2.4.1 Hazardous Substance Inventory
Hazardous materials used or stored on the NNSS are controlled and managed through the use of a chemical
inventory module of an enterprise asset management software system called Maximo, which was implemented in 2015. Hazardous substances used or stored by contractors and subcontractors of the NNSA/NFO are entered into this database. Contractors and subcontractors are required to comply with the operational and reporting requirements of the Toxic Substances Control Act; the Federal Insecticide, Fungicide, and Rodenticide Act; the Emergency Planning and Community Right-to-Know Act; and the Nevada Chemical Catastrophe Prevention Act. Chemicals to be purchased are subject to a requisition compliance review process. Hazardous substance purchases are reviewed to ensure that toxic chemicals and products are not purchased when less hazardous substitutes are commercially available. Requirements and responsibilities for the use and management of hazardous/toxic
chemicals are provided in company documents.
The inventory management system allows the tracking of chemicals from the moment they arrive at NNSS,
NLVF, or RSL-Nellis to when they are disposed, and provides an accurate account of chemicals on site. It provides chemical owners with additional information, including purchase dates, Safety Data Sheets, storage locations, and expiration dates. The system allows for chemical inventories to be utilized for emergency planning and planning for operational needs. The tracking system reduces the quantities of chemicals purchased and stored through the chemical custodians’ awareness of the chemicals currently in inventory. Chemical compatibility and proper storage is routinely evaluated and has improved NNSA/NFO’s safety posture in regards to the control and management of chemicals. In 2018, the NNSS managed 4,258 chemicals in 45,892 containers.
2.4.2 Polychlorinated Biphenyls
The storage, handling, and use of PCBs are regulated under the Toxic Substance and Control Act (TSCA). There are no known pieces of PCB-containing electrical equipment (transformers, capacitors, or regulators) at the NNSS. The TSCA program consists mainly of properly characterizing, storing, and disposing of various PCB
wastes generated on site through remediation activities at corrective action sites (Chapter 11) and maintenance of fluorescent lights. PCB bulk product waste (i.e., contaminated building materials) from corrective action sites and light ballasts removed during normal maintenance are disposed of in the Area 9 U10c Solid Waste Disposal Site with prior State of Nevada approval. Soil and other remediation wastes contaminated with PCBs and large volumes of light ballasts are sent off site to an approved PCB disposal facility. Radioactive waste received from offsite waste generator facilities that contains regulated quantities of PCBs is disposed of at the Area 5 RWMS (Section 10.1.1) in accordance with RCRA hazardous waste management permit NEV HW0101. Offsite waste
generators bringing PCB wastes to the NNSS for disposal are issued a Certificate of Disposal for PCBs. Onsite PCB records are maintained as required by the EPA, and PCB management activities are documented herein annually. If any generated PCB wastes that are above threshold levels are released, they are also reported in the Toxic Release Inventory (TRI) Report (Section 2.4.4.1, Table 2-7).
In 2018, NNSS remediation activities generated three drums, 216 kilograms (kg) (474 pounds [lb]) of PCB light ballasts. One drum, 49 kg (108 lb), was shipped off site from the Area 5 Hazardous Waste Storage Unit for treatment and disposal. These weights include the PCBs, the associated materials that are contaminated and/or cannot be separated from the PCBs, and the weight of the waste container. The EPA did not conduct any TSCA inspections at the NNSS in 2018.
2.4.3 Pesticides
The storage and application of pesticides (e.g., insecticides, rodenticides, and herbicides) are regulated under the Federal Insecticide, Fungicide and Rodenticide Act (FIFRA). Several oversight functions are performed each year to ensure FIFRA compliance. They include the screening of all purchase requisitions for restricted-use pesticides;
the review of operating procedures for handling, storing, and applying pesticide products; and monthly inspections of stored pesticides. On the NNSS, pesticides are applied under the direction of a Nevada Pest Control Government License. This service is provided by Waste & Water. Pesticide applications in NNSS food service facilities are also
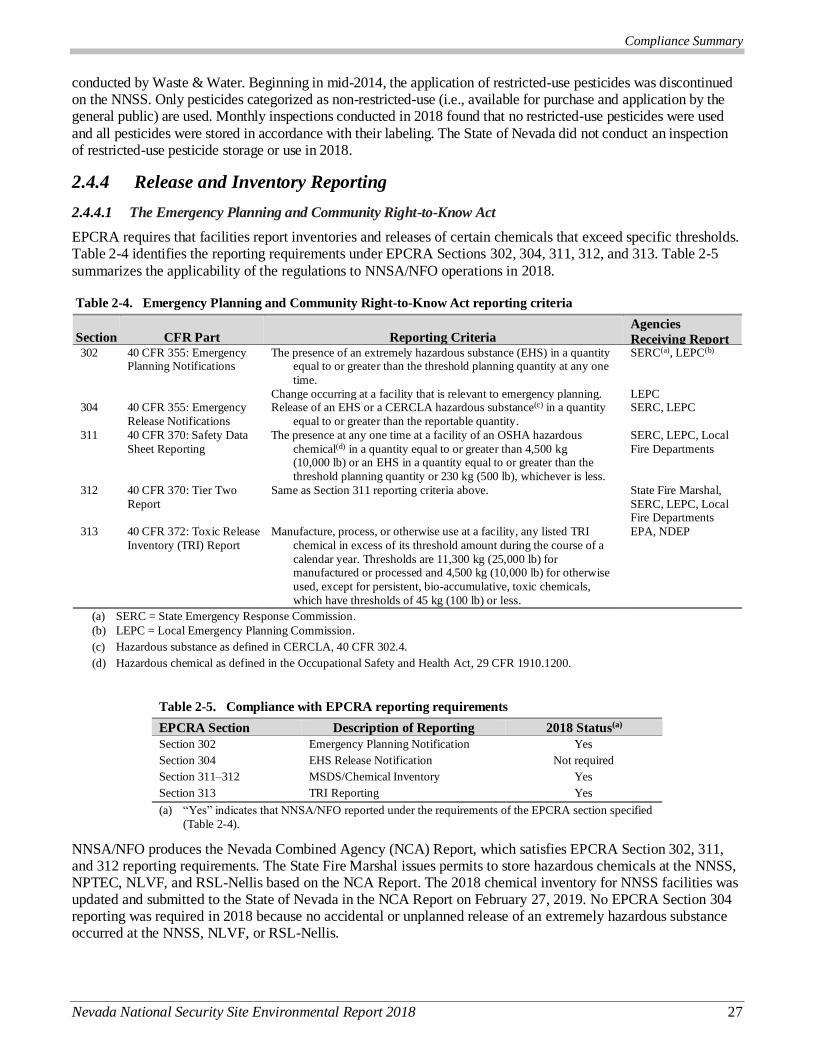
Compliance Summary
Nevada National Security Site Environmental Report 2018 27
conducted by Waste & Water. Beginning in mid-2014, the application of restricted-use pesticides was discontinued on the NNSS. Only pesticides categorized as non-restricted-use (i.e., available for purchase and application by the general public) are used. Monthly inspections conducted in 2018 found that no restricted-use pesticides were used
and all pesticides were stored in accordance with their labeling. The State of Nevada did not conduct an inspection of restricted-use pesticide storage or use in 2018.
2.4.4 Release and Inventory Reporting
2.4.4.1 The Emergency Planning and Community Right-to-Know Act
EPCRA requires that facilities report inventories and releases of certain chemicals that exceed specific thresholds. Table 2-4 identifies the reporting requirements under EPCRA Sections 302, 304, 311, 312, and 313. Table 2-5
summarizes the applicability of the regulations to NNSA/NFO operations in 2018.
Table 2-4. Emergency Planning and Community Right-to-Know Act reporting criteria
Section CFR Part Reporting Criteria Agencies
Receiving Report 302 40 CFR 355: Emergency
Planning Notifications The presence of an extremely hazardous substance (EHS) in a quantity
equal to or greater than the threshold planning quantity at any one
time.
SERC(a), LEPC(b)
Change occurring at a facility that is relevant to emergency planning. LEPC 304 40 CFR 355: Emergency
Release Notifications
Release of an EHS or a CERCLA hazardous substance(c) in a quantity
equal to or greater than the reportable quantity.
SERC, LEPC
311 40 CFR 370: Safety Data
Sheet Reporting
The presence at any one time at a facility of an OSHA hazardous
chemical(d) in a quantity equal to or greater than 4,500 kg (10,000 lb) or an EHS in a quantity equal to or greater than the
threshold planning quantity or 230 kg (500 lb), whichever is less.
SERC, LEPC, Local
Fire Departments
312 40 CFR 370: Tier Two
Report
Same as Section 311 reporting criteria above. State Fire Marshal,
SERC, LEPC, Local Fire Departments
313 40 CFR 372: Toxic Release
Inventory (TRI) Report
Manufacture, process, or otherwise use at a facility, any listed TRI
chemical in excess of its threshold amount during the course of a
calendar year. Thresholds are 11,300 kg (25,000 lb) for manufactured or processed and 4,500 kg (10,000 lb) for otherwise
used, except for persistent, bio-accumulative, toxic chemicals,
which have thresholds of 45 kg (100 lb) or less.
EPA, NDEP
(a) SERC = State Emergency Response Commission.
(b) LEPC = Local Emergency Planning Commission.
(c) Hazardous substance as defined in CERCLA, 40 CFR 302.4.
(d) Hazardous chemical as defined in the Occupational Safety and Health Act, 29 CFR 1910.1200.
Table 2-5. Compliance with EPCRA reporting requirements
EPCRA Section Description of Reporting 2018 Status(a)
Section 302 Emergency Planning Notification Yes
Section 304 EHS Release Notification Not required
Section 311–312 MSDS/Chemical Inventory Yes
Section 313 TRI Reporting Yes
(a) “Yes” indicates that NNSA/NFO reported under the requirements of the EPCRA section specified
(Table 2-4).
NNSA/NFO produces the Nevada Combined Agency (NCA) Report, which satisfies EPCRA Section 302, 311, and 312 reporting requirements. The State Fire Marshal issues permits to store hazardous chemicals at the NNSS, NPTEC, NLVF, and RSL-Nellis based on the NCA Report. The 2018 chemical inventory for NNSS facilities was updated and submitted to the State of Nevada in the NCA Report on February 27, 2019. No EPCRA Section 304 reporting was required in 2018 because no accidental or unplanned release of an extremely hazardous substance occurred at the NNSS, NLVF, or RSL-Nellis.

Compliance Summary
28 Nevada National Security Site Environmental Report 2018
NNSA/NFO produces an annual TRI Report, as necessary, to comply with EPCRA Section 313 reporting. It identifies the reportable quantities of TRI chemicals released to the environment through air emissions, landfill disposal, and recycling. TRI chemicals that are recovered during NNSS remediation activities or become “excess” to operational needs (e.g., lead bricks, lead shielding) are sent off site for recycling, reuse, or proper disposal. Mixed wastes generated at other DOE facilities that contain TRI chemicals and are sent to the NNSS for disposal
are included in the TRI Report. In 2018 at the NNSS, reportable quantities of lead, mercury, nitromethane, PCBs, and PACs were released as a result of NNSS activities (Table 2-6). No accidental or intentional releases (e.g., proper waste disposal) of toxic chemicals at NLVF or RSL-Nellis exceeded the TRI reportable thresholds in 2018. On June 25, 2019, NNSA/NFO submitted the NNSS TRI Report for calendar year 2018 to the EPA and the State Emergency Response Commission. No EPCRA inspections were performed by outside regulators in 2018.
Table 2-6. Summary of reported releases at the NNSS subject to EPCRA Section 313
Quantity(a) (lb)
2018 Reported Release Lead Mercury Nitromethane PCB PACs
Air Emissions(b) 1.362 0.026 -- -- 3.99
Onsite Disposal(c) 203,540 278 -- 23 --
Onsite Release (d) (g) 2,093 -- -- -- 112
Offsite Recycling(e) 64,074.211 2.352 -- -- --
Offsite Disposal(f) 136.138 -- -- 0.054 --
Cleanup Activities One-time Events -- -- -- -- --
Otherwise used as fuel on site -- -- 133,075 -- --
Totals 269,844.71 280.38 133,075 23.05 115.99
EPCRA Reporting Thresholds 100 10 25,000 10 100
(a) The weight of the chemical released, not the weight of the waste material containing the toxic chemical. Weights in the TRI Report
vary from two to four decimal places.
(b) Fugitive airborne releases of lead include from weapons firing at the Mercury Firing Range, chemical releases and detonations, and
from stack air emissions. All airborne releases of mercury were from stack air emissions. PACs, which are in asphalt, were released to the air as part of a road reconstruction project and resurfacing activities.
(c) MLLW or HW containing lead, mercury, or PCB was received and disposed in Cell 18 at the Area 5 RWMS (Section 10.1.1). (d) Lead from spent ammunition left on the ground during firing at the Mercury Firing Range. When the firing range is closed,
ammunition will be collected for recycling.
(e) Lead was recycled from three waste streams: lead-acid batteries, miscellaneous lead items and offsite waste treatment. Mercury was
recycled from lamps and field test kits.
(f) Lead was from lead-contaminated debris and other routinely generated waste. Mercury was from lamps and test kits. PCBs were
from transformer oil.
(g) PACs, which are in asphalt, were released to the ground as part of a road reconstruction project and resurfacing activities.
2.4.4.2 Nevada Chemical Catastrophe Prevention Act
This act directs NDEP to develop and implement a program called the Chemical Accident Prevention Program
(CAPP). It requires registration of facilities storing or processing highly hazardous substances above listed thresholds. NPTEC in Area 5 of the NNSS is registered as a CAPP facility because of its use of the highly hazardous chemical oleum. On January 10, 2018, NDEP conducted an annual site inspection of NPTEC and did not identify any findings.
On January 24, 2018, permits to construct and operate the Temporary Flammable Materials Storage process at the NNSS were issued by NDEP. The permits allowed for the process construction and storage of flammable liquid.
NNSA/NFO is required to submit an annual CAPP Registration report to the State of Nevada for the NPTEC oleum release process. The CAPP Registration report for NPTEC operations from July 2018 through June 2019 was signed on June 17, 2019, and submitted to NDEP. The Registration reported that oleum was not present and that 2,088 lbs of nitromethane was present during the reporting period.
2.4.4.3 Continuous Releases
Section 103(a) of CERCLA, and EPA’s implementing regulation (40 CFR 302.8), require that federal authorities be
notified immediately whenever a reportable quantity of a hazardous substance is released into the environment, so

Compliance Summary
Nevada National Security Site Environmental Report 2018 29
that government response officials can evaluate the need for a response action. CERCLA Section 103(f) (2) provides relief from these immediate reporting requirements for releases of hazardous substances from facilities or vessels that are continuous and are predictable and regular in the amount and rate of emission. No continuous releases of
hazardous substances are known to occur at the NNSS, NLVF, or RSL-Nellis.
2.5 Environmental Occurrences
On October 1, 2017, new Occurrence Reporting Criteria were established and implemented based on DOE O 232.2A, Occurrence Reporting and Processing of Operations Information. DOE defines an occurrence as “one or more (i.e., recurring) events or conditions that adversely affect, or may adversely affect, DOE or contractor personnel, the public, property, the environment, or the DOE mission. Events or conditions meeting the criteria thresholds identified in this order, or determined to be recurring performance analysis, are occurrences.”
In 2018, no environmental occurrences were reportable under the requirements of the order. Twenty-three hazardous substance spills occurred in 2018, which were not reportable under DOE O 232.2A: 21 at NNSS, 1 at the NLVF, and 1 at RSL-Nellis. The spills consisted of small-volume releases either to containment areas or to
other surfaces. All spills were cleaned up. There are no continuous releases on the NNSS, nor at the NLVF or RSL-Nellis.
2.6 Environmental Reports Submitted to Regulators
Numerous reports were prepared to meet regulation requirements or to document compliance for NNSA/NFO activities. These reports and the federal or state regulators to whom they were submitted are listed in Table 2-7.
Table 2-7. List of environmental reports submitted to regulators for activities in 2018
Regulator(s) Report
Air Quality
EPA Region 9 National Emission Standards for Hazardous Air Pollutants – Radionuclide Emissions, Calendar Year 2017 NDEP,
EPA Region 9
Annual Asbestos Abatement Notification Form, submitted to NDEP and to EPA Region 9
NDEP Calendar Year 2017 Actual Production/Emissions Reporting Form, submitted to NDEP
NDEP Quarterly Summary Emissions Reports for Nonproliferation Test and Evaluation Complex (NPTEC) and Big Explosives Experimental Facility (BEEF)
Quarterly Class II Air Quality Reports
Nonproliferation Test and Evaluation Complex (NPTEC) Pre-test and Post-test Reports
CCDAQ Department of Air Quality Annual Emission Inventory Reporting Form for North Las Vegas Facility Department of Air Quality Annual Emission Inventory Reporting Forms for Remote Sensing Laboratory
Water Quality
NDEP Quarterly Monitoring Reports for Nevada National Security Site Sewage Lagoons
Results of water quality analyses for PWSs, sent to the state throughout the year as they were obtained from the
analytical laboratory
Water Pollution Control Permit NEV 96021, Quarterly Monitoring Reports (for first, second, and third quarters of 2017
for E Tunnel effluent monitoring)
Water Pollution Control Permit NEV 96021, Quarterly Monitoring Report and Annual Summary Report for E Tunnel
Wastewater Disposal System
Waste Management
NDEP Nevada National Security Area 5 Solid Waste Disposal Annual Report for CY 2017
NNSS Quarterly Volume Reports (for all active LLW and MLLW disposal cells), April, July, and October 2017, and
January 2018
4th Quarter Transportation Report FY2017, Radioactive Waste Shipments to and from the Nevada National Security Site
RCRA Permit for a Hazardous Waste Management Facility Permit Number NEV HW0101 – Annual Summary/Waste
Minimization Report Calendar Year 2017
Nevada National Security Site 2017 Data Report: Groundwater Monitoring Program Area 5 Radioactive Waste Management Site
Nevada National Security Site 2017 Waste Management Monitoring Report - Area 3 and Area 5 Radioactive Waste
Management Site
Post-Closure Report for Closed Resource Conservation and Recovery Act Corrective Action Units, Nevada National Security Site, Nevada, for Fiscal Year 2017 (October 2016–September 2017)

Compliance Summary
30 Nevada National Security Site Environmental Report 2018
Table 2-7. List of environmental reports submitted to regulators for activities in 2018
Regulator(s) Report
Annual Soil Moisture Monitoring Report for the Area 9 U10c Landfill, Nevada National Security Site, Nevada, for the Period January–December 2017
January–June 2017 Biannual Solid Waste Disposal Site Report for the Nevada National Security Site Area 23 Sanitary
Landfill
July–December 2017 Biannual Solid Waste Disposal Site Report for the Nevada National Security Site Area 23 Sanitary Landfill
Annual Soil Moisture Monitoring Report for the Area 6 Hydrocarbon Landfill, Nevada National Security Site, Nevada,
for the Period January–December 2017
The 2017 Biennial Hazardous Waste Report for the Nevada National Security Site
Environmental Corrective Actions
NDEP CAU 98: Frenchman Flat – Record of Technical Change (ROTC)-2 for the Final Closure Report, Revision 1
CAU 98: Frenchman Flat – Annual Closure Monitoring Report for Calendar Year 2017
CAU 98: Frenchman Flat – Record of Technical Change (ROTC)-1 for the Annual Closure Monitoring Report for
Calendar Year 2017 CAU 99: Rainier Mesa/Shoshone Mountain – Hydrostratigraphic Framework Model-Prime Model, Model Development
Process and Model Description. Rev 0
CAU 99: Rainier Mesa/Shoshone Mountain – Final Flow and Transport Model Report Rev 1
CAUs 101/102 – Central and Western Pahute Mesa – Annual Sampling Report for Calendar Year 2017 CAU 412: Clean Slate I Plutonium Dispersion (TTR) – Final Addendum to the Final Closure Report
CAU 413: Clean Slate II Plutonium Dispersion (TTR) –Final Closure Report
CAU 414: Clean Slate III Plutonium Dispersion (TTR) – Record of Technical Change (ROTC)-1 for the Final
Corrective Action Decision Document/Closure Report (CADD/CR) CAU 415: Project 57 No. 1 Plutonium Dispersion (NTTR) – Record of Technical Change (ROTC)-1 for the Final
Closure Report
CAU 575: Area 15 Miscellaneous Sites – Final Closure Report
Various CAUs – Final Post-Closure Report for the Closed Resource Conservation and Recovery Act (RCRA) Corrective Action Units for Calendar Year 2017
Various CAUs – Final Post-Closure Inspection Report for the Tonopah Test Range (TTR) for Calendar Year 2017
Various CAUs – Final Post-Closure Inspection Letter Report for Corrective Action Units on the Nevada National
Security Site (NNSS) for Calendar Year 2017 Nevada National Security Site (NNSS) Integrated Groundwater Sampling Plan Rev 1
Hazardous Materials Management
State Fire
Marshal
Nevada Combined Agency Hazmat Facility Report – Calendar Year (CY) 2018
EPA, NDEP Toxic Release Inventory Report, Form Rs for CY 2018 NDEP Chemical Accident Prevention Program 2018 Registration
Cultural and Natural Resources
NSHPO A Cultural Resources Inventory of the RWMC Expansion, Area 5, Nevada National Security Site, Nye County, Nevada
A Cultural Resources Inventory of the DOE Point Roundabout, Area 12, Nevada National Security Site, Nye County,
Nevada
A Cultural Resources Inventory for the Proposed DAG Test Pad Project, Area 2, Nevada National Security Site, Nye
County, Nevada
A Cultural Resources Inventory of the Proposed Backfill Project, Area 27, Nevada National Security Site, Nye County,
Nevada
Monitoring of Site 26NY15513, A Recording/Instrument Station at UGTA Well ER-4-1, Area 4, Nevada National
Security Site, Nye County, Nevada
A Cultural Resources Inventory of the Proposed LLNL Field Experiment Location, Area 2, Nevada National Security Site, Nye County, Nevada
A Cultural Resources Inventory of the Proposed Performance Optimized Data Center, Area 6, Nevada National Security
Site, Nye County, Nevada
A Cultural Resources Inventory of the Proposed Dense Plasma Focus Facility Research and Development Project, Area 11, Nevada National Security Site, Nye County, Nevada
A Cultural Resources Inventory for the Removal of the Debris Pile at the Hamilton Atmospheric Test Location, Area 5,
Nevada National Security Site, Nye County, Nevada
Cultural Resources Preliminary Assessment of Corrective Action Unit 576, Miscellaneous Radiological Sites and Debris, Areas 2,3,5,8 and 9, Nevada National Security Site, Nye County, Nevada
A Cultural Resources Inventory of the Proposed Wildland Fire Training Area, Area 23, Nevada National Security Site,
Nye County, Nevada
A Cultural Resources Inventory of the Proposed UNESE Drill Hole Project, Area 12, Nevada National Security Site, Nye County, Nevada
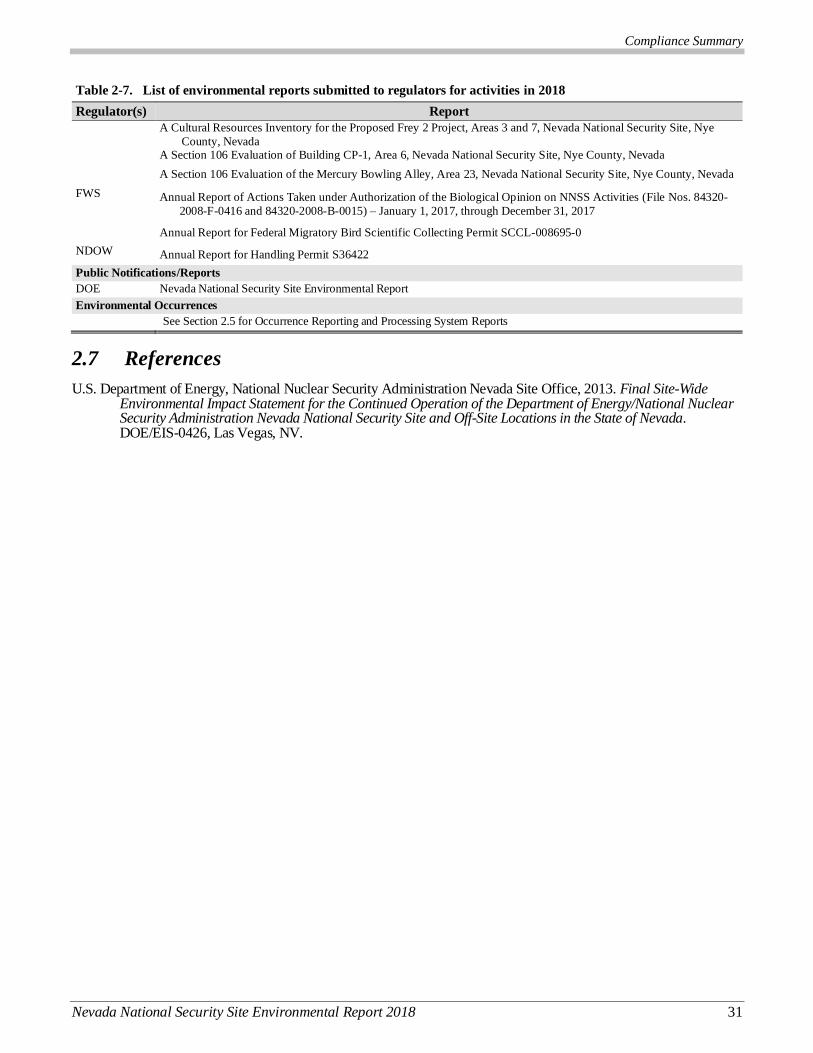
Compliance Summary
Nevada National Security Site Environmental Report 2018 31
Table 2-7. List of environmental reports submitted to regulators for activities in 2018
Regulator(s) Report
A Cultural Resources Inventory for the Proposed Frey 2 Project, Areas 3 and 7, Nevada National Security Site, Nye
County, Nevada
A Section 106 Evaluation of Building CP-1, Area 6, Nevada National Security Site, Nye County, Nevada
A Section 106 Evaluation of the Mercury Bowling Alley, Area 23, Nevada National Security Site, Nye County, Nevada
FWS Annual Report of Actions Taken under Authorization of the Biological Opinion on NNSS Activities (File Nos. 84320-
2008-F-0416 and 84320-2008-B-0015) – January 1, 2017, through December 31, 2017
Annual Report for Federal Migratory Bird Scientific Collecting Permit SCCL-008695-0
NDOW Annual Report for Handling Permit S36422
Public Notifications/Reports
DOE Nevada National Security Site Environmental Report
Environmental Occurrences
See Section 2.5 for Occurrence Reporting and Processing System Reports
2.7 References
U.S. Department of Energy, National Nuclear Security Administration Nevada Site Office, 2013. Final Site-Wide Environmental Impact Statement for the Continued Operation of the Department of Energy/National Nuclear Security Administration Nevada National Security Site and Off-Site Locations in the State of Nevada. DOE/EIS-0426, Las Vegas, NV.
Compliance Summary
32 Nevada National Security Site Environmental Report 2018
THIS PAGE INTENTIONALLY LEFT BLANK
Environmental Management System
Nevada National Security Site Environmental Report 2018 33
3.0 Ch3
Chapter 3: Environmental Management System
Troy S. Belka, Savitra M. Candley, and Delane P. Fitzpatrick-Maul
Mission Support and Test Services, LLC
The U.S. Department of Energy (DOE), National Nuclear Security Administration Nevada Field Office (NNSA/NFO) conducts activities on the Nevada National Security Site (NNSS) while ensuring the protection of the environment, the worker, and the public. The International Organization for Standardization (ISO)
14001:2004 certification of the Environmental Management System (EMS) ended in 2017 when the Management and Operating (M&O) contract transitioned to Mission Support and Test Services, LLC (MSTS). However, NNSS M&O policies and directives are established and continue to promote, guide, and regulate NNSS environmental aspects in order to protect the environment and public health. MSTS is planning to establish a new EMS in 2019 that conforms to the ISO 14001:2015 standard.
This chapter describes the 2018 progress made towards improving overall environmental performance and discusses the MSTS Sustainability Program. The Program has the specific mission to support and track DOE’s complex-wide sustainability goals. Reported progress applies to operations on the NNSS as well as support activities conducted at the NNSA/NFO-managed North Las Vegas Facility (NLVF), Remote Sensing Laboratory–Nellis (RSL-Nellis), and additional outlying sites. NNSA/NFO uses this annual environmental report as the
mechanism to communicate to the public the components and status of the EMS and the Sustainability Program.
3.1 Environmental Policy
MSTS’s environmental commitments are incorporated into an Environmental Policy approved by NNSA/NFO. The policy applies to all MSTS operations, projects, facilities, and personnel, including subcontractors. The EMS implements this policy and is incorporated into MSTS’s Integrated Safety Management System. MSTS evaluates
its operations, identifies aspects that can impact the environment, qualitatively assesses the potential impacts, and manages those aspects appropriately. In addition, the MSTS policy is to:
Protect environmental quality and human welfare by implementing EMS practices.
Identify and comply with all applicable DOE orders and federal, state, and local environmental laws and regulations.
Identify and mitigate environmental aspects early in project planning.
Establish environmental objectives, targets, and performance measures.
Collaborate with employees, customers, subcontractors, and key suppliers on sustainable development
and pollution prevention efforts.
Communicate and instill an organizational commitment to environmental excellence in company activities through processes of continual improvement.
3.2 Legal and Other Requirements
MSTS environmental compliance requirements are documented in the M&O Prime Contract, which includes DEAR [U.S. Department of Energy Acquisition Regulation] Clause 970.5204-2, Laws, Regulations, and DOE Directives, requiring compliance with all applicable laws and regulations (including DOE Order DOE O 436.1, Departmental Sustainability, which contains DOE Sustainability Goals). These baseline directives are
supplemented on an activity-specific basis as needed. M&O Contractor executive management and NNSA/NFO develop, update, and approve these standards through controlled processes. The M&O Contractor must also work to applicable Air Force Directives at RSL-Andrews and RSL-Nellis.
Environmental management performance-related needs and expectations of NNSA/NFO and M&O Contractor parent companies are identified in the M&O Contract, agreements, and Board recommendations. These are considered when developing compliance obligations. The needs and expectations of interested parties include clean-up of contaminated sites, community air and groundwater monitoring, safe handling of hazardous and radioactive waste, compliance with environmental regulations, and host site environmental operating provisions.
Environmental Management System
34 Nevada National Security Site Environmental Report 2018
MSTS has a process to review changes in federal, state, and local environmental regulations and to communicate those changes to affected staff and organizations.
DOE publishes updated sustainability goals and targets annually in a DOE Strategic Sustainability Performance Plan, and pursues and tracks goals under the MSTS Sustainability Program (Section 3.3.1). Implementing instructions for the new Executive Order (E.O.) listing goal targets for energy use intensity, water use intensity, and greenhouse gas (GHG) emission were completed and distributed in April 2019.
3.3 Environmental Management System Programs
3.3.1 Sustainability Program
The Sustainability Program has the specific mission to support and track DOE’s complex-wide sustainability goals. The program strives to ensure continuous life cycle, cost-effective improvements to increase energy efficiency; increase the effective management of energy, water, and transportation fleets; and increase the use of clean energy sources for NNSA/NFO operations. NNSA/NFO currently uses electricity, fuel oil, and propane at the NNSS facility. At the NLVF and RSL-Nellis facilities, electricity and natural gas are used. NNSA/NFO vehicles and equipment are powered by unleaded gasoline, diesel, bio-diesel, E-85, and jet fuel. All water used at
the NNSS is groundwater, and water used at the NLVF and RSL-Nellis is predominately surface water from Lake Mead.
Each fiscal year (FY) (October 1–September 30), the Sustainability Program produces an NNSA/NFO Site Sustainability Plan (SSP) (MSTS 2019). The SSP identifies how NNSA/NFO will meet DOE’s sustainability goals, which were first published in the 2010 Strategic Sustainability Performance Plan (SSPP) (DOE 2010). The SSP describes the program, planning, and budget assumptions as well as NNSA/NFO’s performance for the previous year for each DOE goal, and planned actions to meet each goal during the next year. To implement the SSP, an Energy Management Council meets bimonthly to track requirements and progress and facilitate goal achievement. Table 3-1 includes a summary of the DOE goals and NNSA/NFO’s FY 2018 performance.
NNSS 5- to 10-Year Major Initiatives
Mercury Modernization – create a modern, welcoming campus to support the goals and operations of the NNSS.
U1a Master Planning – plan for existing and future conditions of all buildings and infrastructure, personnel, space needs,
and mission requirements.
DAF Master Planning – early planning for improved operations to support new capabilities and increased capacity for
additional programs at the DAF [Device Assembly Facility].
Footprint Management – aggressive consolidation and modernization of facilities at the NNSS and NLVF to reduce the
footprint and provide sustainable infrastructure to support mission needs.
NNSS Solar Project – early planning and viability assessment of a large solar Photo Voltaic (PV) project with storage at
the NNSS to cover power usage for the majority of site power.
Sustainability Strategies
Provide sustainable facilities and equipment that meet requirements until at least
the 2080s.
Improve energy efficiency and strive to create the first net-zero energy buildings in
the NNSA complex.
Reduce the overall size of Mercury by consolidating operations.
Complete utility/infrastructure upgrades and consolidations across the campus.
Dispose of 28 facilities in the next 10 years.
Sustainability Mission
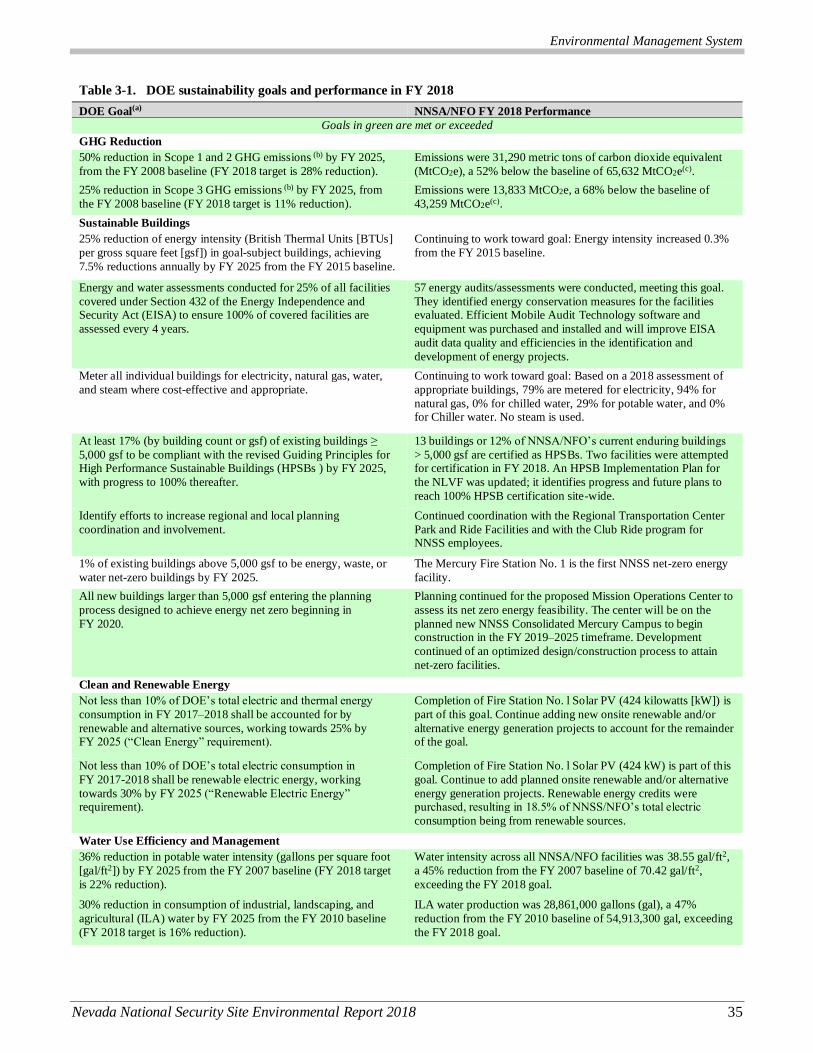
Environmental Management System
Nevada National Security Site Environmental Report 2018 35
Table 3-1. DOE sustainability goals and performance in FY 2018
DOE Goal(a) NNSA/NFO FY 2018 Performance
Goals in green are met or exceeded
GHG Reduction
50% reduction in Scope 1 and 2 GHG emissions (b) by FY 2025,
from the FY 2008 baseline (FY 2018 target is 28% reduction).
Emissions were 31,290 metric tons of carbon dioxide equivalent
(MtCO2e), a 52% below the baseline of 65,632 MtCO2e(c).
25% reduction in Scope 3 GHG emissions (b) by FY 2025, from
the FY 2008 baseline (FY 2018 target is 11% reduction).
Emissions were 13,833 MtCO2e, a 68% below the baseline of
43,259 MtCO2e(c).
Sustainable Buildings
25% reduction of energy intensity (British Thermal Units [BTUs]
per gross square feet [gsf]) in goal-subject buildings, achieving
7.5% reductions annually by FY 2025 from the FY 2015 baseline.
Continuing to work toward goal: Energy intensity increased 0.3%
from the FY 2015 baseline.
Energy and water assessments conducted for 25% of all facilities
covered under Section 432 of the Energy Independence and Security Act (EISA) to ensure 100% of covered facilities are
assessed every 4 years.
57 energy audits/assessments were conducted, meeting this goal.
They identified energy conservation measures for the facilities evaluated. Efficient Mobile Audit Technology software and
equipment was purchased and installed and will improve EISA
audit data quality and efficiencies in the identification and
development of energy projects.
Meter all individual buildings for electricity, natural gas, water,
and steam where cost-effective and appropriate.
Continuing to work toward goal: Based on a 2018 assessment of
appropriate buildings, 79% are metered for electricity, 94% for
natural gas, 0% for chilled water, 29% for potable water, and 0% for Chiller water. No steam is used.
At least 17% (by building count or gsf) of existing buildings ≥
5,000 gsf to be compliant with the revised Guiding Principles for High Performance Sustainable Buildings (HPSBs ) by FY 2025,
with progress to 100% thereafter.
13 buildings or 12% of NNSA/NFO’s current enduring buildings
> 5,000 gsf are certified as HPSBs. Two facilities were attempted for certification in FY 2018. An HPSB Implementation Plan for
the NLVF was updated; it identifies progress and future plans to
reach 100% HPSB certification site-wide.
Identify efforts to increase regional and local planning
coordination and involvement.
Continued coordination with the Regional Transportation Center
Park and Ride Facilities and with the Club Ride program for NNSS employees.
1% of existing buildings above 5,000 gsf to be energy, waste, or
water net-zero buildings by FY 2025.
The Mercury Fire Station No. 1 is the first NNSS net-zero energy
facility.
All new buildings larger than 5,000 gsf entering the planning
process designed to achieve energy net zero beginning in
FY 2020.
Planning continued for the proposed Mission Operations Center to
assess its net zero energy feasibility. The center will be on the
planned new NNSS Consolidated Mercury Campus to begin construction in the FY 2019–2025 timeframe. Development
continued of an optimized design/construction process to attain
net-zero facilities.
Clean and Renewable Energy
Not less than 10% of DOE’s total electric and thermal energy
consumption in FY 2017–2018 shall be accounted for by
renewable and alternative sources, working towards 25% by FY 2025 (“Clean Energy” requirement).
Completion of Fire Station No. l Solar PV (424 kilowatts [kW]) is
part of this goal. Continue adding new onsite renewable and/or
alternative energy generation projects to account for the remainder of the goal.
Not less than 10% of DOE’s total electric consumption in
FY 2017-2018 shall be renewable electric energy, working
towards 30% by FY 2025 (“Renewable Electric Energy” requirement).
Completion of Fire Station No. l Solar PV (424 kW) is part of this
goal. Continue to add planned onsite renewable and/or alternative
energy generation projects. Renewable energy credits were purchased, resulting in 18.5% of NNSS/NFO’s total electric
consumption being from renewable sources.
Water Use Efficiency and Management
36% reduction in potable water intensity (gallons per square foot
[gal/ft2]) by FY 2025 from the FY 2007 baseline (FY 2018 target
is 22% reduction).
Water intensity across all NNSA/NFO facilities was 38.55 gal/ft2,
a 45% reduction from the FY 2007 baseline of 70.42 gal/ft2,
exceeding the FY 2018 goal.
30% reduction in consumption of industrial, landscaping, and
agricultural (ILA) water by FY 2025 from the FY 2010 baseline
(FY 2018 target is 16% reduction).
ILA water production was 28,861,000 gallons (gal), a 47%
reduction from the FY 2010 baseline of 54,913,300 gal, exceeding
the FY 2018 goal.
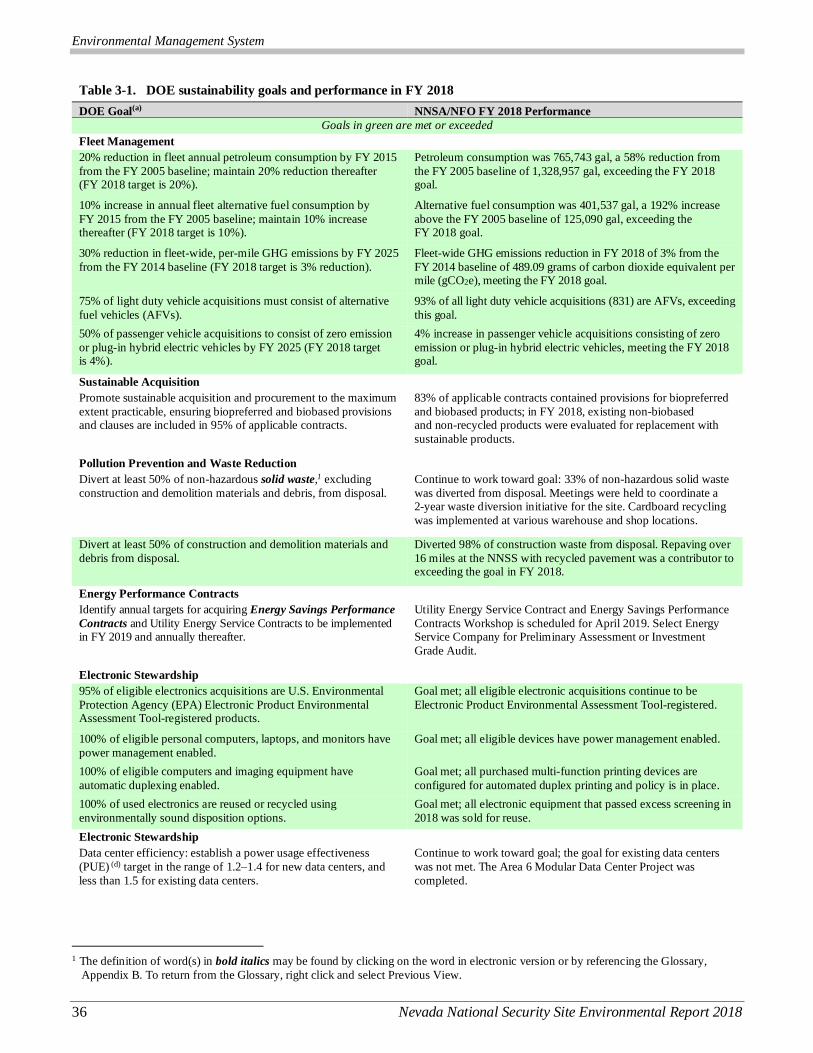
Environmental Management System
36 Nevada National Security Site Environmental Report 2018
Table 3-1. DOE sustainability goals and performance in FY 2018
DOE Goal(a) NNSA/NFO FY 2018 Performance
Goals in green are met or exceeded
Fleet Management
20% reduction in fleet annual petroleum consumption by FY 2015
from the FY 2005 baseline; maintain 20% reduction thereafter (FY 2018 target is 20%).
Petroleum consumption was 765,743 gal, a 58% reduction from
the FY 2005 baseline of 1,328,957 gal, exceeding the FY 2018 goal.
10% increase in annual fleet alternative fuel consumption by
FY 2015 from the FY 2005 baseline; maintain 10% increase thereafter (FY 2018 target is 10%).
Alternative fuel consumption was 401,537 gal, a 192% increase
above the FY 2005 baseline of 125,090 gal, exceeding the FY 2018 goal.
30% reduction in fleet-wide, per-mile GHG emissions by FY 2025
from the FY 2014 baseline (FY 2018 target is 3% reduction).
Fleet-wide GHG emissions reduction in FY 2018 of 3% from the
FY 2014 baseline of 489.09 grams of carbon dioxide equivalent per mile (gCO2e), meeting the FY 2018 goal.
75% of light duty vehicle acquisitions must consist of alternative
fuel vehicles (AFVs).
93% of all light duty vehicle acquisitions (831) are AFVs, exceeding
this goal.
50% of passenger vehicle acquisitions to consist of zero emission
or plug-in hybrid electric vehicles by FY 2025 (FY 2018 target is 4%).
4% increase in passenger vehicle acquisitions consisting of zero
emission or plug-in hybrid electric vehicles, meeting the FY 2018 goal.
Sustainable Acquisition
Promote sustainable acquisition and procurement to the maximum
extent practicable, ensuring biopreferred and biobased provisions and clauses are included in 95% of applicable contracts.
83% of applicable contracts contained provisions for biopreferred
and biobased products; in FY 2018, existing non-biobased and non-recycled products were evaluated for replacement with
sustainable products.
Pollution Prevention and Waste Reduction
Divert at least 50% of non-hazardous solid waste,1 excluding
construction and demolition materials and debris, from disposal.
Continue to work toward goal: 33% of non-hazardous solid waste
was diverted from disposal. Meetings were held to coordinate a 2-year waste diversion initiative for the site. Cardboard recycling
was implemented at various warehouse and shop locations.
Divert at least 50% of construction and demolition materials and
debris from disposal.
Diverted 98% of construction waste from disposal. Repaving over
16 miles at the NNSS with recycled pavement was a contributor to exceeding the goal in FY 2018.
Energy Performance Contracts
Identify annual targets for acquiring Energy Savings Performance
Contracts and Utility Energy Service Contracts to be implemented in FY 2019 and annually thereafter.
Utility Energy Service Contract and Energy Savings Performance
Contracts Workshop is scheduled for April 2019. Select Energy Service Company for Preliminary Assessment or Investment
Grade Audit.
Electronic Stewardship
95% of eligible electronics acquisitions are U.S. Environmental
Protection Agency (EPA) Electronic Product Environmental Assessment Tool-registered products.
Goal met; all eligible electronic acquisitions continue to be
Electronic Product Environmental Assessment Tool-registered.
100% of eligible personal computers, laptops, and monitors have
power management enabled.
Goal met; all eligible devices have power management enabled.
100% of eligible computers and imaging equipment have
automatic duplexing enabled.
Goal met; all purchased multi-function printing devices are
configured for automated duplex printing and policy is in place.
100% of used electronics are reused or recycled using
environmentally sound disposition options.
Goal met; all electronic equipment that passed excess screening in
2018 was sold for reuse.
Electronic Stewardship
Data center efficiency: establish a power usage effectiveness
(PUE) (d) target in the range of 1.2–1.4 for new data centers, and
less than 1.5 for existing data centers.
Continue to work toward goal; the goal for existing data centers
was not met. The Area 6 Modular Data Center Project was
completed.
1 The definition of word(s) in bold italics may be found by clicking on the word in electronic version or by referencing the Glossary,
Appendix B. To return from the Glossary, right click and select Previous View.
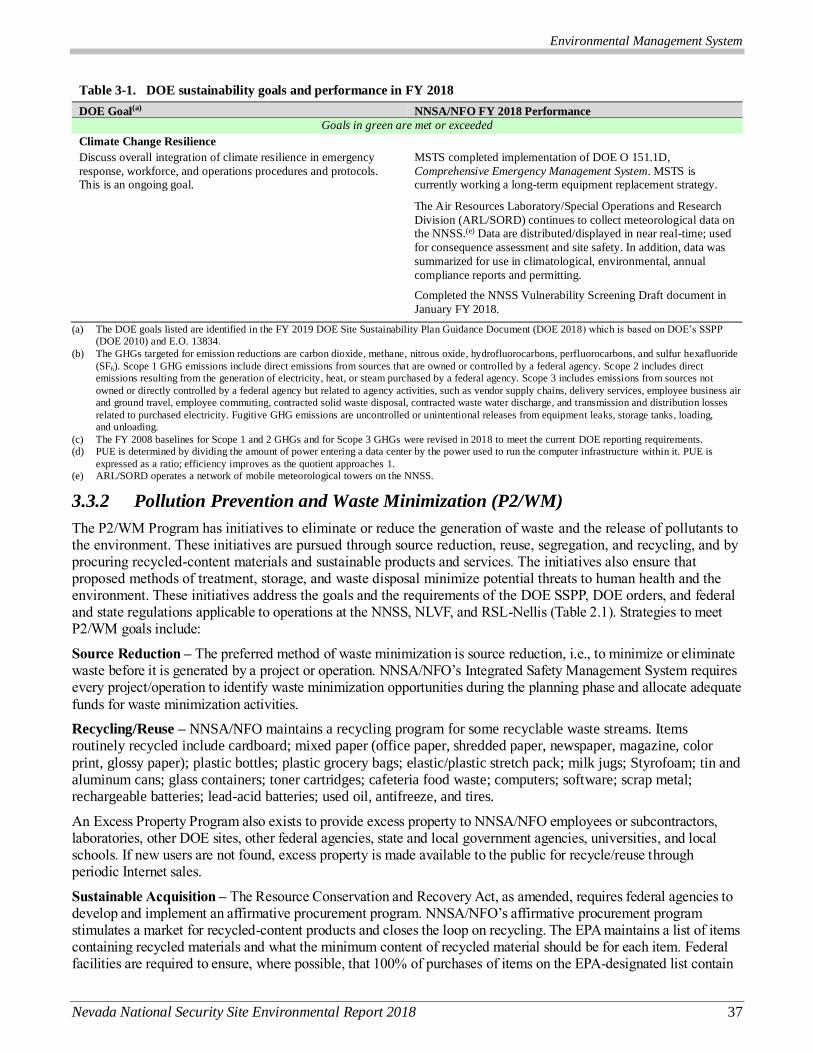
Environmental Management System
Nevada National Security Site Environmental Report 2018 37
Table 3-1. DOE sustainability goals and performance in FY 2018
DOE Goal(a) NNSA/NFO FY 2018 Performance
Goals in green are met or exceeded
Climate Change Resilience
Discuss overall integration of climate resilience in emergency
response, workforce, and operations procedures and protocols. This is an ongoing goal.
MSTS completed implementation of DOE O 151.1D,
Comprehensive Emergency Management System. MSTS is currently working a long-term equipment replacement strategy.
The Air Resources Laboratory/Special Operations and Research
Division (ARL/SORD) continues to collect meteorological data on the NNSS.(e) Data are distributed/displayed in near real-time; used
for consequence assessment and site safety. In addition, data was
summarized for use in climatological, environmental, annual
compliance reports and permitting.
Completed the NNSS Vulnerability Screening Draft document in
January FY 2018.
(a) The DOE goals listed are identified in the FY 2019 DOE Site Sustainability Plan Guidance Document (DOE 2018) which is based on DOE’s SSPP
(DOE 2010) and E.O. 13834.
(b) The GHGs targeted for emission reductions are carbon dioxide, methane, nitrous oxide, hydrofluorocarbons, perfluorocarbons, and sulfur hexafluoride
(SF6). Scope 1 GHG emissions include direct emissions from sources that are owned or controlled by a federal agency. Scope 2 includes direct
emissions resulting from the generation of electricity, heat, or steam purchased by a federal agency. Scope 3 includes emissions from sources not
owned or directly controlled by a federal agency but related to agency activities, such as vendor supply chains, delivery services, employee business air
and ground travel, employee commuting, contracted solid waste disposal, contracted waste water discharge, and transmission and distribution losses
related to purchased electricity. Fugitive GHG emissions are uncontrolled or unintentional releases from equipment leaks, storage tanks, loading,
and unloading.
(c) The FY 2008 baselines for Scope 1 and 2 GHGs and for Scope 3 GHGs were revised in 2018 to meet the current DOE reporting requirements.
(d) PUE is determined by dividing the amount of power entering a data center by the power used to run the computer infrastructure within it. PUE is
expressed as a ratio; efficiency improves as the quotient approaches 1.
(e) ARL/SORD operates a network of mobile meteorological towers on the NNSS.
3.3.2 Pollution Prevention and Waste Minimization (P2/WM)
The P2/WM Program has initiatives to eliminate or reduce the generation of waste and the release of pollutants to the environment. These initiatives are pursued through source reduction, reuse, segregation, and recycling, and by procuring recycled-content materials and sustainable products and services. The initiatives also ensure that proposed methods of treatment, storage, and waste disposal minimize potential threats to human health and the environment. These initiatives address the goals and the requirements of the DOE SSPP, DOE orders, and federal and state regulations applicable to operations at the NNSS, NLVF, and RSL-Nellis (Table 2.1). Strategies to meet P2/WM goals include:
Source Reduction – The preferred method of waste minimization is source reduction, i.e., to minimize or eliminate waste before it is generated by a project or operation. NNSA/NFO’s Integrated Safety Management System requires every project/operation to identify waste minimization opportunities during the planning phase and allocate adequate
funds for waste minimization activities.
Recycling/Reuse – NNSA/NFO maintains a recycling program for some recyclable waste streams. Items routinely recycled include cardboard; mixed paper (office paper, shredded paper, newspaper, magazine, color
print, glossy paper); plastic bottles; plastic grocery bags; elastic/plastic stretch pack; milk jugs; Styrofoam; tin and aluminum cans; glass containers; toner cartridges; cafeteria food waste; computers; software; scrap metal; rechargeable batteries; lead-acid batteries; used oil, antifreeze, and tires.
An Excess Property Program also exists to provide excess property to NNSA/NFO employees or subcontractors, laboratories, other DOE sites, other federal agencies, state and local government agencies, universities, and local schools. If new users are not found, excess property is made available to the public for recycle/reuse through periodic Internet sales.
Sustainable Acquisition – The Resource Conservation and Recovery Act, as amended, requires federal agencies to develop and implement an affirmative procurement program. NNSA/NFO’s affirmative procurement program stimulates a market for recycled-content products and closes the loop on recycling. The EPA maintains a list of items containing recycled materials and what the minimum content of recycled material should be for each item. Federal facilities are required to ensure, where possible, that 100% of purchases of items on the EPA-designated list contain

Environmental Management System
38 Nevada National Security Site Environmental Report 2018
recycled materials at the specified minimum content. The U.S. Department of Agriculture designates types of materials that have a required minimum amount of bio-based chemicals. Products that meet this requirement are identified by requestors and tracked in the procurement system.
3.4 EMS Competence, Training, and Awareness
EMS awareness is included in the orientation training for all new MSTS employees. Ongoing EMS awareness is accomplished by publishing environmental articles in electronic employee newsletters. Focused environmental briefings are given at tailgate meetings in the field prior to work with high or non-routine environmental risk.
3.5 Audits and Operational Assessments
In calendar year 2018, the M&O contract was transitioning from National Security Technologies, LLC (NSTec), to MSTS and the prior NSTec EMS could not transfer to MSTS. Because of this, the ISO 14001 annual surveillance was not conducted. The new contract requires MSTS to develop a plan to develop an EMS that conforms to ISO 14001-2015. In the interim, MSTS continues the programs and processes certified under ISO 14001:2004.
MSTS conducts internal management assessments and compliance evaluations. These assessments and evaluations determine the extent of compliance with environmental regulations, DOE sustainability goals, and identify areas for overall improvement. In FY 2018, MSTS conducted 9 internal environmental protection
management assessments and 114 environmental inspections.
3.6 EMS Effectiveness and Reporting
The 2018 Facility EMS Annual Report Data for the NNSS was entered into the DOE Headquarters EMS database during January 2019. This database is accessed through the FedCenter.gov website (http://www.fedcenter.gov/programs/ems/). This database gathers information in several EMS areas from all DOE
sites to produce a combined report reflecting DOE’s overall performance compared to other federal agencies. The report includes a scorecard section, which is a series of questions regarding a site’s EMS effectiveness in meeting the objectives of federal EMS directives. The NNSS scored “red” because an ISO 14001:2015-conforming EMS was yet to be developed by MSTS.
3.7 Awards, Recognition, and Outreach
The NNSS Fleet, Fuel and Equipment (FFE) department received three awards:
1. North American Fleet Association (NAFA) Flexy award winner – Excellence in Fleet Sustainability (Public). NAFA is a non-profit professional society for member professionals who manage fleets of
automobiles, SUVs [sport utility vehicle], trucks, vans, and specialized mobile equipment in the U.S. and Canada.
2. Outstanding Sustainability Program/Project from DOE – recognized by DOE for their outstanding contribution in sustainability at this year’s Energy Exchange and Better Buildings Summit.
3. 2018 NNSA Outstanding Sustainability Program (Small Site Winner) – In FY 2018, NNSA recognized
NNSS FFE Services for Outstanding Sustainability Program. NNSS FFE Services “consistently demonstrates leadership and exceptional environmental stewardship of NNSS’s fleet by instituting processes and developing procedures that achieve and surpass DOE’s sustainability goals.”
Earth Day events included a plastic bag exchange, electronic recycling, plastic pledge, and a sustainability theatre event. A total of over 1,000 pounds of clothing items and shoes were diverted from the landfill by donating them to Safe Nest. Club Ride encouraged employees to participate in the Club Ride rewards program and to use alternative types of commuting. Safe Nest exchanged information with employees on how they could divert items from going to the landfill by donating gently used clothes or small household items to the Safe Nest Donation Center. The Habitat for Humanity ReStore shared information about their donation store and the services they
provide to divert hundreds of tons from the landfill each year.
Environmental Management System
Nevada National Security Site Environmental Report 2018 39
Activities for Energy Action Month included a Sustainable Home Energy Tour, an online ECO Scavenger Hunt, the hosting of a bin for Safe Nest, a Lunch and Learn, two Republic Services Recycling Center Tours, FREE Home Energy Assessments, and collaboration with DOGS of OPSEC (Operations Security) at their Shred Day
event and the Health and Productivity Department at their Fall Health Fair/Farmers Market event. At both outreach activities, our employees were educated on how to integrate and embrace sustainability into their day-to-day activities.
3.8 References
DOE, see U.S. Department of Energy.
Mission Support and Test Services, LLC, 2019. NNSA/NFO Site Sustainability Plan. Las Vegas, NV, January 2019.
MSTS, see Mission Support and Test Services, LLC.
U.S. Department of Energy, 2010. 2010 Strategic Sustainability Performance Plan. Report to the White House Council on Environmental Quality. Available at: https://www.energy.gov/sites/prod/files/edg/media/DOE_Sustainability_Plan_2010.PDF as accessed on
July 29, 2019.
———, 2018. FY 2019 Site Sustainability Plan Guidance Document, U.S. Department of Energy Sustainability Performance Office, September 2018. Available at: https://sustainabilitydashboard.doe.gov/PDF/Resources/2019%20Site%20Sustainability%20Plan%20Guidance.pdf as accessed on July 29, 2019.

Environmental Management System
40 Nevada National Security Site Environmental Report 2018
THIS PAGE INTENTIONALLY LEFT BLANK
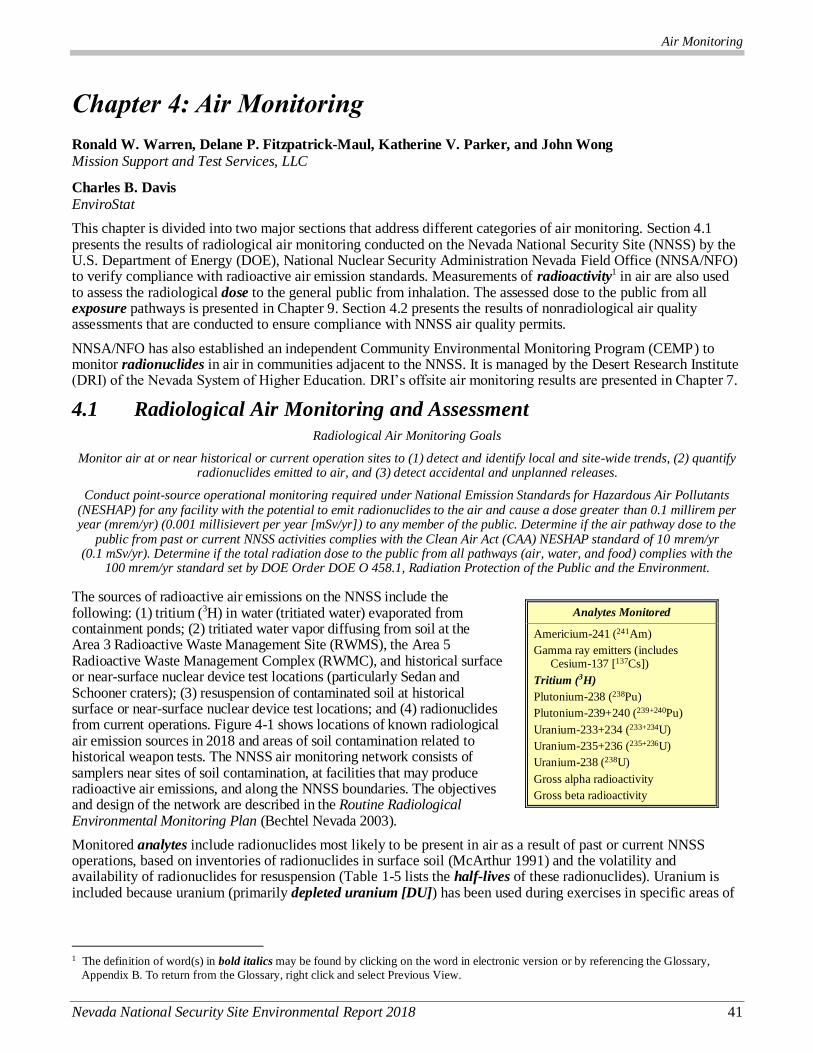
Air Monitoring
Nevada National Security Site Environmental Report 2018 41
4.0 Ch4
Chapter 4: Air Monitoring
Ronald W. Warren, Delane P. Fitzpatrick-Maul, Katherine V. Parker, and John Wong
Mission Support and Test Services, LLC
Charles B. Davis
EnviroStat
This chapter is divided into two major sections that address different categories of air monitoring. Section 4.1 presents the results of radiological air monitoring conducted on the Nevada National Security Site (NNSS) by the U.S. Department of Energy (DOE), National Nuclear Security Administration Nevada Field Office (NNSA/NFO) to verify compliance with radioactive air emission standards. Measurements of radioactivity1 in air are also used to assess the radiological dose to the general public from inhalation. The assessed dose to the public from all exposure pathways is presented in Chapter 9. Section 4.2 presents the results of nonradiological air quality assessments that are conducted to ensure compliance with NNSS air quality permits.
NNSA/NFO has also established an independent Community Environmental Monitoring Program (CEMP) to monitor radionuclides in air in communities adjacent to the NNSS. It is managed by the Desert Research Institute (DRI) of the Nevada System of Higher Education. DRI’s offsite air monitoring results are presented in Chapter 7.
4.1 Radiological Air Monitoring and Assessment
Radiological Air Monitoring Goals
Monitor air at or near historical or current operation sites to (1) detect and identify local and site-wide trends, (2) quantify radionuclides emitted to air, and (3) detect accidental and unplanned releases.
Conduct point-source operational monitoring required under National Emission Standards for Hazardous Air Pollutants (NESHAP) for any facility with the potential to emit radionuclides to the air and cause a dose greater than 0.1 millirem per year (mrem/yr) (0.001 millisievert per year [mSv/yr]) to any member of the public. Determine if the air pathway dose to the
public from past or current NNSS activities complies with the Clean Air Act (CAA) NESHAP standard of 10 mrem/yr (0.1 mSv/yr). Determine if the total radiation dose to the public from all pathways (air, water, and food) complies with the
100 mrem/yr standard set by DOE Order DOE O 458.1, Radiation Protection of the Public and the Environment.
The sources of radioactive air emissions on the NNSS include the following: (1) tritium (3H) in water (tritiated water) evaporated from containment ponds; (2) tritiated water vapor diffusing from soil at the Area 3 Radioactive Waste Management Site (RWMS), the Area 5 Radioactive Waste Management Complex (RWMC), and historical surface or near-surface nuclear device test locations (particularly Sedan and Schooner craters); (3) resuspension of contaminated soil at historical surface or near-surface nuclear device test locations; and (4) radionuclides from current operations. Figure 4-1 shows locations of known radiological air emission sources in 2018 and areas of soil contamination related to historical weapon tests. The NNSS air monitoring network consists of samplers near sites of soil contamination, at facilities that may produce radioactive air emissions, and along the NNSS boundaries. The objectives and design of the network are described in the Routine Radiological Environmental Monitoring Plan (Bechtel Nevada 2003).
Monitored analytes include radionuclides most likely to be present in air as a result of past or current NNSS operations, based on inventories of radionuclides in surface soil (McArthur 1991) and the volatility and availability of radionuclides for resuspension (Table 1-5 lists the half-lives of these radionuclides). Uranium is included because uranium (primarily depleted uranium [DU]) has been used during exercises in specific areas of
1 The definition of word(s) in bold italics may be found by clicking on the word in electronic version or by referencing the Glossary,
Appendix B. To return from the Glossary, right click and select Previous View.
Analytes Monitored
Americium-241 (241Am)
Gamma ray emitters (includes Cesium-137 [137Cs])
Tritium (3H)
Plutonium-238 (238Pu)
Plutonium-239+240 (239+240Pu)
Uranium-233+234 (233+234U)
Uranium-235+236 (235+236U)
Uranium-238 (238U)
Gross alpha radioactivity
Gross beta radioactivity
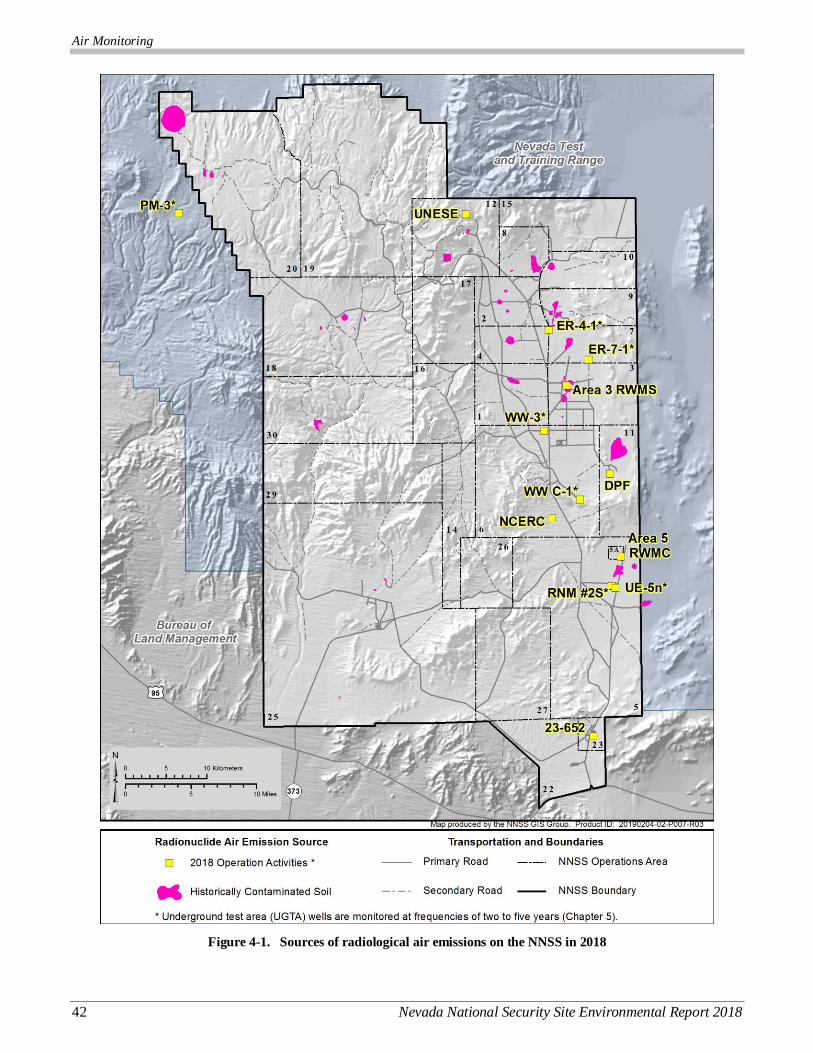
Air Monitoring
42 Nevada National Security Site Environmental Report 2018
Figure 4-1. Sources of radiological air emissions on the NNSS in 2018
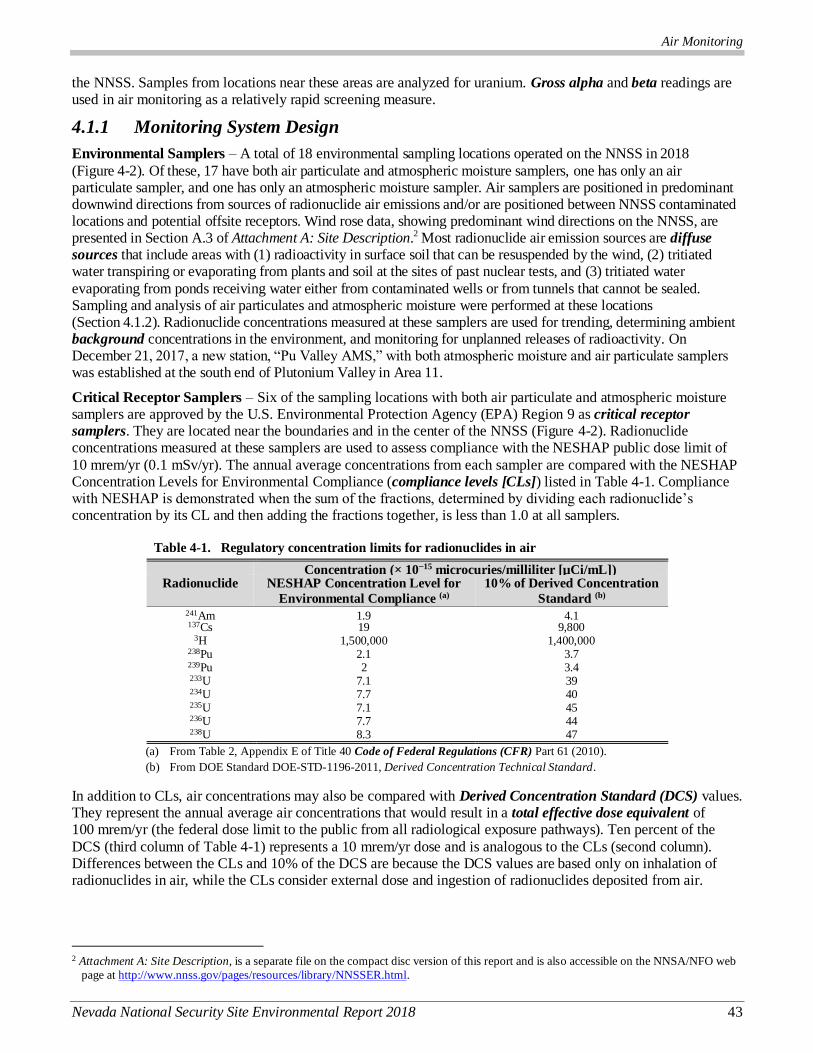
Air Monitoring
Nevada National Security Site Environmental Report 2018 43
the NNSS. Samples from locations near these areas are analyzed for uranium. Gross alpha and beta readings are used in air monitoring as a relatively rapid screening measure.
4.1.1 Monitoring System Design
Environmental Samplers – A total of 18 environmental sampling locations operated on the NNSS in 2018
(Figure 4-2). Of these, 17 have both air particulate and atmospheric moisture samplers, one has only an air particulate sampler, and one has only an atmospheric moisture sampler. Air samplers are positioned in predominant downwind directions from sources of radionuclide air emissions and/or are positioned between NNSS contaminated locations and potential offsite receptors. Wind rose data, showing predominant wind directions on the NNSS, are presented in Section A.3 of Attachment A: Site Description.2 Most radionuclide air emission sources are diffuse
sources that include areas with (1) radioactivity in surface soil that can be resuspended by the wind, (2) tritiated water transpiring or evaporating from plants and soil at the sites of past nuclear tests, and (3) tritiated water
evaporating from ponds receiving water either from contaminated wells or from tunnels that cannot be sealed. Sampling and analysis of air particulates and atmospheric moisture were performed at these locations (Section 4.1.2). Radionuclide concentrations measured at these samplers are used for trending, determining ambient background concentrations in the environment, and monitoring for unplanned releases of radioactivity. On December 21, 2017, a new station, “Pu Valley AMS,” with both atmospheric moisture and air particulate samplers was established at the south end of Plutonium Valley in Area 11.
Critical Receptor Samplers – Six of the sampling locations with both air particulate and atmospheric moisture samplers are approved by the U.S. Environmental Protection Agency (EPA) Region 9 as critical receptor
samplers. They are located near the boundaries and in the center of the NNSS (Figure 4-2). Radionuclide concentrations measured at these samplers are used to assess compliance with the NESHAP public dose limit of
10 mrem/yr (0.1 mSv/yr). The annual average concentrations from each sampler are compared with the NESHAP Concentration Levels for Environmental Compliance (compliance levels [CLs]) listed in Table 4-1. Compliance with NESHAP is demonstrated when the sum of the fractions, determined by dividing each radionuclide’s concentration by its CL and then adding the fractions together, is less than 1.0 at all samplers.
Table 4-1. Regulatory concentration limits for radionuclides in air
Concentration (× 10−15 microcuries/milliliter [µCi/mL]) Radionuclide NESHAP Concentration Level for
Environmental Compliance (a)
10% of Derived Concentration
Standard (b) 241Am 1.9 4.1 137Cs 19 9,800
3H 1,500,000 1,400,000 238Pu 2.1 3.7 239Pu 2 3.4 233U 7.1 39 234U 7.7 40 235U 7.1 45 236U 7.7 44 238U 8.3 47
(a) From Table 2, Appendix E of Title 40 Code of Federal Regulations (CFR) Part 61 (2010).
(b) From DOE Standard DOE-STD-1196-2011, Derived Concentration Technical Standard.
In addition to CLs, air concentrations may also be compared with Derived Concentration Standard (DCS) values. They represent the annual average air concentrations that would result in a total effective dose equivalent of 100 mrem/yr (the federal dose limit to the public from all radiological exposure pathways). Ten percent of the
DCS (third column of Table 4-1) represents a 10 mrem/yr dose and is analogous to the CLs (second column). Differences between the CLs and 10% of the DCS are because the DCS values are based only on inhalation of radionuclides in air, while the CLs consider external dose and ingestion of radionuclides deposited from air.
2 Attachment A: Site Description, is a separate file on the compact disc version of this report and is also accessible on the NNSA/NFO web
page at http://www.nnss.gov/pages/resources/library/NNSSER.html.
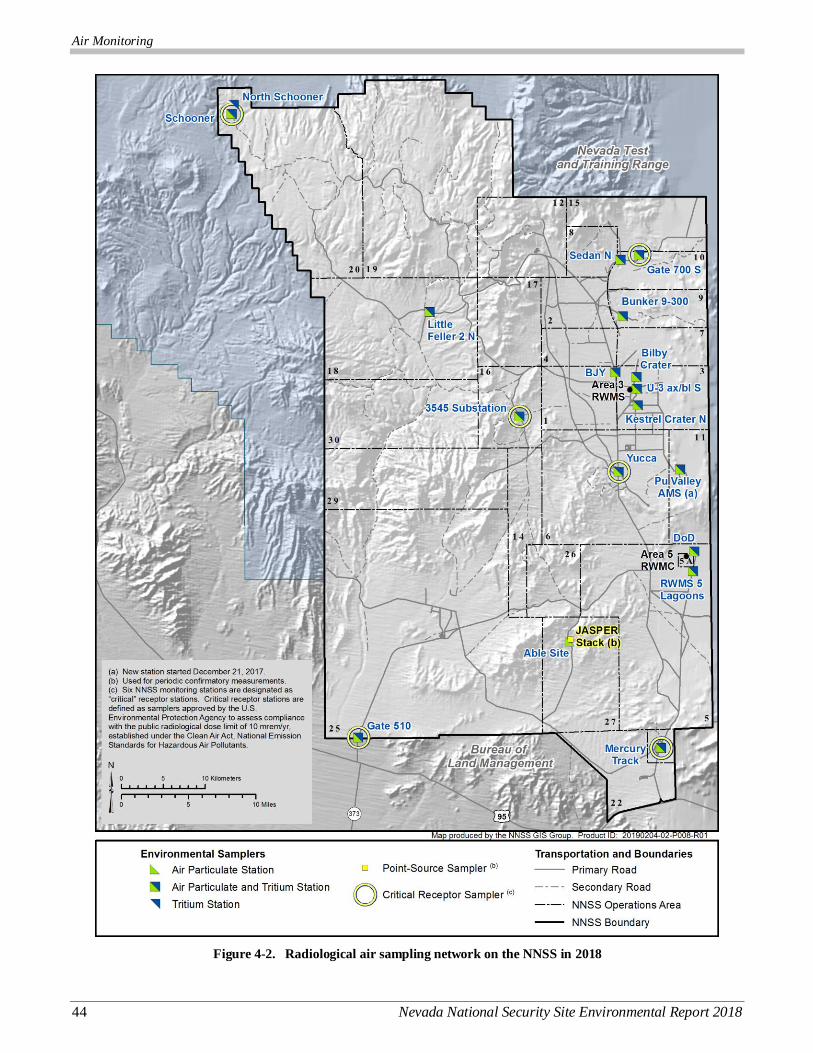
Air Monitoring
44 Nevada National Security Site Environmental Report 2018
Figure 4-2. Radiological air sampling network on the NNSS in 2018
Air Monitoring
Nevada National Security Site Environmental Report 2018 45
Because of this, and the fact the CLs are regulatory values, the CLs are generally the more conservative of the two and are used to demonstrate compliance. Air concentrations approaching 10% of the CLs are investigated for causes that may be mitigated in order to ensure that regulatory dose limits are not exceeded.
Point-Source (Stack) Sampler – Continuous stack monitoring has been conducted in the past at one facility on the NNSS, the Joint Actinide Shock Physics Experimental Research (JASPER) facility in Area 27 (Figure 4-2).
In 2013, the potential air emissions from the facility were re-evaluated and determined to result in a potential dose that is much less than the 0.1 mrem/yr threshold at which stack monitoring is required under NESHAP. Therefore, only periodic sampling is recommended to verify low emissions. In 2018, one sample was taken from April 24–25
for this purpose. No man-made radionuclides were detected in the sample, which confirms continued low emissions.
4.1.2 Air Particulate and Tritium Sampling Methods
A sample is collected from each air particulate sampler by drawing air through a 10-centimeter (4-inch) diameter glass-fiber filter at a flow rate of about 85 liters (3 cubic feet [ft3]) per minute. The particulate filter is mounted in a filter holder that faces downward at a height of 1.5 meters (m) (5 feet [ft]) above ground. A timer measures the operating time. The run time multiplied by the flow rate yields the volume of air sampled, which is about 1,720 cubic meters (m3) (60,000 ft3) during a typical 14-day sampling period. The air sampling rates are measured using
mass-flow meters that are calibrated annually. The filters are collected every 2 weeks.
Filters are analyzed for gross alpha and gross beta radioactivity after an approximate 5-day holding time to allow for the decay of naturally occurring radon progeny. They are then composited quarterly for each sampler. The
composite samples are analyzed for gamma-emitting radionuclides (which includes 137Cs) by gamma spectroscopy and for 238Pu, 239+240Pu, and 241Am by alpha spectroscopy after chemical separation. Samples from nine locations relatively near potential sources of uranium emissions are also analyzed for uranium isotopes by alpha spectroscopy. These sampling locations are: BJY (Area 1), RWMS 5 Lagoons (Area 5), Yucca (Area 6), Bunker 9-300 (Area 9), Sedan Crater N (Area 10), Gate 700 S (Area 10), 3545 Substation (Area 16), Gate 510 (Area 25), and Able Site (Area 27).
Water in the atmosphere is sampled continuously at a flow rate of about 566 cubic centimeters per minute (1.2 ft3 per hour) with elapsed time meters. The total volume sampled is determined from the product of the sampling period and the flow rate (about 11 m3 [388 ft3] over a 2-week sampling period). The atmospheric moisture is
removed from the airstream by a molecular sieve desiccant that is exchanged biweekly. The water is extracted from the desiccant and analyzed for 3H by liquid scintillation counting.
Measured radioactivity in each sample is converted to units per volume of air prior to the reporting described in
the following sections.
Quality control air samples (e.g., duplicates, blanks, and spikes) are also routinely incorporated into the analytical
suites. Chapter 14 contains a discussion of quality assurance/quality control protocols and procedures.
4.1.3 Presentation of Air Sampling Data
The 2018 annual average radionuclide concentrations at each air sampling location are presented in the following sections. The annual average (mean) concentration for each radionuclide is estimated from uncensored analytical results for individual samples; i.e., values less than their analysis-specific minimum detectable concentrations
(MDCs) are included in the calculation. 239+240Pu, 233+234U, and 235+236U are reported as the sum of isotope concentrations because the analytical method cannot readily distinguish the individual isotopes. Where field duplicate measurements are available, plots and summaries use the average of the regular and field duplicate
measurements.
In graphs of concentration data in the following figures, the CL (second column of Table 4-1) or a fraction of the CL is included as a dashed green horizontal line. For graphs displaying individual measurements, the CL or
fraction thereof is shown for reference only; assessment of NESHAP compliance is based on annual average concentrations rather than individual measurements.
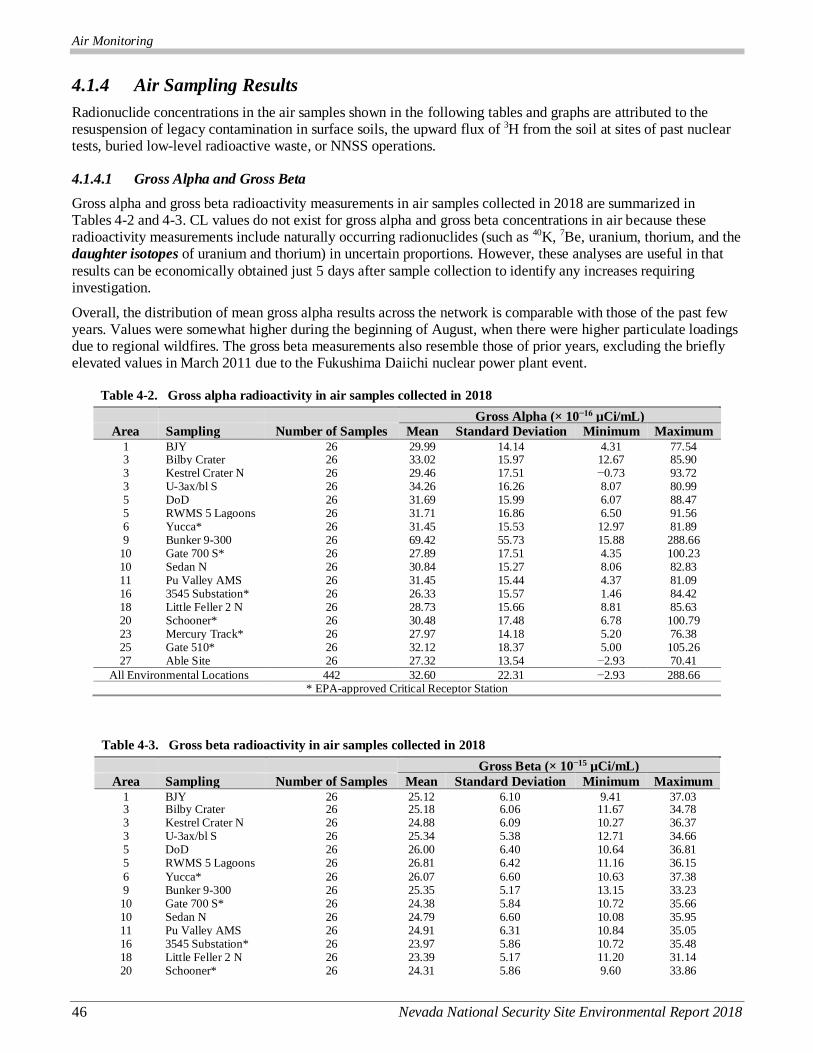
Air Monitoring
46 Nevada National Security Site Environmental Report 2018
4.1.4 Air Sampling Results
Radionuclide concentrations in the air samples shown in the following tables and graphs are attributed to the resuspension of legacy contamination in surface soils, the upward flux of 3H from the soil at sites of past nuclear tests, buried low-level radioactive waste, or NNSS operations.
4.1.4.1 Gross Alpha and Gross Beta
Gross alpha and gross beta radioactivity measurements in air samples collected in 2018 are summarized in Tables 4-2 and 4-3. CL values do not exist for gross alpha and gross beta concentrations in air because these radioactivity measurements include naturally occurring radionuclides (such as 40K, 7Be, uranium, thorium, and the daughter isotopes of uranium and thorium) in uncertain proportions. However, these analyses are useful in that
results can be economically obtained just 5 days after sample collection to identify any increases requiring investigation.
Overall, the distribution of mean gross alpha results across the network is comparable with those of the past few years. Values were somewhat higher during the beginning of August, when there were higher particulate loadings due to regional wildfires. The gross beta measurements also resemble those of prior years, excluding the briefly elevated values in March 2011 due to the Fukushima Daiichi nuclear power plant event.
Table 4-2. Gross alpha radioactivity in air samples collected in 2018
Gross Alpha (× 10−16 µCi/mL) Area Sampling
Station
Number of Samples Mean Standard Deviation Minimum Maximum 1 BJY 26 29.99 14.14 4.31 77.54 3 Bilby Crater 26 33.02 15.97 12.67 85.90 3 Kestrel Crater N 26 29.46 17.51 −0.73 93.72 3 U-3ax/bl S 26 34.26 16.26 8.07 80.99 5 DoD 26 31.69 15.99 6.07 88.47 5 RWMS 5 Lagoons 26 31.71 16.86 6.50 91.56 6 Yucca* 26 31.45 15.53 12.97 81.89 9 Bunker 9-300 26 69.42 55.73 15.88 288.66
10 Gate 700 S* 26 27.89 17.51 4.35 100.23 10 Sedan N 26 30.84 15.27 8.06 82.83 11 Pu Valley AMS 26 31.45 15.44 4.37 81.09 16 3545 Substation* 26 26.33 15.57 1.46 84.42 18 Little Feller 2 N 26 28.73 15.66 8.81 85.63 20 Schooner* 26 30.48 17.48 6.78 100.79 23 Mercury Track* 26 27.97 14.18 5.20 76.38 25 Gate 510* 26 32.12 18.37 5.00 105.26 27 Able Site 26 27.32 13.54 −2.93 70.41
All Environmental Locations 442 32.60 22.31 −2.93 288.66 * EPA-approved Critical Receptor Station
Table 4-3. Gross beta radioactivity in air samples collected in 2018
Gross Beta (× 10−15 µCi/mL)
Area Sampling
Station
Number of Samples Mean Standard Deviation Minimum Maximum 1 BJY 26 25.12 6.10 9.41 37.03 3 Bilby Crater 26 25.18 6.06 11.67 34.78 3 Kestrel Crater N 26 24.88 6.09 10.27 36.37 3 U-3ax/bl S 26 25.34 5.38 12.71 34.66 5 DoD 26 26.00 6.40 10.64 36.81 5 RWMS 5 Lagoons 26 26.81 6.42 11.16 36.15
6 Yucca* 26 26.07 6.60 10.63 37.38 9 Bunker 9-300 26 25.35 5.17 13.15 33.23 10 Gate 700 S* 26 24.38 5.84 10.72 35.66 10 Sedan N 26 24.79 6.60 10.08 35.95 11 Pu Valley AMS 26 24.91 6.31 10.84 35.05 16 3545 Substation* 26 23.97 5.86 10.72 35.48 18 Little Feller 2 N 26 23.39 5.17 11.20 31.14 20 Schooner* 26 24.31 5.86 9.60 33.86
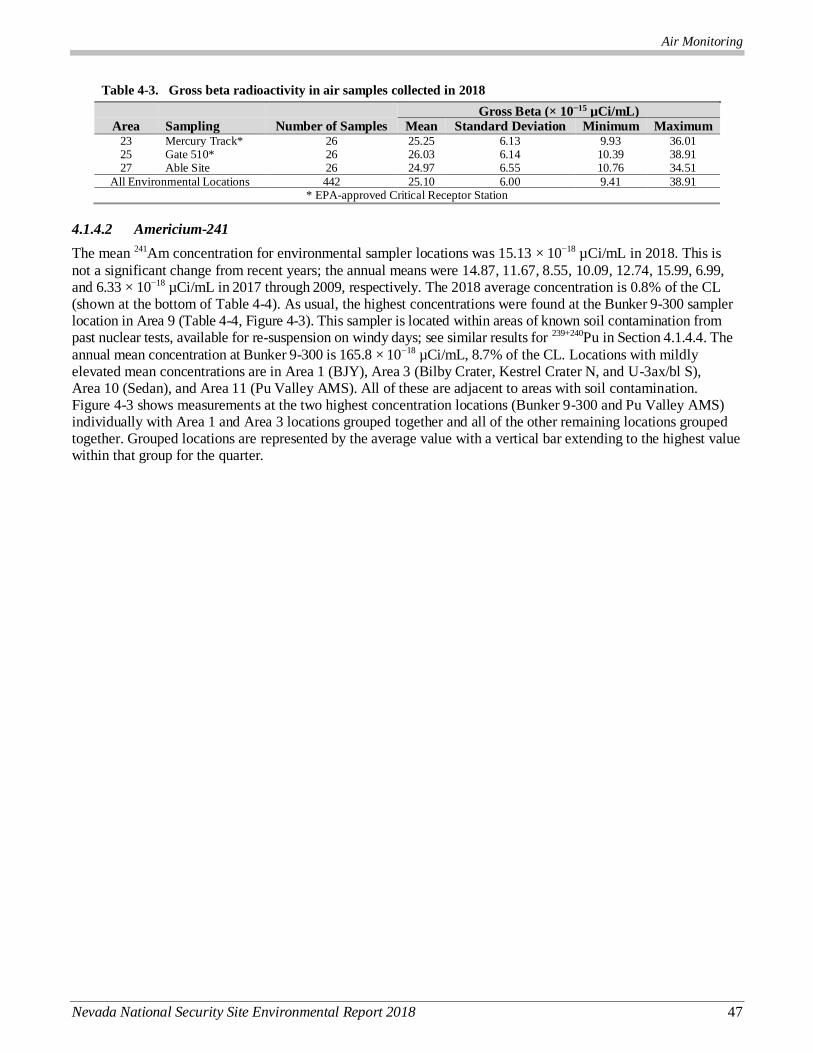
Air Monitoring
Nevada National Security Site Environmental Report 2018 47
Table 4-3. Gross beta radioactivity in air samples collected in 2018
Gross Beta (× 10−15 µCi/mL) Area Sampling
Station
Number of Samples Mean Standard Deviation Minimum Maximum 23 Mercury Track* 26 25.25 6.13 9.93 36.01 25 Gate 510* 26 26.03 6.14 10.39 38.91 27 Able Site 26 24.97 6.55 10.76 34.51
All Environmental Locations 442 25.10 6.00 9.41 38.91 * EPA-approved Critical Receptor Station
4.1.4.2 Americium-241
The mean 241Am concentration for environmental sampler locations was 15.13 × 10⁻¹⁸ µCi/mL in 2018. This is
not a significant change from recent years; the annual means were 14.87, 11.67, 8.55, 10.09, 12.74, 15.99, 6.99, and 6.33 × 10⁻¹⁸ µCi/mL in 2017 through 2009, respectively. The 2018 average concentration is 0.8% of the CL (shown at the bottom of Table 4-4). As usual, the highest concentrations were found at the Bunker 9-300 sampler location in Area 9 (Table 4-4, Figure 4-3). This sampler is located within areas of known soil contamination from past nuclear tests, available for re-suspension on windy days; see similar results for 239+240Pu in Section 4.1.4.4. The
annual mean concentration at Bunker 9-300 is 165.8 × 10⁻¹⁸ µCi/mL, 8.7% of the CL. Locations with mildly elevated mean concentrations are in Area 1 (BJY), Area 3 (Bilby Crater, Kestrel Crater N, and U-3ax/bl S), Area 10 (Sedan), and Area 11 (Pu Valley AMS). All of these are adjacent to areas with soil contamination. Figure 4-3 shows measurements at the two highest concentration locations (Bunker 9-300 and Pu Valley AMS) individually with Area 1 and Area 3 locations grouped together and all of the other remaining locations grouped together. Grouped locations are represented by the average value with a vertical bar extending to the highest value within that group for the quarter.
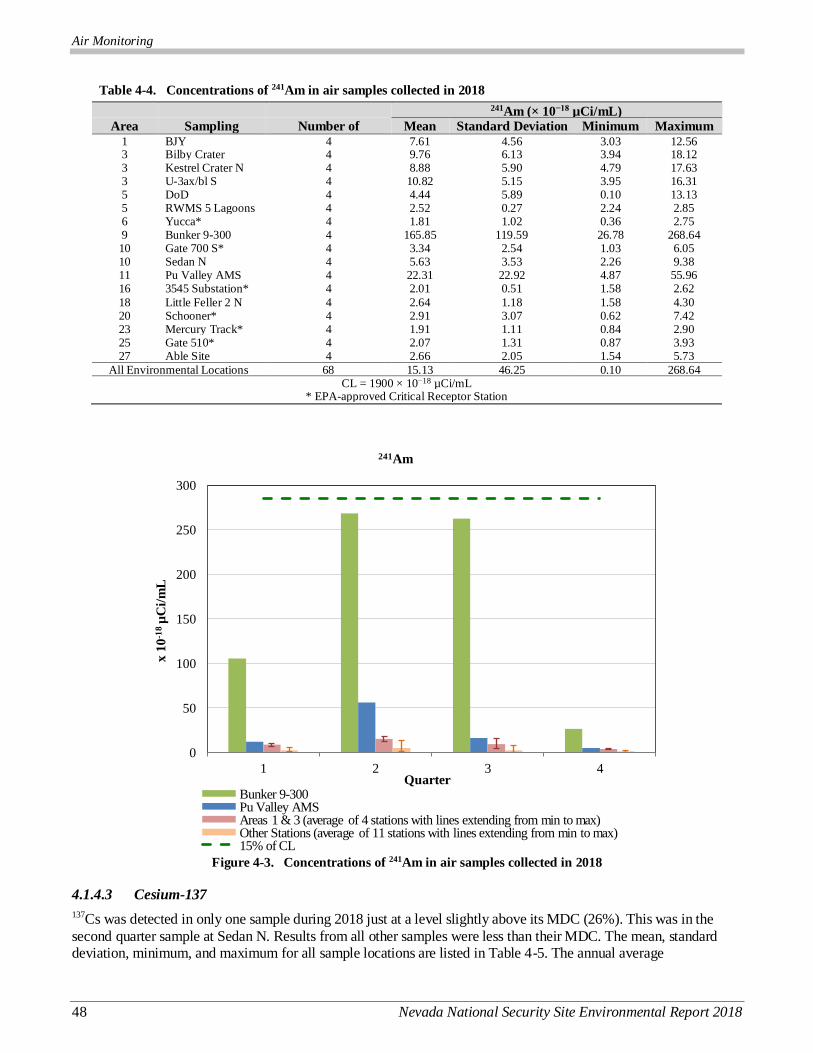
Air Monitoring
48 Nevada National Security Site Environmental Report 2018
Table 4-4. Concentrations of 241Am in air samples collected in 2018
241Am (× 10−18 µCi/mL) Area Sampling
Station
Number of
Samples
Mean Standard Deviation Minimum Maximum 1 BJY 4 7.61 4.56 3.03 12.56 3 Bilby Crater 4 9.76 6.13 3.94 18.12 3 Kestrel Crater N 4 8.88 5.90 4.79 17.63 3 U-3ax/bl S 4 10.82 5.15 3.95 16.31 5 DoD 4 4.44 5.89 0.10 13.13 5 RWMS 5 Lagoons 4 2.52 0.27 2.24 2.85 6 Yucca* 4 1.81 1.02 0.36 2.75 9 Bunker 9-300 4 165.85 119.59 26.78 268.64 10 Gate 700 S* 4 3.34 2.54 1.03 6.05 10 Sedan N 4 5.63 3.53 2.26 9.38 11 Pu Valley AMS 4 22.31 22.92 4.87 55.96 16 3545 Substation* 4 2.01 0.51 1.58 2.62
18 Little Feller 2 N 4 2.64 1.18 1.58 4.30 20 Schooner* 4 2.91 3.07 0.62 7.42 23 Mercury Track* 4 1.91 1.11 0.84 2.90 25 Gate 510* 4 2.07 1.31 0.87 3.93 27 Able Site 4 2.66 2.05 1.54 5.73
All Environmental Locations 68 15.13 46.25 0.10 268.64 CL = 1900 × 10−18 µCi/mL
* EPA-approved Critical Receptor Station
Figure 4-3. Concentrations of 241Am in air samples collected in 2018
4.1.4.3 Cesium-137
137Cs was detected in only one sample during 2018 just at a level slightly above its MDC (26%). This was in the
second quarter sample at Sedan N. Results from all other samples were less than their MDC. The mean, standard deviation, minimum, and maximum for all sample locations are listed in Table 4-5. The annual average
0
50
100
150
200
250
300
1 2 3 4
x 1
0-1
8µ
Ci/
mL
Quarter
241Am
Bunker 9-300Pu Valley AMSAreas 1 & 3 (average of 4 stations with lines extending from min to max)Other Stations (average of 11 stations with lines extending from min to max)15% of CL
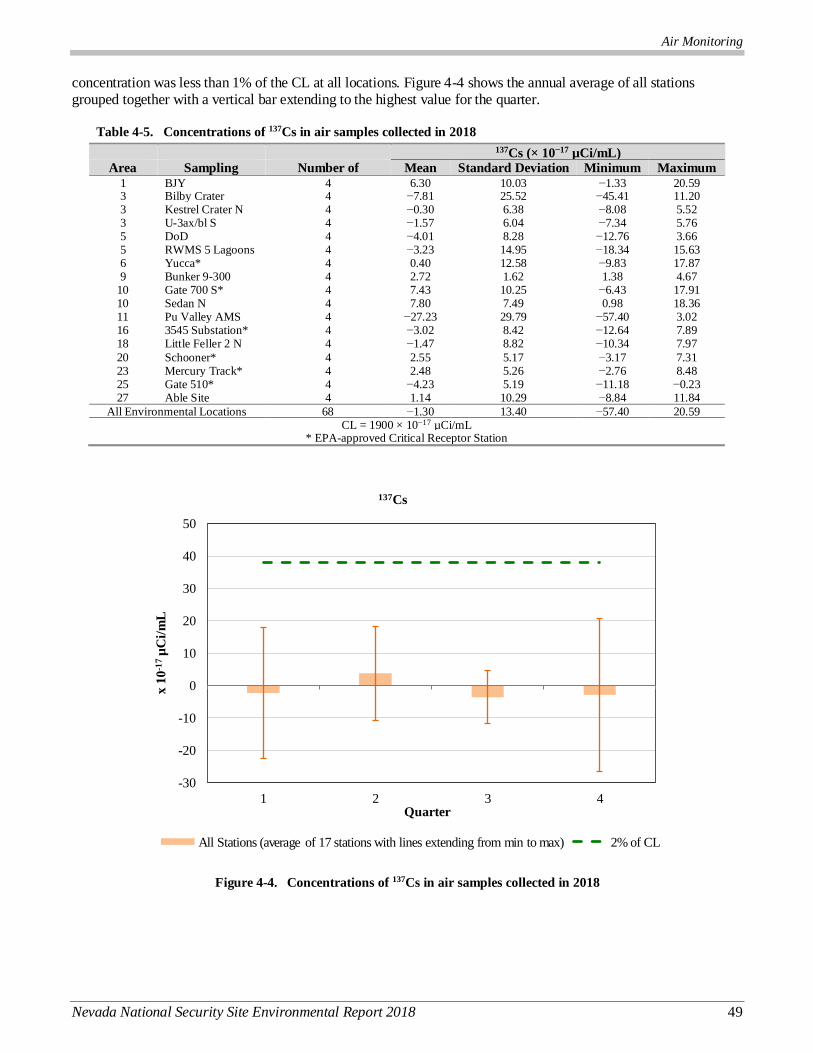
Air Monitoring
Nevada National Security Site Environmental Report 2018 49
concentration was less than 1% of the CL at all locations. Figure 4-4 shows the annual average of all stations grouped together with a vertical bar extending to the highest value for the quarter.
Table 4-5. Concentrations of 137Cs in air samples collected in 2018
137Cs (× 10−17 µCi/mL)
Area Sampling
Station
Number of
Samples
Mean Standard Deviation Minimum Maximum 1 BJY 4 6.30 10.03 −1.33 20.59 3 Bilby Crater 4 −7.81 25.52 −45.41 11.20 3 Kestrel Crater N 4 −0.30 6.38 −8.08 5.52 3 U-3ax/bl S 4 −1.57 6.04 −7.34 5.76 5 DoD 4 −4.01 8.28 −12.76 3.66 5 RWMS 5 Lagoons 4 −3.23 14.95 −18.34 15.63 6 Yucca* 4 0.40 12.58 −9.83 17.87 9 Bunker 9-300 4 2.72 1.62 1.38 4.67
10 Gate 700 S* 4 7.43 10.25 −6.43 17.91 10 Sedan N 4 7.80 7.49 0.98 18.36 11 Pu Valley AMS 4 −27.23 29.79 −57.40 3.02 16 3545 Substation* 4 −3.02 8.42 −12.64 7.89 18 Little Feller 2 N 4 −1.47 8.82 −10.34 7.97
20 Schooner* 4 2.55 5.17 −3.17 7.31 23 Mercury Track* 4 2.48 5.26 −2.76 8.48 25 Gate 510* 4 −4.23 5.19 −11.18 −0.23 27 Able Site 4 1.14 10.29 −8.84 11.84
All Environmental Locations 68 −1.30 13.40 −57.40 20.59 CL = 1900 × 10−17 µCi/mL
* EPA-approved Critical Receptor Station
Figure 4-4. Concentrations of 137Cs in air samples collected in 2018
-30
-20
-10
0
10
20
30
40
50
1 2 3 4
x 1
0-1
7µ
Ci/
mL
Quarter
137Cs
All Stations (average of 17 stations with lines extending from min to max) 2% of CL

Air Monitoring
50 Nevada National Security Site Environmental Report 2018
4.1.4.4 Cobalt-60
Cobalt-60 was detected in the same second quarter sample at Sedan N that had the 137Cs detection. Results from all other samples at this and all other locations were less than their MDC. Though the concentration (6.94 × 10⁻¹⁶ µCi/mL) was low (4.1% of CL), it was readily detectible at five times the MDC. This was verified by a second analysis. Cobalt-60 is an activation product common to all past atmospheric nuclear test locations. Because it has a relatively short half-life of 5.26 years, it is not commonly observed in current samples. Results
for this particular radionuclide are only reported by the analytical laboratory if the result is greater than the MDC. Since there were no other samples that met this criteria, there are no data to be used to calculate statistics (mean, standard deviation minimum, and maximum) for all stations. Therefore, no summary table or figure is presented for this radionuclide.
4.1.4.5 Plutonium Isotopes
The overall mean concentration for 238Pu at environmental samplers in 2018 (1.99 × 10⁻¹⁸ µCi/mL) (Table 4-6) is within the range of values (1.15 to 5.54 × 10⁻¹⁸ µCi/mL) observed from 2009 through 2017. The highest 2018 mean
(11.22 × 10⁻¹⁸ µCi/mL) was at Bunker 9-300 in Area 9; this is 0.5% of the CL (Figure 4-5).
The 239+240Pu isotopes are of greater abundance and hence greater interest. The overall mean of 83.04 × 10⁻¹⁸ µCi/mL in 2018 (Table 4-7) is within the range of values measured during 2009–2017 (33.47 to 96.46 × 10⁻¹⁸ µCi/mL). The
location with the highest mean, as usual, is Bunker 9-300 (1,039 × 10−18 µCi/mL, 52.0% of the CL; Table 4-7 and Figure 4-6). The higher plutonium values at this sampler are primarily due to diffuse sources of radionuclides from historical nuclear testing in Area 9. Other samplers with relatively higher values are Sedan N and samplers in Areas 1, 3, and 11; these are represented individually in the plots.
The concentrations of 241Am, 239+240Pu, and to some extent 238Pu, show similar patterns through time at Bunker 9-300 (Figures 4-3, 4-6, and 4-5, respectively). This is because 241Am is the long-lived daughter product obtained when 241Pu (a short-lived isotope created along with the more common Pu isotopes) decays by beta emission. Hence 239+240Pu and 241Am (and also 238Pu) tend to be found together in particles of Pu remaining from past nuclear tests. The half-life of 241Pu is 14.4 years, whereas that of 241Am is 432 years. Consequently, the
amount of 241Am will gradually increase temporarily as 241Pu decays, and then it will decrease.
Figure 4-7 shows long-term trends in 239+240Pu annual mean concentrations at locations with at least 15-year data histories since 1970. Rather than showing the time histories for all 50 such locations, Figure 4-7 shows the
average (geometric mean) trend lines for Areas 1 and 3; Area 5; Areas 7, 9, 10, and 15; and other areas. Areas 1, 3, 7, 9, 10, and 15 in the northeast portion of the NNSS have a legacy of soil contamination from surface and atmospheric nuclear tests and safety shots. The average annual rates of decline for these groups range from 2.2% (Areas 1 and 3) and 2.9% (Areas 7, 9, 10, and 15) to 10.7% (the “Other Areas” group). This equates to a reduction in 239+240Pu concentration by half every 31.6 years for Areas 1 and 3; 23.2 years for Areas 7, 9, 10, and 15; 6.4 years for Area 5; and 6.2 years for the “Other Areas” group. Declining rates are not attributable to radioactive
decay, as the physical half-lives of 239Pu and 240Pu are 24,110 and 6,537 years, respectively. The decreases are due
primarily to immobilization and dilution of Pu particles in surface soil, resulting in reduced concentrations re-suspended in air. The half-life of the less abundant 238Pu is 88 years.
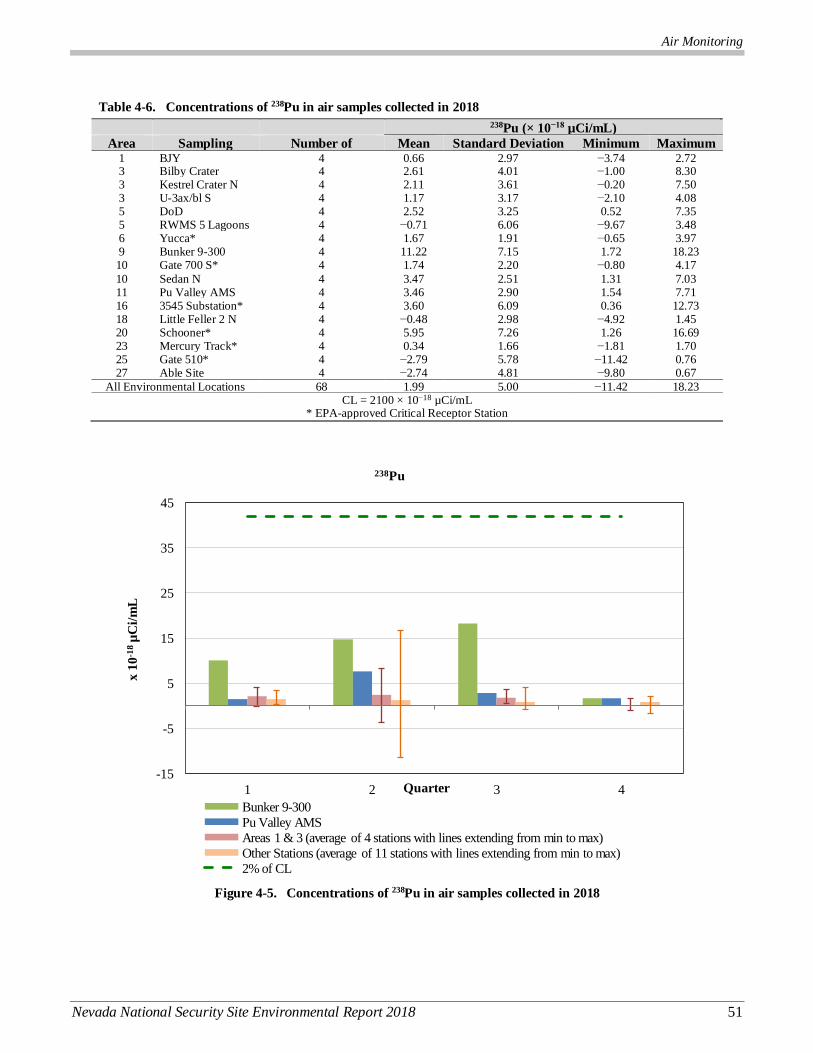
Air Monitoring
Nevada National Security Site Environmental Report 2018 51
Table 4-6. Concentrations of 238Pu in air samples collected in 2018
238Pu (× 10−18 µCi/mL)
Area Sampling
Station
Number of
Samples
Mean Standard Deviation Minimum Maximum 1 BJY 4 0.66 2.97 −3.74 2.72 3 Bilby Crater 4 2.61 4.01 −1.00 8.30 3 Kestrel Crater N 4 2.11 3.61 −0.20 7.50 3 U-3ax/bl S 4 1.17 3.17 −2.10 4.08 5 DoD 4 2.52 3.25 0.52 7.35 5 RWMS 5 Lagoons 4 −0.71 6.06 −9.67 3.48 6 Yucca* 4 1.67 1.91 −0.65 3.97 9 Bunker 9-300 4 11.22 7.15 1.72 18.23 10 Gate 700 S* 4 1.74 2.20 −0.80 4.17
10 Sedan N 4 3.47 2.51 1.31 7.03 11 Pu Valley AMS 4 3.46 2.90 1.54 7.71 16 3545 Substation* 4 3.60 6.09 0.36 12.73 18 Little Feller 2 N 4 −0.48 2.98 −4.92 1.45 20 Schooner* 4 5.95 7.26 1.26 16.69 23 Mercury Track* 4 0.34 1.66 −1.81 1.70 25 Gate 510* 4 −2.79 5.78 −11.42 0.76 27 Able Site 4 −2.74 4.81 −9.80 0.67
All Environmental Locations 68 1.99 5.00 −11.42 18.23 CL = 2100 × 10−18 µCi/mL
* EPA-approved Critical Receptor Station
Figure 4-5. Concentrations of 238Pu in air samples collected in 2018
-15
-5
5
15
25
35
45
1 2 3 4
x 1
0-1
8µ
Ci/
mL
Quarter
238Pu
Bunker 9-300
Pu Valley AMS
Areas 1 & 3 (average of 4 stations with lines extending from min to max)
Other Stations (average of 11 stations with lines extending from min to max)
2% of CL
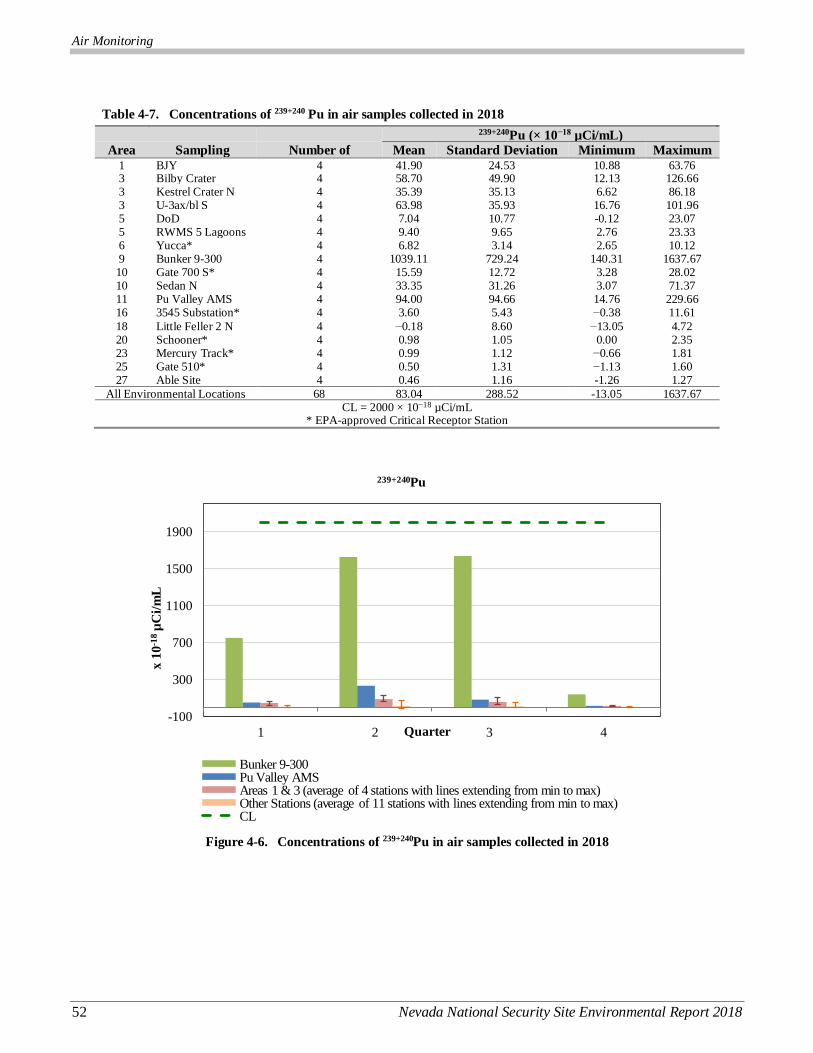
Air Monitoring
52 Nevada National Security Site Environmental Report 2018
Table 4-7. Concentrations of 239+240 Pu in air samples collected in 2018
239+240Pu (× 10−18 µCi/mL) Area Sampling
Station
Number of
Samples
Mean Standard Deviation Minimum Maximum 1 BJY 4 41.90 24.53 10.88 63.76 3 Bilby Crater 4 58.70 49.90 12.13 126.66 3 Kestrel Crater N 4 35.39 35.13 6.62 86.18 3 U-3ax/bl S 4 63.98 35.93 16.76 101.96 5 DoD 4 7.04 10.77 -0.12 23.07 5 RWMS 5 Lagoons 4 9.40 9.65 2.76 23.33 6 Yucca* 4 6.82 3.14 2.65 10.12 9 Bunker 9-300 4 1039.11 729.24 140.31 1637.67 10 Gate 700 S* 4 15.59 12.72 3.28 28.02 10 Sedan N 4 33.35 31.26 3.07 71.37 11 Pu Valley AMS 4 94.00 94.66 14.76 229.66 16 3545 Substation* 4 3.60 5.43 −0.38 11.61
18 Little Feller 2 N 4 −0.18 8.60 −13.05 4.72 20 Schooner* 4 0.98 1.05 0.00 2.35 23 Mercury Track* 4 0.99 1.12 −0.66 1.81 25 Gate 510* 4 0.50 1.31 −1.13 1.60 27 Able Site 4 0.46 1.16 -1.26 1.27
All Environmental Locations 68 83.04 288.52 -13.05 1637.67 CL = 2000 × 10−18 µCi/mL
* EPA-approved Critical Receptor Station
Figure 4-6. Concentrations of 239+240Pu in air samples collected in 2018
-100
300
700
1100
1500
1900
1 2 3 4
x 1
0-1
8µ
Ci/
mL
Quarter
239+240Pu
Bunker 9-300Pu Valley AMSAreas 1 & 3 (average of 4 stations with lines extending from min to max)Other Stations (average of 11 stations with lines extending from min to max)CL
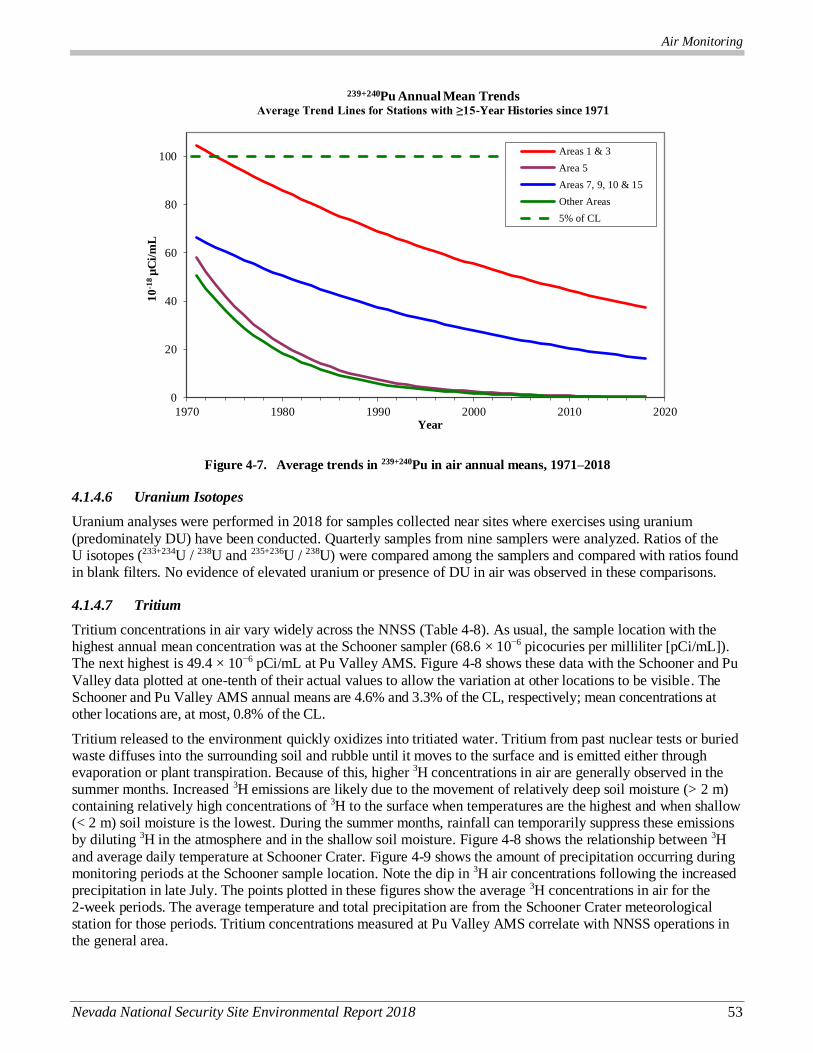
Air Monitoring
Nevada National Security Site Environmental Report 2018 53
Figure 4-7. Average trends in 239+240Pu in air annual means, 1971–2018
4.1.4.6 Uranium Isotopes
Uranium analyses were performed in 2018 for samples collected near sites where exercises using uranium
(predominately DU) have been conducted. Quarterly samples from nine samplers were analyzed. Ratios of the U isotopes (233+234U / 238U and 235+236U / 238U) were compared among the samplers and compared with ratios found in blank filters. No evidence of elevated uranium or presence of DU in air was observed in these comparisons.
4.1.4.7 Tritium
Tritium concentrations in air vary widely across the NNSS (Table 4-8). As usual, the sample location with the highest annual mean concentration was at the Schooner sampler (68.6 × 10⁻⁶ picocuries per milliliter [pCi/mL]). The next highest is 49.4 × 10⁻⁶ pCi/mL at Pu Valley AMS. Figure 4-8 shows these data with the Schooner and Pu
Valley data plotted at one-tenth of their actual values to allow the variation at other locations to be visible. The Schooner and Pu Valley AMS annual means are 4.6% and 3.3% of the CL, respectively; mean concentrations at other locations are, at most, 0.8% of the CL.
Tritium released to the environment quickly oxidizes into tritiated water. Tritium from past nuclear tests or buried waste diffuses into the surrounding soil and rubble until it moves to the surface and is emitted either through evaporation or plant transpiration. Because of this, higher 3H concentrations in air are generally observed in the summer months. Increased 3H emissions are likely due to the movement of relatively deep soil moisture (> 2 m) containing relatively high concentrations of 3H to the surface when temperatures are the highest and when shallow (< 2 m) soil moisture is the lowest. During the summer months, rainfall can temporarily suppress these emissions by diluting 3H in the atmosphere and in the shallow soil moisture. Figure 4-8 shows the relationship between 3H
and average daily temperature at Schooner Crater. Figure 4-9 shows the amount of precipitation occurring during monitoring periods at the Schooner sample location. Note the dip in 3H air concentrations following the increased precipitation in late July. The points plotted in these figures show the average 3H concentrations in air for the 2-week periods. The average temperature and total precipitation are from the Schooner Crater meteorological station for those periods. Tritium concentrations measured at Pu Valley AMS correlate with NNSS operations in the general area.
0
20
40
60
80
100
1970 1980 1990 2000 2010 2020
10
-18
µC
i/m
L
Year
239+240Pu Annual Mean TrendsAverage Trend Lines for Stations with ≥15-Year Histories since 1971
Areas 1 & 3
Area 5
Areas 7, 9, 10 & 15
Other Areas
5% of CL

Air Monitoring
54 Nevada National Security Site Environmental Report 2018
Figure 4-10 shows average (geometric mean) long-term trends for the annual mean 3H levels at locations with at least 7-year histories since 1999, by Area groups. Tritium measurements have been decreasing fairly rapidly at most locations; the overall average decline rate for samplers other than Schooner is around 9.5% per year. The
decline rate for Schooner has been about 11.4% per year since 2002.
Table 4-8. Concentrations of 3H in air samples collected in 2018
3H Concentration (× 10−6 pCi/mL)
Area Sampling Station Number of Samples Mean Standard Deviation Minimum Maximum 1 BJY 26 0.20 0.22 −0.22 0.57 3 Bilby Crater 26 0.27 0.53 −1.03 2.04 3 Kestrel Crater N 26 0.38 0.42 −0.37 1.24 3 U-3ax/bl S 26 0.30 0.33 −0.31 1.17 5 DoD 26 0.36 0.45 −0.35 1.30 5 RWMS 5 Lagoons 26 0.48 0.47 −0.19 1.72 6 Yucca* 26 0.59 1.60 −0.31 8.26 9 Bunker 9-300 26 0.32 0.40 −0.43 1.57
10 Gate 700 S* 26 0.07 0.29 −0.54 0.67 10 Sedan N 26 1.14 0.95 0.07 3.22 11 Pu Valley AMS 26 49.36 101.56 −0.11 390.65 16 3545 Substation* 26 0.15 0.35 −0.44 1.25 18 Little Feller 2 N 26 0.11 0.34 −0.37 1.05 20 North Schooner 26 1.59 1.21 0.12 3.66 20 Schooner* 26 68.56 55.77 6.80 171.90 23 Mercury Track* 26 0.17 0.33 −0.61 1.20 25 Gate 510* 26 0.13 0.29 −0.56 0.65
All Environmental Locations 442 7.16 33.28 −1.03 390.65 CL = 1500 × 10−6 pCi/mL
* EPA-approved Critical Receptor Station
Figure 4-8. Concentrations of 3H in air samples collected in 2018 with the average air temperature near the Schooner
sampler during the collection period
30
40
50
60
70
80
90
100
110
0
10
20
30
40
50
ºF
x 1
0-6
pC
i/m
L
Air Sample Collection Date
3H and Temperature
Pu Valley AMS x 0.1 Schooner x 0.1
Sedan N & North Schooner Other 13 stations with bar extending to max
3% of CL Temperature at Schooner
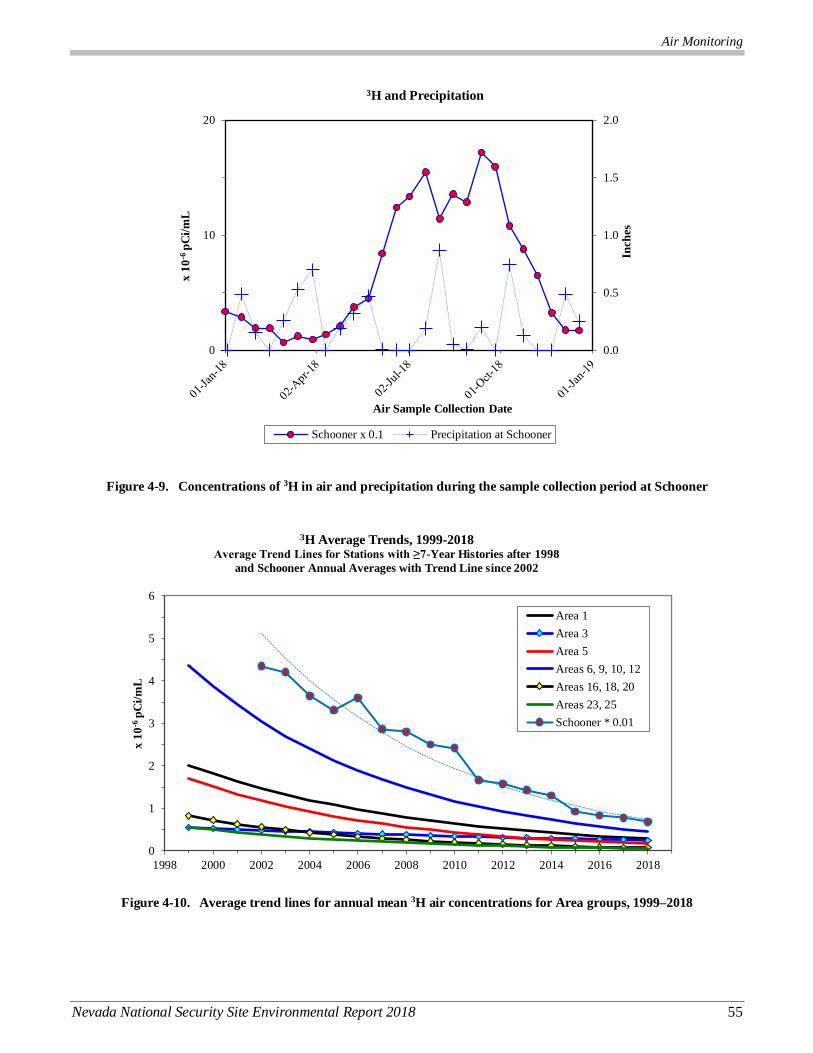
Air Monitoring
Nevada National Security Site Environmental Report 2018 55
Figure 4-9. Concentrations of 3H in air and precipitation during the sample collection period at Schooner
Figure 4-10. Average trend lines for annual mean 3H air concentrations for Area groups, 1999–2018
0.0
0.5
1.0
1.5
2.0
0
10
20
Inch
es
x 1
0-6
pC
i/m
L
Air Sample Collection Date
3H and Precipitation
Schooner x 0.1 Precipitation at Schooner
0
1
2
3
4
5
6
1998 2000 2002 2004 2006 2008 2010 2012 2014 2016 2018
x 1
0-6
pC
i/m
L
3H Average Trends, 1999-2018Average Trend Lines for Stations with ≥7-Year Histories after 1998
and Schooner Annual Averages with Trend Line since 2002
Area 1
Area 3
Area 5
Areas 6, 9, 10, 12
Areas 16, 18, 20
Areas 23, 25
Schooner * 0.01
Air Monitoring
56 Nevada National Security Site Environmental Report 2018
4.1.5 Emission Evaluations for Planned Projects
In 2018, two NESHAP evaluations for radionuclide emissions were conducted. These evaluations were to determine if activities had the potential to release airborne radionuclides that might expose the public to a dose equal to or greater than 0.1 mrem/yr. For any project or facility with this potential, the EPA requires monitoring of the emissions and possibly the submittal of an application for EPA approval prior to active operations. The predicted dose at the nearest offsite receptor for each activity evaluated in 2018 was much less than the 0.1 mrem/yr level specified under NESHAP regulations. Therefore, it was concluded that these activities constituted minor sources and did not require point-source operational monitoring. Detailed air emission dose evaluations for each project are reported in the NESHAP annual report for 2018 (Mission Support and Test
Services, LLC [MSTS], 2019).
4.1.6 Unplanned Releases
There were no known unplanned radionuclide releases in 2018. In 2018, five wildland fires occurred on the NNSS. The largest occurred in Area 19 in late July and was caused by lightening. It burned approximately 10.1 square kilometers (km2). Another large fire caused by a power pole break burned about 4.6 km2 in Mid Valley (Area 16). A small fire (0.2 km2) occurred in late July in Area 30, likely due to lightening and the other two wildland fires were small (<1 acre each) and were extinguished by NNSS Fire and Rescue personnel or carefully monitored until they burned out.
4.1.7 Estimate of Total NNSS Radiological Atmospheric Releases
Each year, existing operations, new construction projects, and modifications to existing facilities that have the potential for airborne emissions of radioactive materials are reviewed. Quantities of radionuclides released during these operations and from legacy contamination sites are measured or calculated to obtain the total annual quantity of radiological atmospheric releases from the NNSS. The methods are described in detail in the NESHAP annual report for 2018 (MSTS 2019).
Total emissions in 2018, by radionuclide, are shown in Table 4-9. Radionuclide emissions by source are shown in Table 4-10. Their locations in relation to critical receptor air monitoring locations are shown in Figure 4-1.
In 2018, an estimated 13,179 curies (Ci) of radionuclides were released as air emissions. Of this amount, about 83.6% (11,015 Ci) were from very short-lived radionuclides. These range from seven seconds for nitrogen-16 to 15.3 minutes for metastable xenon-135 (Table 4-9 lists radionuclide name, half-life, and amount emitted). All of these short-lived radionuclides decay very quickly and are essentially not available to contribute dose to the public at the 31 to 62 kilometer (19 to 38 mile) distances over which they have to travel. Tritium makes up about
9.6% of the total emission. Other radionuclides make up about 6.8% of the total emission.
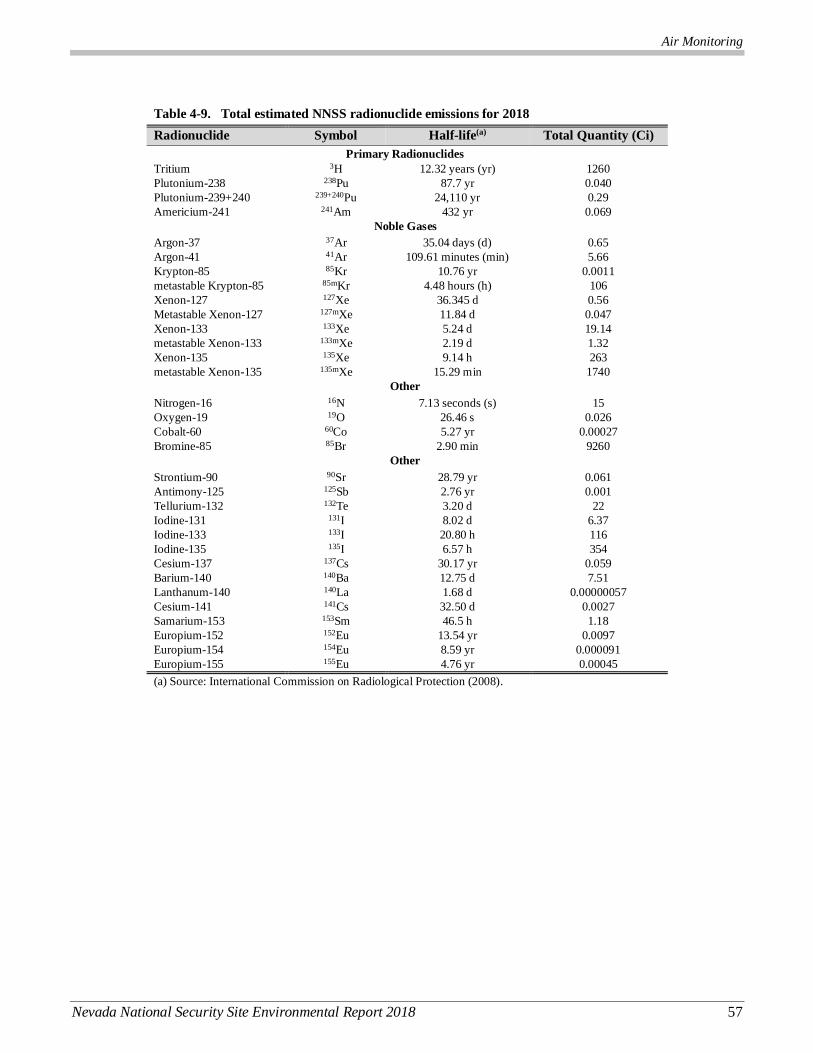
Air Monitoring
Nevada National Security Site Environmental Report 2018 57
Table 4-9. Total estimated NNSS radionuclide emissions for 2018
Radionuclide Symbol Half-life(a) Total Quantity (Ci)
Primary Radionuclides
Tritium 3H 12.32 years (yr) 1260
Plutonium-238 238Pu 87.7 yr 0.040
Plutonium-239+240 239+240Pu 24,110 yr 0.29
Americium-241 241Am 432 yr 0.069
Noble Gases
Argon-37 37Ar 35.04 days (d) 0.65
Argon-41 41Ar 109.61 minutes (min) 5.66
Krypton-85 85Kr 10.76 yr 0.0011
metastable Krypton-85 85mKr 4.48 hours (h) 106
Xenon-127 127Xe 36.345 d 0.56
Metastable Xenon-127 127mXe 11.84 d 0.047
Xenon-133 133Xe 5.24 d 19.14
metastable Xenon-133 133mXe 2.19 d 1.32
Xenon-135 135Xe 9.14 h 263
metastable Xenon-135 135mXe 15.29 min 1740
Other
Nitrogen-16 16N 7.13 seconds (s) 15
Oxygen-19 19O 26.46 s 0.026
Cobalt-60 60Co 5.27 yr 0.00027
Bromine-85 85Br 2.90 min 9260
Other
Strontium-90 90Sr 28.79 yr 0.061
Antimony-125 125Sb 2.76 yr 0.001
Tellurium-132 132Te 3.20 d 22
Iodine-131 131I 8.02 d 6.37
Iodine-133 133I 20.80 h 116
Iodine-135 135I 6.57 h 354
Cesium-137 137Cs 30.17 yr 0.059
Barium-140 140Ba 12.75 d 7.51
Lanthanum-140 140La 1.68 d 0.00000057
Cesium-141 141Cs 32.50 d 0.0027
Samarium-153 153Sm 46.5 h 1.18
Europium-152 152Eu 13.54 yr 0.0097
Europium-154 154Eu 8.59 yr 0.000091
Europium-155 155Eu 4.76 yr 0.00045
(a) Source: International Commission on Radiological Protection (2008).
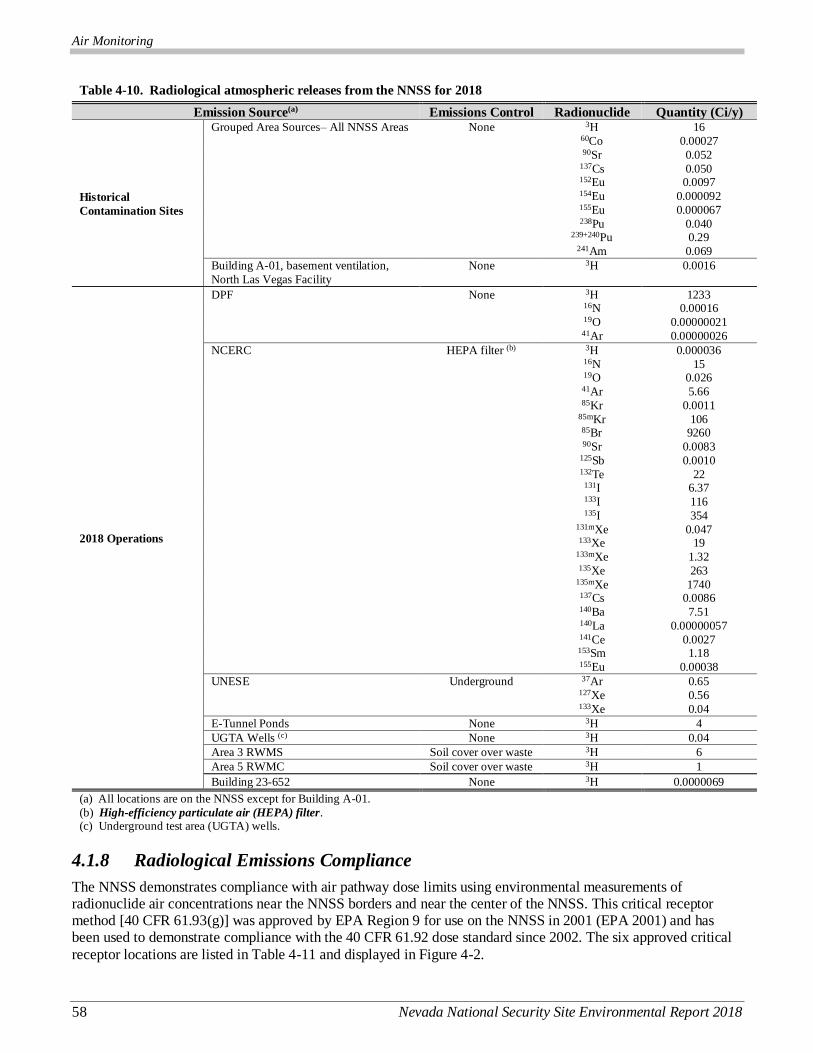
Air Monitoring
58 Nevada National Security Site Environmental Report 2018
Table 4-10. Radiological atmospheric releases from the NNSS for 2018
Emission Source(a) Emissions Control Radionuclide Quantity (Ci/y)
Historical
Contamination Sites
Grouped Area Sources– All NNSS Areas None 3H 16
60Co 0.00027
90Sr 0.052
137Cs 0.050
152Eu 0.0097
154Eu 0.000092
155Eu 0.000067
238Pu 0.040
239+240Pu 0.29
241Am 0.069
Building A-01, basement ventilation,
North Las Vegas Facility
None 3H 0.0016
2018 Operations
DPF None 3H 1233
16N 0.00016
19O 0.00000021
41Ar 0.00000026
NCERC HEPA filter (b) 3H 0.000036
16N 15
19O 0.026
41Ar 5.66
85Kr 0.0011
85mKr 106 85Br 9260
90Sr 0.0083
125Sb 0.0010
132Te 22
131I 6.37
133I 116
135I 354
131mXe 0.047
133Xe 19
133mXe 1.32
135Xe 263
135mXe 1740
137Cs 0.0086
140Ba 7.51
140La 0.00000057
141Ce 0.0027
153Sm 1.18
155Eu 0.00038
UNESE Underground 37Ar 0.65
127Xe 0.56
133Xe 0.04
E-Tunnel Ponds None 3H 4
UGTA Wells (c) None 3H 0.04
Area 3 RWMS Soil cover over waste 3H 6
Area 5 RWMC Soil cover over waste 3H 1
Building 23-652 None 3H 0.0000069
(a) All locations are on the NNSS except for Building A-01.
(b) High-efficiency particulate air (HEPA) filter. (c) Underground test area (UGTA) wells.
4.1.8 Radiological Emissions Compliance
The NNSS demonstrates compliance with air pathway dose limits using environmental measurements of radionuclide air concentrations near the NNSS borders and near the center of the NNSS. This critical receptor method [40 CFR 61.93(g)] was approved by EPA Region 9 for use on the NNSS in 2001 (EPA 2001) and has been used to demonstrate compliance with the 40 CFR 61.92 dose standard since 2002. The six approved critical
receptor locations are listed in Table 4-11 and displayed in Figure 4-2.
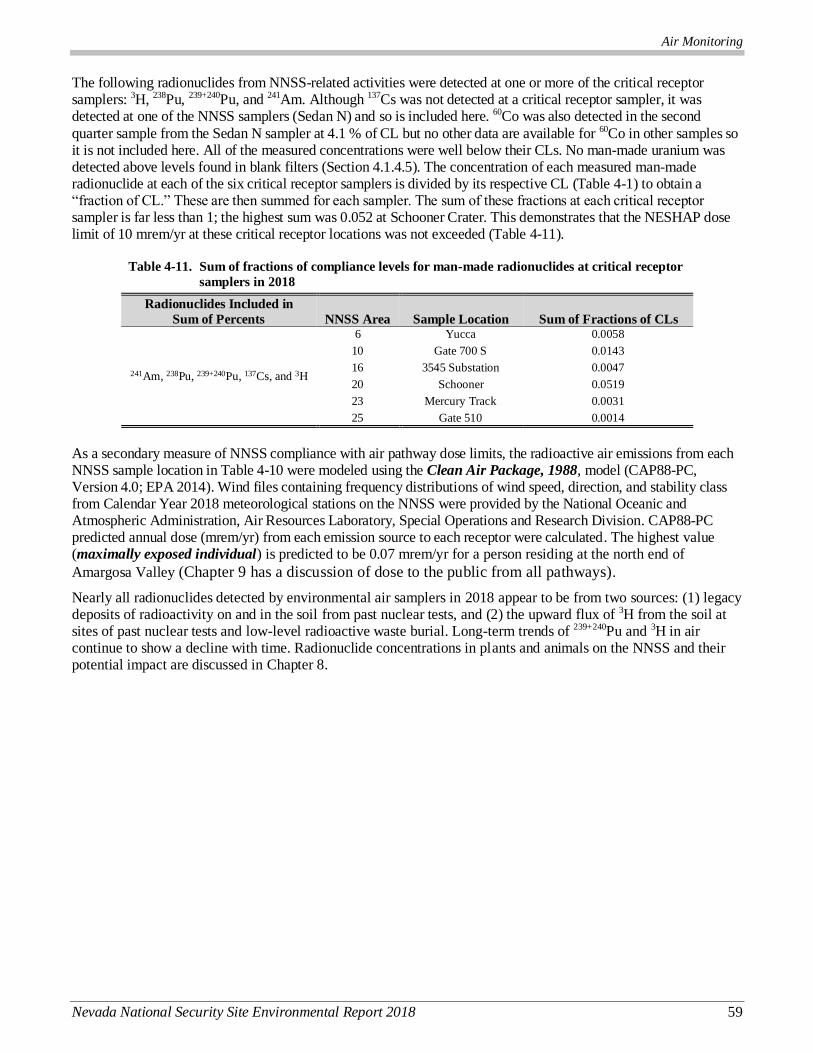
Air Monitoring
Nevada National Security Site Environmental Report 2018 59
The following radionuclides from NNSS-related activities were detected at one or more of the critical receptor samplers: 3H, 238Pu, 239+240Pu, and 241Am. Although 137Cs was not detected at a critical receptor sampler, it was detected at one of the NNSS samplers (Sedan N) and so is included here. 60Co was also detected in the second
quarter sample from the Sedan N sampler at 4.1 % of CL but no other data are available for 60Co in other samples so it is not included here. All of the measured concentrations were well below their CLs. No man-made uranium was detected above levels found in blank filters (Section 4.1.4.5). The concentration of each measured man-made radionuclide at each of the six critical receptor samplers is divided by its respective CL (Table 4-1) to obtain a “fraction of CL.” These are then summed for each sampler. The sum of these fractions at each critical receptor sampler is far less than 1; the highest sum was 0.052 at Schooner Crater. This demonstrates that the NESHAP dose limit of 10 mrem/yr at these critical receptor locations was not exceeded (Table 4-11).
Table 4-11. Sum of fractions of compliance levels for man-made radionuclides at critical receptor
samplers in 2018
Radionuclides Included in
Sum of Percents NNSS Area Sample Location Sum of Fractions of CLs
241Am, 238Pu, 239+240Pu, 137Cs, and 3H
6 Yucca 0.0058
10 Gate 700 S 0.0143
16 3545 Substation 0.0047
20 Schooner 0.0519
23 Mercury Track 0.0031
25 Gate 510 0.0014
As a secondary measure of NNSS compliance with air pathway dose limits, the radioactive air emissions from each NNSS sample location in Table 4-10 were modeled using the Clean Air Package, 1988, model (CAP88-PC, Version 4.0; EPA 2014). Wind files containing frequency distributions of wind speed, direction, and stability class from Calendar Year 2018 meteorological stations on the NNSS were provided by the National Oceanic and Atmospheric Administration, Air Resources Laboratory, Special Operations and Research Division. CAP88-PC predicted annual dose (mrem/yr) from each emission source to each receptor were calculated. The highest value (maximally exposed individual) is predicted to be 0.07 mrem/yr for a person residing at the north end of
Amargosa Valley (Chapter 9 has a discussion of dose to the public from all pathways).
Nearly all radionuclides detected by environmental air samplers in 2018 appear to be from two sources: (1) legacy deposits of radioactivity on and in the soil from past nuclear tests, and (2) the upward flux of 3H from the soil at sites of past nuclear tests and low-level radioactive waste burial. Long-term trends of 239+240Pu and 3H in air continue to show a decline with time. Radionuclide concentrations in plants and animals on the NNSS and their potential impact are discussed in Chapter 8.
Air Monitoring
60 Nevada National Security Site Environmental Report 2018
4.2 Nonradiological Air Quality Monitoring and Assessment
Air Quality Assessment Program Goals
Ensure NNSS operations comply with all requirements of the current air quality permit issued by the State of Nevada. Ensure emissions of criteria air pollutants (sulfur dioxide [SO2], nitrogen oxides [NOX], carbon
monoxide [CO], volatile organic compounds [VOCs], and particulate matter) and emissions of hazardous air pollutants do not exceed limits established under National Ambient Air Quality Standards (NAAQS) and
NESHAP, respectively. Ensure emissions of permitted NNSS equipment comply with the opacity criteria set by NAAQS and New Source Performance Standards (NSPS). Ensure NNSS operations comply with asbestos
abatement reporting requirements under NESHAP. Document usage of ozone-depleting substances (ODS) to comply with Title VI of the CAA.
NNSS operations that are potential sources of air pollution include aggregate production, surface disturbance
(e.g., construction), release of fugitive dust from driving on unpaved roads, use of fuel-burning equipment, open burning, venting from bulk fuel storage facilities, explosives detonations, and releases of various chemicals during testing. Air quality assessments are conducted to document compliance with the current State of Nevada air quality permit that regulates specific operations or facilities on the NNSS. The assessments mainly address nonradiological air pollutants. The State of Nevada has adopted the CAA standards, which include NESHAP, NAAQS, and NSPS. NESHAP compliance with radionuclide emissions monitoring and with air pathway public dose limits are presented in Section 4.1. Compliance with all other CAA air quality standards is addressed in this
section. Data collection, opacity readings, recordkeeping, and reporting activities on the NNSS are conducted to meet the specific program goals.
4.2.1 Permitted NNSS Facilities
NNSA/NFO maintains a Class II Air Quality Operating Permit (AP9711-2557) for NNSS activities. State of Nevada Class II permits are issued for sources of air pollutants considered “minor,” i.e., where annual emissions do not exceed 100 tons of any one criteria pollutant, 10 tons of any one hazardous air pollutant (HAP), or 25 tons of any combination of HAPs. The NNSS facilities regulated by permit AP9711-2557 include the following:
Approximately 14 facilities/131 pieces of equipment in Areas 1, 2, 5, 6, 12, 18, 19, 20, 23, 25, 26, 27, and 29
Chemical releases at the Nonproliferation Test and Evaluation Complex (NPTEC) in Area 5 and in Port Gaston in Area 26
Site-wide chemical releases (conducted throughout the NNSS)
The Big Explosives Experimental Facility (BEEF) in Area 4
Explosives Ordnance Disposal Unit (EODU) in Area 11
Explosives activities sites at NPTEC in Area 5; High Explosives Simulation Test (HEST) in Area 14;
Test Cell C, Calico Hills, and Army Research Laboratory (ARL) in Area 25; Port Gaston in Area 26; and Baker in Area 27
4.2.2 Permit Maintenance Activities
An application to renew the NNSS air permit (AP9711-2557) was submitted to the Nevada Division of Environmental Protection (NDEP) in April 2014 prior to the permit’s expiration. The air permit was issued in January 2019. Operations at the NNSS continued under a permit application “shield” until the permit was
renewed. Nevada Administrative Code (NAC) Chapter 445B, Air Controls, allows for the continued operation of a stationary source until the permit is renewed or denied. The permit issued in January 2019 will expire in June 2019, and an application for permit renewal will be submitted to the state in April 2019.
Air Monitoring
Nevada National Security Site Environmental Report 2018 61
New operational allowances in the 2019 permit include:
Modification of the EODU reporting requirement to coincide with the submittal of other facility quarterly reports.
Reduction of the site-wide HAP emissions cap for a single pollutant from 8 tons/year down to 7 tons/year. Actual emissions are typically < 1 ton/year.
Also, operational allowances requested as modifications to the permit were approved for 2019. Because these allowances are not directly covered by the NAC but are enacted with the Director’s approval, they are requested with each permit application. Permit modifications for 2019 include:
Revision of the recordkeeping requirements for seven remotely located fuel-fired generators.
Removal of the requirement to report the CEMP offsite air monitoring results.
Elimination of the performance emissions test (“stack test”) requirement for five diesel-fired generators
and for eight baghouses associated with the aggregate plant, batch plant, and cementing services facilities.
4.2.3 Emissions of Criteria Air Pollutants and Hazardous Air Pollutants
A source’s regulatory status is determined by potential to emit (PTE), the maximum number of tons of criteria air pollutants and nonradiological HAPs it may emit in a 12-month period if the source were operated for the maximum number of hours and at the maximum production amounts specified in the source’s air permit. The PTE is specified in an Air Emissions Inventory of all emission units. Each year, NNSA/NFO submits Actual Production/Emissions Reporting Forms to NDEP as required by the NNSS air permit. These forms report the actual annual operational information and the calculated emissions of the criteria air pollutants and HAPs for
permitted emission units. The state uses the information to determine permit fees and to verify that emissions do not exceed the PTEs. Quarterly reports of HAP emission quantities were also submitted to NDEP in April, July, and October 2018, and January, 2019. Quarterly reporting is no longer required; however, the new permit continues to include an annual reporting requirement. The annual report is submitted to NDEP in February of each year, due to an NNSS-wide emissions limit or “cap” on HAPs. In February 2019, the Actual Production/Emissions Reporting Forms for Calendar Year 2018 were submitted to NDEP as required.
All records examined in 2018 for permitted facilities and equipment indicate that operational parameters were being properly tracked and no PTEs were exceeded. An estimated 5.87 tons of criteria air pollutants were released (Table 4-12). The majority of the emissions were NOX from diesel generators. An estimated 0.01 tons of HAPs were released in 2018 (Table 4-13). Table 4-13 also shows the calculated tons of air pollutants released on the
NNSS over the past 10 years. Fluctuations in emissions over time reflect changes in project activities and facility operations.
Field measurements of particulate matter equal to or less than 10 microns in diameter (PM10) are required for all permitted explosives activities. The sampling systems must operate and record ambient PM10 concentrations at least each day a detonation or chemical release occurs. The PM10 emissions are reported to the state in reports specific to each series of detonations or chemical releases.
Unless specifically exempted, the open burning of any combustible refuse, waste, garbage, or oil is prohibited. Open burning for other purposes is allowed if approved in advance by the state issuance of an Open Burn Authorization. Open Burn Authorizations are renewed annually. At the NNSS, they are issued for fire extinguisher training and for support-vehicle live-fire training activities. In 2018, 31 fire extinguisher training sessions and 6 vehicle burns were conducted at the NNSS. The fire extinguisher training sessions used a new system that burns propane rather than diesel fuel, resulting in greatly reduced hydrocarbon emissions. Quantities of criteria air pollutants produced by open
burns are not required to be calculated or reported.
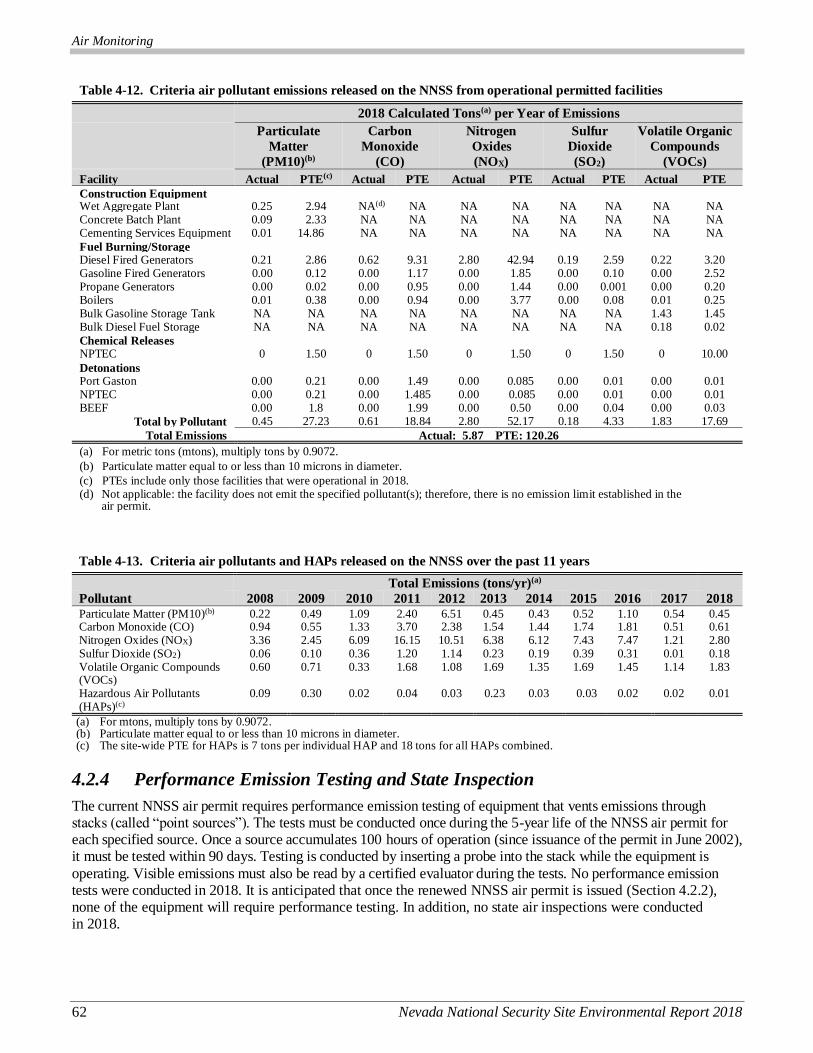
Air Monitoring
62 Nevada National Security Site Environmental Report 2018
Table 4-12. Criteria air pollutant emissions released on the NNSS from operational permitted facilities
2018 Calculated Tons(a) per Year of Emissions
Particulate
Matter
(PM10)(b)
Carbon
Monoxide
(CO)
Nitrogen
Oxides
(NOX)
Sulfur
Dioxide
(SO2)
Volatile Organic
Compounds
(VOCs)
Facility Actual PTE(c) Actual PTE Actual PTE Actual PTE Actual PTE
Construction Equipment Wet Aggregate Plant 0.25 2.94 NA(d) NA NA NA NA NA NA NA Concrete Batch Plant 0.09 2.33 NA NA NA NA NA NA NA NA Cementing Services Equipment 0.01 14.86 NA NA NA NA NA NA NA NA
Fuel Burning/Storage Diesel Fired Generators 0.21 2.86 0.62 9.31 2.80 42.94 0.19 2.59 0.22 3.20 Gasoline Fired Generators 0.00 0.12 0.00 1.17 0.00 1.85 0.00 0.10 0.00 2.52 Propane Generators 0.00 0.02 0.00 0.95 0.00 1.44 0.00 0.001 0.00 0.20 Boilers 0.01 0.38 0.00 0.94 0.00 3.77 0.00 0.08 0.01 0.25 Bulk Gasoline Storage Tank NA NA NA NA NA NA NA NA 1.43 1.45 Bulk Diesel Fuel Storage
Tank
NA NA NA NA NA NA NA NA 0.18 0.02
Chemical Releases NPTEC 0 1.50 0 1.50 0 1.50 0 1.50 0 10.00
Detonations Port Gaston 0.00 0.21 0.00 1.49 0.00 0.085 0.00 0.01 0.00 0.01 NPTEC 0.00 0.21 0.00 1.485 0.00 0.085 0.00 0.01 0.00 0.01 BEEF 0.00 1.8 0.00 1.99 0.00 0.50 0.00 0.04 0.00 0.03
Total by Pollutant 0.45 0.459
27.23 0.61 18.84 2.80 52.17 0.18 0.180.
27
4.33 1.83 1.831.8
35
17.69
Total Emissions Actual: 5.87 PTE: 120.26
(a) For metric tons (mtons), multiply tons by 0.9072.
(b) Particulate matter equal to or less than 10 microns in diameter.
(c) PTEs include only those facilities that were operational in 2018. (d) Not applicable: the facility does not emit the specified pollutant(s); therefore, there is no emission limit established in the
air permit.
Table 4-13. Criteria air pollutants and HAPs released on the NNSS over the past 11 years
Total Emissions (tons/yr)(a)
Pollutant 2008 2009 2010 2011 2012 2013 2014 2015 2016 2017 2018 Particulate Matter (PM10)(b) 0.22 0.49 1.09 2.40 6.51 0.45 0.43 0.52 1.10 0.54 0.45 Carbon Monoxide (CO) 0.94 0.55 1.33 3.70 2.38 1.54 1.44 1.74 1.81 0.51 0.61 Nitrogen Oxides (NOX) 3.36 2.45 6.09 16.15 10.51 6.38 6.12 7.43 7.47 1.21 2.80 Sulfur Dioxide (SO2) 0.06 0.10 0.36 1.20 1.14 0.23 0.19 0.39 0.31 0.01 0.18 Volatile Organic Compounds (VOCs)
0.60 0.71 0.33 1.68 1.08 1.69 1.35 1.69 1.45 1.14 1.83
Hazardous Air Pollutants (HAPs)(c)
0.09 0.30 0.02 0.04 0.03 0.23 0.03 0.03 0.02 0.02 0.01
(a) For mtons, multiply tons by 0.9072. (b) Particulate matter equal to or less than 10 microns in diameter. (c) The site-wide PTE for HAPs is 7 tons per individual HAP and 18 tons for all HAPs combined.
4.2.4 Performance Emission Testing and State Inspection
The current NNSS air permit requires performance emission testing of equipment that vents emissions through stacks (called “point sources”). The tests must be conducted once during the 5-year life of the NNSS air permit for each specified source. Once a source accumulates 100 hours of operation (since issuance of the permit in June 2002), it must be tested within 90 days. Testing is conducted by inserting a probe into the stack while the equipment is
operating. Visible emissions must also be read by a certified evaluator during the tests. No performance emission tests were conducted in 2018. It is anticipated that once the renewed NNSS air permit is issued (Section 4.2.2), none of the equipment will require performance testing. In addition, no state air inspections were conducted in 2018.
Air Monitoring
Nevada National Security Site Environmental Report 2018 63
4.2.5 Opacity Readings
Visual opacity readings are conducted in accordance with permit and regulatory requirements. Personnel who take opacity readings are certified semiannually. In 2018, seven employees on the NNSS were certified. Readings were taken for the following NNSS facility regulated under the NAAQS opacity limit of 20%: Area 2 Dry Alluvium Geology Stemming Operation. None of the opacity readings exceeded the 20% limit.
4.2.6 Chemical Releases and Detonations Reporting
The NNSS air permit regulates the release of chemicals at specific locations under three separate “systems”: NPTEC in Area 5 (System 29), site-wide releases throughout the NNSS (System 81), and Port Gaston in Area 26 (System 95). The types and amounts of chemicals that may be released vary depending on the system. In 2018,
the Humble Jasmine test series was conducted at NPTEC. The chemicals released during the series included small amounts of HAPs. No permit limits were exceeded.
Near-surface explosives detonations can take place at nine locations on the NNSS (BEEF in Area 4; EODU in
Area 11; NPTEC in Area 5; Port Gaston in Area 26; HEST in Area 14; Test Cell C, Calico Hills, and ARL in Area 25; and Baker in Area 27). BEEF is permitted to detonate large quantities of explosives (up to 41.5 tons per detonation with a limit of 50.0 tons per 12-month period), while the other locations are limited to much smaller quantities (1 ton per detonation with a limit of 10 tons per 12-month period). Permitted limits exist also for the amounts of criteria air pollutant and HAP emissions generated by the detonations. In 2018, explosives were detonated at BEEF, and no permit limits were exceeded (Table 4-12). No detonations took place at any of the other detonation facilities.
PM10 monitoring was conducted for each chemical release test and detonation at NPTEC in 2018. Monitoring was conducted in accordance with the permit and met all related requirements.
In addition to annual reporting, the NNSS air quality operating permit requires the submittal of test plans and final analysis reports to the state for chemical releases or release series and for detonations. For BEEF and for the detonation facilities, quarterly test plans and final reports are submitted for the types and weights of explosives
and estimated emissions that may be released. Completion reports are submitted at the end of each calendar quarter for all chemical releases and detonations. In 2018, all of the required quarterly reports were submitted prior to the reporting deadline, and to streamline reporting, they were included in the quarterly HAPs reports to NDEP (Section 4.2.3).
4.2.7 Ozone-Depleting Substances Recordkeeping
At the NNSS, refrigerants containing ODS are mainly in air conditioning units in vehicles, buildings, refrigerators, drinking water fountains, vending machines, and laboratory equipment. Halon 1211 and 1301, classified as ODS, have been used in the past in fire extinguishers and deluge systems, but all known occurrences
of these halons have been removed from the NNSS. ODS recordkeeping requirements applicable to NNSS operations include maintaining evidence of technician certification at all times and for 3 years, recycling/recovery equipment approval, servicing records for appliances containing 22.7 kilograms (50 pounds) or more of refrigerant, and the amount and type of refrigerant sent offsite for reclamation.
4.2.8 Asbestos Abatement
A Notification of Demolition and Renovation Form is submitted to the EPA at least 10 working days prior to the start of a demolition or renovation project if the quantities of asbestos-containing material (ACM) to be removed are estimated to equal or exceed 260 linear ft, 160 square ft, or 35 ft3. Small asbestos abatement projects are
conducted during the year with the removal of lesser quantities of ACM and a Notification of Demolition and Renovation Form is not required.
Eight Notification of Demolition and Renovation Forms were submitted in 2018. Seven notifications were for
demolition of facilities and trailers. One notification was for renovation activities at the NNSS. ACM was buried in the Area 10 or Area 23 solid waste disposal site as per each project’s work plan. Friable materials are segregated in a defined section of the landfill.

Air Monitoring
64 Nevada National Security Site Environmental Report 2018
The recordkeeping requirements for asbestos abatement activities include maintaining air and bulk sampling data records, abatement plans, and operations and maintenance activity records for up to 75 years; and maintaining location-specific records of ACM for a minimum of 75 years. Compliance is verified through periodic internal
management assessments. Asbestos abatement records continue to be maintained as required.
4.2.9 Fugitive Dust Control
The NNSS Class II Air Quality Operating Permit states that the best practical methods should be used to prevent particulate matter from becoming airborne prior to the construction, repair, demolition, or use of unpaved or untreated areas. At the NNSS, the main method of dust control is the use of water sprays. In 2018, field personnel observed operations throughout the NNSS for the occurrence of excessive fugitive dust, and water sprays were used to control dust at sites where trenching and digging activities occurred in Areas 1, 2, 12, and 23.
Off the NNSS, all NNSA/NFO surface-disturbing activities that cover 5 or more acres are regulated by stand-alone Class II Surface Area Disturbance (SAD) permits issued by the state. Current SAD permits exist for the operation of three UGTA wells on the Nevada Test and Training Range: ER-EC-13, ER-EC-14, and ER-EC-15. No activities occurred at these wells in 2018, and all reporting requirements of the SAD permits were met.
4.2.10 Environmental Impact of Nonradiological Emissions
In 2018, NNSS activities produced a total of 5.87 tons of criteria air pollutants and 0.01 tons of HAPs. These small quantities had little, if any, impact on air quality on or around the NNSS. NNSS air pollutant emissions are very low compared to the estimated daily releases from point sources in Clark County, Nevada. For example, the average annual projected emissions of NOX in Clark County for base year 2002 through projected year 2018 is 37,549 tons per year (Pollack 2007), whereas the estimated annual release from the NNSS in 2018 of 2.8 tons of NOX represents less than 0.01% of Clark County’s projected annual emissions of this criteria pollutant.
Impacts of the chemical release tests at the NNSS are minimized by controlling the amount and duration of each release. Biological monitoring at NPTEC is performed if there is a risk of significant exposure to downwind plants and animals from the planned tests. To date, chemical releases at NPTEC and other locations are such
small quantities (when dispersed into the air) that downwind test-specific monitoring has not been warranted. No measurable impacts to downwind plants or animals have been observed.
4.3 References
Bechtel Nevada, 2003. Routine Radiological Environmental Monitoring Plan. DOE/NV/11718--804, Las Vegas, NV.
EPA, see U.S. Environmental Protection Agency.
International Commission on Radiological Protection (ICRP), 2008. Nuclear Decay Data for Dosimetric Calculations. ICRP Publication 107. Ann. ICRP 38 (3).
McArthur, R. D., 1991. Radionuclides in Surface Soil at the Nevada Test Site. DOE/NV/10845-02, Water Resources Center Publication #45077, Desert Research Institute, Las Vegas, NV.
Mission Support and Test Services, LLC, 2019. National Emission Standards for Hazardous Air Pollutants - Radionuclide Emissions, Calendar Year 2018. DOE/NV/03624--0521, Las Vegas, NV.
MSTS, see Mission Support and Test Services, LLC.
Pollack, A., 2007. Clark County Consolidated Emission Inventory Report. Prepared for Clark County Department of Air Quality Management, ENVIRON International Corporation, Novato, CA.
U.S. Environmental Protection Agency, 2014. CAP88-PC Version 4.0 User Guide, Office of Radiation and Indoor Air, Washington, D.C.
U.S. Environmental Protection Agency, 2001. Letter from Jack P. Broadbent, EPA Region IX Director, Air Division, to Kenneth A. Hoar, DOE Nevada Field [Operations] Office, Environmental, Safety & Health Division, July 23, 2001.
Water Monitoring
Nevada National Security Site Environmental Report 2018 65
5.0 Ch5
Chapter 5: Water Monitoring
Irene Farnham, Patrick K. Matthews, Jaun Alvarado
Navarro Research and Engineering, Inc Peggy E. Elliott
U.S. Geological Survey
Elizabeth Burns, Elizabeth A. Marchese, Theodore J. Redding, and Nikolas J. Taranik
Mission Support and Test Services, LLC
This chapter presents the recent results of water monitoring conducted on and near the Nevada National Security Site (NNSS) by the U.S. Department of Energy, National Nuclear Security Administration Nevada Field Office (NNSA/NFO) and the Environmental Management (EM) Nevada Program. NNSA/NFO and EM Nevada Program monitor groundwater to provide safe drinking water for NNSS workers and visitors, avoid NNSS groundwater contamination from current activities, and protect the public and environment from areas of known underground
contamination from historical nuclear testing. Water is monitored to comply with applicable state and federal water quality and water protection regulations, U.S. Department of Energy (DOE) directives, and the Federal Facility Agreement and Consent Order (FFACO) between the DOE, the U.S. Department of Defense, and the State of Nevada. Laws and regulations applicable to water monitoring are listed in Table 2-1.
The Community Environmental Monitoring Program (CEMP) and the Nye County Tritium Sampling and Monitoring Program (TSaMP) perform annual, independent radiological monitoring of water supply systems in communities surrounding the NNSS and emphasize community involvement. The TSaMP is funded through a grant from EM Nevada Program and the CEMP is funded by NNSA/NFO. Sections 7.2 and 7.3 describe CEMP’s and Nye County’s groundwater monitoring activities in 2018.
5.1 Radiological Monitoring
Radiological Water Monitoring Objectives
Provide data to complete corrective actions prescribed under the FFACO to protect the public from groundwater
contaminated by historical underground nuclear testing. Monitor water supply wells on the NNSS (referred to as onsite
wells) to demonstrate safety of drinking water. Determine compliance with the dose limits to the general public set by
DOE O 458.1 via the water pathway (Chapter 9 for estimates of public dose). Monitor wells downgradient of an
NNSS radioactive waste disposal unit in accordance with a Resource Conservation and Recovery Act (RCRA) permit to
ensure wastes do not impact groundwater.
Radionuclides1 have been detected in the groundwater in some areas of the NNSS and Nevada Test and Training Range (NTTR) that are a result of historical underground nuclear tests (UGTs). Between 1951 and 1992, 828 UGTs were conducted, and approximately one-third were detonated near or in the saturated zone (NNSA/NFO 2015). The FFACO (as amended) established underground test area (UGTA) corrective action units (CAUs) that geographically group the UGTs. A complete description of the hydrogeological environment in which UGTs were conducted is in Attachment A: Site Description.2
An integrated approach to assess both the extent of groundwater contamination from UGTs and impact of testing on water quality in communities downgradient of historical UGTs is implemented through the NNSS Integrated Groundwater Sampling Plan (NNSA/NFO 2014; EM Nevada Program 2018), referred to hereafter as the Plan. The Plan describes a comprehensive approach for collecting and analyzing groundwater that combines routine
radiological monitoring performed by NNSA/NFO (Bechtel Nevada 2003) with that performed by EM Nevada Program’s UGTA Activity. Its implementation was designed to meet both the NNSA/NFO and EM Nevada Program’s radiological water monitoring objectives not already covered by a permit (compliance wells and NNSS public water system [PWS] wells). NNSS PWS wells are sampled quarterly and Compliance well sampling is consistent with the applicable permit requirements.
1 The definition of word(s) in bold italics may be found by clicking on the word in electronic version or by referencing the Glossary,
Appendix B. To return from the Glossary, right click and select Previous View. 2 Attachment A: Site Description is included on the compact disc of this report and on the NNSA/NFO web site at
http://www.nnss.gov/pages/resources/library/NNSSER.html.
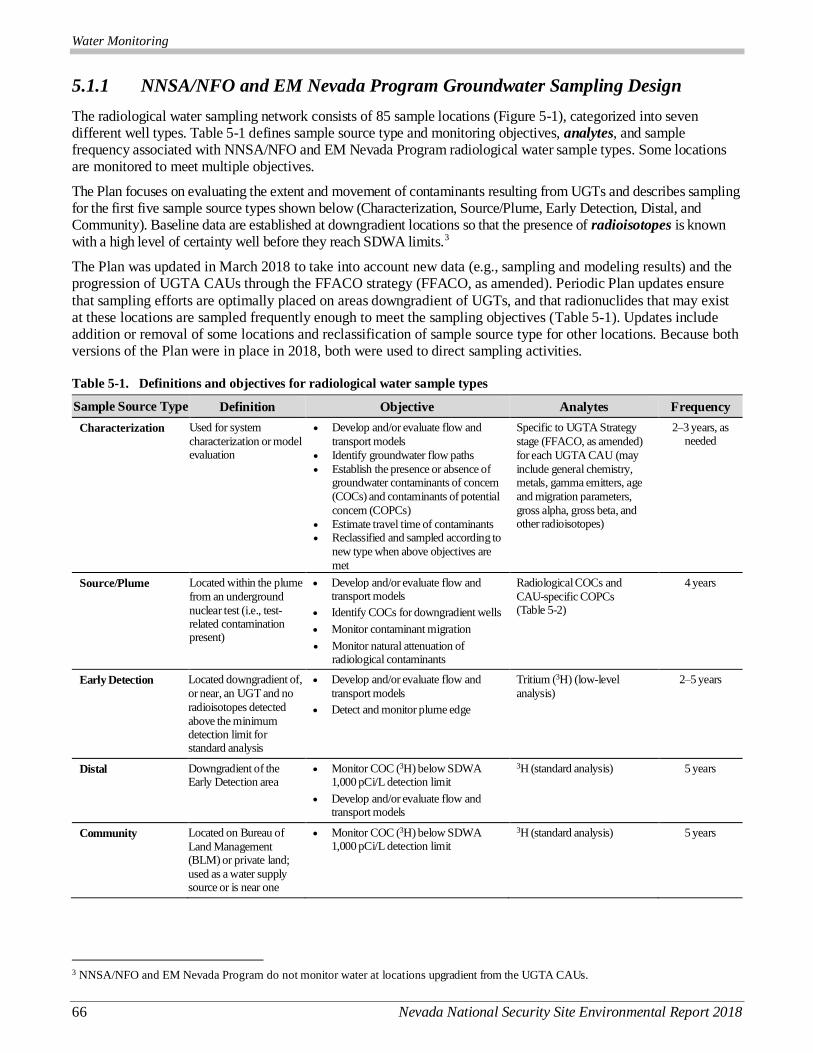
Water Monitoring
66 Nevada National Security Site Environmental Report 2018
5.1.1 NNSA/NFO and EM Nevada Program Groundwater Sampling Design
The radiological water sampling network consists of 85 sample locations (Figure 5-1), categorized into seven different well types. Table 5-1 defines sample source type and monitoring objectives, analytes, and sample frequency associated with NNSA/NFO and EM Nevada Program radiological water sample types. Some locations are monitored to meet multiple objectives.
The Plan focuses on evaluating the extent and movement of contaminants resulting from UGTs and describes sampling for the first five sample source types shown below (Characterization, Source/Plume, Early Detection, Distal, and Community). Baseline data are established at downgradient locations so that the presence of radioisotopes is known with a high level of certainty well before they reach SDWA limits.3
The Plan was updated in March 2018 to take into account new data (e.g., sampling and modeling results) and the progression of UGTA CAUs through the FFACO strategy (FFACO, as amended). Periodic Plan updates ensure
that sampling efforts are optimally placed on areas downgradient of UGTs, and that radionuclides that may exist at these locations are sampled frequently enough to meet the sampling objectives (Table 5-1). Updates include addition or removal of some locations and reclassification of sample source type for other locations. Because both versions of the Plan were in place in 2018, both were used to direct sampling activities.
Table 5-1. Definitions and objectives for radiological water sample types
Sample Source Type Definition Objective Analytes Frequency
Characterization Used for system
characterization or model evaluation
Develop and/or evaluate flow and
transport models
Identify groundwater flow paths
Establish the presence or absence of groundwater contaminants of concern
(COCs) and contaminants of potential
concern (COPCs)
Estimate travel time of contaminants Reclassified and sampled according to
new type when above objectives are
met
Specific to UGTA Strategy
stage (FFACO, as amended)
for each UGTA CAU (may
include general chemistry, metals, gamma emitters, age
and migration parameters,
gross alpha, gross beta, and other radioisotopes)
2–3 years, as needed
Source/Plume Located within the plume
from an underground
nuclear test (i.e., test-related contamination present)
Develop and/or evaluate flow and transport models
Identify COCs for downgradient wells
Monitor contaminant migration
Monitor natural attenuation of radiological contaminants
Radiological COCs and
CAU-specific COPCs (Table 5-2)
4 years
Early Detection Located downgradient of,
or near, an UGT and no
radioisotopes detected
above the minimum detection limit for standard analysis
Develop and/or evaluate flow and
transport models
Detect and monitor plume edge
Tritium (3H) (low-level
analysis)
2–5 years
Distal Downgradient of the Early Detection area
Monitor COC (3H) below SDWA 1,000 pCi/L detection limit
Develop and/or evaluate flow and transport models
3H (standard analysis) 5 years
Community Located on Bureau of
Land Management (BLM) or private land;
used as a water supply source or is near one
Monitor COC (3H) below SDWA 1,000 pCi/L detection limit
3H (standard analysis) 5 years
3 NNSA/NFO and EM Nevada Program do not monitor water at locations upgradient from the UGTA CAUs.
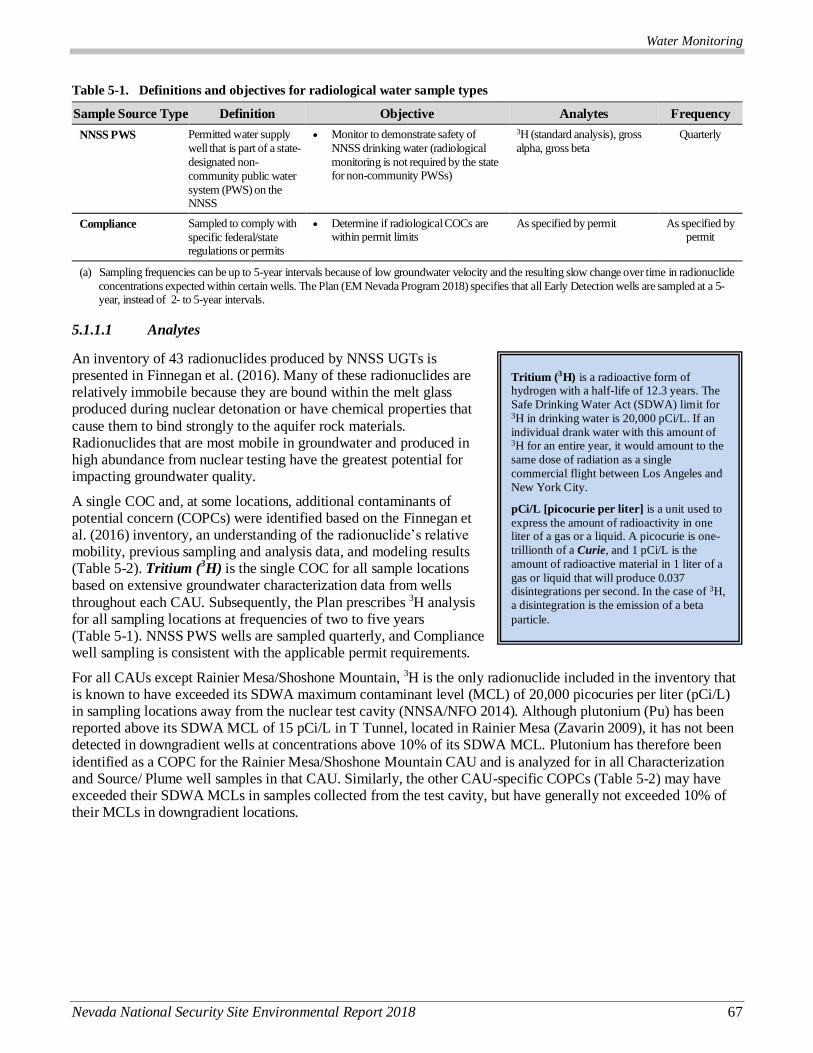
Water Monitoring
Nevada National Security Site Environmental Report 2018 67
Table 5-1. Definitions and objectives for radiological water sample types
Sample Source Type Definition Objective Analytes Frequency
NNSS PWS Permitted water supply
well that is part of a state-
designated non-
community public water
system (PWS) on the NNSS
Monitor to demonstrate safety of
NNSS drinking water (radiological
monitoring is not required by the state for non-community PWSs)
3H (standard analysis), gross
alpha, gross beta
Quarterly
Compliance Sampled to comply with
specific federal/state regulations or permits
Determine if radiological COCs are within permit limits
As specified by permit As specified by permit
(a) Sampling frequencies can be up to 5-year intervals because of low groundwater velocity and the resulting slow change over time in radionuclide
concentrations expected within certain wells. The Plan (EM Nevada Program 2018) specifies that all Early Detection wells are sampled at a 5-year, instead of 2- to 5-year intervals.
5.1.1.1 Analytes
An inventory of 43 radionuclides produced by NNSS UGTs is presented in Finnegan et al. (2016). Many of these radionuclides are relatively immobile because they are bound within the melt glass produced during nuclear detonation or have chemical properties that
cause them to bind strongly to the aquifer rock materials. Radionuclides that are most mobile in groundwater and produced in high abundance from nuclear testing have the greatest potential for impacting groundwater quality.
A single COC and, at some locations, additional contaminants of potential concern (COPCs) were identified based on the Finnegan et al. (2016) inventory, an understanding of the radionuclide’s relative mobility, previous sampling and analysis data, and modeling results (Table 5-2). Tritium (
3H) is the single COC for all sample locations
based on extensive groundwater characterization data from wells
throughout each CAU. Subsequently, the Plan prescribes 3H analysis for all sampling locations at frequencies of two to five years (Table 5-1). NNSS PWS wells are sampled quarterly, and Compliance well sampling is consistent with the applicable permit requirements.
For all CAUs except Rainier Mesa/Shoshone Mountain, 3H is the only radionuclide included in the inventory that is known to have exceeded its SDWA maximum contaminant level (MCL) of 20,000 picocuries per liter (pCi/L) in sampling locations away from the nuclear test cavity (NNSA/NFO 2014). Although plutonium (Pu) has been reported above its SDWA MCL of 15 pCi/L in T Tunnel, located in Rainier Mesa (Zavarin 2009), it has not been detected in downgradient wells at concentrations above 10% of its SDWA MCL. Plutonium has therefore been
identified as a COPC for the Rainier Mesa/Shoshone Mountain CAU and is analyzed for in all Characterization and Source/ Plume well samples in that CAU. Similarly, the other CAU-specific COPCs (Table 5-2) may have exceeded their SDWA MCLs in samples collected from the test cavity, but have generally not exceeded 10% of their MCLs in downgradient locations.
Tritium (3H) is a radioactive form of hydrogen with a half-life of 12.3 years. The
Safe Drinking Water Act (SDWA) limit for 3H in drinking water is 20,000 pCi/L. If an
individual drank water with this amount of 3H for an entire year, it would amount to the
same dose of radiation as a single
commercial flight between Los Angeles and
New York City.
pCi/L [picocurie per liter] is a unit used to
express the amount of radioactivity in one liter of a gas or a liquid. A picocurie is one-
trillionth of a Curie, and 1 pCi/L is the
amount of radioactive material in 1 liter of a
gas or liquid that will produce 0.037 disintegrations per second. In the case of 3H,
a disintegration is the emission of a beta
particle.
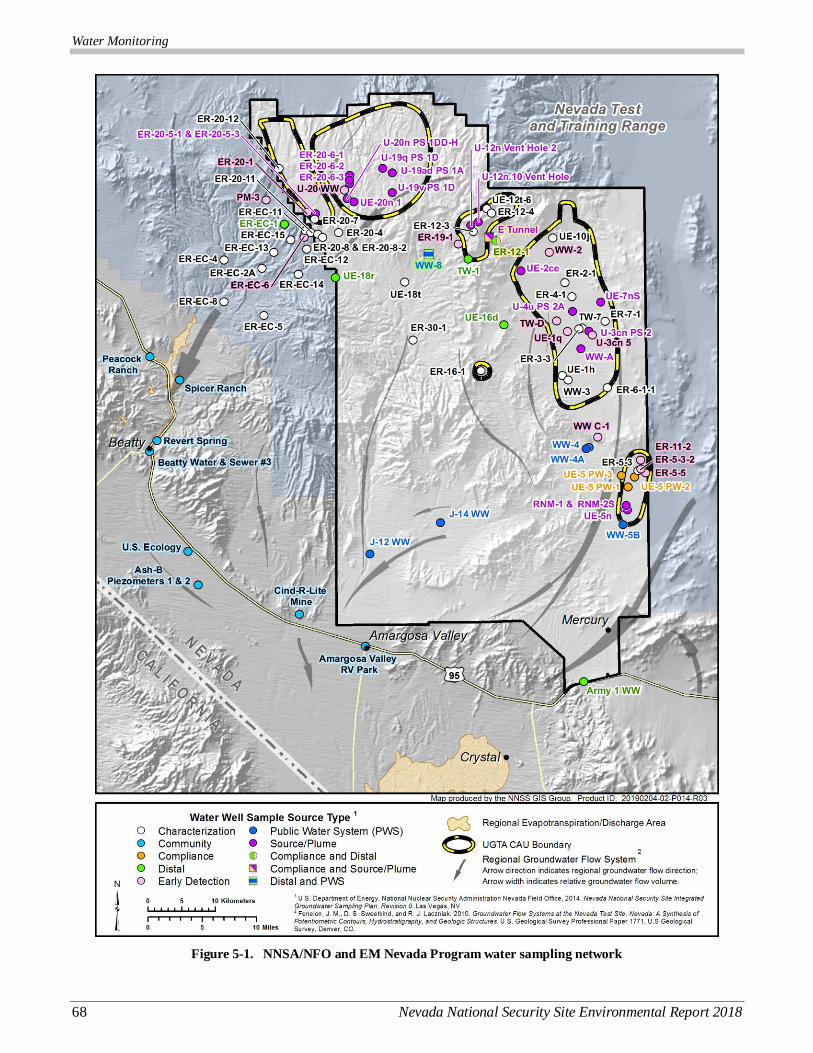
Water Monitoring
68 Nevada National Security Site Environmental Report 2018
Figure 5-1. NNSA/NFO and EM Nevada Program water sampling network
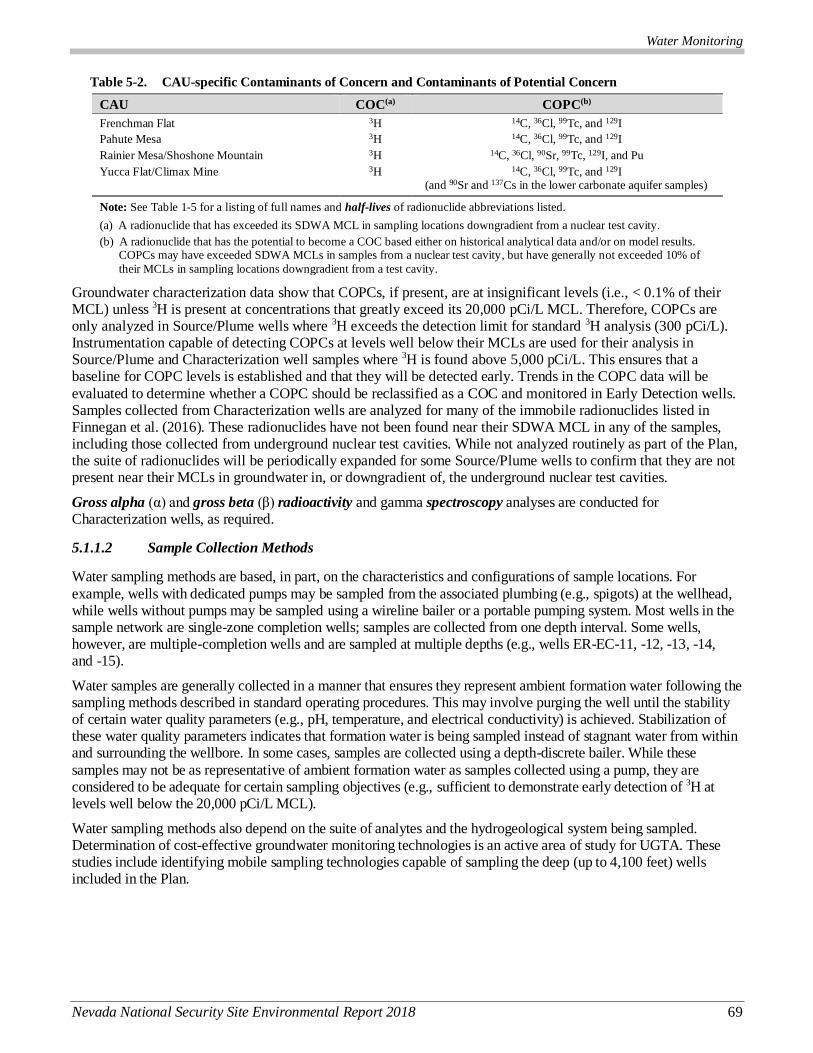
Water Monitoring
Nevada National Security Site Environmental Report 2018 69
Table 5-2. CAU-specific Contaminants of Concern and Contaminants of Potential Concern
CAU COC(a) COPC(b)
Frenchman Flat 3H 14C, 36Cl, 99Tc, and 129I
Pahute Mesa 3H 14C, 36Cl, 99Tc, and 129I
Rainier Mesa/Shoshone Mountain 3H 14C, 36Cl, 90Sr, 99Tc, 129I, and Pu
Yucca Flat/Climax Mine 3H 14C, 36Cl, 99Tc, and 129I (and 90Sr and 137Cs in the lower carbonate aquifer samples)
Note: See Table 1-5 for a listing of full names and half-lives of radionuclide abbreviations listed.
(a) A radionuclide that has exceeded its SDWA MCL in sampling locations downgradient from a nuclear test cavity.
(b) A radionuclide that has the potential to become a COC based either on historical analytical data and/or on model results. COPCs may have exceeded SDWA MCLs in samples from a nuclear test cavity, but have generally not exceeded 10% of
their MCLs in sampling locations downgradient from a test cavity.
Groundwater characterization data show that COPCs, if present, are at insignificant levels (i.e., < 0.1% of their MCL) unless 3H is present at concentrations that greatly exceed its 20,000 pCi/L MCL. Therefore, COPCs are only analyzed in Source/Plume wells where 3H exceeds the detection limit for standard 3H analysis (300 pCi/L). Instrumentation capable of detecting COPCs at levels well below their MCLs are used for their analysis in Source/Plume and Characterization well samples where 3H is found above 5,000 pCi/L. This ensures that a baseline for COPC levels is established and that they will be detected early. Trends in the COPC data will be
evaluated to determine whether a COPC should be reclassified as a COC and monitored in Early Detection wells. Samples collected from Characterization wells are analyzed for many of the immobile radionuclides listed in Finnegan et al. (2016). These radionuclides have not been found near their SDWA MCL in any of the samples, including those collected from underground nuclear test cavities. While not analyzed routinely as part of the Plan, the suite of radionuclides will be periodically expanded for some Source/Plume wells to confirm that they are not present near their MCLs in groundwater in, or downgradient of, the underground nuclear test cavities.
Gross alpha (α) and gross beta (β) radioactivity and gamma spectroscopy analyses are conducted for Characterization wells, as required.
5.1.1.2 Sample Collection Methods
Water sampling methods are based, in part, on the characteristics and configurations of sample locations. For
example, wells with dedicated pumps may be sampled from the associated plumbing (e.g., spigots) at the wellhead, while wells without pumps may be sampled using a wireline bailer or a portable pumping system. Most wells in the sample network are single-zone completion wells; samples are collected from one depth interval. Some wells, however, are multiple-completion wells and are sampled at multiple depths (e.g., wells ER-EC-11, -12, -13, -14, and -15).
Water samples are generally collected in a manner that ensures they represent ambient formation water following the sampling methods described in standard operating procedures. This may involve purging the well until the stability of certain water quality parameters (e.g., pH, temperature, and electrical conductivity) is achieved. Stabilization of these water quality parameters indicates that formation water is being sampled instead of stagnant water from within and surrounding the wellbore. In some cases, samples are collected using a depth-discrete bailer. While these
samples may not be as representative of ambient formation water as samples collected using a pump, they are considered to be adequate for certain sampling objectives (e.g., sufficient to demonstrate early detection of 3H at levels well below the 20,000 pCi/L MCL).
Water sampling methods also depend on the suite of analytes and the hydrogeological system being sampled. Determination of cost-effective groundwater monitoring technologies is an active area of study for UGTA. These studies include identifying mobile sampling technologies capable of sampling the deep (up to 4,100 feet) wells included in the Plan.
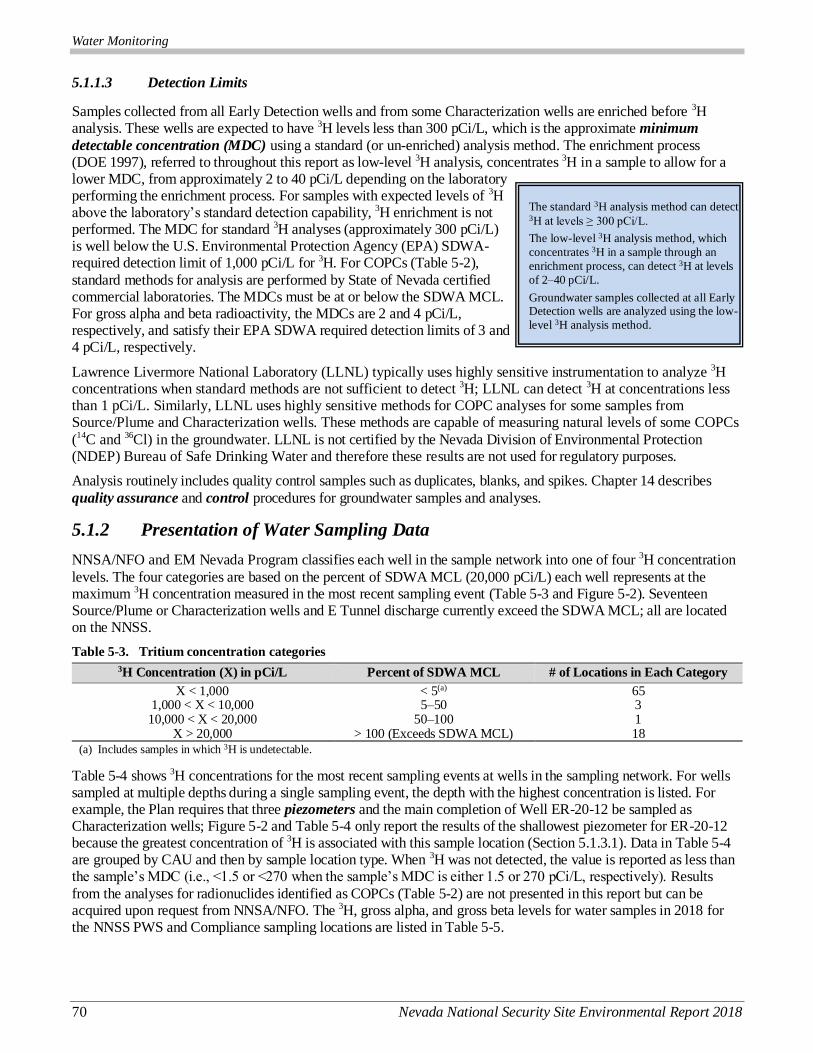
Water Monitoring
70 Nevada National Security Site Environmental Report 2018
5.1.1.3 Detection Limits
Samples collected from all Early Detection wells and from some Characterization wells are enriched before 3H analysis. These wells are expected to have 3H levels less than 300 pCi/L, which is the approximate minimum
detectable concentration (MDC) using a standard (or un-enriched) analysis method. The enrichment process (DOE 1997), referred to throughout this report as low-level 3H analysis, concentrates 3H in a sample to allow for a lower MDC, from approximately 2 to 40 pCi/L depending on the laboratory performing the enrichment process. For samples with expected levels of 3H above the laboratory’s standard detection capability, 3H enrichment is not performed. The MDC for standard 3H analyses (approximately 300 pCi/L) is well below the U.S. Environmental Protection Agency (EPA) SDWA-required detection limit of 1,000 pCi/L for 3H. For COPCs (Table 5-2),
standard methods for analysis are performed by State of Nevada certified commercial laboratories. The MDCs must be at or below the SDWA MCL. For gross alpha and beta radioactivity, the MDCs are 2 and 4 pCi/L, respectively, and satisfy their EPA SDWA required detection limits of 3 and 4 pCi/L, respectively.
Lawrence Livermore National Laboratory (LLNL) typically uses highly sensitive instrumentation to analyze 3H concentrations when standard methods are not sufficient to detect 3H; LLNL can detect 3H at concentrations less than 1 pCi/L. Similarly, LLNL uses highly sensitive methods for COPC analyses for some samples from Source/Plume and Characterization wells. These methods are capable of measuring natural levels of some COPCs
(14C and 36Cl) in the groundwater. LLNL is not certified by the Nevada Division of Environmental Protection (NDEP) Bureau of Safe Drinking Water and therefore these results are not used for regulatory purposes.
Analysis routinely includes quality control samples such as duplicates, blanks, and spikes. Chapter 14 describes
quality assurance and control procedures for groundwater samples and analyses.
5.1.2 Presentation of Water Sampling Data
NNSA/NFO and EM Nevada Program classifies each well in the sample network into one of four 3H concentration
levels. The four categories are based on the percent of SDWA MCL (20,000 pCi/L) each well represents at the maximum 3H concentration measured in the most recent sampling event (Table 5-3 and Figure 5-2). Seventeen Source/Plume or Characterization wells and E Tunnel discharge currently exceed the SDWA MCL; all are located on the NNSS.
Table 5-3. Tritium concentration categories
3H Concentration (X) in pCi/L Percent of SDWA MCL # of Locations in Each Category
X < 1,000 < 5(a) 65 1,000 < X < 10,000 5–50 3
10,000 < X < 20,000 50–100 1 X > 20,000 > 100 (Exceeds SDWA MCL) 18
(a) Includes samples in which 3H is undetectable.
Table 5-4 shows 3H concentrations for the most recent sampling events at wells in the sampling network. For wells sampled at multiple depths during a single sampling event, the depth with the highest concentration is listed. For example, the Plan requires that three piezometers and the main completion of Well ER-20-12 be sampled as Characterization wells; Figure 5-2 and Table 5-4 only report the results of the shallowest piezometer for ER-20-12 because the greatest concentration of 3H is associated with this sample location (Section 5.1.3.1). Data in Table 5-4 are grouped by CAU and then by sample location type. When 3H was not detected, the value is reported as less than the sample’s MDC (i.e., <1.5 or <270 when the sample’s MDC is either 1.5 or 270 pCi/L, respectively). Results
from the analyses for radionuclides identified as COPCs (Table 5-2) are not presented in this report but can be acquired upon request from NNSA/NFO. The 3H, gross alpha, and gross beta levels for water samples in 2018 for the NNSS PWS and Compliance sampling locations are listed in Table 5-5.
The standard 3H analysis method can detect 3H at levels ≥ 300 pCi/L.
The low-level 3H analysis method, which
concentrates 3H in a sample through an
enrichment process, can detect 3H at levels
of 2–40 pCi/L.
Groundwater samples collected at all Early Detection wells are analyzed using the low-
level 3H analysis method.

Water Monitoring
Nevada National Security Site Environmental Report 2018 71
Figure 5-2. Tritium concentration categories at NNSA/NFO and EM Nevada Program sampling locations

Water Monitoring
72 Nevada National Security Site Environmental Report 2018
Table 5-4. Tritium concentrations for the most recent sample at wells in the NNSA/NFO and EM Nevada Program
sample network
Sample Location(a) Land Management or NNSS
Area Sample Year
Maximum 3H Concentration
(pCi/L)(b)(c)
Yellow highlight indicates 3H levels above the SDWA MCL of 20,000 pCi/L Frenchman Flat
Characterization Wells
ER-5-3(d, e) Area 5 2018 <2.9
Source/Plume Wells
RNM-1(e) Area 5 2014 620
RNM-2S(d, e) Area 5 2018 82,000
UE-5n(d, e) Area 5 2018 123,000
Early Detection Wells
ER-5-3-2(d, e) Area 5 2018 <3.1
ER-5-5(d, e) Area 5 2018 <2.7
ER-11-2(d, e) Area 5 2018 <3.1
Pahute Mesa (Central and Western)
Characterization Wells
ER-20-4(f) Area 20 2018 <3.0
ER-20-7(g) Area 20 2017 13,600,000
ER-20-8(g) Area 20 2017 6,600
ER-20-8-2(g) Area 20 2017 3,670
ER-20-11 Area 20 2017 202,000
ER-20-12(f) Area 20 2017 58,100
ER-EC-2A(g) NTTR(h) 2016 <2.9
ER-EC-4(f) NTTR 2018 <2.7
ER-EC-5 NTTR 2003 <320
ER-EC-8(g) NTTR 2016 <4.5
ER-EC-11 NTTR 2017 18,400
ER-EC-12 NTTR 2016 U 3.2(i)
ER-EC-13 NTTR 2013 <3.0
ER-EC-14 NTTR 2014 <2.2
ER-EC-15 NTTR 2014 <2.1
Source/Plume Wells
ER-20-5-1 Area 20 2015 24,800,000
ER-20-5-3 Area 20 2015 84,000
ER-20-6-1(e) Area 20 2017 <270
ER-20-6-2 Area 20 2017 U390(i)
ER-20-6-3(e) Area 20 2017 <290
U-19ad PS 1A(e) Area 19 2008 12,900,000
U-19q PS 1D(e) Area 19 2003 11,000,000
U-19v PS 1D(e) Area 19 2009 84,900,000
U-20n PS 1DD-H Area 20 2005 33,300,000
UE-20n 1 Area 20 2012 55,500,000
Early Detection Wells
ER-20-1 Area 20 2017 <2.9
PM-3 NTTR 2018 574
ER-EC-6 NTTR 2018 U 4.1(i)
U-20 WW Area 20 2018 <3.2
Distal Wells/Locations
ER-EC-1(g) NTTR 2016 <2.9
UE-18r Area 18 2017 <188
Community Wells/Springs
Amargosa Valley RV Park BLM 2017 <211
Ash B, Piezometer 1(e) BLM 2014 <183
Ash B, Piezometer 2(e) BLM 2014 <177
Beatty Water & Sewer #3(j) Beatty 2017 <201
Cind-R-Lite Mine BLM 2017 <205
Peacock Ranch Private land 2017 <209
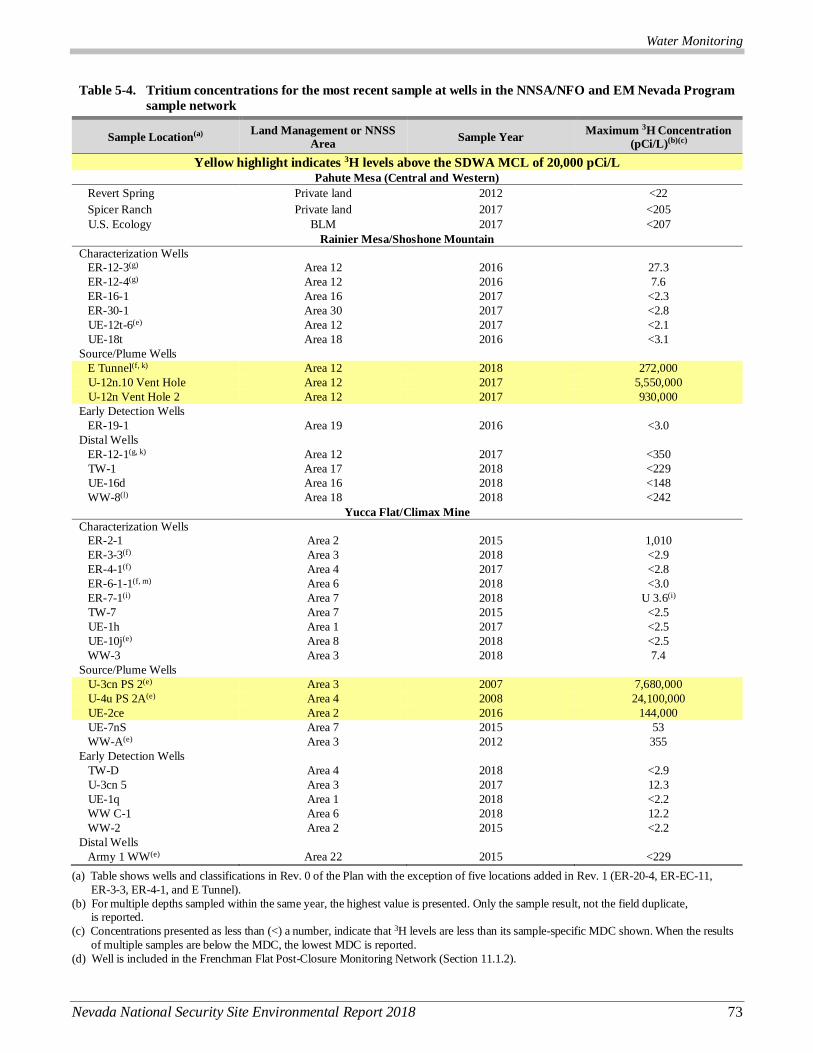
Water Monitoring
Nevada National Security Site Environmental Report 2018 73
Table 5-4. Tritium concentrations for the most recent sample at wells in the NNSA/NFO and EM Nevada Program
sample network
Sample Location(a) Land Management or NNSS
Area Sample Year
Maximum 3H Concentration
(pCi/L)(b)(c)
Yellow highlight indicates 3H levels above the SDWA MCL of 20,000 pCi/L Pahute Mesa (Central and Western)
Revert Spring Private land 2012 <22
Spicer Ranch Private land 2017 <205
U.S. Ecology BLM 2017 <207
Rainier Mesa/Shoshone Mountain
Characterization Wells
ER-12-3(g) Area 12 2016 27.3
ER-12-4(g) Area 12 2016 7.6
ER-16-1 Area 16 2017 <2.3
ER-30-1 Area 30 2017 <2.8
UE-12t-6(e) Area 12 2017 <2.1
UE-18t Area 18 2016 <3.1
Source/Plume Wells
E Tunnel(f, k) Area 12 2018 272,000
U-12n.10 Vent Hole Area 12 2017 5,550,000
U-12n Vent Hole 2 Area 12 2017 930,000
Early Detection Wells
ER-19-1 Area 19 2016 <3.0
Distal Wells
ER-12-1(g, k) Area 12 2017 <350
TW-1 Area 17 2018 <229
UE-16d Area 16 2018 <148
WW-8(l) Area 18 2018 <242
Yucca Flat/Climax Mine
Characterization Wells
ER-2-1 Area 2 2015 1,010
ER-3-3(f) Area 3 2018 <2.9
ER-4-1(f) Area 4 2017 <2.8
ER-6-1-1(f, m) Area 6 2018 <3.0
ER-7-1(i) Area 7 2018 U 3.6(i)
TW-7 Area 7 2015 <2.5
UE-1h Area 1 2017 <2.5
UE-10j(e) Area 8 2018 <2.5
WW-3 Area 3 2018 7.4
Source/Plume Wells
U-3cn PS 2(e) Area 3 2007 7,680,000
U-4u PS 2A(e) Area 4 2008 24,100,000
UE-2ce Area 2 2016 144,000
UE-7nS Area 7 2015 53
WW-A(e) Area 3 2012 355
Early Detection Wells
TW-D Area 4 2018 <2.9
U-3cn 5 Area 3 2017 12.3
UE-1q Area 1 2018 <2.2
WW C-1 Area 6 2018 12.2
WW-2 Area 2 2015 <2.2
Distal Wells
Army 1 WW(e) Area 22 2015 <229
(a) Table shows wells and classifications in Rev. 0 of the Plan with the exception of five locations added in Rev. 1 (ER-20-4, ER-EC-11,
ER-3-3, ER-4-1, and E Tunnel).
(b) For multiple depths sampled within the same year, the highest value is presented. Only the sample result, not the field duplicate, is reported.
(c) Concentrations presented as less than (<) a number, indicate that 3H levels are less than its sample-specific MDC shown. When the results
of multiple samples are below the MDC, the lowest MDC is reported.
(d) Well is included in the Frenchman Flat Post-Closure Monitoring Network (Section 11.1.2).
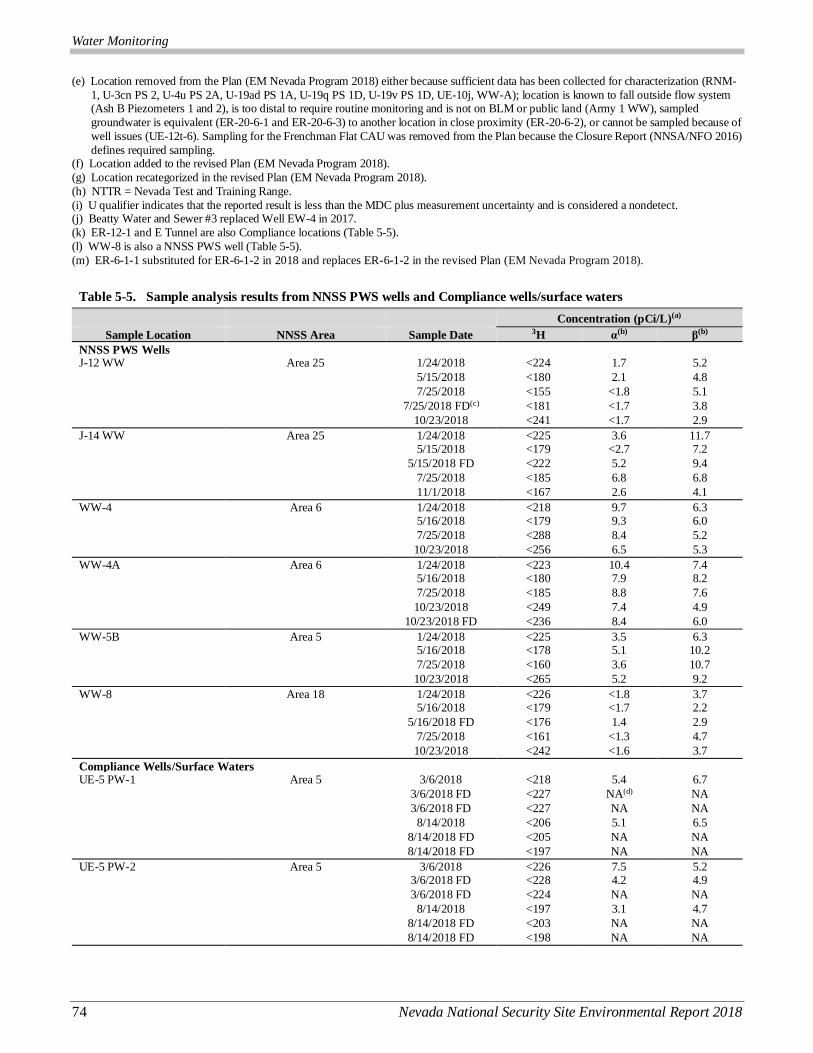
Water Monitoring
74 Nevada National Security Site Environmental Report 2018
(e) Location removed from the Plan (EM Nevada Program 2018) either because sufficient data has been collected for characterization (RNM-
1, U-3cn PS 2, U-4u PS 2A, U-19ad PS 1A, U-19q PS 1D, U-19v PS 1D, UE-10j, WW-A); location is known to fall outside flow system (Ash B Piezometers 1 and 2), is too distal to require routine monitoring and is not on BLM or public land (Army 1 WW), sampled
groundwater is equivalent (ER-20-6-1 and ER-20-6-3) to another location in close proximity (ER-20-6-2), or cannot be sampled because of
well issues (UE-12t-6). Sampling for the Frenchman Flat CAU was removed from the Plan because the Closure Report (NNSA/NFO 2016)
defines required sampling. (f) Location added to the revised Plan (EM Nevada Program 2018).
(g) Location recategorized in the revised Plan (EM Nevada Program 2018).
(h) NTTR = Nevada Test and Training Range.
(i) U qualifier indicates that the reported result is less than the MDC plus measurement uncertainty and is considered a nondetect. (j) Beatty Water and Sewer #3 replaced Well EW-4 in 2017.
(k) ER-12-1 and E Tunnel are also Compliance locations (Table 5-5).
(l) WW-8 is also a NNSS PWS well (Table 5-5).
(m) ER-6-1-1 substituted for ER-6-1-2 in 2018 and replaces ER-6-1-2 in the revised Plan (EM Nevada Program 2018).
Table 5-5. Sample analysis results from NNSS PWS wells and Compliance wells/surface waters
Concentration (pCi/L)(a)
Sample Location NNSS Area Sample Date 3H α(b) β(b)
NNSS PWS Wells
J-12 WW Area 25 1/24/2018 <224 1.7 5.2 5/15/2018 <180 2.1 4.8 7/25/2018 <155 <1.8 5.1
7/25/2018 FD(c) <181 <1.7 3.8 10/23/2018 <241 <1.7 2.9
J-14 WW Area 25 1/24/2018 <225 3.6 11.7 5/15/2018 <179 <2.7 7.2
5/15/2018 FD <222 5.2 9.4 7/25/2018 <185 6.8 6.8 11/1/2018 <167 2.6 4.1
WW-4 Area 6 1/24/2018 <218 9.7 6.3 5/16/2018 <179 9.3 6.0 7/25/2018 <288 8.4 5.2 10/23/2018 <256 6.5 5.3
WW-4A Area 6 1/24/2018 <223 10.4 7.4 5/16/2018 <180 7.9 8.2 7/25/2018 <185 8.8 7.6 10/23/2018 <249 7.4 4.9
10/23/2018 FD <236 8.4 6.0
WW-5B Area 5 1/24/2018 <225 3.5 6.3 5/16/2018 <178 5.1 10.2 7/25/2018 <160 3.6 10.7 10/23/2018 <265 5.2 9.2
WW-8 Area 18 1/24/2018 <226 <1.8 3.7 5/16/2018 <179 <1.7 2.2
5/16/2018 FD <176 1.4 2.9 7/25/2018 <161 <1.3 4.7 10/23/2018 <242 <1.6 3.7
Compliance Wells/Surface Waters
UE-5 PW-1 Area 5 3/6/2018 <218 5.4 6.7 3/6/2018 FD <227 NA(d) NA 3/6/2018 FD <227 NA NA
8/14/2018 <206 5.1 6.5 8/14/2018 FD <205 NA NA 8/14/2018 FD <197 NA NA
UE-5 PW-2 Area 5 3/6/2018 <226 7.5 5.2 3/6/2018 FD <228 4.2 4.9 3/6/2018 FD <224 NA NA
8/14/2018 <197 3.1 4.7 8/14/2018 FD <203 NA NA 8/14/2018 FD <198 NA NA
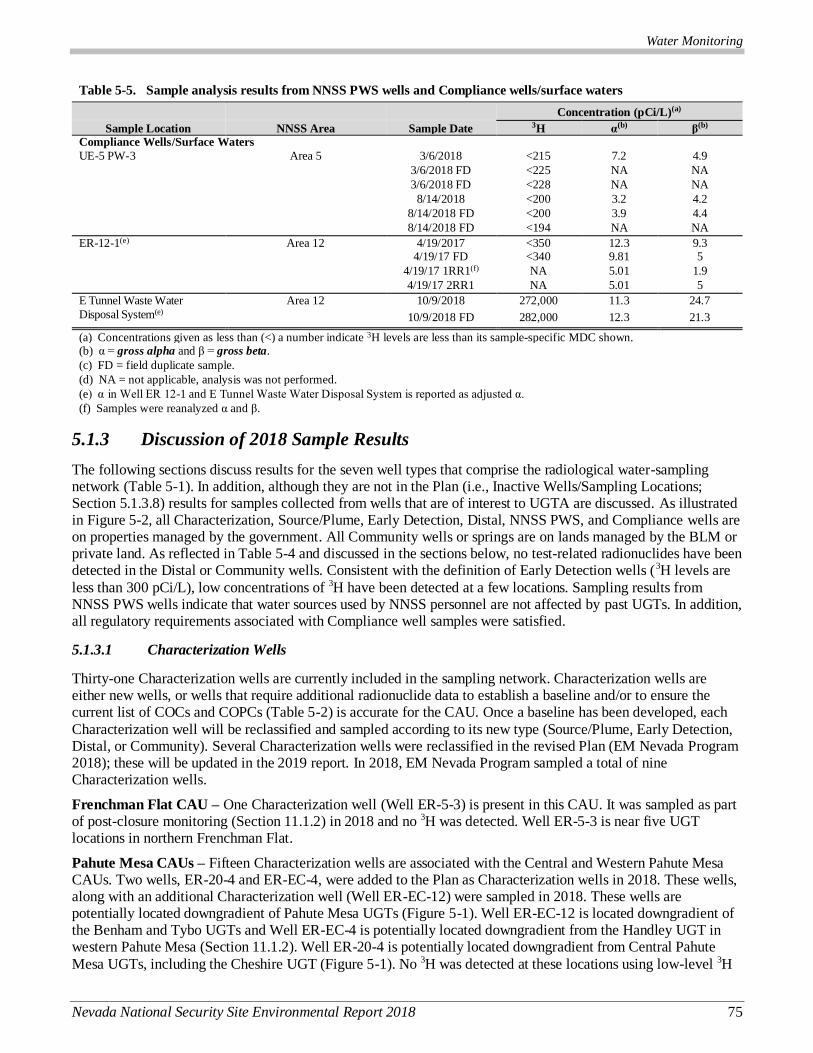
Water Monitoring
Nevada National Security Site Environmental Report 2018 75
Table 5-5. Sample analysis results from NNSS PWS wells and Compliance wells/surface waters
Concentration (pCi/L)(a)
Sample Location NNSS Area Sample Date 3H α(b) β(b)
Compliance Wells/Surface Waters
UE-5 PW-3 Area 5 3/6/2018 <215 7.2 4.9 3/6/2018 FD <225 NA NA 3/6/2018 FD <228 NA NA
8/14/2018 <200 3.2 4.2 8/14/2018 FD <200 3.9 4.4 8/14/2018 FD <194 NA NA
ER-12-1(e) Area 12 4/19/2017 <350 12.3 9.3 4/19/17 FD <340 9.81 5
4/19/17 1RR1(f) NA 5.01 1.9 4/19/17 2RR1 NA 5.01 5
E Tunnel Waste Water
Disposal System(e)
Area 12 10/9/2018 272,000 11.3 24.7
10/9/2018 FD 282,000 12.3 21.3
(a) Concentrations given as less than (<) a number indicate 3H levels are less than its sample-specific MDC shown. (b) α = gross alpha and β = gross beta.
(c) FD = field duplicate sample.
(d) NA = not applicable, analysis was not performed.
(e) α in Well ER 12-1 and E Tunnel Waste Water Disposal System is reported as adjusted α.
(f) Samples were reanalyzed α and β.
5.1.3 Discussion of 2018 Sample Results
The following sections discuss results for the seven well types that comprise the radiological water-sampling network (Table 5-1). In addition, although they are not in the Plan (i.e., Inactive Wells/Sampling Locations; Section 5.1.3.8) results for samples collected from wells that are of interest to UGTA are discussed. As illustrated in Figure 5-2, all Characterization, Source/Plume, Early Detection, Distal, NNSS PWS, and Compliance wells are on properties managed by the government. All Community wells or springs are on lands managed by the BLM or private land. As reflected in Table 5-4 and discussed in the sections below, no test-related radionuclides have been detected in the Distal or Community wells. Consistent with the definition of Early Detection wells (3H levels are
less than 300 pCi/L), low concentrations of 3H have been detected at a few locations. Sampling results from NNSS PWS wells indicate that water sources used by NNSS personnel are not affected by past UGTs. In addition, all regulatory requirements associated with Compliance well samples were satisfied.
5.1.3.1 Characterization Wells
Thirty-one Characterization wells are currently included in the sampling network. Characterization wells are either new wells, or wells that require additional radionuclide data to establish a baseline and/or to ensure the current list of COCs and COPCs (Table 5-2) is accurate for the CAU. Once a baseline has been developed, each
Characterization well will be reclassified and sampled according to its new type (Source/Plume, Early Detection, Distal, or Community). Several Characterization wells were reclassified in the revised Plan (EM Nevada Program 2018); these will be updated in the 2019 report. In 2018, EM Nevada Program sampled a total of nine Characterization wells.
Frenchman Flat CAU – One Characterization well (Well ER-5-3) is present in this CAU. It was sampled as part of post-closure monitoring (Section 11.1.2) in 2018 and no 3H was detected. Well ER-5-3 is near five UGT locations in northern Frenchman Flat.
Pahute Mesa CAUs – Fifteen Characterization wells are associated with the Central and Western Pahute Mesa CAUs. Two wells, ER-20-4 and ER-EC-4, were added to the Plan as Characterization wells in 2018. These wells, along with an additional Characterization well (Well ER-EC-12) were sampled in 2018. These wells are potentially located downgradient of Pahute Mesa UGTs (Figure 5-1). Well ER-EC-12 is located downgradient of the Benham and Tybo UGTs and Well ER-EC-4 is potentially located downgradient from the Handley UGT in western Pahute Mesa (Section 11.1.2). Well ER-20-4 is potentially located downgradient from Central Pahute
Mesa UGTs, including the Cheshire UGT (Figure 5-1). No 3H was detected at these locations using low-level 3H
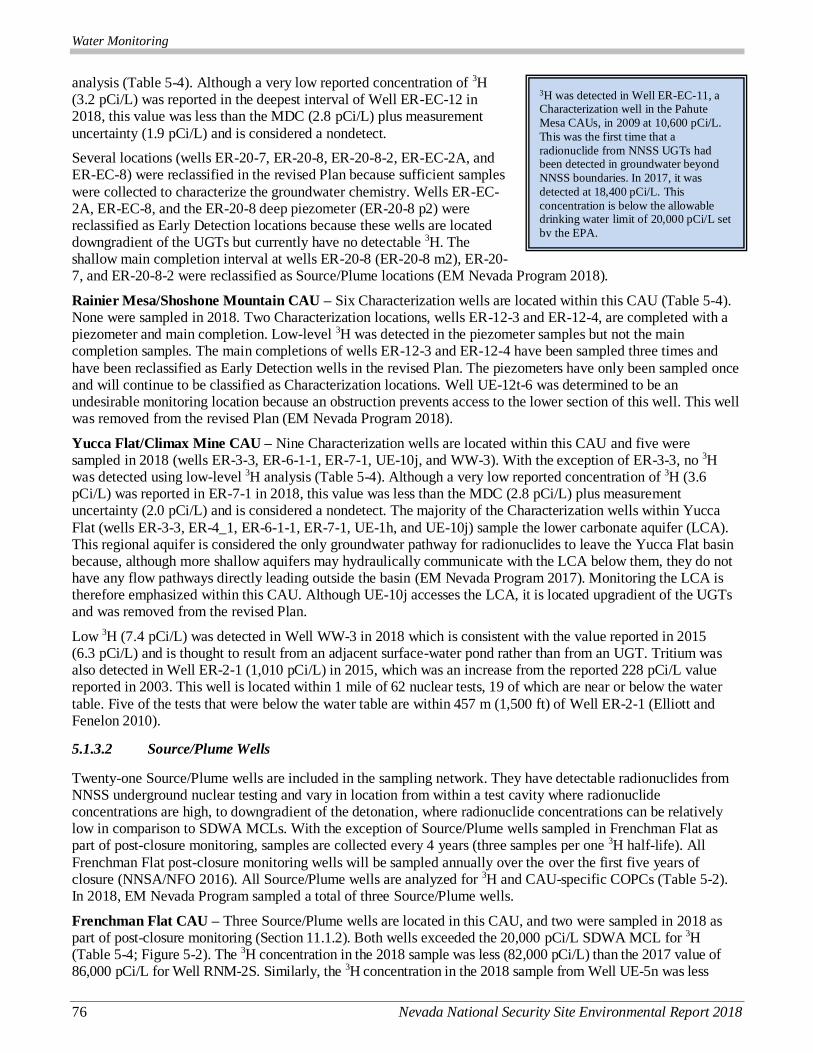
Water Monitoring
76 Nevada National Security Site Environmental Report 2018
analysis (Table 5-4). Although a very low reported concentration of 3H (3.2 pCi/L) was reported in the deepest interval of Well ER-EC-12 in 2018, this value was less than the MDC (2.8 pCi/L) plus measurement
uncertainty (1.9 pCi/L) and is considered a nondetect.
Several locations (wells ER-20-7, ER-20-8, ER-20-8-2, ER-EC-2A, and ER-EC-8) were reclassified in the revised Plan because sufficient samples
were collected to characterize the groundwater chemistry. Wells ER-EC-2A, ER-EC-8, and the ER-20-8 deep piezometer (ER-20-8 p2) were reclassified as Early Detection locations because these wells are located downgradient of the UGTs but currently have no detectable 3H. The shallow main completion interval at wells ER-20-8 (ER-20-8 m2), ER-20-7, and ER-20-8-2 were reclassified as Source/Plume locations (EM Nevada Program 2018).
Rainier Mesa/Shoshone Mountain CAU – Six Characterization wells are located within this CAU (Table 5-4). None were sampled in 2018. Two Characterization locations, wells ER-12-3 and ER-12-4, are completed with a piezometer and main completion. Low-level 3H was detected in the piezometer samples but not the main completion samples. The main completions of wells ER-12-3 and ER-12-4 have been sampled three times and
have been reclassified as Early Detection wells in the revised Plan. The piezometers have only been sampled once and will continue to be classified as Characterization locations. Well UE-12t-6 was determined to be an undesirable monitoring location because an obstruction prevents access to the lower section of this well. This well was removed from the revised Plan (EM Nevada Program 2018).
Yucca Flat/Climax Mine CAU – Nine Characterization wells are located within this CAU and five were sampled in 2018 (wells ER-3-3, ER-6-1-1, ER-7-1, UE-10j, and WW-3). With the exception of ER-3-3, no 3H was detected using low-level 3H analysis (Table 5-4). Although a very low reported concentration of 3H (3.6 pCi/L) was reported in ER-7-1 in 2018, this value was less than the MDC (2.8 pCi/L) plus measurement uncertainty (2.0 pCi/L) and is considered a nondetect. The majority of the Characterization wells within Yucca
Flat (wells ER-3-3, ER-4_1, ER-6-1-1, ER-7-1, UE-1h, and UE-10j) sample the lower carbonate aquifer (LCA). This regional aquifer is considered the only groundwater pathway for radionuclides to leave the Yucca Flat basin because, although more shallow aquifers may hydraulically communicate with the LCA below them, they do not have any flow pathways directly leading outside the basin (EM Nevada Program 2017). Monitoring the LCA is therefore emphasized within this CAU. Although UE-10j accesses the LCA, it is located upgradient of the UGTs and was removed from the revised Plan.
Low 3H (7.4 pCi/L) was detected in Well WW-3 in 2018 which is consistent with the value reported in 2015 (6.3 pCi/L) and is thought to result from an adjacent surface-water pond rather than from an UGT. Tritium was also detected in Well ER-2-1 (1,010 pCi/L) in 2015, which was an increase from the reported 228 pCi/L value reported in 2003. This well is located within 1 mile of 62 nuclear tests, 19 of which are near or below the water
table. Five of the tests that were below the water table are within 457 m (1,500 ft) of Well ER-2-1 (Elliott and Fenelon 2010).
5.1.3.2 Source/Plume Wells
Twenty-one Source/Plume wells are included in the sampling network. They have detectable radionuclides from NNSS underground nuclear testing and vary in location from within a test cavity where radionuclide concentrations are high, to downgradient of the detonation, where radionuclide concentrations can be relatively low in comparison to SDWA MCLs. With the exception of Source/Plume wells sampled in Frenchman Flat as part of post-closure monitoring, samples are collected every 4 years (three samples per one 3H half-life). All
Frenchman Flat post-closure monitoring wells will be sampled annually over the over the first five years of closure (NNSA/NFO 2016). All Source/Plume wells are analyzed for 3H and CAU-specific COPCs (Table 5-2). In 2018, EM Nevada Program sampled a total of three Source/Plume wells.
Frenchman Flat CAU – Three Source/Plume wells are located in this CAU, and two were sampled in 2018 as part of post-closure monitoring (Section 11.1.2). Both wells exceeded the 20,000 pCi/L SDWA MCL for 3H (Table 5-4; Figure 5-2). The 3H concentration in the 2018 sample was less (82,000 pCi/L) than the 2017 value of 86,000 pCi/L for Well RNM-2S. Similarly, the 3H concentration in the 2018 sample from Well UE-5n was less
3H was detected in Well ER-EC-11, a Characterization well in the Pahute
Mesa CAUs, in 2009 at 10,600 pCi/L.
This was the first time that a
radionuclide from NNSS UGTs had been detected in groundwater beyond
NNSS boundaries. In 2017, it was
detected at 18,400 pCi/L. This
concentration is below the allowable drinking water limit of 20,000 pCi/L set
by the EPA.
Water Monitoring
Nevada National Security Site Environmental Report 2018 77
(123,000 pCi/L) than the 2017 value of 132,000 pCi/L. None of the COPCs were detected in the 2018 water samples. Well RNM-1 accesses the explosion region of the Cambric UGT (Stoller-Navarro Joint Venture [SNJV] 2005). Because of extensive pumping of Well RNM-2S from 1975 to 1991, the 3H in RNM-1 groundwater no longer
exceeds SDWA MCLs; therefore, this well is not included in the network of Frenchman Flat post-closure monitoring wells. This well was also removed from the revised Plan.
Pahute Mesa CAUs – Ten Source/Plume wells, associated with six different UGTs, are located within the
Central and Western Pahute Mesa CAUs. None were sampled in 2018 (Table 5-4). The Pahute Mesa Source/Plume wells consist of wells drilled within the test cavity environment following the UGT (“post-shot”) (wells U-19ad PS 1A, U-19v PS 1D, and U-20n PS 1DD-H) and satellite wells located near the test cavity and pumped to evaluate radionuclide migration (wells ER-20-5, ER-20-5-3, ER-20-6-1, ER-20-6-2, ER-20-6-3, and UE-20n 1). Because of the close proximity to the UGT cavity, high 3H is present in most of these samples (Table 5-4 and Figure 5-2).
A few radionuclides (90Sr, 129I, 137Cs, and Pu) exceed their SDWA MCLs (8, 200, 1, and 15 pCi/L, respectively) in samples from the post-shot wells. However, they have not exceeded their MCLs in the satellite wells. Routine analysis of the post-shot wells was determined to be unnecessary because little information is gained regarding radionuclide migration. These wells were therefore removed from the revised Plan. Three wells near the Bullion
UGT (wells ER-20-6-1, ER-20-6-2, and ER-20-6-3) monitor the same aquifer and are in close proximity to each other (Figure 5-2). The revised Plan includes only one of these wells, Well ER-20-6-2, but states that either wells ER-20-6-1 or ER-20-6-3 can be substituted.
Rainier Mesa/Shoshone Mountain CAU – Three Source/Plume are located within the Rainier Mesa/Shoshone Mountain CAU (Table 5-4). One of the Source/Plume locations, E Tunnel, was added to the revised Plan. None were sampled in 2018. Two of the Source/Plume locations monitor radionuclide concentrations in groundwater in the N Tunnel complex through the vent holes. The 3H concentration had decreased in both vent holes when last sampled in 2017. In the U-12n.10 Vent Hole, 129I (3.3 pCi/L) was reported above its 1 pCi/L MCL, and 36Cl (99 pCi/L) was within 10% of its 700 pCi/L SDWA MCL. The 129I result for the U-12n.10 Vent Hole reported by
the commercial lab (3.3 pCi/L) was quite close to the 1.5 pCi/L MDC when the analytical uncertainty (1.6 pCi/L) is considered. LLNL reported 36Cl and 129I of 120 pCi/L and 1.1 pCi/L, respectively using their specialized methods.
Yucca Flat/Climax Mine CAU – Five Source/Plume wells are located within the Yucca Flat/Climax Mine CAU (Table 5-4) but were not sampled in 2018. Three of the five Source/Plume locations exceed the 20,000 pCi/L SDWA MCL. Two of the Source/Plume wells are drilled directly into a test cavity (wells U-3cn PS 2 and U-4u PS 2A). The combined presence of four radionuclides (14C, 90Sr, 129I, and 137Cs) in Well U-4u PS 2A exceeds the SDWA MCL for beta- and photon-emitting radionuclides allowed in drinking water, which is the combined concentration of such emitters that would result in an exposure of 4 mrem/yr. No other radionuclides in samples from Source/Plume wells in this CAU exceed the SDWA MCL. Well WW-A is located approximately 520 m
(1,705 ft) from a test cavity. Tritium was detected in Well WW-A in the late 1980s, peaked at ~700 pCi/L in 1999, and declined to 355 pCi/L by 2012. Well WW-A was removed from the revised Plan because the 3H at this well has been well characterized and is far below the SDWA MCL. As is the case for Pahute Mesa, routine analysis of post-shot wells (wells U 3cn PS 2 and U 4u PS 2A) was determined to be unnecessary so these wells were removed from the revised Plan.
5.1.3.3 Early Detection Wells
Thirteen Early Detection wells are included in the sampling network: three within the Frenchman Flat CAU, four within the Pahute Mesa CAU, one within the Rainier Mesa/Shoshone Mountain CAU, and five within the Yucca
Flat/Climax Mine CAU (Table 5-4). Early Detection Wells are the next wells downgradient of a UGT or Source/Plume well and have expected 3H levels less than the MDCs for standard 3H analyses (i.e., < 300 pCi/L). In the absence of 3H, no other test-related radionuclides are present in historically sampled groundwater; therefore, Early Detection wells are monitored solely for low levels of 3H using the low-level 3H method.
The sampling frequency for Early Detection wells is once every 5 years because of the low groundwater velocities and the resulting slow change in radionuclide concentration with time. Prior to the revised Plan, Early Detection wells associated with the Central and Western Pahute Mesa CAUs were sampled every two years to ensure that

Water Monitoring
78 Nevada National Security Site Environmental Report 2018
the plume front is detected in a reasonable period and a time trend for 3H is established early. This was determined to be much more frequent than necessary based on all current monitoring data. Three Early Detection wells in Frenchman Flat (wells ER-11-2, ER-5-3-2, and ER-5-5), three in Pahute Mesa CAU (wells ER-EC-6,
ER-20-1, PM-3, and U-20 WW) and three in Yucca/Flat/Climax Mine CAU (wells TW-D, UE-1q and U-3cn-5WW-C1) were sampled in 2018.
Frenchman Flat CAU – Wells ER-11-2, ER-5-3-2, and ER-5-5 were sampled in 2018. No 3H was detected in
these wells.
Pahute Mesa CAUs – Wells ER-EC-6, ER-20-1, PM-3, and U-20 WW were sampled in 2018 using depth
discrete bailers. No 3H was detected at Well U-20 WW above the 3.2 pCi/L MDC. Although a very low reported concentration of 3H (4.1 pCi/L) was reported in Well ER-EC-6 in 2018, this value was less than the MDC (2.3 pCi/L) plus measurement uncertainty (1.9 pCi/L) and is considered a nondetect. A previous sample collected from Well ER-EC-6 in 2017 was reported to have a low 3H concentration (6.7 pCi/L) similar to that reported in 2015 (5.2 pCi/L).
Two PM-3 piezometers were sampled using a depth-discrete bailer and a pump in 2018. The 3H was reported as 192 pCi/L (pumped) and 98.2 pCi/L (bailed) in samples collected from the deep piezometer and was reported as 574 pCi/L (pumped) and 201 pCi/L (bailed) in samples collected from the shallow piezometer. The 3H concentrations were lower by a factor of 2.0 (deep piezometer) to 2.9 (shallow piezometer) in the bailed versus pumped samples. Because the 3H in samples collected from the shallow piezometer is greater than the MDC for
standard 3H analysis, this location (Well PM-3 p2) was reclassified as a Source/Plume location.
Yucca Flat/Climax Mine CAU – Wells TW-D, U-3cn 5, UE-1q and WW C-1 were sampled in 2018. All wells
access the LCA in Yucca Flat. Wells TW-D and UE-1q were sampled using depth discrete bailer and no 3H was detected. Well WW C-1 was sampled with a pump, and 3H concentrations of 12.2 pCi/L and 13.5 pCi/L were reported for the sample and duplicate in 2018. Several potential sources of the 3H have been hypothesized, both related and unrelated to underground testing, and combinations of sources are also possible. Potential sources unrelated to underground testing include the accidental spillage of 3H, intended as an RN tracer, into Well WW C-1 in 1964 and also possible localized infiltration of precipitation through cracks in Yucca Lake, located a few kilometers (km) north of Well WW C-1. Continued monitoring at this location will ensure potential MCL exceedances are known well in advance, and will confirm or refute any potential 3H trend at this well.
5.1.3.4 Distal Wells
Seven Distal wells are included in the sampling network: two for the Pahute Mesa CAUs, four for the Rainier Mesa/ Shoshone Mountain CAU, and one for the Yucca Flat/Climax Mine CAU; there are no Distal wells currently associated with the Frenchman Flat CAU (Table 5-4). Distal wells are analyzed for 3H using the standard EPA method. Samples are collected at a 5-year frequency. The sampling objective for these wells is to demonstrate that 3H is not present downgradient of UGTs at levels above the SDWA-required minimum detection limit of 1,000 pCi/L. Data from these wells also support the development and evaluation of the groundwater flow
and contaminant transport models. Three Distal wells (wells ER-12-1, UE-16d, and WW-8) within the Rainier Mesa/Shoshone Mountain CAU were sampled in 2018. No 3H was detected (tables 5-4 and 5-5). Well WW-8 is also an NNSS PWS well (Section 5.1.3.6) and Well ER-12-1 is also a Compliance well (Section 5.1.3.7.2). One Distal well in Pahute Mesa (Well ER-EC-1) was reclassified as an Early Detection well in the revised Plan.
5.1.3.5 Community Wells/Springs
The community sampling network comprises nine locations that are associated with the Pahute Mesa CAUs (Table 5-4). None were sampled in 2018. These wells and springs are used as private, business, or community water supply sources or are near such sources, and they are sampled for 3H every five years. Sampling at a 5-year
frequency is sufficient because of the long flow paths to these locations, the low groundwater velocities, and the monitoring of Early Detection wells upgradient from the Community wells and springs. Early Detection well samples will detect the arrival of a contaminant plume at very low concentrations (i.e., measuring 3H at 0.01% of its MCL) long before such a plume could be detected in these more distant private, business, or community water supply sources. Samples are analyzed using a standard EPA method. The objective is to demonstrate that 3H is not present at levels above the SDWA-required minimum detection limit of 1,000 pCi/L. No 3H has been detected at
Water Monitoring
Nevada National Security Site Environmental Report 2018 79
any locations (Table 5-4 and Chapter 7). Two locations, Ash B, piezometer 1 and Ash B, piezometer 2 were removed from the revised Plan because they do not sample the same flow system downgradient of UGTs (Figure 5-1).
5.1.3.6 NNSS Public Water System Wells
Results from the NNSS PWS water wells sampled quarterly in 2018 continue to indicate that historical underground nuclear testing has not impacted the NNSS water supply network. No 3H measurements were above their MDCs using the EPA standard analysis method (Table 5-5). Gross alpha and gross beta radioactivity were found at concentrations slightly greater than their MDCs in most 2018 samples and are believed to represent the presence of naturally occurring radionuclides. However, no water supply samples had gross alpha measurements that exceeded the EPA MCL (15 pCi/L) or gross beta measurements that exceeded the EPA level of concern (50 pCi/L).
5.1.3.7 Compliance Wells/Groundwater Discharges
RCRA Permitted Wells for the Area 5 Mixed Waste Disposal Unit
Wells UE-5 PW-1, UE-5 PW-2, and UE-5 PW-3 are sampled semi-annually for 3H. They are monitored for 3H
and nonradiological parameters (Section 10.1.7) to verify the performance of the Area 5 Mixed Waste Disposal Unit (Cell 18), which is operated under a RCRA permit. In 2018, standard 3H analyses of the wells’ water samples were performed; all samples had non-detectable levels of 3H (Table 5-5), and their MDCs were well below the permit-established investigation level (IL) of 2,000 pCi/L. Further groundwater analysis is required if the IL is exceeded. Results continue to indicate that Cell 18 radioactive wastes have not contaminated local groundwater.
Table 10-4 presents the 2018 sampling results for four additional indicators of groundwater contamination, and all 2018 sample analysis results for these three wells are presented in MSTS (2018).
NDEP Permitted E Tunnel Waste Water Disposal System
NNSA/NFO manages and operates the Nevada National Security Site (NNSS) Area 12 E Tunnel Waste Water Disposal System (ETDS) in accordance to the Nevada Division of Environmental Protection (NDEP) Bureau of
Federal Facilities water pollution control permit (NEV 96021), Revision 1. The permit governs the management of radionuclide-contaminated wastewater that discharges from the E Tunnel portal into a series of conveyance pipes and earthen holding/infiltration ponds.
The permit requires chemical and radiological constituents monitoring of the ETDS effluent and groundwater associated with well ER-12-1. ETDS effluent tritium, adjusted gross alpha and gross beta activities are measured annually. Groundwater tritium, adjusted gross alpha and gross beta activities are measured biennial at well ER-12-1. The permissible limits of tritium, adjusted gross alpha, and gross beta in the ETDS effluent are 1,000,000 pCi/L, 35.1 pCi/L, and 101 pCi/L, respectively. The permissible limits for tritium, adjusted gross alpha, and gross beta in groundwater of Well ER-12-1 are 20,000 pCi/L, 15 pCi/L, and 50 pCi/L, respectively.
Monitoring personnel sampled the ETDS effluent on October 9, 2018 (Table 5.5). All radiological and non-radiological parameters were within their permissible and threshold limits. Non-radiological results and associated threshold limits are provided in Table 5-9. Well ER-12-1 was not sampled in 2018.
UGTA Well Discharged Groundwater and Fluids
UGTA wells are regulated by the state through an agreement between NNSA/NFO and NDEP called the UGTA Fluid Management Plan (Attachment 1 of NNSA/NFO 2009). The plan prescribes the methods for disposing groundwater and fluids pumped from UGTA wells during drilling, development, and testing based on the levels of radiological contamination. Discharge water and drilling fluids with ≥400,000 pCi/L of 3H are required to be
diverted to lined or unlined sumps to evaporate. Samples of the discharge water from the wellhead are analyzed for gross alpha, gross beta, 3H, and RCRA-regulated metals to ensure discharged water is below the established fluid management criteria for these parameters. When the 3H level in discharge water and drilling fluids is ≥400,000 pCi/L, lead is monitored in the field to ensure the RCRA limit for lead of 5 milligrams per liter (mg/L) is not exceeded; exceeding this level may result in the generation of hazardous or mixed waste in a sump, which could result in the suspension of drilling operations.
Water Monitoring
80 Nevada National Security Site Environmental Report 2018
In 2018, no wells were sampled with 3H ≥400,000 pCi/L. With the exception of wells UE-5n and RNM-2S, groundwater from all UGTA wells was discharged into a lined or unlined sump. Groundwater from Well UE-5n was discharged into an infiltration area and Well RNM-2S was discharged into the Cambric ditch. Grab samples
from all of the discharge water were below the fluid management criteria limits for all analyzed parameters.
5.1.3.8 Underground Test Area Inactive Wells/Sampling Locations
Sampling locations not assigned to one of the seven previously discussed sample location types are called Inactive Wells or Inactive Sampling Locations; they are not included in the water-sampling network depicted in Figures 5-1 and 5-2. One inactive well (Well ER-20-2-1) was sampled in 2018. No 3H was detected.
Water Monitoring
Nevada National Security Site Environmental Report 2018 81
5.2 Nonradiological Drinking Water and Wastewater Monitoring
Nonradiological Water Monitoring Goals
Ensure that the operation of NNSS PWSs and private water systems provides high-quality drinking water to workers and
visitors at the NNSS. Determine if NNSS PWSs are operated in accordance with the requirements in Nevada Administrative
Code Chapter NAC 445A, Water Controls, under permits issued by the state. Determine if the operation of commercial septic
systems that process domestic wastewater on the NNSS meets operational standards in accordance with the requirements
NAC 445A under permits issued by the state. Determine if the operation of industrial wastewater systems on the NNSS meets
operational standards of federal and state regulations as prescribed under the GNEV93001 state permit.
Federal and state laws regulate the quality of drinking water and wastewater on the NNSS. The design, construction, operation, and maintenance of many of the drinking water and wastewater systems are regulated under state permits. NNSA/NFO ensures systems meet applicable water quality standards and permit requirements. The NNSS nonradiological water monitoring goals are shown below. They are met by analyzing water samples, performing assessments, and maintaining documentation. This section describes the results of
2018 activities. Results from radiological monitoring of drinking water on and off the NNSS and of wastewater on the NNSS is discussed in Sections 5.1.3.5, 5.1.3.6, and 5.1.3.7.
5.2.1 Drinking Water Monitoring
Six wells on the NNSS are permitted to supply the potable water needs of NNSS operations. These are grouped into three PWSs (Figure 5-3). The largest system (Areas 23 and 6) is classified under its permit as a non-transient non-community PWS and serves the main work areas of the NNSS. The other two systems (Area 12 and Area 25) are classified as transient non-community PWSs. The PWSs are designed, operated, and maintained in accordance with the requirements in NAC 445A under permits issued by the NDEP Bureau of Safe Drinking Water (BSDW).
PWS permits are renewed annually.
The three PWSs must meet National Primary Drinking Water Standards and Secondary Standards (set by the state) for water quality. They are sampled according to a 9-year monitoring cycle, which identifies the specific
classes of contaminants to monitor at each drinking water source, and the frequency (Table 5-6). At sample locations in buildings, the sampling point for coliform bacteria is a sink within the building. Samples for chemical contaminants are collected at the points of entry to the PWS. Although not required by regulation or by any permit, NNSA/NFO collects samples inside service connections for coliform bacteria to further ensure safe drinking water.
For work locations at the NNSS not connected to a PWS, NNSA/NFO hauls potable water in two water tanker trucks. Three work locations (the Device Assembly Facility [DAF] in Area 6, the Joint Actinide Shock Physics Experimental Research facility in Area 27, and the Area 5 Radioactive Waste Management Site) are designated as service connections to the Area 23 and 6 PWS. The trucks are permitted by the BSDW, and the water they carry is subject to water quality standards for coliform bacteria (Table 5-6). Normal water delivery is to remote service
connections and hand-washing stations at construction sites, which are activities not subject to permitting. NNSA/NFO renews the permits for the trucks annually.
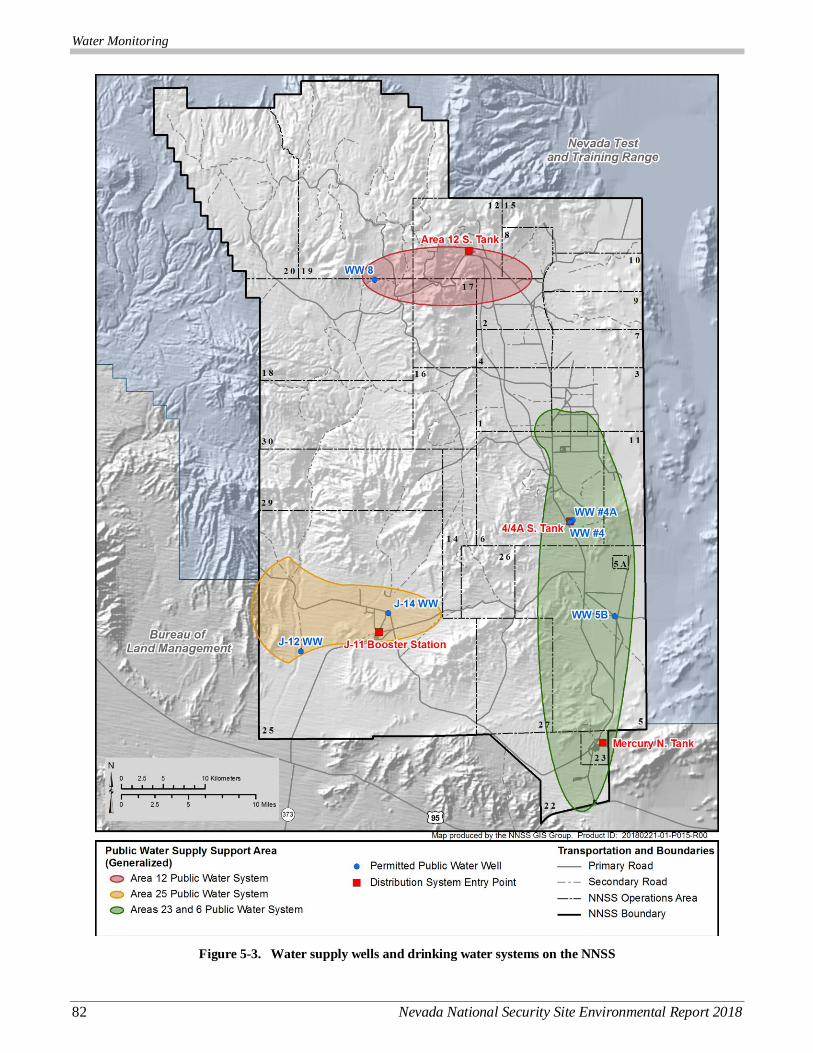
Water Monitoring
82 Nevada National Security Site Environmental Report 2018
Figure 5-3. Water supply wells and drinking water systems on the NNSS

Water Monitoring
Nevada National Security Site Environmental Report 2018 83
Table 5-6. Current sampling requirements for permitted NNSS PWSs and water-hauling trucks
System/ Truck Contaminant or
Contaminant Category Sample Location
Sampling
Cycle
Number of
Samples
Area 23 and 6 National Primary Standards
Coliform WDP-23/6(a) monthly 2
Disinfectant residual WDP-23/6 monthly 2
Asbestos WDP-23/6 9 year 1
Disinfection by-products WDP-23/6 1 year 1
Lead and copper WDP-23/6 3 year 10
Arsenic POE-23/6(b) 3 year 1
IOCs(c) - Phase 2 and 5(d) POE-23/6 9 year 1
Nitrate POE-23/6 1 year 1
Nitrite POE-23/6 3 year 1
SOCs(e) - Phase 2 and 5 POE-23/6 6 year 1
VOCs(f) - Phase 2 and 5 POE-23/6 3 year 1
Secondary Standards
Secondary IOCs POE-23/6 3 year 1
Area 12 and Area 25 National Primary Standards
Coliform WDP-12/25(g) quarterly 1
Nitrate POE-12/25(h) 1 year 1
Nitrite POE-12/25 3 year 1
Secondary Standards
Secondary IOCs POE-12/25 3 year 1
Water-hauling Trucks
Trucks 84846 and 84847 Coliform Bacteria Truck valve monthly 1
(a) WDP–23/6 = Water delivery points for the Area 23 and 6 PWS: taps within Buildings 5-7, 6-609, 6-900, 22-1, 23-180, 23-701,
23-777, 23-1103, and the U1H restroom. (b) POE–23/6 = Points of entry for the Area 23 and 6 PWS: Mercury N. Tank and 4/4A S. Tank (Figure 5-3).
(c) IOCs = Inorganic chemicals.
(d) Refers to sets of chemical contaminants in drinking water for which the EPA established maximum contaminant levels
(MCLs) through a series of rules known as the Chemical Phase Rules issued from1987 (Phase 1) through 1992 (Phase 5);
http://water.epa.gov/lawsregs/rulesregs/sdwa/chemicalcontaminantrules/basicinformation.cfm.
(e) SOCs = Synthetic organic chemicals.
(f) VOCs = Volatile organic compounds.
(g) WDP-12/25 = Water delivery points for the Area 12 and Area 25 PWSs: Buildings 12-909 and 25-3123 or 25-4222.
(h) POE-12/25 = Points of entry for the Area 12 and Area 25 PWSs: Area 12 S. Tank, J-11 Booster Station, and J-14 WW (Figure 5-3).
5.2.1.1 2018 Results of Public Water System and Water-Hauling Truck Monitoring
Water samples are collected in accordance with accepted practices, analyses are conducted by state-certified
laboratories, and analytical methods are approved as listed in NAC 445A and Title 40 Code of Federal Regulations
(CFR) Part 141, National Primary Drinking Water Standards. The 2018 monitoring results indicated all of the PWSs complied with applicable National Primary Drinking Water Quality Standards (Table 5-7). In addition, water samples from the water-hauling trucks were negative for coliform bacteria.
5.2.1.2 State Inspections
Approximately every three years, NDEP conducts a sanitary survey of the permitted PWSs that includes an inspection of wells, tanks, and other visible portions of each PWS. The last NDEP survey was in 2017; no
sanitary surveys were conducted in 2018. Water-hauling trucks are inspected annually for compliance with NAC 445A; truck inspections were in June 2018, and NDEP renewed both permits.
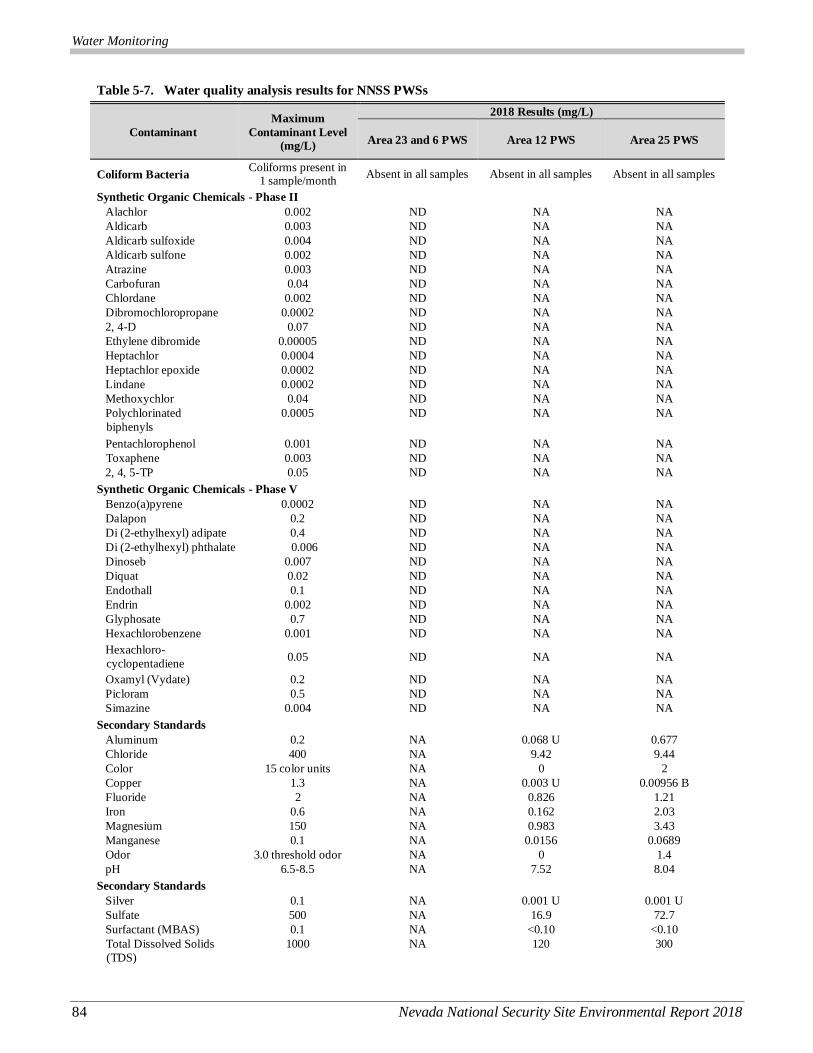
Water Monitoring
84 Nevada National Security Site Environmental Report 2018
Table 5-7. Water quality analysis results for NNSS PWSs
Contaminant
Maximum
Contaminant Level
(mg/L)
2018 Results (mg/L)
Area 23 and 6 PWS Area 12 PWS Area 25 PWS
Coliform Bacteria Coliforms present in
1 sample/month Absent in all samples Absent in all samples Absent in all samples
Synthetic Organic Chemicals - Phase II
Alachlor 0.002 ND NA NA
Aldicarb 0.003 ND NA NA
Aldicarb sulfoxide 0.004 ND NA NA
Aldicarb sulfone 0.002 ND NA NA
Atrazine 0.003 ND NA NA
Carbofuran 0.04 ND NA NA
Chlordane 0.002 ND NA NA
Dibromochloropropane 0.0002 ND NA NA
2, 4-D 0.07 ND NA NA
Ethylene dibromide 0.00005 ND NA NA
Heptachlor 0.0004 ND NA NA
Heptachlor epoxide 0.0002 ND NA NA
Lindane 0.0002 ND NA NA
Methoxychlor 0.04 ND NA NA
Polychlorinated
biphenyls
0.0005 ND NA NA
Pentachlorophenol 0.001 ND NA NA
Toxaphene 0.003 ND NA NA
2, 4, 5-TP 0.05 ND NA NA
Synthetic Organic Chemicals - Phase V
Benzo(a)pyrene 0.0002 ND NA NA
Dalapon 0.2 ND NA NA
Di (2-ethylhexyl) adipate 0.4 ND NA NA
Di (2-ethylhexyl) phthalate 0.006 ND NA NA
Dinoseb 0.007 ND NA NA
Diquat 0.02 ND NA NA
Endothall 0.1 ND NA NA
Endrin 0.002 ND NA NA
Glyphosate 0.7 ND NA NA
Hexachlorobenzene 0.001 ND NA NA
Hexachloro-
cyclopentadiene 0.05 ND NA NA
Oxamyl (Vydate) 0.2 ND NA NA
Picloram 0.5 ND NA NA
Simazine 0.004 ND NA NA
Secondary Standards
Aluminum 0.2 NA 0.068 U 0.677
Chloride 400 NA 9.42 9.44
Color 15 color units NA 0 2
Copper 1.3 NA 0.003 U 0.00956 B
Fluoride 2 NA 0.826 1.21
Iron 0.6 NA 0.162 2.03
Magnesium 150 NA 0.983 3.43
Manganese 0.1 NA 0.0156 0.0689
Odor 3.0 threshold odor
number
NA 0 1.4
pH 6.5-8.5 NA 7.52 8.04
Secondary Standards
Silver 0.1 NA 0.001 U 0.001 U
Sulfate 500 NA 16.9 72.7
Surfactant (MBAS) 0.1 NA <0.10 <0.10
Total Dissolved Solids
(TDS)
1000 NA 120 300
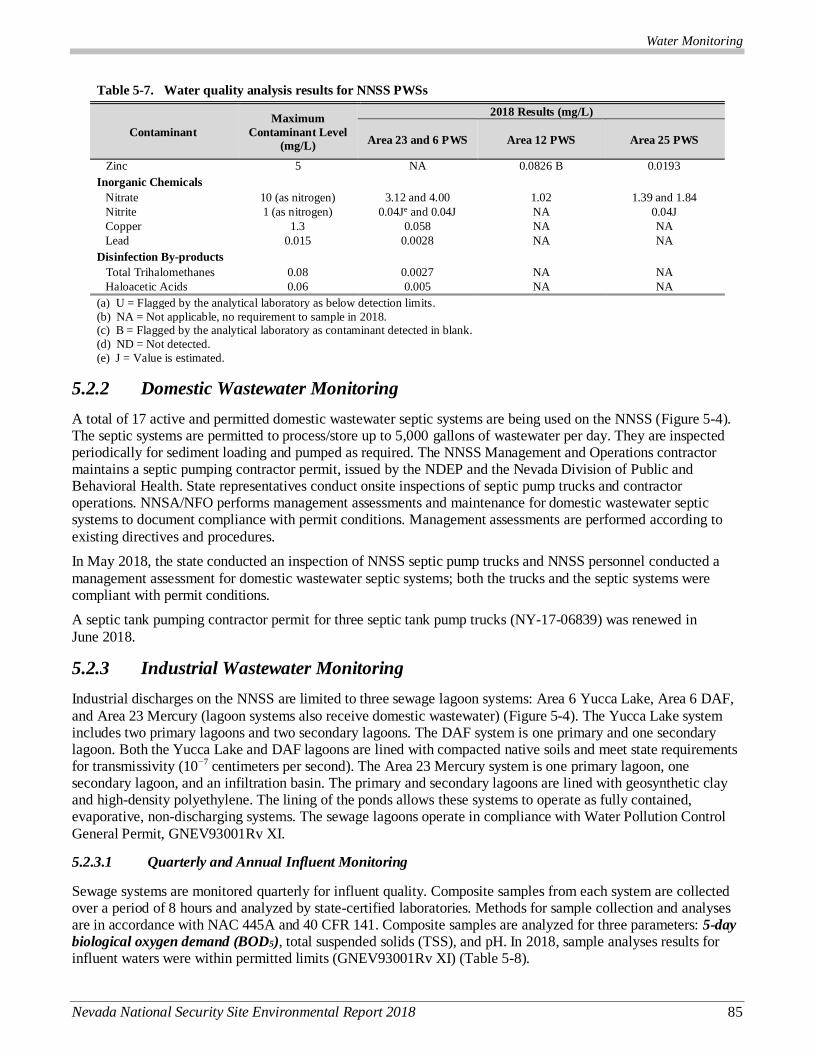
Water Monitoring
Nevada National Security Site Environmental Report 2018 85
Table 5-7. Water quality analysis results for NNSS PWSs
Contaminant
Maximum
Contaminant Level
(mg/L)
2018 Results (mg/L)
Area 23 and 6 PWS Area 12 PWS Area 25 PWS
Zinc 5 NA 0.0826 B 0.0193
Inorganic Chemicals
Nitrate 10 (as nitrogen) 3.12 and 4.00 1.02 1.39 and 1.84
Nitrite 1 (as nitrogen) 0.04Je and 0.04J NA 0.04J
Copper 1.3 0.058 NA NA
Lead 0.015 0.0028 NA NA
Disinfection By-products
Total Trihalomethanes 0.08 0.0027 NA NA
Haloacetic Acids 0.06 0.005 NA NA
(a) U = Flagged by the analytical laboratory as below detection limits.
(b) NA = Not applicable, no requirement to sample in 2018. (c) B = Flagged by the analytical laboratory as contaminant detected in blank.
(d) ND = Not detected.
(e) J = Value is estimated.
5.2.2 Domestic Wastewater Monitoring
A total of 17 active and permitted domestic wastewater septic systems are being used on the NNSS (Figure 5-4). The septic systems are permitted to process/store up to 5,000 gallons of wastewater per day. They are inspected periodically for sediment loading and pumped as required. The NNSS Management and Operations contractor maintains a septic pumping contractor permit, issued by the NDEP and the Nevada Division of Public and Behavioral Health. State representatives conduct onsite inspections of septic pump trucks and contractor operations. NNSA/NFO performs management assessments and maintenance for domestic wastewater septic systems to document compliance with permit conditions. Management assessments are performed according to
existing directives and procedures.
In May 2018, the state conducted an inspection of NNSS septic pump trucks and NNSS personnel conducted a
management assessment for domestic wastewater septic systems; both the trucks and the septic systems were compliant with permit conditions.
A septic tank pumping contractor permit for three septic tank pump trucks (NY-17-06839) was renewed in
June 2018.
5.2.3 Industrial Wastewater Monitoring
Industrial discharges on the NNSS are limited to three sewage lagoon systems: Area 6 Yucca Lake, Area 6 DAF,
and Area 23 Mercury (lagoon systems also receive domestic wastewater) (Figure 5-4). The Yucca Lake system includes two primary lagoons and two secondary lagoons. The DAF system is one primary and one secondary lagoon. Both the Yucca Lake and DAF lagoons are lined with compacted native soils and meet state requirements for transmissivity (10−7 centimeters per second). The Area 23 Mercury system is one primary lagoon, one secondary lagoon, and an infiltration basin. The primary and secondary lagoons are lined with geosynthetic clay and high-density polyethylene. The lining of the ponds allows these systems to operate as fully contained, evaporative, non-discharging systems. The sewage lagoons operate in compliance with Water Pollution Control
General Permit, GNEV93001Rv XI.
5.2.3.1 Quarterly and Annual Influent Monitoring
Sewage systems are monitored quarterly for influent quality. Composite samples from each system are collected over a period of 8 hours and analyzed by state-certified laboratories. Methods for sample collection and analyses are in accordance with NAC 445A and 40 CFR 141. Composite samples are analyzed for three parameters: 5-day
biological oxygen demand (BOD5), total suspended solids (TSS), and pH. In 2018, sample analyses results for influent waters were within permitted limits (GNEV93001Rv XI) (Table 5-8).

Water Monitoring
86 Nevada National Security Site Environmental Report 2018
Toxicity monitoring of influent waters of the lagoons was not conducted in 2018. Permit GNEV93001 Revision XI requires lagoons to be sampled and analyzed for the 29 contaminants listed in Table 4-10 of the Nevada Test Site Environmental Report 2008 (NSTec 2009) only in the event of specific or accidental discharges of potential
contaminants. No specific or accidental discharges occurred in 2018.
Table 5-8. Water quality and flow monitoring results for NNSS sewage lagoon influent waters in 2018
5.2.3.2 Sewage System Inspections
NNSA/NFO personnel inspect active systems bi-weekly and inactive lagoon systems quarterly; no notable observations were made in 2018. NDEP inspects both active and inactive NNSS lagoon systems annually; there were no findings of deficiency in 2018. Inspections evaluate all infrastructure (i.e., field maintenance programs, lagoons, sites, and access roads) for abnormal conditions, weeds, algae blooms, pond color, abnormal odors, dike erosion, burrowing animals, discharge, depth of staff gauge, crest level, excess insect population, maintenance/repairs, and general conditions.
5.2.4 E Tunnel Waste Water Disposal System Monitoring
NNSA/NFO manages and operates the ETDS in Area 12 under a separate water pollution control permit (NEV 96021) issued by the NDEP Bureau of Federal Facilities. The permit regulates the management of radionuclide-contaminated wastewater that drains from the E Tunnel portal into a series of holding ponds. The
permit requires ETDS discharge waters to be monitored every 12 months for radiological parameters (Adjusted Gross Alpha, Gross Beta, 3H) and nonradiological parameters (Table 5-9). It also requires nearby Well ER-12-1 to be sampled for the same parameters once every 24 months. ETDS discharge water is also monitored monthly for flow rate, pH, temperature, and specific conductance, and for the volume and structural integrity of the holding ponds. Monitoring data are reported to the NDEP Bureau of Federal Facilities in quarterly and annual reports.
Monitoring personnel sampled the ETDS discharge water on October 9, 2018. All radiological and nonradiological parameters were within the threshold limits. Nonradiological results and thresholds are provided in Table 5-9. Well ER-12-1 was not sampled in 2018.
Minimum and Maximum Values from Quarterly Samples
Parameter Units Area 6 Yucca Lake Area 23 Mercury Area 6 DAF
BOD5 mg/L 48–188 141–251 85.9–178 Permit Limit None None None
BOD5 Mean Daily Load(a) kg/d 0.40–1.9 4.9–19.9 2.4–4.8
Permit Limit 34.43 124.31 15.29
TSS mg/L 50–202 89–420 126–540
Permit Limit None None None
pH S.U.(b) 7.46–8.05 7.13–8.29 8.21–8.48
Permit Limit 6.0–9.0 6.0–9.0 6.0–9.0
Quarterly Average Flow Rate GPD(c) 757–3,415 8,666–23,527 521–948
Permit Limit 10,850 73,407 3,080(d)
(a) BOD5 Mean Daily Load in kilograms per day (kg/d) = (mg/L BOD × liters per day (L/d) average flow × 3.785)/106.
(b) Standard units of pH.
(c) Gallons per day.
(d) Average flow rate exceeded reported limit; NDEP granted a waiver for flow rate at the Area 6 DAF (included in permit Revision XI). The limit was initially too low due to the use of a standard water balance calculation in lieu of a metering device.
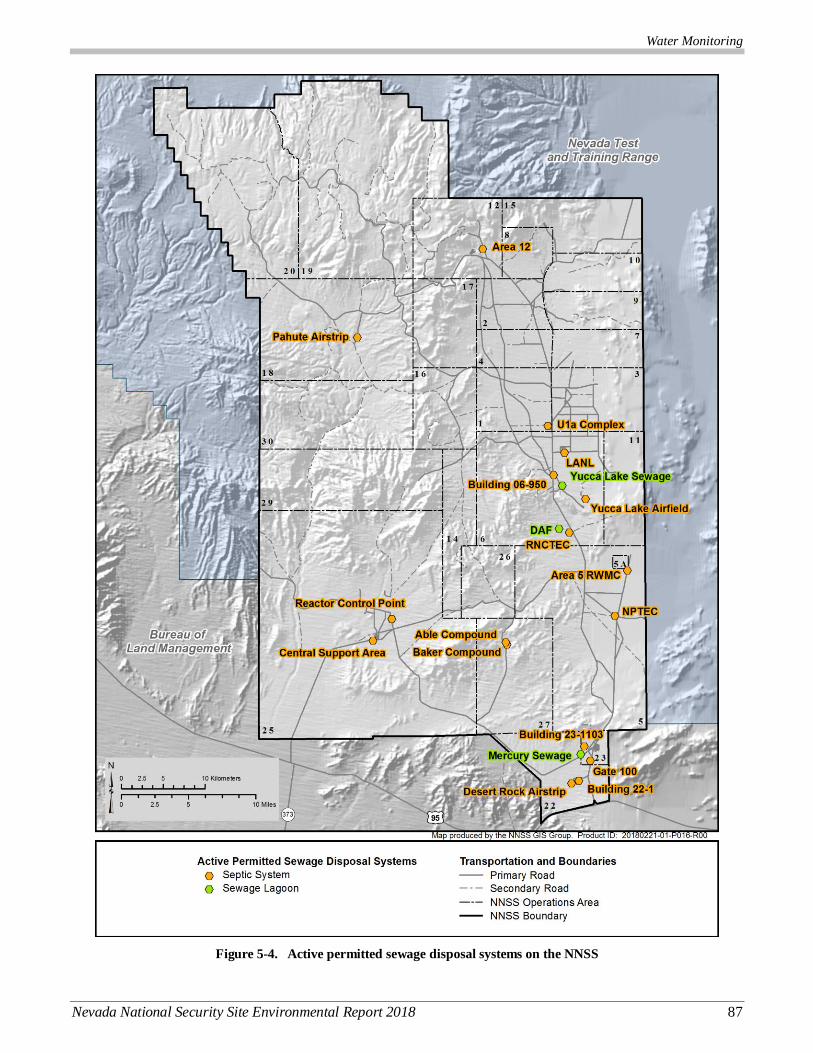
Water Monitoring
Nevada National Security Site Environmental Report 2018 87
Figure 5-4. Active permitted sewage disposal systems on the NNSS
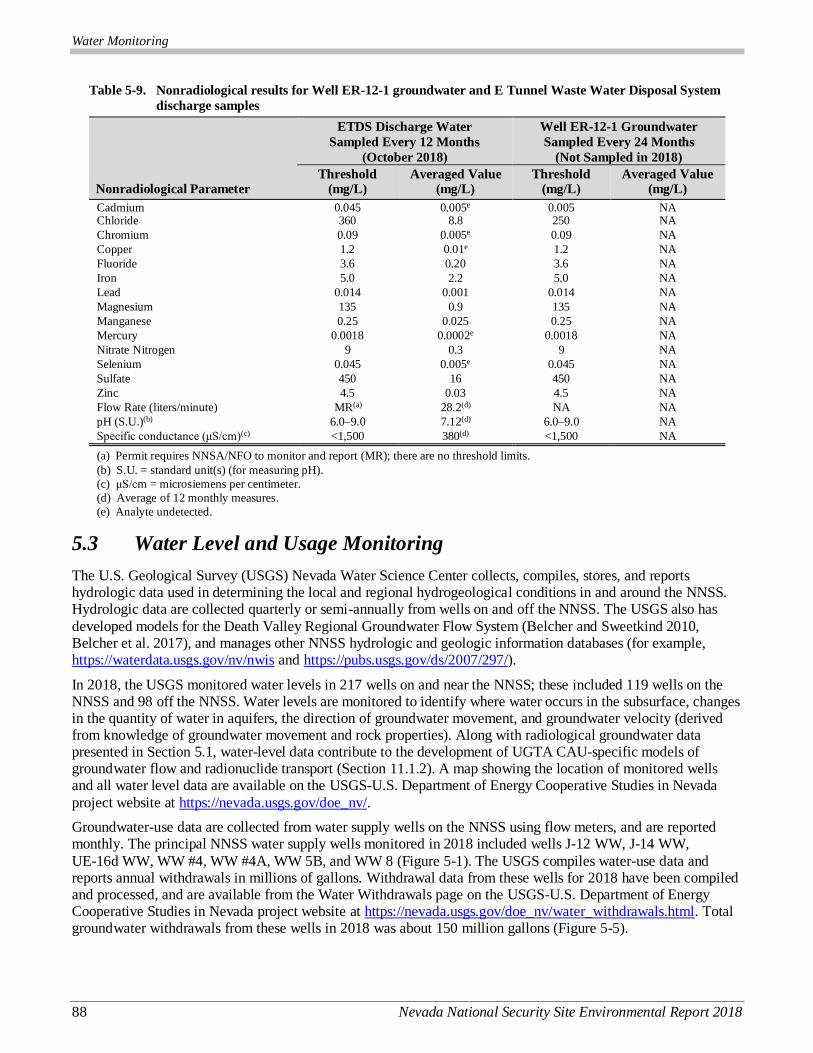
Water Monitoring
88 Nevada National Security Site Environmental Report 2018
Table 5-9. Nonradiological results for Well ER-12-1 groundwater and E Tunnel Waste Water Disposal System
discharge samples
Nonradiological Parameter
ETDS Discharge Water
Sampled Every 12 Months
(October 2018)
Well ER-12-1 Groundwater
Sampled Every 24 Months
(Not Sampled in 2018)
Threshold (mg/L)
Averaged Value (mg/L)
Threshold (mg/L)
Averaged Value (mg/L)
Cadmium 0.045 0.005e 0.005 NA
Chloride 360 8.8 250 NA
Chromium 0.09 0.005e 0.09 NA
Copper 1.2 0.01e 1.2 NA
Fluoride 3.6 0.20 3.6 NA
Iron 5.0 2.2 5.0 NA
Lead 0.014 0.001 0.014 NA
Magnesium 135 0.9 135 NA
Manganese 0.25 0.025 0.25 NA
Mercury 0.0018 0.0002e 0.0018 NA
Nitrate Nitrogen 9 0.3 9 NA
Selenium 0.045 0.005e 0.045 NA
Sulfate 450 16 450 NA
Zinc 4.5 0.03 4.5 NA
Flow Rate (liters/minute) MR(a) 28.2(d) NA NA
pH (S.U.)(b) 6.0–9.0 7.12(d) 6.0–9.0 NA
Specific conductance (μS/cm)(c) <1,500 380(d) <1,500 NA
(a) Permit requires NNSA/NFO to monitor and report (MR); there are no threshold limits.
(b) S.U. = standard unit(s) (for measuring pH).
(c) μS/cm = microsiemens per centimeter.
(d) Average of 12 monthly measures.
(e) Analyte undetected.
5.3 Water Level and Usage Monitoring
The U.S. Geological Survey (USGS) Nevada Water Science Center collects, compiles, stores, and reports hydrologic data used in determining the local and regional hydrogeological conditions in and around the NNSS. Hydrologic data are collected quarterly or semi-annually from wells on and off the NNSS. The USGS also has
developed models for the Death Valley Regional Groundwater Flow System (Belcher and Sweetkind 2010, Belcher et al. 2017), and manages other NNSS hydrologic and geologic information databases (for example, https://waterdata.usgs.gov/nv/nwis and https://pubs.usgs.gov/ds/2007/297/).
In 2018, the USGS monitored water levels in 217 wells on and near the NNSS; these included 119 wells on the NNSS and 98 off the NNSS. Water levels are monitored to identify where water occurs in the subsurface, changes in the quantity of water in aquifers, the direction of groundwater movement, and groundwater velocity (derived from knowledge of groundwater movement and rock properties). Along with radiological groundwater data presented in Section 5.1, water-level data contribute to the development of UGTA CAU-specific models of groundwater flow and radionuclide transport (Section 11.1.2). A map showing the location of monitored wells and all water level data are available on the USGS-U.S. Department of Energy Cooperative Studies in Nevada
project website at https://nevada.usgs.gov/doe_nv/.
Groundwater-use data are collected from water supply wells on the NNSS using flow meters, and are reported monthly. The principal NNSS water supply wells monitored in 2018 included wells J-12 WW, J-14 WW,
UE-16d WW, WW #4, WW #4A, WW 5B, and WW 8 (Figure 5-1). The USGS compiles water-use data and reports annual withdrawals in millions of gallons. Withdrawal data from these wells for 2018 have been compiled and processed, and are available from the Water Withdrawals page on the USGS-U.S. Department of Energy Cooperative Studies in Nevada project website at https://nevada.usgs.gov/doe_nv/water_withdrawals.html. Total groundwater withdrawals from these wells in 2018 was about 150 million gallons (Figure 5-5).
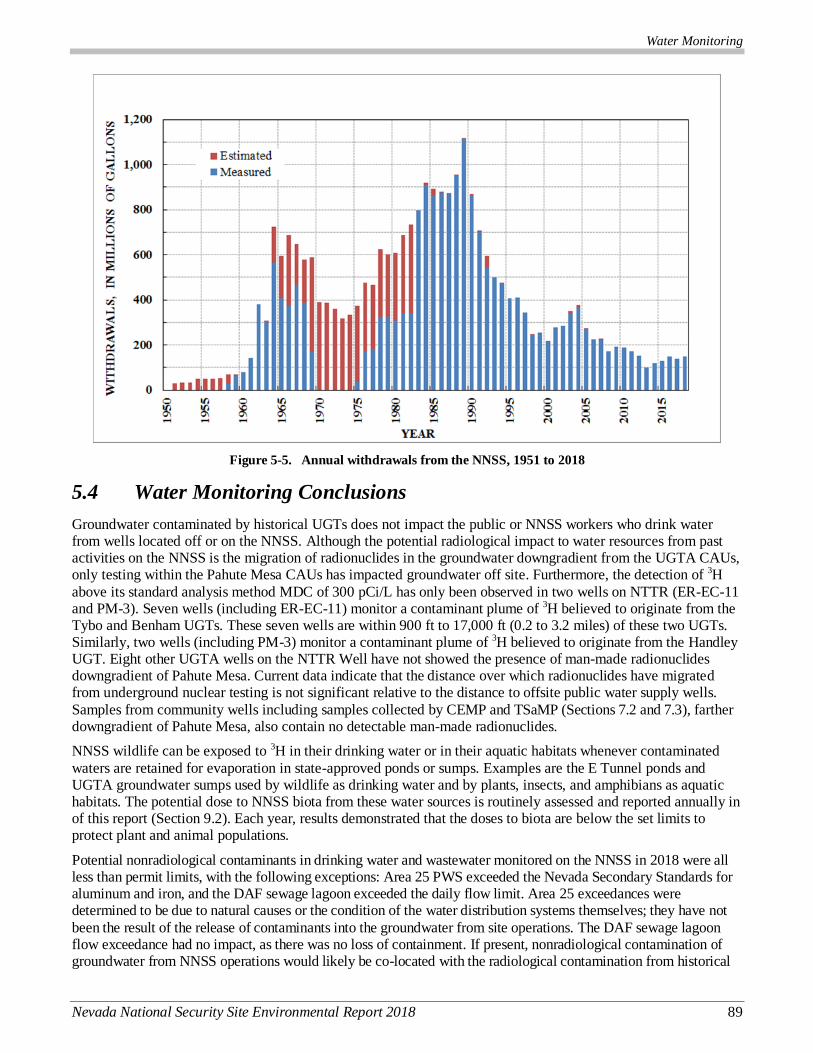
Water Monitoring
Nevada National Security Site Environmental Report 2018 89
Figure 5-5. Annual withdrawals from the NNSS, 1951 to 2018
5.4 Water Monitoring Conclusions
Groundwater contaminated by historical UGTs does not impact the public or NNSS workers who drink water from wells located off or on the NNSS. Although the potential radiological impact to water resources from past activities on the NNSS is the migration of radionuclides in the groundwater downgradient from the UGTA CAUs, only testing within the Pahute Mesa CAUs has impacted groundwater off site. Furthermore, the detection of 3H
above its standard analysis method MDC of 300 pCi/L has only been observed in two wells on NTTR (ER-EC-11 and PM-3). Seven wells (including ER-EC-11) monitor a contaminant plume of 3H believed to originate from the Tybo and Benham UGTs. These seven wells are within 900 ft to 17,000 ft (0.2 to 3.2 miles) of these two UGTs. Similarly, two wells (including PM-3) monitor a contaminant plume of 3H believed to originate from the Handley UGT. Eight other UGTA wells on the NTTR Well have not showed the presence of man-made radionuclides downgradient of Pahute Mesa. Current data indicate that the distance over which radionuclides have migrated from underground nuclear testing is not significant relative to the distance to offsite public water supply wells.
Samples from community wells including samples collected by CEMP and TSaMP (Sections 7.2 and 7.3), farther downgradient of Pahute Mesa, also contain no detectable man-made radionuclides.
NNSS wildlife can be exposed to 3H in their drinking water or in their aquatic habitats whenever contaminated
waters are retained for evaporation in state-approved ponds or sumps. Examples are the E Tunnel ponds and UGTA groundwater sumps used by wildlife as drinking water and by plants, insects, and amphibians as aquatic habitats. The potential dose to NNSS biota from these water sources is routinely assessed and reported annually in of this report (Section 9.2). Each year, results demonstrated that the doses to biota are below the set limits to protect plant and animal populations.
Potential nonradiological contaminants in drinking water and wastewater monitored on the NNSS in 2018 were all less than permit limits, with the following exceptions: Area 25 PWS exceeded the Nevada Secondary Standards for aluminum and iron, and the DAF sewage lagoon exceeded the daily flow limit. Area 25 exceedances were determined to be due to natural causes or the condition of the water distribution systems themselves; they have not
been the result of the release of contaminants into the groundwater from site operations. The DAF sewage lagoon flow exceedance had no impact, as there was no loss of containment. If present, nonradiological contamination of groundwater from NNSS operations would likely be co-located with the radiological contamination from historical
Water Monitoring
90 Nevada National Security Site Environmental Report 2018
UGT within UGTA CAUs. It is expected to be minor, however, in comparison to the radiological contamination. For nuclear tests above the water table, potential nonradiological contaminants are not likely to reach groundwater because of their negligible advective and dispersive transport rates through the thick vadose zone. Water samples
from UGTA investigation wells, which include highly contaminated wells, have not had elevated levels of nonradiological man-made contaminants.
Well drilling, waste burial, chemical storage, and wastewater management are the only current NNSS activities
that have the potential to contaminate groundwater with nonradiological contaminants. This potential is very low, however, due to engineered and operational deterrents and natural environmental factors. Current drilling operations procedures include the containment of drilling muds and well effluents in sumps (Section 5.1.3.7.3). Well effluents are monitored for nonradiological contaminants (predominantly lead) to ensure lined sumps are used when necessary. The Area 3 and Area 5 Radioactive Waste Management Sites and solid waste landfills are designed and monitored to ensure that contaminants do not reach groundwater (Chapter 10). In addition, the potential for mobilization of contaminants from all these sources to groundwater is negligible due to the arid
climate, the great depth to groundwater (thickness of the vadose zone), and the proven behavior of liquid and vapor fluxes in the vadose zone (primarily upward liquid movement towards the ground surface due to evapotranspiration).
The EM Nevada Program is responsible for completing environmental corrective actions at sites where surface and shallow subsurface contamination historically occurred. Some of these sites also have nonradiological contaminants such as metals, petroleum hydrocarbons, hazardous organic and inorganic chemicals, and unexploded ordinance (Sections 11.2 and 11.3). The potential for mobilization of these contaminants to groundwater is negligible due to the same regional climatic, soil, and hydrogeological factors mentioned above.
Water level monitoring continues to be used to develop and refine CAU-specific models of groundwater flow and contaminant transport. Section 11.1.2 of this report describes the status of these models.
Current water usage, monitored annually, has dropped to levels that have not been seen since the early 1960s, due mainly to changes in site operations, and to some extent, recent conservation actions. Within the past several years, NNSA/NFO has taken actions to conserve groundwater by addressing DOE’s water efficiency and water management goals, which include reducing both potable and non-potable water use (Chapter 3).
5.5 References
Bechtel Nevada, 2003. Nevada Test Site Routine Radiological Environmental Monitoring Plan, DOE/NV/11718--804. Prepared for the U.S. Department of Energy, National Nuclear Security Administration Nevada Site Office. Las Vegas, NV.
Belcher, W.R. and D.S. Sweetkind, eds., 2010. Death Valley Regional Groundwater Flow System, Nevada and California–Hydrogeologic Framework and Transient Groundwater Flow Model. USGS Professional Paper 1711. Available at https://pubs.usgs.gov/pp/1711/, as accessed on June 20, 2017.
Belcher, W.R., D.S. Sweetkind, C.C. Faunt, M.T. Pavelko, and M.C. Hill, 2017. An Update of the Death Valley Regional Groundwater Flow System Transient Model, Nevada and California. USGS Scientific Investigations Report 2016-5150. Available at https://doi.org/10.3133/sir20165150, as accessed on June 20, 2017.
DOE, see U.S. Department of Energy.
Elliott, P.E. and J.M. Fenelon, 2010. Database of Groundwater Levels and Hydrograph Descriptions for the Nevada Test Site Area, Nye County, Nevada (ver. 7.0, October 2016). USGS Data Series 533. Available at https://pubs.usgs.gov/ds/533/.
Finnegan, D.L., S.M. Bowen, J.L. Thompson, C.M. Miller, P.L. Baca, L.F. Olivas, C.G. Geoffrion, D.K. Smith, W. Goishi, B.K. Esser, J.W. Meadows, N. Namboodiri, and J.F. Wild, 2016. Nevada National Security Site Radionuclide Inventory, 1951–1992: Accounting for Radionuclide Decay through September 30, 2012, LA-UR-16-21749. Los Alamos National Laboratory. Los Alamos, NM.
Mission Support and Test Services, LLC, 2018. Nevada National Security Site 2017 Data Report: Groundwater Monitoring Program Area 5 Radioactive Waste Management Site. DOE/NV/03624--0061, Las Vegas, NV.
Water Monitoring
Nevada National Security Site Environmental Report 2018 91
MSTS, see Mission Support and Test Services, LLC.
National Security Technologies, LLC, 2009. Nevada Test Site Environmental Report 2008. DOE/NV/25946--790,
Las Vegas, NV.
Navarro, 2018. Water Pollution Control Permit NEV 96021, E Tunnel Wastewater Disposal System, Well ER-12-1 Groundwater Sampling Summary Report, Nevada National Security Site, Nevada, Las Vegas, NV.
NNSA/NFO, see U.S. Department of Energy, National Nuclear Security Administration Nevada Field Office.
NSTec, see National Security Technologies, LLC.
SNJV, see Stoller-Navarro Joint Venture.
Stoller-Navarro Joint Venture, 2005. Unclassified Source Term and Radionuclide Data for Corrective Action Unit 98: Frenchman Flat, Nevada Test Site, Nevada, Rev. 0, S-N/99205--058, Las Vegas, NV.
U.S. Department of Energy, 1997. The Procedures Manual of the Environmental Measurements Laboratory,
HASL-300 3H-02, Tritium in Water – Alkaline Electrolysis. 28th Ed., Vol. I. February, New York, NY.
U.S. Department of Energy Environmental Management Nevada Program, 2017. Corrective Action Decision Document/Corrective Action Plan for Corrective Action Unit 97: Yucca Flat/Climax Mine Nevada National Security Site, Nevada, Rev. 1, DOE/NV--1566-REV. 1. Las Vegas, NV.
———, 2018. Nevada National Security Site Integrated Groundwater Sampling Plan, DOE/NV--1525, Revision 1, Las Vegas, NV.
U.S. Department of Energy, National Nuclear Security Administration Nevada Field Office, 2009. Attachment 1, “Fluid Management Plan for the Underground Test Area Project,” Revision 5, DOE/NV--370. In: Underground Test Area Project Waste Management Plan, Revision 3, DOE/NV--343. Las Vegas, NV.
———, 2014. Nevada National Security Site Integrated Groundwater Sampling Plan, DOE/NV--1525, Revision 0, Las Vegas, NV.
———, 2015. United States Nuclear Tests, July 1945 through September 1992. DOE/NV--209, Revision 16, Las Vegas, NV. Available at https://www.nnss.gov/docs/docs_LibraryPublications/DOE_NV-209_Rev16.pdf, as accessed on July 17, 2019.
———, 2016. Underground Test Area (UGTA) Closure Report for Corrective Action Unit 98: Frenchman Flat Nevada National Security Site, Nevada, Revision 1, DOE/NV--1538-REV 1. Las Vegas, NV.
Zavarin, M., 2009. Memorandum to B. Wilborn (U.S. Department of Energy, National Nuclear Security
Administration Nevada Site Office) from M. Zavarin (Lawrence Livermore National Laboratory) dated May 5, 2009, titled “Isotopic Analyses: 2006 U12n sampling.”
Water Monitoring
92 Nevada National Security Site Environmental Report 2018
THIS PAGE INTENTIONALLY LEFT BLANK

Direct Radiation Monitoring
Nevada National Security Site Environmental Report 2018 93
6.0 Ch6
Chapter 6: Direct Radiation Monitoring
Ronald W. Warren and Xianan Liu
Mission Support and Test Services, LLC
Charles B. Davis
EnviroStat Direct Radiation Monitoring Program Goals
Assess the proportion of external dose from background radiation versus that from operations at the Nevada National
Security Site (NNSS). Measure external radiation to assess the potential external dose to a member of the public from
operations at the NNSS (Chapter 9 gives estimates for public dose). Measure external radiation to assess the potential
external dose to a member of the public from operations at the Area 3 and 5 Radioactive Waste Management Sites (RWMSs).
Monitor operational activities involving radioactive material, radiation-generating devices, and accidental releases of
radioactive material to ensure exposure to members of the public are kept as low as is reasonably achievable (ALARA).
Measure external radiation to assess the potential external and absorbed radiation doses to NNSS plants and animals
(Section 9.2 gives biota dose assessments). Determine the patterns of exposure rates through time at various soil
contamination areas to characterize releases in the environment.
U.S. Department of Energy (DOE) Orders DOE O 458.1, Radiation Protection of the Public and the Environment,
and DOE O 435.1, Radioactive Waste Management, have requirements to protect the public and environment from radiation exposure;1 see descriptions of these orders in Table 2-1. Energy absorbed from radioactive materials outside the body results in an external dose. On the NNSS, external dose comes from direct ionizing radiation
including natural radioactivity from cosmic and terrestrial sources as well as man-made radioactive sources. This chapter presents data obtained to assess external dose for 2018. Chapters 4, 5, and 8 present monitoring results for radioactivity from NNSS activities in air, water, and biota, respectively. Those results help estimate potential internal radiation dose to the public via inhalation and ingestion. The total estimated dose, both internal and external, from
NNSS activities is presented in Chapter 9.
Direct radiation monitoring is conducted to assess the external radiation environment, detect changes in that
environment, respond to releases from U.S. Department of Energy, National Nuclear Security Administration Nevada Field Office (NNSA/NFO) activities, and measure gamma radiation levels near potential exposure sites. In addition, DOE O 458.1 states that “it is also an objective that potential exposures to members of the public be as low as is reasonably achievable (ALARA).”
An offsite monitoring program implemented by NNSA/NFO monitors direct radiation in communities adjacent to the NNSS. The Desert Research Institute (DRI) conducts this monitoring as part of its Community Environmental Monitoring Program (CEMP). DRI’s 2018 direct radiation monitoring results are in Sections 7.1.4 and 7.1.5; DRI thermoluminescent dosimeter (TLD) data are compared with onsite TLD data in this chapter (Figures 6-2 and 6-3).
6.1 Measurement of Direct Radiation
Direct (or external) radiation exposure can occur when alpha particles, beta particles, or electromagnetic (gamma and X-ray) radiation interact with living tissue. Electromagnetic radiation can travel long distances through air and penetrate living tissue, causing ionization within the body tissues. For this reason, electromagnetic radiation is one of the greater concerns of direct radiation exposure. By contrast, alpha and beta particles do not travel far in air (a few centimeters for alpha, and about 10 meters [m] or 33 feet [ft] for beta particles). Alpha particles deposit only negligible energy to living tissue as they rarely penetrate the outer dead layer of skin and cannot penetrate thin plastic. Beta particles are generally absorbed in the layers of skin immediately below the outer layer.
1 The definition of word(s) in bold italics may be found by clicking on the word in electronic version or by referencing the Glossary,
Appendix B. To return from the Glossary, right click and select Previous View.
Direct Radiation Monitoring
94 Nevada National Security Site Environmental Report 2018
Direct radiation exposure is usually reported in the unit milliroentgen (mR), which is a measure of exposure in terms of numbers of ionizations in air. The dose in human tissue resulting from an exposure from one of the most common radionuclides (cesium-137) is approximated by equating a 1-mR exposure with a dose of 1 millirem
(mrem) (or 0.01 millisievert [mSv]).
6.2 Thermoluminescent Dosimetry Surveillance Network Design
A surveillance network of TLD sample locations (Figure 6-1) monitors NNSS areas with elevated radiation levels from historical nuclear weapons testing, current and past radioactive waste management activities, and/or current operations involving radioactive material or radiation-generating devices. The objectives and design of the network are described in detail in the Routine Radiological Environmental Monitoring Plan (RREMP) (Bechtel Nevada 2003).
TLDs have the capability to measure exposure from all sources of ionizing radiation, but with normal use, the TLD will detect only electromagnetic radiation, high-energy beta particles, and in some special cases, neutrons. This is due to the penetrative abilities of the radiation. The TLD used for environmental sampling is the Panasonic
UD-814AS, which has three calcium sulfate elements housed in an air-tight, water-tight, ultra-violet light-protected case. Measurements from the three calcium sulfate elements are averaged to assess penetrating gamma radiation.
A pair of TLDs is placed at 1.0 ± 0.3 m (28 to 51 inches [in.]) above the ground at each monitoring location. TLD analysis is performed quarterly using automated TLD readers calibrated and maintained by the Radiological Control Department. Reference TLDs are exposed to a 100 mR cesium-137 source under tightly controlled conditions. These are read along with TLDs collected from the network to calibrate their responses.
There were 103 active environmental TLD locations on the NNSS in 2018 (Figure 6-1), along with six control locations. They include the following:
Background (B) – 10 locations where radiation effects from NNSS operations are negligible.
Environmental 1 (E1) – 41 locations where there is no measurable radioactivity from past operations, but
which are locations of interest due to the presence of people in the area and/or the potential for increased radiation exposure from a current operation.
Environmental 2 (E2) – 35 locations where there is or has been measurable added radioactivity from past
operations; these locations are of interest for monitoring direct radiation trends in the area. Some locations fitting this description are grouped with the Waste Operations category below.
Waste Operations (WO) – 17 locations in and around the Area 3 and 5 RWMSs. One of these stations
(Area 5 RWMS Expasion NW) was removed after the first quarter due to construction.
Control (C) – 5 locations in Building 652 and 1 in Building 650 (both in Area 23). Control TLDs are kept in stable environments. Those in Building 652 are shielded inside a lead cabinet, and those in
Building 650 are shielded by just the building itself. These TLDs are used as a quality check on the TLDs and the analysis process.
This network of TLD stations, along with the analysis of their data, serve to monitor operational activities
throughout the NNSS for changes in external radiation measures over time and any accidental releases of radioactive material. TLD data are reviewed annually to identify any patterns of exposure rates through time at various soil contamination areas.
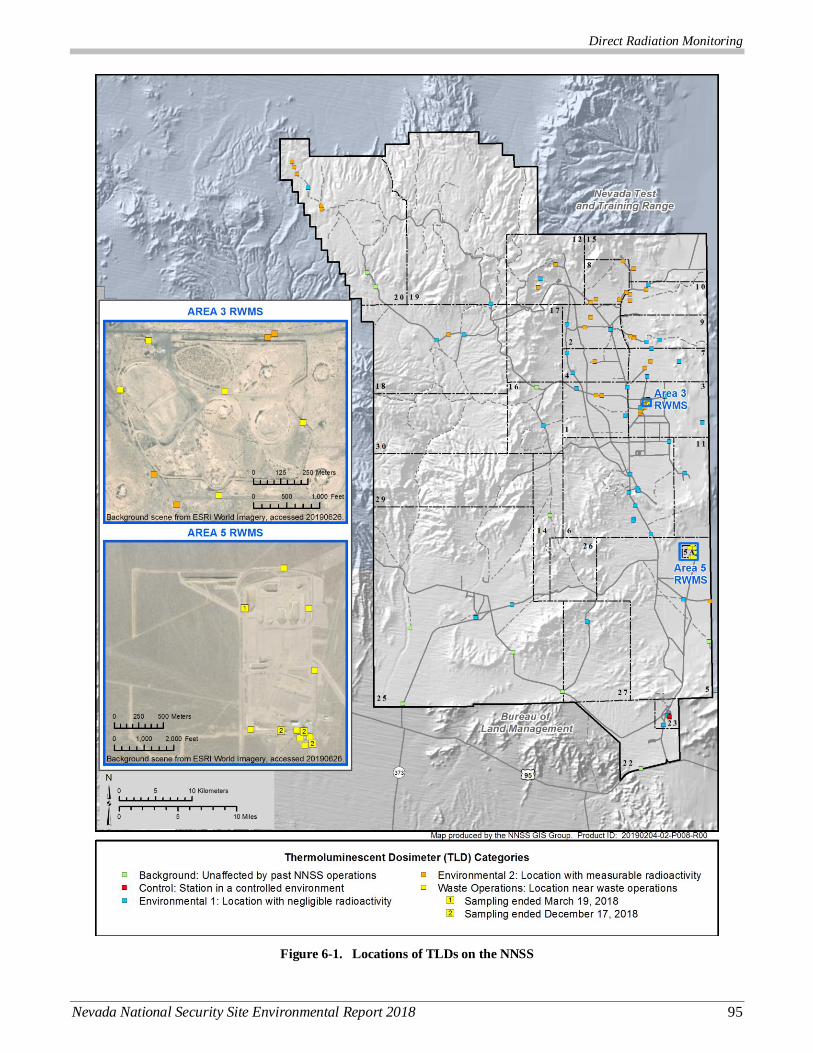
Direct Radiation Monitoring
Nevada National Security Site Environmental Report 2018 95
Figure 6-1. Locations of TLDs on the NNSS
Direct Radiation Monitoring
96 Nevada National Security Site Environmental Report 2018
6.2.1 Data Quality
Quality assurance (QA) procedures for direct radiation monitoring involve: (1) a readings comparison among the three TLD elements in individual TLDs, (2) a data comparison of the paired TLDs at each location to estimate the measurement and its precision, (3) comparison of current and past data measurements at each TLD location, and (4) review of data from the TLDs in the control locations. The TLDs in control locations allow the detection and estimation of any systematic variations that might be introduced by the measurement process itself.
As specified by the RREMP, QA and quality control (QC) protocols (including Data Quality Objectives) are maintained as essential elements of direct radiation monitoring. QA/QC requirements include the use of sample packages to thoroughly document each sampling event, rigorous management of databases, and completion of
essential training (Chapter 14). The Radiological Control Department maintains certification through the DOE Laboratory Accreditation Program for dosimetry.
Four steps comprise the monitoring process for each environmental TLD: the TLD is (1) annealed (i.e., heated and then cooled) to reset its original unexposed condition, then stored in a shielded location; (2) deployed to the field at the beginning of each quarter; (3) collected from the field at the end of each quarter; and (4) again stored in a shielded location until it is read. To control for variations related to holding times, an estimate of the additional dose due to holding prior to deployment and following collection in the shielded location is subtracted from the measured quarterly dose before computing annual exposure estimates. This adjustment has been applied retroactively to data from 2003 on. This adjustment resulted in a decrease of estimated dose between 0.27% and 3.65%; averaging 1.32% in 2018.
6.2.2 Data Reporting
Direct radiation is recorded as exposure per unit time in milliroentgens per day (mR/d), calculated by dividing the measured exposure per quarter for each TLD by the number of days the TLD was exposed at its measurement
location. These are multiplied by 365.25 to obtain annualized values. The estimated annual exposure is the average of the quarterly annualized values; this is the metric used to determine compliance with federal annual dose limits.
6.3 Results
Estimated annual exposures for all TLD locations are in Table 6-1. Summary statistics for the five location types are in Table 6-2. Data were successfully obtained from nearly all of the TLDs during all quarters in 2018; one pair was found chewed by coyotes and its data were rejected for that quarter. Otherwise, agreement between the results provided by the paired TLDs was quite good, with an average relative percent difference between
measurements of 3.0%. The quarter-to-quarter coefficient of variation (CV) (i.e., the relative standard deviation) ranged from 0.8% to 7.3% (mean = 3.7%) over all locations, excluding Gate 100 Truck Parking 1 (discussed in Section 6.3.2).
6.3.1 Background Exposure
In 2018, the average of the estimated annual exposures among the 10 background locations was 122 mR, ranging from 80 to 166 mR (Table 6-2). A 95% prediction interval (PI) for annual exposures based on the 2018 estimated mean annual exposures at the background locations (denoted “95% PI from B” in the plots, Figures 6-2, 6-4, and 6-5) is 47.4 to 195.9 mR. This interval predicts mean annual background exposures at locations where radiation effects from NNSS operations are negligible.
For comparison, the CEMP’s estimated annual exposure in Las Vegas, Nevada (at 622 m [2,040 ft] elevation), was 107 mR in 2018 (Table 7-3). Estimated mean annual exposures at CEMP locations ranged from 96 mR at Pahrump, Nevada (777 m [2,550 ft] elevation), to 151 mR at Milford, Utah (1,494 m [4,900 ft] elevation). There is a general increasing relationship between natural background exposure and elevation due to cosmic radiation
(Figure 6-3). The NNSS background locations with lowest and highest exposures are at elevations 1,064 m (3,490 ft) at Old Indian Springs Road in Area 5 and 1,737 m (5,700 ft) at Stake A-112 in Area 20, respectively.
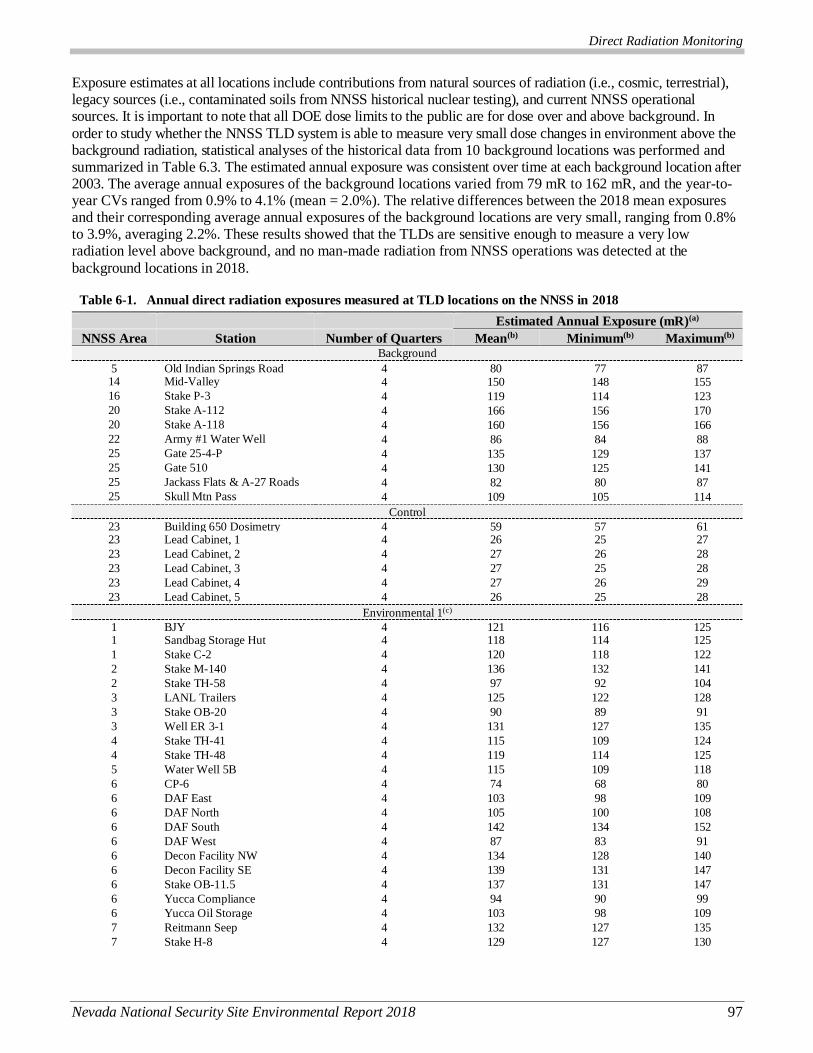
Direct Radiation Monitoring
Nevada National Security Site Environmental Report 2018 97
Exposure estimates at all locations include contributions from natural sources of radiation (i.e., cosmic, terrestrial), legacy sources (i.e., contaminated soils from NNSS historical nuclear testing), and current NNSS operational sources. It is important to note that all DOE dose limits to the public are for dose over and above background. In
order to study whether the NNSS TLD system is able to measure very small dose changes in environment above the background radiation, statistical analyses of the historical data from 10 background locations was performed and summarized in Table 6.3. The estimated annual exposure was consistent over time at each background location after 2003. The average annual exposures of the background locations varied from 79 mR to 162 mR, and the year-to-year CVs ranged from 0.9% to 4.1% (mean = 2.0%). The relative differences between the 2018 mean exposures and their corresponding average annual exposures of the background locations are very small, ranging from 0.8% to 3.9%, averaging 2.2%. These results showed that the TLDs are sensitive enough to measure a very low radiation level above background, and no man-made radiation from NNSS operations was detected at the
background locations in 2018.
Table 6-1. Annual direct radiation exposures measured at TLD locations on the NNSS in 2018
Estimated Annual Exposure (mR)(a)
NNSS Area Station Number of Quarters Mean(b) Minimum(b) Maximum(b) Background
5 Old Indian Springs Road 4 80 77 87 14 Mid-Valley 4 150 148 155
16 Stake P-3 4 119 114 123
20 Stake A-112 4 166 156 170
20 Stake A-118 4 160 156 166
22 Army #1 Water Well 4 86 84 88
25 Gate 25-4-P 4 135 129 137
25 Gate 510 4 130 125 141
25 Jackass Flats & A-27 Roads 4 82 80 87
25 Skull Mtn Pass 4 109 105 114
Control
23 Building 650 Dosimetry 4 59 57 61 23 Lead Cabinet, 1 4 26 25 27
23 Lead Cabinet, 2 4 27 26 28
23 Lead Cabinet, 3 4 27 25 28
23 Lead Cabinet, 4 4 27 26 29
23 Lead Cabinet, 5 4 26 25 28
Environmental 1(c)
1 BJY 4 121 116 125 1 Sandbag Storage Hut 4 118 114 125
1 Stake C-2 4 120 118 122
2 Stake M-140 4 136 132 141
2 Stake TH-58 4 97 92 104
3 LANL Trailers 4 125 122 128
3 Stake OB-20 4 90 89 91
3 Well ER 3-1 4 131 127 135
4 Stake TH-41 4 115 109 124
4 Stake TH-48 4 119 114 125
5 Water Well 5B 4 115 109 118
6 CP-6 4 74 68 80
6 DAF East 4 103 98 109
6 DAF North 4 105 100 108
6 DAF South 4 142 134 152
6 DAF West 4 87 83 91
6 Decon Facility NW 4 134 128 140
6 Decon Facility SE 4 139 131 147
6 Stake OB-11.5 4 137 131 147
6 Yucca Compliance 4 94 90 99
6 Yucca Oil Storage 4 103 98 109
7 Reitmann Seep 4 132 127 135
7 Stake H-8 4 129 127 130
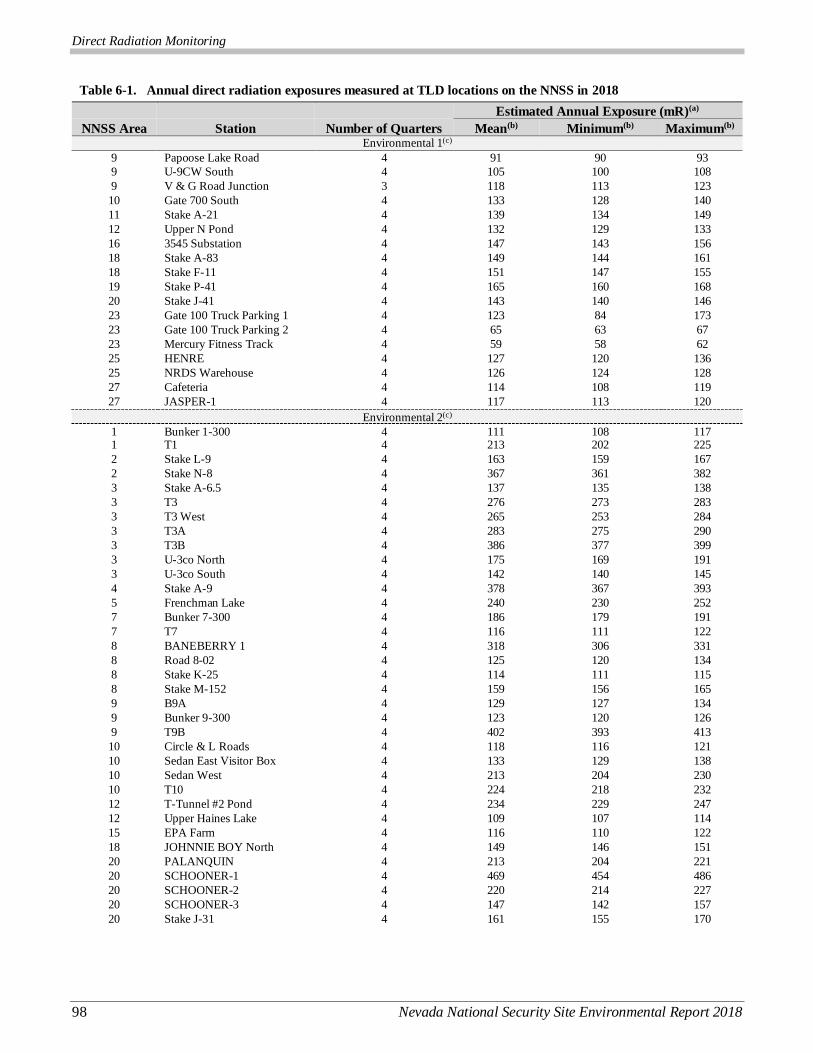
Direct Radiation Monitoring
98 Nevada National Security Site Environmental Report 2018
Table 6-1. Annual direct radiation exposures measured at TLD locations on the NNSS in 2018
Estimated Annual Exposure (mR)(a)
NNSS Area Station Number of Quarters Mean(b) Minimum(b) Maximum(b) Environmental 1(c)
9 Papoose Lake Road 4 91 90 93
9 U-9CW South 4 105 100 108
9 V & G Road Junction 3 118 113 123
10 Gate 700 South 4 133 128 140
11 Stake A-21 4 139 134 149
12 Upper N Pond 4 132 129 133
16 3545 Substation 4 147 143 156
18 Stake A-83 4 149 144 161
18 Stake F-11 4 151 147 155
19 Stake P-41 4 165 160 168
20 Stake J-41 4 143 140 146
23 Gate 100 Truck Parking 1 4 123 84 173
23 Gate 100 Truck Parking 2 4 65 63 67
23 Mercury Fitness Track 4 59 58 62
25 HENRE 4 127 120 136
25 NRDS Warehouse 4 126 124 128
27 Cafeteria 4 114 108 119
27 JASPER-1 4 117 113 120
Environmental 2(c)
1 Bunker 1-300 4 111 108 117 1 T1 4 213 202 225
2 Stake L-9 4 163 159 167
2 Stake N-8 4 367 361 382
3 Stake A-6.5 4 137 135 138
3 T3 4 276 273 283
3 T3 West 4 265 253 284
3 T3A 4 283 275 290
3 T3B 4 386 377 399
3 U-3co North 4 175 169 191
3 U-3co South 4 142 140 145
4 Stake A-9 4 378 367 393
5 Frenchman Lake 4 240 230 252
7 Bunker 7-300 4 186 179 191
7 T7 4 116 111 122
8 BANEBERRY 1 4 318 306 331
8 Road 8-02 4 125 120 134
8 Stake K-25 4 114 111 115
8 Stake M-152 4 159 156 165
9 B9A 4 129 127 134
9 Bunker 9-300 4 123 120 126
9 T9B 4 402 393 413
10 Circle & L Roads 4 118 116 121
10 Sedan East Visitor Box 4 133 129 138
10 Sedan West 4 213 204 230
10 T10 4 224 218 232
12 T-Tunnel #2 Pond 4 234 229 247
12 Upper Haines Lake 4 109 107 114
15 EPA Farm 4 116 110 122
18 JOHNNIE BOY North 4 149 146 151
20 PALANQUIN 4 213 204 221
20 SCHOONER-1 4 469 454 486
20 SCHOONER-2 4 220 214 227
20 SCHOONER-3 4 147 142 157
20 Stake J-31 4 161 155 170
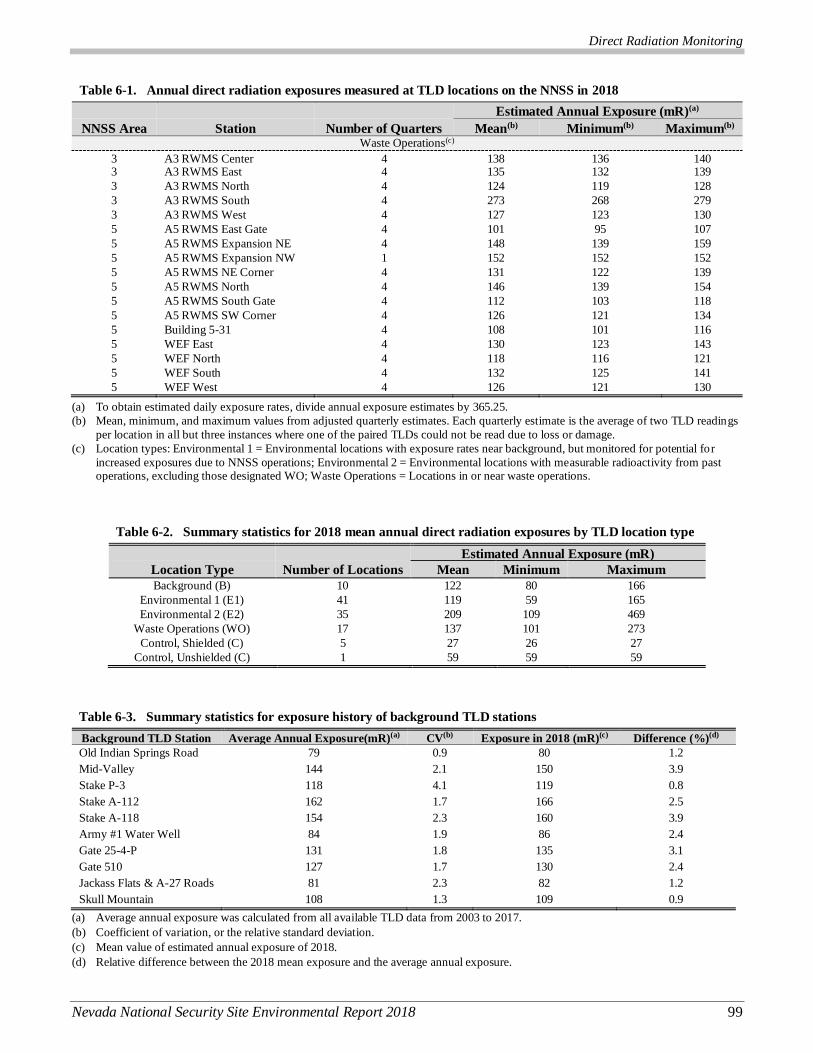
Direct Radiation Monitoring
Nevada National Security Site Environmental Report 2018 99
Table 6-1. Annual direct radiation exposures measured at TLD locations on the NNSS in 2018
Estimated Annual Exposure (mR)(a)
NNSS Area Station Number of Quarters Mean(b) Minimum(b) Maximum(b) Waste Operations(c)
3 A3 RWMS Center 4 138 136 140 3 A3 RWMS East 4 135 132 139
3 A3 RWMS North 4 124 119 128
3 A3 RWMS South 4 273 268 279
3 A3 RWMS West 4 127 123 130
5 A5 RWMS East Gate 4 101 95 107
5 A5 RWMS Expansion NE 4 148 139 159
5 A5 RWMS Expansion NW 1 152 152 152
5 A5 RWMS NE Corner 4 131 122 139
5 A5 RWMS North 4 146 139 154
5 A5 RWMS South Gate 4 112 103 118
5 A5 RWMS SW Corner 4 126 121 134
5 Building 5-31 4 108 101 116
5 WEF East 4 130 123 143
5 WEF North 4 118 116 121
5 WEF South 4 132 125 141
5 WEF West 4 126 121 130
(a) To obtain estimated daily exposure rates, divide annual exposure estimates by 365.25.
(b) Mean, minimum, and maximum values from adjusted quarterly estimates. Each quarterly estimate is the average of two TLD readings
per location in all but three instances where one of the paired TLDs could not be read due to loss or damage.
(c) Location types: Environmental 1 = Environmental locations with exposure rates near background, but monitored for potential for
increased exposures due to NNSS operations; Environmental 2 = Environmental locations with measurable radioactivity from past operations, excluding those designated WO; Waste Operations = Locations in or near waste operations.
Table 6-2. Summary statistics for 2018 mean annual direct radiation exposures by TLD location type
Estimated Annual Exposure (mR)
Location Type Number of Locations Mean Minimum Maximum
Background (B) 10 122 80 166
Environmental 1 (E1) 41 119 59 165
Environmental 2 (E2) 35 209 109 469
Waste Operations (WO) 17 137 101 273
Control, Shielded (C) 5 27 26 27
Control, Unshielded (C) 1 59 59 59
Table 6-3. Summary statistics for exposure history of background TLD stations
Background TLD Station Average Annual Exposure(mR)(a) CV(b) Exposure in 2018 (mR)(c) Difference (%)(d)
Old Indian Springs Road 79 0.9 80 1.2
Mid-Valley 144 2.1 150 3.9
Stake P-3 118 4.1 119 0.8
Stake A-112 162 1.7 166 2.5
Stake A-118 154 2.3 160 3.9
Army #1 Water Well 84 1.9 86 2.4
Gate 25-4-P 131 1.8 135 3.1
Gate 510 127 1.7 130 2.4
Jackass Flats & A-27 Roads 81 2.3 82 1.2
Skull Mountain 108 1.3 109 0.9
(a) Average annual exposure was calculated from all available TLD data from 2003 to 2017.
(b) Coefficient of variation, or the relative standard deviation.
(c) Mean value of estimated annual exposure of 2018.
(d) Relative difference between the 2018 mean exposure and the average annual exposure.
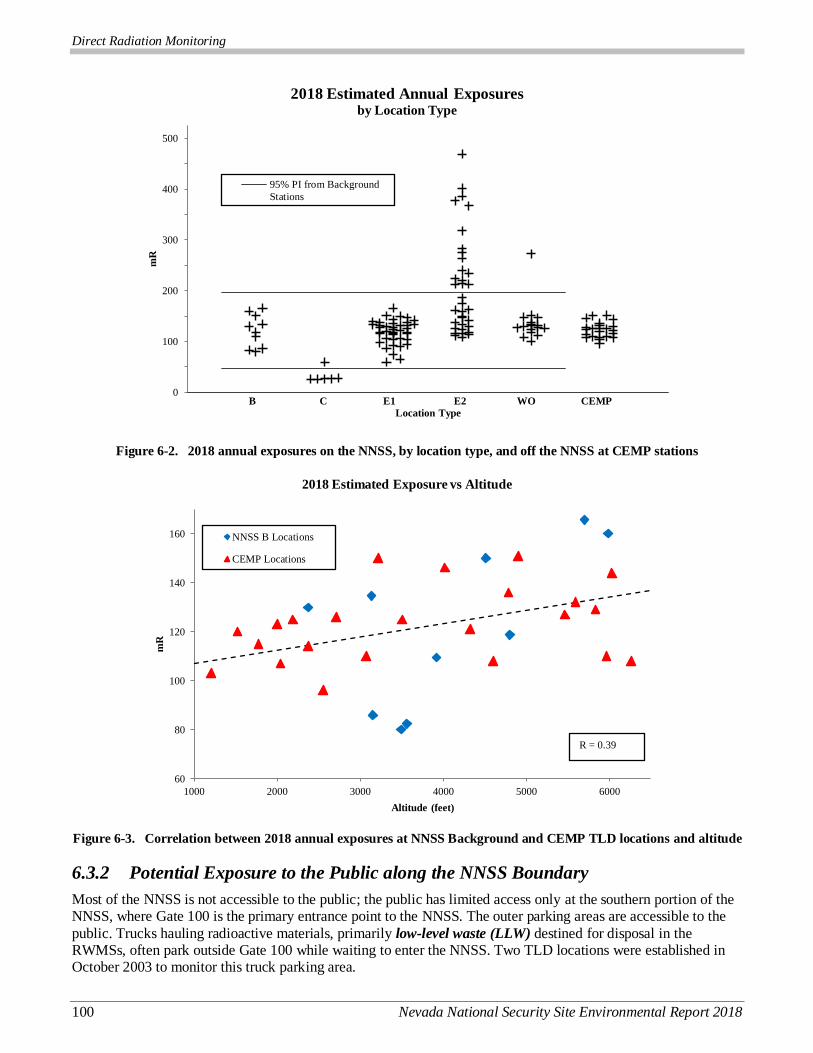
Direct Radiation Monitoring
100 Nevada National Security Site Environmental Report 2018
Figure 6-2. 2018 annual exposures on the NNSS, by location type, and off the NNSS at CEMP stations
Figure 6-3. Correlation between 2018 annual exposures at NNSS Background and CEMP TLD locations and altitude
6.3.2 Potential Exposure to the Public along the NNSS Boundary
Most of the NNSS is not accessible to the public; the public has limited access only at the southern portion of the NNSS, where Gate 100 is the primary entrance point to the NNSS. The outer parking areas are accessible to the
public. Trucks hauling radioactive materials, primarily low-level waste (LLW) destined for disposal in the RWMSs, often park outside Gate 100 while waiting to enter the NNSS. Two TLD locations were established in October 2003 to monitor this truck parking area.
0
100
200
300
400
500
mR
B C E1 E2 WO CEMP
Location Type
2018 Estimated Annual Exposuresby Location Type
95% PI from Background
Stations
60
80
100
120
140
160
1000 2000 3000 4000 5000 6000
mR
Altitude (feet)
2018 Estimated Exposure vs Altitude
NNSS B Locations
CEMP Locations
R = 0.39
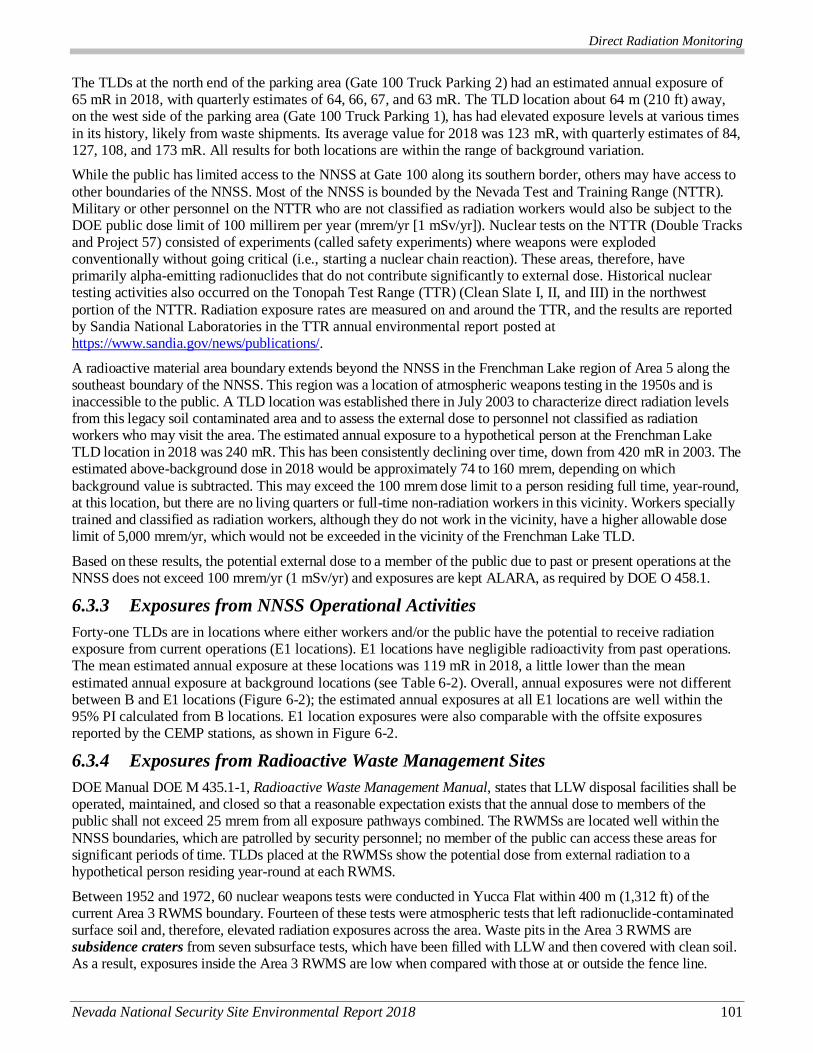
Direct Radiation Monitoring
Nevada National Security Site Environmental Report 2018 101
The TLDs at the north end of the parking area (Gate 100 Truck Parking 2) had an estimated annual exposure of 65 mR in 2018, with quarterly estimates of 64, 66, 67, and 63 mR. The TLD location about 64 m (210 ft) away, on the west side of the parking area (Gate 100 Truck Parking 1), has had elevated exposure levels at various times
in its history, likely from waste shipments. Its average value for 2018 was 123 mR, with quarterly estimates of 84, 127, 108, and 173 mR. All results for both locations are within the range of background variation.
While the public has limited access to the NNSS at Gate 100 along its southern border, others may have access to
other boundaries of the NNSS. Most of the NNSS is bounded by the Nevada Test and Training Range (NTTR). Military or other personnel on the NTTR who are not classified as radiation workers would also be subject to the DOE public dose limit of 100 millirem per year (mrem/yr [1 mSv/yr]). Nuclear tests on the NTTR (Double Tracks and Project 57) consisted of experiments (called safety experiments) where weapons were exploded conventionally without going critical (i.e., starting a nuclear chain reaction). These areas, therefore, have primarily alpha-emitting radionuclides that do not contribute significantly to external dose. Historical nuclear testing activities also occurred on the Tonopah Test Range (TTR) (Clean Slate I, II, and III) in the northwest
portion of the NTTR. Radiation exposure rates are measured on and around the TTR, and the results are reported by Sandia National Laboratories in the TTR annual environmental report posted at https://www.sandia.gov/news/publications/.
A radioactive material area boundary extends beyond the NNSS in the Frenchman Lake region of Area 5 along the southeast boundary of the NNSS. This region was a location of atmospheric weapons testing in the 1950s and is inaccessible to the public. A TLD location was established there in July 2003 to characterize direct radiation levels from this legacy soil contaminated area and to assess the external dose to personnel not classified as radiation workers who may visit the area. The estimated annual exposure to a hypothetical person at the Frenchman Lake TLD location in 2018 was 240 mR. This has been consistently declining over time, down from 420 mR in 2003. The estimated above-background dose in 2018 would be approximately 74 to 160 mrem, depending on which
background value is subtracted. This may exceed the 100 mrem dose limit to a person residing full time, year-round, at this location, but there are no living quarters or full-time non-radiation workers in this vicinity. Workers specially trained and classified as radiation workers, although they do not work in the vicinity, have a higher allowable dose limit of 5,000 mrem/yr, which would not be exceeded in the vicinity of the Frenchman Lake TLD.
Based on these results, the potential external dose to a member of the public due to past or present operations at the NNSS does not exceed 100 mrem/yr (1 mSv/yr) and exposures are kept ALARA, as required by DOE O 458.1.
6.3.3 Exposures from NNSS Operational Activities
Forty-one TLDs are in locations where either workers and/or the public have the potential to receive radiation exposure from current operations (E1 locations). E1 locations have negligible radioactivity from past operations. The mean estimated annual exposure at these locations was 119 mR in 2018, a little lower than the mean
estimated annual exposure at background locations (see Table 6-2). Overall, annual exposures were not different between B and E1 locations (Figure 6-2); the estimated annual exposures at all E1 locations are well within the 95% PI calculated from B locations. E1 location exposures were also comparable with the offsite exposures reported by the CEMP stations, as shown in Figure 6-2.
6.3.4 Exposures from Radioactive Waste Management Sites
DOE Manual DOE M 435.1-1, Radioactive Waste Management Manual, states that LLW disposal facilities shall be operated, maintained, and closed so that a reasonable expectation exists that the annual dose to members of the public shall not exceed 25 mrem from all exposure pathways combined. The RWMSs are located well within the
NNSS boundaries, which are patrolled by security personnel; no member of the public can access these areas for significant periods of time. TLDs placed at the RWMSs show the potential dose from external radiation to a hypothetical person residing year-round at each RWMS.
Between 1952 and 1972, 60 nuclear weapons tests were conducted in Yucca Flat within 400 m (1,312 ft) of the current Area 3 RWMS boundary. Fourteen of these tests were atmospheric tests that left radionuclide-contaminated surface soil and, therefore, elevated radiation exposures across the area. Waste pits in the Area 3 RWMS are subsidence craters from seven subsurface tests, which have been filled with LLW and then covered with clean soil. As a result, exposures inside the Area 3 RWMS are low when compared with those at or outside the fence line.

Direct Radiation Monitoring
102 Nevada National Security Site Environmental Report 2018
Annual exposures measured inside the Area 3 RWMS and at three of four locations at the boundary were within the range of NNSS background exposures in 2018 (Figure 6-4). The boundary location A3 RWMS South has an estimated exposure above the range of NNSS background; it is 160 m (525 ft) from the site of two atmospheric
nuclear weapons tests. The three E2 TLD locations outside the RWMS that are also above the range of NNSS background (Figure 6-4) are a similar distance from the same atmospheric tests, but on the other side, farther from the RWMS boundary. Based on these measurements, it does not appear that waste buried at the Area 3 RWMS would have contributed external exposure to a hypothetical person residing at its boundary during 2018.
Figure 6-4. 2018 annual exposures in and around the Area 3 RWMS and at background locations
The Area 5 RWMS is located in the northern portion of Frenchman Flat. Between 1951 and 1971, 25 nuclear weapons tests were conducted within 6.3 kilometers (km) (3.9 miles [mi]) of the Area 5 RWMS. Fifteen of these were atmospheric tests and, of the remaining ten, nine released radioactivity to the surface, which contributes to
exposures in the area. No nuclear weapons testing occurred within the boundaries of the Area 5 RWMS.
In 2018, estimated annual exposures at Area 5 RWMS TLD locations were within the range of exposures
measured at NNSS background locations (Figure 6-5). The one location outside the Area 5 RWMS that has an estimated exposure above background levels (the Frenchman Lake TLD station) is within 0.5 km (0.3 mi) of six atmospheric tests in the Frenchman Lake Playa.
0
50
100
150
200
250
300
350
mR
All B Inside RWMS Outside
Locations RWMS Boundary RWMS
Area 3 RWMS Estimated Annual Exposures
B Locations
E2 Locations
WO Locations
95% PI from B
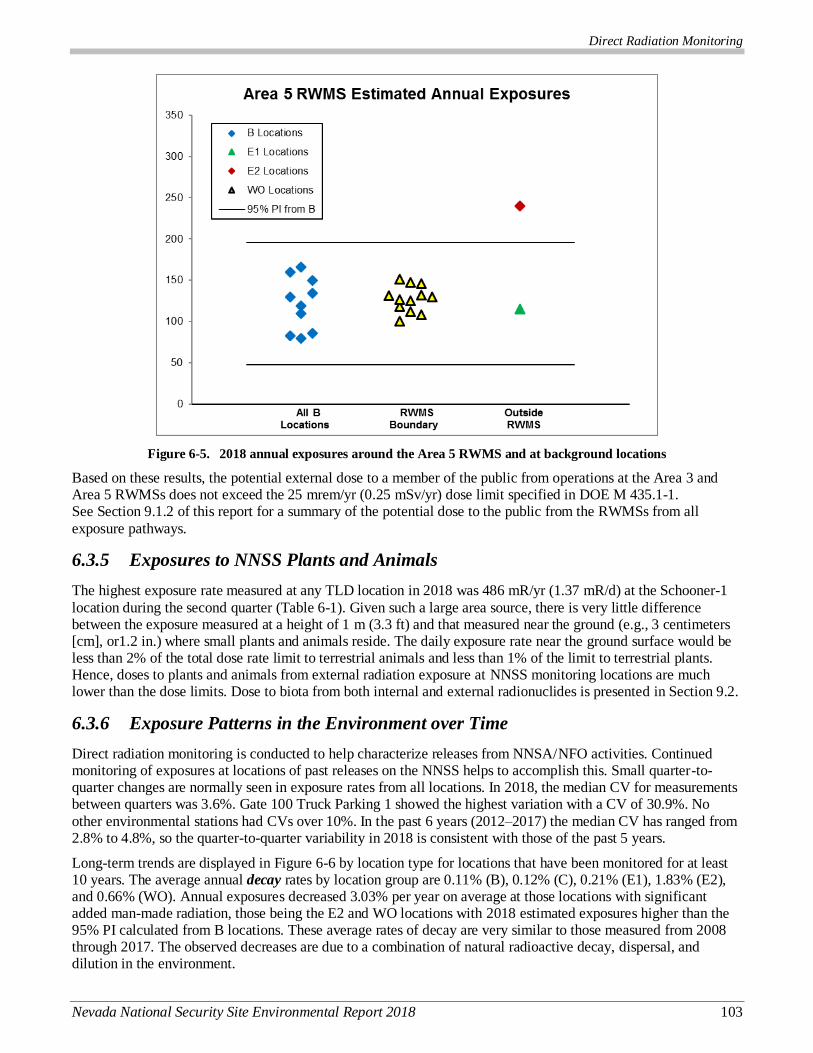
Direct Radiation Monitoring
Nevada National Security Site Environmental Report 2018 103
Figure 6-5. 2018 annual exposures around the Area 5 RWMS and at background locations
Based on these results, the potential external dose to a member of the public from operations at the Area 3 and Area 5 RWMSs does not exceed the 25 mrem/yr (0.25 mSv/yr) dose limit specified in DOE M 435.1-1. See Section 9.1.2 of this report for a summary of the potential dose to the public from the RWMSs from all
exposure pathways.
6.3.5 Exposures to NNSS Plants and Animals
The highest exposure rate measured at any TLD location in 2018 was 486 mR/yr (1.37 mR/d) at the Schooner-1
location during the second quarter (Table 6-1). Given such a large area source, there is very little difference between the exposure measured at a height of 1 m (3.3 ft) and that measured near the ground (e.g., 3 centimeters [cm], or1.2 in.) where small plants and animals reside. The daily exposure rate near the ground surface would be less than 2% of the total dose rate limit to terrestrial animals and less than 1% of the limit to terrestrial plants. Hence, doses to plants and animals from external radiation exposure at NNSS monitoring locations are much lower than the dose limits. Dose to biota from both internal and external radionuclides is presented in Section 9.2.
6.3.6 Exposure Patterns in the Environment over Time
Direct radiation monitoring is conducted to help characterize releases from NNSA/NFO activities. Continued monitoring of exposures at locations of past releases on the NNSS helps to accomplish this. Small quarter-to-quarter changes are normally seen in exposure rates from all locations. In 2018, the median CV for measurements between quarters was 3.6%. Gate 100 Truck Parking 1 showed the highest variation with a CV of 30.9%. No
other environmental stations had CVs over 10%. In the past 6 years (2012–2017) the median CV has ranged from 2.8% to 4.8%, so the quarter-to-quarter variability in 2018 is consistent with those of the past 5 years.
Long-term trends are displayed in Figure 6-6 by location type for locations that have been monitored for at least 10 years. The average annual decay rates by location group are 0.11% (B), 0.12% (C), 0.21% (E1), 1.83% (E2), and 0.66% (WO). Annual exposures decreased 3.03% per year on average at those locations with significant added man-made radiation, those being the E2 and WO locations with 2018 estimated exposures higher than the 95% PI calculated from B locations. These average rates of decay are very similar to those measured from 2008 through 2017. The observed decreases are due to a combination of natural radioactive decay, dispersal, and dilution in the environment.
0
50
100
150
200
250
300
350
mR
Area 5 RWMS Estimated Annual Exposures
B Locations
E1 Locations
E2 Locations
WO Locations
95% PI from B
Direct Radiation Monitoring
104 Nevada National Security Site Environmental Report 2018
The stations with the five estimated annual highest exposures in 2018 are Schooner-1 (Area 20), T9B (Area 9), T3B (Area 3), Stake A-9 (Area 4), and Stake N-8 (Area 2). Their annual exposures have been decreasing at an estimated rate of 50% every 15, 25, 36, 16, and 16 years respectively.
Figure 6-6. Trends in direct radiation exposure measured at TLD locations
6.4 Environmental Impact
Direct radiation exposure to the public from NNSS operations during 2018 was negligible. Radionuclides historically released to the environment on the NNSS have resulted in localized elevated exposures. The areas of elevated exposure are not open to the public, nor do personnel work in these areas full-time. Overall exposures at the RWMSs appear to be generally lower inside and at the boundary than those outside the RWMSs. This is due to the presence of radionuclides released from historical testing distributed throughout the area around the RWMSs compared with the clean soil used inside the RWMSs to cover the waste. The external dose to plants and animals at the location with the highest measured exposure was a small fraction of the dose limit to biota; hence,
no detrimental effects to biota from external radiation exposure are expected at the NNSS.
6.5 References
Bechtel Nevada, 2003. Routine Radiological Environmental Monitoring Plan. DOE/NV/11718--804, Las Vegas, NV.
0
400
800
1200
1600
1988 1992 1996 2000 2004 2008 2012 2016
mR
Estimated Annual ExposuresLocations with at least 10-year histories
Control
Background
Environmental 1
Environmental 2
Waste OperationsA4 Stake A-9
A20 Schooner-1
A3 RWMS S
A2 Stake N-8
A12 T-Tunnel
#2 Pond
Community-Based Offsite Monitoring
Nevada National Security Site Environmental Report 2018 105
7.0 Ch7
Chapter 7: Community-Based Offsite Monitoring
John O. Goreham, William T. Hartwell, Lynn H. Karr, Charles E. Russell, and Craig A. Shadel
Desert Research Institute
John M. Klenke
Nye County
Community Environmental Monitoring Program Goals
Provide independent monitoring at offsite locations and communicate environmental data relevant to past and continuing
activities at the Nevada National Security Site (NNSS). Engage the public through hands-on monitoring of environmental
conditions in their communities as they might relate to activities at the NNSS. Communicate environmental monitoring data
to the public in a transparent and accessible manner. Provide an educated, trusted, local resource for public inquiries
regarding past and present activities at the NNSS.
Two community-based radiological monitoring programs are conducted off the NNSS. They provide independent
results for the presence of man-made radionuclides1 in air and groundwater samples from communities surrounding the NNSS.
The Community Environmental Monitoring Program (CEMP) was initiated in 1981 and is conducted by the Desert Research Institute (DRI) of the Nevada System of Higher Education. CEMP’s mission is to provide data to the public regarding the presence of man-made radionuclides in air and groundwater off of the NNSS that could be the result of current operations or past nuclear testing on the NNSS. Initially, the CEMP network functioned as a first line of offsite detection of potential radiation releases from underground nuclear tests at the NNSS. It currently exists as a non-regulatory public informational and outreach program. Monitored and collected data include, but are not necessarily limited to, background and airborne radiation data, meteorological data, and tritium (
3H) concentrations in downgradient community drinking water. Network air monitoring stations, located
in Nevada, Utah, and California, are managed by local citizens, many of them high school science teachers, whose routine tasks are to ensure equipment is operating normally and to collect air filters and route them to DRI for analysis. These Community Environmental Monitors (CEMs) are also available to discuss the monitoring results with the public and to speak to community and school groups. DRI’s responsibilities include maintaining the physical monitoring network through monthly visits by environmental radiation monitoring specialists, who also participate in training and interfacing with CEMs and interacting with local community members and organizations to provide information related to the monitoring data. DRI also provides public access to the
monitoring data through maintenance of a project website at http://www.cemp.dri.edu/. A detailed informational background narrative about the CEMP can be found at http://www.cemp.dri.edu/cemp/moreinfo.html along with more detailed descriptions of the various types of sensors found at the stations and on outreach activities conducted by the CEMP.
The Nye County Tritium Sampling and Monitoring Program (TSaMP) was initiated in 2015 when the U.S. Department of Energy (DOE), National Nuclear Security Administration Nevada Field Office (NNSA/NFO) and the Environmental Management (EM) Nevada Program issued a 5-year grant to Nye County to monitor 3H in wells downgradient of the NNSS. The grant supports the annual sampling of 10 core wells (i.e., the same wells year to year) and 10 additional wells (selected locations change from year to year). The program also supports Nye County’s involvement in technical reviews of the Underground Test Area (UGTA) corrective action program
(Chapter 11). Nye County coordinates with DRI, CEMs, and Nye County citizens to determine the sample well locations. Due to CEMP’s success at involving and educating local communities, the grant directs that data administration and communication to the public of Nye County’s program be conducted through the CEMP. DRI provides a link to Nye County’s TSaMP data from the CEMP website at http://www.cemp.dri.edu/.
Sections 7.1 and 7.2 of this chapter present the 2018 CEMP air and water monitoring results. Section 7.3 presents the 2018 TSaMP monitoring results. Results from radiological monitoring of air, groundwater, direct radiation,
1 The definition of word(s) in bold italics may be found by clicking on the word in electronic version or by referencing the Glossary,
Appendix B. To return from the Glossary, right click and select Previous View.
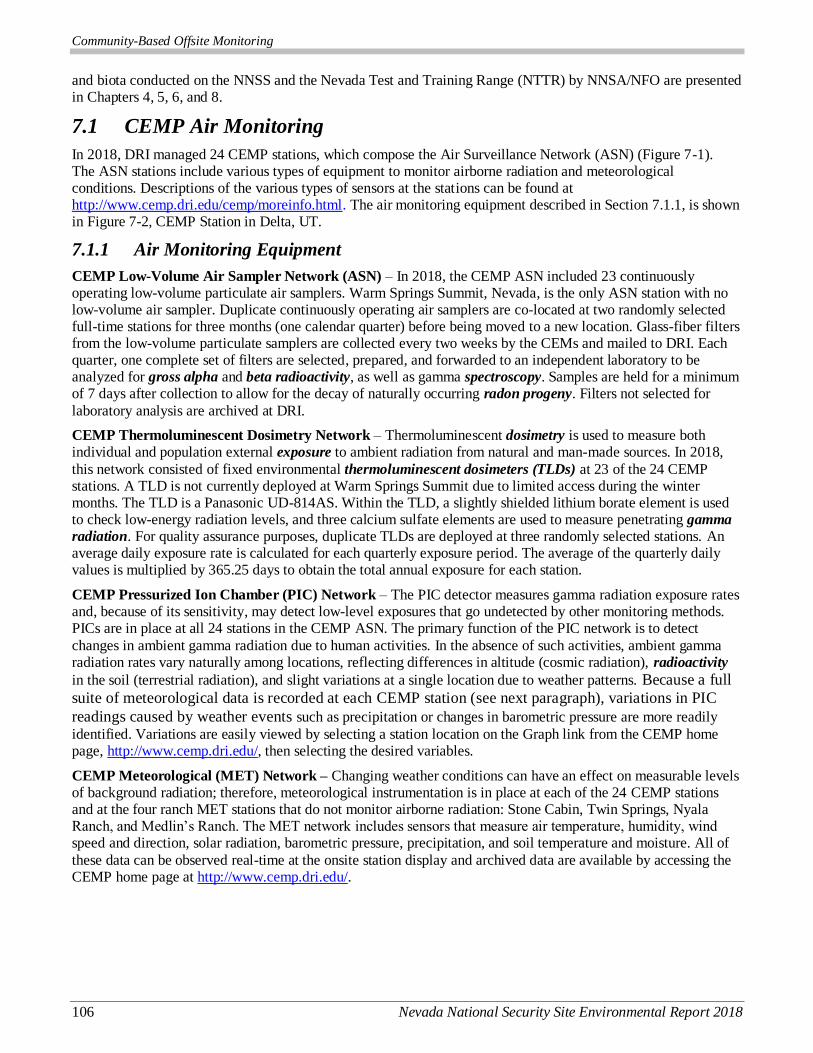
Community-Based Offsite Monitoring
106 Nevada National Security Site Environmental Report 2018
and biota conducted on the NNSS and the Nevada Test and Training Range (NTTR) by NNSA/NFO are presented in Chapters 4, 5, 6, and 8.
7.1 CEMP Air Monitoring
In 2018, DRI managed 24 CEMP stations, which compose the Air Surveillance Network (ASN) (Figure 7-1). The ASN stations include various types of equipment to monitor airborne radiation and meteorological conditions. Descriptions of the various types of sensors at the stations can be found at http://www.cemp.dri.edu/cemp/moreinfo.html. The air monitoring equipment described in Section 7.1.1, is shown in Figure 7-2, CEMP Station in Delta, UT.
7.1.1 Air Monitoring Equipment
CEMP Low-Volume Air Sampler Network (ASN) – In 2018, the CEMP ASN included 23 continuously operating low-volume particulate air samplers. Warm Springs Summit, Nevada, is the only ASN station with no low-volume air sampler. Duplicate continuously operating air samplers are co-located at two randomly selected full-time stations for three months (one calendar quarter) before being moved to a new location. Glass-fiber filters from the low-volume particulate samplers are collected every two weeks by the CEMs and mailed to DRI. Each quarter, one complete set of filters are selected, prepared, and forwarded to an independent laboratory to be analyzed for gross alpha and beta radioactivity, as well as gamma spectroscopy. Samples are held for a minimum of 7 days after collection to allow for the decay of naturally occurring radon progeny. Filters not selected for
laboratory analysis are archived at DRI.
CEMP Thermoluminescent Dosimetry Network – Thermoluminescent dosimetry is used to measure both individual and population external exposure to ambient radiation from natural and man-made sources. In 2018,
this network consisted of fixed environmental thermoluminescent dosimeters (TLDs) at 23 of the 24 CEMP stations. A TLD is not currently deployed at Warm Springs Summit due to limited access during the winter months. The TLD is a Panasonic UD-814AS. Within the TLD, a slightly shielded lithium borate element is used to check low-energy radiation levels, and three calcium sulfate elements are used to measure penetrating gamma
radiation. For quality assurance purposes, duplicate TLDs are deployed at three randomly selected stations. An average daily exposure rate is calculated for each quarterly exposure period. The average of the quarterly daily values is multiplied by 365.25 days to obtain the total annual exposure for each station.
CEMP Pressurized Ion Chamber (PIC) Network – The PIC detector measures gamma radiation exposure rates and, because of its sensitivity, may detect low-level exposures that go undetected by other monitoring methods. PICs are in place at all 24 stations in the CEMP ASN. The primary function of the PIC network is to detect
changes in ambient gamma radiation due to human activities. In the absence of such activities, ambient gamma radiation rates vary naturally among locations, reflecting differences in altitude (cosmic radiation), radioactivity
in the soil (terrestrial radiation), and slight variations at a single location due to weather patterns. Because a full
suite of meteorological data is recorded at each CEMP station (see next paragraph), variations in PIC
readings caused by weather events such as precipitation or changes in barometric pressure are more readily
identified. Variations are easily viewed by selecting a station location on the Graph link from the CEMP home page, http://www.cemp.dri.edu/, then selecting the desired variables.
CEMP Meteorological (MET) Network – Changing weather conditions can have an effect on measurable levels of background radiation; therefore, meteorological instrumentation is in place at each of the 24 CEMP stations and at the four ranch MET stations that do not monitor airborne radiation: Stone Cabin, Twin Springs, Nyala Ranch, and Medlin’s Ranch. The MET network includes sensors that measure air temperature, humidity, wind speed and direction, solar radiation, barometric pressure, precipitation, and soil temperature and moisture. All of
these data can be observed real-time at the onsite station display and archived data are available by accessing the CEMP home page at http://www.cemp.dri.edu/.
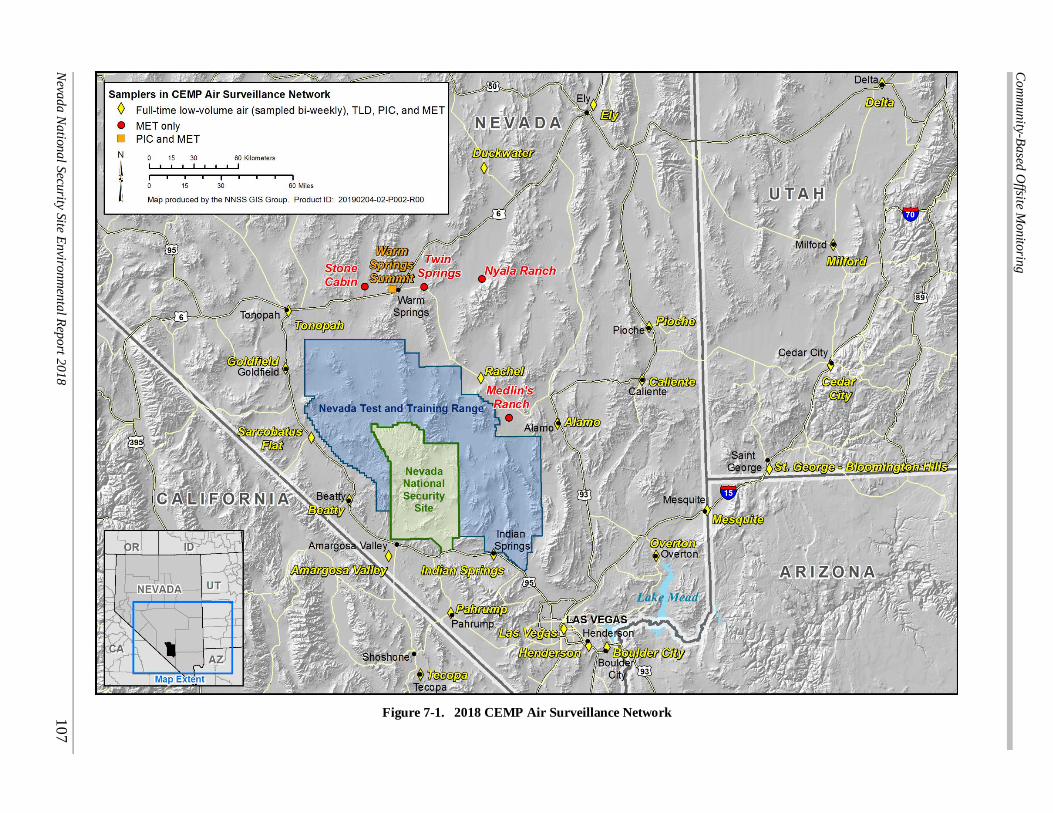
Figure 7-1. 2018 CEMP Air Surveillance Network
Com
munity-B
ased
Offsite M
on
itorin
g
Neva
da N
atio
na
l Secu
rity Site E
nviro
nm
enta
l Rep
ort 2
01
8 1
07
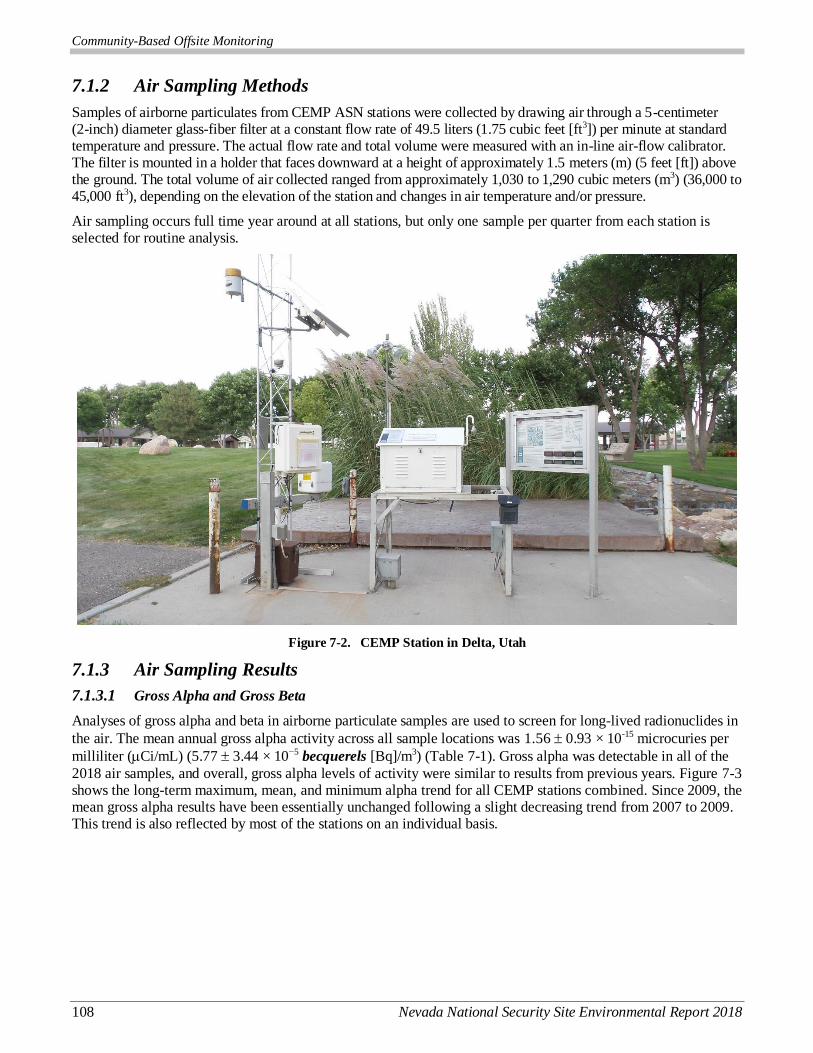
Community-Based Offsite Monitoring
108 Nevada National Security Site Environmental Report 2018
7.1.2 Air Sampling Methods
Samples of airborne particulates from CEMP ASN stations were collected by drawing air through a 5-centimeter (2-inch) diameter glass-fiber filter at a constant flow rate of 49.5 liters (1.75 cubic feet [ft3]) per minute at standard temperature and pressure. The actual flow rate and total volume were measured with an in-line air-flow calibrator. The filter is mounted in a holder that faces downward at a height of approximately 1.5 meters (m) (5 feet [ft]) above the ground. The total volume of air collected ranged from approximately 1,030 to 1,290 cubic meters (m3) (36,000 to 45,000 ft3), depending on the elevation of the station and changes in air temperature and/or pressure.
Air sampling occurs full time year around at all stations, but only one sample per quarter from each station is selected for routine analysis.
Figure 7-2. CEMP Station in Delta, Utah
7.1.3 Air Sampling Results
7.1.3.1 Gross Alpha and Gross Beta
Analyses of gross alpha and beta in airborne particulate samples are used to screen for long-lived radionuclides in
the air. The mean annual gross alpha activity across all sample locations was 1.56 0.93 × 10⁻¹⁵ microcuries per
milliliter (Ci/mL) (5.77 3.44 × 10⁻⁵ becquerels [Bq]/m3) (Table 7-1). Gross alpha was detectable in all of the
2018 air samples, and overall, gross alpha levels of activity were similar to results from previous years. Figure 7-3 shows the long-term maximum, mean, and minimum alpha trend for all CEMP stations combined. Since 2009, the mean gross alpha results have been essentially unchanged following a slight decreasing trend from 2007 to 2009. This trend is also reflected by most of the stations on an individual basis.
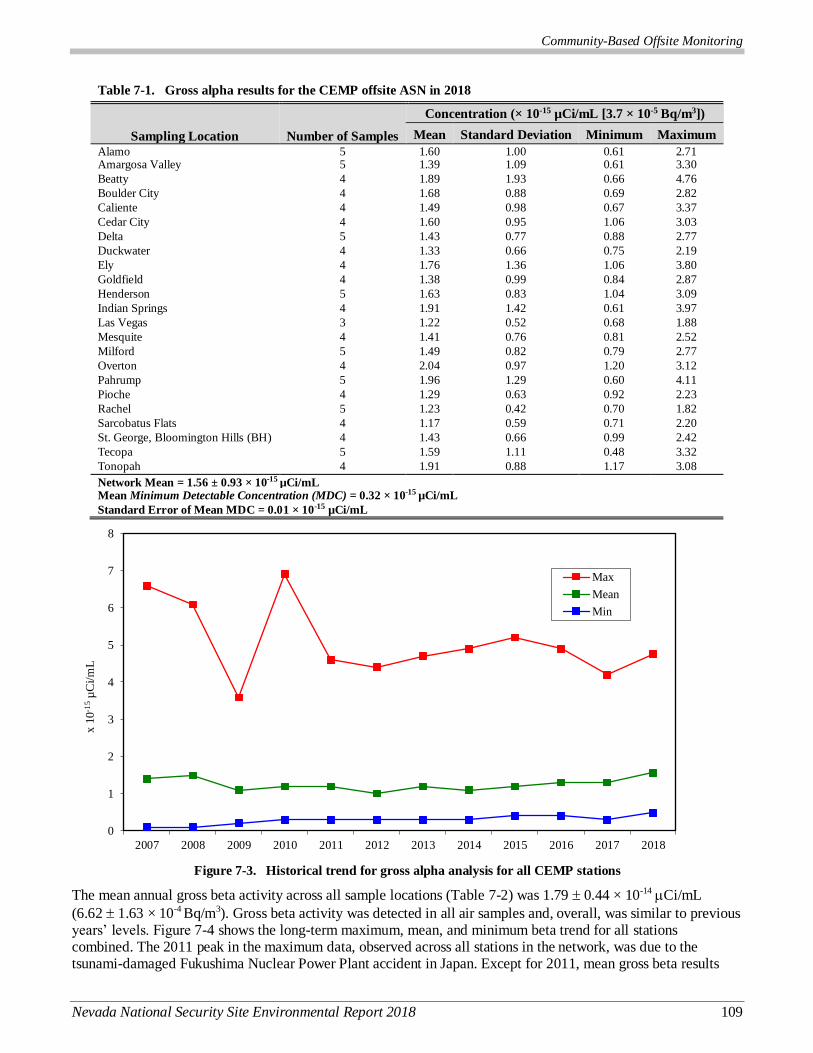
Community-Based Offsite Monitoring
Nevada National Security Site Environmental Report 2018 109
Table 7-1. Gross alpha results for the CEMP offsite ASN in 2018
Sampling Location Number of Samples
Concentration (× 10-15 µCi/mL [3.7 × 10⁻⁵ Bq/m3])
Mean Standard Deviation Minimum Maximum
Alamo 5 1.60 1.00 0.61 2.71 Amargosa Valley 5 1.39 1.09 0.61 3.30
Beatty 4 1.89 1.93 0.66 4.76
Boulder City 4 1.68 0.88 0.69 2.82
Caliente 4 1.49 0.98 0.67 3.37
Cedar City 4 1.60 0.95 1.06 3.03
Delta 5 1.43 0.77 0.88 2.77
Duckwater 4 1.33 0.66 0.75 2.19
Ely 4 1.76 1.36 1.06 3.80
Goldfield 4 1.38 0.99 0.84 2.87
Henderson 5 1.63 0.83 1.04 3.09
Indian Springs 4 1.91 1.42 0.61 3.97
Las Vegas 3 1.22 0.52 0.68 1.88
Mesquite 4 1.41 0.76 0.81 2.52
Milford 5 1.49 0.82 0.79 2.77
Overton 4 2.04 0.97 1.20 3.12
Pahrump 5 1.96 1.29 0.60 4.11
Pioche 4 1.29 0.63 0.92 2.23
Rachel 5 1.23 0.42 0.70 1.82
Sarcobatus Flats 4 1.17 0.59 0.71 2.20
St. George, Bloomington Hills (BH) 4 1.43 0.66 0.99 2.42
Tecopa 5 1.59 1.11 0.48 3.32
Tonopah 4 1.91 0.88 1.17 3.08
Network Mean = 1.56 ± 0.93 × 10⁻¹⁵ µCi/mL Mean Minimum Detectable Concentration (MDC) = 0.32 × 10⁻¹⁵ µCi/mL
Standard Error of Mean MDC = 0.01 × 10⁻¹⁵ µCi/mL
Figure 7-3. Historical trend for gross alpha analysis for all CEMP stations
The mean annual gross beta activity across all sample locations (Table 7-2) was 1.79 0.44 × 10⁻¹⁴ Ci/mL
(6.62 1.63 × 10⁻⁴ Bq/m3). Gross beta activity was detected in all air samples and, overall, was similar to previous years’ levels. Figure 7-4 shows the long-term maximum, mean, and minimum beta trend for all stations combined. The 2011 peak in the maximum data, observed across all stations in the network, was due to the tsunami-damaged Fukushima Nuclear Power Plant accident in Japan. Except for 2011, mean gross beta results
0
1
2
3
4
5
6
7
8
2007 2008 2009 2010 2011 2012 2013 2014 2015 2016 2017 2018
x 1
0-1
5µ
Ci/
mL
Max
Mean
Min
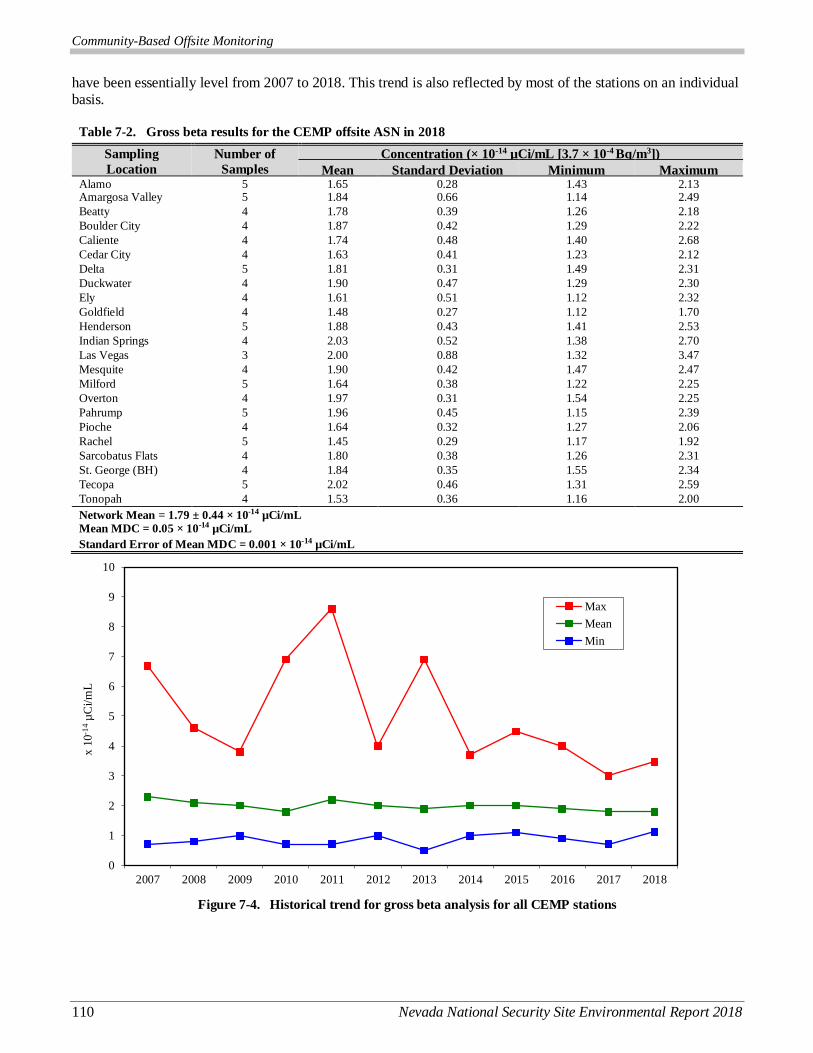
Community-Based Offsite Monitoring
110 Nevada National Security Site Environmental Report 2018
have been essentially level from 2007 to 2018. This trend is also reflected by most of the stations on an individual basis.
Table 7-2. Gross beta results for the CEMP offsite ASN in 2018
Sampling
Location
Number of
Samples
Concentration (× 10-14 µCi/mL [3.7 × 10⁻⁴ Bq/m3])
Mean Standard Deviation Minimum Maximum Alamo 5 1.65 0.28 1.43 2.13 Amargosa Valley 5 1.84 0.66 1.14 2.49
Beatty 4 1.78 0.39 1.26 2.18
Boulder City 4 1.87 0.42 1.29 2.22
Caliente 4 1.74 0.48 1.40 2.68
Cedar City 4 1.63 0.41 1.23 2.12
Delta 5 1.81 0.31 1.49 2.31
Duckwater 4 1.90 0.47 1.29 2.30
Ely 4 1.61 0.51 1.12 2.32
Goldfield 4 1.48 0.27 1.12 1.70
Henderson 5 1.88 0.43 1.41 2.53
Indian Springs 4 2.03 0.52 1.38 2.70
Las Vegas 3 2.00 0.88 1.32 3.47
Mesquite 4 1.90 0.42 1.47 2.47
Milford 5 1.64 0.38 1.22 2.25
Overton 4 1.97 0.31 1.54 2.25
Pahrump 5 1.96 0.45 1.15 2.39
Pioche 4 1.64 0.32 1.27 2.06
Rachel 5 1.45 0.29 1.17 1.92
Sarcobatus Flats 4 1.80 0.38 1.26 2.31
St. George (BH) 4 1.84 0.35 1.55 2.34
Tecopa 5 2.02 0.46 1.31 2.59
Tonopah 4 1.53 0.36 1.16 2.00
Network Mean = 1.79 ± 0.44 × 10⁻¹⁴ µCi/mL
Mean MDC = 0.05 × 10⁻¹⁴ µCi/mL
Standard Error of Mean MDC = 0.001 × 10⁻¹⁴ µCi/mL
Figure 7-4. Historical trend for gross beta analysis for all CEMP stations
0
1
2
3
4
5
6
7
8
9
10
2007 2008 2009 2010 2011 2012 2013 2014 2015 2016 2017 2018
x 1
0-1
4µ
Ci/
mL
Max
Mean
Min
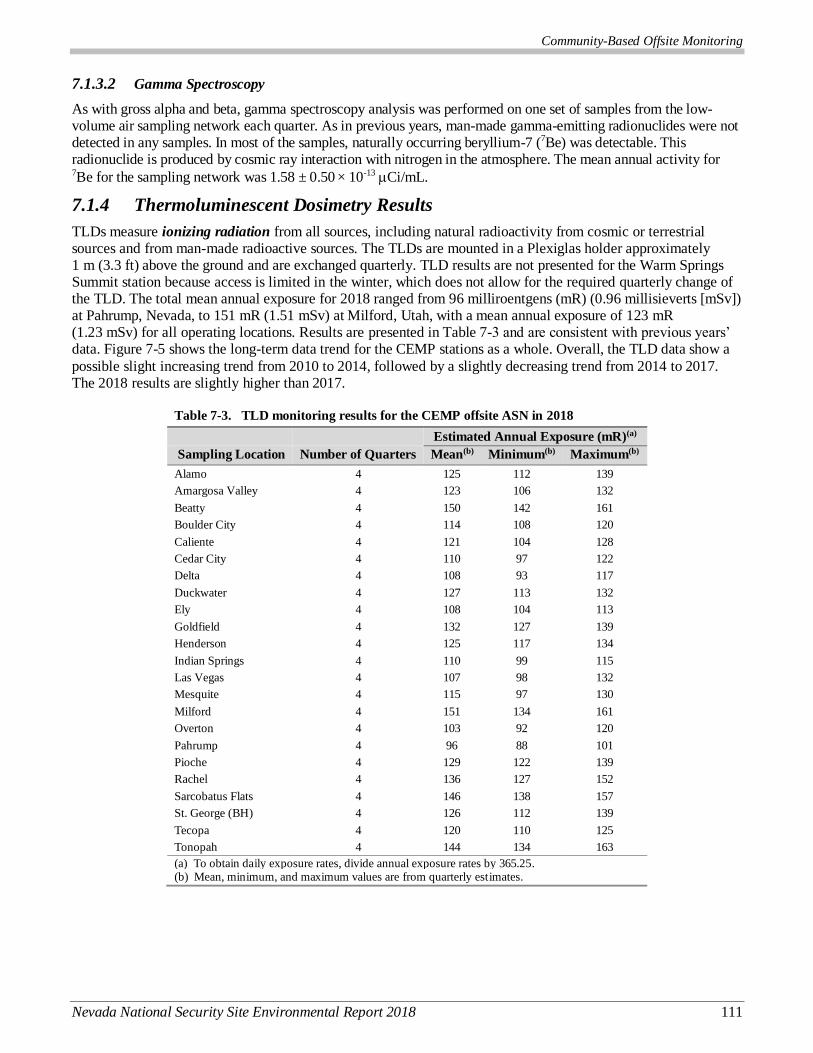
Community-Based Offsite Monitoring
Nevada National Security Site Environmental Report 2018 111
7.1.3.2 Gamma Spectroscopy
As with gross alpha and beta, gamma spectroscopy analysis was performed on one set of samples from the low-volume air sampling network each quarter. As in previous years, man-made gamma-emitting radionuclides were not detected in any samples. In most of the samples, naturally occurring beryllium-7 (7Be) was detectable. This radionuclide is produced by cosmic ray interaction with nitrogen in the atmosphere. The mean annual activity for 7Be for the sampling network was 1.58 ± 0.50 × 10⁻¹³ Ci/mL.
7.1.4 Thermoluminescent Dosimetry Results
TLDs measure ionizing radiation from all sources, including natural radioactivity from cosmic or terrestrial sources and from man-made radioactive sources. The TLDs are mounted in a Plexiglas holder approximately 1 m (3.3 ft) above the ground and are exchanged quarterly. TLD results are not presented for the Warm Springs Summit station because access is limited in the winter, which does not allow for the required quarterly change of the TLD. The total mean annual exposure for 2018 ranged from 96 milliroentgens (mR) (0.96 millisieverts [mSv]) at Pahrump, Nevada, to 151 mR (1.51 mSv) at Milford, Utah, with a mean annual exposure of 123 mR (1.23 mSv) for all operating locations. Results are presented in Table 7-3 and are consistent with previous years’ data. Figure 7-5 shows the long-term data trend for the CEMP stations as a whole. Overall, the TLD data show a
possible slight increasing trend from 2010 to 2014, followed by a slightly decreasing trend from 2014 to 2017. The 2018 results are slightly higher than 2017.
Table 7-3. TLD monitoring results for the CEMP offsite ASN in 2018
Estimated Annual Exposure (mR)(a)
Sampling Location Number of Quarters Mean(b) Minimum(b) Maximum(b)
Alamo 4 125 112 139
Amargosa Valley 4 123 106 132
Beatty 4 150 142 161
Boulder City 4 114 108 120
Caliente 4 121 104 128
Cedar City 4 110 97 122
Delta 4 108 93 117
Duckwater 4 127 113 132
Ely 4 108 104 113
Goldfield 4 132 127 139
Henderson 4 125 117 134
Indian Springs 4 110 99 115
Las Vegas 4 107 98 132
Mesquite 4 115 97 130
Milford 4 151 134 161
Overton 4 103 92 120
Pahrump 4 96 88 101
Pioche 4 129 122 139
Rachel 4 136 127 152
Sarcobatus Flats 4 146 138 157
St. George (BH) 4 126 112 139
Tecopa 4 120 110 125
Tonopah 4 144 134 163
(a) To obtain daily exposure rates, divide annual exposure rates by 365.25. (b) Mean, minimum, and maximum values are from quarterly estimates.
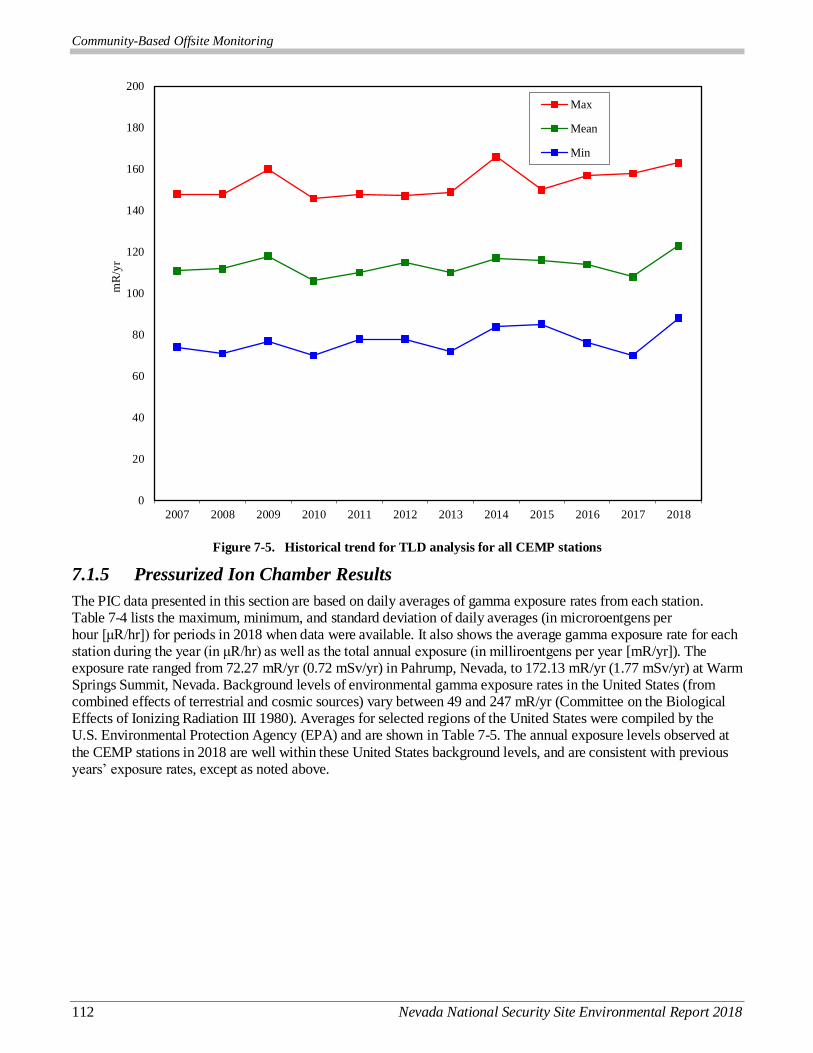
Community-Based Offsite Monitoring
112 Nevada National Security Site Environmental Report 2018
Figure 7-5. Historical trend for TLD analysis for all CEMP stations
7.1.5 Pressurized Ion Chamber Results
The PIC data presented in this section are based on daily averages of gamma exposure rates from each station. Table 7-4 lists the maximum, minimum, and standard deviation of daily averages (in microroentgens per hour [μR/hr]) for periods in 2018 when data were available. It also shows the average gamma exposure rate for each station during the year (in μR/hr) as well as the total annual exposure (in milliroentgens per year [mR/yr]). The exposure rate ranged from 72.27 mR/yr (0.72 mSv/yr) in Pahrump, Nevada, to 172.13 mR/yr (1.77 mSv/yr) at Warm Springs Summit, Nevada. Background levels of environmental gamma exposure rates in the United States (from combined effects of terrestrial and cosmic sources) vary between 49 and 247 mR/yr (Committee on the Biological Effects of Ionizing Radiation III 1980). Averages for selected regions of the United States were compiled by the U.S. Environmental Protection Agency (EPA) and are shown in Table 7-5. The annual exposure levels observed at
the CEMP stations in 2018 are well within these United States background levels, and are consistent with previous years’ exposure rates, except as noted above.
0
20
40
60
80
100
120
140
160
180
200
2007 2008 2009 2010 2011 2012 2013 2014 2015 2016 2017 2018
mR
/yr
Max
Mean
Min
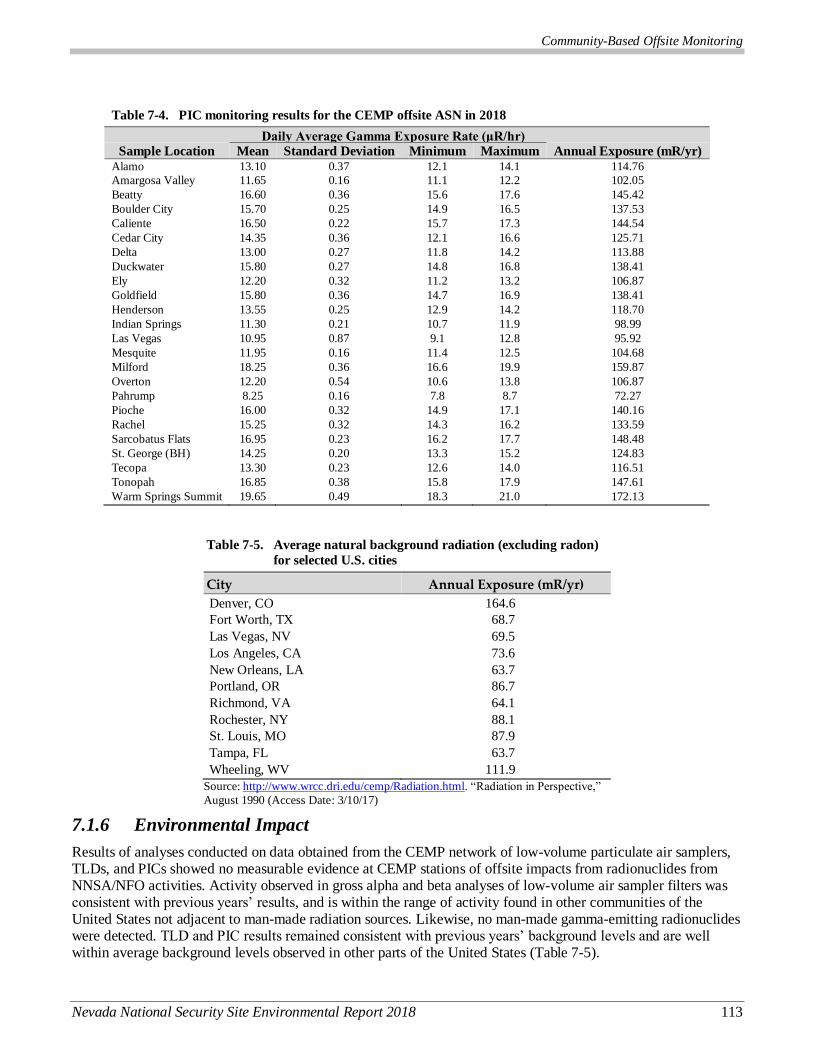
Community-Based Offsite Monitoring
Nevada National Security Site Environmental Report 2018 113
Table 7-4. PIC monitoring results for the CEMP offsite ASN in 2018
Daily Average Gamma Exposure Rate (μR/hr) Sample Location Mean Standard Deviation Minimum Maximum Annual Exposure (mR/yr)
Alamo 13.10 0.37 12.1 14.1 114.76
Amargosa Valley 11.65 0.16 11.1 12.2 102.05
Beatty 16.60 0.36 15.6 17.6 145.42
Boulder City 15.70 0.25 14.9 16.5 137.53
Caliente 16.50 0.22 15.7 17.3 144.54
Cedar City 14.35 0.36 12.1 16.6 125.71
Delta 13.00 0.27 11.8 14.2 113.88
Duckwater 15.80 0.27 14.8 16.8 138.41
Ely 12.20 0.32 11.2 13.2 106.87
Goldfield 15.80 0.36 14.7 16.9 138.41
Henderson 13.55 0.25 12.9 14.2 118.70
Indian Springs 11.30 0.21 10.7 11.9 98.99
Las Vegas 10.95 0.87 9.1 12.8 95.92
Mesquite 11.95 0.16 11.4 12.5 104.68
Milford 18.25 0.36 16.6 19.9 159.87
Overton 12.20 0.54 10.6 13.8 106.87
Pahrump 8.25 0.16 7.8 8.7 72.27
Pioche 16.00 0.32 14.9 17.1 140.16
Rachel 15.25 0.32 14.3 16.2 133.59
Sarcobatus Flats 16.95 0.23 16.2 17.7 148.48
St. George (BH) 14.25 0.20 13.3 15.2 124.83
Tecopa 13.30 0.23 12.6 14.0 116.51
Tonopah 16.85 0.38 15.8 17.9 147.61
Warm Springs Summit 19.65 0.49 18.3 21.0 172.13
Table 7-5. Average natural background radiation (excluding radon)
for selected U.S. cities
City Annual Exposure (mR/yr)
Denver, CO 164.6
Fort Worth, TX 68.7
Las Vegas, NV 69.5
Los Angeles, CA 73.6
New Orleans, LA 63.7
Portland, OR 86.7
Richmond, VA 64.1
Rochester, NY 88.1
St. Louis, MO 87.9
Tampa, FL 63.7
Wheeling, WV 111.9
Source: http://www.wrcc.dri.edu/cemp/Radiation.html. “Radiation in Perspective,”
August 1990 (Access Date: 3/10/17)
7.1.6 Environmental Impact
Results of analyses conducted on data obtained from the CEMP network of low-volume particulate air samplers, TLDs, and PICs showed no measurable evidence at CEMP stations of offsite impacts from radionuclides from NNSA/NFO activities. Activity observed in gross alpha and beta analyses of low-volume air sampler filters was consistent with previous years’ results, and is within the range of activity found in other communities of the United States not adjacent to man-made radiation sources. Likewise, no man-made gamma-emitting radionuclides were detected. TLD and PIC results remained consistent with previous years’ background levels and are well within average background levels observed in other parts of the United States (Table 7-5).
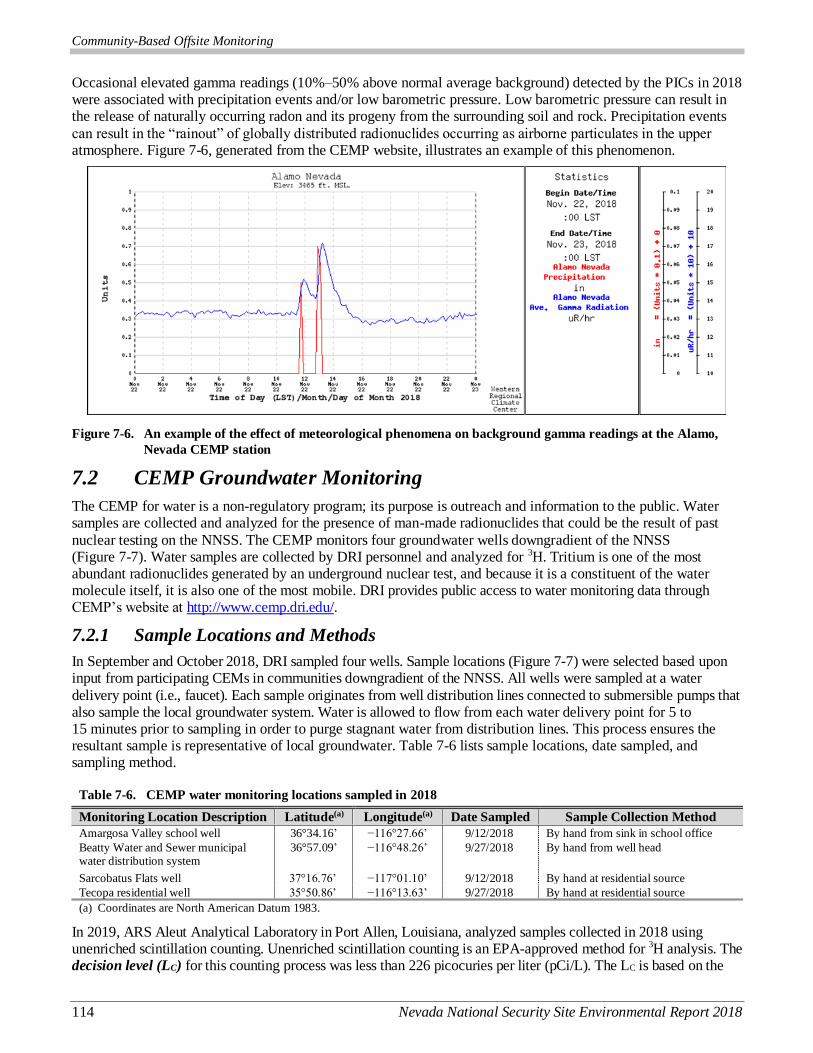
Community-Based Offsite Monitoring
114 Nevada National Security Site Environmental Report 2018
Occasional elevated gamma readings (10%–50% above normal average background) detected by the PICs in 2018 were associated with precipitation events and/or low barometric pressure. Low barometric pressure can result in the release of naturally occurring radon and its progeny from the surrounding soil and rock. Precipitation events
can result in the “rainout” of globally distributed radionuclides occurring as airborne particulates in the upper atmosphere. Figure 7-6, generated from the CEMP website, illustrates an example of this phenomenon.
Figure 7-6. An example of the effect of meteorological phenomena on background gamma readings at the Alamo,
Nevada CEMP station
7.2 CEMP Groundwater Monitoring
The CEMP for water is a non-regulatory program; its purpose is outreach and information to the public. Water samples are collected and analyzed for the presence of man-made radionuclides that could be the result of past
nuclear testing on the NNSS. The CEMP monitors four groundwater wells downgradient of the NNSS (Figure 7-7). Water samples are collected by DRI personnel and analyzed for 3H. Tritium is one of the most abundant radionuclides generated by an underground nuclear test, and because it is a constituent of the water molecule itself, it is also one of the most mobile. DRI provides public access to water monitoring data through CEMP’s website at http://www.cemp.dri.edu/.
7.2.1 Sample Locations and Methods
In September and October 2018, DRI sampled four wells. Sample locations (Figure 7-7) were selected based upon input from participating CEMs in communities downgradient of the NNSS. All wells were sampled at a water
delivery point (i.e., faucet). Each sample originates from well distribution lines connected to submersible pumps that also sample the local groundwater system. Water is allowed to flow from each water delivery point for 5 to 15 minutes prior to sampling in order to purge stagnant water from distribution lines. This process ensures the resultant sample is representative of local groundwater. Table 7-6 lists sample locations, date sampled, and sampling method.
Table 7-6. CEMP water monitoring locations sampled in 2018
Monitoring Location Description Latitude(a) Longitude(a) Date Sampled Sample Collection Method
Amargosa Valley school well 36°34.16’ −116°27.66’ 9/12/2018 By hand from sink in school office
Beatty Water and Sewer municipal water distribution system
36°57.09’ −116°48.26’ 9/27/2018 By hand from well head
Sarcobatus Flats well 37°16.76’ −117°01.10’ 9/12/2018 By hand at residential source
Tecopa residential well 35°50.86’ −116°13.63’ 9/27/2018 By hand at residential source
(a) Coordinates are North American Datum 1983.
In 2019, ARS Aleut Analytical Laboratory in Port Allen, Louisiana, analyzed samples collected in 2018 using unenriched scintillation counting. Unenriched scintillation counting is an EPA-approved method for 3H analysis. The decision level (LC) for this counting process was less than 226 picocuries per liter (pCi/L). The LC is based on the
Community-Based Offsite Monitoring
Nevada National Security Site Environmental Report 2018 115
variability of multiple measures of samples, which establish laboratory background. If a sample exceeds the Lc, it is considered distinguishable from laboratory background. The MDC considers both the variability associated with multiple measures of the background and the variability associated with multiple measures of the sample itself. For
samples collected in 2018, the MDC for 3H was approximately 445 pCi/L; this is a more rigorous threshold than the Lc, dictating that the sample be distinguishable from background at a confidence of 95%. The LC and the MDC are approximately 1% and 2% of the EPA limit for 3H in drinking water (respectively); the EPA limit is 20,000 pCi/L. Quality assurance and quality control procedures are described in Chapter 15.
7.2.2 Results of Groundwater Monitoring
Tritium analyses from ARS Aluet Analytical for the four groundwater samples yielded results that were all quantifiably below background (≤ the MDC of approximately 446 pCi/L). Public access to monitoring data is available on the DRI CEMP website at http://www.cemp.dri.edu/.
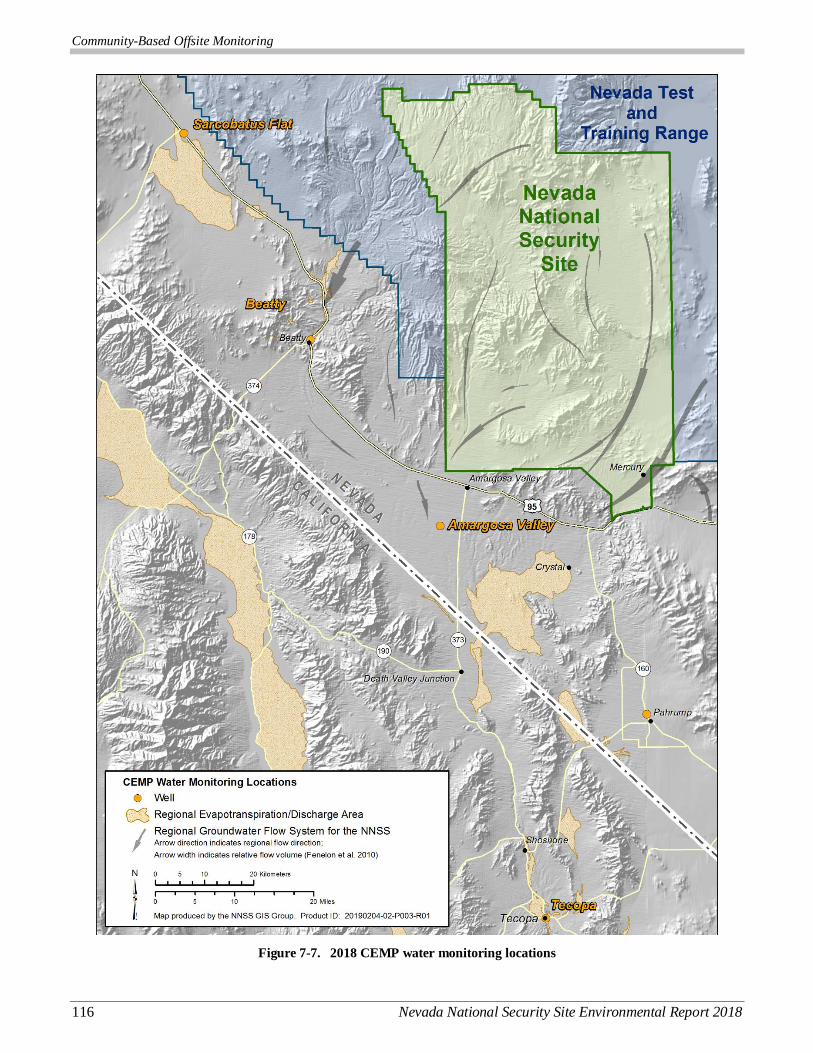
Community-Based Offsite Monitoring
116 Nevada National Security Site Environmental Report 2018
Figure 7-7. 2018 CEMP water monitoring locations
Community-Based Offsite Monitoring
Nevada National Security Site Environmental Report 2018 117
7.3 Nye County Tritium Sampling and Monitoring Program
The Nye County TSaMP was initiated in 2015 in response to the county’s request for NNSA/NFO to expand its support of offsite community-based monitoring of wells for 3H. A 5-year grant from the NNSA/NFO and the EM
Nevada Program supports the county’s annual sampling of 20 wells downgradient of the NNSS: 10 core wells (i.e., the same wells year to year) and 10 additional wells (selected locations change from year to year). The grant also supports Nye County’s involvement in technical reviews of the UGTA corrective action program (Chapter 11). To help determine sample well locations, Nye County coordinates with DRI, who conducts the CEMP, with the CEMP’s CEMs, and Nye County citizens. Nye County communicates their TSaMP activities and results to the public through poster presentations at annual DOE EM-funded Groundwater Open House meetings (Section 11.6), presentations at annual CEMP meetings, articles published in the Pahrump Valley Times, and this annually published report.
In 2018, in addition to the 10 core wells (9 wells and 1 spring), Nye County sampled 8 wells and 2 springs. (Table 7-7 and Figure 7-8). Selected locations for 2018 were in the same general areas as 2015–2017, and were
chosen for their position within the projected groundwater flow path from the NNSS, proximity to downgradient communities, and recommendations provided by CEMs or Nye County citizens. Wells managed by Nye County and being sampled for 3H under the TSaMP were initially drilled as part of the Early Warning Drill Program (“EWDP” labeled wells) or as Nye County Groundwater Evaluation Wells (“NC-GWE” labeled wells). Nye County also takes water levels in these wells on a quarterly basis through funding from the Nye County Water District’s Water Level Measurement Program. Some locations selected for sampling under the TSaMP may include NNSA/NFO wells or locations that are also sampled under the NNSS Integrated Groundwater Sampling Plan (Section 5.1) or under the CEMP.
All wells without integrated pumps were sampled using either an air-powered submersible positive displacement pump or a 3-inch submersible electric pump. A minimum of three well volumes was pumped from each well prior
to sampling in order to purge water from the pump tubing and well annulus and ensure samples are representative of local groundwater conditions. Community wells, which include domestic or municipal wells, were sampled from the dedicated pump discharge. New to 2018 was the addition of private domestic wells, also sampled from the dedicated pump discharge. The private well initiative, approved by CEMs at the 2018 CEMP annual workshop (July 23rd–25th), was incorporated into the program in order to expand the spatial distribution of sampling sites and to provide a means to increase community involvement. The three springs sampled in 2018 were all sampled directly from the spring discharge.
All samples were analyzed for 3H by Radiation Safety Engineering, Inc., in Chandler, Arizona, using an EPA-approved, unenriched scintillation counting method. The sample MDCs for this method were 282 or 289 pCi/L, which are less than 2% of the EPA limit for 3H in drinking water (20,000 pCi/L). Analytical methods included the
use of quality control samples such as duplicates, blanks, and spikes. Nye County’s quality assurance procedures for 3H sampling are documented in Test Plan TPN-11.8 (2016), Groundwater Sampling and Analysis for the Nye County Tritium Sampling and Monitoring Program, and Work Plan WP-11, Groundwater Chemistry Sampling and Analysis (2016) (available on the Nye County website at http://www.co.nye.nv.us/index.aspx?NID=901).
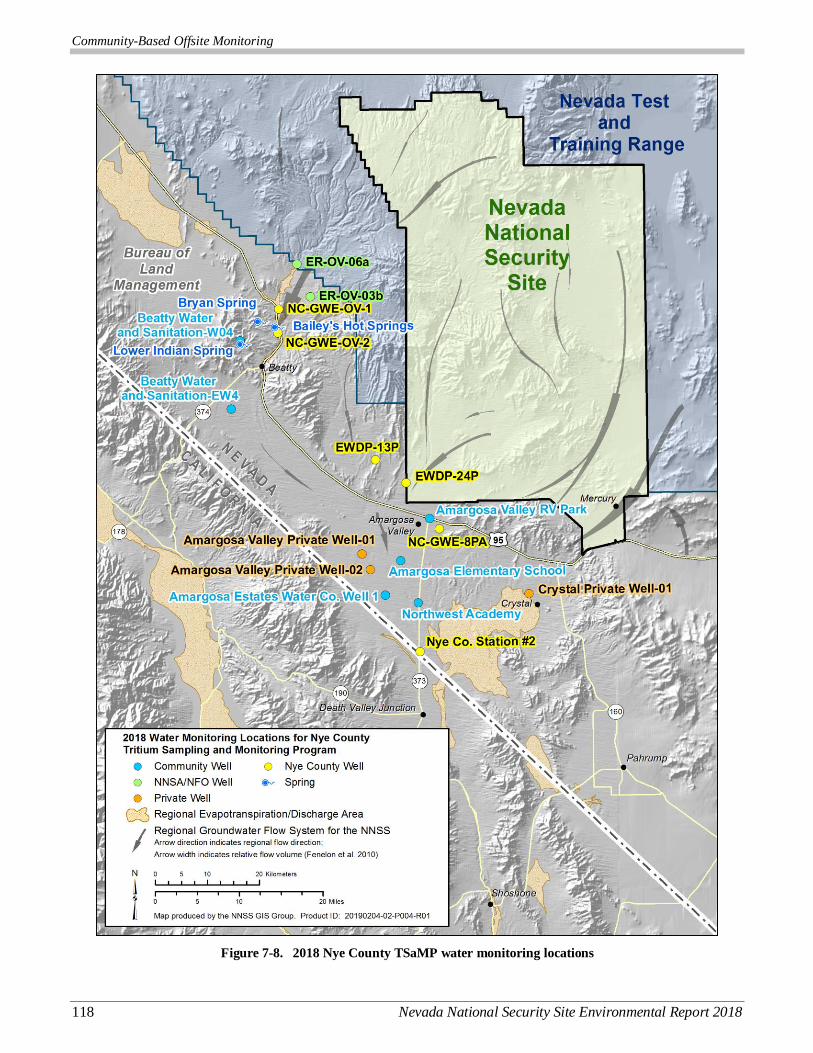
Community-Based Offsite Monitoring
118 Nevada National Security Site Environmental Report 2018
Figure 7-8. 2018 Nye County TSaMP water monitoring locations
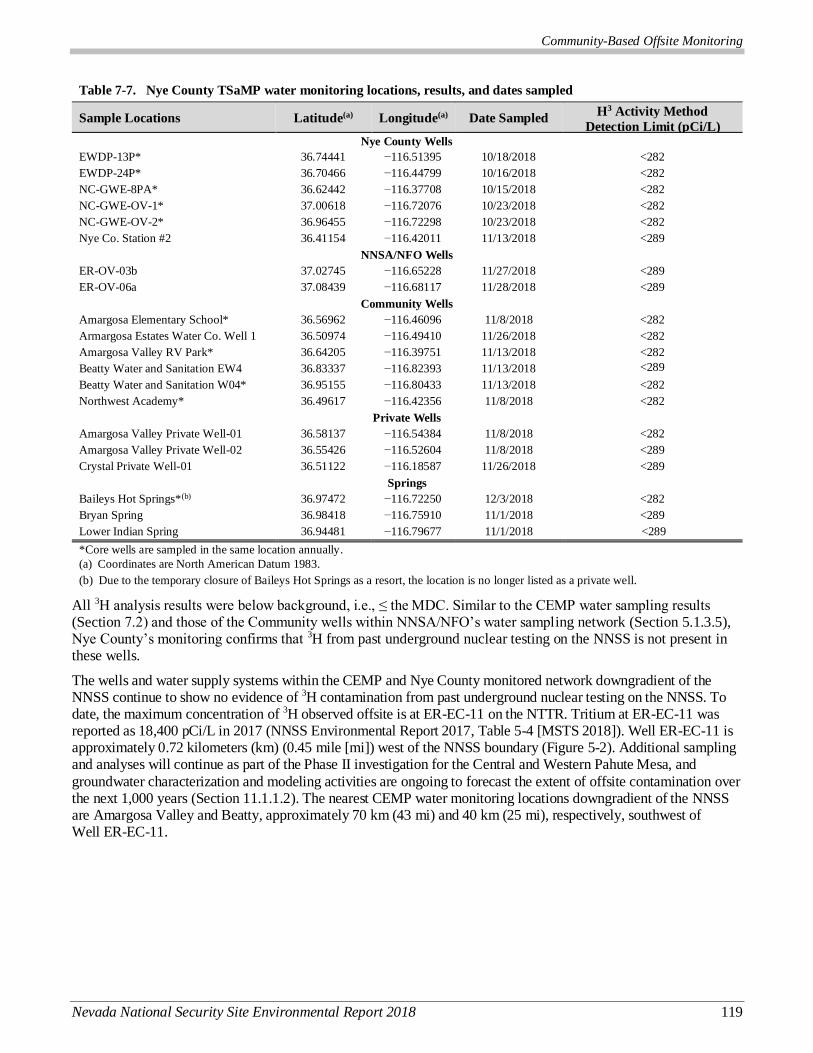
Community-Based Offsite Monitoring
Nevada National Security Site Environmental Report 2018 119
Table 7-7. Nye County TSaMP water monitoring locations, results, and dates sampled
Sample Locations Latitude(a) Longitude(a) Date Sampled H3 Activity Method
Detection Limit (pCi/L) Nye County Wells
EWDP-13P* 36.74441 −116.51395 10/18/2018 <282
EWDP-24P* 36.70466 −116.44799 10/16/2018 <282
NC-GWE-8PA* 36.62442 −116.37708 10/15/2018 <282
NC-GWE-OV-1* 37.00618 −116.72076 10/23/2018 <282
NC-GWE-OV-2* 36.96455 −116.72298 10/23/2018 <282
Nye Co. Station #2 36.41154 −116.42011 11/13/2018 <289
NNSA/NFO Wells
ER-OV-03b 37.02745 −116.65228 11/27/2018 <289
ER-OV-06a 37.08439 −116.68117 11/28/2018 <289
Community Wells
Amargosa Elementary School* 36.56962 −116.46096 11/8/2018 <282
Armargosa Estates Water Co. Well 1 36.50974 −116.49410 11/26/2018 <282
Amargosa Valley RV Park* 36.64205 −116.39751 11/13/2018 <282
Beatty Water and Sanitation EW4 36.83337 −116.82393 11/13/2018 <289
<282 Beatty Water and Sanitation W04* 36.95155 −116.80433 11/13/2018 <282
Northwest Academy* 36.49617 −116.42356 11/8/2018 <282
Private Wells
Amargosa Valley Private Well-01 36.58137 −116.54384 11/8/2018 <282
Amargosa Valley Private Well-02 36.55426 −116.52604 11/8/2018 <289
Crystal Private Well-01 36.51122 −116.18587 11/26/2018 <289
Springs
Baileys Hot Springs*(b) 36.97472 −116.72250 12/3/2018 <282
Bryan Spring 36.98418 −116.75910 11/1/2018 <289
Lower Indian Spring 36.94481 −116.79677 11/1/2018 <289
*Core wells are sampled in the same location annually.
(a) Coordinates are North American Datum 1983.
(b) Due to the temporary closure of Baileys Hot Springs as a resort, the location is no longer listed as a private well.
All 3H analysis results were below background, i.e., ≤ the MDC. Similar to the CEMP water sampling results (Section 7.2) and those of the Community wells within NNSA/NFO’s water sampling network (Section 5.1.3.5), Nye County’s monitoring confirms that 3H from past underground nuclear testing on the NNSS is not present in these wells.
The wells and water supply systems within the CEMP and Nye County monitored network downgradient of the NNSS continue to show no evidence of 3H contamination from past underground nuclear testing on the NNSS. To date, the maximum concentration of 3H observed offsite is at ER-EC-11 on the NTTR. Tritium at ER-EC-11 was reported as 18,400 pCi/L in 2017 (NNSS Environmental Report 2017, Table 5-4 [MSTS 2018]). Well ER-EC-11 is approximately 0.72 kilometers (km) (0.45 mile [mi]) west of the NNSS boundary (Figure 5-2). Additional sampling and analyses will continue as part of the Phase II investigation for the Central and Western Pahute Mesa, and
groundwater characterization and modeling activities are ongoing to forecast the extent of offsite contamination over the next 1,000 years (Section 11.1.1.2). The nearest CEMP water monitoring locations downgradient of the NNSS are Amargosa Valley and Beatty, approximately 70 km (43 mi) and 40 km (25 mi), respectively, southwest of Well ER-EC-11.
Community-Based Offsite Monitoring
120 Nevada National Security Site Environmental Report 2018
7.4 References
Committee on the Biological Effects of Ionizing Radiation III, 1980. The Effects on Populations of Exposure to Low Levels of Ionizing Radiation: 1980. National Academy Press, Washington, D.C.
Mission Support and Test Services LLC, 2018. Nevada National Security Site Environmental Report 2017. DOE/NV/03624--0270, Las Vegas, Nevada.
MSTS, see Mission Support and Test Services, LLC.
TPN-11.8.2016. Groundwater Sampling and Analysis for the Nye County Tritium Sampling and Monitoring Program. Test Plan: Nye County Nuclear Waste Repository Project Office, Pahrump, Nevada.
WP-11, 2016. Groundwater Chemistry Sampling and Analysis for the Nye County Tritium Sampling and Monitoring Program. Work Plan: Nye County Nuclear Waste Repository Project Office, Pahrump, Nevada.

Radiological Biota Monitoring
Nevada National Security Site Environmental Report 2018 121
8.0 Ch8
Chapter 8: Radiological Biota Monitoring
Ronald W. Warren
Mission Support and Test Services, LLC
Radiological Biota Monitoring Goals
Collect and analyze biota samples for radionuclides to estimate the potential dose to humans who may consume plants or
game animals from the Nevada National Security Site (NNSS) (see Chapter 9 for the estimates of dose to humans). Collect
and analyze biota samples for radionuclides to estimate the absorbed radiation dose1 to NNSS biota (see Chapter 9 for the
estimates of dose to NNSS plants and animals). Collect and analyze soil samples at the Area 3 and Area 5 Radioactive Waste Management Sites (RWMSs) to provide evidence that the burrowing activities of fossorial animals have or have not
compromised the integrity of the soil-covered waste disposal units.
Historical atmospheric nuclear weapons testing, releases from underground nuclear tests, and radioactive waste disposal sites provide potential sources of radiation contamination and exposure to NNSS plants and animals (biota). U.S. Department of Energy (DOE) Order DOE O 458.1, Radiation Protection of the Public and the
Environment, requires DOE sites to monitor radioactivity in the environment to ensure the public does not receive a radiological dose greater than 100 millirems per year (mrem/yr) from all pathways of exposure, including the ingestion of contaminated plants and animals. DOE O 458.1 also requires monitoring to ensure aquatic and terrestrial plant and animal populations are protected from excessive radiological dose.
The U.S. Department of Energy, National Nuclear Security Administration Nevada Field Office (NNSA/NFO) land use practices on the NNSS discourage the harvest of plants or plant parts (e.g., pine nuts and wolfberries) for direct consumption by humans. Some edible plant material might be taken off site and consumed, but this is generally not allowed and, if it does occur, is very limited. Game animals on the NNSS might travel off the site and become available through hunting for consumption by the public, which makes the ingestion of game animals the primary potential biotic pathway for dose to the public.
Plants and game animals are monitored under the Routine Radiological Environmental Monitoring Plan (RREMP) (Bechtel Nevada 2003). They are sampled annually from contaminated NNSS sites to estimate doses to
persons hypothetically consuming them, to measure the potential for radionuclide transfer through the food chain, and to determine if NNSS biota are exposed to radiation levels harmful to their own populations. Biota and soil samples from the RWMSs are also periodically collected to assess the integrity of waste disposal cells. This chapter describes the biota-monitoring program designed to meet public and environmental radiation protection regulations (Section 2.4) and presents the field sampling and analysis results from 2018. The estimated dose to humans potentially consuming NNSS plants and animals and the dose to biota from these radionuclides are presented in Chapter 9.
8.1 Species Selection
The goal for vegetation monitoring is to sample the plants most likely to have the highest contamination within the NNSS environment. They are generally found inside demarcated radiological areas near the “ground zero” locations of historical aboveground or near-surface nuclear tests. The species selected for sampling represent the most dominant life forms (e.g., trees, shrubs, herbs, or grasses) at these sites. Woody vegetation (i.e., shrubs versus forbs or grasses) is sampled because it is reported to have deeper penetrating roots and potentially higher
concentrations of tritium (3H) (Hunter and Kinnison 1998). Woody vegetation also is a major source of browse
for game animals that might potentially migrate off site. Grasses and forbs are sampled when present because they are also a source of food for wildlife. Plant parts collected for analysis represent new growth over the past year. Pine nuts from singleleaf pinyon pine trees, which may be consumed by humans, are also sampled periodically.
When determining the potential dose to animals, the goal of sampling is to select species that are most exposed and most sensitive to the effects of radiation. In general, mammals and birds are more sensitive to radiation than
1 The definition of word(s) in bold italics may be found by clicking on the word in electronic version or by referencing the Glossary,
Appendix B. To return from the Glossary, right click and select Previous View.
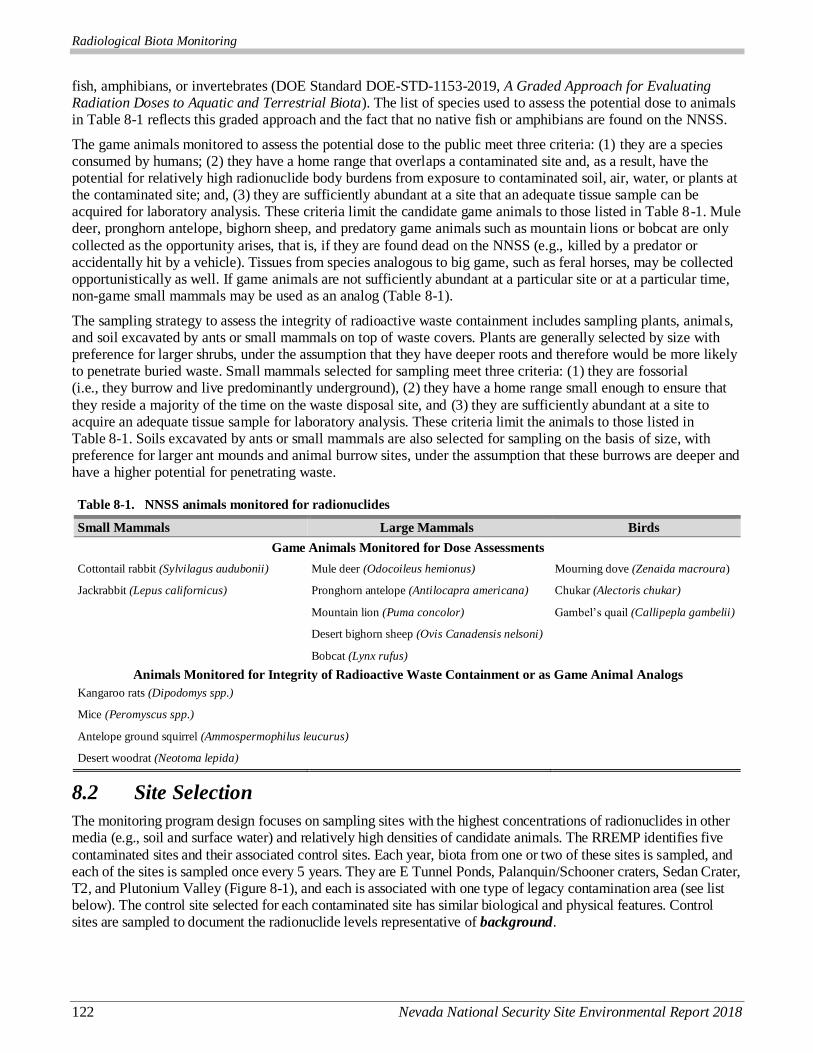
Radiological Biota Monitoring
122 Nevada National Security Site Environmental Report 2018
fish, amphibians, or invertebrates (DOE Standard DOE-STD-1153-2019, A Graded Approach for Evaluating Radiation Doses to Aquatic and Terrestrial Biota). The list of species used to assess the potential dose to animals in Table 8-1 reflects this graded approach and the fact that no native fish or amphibians are found on the NNSS.
The game animals monitored to assess the potential dose to the public meet three criteria: (1) they are a species consumed by humans; (2) they have a home range that overlaps a contaminated site and, as a result, have the potential for relatively high radionuclide body burdens from exposure to contaminated soil, air, water, or plants at the contaminated site; and, (3) they are sufficiently abundant at a site that an adequate tissue sample can be acquired for laboratory analysis. These criteria limit the candidate game animals to those listed in Table 8-1. Mule deer, pronghorn antelope, bighorn sheep, and predatory game animals such as mountain lions or bobcat are only
collected as the opportunity arises, that is, if they are found dead on the NNSS (e.g., killed by a predator or accidentally hit by a vehicle). Tissues from species analogous to big game, such as feral horses, may be collected opportunistically as well. If game animals are not sufficiently abundant at a particular site or at a particular time, non-game small mammals may be used as an analog (Table 8-1).
The sampling strategy to assess the integrity of radioactive waste containment includes sampling plants, animals, and soil excavated by ants or small mammals on top of waste covers. Plants are generally selected by size with preference for larger shrubs, under the assumption that they have deeper roots and therefore would be more likely to penetrate buried waste. Small mammals selected for sampling meet three criteria: (1) they are fossorial (i.e., they burrow and live predominantly underground), (2) they have a home range small enough to ensure that
they reside a majority of the time on the waste disposal site, and (3) they are sufficiently abundant at a site to acquire an adequate tissue sample for laboratory analysis. These criteria limit the animals to those listed in Table 8-1. Soils excavated by ants or small mammals are also selected for sampling on the basis of size, with preference for larger ant mounds and animal burrow sites, under the assumption that these burrows are deeper and have a higher potential for penetrating waste.
Table 8-1. NNSS animals monitored for radionuclides
Small Mammals Large Mammals Birds
Game Animals Monitored for Dose Assessments
Cottontail rabbit (Sylvilagus audubonii) Mule deer (Odocoileus hemionus) Mourning dove (Zenaida macroura)
Jackrabbit (Lepus californicus) Pronghorn antelope (Antilocapra americana) Chukar (Alectoris chukar)
Mountain lion (Puma concolor) Gambel’s quail (Callipepla gambelii)
Desert bighorn sheep (Ovis Canadensis nelsoni)
Bobcat (Lynx rufus)
Animals Monitored for Integrity of Radioactive Waste Containment or as Game Animal Analogs
Kangaroo rats (Dipodomys spp.)
Mice (Peromyscus spp.)
Antelope ground squirrel (Ammospermophilus leucurus)
Desert woodrat (Neotoma lepida)
8.2 Site Selection
The monitoring program design focuses on sampling sites with the highest concentrations of radionuclides in other media (e.g., soil and surface water) and relatively high densities of candidate animals. The RREMP identifies five
contaminated sites and their associated control sites. Each year, biota from one or two of these sites is sampled, and each of the sites is sampled once every 5 years. They are E Tunnel Ponds, Palanquin/Schooner craters, Sedan Crater, T2, and Plutonium Valley (Figure 8-1), and each is associated with one type of legacy contamination area (see list below). The control site selected for each contaminated site has similar biological and physical features. Control sites are sampled to document the radionuclide levels representative of background.
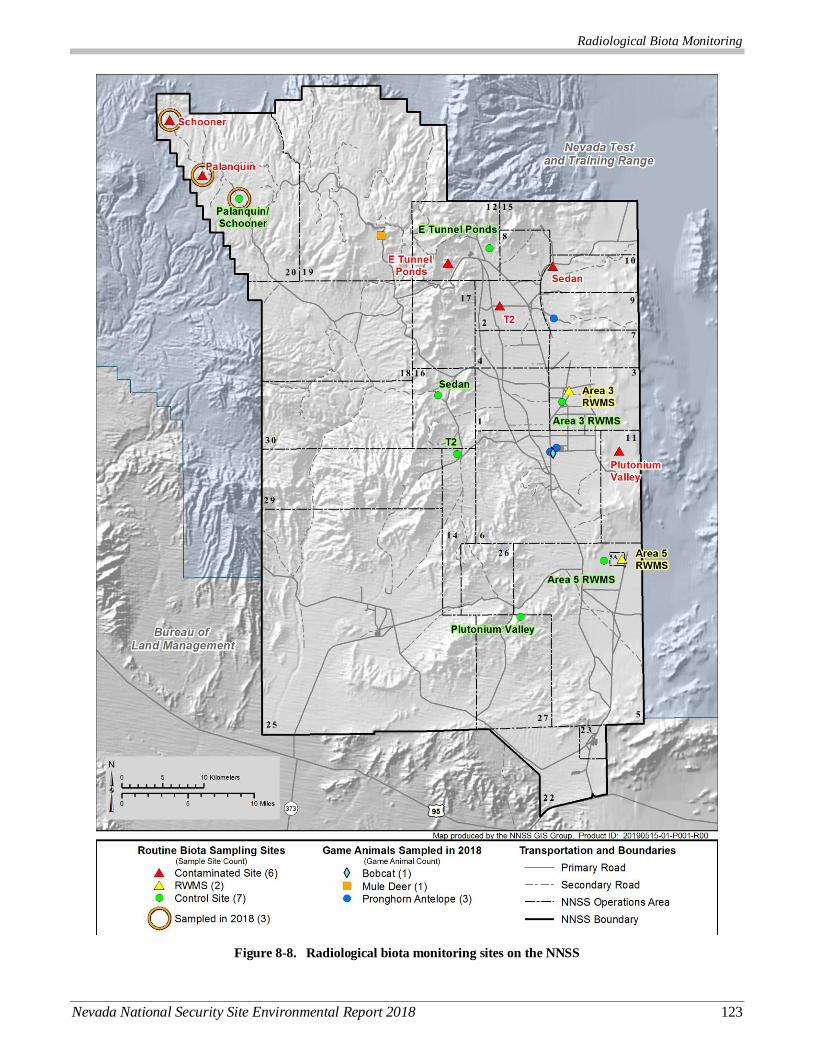
Radiological Biota Monitoring
Nevada National Security Site Environmental Report 2018 123
Figure 8-8. Radiological biota monitoring sites on the NNSS
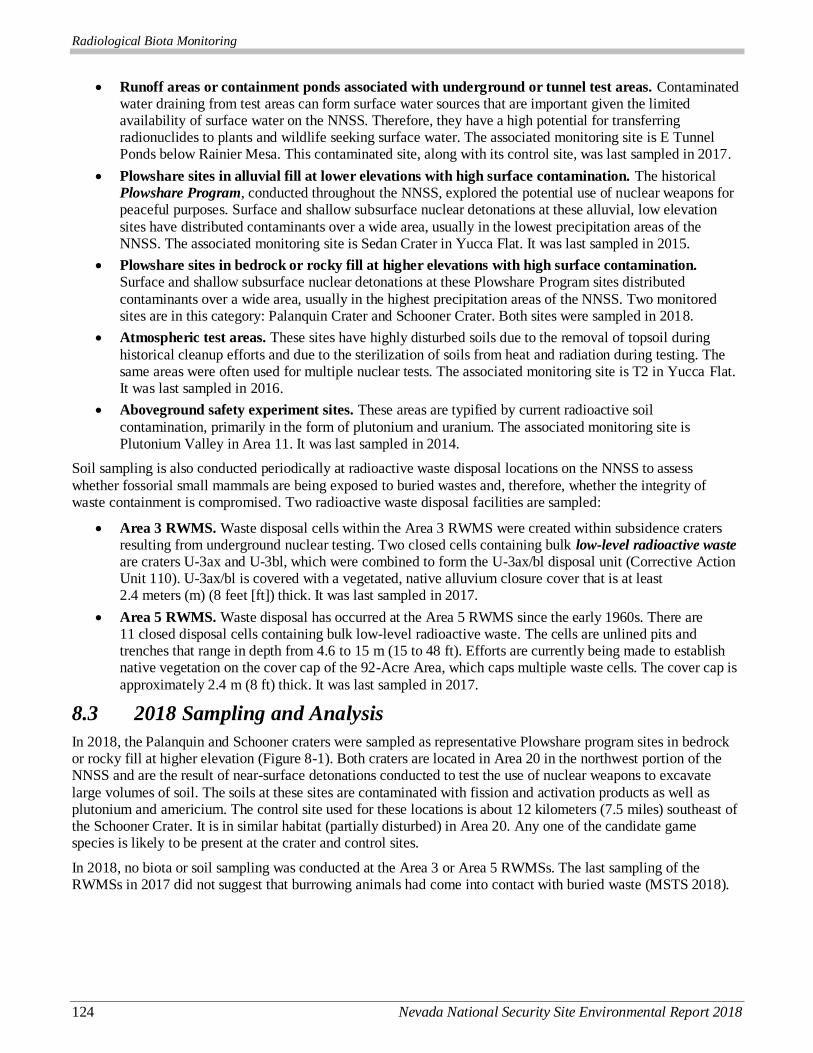
Radiological Biota Monitoring
124 Nevada National Security Site Environmental Report 2018
Runoff areas or containment ponds associated with underground or tunnel test areas. Contaminated water draining from test areas can form surface water sources that are important given the limited availability of surface water on the NNSS. Therefore, they have a high potential for transferring radionuclides to plants and wildlife seeking surface water. The associated monitoring site is E Tunnel Ponds below Rainier Mesa. This contaminated site, along with its control site, was last sampled in 2017.
Plowshare sites in alluvial fill at lower elevations with high surface contamination. The historical Plowshare Program, conducted throughout the NNSS, explored the potential use of nuclear weapons for peaceful purposes. Surface and shallow subsurface nuclear detonations at these alluvial, low elevation
sites have distributed contaminants over a wide area, usually in the lowest precipitation areas of the NNSS. The associated monitoring site is Sedan Crater in Yucca Flat. It was last sampled in 2015.
Plowshare sites in bedrock or rocky fill at higher elevations with high surface contamination. Surface and shallow subsurface nuclear detonations at these Plowshare Program sites distributed
contaminants over a wide area, usually in the highest precipitation areas of the NNSS. Two monitored sites are in this category: Palanquin Crater and Schooner Crater. Both sites were sampled in 2018.
Atmospheric test areas. These sites have highly disturbed soils due to the removal of topsoil during
historical cleanup efforts and due to the sterilization of soils from heat and radiation during testing. The same areas were often used for multiple nuclear tests. The associated monitoring site is T2 in Yucca Flat. It was last sampled in 2016.
Aboveground safety experiment sites. These areas are typified by current radioactive soil
contamination, primarily in the form of plutonium and uranium. The associated monitoring site is Plutonium Valley in Area 11. It was last sampled in 2014.
Soil sampling is also conducted periodically at radioactive waste disposal locations on the NNSS to assess
whether fossorial small mammals are being exposed to buried wastes and, therefore, whether the integrity of waste containment is compromised. Two radioactive waste disposal facilities are sampled:
Area 3 RWMS. Waste disposal cells within the Area 3 RWMS were created within subsidence craters resulting from underground nuclear testing. Two closed cells containing bulk low-level radioactive waste are craters U-3ax and U-3bl, which were combined to form the U-3ax/bl disposal unit (Corrective Action Unit 110). U-3ax/bl is covered with a vegetated, native alluvium closure cover that is at least 2.4 meters (m) (8 feet [ft]) thick. It was last sampled in 2017.
Area 5 RWMS. Waste disposal has occurred at the Area 5 RWMS since the early 1960s. There are 11 closed disposal cells containing bulk low-level radioactive waste. The cells are unlined pits and trenches that range in depth from 4.6 to 15 m (15 to 48 ft). Efforts are currently being made to establish native vegetation on the cover cap of the 92-Acre Area, which caps multiple waste cells. The cover cap is
approximately 2.4 m (8 ft) thick. It was last sampled in 2017.
8.3 2018 Sampling and Analysis
In 2018, the Palanquin and Schooner craters were sampled as representative Plowshare program sites in bedrock or rocky fill at higher elevation (Figure 8-1). Both craters are located in Area 20 in the northwest portion of the NNSS and are the result of near-surface detonations conducted to test the use of nuclear weapons to excavate
large volumes of soil. The soils at these sites are contaminated with fission and activation products as well as plutonium and americium. The control site used for these locations is about 12 kilometers (7.5 miles) southeast of the Schooner Crater. It is in similar habitat (partially disturbed) in Area 20. Any one of the candidate game species is likely to be present at the crater and control sites.
In 2018, no biota or soil sampling was conducted at the Area 3 or Area 5 RWMSs. The last sampling of the RWMSs in 2017 did not suggest that burrowing animals had come into contact with buried waste (MSTS 2018).
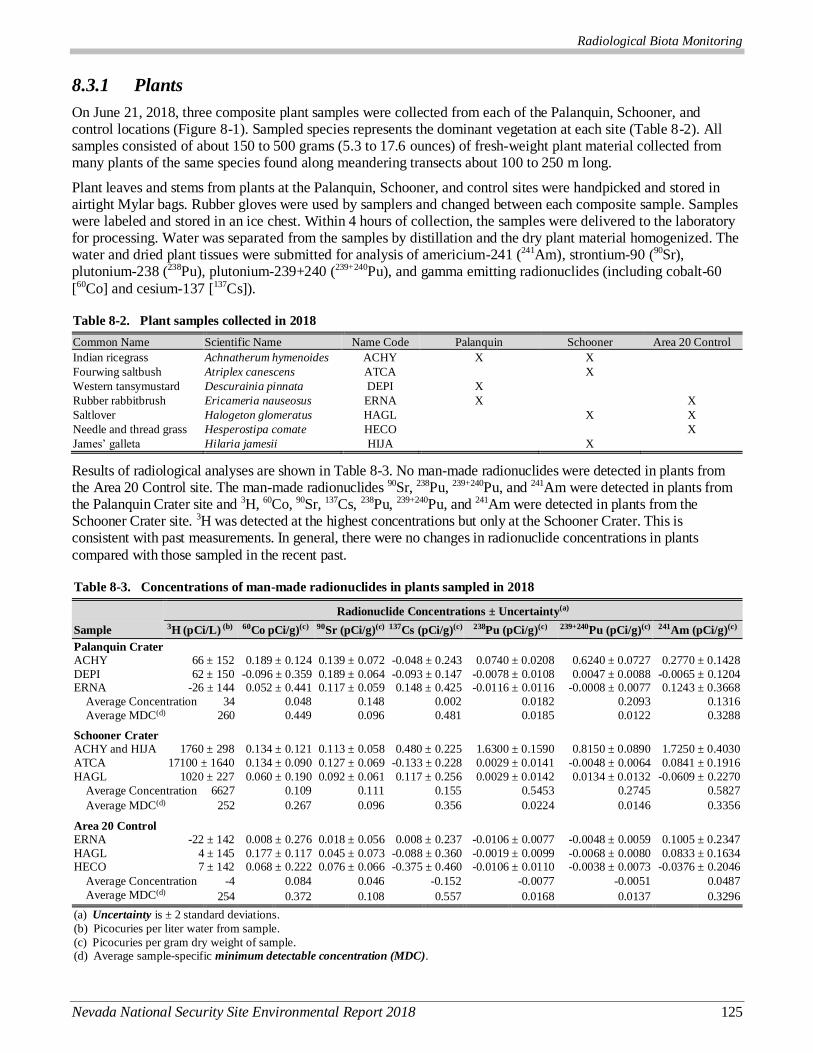
Radiological Biota Monitoring
Nevada National Security Site Environmental Report 2018 125
8.3.1 Plants
On June 21, 2018, three composite plant samples were collected from each of the Palanquin, Schooner, and control locations (Figure 8-1). Sampled species represents the dominant vegetation at each site (Table 8-2). All samples consisted of about 150 to 500 grams (5.3 to 17.6 ounces) of fresh-weight plant material collected from many plants of the same species found along meandering transects about 100 to 250 m long.
Plant leaves and stems from plants at the Palanquin, Schooner, and control sites were handpicked and stored in airtight Mylar bags. Rubber gloves were used by samplers and changed between each composite sample. Samples were labeled and stored in an ice chest. Within 4 hours of collection, the samples were delivered to the laboratory for processing. Water was separated from the samples by distillation and the dry plant material homogenized. The water and dried plant tissues were submitted for analysis of americium-241 (241Am), strontium-90 (90Sr), plutonium-238 (238Pu), plutonium-239+240 (239+240Pu), and gamma emitting radionuclides (including cobalt-60
[60Co] and cesium-137 [137Cs]).
Table 8-2. Plant samples collected in 2018
Common Name Scientific Name Name Code Palanquin Schooner Area 20 Control
Indian ricegrass Achnatherum hymenoides ACHY X X
Fourwing saltbush Atriplex canescens ATCA X
Western tansymustard Descurainia pinnata DEPI X
Rubber rabbitbrush Ericameria nauseosus ERNA X X
Saltlover Halogeton glomeratus HAGL X X
Needle and thread grass Hesperostipa comate HECO X
James’ galleta Hilaria jamesii HIJA X
Results of radiological analyses are shown in Table 8-3. No man-made radionuclides were detected in plants from the Area 20 Control site. The man-made radionuclides 90Sr, 238Pu, 239+240Pu, and 241Am were detected in plants from the Palanquin Crater site and 3H, 60Co, 90Sr, 137Cs, 238Pu, 239+240Pu, and 241Am were detected in plants from the Schooner Crater site. 3H was detected at the highest concentrations but only at the Schooner Crater. This is consistent with past measurements. In general, there were no changes in radionuclide concentrations in plants
compared with those sampled in the recent past.
Table 8-3. Concentrations of man-made radionuclides in plants sampled in 2018
Radionuclide Concentrations ± Uncertainty(a)
Sample 3H (pCi/L) (b) 60Co pCi/g)(c) 90Sr (pCi/g)(c) 137Cs (pCi/g)(c) 238Pu (pCi/g)(c) 239+240Pu (pCi/g)(c) 241Am (pCi/g)(c)
Palanquin Crater ACHY 66 ± 152 0.189 ± 0.124 0.139 ± 0.072 -0.048 ± 0.243 0.0740 ± 0.0208 0.6240 ± 0.0727 0.2770 ± 0.1428
DEPI 62 ± 150 -0.096 ± 0.359 0.189 ± 0.064 -0.093 ± 0.147 -0.0078 ± 0.0108 0.0047 ± 0.0088 -0.0065 ± 0.1204 ERNA -26 ± 144 0.052 ± 0.441 0.117 ± 0.059 0.148 ± 0.425 -0.0116 ± 0.0116 -0.0008 ± 0.0077 0.1243 ± 0.3668
Average Concentration 34 0.048 0.148 0.002 0.0182 0.2093 0.1316
Average MDC(d) 260 0.449 0.096 0.481 0.0185 0.0122 0.3288
Schooner Crater ACHY and HIJA 1760 ± 298 0.134 ± 0.121 0.113 ± 0.058 0.480 ± 0.225 1.6300 ± 0.1590 0.8150 ± 0.0890 1.7250 ± 0.4030
ATCA 17100 ± 1640 0.134 ± 0.090 0.127 ± 0.069 -0.133 ± 0.228 0.0029 ± 0.0141 -0.0048 ± 0.0064 0.0841 ± 0.1916
HAGL 1020 ± 227 0.060 ± 0.190 0.092 ± 0.061 0.117 ± 0.256 0.0029 ± 0.0142 0.0134 ± 0.0132 -0.0609 ± 0.2270
Average Concentration 6627 0.109 0.111 0.155 0.5453 0.2745 0.5827
Average MDC(d) 252 0.267 0.096 0.356 0.0224 0.0146 0.3356
Area 20 Control ERNA -22 ± 142 0.008 ± 0.276 0.018 ± 0.056 0.008 ± 0.237 -0.0106 ± 0.0077 -0.0048 ± 0.0059 0.1005 ± 0.2347
HAGL 4 ± 145 0.177 ± 0.117 0.045 ± 0.073 -0.088 ± 0.360 -0.0019 ± 0.0099 -0.0068 ± 0.0080 0.0833 ± 0.1634 HECO 7 ± 142 0.068 ± 0.222 0.076 ± 0.066 -0.375 ± 0.460 -0.0106 ± 0.0110 -0.0038 ± 0.0073 -0.0376 ± 0.2046
Average Concentration -4 0.084 0.046 -0.152 -0.0077 -0.0051 0.0487
Average MDC(d) 254 0.372 0.108 0.557 0.0168 0.0137 0.3296
(a) Uncertainty is ± 2 standard deviations.
(b) Picocuries per liter water from sample.
(c) Picocuries per gram dry weight of sample. (d) Average sample-specific minimum detectable concentration (MDC).
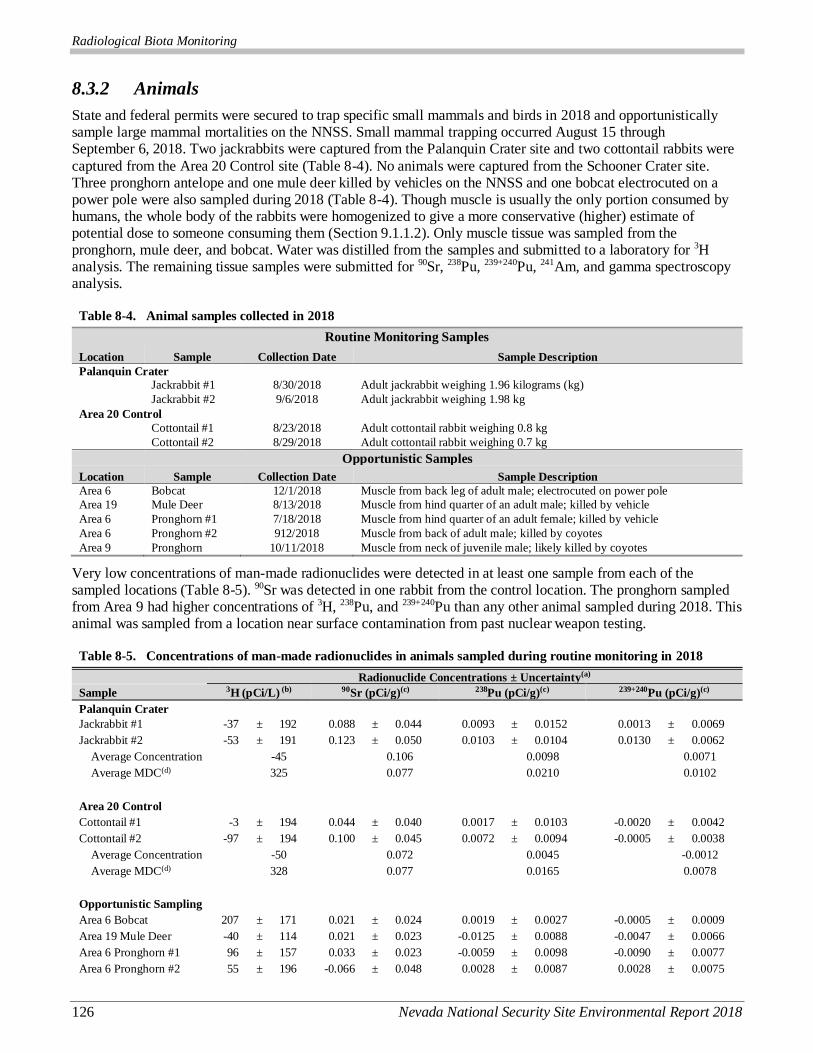
Radiological Biota Monitoring
126 Nevada National Security Site Environmental Report 2018
8.3.2 Animals
State and federal permits were secured to trap specific small mammals and birds in 2018 and opportunistically sample large mammal mortalities on the NNSS. Small mammal trapping occurred August 15 through September 6, 2018. Two jackrabbits were captured from the Palanquin Crater site and two cottontail rabbits were
captured from the Area 20 Control site (Table 8-4). No animals were captured from the Schooner Crater site. Three pronghorn antelope and one mule deer killed by vehicles on the NNSS and one bobcat electrocuted on a power pole were also sampled during 2018 (Table 8-4). Though muscle is usually the only portion consumed by humans, the whole body of the rabbits were homogenized to give a more conservative (higher) estimate of potential dose to someone consuming them (Section 9.1.1.2). Only muscle tissue was sampled from the pronghorn, mule deer, and bobcat. Water was distilled from the samples and submitted to a laboratory for 3H analysis. The remaining tissue samples were submitted for 90Sr, 238Pu, 239+240Pu, 241Am, and gamma spectroscopy analysis.
Table 8-4. Animal samples collected in 2018
Routine Monitoring Samples
Location Sample Collection Date Sample Description
Palanquin Crater
Jackrabbit #1 8/30/2018 Adult jackrabbit weighing 1.96 kilograms (kg)
Jackrabbit #2 9/6/2018 Adult jackrabbit weighing 1.98 kg
Area 20 Control
Cottontail #1 8/23/2018 Adult cottontail rabbit weighing 0.8 kg
Cottontail #2 8/29/2018
Adult cottontail rabbit weighing 0.7 kg
Opportunistic Samples
Location Sample Collection Date Sample Description
Area 6 Bobcat 12/1/2018 Muscle from back leg of adult male; electrocuted on power pole
Area 19 Mule Deer 8/13/2018 Muscle from hind quarter of an adult male; killed by vehicle
Area 6 Pronghorn #1 7/18/2018 Muscle from hind quarter of an adult female; killed by vehicle
Area 6 Pronghorn #2 912/2018 Muscle from back of adult male; killed by coyotes
Area 9 Pronghorn 10/11/2018 Muscle from neck of juvenile male; likely killed by coyotes
Very low concentrations of man-made radionuclides were detected in at least one sample from each of the sampled locations (Table 8-5). 90Sr was detected in one rabbit from the control location. The pronghorn sampled from Area 9 had higher concentrations of 3H, 238Pu, and 239+240Pu than any other animal sampled during 2018. This animal was sampled from a location near surface contamination from past nuclear weapon testing.
Table 8-5. Concentrations of man-made radionuclides in animals sampled during routine monitoring in 2018
Radionuclide Concentrations ± Uncertainty(a)
Sample 3H (pCi/L) (b) 90Sr (pCi/g)(c) 238Pu (pCi/g)(c) 239+240Pu (pCi/g)(c)
Palanquin Crater
Jackrabbit #1 -37 ± 192 0.088 ± 0.044 0.0093 ± 0.0152 0.0013 ± 0.0069
Jackrabbit #2 -53 ± 191 0.123 ± 0.050 0.0103 ± 0.0104 0.0130 ± 0.0062
Average Concentration -45 0.106 0.0098 0.0071
Average MDC(d) 325 0.077 0.0210 0.0102
Area 20 Control
Cottontail #1 -3 ± 194 0.044 ± 0.040 0.0017 ± 0.0103 -0.0020 ± 0.0042
Cottontail #2 -97 ± 194 0.100 ± 0.045 0.0072 ± 0.0094 -0.0005 ± 0.0038
Average Concentration -50 0.072 0.0045 -0.0012
Average MDC(d) 328 0.077 0.0165 0.0078
Opportunistic Sampling
Area 6 Bobcat 207 ± 171 0.021 ± 0.024 0.0019 ± 0.0027 -0.0005 ± 0.0009
Area 19 Mule Deer -40 ± 114 0.021 ± 0.023 -0.0125 ± 0.0088 -0.0047 ± 0.0066
Area 6 Pronghorn #1 96 ± 157 0.033 ± 0.023 -0.0059 ± 0.0098 -0.0090 ± 0.0077
Area 6 Pronghorn #2 55 ± 196 -0.066 ± 0.048 0.0028 ± 0.0087 0.0028 ± 0.0075
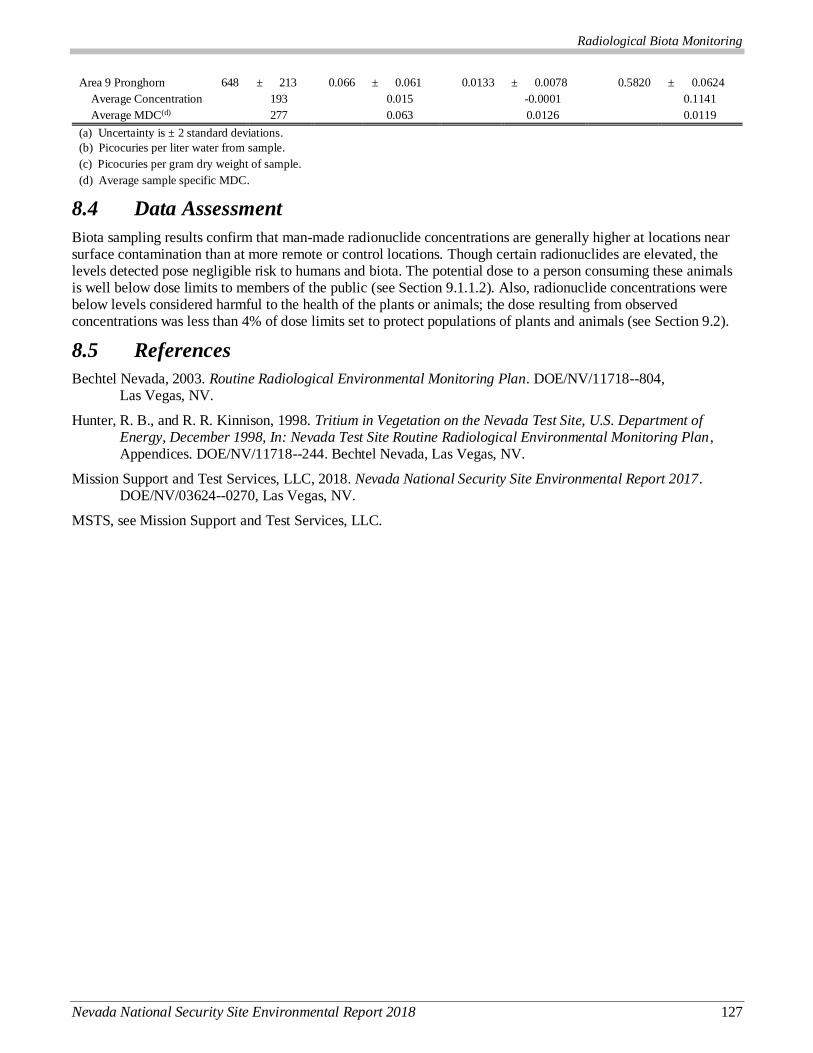
Radiological Biota Monitoring
Nevada National Security Site Environmental Report 2018 127
Area 9 Pronghorn 648 ± 213 0.066 ± 0.061 0.0133 ± 0.0078 0.5820 ± 0.0624
Average Concentration 193 0.015 -0.0001 0.1141
Average MDC(d) 277 0.063 0.0126 0.0119
(a) Uncertainty is ± 2 standard deviations.
(b) Picocuries per liter water from sample.
(c) Picocuries per gram dry weight of sample.
(d) Average sample specific MDC.
8.4 Data Assessment
Biota sampling results confirm that man-made radionuclide concentrations are generally higher at locations near surface contamination than at more remote or control locations. Though certain radionuclides are elevated, the levels detected pose negligible risk to humans and biota. The potential dose to a person consuming these animals is well below dose limits to members of the public (see Section 9.1.1.2). Also, radionuclide concentrations were below levels considered harmful to the health of the plants or animals; the dose resulting from observed concentrations was less than 4% of dose limits set to protect populations of plants and animals (see Section 9.2).
8.5 References
Bechtel Nevada, 2003. Routine Radiological Environmental Monitoring Plan. DOE/NV/11718--804, Las Vegas, NV.
Hunter, R. B., and R. R. Kinnison, 1998. Tritium in Vegetation on the Nevada Test Site, U.S. Department of Energy, December 1998, In: Nevada Test Site Routine Radiological Environmental Monitoring Plan , Appendices. DOE/NV/11718--244. Bechtel Nevada, Las Vegas, NV.
Mission Support and Test Services, LLC, 2018. Nevada National Security Site Environmental Report 2017. DOE/NV/03624--0270, Las Vegas, NV.
MSTS, see Mission Support and Test Services, LLC.

Radiological Biota Monitoring
128 Nevada National Security Site Environmental Report 2018
THIS PAGE INTENTIONALLY LEFT BLANK

Radiological Dose Assessment
Nevada National Security Site Environmental Report 2018 129
9.0 Ch9
Chapter 9: Radiological Dose Assessment
Ronald W. Warren and Jeffrey C. Smith
Mission Support and Test Services, LLC
Radiological Dose Assessment Goals
Determine if the maximum radiation dose to a member of the general public from airborne radionuclide emissions at the
Nevada National Security Site (NNSS) complies with the Clean Air Act, National Emission Standards for Hazardous Air
Pollutants (NESHAP) limit of 10 millirems per year (mrem/yr) (0.1 millisieverts per year [mSv/yr]). Determine if radiation
levels from the Radioactive Waste Management Sites (RWMSs) comply with the 25 mrem/yr (0.25 mSv/yr) dose limit to members of the public as specified in U.S. Department of Energy (DOE) Manual DOE M 435.1-1, Radioactive Waste
Management Manual. Determine if the total radiation dose (total effective dose equivalent [TEDE]) to a member of the
general public from all possible pathways (direct exposure, inhalation, ingestion of water and food) as a result of NNSS
operations complies with the limit of 100 mrem/yr (1 mSv/yr) established by DOE Order DOE O 458.1, Radiation Protection
of the Public and the Environment. Determine if the radiation dose (in a unit of measure called a rad) to NNSS biota
complies with the following limits set by DOE Standard DOE-STD-1153-2019, A Graded Approach for Evaluating Radiation
Doses to Aquatic and Terrestrial Biota.
The U.S. Department of Energy requires DOE facilities to estimate the radiological dose1 to the general public and to plants and animals in the environment caused by past or present facility operations. These requirements are specified in DOE O 458.1 and in DOE O 435.1, Radioactive Waste Management (Table 2-1). To estimate these radiological doses, radionuclide concentration data gathered on the NNSS are used along with dose conversion factors published in DOE-STD-1196-2011, Derived Concentration Technical Standard. The dose conversion
factors take into account the different population fractions of age and sex to give representative dose coefficients for a reference person within the U.S. population. The 2018 data are presented in Chapters 4, 5, 6, and 8 of this report, and include the results for onsite monitoring of air, water, direct radiation, and biota, and for offsite monitoring of groundwater. The independent offsite air and groundwater data presented in Chapter 7, Community-Based Offsite Monitoring, provide extra assurance to the public that estimated doses do not underestimate potential offsite exposures to NNSS-related radiation. The specific goals for the dose assessment component of radiological monitoring are described below.
9.1 Dose to the Public
This section identifies the possible pathways by which the public could be exposed to radionuclides present in the environment due to past or current NNSS activities. It describes how field-monitoring data are used with other NNSS data sources (e.g., radionuclide inventory data) to provide input to the dose estimates, and presents the estimated 2018 public dose attributable to U.S. Department of Energy, National Nuclear Security Administration Nevada Field Office (NNSA/NFO) activities from each pathway and from all pathways combined. The public
dose due to radioactive waste operations on the NNSS is also assessed, and a description of the program that controls the release of NNSS materials having residual radioactivity into the public domain is provided.
9.1.1 Dose from Possible Exposure Pathways
As prescribed in the Routine Radiological Environmental Monitoring Plan (Bechtel Nevada [BN] 2003), air, groundwater, and biota are routinely sampled to document the amount of radioactivity in these media and to provide data to assess the radiation dose received by the general public from several pathways.
The potential pathways by which a member of the general public residing off site might receive a radiation dose resulting from past or present NNSS operations include the following:
Inhalation of, ingestion of, or direct external exposure to airborne radionuclide emissions transported off site by wind
1 The definition of word(s) in bold italics may be found by clicking on the word in electronic version or by referencing the Glossary,
Appendix B. To return from the Glossary, right click and select Previous View.
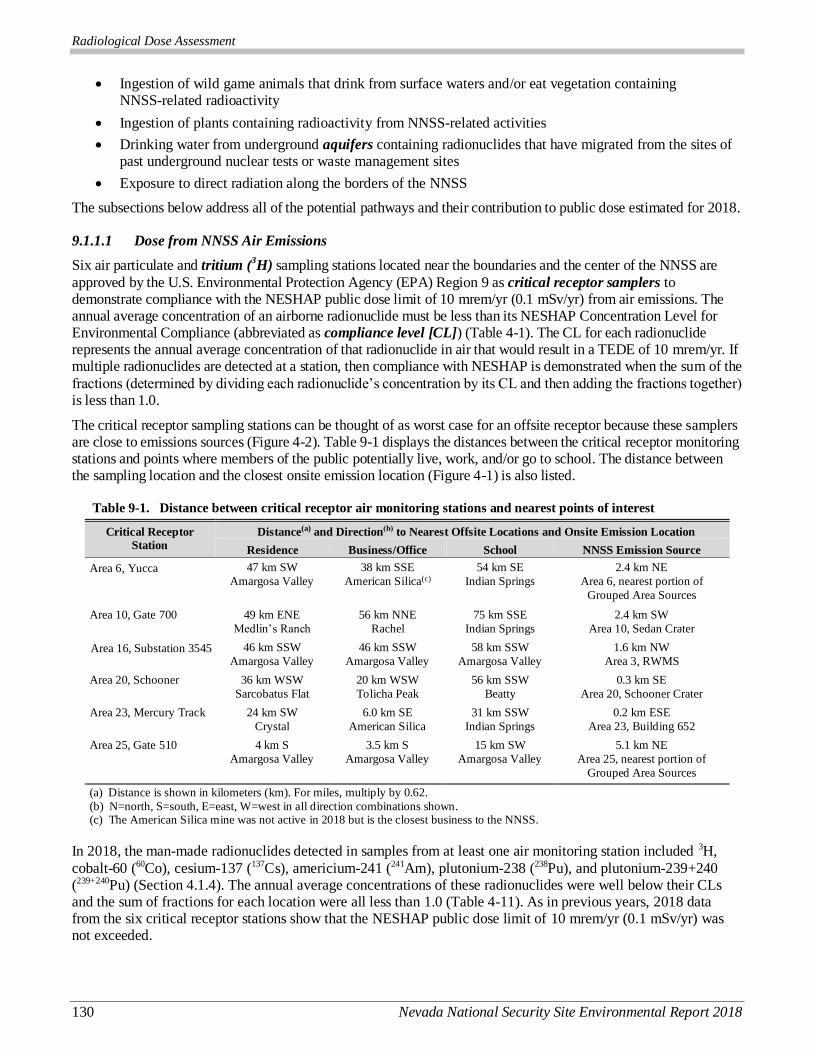
Radiological Dose Assessment
130 Nevada National Security Site Environmental Report 2018
Ingestion of wild game animals that drink from surface waters and/or eat vegetation containing NNSS-related radioactivity
Ingestion of plants containing radioactivity from NNSS-related activities
Drinking water from underground aquifers containing radionuclides that have migrated from the sites of past underground nuclear tests or waste management sites
Exposure to direct radiation along the borders of the NNSS
The subsections below address all of the potential pathways and their contribution to public dose estimated for 2018.
9.1.1.1 Dose from NNSS Air Emissions
Six air particulate and tritium (3H) sampling stations located near the boundaries and the center of the NNSS are
approved by the U.S. Environmental Protection Agency (EPA) Region 9 as critical receptor samplers to demonstrate compliance with the NESHAP public dose limit of 10 mrem/yr (0.1 mSv/yr) from air emissions. The annual average concentration of an airborne radionuclide must be less than its NESHAP Concentration Level for Environmental Compliance (abbreviated as compliance level [CL]) (Table 4-1). The CL for each radionuclide represents the annual average concentration of that radionuclide in air that would result in a TEDE of 10 mrem/yr. If multiple radionuclides are detected at a station, then compliance with NESHAP is demonstrated when the sum of the
fractions (determined by dividing each radionuclide’s concentration by its CL and then adding the fractions together) is less than 1.0.
The critical receptor sampling stations can be thought of as worst case for an offsite receptor because these samplers are close to emissions sources (Figure 4-2). Table 9-1 displays the distances between the critical receptor monitoring stations and points where members of the public potentially live, work, and/or go to school. The distance between the sampling location and the closest onsite emission location (Figure 4-1) is also listed.
Table 9-1. Distance between critical receptor air monitoring stations and nearest points of interest
Critical Receptor
Station Distance(a) and Direction(b) to Nearest Offsite Locations and Onsite Emission Location
Residence Business/Office School NNSS Emission Source
Area 6, Yucca 47 km SW
Amargosa Valley
38 km SSE
American Silica(c)
54 km SE
Indian Springs
2.4 km NE
Area 6, nearest portion of
Grouped Area Sources
Area 10, Gate 700 49 km ENE
Medlin’s Ranch
56 km NNE
Rachel
75 km SSE
Indian Springs
2.4 km SW
Area 10, Sedan Crater
Area 16, Substation 3545 46 km SSW
Amargosa Valley
46 km SSW
Amargosa Valley
58 km SSW
Amargosa Valley
1.6 km NW
Area 3, RWMS
Area 20, Schooner 36 km WSW
Sarcobatus Flat
20 km WSW
Tolicha Peak
56 km SSW
Beatty
0.3 km SE
Area 20, Schooner Crater
Area 23, Mercury Track 24 km SW
Crystal
6.0 km SE
American Silica
31 km SSW
Indian Springs
0.2 km ESE
Area 23, Building 652
Area 25, Gate 510 4 km S
Amargosa Valley
3.5 km S
Amargosa Valley
15 km SW
Amargosa Valley
5.1 km NE
Area 25, nearest portion of
Grouped Area Sources
(a) Distance is shown in kilometers (km). For miles, multiply by 0.62. (b) N=north, S=south, E=east, W=west in all direction combinations shown. (c) The American Silica mine was not active in 2018 but is the closest business to the NNSS.
In 2018, the man-made radionuclides detected in samples from at least one air monitoring station included 3H,
cobalt-60 (60Co), cesium-137 (137Cs), americium-241 (241Am), plutonium-238 (238Pu), and plutonium-239+240 (239+240Pu) (Section 4.1.4). The annual average concentrations of these radionuclides were well below their CLs and the sum of fractions for each location were all less than 1.0 (Table 4-11). As in previous years, 2018 data from the six critical receptor stations show that the NESHAP public dose limit of 10 mrem/yr (0.1 mSv/yr) was not exceeded.
Radiological Dose Assessment
Nevada National Security Site Environmental Report 2018 131
The radioactive air emissions from each 2018 NNSS source were modeled using the Clean Air Package, 1988, model (CAP88, Version 4.0; EPA 2014). The highest value (0.07 mrem/yr [0.0007 MSv/yr]) is predicted to be a person residing at the north end of Amargosa Valley. More detailed information regarding the estimation of the
dose to the public from airborne radioactivity in 2018 from all activities conducted by NNSA/NFO on the NNSS and its Nevada support facilities is reported in Mission Support and Test Services, LLC (MSTS) (2019).
9.1.1.2 Dose from Ingestion of Game Animals from the NNSS
Three game species, mule deer, bighorn sheep, and mourning doves, have been shown to travel off the NNSS and be available to hunters (Giles and Cooper 1985; Hall and Perry 2019; National Security Technologies, LLC [NSTec] 2009). Because of this, game animals on the NNSS are sampled annually near known radiologically contaminated areas to give conservative (worst-case) estimates of the level of radionuclides that hunters may consume if these animals are harvested off the NNSS. In 2018, the following animals were sampled (Figure 8-1
and Tables 8-4, and 8-5):
Two jackrabbits from near the Area 20 Palanquin Crater
Two cottontail rabbits sampled from a control location in Area 20
One bobcat electrocuted on a power pole in Area 6
One mule deer killed by a vehicle in Area 19
Three pronghorn, one killed by a vehicle (Pronghorn #1 in Area 6) and two killed by coyotes (Pronghorn #2 in Area 6 and one pronghorn in Area 9)
The potential committed effective dose equivalent (CEDE) to an individual from consuming game animals was calculated for each animal sampled in 2018. The following assumption/parameters were used to estimate dose:
Analysis results from all samples were included in calculating dose from consuming a particular species as long as the radionuclide was detected, i.e., the analysis result was above the minimum detectable
concentration, in at least one sample of that species at a particular location. The opportunistic samples are grouped as all being from the same location (NNSS) for this assessment.
If the analytical result for a radionuclide concentration in the sample was a negative value (resulting from a background measurement higher than what was observed in the sample), then the concentration for that sample was set to zero.
An individual consumes one of each species of animal sampled during the year: one jackrabbit (513 grams [g]), one cottontail rabbit (167 g), one bobcat (9.6 kilograms [kg]), one mule deer (35.4 kg), and one pronghorn antelope (20.0 kg).
The moisture content of the muscle tissue samples of all species is 73%.
Dose coefficients for a reference person as defined by DOE-STD-1196-2011 are used; they are for a
hypothetical person representing an aggregate of individuals in the U.S. population.
The entire committed dose is considered to be received during the calendar year.
Dose coefficients (mrem per picocurie [pCi] ingested), based on values listed in DOE-STD-1196-2011, were multiplied by the amount of radioactivity (pCi) potentially ingested to obtain the potential dose (CEDE) (Table 9-2). The average and maximum CEDEs for each monitored location and for each animal species are presented in Table 9-2. Based on the 2018 samples, an individual who consumes one animal of each sampled species from
each location (where opportunistic large game samples were considered to be from one location, i.e., the entire NNSS) may receive an estimated dose of 4.5 mrem (0.045 mSv) based on the averages. To put this dose in perspective, the dose from naturally occurring cosmic radiation received during a 2-hour airplane flight at 39,000 feet is about 1 mrem (0.01 mSv). From consuming just one animal, the maximum would come from the pronghorn sampled in Area 9 (Table 8-5), and would result in a dose of 12.9 mrem (0.129 mSv).

Radiological Dose Assessment
132 Nevada National Security Site Environmental Report 2018
Table 9-2. Hypothetical CEDE from ingesting game animals sampled in 2018
Committed Effective Dose Equivalent (mrem)(a)
Location
Samples Sample Location 3H (b) 90Sr 238Pu 239+240Pu Total Average Max Area 20 Palanquin
Jackrabbit #1 0.0000 0.0060 0.0047 0.0007 0.0114 0.0160 0.0207
Jackrabbit #2 0.0000 0.0084 0.0051 0.0071 0.0207 -- -- Area 20 Control
Cottontail #1 0.0000 0.0010 0.0003 0.0000 0.0013 0.0023 0.0034 Cottontail #2 0.0000 0.0022 0.0012 0.0000 0.0034 --
Opportunistic samples from natural mortality or accidental road kills: Species
Samples Sample Location 3H (b) 90Sr 238Pu 239+240Pu Total Average Max
Bobcat Area 6 0.0001 0.0270 0.0176 0.0000 0.0447 0.0447 0.0447 Mule Deer Area 19 0.0000 0.0994 0.0000 0.0000 0.0994 0.9994 0.0994
Pronghorn #1 Area 6 0.0001 0.0889 0.0000 0.0000 0.0890 4.3570 12.8687
Pronghorn #2 Area 6 0.0001 0.0000 0.0540 0.0592 0.1133 -- --
Pronghorn Area 9 0.0007 0.1770 0.2594 12.4315 12.8687 -- --
CEDE from consuming one animal of each species and location = 4.5 mrem (using averages) and 13.0 mrem (using maximums )
(a) Based on dose coefficients in Appendix A of DOE-STD-2011 for a Reference Person.
(b) Based on assumption that the water content of all muscle tissue samples is 73%.
A person may consume animals from locations on the NNSS other than where samples were collected in 2018; therefore, Table 9-3 presents the maximum CEDE for humans consuming various species of wildlife from all
animals sampled from 2001–2018. While it is possible that someone could consume an animal from the NNSS, the probability is low. Table 9-3 gives a worst-case scenario based on radionuclide analyses of NNSS game animal samples over the past 18 years.
The highest CEDE from consuming just one animal (12.9 mrem or 0.129 mSv) would be from the pronghorn sampled in 2018 from Area 9 (Table 9-3). This represents 12.9% of the annual dose limit for members of the public.
Table 9-3. Maximum CEDEs to a person hypothetically ingesting NNSS game animals sampled from 2001--2018
Game Animal Sample Location Year
Sampled
Amount
Consumed
CEDE for
Consumption
of One Animal
(mrem)
Bighorn Sheep Area 25 (captured study animal) 2015 all muscle 0.170
Bobcat Area 25 (roadkill) 2012 all muscle 0.032 Chuckar Area 12 (E-Tunnel) 2001 breast muscle 0.006
Cottontail Rabbit Area 20 (Schooner Crater) 2013 whole body 0.032
Gambel’s Quail Area 2 (T2) 2002 all muscle 0.004
Jackrabbit Area 10 (Sedan) 2015 all muscle 1.298
Mountain Lion Nevada Test and Training Range (natural mortality of study
lion NNSS4) 2013 all muscle 0.095
Mourning Dove Area 20 (Palanquin control but likely from sump of Well U-20n) 2003 breast muscle 0.032
Mule Deer Area 19 (killed by a mountain lion) 2014 all muscle 3.228 Pronghorn Area 9 (likely killed by coyotes) 2018 all muscle 12.869
9.1.1.3 Dose from Ingestion of Plants from the NNSS
Current NNSS land-use practices discourage the harvest of plants or plant parts for direct consumption by humans. However, it is possible that individuals with access will collect and consume edible plant material. One species in particular, the pinyon pine tree, produces pine nuts that are harvested and consumed across the western United States. Pinyon pine trees grow throughout regions of higher elevation on the NNSS. In 2013, pine nuts were sampled from three locations on the NNSS (Area 15, Area 17, and in Area 12 near the E Tunnel Ponds). The estimated dose
from consuming them was shown to be extremely low (0.00056 mrem or 0.0000056 mSv) and a negligible contribution to the total potential dose to a member of the public (NSTec 2014). No other edible plant materials have been collected for analysis on the NNSS in recent history, and no edible plants were sampled in 2018.
Radiological Dose Assessment
Nevada National Security Site Environmental Report 2018 133
9.1.1.4 Dose from Drinking Contaminated Groundwater
The 2018 groundwater monitoring data indicate that groundwater from offsite private and community wells and springs has not been impacted by past NNSS nuclear testing operations (Sections 5.1.3.5, 7.2, and 7.3). No man-made radionuclides have been detected in any sampled wells accessible to the offsite public or in sampled private wells or springs. These field monitoring data also agree with the forecasts of current groundwater flow and contaminant transport models discussed in Chapter 11 (Section 11.1). Therefore, drinking water from underground
aquifers containing radionuclides is not a possible pathway of exposure to the public residing off site.
9.1.1.5 Dose from Direct Radiation Exposure along NNSS Borders
The direct exposure pathway from gamma radiation to the public is monitored routinely (Chapter 6). In 2018, the only place where the public had the potential to be exposed to direct radiation from NNSS operations was at Gate 100, the primary entrance to the site on the southern NNSS border. Trucks hauling radioactive materials, primarily low-level waste (LLW) being shipped for disposal at the Area 5 RWMS, park outside Gate 100 while waiting for entry approval. Only during these times is there a potential for exposure to the public due to NNSS
activities. However, no member of the public resides or remains full-time at the Gate 100 truck parking area. Therefore, dose from direct radiation is not included as a current pathway of exposure to the public residing off site.
9.1.2 Dose from Waste Operations
DOE M 435.1-1 states that LLW disposal facilities shall be operated, maintained, and closed so that a reasonable expectation exists that annual dose to members of the public shall not exceed 10 mrem through the air pathway and 25 mrem through all pathways for a 1,000-year compliance period after closure of the disposal units. Given that the RWMSs are located well within the NNSS boundaries and public access is limited (e.g., tours), members of the public have access only for brief periods. However, for purposes of documenting potential impacts, the
pathways for radionuclide movement from waste disposal facilities are monitored.
In 2018, external radiation from waste operations measured near the boundaries of the Area 3 and Area 5 RWMSs could not be distinguished from background levels at those locations (Section 6.3.4). Area 3 and Area 5 RWMS
operations would have contributed negligible external exposure to a hypothetical person residing near the boundaries of these sites and would have resulted in no dose to the offsite public.
The dose from the air pathway can be estimated from air monitoring results from stations near the RWMSs (Figure 4-2 and Table 10-4). Mean concentrations of radionuclides in air at the Area 3 and Area 5 environmental sampler locations were, at the most, only 3.9% of their CLs (Table 10-4). Scaling this to the 10-mrem dose that the CL represents would be 0.39 mrem (0.0039 mSv) to a hypothetical person residing near the boundaries of the RWMS, and the dose would be much lower to the offsite public.
There is no exposure, and therefore no dose, to the public from groundwater beneath waste disposal sites on the NNSS. Groundwater monitoring indicates that man-made radionuclides have not been detected in wells accessible to the offsite public or in private wells or springs (Sections 5.1.3.5, 7.2, and 7.3). Also, groundwater and vadose
zone monitoring at the Area 3 and Area 5 RWMSs, conducted to verify the performance of waste disposal facilities, have not detected the migration of radiological wastes into groundwater (Sections 10.1.7 and 10.1.8).
Based on these results, potential doses to members of the public from LLW disposal facilities on the NNSS from all pathways are negligible.
9.1.3 Total Offsite Dose to the Public from All Pathways
The DOE-established radiation dose limit to a member of the general public from all possible pathways as a result of NNSA/NFO facility operations is 100 mrem/yr (1 mSv/yr) excluding background radiation, while considering air transport, ingestion, and direct exposure pathways. For 2018, the only plausible pathways of public exposure to man-made radionuclides from current or past NNSS activities included the air transport pathway and the ingestion of game animals and plants. The doses from these pathways are combined in Table 9-4 to present an
estimate of the total 2018 dose to the maximally exposed individual (MEI) residing off site.
The MEI for the air pathway was considered to be a person residing at the north end of Amargosa Valley south of
the NNSS (Section 9.1.1.1). If the offsite MEI were assumed to also eat wildlife from the NNSS, additional dose
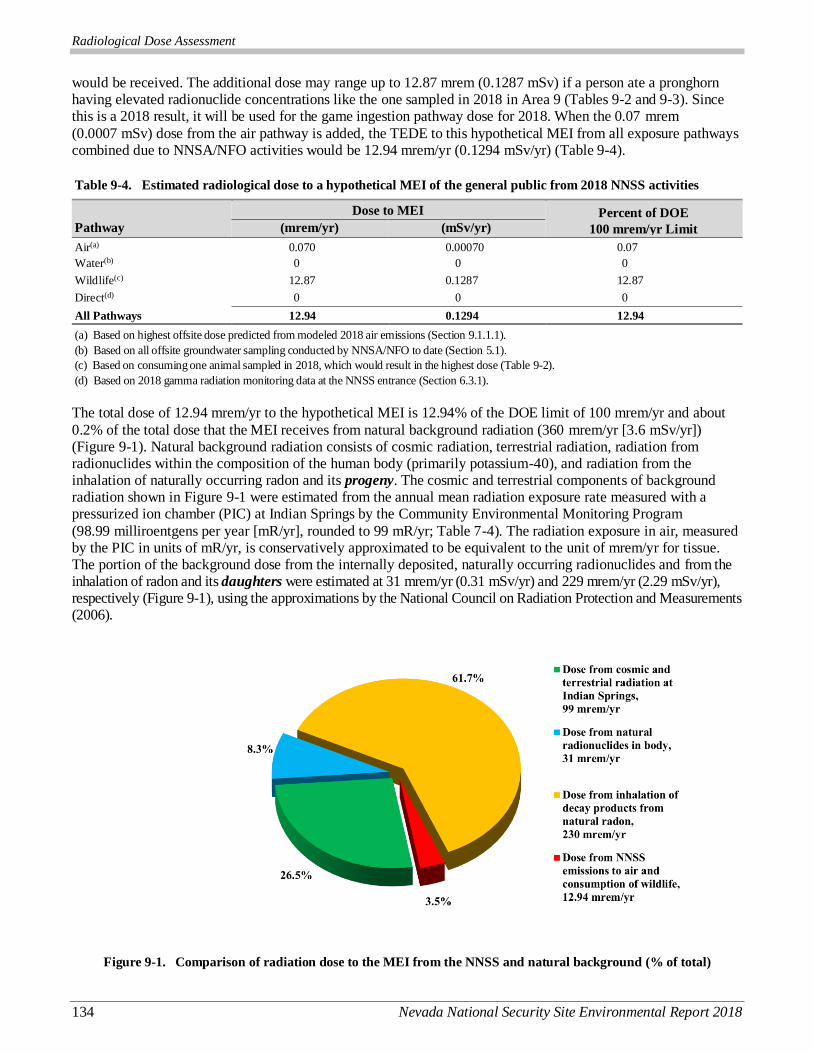
Radiological Dose Assessment
134 Nevada National Security Site Environmental Report 2018
would be received. The additional dose may range up to 12.87 mrem (0.1287 mSv) if a person ate a pronghorn having elevated radionuclide concentrations like the one sampled in 2018 in Area 9 (Tables 9-2 and 9-3). Since this is a 2018 result, it will be used for the game ingestion pathway dose for 2018. When the 0.07 mrem
(0.0007 mSv) dose from the air pathway is added, the TEDE to this hypothetical MEI from all exposure pathways combined due to NNSA/NFO activities would be 12.94 mrem/yr (0.1294 mSv/yr) (Table 9-4).
Table 9-4. Estimated radiological dose to a hypothetical MEI of the general public from 2018 NNSS activities
Pathway Dose to MEI Percent of DOE
100 mrem/yr Limit (mrem/yr) (mSv/yr)
Air(a) 0.070 0.00070 0.07
Water(b) 0 0 0
Wildlife(c) 12.87 0.1287 12.87
Direct(d) 0 0 0
All Pathways 12.94 0.1294 12.94
(a) Based on highest offsite dose predicted from modeled 2018 air emissions (Section 9.1.1.1).
(b) Based on all offsite groundwater sampling conducted by NNSA/NFO to date (Section 5.1).
(c) Based on consuming one animal sampled in 2018, which would result in the highest dose (Table 9-2).
(d) Based on 2018 gamma radiation monitoring data at the NNSS entrance (Section 6.3.1).
The total dose of 12.94 mrem/yr to the hypothetical MEI is 12.94% of the DOE limit of 100 mrem/yr and about
0.2% of the total dose that the MEI receives from natural background radiation (360 mrem/yr [3.6 mSv/yr]) (Figure 9-1). Natural background radiation consists of cosmic radiation, terrestrial radiation, radiation from radionuclides within the composition of the human body (primarily potassium-40), and radiation from the inhalation of naturally occurring radon and its progeny. The cosmic and terrestrial components of background radiation shown in Figure 9-1 were estimated from the annual mean radiation exposure rate measured with a pressurized ion chamber (PIC) at Indian Springs by the Community Environmental Monitoring Program
(98.99 milliroentgens per year [mR/yr], rounded to 99 mR/yr; Table 7-4). The radiation exposure in air, measured by the PIC in units of mR/yr, is conservatively approximated to be equivalent to the unit of mrem/yr for tissue. The portion of the background dose from the internally deposited, naturally occurring radionuclides and from the inhalation of radon and its daughters were estimated at 31 mrem/yr (0.31 mSv/yr) and 229 mrem/yr (2.29 mSv/yr), respectively (Figure 9-1), using the approximations by the National Council on Radiation Protection and Measurements (2006).
Figure 9-1. Comparison of radiation dose to the MEI from the NNSS and natural background (% of total)
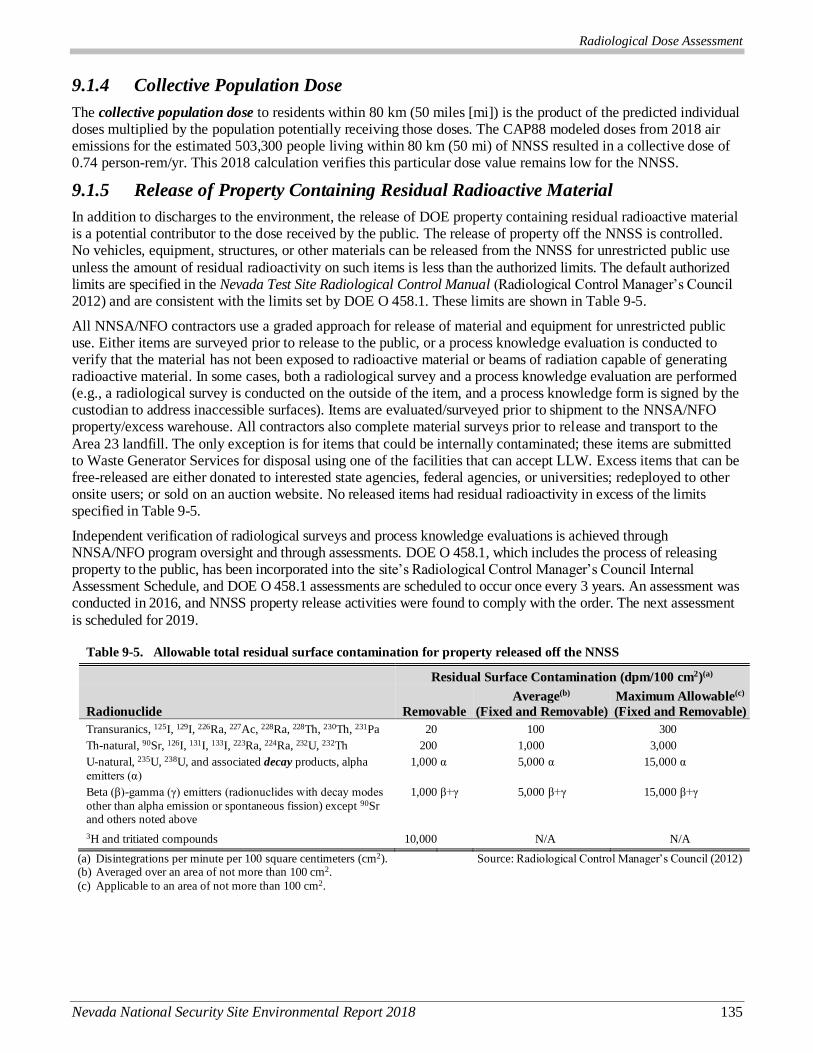
Radiological Dose Assessment
Nevada National Security Site Environmental Report 2018 135
9.1.4 Collective Population Dose
The collective population dose to residents within 80 km (50 miles [mi]) is the product of the predicted individual doses multiplied by the population potentially receiving those doses. The CAP88 modeled doses from 2018 air emissions for the estimated 503,300 people living within 80 km (50 mi) of NNSS resulted in a collective dose of 0.74 person-rem/yr. This 2018 calculation verifies this particular dose value remains low for the NNSS.
9.1.5 Release of Property Containing Residual Radioactive Material
In addition to discharges to the environment, the release of DOE property containing residual radioactive material is a potential contributor to the dose received by the public. The release of property off the NNSS is controlled. No vehicles, equipment, structures, or other materials can be released from the NNSS for unrestricted public use
unless the amount of residual radioactivity on such items is less than the authorized limits. The default authorized limits are specified in the Nevada Test Site Radiological Control Manual (Radiological Control Manager’s Council 2012) and are consistent with the limits set by DOE O 458.1. These limits are shown in Table 9-5.
All NNSA/NFO contractors use a graded approach for release of material and equipment for unrestricted public use. Either items are surveyed prior to release to the public, or a process knowledge evaluation is conducted to verify that the material has not been exposed to radioactive material or beams of radiation capable of generating radioactive material. In some cases, both a radiological survey and a process knowledge evaluation are performed (e.g., a radiological survey is conducted on the outside of the item, and a process knowledge form is signed by the custodian to address inaccessible surfaces). Items are evaluated/surveyed prior to shipment to the NNSA/NFO property/excess warehouse. All contractors also complete material surveys prior to release and transport to the
Area 23 landfill. The only exception is for items that could be internally contaminated; these items are submitted to Waste Generator Services for disposal using one of the facilities that can accept LLW. Excess items that can be free-released are either donated to interested state agencies, federal agencies, or universities; redeployed to other onsite users; or sold on an auction website. No released items had residual radioactivity in excess of the limits specified in Table 9-5.
Independent verification of radiological surveys and process knowledge evaluations is achieved through NNSA/NFO program oversight and through assessments. DOE O 458.1, which includes the process of releasing property to the public, has been incorporated into the site’s Radiological Control Manager’s Council Internal Assessment Schedule, and DOE O 458.1 assessments are scheduled to occur once every 3 years. An assessment was conducted in 2016, and NNSS property release activities were found to comply with the order. The next assessment
is scheduled for 2019.
Table 9-5. Allowable total residual surface contamination for property released off the NNSS
Residual Surface Contamination (dpm/100 cm2)(a)
Radionuclide Removable
Average(b)
(Fixed and Removable)
Maximum Allowable(c)
(Fixed and Removable)
Transuranics, 125I, 129I, 226Ra, 227Ac, 228Ra, 228Th, 230Th, 231Pa 20 100 300
Th-natural, 90Sr, 126I, 131I, 133I, 223Ra, 224Ra, 232U, 232Th 200 1,000 3,000
U-natural, 235U, 238U, and associated decay products, alpha
emitters (α)
1,000 α 5,000 α 15,000 α
Beta (β)-gamma (γ) emitters (radionuclides with decay modes
other than alpha emission or spontaneous fission) except 90Sr and others noted above
1,000 β+γ 5,000 β+γ 15,000 β+γ
3H and tritiated compounds 10,000 N/A N/A
(a) Disintegrations per minute per 100 square centimeters (cm2). Source: Radiological Control Manager’s Council (2012) (b) Averaged over an area of not more than 100 cm2.
(c) Applicable to an area of not more than 100 cm2.
Radiological Dose Assessment
136 Nevada National Security Site Environmental Report 2018
9.2 Dose to Aquatic and Terrestrial Biota
DOE requires their facilities to evaluate the potential impacts of radiation exposure to biota in the vicinity of DOE activities. To assist in such an evaluation, DOE’s Biota Dose Assessment Committee developed DOE-STD-1153-2002. This standard established the following radiological dose limits for plants and animals. Dose rates equal to or less than these are expected to have no direct, observable effect on plant or animal reproduction:
1 rad/d (0.01 grays per day [Gy/d]) for aquatic animals
1 rad/d (0.01 Gy/d) for terrestrial plants
0.1 rad/d (1 milligray per day) for terrestrial animals
DOE-STD-1153-2019 also provides concentration values for radionuclides in soil, water, and sediment to use as a guide to determine if biota are potentially receiving radiation doses above the limits. These concentrations are called the Biota Concentration Guide (BCG) values. They are defined as the minimum concentration of a radionuclide that would cause dose limits to be exceeded using very conservative uptake and exposure
assumptions.
NNSS biologists use the graded approach described in DOE-STD-1153-2019. The approach is a three-step process consisting of a data assembly step, a general screening step, and an analysis step. The analysis step
consists of site-specific screening, site-specific analysis, and site-specific biota dose assessment. The following information is required by the graded approach:
Identification of terrestrial and aquatic habitats on the NNSS with radionuclides in soil, water, or sediment.
Identification of terrestrial and aquatic biota on the NNSS in contaminated habitats and at risk of
exposure.
Measured or calculated radionuclide concentrations in soil, water, and sediment in contaminated habitats on the NNSS that can be compared to BCG values to determine the potential for exceeding biota dose
limits.
Measured radionuclide concentrations in NNSS biota, soil, water, and sediment in contaminated habitats on the NNSS to estimate site-specific dose to biota.
A comprehensive biota dose assessment for the NNSS using the graded approach was reported in the Nevada Test Site Environmental Report 2003 (BN 2004). The assessment demonstrated that the potential radiological dose to biota on the NNSS was not likely to exceed dose limits. Data from monitoring air, water, and biota across the
NNSS suggest no significant change to NNSS surface conditions; therefore, the biota dose evaluation conclusion remains the same for 2018.
9.2.1 2018 Site-Specific Biota Dose Assessment
The site-specific biota dose assessment phase of the graded approach centers on the actual collection and analysis of biota. To obtain a predicted internal dose to biota sampled in 2018, the RESRAD-BIOTA, Version 1.5, computer model (DOE 2004) was used. Maximum concentrations of man-made radionuclides detected in plant and animal tissue (Table 8-3 and 8-5) were entered into the model. External dose was based on the measured
annual exposure rate using the maximum quarterly thermoluminescent dosimeter (TLD) measurement made close to each biota sampling site (Table 6-1), minus average background exposure rate (Table 6-2). If the average background exposure rate was higher than the monitored location, then man-made external dose was set to zero.
The 2018 site-specific estimated dose rates to biota were all below the DOE limits for both plants and animals (Table 9-6). The highest dose was predicted for plants near the Schooner Crater followed by the pronghorn in Area 9.
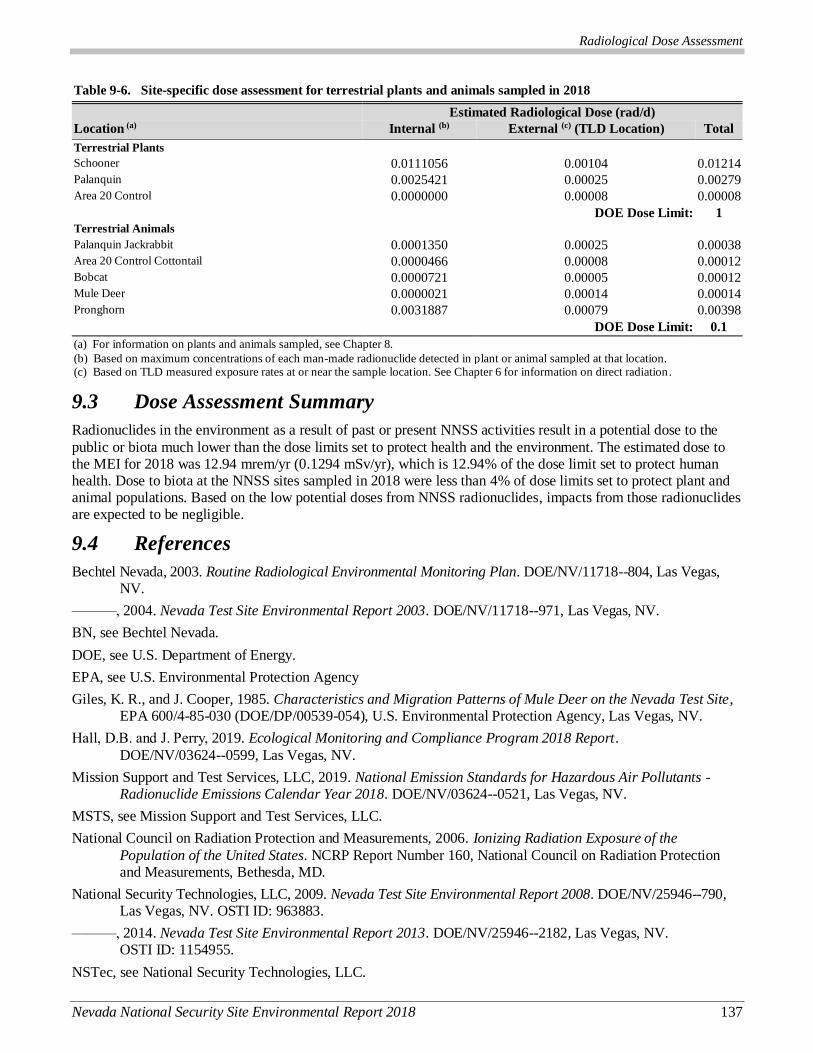
Radiological Dose Assessment
Nevada National Security Site Environmental Report 2018 137
Table 9-6. Site-specific dose assessment for terrestrial plants and animals sampled in 2018
Estimated Radiological Dose (rad/d)
Location (a) Internal (b) External (c) (TLD Location) Total
Terrestrial Plants
Schooner 0.0111056 0.00104 0.01214
Palanquin 0.0025421 0.00025 0.00279
Area 20 Control 0.0000000 0.00008 0.00008 DOE Dose Limit: 1
Terrestrial Animals
Palanquin Jackrabbit 0.0001350 0.00025 0.00038
Area 20 Control Cottontail 0.0000466 0.00008 0.00012
Bobcat 0.0000721 0.00005 0.00012
Mule Deer 0.0000021 0.00014 0.00014
Pronghorn 0.0031887 0.00079 0.00398
DOE Dose Limit: 0.1
(a) For information on plants and animals sampled, see Chapter 8.
(b) Based on maximum concentrations of each man-made radionuclide detected in plant or animal sampled at that location. (c) Based on TLD measured exposure rates at or near the sample location. See Chapter 6 for information on direct radiation.
9.3 Dose Assessment Summary
Radionuclides in the environment as a result of past or present NNSS activities result in a potential dose to the
public or biota much lower than the dose limits set to protect health and the environment. The estimated dose to the MEI for 2018 was 12.94 mrem/yr (0.1294 mSv/yr), which is 12.94% of the dose limit set to protect human health. Dose to biota at the NNSS sites sampled in 2018 were less than 4% of dose limits set to protect plant and animal populations. Based on the low potential doses from NNSS radionuclides, impacts from those radionuclides are expected to be negligible.
9.4 References
Bechtel Nevada, 2003. Routine Radiological Environmental Monitoring Plan. DOE/NV/11718--804, Las Vegas, NV.
———, 2004. Nevada Test Site Environmental Report 2003. DOE/NV/11718--971, Las Vegas, NV.
BN, see Bechtel Nevada.
DOE, see U.S. Department of Energy.
EPA, see U.S. Environmental Protection Agency
Giles, K. R., and J. Cooper, 1985. Characteristics and Migration Patterns of Mule Deer on the Nevada Test Site, EPA 600/4-85-030 (DOE/DP/00539-054), U.S. Environmental Protection Agency, Las Vegas, NV.
Hall, D.B. and J. Perry, 2019. Ecological Monitoring and Compliance Program 2018 Report.
DOE/NV/03624--0599, Las Vegas, NV.
Mission Support and Test Services, LLC, 2019. National Emission Standards for Hazardous Air Pollutants - Radionuclide Emissions Calendar Year 2018. DOE/NV/03624--0521, Las Vegas, NV.
MSTS, see Mission Support and Test Services, LLC.
National Council on Radiation Protection and Measurements, 2006. Ionizing Radiation Exposure of the
Population of the United States. NCRP Report Number 160, National Council on Radiation Protection and Measurements, Bethesda, MD.
National Security Technologies, LLC, 2009. Nevada Test Site Environmental Report 2008. DOE/NV/25946--790, Las Vegas, NV. OSTI ID: 963883.
———, 2014. Nevada Test Site Environmental Report 2013. DOE/NV/25946--2182, Las Vegas, NV. OSTI ID: 1154955.
NSTec, see National Security Technologies, LLC.
Radiological Dose Assessment
138 Nevada National Security Site Environmental Report 2018
Radiological Control Manager’s Council, 2012. Nevada Test Site Radiological Control Manual. DOE/NV/25946--801, Rev. 2, Las Vegas, NV. OSTI ID: 1036978.
U.S. Department of Energy, 2004. Users Guide, Version 1; RESRAD-BIOTA: A Tool for Implementing a Graded Approach to Biota Dose Evaluation. DOE/EH-0676 (also Interagency Steering Committee on Radiation Standards [ISCORS] Technical Report 2004-02), Washington D.C.
U.S. Environmental Protection Agency, 2014. CAP88-PC Version 4.0 User Guide, Office of Radiation and Indoor Air, Washington, D.C.

Waste Management
Nevada National Security Site Environmental Report 2018 139
10.0 Ch10
Chapter 10: Waste Management
Troy S. Belka, Rose C. Denton, Stefan J. Duke, Cirilo C. Gonzales, Louis B. Gregory, David B. Hudson,
Brian D. Moran, Alissa J. Silvas, and Ronald W. Warren
Mission Support and Test Services, LLC
Waste Management Goals
Ensure disposal systems meet performance objectives. Manage and safely dispose of all types of wastes. Ensure wastes
received for disposal at the Nevada National Security Site (NNSS) meet NNSS acceptance criteria. Manage and monitor
wastes and waste sites for the protection of the public and environment.
Several federal and state regulations govern the safe management, storage, and disposal of radioactive, hazardous, and solid wastes generated or received on the NNSS (Tables 2-1 and 2-3). This chapter describes waste management operations and compliance with all applicable environmental/public safety regulations. The Environmental Management (EM) Nevada Program is responsible for the Area 3 and Area 5 radioactive waste facilities described in Section 10.1, and operates them in conjunction with the U.S. Department of Energy (DOE), National Nuclear Security Administration Nevada Field Office (NNSA/NFO). NNSA/NFO is responsible for and operates all other waste disposal facilities on the NNSS (Figure 10-1).
This chapter describes several waste streams, including the following:
low-level waste (LLW)1
mixed LLW (MLLW)
non-radioactive classified waste/matter
hazardous waste (HW)
transuranic and mixed transuranic (TRU/MTRU)
explosive ordnance wastes
solid/sanitary waste
In addition, details are included for the management of underground storage tanks (USTs); the process to evaluate, design, construct, maintain, and monitor closure covers for radioactive waste disposal units at the Area 3 and Area 5 Radioactive Waste Management Sites (RWMSs); and monitoring radiation doses from the Area 3
RWMS and the Area 5 Radioactive Waste Management Complex (RWMC) to the levels specified in DOE Manual DOE M 435.1-1, Radioactive Waste Management Manual.
10.1 Radioactive Waste Management
The NNSS Radioactive Waste Management facilities include the Area 5 RWMC and the Area 3 RWMS. They operate as Category II non-reactor nuclear facilities. The Area 5 RWMC (Figure 10-2) is composed of the Area 5
RWMS, the Hazardous Waste Storage Unit (HWSU), and the Waste Examination Facility (WEF). This section describes the facilities and processes that comprise the safe receipt, storage, disposal, and disposal unit monitoring of radioactive wastes at the NNSS.
10.1.1 Area 5 Radioactive Waste Management Site
The Area 5 RWMS is a DOE-owned radioactive waste disposal facility. It encompasses approximately 740 acres (ac), including 200 ac of historical and active disposal cells used for burial of LLW, MLLW, Non-Radiological Classified (NRC) waste, and Non-Radiological Classified Hazardous (NRCH) waste, and 540 ac of land available for future radioactive disposal cells. Waste disposal at the Area 5 RWMS occurred in a 92-acre portion of the site
starting in the early 1960s. This “92-Acre Area” consists of 31 disposal cells and 13 Greater Confinement Disposal boreholes, and was used for disposal of waste in drums, soft-sided containers, large cargo containers, and boxes. The 92-Acre Area was filled and permanently closed in 2011. Closure covers for the 92-Acre Area were seeded in the fall of 2011. They have been monitored and reseeded in several failed attempts to produce covers supporting sustainable native plant populations.
1 The definition of word(s) in bold italics may be found by clicking on the word in electronic version or by referencing the Glossary,
Appendix B. To return from the Glossary, right click and select Previous View.

Waste Management
140 Nevada National Security Site Environmental Report 2018
Figure 10-1. Waste Disposal Facilities on the NNSS
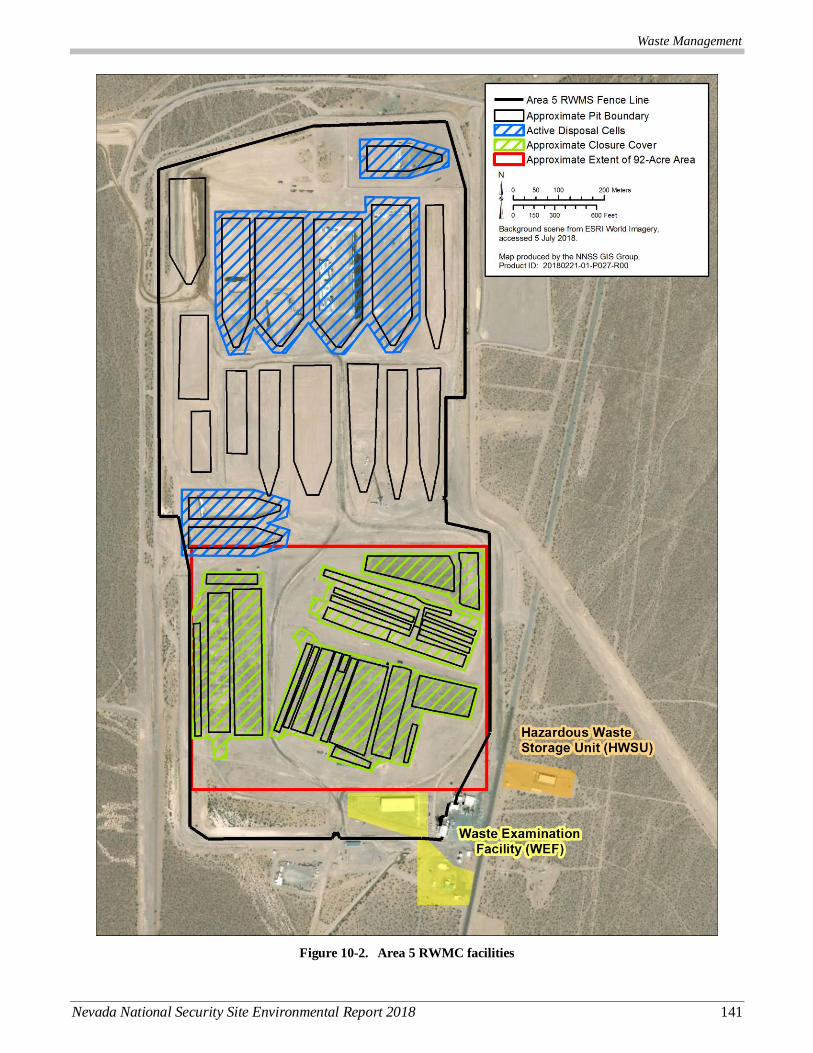
Waste Management
Nevada National Security Site Environmental Report 2018 141
Figure 10-2. Area 5 RWMC facilities

Waste Management
142 Nevada National Security Site Environmental Report 2018
In 2018, the EM Nevada Program investigated other strategies for revegetating these closure covers and teamed with Numic-speaking people, who have cultural ties to lands on the NNSS. The goal was to help ensure success by integrating traditional ecological knowledge with scientific ecological methods
(http://www.nnss.gov/pages/News/news_JanMar2018.html).
Eight cells, developed immediately north and west of the 92-Acre Area, have been receiving wastes since 2010. They include six LLW cells (Cells 19, 20, 21, 22, 27, and 28) and two MLLW cells (Cells 18 and 25). All active
Area 5 RWMS cells can accept radioactive waste contaminated with non-regulated polychlorinated biphenyl
(PCB) bulk product waste, but only Cells 18 and 25 can accept waste contaminated with regulated PCB remediation waste as well as asbestos-contaminated MLLW. Cells 18, 19, 20, 22, 27, and 28 can accept asbestos-contaminated LLW. Table 10-1 lists disposal cells active in 2018. MLLW disposal services are expected to continue at the Area 5 RWMS until the remaining needs of the DOE complex are met.
Disposal Cells 18 and 25 are operated under a Resource Conservation and Recovery Act (RCRA) Part B Permit (NEV HW0101), which authorizes the disposal of up to 25,485 cubic meters (m3) (899,994 cubic feet [ft3]) of MLLW and NRCH in Cell 18 and up to 37,000 m3 (1,306,643 ft3) in Cell 25. The volume and weight of wastes received at Cells 18 and 25 in 2018 is shown in Table 10-1. Cell 18 waste accumulation began on January 26, 2011; a cumulative total of 21,201 m3 (748,693 ft3) of MLLW/NRCH has been disposed through the end of 2018.
Cell 25 waste accumulation began on July 12, 2018; a cumulative total of 345 m3 (12,183 ft3) of MLLW/NRCH has been disposed through the end of 2018. Quarterly reports are submitted to the state to document the weight of MLLW/NRCH disposed.
In 2018, the Area 5 RWMS received shipments containing a total of 27,627 m3 (975,638 ft3) of radioactive waste for disposal (Table 10-1), which included both NRC and NRCH waste. The majority of waste disposed was received from offsite generators. The total number of waste shipments in fiscal year (FY) 2018 are reported annually (Mission Support and Test Services, LLC [MSTS] 2018a). Offsite waste generators delivering MLLW with regulated quantities of PCBs are issued Certificates of Disposal, as required under the Toxic Substances Control Act.
Table 10-1. Total waste volumes received and disposed at the Area 5 RWMS in 2018
Waste Type Disposal Cell(s) 2018 Volume Received and
Disposed in m3 (ft3)
LLW and NRC Cells 19, 20, 21, 22, 27, and 28 23,909 (844,344)
MLLW and NRCH (includes regulated PCB-contaminated LLW)
Cells 18 and 25 3,718 (131,294) [1,644](a)
Total 27,627 (975,638)
(a) Fees paid to the state for HW generated at the NNSS and MLLW wastes received for disposal are based on weight.
10.1.2 Waste Examination Facility
Operational units of the WEF include the TRU Pad, TRU Pad Cover Building (TPCB), TRU Loading Operations
Area, WEF Yard, WEF Drum Holding Pad, Sprung Instant Structure (SIS), and the Visual Examination and Repackaging Building (VERB). Until 2009, the WEF was used for the staging, characterization, repackaging, and offsite shipment of legacy TRU wastes that had been stored for many years at the NNSS.
At present, the SIS, VERB, TRU Pad, and TPCB are authorized for the safe storage of radioactive mixed waste under the current RCRA Permit. The TPCB also accepts TRU/MTRU waste from NNSS generators. The TPCB stores the waste until it is characterized for disposal at the Waste Isolation Pilot Plant in Carlsbad, New Mexico. In 2018, the TRU waste remaining in storage at the TPCB consisted of two experimental spheres from Lawrence Livermore National Laboratory and 34 standard waste boxes from the Joint Actinide Shock Physics Experimental Research facility. The VERB is no longer a Category III Nuclear Facility (a designation based on radioactive material inventory as defined in DOE Standard DOE-STD-1027-92, Hazard Categorization and Accident
Analysis Techniques for Compliance with DOE Order 5480.23, Nuclear Safety Analysis Reports) for the TRU characterization campaign. Upon completion of the Oversized Box Campaign, it was downgraded in 2016 to a radiological facility.
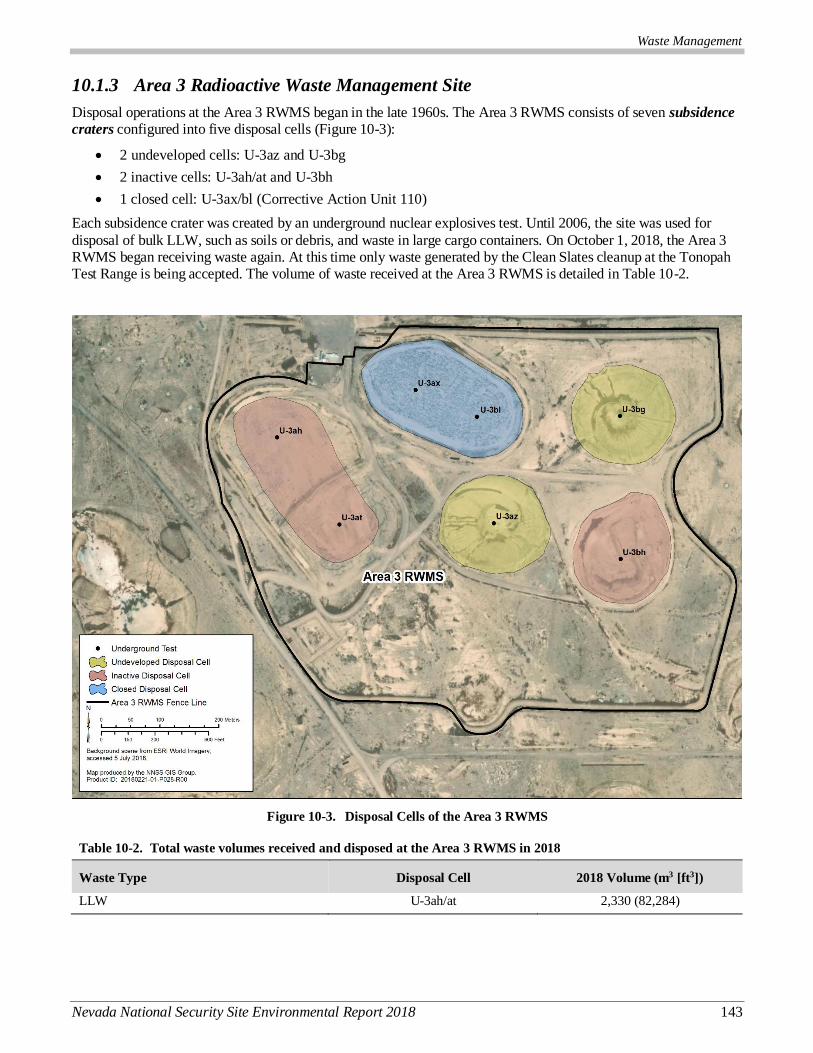
Waste Management
Nevada National Security Site Environmental Report 2018 143
10.1.3 Area 3 Radioactive Waste Management Site
Disposal operations at the Area 3 RWMS began in the late 1960s. The Area 3 RWMS consists of seven subsidence
craters configured into five disposal cells (Figure 10-3):
2 undeveloped cells: U-3az and U-3bg
2 inactive cells: U-3ah/at and U-3bh
1 closed cell: U-3ax/bl (Corrective Action Unit 110)
Each subsidence crater was created by an underground nuclear explosives test. Until 2006, the site was used for
disposal of bulk LLW, such as soils or debris, and waste in large cargo containers. On October 1, 2018, the Area 3 RWMS began receiving waste again. At this time only waste generated by the Clean Slates cleanup at the Tonopah Test Range is being accepted. The volume of waste received at the Area 3 RWMS is detailed in Table 10-2.
Figure 10-3. Disposal Cells of the Area 3 RWMS
Table 10-2. Total waste volumes received and disposed at the Area 3 RWMS in 2018
Waste Type Disposal Cell 2018 Volume (m3 [ft3])
LLW U-3ah/at 2,330 (82,284)
Waste Management
144 Nevada National Security Site Environmental Report 2018
10.2 Waste Characterization
All generators of waste must demonstrate eligibility for waste to be disposed at the NNSS, submit profiles characterizing specific waste streams, meet the NNSS Waste Acceptance Criteria, and receive programmatic approval from the EM Nevada Program for their site waste certification programs.
Characterization is performed by approved EM Nevada Program waste generators using knowledge of the generating process, sampling and analysis, or non-destructive analysis. Following the characterization of a waste stream, the approved EM Nevada Program waste generator develops a waste profile. The waste profile delineates the pedigree of the waste, including, but not limited to, a description of the waste generating process, physical and
chemical characteristics, radioactive isotope activity and quantity, and packaging information. The waste profile is reviewed by the Waste Acceptance Review Panel for eventual approval or disapproval by the EM Nevada Program. The approved waste generator packages and ships approved waste streams in accordance with U.S. Department of Transportation requirements to the Area 5 RWMC or to an offsite facility for treatment, if necessary, prior to its shipment for disposal at the Area 5 RWMC.
In 2018, LLW, MLLW, and classified waste/matter were characterized by approved waste generators for the following general waste stream categories:
Lead Solids Contaminated Demolition Debris
Sealed Sources Contaminated Soil
Miscellaneous Debris/Solids Depleted Uranium Waste
Contaminated PCB Waste Contaminated Asbestos Waste
Compactable Trash Non-radioactive Classified Matter/Waste
Radioactive Hazardous Classified Matter/Waste
High-Efficiency Particulate Air Exhaust and Filter Media
Amalgamated Mercury
10.2.1 Mixed Waste and Classified Non-Radioactive Hazardous Matter Verification
Waste verification is an inspection process that confirms the waste stream data supplied by approved waste generators before MLLW or non-radioactive classified HW is accepted for disposal at the NNSS. Verification may involve visual inspection, Real-Time Radiography (RTR), and/or chemical screening on a designated percentage of MLLW or non-radioactive classified hazardous matter. The objectives of waste verification include
verifying that HW treatment objectives are met, confirming that waste containers do not contain free liquids, and ensuring that waste containers are at least 90% full, per RCRA and State of Nevada requirements. Offsite-generated waste is verified either when the waste is received at the NNSS or when it is still at a generator facility or a designated treatment, storage, or disposal facility. The first choice for the method of verification is visual inspection at the site of generation.
In 2018, offsite visual inspections were completed on 18 MLLW packages from five separate waste streams. No chemical screening or RTR was conducted. No MLLW or non-radioactive classified hazardous matter packages were rejected.
10.3 Annual Performance Assessments and Composite Analyses
To assess and forecast the long-term performance of NNSS disposal sites, the EM Nevada Program conducts a Performance Assessment (PA) and a Composite Analysis (CA). A PA is a systematic analysis of the potential risks posed to the public and environment by a waste disposal facility for LLW disposed after 1988. A CA is an assessment of the risks posed by all wastes disposed in an LLW disposal facility and by all other sources of residual contamination that may interact with the disposal site. The EM Nevada Program maintains current PAs and CAs for the Area 3 and Area 5 RWMSs (Table 10-3). The Maintenance Plan for the Performance
Assessments and Composite Analyses for the Area 3 and Area 5 Radioactive Waste Management Sites at the
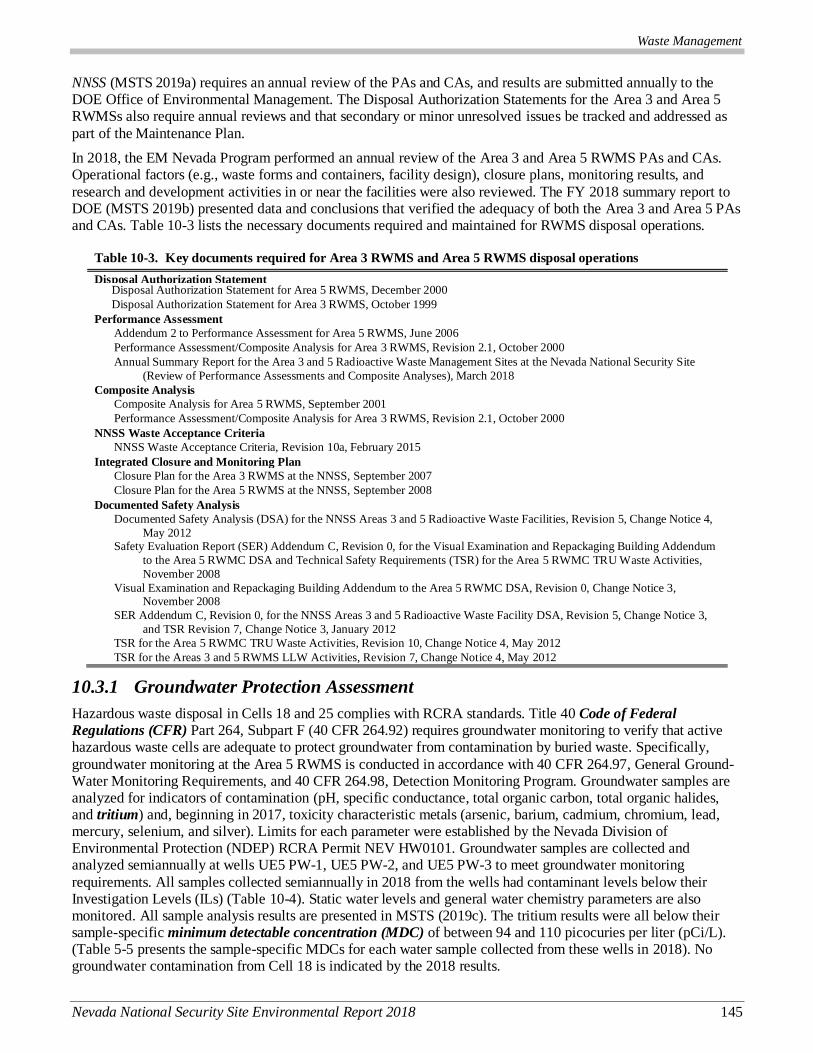
Waste Management
Nevada National Security Site Environmental Report 2018 145
NNSS (MSTS 2019a) requires an annual review of the PAs and CAs, and results are submitted annually to the DOE Office of Environmental Management. The Disposal Authorization Statements for the Area 3 and Area 5 RWMSs also require annual reviews and that secondary or minor unresolved issues be tracked and addressed as
part of the Maintenance Plan.
In 2018, the EM Nevada Program performed an annual review of the Area 3 and Area 5 RWMS PAs and CAs. Operational factors (e.g., waste forms and containers, facility design), closure plans, monitoring results, and
research and development activities in or near the facilities were also reviewed. The FY 2018 summary report to DOE (MSTS 2019b) presented data and conclusions that verified the adequacy of both the Area 3 and Area 5 PAs and CAs. Table 10-3 lists the necessary documents required and maintained for RWMS disposal operations.
Table 10-3. Key documents required for Area 3 RWMS and Area 5 RWMS disposal operations
Disposal Authorization Statement Disposal Authorization Statement for Area 5 RWMS, December 2000
Disposal Authorization Statement for Area 3 RWMS, October 1999
Performance Assessment
Addendum 2 to Performance Assessment for Area 5 RWMS, June 2006
Performance Assessment/Composite Analysis for Area 3 RWMS, Revision 2.1, October 2000
Annual Summary Report for the Area 3 and 5 Radioactive Waste Management Sites at the Nevada National Security Site
(Review of Performance Assessments and Composite Analyses), March 2018
Composite Analysis
Composite Analysis for Area 5 RWMS, September 2001
Performance Assessment/Composite Analysis for Area 3 RWMS, Revision 2.1, October 2000
NNSS Waste Acceptance Criteria
NNSS Waste Acceptance Criteria, Revision 10a, February 2015
Integrated Closure and Monitoring Plan
Closure Plan for the Area 3 RWMS at the NNSS, September 2007
Closure Plan for the Area 5 RWMS at the NNSS, September 2008
Documented Safety Analysis
Documented Safety Analysis (DSA) for the NNSS Areas 3 and 5 Radioactive Waste Facilities, Revision 5, Change Notice 4,
May 2012 Safety Evaluation Report (SER) Addendum C, Revision 0, for the Visual Examination and Repackaging Building Addendum
to the Area 5 RWMC DSA and Technical Safety Requirements (TSR) for the Area 5 RWMC TRU Waste Activities,
November 2008
Visual Examination and Repackaging Building Addendum to the Area 5 RWMC DSA, Revision 0, Change Notice 3, November 2008
SER Addendum C, Revision 0, for the NNSS Areas 3 and 5 Radioactive Waste Facility DSA, Revision 5, Change Notice 3,
and TSR Revision 7, Change Notice 3, January 2012
TSR for the Area 5 RWMC TRU Waste Activities, Revision 10, Change Notice 4, May 2012
TSR for the Areas 3 and 5 RWMS LLW Activities, Revision 7, Change Notice 4, May 2012
10.3.1 Groundwater Protection Assessment
Hazardous waste disposal in Cells 18 and 25 complies with RCRA standards. Title 40 Code of Federal
Regulations (CFR) Part 264, Subpart F (40 CFR 264.92) requires groundwater monitoring to verify that active hazardous waste cells are adequate to protect groundwater from contamination by buried waste. Specifically,
groundwater monitoring at the Area 5 RWMS is conducted in accordance with 40 CFR 264.97, General Ground-Water Monitoring Requirements, and 40 CFR 264.98, Detection Monitoring Program. Groundwater samples are analyzed for indicators of contamination (pH, specific conductance, total organic carbon, total organic halides, and tritium) and, beginning in 2017, toxicity characteristic metals (arsenic, barium, cadmium, chromium, lead, mercury, selenium, and silver). Limits for each parameter were established by the Nevada Division of Environmental Protection (NDEP) RCRA Permit NEV HW0101. Groundwater samples are collected and analyzed semiannually at wells UE5 PW-1, UE5 PW-2, and UE5 PW-3 to meet groundwater monitoring
requirements. All samples collected semiannually in 2018 from the wells had contaminant levels below their Investigation Levels (ILs) (Table 10-4). Static water levels and general water chemistry parameters are also monitored. All sample analysis results are presented in MSTS (2019c). The tritium results were all below their sample-specific minimum detectable concentration (MDC) of between 94 and 110 picocuries per liter (pCi/L). (Table 5-5 presents the sample-specific MDCs for each water sample collected from these wells in 2018). No groundwater contamination from Cell 18 is indicated by the 2018 results.

Waste Management
146 Nevada National Security Site Environmental Report 2018
Table 10-4. Groundwater monitoring results for Cell 18
Parameter Investigation Level (IL) 2018 Sample Levels(a)
pH < 7.6 or > 9.2 S.U.(b) 8.30 to 8.41 S.U. Specific conductance (SC) 0.440 mmhos/cm(c) 0.355 to 0.384 mmhos/cm
Total organic carbon (TOC) 2 mg/L(d) ND(e)
Total organic halides (TOX) 50 μg/L(f) ND(e) to < 0.10 μg/L
Tritium (3H) 2,000 pCi/L(g) ND(e) to < 300 pCi/L
Arsenic (As) 0.05 mg/L < 0.03 mg/L
Barium (Ba) 1 mg/L <0.005 to 0.014 mg/L
Cadmium (Cd) 0.01 mg/L ND(e)
Chromium (Cr) 0.05 mg/L ND(e) to 0.008 mg/L
Lead (Pb) 0.05 mg/L ND(e)
Mercury (Hg) 0.002 mg/L ND(e)
Selenium (Se) 0.01 mg/L ND(e)
Silver (Ag) 0.05 mg/L ND(e) to <0.005 mg/L
(a) Levels shown are the lowest and highest values for each well for each sample date. Source: MSTS (2018c)
(b) S.U. = standard unit(s) (for measuring pH). (c) mmhos/cm = millimhos per centimeter.
(d) mg/L = milligrams per liter. (e) ND = not detected; levels were below MDC.
(f) µg/L = microgram(s) per liter. (g) pCi/L = picocuries per liter.
10.3.2 Vadose Zone Assessment
Monitoring of the vadose zone (unsaturated zone above the water table) is conducted at the RWMC to
demonstrate (1) the PA assumptions at the RWMSs are valid regarding the hydrologic conceptual models used, including soil water contents, and upward and downward flux rates; and (2) there is negligible infiltration and percolation of precipitation into zones of buried waste at the RWMSs. Vadose zone monitoring (VZM) offers many advantages over groundwater monitoring, including detecting potential problems long before groundwater resources would be impacted, allowing corrective actions to be made early, and being less expensive than groundwater monitoring. The components of the VZM program include the Drainage Lysimeter Facility northwest of U-3ax/bl, the Area 5 Weighing Lysimeter Facility southwest of the Area 5 RWMS, two meteorology towers, and instruments at eight depth levels at six locations in four waste disposal cell covers that measure water
content and water potential profiles. Data from all of these components are used to monitor the natural water balance at the RWMSs. Descriptions of the VZM components and the results of monitoring in 2018 are reported in MSTS (2019d). All VZM continued to demonstrate negligible infiltration of precipitation into zones of buried waste at the RWMC, and performance criteria to prevent contamination of groundwater and the environment are being met.
10.4 Assessment of Radiological Dose to the Public
DOE M 435.1-1 states that LLW disposal facilities shall be operated, maintained, and closed so that a reasonable expectation exists that annual dose to members of the public shall not exceed 10 millirem (mrem) through the air pathway and 25 mrem through all pathways for a 1,000-year compliance period after closure of the disposal units. Given that the RWMSs are well within the NNSS boundaries, no members of the public can currently access the areas for significant enough periods of time to acquire a dose exceeding the annual limit. To document compliance with DOE M 435.1-1, however, the possible pathways for radionuclide movement from waste
disposal facilities are monitored. Long-term compliance with the DOE M 435.1-1 dose limits is evaluated by performance assessment modeling. As discussed below, waste operations would contribute negligible exposure to a hypothetical person residing near the boundaries of the RWMSs and would contribute no dose to the offsite public.
10.4.1 Dose from Air and Direct Radiation
Air samplers operate continuously to collect air particulates and atmospheric moisture near each RWMS. These samples are analyzed for radionuclides, and results are used to assess potential dose. Details of the air sampling and a summary of the analysis results are given in Chapter 4. In 2018, three environmental sampling stations
operated in/near the Area 3 RWMS (U-3ax/bl S, Bilby Crater, and Kestrel Crater N), and two air monitoring stations operated near the Area 5 RWMS (DOD and RWMS 5 Lagoons). The dose from the air pathway was
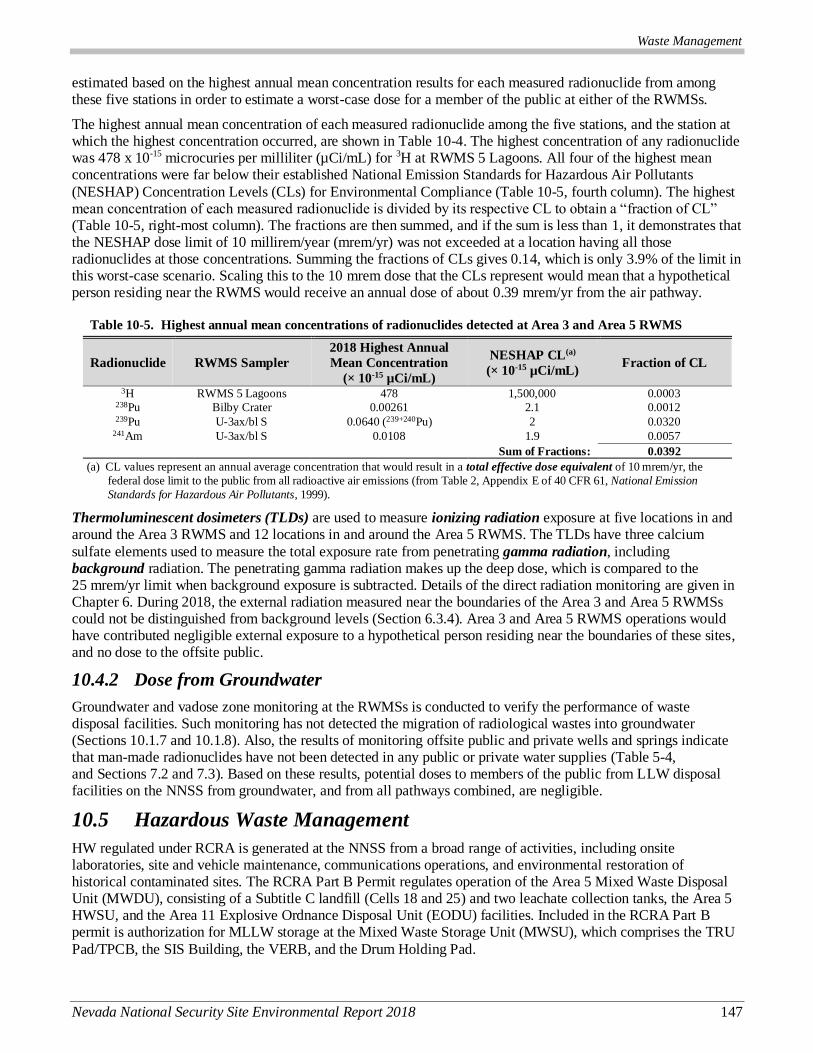
Waste Management
Nevada National Security Site Environmental Report 2018 147
estimated based on the highest annual mean concentration results for each measured radionuclide from among these five stations in order to estimate a worst-case dose for a member of the public at either of the RWMSs.
The highest annual mean concentration of each measured radionuclide among the five stations, and the station at which the highest concentration occurred, are shown in Table 10-4. The highest concentration of any radionuclide was 478 x 10-15 microcuries per milliliter (µCi/mL) for 3H at RWMS 5 Lagoons. All four of the highest mean concentrations were far below their established National Emission Standards for Hazardous Air Pollutants
(NESHAP) Concentration Levels (CLs) for Environmental Compliance (Table 10-5, fourth column). The highest mean concentration of each measured radionuclide is divided by its respective CL to obtain a “fraction of CL” (Table 10-5, right-most column). The fractions are then summed, and if the sum is less than 1, it demonstrates that the NESHAP dose limit of 10 millirem/year (mrem/yr) was not exceeded at a location having all those radionuclides at those concentrations. Summing the fractions of CLs gives 0.14, which is only 3.9% of the limit in this worst-case scenario. Scaling this to the 10 mrem dose that the CLs represent would mean that a hypothetical person residing near the RWMS would receive an annual dose of about 0.39 mrem/yr from the air pathway.
Table 10-5. Highest annual mean concentrations of radionuclides detected at Area 3 and Area 5 RWMS
Radionuclide RWMS Sampler
2018 Highest Annual
Mean Concentration
(× 10-15 µCi/mL)
NESHAP CL(a)
(× 10-15 µCi/mL) Fraction of CL
3H RWMS 5 Lagoons 478 1,500,000 0.0003 238Pu Bilby Crater 0.00261 2.1 0.0012 239Pu U-3ax/bl S 0.0640 (239+240Pu) 2 0.0320
241Am U-3ax/bl S 0.0108 1.9 0.0057 Sum of Fractions: 0.0392
(a) CL values represent an annual average concentration that would result in a total effective dose equivalent of 10 mrem/yr, the
federal dose limit to the public from all radioactive air emissions (from Table 2, Appendix E of 40 CFR 61, National Emission
Standards for Hazardous Air Pollutants, 1999).
Thermoluminescent dosimeters (TLDs) are used to measure ionizing radiation exposure at five locations in and around the Area 3 RWMS and 12 locations in and around the Area 5 RWMS. The TLDs have three calcium
sulfate elements used to measure the total exposure rate from penetrating gamma radiation, including background radiation. The penetrating gamma radiation makes up the deep dose, which is compared to the 25 mrem/yr limit when background exposure is subtracted. Details of the direct radiation monitoring are given in Chapter 6. During 2018, the external radiation measured near the boundaries of the Area 3 and Area 5 RWMSs could not be distinguished from background levels (Section 6.3.4). Area 3 and Area 5 RWMS operations would have contributed negligible external exposure to a hypothetical person residing near the boundaries of these sites, and no dose to the offsite public.
10.4.2 Dose from Groundwater
Groundwater and vadose zone monitoring at the RWMSs is conducted to verify the performance of waste disposal facilities. Such monitoring has not detected the migration of radiological wastes into groundwater (Sections 10.1.7 and 10.1.8). Also, the results of monitoring offsite public and private wells and springs indicate that man-made radionuclides have not been detected in any public or private water supplies (Table 5-4, and Sections 7.2 and 7.3). Based on these results, potential doses to members of the public from LLW disposal facilities on the NNSS from groundwater, and from all pathways combined, are negligible.
10.5 Hazardous Waste Management
HW regulated under RCRA is generated at the NNSS from a broad range of activities, including onsite laboratories, site and vehicle maintenance, communications operations, and environmental restoration of historical contaminated sites. The RCRA Part B Permit regulates operation of the Area 5 Mixed Waste Disposal Unit (MWDU), consisting of a Subtitle C landfill (Cells 18 and 25) and two leachate collection tanks, the Area 5 HWSU, and the Area 11 Explosive Ordnance Disposal Unit (EODU) facilities. Included in the RCRA Part B permit is authorization for MLLW storage at the Mixed Waste Storage Unit (MWSU), which comprises the TRU
Pad/TPCB, the SIS Building, the VERB, and the Drum Holding Pad.
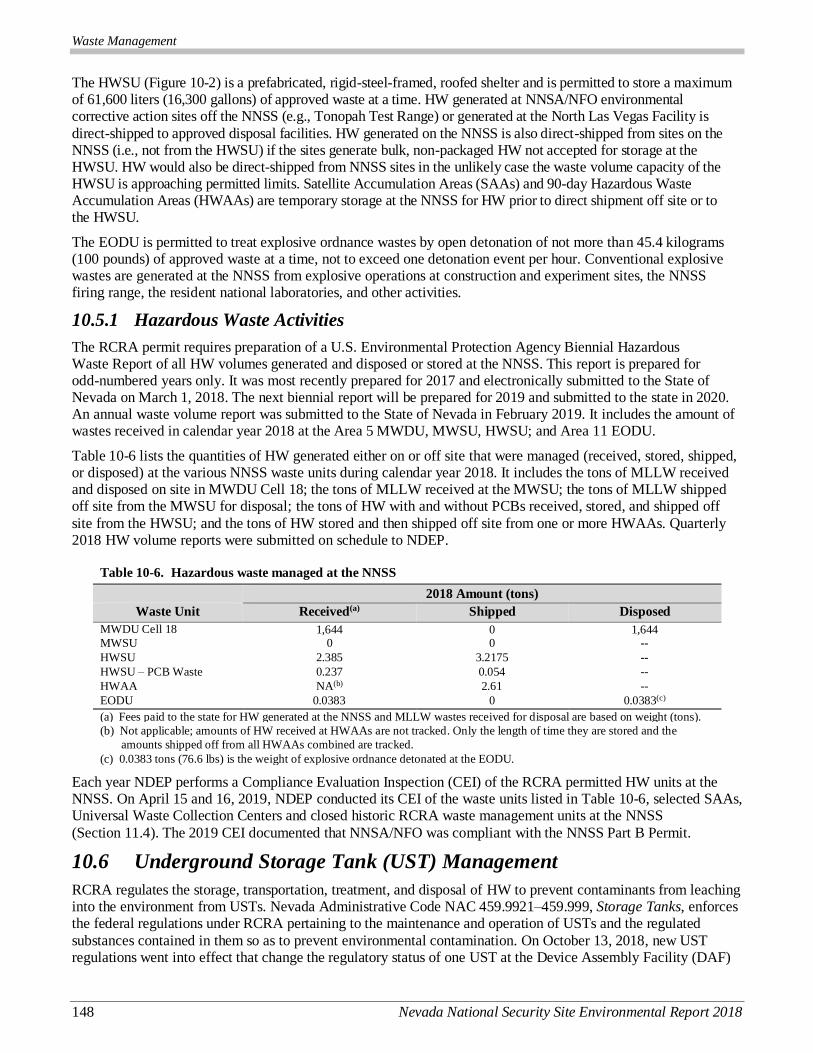
Waste Management
148 Nevada National Security Site Environmental Report 2018
The HWSU (Figure 10-2) is a prefabricated, rigid-steel-framed, roofed shelter and is permitted to store a maximum of 61,600 liters (16,300 gallons) of approved waste at a time. HW generated at NNSA/NFO environmental corrective action sites off the NNSS (e.g., Tonopah Test Range) or generated at the North Las Vegas Facility is
direct-shipped to approved disposal facilities. HW generated on the NNSS is also direct-shipped from sites on the NNSS (i.e., not from the HWSU) if the sites generate bulk, non-packaged HW not accepted for storage at the HWSU. HW would also be direct-shipped from NNSS sites in the unlikely case the waste volume capacity of the HWSU is approaching permitted limits. Satellite Accumulation Areas (SAAs) and 90-day Hazardous Waste Accumulation Areas (HWAAs) are temporary storage at the NNSS for HW prior to direct shipment off site or to the HWSU.
The EODU is permitted to treat explosive ordnance wastes by open detonation of not more than 45.4 kilograms (100 pounds) of approved waste at a time, not to exceed one detonation event per hour. Conventional explosive wastes are generated at the NNSS from explosive operations at construction and experiment sites, the NNSS firing range, the resident national laboratories, and other activities.
10.5.1 Hazardous Waste Activities
The RCRA permit requires preparation of a U.S. Environmental Protection Agency Biennial Hazardous Waste Report of all HW volumes generated and disposed or stored at the NNSS. This report is prepared for odd-numbered years only. It was most recently prepared for 2017 and electronically submitted to the State of Nevada on March 1, 2018. The next biennial report will be prepared for 2019 and submitted to the state in 2020. An annual waste volume report was submitted to the State of Nevada in February 2019. It includes the amount of wastes received in calendar year 2018 at the Area 5 MWDU, MWSU, HWSU; and Area 11 EODU.
Table 10-6 lists the quantities of HW generated either on or off site that were managed (received, stored, shipped, or disposed) at the various NNSS waste units during calendar year 2018. It includes the tons of MLLW received and disposed on site in MWDU Cell 18; the tons of MLLW received at the MWSU; the tons of MLLW shipped off site from the MWSU for disposal; the tons of HW with and without PCBs received, stored, and shipped off
site from the HWSU; and the tons of HW stored and then shipped off site from one or more HWAAs. Quarterly 2018 HW volume reports were submitted on schedule to NDEP.
Table 10-6. Hazardous waste managed at the NNSS
2018 Amount (tons)
Waste Unit Received(a) Shipped Disposed
MWDU Cell 18 1,644 0 1,644 MWSU 0 0 --
HWSU 2.385 3.2175 --
HWSU – PCB Waste 0.237 0.054 --
HWAA NA(b) 2.61 --
EODU 0.0383 0 0.0383(c)
(a) Fees paid to the state for HW generated at the NNSS and MLLW wastes received for disposal are based on weight (tons).
(b) Not applicable; amounts of HW received at HWAAs are not tracked. Only the length of time they are stored and the
amounts shipped off from all HWAAs combined are tracked.
(c) 0.0383 tons (76.6 lbs) is the weight of explosive ordnance detonated at the EODU.
Each year NDEP performs a Compliance Evaluation Inspection (CEI) of the RCRA permitted HW units at the NNSS. On April 15 and 16, 2019, NDEP conducted its CEI of the waste units listed in Table 10-6, selected SAAs, Universal Waste Collection Centers and closed historic RCRA waste management units at the NNSS
(Section 11.4). The 2019 CEI documented that NNSA/NFO was compliant with the NNSS Part B Permit.
10.6 Underground Storage Tank (UST) Management
RCRA regulates the storage, transportation, treatment, and disposal of HW to prevent contaminants from leaching into the environment from USTs. Nevada Administrative Code NAC 459.9921–459.999, Storage Tanks, enforces the federal regulations under RCRA pertaining to the maintenance and operation of USTs and the regulated
substances contained in them so as to prevent environmental contamination. On October 13, 2018, new UST regulations went into effect that change the regulatory status of one UST at the Device Assembly Facility (DAF)
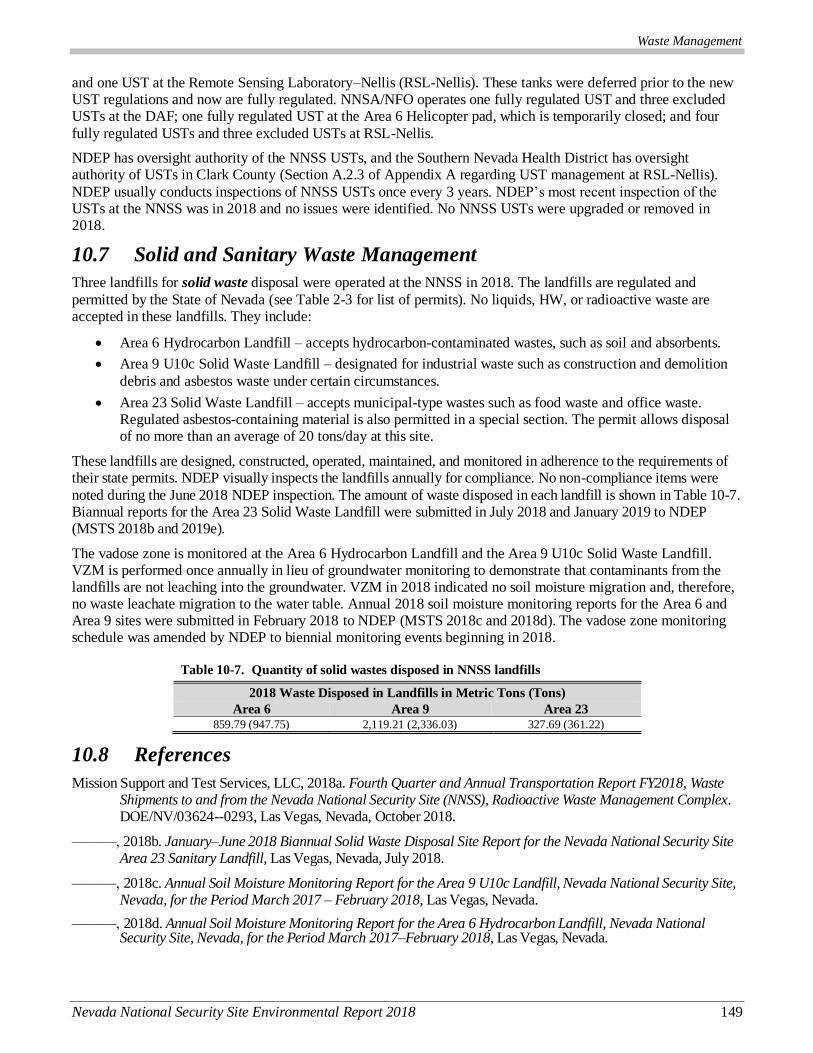
Waste Management
Nevada National Security Site Environmental Report 2018 149
and one UST at the Remote Sensing Laboratory–Nellis (RSL-Nellis). These tanks were deferred prior to the new UST regulations and now are fully regulated. NNSA/NFO operates one fully regulated UST and three excluded USTs at the DAF; one fully regulated UST at the Area 6 Helicopter pad, which is temporarily closed; and four
fully regulated USTs and three excluded USTs at RSL-Nellis.
NDEP has oversight authority of the NNSS USTs, and the Southern Nevada Health District has oversight authority of USTs in Clark County (Section A.2.3 of Appendix A regarding UST management at RSL-Nellis).
NDEP usually conducts inspections of NNSS USTs once every 3 years. NDEP’s most recent inspection of the USTs at the NNSS was in 2018 and no issues were identified. No NNSS USTs were upgraded or removed in 2018.
10.7 Solid and Sanitary Waste Management
Three landfills for solid waste disposal were operated at the NNSS in 2018. The landfills are regulated and
permitted by the State of Nevada (see Table 2-3 for list of permits). No liquids, HW, or radioactive waste are accepted in these landfills. They include:
Area 6 Hydrocarbon Landfill – accepts hydrocarbon-contaminated wastes, such as soil and absorbents.
Area 9 U10c Solid Waste Landfill – designated for industrial waste such as construction and demolition
debris and asbestos waste under certain circumstances.
Area 23 Solid Waste Landfill – accepts municipal-type wastes such as food waste and office waste. Regulated asbestos-containing material is also permitted in a special section. The permit allows disposal of no more than an average of 20 tons/day at this site.
These landfills are designed, constructed, operated, maintained, and monitored in adherence to the requirements of their state permits. NDEP visually inspects the landfills annually for compliance. No non-compliance items were
noted during the June 2018 NDEP inspection. The amount of waste disposed in each landfill is shown in Table 10-7. Biannual reports for the Area 23 Solid Waste Landfill were submitted in July 2018 and January 2019 to NDEP (MSTS 2018b and 2019e).
The vadose zone is monitored at the Area 6 Hydrocarbon Landfill and the Area 9 U10c Solid Waste Landfill. VZM is performed once annually in lieu of groundwater monitoring to demonstrate that contaminants from the landfills are not leaching into the groundwater. VZM in 2018 indicated no soil moisture migration and, therefore, no waste leachate migration to the water table. Annual 2018 soil moisture monitoring reports for the Area 6 and Area 9 sites were submitted in February 2018 to NDEP (MSTS 2018c and 2018d). The vadose zone monitoring schedule was amended by NDEP to biennial monitoring events beginning in 2018.
Table 10-7. Quantity of solid wastes disposed in NNSS landfills
2018 Waste Disposed in Landfills in Metric Tons (Tons)
Area 6 Area 9 Area 23 859.79 (947.75) 2,119.21 (2,336.03) 327.69 (361.22)
10.8 References
Mission Support and Test Services, LLC, 2018a. Fourth Quarter and Annual Transportation Report FY2018, Waste Shipments to and from the Nevada National Security Site (NNSS), Radioactive Waste Management Complex. DOE/NV/03624--0293, Las Vegas, Nevada, October 2018.
———, 2018b. January–June 2018 Biannual Solid Waste Disposal Site Report for the Nevada National Security Site Area 23 Sanitary Landfill, Las Vegas, Nevada, July 2018.
———, 2018c. Annual Soil Moisture Monitoring Report for the Area 9 U10c Landfill, Nevada National Security Site, Nevada, for the Period March 2017 – February 2018, Las Vegas, Nevada.
———, 2018d. Annual Soil Moisture Monitoring Report for the Area 6 Hydrocarbon Landfill, Nevada National Security Site, Nevada, for the Period March 2017–February 2018, Las Vegas, Nevada.
Waste Management
150 Nevada National Security Site Environmental Report 2018
———, 2019a. Maintenance Plan for Performance Assessments and Composite Analyses for the Area 3 and Area 5 Radioactive Waste Managements Sites at the Nevada National Security Site, Revision 3.0. DOE/NV/0362--0423, Las Vegas, Nevada, March 2019.
———, 2019b. 2018 Annual Summary Report for the Area 3 and 5 Radioactive Waste Management Sites at the Nevada National Security Site (Review of Performance Assessments and Composite Analyses). DOE/NV/03624--0388, Las Vegas, Nevada, March 2018.
———, 2019c. Nevada National Security Site 2018 Data Report: Groundwater Monitoring Program Area 5 Radioactive Waste Management Site. DOE/NV/03624--0400, Las Vegas, Nevada.
———, 2019d. Nevada National Security Site 2018 Waste Management Monitoring Report, Area 3 and Area 5 Radioactive Waste Management Site (in review). Las Vegas, Nevada.
———, 2019e. July–December 2018 Biannual Solid Waste Disposal Site Report for the Nevada National Security Site Area 23 Sanitary Landfill, Las Vegas, Nevada, January 2019.
MSTS, see Mission Support and Test Services, LLC.
Environmental Corrective Actions
Nevada National Security Site Environmental Report 2018 151
11.0 Ch11
Chapter 11: Environmental Corrective Actions Irene Farnham and Patrick K. Matthews
Navarro Research and Engineering, Inc.
Jenny B. Chapman and Julianne Miller
Desert Research Institute
Carol F. Dinsman
U.S. Department of Energy, Environmental Management Nevada Program
Environmental Corrective Action Objectives for All Sites
Characterize sites contaminated by activities related to nuclear testing. Remediate contaminated sites in accordance with
Federal Facility Agreement and Consent Order (FFACO)-approved planning documents. Conduct post-closure monitoring
of sites in accordance with FFACO closure documents.
The Environmental Management (EM) Nevada Program is responsible for evaluating and implementing corrective actions on areas of the Nevada National Security Site (NNSS), the Nevada Test and Training Range (NTTR), and the Tonopah Test Range (TTR) impacted by atmospheric and underground nuclear tests conducted from 1951 to 1992, and by other nuclear research and development activities. These areas are referred to as
corrective action sites (CASs). Environmental corrective action strategies are developed based on the nature and extent of contamination, the risks posed by contamination, and future land use. The EM Nevada Program is responsible for approximately 3,000 CASs in Nevada.
CASs are broadly organized into four categories based on the source of contamination: Underground Test Area (UGTA) sites, Industrial sites, Soils sites, and Nevada Offsites. Multiple CASs are grouped into larger, geographic corrective action units (CAUs) according to location, physical and geological characteristics, and/or contaminants. UGTA is the largest component of the EM Nevada Program and includes 878 CASs in five CAUs that are directly related to groundwater in the geographical areas of past underground nuclear testing. Industrial sites are facilities and land that may have become contaminated due to activities conducted in support of nuclear research, development, and testing; and include disposal wells, inactive tanks, contaminated waste sites, inactive
ponds, muck piles, spill sites, drains and sumps, and ordnance sites. Soils sites include areas where nuclear tests have resulted in extensive surface and/or shallow subsurface contamination from radioactive materials and potentially from oils, solvents, heavy metals, and contaminated instruments and test structures used during testing activities. Nevada Offsites are associated with underground nuclear testing at the Project Shoal Area and the Central Nevada Test Area, located in northern and central Nevada, respectively. Nevada Offsites are managed by the U.S. Department of Energy (DOE) Office of Legacy Management.
In April 1996, the DOE, the U.S. Department of Defense, and the State of Nevada entered into an FFACO to address the environmental remediation of CASs. Appendix VI of the FFACO (1996, as amended), describes the strategy to plan, implement, and complete environmental corrective actions (i.e., to “close” the CASs). Environmental corrective action activities follow a formal work process described in the FFACO. The State of
Nevada is a participant throughout the closure process, and the Nevada Site Specific Advisory Board (NSSAB)1 is kept informed of progress. The NSSAB is a federally appointed group of interested citizens and representatives who volunteer to provide informed recommendations to the EM Nevada Program. The NSSAB’s comments are strongly considered throughout the corrective action process. This chapter summarizes actions taken by the EM Nevada Program towards the closure of UGTA, Industrial, and Soils sites in 2018.
11.1 Underground Test Area Sites
From 1951 to 1992, 818 underground tests (UGTs), some involving multiple detonations, were conducted at the NNSS (NNSA/NFO 2015a). Most were conducted hundreds of feet above groundwater; however, more than 200 were within or near the water table2. The test locations (i.e., CASs) are grouped into five CAUs based primarily on geographically distinct areas of underground testing (Figure 11-1). Closure-in-place with institutional controls
1 NSSAB activities can be accessed at http://www.nnss.gov/NSSAB/. 2 The definition of word(s) in bold italics may be found by clicking on the word in electronic version or by referencing the Glossary,
Appendix B. To return from the Glossary, right click and select Previous View.

Environmental Corrective Actions
152 Nevada National Security Site Environmental Report 2018
(e.g., restricting land and groundwater access) and monitoring is considered to be the only feasible corrective action for these sites because cost-effective groundwater technologies have not been developed to effectively and safely remove or stabilize deep subsurface radiological contaminants. As a result, the corrective action for UGTA
CAUs is based on a combination of characterization and modeling studies, monitoring, and institutional controls.
The UGTA CAU corrective action strategy is implemented through a four-stage approach, proceeding from one stage to the next upon approval by Nevada Division of Environmental Protection (NDEP). The corrective action
strategy begins with a planning stage during which characterization and modeling studies are planned and documented in a Corrective Action Investigation Plan. The plan is then implemented during an investigation stage when new data (e.g., new wells, groundwater samples, water levels, geologic, hydrologic testing, field and laboratory studies) are collected and analyzed. These data provide the basis for developing models of the hydrogeologic setting, the radiological source term, and flow and contaminant transport for each CAU. These models are used to identify contaminant boundaries that forecast areas with the potential (95th percentile) to exceed the Safe Drinking Water Act (SDWA) maximum contaminant levels for radionuclides over the next 1,000 years.
Modeling studies continue in a model evaluation stage whereby specific model uncertainties are addressed to build confidence in the model for supporting regulatory decisions regarding development of the monitoring well network and land-use restrictions that protect the public. During the model evaluation stage, regulatory boundary objectives and initial use-restriction boundaries are identified. Once NDEP determines that the model is acceptable, the CAU advances to the closure stage. An alternative strategy for the Rainier Mesa/Shoshone Mountain CAU, following a three-stage process, was agreed upon by NDEP and DOE and implemented beginning in 2013 (see Section 11.1.1.3). The alternative strategy does not include a model evaluation stage. Instead, this CAU advances from the
investigation stage directly to the closure stage.
The characterization and modeling studies are evaluated throughout the investigation and model evaluation stage by a preemptive review committee. CAU-specific preemptive review committees provide internal technical
review of ongoing work to assure work is comprehensive, accurate, in keeping with the state of the art, and consistent with CAU goals (EM Nevada Program 2019a). In addition, an external review process follows the investigation stage. Recommendations are made by the reviewers to support the regulatory decisions that are the responsibility of the EM Nevada Program and NDEP. The numerous investigations and computer modeling for UGTA CAUs are conducted by various participating organizations including Navarro Research and Engineering, Inc. (Navarro); Los Alamos National Laboratory (LANL); Lawrence Livermore National Laboratory (LLNL); the U.S. Geological Survey (USGS); the Desert Research Institute (DRI); and Mission Support and Test Services,
LLC.
During the closure stage, regulatory boundary(ies) and use-restriction boundaries are identified for each CAU in agreement between DOE and NDEP. A Closure Report is then developed to document these boundaries and
describe the monitoring well network and land-use restrictions. The Closure Report requires NDEP approval prior to implementation. UGTA corrective actions are expected to be complete, and long-term closure monitoring networks established and implemented, for all CAUs by fiscal year (FY) 2030 (October 1, 2029–September 30, 2030).
Environmental Corrective Action Objectives for UGTA Sites
Collect data (e.g., new wells, groundwater samples, water levels, geologic, hydrologic testing, field and
laboratory studies) to characterize the hydrogeological setting and nature and extent of contamination.
Develop CAU-specific models of groundwater flow and contaminant transport.
Identify boundaries within which contaminants are forecasted to potentially (95th percentile) exceed the SDWA limits at any time within a 1,000-year compliance period.
Negotiate and implement regulatory boundary objectives and regulatory boundaries to protect the public and environment from the effects of radioactive contaminant migration.
Negotiate and implement use-restriction boundaries to restrict access to contaminated groundwater.
Develop and implement a long-term closure monitoring network to verify consistency with the flow and transport models, compliance to the regulatory boundary, and protection of human health and the environment.
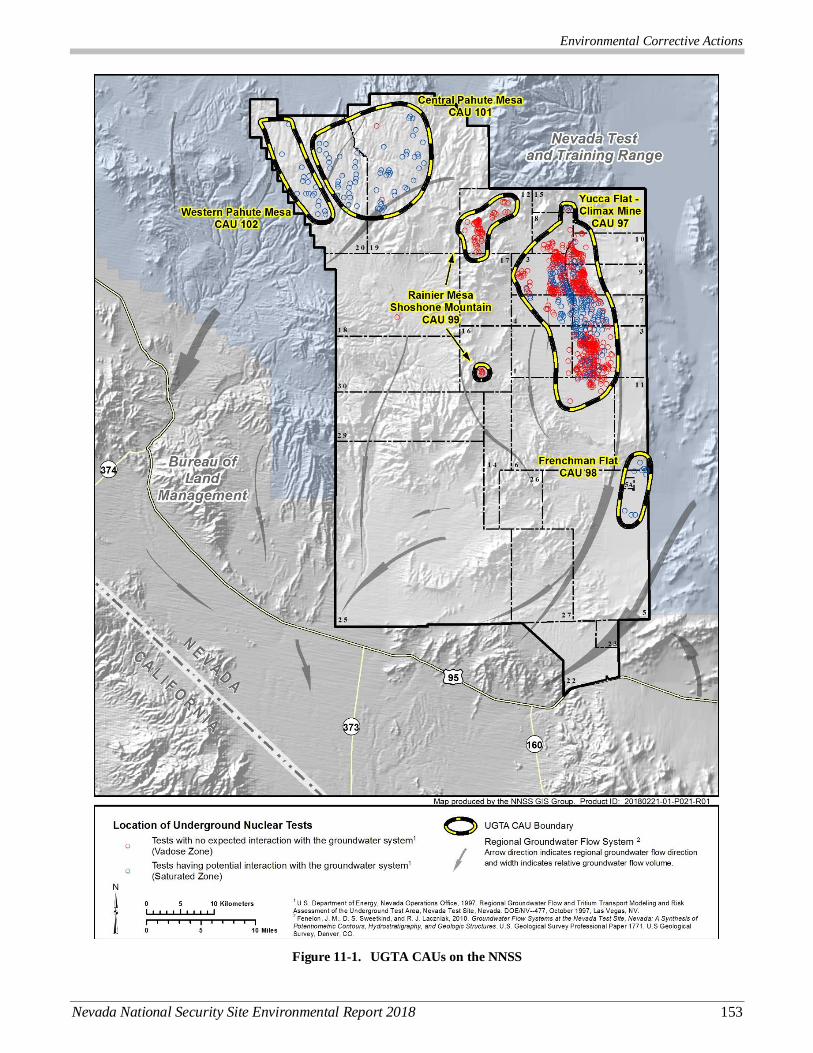
Environmental Corrective Actions
Nevada National Security Site Environmental Report 2018 153
Figure 11-1. UGTA CAUs on the NNSS

Environmental Corrective Actions
154 Nevada National Security Site Environmental Report 2018
Figure 11-2. Groundwater flow systems of the NNSS
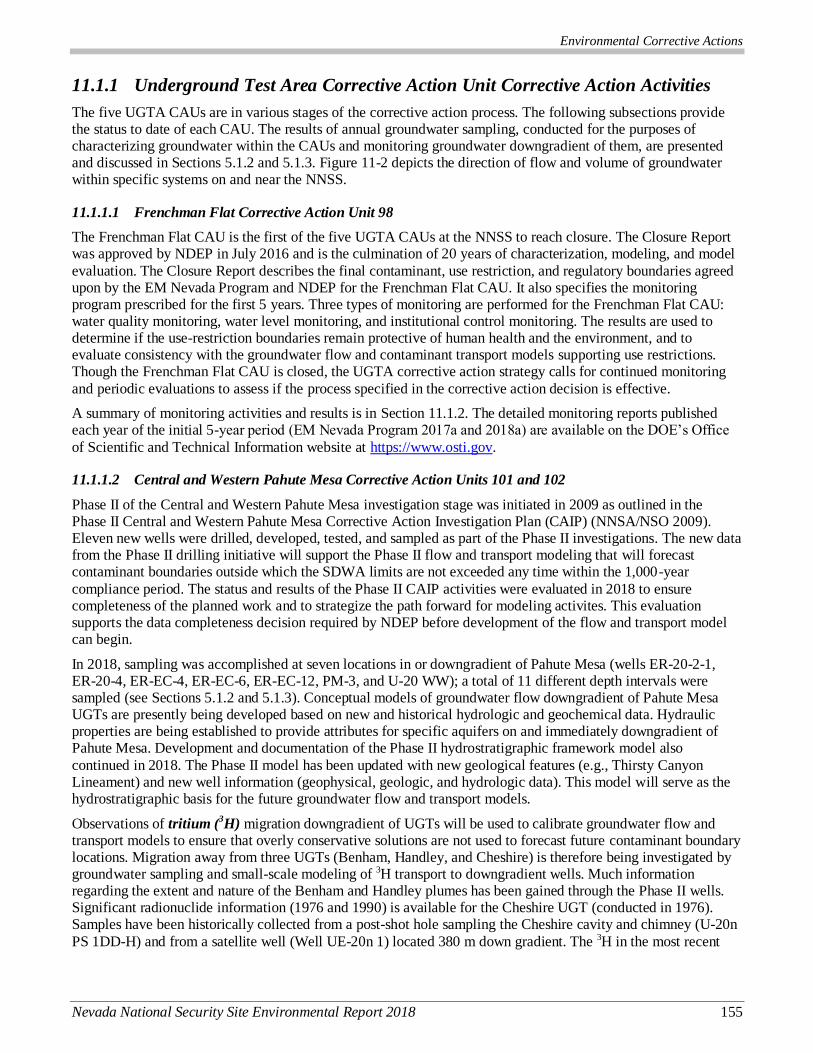
Environmental Corrective Actions
Nevada National Security Site Environmental Report 2018 155
11.1.1 Underground Test Area Corrective Action Unit Corrective Action Activities
The five UGTA CAUs are in various stages of the corrective action process. The following subsections provide the status to date of each CAU. The results of annual groundwater sampling, conducted for the purposes of characterizing groundwater within the CAUs and monitoring groundwater downgradient of them, are presented and discussed in Sections 5.1.2 and 5.1.3. Figure 11-2 depicts the direction of flow and volume of groundwater within specific systems on and near the NNSS.
11.1.1.1 Frenchman Flat Corrective Action Unit 98
The Frenchman Flat CAU is the first of the five UGTA CAUs at the NNSS to reach closure. The Closure Report was approved by NDEP in July 2016 and is the culmination of 20 years of characterization, modeling, and model
evaluation. The Closure Report describes the final contaminant, use restriction, and regulatory boundaries agreed upon by the EM Nevada Program and NDEP for the Frenchman Flat CAU. It also specifies the monitoring program prescribed for the first 5 years. Three types of monitoring are performed for the Frenchman Flat CAU: water quality monitoring, water level monitoring, and institutional control monitoring. The results are used to determine if the use-restriction boundaries remain protective of human health and the environment, and to evaluate consistency with the groundwater flow and contaminant transport models supporting use restrictions. Though the Frenchman Flat CAU is closed, the UGTA corrective action strategy calls for continued monitoring
and periodic evaluations to assess if the process specified in the corrective action decision is effective.
A summary of monitoring activities and results is in Section 11.1.2. The detailed monitoring reports published each year of the initial 5-year period (EM Nevada Program 2017a and 2018a) are available on the DOE’s Office
of Scientific and Technical Information website at https://www.osti.gov.
11.1.1.2 Central and Western Pahute Mesa Corrective Action Units 101 and 102
Phase II of the Central and Western Pahute Mesa investigation stage was initiated in 2009 as outlined in the Phase II Central and Western Pahute Mesa Corrective Action Investigation Plan (CAIP) (NNSA/NSO 2009). Eleven new wells were drilled, developed, tested, and sampled as part of the Phase II investigations. The new data from the Phase II drilling initiative will support the Phase II flow and transport modeling that will forecast contaminant boundaries outside which the SDWA limits are not exceeded any time within the 1,000-year
compliance period. The status and results of the Phase II CAIP activities were evaluated in 2018 to ensure completeness of the planned work and to strategize the path forward for modeling activites. This evaluation supports the data completeness decision required by NDEP before development of the flow and transport model can begin.
In 2018, sampling was accomplished at seven locations in or downgradient of Pahute Mesa (wells ER-20-2-1, ER-20-4, ER-EC-4, ER-EC-6, ER-EC-12, PM-3, and U-20 WW); a total of 11 different depth intervals were sampled (see Sections 5.1.2 and 5.1.3). Conceptual models of groundwater flow downgradient of Pahute Mesa UGTs are presently being developed based on new and historical hydrologic and geochemical data. Hydraulic properties are being established to provide attributes for specific aquifers on and immediately downgradient of Pahute Mesa. Development and documentation of the Phase II hydrostratigraphic framework model also
continued in 2018. The Phase II model has been updated with new geological features (e.g., Thirsty Canyon Lineament) and new well information (geophysical, geologic, and hydrologic data). This model will serve as the hydrostratigraphic basis for the future groundwater flow and transport models.
Observations of tritium (3H) migration downgradient of UGTs will be used to calibrate groundwater flow and
transport models to ensure that overly conservative solutions are not used to forecast future contaminant boundary locations. Migration away from three UGTs (Benham, Handley, and Cheshire) is therefore being investigated by groundwater sampling and small-scale modeling of 3H transport to downgradient wells. Much information regarding the extent and nature of the Benham and Handley plumes has been gained through the Phase II wells. Significant radionuclide information (1976 and 1990) is available for the Cheshire UGT (conducted in 1976). Samples have been historically collected from a post-shot hole sampling the Cheshire cavity and chimney (U-20n
PS 1DD-H) and from a satellite well (Well UE-20n 1) located 380 m down gradient. The 3H in the most recent
Environmental Corrective Actions
156 Nevada National Security Site Environmental Report 2018
sample was reported as 33,300,000 picocuries per liter (pCi/L) (2005) and 55,500,000 pCi/L (2012) from the Cheshire cavity and downgradient well, respectively (Table 5-4 and Figure 5-2).
To date, the maximum concentration of 3H observed offsite (reported as 18,400 pCi/L in 2017; Table 5-4) is at the Phase II Well ER-EC-11 located approximately 3.2 kilometers (km) (2 miles [mi]) from the Benham UGT (conducted in 1968). Well ER-EC-11 is on the NTTR approximately 0.72 km (0.45 mi) west of the NNSS boundary (Figure 5-2). The conceptual model assumes that thermally driven flow transports contaminants upward
through the rubble of the UGT collapse chimney to the relatively permeable aquifers above the detonation point. Horizontal transport occurs through these aquifers along the regional hydraulic gradient. This is demonstrated by the decrease of 3H concentrations in a southward direction, with 24,800,000 pCi/L measured at Well ER-20-5-1 (2015), 13,600,000 pCi/L at Well ER-20-7 (2017), 202,000 pCi/L at Well ER-20-11 (2017), 18,400 pCi/L at Well ER-EC-11 (2017), 6,600 pCi/L at Well ER-20-8 (2017), and 3,670 pCi/L at Well ER-20-8-2 (2017) (Table 5-4 and Figure 5-2). LANL is currently applying their advanced computing capabilities to develop a model of this area to better understand migration from the Benham-Tybo UGTs, and to forecast the potential extent of the
contaminant plume over the next 1,000 years.
Tritium migration from the Handley UGT is being evaluated at wells ER-20-12 and PM-3. Well ER-20-12, a Phase II well, is located in the far northwestern portion of the NNSS, approximately 2.3 km (1.4 mi)
south-southwest of the Handley UGT and approximately 5.1 km (3.2 mi) north-northeast of Well PM-3. Elevated 3H levels in the most shallow (58,100 pCi/L) and deepest (41,600 pCi/L) intervals when compared to intermediate intervals within Well ER-20-12 suggest stratification of the Handley plume. The high 3H observed at a depth above the UGT detonation point (1,209 meters [m], or 3,967 feet [ft] below ground surface) is consistent with the conceptual model of radionuclide migration upward in the UGT chimney. The maximum 3H concentration at Well PM-3, located approximately 5.1 km (3.2 mi) south-southwest of Well ER-20-12, was reported as 574 pCi/L in 2018 (Table 5-4). This is less than 3% of the SDWA maximum contaminant level.
11.1.1.3 Rainier Mesa/Shoshone Mountain Corrective Action Unit 99
The Rainier Mesa/Shoshone Mountain CAU is near the end of the investigation stage of the closure process. An
alternative modeling strategy to close the Rainier Mesa/Shoshone Mountain CAU, unique from the other UGTA CAUs, was accepted by NDEP in 2013. Instead of developing complex models to forecast potential contaminated volumes (i.e., contaminant boundaries), simpler models were developed to investigate potential directions and distances of contaminated groundwater away from the UGTs. Potential flow paths, identified based on the hydrogeological conceptual model and regional groundwater flow information, were evaluated by these models.
Tritium observations in wells in the vicinity of the flow paths (wells ER-19-1, ER-12-3, and TW-1; Figure 5 4) were compared to the simulation results.
Implementation of the revised strategy continued in 2018. The contamination is forecast to remain well within the
boundaries of the NNSS, where institutional controls will prevent inadvertent access to contaminated groundwater. The very deep water table at Shoshone Mountain, overlain by a thick unsaturated zone, resulted in no simulations for which radionuclides exceeded the SDWA limits at the water table. Therefore, there were no simulations with transport away from Shoshone Mountain within 1,000 years.
In 2018, the Rainier Mesa/Shoshone Mountain Flow and Transport Model Report describing the extensive modeling and associated results was completed (EM Nevada Program 2018b) and reviewed by a peer review panel. Peer review panel expertise included hydrogeology, transport modeling, regulatory implementation, and closure of complex groundwater sites. The panel concluded that the implementation of the alternative modeling strategy is both regulatory and technically a sound course of action and also provided some technical recommendations to improve the defensibility of the modeling results (Navarro 2018a). NDEP assessed the
panel’s recommendations and provided EM Nevada Program comments to address before they would accept the
CAU model for advancement to the closure stage. An addendum was developed in 2018 to address NDEP’s
comments. The addendum provides additional analyses, insights, and explanations to the Rainier Mesa/Shoshone Mountain Flow and Transport Model Report. The addendum was submitted to NDEP in April 2019 (EM Nevada Program 2019b).
Environmental Corrective Actions
Nevada National Security Site Environmental Report 2018 157
11.1.1.4 Yucca Flat/Climax Mine Corrective Action Unit 97
The Yucca Flat/Climax Mine CAU is in the model evaluation stage of the closure process (FFACO 1996, as amended). A Corrective Action Decision Document/Corrective Action Plan describing the model evaluation plan, initial use-restriction boundaries, and regulatory boundary objective was approved by NDEP in 2017 (EM Nevada Program 2017b). The regulatory boundary objective for the Yucca Flat/Climax Mine CAU is to verify that radionuclide contamination from the Yucca Flat/Climax Mine CAU is contained within the Yucca Flat basin, thus
not impacting the Frenchman Flat lower carbonate aquifer or downgradient receptors.
The focus of model evaluation is to reduce uncertainty in the contaminant boundary extent and build confidence
in the final models to support regulatory decisions, including finalizing use-restriction boundaries and regulatory boundaries; and siting monitoring wells during closure. A specific goal for the Yucca Flat/Climax Mine model evaluation is to refine the groundwater and contaminant transport model to be more realistic than the present model, which is considered overly conservative (EM Nevada Program 2017b).
Data collection and analysis activities used to reduce uncertainties leading to model conservativism were completed in 2018. Hydrologic and radionuclide data were evaluated for fifteen wells that access the lower carbonate aquifer (LCA) within the Yucca Flat basin. This included the three new model evaluation wells (wells ER-2-2, ER-3-3, and ER-4-1) drilled near UGTs considered most likely to have impacted the LCA. Understanding radionuclide transport within the regional carbonate aquifer was identified as the highest priority for this CAU because it is the only pathway for radionuclides to migrate out of the basin. Either very low (12.2 to
53 pCi/L) to no 3H was observed in the Yucca Flat LCA, with the exception of one well (Well UE-2ce) where 3H was reported as 144,000 pCi/L (Table 5-4). Well UE-2ce is located 183 m (600 ft) south of the Nash UGT which was detonated within the carbonate aquifer near the water table. UE-2ce was used to support of radionuclide migration experiments where approximately eleven million gallons of groundwater were pumped between 1977 and 1984 (Buddemeier and Isherwood 1985). Although the 3H activity greatly exceeded the 20,000-pCi/L maximum contaminant level, no radionuclides other than 3H exceeded its maximum contaminant level in the recent Well UE-2ce groundwater samples. The lack of 3H migration from the shallow volcanic rock units to the
deeper carbonate aquifer demonstrates the effectiveness of the confining units that overlie the carbonate aquifer as barriers to contaminant migration. The lack of 3H at Well ER-3-3 and other wells located near a fault, also indicates that contaminant migration within the faults is limited. Both of these observations verify the conceptual model that UGTs not intersecting the carbonate aquifer have a negligible impact on migration within the regional carbonate aquifer and outside of the basin.
Other important model evaluation activities completed in 2018 include (1) reanalysis of the Well ER-6-1-2 multiple well aquifer test to characterize groundwater flux through the testing area; (2) estimating boundary fluxes using a regional, three-dimensional groundwater-flow model, referred to as the Death Valley version 3 model; and (3) analyzing the results of the ER-4-1 aquifer tests. These activities were performed by the USGS.
In 2018, the results of model evaluation activities were used to refine the groundwater flow and contaminant transport model. The work was reviewed by the Yucca Flat/Climax Mine preemptive review committee throughout 2018. A total of six meetings were conducted with the review committee. Committee suggestions were addressed during the ongoing work. The Model Evaluation Report describing this work was submitted to NDEP
in May 2019.
11.1.2 Post-Closure Monitoring of Frenchman Flat
The Closure Report for the Frenchman Flat CAU, approved by NDEP in 2016, specifies a monitoring program for the first 5 years post-closure (NNSA/NFO 2016). Three types of monitoring are performed under this program: water quality, water level, and institutional control monitoring. The monitoring objective is to determine if the use-restriction boundaries identified for the Frenchman Flat CAU remain protective of human health and the environment. Additionally, water quality and water-level monitoring is used to evaluate consistency with the groundwater flow and contaminant transport conceptual and numerical models. Such consistency is important
because the models are the primary basis for use-restriction boundaries. The Frenchman Flat CAU use-restriction, contaminant, and regulatory boundaries are identified in Figure 11-3.
Environmental Corrective Actions
158 Nevada National Security Site Environmental Report 2018
The Frenchman Flat Post-Closure Monitoring Network includes the following 17 wells (Figure 11-3), five of which are sampled for water quality and water levels (Q/L), 1 for only water quality (Q), and 11 for only water levels (L):
ER-5-3 Deep Piezometer (L) ER-5-4 Main (L) RNM-1 (L) WW-5B (L)
ER-5-3 Main (Upper Zone) (L) ER-5-4 Piezometer (L) RNM-2S (Q/L) WW-4 (L)
ER-5-3 Shallow Piezometer (Q) ER-5-4-2 (L) UE-5n (Q/L) WW-4A (L)
ER-5-3-2 (Q/L) ER-5-5 (Q/L) WW-5A (L) ER-11-2 (Q/L)
ER-5-3-3 (L)
The six wells sampled for water quality include one Characterization, two Source/Plume, and three Early Detection wells within the CAU. Records of Technical Change have been established to reclassify these wells as new data are collected and evaluated. The contaminants for which each of the six wells were sampled, based on the well type, are described in Section 5.1.1, and the 2018 analytical results for 3H are presented in Table 5-4. Tritium at a concentration above the regulatory approved minimum detection limit is present in only the two Source/Plume wells previously identified as containing contamination as a result of a radionuclide migration
experiment (wells RNM-2S and UE-5n). The 3H concentration in Well RNM-2S is about 5% lower than in 2017, but remains more than an order of magnitude less than the peak value measured in 1980. The concentration in Well UE-5n continues to slowly decrease, being almost 7% lower than in 2017.
Depth to water measured in 2018 in the 16 water level monitoring wells is generally consistent with measurements taken in recent years. A long-term declining water level trend exists in most of the wells completed in the alluvium and is primarily attributed to drawdown from basin-scale pumping. Groundwater has been pumped from wells in the central and southern part of the Frenchman Flat basin since the 1950s.
Rising water levels are observed in two deep wells and one former water supply well, and variable water levels occur in the three current production wells. The lowered water level in Well ER-5-3-2, observed since 2016, remains unexplained.
The objective of the Frenchman Flat CAU regulatory boundary is to protect receptors downgradient of the Rock Valley fault system from radionuclide contamination. Although contaminants resulting from UGTs are not forecast to migrate out of the basin within the next 1,000 years, the Rock Valley fault system is the expected groundwater migration pathway. The negotiated regulatory boundary is established at the interface of the Alluvial/Volcanic aquifer and the Rock Valley fault (Figure 11-3). If radionuclides reach this boundary, EM
Nevada Program is required to submit a plan to NDEP that will meet the CAU’s regulatory boundary objectives. All monitoring results indicate that the regulatory boundary objective has been met.
Institutional control monitoring confirmed that use restrictions are recorded in land management systems maintained by the U.S. Department of Energy, National Nuclear Security Administration Nevada Field Office (NNSA/NFO) and the U.S. Air Force, and no activities within Frenchman Flat basin are occurring that could potentially affect the contaminant boundaries. A survey of groundwater resources in basins surrounding Frenchman Flat similarly identified no current or pending development that would indicate the need to increase monitoring activities or otherwise cause concern for the closure decision. Use restrictions continue to prevent exposure to the public, workers, and the environment from contaminants of concern by preventing the use of potentially contaminated groundwater.
11.1.3 Quality Assurance
The UGTA Quality Assurance Plan (QAP) (NNSA/NFO 2015b) provides the overall quality assurance requirements and general quality practices applied to UGTA activities including drilling, laboratory analyses, and modeling. The UGTA QAP complies with DOE Order DOE O 414.1D, Quality Assurance; Guidance for Quality Assurance Project Plans for Modeling (EPA QA/G-5M) (EPA 2002); and Guidance on the Development, Evaluation, and Application of Environmental Models (EPA 2009). UGTA work is conducted under the UGTA QAP in conjunction with other UGTA participants’ quality assurance programs. In 2018, quality assurance included conducting oversight assessments, identifying findings and completing corrective actions, and evaluating laboratory
performance. In addition, UGTA documents and models undergo thorough preemptive reviews throughout the investigation and model evaluation stages of the CAU closure process as well an independent formal peer review at
Environmental Corrective Actions
Nevada National Security Site Environmental Report 2018 159
the end of the investigation stage. Chapter 14 discusses the quality assurance and quality control procedures used for collecting and analyzing groundwater samples.
11.1.4 Other Activities and Studies
Compiling, evaluating, and updating various databases (e.g., chemistry, water level, hydraulic properties,
hydrostratigraphy) is an ongoing effort. In 2018, the USGS continued their water-level monitoring program and also continued work on revising their regional model of groundwater flow within the Death Valley regional flow system. Water levels and other pertinent NNSS information and data sets can be accessed through the USGS/DOE Cooperative Studies in Nevada website at http://nevada.usgs.gov/doe_nv/. This work is also published in several USGS 2018 reports (Elliott and Fenelon 2018; Elliott and Moreo 2018; Frus and Halford 2018; and Wood 2018).
In addition, several investigations were completed in 2018 including 1) an evaluation of archived gamma data to estimate detectable radionuclide activities in historical NNSS groundwater samples (Finnegan and Birdsell 2018); 2) comparison of tritium activities observed in bailed versus pumped samples (Hershey 2018); 3) evaluation of four Pahute Mesa post shot wells (Heintz et al 2018b); 4) Evaluation and modeling of two Rainier Mesa tests, Wineskin and Clearwater (Carle 2018a); 5) analysis of water-level trends in the Pahute Mesa-Oasis Valley Groundwater Basin
(Jackson and Fenelon 2018b).
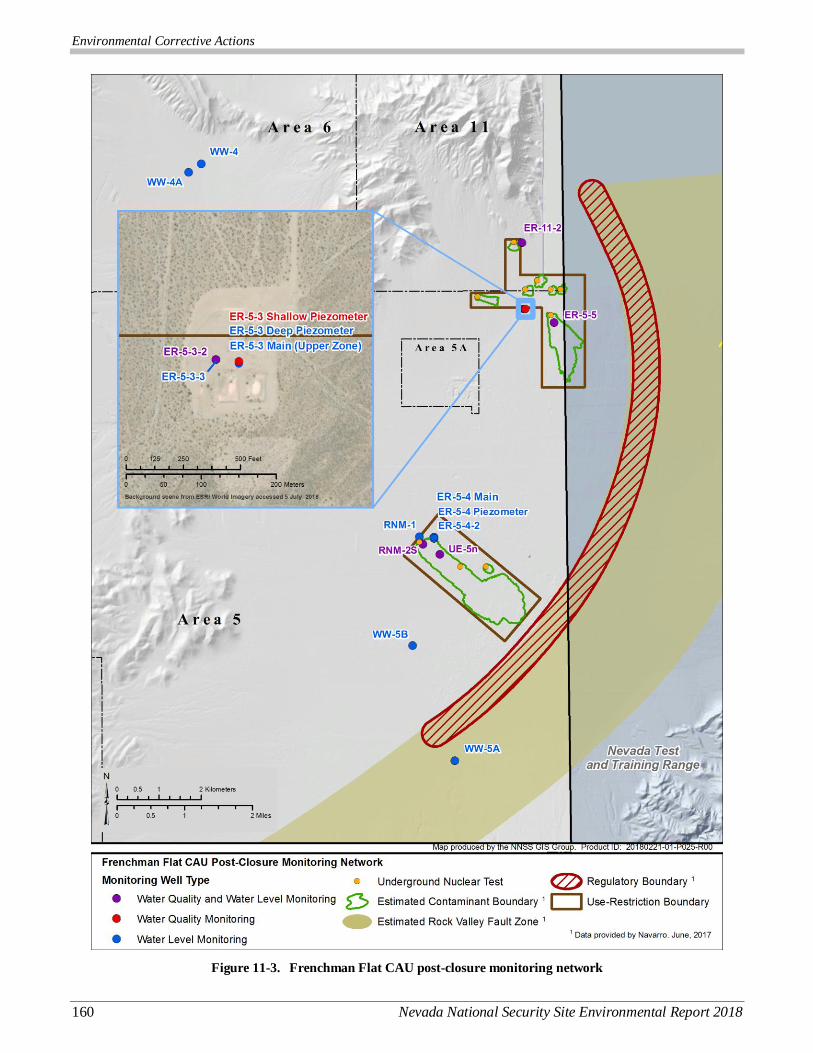
Environmental Corrective Actions
160 Nevada National Security Site Environmental Report 2018
Figure 11-3. Frenchman Flat CAU post-closure monitoring network
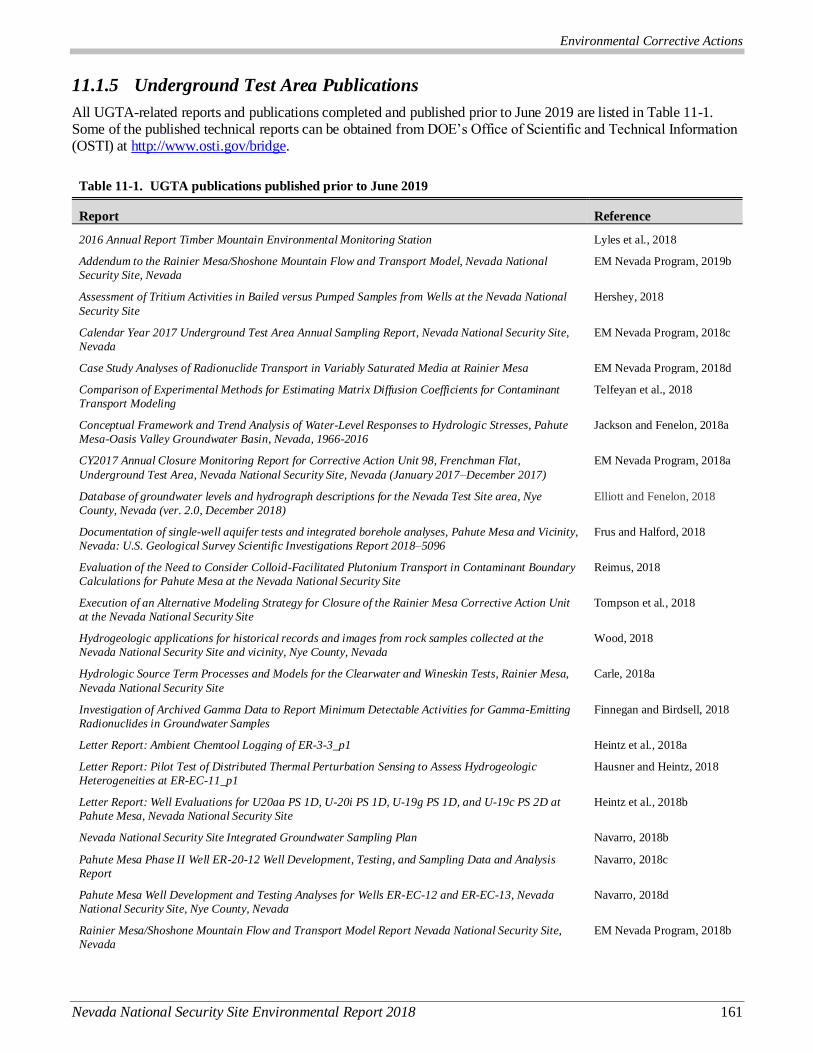
Environmental Corrective Actions
Nevada National Security Site Environmental Report 2018 161
11.1.5 Underground Test Area Publications
All UGTA-related reports and publications completed and published prior to June 2019 are listed in Table 11-1. Some of the published technical reports can be obtained from DOE’s Office of Scientific and Technical Information (OSTI) at http://www.osti.gov/bridge.
Table 11-1. UGTA publications published prior to June 2019
Report Reference
2016 Annual Report Timber Mountain Environmental Monitoring Station Lyles et al., 2018
Addendum to the Rainier Mesa/Shoshone Mountain Flow and Transport Model, Nevada National
Security Site, Nevada
EM Nevada Program, 2019b
Assessment of Tritium Activities in Bailed versus Pumped Samples from Wells at the Nevada National
Security Site
Hershey, 2018
Calendar Year 2017 Underground Test Area Annual Sampling Report, Nevada National Security Site,
Nevada
EM Nevada Program, 2018c
Case Study Analyses of Radionuclide Transport in Variably Saturated Media at Rainier Mesa EM Nevada Program, 2018d
Comparison of Experimental Methods for Estimating Matrix Diffusion Coefficients for Contaminant
Transport Modeling
Telfeyan et al., 2018
Conceptual Framework and Trend Analysis of Water-Level Responses to Hydrologic Stresses, Pahute
Mesa-Oasis Valley Groundwater Basin, Nevada, 1966-2016
Jackson and Fenelon, 2018a
CY2017 Annual Closure Monitoring Report for Corrective Action Unit 98, Frenchman Flat,
Underground Test Area, Nevada National Security Site, Nevada (January 2017–December 2017)
EM Nevada Program, 2018a
Database of groundwater levels and hydrograph descriptions for the Nevada Test Site area, Nye
County, Nevada (ver. 2.0, December 2018)
Elliott and Fenelon, 2018
Documentation of single-well aquifer tests and integrated borehole analyses, Pahute Mesa and Vicinity,
Nevada: U.S. Geological Survey Scientific Investigations Report 2018–5096
Frus and Halford, 2018
Evaluation of the Need to Consider Colloid-Facilitated Plutonium Transport in Contaminant Boundary
Calculations for Pahute Mesa at the Nevada National Security Site
Reimus, 2018
Execution of an Alternative Modeling Strategy for Closure of the Rainier Mesa Corrective Action Unit
at the Nevada National Security Site
Tompson et al., 2018
Hydrogeologic applications for historical records and images from rock samples collected at the
Nevada National Security Site and vicinity, Nye County, Nevada
Wood, 2018
Hydrologic Source Term Processes and Models for the Clearwater and Wineskin Tests, Rainier Mesa,
Nevada National Security Site
Carle, 2018a
Investigation of Archived Gamma Data to Report Minimum Detectable Activities for Gamma-Emitting
Radionuclides in Groundwater Samples
Finnegan and Birdsell, 2018
Letter Report: Ambient Chemtool Logging of ER-3-3_p1 Heintz et al., 2018a
Letter Report: Pilot Test of Distributed Thermal Perturbation Sensing to Assess Hydrogeologic
Heterogeneities at ER-EC-11_p1
Hausner and Heintz, 2018
Letter Report: Well Evaluations for U20aa PS 1D, U-20i PS 1D, U-19g PS 1D, and U-19c PS 2D at
Pahute Mesa, Nevada National Security Site
Heintz et al., 2018b
Nevada National Security Site Integrated Groundwater Sampling Plan Navarro, 2018b
Pahute Mesa Phase II Well ER-20-12 Well Development, Testing, and Sampling Data and Analysis
Report
Navarro, 2018c
Pahute Mesa Well Development and Testing Analyses for Wells ER-EC-12 and ER-EC-13, Nevada
National Security Site, Nye County, Nevada
Navarro, 2018d
Rainier Mesa/Shoshone Mountain Flow and Transport Model Report Nevada National Security Site,
Nevada
EM Nevada Program, 2018b
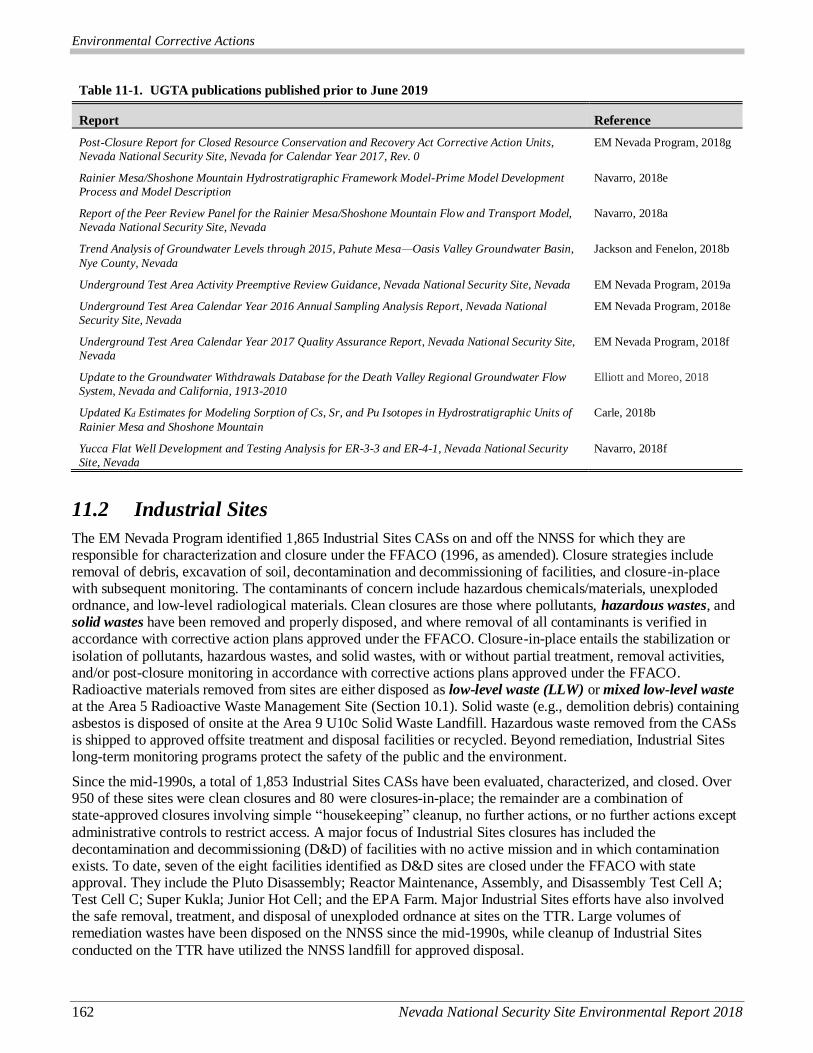
Environmental Corrective Actions
162 Nevada National Security Site Environmental Report 2018
Table 11-1. UGTA publications published prior to June 2019
Report Reference
Post-Closure Report for Closed Resource Conservation and Recovery Act Corrective Action Units,
Nevada National Security Site, Nevada for Calendar Year 2017, Rev. 0
EM Nevada Program, 2018g
Rainier Mesa/Shoshone Mountain Hydrostratigraphic Framework Model-Prime Model Development
Process and Model Description
Navarro, 2018e
Report of the Peer Review Panel for the Rainier Mesa/Shoshone Mountain Flow and Transport Model,
Nevada National Security Site, Nevada
Navarro, 2018a
Trend Analysis of Groundwater Levels through 2015, Pahute Mesa—Oasis Valley Groundwater Basin,
Nye County, Nevada
Jackson and Fenelon, 2018b
Underground Test Area Activity Preemptive Review Guidance, Nevada National Security Site, Nevada EM Nevada Program, 2019a
Underground Test Area Calendar Year 2016 Annual Sampling Analysis Report, Nevada National
Security Site, Nevada
EM Nevada Program, 2018e
Underground Test Area Calendar Year 2017 Quality Assurance Report, Nevada National Security Site,
Nevada
EM Nevada Program, 2018f
Update to the Groundwater Withdrawals Database for the Death Valley Regional Groundwater Flow
System, Nevada and California, 1913-2010
Elliott and Moreo, 2018
Updated Kd Estimates for Modeling Sorption of Cs, Sr, and Pu Isotopes in Hydrostratigraphic Units of
Rainier Mesa and Shoshone Mountain
Carle, 2018b
Yucca Flat Well Development and Testing Analysis for ER-3-3 and ER-4-1, Nevada National Security
Site, Nevada
Navarro, 2018f
11.2 Industrial Sites
The EM Nevada Program identified 1,865 Industrial Sites CASs on and off the NNSS for which they are responsible for characterization and closure under the FFACO (1996, as amended). Closure strategies include removal of debris, excavation of soil, decontamination and decommissioning of facilities, and closure-in-place with subsequent monitoring. The contaminants of concern include hazardous chemicals/materials, unexploded ordnance, and low-level radiological materials. Clean closures are those where pollutants, hazardous wastes, and solid wastes have been removed and properly disposed, and where removal of all contaminants is verified in accordance with corrective action plans approved under the FFACO. Closure-in-place entails the stabilization or
isolation of pollutants, hazardous wastes, and solid wastes, with or without partial treatment, removal activities, and/or post-closure monitoring in accordance with corrective actions plans approved under the FFACO. Radioactive materials removed from sites are either disposed as low-level waste (LLW) or mixed low-level waste
at the Area 5 Radioactive Waste Management Site (Section 10.1). Solid waste (e.g., demolition debris) containing asbestos is disposed of onsite at the Area 9 U10c Solid Waste Landfill. Hazardous waste removed from the CASs is shipped to approved offsite treatment and disposal facilities or recycled. Beyond remediation, Industrial Sites long-term monitoring programs protect the safety of the public and the environment.
Since the mid-1990s, a total of 1,853 Industrial Sites CASs have been evaluated, characterized, and closed. Over 950 of these sites were clean closures and 80 were closures-in-place; the remainder are a combination of state-approved closures involving simple “housekeeping” cleanup, no further actions, or no further actions except
administrative controls to restrict access. A major focus of Industrial Sites closures has included the decontamination and decommissioning (D&D) of facilities with no active mission and in which contamination exists. To date, seven of the eight facilities identified as D&D sites are closed under the FFACO with state approval. They include the Pluto Disassembly; Reactor Maintenance, Assembly, and Disassembly Test Cell A; Test Cell C; Super Kukla; Junior Hot Cell; and the EPA Farm. Major Industrial Sites efforts have also involved the safe removal, treatment, and disposal of unexploded ordnance at sites on the TTR. Large volumes of remediation wastes have been disposed on the NNSS since the mid-1990s, while cleanup of Industrial Sites
conducted on the TTR have utilized the NNSS landfill for approved disposal.
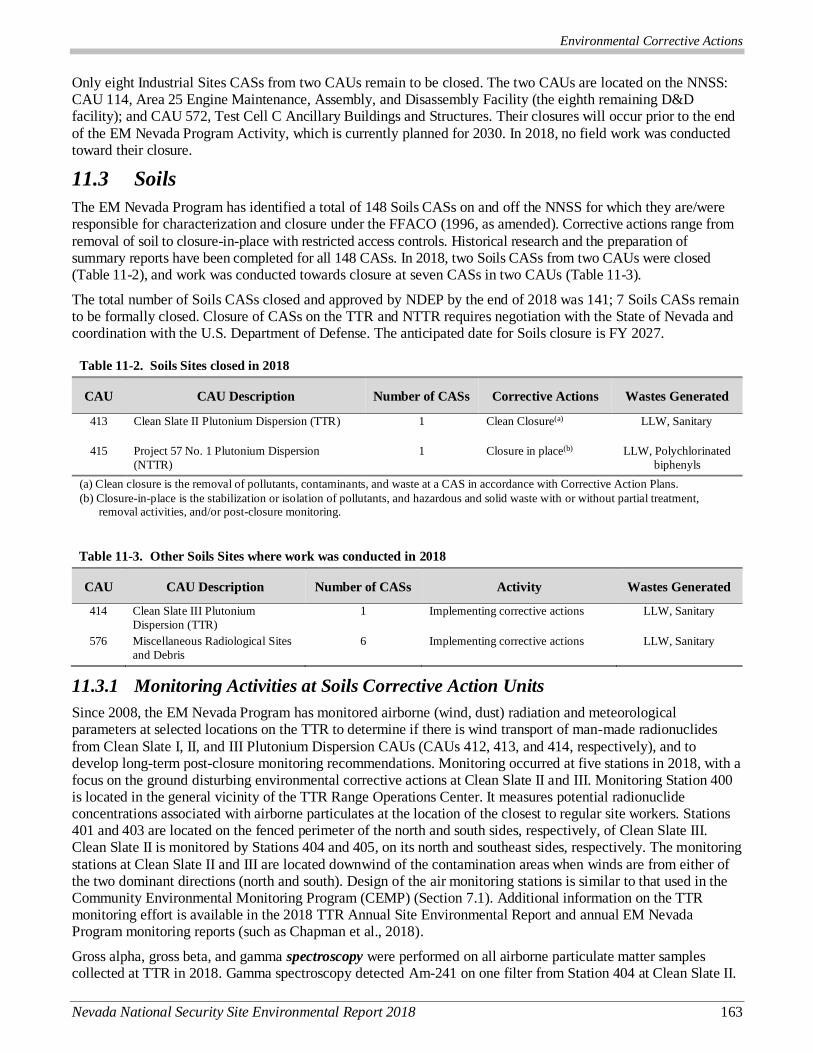
Environmental Corrective Actions
Nevada National Security Site Environmental Report 2018 163
Only eight Industrial Sites CASs from two CAUs remain to be closed. The two CAUs are located on the NNSS: CAU 114, Area 25 Engine Maintenance, Assembly, and Disassembly Facility (the eighth remaining D&D facility); and CAU 572, Test Cell C Ancillary Buildings and Structures. Their closures will occur prior to the end
of the EM Nevada Program Activity, which is currently planned for 2030. In 2018, no field work was conducted toward their closure.
11.3 Soils
The EM Nevada Program has identified a total of 148 Soils CASs on and off the NNSS for which they are/were responsible for characterization and closure under the FFACO (1996, as amended). Corrective actions range from
removal of soil to closure-in-place with restricted access controls. Historical research and the preparation of summary reports have been completed for all 148 CASs. In 2018, two Soils CASs from two CAUs were closed (Table 11-2), and work was conducted towards closure at seven CASs in two CAUs (Table 11-3).
The total number of Soils CASs closed and approved by NDEP by the end of 2018 was 141; 7 Soils CASs remain to be formally closed. Closure of CASs on the TTR and NTTR requires negotiation with the State of Nevada and coordination with the U.S. Department of Defense. The anticipated date for Soils closure is FY 2027.
Table 11-2. Soils Sites closed in 2018
CAU CAU Description Number of CASs Corrective Actions Wastes Generated
413 Clean Slate II Plutonium Dispersion (TTR) 1 Clean Closure(a) LLW, Sanitary
415 Project 57 No. 1 Plutonium Dispersion
(NTTR)
1 Closure in place(b) LLW, Polychlorinated
biphenyls
(a) Clean closure is the removal of pollutants, contaminants, and waste at a CAS in accordance with Corrective Action Plans.
(b) Closure-in-place is the stabilization or isolation of pollutants, and hazardous and solid waste with or without partial treatment, removal activities, and/or post-closure monitoring.
Table 11-3. Other Soils Sites where work was conducted in 2018
CAU CAU Description Number of CASs Activity Wastes Generated
414 Clean Slate III Plutonium
Dispersion (TTR)
1 Implementing corrective actions LLW, Sanitary
576 Miscellaneous Radiological Sites
and Debris
6 Implementing corrective actions LLW, Sanitary
11.3.1 Monitoring Activities at Soils Corrective Action Units
Since 2008, the EM Nevada Program has monitored airborne (wind, dust) radiation and meteorological parameters at selected locations on the TTR to determine if there is wind transport of man-made radionuclides
from Clean Slate I, II, and III Plutonium Dispersion CAUs (CAUs 412, 413, and 414, respectively), and to develop long-term post-closure monitoring recommendations. Monitoring occurred at five stations in 2018, with a focus on the ground disturbing environmental corrective actions at Clean Slate II and III. Monitoring Station 400 is located in the general vicinity of the TTR Range Operations Center. It measures potential radionuclide concentrations associated with airborne particulates at the location of the closest to regular site workers. Stations 401 and 403 are located on the fenced perimeter of the north and south sides, respectively, of Clean Slate III. Clean Slate II is monitored by Stations 404 and 405, on its north and southeast sides, respectively. The monitoring
stations at Clean Slate II and III are located downwind of the contamination areas when winds are from either of the two dominant directions (north and south). Design of the air monitoring stations is similar to that used in the Community Environmental Monitoring Program (CEMP) (Section 7.1). Additional information on the TTR monitoring effort is available in the 2018 TTR Annual Site Environmental Report and annual EM Nevada Program monitoring reports (such as Chapman et al., 2018).
Gross alpha, gross beta, and gamma spectroscopy were performed on all airborne particulate matter samples collected at TTR in 2018. Gamma spectroscopy detected Am-241 on one filter from Station 404 at Clean Slate II.

Environmental Corrective Actions
164 Nevada National Security Site Environmental Report 2018
Alpha spectroscopy was performed on two filters from each station each quarter: the filter with the highest gross alpha measurement during the quarter, and one random sample. Of these 40 samples, three from the Clean Slate II monitoring stations detected Pu-238, and 24 from both Clean Slate II and III detected Pu-239/240. Neither Pu-238
nor Pu-239/240 were detected in the analyzed sub-set of airborne particulate matter samples collected from the Range Operation Center. Sandia National Laboratories reports this monitoring in the TTR annual environmental report, which is posted at http://www.sandia.gov/news/publications/environmental/index.html.
The EM Nevada Program also monitors meteorological and surface runoff data from two Soils CAUs on the NNSS: Smoky Contamination Area (CAU 550) in Area 8 and the Area 11 Plutonium Valley Dispersion Sites (CAU 366). In 2011, one meteorological station and a flume to measure channelized runoff were installed at CAU 550, and two meteorological stations and an instrument station to collect surface water runoff and transported suspended and bedload sediments were installed at CAU 366. The meteorological stations are similar in design and function to those used in the CEMP (see Chapter 7), except the NNSS stations do not include air particulate matter sample collection or pressurized ion chambers. The equipment at both NNSS sites collect data
to develop an understanding of meteorological conditions that may contribute to potential radionuclide-contaminated soil transport. These monitoring efforts are conducted to aid in developing post-closure monitoring requirements.
During FY 2018 (October 1, 2017–September 30, 2018), data from the CAU 550 meteorological station, the flume, and visual observations of sediment transport were summarized, evaluated, and reported. Runoff events were measured at the flume on both July 14, 2018, and September 4, 2018. The most significant runoff event occurred on July 14 and was the result of 0.82 inches of precipitation during a single 60-minute period. This precipitation event followed a 48-hour period during which 0.31 inches of precipitation fell, so that soil moisture content was already increased. The estimated flow velocity in the natural channel during the July 14, 2018, flow event was considered adequate to cause erosion and transport of silt- and fine sand-size particulates; thus, channel
bed material samples were collected for radionuclide analysis. The September 4, 2018, flow event resulted from a much smaller precipitation event (0.12 inches of precipitation during a 50-minute period). Although runoff was measured at the flume, the estimated flow velocity in the natural channel was insufficient to result in erosion and transport of soil material; no channel sediment was collected following this event (Mizell et al., 2019).
Samples of channel bed sediments were collected at three locations upstream of the flume and seven locations downstream of the flume following the July 14 flow event. Each of the 10 samples were separated into three size fractions and analyzed for americium-241, plutonium-238, and plutonium-230/240. The highest reported concentrations of Am-241, Pu-238, and Pu-239/240, 57.5 picocuries per gram (pCi/g), 5.98 pCi/g, and 351 pCi/g, respectively, were associated with a sample that was collected from a channel terrace immediately downstream of the flume on the north side of the main channel (Mizell et al., in review). Because fine-grained materials from
overbank flooding would be expected to be deposited on such a terrace, and because fine-grained materials have been shown to be preferentially associated with radionuclide contamination (Tamura, 1985; Friesen, 1992; Murarik et al., 1992; and Misra et al., 1993), it is not unexpected that this sample had the highest concentrations of radionuclides. In fact, the smallest size fraction, less than 63 micrometers (µm), produced the highest concentrations of Am-241 for six of the samples and the highest concentration of Pu-239/240 for seven of the samples. The intermediate size fraction, greater than 63 µm but less than 250 µm, produced the highest concentrations of Am-241 and Pu-239/240 in the remaining samples. The highest concentrations of Pu-238 in the
samples were produced by the size fraction greater than 63 µm but less than 250 µm, except for the terrace sample for which the size fraction less than 63 µm produced the highest concentration (Mizell et al., in review). Generally, the size fraction greater than 250 µm returned the lowest concentrations for all three radionuclides.
In FY 2018, air monitoring data collected at CAU 366 identified wind speed conditions that resulted in increased dust transport and, thus, the potential re-suspension of contaminated soils. Several precipitation events were recorded within Plutonium Valley but none produced significant runoff. Therefore, no suspended sediment or bedload transport sediment samples at CAU 366 were collected (Nikolich et al., 2019).
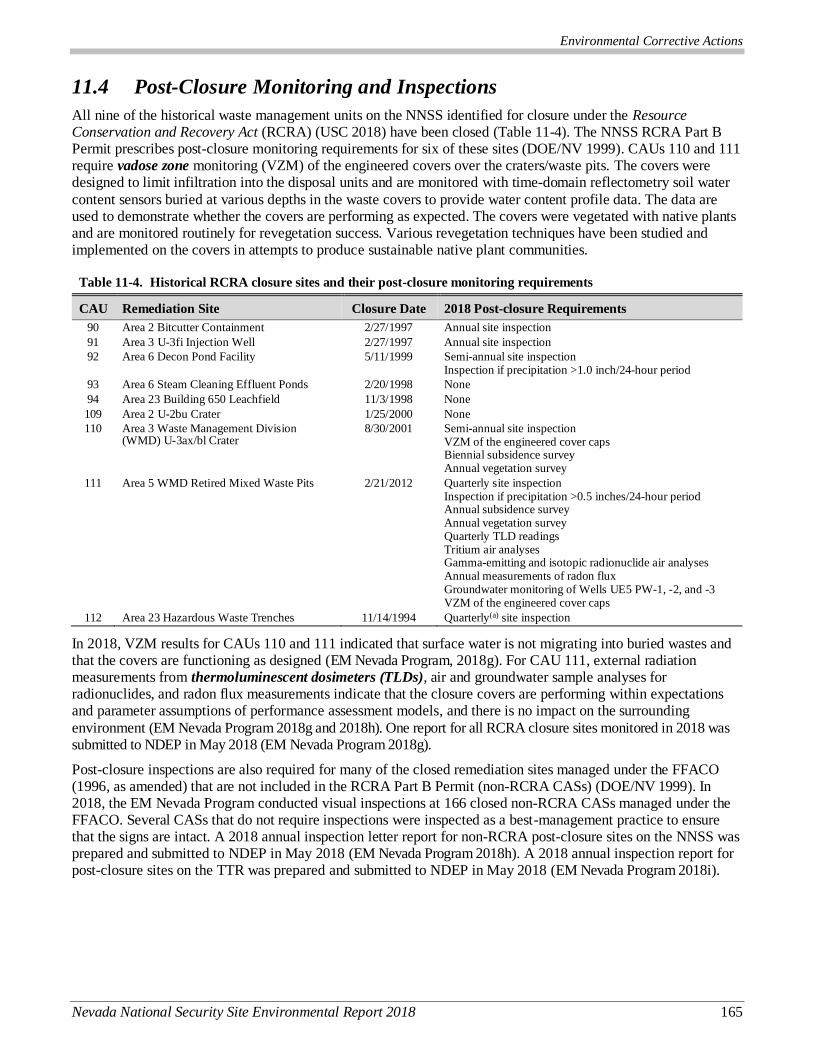
Environmental Corrective Actions
Nevada National Security Site Environmental Report 2018 165
11.4 Post-Closure Monitoring and Inspections
All nine of the historical waste management units on the NNSS identified for closure under the Resource Conservation and Recovery Act (RCRA) (USC 2018) have been closed (Table 11-4). The NNSS RCRA Part B Permit prescribes post-closure monitoring requirements for six of these sites (DOE/NV 1999). CAUs 110 and 111 require vadose zone monitoring (VZM) of the engineered covers over the craters/waste pits. The covers were designed to limit infiltration into the disposal units and are monitored with time-domain reflectometry soil water
content sensors buried at various depths in the waste covers to provide water content profile data. The data are used to demonstrate whether the covers are performing as expected. The covers were vegetated with native plants and are monitored routinely for revegetation success. Various revegetation techniques have been studied and implemented on the covers in attempts to produce sustainable native plant communities.
Table 11-4. Historical RCRA closure sites and their post-closure monitoring requirements
CAU Remediation Site Closure Date 2018 Post-closure Requirements
90 Area 2 Bitcutter Containment 2/27/1997 Annual site inspection
91 Area 3 U-3fi Injection Well 2/27/1997 Annual site inspection
92 Area 6 Decon Pond Facility 5/11/1999 Semi-annual site inspection Inspection if precipitation >1.0 inch/24-hour period
93 Area 6 Steam Cleaning Effluent Ponds 2/20/1998 None
94 Area 23 Building 650 Leachfield 11/3/1998 None
109 Area 2 U-2bu Crater 1/25/2000 None
110 Area 3 Waste Management Division (WMD) U-3ax/bl Crater
8/30/2001 Semi-annual site inspection VZM of the engineered cover caps Biennial subsidence survey Annual vegetation survey
111 Area 5 WMD Retired Mixed Waste Pits 2/21/2012 Quarterly site inspection Inspection if precipitation >0.5 inches/24-hour period Annual subsidence survey Annual vegetation survey Quarterly TLD readings Tritium air analyses Gamma-emitting and isotopic radionuclide air analyses Annual measurements of radon flux Groundwater monitoring of Wells UE5 PW-1, -2, and -3 VZM of the engineered cover caps
112 Area 23 Hazardous Waste Trenches 11/14/1994 Quarterly(a) site inspection
In 2018, VZM results for CAUs 110 and 111 indicated that surface water is not migrating into buried wastes and that the covers are functioning as designed (EM Nevada Program, 2018g). For CAU 111, external radiation measurements from thermoluminescent dosimeters (TLDs), air and groundwater sample analyses for radionuclides, and radon flux measurements indicate that the closure covers are performing within expectations and parameter assumptions of performance assessment models, and there is no impact on the surrounding
environment (EM Nevada Program 2018g and 2018h). One report for all RCRA closure sites monitored in 2018 was submitted to NDEP in May 2018 (EM Nevada Program 2018g).
Post-closure inspections are also required for many of the closed remediation sites managed under the FFACO (1996, as amended) that are not included in the RCRA Part B Permit (non-RCRA CASs) (DOE/NV 1999). In 2018, the EM Nevada Program conducted visual inspections at 166 closed non-RCRA CASs managed under the FFACO. Several CASs that do not require inspections were inspected as a best-management practice to ensure that the signs are intact. A 2018 annual inspection letter report for non-RCRA post-closure sites on the NNSS was prepared and submitted to NDEP in May 2018 (EM Nevada Program 2018h). A 2018 annual inspection report for post-closure sites on the TTR was prepared and submitted to NDEP in May 2018 (EM Nevada Program 2018i).
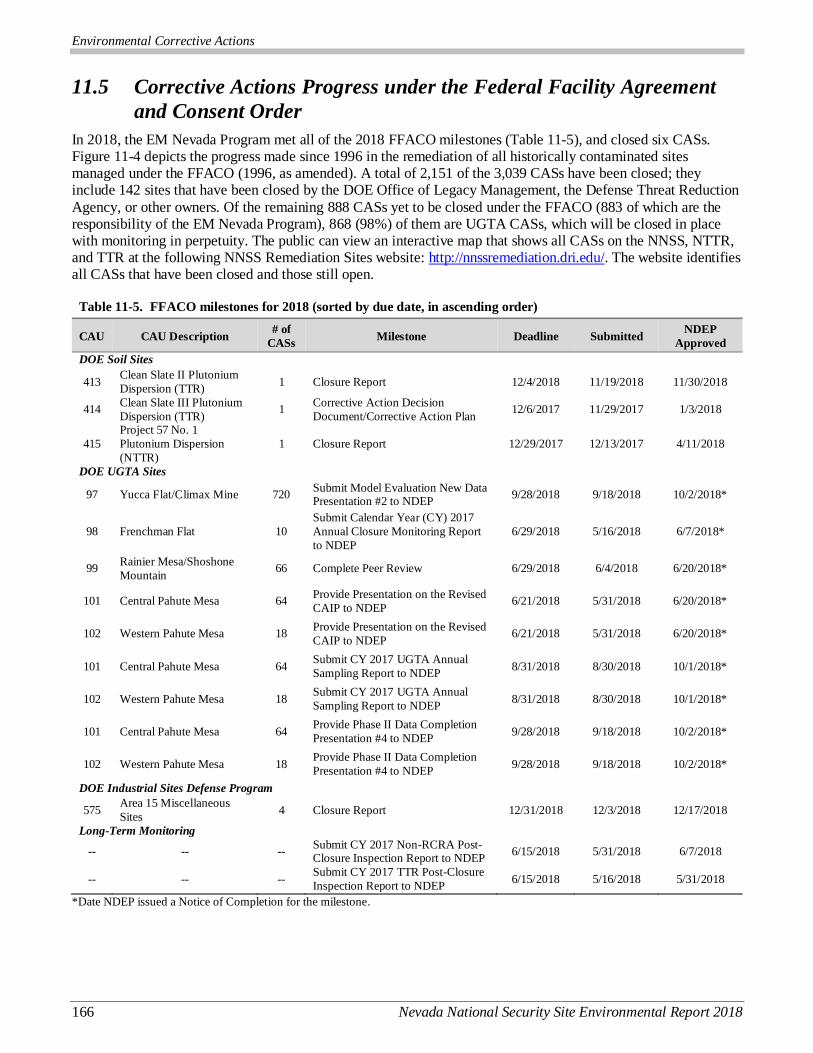
Environmental Corrective Actions
166 Nevada National Security Site Environmental Report 2018
11.5 Corrective Actions Progress under the Federal Facility Agreement
and Consent Order
In 2018, the EM Nevada Program met all of the 2018 FFACO milestones (Table 11-5), and closed six CASs. Figure 11-4 depicts the progress made since 1996 in the remediation of all historically contaminated sites managed under the FFACO (1996, as amended). A total of 2,151 of the 3,039 CASs have been closed; they include 142 sites that have been closed by the DOE Office of Legacy Management, the Defense Threat Reduction
Agency, or other owners. Of the remaining 888 CASs yet to be closed under the FFACO (883 of which are the responsibility of the EM Nevada Program), 868 (98%) of them are UGTA CASs, which will be closed in place with monitoring in perpetuity. The public can view an interactive map that shows all CASs on the NNSS, NTTR, and TTR at the following NNSS Remediation Sites website: http://nnssremediation.dri.edu/. The website identifies all CASs that have been closed and those still open.
Table 11-5. FFACO milestones for 2018 (sorted by due date, in ascending order)
CAU CAU Description # of
CASs Milestone Deadline Submitted
NDEP
Approved
DOE Soil Sites
413 Clean Slate II Plutonium
Dispersion (TTR) 1 Closure Report 12/4/2018 11/19/2018 11/30/2018
414 Clean Slate III Plutonium
Dispersion (TTR) 1
Corrective Action Decision
Document/Corrective Action Plan 12/6/2017 11/29/2017 1/3/2018
415
Project 57 No. 1
Plutonium Dispersion
(NTTR)
1 Closure Report 12/29/2017 12/13/2017 4/11/2018
DOE UGTA Sites
97 Yucca Flat/Climax Mine 720 Submit Model Evaluation New Data Presentation #2 to NDEP
9/28/2018 9/18/2018 10/2/2018*
98 Frenchman Flat 10
Submit Calendar Year (CY) 2017
Annual Closure Monitoring Report
to NDEP
6/29/2018 5/16/2018 6/7/2018*
99 Rainier Mesa/Shoshone
Mountain 66 Complete Peer Review 6/29/2018 6/4/2018 6/20/2018*
101 Central Pahute Mesa 64 Provide Presentation on the Revised
CAIP to NDEP 6/21/2018 5/31/2018 6/20/2018*
102 Western Pahute Mesa 18 Provide Presentation on the Revised
CAIP to NDEP 6/21/2018 5/31/2018 6/20/2018*
101 Central Pahute Mesa 64 Submit CY 2017 UGTA Annual
Sampling Report to NDEP 8/31/2018 8/30/2018 10/1/2018*
102 Western Pahute Mesa 18 Submit CY 2017 UGTA Annual
Sampling Report to NDEP 8/31/2018 8/30/2018 10/1/2018*
101 Central Pahute Mesa 64 Provide Phase II Data Completion
Presentation #4 to NDEP 9/28/2018 9/18/2018 10/2/2018*
102 Western Pahute Mesa 18 Provide Phase II Data Completion
Presentation #4 to NDEP 9/28/2018 9/18/2018 10/2/2018*
DOE Industrial Sites Defense Program
575 Area 15 Miscellaneous
Sites 4 Closure Report 12/31/2018 12/3/2018 12/17/2018
Long-Term Monitoring
-- -- -- Submit CY 2017 Non-RCRA Post-Closure Inspection Report to NDEP
6/15/2018 5/31/2018 6/7/2018
-- -- -- Submit CY 2017 TTR Post-Closure
Inspection Report to NDEP 6/15/2018 5/16/2018 5/31/2018
*Date NDEP issued a Notice of Completion for the milestone.
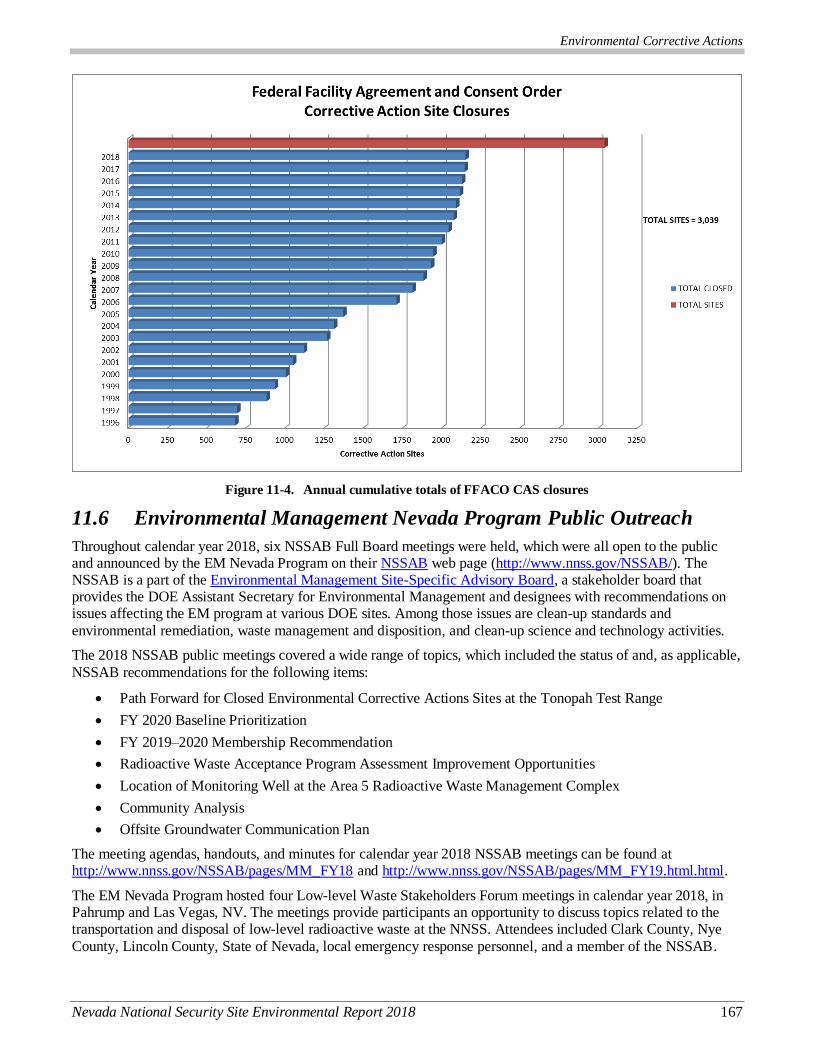
Environmental Corrective Actions
Nevada National Security Site Environmental Report 2018 167
Figure 11-4. Annual cumulative totals of FFACO CAS closures
11.6 Environmental Management Nevada Program Public Outreach
Throughout calendar year 2018, six NSSAB Full Board meetings were held, which were all open to the public and announced by the EM Nevada Program on their NSSAB web page (http://www.nnss.gov/NSSAB/). The NSSAB is a part of the Environmental Management Site-Specific Advisory Board, a stakeholder board that provides the DOE Assistant Secretary for Environmental Management and designees with recommendations on issues affecting the EM program at various DOE sites. Among those issues are clean-up standards and
environmental remediation, waste management and disposition, and clean-up science and technology activities.
The 2018 NSSAB public meetings covered a wide range of topics, which included the status of and, as applicable,
NSSAB recommendations for the following items:
Path Forward for Closed Environmental Corrective Actions Sites at the Tonopah Test Range
FY 2020 Baseline Prioritization
FY 2019–2020 Membership Recommendation
Radioactive Waste Acceptance Program Assessment Improvement Opportunities
Location of Monitoring Well at the Area 5 Radioactive Waste Management Complex
Community Analysis
Offsite Groundwater Communication Plan
The meeting agendas, handouts, and minutes for calendar year 2018 NSSAB meetings can be found at http://www.nnss.gov/NSSAB/pages/MM_FY18 and http://www.nnss.gov/NSSAB/pages/MM_FY19.html.html.
The EM Nevada Program hosted four Low-level Waste Stakeholders Forum meetings in calendar year 2018, in Pahrump and Las Vegas, NV. The meetings provide participants an opportunity to discuss topics related to the transportation and disposal of low-level radioactive waste at the NNSS. Attendees included Clark County, Nye
County, Lincoln County, State of Nevada, local emergency response personnel, and a member of the NSSAB.

Environmental Corrective Actions
168 Nevada National Security Site Environmental Report 2018
The EM Nevada Program also hosts an educational program to promote awareness of environmental management activities at the NNSS. Operation Clean Desert learning materials offer activities geared toward teaching children about ongoing efforts to address environmental challenges, such as contaminated groundwater and radioactive
waste disposal. In calendar year 2018, nearly 6,000 Operation Clean Desert activity books and teacher’s guides were distributed to students and educators throughout the nation. Since 2008, more than 47,000 Operation Clean Desert activity books and teacher’s guides have been distributed nationwide.
Operation Clean Desert learning materials and information can be accessed online at http://www.nnss.gov/pages/PublicAffairsOutreach/KidsZone/OpCleanDesert.html. This includes an activity book, a teacher’s guide, an interactive computer game, and several videos.
Other outreach/education initiatives conducted in calendar year 2018 included:
Community Conversations events held in Amargosa Valley, NV, and Beatty, NV, to discuss groundwater
with local residents.
“Ant farm” groundwater demonstrations held at schools and science fairs in Nevada, such as the
“May Science Be With You” event hosted by DRI as part of the Las Vegas Science and Technology Festival.
Operation Clean Desert promotional booths hosted for Clark County School District teachers.
NNSS site tours hosted for Nevada students, as well as the NSSAB.
11.7 References
Buddemeier, R.W., and D. Isherwood comps, 1985. Radionuclide Migration Project 1984 Progress Report, UCRL-53628. Livermore, CA: Lawrence Livermore National Laboratory.
Carle, S.F., 2018a. Hydrologic Source Term Processes and Models for the Clearwater and Wineskin Tests, Rainier Mesa, Nevada National Security Site. LLNL-TR-483651. LLNL. Livermore, CA. OSTI ID: 1418947.
———, 2018b. Updated Kd Estimates for Modeling Sorption of Cs, Sr, and Pu Isotopes in Hydrostratigraphic Units of Rainier Mesa and Shoshone Mountain. LLNL-TR-751397. LLNL. Livermore, CA. OSTI ID: 1459145.
Chapman, J., G. Nikolich, C. Shadel, G. McCurdy, V. Etyemezian. J. Miller, and S. Mizell, 2018. Tonopah Test Range Air Monitoring: CY2017 Meteorological, Radiological, and Wind Transported Particulate Observations. Desert Research Institute, Publication No. 45284, DOE/NV/0003590-25.
DOE, see U.S. Department of Energy.
DOE/NV, see U.S. Department of Energy, Nevada Operations Office.
Elliott, P.E., and J.M. Fenelon, 2018. Database of Groundwater Levels and Hydrograph Descriptions for the
Nevada Test Site Area, Nye County, Nevada, Data Series 533, Version 2.0. Reston, VA: U.S. Geological Survey.
Elliott, P.E., and M.T. Moreo, 2018. Update to the Groundwater Withdrawals Database for the Death Valley
Regional Groundwater Flow System, Nevada and California, 1913-2010. Reston, VA: U.S. Geological Survey.
EM Nevada Program, see U.S. Department of Energy, Environmental Management Nevada Program.
EPA, see U.S. Environmental Protection Agency.
Federal Facility Agreement and Consent Order, 1996 (as amended March 2010). Agreed to by the State of Nevada; U.S. Department of Energy, Environmental Management; U.S. Department of Defense; and U.S. Department of Energy, Legacy Management. Appendix VI, which contains the Underground Test Area
Strategy, was last modified June 2014, Revision No. 5.
FFACO, see Federal Facility Agreement and Consent Order.
Environmental Corrective Actions
Nevada National Security Site Environmental Report 2018 169
Finnegan, D., and K.H. Birdsell, 2018. Investigation of Archived Gamma Data to Report Minimum Detectable Activities for Gamma-Emitting Radionuclides in Groundwater Samples, LA-UR-18-25428. Los Alamos, NM: Los Alamos National Laboratory.
Friesen, H.N., 1992. Summary of the Nevada Applied Ecology Group and Correlative Programs. DOE/NV-357. Prepared for the U.S. Department of Energy, Nevada Operations Office. Las Vegas, NV.
Frus, R.J., and K.J. Halford, 2018. Documentation of single-well aquifer tests and integrated borehole analyses, Pahute Mesa and Vicinity, Nevada, Scientific Investigations Report 2018-5096. Reston, VA: U.S. Geological Survey.
Hausner, M.B. and K.M. Heintz, 2018. Letter Report: Pilot Test of Distributed Thermal Perturbation Sensing to Assess Hydrogeologic Heterogeneities at ER-EC-11_p1, Nevada System of Higher Education, DOE/NV/0003590-14.
Heintz, K.M., J.M. Healey, J.M., and K.F. Pohlmann, 2018a, Letter Report: Ambient Chemtool Logging of ER-3-3_p1. DOE/NV/0003590-08.
———, 2018b, Letter Report: Well Evaluations for U20aa PS 1D, U-20i PS 1D, U-19g PS 1D, and U-19c PS 2D at Pahute Mesa, Nevada National Security Site. DOE/NV/0003590-12.
Hershey, R.L. 2018. Assessment of Tritium Activities in Bailed versus Pumped Samples from Wells at the Nevada National Security Site, DOE/NV/0003590-28; Publication No. 45285. Las Vegas, NV: Desert Research Institute.
Jackson, T.R. and J.M. Fenelon, 2018a. Conceptual Framework and Trend Analysis of Water-Level Responses to Hydrologic Stresses, Pahute Mesa–Oasis Valley Groundwater Basin, Nevada, 1966–2016: USGS
Scientific Investigation Report 2018-5064, 89 p., https://doi.org/10.3133/sir20185064.
Jackson, T.R., and J.M. Fenelon, 2018b. Trend Analysis of Groundwater Levels through 2015, Pahute Mesa—Oasis Valley Groundwater Basin, Nye County, Nevada.
Lyles, B., G. McCurdy, J. Healey, and K. Heintz, 2018. 2016 Annual Report Timber Mountain Environmental Monitoring Station. Desert Research Institute Letter Report DOE/NV/0003590-13.
Misra, M., C. Neve, and A. Raichur, 1993. Characterization and Physical Separation of Radionuclides from Contaminated Soils. Proceedings of the Soil Decon ’93: Technology Targeting Radionuclides and Heavy Metals. Gatlinburg, TN, ORNL-6769, Oak Ridge National Laboratory, Oak Ridge, TN.
Mizell, S.A., G. McCurdy, K. Heintz, and J.J. Miller, 2019. Monitoring Potential Transport of Radioactive Contaminants in Shallow Ephemeral Channels: FY2018. Las Vegas, Nevada. Prepared by Desert
Research Institute, Las Vegas, Nevada. DRI 45287; DOE/NV/0003590-32. Paginated by section.
Murarik, T.M., T.K. Wenstrang, and L.A. Rogers, 1992. Characterization Studies and Indicated Remediation Methods for Plutonium Contaminated Soils at the Nevada Test Site. Spectrum 1992: Nuclear and
Hazardous Waste Management, Boise, ID.
NNSA/NFO, see U.S. Department of Energy, National Nuclear Security Administration Nevada Field Office.
NNSA/NSO, see U.S. Department of Energy, National Nuclear Security Administration Nevada Site Office.
Navarro, 2018a. Report of the Peer Review Panel for the Rainier Mesa/Shoshone Mountain Flow and Transport Model, Nevada National Security Site, Nevada, Rev. 0. N/0002653--052. Las Vegas, NV.
———, 2018b. Nevada National Security Site Integrated Groundwater Sampling Plan, Rev. 1, DOE/NV--1525-REV. 1. Las Vegas, NV.
———, 2018c. Pahute Mesa Phase II Well ER-20-12 Well Development, Testing, and Sampling Data and Analysis Repor, N/0002653--046. Las Vegas, NV.
———, 2018d. Pahute Mesa Well Development and Testing Analyses for Wells ER-EC-12 and ER-EC-13, Nevada National Security Site, Nye County, Nevada, N/0002653--051. Las Vegas, NV.
Environmental Corrective Actions
170 Nevada National Security Site Environmental Report 2018
———, 2018e. Rainier Mesa/Shoshone Mountain Hydrostratigraphic Framework Model-Prime Model Development Process and Model Description N/0002653--044. Las Vegas, NV.
———, 2018f. Yucca Flat Well Development and Testing Analysis for ER-3-3 and ER-4-1, Nevada National Security Site, Nevada. Nye County, Nevada, Rev. 0, N/00002653--043. Las Vegas, NV.
Nikolich, G., S.A. Mizell, G. McCurdy, S.A. Campbell, and J.J. Miller, 2019. NNSS Soils Monitoring: Plutonium Valley (CAU 366) FY2018. Prepared by Desert Research Institute, Las Vegas, NV. DRI 45288; DOE/NV/0003950-37. Paginated by section.
Reimus, P.W., 2018. Evaluation of the Need to Consider Colloid-Facilitated Plutonium Transport in Contaminant Boundary Calculations for Pahute Mesa at the Nevada National Security Site, LA-UR-18-29291. Los Alamos, NM: Los Alamos National Laboratory.
Tamura, T., 1985. Characterization of Plutonium in Surface Soils, Area 13 of the Nevada Test Site. The Radioecology of Plutonium and Transuranics in Desert Environments, HVO, 153, 1973.
Telfeyan, K., S. Doug, P.W. Ware, and K.H. Birdsell, 2018. Comparison of Experimental Methods for Estimating Matrix Diffusion Coefficients for Contaminant Transport Modeling. In Journal of Contaminant Hydrology, Vol. 209: pp.51–60.
Tompson, A. F. B., T. de Bues, and S. Kelkar, 2018. Execution of an Alternative Modeling Strategy for Closure of the Rainier Mesa Corrective Action Unit at the Nevada National Security Site. Proceedings, WM2019 Conference, March 3-7, 2019, Phoenix, AZ.USC, see United States Code. United States Code, 2018. Title
42 USC 6901 et seq., “Resource Conservation and Recovery Act of 1976,” as amended. Washington, DC: U.S. Government Printing Office.
U.S. Department of Energy, Environmental Management Nevada Program, 2017a. Post-Closure Monitoring Report for Corrective Action Unit 98, Frenchman Flat, Underground Test Area, Nevada National Security Site, Nevada for Calendar Year 2016 (January–December 2016). DOE/NV--1572, June 2017. Las Vegas, NV.
———, 2017b. Corrective Action Decision Document/Corrective Action Plan for Corrective Action Unit 97: Yucca Flat/Climax Mine, Nevada National Security Site, Nevada, DOE/NV--1566-REV. 1, August 2017. Las Vegas, NV.
———, 2018a. CY2017 Annual Closure Monitoring Report for Corrective Action Unit 98, Frenchman Flat, Underground Test Area, Nevada National Security Site, Nevada (January 2017–December 2017), DOE/NV--1593. Las Vegas, NV.
———, 2018b. Rainier Mesa/Shoshone Mountain Flow and Transport Model Report Nevada National Security Site, Nevada, Rev. 1, DOE/NV--1588. Las Vegas, NV.
———, 2018c. Calendar Year 2017 Underground Test Area Annual Sampling Report, Nevada National Security Site, Nevada, Rev. 1, DOE/NV--1599-REV. 1.
———, 2018d Case Study Analyses of Radionuclide Transport in Variably Saturated Media at Rainier Mesa, Rev. 0, DOE/NV--1595. Las Vegas, NV.
———, 2018e. Underground Test Area Calendar Year 2016 Annual Sampling Analysis Report, Nevada National Security Site, Nevada. Las Vegas, NV.
———, 2018f. Underground Test Area Calendar Year 2017 Quality Assurance Report, Nevada National Security
Site, Nevada, DOE/NV-1592, April 2018. Las Vegas, NV.
———, 2018g. Post-Closure Report for Closed Resource Conservation and Recovery Act Corrective Action Units,
Nevada National Security Site, Nevada for Calendar Year 2017, Rev. 0, DOE/NV--1594, May 2018. Las Vegas, NV.
———, 2018h. Post-Closure Inspection Letter Report for CAUs on the NNSS, May 2018. Bill R. Wilborn, Deputy
Program Manager, Operations, EM Nevada Program to Christine Andres, Chief Bureau of Federal Facilities, NDEP, N020-05-31-18. Las Vegas, NV.
Environmental Corrective Actions
Nevada National Security Site Environmental Report 2018 171
———, 2018i. Post-Closure Inspection Report for the Tonopah Test Range, Nevada, For Calendar Year 2017, Rev. 0 DOE/NV--1591, May 2018. Las Vegas, NV.
———, 2019a. Underground Test Area Activity Preemptive Review Guidance, Nevada National Security Site, Nevada, Rev. 0, DOE/EMNV--0003; Revision to DOE/NV--1552. Las Vegas, NV.
———, 2019b. Addendum to the Rainier Mesa/Shoshone Mountain Flow and Transport Model Report, Nevada National Security Site, Nevada, Rev. 1, DOE/EMNV--0002. Las Vegas, NV.
U.S. Department of Energy, National Nuclear Security Administration Nevada Field Office, 2015a. United States Nuclear Tests, July 1945 through September 1992. DOE/NV--209, Revision 16, Las Vegas, NV. Available at http://www.nnss.gov/docs/docs_LibraryPublications/DOE_NV-209_Rev16.pdf, as accessed on June 29, 2016.
———, 2015b. Underground Test Area Activity Quality Assurance Plan Nevada National Security Site, Nevada, DOE/NV--1450-REV. 2, Las Vegas, NV.
———, 2016. Underground Test Area (UGTA) Closure Report for Corrective Action Unit 98: Frenchman Flat, Nevada National Security Site, Nevada, Rev. 1, DOE/NV--1538-Rev. 1. Las Vegas, NV.
U.S. Department of Energy, National Nuclear Security Administration Nevada Site Office. 2009. Phase II Corrective Action Investigation Plan for Corrective Action Units 101 and 102: Central and Western Pahute Mesa, Nevada Test Site, Nye County, Nevada, DOE/NV--1312-Rev. 2. Las Vegas, NV. OSTI ID: 968999
U.S. Department of Energy, Nevada Operations Office, 1999. RCRA Part B Permit (NEV HW0021) Application for Waste Management Activities at the Nevada Test Site. Las Vegas, NV.
U.S. Environmental Protection Agency, 2002. Guidance for Quality Assurance Project Plans for Modeling (EPA QA/G-5M), EPA/240/R-02/007. Office of Environmental Information, Washington, D.C.
———, 2009. Guidance on the Development, Evaluation, and Application of Environmental Models, EPA/100/K-09/003. Office of the Science Advisor, Washington, D.C.
Wood, D.B., 2018. Hydrogeologic applications for historical records and images from rock samples collected at the Nevada National Security Site and vicinity, Nye County, Nevada—A supplement to Data Series 297: U.S. Geological Survey Open-File Report 2018–1011, 13 p., https://doi.org/10.3133/ofr20181011.
Environmental Corrective Actions
172 Nevada National Security Site Environmental Report 2018
THIS PAGE INTENTIONALLY LEFT BLANK

Historic Preservation and Cultural Resources Management
Nevada National Security Site Environmental Report 2018 173
12.0 Ch12
Chapter 12: Historic Preservation and Cultural Resources
Management
Maureen L. King, Susanne J. Rowe, Richard Arnold, and Tatianna Menocal
Desert Research Institute
Cultural Resources Management Program Goals
Ensure compliance with all regulations pertaining to cultural resources. Identify, evaluate, and manage cultural resources.
Evaluate the potential impacts of proposed projects on cultural resources and, when necessary, mitigate adverse effects. Curate archaeological collections in accordance with Title 36 Code of Federal Regulations (CFR) Part 79, Curation of
Federally Owned and Administered Archeological Collections. Consult with American Indians regarding places and items of
importance to the Consolidated Group of Tribes and Organizations.
The Nevada National Security Site (NNSS) contains a wide range of cultural resources, including prehistoric and historic archaeological sites, buildings and structures that are part of the historic built environment, and places of religious and cultural importance to American Indians and others interested in history. Attachment A, Section A.5,
provides a summary of the known human occupation and uses of the NNSS from the Paleoamerican period, approximately 13,000 to 10,000 years ago, through the Cold War era and nuclear testing from 1951 to 1992. U.S. Department of Energy (DOE) Order DOE O 436.1, Departmental Sustainability, requires the DOE National Nuclear Security Administration Nevada Field Office (NNSA/NFO) to develop policies and directives for the conservation and preservation of these resources. The Cultural Resources Management Program (CRMP) at the NNSS was established by NNSA/NFO. The mandates of this program are implemented by Desert Research Institute (DRI) to aid in conserving and preserving cultural resources that may be affected by proposed NNSA/NFO activities. NNSA/NFO must also comply with applicable federal and state regulations to protect and
manage those cultural resources eligible for listing in the National Register of Historic Places (NRHP). These eligible resources are technically known as historic properties regardless of the age of the resource.
To meet federal and state requirements and achieve CRMP goals, the NNSA/NFO program contains the following major components: (1) NNSS project reviews for cultural resource compliance; (2) archival research, field inventories, built environment surveys, and evaluations of NRHP eligibility; (3) the curation of archaeological
collections and program records; and (4) the American Indian Consultation Program (AICP). Guidance for CRMP work is provided in the NNSS Cultural Resources Management Plan (Rhode et al., in preparation). DRI historic preservation personnel and archaeologists, who meet the professional qualification standards set by the Secretary of the Interior, carry out these activities.
Methods used to identify cultural resources vary according to the type of resource under consideration. Archaeological sites are typically identified through an intensive pedestrian surface survey, which is sometimes supplemented by small-scale subsurface testing to assess the potential for intact subsurface cultural deposits at potentially significant archaeological sites. Historic architectural properties, structures, and objects are identified during surveys through the use of maps and aerial imagery, historical archives, and information from individuals who may have direct knowledge of the functions and historical events associated with particular buildings or structures. Direct communication and consultation is also necessary to identify and characterize resources that are culturally important to American Indians, such as sacred sites or traditional-use areas.
12.1 Cultural Resources Inventories and NRHP Eligibility Evaluations
Cultural resources inventories and built environment surveys are conducted to meet the requirements of the National Historic Preservation Act (NHPA). These are completed prior to proposed projects or activities that have the potential to affect historic properties.
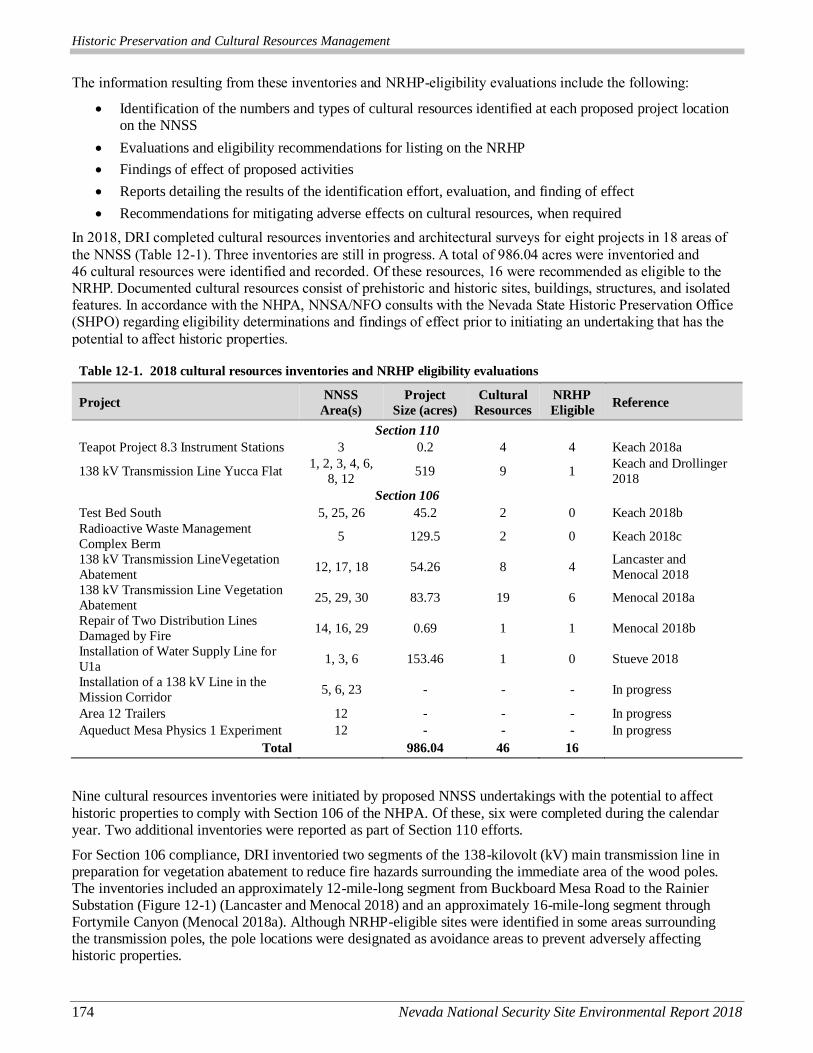
Historic Preservation and Cultural Resources Management
174 Nevada National Security Site Environmental Report 2018
The information resulting from these inventories and NRHP-eligibility evaluations include the following:
Identification of the numbers and types of cultural resources identified at each proposed project location on the NNSS
Evaluations and eligibility recommendations for listing on the NRHP
Findings of effect of proposed activities
Reports detailing the results of the identification effort, evaluation, and finding of effect
Recommendations for mitigating adverse effects on cultural resources, when required
In 2018, DRI completed cultural resources inventories and architectural surveys for eight projects in 18 areas of
the NNSS (Table 12-1). Three inventories are still in progress. A total of 986.04 acres were inventoried and 46 cultural resources were identified and recorded. Of these resources, 16 were recommended as eligible to the NRHP. Documented cultural resources consist of prehistoric and historic sites, buildings, structures, and isolated features. In accordance with the NHPA, NNSA/NFO consults with the Nevada State Historic Preservation Office (SHPO) regarding eligibility determinations and findings of effect prior to initiating an undertaking that has the
potential to affect historic properties.
Table 12-1. 2018 cultural resources inventories and NRHP eligibility evaluations
Project NNSS
Area(s)
Project
Size (acres)
Cultural
Resources
NRHP
Eligible Reference
Section 110
Teapot Project 8.3 Instrument Stations 3 0.2 4 4 Keach 2018a
138 kV Transmission Line Yucca Flat 1, 2, 3, 4, 6,
8, 12 519 9 1
Keach and Drollinger
2018
Section 106
Test Bed South 5, 25, 26 45.2 2 0 Keach 2018b
Radioactive Waste Management
Complex Berm 5 129.5 2 0 Keach 2018c
138 kV Transmission LineVegetation
Abatement 12, 17, 18 54.26 8 4
Lancaster and
Menocal 2018
138 kV Transmission Line Vegetation
Abatement 25, 29, 30 83.73 19 6 Menocal 2018a
Repair of Two Distribution Lines
Damaged by Fire 14, 16, 29 0.69 1 1 Menocal 2018b
Installation of Water Supply Line for
U1a 1, 3, 6 153.46 1 0 Stueve 2018
Installation of a 138 kV Line in the
Mission Corridor 5, 6, 23 - - - In progress
Area 12 Trailers 12 - - - In progress
Aqueduct Mesa Physics 1 Experiment 12 - - - In progress
Total 986.04 46 16
Nine cultural resources inventories were initiated by proposed NNSS undertakings with the potential to affect
historic properties to comply with Section 106 of the NHPA. Of these, six were completed during the calendar year. Two additional inventories were reported as part of Section 110 efforts.
For Section 106 compliance, DRI inventoried two segments of the 138-kilovolt (kV) main transmission line in preparation for vegetation abatement to reduce fire hazards surrounding the immediate area of the wood poles. The inventories included an approximately 12-mile-long segment from Buckboard Mesa Road to the Rainier Substation (Figure 12-1) (Lancaster and Menocal 2018) and an approximately 16-mile-long segment through Fortymile Canyon (Menocal 2018a). Although NRHP-eligible sites were identified in some areas surrounding the transmission poles, the pole locations were designated as avoidance areas to prevent adversely affecting historic properties.
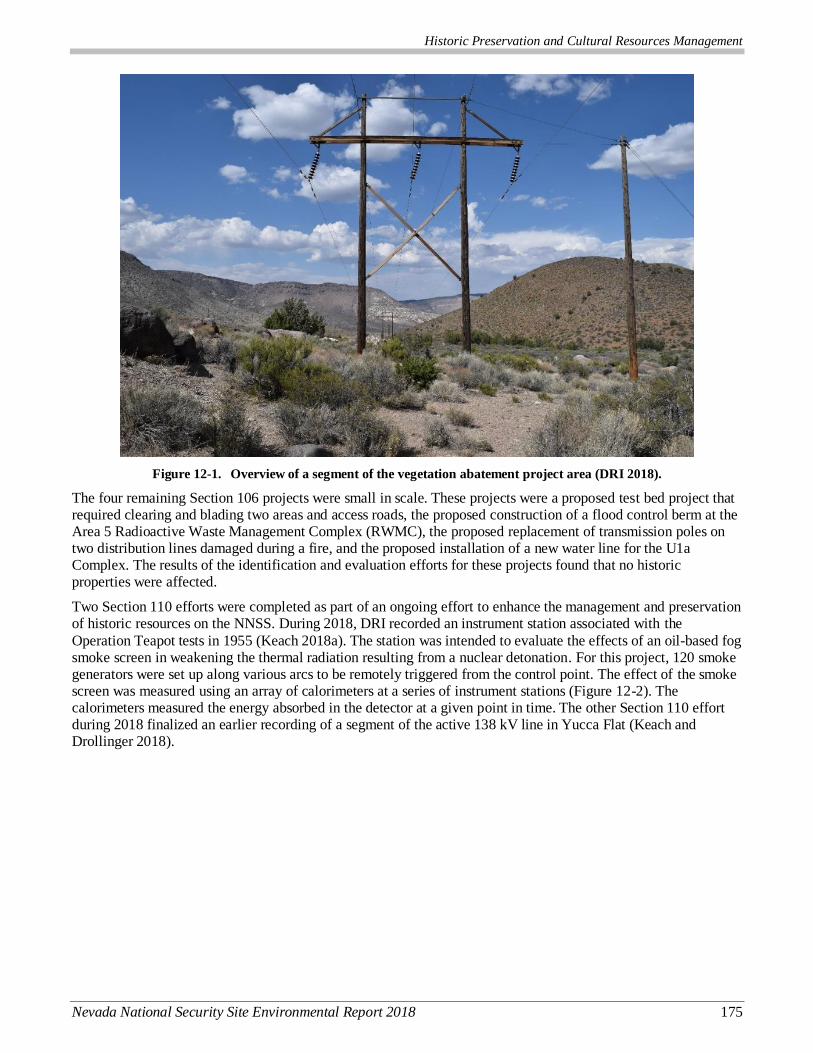
Historic Preservation and Cultural Resources Management
Nevada National Security Site Environmental Report 2018 175
Figure 12-1. Overview of a segment of the vegetation abatement project area (DRI 2018).
The four remaining Section 106 projects were small in scale. These projects were a proposed test bed project that required clearing and blading two areas and access roads, the proposed construction of a flood control berm at the Area 5 Radioactive Waste Management Complex (RWMC), the proposed replacement of transmission poles on two distribution lines damaged during a fire, and the proposed installation of a new water line for the U1a Complex. The results of the identification and evaluation efforts for these projects found that no historic properties were affected.
Two Section 110 efforts were completed as part of an ongoing effort to enhance the management and preservation of historic resources on the NNSS. During 2018, DRI recorded an instrument station associated with the
Operation Teapot tests in 1955 (Keach 2018a). The station was intended to evaluate the effects of an oil-based fog smoke screen in weakening the thermal radiation resulting from a nuclear detonation. For this project, 120 smoke generators were set up along various arcs to be remotely triggered from the control point. The effect of the smoke screen was measured using an array of calorimeters at a series of instrument stations (Figure 12-2). The calorimeters measured the energy absorbed in the detector at a given point in time. The other Section 110 effort during 2018 finalized an earlier recording of a segment of the active 138 kV line in Yucca Flat (Keach and Drollinger 2018).
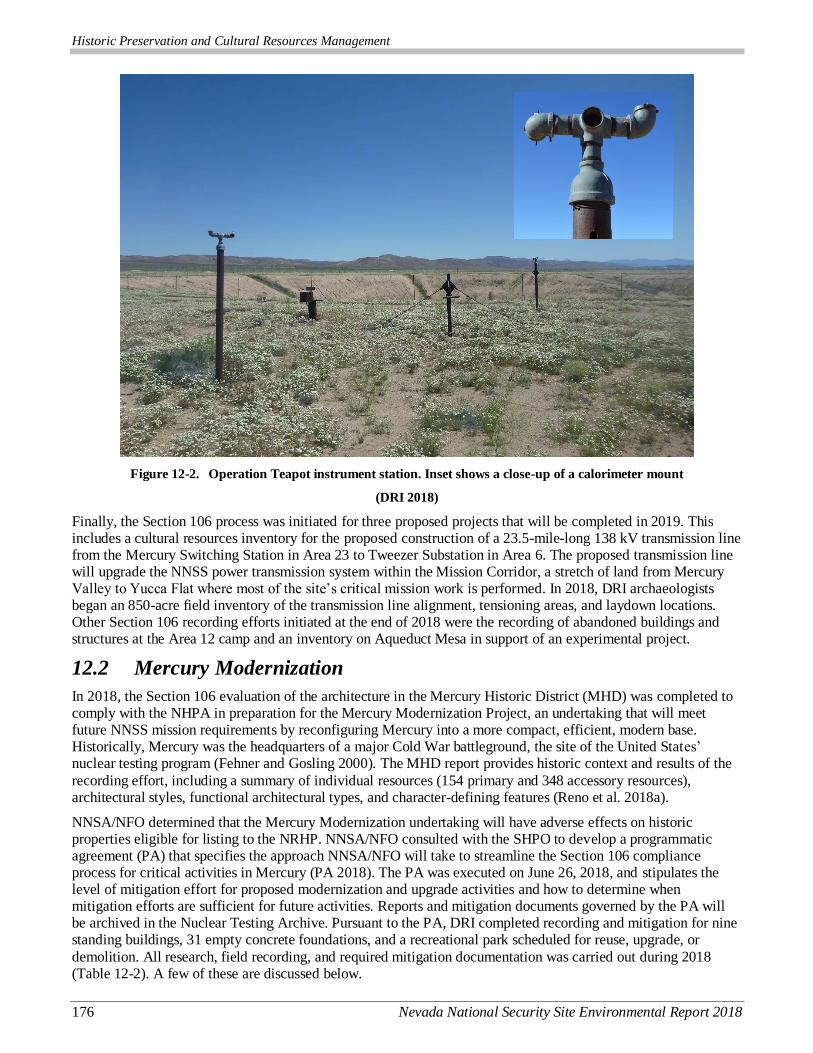
Historic Preservation and Cultural Resources Management
176 Nevada National Security Site Environmental Report 2018
Figure 12-2. Operation Teapot instrument station. Inset shows a close-up of a calorimeter mount
(DRI 2018)
Finally, the Section 106 process was initiated for three proposed projects that will be completed in 2019. This includes a cultural resources inventory for the proposed construction of a 23.5-mile-long 138 kV transmission line from the Mercury Switching Station in Area 23 to Tweezer Substation in Area 6. The proposed transmission line will upgrade the NNSS power transmission system within the Mission Corridor, a stretch of land from Mercury Valley to Yucca Flat where most of the site’s critical mission work is performed. In 2018, DRI archaeologists began an 850-acre field inventory of the transmission line alignment, tensioning areas, and laydown locations. Other Section 106 recording efforts initiated at the end of 2018 were the recording of abandoned buildings and structures at the Area 12 camp and an inventory on Aqueduct Mesa in support of an experimental project.
12.2 Mercury Modernization
In 2018, the Section 106 evaluation of the architecture in the Mercury Historic District (MHD) was completed to comply with the NHPA in preparation for the Mercury Modernization Project, an undertaking that will meet future NNSS mission requirements by reconfiguring Mercury into a more compact, efficient, modern base. Historically, Mercury was the headquarters of a major Cold War battleground, the site of the United States’ nuclear testing program (Fehner and Gosling 2000). The MHD report provides historic context and results of the
recording effort, including a summary of individual resources (154 primary and 348 accessory resources), architectural styles, functional architectural types, and character-defining features (Reno et al. 2018a).
NNSA/NFO determined that the Mercury Modernization undertaking will have adverse effects on historic properties eligible for listing to the NRHP. NNSA/NFO consulted with the SHPO to develop a programmatic agreement (PA) that specifies the approach NNSA/NFO will take to streamline the Section 106 compliance process for critical activities in Mercury (PA 2018). The PA was executed on June 26, 2018, and stipulates the level of mitigation effort for proposed modernization and upgrade activities and how to determine when mitigation efforts are sufficient for future activities. Reports and mitigation documents governed by the PA will be archived in the Nuclear Testing Archive. Pursuant to the PA, DRI completed recording and mitigation for nine standing buildings, 31 empty concrete foundations, and a recreational park scheduled for reuse, upgrade, or
demolition. All research, field recording, and required mitigation documentation was carried out during 2018 (Table 12-2). A few of these are discussed below.
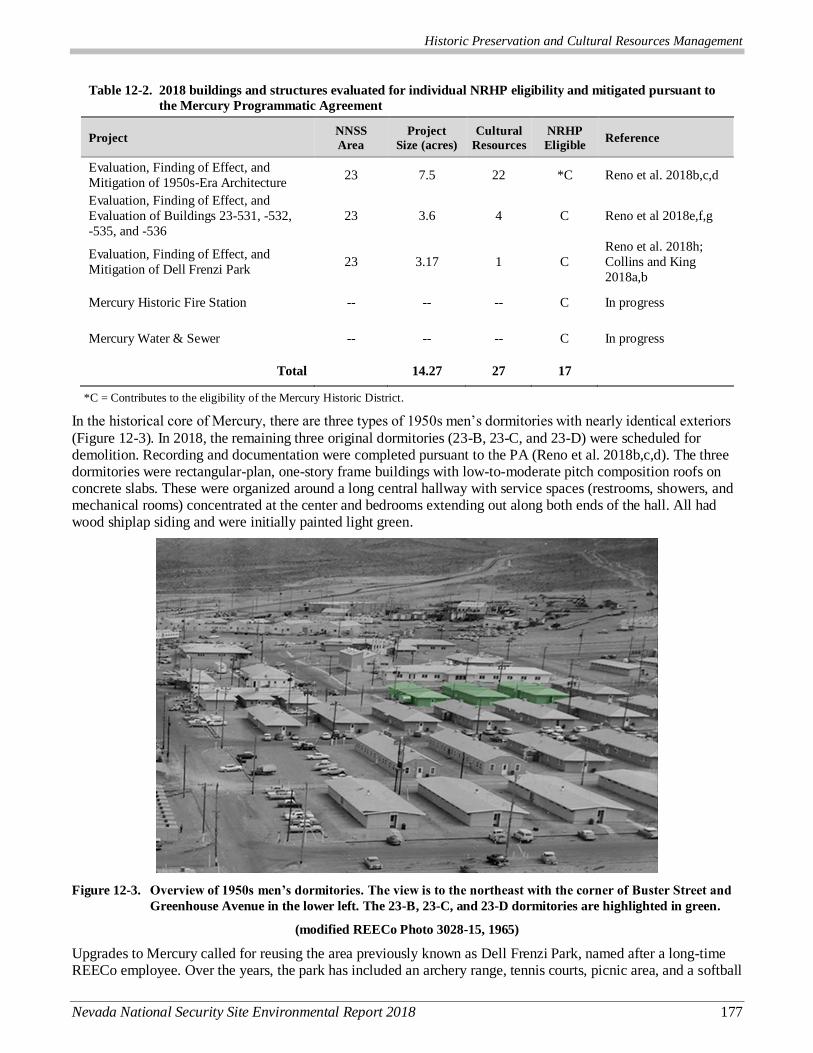
Historic Preservation and Cultural Resources Management
Nevada National Security Site Environmental Report 2018 177
Table 12-2. 2018 buildings and structures evaluated for individual NRHP eligibility and mitigated pursuant to
the Mercury Programmatic Agreement
Project NNSS
Area
Project
Size (acres)
Cultural
Resources
NRHP
Eligible Reference
Evaluation, Finding of Effect, and
Mitigation of 1950s-Era Architecture 23 7.5 22 *C Reno et al. 2018b,c,d
Evaluation, Finding of Effect, and
Evaluation of Buildings 23-531, -532,
-535, and -536
23 3.6 4 C Reno et al 2018e,f,g
Evaluation, Finding of Effect, and
Mitigation of Dell Frenzi Park 23 3.17 1 C
Reno et al. 2018h;
Collins and King
2018a,b
Mercury Historic Fire Station -- -- -- C In progress
Mercury Water & Sewer -- -- -- C In progress
Total 14.27 27 17
*C = Contributes to the eligibility of the Mercury Historic District.
In the historical core of Mercury, there are three types of 1950s men’s dormitories with nearly identical exteriors
(Figure 12-3). In 2018, the remaining three original dormitories (23-B, 23-C, and 23-D) were scheduled for demolition. Recording and documentation were completed pursuant to the PA (Reno et al. 2018b,c,d). The three dormitories were rectangular-plan, one-story frame buildings with low-to-moderate pitch composition roofs on concrete slabs. These were organized around a long central hallway with service spaces (restrooms, showers, and mechanical rooms) concentrated at the center and bedrooms extending out along both ends of the hall. All had wood shiplap siding and were initially painted light green.
Figure 12-3. Overview of 1950s men’s dormitories. The view is to the northeast with the corner of Buster Street and
Greenhouse Avenue in the lower left. The 23-B, 23-C, and 23-D dormitories are highlighted in green.
(modified REECo Photo 3028-15, 1965)
Upgrades to Mercury called for reusing the area previously known as Dell Frenzi Park, named after a long-time REECo employee. Over the years, the park has included an archery range, tennis courts, picnic area, and a softball
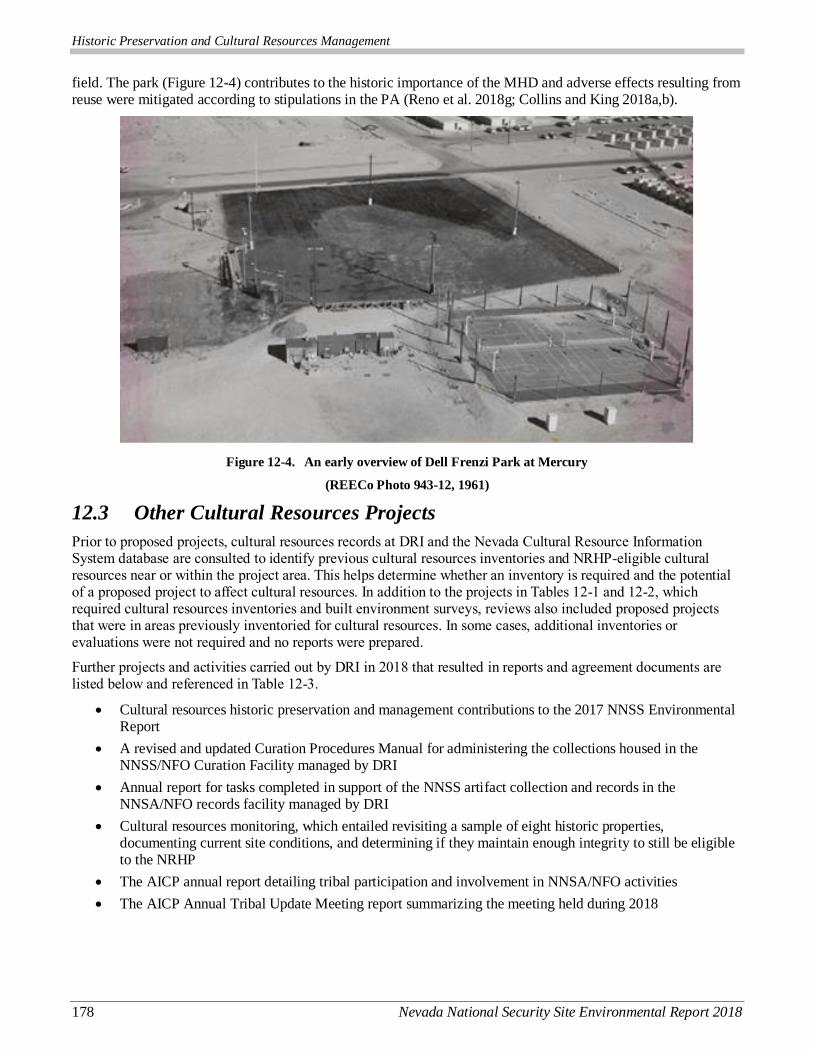
Historic Preservation and Cultural Resources Management
178 Nevada National Security Site Environmental Report 2018
field. The park (Figure 12-4) contributes to the historic importance of the MHD and adverse effects resulting from reuse were mitigated according to stipulations in the PA (Reno et al. 2018g; Collins and King 2018a,b).
Figure 12-4. An early overview of Dell Frenzi Park at Mercury
(REECo Photo 943-12, 1961)
12.3 Other Cultural Resources Projects
Prior to proposed projects, cultural resources records at DRI and the Nevada Cultural Resource Information System database are consulted to identify previous cultural resources inventories and NRHP-eligible cultural resources near or within the project area. This helps determine whether an inventory is required and the potential of a proposed project to affect cultural resources. In addition to the projects in Tables 12-1 and 12-2, which required cultural resources inventories and built environment surveys, reviews also included proposed projects that were in areas previously inventoried for cultural resources. In some cases, additional inventories or evaluations were not required and no reports were prepared.
Further projects and activities carried out by DRI in 2018 that resulted in reports and agreement documents are listed below and referenced in Table 12-3.
Cultural resources historic preservation and management contributions to the 2017 NNSS Environmental Report
A revised and updated Curation Procedures Manual for administering the collections housed in the NNSS/NFO Curation Facility managed by DRI
Annual report for tasks completed in support of the NNSS artifact collection and records in the NNSA/NFO records facility managed by DRI
Cultural resources monitoring, which entailed revisiting a sample of eight historic properties, documenting current site conditions, and determining if they maintain enough integrity to still be eligible to the NRHP
The AICP annual report detailing tribal participation and involvement in NNSA/NFO activities
The AICP Annual Tribal Update Meeting report summarizing the meeting held during 2018

Historic Preservation and Cultural Resources Management
Nevada National Security Site Environmental Report 2018 179
Table 12-3. Other 2018 cultural resources projects
Project Reference
NNSSER 2017 Contributions Rowe et al. 2018
Curation Procedures Manual Menocal and Rowe 2018
NNSA/NFO Annual Curation Compliance Report Menocal 2018c
NNSS Cultural Resources Monitoring Menocal 2018d
AICP Annual Progress Report Arnold 2018a
12.4 Curation
The NHPA requires that archaeological collections and associated records be maintained at professional standards. The specific requirements are delineated in 36 CFR 79. The NNSS Archaeological Collection currently contains approximately 467,000 artifacts and is curated in accordance with 36 CFR 79. Curation requirements include:
Maintaining an inventory catalog of the items in the NNSS collection.
Packaging the NNSS collection in materials that meet archival standards (e.g., acid-free boxes).
Maintaining the NNSS collection and records in a secure facility with environmental controls.
Following established procedures for the NNSS collection and curation facility.
Complying with the Native American Graves Protection and Repatriation Act.
In 2018, catalog records were maintained through spot-check inventories. No erroneous or absent artifact entries were observed. DRI completed the standardization of entry field codes and updated the catalog database code
guide. This document is appended to the revised curation procedures manual (Menocal and Rowe 2018).
DRI staff archived 48 hard copies of cultural resources reports and associated site forms, and 5 documents related to the AICP. DRI staff also archived all project files associated with the NNSA/NFO CRMP from Fiscal Year
(FY) 2012 and FY 2013.
Three loan agreements between NNSA/NFO and the National Atomic Testing Museum (NATM) were
renewed. The NATM is located on the first floor of the Rogers Building of DRI. Two of these loans,
renewed in March 2018, are five-year terms for historic and ethnographic items on exhibit. The third
loan renewal is for the McGuffin Collection, also on display. The McGuffin Collection consists of 39
chipped stone artifacts from a prehistoric site in Fortymile Canyon. The McGuffin Collection loan is
renewed on a yearly basis and has been on loan to the NATM since 2005.
One loan agreement between NNSA/NFO and Utah State University for master’s thesis research ended. This one-year-term loan agreement began August 2017. In May 2018, the borrower contacted DRI and indicated she had completed her thesis research and wished to return the materials. DRI acknowledged receipt of the loaned artifacts in June 2018 and they were subsequently reincorporated into the NNSA/NFO collection by staff.
12.5 American Indian Consultation Program
The NNSA/NFO AICP was developed in 1991 and involves sixteen Southern Paiute, Western Shoshone, and Owens Valley Paiute-Shoshone tribes with cultural and historic ties to the NNSS. The AICP operates in accordance with DOE O 144.1, Department of Energy American Indian Tribal Government Interactions and Policy, which provides a foundation for engaging tribal leadership and their designated representatives in
activities that occur on the NNSS.
In 1994, the tribes came together to form the Consolidated Group of Tribes and Organizations (CGTO), which serves
as a conduit for speaking with one collective voice while retaining each tribe’s individual ability to interact independently with NNSA/NFO, if desired. The CGTO selects a Spokesperson who is responsible for representing the group and interfacing with NNSA/NFO on an interim basis between regularly scheduled meetings. The CGTO and its Spokesperson share tribal perspectives and identify topics of mutual interest to both the tribes and NNSA/NFO.
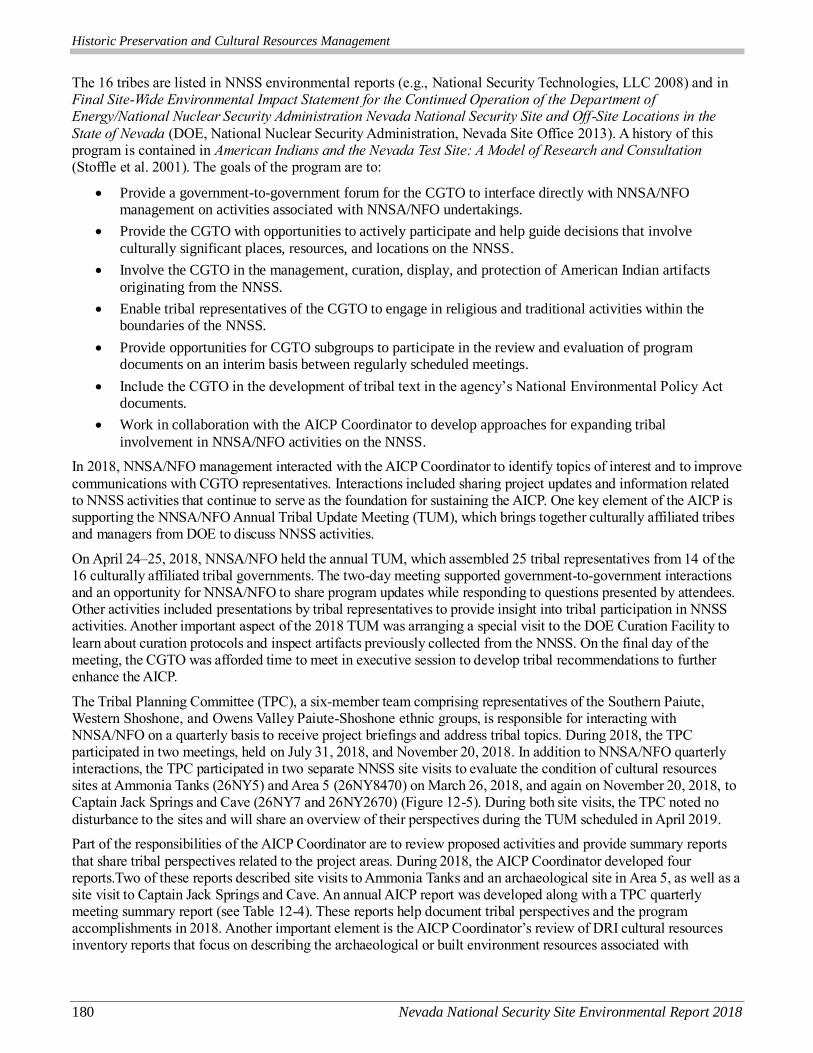
Historic Preservation and Cultural Resources Management
180 Nevada National Security Site Environmental Report 2018
The 16 tribes are listed in NNSS environmental reports (e.g., National Security Technologies, LLC 2008) and in Final Site-Wide Environmental Impact Statement for the Continued Operation of the Department of Energy/National Nuclear Security Administration Nevada National Security Site and Off-Site Locations in the
State of Nevada (DOE, National Nuclear Security Administration, Nevada Site Office 2013). A history of this program is contained in American Indians and the Nevada Test Site: A Model of Research and Consultation (Stoffle et al. 2001). The goals of the program are to:
Provide a government-to-government forum for the CGTO to interface directly with NNSA/NFO management on activities associated with NNSA/NFO undertakings.
Provide the CGTO with opportunities to actively participate and help guide decisions that involve
culturally significant places, resources, and locations on the NNSS.
Involve the CGTO in the management, curation, display, and protection of American Indian artifacts
originating from the NNSS.
Enable tribal representatives of the CGTO to engage in religious and traditional activities within the boundaries of the NNSS.
Provide opportunities for CGTO subgroups to participate in the review and evaluation of program documents on an interim basis between regularly scheduled meetings.
Include the CGTO in the development of tribal text in the agency’s National Environmental Policy Act documents.
Work in collaboration with the AICP Coordinator to develop approaches for expanding tribal
involvement in NNSA/NFO activities on the NNSS.
In 2018, NNSA/NFO management interacted with the AICP Coordinator to identify topics of interest and to improve
communications with CGTO representatives. Interactions included sharing project updates and information related to NNSS activities that continue to serve as the foundation for sustaining the AICP. One key element of the AICP is supporting the NNSA/NFO Annual Tribal Update Meeting (TUM), which brings together culturally affiliated tribes and managers from DOE to discuss NNSS activities.
On April 24–25, 2018, NNSA/NFO held the annual TUM, which assembled 25 tribal representatives from 14 of the 16 culturally affiliated tribal governments. The two-day meeting supported government-to-government interactions and an opportunity for NNSA/NFO to share program updates while responding to questions presented by attendees. Other activities included presentations by tribal representatives to provide insight into tribal participation in NNSS activities. Another important aspect of the 2018 TUM was arranging a special visit to the DOE Curation Facility to
learn about curation protocols and inspect artifacts previously collected from the NNSS. On the final day of the meeting, the CGTO was afforded time to meet in executive session to develop tribal recommendations to further enhance the AICP.
The Tribal Planning Committee (TPC), a six-member team comprising representatives of the Southern Paiute, Western Shoshone, and Owens Valley Paiute-Shoshone ethnic groups, is responsible for interacting with NNSA/NFO on a quarterly basis to receive project briefings and address tribal topics. During 2018, the TPC participated in two meetings, held on July 31, 2018, and November 20, 2018. In addition to NNSA/NFO quarterly interactions, the TPC participated in two separate NNSS site visits to evaluate the condition of cultural resources sites at Ammonia Tanks (26NY5) and Area 5 (26NY8470) on March 26, 2018, and again on November 20, 2018, to Captain Jack Springs and Cave (26NY7 and 26NY2670) (Figure 12-5). During both site visits, the TPC noted no
disturbance to the sites and will share an overview of their perspectives during the TUM scheduled in April 2019.
Part of the responsibilities of the AICP Coordinator are to review proposed activities and provide summary reports
that share tribal perspectives related to the project areas. During 2018, the AICP Coordinator developed four reports.Two of these reports described site visits to Ammonia Tanks and an archaeological site in Area 5, as well as a site visit to Captain Jack Springs and Cave. An annual AICP report was developed along with a TPC quarterly meeting summary report (see Table 12-4). These reports help document tribal perspectives and the program accomplishments in 2018. Another important element is the AICP Coordinator’s review of DRI cultural resources inventory reports that focus on describing the archaeological or built environment resources associated with
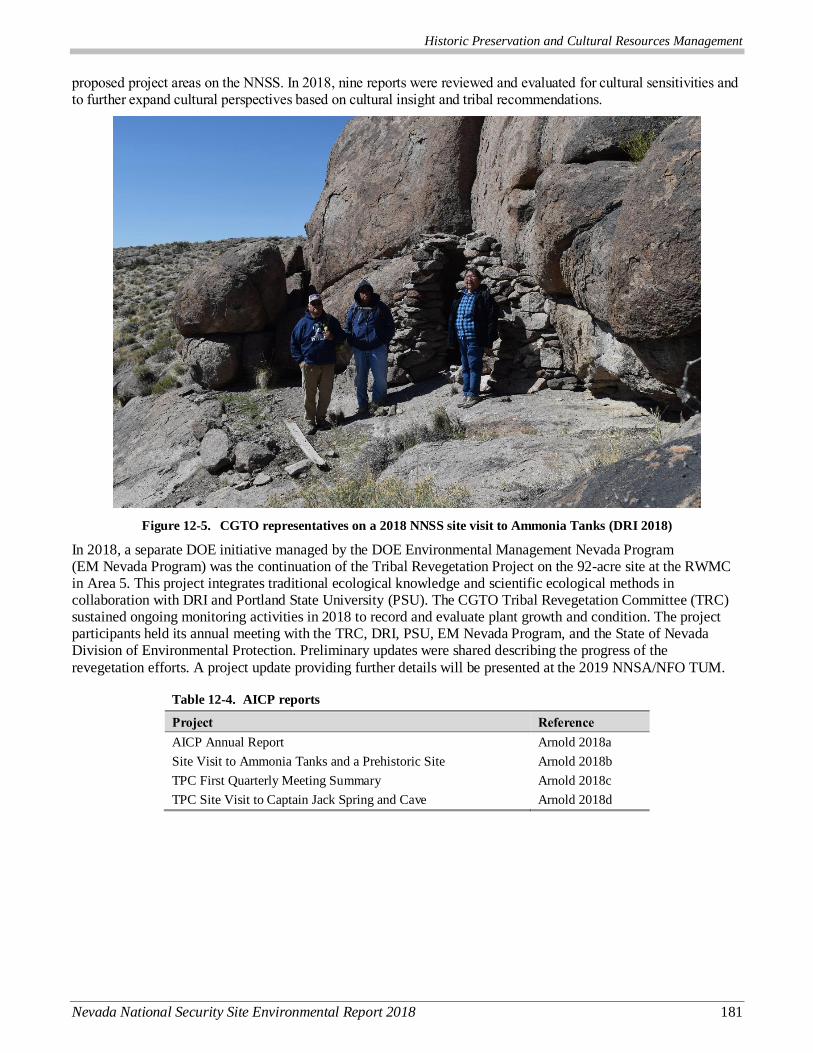
Historic Preservation and Cultural Resources Management
Nevada National Security Site Environmental Report 2018 181
proposed project areas on the NNSS. In 2018, nine reports were reviewed and evaluated for cultural sensitivities and to further expand cultural perspectives based on cultural insight and tribal recommendations.
Figure 12-5. CGTO representatives on a 2018 NNSS site visit to Ammonia Tanks (DRI 2018)
In 2018, a separate DOE initiative managed by the DOE Environmental Management Nevada Program (EM Nevada Program) was the continuation of the Tribal Revegetation Project on the 92-acre site at the RWMC in Area 5. This project integrates traditional ecological knowledge and scientific ecological methods in collaboration with DRI and Portland State University (PSU). The CGTO Tribal Revegetation Committee (TRC) sustained ongoing monitoring activities in 2018 to record and evaluate plant growth and condition. The project participants held its annual meeting with the TRC, DRI, PSU, EM Nevada Program, and the State of Nevada Division of Environmental Protection. Preliminary updates were shared describing the progress of the
revegetation efforts. A project update providing further details will be presented at the 2019 NNSA/NFO TUM.
Table 12-4. AICP reports
Project Reference
AICP Annual Report Arnold 2018a
Site Visit to Ammonia Tanks and a Prehistoric Site Arnold 2018b
TPC First Quarterly Meeting Summary Arnold 2018c
TPC Site Visit to Captain Jack Spring and Cave Arnold 2018d
Historic Preservation and Cultural Resources Management
182 Nevada National Security Site Environmental Report 2018
12.6 References
Arnold, Richard, 2018a. American Indian Consultation Program Annual Report FY2018. Desert Research Institute Report AI090118-1, Las Vegas, Nevada. Consolidated Group of Tribes and Organizations Tribal Planning Committee
———, 2018b. Site Visit to the Nevada National Security Site, Nye County, Nevada: Ammonia Tanks (26NY5) in
Area 18 and a Prehistoric Site (26NY8470) in Area 5. Cultural Resources Inventory Letter Report No. LR032618-1, Desert Research Institute, Las Vegas, Nevada.
———, 2018c. Report on the Tribal Planning Committee’s First Quarterly Meeting, American Indian Consultation Program, Nevada National Security Site, Nye County, Nevada. Desert Research Institute Letter Report No. LR112018-1, Las Vegas, Nevada.
———, 2018d. Report for the FY2019 Tribal Planning Committee Site Visit to Captain Jack Springs (26NY7)
and Captain Jack Cave (26NY2670), in Area 12, Nevada National Security Site, Nye County, Nevada. Desert Research Institute Letter Report No. LR112018-2, Las Vegas, Nevada.
Collins, Cheryl, and Maureen King, 2018a. Cultural Resources Report on the Finding of Adverse Effect and Proposed Mitigation for the Demolition of Dell Frenzi Park in Mercury, Nevada National Security Site, Nye County, Nevada. Cultural Resources Finding of Effect Letter Report No. LR082018-1-FOE, Desert Research Institute, Las Vegas, Nevada.
———, 2018b. Cultural Resources Report for the Submission of Mitigation Documentation Related to the Demolition of Dell Frenzi Park in Mercury, Nevada National Security Site, Nye County, Nevada. Cultural Resources Mitigation Submission Letter Report No. LR082018-1-MIT, Desert Research Institute, Las Vegas, Nevada.
DOE, see U.S. Department of Energy, National Nuclear Security Administration, Nevada Site Office
Fehner, Terrence R., and F. G. Gosling, 2000. Origins of the Nevada Test Site. Report DOE/MA--0518. U.S. Department of Energy, Management and Administration, Washington D.C.
Keach, Levi, 2018a. A Section 110 Recordation of the Teapot Project 8.3 Instrument Stations, Area 3, Nevada National Security Site, Nye County, Nevada. Cultural Resources Inventory Short Report No. SR112817-1, Desert Research Institute, Las Vegas, Nevada.
———, 2018b. A Cultural Resources Inventory for the Proposed Test Bed South Project, Areas 5, 25, and 26,
Nevada National Security Site, Nye County, Nevada. Cultural Resources Inventory Short Report No. SR022718-1, Desert Research Institute, Las Vegas, Nevada.
———, 2018c. A Section 106 Cultural Resources Inventory for the Proposed RWMC Berm, Area 5, Nevada National Security Site, Nye County, Nevada. Cultural Resources Inventory Short Report No. SR021518-1, Desert Research Institute, Las Vegas, Nevada.
Keach, Levi and Harold Drollinger, 2018. A Section 110 Cultural Resources Inventory of the NNSS 138 kV Main
Transmission Line, Yucca Flat, Nevada National Security Site, Nye County, Nevada. Cultural Resources Inventory Short Report No. SR081710-1, Desert Research Institute, Las Vegas, Nevada.
Lancaster, J.D. and Tatianna Menocal, 2018. A Cultural Resources Inventory for Proposed Vegetation Abatement Around Power Poles on the 138 kV Main Transmission Line, Areas 12, 17, and 18, Nevada National Security Site, Nye County, Nevada. Cultural Resources Inventory Short Report No. SR081318-1, Desert Research Institute, Las Vegas, Nevada.
Menocal, Tatianna, 2018a. A Cultural Resources Inventory for Proposed Vegetation Abatement Around Power Poles on the 138kV Main Transmission Line, Areas 25, 29, and 30, Nevada National Security Site, Nye County, Nevada. Cultural Resources Inventory Short Report No. SR110717-1, Desert Research Institute, Las Vegas, Nevada.
———, 2018b. A Cultural Resources Inventory for Proposed Repair of Two Distribution Lines Damaged by Fire, Areas 14, 16, and 29, Nevada National Security Site, Nye County, Nevada. Cultural Resources Inventory
Short Report No. SR050718-1, Desert Research Institute, Las Vegas, Nevada.
Historic Preservation and Cultural Resources Management
Nevada National Security Site Environmental Report 2018 183
———, 2018c. Curation Compliance Annual Progress Report FY 2018. Desert Research Institute Report CU080918-1, Las Vegas, Nevada.
———, 2018d. Fiscal Year 2018 Cultural Resources Monitoring, Nevada National Security Site, Nye County, Nevada. Cultural Resources Monitoring Report No. MR110617-1, Desert Research Institute, Las Vegas, Nevada.
Menocal, Tatianna, and Susanne J. Rowe, 2018. Curation Procedures for the National Nuclear Security Administration Nevada Field Office Curation Facility at Desert Research Institute, Las Vegas, Nevada. Curation Report No. CU073018-1, Desert Research Institute, Las Vegas, Nevada.
National Security Technologies, LLC, 2008. Nevada Test Site Environmental Report 2007. Report DOE/NV/25946--543, prepared for U.S. Department of Energy, National Nuclear Security Administration Nevada Site Office, Las Vegas, Nevada.
PA, see Programmatic Agreement
Programmatic Agreement, 2018. Programmatic Agreement Between the National Nuclear Security Administration Nevada Field Office and the Nevada State Historic Preservation Officer regarding
Modernization and Operational Maintenance of the Nevada National Security Site, at Mercury in Nye County, Nevada. Available at: http://shpo.nv.gov/uploads/documents/DOE_Modernization_and_Operational_Maintenance_of_the_Nevada_National_Security_Site_at_Mercury_PA.pdf, as accessed on July 9, 2019.
Reno, Ron, Cheryl M. Collins, and Maureen King, 2018a. The Architecture of Mercury – Nevada’s Atomic Boom Town, An Architectural Survey of Mercury, Area 23, Nevada National Security Site, Nye County, Nevada,
Rev 1. DOE/NV/0003590-09, Cultural Resources Technical Report No. 115, Division of Earth and Ecosystems Sciences, Desert Research Institute, Las Vegas, Nevada.
———, 2018b. Cultural Resources Letter Report on the Finding of Adverse Effect and Proposed Mitigation for the Removal of Four Buildings and Multiple Concrete Foundations in Mercury, Nevada National Security Site, Nye County, Nevada. Cultural Resources Finding of Effect Letter Report No. LR070918-1-FOE, Desert Research Institute, Las Vegas, Nevada.
———, 2018c. Cultural Resources Letter Report for the Submission of Mitigation Documentation Related to the Removal of Four Buildings and Multiple Concrete Foundations in Mercury, Nevada National Security Site, Nye County, Nevada. Cultural Resources Mitigation Submission Letter Report No. LR070918-1-MIT, Desert Research Institute, Las Vegas, Nevada.
———, 2018d. Evaluation of 1950s-Era Architectural Resources in Blocks 10, 11, and 17, Mercury, Area 23, Nevada National Security Site, Nye County, Nevada. Cultural Resources Short Report No. SR070918-1, Desert Research Institute, Las Vegas, Nevada.
———, 2018e. Cultural Resources Report on the Finding of Adverse Effect and Proposed Mitigation for the Modification of Buildings in the 23-531 Series Dormitory Complex in Mercury, Nevada National Security Site, Nye County, Nevada. Cultural Resources Finding of Effect Letter Report No. LR071018-1-FOE, Desert Research Institute, Las Vegas, Nevada.
———, 2018f. Cultural Resources Report for the Submission of Mitigation Documentation Related to the
Modification of Buildings in the 23-531 Series Dormitory Complex in Mercury, Nevada National Security Site, Nye County, Nevada. Cultural Resources Mitigation Submission Letter Report No. LR071018-1-MIT, Desert Research Institute, Las Vegas, Nevada.
———, 2018g. Evaluation of Buildings 23-531, -532, -535, and -536 in Block 17, Mercury, Area 23, Nevada National Security Site, Nye County, Nevada. Cultural Resources Short Report No. SR071018-1, Desert Research Institute, Las Vegas, Nevada.
———, 2018h. Evaluation of Dell Frenzi Park, Mercury, Area 23, Nevada National Security Site, Nye County, Nevada. Cultural Resources Inventory Short Report No. SR082018-1, Desert Research Institute, Las Vegas, Nevada.
Rhode, David E., Susanne J. Rowe, and Maureen L. King, in preparation. Nevada National Security Site Cultural Resoures Management Plan. Desert Research Institute, Las Vegas, Nevada.
Historic Preservation and Cultural Resources Management
184 Nevada National Security Site Environmental Report 2018
Rowe, Susanne J., Richard Arnold, and Maureen King, 2018. Historic Preservation and Cultural Resource Management, Chapter 12, Nevada National Security Site Environmental Report 2017, DOE/NV/03624--0270, Patricia Hardesty, editor, Mission Support and Test Services, U.S. Department of Energy, National
Nuclear Security Administration Nevada Field Office.
Stoffle, R. W., M. N. Zedeno, and D. B. Halmo, 2001. American Indians and the Nevada Test Site, a Model of Research and Consultation. U.S. Government Printing Office, Washington, D.C.
Stueve, Megan, 2018. A Cultural Resources Inventory for the Proposed Replacement of the U1a Water Supply Line, Areas 1, 3 and 6, Nevada National Security Site, Nye County, Nevada. Cultural Resources Inventory Short Report No. SR102218-1, Desert Research Institute, Las Vegas, Nevada.
U.S. Department of Energy, National Nuclear Security Administration, Nevada Site Office, 2013. Final Site-Wide Environmental Impact Statement for the Continued Operation of the Department of Energy/National Nuclear Security Administration Nevada National Security Site and Off-Site Locations in the State of Nevada. Report DOE/EIS-0426, U.S. Department of Energy, Nevada Site Office, Las Vegas, Nevada.
Ecological Monitoring
Nevada National Security Site Environmental Report 2018 185
13.0 Ch13
Chapter 13: Ecological Monitoring
Derek B. Hall and Jeanette A. Perry
Mission Support and Test Services, LLC
Ecological Monitoring and Compliance Program Goals
Ensure compliance with all state and federal regulations and stakeholder commitments pertaining to Nevada National
Security Site (NNSS) flora, fauna, wetlands, and sensitive vegetation and wildlife habitats. Ecosystem monitoring to identify
impacts of climate and other environmental changes on the NNSS. Provide ecological information that can be used to
evaluate the potential impacts of proposed projects and programs on NNSS ecosystems and important plant and animal
species. Provide fuels assessments to examine fire risk and monitor for the success of restoration programs.
The Ecological Monitoring and Compliance (EMAC) Program provides ecological monitoring and biological compliance support for activities and programs conducted at the NNSS. Major program activities include (a)
biological surveys at proposed activity sites, (b) desert tortoise permit compliance, (c) ecosystem monitoring, (d) sensitive plant species monitoring, (e) sensitive and protected/regulated animal monitoring, and (f) habitat restoration monitoring. Brief descriptions of these programs and their 2018 accomplishments are provided in this chapter. Detailed information may be found in the most recent annual EMAC report (Hall and Perry 2019). EMAC annual reports are available at http://www.nnss.gov/pages/resources/library/EMAC.html. The reader is also directed to Attachment A: Site Description, a separate file on the compact disc of this report, where the ecology of the NNSS is described.
13.1 Desert Tortoise Compliance Program
The Mojave Desert tortoise (Gopherus agassizii), which inhabits the southern one-third (544 square miles) of the NNSS (Figure 13-1), is listed as threatened under the federal Endangered Species Act. Activities conducted in desert tortoise habitat on the NNSS must comply with the terms and conditions of a Programmatic Biological Opinion (Opinion) issued to the U.S. Department of Energy, National Nuclear Security Administration Nevada Field Office (NNSA/NFO) by the U.S. Fish and Wildlife Service (FWS) (FWS 2009); the term of the Opinion is through
February 2019. The Opinion is effectively a permit to conduct activities in desert tortoise habitat in a specific manner. It authorizes the incidental take
1 of tortoises that may occur during the activities, which, without the
Opinion, would be illegal and subject to civil or criminal penalties.
The Opinion states that proposed NNSS activities are not likely to jeopardize the continued existence of the Mojave population. It sets limits for the acres of tortoise habitat that can be disturbed; the number of accidentally injured and killed tortoises; and the number of captured, displaced, and relocated tortoises (Table 13-1). It also establishes mitigation requirements for habitat loss. The focus of the Desert Tortoise Compliance Program is to implement the Opinion’s terms and conditions, document compliance actions, and assist NNSA/NFO in continuing FWS consultations.
In March 2019, NNSA/NFO provided FWS with an updated Biological Assessment, which covers anticipated NNSS activities in tortoise habitat through 2029. NNSA/NFO awaits the completion of this formal consultation with FWS in order to obtain a new Opinion.
1 The definition of word(s) in bold italics may be found by clicking on the word in electronic version or by referencing the Glossary,
Appendix B. To return from the Glossary, right click and select Previous View.
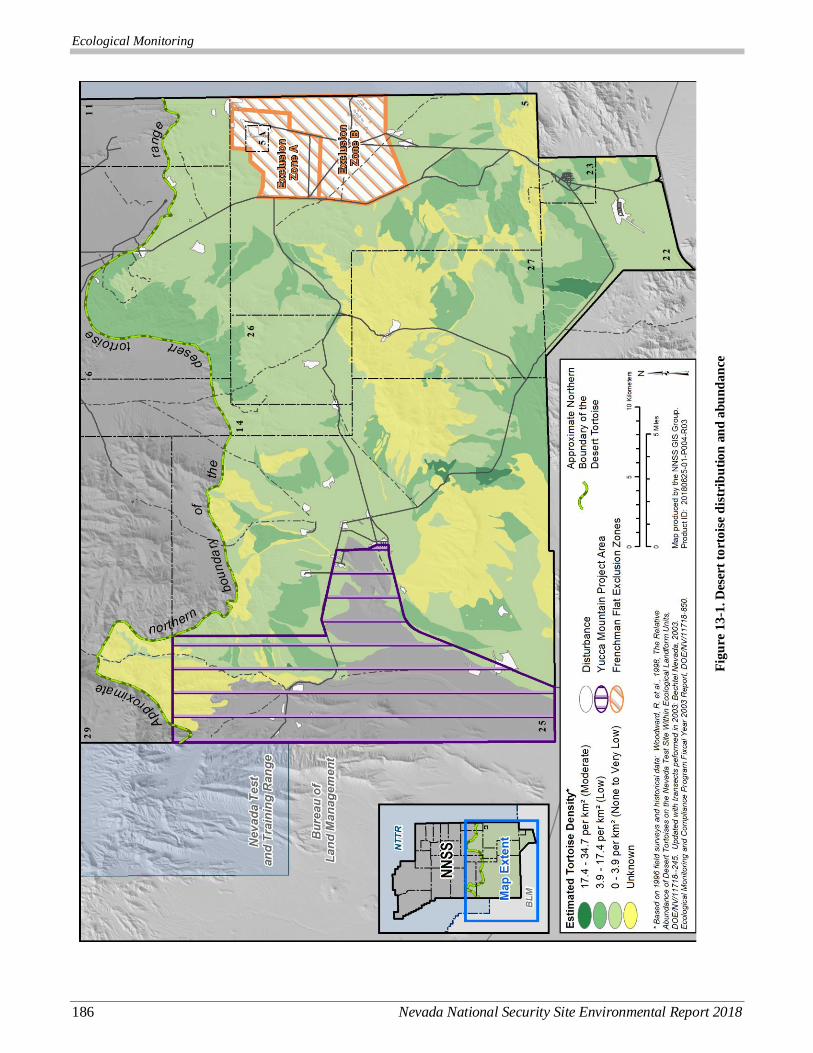
Ecological Monitoring
186 Nevada National Security Site Environmental Report 2018
Fig
ure
13
-1. D
eser
t to
rto
ise
dis
trib
uti
on
an
d a
bu
nd
an
ce
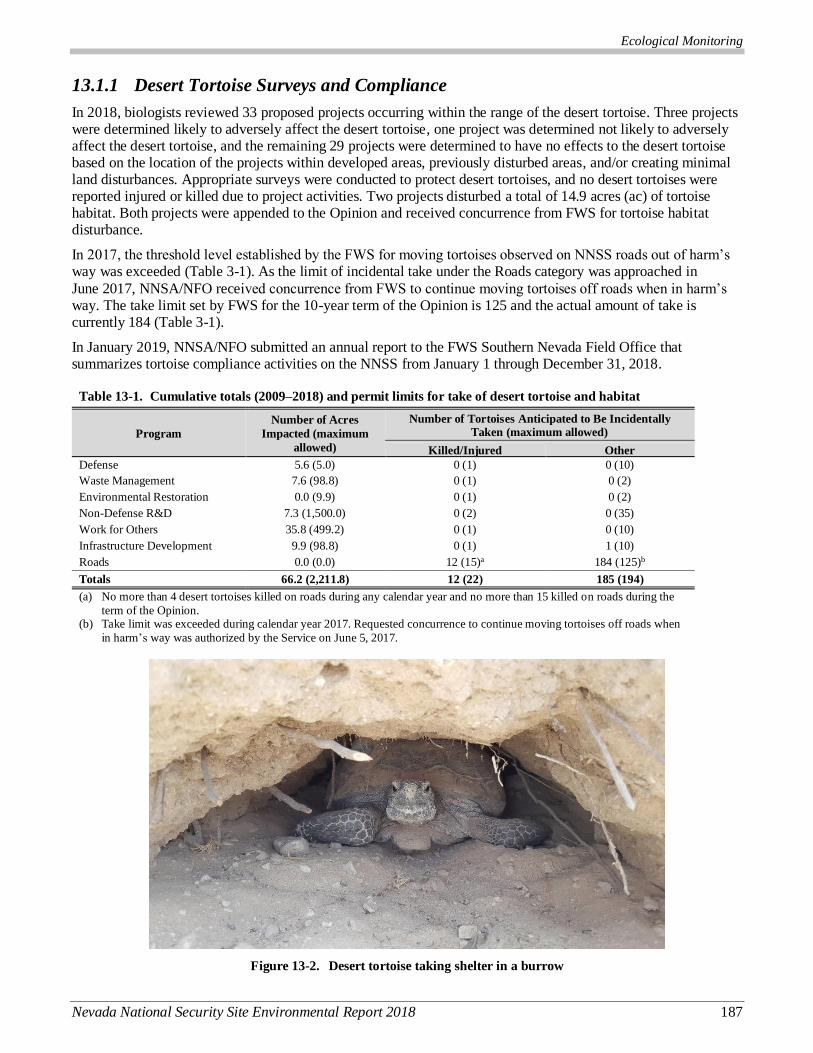
Ecological Monitoring
Nevada National Security Site Environmental Report 2018 187
13.1.1 Desert Tortoise Surveys and Compliance
In 2018, biologists reviewed 33 proposed projects occurring within the range of the desert tortoise. Three projects were determined likely to adversely affect the desert tortoise, one project was determined not likely to adversely affect the desert tortoise, and the remaining 29 projects were determined to have no effects to the desert tortoise based on the location of the projects within developed areas, previously disturbed areas, and/or creating minimal land disturbances. Appropriate surveys were conducted to protect desert tortoises, and no desert tortoises were reported injured or killed due to project activities. Two projects disturbed a total of 14.9 acres (ac) of tortoise habitat. Both projects were appended to the Opinion and received concurrence from FWS for tortoise habitat disturbance.
In 2017, the threshold level established by the FWS for moving tortoises observed on NNSS roads out of harm’s way was exceeded (Table 3-1). As the limit of incidental take under the Roads category was approached in
June 2017, NNSA/NFO received concurrence from FWS to continue moving tortoises off roads when in harm’s way. The take limit set by FWS for the 10-year term of the Opinion is 125 and the actual amount of take is currently 184 (Table 3-1).
In January 2019, NNSA/NFO submitted an annual report to the FWS Southern Nevada Field Office that summarizes tortoise compliance activities on the NNSS from January 1 through December 31, 2018.
Table 13-1. Cumulative totals (2009–2018) and permit limits for take of desert tortoise and habitat
Program
Number of Acres
Impacted (maximum
allowed)
Number of Tortoises Anticipated to Be Incidentally
Taken (maximum allowed)
Killed/Injured Other
Defense 5.6 (5.0) 0 (1) 0 (10)
Waste Management 7.6 (98.8) 0 (1) 0 (2)
Environmental Restoration 0.0 (9.9) 0 (1) 0 (2)
Non-Defense R&D 7.3 (1,500.0) 0 (2) 0 (35)
Work for Others 35.8 (499.2) 0 (1) 0 (10)
Infrastructure Development 9.9 (98.8) 0 (1) 1 (10)
Roads 0.0 (0.0) 12 (15)a 184 (125)b
Totals 66.2 (2,211.8) 12 (22) 185 (194)
(a) No more than 4 desert tortoises killed on roads during any calendar year and no more than 15 killed on roads during the
term of the Opinion. (b) Take limit was exceeded during calendar year 2017. Requested concurrence to continue moving tortoises off roads when
in harm’s way was authorized by the Service on June 5, 2017.
Figure 13-2. Desert tortoise taking shelter in a burrow
Ecological Monitoring
188 Nevada National Security Site Environmental Report 2018
13.1.2 Desert Tortoise Conservation Projects
NNSS biologists are conducting two desert tortoise projects on the NNSS, approved by the FWS. The roadside movements study tracks tortoise movement patterns for resident adult tortoises found along paved NNSS roads. The goals of the study are to determine patterns of habitat use near roads on the NNSS and assess the risk of road mortality. The juvenile tortoise translocation study monitors 60 juvenile tortoises to evaluate the survival of juveniles released from captivity to the wild. Prior to their release, the tortoises were in the care of the San Diego Zoo Institute for Conservation Research at the Desert Tortoise Conservation Center located near Las Vegas, Nevada. For both projects, NNSS biologists use radiotelemetry to track the location of study tortoises, record habitat characteristics and use, and collect other ecological data. Since 2013, NNSS biologists have conducted and
supported these projects in lieu of the NNSS paying remuneration fees to FWS for habitat loss that may result from NNSS projects (i.e., all projects except for the Work for Others Program).
Since 2012, the roadside movements study has monitored a total of 30 tortoises (the maximum allowed by the FWS) for a minimum of three active seasons (March through October) per individual. Each tortoise is affixed with a Global Positioning Unit; an analysis of the data logged in these units will help NNSS and FWS understand tortoise use of roads and adjacent habitats and the risk of mortality or injury associated with that use. In 2018, six tortoises were actively monitored as part of the ongoing study. Transmitters were removed from the animals in September 2018, when fieldwork came to completion for the study. Preliminary results from the study are included in the most recent annual EMAC report (Hall and Perry 2019).
Of the 60 juvenile tortoises released in 2012, three died in 2018. For one, the cause of death was suspected exposure; the other two were assumed to have succumbed to predation. The remaining 24 continued to be monitored in 2018. Monitoring includes location tracking and annual health assessments. This study will continue
for the next several years and will provide valuable data for future juvenile desert tortoise translocations.
13.2 Biological Surveys at Proposed Project Sites
Biological surveys are performed at proposed project sites where project activities may have significant impacts to plants, animals, associated habitat, and other biological resources (e.g., the demolition of structures that may contain bird nests). The goal is to minimize the adverse effects to important biological resources (Section 13.3).
Important biological resources include such things as cover sites, nest/burrow sites, roost sites, wetlands, or water sources that are vital to important species.
In 2018, biologists surveyed a total of 769 ac for 29 proposed
projects in or near the NNSS. Although projects target previously disturbed areas (e.g., road shoulders, utility corridors), a total of 53 ac, including 8.4 ac of sensitive habitat, were disturbed in 2018. The total area of disturbed important habitats has been tracked since 1999; totals to date are 23.4 ac (Pristine), 43.1 ac (Unique), 937.8 ac (Sensitive), and 215.1 ac (Diverse).
Important animal species and other biological resources observed included tortoise burrows; several potential and active burrowing owl sites; several predator burrows, which can be utilized by tortoises and
other wildlife; and several bird nests and species. Important plant species observed were yucca, cacti, and pine trees. In addition, pronghorn antelope, mule deer, burro, and horse scat were observered at several project sites. Biologists communicated to ground crews and provided written reports of survey findings and mitigation recommendations. Important biological resources within project sites were flagged, avoided, or removed.
13.3 Important Species and Ecosystem Monitoring
NNSA/NFO strives to protect and conserve sensitive plant and animal species found on the NNSS and to minimize cumulative impacts to those species as a result of NNSA/NFO activities. Important species known to occur on the NNSS include one mollusk, two reptiles, 241 birds, 23 mammals, 21 sensitive plants, and 23 plants protected from unauthorized collection. They are identified in Tables A-10 and A-11 of Attachment A: Site
Important Habitat Categories
Pristine Habitat: having few human-made
disturbances
Unique Habitat: containing uncommon
biological resources such as a natural wetland
Sensitive Habitat: containing vegetation
associations that recover very slowly from
direct disturbance or are susceptible to erosion
Diverse Habitat: having high plant species
diversity
Ecological Monitoring
Nevada National Security Site Environmental Report 2018 189
Description, included on the compact disc of this document. They are classified as important due to their sensitive, protected, and/or regulatory status with state or federal agencies, and they are evaluated for inclusion in long-term monitoring activities on the NNSS. NNSA/NFO has produced numerous documents reporting the
occurrence, distribution, and susceptibility to threats for predominately sensitive species on the NNSS (Wills and Ostler 2001).
Field monitoring activities in 2018 related to important NNSS plants and animals and to ecosystem monitoring
are listed in Table 13-2. A description of the methods and a more detailed presentation of the results of these activities are reported in Hall and Perry (2019).
Table 13-2. Activities conducted in 2018 for important species and ecosystem monitoring on the NNSS
Sensitive Plants (Table A-10 of Attachment A: Site Description)
The list of known sensitive plants on the NNSS was reviewed and determined to be up-to-date with the current Nevada Natural
History Program’s “At-Risk Plant and Animal Tracking List.” Four sensitive plant populations were monitored, including the Cane
Spring suncup (Camissonia megalantha), Clokey’s buckwheat (Eriogonum heermanni var. clokeyi), Inyo hulsea (Hulsea vestita ssp. inyoensis), and Death Valley beardtongue (Penstemon fruticiformis var. armagosae). The Cane Spring suncup population located at
Cane Spring showed minimal threats from trampling and herbivory. No evidence of threat was observed in the other three species.
Opportunistic observations of other sensitive plant occurrences were documented.
Reptiles
No trapping or roadkill surveys were conducted in 2018. Opportunistic observations were documented.
Migratory Birds (protected under the Migratory Bird Treaty Act)
Three instances of greater roadrunner (Geococcyx californianus) nesting in equipment were recorded. In one instance, the nest was
relocated with the approval of the FWS; the other two nests were left undisturbed until the nests were empty.
Twelve birds were found dead on the NNSS in 2018. Seven were electrocuted, including four golden eagles (Aquila chrysaetos), one red-tailed hawk (Buteo jamaicensis), one great horned owl (Bubo virginianus), and one greater roadrunner. Two birds were
killed by vehicles. A golden eagle was injured by a vehicle and cared for by a raptor rehabilitator (Wild Wing Project) for about
6 months. Shortly before its planned release back to the NNSS, it became ill and died. Additionally, a western screech owl
(Megascops kennicottii) was killed by a vehicle. A Wilson’s warbler (Wilsonia pusilla) was extracted from a glue trap, but died the next day. Two birds died of unknown causes, including a red-tailed hawk found dead near the ATLAS facility in Yucca Flat
(Area 6) and a great horned owl that was found alive in Frenchman Flat but died later that day. It appeared to have some head
trauma with unresponsive pupils and may have flown into a building.
The Power Group installed a variety of retrofits, including insulator covers and extenders, perch deterrents, conductor-wire covers,
and fuse covers. In addition, the FWS issued a Special Purpose Utility permit to NNSA/NFO, which allows NNSS biologists to
remove active nests at project sites in emergencies, and to possess and transport carcasses of golden eagles and other bird species.
All permit conditions were met in 2018, and an annual report summarizing activities was submitted to FWS.
Two winter raptor survey routes were sampled in January and February; 56 raptor sightings, representing five species, were
recorded. Data were shared with the U.S. Army Corps of Engineers for their nationwide mid-winter bald eagle survey, and with the
Nevada Department of Wildlife (NDOW) for their statewide monitoring effort.
Wild Horses (Equus caballus) (protected under the Wild Free Roaming Horses and Burros Act)
Horse monitoring has been conducted since 1989 to determine abundance, foal survival, and population distribution on the NNSS.
Horse surveys were conducted during the summer in 2018 to determine abundance and band distribution. Survey locations included
Camp 17 Pond, Airport Road, and Pahute Mesa Road. A total of 40 individuals were observed in at least five different bands; the
total includes six juveniles and five foals.
Opportunistic sightings were also noted and motion-activated cameras at water sources were used. Camp 17 Pond and Gold
Meadows Spring continue to be important summer water sources for NNSS horses.
Mule Deer (Odocoileus hemionus) (managed as a game mammal by NDOW)
Mule deer surveys were conducted on Pahute and Rainier mesas, and the average number of deer counted was 19 deer/night. The observed buck/doe ratio was 105 bucks/100 does, a slight decrease from 2017 but well within the overall average of 109/100
(2006–2018). The observed fawn/doe ratio was 26 fawns/100 does, which matches 2017 counts.
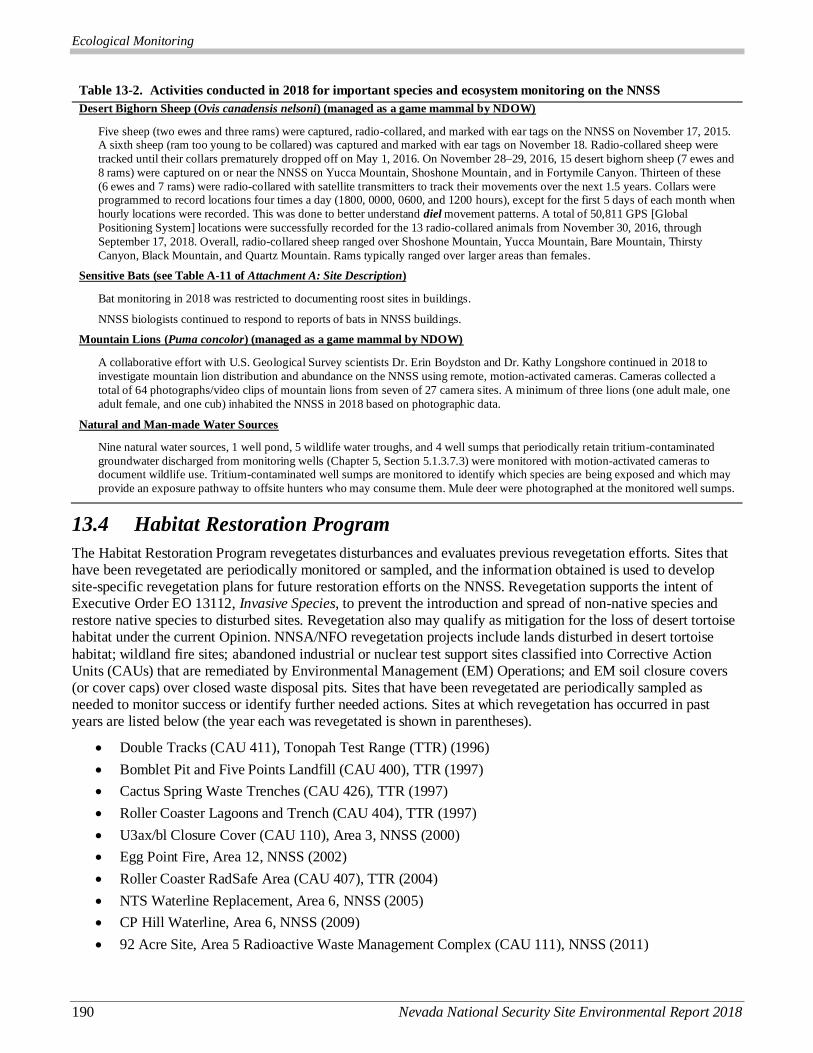
Ecological Monitoring
190 Nevada National Security Site Environmental Report 2018
Table 13-2. Activities conducted in 2018 for important species and ecosystem monitoring on the NNSS
Desert Bighorn Sheep (Ovis canadensis nelsoni) (managed as a game mammal by NDOW)
Five sheep (two ewes and three rams) were captured, radio-collared, and marked with ear tags on the NNSS on November 17, 2015. A sixth sheep (ram too young to be collared) was captured and marked with ear tags on November 18. Radio-collared sheep were
tracked until their collars prematurely dropped off on May 1, 2016. On November 28–29, 2016, 15 desert bighorn sheep (7 ewes and
8 rams) were captured on or near the NNSS on Yucca Mountain, Shoshone Mountain, and in Fortymile Canyon. Thirteen of these
(6 ewes and 7 rams) were radio-collared with satellite transmitters to track their movements over the next 1.5 years. Collars were programmed to record locations four times a day (1800, 0000, 0600, and 1200 hours), except for the first 5 days of each month when
hourly locations were recorded. This was done to better understand diel movement patterns. A total of 50,811 GPS [Global
Positioning System] locations were successfully recorded for the 13 radio-collared animals from November 30, 2016, through
September 17, 2018. Overall, radio-collared sheep ranged over Shoshone Mountain, Yucca Mountain, Bare Mountain, Thirsty
Canyon, Black Mountain, and Quartz Mountain. Rams typically ranged over larger areas than females.
Sensitive Bats (see Table A-11 of Attachment A: Site Description)
Bat monitoring in 2018 was restricted to documenting roost sites in buildings.
NNSS biologists continued to respond to reports of bats in NNSS buildings.
Mountain Lions (Puma concolor) (managed as a game mammal by NDOW)
A collaborative effort with U.S. Geological Survey scientists Dr. Erin Boydston and Dr. Kathy Longshore continued in 2018 to
investigate mountain lion distribution and abundance on the NNSS using remote, motion-activated cameras. Cameras collected a
total of 64 photographs/video clips of mountain lions from seven of 27 camera sites. A minimum of three lions (one adult male, one
adult female, and one cub) inhabited the NNSS in 2018 based on photographic data.
Natural and Man-made Water Sources
Nine natural water sources, 1 well pond, 5 wildlife water troughs, and 4 well sumps that periodically retain tritium-contaminated
groundwater discharged from monitoring wells (Chapter 5, Section 5.1.3.7.3) were monitored with motion-activated cameras to document wildlife use. Tritium-contaminated well sumps are monitored to identify which species are being exposed and which may
provide an exposure pathway to offsite hunters who may consume them. Mule deer were photographed at the monitored well sumps.
13.4 Habitat Restoration Program
The Habitat Restoration Program revegetates disturbances and evaluates previous revegetation efforts. Sites that have been revegetated are periodically monitored or sampled, and the information obtained is used to develop site-specific revegetation plans for future restoration efforts on the NNSS. Revegetation supports the intent of Executive Order EO 13112, Invasive Species, to prevent the introduction and spread of non-native species and restore native species to disturbed sites. Revegetation also may qualify as mitigation for the loss of desert tortoise habitat under the current Opinion. NNSA/NFO revegetation projects include lands disturbed in desert tortoise
habitat; wildland fire sites; abandoned industrial or nuclear test support sites classified into Corrective Action Units (CAUs) that are remediated by Environmental Management (EM) Operations; and EM soil closure covers (or cover caps) over closed waste disposal pits. Sites that have been revegetated are periodically sampled as needed to monitor success or identify further needed actions. Sites at which revegetation has occurred in past years are listed below (the year each was revegetated is shown in parentheses).
Double Tracks (CAU 411), Tonopah Test Range (TTR) (1996)
Bomblet Pit and Five Points Landfill (CAU 400), TTR (1997)
Cactus Spring Waste Trenches (CAU 426), TTR (1997)
Roller Coaster Lagoons and Trench (CAU 404), TTR (1997)
U3ax/bl Closure Cover (CAU 110), Area 3, NNSS (2000)
Egg Point Fire, Area 12, NNSS (2002)
Roller Coaster RadSafe Area (CAU 407), TTR (2004)
NTS Waterline Replacement, Area 6, NNSS (2005)
CP Hill Waterline, Area 6, NNSS (2009)
92 Acre Site, Area 5 Radioactive Waste Management Complex (CAU 111), NNSS (2011)
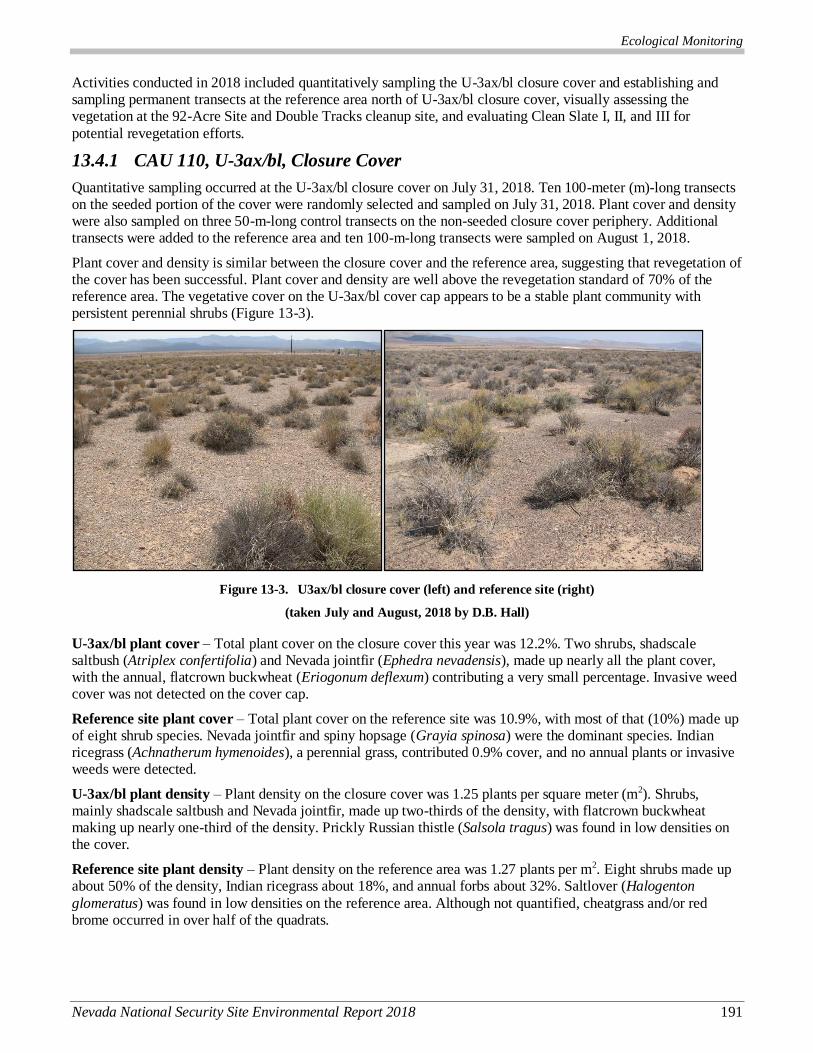
Ecological Monitoring
Nevada National Security Site Environmental Report 2018 191
Activities conducted in 2018 included quantitatively sampling the U-3ax/bl closure cover and establishing and sampling permanent transects at the reference area north of U-3ax/bl closure cover, visually assessing the vegetation at the 92-Acre Site and Double Tracks cleanup site, and evaluating Clean Slate I, II, and III for
potential revegetation efforts.
13.4.1 CAU 110, U-3ax/bl, Closure Cover
Quantitative sampling occurred at the U-3ax/bl closure cover on July 31, 2018. Ten 100-meter (m)-long transects on the seeded portion of the cover were randomly selected and sampled on July 31, 2018. Plant cover and density were also sampled on three 50-m-long control transects on the non-seeded closure cover periphery. Additional transects were added to the reference area and ten 100-m-long transects were sampled on August 1, 2018.
Plant cover and density is similar between the closure cover and the reference area, suggesting that revegetation of the cover has been successful. Plant cover and density are well above the revegetation standard of 70% of the reference area. The vegetative cover on the U-3ax/bl cover cap appears to be a stable plant community with persistent perennial shrubs (Figure 13-3).
Figure 13-3. U3ax/bl closure cover (left) and reference site (right)
(taken July and August, 2018 by D.B. Hall)
U-3ax/bl plant cover – Total plant cover on the closure cover this year was 12.2%. Two shrubs, shadscale saltbush (Atriplex confertifolia) and Nevada jointfir (Ephedra nevadensis), made up nearly all the plant cover, with the annual, flatcrown buckwheat (Eriogonum deflexum) contributing a very small percentage. Invasive weed cover was not detected on the cover cap.
Reference site plant cover – Total plant cover on the reference site was 10.9%, with most of that (10%) made up of eight shrub species. Nevada jointfir and spiny hopsage (Grayia spinosa) were the dominant species. Indian ricegrass (Achnatherum hymenoides), a perennial grass, contributed 0.9% cover, and no annual plants or invasive weeds were detected.
U-3ax/bl plant density – Plant density on the closure cover was 1.25 plants per square meter (m2). Shrubs, mainly shadscale saltbush and Nevada jointfir, made up two-thirds of the density, with flatcrown buckwheat making up nearly one-third of the density. Prickly Russian thistle (Salsola tragus) was found in low densities on the cover.
Reference site plant density – Plant density on the reference area was 1.27 plants per m2. Eight shrubs made up about 50% of the density, Indian ricegrass about 18%, and annual forbs about 32%. Saltlover (Halogenton
glomeratus) was found in low densities on the reference area. Although not quantified, cheatgrass and/or red brome occurred in over half of the quadrats.

Ecological Monitoring
192 Nevada National Security Site Environmental Report 2018
Non-seeded Portion of U-3ax/bl Closure Cover – On the non-seeded portion of the closure cover, 0% plant cover and an average of 4 plants (flatcrown buckwheat) per m2 was documented. Additionally, 10.9 invasive plants per m2 (9 saltlover and 1.9 prickly Russian thistle) were documented.
Wildlife Usage – Several western whiptail lizards (Aspidoscelis tigris) and one black-tailed jackrabbit (Lepus californicus) were observed on the closure cover. In some places, ants were abundant and very active on the surface. Several rodent burrows were observed, but only a few of them appeared to be active. Rabbit pellets were
only observed in 1% of the m2 quadrats. The only plant that seems to be impacted by rabbit herbivory is winterfat (Krascheninnikovia lanata) and possibly desert globemallow (Sphaeralcea ambigua). In comparison, several western whiptail lizards, a side-blotched lizard (Uta stansburiana), and one horned lizard (Phrynosoma platyrhinos) were observed on the reference site. Coyote scat was documented and rabbit pellets were found in 20% of the m2 quadrats.
13.4.2 CAU 111, 92-Acre Site, Closure Covers
No quantitative sampling occurred at the 92-Acre Site in 2018. A visual assessment in July found very few perennial plants on any of the cover caps. There were about 20 large fourwing saltbush (Atriplex canescens)
plants on the North South Cover. These plants were from the prior revegetation efforts that had survived the extensive rabbit herbivory before the site was fenced.
Overall, the integrity of the cover caps is very good. Weed densities were low due to the lack of precipitation, with saltlover and prickly Russian thistle being the most common species. No rabbits or fresh rabbit sign were observed. Light rodent burrowing activity was detected but does not appear to be enough of a concern to trap.
13.4.3 Double Tracks
In December, an NNSS biologist conducted a qualitative assessment of the Double Tracks Cleanup Site plant community. The site was revegetated in 1996 and last evaluated in 2007. Perennial plant cover and density was in good condition. There were some bare areas where saltlover was abundant and there was some Russian thistle scattered throughout as well. There were several small washes and rivulets that had formed since the last visit,
allowing for natural drainage across the site.
13.4.4 Clean Slate I, II, and III
Clean Slate I, II, and III were visually assessed in December to evaluate the feasibility of revegetation. Clean Slate I was cleaned up in 1997 but was not revegetated. Natural succession has filled in some of the bare areas, especially by the rhizomatous, spreading galleta grass (Pleuraphis jamesii). Bare areas were dominated by saltlover. Clean-up efforts at Clean Slate II were completed in 2018. It was assessed to determine the feasibility of revegetating the staging areas and cleaned-up sites inside the contamination area.
Clean-up efforts at Clean Slate III are ongoing, with an anticipated completion date of August 2019. It was assessed to determine the feasibility of revegetation as well. A report was submitted to Navarro containing the results of the site visits and a proposed revegetation strategy for Clean Slate II and III.
13.5 Wildland Fire Hazard Assessment
A Wildland Fire Management Plan is maintained that requires protection of site resources from wildland and operational fires. An annual vegetation survey to determine wildland fire hazards is conducted on the NNSS each spring. Survey findings are submitted to the NNSS Fire Marshal and summarized in the annual EMAC report (Hall and Perry 2019). In April and May 2018, NNSS biologists visited 104 roadside sampling stations to assess a fuel index that can range from 0 to 10 (lowest to highest risk of wildfires). The mean combined fuels index (which
includes both fine [non-woody] and woody fuels) for all sampling stations was 4.32. Due to the below-average precipitation received during winter/spring 2017–2018, few annual grasses and forbs germinated and grew. Production of perennial herbaceous grasses and forbs was also limited.
In 2018, five wildland fires occurred on the NNSS. The largest occurred in Area 19 in late July and was caused by lightning. It burned approximately 2,501 ac between Lambs Canyon and Kawich Canyon in pinyon pine/Utah juniper/sagebrush habitat. Another large fire caused by a power pole break burned about 1,132 ac in Mid Valley
Ecological Monitoring
Nevada National Security Site Environmental Report 2018 193
(Area 16) in blackbrush habitat. This fire occurred in mid-April, which was fortunate because moisture content in the vegetation was still relatively high. A small fire (42 ac) occurred in late July in Area 30, likely due to lightning. The other two wildland fires were small (<1 ac) and were extinguished by NNSS Fire and Rescue
personnel or carefully monitored until they burned out.
13.6 References
Hall, D. B. and J. A. Perry, 2019. Ecological Monitoring and Compliance Program 2018 Report. DOE/NV/03624--0599. Mission Support and Test Services, LLC, Las Vegas, NV.
U.S. Fish and Wildlife Service, 2009. Final Programmatic Biological Opinion for Implementation of Actions Proposed on the Nevada Test Site, Nye County, Nevada. File Nos. 84320-2008-F-0416 and B-0015,
February 12, 2009, Las Vegas, NV.
Wills, C. A., and W. K. Ostler, 2001. Ecology of the Nevada Test Site: An Annotated Bibliography, with Narrative Summary, Keyword Index, and Species List. DOE/NV/11718--594, Bechtel Nevada, Ecological Services, Las Vegas, NV. OSTI ID: 901998
Ecological Monitoring
194 Nevada National Security Site Environmental Report 2018
THIS PAGE INTENTIONALLY LEFT BLANK
Quality Assurance Program
Nevada National Security Site Environmental Report 195
14.0 Ch14
Chapter 14: Quality Assurance Program
Elizabeth Burns and Theodore J. Redding
Mission Support and Test Services, LLC
Milinka Watson-Garrett and Irene Farnham
Navarro Research and Engineering, Inc.
Charles B. Davis
EnviroStat
The environmental monitoring work conducted for the U.S. Department of Energy, National Nuclear Security Administration Nevada Field Office (NNSA/NFO) and the Environmental Management (EM) Nevada Program is performed in accordance with the Quality Assurance Program (QAP) established by the current Management and Operations (M&O) Contractor, Mission Support and Test Services, LLC (MSTS), or with the Underground Test Area (UGTA) QAP
implemented by Navarro Research and Engineering, Inc. (Navarro). The QAPs describe the methods used to ensure quality is integrated into monitoring work, and to comply with Title 10 Code of Federal Regulations (CFR)1 Part 830, Subpart A, Quality Assurance Requirements, and with U.S. Department of Energy (DOE) Order DOE O 414.1D, Quality Assurance. The 10 criteria of a quality program specified by these regulations are shown in the box above. The QAPs require a graded approach to quality for determining the level of rigor that effectively provides assurance of performance and conformance to
requirements.
A Data Quality Objective (DQO) process is cited by most organizations as the planning approach used to ensure that environmental data collection activities produce the appropriate data needed for decision-making. Sampling
and Analysis Plans are developed prior to performing an activity to ensure complete understanding of the data-use objectives. Personnel are trained and qualified in accordance with company- and task-specific requirements. Access to sampling locations is coordinated with organizations conducting work at or having authority over those locations in order to avoid conflicts in activities and to communicate hazards to better ensure successful execution of the work and protection of the safety and health of sampling personnel. Sample collection activities adhere to organization instructions and/or procedures designed to ensure that samples are representative and data are reliable and defensible. Sample shipments on site and to offsite laboratories are conducted in accordance with
U.S. Department of Transportation and International Air Transport Association regulations, as applicable. Quality
control (QC) in the analytical laboratories is maintained through adherence to standard operating procedures based on methodologies developed by nationally recognized organizations such as DOE, the Environmental Protection Agency (EPA), and ASTM International. Key quality-affecting procedural areas cover sample collection, preparation, instrument calibration, instrument performance checking, testing for precision and accuracy, obtaining a measurement, and laboratory data review. Data users perform reviews as required by the project-specific objectives before the data are used to support decision-making.
The key elements of the environmental monitoring process workflow are listed below. Each element is designed to ensure that applicable quality assurance (QA) requirements are implemented. A discussion of these elements follows.
A Sampling and Analysis Plan (SAP) is developed consistent with a DQO process to ensure clear goals
and objectives are established for the environmental activity. The SAP is implemented in accordance with EPA, DOE, and other requirements addressing environmental, safety, and health objectives.
1 The definition of word(s) in bold italics may be found by clicking on the word in electronic version or by referencing the Glossary,
Appendix B. To return from the Glossary, right click and select Previous View.
Required Criteria of a Quality Program
Quality assurance program
Personnel training and qualification
Quality improvement process
Documents and records
Established work processes
Established standards for design and verification
Established procurement requirements
Inspection and acceptance testing
Management assessment
Independent assessment
Quality Assurance Program
196 Nevada National Security Site Environmental Report 2018
Environmental Sampling is performed in accordance with the SAP, procedures, and site work controls to ensure defensibility of the resulting data products as well as protection of the worker and the
environment.
Laboratory Analyses are performed to ensure the resultant data meet DOE, MSTS (as the current M&O contractor), and UGTA regulation-defined requirements.
Data Review ensures the SAP DQOs have been met, and determines whether the data are suitable for their intended purpose.
Assessments ensure monitoring operations are conducted according to procedure and analytical data quality requirements are met in order to identify nonconforming items, investigate causal factors, implement corrective actions, and monitor for corrective action effectiveness.
14.1 Sampling and Analysis Plan
Sampling is specifically mandated to demonstrate compliance with a variety of requirements, including federal and state regulations and DOE orders and standards. Developing the SAP using the DQO approach ensures those requirements are considered in the planning stage. The following statistical concepts and controls are vital in designing and evaluating the system design and implementation.
14.1.1 Precision
Precision is the degree to which a set of observations or measurements of the same property, obtained under similar conditions, conform to themselves. Precision is a data quality indicator and is usually expressed as
standard deviation, variance, or range, in either absolute or relative terms (DOE 2013).
In practice, precision is determined by comparing the results obtained from performing analyses on split or
duplicate samples taken at the same time from the same location or locations very close to one another, maintaining sampling and analytical conditions as nearly identical as possible.
14.1.2 Accuracy
Accuracy refers to the degree of agreement between an observed value and an accepted reference value. Accuracy includes a combination of random error (precision) and systematic error (bias) components that are due to sampling and analytical operations. Accuracy is a data quality indicator (DOE 2013) and is monitored by performing measurements and evaluating results of control samples containing known quantities of the analytes of interest.
14.1.3 Representativeness
Representativeness is the degree to which measured analytical concentrations represent concentrations in the
medium being sampled (Stanley and Verner 1985).
At each point in the sampling and analysis process, samples of the medium of interest are obtained. The challenge is to ensure each sample maintains the character of the larger population being sampled. From a field sample
collection standpoint, representativeness is managed through sampling plan design and execution. Sampling locations are/have been determined historically by consensus and/or agreement with authorities, in many cases, or are determined based on the properties of the operation being monitored (such as environmental remediation).
Representativeness related to laboratory operations addresses the ability to appropriately subsample and characterize for analytes of interest. For example, to ensure representative characterization of a heterogeneous matrix (soil, sludge, solids, etc.), the sampling and/or analysis process should evaluate whether homogenization or segregation should be employed prior to sampling or analysis. Water samples are generally considered homogeneous unless observation suggests otherwise. Each air monitoring station’s continuous operation at a fixed location results in representatively sampling the ambient atmosphere. Field sample duplicate analyses are
additional controls allowing evaluation of representativeness and heterogeneity; these are employed for air monitoring and direct radiation monitoring measurements. Generally, monitoring measurements are compared with historical measurements at the same location.
Quality Assurance Program
Nevada National Security Site Environmental Report 197
14.1.4 Comparability
Comparability refers to “the confidence with which one data set can be compared to another” (Stanley and Verner 1985). Comparability from an overall monitoring perspective is ensured by consistent execution of the sampling design for sample collection and handling, laboratory analyses, and data review and through adherence to established procedures and standardized methodologies. Ongoing data evaluation compares data collected at the same locations from sampling events conducted over multiple years and produced by numerous laboratories to detect any anomalies that might occur.
14.2 Environmental Sampling
Environmental samples are collected in support of various environmental programs. Each program executes field-sampling activities in accordance with the SAP to ensure usability and defensibility of the resulting data. The key elements supporting the quality and defensibility of the sampling process and products include the following:
Training and qualification
Procedures and methods
Field documentation
Inspection and acceptance testing
14.2.1 Training and Qualification
The environmental programs ensure that personnel are properly trained and qualified prior to doing the work. In addition to procedure-specific and task-specific qualifications for performing work, training addresses environment, safety, and health aspects for protection of workers, the public, and the environment. Recurrent training is also conducted as appropriate to maintain proficiency.
14.2.2 Procedures and Methods
Sampling is conducted in accordance with established procedures to ensure consistent execution and continuous
comparability of the environmental data. Descriptions of the analytical methods to be used are also consulted to ensure that, as methods are revised, sample collection is performed appropriately and viable samples are obtained.
14.2.3 Field Documentation
Field documentation is generated for each sample collection activity. This may include chain of custody documentation, sampling procedures, analytical methods, equipment and data logs, maps, Safety Data Sheets, and other materials needed to support the safe and successful execution and defense of the sampling effort. Chain-of-custody practices are employed from point of generation through disposal (cradle-to-grave); these are critical to the defensibility of the decisions made as a result of the sampling and analysis. Sampling data and documentation
are stored and archived so they are readily retrievable for use later. In many cases, the data are managed in electronic data management systems. Routine assessments or surveillances are performed to ensure that sampling activities are performed in accordance with applicable requirements. Deficiencies are noted, causal factors are determined, corrective actions are implemented, and follow-up assessments are performed to ensure effective resolution. This data management approach ensures the quality and defensibility of the decisions made using analytical environmental data.
14.2.4 Inspection and Acceptance Testing
Sample collection data are reviewed for appropriateness, accuracy, and fit with historical measurements. In the
case of groundwater sampling, water quality parameters are monitored during purging. Stabilization of these parameters generally indicates that the water is representative of the aquifer, at which time sample collection may begin. After a sampling activity is complete, data are reviewed to ensure the samples were collected in accordance with the SAP. Samples are further inspected to ensure that their integrity has not been compromised, either physically (leaks, tears, breakage, custody seals) or administratively (labeled incorrectly), and that they are valid for supporting the intended analyses. If concerns are raised at any point during collection, the data user, in consideration of data usability, is consulted for direction on proceeding with or canceling the subsequent analyses.

Quality Assurance Program
198 Nevada National Security Site Environmental Report 2018
14.3 Laboratory Analyses
Samples are transported to a laboratory for analysis. Several DOE contractor organizations maintain measurement capabilities that may be used to support planning or decision-making activities. However, unless specifically authorized by NNSA/NFO, the EM Nevada Program, or the regulator, data used for demonstrating regulatory compliance are generated by a DOE- and contractor-qualified laboratory whose services have been obtained through subcontracts. Ensuring the quality of procured laboratory services is accomplished through focus on three
specific areas: (1) procurement, (2) initial and continuing assessment, and (3) data evaluation.
14.3.1 Procurement
Laboratory services are procured through subcontracts in accordance with the Competition in Contracting Act, the Federal Acquisition Regulations, the DOE Acquisition Regulations, contractor terms and conditions for subcontracting, and other relevant policies and procedures. The analytical services technical basis is codified in the Department of Energy (DOE) Consolidated Quality Systems Manual (QSM) for Environmental Laboratories (DOE 2013). The QSM is based on the National Environmental Laboratory Accreditation Conference (NELAC) Chapter 5, “Quality Systems,” as implemented in 2005, based on International Organization for Standardization
Standard ISO 17025, “General Requirements for the Competence of Testing and Calibration Laboratories,” and the NELAC Institute (TNI) Standards Volume 1 2009. Subcontracted laboratories are assessed to comply with the QSM and are routinely audited under the DOE Consolidated Audit Program (DOECAP).
A request for proposal (RFP) is posted to the government website, laboratory responses are evaluated, and subcontracts awarded. The RFP cites the QSM and DOECAP participation as base requirements and addresses site-specific conditions. Multiple laboratories may receive a subcontract through one RFP.
The laboratories are primarily those providing a wide range of analytical services to DOE. Other services can be subcontracted by the laboratory (i.e., lower-tier subcontractor) or contracted directly from a vendor. In either case,
requirements are established for the specific services provided.
The subcontract places numerous requirements on the laboratory, including the following:
Maintaining the following documents:
A Quality Assurance Plan and/or Manual describing the laboratory’s policies and approach to the
implementation of QA requirements
An Environment, Safety, and Health Plan
A Waste Management Plan
Procedures pertinent to subcontract scope
The ability to generate data deliverables, both hard copy reports and electronic files
Responding to all data quality questions in a timely manner
Mandatory participation in proficiency testing programs
Maintaining specific licenses, accreditations, and certifications
Conducting internal audits of laboratory operations as well as audits of vendors
Allowing external audits by DOECAP, EM Nevada Program, and NNSA/NFO contractors and providing
copies of other audits considered to be comparable and applicable
14.3.2 Initial and Continuing Assessment
An initial assessment is made during the RFP process, including a pre-award audit. If an acceptable audit has not been performed within the past year, MSTS or Navarro will consider performing an audit (or participating in a DOECAP audit) of those laboratories awarded the contract. Neither contractor will initiate work with a laboratory without authorized approval from those personnel responsible for ensuring vendor acceptability.
Quality Assurance Program
Nevada National Security Site Environmental Report 199
A continuing assessment consists of the ongoing monitoring of a laboratory’s performance against contract terms and conditions, of which the technical specifications are a part. Tasks supporting continuing assessment are listed below:
Conducting regular audits or participating in evaluation of DOECAP audit products
Monitoring for continued successful participation in proficiency testing programs such as:
– National Institute of Standards and Technology Radiochemistry Intercomparison Program
– Studies that support certification by the State of Nevada or appropriate regulatory authority for analyses performed in support of routine monitoring
Routine ongoing monitoring of the laboratory’s adherence to the quality requirements
14.3.3 Data Evaluation
Data products are routinely evaluated for compliance with contract terms and specifications. This primarily involves review of the data against the specified analytical method to determine the laboratory’s ability to adhere to the QA/QC requirements, as well as an evaluation of the data against the DQOs. This activity is discussed in further detail in Section 14.4. Any discrepancies are documented and resolved with the laboratory, and ongoing assessment tracks the recurrence and efficacy of corrective actions.
14.4 Data Review
A systematic approach to thoroughly evaluating the data products generated from an environmental monitoring effort is essential for understanding and sustaining the quality of data collected under the program. This allows the programs to determine whether the DQOs established in the planning phase were achieved and whether the monitoring design performed as intended or requires review.
Because decisions are based on environmental data, and the effectiveness of operations is measured at least in part by environmental data, reliable, accurate, and defensible records are essential. Detailed records that must be kept include temporal, spatial, numerical, geotechnical, chemical, and radiological data as well as all sampling, analytical, and data review procedures used. Failure to maintain these records in a secure but accessible form may result in exposure to legal challenges and the inability to respond to demands or requests from regulators and
other interested organizations.
An electronic data management system is a key tool used by many programs for achieving standardization and integrity in managing environmental data. The primary objective is to store and manage in an easily and
efficiently retrievable form unclassified environmental data that are directly or indirectly tied to monitoring events. This may include information on monitoring system construction (groundwater wells, ambient air monitoring), and analytical, geotechnical, and field parameters at the Nevada National Security Site. Database integrity and security are enforced through the assignment of varying database access privileges commensurate with an employee’s database responsibilities.
14.4.1 Data Verification
Data verification generally involves a subcontract compliance and completeness review to ensure that all laboratory data and sample documentation are present and complete. Additional critical sampling and analysis
process information is also reviewed at this stage, which may include, but is not limited to, sample preservation and temperature, defensible chain-of-custody documentation and integrity, and analytical hold-time compliance. Data verification also ensures that electronic data products correctly represent the sampling and/or analyses performed, and includes evaluation of QC sample results.
14.4.2 Data Validation
Data validation supplements verification and is a more thorough process of analytical data review to better determine if the data meet the analytical and project requirements. Data validation ensures that the reported results correctly represent the sampling and analyses performed, determines the validity of the reported results, and
assigns data qualifiers (or “flags”), if required.
Quality Assurance Program
200 Nevada National Security Site Environmental Report 2018
14.4.3 Data Quality Assessment (DQA)
DQA is a scientific and statistical evaluation to determine if the data obtained from environmental operations are of the right type, quality, and quantity to support their intended use. The DQA includes reviewing data for accuracy, representativeness, and fit with historical measurements to ensure that the data will support their intended uses.
14.5 Assessments
The overall effectiveness of the environmental program is determined through routine surveillance and assessments of work execution as well as review of program requirements. Deficiencies are identified, causal
factors are investigated, corrective actions are developed and implemented, and follow-on monitoring is performed to ensure effective resolution. The assessments discussed below are broken down into general programmatic and focused measurement data areas.
14.5.1 Programmatic
Assessments and audits under this category include evaluations of work planning, execution, and performance activities. Personnel independent of the work activity perform the assessments to evaluate compliance with established requirements and report on deficiencies identified. Organizations responsible for the activity are required to develop and implement corrective actions, with the concurrence of the deficiency originator or
recognized subject matter expert. NNSA/NFO contractors maintain companywide issues tracking systems to manage assessments, findings, and corrective actions.
14.5.2 Measurement Data
This type of assessment includes routine evaluation of data generated from analyses of QC and other samples. QC sample data are used to monitor the analytical control on a given batch of samples and are indicators over time of potential biases in laboratory performance. Discussions of the 2018 results for field duplicates, laboratory control samples, blank analyses, matrix spikes, and proficiency testing programs are provided, and summary tables are included below.
14.5.2.1 Field Duplicates
Samples obtained at nearly the same locations and times as initial samples are termed field duplicates. These are
used to evaluate the overall precision of the measurement process, including small-scale heterogeneity in the medium (air, water, or direct radiation) being sampled as well as analytical and sample preparation variation. The absolute relative percent difference (RPD) compares the absolute difference of initial and field duplicate measurements with the average of the two measurements (Table 14-1, footnote c); it is computed only from pairs for which both values are above their respective minimum detectable concentrations (MDCs) or MDC + 2σ
uncertainty. The relative error ratio (RER) compares the absolute difference of initial and field duplicate measurements to the laboratory’s reported analytical uncertainty (Table 14-1, footnote d).
The average absolute RPD and average RER values for all 2018 radiological air and water duplicate pairs are shown in Table 14-1. They are similar to those seen in prior years. The higher average absolute RPDs (those greater than 25) are associated with two types of phenomena. RPDs for actinides in air, in particular, and consequently for gross alpha in air, can be elevated when one sampler of a pair intercepts a particle with high americium (Am) or plutonium (Pu), while the other sampler in the pair had a typical background value. Also, higher average absolute RPDs can be associated with relatively few pairs having both values above their MDCs, as low-level measurements are typically relatively “noisier” than higher-level measurements. Both scenarios may be in effect for 241Am in 2018, with only one pair with both values above their MDCs.
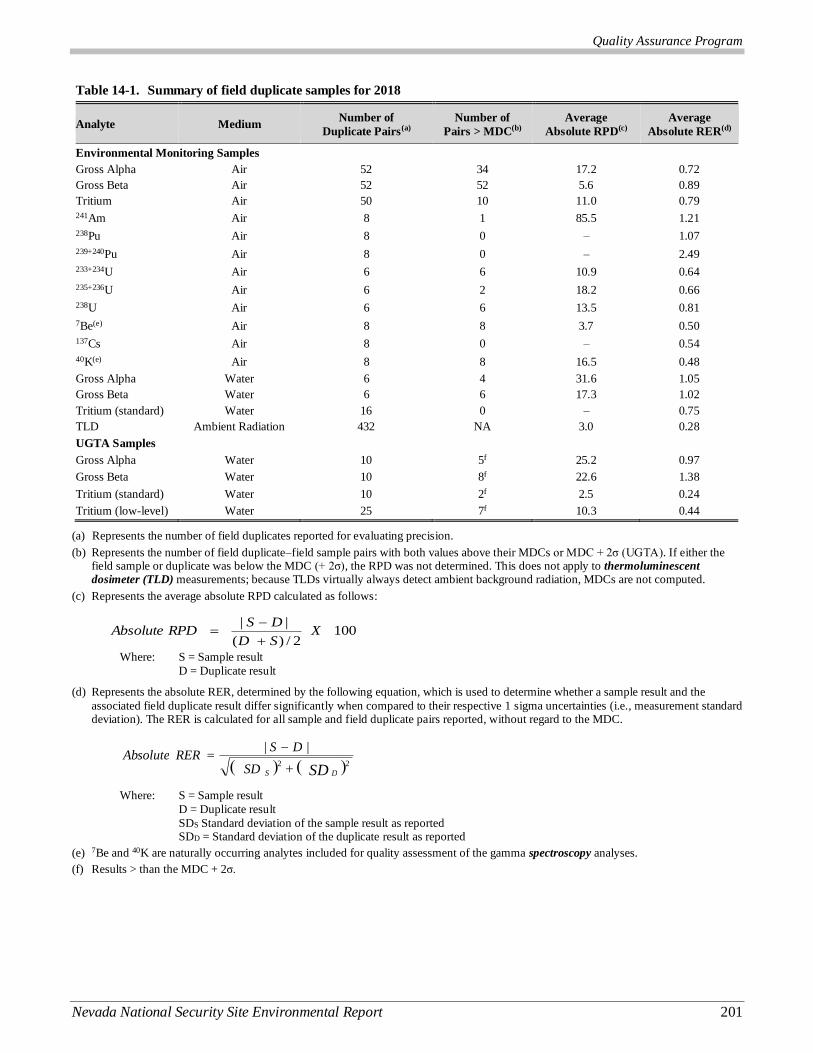
Quality Assurance Program
Nevada National Security Site Environmental Report 201
(a) Represents the number of field duplicates reported for evaluating precision.
(b) Represents the number of field duplicate–field sample pairs with both values above their MDCs or MDC + 2σ (UGTA). If either the field sample or duplicate was below the MDC (+ 2σ), the RPD was not determined. This does not apply to thermoluminescent
dosimeter (TLD) measurements; because TLDs virtually always detect ambient background radiation, MDCs are not computed.
(c) Represents the average absolute RPD calculated as follows:
Where: S = Sample result
D = Duplicate result
(d) Represents the absolute RER, determined by the following equation, which is used to determine whether a sample result and the
associated field duplicate result differ significantly when compared to their respective 1 sigma uncertainties (i.e., measurement standard deviation). The RER is calculated for all sample and field duplicate pairs reported, without regard to the MDC.
Where: S = Sample result
D = Duplicate result
SDS Standard deviation of the sample result as reported SDD = Standard deviation of the duplicate result as reported
(e) 7Be and 40K are naturally occurring analytes included for quality assessment of the gamma spectroscopy analyses.
(f) Results > than the MDC + 2σ.
Table 14-1. Summary of field duplicate samples for 2018
Analyte Medium Number of
Duplicate Pairs(a)
Number of
Pairs > MDC(b)
Average
Absolute RPD(c)
Average
Absolute RER(d)
Environmental Monitoring Samples
Gross Alpha Air 52 34 17.2 0.72
Gross Beta Air 52 52 5.6 0.89
Tritium Air 50 10 11.0 0.79 241Am Air 8 1 85.5 1.21
238Pu Air 8 0 – 1.07
239+240Pu Air 8 0 – 2.49
233+234U Air 6 6 10.9 0.64
235+236U Air 6 2 18.2 0.66
238U Air 6 6 13.5 0.81
7Be(e) Air 8 8 3.7 0.50
137Cs Air 8 0 ‒ 0.54
40K(e) Air 8 8 16.5 0.48
Gross Alpha Water 6 4 31.6 1.05
Gross Beta Water 6 6 17.3 1.02
Tritium (standard) Water 16 0 – 0.75
TLD Ambient Radiation 432 NA 3.0 0.28
UGTA Samples
Gross Alpha Water 10 5f 25.2 0.97
Gross Beta Water 10 8f 22.6 1.38
Tritium (standard) Water 10 2f 2.5 0.24
Tritium (low-level) Water 25 7f 10.3 0.44
1002/)(
||X
SD
DSRPDAbsolute
2 2 | |
D S SD SD
D S RER Absolute
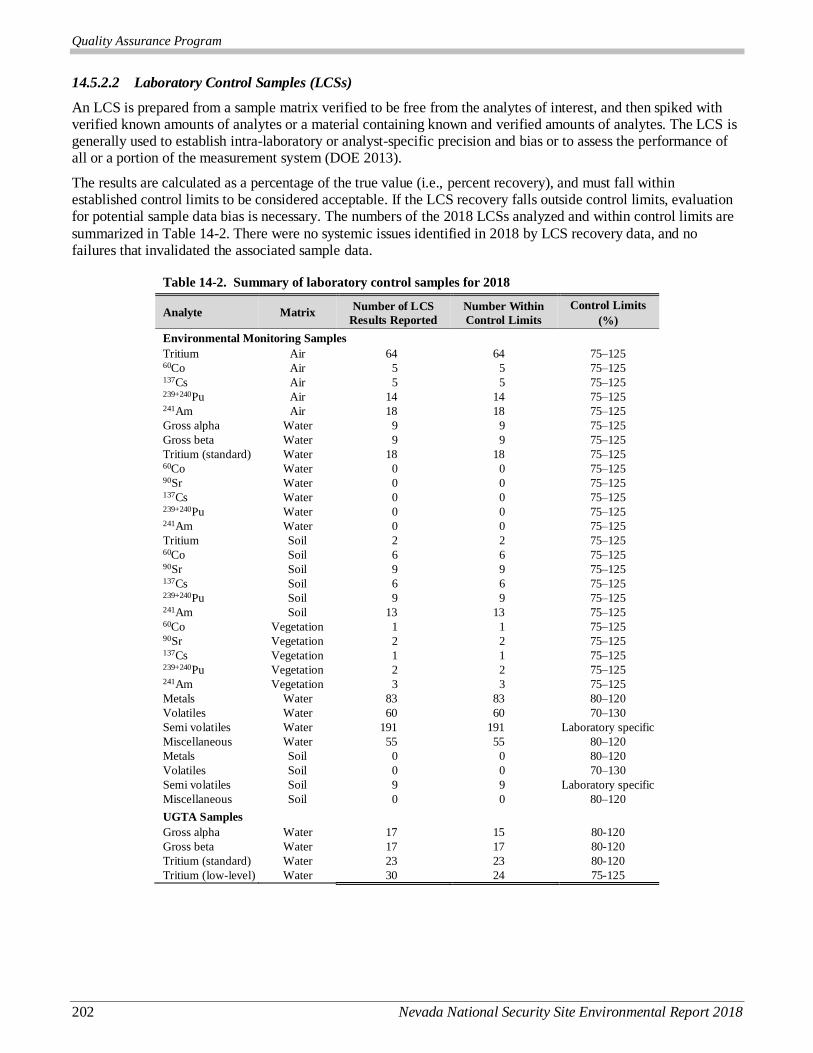
Quality Assurance Program
202 Nevada National Security Site Environmental Report 2018
14.5.2.2 Laboratory Control Samples (LCSs)
An LCS is prepared from a sample matrix verified to be free from the analytes of interest, and then spiked with verified known amounts of analytes or a material containing known and verified amounts of analytes. The LCS is generally used to establish intra-laboratory or analyst-specific precision and bias or to assess the performance of all or a portion of the measurement system (DOE 2013).
The results are calculated as a percentage of the true value (i.e., percent recovery), and must fall within established control limits to be considered acceptable. If the LCS recovery falls outside control limits, evaluation for potential sample data bias is necessary. The numbers of the 2018 LCSs analyzed and within control limits are
summarized in Table 14-2. There were no systemic issues identified in 2018 by LCS recovery data, and no failures that invalidated the associated sample data.
Table 14-2. Summary of laboratory control samples for 2018
Analyte Matrix Number of LCS
Results Reported
Number Within
Control Limits
Control Limits
(%)
Environmental Monitoring Samples
Tritium Air 64 64 75–125 60Co Air 5 5 75–125 137Cs Air 5 5 75–125 239+240Pu Air 14 14 75–125 241Am Air 18 18 75–125
Gross alpha Water 9 9 75–125
Gross beta Water 9 9 75–125
Tritium (standard) Water 18 18 75–125 60Co Water 0 0 75–125 90Sr Water 0 0 75–125 137Cs Water 0 0 75–125 239+240Pu Water 0 0 75–125 241Am Water 0 0 75–125
Tritium Soil 2 2 75–125 60Co Soil 6 6 75–125 90Sr Soil 9 9 75–125 137Cs Soil 6 6 75–125 239+240Pu Soil 9 9 75–125 241Am Soil 13 13 75–125 60Co Vegetation 1 1 75–125 90Sr Vegetation 2 2 75–125 137Cs Vegetation 1 1 75–125 239+240Pu Vegetation 2 2 75–125 241Am Vegetation 3 3 75–125
Metals Water 83 83 80–120
Volatiles Water 60 60 70–130
Semi volatiles Water 191 191 Laboratory specific
Miscellaneous Water 55 55 80–120
Metals Soil 0 0 80–120
Volatiles Soil 0 0 70–130
Semi volatiles Soil 9 9 Laboratory specific
Miscellaneous Soil 0 0 80–120
UGTA Samples
Gross alpha Water 17 15 80-120
Gross beta Water 17 17 80-120
Tritium (standard) Water 23 23 80-120
Tritium (low-level) Water 30 24 75-125

Quality Assurance Program
Nevada National Security Site Environmental Report 203
14.5.2.3 Blank Analysis
In general, a blank is a sample that has not been exposed to the targeted environment and is analyzed in order to monitor “no exposure” analyte levels and contamination that might be introduced during sampling, transport, storage, or analysis. The blank is subjected to the usual analytical and measurement process to establish a baseline or background value, and is sometimes used to adjust or correct routine analytical results (DOE 2013). Blanks are processed simultaneously with and under the same conditions as samples through all steps of the analytical
procedures. The following list identifies the blanks routinely used during environmental monitoring activities.
A trip blank is a sample of analyte-free media taken from the laboratory to the sampling site and returned to the laboratory unopened. A trip blank is used to document contamination attributable to shipping and
field handling procedures. This type of blank is useful in documenting contamination of volatile organics samples (DOE 2013).
An equipment blank is a sample of analyte-free media that has been used to rinse common sampling equipment to check effectiveness of decontamination procedures (DOE 2013).
A field blank is prepared in the field by filling a clean container with purified water (appropriate for the target analytes) and appropriate preservative, if any, for the specific sampling activity being undertaken. The field blank is used to indicate the presence of contamination due to sample collection and handling
(DOE 2013).
A method blank is a sample of a matrix similar to the associated sample batch in which no target analytes or interferences are present at concentrations that would impact the sample analyses results (DOE 2013). Method blank data are summarized in Table 14-3.
There were no systemic issues and no failures that required invalidating the associated sample data identified in 2018 by the blank data.
Table 14-3. Summary of laboratory method blank samples for 2018
Analyte Matrix
Number of Blank
Results Reported
Number of
Results < MDC
Environmental Monitoring Samples
Tritium Air 73 72 7 Be Air 5 5 60Co Air 2 2 137Cs Air 5 5 238Pu Air 8 8 239+240Pu Air 8 8 241Am Air 9 7
Gross alpha Water 9 8
Gross beta Water 9 7
Tritium (standard) Water 15 15 60Co Water 0 0 90Sr Water 0 0 137Cs Water 0 0 238Pu Water 0 0 239+240Pu Water 0 0 241Am Water 0 0
Tritium Soil 1 1 60Co Soil 4 4 90Sr Soil 5 5 137Cs Soil 6 6 238Pu Soil 6 5 239+240Pu Soil 6 6 241Am Soil 9 9 60Co Vegetation 1 1 90Sr Vegetation 1 1 137Cs Vegetation 1 1 238Pu Vegetation 1 1 239+240Pu Vegetation 1 1
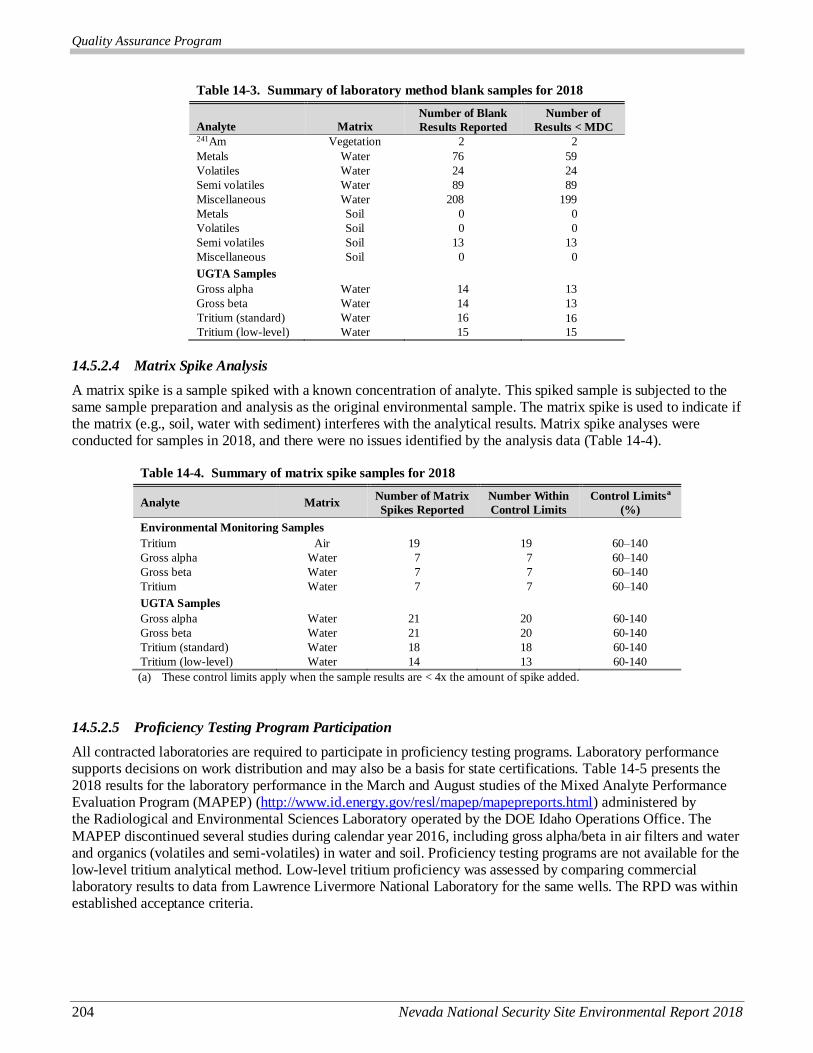
Quality Assurance Program
204 Nevada National Security Site Environmental Report 2018
Table 14-3. Summary of laboratory method blank samples for 2018
Analyte Matrix
Number of Blank
Results Reported
Number of
Results < MDC 241Am Vegetation 2 2
Metals Water 76 59
Volatiles Water 24 24
Semi volatiles Water 89 89
Miscellaneous Water 208 199
Metals Soil 0 0
Volatiles Soil 0 0
Semi volatiles Soil 13 13
Miscellaneous Soil 0 0
UGTA Samples
Gross alpha Water 14 13
Gross beta Water 14 13
Tritium (standard) Water 16 16
Tritium (low-level) Water 15 15
14.5.2.4 Matrix Spike Analysis
A matrix spike is a sample spiked with a known concentration of analyte. This spiked sample is subjected to the same sample preparation and analysis as the original environmental sample. The matrix spike is used to indicate if the matrix (e.g., soil, water with sediment) interferes with the analytical results. Matrix spike analyses were conducted for samples in 2018, and there were no issues identified by the analysis data (Table 14-4).
Table 14-4. Summary of matrix spike samples for 2018
Analyte Matrix Number of Matrix
Spikes Reported
Number Within
Control Limits
Control Limitsa
(%)
Environmental Monitoring Samples
Tritium Air 19 19 60–140
Gross alpha Water 7 7 60–140
Gross beta Water 7 7 60–140
Tritium Water 7 7 60–140
UGTA Samples
Gross alpha Water 21 20 60-140
Gross beta Water 21 20 60-140
Tritium (standard) Water 18 18 60-140
Tritium (low-level) Water 14 13 60-140
(a) These control limits apply when the sample results are < 4x the amount of spike added.
14.5.2.5 Proficiency Testing Program Participation
All contracted laboratories are required to participate in proficiency testing programs. Laboratory performance supports decisions on work distribution and may also be a basis for state certifications. Table 14-5 presents the 2018 results for the laboratory performance in the March and August studies of the Mixed Analyte Performance Evaluation Program (MAPEP) (http://www.id.energy.gov/resl/mapep/mapepreports.html) administered by the Radiological and Environmental Sciences Laboratory operated by the DOE Idaho Operations Office. The
MAPEP discontinued several studies during calendar year 2016, including gross alpha/beta in air filters and water and organics (volatiles and semi-volatiles) in water and soil. Proficiency testing programs are not available for the low-level tritium analytical method. Low-level tritium proficiency was assessed by comparing commercial laboratory results to data from Lawrence Livermore National Laboratory for the same wells. The RPD was within established acceptance criteria.
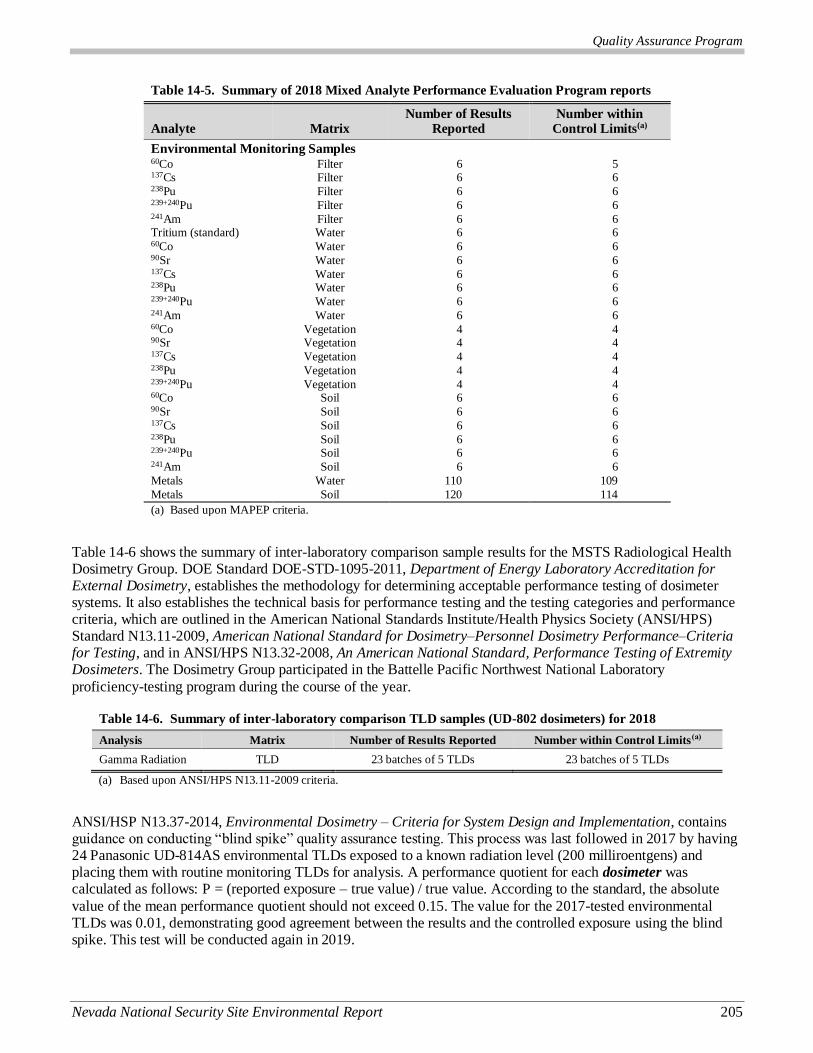
Quality Assurance Program
Nevada National Security Site Environmental Report 205
Table 14-5. Summary of 2018 Mixed Analyte Performance Evaluation Program reports
Analyte Matrix Number of Results
Reported Number within
Control Limits(a)
Environmental Monitoring Samples 60Co Filter 6 5 137Cs Filter 6 6 238Pu Filter 6 6 239+240Pu Filter 6 6 241Am Filter 6 6 Tritium (standard) Water 6 6 60Co Water 6 6 90Sr Water 6 6 137Cs Water 6 6 238Pu Water 6 6 239+240Pu Water 6 6 241Am Water 6 6 60Co Vegetation 4 4 90Sr Vegetation 4 4 137Cs Vegetation 4 4 238Pu Vegetation 4 4 239+240Pu Vegetation 4 4 60Co Soil 6 6 90Sr Soil 6 6 137Cs Soil 6 6 238Pu Soil 6 6 239+240Pu Soil 6 6 241Am Soil 6 6 Metals Water 110 109
Metals Soil 120 114
(a) Based upon MAPEP criteria.
Table 14-6 shows the summary of inter-laboratory comparison sample results for the MSTS Radiological Health Dosimetry Group. DOE Standard DOE-STD-1095-2011, Department of Energy Laboratory Accreditation for External Dosimetry, establishes the methodology for determining acceptable performance testing of dosimeter systems. It also establishes the technical basis for performance testing and the testing categories and performance criteria, which are outlined in the American National Standards Institute/Health Physics Society (ANSI/HPS) Standard N13.11-2009, American National Standard for Dosimetry–Personnel Dosimetry Performance–Criteria for Testing, and in ANSI/HPS N13.32-2008, An American National Standard, Performance Testing of Extremity Dosimeters. The Dosimetry Group participated in the Battelle Pacific Northwest National Laboratory
proficiency-testing program during the course of the year.
Table 14-6. Summary of inter-laboratory comparison TLD samples (UD-802 dosimeters) for 2018
Analysis Matrix Number of Results Reported Number within Control Limits(a)
Gamma Radiation TLD 23 batches of 5 TLDs 23 batches of 5 TLDs
(a) Based upon ANSI/HPS N13.11-2009 criteria.
ANSI/HSP N13.37-2014, Environmental Dosimetry – Criteria for System Design and Implementation, contains guidance on conducting “blind spike” quality assurance testing. This process was last followed in 2017 by having 24 Panasonic UD-814AS environmental TLDs exposed to a known radiation level (200 milliroentgens) and placing them with routine monitoring TLDs for analysis. A performance quotient for each dosimeter was calculated as follows: P = (reported exposure – true value) / true value. According to the standard, the absolute
value of the mean performance quotient should not exceed 0.15. The value for the 2017-tested environmental TLDs was 0.01, demonstrating good agreement between the results and the controlled exposure using the blind spike. This test will be conducted again in 2019.
Quality Assurance Program
206 Nevada National Security Site Environmental Report 2018
14.6 References
DOE, see U.S. Department of Energy.
Stanley, T. W., and S. S. Verner, 1985. “The U.S. Environmental Protection Agency’s Quality Assurance Program.” In: Taylor, J. K., and T. W. Stanley (eds.), Quality Assurance for Environmental Measurements, ASTM STP-867, Philadelphia, PA.
U.S. Department of Energy, 2013. Department of Energy (DOE) Consolidated Quality Systems Manual (QSM) for Environmental Laboratories, July 2013, Washington D.C.
Quality Assurance Program for the CEMP
Nevada National Security Site Environmental Report 2018 207
15.0 Ch15
Chapter 15: Quality Assurance Program for the Community
Environmental Monitoring Program
John Goreham and Craig Shadel
Desert Research Institute
The Community Environmental Monitoring Program (CEMP) Quality Assurance Management and Assessment Plan (QAMAP) (Desert Research Institute [DRI] 2009) is followed for the collection and analysis of radiological air and water data presented in Chapter 7 of this report. The CEMP QAMAP ensures compliance with U.S. Department of Energy (DOE) Order DOE O 414.1D, Quality Assurance, which implements a quality
management system, ensuring the generation and use of quality data. This QAMAP addresses the following items previously defined in Chapter 14:
Data Quality Objectives (DQOs) Sample analyses
Sampling plan development to satisfy the DQOs Data review
Environmental health and safety Continuous improvement
Sampling plan execution
15.1 Data Quality Objectives (DQOs)
The DQO process is a strategic planning approach used to plan data collection activities. It provides a systematic process for defining the criteria that a data collection design should satisfy. These criteria include when and where samples should be collected, how many samples to collect, and the tolerable level of decision errors for the study. DQOs are unique to the specific data collection or monitoring activity, and follow similar guidelines for onsite activities where applicable (Chapter 14).
15.2 Measurement Quality Objectives (MQOs)
The MQOs are basically equivalent to DQOs for analytical processes. The MQOs provide direction to the analytical laboratory concerning performance objectives or requirements for specific method performance characteristics. Default MQOs are established in the subcontract with the laboratory, but may be altered in order to satisfy changes in the DQOs. The MQOs for the CEMP project are described in terms of precision, accuracy, representativeness, completeness, and comparability requirements. These terms are defined and discussed in Section 14.1 for onsite activities.
15.3 Sampling Quality Assurance Program
Quality assurance (QA)1 in CEMP field operations includes sampling assessment, surveillance, and oversight of the following supporting elements:
The sampling plan, DQOs, and field data sheets accompanying the sample package
Database support for field and laboratory results, including systems for long-term storage and retrieval
A training program to ensure that qualified personnel are available to perform required tasks
Sample packages include the following:
Station manager checklist confirming all observable information pertinent to sample collection
An Air Surveillance Network Sample Data Form documenting air sampler parameters, collection dates and times, and total sample volumes collected
Chain-of-custody forms
1 The definition of word(s) in bold italics may be found by clicking on the word in electronic version or by referencing the Glossary,
Appendix B. To return from the Glossary, right click and select Previous View.
Quality Assurance Program for the CEMP
208 Nevada National Security Site Environmental Report 2018
This managed approach ensures that the sampling is traceable and enhances the value of the final data. The sample package also ensures that the Community Environmental Monitor (CEM) station manager (Chapter 7 describes CEMs) followed proper procedures for sample collection. The CEMP Project Manager or QA Officer
routinely performs assessments of the station managers and field monitors to ensure that standard operating procedures and sampling protocols are followed properly.
Data obtained in the course of executing field operations are entered in the documentation accompanying the
sample package during sample collection and in the CEMP database along with analytical results upon their receipt and evaluation.
Completed sample packages are kept as hard copy in file archives at DRI. Analytical reports are kept as hard copy in file archives as well as on read-only compact discs by calendar year. Analytical reports and databases are protected and maintained in accordance with the DRI’s Computer Protection Program.
15.4 Laboratory QA Oversight
The CEMP QA Officer ensures that DOE O 414.1D requirements are met with respect to laboratory services
through review of the vendor laboratory policies formalized in a Laboratory Quality Assurance Plan (LQAP) (Testamerica, Inc., 2017). The CEMP is assured of obtaining quality data from laboratory services through a multifaceted approach involving specific procurement protocols, the conduct of quality assessments, and requirements for selected laboratories to have an acceptable QA program. These elements are discussed below.
15.4.1 Procurement
Laboratory services are procured through subcontracts. The subcontract establishes the technical specifications required of the laboratory and provides the basis for determining compliance with those requirements and evaluating overall performance. The subcontract is awarded on a “best value” basis as determined by pre-award
audits. The prospective vendor is required to provide a review package to the CEMP QA Officer that includes the following:
All procedures pertinent to subcontract scope Facility design/description
Environment, Safety, and Health Plan Accreditations and certifications
LQAP Licenses
Example deliverables (hard copy and/or electronic) Pricing
Proficiency testing (PT) results from the previous year from recognized PT programs
Résumés of laboratory personnel
Audits performed by an acceptable DOE program covering comparable
scope
All procedures pertinent to subcontract scope Past performance surveys
The CEMP QA Officer evaluates the review package in terms of technical capability. Vendor selection is based solely on these capabilities and not biased by pricing.
15.4.2 Initial and Continuing Assessment
An initial assessment of a laboratory is managed through the procurement process above, including a pre-award audit. Pre-award audits are conducted by the CEMP (usually by the CEMP QA Officer). The CEMP does not initiate work with a laboratory without approval from the CEMP Program Manager.

Quality Assurance Program for the CEMP
Nevada National Security Site Environmental Report 2018 209
A continuing assessment of a selected laboratory involves ongoing monitoring of a laboratory’s performance against the contract terms and conditions, of which technical specifications are a part. The following tasks support continuing assessment:
Tracking schedule compliance Conducting regular audits
Reviewing analytical data deliverables
Monitoring for continued successful participation in approved PT programs
Monitoring the laboratory’s adherence to the LQAP
15.4.3 Laboratory QA Program
The laboratory policy and approach to implement DOE O 414.1D is verified in an LQAP prepared by the laboratory. The required elements of a CEMP LQAP are similar to those required by Mission Support and Test Services, LLC, for onsite monitoring (Section 14.3).
15.5 Data Review
Essential components of process-based QA are data checks, verification, validation, and data quality assessment to evaluate data quality and usability.
Data Checks – Data checks are conducted to ensure accuracy and consistency of field data collection operations prior to and upon data entry into CEMP databases and data management systems.
Data Verification – Data verification is defined as a subcontract compliance and completeness review to ensure that all laboratory data and sample documentation are present and complete. Sample preservation, chain-of-
custody, and other field sampling documentation is reviewed during the verification process. Data verification ensures that the reported results entered in CEMP databases correctly represent the sampling and/or analyses performed and includes evaluation of quality control (QC) sample results.
Data Validation – Data validation is the process of reviewing a body of analytical data to determine if it meets the data quality criteria defined in operating instructions. Data validation ensures that the reported results correctly represent the sampling and/or analyses performed, determines the validity of reported results, and assigns data qualifiers (or “flags”), if required. The process of data validation consists of the following:
Evaluating the quality of data to ensure all project requirements are met
Determining the impact on data quality of those requirements if they are not met
Verifying compliance with QA requirements
Checking QC values against defined limits
Applying qualifiers to analytical results in CEMP databases to define the limitations in the use of the
reviewed data
Operating instructions, procedures, applicable project-specific work plans, field sampling plans, QA plans,
analytical method references, and laboratory statements of work may all be used in the process of data validation. Documentation of data validation includes checklists, qualifier assignments, and summary forms.
Data Quality Assessment (DQA) – DQA is the scientific evaluation of data to determine if the data obtained from environmental data operations are of the right type, quality, and quantity to support their intended use. DQA review is a systematic review against pre-established criteria to verify that the data are valid for their intended use.
15.6 QA Program Assessments
The overall effectiveness of the QA Program is determined through management and independent assessments
as defined in the CEMP QAMAP. These assessments evaluate the plan execution workflow (sampling plan development and execution, chain-of-custody, sample receiving, shipping, subcontract laboratory analytical activities, and data review) as well as program requirements as they pertain to the organization.
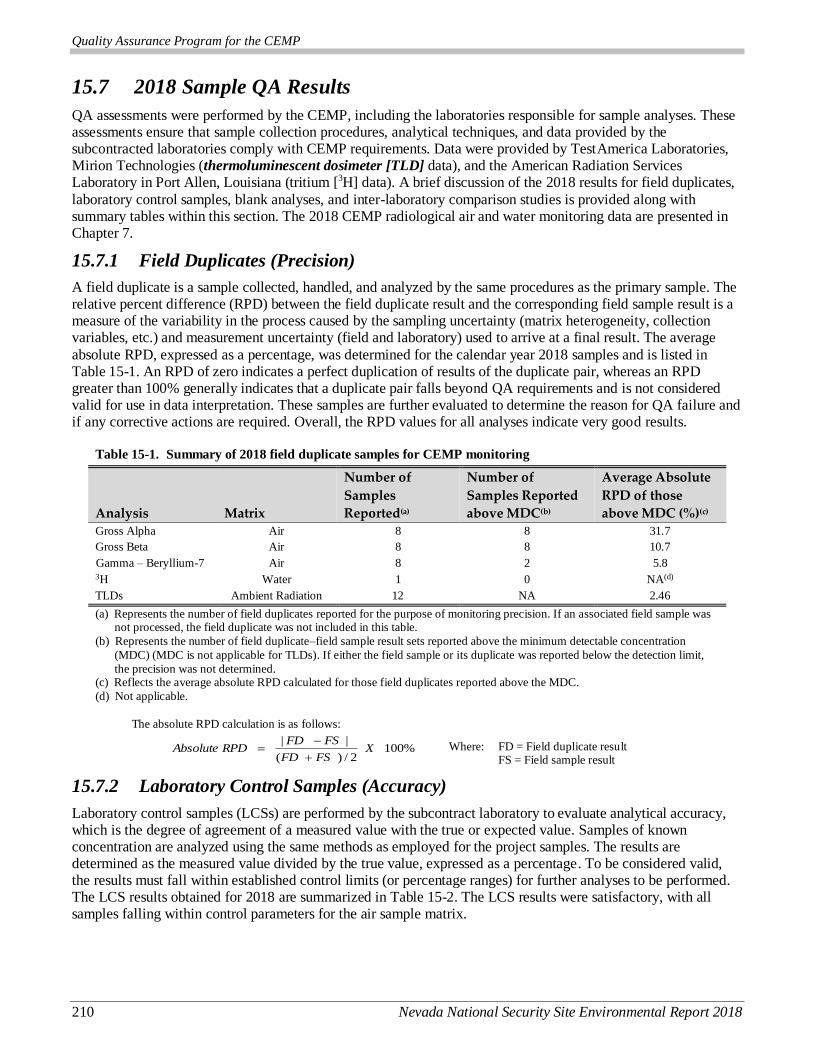
Quality Assurance Program for the CEMP
210 Nevada National Security Site Environmental Report 2018
15.7 2018 Sample QA Results
QA assessments were performed by the CEMP, including the laboratories responsible for sample analyses. These assessments ensure that sample collection procedures, analytical techniques, and data provided by the subcontracted laboratories comply with CEMP requirements. Data were provided by TestAmerica Laboratories, Mirion Technologies (thermoluminescent dosimeter [TLD] data), and the American Radiation Services Laboratory in Port Allen, Louisiana (tritium [3H] data). A brief discussion of the 2018 results for field duplicates,
laboratory control samples, blank analyses, and inter-laboratory comparison studies is provided along with summary tables within this section. The 2018 CEMP radiological air and water monitoring data are presented in Chapter 7.
15.7.1 Field Duplicates (Precision)
A field duplicate is a sample collected, handled, and analyzed by the same procedures as the primary sample. The relative percent difference (RPD) between the field duplicate result and the corresponding field sample result is a measure of the variability in the process caused by the sampling uncertainty (matrix heterogeneity, collection variables, etc.) and measurement uncertainty (field and laboratory) used to arrive at a final result. The average
absolute RPD, expressed as a percentage, was determined for the calendar year 2018 samples and is listed in Table 15-1. An RPD of zero indicates a perfect duplication of results of the duplicate pair, whereas an RPD greater than 100% generally indicates that a duplicate pair falls beyond QA requirements and is not considered valid for use in data interpretation. These samples are further evaluated to determine the reason for QA failure and if any corrective actions are required. Overall, the RPD values for all analyses indicate very good results.
Table 15-1. Summary of 2018 field duplicate samples for CEMP monitoring
Analysis Matrix
Number of
Samples
Reported(a)
Number of
Samples Reported
above MDC(b)
Average Absolute
RPD of those
above MDC (%)(c)
Gross Alpha Air 8 8 31.7
Gross Beta Air 8 8 10.7
Gamma – Beryllium-7 Air 8 2 5.8 3H Water 1 0 NA(d)
TLDs Ambient Radiation 12 NA 2.46
(a) Represents the number of field duplicates reported for the purpose of monitoring precision. If an associated field sample was not processed, the field duplicate was not included in this table.
(b) Represents the number of field duplicate–field sample result sets reported above the minimum detectable concentration
(MDC) (MDC is not applicable for TLDs). If either the field sample or its duplicate was reported below the detection limit,
the precision was not determined. (c) Reflects the average absolute RPD calculated for those field duplicates reported above the MDC.
(d) Not applicable.
The absolute RPD calculation is as follows:
Where: FD = Field duplicate result FS = Field sample result
15.7.2 Laboratory Control Samples (Accuracy)
Laboratory control samples (LCSs) are performed by the subcontract laboratory to evaluate analytical accuracy, which is the degree of agreement of a measured value with the true or expected value. Samples of known concentration are analyzed using the same methods as employed for the project samples. The results are determined as the measured value divided by the true value, expressed as a percentage. To be considered valid, the results must fall within established control limits (or percentage ranges) for further analyses to be performed. The LCS results obtained for 2018 are summarized in Table 15-2. The LCS results were satisfactory, with all samples falling within control parameters for the air sample matrix.
%1002/)(
||X
FSFD
FSFDRPDAbsolute
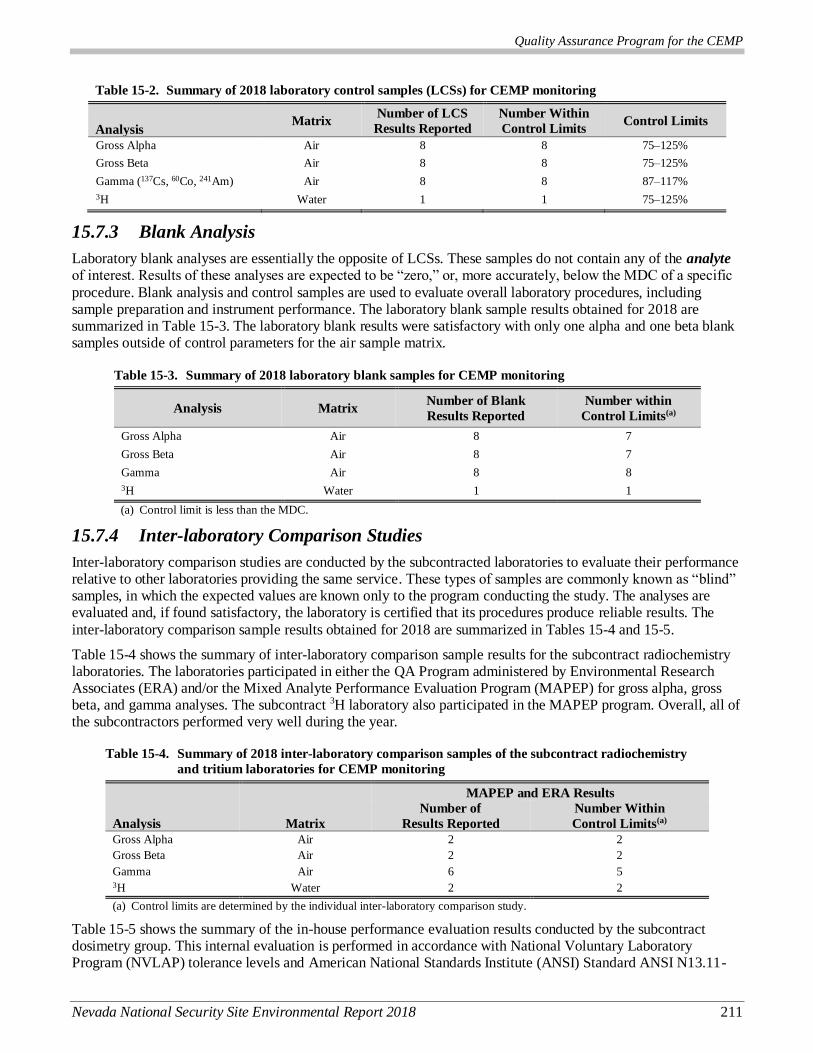
Quality Assurance Program for the CEMP
Nevada National Security Site Environmental Report 2018 211
Table 15-2. Summary of 2018 laboratory control samples (LCSs) for CEMP monitoring
Analysis Matrix
Number of LCS
Results Reported
Number Within
Control Limits Control Limits
Gross Alpha Air 8 8 75–125%
Gross Beta Air 8 8 75–125%
Gamma (137Cs, 60Co, 241Am) Air 8 8 87–117%
3H Water 1 1 75–125%
15.7.3 Blank Analysis
Laboratory blank analyses are essentially the opposite of LCSs. These samples do not contain any of the analyte of interest. Results of these analyses are expected to be “zero,” or, more accurately, below the MDC of a specific
procedure. Blank analysis and control samples are used to evaluate overall laboratory procedures, including sample preparation and instrument performance. The laboratory blank sample results obtained for 2018 are summarized in Table 15-3. The laboratory blank results were satisfactory with only one alpha and one beta blank samples outside of control parameters for the air sample matrix.
Table 15-3. Summary of 2018 laboratory blank samples for CEMP monitoring
Analysis Matrix Number of Blank
Results Reported
Number within
Control Limits(a)
Gross Alpha Air 8 7
Gross Beta Air 8 7
Gamma Air 8 8
3H Water 1 1
(a) Control limit is less than the MDC.
15.7.4 Inter-laboratory Comparison Studies
Inter-laboratory comparison studies are conducted by the subcontracted laboratories to evaluate their performance relative to other laboratories providing the same service. These types of samples are commonly known as “blind” samples, in which the expected values are known only to the program conducting the study. The analyses are evaluated and, if found satisfactory, the laboratory is certified that its procedures produce reliable results. The
inter-laboratory comparison sample results obtained for 2018 are summarized in Tables 15-4 and 15-5.
Table 15-4 shows the summary of inter-laboratory comparison sample results for the subcontract radiochemistry laboratories. The laboratories participated in either the QA Program administered by Environmental Research Associates (ERA) and/or the Mixed Analyte Performance Evaluation Program (MAPEP) for gross alpha, gross beta, and gamma analyses. The subcontract 3H laboratory also participated in the MAPEP program. Overall, all of the subcontractors performed very well during the year.
Table 15-4. Summary of 2018 inter-laboratory comparison samples of the subcontract radiochemistry
and tritium laboratories for CEMP monitoring
Analysis Matrix
MAPEP and ERA Results
Number of
Results Reported
Number Within
Control Limits(a)
Gross Alpha Air 2 2
Gross Beta Air 2 2
Gamma Air 6 5 3H Water 2 2
(a) Control limits are determined by the individual inter-laboratory comparison study.
Table 15-5 shows the summary of the in-house performance evaluation results conducted by the subcontract dosimetry group. This internal evaluation is performed in accordance with National Voluntary Laboratory Program (NVLAP) tolerance levels and American National Standards Institute (ANSI) Standard ANSI N13.11-
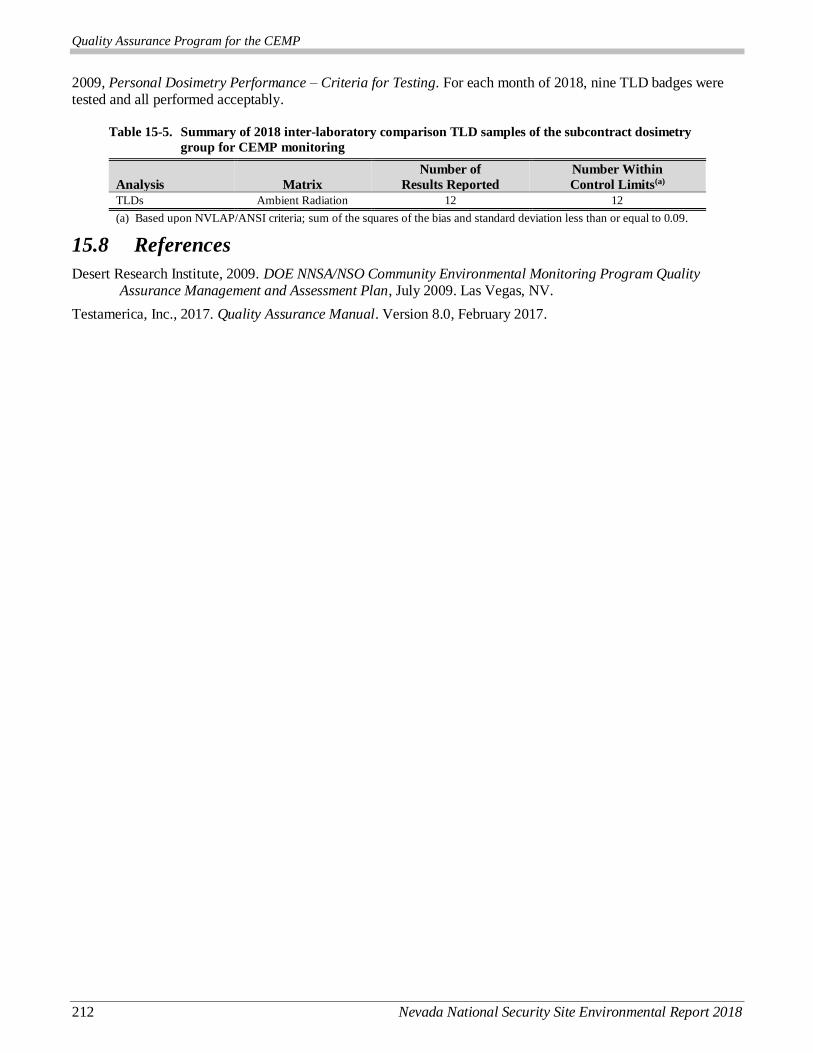
Quality Assurance Program for the CEMP
212 Nevada National Security Site Environmental Report 2018
2009, Personal Dosimetry Performance – Criteria for Testing. For each month of 2018, nine TLD badges were tested and all performed acceptably.
Table 15-5. Summary of 2018 inter-laboratory comparison TLD samples of the subcontract dosimetry
group for CEMP monitoring
Analysis Matrix
Number of
Results Reported
Number Within
Control Limits(a)
TLDs Ambient Radiation 12 12
(a) Based upon NVLAP/ANSI criteria; sum of the squares of the bias and standard deviation less than or equal to 0.09.
15.8 References
Desert Research Institute, 2009. DOE NNSA/NSO Community Environmental Monitoring Program Quality Assurance Management and Assessment Plan, July 2009. Las Vegas, NV.
Testamerica, Inc., 2017. Quality Assurance Manual. Version 8.0, February 2017.

Appendix A – Las Vegas Area Support Facilities
Nevada National Security Site Environmental Report 2018 A-i
Appendix A
Las Vegas Area Support Facilities 16.0
Appendix A – Las Vegas Area Support Facilities
A-ii Nevada National Security Site Environmental Report 2018
THIS PAGE INTENTIONALLY LEFT BLANK
Appendix A – Las Vegas Area Support Facilities
Nevada National Security Site Environmental Report 2018 A-iii
TABLE OF CONTENTS
A.1 North Las Vegas Facility ..................................................................................................................... A-1
A.1.1 Air Quality and Protection ...................................................................................................... A-1
A.1.2 Water Quality and Protection .................................................................................................. A-3 A.1.2.1 Storm Water No Exposure Waiver ISW-40565 ....................................................... A-3 A.1.2.2 National Pollutant Discharge Elimination System DeMinimus General Permit ........ A-3 A.1.2.3 Groundwater Control and Dewatering Operation ..................................................... A-5 A.1.2.4 Oil Pollution Prevention .......................................................................................... A-5
A.1.3 Radiation Protection ............................................................................................................... A-6 A.1.3.1 National Emission Standards for Hazardous Air Pollutants ...................................... A-6 A.1.3.2 U.S. Department of Energy Order 458.1 .................................................................. A-6
A.1.4 Hazardous Waste Management ............................................................................................... A-6
A.1.5 Hazardous Materials Control and Management ....................................................................... A-7
A.2 Remote Sensing Laboratory–Nellis ..................................................................................................... A-7
A.2.1 Air Quality and Protection ...................................................................................................... A-7
A.2.2 Water Quality and Protection .................................................................................................. A-8 A.2.2.1 Oil Pollution Prevention .......................................................................................... A-8
A.2.3 Underground Storage Tank Management ................................................................................ A-8
A.2.4 Hazardous Materials Control and Management ....................................................................... A-8
A.3 References .......................................................................................................................................... A-9
FIGURES
Figure A-1. Location of NNSS offsite facilities in Las Vegas and North Las Vegas....................................... A-2 Figure A-2. Location of dewatering and monitoring wells around Building A-1 ............................................ A-4
TABLES
Table A-1. Summary of air emissions for the NLVF in 2018 ....................................................................... A-1 Table A-2. NLVF NPDES permit 2018 monitoring requirements and analysis results of storage tank
water samples ............................................................................................................................ A-5 Table A-3. Results of 2018 direct radiation exposure monitoring at the NLVF ............................................. A-6 Table A-4. Summary of air emissions for RSL-Nellis in 2018 ...................................................................... A-8
Appendix A – Las Vegas Area Support Facilities
A-iv Nevada National Security Site Environmental Report 2018
THIS PAGE INTENTIONALLY LEFT BLANK

Appendix A – Las Vegas Area Support Facilities
Nevada National Security Site Environmental Report 2018 A-1
Appendix A: Las Vegas Area Support Facilities
Troy S. Belka, Delane P. Fitzpatrick-Maul, Jennifer M. Larotonda, Nikolas J. Taranik, and
Ronald W. Warren
Mission Support and Test Services, LLC
The U.S. Department of Energy, National Nuclear Security Administration Nevada Field Office (NNSA/NFO)
manages two facilities in Clark County, Nevada, that support NNSA/NFO missions on and off the Nevada National Security Site (NNSS). These are the North Las Vegas Facility (NLVF) and the Remote Sensing Laboratory–Nellis (RSL-Nellis) (Figure A-1). This appendix describes environmental monitoring and compliance activities in 2018 at these facilities.
A.1 North Las Vegas Facility
The NLVF is a fenced complex composed of 31 buildings that house much of the NNSS project management, diagnostic development and testing, design, engineering, and procurement personnel. The 32-hectare (80-acre) facility is located along Losee Road, a short distance west of Interstate 15 (Figure A-1). The facility is buffered on the north, south, and east by general industrial zoning. The western border separates the property from fully developed, single-family residential-zoned property. The NLVF is a controlled-access facility. Environmental
compliance and monitoring activities associated with this facility in 2018 included the maintenance of one air quality operating permit; one wastewater permit; one National Pollutant Discharge Elimination System (NPDES) permit; one Spill Prevention, Control, and Countermeasure (SPCC) Plan; and one hazardous materials permit (Table 2-3 lists NNSA/NFO permits). NNSA/NFO also monitors tritium (
3H)1 in air and ambient gamma
emissions to comply with federal radiation protection regulations.
A.1.1 Air Quality and Protection
Sources of air pollutants at the NLVF are regulated by the Source 657 Minor Source Permit issued by the Clark County Department of Air Quality (DAQ) for the emission of criteria pollutants. These pollutants include particulate matter (PM), nitrogen oxide (NOX), carbon monoxide (CO), sulfur dioxide (SO2), and volatile organic compounds (VOCs). Because the NLVF is considered a true minor source, there is no requirement to report hazardous air pollutants (HAPs). The regulated sources of emissions at the NLVF include diesel generators, a fire pump, cooling towers, and boilers. The DAQ requires an annual emissions inventory of criteria air pollutants;
the 2018 inventory reported the estimated quantities (Table A-1) on March 19, 2019.
Table A-1. Summary of air emissions for the NLVF in 2018
Parameter
Criteria Pollutant (tons/yr)(a)
PM10(b) PM2.5(c) NOx CO SO2 VOC
PTE(d) 1.49 0.87 20.40 4.54 0.09 0.93
Actual(e) 0.26 0.07 1.59 0.41 0.01 0.07
Total Emissions = 2.41 Actual, 28.32 PTE
(a) 1 ton equals 0.91 metric tons.
(b) Particulate matter equal to or less than 10 microns in diameter.
(c) Particulate matter equal to or less than 2.5 microns in diameter. (d) Potential to emit (PTE) is the quantity of criteria air pollutant facilities/pieces of equipment would emit annually if they were
operated for the maximum number of hours at the maximum production rate specified in the air permit.
(e) Emissions based on calculations using actual hours of operation for each piece of equipment.
Clark County air regulations specify that the opacity from any emission unit may not exceed the Clean Air Act National Ambient Air Quality Standards (NAAQS) opacity limit of 20% for more than six consecutive minutes. The NLVF air permit requires, at a minimum of each quarter, a visible emissions check be performed from each diesel-fired generator when operated for testing and maintenance. If emissions are observed, then U.S. Environmental Protection Agency (EPA) Method 9 opacity readings are recorded by a certified visible-emissions evaluator.
1 The definition of word(s) in bold italics may be found by clicking on the word in electronic version or by referencing the Glossary,
Appendix B. To return from the Glossary, right click and select Previous View.

Appendix A – Las Vegas Area Support Facilities
A-2 Nevada National Security Site Environmental Report 2018
Figure A-1. Location of NNSS offsite facilities in Las Vegas and North Las Vegas
Appendix A – Las Vegas Area Support Facilities
Nevada National Security Site Environmental Report 2018 A-3
If visible emissions appear to exceed the limit, corrective actions must be taken to minimize emissions. In 2018, two NLVF Maintenance Engineers were recertified and one new employee was certified to conduct opacity readings. In 2018, observations were taken for diesel fired generators; emissions were below the NAAQS opacity
limit of 20%.
At NLVF, a verbal notification to the City of North Las Vegas (CNLV) Fire Department is required before each fire extinguisher training session. In 2018, two hot work live fire extinguisher training sessions were conducted at
the NLVF. Quantities of criteria air pollutants produced by the open burns during training are not required to be calculated or reported.
A.1.2 Water Quality and Protection
Water used at the NLVF is supplied by the CNLV and meets or exceeds federal drinking water standards. Water quality permits issued to NNSA/NFO include a Class II Wastewater Control Permit (036555-02) from the CNLV for NLVF sewer discharges and an NPDES DeMinimus (NV201000) permit from the Nevada Division of Environmental Protection (NDEP) for dewatering operations to control rising groundwater levels at the facility. Discharges of sewage and industrial wastewater from the NLVF must meet permit limits set by the CNLV. These
limits support the permit limits for the Publicly Owned Treatment Works operated by the CNLV. The Class II Permit specifies substances prohibited from being discharged at NLVF and requires CNLV be notified of changes in discharge flow rates, spills, or other abnormal events. In 2018, no changes, spills, or abnormal events occurred.
A.1.2.1 Storm Water No Exposure Waiver ISW-40565
This waiver was approved on July 16, 2015 and it provides a conditional exemption from the NPDES Storm Water Program and the State of Nevada Stormwater General Permit. The conditions specify that storm water discharges from the NLVF will not be exposed to industrial activities or materials. In 2018, no storm water exposures to such activities or materials occurred.
A.1.2.2 National Pollutant Discharge Elimination System DeMinimus General Permit
An NPDES DeMinimus general permit covers the dewatering operation at the NLVF (Section A.1.2.3). Dewatering wells (NLVF-13s, -15, -16, -17) and the A-01 Basement Sump Well pump groundwater into a 37,854-liter (L) (10,000-gallon [gal]) storage tank (Figure A-2). The water is then discharged from the storage tank into the Las Vegas Wash via direct discharge (Outfall 002) into the CNLV storm drainage system. Chemistry analyses are performed annually on water samples collected from the storage tank. The total quantities of groundwater produced and discharged and the results of chemistry analyses are reported annually to NDEP’s Bureau of Water Pollution Control.
In 2018, the five dewatering wells at the NLVF produced a total of about 470,905 L (124,400 gal) per month that were directed into the storage tank. Annual water sampling for the presence of 23 analytes (listed in Section A.10.3.4 of the permit) was performed on November 19, 2018. All analytes were below permit limits, and
discharge rates (i.e., daily maximum flows) did not exceed the NPDES DeMinimus general permit limits (Table A-2).
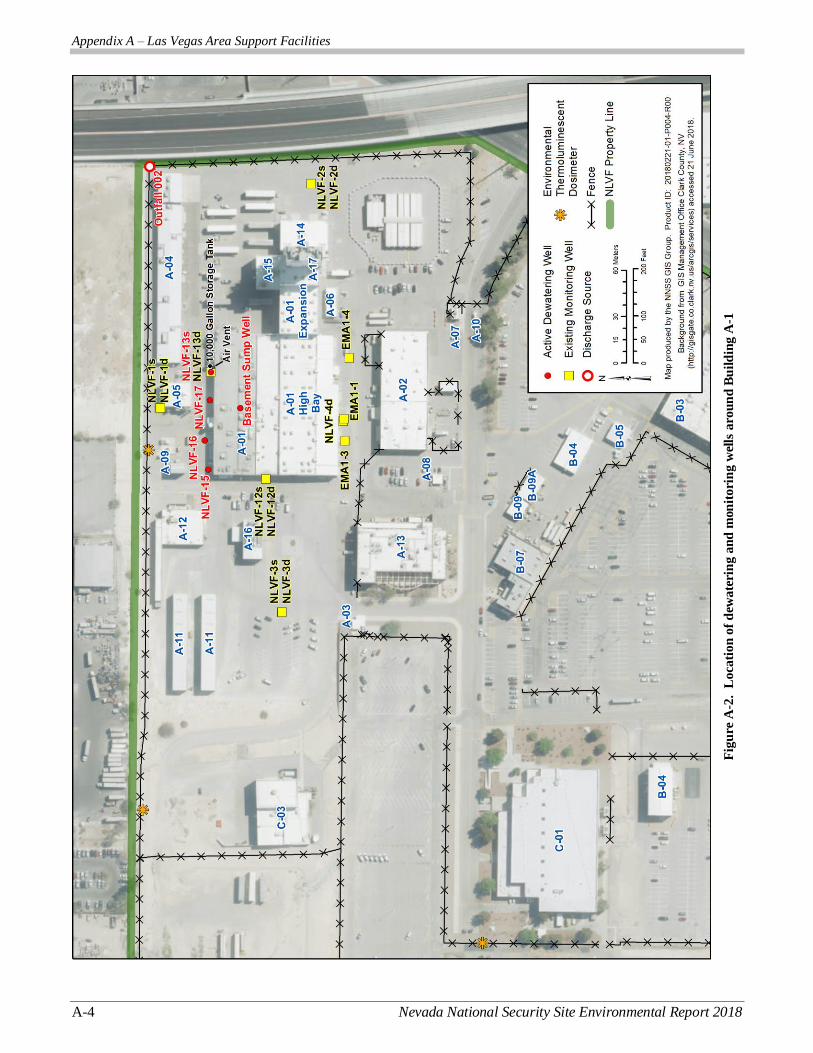
Appendix A – Las Vegas Area Support Facilities
A-4 Nevada National Security Site Environmental Report 2018
Fig
ure
A-2
. L
oca
tio
n o
f d
ewa
teri
ng
an
d m
on
ito
rin
g w
ells
aro
un
d B
uil
din
g A
-1
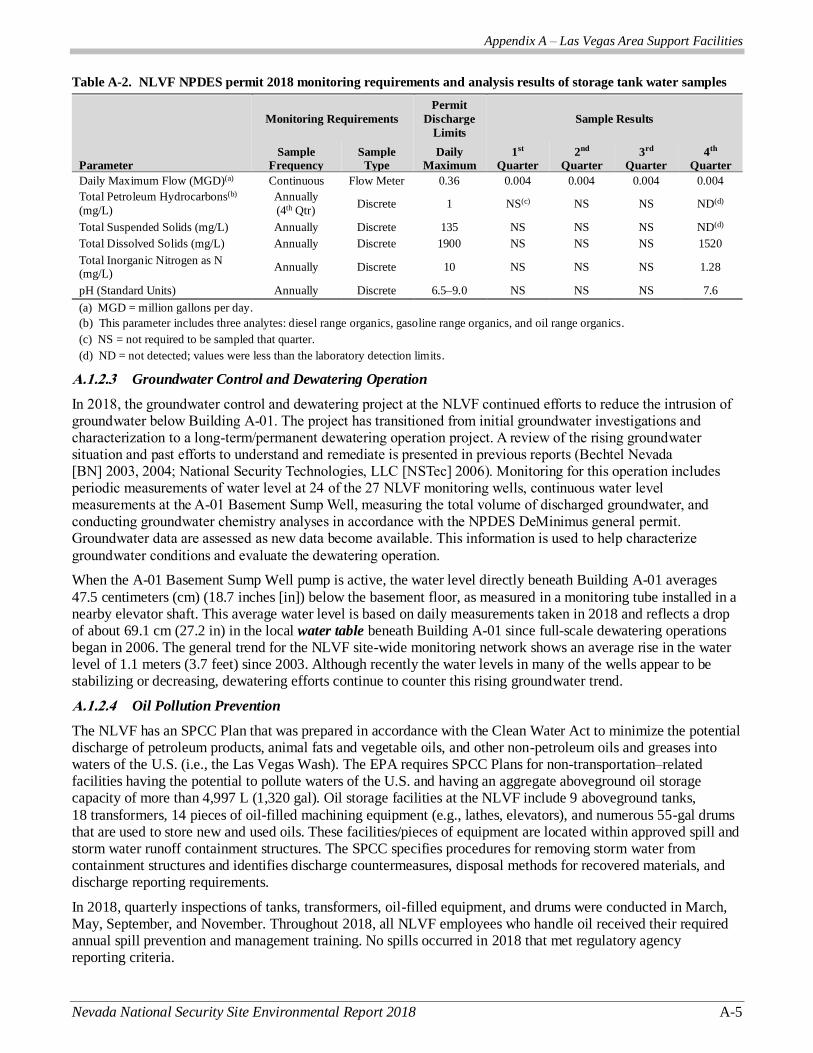
Appendix A – Las Vegas Area Support Facilities
Nevada National Security Site Environmental Report 2018 A-5
Table A-2. NLVF NPDES permit 2018 monitoring requirements and analysis results of storage tank water samples
Monitoring Requirements
Permit
Discharge
Limits
Sample Results
Parameter
Sample
Frequency
Sample
Type
Daily
Maximum
1st
Quarter
2nd
Quarter
3rd
Quarter
4th
Quarter
Daily Maximum Flow (MGD)(a) Continuous Flow Meter 0.36 0.004 0.004 0.004 0.004
Total Petroleum Hydrocarbons(b)
(mg/L)
Annually
(4th Qtr) Discrete 1 NS(c) NS NS ND(d)
Total Suspended Solids (mg/L) Annually Discrete 135 NS NS NS ND(d)
Total Dissolved Solids (mg/L) Annually Discrete 1900 NS NS NS 1520
Total Inorganic Nitrogen as N (mg/L)
Annually Discrete 10 NS NS NS 1.28
pH (Standard Units) Annually Discrete 6.5–9.0 NS NS NS 7.6
(a) MGD = million gallons per day.
(b) This parameter includes three analytes: diesel range organics, gasoline range organics, and oil range organics.
(c) NS = not required to be sampled that quarter.
(d) ND = not detected; values were less than the laboratory detection limits.
A.1.2.3 Groundwater Control and Dewatering Operation
In 2018, the groundwater control and dewatering project at the NLVF continued efforts to reduce the intrusion of groundwater below Building A-01. The project has transitioned from initial groundwater investigations and characterization to a long-term/permanent dewatering operation project. A review of the rising groundwater situation and past efforts to understand and remediate is presented in previous reports (Bechtel Nevada [BN] 2003, 2004; National Security Technologies, LLC [NSTec] 2006). Monitoring for this operation includes periodic measurements of water level at 24 of the 27 NLVF monitoring wells, continuous water level measurements at the A-01 Basement Sump Well, measuring the total volume of discharged groundwater, and conducting groundwater chemistry analyses in accordance with the NPDES DeMinimus general permit. Groundwater data are assessed as new data become available. This information is used to help characterize
groundwater conditions and evaluate the dewatering operation.
When the A-01 Basement Sump Well pump is active, the water level directly beneath Building A-01 averages
47.5 centimeters (cm) (18.7 inches [in]) below the basement floor, as measured in a monitoring tube installed in a nearby elevator shaft. This average water level is based on daily measurements taken in 2018 and reflects a drop of about 69.1 cm (27.2 in) in the local water table beneath Building A-01 since full-scale dewatering operations began in 2006. The general trend for the NLVF site-wide monitoring network shows an average rise in the water level of 1.1 meters (3.7 feet) since 2003. Although recently the water levels in many of the wells appear to be stabilizing or decreasing, dewatering efforts continue to counter this rising groundwater trend.
A.1.2.4 Oil Pollution Prevention
The NLVF has an SPCC Plan that was prepared in accordance with the Clean Water Act to minimize the potential discharge of petroleum products, animal fats and vegetable oils, and other non-petroleum oils and greases into waters of the U.S. (i.e., the Las Vegas Wash). The EPA requires SPCC Plans for non-transportation–related facilities having the potential to pollute waters of the U.S. and having an aggregate aboveground oil storage capacity of more than 4,997 L (1,320 gal). Oil storage facilities at the NLVF include 9 aboveground tanks,
18 transformers, 14 pieces of oil-filled machining equipment (e.g., lathes, elevators), and numerous 55-gal drums that are used to store new and used oils. These facilities/pieces of equipment are located within approved spill and storm water runoff containment structures. The SPCC specifies procedures for removing storm water from containment structures and identifies discharge countermeasures, disposal methods for recovered materials, and discharge reporting requirements.
In 2018, quarterly inspections of tanks, transformers, oil-filled equipment, and drums were conducted in March, May, September, and November. Throughout 2018, all NLVF employees who handle oil received their required annual spill prevention and management training. No spills occurred in 2018 that met regulatory agency reporting criteria.

Appendix A – Las Vegas Area Support Facilities
A-6 Nevada National Security Site Environmental Report 2018
A.1.3 Radiation Protection
A.1.3.1 National Emission Standards for Hazardous Air Pollutants
In compliance with the National Emission Standards for Hazardous Air Pollutants (NESHAP) of the Clean Air Act, the radionuclide air emissions from the NLVF and the resultant radiological dose to the public surrounding the facility were assessed. NESHAP establis es a dose limit for the general public to be no greater than 10 millirems per year (mrem/yr) from all radioactive air emissions. The basement of Building A-01 was contaminated with 3H in 1995 when a container of 3H foils was opened, emitting about 1 curie of 3H (U.S. Department of Energy, Nevada Operations Office 1996). Complete cleanup of the 3H was unsuccessful due to the 3H being absorbed into the building materials. This has resulted in a continuous but decreasing release of 3H into the basement air space, which is ventilated to the outdoors. Since 1995, a dose assessment has been performed
every year for this building.
In 2018, no 3H was detected above its analytical method detection limit in groundwater pumped from the sump
well in the basement of Building A-01 during dewatering operations. However, there is still an emission from 3H emanating from building materials in the building’s basement. This 3H emission was determined by taking two air samples from the basement (on April 9–16 and September 11–18, 2018) in order to compute average 3H emissions. A calculated annual total of 1.59 millicuries were released from the basement air that was vented to the outside. Based on this emission rate, the 2018 calculated radiation dose to the nearest member of the general public from the NLVF was very low: 0.000008 mrem/yr (MSTS 2019). The nearest public place is 100 meters (328 feet) northwest of Building A-01. This annual public dose is well below the regulatory limit of 10 mrem/yr
and continues to decrease at a rate of about one-half every 4.75 years (MSTS 2019).
A.1.3.2 U.S. Department of Energy Order 458.1
U.S. Department of Energy (DOE) Order 458.1, Radiation Protection of the Public and the Environment, specifies that the radiological dose to a member of the public from radiation from all pathways must not exceed 100 mrem/yr as a result of DOE activities. This dose limit does not include the dose contribution from natural
background radiation. The Atlas A-1 Source Range Laboratory and the Building C-3 High Intensity Source Building are two NLVF facilities that use radioactive sources or where radiation-producing operations are conducted that have the potential to expose the general population or non-project personnel to direct radiation. Direct radiation monitoring is conducted using thermoluminescent dosimeters (TLDs) to monitor external gamma radiation exposure near the boundaries of these facilities. The methods of TLD use and data analyses are described in Chapter 6 of this report.
In 2018, radiation exposure was measured at two locations along perimeter fences for Buildings A-01 and C-3 and at one control location along the west fence of Building C-1 (Figure A-2). Annual exposure rates estimated from
measurements at those locations are summarized in Table A-3. The radiation exposure in air measured by the TLDs is in the unit of milliroentgens per year (mR/yr), which is considered equivalent to the unit of mrem/yr for tissue.
These exposures include contributions from background radiation and are similar to the TLD measurement of
100 mR/yr for total annual exposure reported by the Desert Research Institute from their Las Vegas air monitoring station (Section 7.1.4, Table 7-3). The NLVF TLD results indicate that facility activities do not contribute a radiological dose to the surrounding public that can be distinguished from the dose due to background radiation.
Table A-3. Results of 2018 direct radiation exposure monitoring at the NLVF
Number of
Samples
Gamma Exposure (mR/yr)
Location Mean Median Minimum Maximum
West Fence of Building C-1 (Control) 4 99 97 93 108
North Fence of Building A-01 4 66 64 60 74
North Fence of Building C-3 4 66 66 60 74
A.1.4 Hazardous Waste Management
Hazardous wastes (HWs) generated at the NLVF include such items as non-empty aerosol cans, lead debris, and oily rags. HWs are stored temporarily in satellite accumulation areas until they are direct-shipped to approved disposal facilities. The NLVF is normally a Conditionally Exempt Small Quantity Generator; therefore, no HW
Appendix A – Las Vegas Area Support Facilities
Nevada National Security Site Environmental Report 2018 A-7
permit is required by the State of Nevada. However, the Southern Nevada Health District (SNHD) issues the facility an annual permit for restricted waste management. The SNHD normally conducts an annual audit to validate proper handling and storage of restricted wastes; in 2018, SNHD did not conduct the audit.
A.1.5 Hazardous Materials Control and Management
The 2018 NLVF chemical inventory was submitted to the state in the Nevada Combined Agency (NCA) Report on February 27, 2019. The inventory data were submitted in accordance with the requirements of the Hazardous Materials Permit 81804. For a description of the content, purpose, and federal regulatory driver behind the NCA Report, see Section 2.4.4.1, Emergency Planning and Community Right-to-Know Act. No accidental or unplanned release of an extremely hazardous substance (EHS) occurred at the NLVF. Also, the quantities of toxic chemicals kept at the NLVF that are used annually did not exceed the specified reporting thresholds (Chapter 2, Table 2-6) concerning Toxic Chemical Release Inventory, Form R).
A.2 Remote Sensing Laboratory–Nellis
RSL-Nellis is approximately 13.7 kilometers (km) (8.5 miles [mi]) northeast of the Las Vegas city center and approximately 11.3 km (7 mi) northeast of the NLVF. It occupies six facilities on approximately 14 secured hectares (35 acres) at the Nellis Air Force Base. A Memorandum of Agreement between the U.S. Air Force (USAF) and NNSA/NFO acknowledges the land belongs to the USAF and is leased to the NNSA/NFO, while the
RSL facilities are owned by NNSA/NFO. RSL-Nellis provides emergency response resources for weapons-of-mass-destruction incidents. The laboratory also designs and conducts field tests of counterterrorism/intelligence technologies, and has the capability to assess environmental and facility conditions using complex radiation measurements and multi-spectral imaging technologies.
Environmental compliance and monitoring activities at RSL-Nellis in 2018 included maintenance of an air quality permit, a waste management permit for underground storage tanks (USTs), and a hazardous materials permit (Table 2-2 lists NNSA/NFO permits). Sealed radiation sources are used for calibration at RSL-Nellis, but the public has no access to any area that may have elevated gamma radiation emitted by the sources. Therefore, no environmental TLD monitoring is conducted. However, dosimetry monitoring is performed to ensure worker protection.
A.2.1 Air Quality and Protection
Sources of air pollutants at RSL-Nellis are regulated by the Minor Source Permit 348 issued by the Clark County DAQ for the emission of criteria pollutants. The permit was renewed June 29, 2017 and expires June 28, 2022. Regulated sources of emissions at RSL-Nellis include an aluminum sander, an abrasive blaster, spray paint booth, generators, a fire pump, cooling towers, and boilers. The 2018 emissions inventory of criteria air pollutants was submitted to the DAQ on March 19, 2019, and is shown in Table A-4.
Clark County Air Quality Regulations specify that the opacity from any emission unit may not exceed the Clean Air Act NAAQS opacity limit of 20% for more than 6 consecutive minutes. The RSL-Nellis air permit requires a monthly visible emissions check during equipment operations. If visible emissions are observed, then EPA Method 9 opacity readings are recorded by a certified visible emissions evaluator. If visible emissions appear to exceed the limit, corrective actions are taken to minimize emissions. In 2018, one RSL-Nellis safety professional
was recertified to conduct opacity readings. Visible emissions checks were taken for the permitted emission units. Emissions for all equipment were well below the Clean Air Act NAAQS limit.
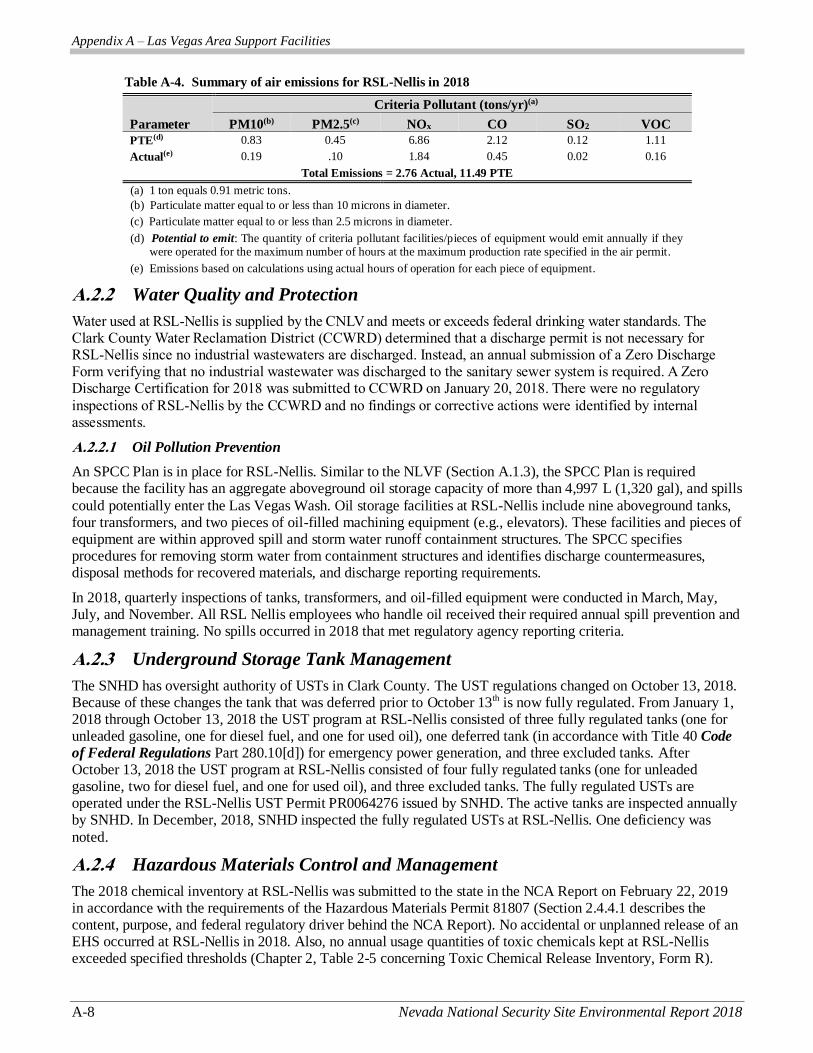
Appendix A – Las Vegas Area Support Facilities
A-8 Nevada National Security Site Environmental Report 2018
Table A-4. Summary of air emissions for RSL-Nellis in 2018
Parameter
Criteria Pollutant (tons/yr)(a)
PM10(b) PM2.5(c) NOx CO SO2 VOC PTE(d) 0.83 0.45 6.86 2.12 0.12 1.11
Actual(e) 0.19 .10 1.84 0.45 0.02 0.16
Total Emissions = 2.76 Actual, 11.49 PTE
(a) 1 ton equals 0.91 metric tons.
(b) Particulate matter equal to or less than 10 microns in diameter.
(c) Particulate matter equal to or less than 2.5 microns in diameter.
(d) Potential to emit: The quantity of criteria pollutant facilities/pieces of equipment would emit annually if they were operated for the maximum number of hours at the maximum production rate specified in the air permit.
(e) Emissions based on calculations using actual hours of operation for each piece of equipment.
A.2.2 Water Quality and Protection
Water used at RSL-Nellis is supplied by the CNLV and meets or exceeds federal drinking water standards. The Clark County Water Reclamation District (CCWRD) determined that a discharge permit is not necessary for RSL-Nellis since no industrial wastewaters are discharged. Instead, an annual submission of a Zero Discharge Form verifying that no industrial wastewater was discharged to the sanitary sewer system is required. A Zero Discharge Certification for 2018 was submitted to CCWRD on January 20, 2018. There were no regulatory
inspections of RSL-Nellis by the CCWRD and no findings or corrective actions were identified by internal assessments.
A.2.2.1 Oil Pollution Prevention
An SPCC Plan is in place for RSL-Nellis. Similar to the NLVF (Section A.1.3), the SPCC Plan is required because the facility has an aggregate aboveground oil storage capacity of more than 4,997 L (1,320 gal), and spills
could potentially enter the Las Vegas Wash. Oil storage facilities at RSL-Nellis include nine aboveground tanks, four transformers, and two pieces of oil-filled machining equipment (e.g., elevators). These facilities and pieces of equipment are within approved spill and storm water runoff containment structures. The SPCC specifies procedures for removing storm water from containment structures and identifies discharge countermeasures, disposal methods for recovered materials, and discharge reporting requirements.
In 2018, quarterly inspections of tanks, transformers, and oil-filled equipment were conducted in March, May, July, and November. All RSL Nellis employees who handle oil received their required annual spill prevention and management training. No spills occurred in 2018 that met regulatory agency reporting criteria.
A.2.3 Underground Storage Tank Management
The SNHD has oversight authority of USTs in Clark County. The UST regulations changed on October 13, 2018. Because of these changes the tank that was deferred prior to October 13th is now fully regulated. From January 1, 2018 through October 13, 2018 the UST program at RSL-Nellis consisted of three fully regulated tanks (one for unleaded gasoline, one for diesel fuel, and one for used oil), one deferred tank (in accordance with Title 40 Code
of Federal Regulations Part 280.10[d]) for emergency power generation, and three excluded tanks. After October 13, 2018 the UST program at RSL-Nellis consisted of four fully regulated tanks (one for unleaded gasoline, two for diesel fuel, and one for used oil), and three excluded tanks. The fully regulated USTs are operated under the RSL-Nellis UST Permit PR0064276 issued by SNHD. The active tanks are inspected annually by SNHD. In December, 2018, SNHD inspected the fully regulated USTs at RSL-Nellis. One deficiency was
noted.
A.2.4 Hazardous Materials Control and Management
The 2018 chemical inventory at RSL-Nellis was submitted to the state in the NCA Report on February 22, 2019 in accordance with the requirements of the Hazardous Materials Permit 81807 (Section 2.4.4.1 describes the content, purpose, and federal regulatory driver behind the NCA Report). No accidental or unplanned release of an EHS occurred at RSL-Nellis in 2018. Also, no annual usage quantities of toxic chemicals kept at RSL-Nellis exceeded specified thresholds (Chapter 2, Table 2-5 concerning Toxic Chemical Release Inventory, Form R).

Appendix A – Las Vegas Area Support Facilities
Nevada National Security Site Environmental Report 2018 A-9
A.3 References
Bechtel Nevada, 2003. Summary Report for the U.S. Department of Energy, National Nuclear Security Administration Nevada Site Office FY02/FY03 Groundwater Control Study at the North Las Vegas Facility. Las Vegas, NV.
———, 2004. Summary Report for the U.S. Department of Energy, National Nuclear Security Administration Nevada Site Office Groundwater Control at Building A-01 North Las Vegas Facility. Las Vegas, NV.
DOE, see U.S. Department of Energy.
Mission Support and Test Services, LLC, 2019. National Emission Standards for Hazardous Air Pollutants - Radionuclide Emissions Calendar Year 2017. DOE/NV/03624--0521, prepared for U.S. Department of Energy, National Nuclear Security Administration Nevada Field Office, Las Vegas, NV.
MSTS, see Mission Support and Test Services, LLC.
National Security Technologies, LLC, 2006. Groundwater Control at Building A-01, North Las Vegas Facility Enhanced Dewatering Initiative. Las Vegas, NV.
NSTec, see National Security Technologies, LLC.
U.S. Department of Energy, Nevada Operations Office, 1996. National Emission Standards for Hazardous Air Pollutants Submittal – 1995. DOE/NV/11718--032, Las Vegas, NV. OSTI ID: 436417
Appendix A – Las Vegas Area Support Facilities
A-10 Nevada National Security Site Environmental Report 2018
THIS PAGE INTENTIONALLY LEFT BLANK
Appendix B – Glossary of Terms
Nevada National Security Site Environmental Report 2018 B-1
Appendix B: Glossary of Terms
A Absorbed dose: the amount of energy absorbed by an object or person per unit mass. It reflects the amount of energy that ionizing radiation sources deposit in materials through which they pass, and is measured in units of radiation-absorbed dose (rad). The related international system unit is the gray (Gy), where 1 Gy is equivalent to 100 rad.
Actinide: any of the series of 15 metallic elements from actinium (atomic number 89) to lawrencium (atomic number 103) in the periodic table. They are all radioactive, the heavier members being extremely unstable and not of natural occurrence. The actinides mentioned in this document include uranium, plutonium, and americium.
Alpha particle: a positively charged particle emitted from the nucleus of an atom having mass and charge equal to those of a helium nucleus (two protons and two neutrons), usually emitted by transuranic elements (elements with atomic numbers greater than 92 [the atomic number of uranium], all of which are unstable and decay radioactively into other elements).
Alpha radioactivity: ionizing radiation consisting of alpha particles, emitted by some substances undergoing radioactive decay.
Analyte: the specific component measured in a chemical analysis.
Aquifer: a saturated layer of rock or soil below the ground surface that can supply usable quantities of groundwater to wells and springs and be a source of water for domestic, agricultural, and industrial uses.
Area 5 Radioactive Waste Management Complex (RWMC): the complex in Area 5 of the Nevada National Security Site at which low-level waste (LLW) and mixed low-level waste (MLLW) may be received, examined, packaged, stored, or disposed. Limited quantities of onsite-generated transuranic waste (TRU) are also stored temporarily at the RWMC. The RWMC is composed of the Area 5 Radioactive Waste Management Site (RWMS) and the Waste Examination Facility (WEF) and supporting administrative
buildings, parking areas, and utilities. The operational units of the Area 5 RWMS include active, inactive, and closed LLW and MLLW cells and a Real Time Radiography Building. The operational units of the WEF include the TRU Pad, TRU Pad Cover Building, TRU Loading Operations Area, WEF Yard, WEF Drum Holding Pad, Sprung Instant Structure, and the Visual Examination and Repackaging Building.
As low as reasonably achievable (ALARA): an approach to radiation safety that strives to manage and control doses to the work force and general public.
Atom: the smallest particle of an element capable of entering into a chemical reaction.
Atomic number: the number of protons in the nucleus of an atom, which determines the chemical properties of an element and its place in the periodic table.
B Background: as used in this report, background is the term for the amounts of chemical constituents or radioactivity in the environment that are not caused by Nevada National Security Site operations. In the broader context outside this report, background radiation refers to radiation arising from natural sources always present in the environment, including solar and cosmic radiation from outer space and naturally radioactive elements in the atmosphere, the ground, building materials, and the human body.
Becquerel (Bq): the International System of Units unit of activity of a radionuclide, equal to the activity of a radionuclide having one spontaneous nuclear transition per second.
Beta particle: a negatively charged particle emitted from the nucleus of an atom, having charge, mass, and other properties of an electron, emitted from fission products such as cesium-137.
Beta radioactivity: ionizing radiation consisting of beta particles emitted in the radioactive decay of an atomic nucleus.
Biological oxygen demand (BOD): a measure of the amount of dissolved oxygen that microorganisms need to break down organic matter in water; used as an indicator of water quality.
Appendix B – Glossary of Terms
B-2 Nevada National Security Site Environmental Report 2018
Bureau of Land Management (BLM) herd management areas (HMA): the BLM manages wild horses and burros in 177 herd management areas across 10 western states. Each HMA is unique in its terrain
features, local climate and natural resources, just as each herd is unique in its history, genetic heritage, coloring and size distribution (source: https://www.blm.gov/programs/wild-horse-and-burro/herd-management/herd-management-areas).
C Clean Air Package, 1988, (CAP88-PC): a computer model with a set of computer programs, databases and associated utility programs for estimating dose and risk from radionuclideemissions to air. CAP88 is a regulatory compliance tool under the National Emissions Standard for Hazardous Air Pollutants (NESHAP) (source: https://www.epa.gov/radiation/cap-88-pc).
Closure-in-place: the stabilization or isolation of pollutants, hazardous wastes, and solid wastes, with or without partial treatment, removal activities, and/or post-closure monitoring. Closures-in-place of legacy contamination sites on and off the Nevada National Security Site, which are managed by the U.S. Department of Energy, National Nuclear Security Administration Nevada Field Office, are attained in accordance with approved corrective action plans outlined in the 1996 Federal Facility Agreement and Consent Order (as
amended) between the U.S. Department of Energy, the U.S. Department of Defense, and the State of Nevada.
Code of Federal Regulations (CFR): a codification of all regulations promulgated by federal government agencies.
Collective population dose: the sum of the total effective dose equivalents of all individuals within a defined population. The unit of collective population dose is person-rem or person-sievert. Collective population dose may also be referred to as “collective effective dose equivalent” or simply “population dose.”
Committed dose equivalent: the dose equivalent to a tissue or organ over a 50-year period after an intake of a radionuclide into the body. Committed dose equivalent is expressed in units of rem or sievert.
Committed effective dose equivalent (CEDE): the sum of the committed dose equivalents to various tissues in the body, each multiplied by an appropriate weighting factor representing the relative vulnerability of different parts of the body to radiation. Committed effective dose equivalent is expressed in units of rem or sievert.
Community water system: as defined in Nevada Revised Statute 445A.808, a public water system that has at least 15 service connections used by year-round residents of the area served by the system; or regularly serves at least 25 year-round residents of the area served by the system.
Compliance Level (CL): the Clean Air Act National Emission Standards for Hazardous Air Pollutants Concentration Level for Environmental Compliance. The CL value represents the annual average concentration that would result in a dose of 10 millirem per year, which is the federal dose limit to the public from all radioactive air emissions.
Composite analysis (CA): an analysis of the risks posed by all wastes disposed in a low-level radioactive waste disposal facility and by all other sources of residual contamination that may interact with the disposal site. CAs, along with performance assessments (PAs), are conducted for the Area 3 and Area 5 Radioactive Waste Management Sites on the Nevada National Security Site to assess and predict their long-term performance.
Confining unit: a geologic unit of relatively low permeability that impedes the vertical movement of groundwater.
Contaminant Boundary: a type of boundary developed for an Underground Test Area (UGTA) corrective action unit (CAU). It is a forecast perimeter and a lower hydrostratigraphic unit boundary that delineates the potential extent of radionuclide-contaminated groundwater from underground testing for 1,000 years.
Contaminated groundwater is defined as water exceeding the radiological standards of the Safe Drinking Water Act (SDWA). The forecasted contamination is a volume, which is projected upward to the ground surface to define a two-dimensional contaminant boundary perimeter. Simulation modeling of the transport of radiological contaminants in groundwater is usually used to forecast the locations of the contaminant boundaries within the next 1,000 years. CAU-specific contaminant boundaries are approved by the Nevada Division of Environmental Protection.
Appendix B – Glossary of Terms
Nevada National Security Site Environmental Report 2018 B-3
Continuous release: defined by the U.S Environmental Protection Agency as a release that occurs without interruption or abatement, or that is routine, anticipated, intermittent, and incidental to normal operation or
treatment process.
Criteria pollutants: those air pollutants designated by the U.S. Environmental Protection Agency as
potentially harmful and for which National Ambient Air Quality Standards under the Clean Air Act have been established to protect the public health and welfare. These pollutants include sulfur dioxide (SO2), nitrogen oxides (NOX), carbon monoxide (CO), ozone, lead, and particulate matter equal to or less than 10 microns in
diameter (PM10). The State of Nevada, through an air quality permit, establishes emission limits on
the Nevada National Security Site for SO2, NOX, CO, PM10, and volatile organic compounds (VOCs).
Ozone is not regulated by the permit as an emission, as it is formed in part from NOX and VOCs. Lead is
considered a hazardous air pollutant (HAP) as well as a criteria pollutant, and lead emissions on the
Nevada National Security Site are reported as part of the total HAP emissions. Lead emissions above
a specified threshold are also reported under Section 313 of the Emergency Planning and
Community Right-to-Know Act.
Critical Level (LC) (also known as decision level): the counts of radioactivity (or concentration level of a radionuclide) in a sample that must be exceeded before there is a specified level of confidence (typically 95 or 99 percent) that the sample contains radioactive material above the background.
Critical receptor sampler: a type of radiological air monitoring station on the NNSS that samples air particulates and water vapor for the purpose of assessing dose to the public from airborne radionuclides originating from past or current NNSS activities and documenting if the assessed dose exceeds the DOE public dose limit of 10 millirems per year from inhalation. The U.S. Environmental Protection Agency has
approved a sampling network of six such stations on the NNSS. The critical receptor is assumed to be an individual who resides at the station location. Air sample analysis results for each station identify whether this hypothetical individual would be exposed to airborne radionuclides that would exceed the DOE public dose limit. It is assumed that if air sampling results at these six locations on the NNSS indicate doses below the public limit, then the public who reside off the NNSS at greater distances from the NNSS sources of airborne radionuclides, then the offsite public dose is even less.
Curie (Ci): a unit of measurement of radioactivity, defined as the amount of radioactive material in which the decay rate is 3.7 × 10¹⁰ (37 billion) disintegrations per second; one Ci is approximately equal to the decay rate of one gram of pure radium.
D Daughter nuclide (also known as isotope or product): a nuclide formed by the radioactive decay of another nuclide, which is called the parent.
Decision level (also known as critical level): the counts of radioactivity (or concentration level of a radionuclide) in a sample that must be exceeded before there is a specified level of confidence (typically 95 or 99 percent) that the sample contains radioactive material above the background.
Depleted uranium (DU): uranium having a lower proportion of the isotope 235U than is found in naturally occurring uranium. The masses of the three uranium isotopes with atomic weights 238, 235, and 234 occur in depleted uranium in the weight-percentages 99.8, 0.2, and 5 × 10⁻⁴, respectively.
Derived Concentration Standard (DCS): concentration of a given radionuclide in either water or air that results in a member of the public receiving 100 millirem (1 millisievert) effective dose following continuous exposure for one year via each of the following pathways: ingestion of water, submersion in air, and
inhalation. They replace the Derived Concentration Guides previously published by the U.S. Department of Energy (DOE) in 1993 in DOE Order DOE O 5400.5. Since 1993, the radiation protection framework on which DCSs are based has evolved with more sophisticated biokinetic and dosimetric information provided by the International Commission on Radiological Protection (ICRP), thus enabling consideration of age and gender. DOE-STD-1196-2011 establishes DCS values that reflect the current state of knowledge and practice in radiation protection. These DCSs are based on age-specific effective dose coefficients, revised gender specific physiological parameters for the Reference Man (ICRP 2002), and the latest information on the
energies and intensities of radiation emitted by radionuclides (ICRP 2008).
Appendix B – Glossary of Terms
B-4 Nevada National Security Site Environmental Report 2018
Designated pollutant: any pollutant regulated by the Clean Air Act’s New Source Performance Standards that is not a criteria pollutant. Examples of these are acid mist, fluorides, hydrogen sulfide in acid gas, and
total reduced sulfur.
Diel: of or relating to a 24-hour period, especially a regular daily cycle, as of the physiology or behavior of an organism.
Diffuse source: an area source from which radioactive air emissions are continuously distributed over a given area or emanate from a number of points randomly distributed over the area (generally, all sources other than
point sources). Diffuse sources are not actively ventilated or exhausted. Diffuse sources include: emissions from large areas of contaminated soil, resuspension of dust deposited on open fields, ponds and uncontrolled releases from openings in a structure.
Dose: the energy imparted to matter by ionizing radiation; the unit of absorbed dose is the rad, equal to 0.01 joules per kilogram for irradiated material in any medium.
Dose equivalent: a measure of the biological damage to living tissue as a result of radiation exposure. Also known as the “biological dose,” the dose equivalent is calculated as the product of absorbed dose in tissue multiplied by a quality factor and then sometimes multiplied by other necessary modifying factors at the location of interest. The dose equivalent is expressed numerically in rems or sieverts (Sv).
Dosimeter: a portable detection device for measuring the total accumulated exposure to ionizing radiation.
Dosimetry: the theory and application of the principles and techniques of measuring and recording radiation doses.
E Effective dose equivalent (EDE): an estimate of the total risk of potential effects from radiation exposure; it is the summation of the products of the dose equivalent and weighting factor for each tissue. The weighting factor is the decimal fraction of the risk arising from irradiation of a selected tissue to the total risk when the whole body is irradiated uniformly to the same dose equivalent. These factors permit dose equivalents from non-uniform exposure of the body to be expressed in terms of an EDE that is numerically equal to the dose from a uniform exposure of the whole body that entails the same risk as the internal exposure. The EDE includes the committed effective dose equivalent from internal deposition of radionuclides and the EDE
caused by penetrating radiation from sources external to the body, and is expressed in units of rem or sievert.
Energy Savings Performance Contract (ESPC): a type of Energy Performance Contract (EPC). EPCs are alternative financing mechanisms authorized by the U.S. Congress designed to accelerate investment in cost
effective energy conservation measures in existing federal buildings. Another type of EPC is a Utility Energy Service Contract. ESPCs allow federal agencies to accomplish energy savings projects without up-front capital costs and without special Congressional appropriations. The contract is a partnership between a federal agency and an energy service company (ESCO). The ESCO conducts a comprehensive energy audit for the federal facility and identifies improvements to save energy. In consultation with the federal agency, the ESCO designs and constructs a project that meets the agency's needs and arranges the necessary financing. The ESCO guarantees that the improvements will generate energy cost savings sufficient to pay for the project over the
term of the contract. After the contract ends, all additional cost savings accrue to the agency. The savings must be guaranteed and the federal agencies may enter into a multiyear contract for a period not to exceed 25 years.
Exposure: the absorption of ionizing radiation or ingestion of a radioisotope. Acute exposure is a large exposure received over a short period. Chronic exposure is exposure received over a long period, such as during a lifetime.
F Federal citation: a reference to a federal law identified by its Public Law (Pub. L) or United States Code (USC) abbreviation, or a reference to the implementing regulation of a federal law identified by its Code of Federal Regulations (CFR) abbreviation. CFR citations are used in this report unless none have been written, in which case, USC citations are used. If a public law has yet to be incorporated into the USC, then its public law (Pub. L) citation is used.
When a bill is signed by the President and becomes a new public law, it is assigned a law number, legal statutory citation, and prepared for publication as a slip law. Citations for public laws include the
Appendix B – Glossary of Terms
Nevada National Security Site Environmental Report 2018 B-5
abbreviation, Pub. L., the Congress number, and the number of the law. At the end of each session of Congress, the slip laws are compiled into bound volumes called the Statutes at Large, which present a
chronological arrangement of the laws in the order that they have been enacted.
Every 6 years, public laws are incorporated into the USC, which is a codification of all general and permanent
laws of the United States. They are assigned a USC number which reflects their relationship to similar laws or laws that govern similar programs. A supplement to the USC is published during each interim year until the next comprehensive volume is published. The USC is arranged by subject matter, and it shows the present status of laws with amendments already incorporated in the text that have been amended on one or more occasions.
Implementing regulations for federal laws are written by the government agencies responsible for the subject matter of the laws and explain in detail how the laws are to be carried out. For example, the United States Environmental Protection Agency writes the regulations concerning water pollution control which are found in Title 40 of the CFR, while the U. S. Fish and Wildlife Service writes the regulations concerning endangered species protection found in Title 50 of the CFR.
G Gamma radiation: high-energy, short-wavelength, ionizing, electromagnetic radiation emitted from the nucleus of an atom, frequently accompanying the emission of alpha or beta particles. It consists of photons in the highest observed range of photon energy. Gamma radiation (or gamma rays) easily pass through the human body but can be almost completely blocked by about 40 inches of concrete, 40 feet of water, or a few
inches of lead.
Gray (Gy): the International System of Units unit of measure for absorbed dose; the quantity of energy
imparted by ionizing radiation to a unit mass of matter, such as tissue. One gray equals 100 rads, or 1 joule per kilogram.
Gross alpha: the measure of radioactivity caused by all radionuclides present in a sample that emit alpha particles. Gross alpha measurements reflect alpha activity from all sources, including those that occur naturally. Gross measurements are used as a method to screen samples for relative levels of radioactivity.
Gross beta: the measure of radioactivity caused by all radionuclides present in a sample that emit beta particles. Gross beta measurements reflect beta activity from all sources, including those that occur naturally. Gross measurements are used as a method to screen samples for relative levels of radioactivity.
H Half-life: the time required for one-half of the radioactive atoms in a given amount of material to decay; for example, after one half-life, half of the atoms will have decayed; after two half-lives, three-fourths; after three half-lives, seven-eighths; and so on, exponentially.
Hazardous air pollutant (HAP): a toxic air pollutant that is known or suspected to cause cancer or other serious health effects, such as reproductive effects or birth defects, or adverse environmental effects. The U.S. Environmental Protection Agency has set emission standards for 22 of the 187 designated HAPs. Examples of toxic air pollutants include benzene, which is found in gasoline; perchloroethylene, which is emitted from some dry cleaning facilities; and methylene chloride, which is used as a solvent and paint stripper by a
number of industries. Examples of other listed HAPs include dioxin, asbestos, toluene, and metals such as cadmium, mercury, chromium, and lead compounds.
Hazardous waste (HW): hazardous wastes exhibit any of the following characteristics: ignitability, corrosivity, reactivity, or Extraction Procedure toxicity (yielding excessive levels of toxic constituents in a leaching test), but other wastes that do not necessarily exhibit these characteristics have been determined to be hazardous by the U.S. Environmental Protection Agency (EPA). Although the legal definition of hazardous waste is complex, according to the EPA, the term generally refers to any waste that, if managed improperly, could pose a threat to human health and the environment.
High-efficiency particulate air (HEPA) filter: a disposable, extended-media, dry-type filter used to capture particulates in an air stream; HEPA collection efficiencies are at least 99.97 percent for 0.3-micrometer diameter particles.
Appendix B – Glossary of Terms
B-6 Nevada National Security Site Environmental Report 2018
I Incidental take: as per the Endangered Species Act (ESA), ‘take’ means to harass, harm, pursue, hunt, shoot, wound, kill, trap, capture, or collect, or to attempt to engage in any such conduct of a listed species under the
ESA. An incidental take is a take that results from activities that are otherwise lawful.
International System of Units (SI): an international system of physical units that includes meter (length), kilogram (mass), kelvin (temperature), becquerel (radioactivity), gray (radioactive dose), and sievert (dose equivalent). The abbreviation, SI, comes from the French term Système International d’Unités.
Ion: (1) an atom that has too many or too few electrons, causing it to have an electrical charge, and therefore, be chemically active. (2) An electron that is not associated (in orbit) with a nucleus.
Ionizing radiation: a form of radiation, which includes alpha particles, beta particles, gamma rays, x-rays, neutrons, high-speed electrons, high-speed protons, and other particles capable of producing ions. Compared to non-ionizing radiation, such as radio- or microwaves, or visible, infrared, or ultraviolet light, ionizing radiation is considerably more energetic. When ionizing radiation passes through material such as air, water, or living tissue, it deposits enough energy to produce ions by breaking molecular bonds and displace (or remove) electrons from atoms or molecules. This electron displacement may lead to changes in living cells. Given this ability, ionizing radiation has a number of beneficial uses, including treating cancer or sterilizing medical equipment. However, ionizing radiation is potentially harmful if not used correctly, and high doses may result in severe skin or tissue damage.
Isotope (also known as daughter nuclide or product): each of two or more forms of the same element that contain equal numbers of protons but different numbers of neutrons in their nuclei, and hence differ in relative
atomic mass but not in chemical properties; in particular, a radioactive form of an element. For example, carbon-12 (12C), the most common form of carbon, has six protons and six neutrons, whereas carbon-14 (14C), the radioactive isotope of carbon, has six protons and eight neutrons.
L LC: see Critical Level (LC).
Low-level waste (LLW): defined by U.S. Department of Energy Manual DOE M 435.1-1, Radioactive Waste Management Manual, as radioactive waste that is not high-level radioactive waste, spent nuclear fuel, transuranic waste, byproduct material (as defined in section 11e.(2) of the Atomic Energy Act of 1954, as
amended), or naturally occurring radioactive material.
Lysimeter: an instrument for measuring the water percolating through soils and determining the dissolved materials.
M Maximally exposed individual (MEI): a hypothetical member of the public at a fixed location who, over an entire year, receives the maximum effective dose equivalent (summed over all pathways) from a given source
of radionuclide releases to air. Generally, the MEI is different for each source at a site.
Maximum contaminant level (MCL): the highest level of a contaminant in drinking water that is allowed by U.S. Environmental Protection Agency regulation.
Minimum detectable concentration (MDC): also known as the lower limit of detection, the smallest amount of radioactive material in a sample that can be quantitatively distinguished from background radiation
in the sample with 95 percent confidence.
Mixed low-level waste (MLLW): waste containing both radioactive and hazardous components. It is defined by U.S. Department of Energy Manual DOE M 435.1-1, Radioactive Waste Management Manual, as
low-level waste determined to contain both source, special nuclear, or byproduct material subject to the Atomic Energy Act of 1954, as amended, and a hazardous component subject to the Resource Conservation and Recovery Act (RCRA), as amended.
N Non-community water system: as defined in Nevada Revised Statute 445A.828, it is a public water system that is not a community water system.
Nuclide: any species of atom that exists for a measurable length of time. A nuclide can be distinguished by its atomic mass, atomic number, and energy state.
Appendix B – Glossary of Terms
Nevada National Security Site Environmental Report 2018 B-7
O Ozone Depleting Substances (ODS): substances regulated by the EPA in the U.S. as Class I or Class II controlled substances. Class I substances have a higher ozone depletion potential (0.2 or higher) and have
been completely phased out in the U.S. With a few exceptions, this means no one can produce or import Class I substances. Class I ODS include halons, chlorofluorocarbons (CFCs), methyl chloroform, carbon tetrachloride, and methyl bromide. Class II substances have an ozone depletion potential less than 0.2 and are all hydrochlorofluorocarbons (HCFCs). HCFCs were developed as transitional substitutes for many Class I substances. New production and import of most HCFCs will be phased out by 2020. The most common HCFC in use today is HCFC-22 or R-22, a refrigerant still used in existing air conditioners and refrigeration equipment.
P Performance assessment (PA): a systematic analysis of the potential risks posed by a waste disposal facility to the public and to the environment from disposed low-level radioactive waste. PAs are conducted, along with composite analyses (CAs), for the Area 3 and Area 5 Radioactive Waste Management Sites on the
Nevada National Security Site to assess and predict their long-term performance.
Piezometer: an instrument for measuring the pressure of a liquid or gas, or something related to pressure
(such as the compressibility of liquid). Piezometers are often placed in boreholes to monitor the pressure or depth of groundwater.
Plowshare Program: the program established by the United States Atomic Energy Commission (AEC), now
the Department of Energy (DOE), as a research and development activity to explore the technical and economic feasibility of using nuclear explosives for industrial applications. The reasoning was that the relatively inexpensive energy available from nuclear explosions could prove useful for a wide variety of peaceful purposes. The Plowshare Program began in 1958 and continued through 1975. Between December 1961 and May 1973, the U.S. conducted 27 Plowshare nuclear explosive tests comprising 35 individual
detonations (source: https://www.osti.gov/opennet/reports/plowshar.pdf).
Point source: a single well-defined point (origin) of an airborne release, such as a stack or vent or other functionally equivalent structure. Point sources are actively ventilated or exhausted. Point source monitoring
is monitoring emissions from a stack or vent.
Polychlorinated biphenyls (PCBs): a chemical belonging to the broad family of man-made organic
chemicals known as chlorinated hydrocarbons. PCBs were domestically manufactured from 1929 until their manufacture was banned by the U.S. Congress in 1979. They have a range of toxicity and vary in consistency from thin, light-colored liquids to yellow or black waxy solids. Due to their non-flammability, chemical stability, high boiling point, and electrical insulating properties, PCBs were used in hundreds of industrial and commercial applications including electrical, heat transfer, and hydraulic equipment; as plasticizers in paints, plastics, and rubber products; in pigments, dyes, and carbonless copy paper; and many other industrial applications. PCBs can persist in the environment and accumulate in the food chain. PCBs' are classified as persistent organic pollutants. Their production was banned by the Stockholm Convention on Persistent
Organic Pollutants in 2001. The International Research Agency on Cancer (IRAC) rendered PCBs as definite carcinogens in humans. According to the U.S. Environmental Protection Agency, PCBs cause cancer in animals and are probable human carcinogens.
Polychlorinated biphenyl (PCB) bulk waste: building material (i.e., substrate) “coated or serviced” with PCB bulk product waste (e.g., caulk, paint, mastics, sealants) at the time of disposal are managed as a PCB bulk product waste, even if the PCBs have migrated from the overlying bulk product waste into the substrate (source: https://www.epa.gov/pcbs/polychlorinated-biphenyl-pcb-guidance-reinterpretation).
Potential to emit (PTE): the quantity of a criteria air pollutant that each facility/piece of equipment would emit annually if it were operated for the maximum number of hours at the maximum production rate specified under its applicable air permit.
Private water system: a water system that is not a public water system, as defined in Nevada Revised Statute 445A.235, and is not regulated under State of Nevada permits.
Product (also known as daughter nuclide or isotope): each of two or more forms of the same element that contain equal numbers of protons but different numbers of neutrons in their nuclei, and hence differ in relative

Appendix B – Glossary of Terms
B-8 Nevada National Security Site Environmental Report 2018
atomic mass but not in chemical properties; in particular, a radioactive form of an element. For example, carbon-12 (12C), the most common form of carbon, has six protons and six neutrons, whereas carbon-14 (14C),
the radioactive isotope of carbon, has six protons and eight neutrons.
Public water system (PWS): as defined in Nevada Revised Statute 445A.235, it is a system, regardless of ownership, that provides the public with water for human consumption through pipes or other constructed conveyances, if the system has 15 or more service connections, as defined in NRS 445A.843, or regularly serves 25 or more persons. The three PWSs on the NNSS are permitted by the State of Nevada as non-community water systems.
Q Quality assurance (QA): a system of activities whose purpose is to provide the assurance that standards of quality are attained with a stated level of confidence.
Quality control (QC): procedures used to verify that prescribed standards of performance are attained.
Quality factor: the factor by which the absorbed dose (rad) is multiplied to obtain a quantity that expresses
(on a common scale for all ionizing radiation) the biological damage to exposed persons, usually used because some types of radiation, such as alpha particles, are biologically more damaging than others. Quality factors for alpha, beta, and gamma radiation are in the ratio 20:1:1.
R Rad: one of the two units used to measure the amount of radiation absorbed by an object or person, known as the “absorbed dose,” which reflects the amount of energy that radioactive sources deposit in materials through which they pass. The radiation-absorbed dose (rad) is the amount of energy (from any type of ionizing radiation) deposited in any medium (e.g., water, tissue, air). An absorbed dose of 1 rad means that 1 gram of material absorbed 100 ergs of energy (a small but measurable amount) as a result of exposure to radiation. The related international system unit is the gray (Gy), where 1 Gy is equivalent to 100 rad.
Radioactive decay: the spontaneous transformation of one radionuclide into a different nuclide (which may or may not be radioactive), or de-excitation to a lower energy state of the nucleus by emission of nuclear radiation, primarily alpha or beta particles, or gamma rays (photons).
Radioactivity: the spontaneous emission of nuclear radiation, generally alpha or beta particles, or gamma rays, from the nucleus of an unstable isotope.
Radioisotope: same as radionuclide.
Radionuclide: may also be called a radioactive nuclide, radioisotope, or radioactive isotope. It is an atom that has excess nuclear energy, making it unstable. This excess energy can either create and emit from the nucleus new radiation (gamma radiation) or a new particle (alpha particle or beta particle), or transfer this excess energy to one of its electrons, causing it to be ejected (conversion electron). During this process, the
radionuclide is said to undergo radioactive decay.
Radon progeny: When radon in air decays, it forms a number of short-lived radioactive decay products (radon progeny), which include polonium-218, lead-214, bismuth-214 and polonium-214. All are radioactive
isotopes of heavy metal elements and all have half-lives that are much less than that of radon.
Regulatory Boundary: a type of boundary developed for an Underground Test Area (UGTA) corrective action unit (CAU). It is established by negotiation between the U.S. Department of Energy, National Nuclear Security Administration Nevada Field Office (NNSA/NFO) and the Nevada Division of Environmental Protection (NDEP) during the CAU closure process based upon negotiated CAU-specific objectives to provide protection for the public and the environment from the effects of migration of radioactive contaminants. If radionuclides above the agreed-upon levels reach this boundary, NNSA/NFO is required to submit a plan for NDEP approval that will identify how the CAU-specific regulatory boundary objectives will be met.
Rem: one of the two standard units used to measure the dose equivalent (or effective dose), which combines the amount of energy (from any type of ionizing radiation that is deposited in human tissue), along with the medical effects of the given type of radiation. For beta and gamma radiation, the dose equivalent is the same
as the absorbed dose. By contrast, the dose equivalent is larger than the absorbed dose for alpha and neutron radiation, because these types of radiation are more damaging to the human body. Thus, the dose equivalent

Appendix B – Glossary of Terms
Nevada National Security Site Environmental Report 2018 B-9
(in rems) is equal to the absorbed dose (in rads) multiplied by the quality factor of the type of radiation [see Title 10, Section 20.1004, of the Code of Federal Regulations (10 CFR 20.1004), “Units of Radiation Dose”].
The related international system unit is the sievert (Sv), where 100 rem is equivalent to 1 Sv.
Roentgen (R): a unit of measurement used to express radiation exposure in terms of the amount of ionization produced in a volume of air. It is the amount of gamma or x-rays required to produce ions resulting in a charge of 0.000258 coulombs/kilogram of air under standard conditions. Named after Wilhelm Roentgen, the German scientist who discovered x-rays in 1895.
S Solid waste: most simply, waste generated by routine operations that is not regulated as hazardous or radioactive by state or federal agencies.
Saturated zone: a zone below the earth’s surface below which all pore spaces between rocks or soil are completely filled with water.
Section 106: Section 106 of the National Historic Preservation Act requires federal agencies to take into account the effects of their undertakings on historic properties and afford the Council a reasonable opportunity to comment on such undertakings (source: https://www.achp.gov/protecting-historic-properties).
Sievert (Sv): the International System of Units unit of radiation dose equivalent and effective dose equivalent, that is the product of the absorbed dose (gray), quality factor, distribution factor, and other necessary modifying factors; 1 Sv equals 100 rem.
Source term: the amount of a specific pollutant emitted or discharged to a particular medium, such as the air or water, from a particular source.
Spectroscopy: the study of the interaction between matter and electromagnetic radiation.
Subcritical experiment: an experiment using high explosives and nuclear weapon materials (including special nuclear materials like plutonium) to gain data used to maintain the nuclear stockpile without conducting nuclear explosions banned by the Comprehensive Nuclear Test Ban Treaty.
Subsidence crater: a hole or depression left on the surface of an area which has had an underground (usually nuclear) explosion.
T Thermoluminescent dosimeter (TLD): a device used to measure external beta or gamma radiation levels, and which contains a material that, after exposure to beta or gamma radiation, emits light when processed and heated.
Total effective dose equivalent (TEDE): The sum of the external exposures and the committed effective dose equivalent (CEDE) for internal exposures.
Transuranic (TRU) waste: material contaminated with alpha-emitting transuranium nuclides, which have an atomic number greater than 92 (e.g., 239Pu), half-lives longer than 20 years, and are present in concentrations greater than 100 nanocuries per gram of waste. Mixed TRU waste contains hazardous waste also.
Tritium (3H): a radioactive form of hydrogen that is produced naturally in the upper atmosphere when
cosmic rays strike nitrogen molecules in the air. Although tritium can be a gas, its most common form is in water, because, like non-radioactive hydrogen, tritium reacts with oxygen to form water. Tritium replaces one of the stable hydrogens in the water molecule, H2O, and is called tritiated water (HTO). Like H2O, tritiated water is colorless and odorless. Naturally-occurring tritium is found in very small or trace amounts in the environment as HTO, which easily disperses in the atmosphere, water bodies, soil, and rock. Tritium is also
produced during nuclear weapons explosions, as a by-product in nuclear reactors producing electricity, and in special production reactors, where the isotope lithium-6 is bombarded to produce tritium. In the mid-1950s and early 1960s, tritium was widely dispersed during the above-ground testing of nuclear weapons. The quantity of tritium in the atmosphere from weapons testing peaked in 1963 and has been decreasing ever since. Tritium is a contaminant of groundwater in select areas of the NNSS as a result of historical underground nuclear testing and is the contaminant of concern being monitored in NNSS groundwater samples. Tritium decays at a half-life of 12.3 years by emitting a low-energy beta particle. In 1976, EPA established a dose-based drinking water standard of 4 mrem per year and set a maximum contaminant level

Appendix B – Glossary of Terms
B-10 Nevada National Security Site Environmental Report 2018
for drinking water of 20,000 picocuries per liter (pCi/L) for tritium, the level assumed to yield a dose of 4 mrem per year. One year of drinking water with this amount of contamination would produce approximately
the same dose of radiation you would get during a single commercial flight between Los Angeles and New York City.
U Uncertainty: the parameter associated with a sample measurement that characterizes the range of the measurement that could reasonably be attributed to the sample. Used in this report, the uncertainty value is established at ± 2 standard deviations.
United States Code (USC): a codification of all general and permanent laws of the United States. Laws in the USC are grouped into various Titles, Chapters, and Sections by topic. For example, the citation 16 USC 1531-1544 is for Title 16 (Conservation), Sections 1531-1544 (in Chapter 35) which comprise the law called the Endangered Species Act.
Unsaturated zone: that portion of the subsurface in which the pores are only partially filled with water and the direction of water flow is vertical; also referred to as the vadose zone.
Use-Restriction (UR) Boundary: a type of boundary developed for an Underground Test Area (UGTA) corrective action unit (CAU). It delineates an area expected to require institutional controls to restrict access to potentially contaminated groundwater. A UR boundary is established by negotiation between the U.S. Department of Energy, National Nuclear Security Administration Nevada Field Office (NNSA/NFO)
and the Nevada Division of Environmental Protection. It is based primarily on contaminant boundary (see Glossary definition) forecasts. A UR boundary is established to protect site workers from inadvertently contacting, or site activities from affecting, the flow paths of contaminated groundwater. NNSA/NFO, and any future land manager, must maintain all official CAU-specific UR boundary records.
V Vadose zone: the partially saturated or unsaturated region above the water table that does not yield water to wells; also referred to as the unsaturated zone.
W Water table: the underground boundary between saturated and unsaturated soils or rock. It is the point beneath the surface of the ground at which natural groundwater is found. It is the upper surface of a saturation zone where the body of groundwater (i.e., aquifer) is not confined by an overlying impermeable formation. In the situation where an aquifer does have an overlying confining formation, the aquifer has no water table.
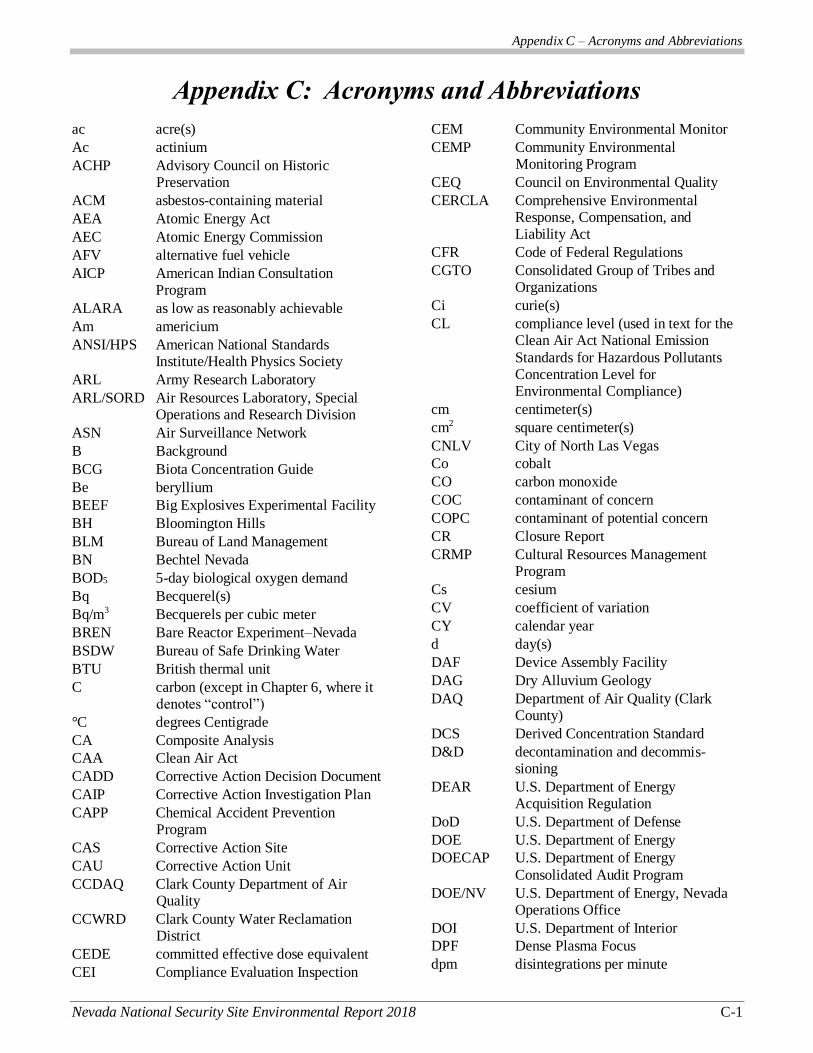
Appendix C – Acronyms and Abbreviations
Nevada National Security Site Environmental Report 2018 C-1
Appendix C: Acronyms and Abbreviations
ac acre(s)
Ac actinium
ACHP Advisory Council on Historic Preservation
ACM asbestos-containing material
AEA Atomic Energy Act
AEC Atomic Energy Commission
AFV alternative fuel vehicle
AICP American Indian Consultation Program
ALARA as low as reasonably achievable
Am americium
ANSI/HPS American National Standards Institute/Health Physics Society
ARL Army Research Laboratory
ARL/SORD Air Resources Laboratory, Special Operations and Research Division
ASN Air Surveillance Network
B Background
BCG Biota Concentration Guide
Be beryllium
BEEF Big Explosives Experimental Facility
BH Bloomington Hills
BLM Bureau of Land Management
BN Bechtel Nevada
BOD5 5-day biological oxygen demand
Bq Becquerel(s)
Bq/m3 Becquerels per cubic meter
BREN Bare Reactor Experiment–Nevada
BSDW Bureau of Safe Drinking Water
BTU British thermal unit
C carbon (except in Chapter 6, where it denotes “control”)
°C degrees Centigrade
CA Composite Analysis
CAA Clean Air Act
CADD Corrective Action Decision Document
CAIP Corrective Action Investigation Plan
CAPP Chemical Accident Prevention Program
CAS Corrective Action Site
CAU Corrective Action Unit
CCDAQ Clark County Department of Air Quality
CCWRD Clark County Water Reclamation District
CEDE committed effective dose equivalent
CEI Compliance Evaluation Inspection
CEM Community Environmental Monitor
CEMP Community Environmental Monitoring Program
CEQ Council on Environmental Quality
CERCLA Comprehensive Environmental Response, Compensation, and Liability Act
CFR Code of Federal Regulations
CGTO Consolidated Group of Tribes and Organizations
Ci curie(s)
CL compliance level (used in text for the Clean Air Act National Emission
Standards for Hazardous Pollutants Concentration Level for Environmental Compliance)
cm centimeter(s)
cm2 square centimeter(s)
CNLV City of North Las Vegas
Co cobalt
CO carbon monoxide
COC contaminant of concern
COPC contaminant of potential concern
CR Closure Report
CRMP Cultural Resources Management Program
Cs cesium
CV coefficient of variation
CY calendar year
d day(s)
DAF Device Assembly Facility
DAG Dry Alluvium Geology
DAQ Department of Air Quality (Clark County)
DCS Derived Concentration Standard
D&D decontamination and decommis-sioning
DEAR U.S. Department of Energy Acquisition Regulation
DoD U.S. Department of Defense
DOE U.S. Department of Energy
DOECAP U.S. Department of Energy
Consolidated Audit Program
DOE/NV U.S. Department of Energy, Nevada Operations Office
DOI U.S. Department of Interior
DPF Dense Plasma Focus
dpm disintegrations per minute
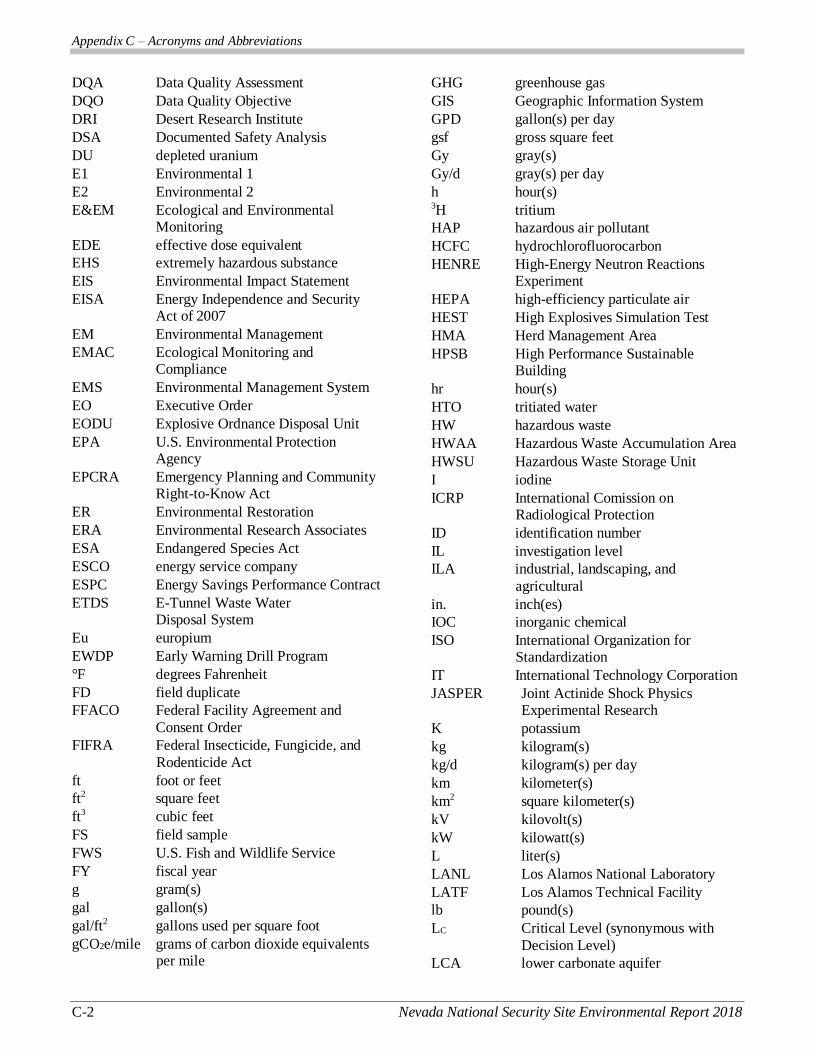
Appendix C – Acronyms and Abbreviations
C-2 Nevada National Security Site Environmental Report 2018
DQA Data Quality Assessment
DQO Data Quality Objective
DRI Desert Research Institute
DSA Documented Safety Analysis
DU depleted uranium
E1 Environmental 1
E2 Environmental 2
E&EM Ecological and Environmental Monitoring
EDE effective dose equivalent
EHS extremely hazardous substance
EIS Environmental Impact Statement
EISA Energy Independence and Security Act of 2007
EM Environmental Management
EMAC Ecological Monitoring and Compliance
EMS Environmental Management System
EO Executive Order
EODU Explosive Ordnance Disposal Unit
EPA U.S. Environmental Protection Agency
EPCRA Emergency Planning and Community Right-to-Know Act
ER Environmental Restoration
ERA Environmental Research Associates
ESA Endangered Species Act
ESCO energy service company
ESPC Energy Savings Performance Contract
ETDS E-Tunnel Waste Water Disposal System
Eu europium
EWDP Early Warning Drill Program
°F degrees Fahrenheit
FD field duplicate
FFACO Federal Facility Agreement and
Consent Order
FIFRA Federal Insecticide, Fungicide, and
Rodenticide Act
ft foot or feet
ft2 square feet
ft3 cubic feet
FS field sample
FWS U.S. Fish and Wildlife Service
FY fiscal year
g gram(s)
gal gallon(s)
gal/ft2 gallons used per square foot
gCO2e/mile grams of carbon dioxide equivalents per mile
GHG greenhouse gas
GIS Geographic Information System
GPD gallon(s) per day
gsf gross square feet
Gy gray(s)
Gy/d gray(s) per day
h hour(s) 3H tritium
HAP hazardous air pollutant
HCFC hydrochlorofluorocarbon
HENRE High-Energy Neutron Reactions Experiment
HEPA high-efficiency particulate air
HEST High Explosives Simulation Test
HMA Herd Management Area
HPSB High Performance Sustainable Building
hr hour(s)
HTO tritiated water
HW hazardous waste
HWAA Hazardous Waste Accumulation Area
HWSU Hazardous Waste Storage Unit
I iodine
ICRP International Comission on Radiological Protection
ID identification number
IL investigation level
ILA industrial, landscaping, and
agricultural
in. inch(es)
IOC inorganic chemical
ISO International Organization for Standardization
IT International Technology Corporation
JASPER Joint Actinide Shock Physics Experimental Research
K potassium
kg kilogram(s)
kg/d kilogram(s) per day
km kilometer(s)
km2 square kilometer(s)
kV kilovolt(s)
kW kilowatt(s)
L liter(s)
LANL Los Alamos National Laboratory
LATF Los Alamos Technical Facility
lb pound(s)
LC Critical Level (synonymous with
Decision Level)
LCA lower carbonate aquifer
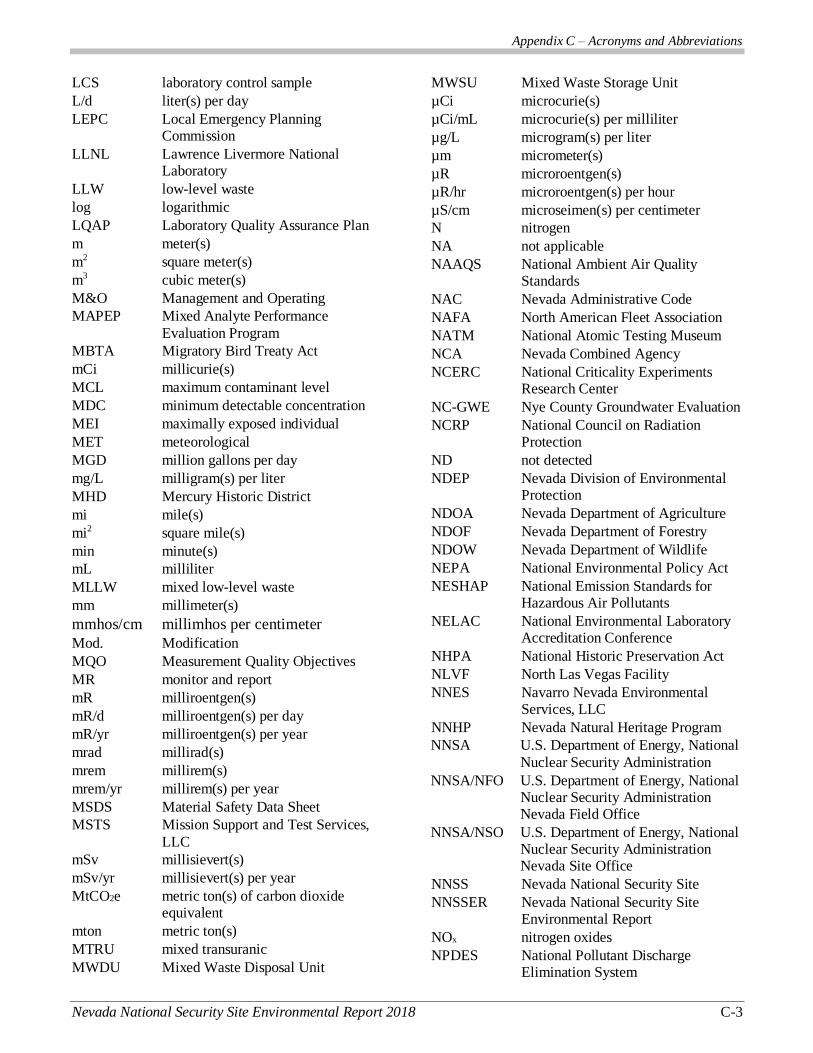
Appendix C – Acronyms and Abbreviations
Nevada National Security Site Environmental Report 2018 C-3
LCS laboratory control sample
L/d liter(s) per day
LEPC Local Emergency Planning Commission
LLNL Lawrence Livermore National Laboratory
LLW low-level waste
log logarithmic
LQAP Laboratory Quality Assurance Plan
m meter(s)
m2 square meter(s)
m3 cubic meter(s)
M&O Management and Operating
MAPEP Mixed Analyte Performance
Evaluation Program
MBTA Migratory Bird Treaty Act
mCi millicurie(s)
MCL maximum contaminant level
MDC minimum detectable concentration
MEI maximally exposed individual
MET meteorological
MGD million gallons per day
mg/L milligram(s) per liter
MHD Mercury Historic District
mi mile(s)
mi2 square mile(s)
min minute(s)
mL milliliter
MLLW mixed low-level waste
mm millimeter(s)
mmhos/cm millimhos per centimeter
Mod. Modification
MQO Measurement Quality Objectives
MR monitor and report
mR milliroentgen(s)
mR/d milliroentgen(s) per day
mR/yr milliroentgen(s) per year
mrad millirad(s)
mrem millirem(s)
mrem/yr millirem(s) per year
MSDS Material Safety Data Sheet
MSTS Mission Support and Test Services,
LLC
mSv millisievert(s)
mSv/yr millisievert(s) per year
MtCO2e metric ton(s) of carbon dioxide equivalent
mton metric ton(s)
MTRU mixed transuranic
MWDU Mixed Waste Disposal Unit
MWSU Mixed Waste Storage Unit
µCi microcurie(s)
µCi/mL microcurie(s) per milliliter
µg/L microgram(s) per liter
µm micrometer(s)
µR microroentgen(s)
µR/hr microroentgen(s) per hour
µS/cm microseimen(s) per centimeter
N nitrogen
NA not applicable
NAAQS National Ambient Air Quality Standards
NAC Nevada Administrative Code
NAFA North American Fleet Association
NATM National Atomic Testing Museum
NCA Nevada Combined Agency
NCERC National Criticality Experiments Research Center
NC-GWE Nye County Groundwater Evaluation
NCRP National Council on Radiation Protection
ND not detected
NDEP Nevada Division of Environmental Protection
NDOA Nevada Department of Agriculture
NDOF Nevada Department of Forestry
NDOW Nevada Department of Wildlife
NEPA National Environmental Policy Act
NESHAP National Emission Standards for Hazardous Air Pollutants
NELAC National Environmental Laboratory Accreditation Conference
NHPA National Historic Preservation Act
NLVF North Las Vegas Facility
NNES Navarro Nevada Environmental Services, LLC
NNHP Nevada Natural Heritage Program
NNSA U.S. Department of Energy, National
Nuclear Security Administration
NNSA/NFO U.S. Department of Energy, National Nuclear Security Administration Nevada Field Office
NNSA/NSO U.S. Department of Energy, National Nuclear Security Administration Nevada Site Office
NNSS Nevada National Security Site
NNSSER Nevada National Security Site Environmental Report
NOx nitrogen oxides
NPDES National Pollutant Discharge Elimination System
Appendix C – Acronyms and Abbreviations
C-4 Nevada National Security Site Environmental Report 2018
NPTEC Nonproliferation Test and Evaluation Complex
NRC Non-Radiological Classified
NRCH Non-Radiological Classified Hazardous
NRHP National Register of Historic Places
NRS Nevada Revised Statutes
NS not required to be sampled
NSHPO Nevada State Historic Preservation Office
NSPS New Source Performance Standards
NSSAB Nevada Site Specific Advisory Board
NSTec National Security Technologies, LLC
NTS Nevada Test Site
NTTR Nevada Test and Training Range
NV Nevada
NVLAP National Voluntary Laboratory
Accreditation Program
ODS ozone-depleting substance
OSHA Occupational Safety and Health
Administration
OSTI Office of Scientific and Technical
Information
oz ounce(s)
P2/WM pollution prevention/waste
minimization
PA Performance Assessment
Pb lead
PCB polychlorinated biphenyl
pCi picocurie(s)
pCi/g picocurie(s) per gram
pCi/L picocurie(s) per liter
pCi/mL picocurie(s) per milliliter
PI prediction interval
PIC pressurized ion chamber
PM particulate matter
PM10 particulate matter equal to or less than 10 microns in diameter
POE point of entry
PSU Portland State University
PT proficiency testing
PTE potential to emit
Pu plutonium
PUE Power Utilization Effectiveness
PV photovoltaic
PWS public water system
Q water quality
QA quality assurance
QAP Quality Assurance Program (or Plan)
QAMAP Quality Assurance Management and Assessment Plan
QC quality control
Q/L water quality and water level
QSM Quality Systems Manual
R roentgen(s)
Ra radium
rad radiation absorbed dose (a unit of measure)
rad/d rad(s) per day
RCRA Resource Conservation and Recovery Act
rem roentgen equivalent man
RER relative error ratio
RFP request for proposal
RNCTEC Radiological/Nuclear
Countermeasures Test and Evaluation Complex
ROTC Record of Technical Change
RPD relative percent difference
RREMP Routine Radiological Environmental Monitoring Plan
RSL Remote Sensing Laboratory
RTR Real-Time Radiography
RWMC Radioactive Waste Management
Complex
RWMS Radioactive Waste Management Site
s second(s)
SAA Satellite Accumulation Area
SAD surface area disturbance
SAP Sampling and Analysis Plan
SARA Superfund Amendments and Reauthorization Act
SC specific conductance
SD standard deviation
SDWA Safe Drinking Water Act
SE standard error of the mean
SER Safety Evaluation Report
SERC State Emergency Response Commissioner
SF6 Sulfur hexafluoride
SHPO State Historic Preservation Office
SI International System of Units
SIS Sprung Instant Structure
SNHD Southern Nevada Health District
SNJV Stoller-Navarro Joint Venture
SOC synthetic organic chemical
SO2 sulfur dioxide
Appendix C – Acronyms and Abbreviations
Nevada National Security Site Environmental Report 2018 C-5
SPCC Spill Prevention, Control, and Countermeasure
Sr strontium
SSP Site Sustainability Plan
SSPP Strategic Sustainability Performance Plan
S.U. standard unit(s) (for measuring pH)
Sv sievert(s)
SWEIS Site-Wide Environmental Impact Statement
Tc technetium
TDS total dissolved solids
TEDE total effective dose equivalent
Th thorium
TLD thermoluminescent dosimeter
TNI The NELAC Institute
TOC total organic carbon
TOX total organic halides
TPC Tribal Planning Committee
TPCB Transuranic Pad Cover Building
TRC Tribal Revegetation Committee
TRI Toxic Release Inventory
TRU transuranic
TSaMP Tritium Sampling and Monitoring Program
TSCA Toxic Substances Control Act
TSR Technical Safety Requirements
TSS total suspended solids
TTR Tonopah Test Range
TUM Tribal Update Meeting
U uranium
UGT underground test
UGTA Underground Test Area
UNESE Underground Nuclear Event Signatures Experiment Forensics
UR use restriction
U.S. United States
USAF U.S. Air Force
USC United States Code
USGS U.S. Geological Survey
UST underground storage tank
VERB Visual Examination and Repackaging Building
VOC volatile organic compound
VZM vadose zone monitoring
WAC Waste Acceptance Criteria
WDP water delivery point
WEF Waste Examination Facility
WIPP Waste Isolation Pilot Plant
WMD Waste Management Division
WO Waste Operations
WW water well
yd yard(s)
yd3 cubic yard(s)
yr year(s)
Appendix C – Acronyms and Abbreviations
C-6 Nevada National Security Site Environmental Report 2018
THIS PAGE INTENTIONALLY LEFT BLANK
Library Distribution List
Nevada National Security Site Environmental Report 2018 DL-1
Library Distribution List
Libraries in this list will be mailed a hard copy of this full report (NNSSER), a hard copy of the Nevada National Security Site Environmental Report Summary 2018 (SUM), and a compact disc (CD) containing the NNSSER,
SUM, and Attachment A: Site Description, unless otherwise indicated. All versions are uncontrolled.
Alamo Branch Library, P.O. Box 239, Alamo, NV 89001
Amargosa Valley Library District, HCR 69-2, P.O. Box 401-T, Amargosa Valley, NV 89020
Beatty Library District, P.O. Box 129, Beatty, NV 89003
Boulder City Library, 701 Adams Blvd., Boulder City, NV 89005
Caliente Branch Library, P.O. Box 306, Caliente, NV 89009
Cedar City Public Library, 303 N. 100 E., Cedar City, UT 84720-2610
Delta City Library, 76 N. 200 W., Delta, UT 84624-9440
Goldfield Public Library, P.O. Box 430, Goldfield, NV 89013
Henderson District Public Library, 280 Water Street, Henderson, NV 89015
Indian Springs Library, P.O. Box 629, Indian Springs, NV 89018
Library of Congress, U.S./Anglo Division, U.S. Government Documents Section, 101 Independence Avenue, SI, STOP 4274, Washington, DC 20540-4274
Lincoln County Library, P.O. Box 330, Pioche, NV 89043
Milford Public Library, P.O. Box 579, Milford, UT 84751-0579
Moapa Valley Library, P.O. Box 397, Overton, NV 89040
Pahrump Library District, 2101 E. Calvada Boulevard, Pahrump, NV 89048
Tonopah Library District, P.O. Box 449, Tonopah, NV 89049
UNLV Library Government Documents, University of Nevada-Las Vegas, P.O. Box 457013, Las Vegas, NV 89154-7013
University of Nevada Libraries, Business & Government Information Center/322, 1664 North Virginia Street, Reno, NV 89557-0044
U.S. Department of Energy, National Nuclear Security Administration Nevada Field Office, Public Reading Facility c/o Nuclear Testing Archive, P.O. Box 98521, M/S 400, Las Vegas, NV 89193-8521 (2 CDs)
U.S. Department of Energy, Office of Scientific and Technical Information, P.O. Box 62, Oak Ridge, TN 37831-0062 (1 electronic copy NNSSER/SUM/Attachment A)
Washington County Library, 50 S. Main Street, St. George, UT 84770-3490
White Pine County Library, 950 Campton Street, Ely, NV 89301
Library Distribution List
DL-2 Nevada National Security Site Environmental Report 2018
THIS PAGE INTENTIONALLY LEFT BLANK
SM
National Nuclear Security Administration