2018 INTEGRATED REPORT - National Government of South ...
242
2018 INTEGRATED REPORT VOLUME 1 Goals can only be achieved if efforts and courage are driven by purpose and direction
-
Upload
khangminh22 -
Category
Documents
-
view
1 -
download
0
Transcript of 2018 INTEGRATED REPORT - National Government of South ...

2018 INTEGRATED REPORTVolume 1
Goals can only be achieved if efforts and courage are driven by purpose and direction
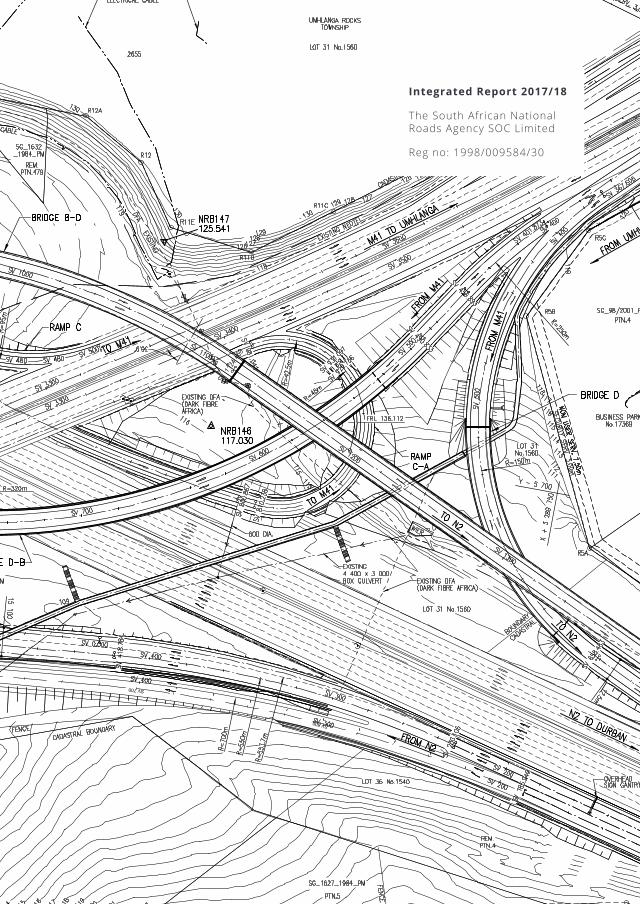
Integrated Report 2017/18
The South African National Roads Agency SOC Limited
Reg no: 1998/009584/30
4
THe SouTH AFRICAN NATIoNAl RoADS AGeNCY SoC lImITeD
The South African National Roads Agency SOC Limited
Integrated Report 2017/18
About the Integrated Report
The 2018 Integrated Report of the South African National Roads Agency (SANRAL) covers the period 1 April 2017 to 31 March 2018 and describes how the agency gave effect to its statutory mandate during this period.
The report is available in printed and electronic formats and is presented in two volumes:
• Volume 1: Integrated Report is a narrative on major development during the year combined with key statistics that indicate value generated in various ways.
• Volume 2: Annual Financial Statements contains the sections on corporate governance and delivery against key performance indicators, in addition to the financial statements.
2018 is the second year in which SANRAL has adopted the practice of integrated reporting, having previously been guided solely by the approach adopted in terms of the Public Finance Management Act (PFMA). The agency has attempted to demonstrate the varied dimensions of its work and indicate how they are strategically coherent. It has continued to comply with the reporting requirements of the PFMA while incorporating major principles of integrated reporting.
This new approach is supported by the adoption of an integrated planning framework in SANRAL’s new strategy, Horizon 2030.
In selecting qualitative and quantitative information for the report, the agency has been guided by Horizon 2030 and the principles of disclosure and materiality. SANRAL has attempted to provide concise but reasonably comprehensive information that enables the reader to make an assessment of the agency.

INTeGRATeD RePoRT 2018
Internal criteria External criteria
Company vision, mission, mandate and values, plus published code of ethics
Developments in the global and national economic and political environment that present challenges and opportunities for the agency
Objectives, shareholder targets, associated key performance indicators (KPIs), policies, processes and procedures
Regulatory changes that impact on SANRAL’s operations
Expectation and feedback from stakeholders, including the shareholder, employees, suppliers, customers, communities where it operates, regulators and environmental organisations.
Guidance provided by independent expert advisors
Key risks affecting the agency, and guidance provided by SANRAL’s management, specialist employees and auditors about risk response.
Factors impacting reputation.
The following criteria guided the selection of content:
The report presents certain data by population group and gender. This is purely in the interests of monitoring progress in terms of transformation and not because SANRAL attaches any other importance to such distinctions.

THE SOUTH AFRICAN NATIONAL ROADS AGENCY SOC LIMITED
6
Table of contents
Chairperson’s Report.................................................................................................................. CEO’s Report.................................................................................................................................
SECTION 1: COMPANY OVERVIEW.............................................................................................. Our vision, mission and core values.......................................................................................... Our mandate and principal tasks............................................................................................... Overview of Strategy...................................................................................................................... Looking ahead................................................................................................................................. Our Board of Directors.................................................................................................................. Our Executive Team....................................................................................................................... SECTION 2: CAPITALS AND PERFORMANCE............................................................................... 1 Manufactured Capital...........................................................................................
1.1 Road development, improvement and rehabilitation New contracts awarded Projects completed Major projects in progress Toll roads under concession
1.2 Road network management and maintenance Pavement management Bridge management Slope management Routine road management Smart road systems Combatting vehicle overloading
1.3 Going forward: sector transformation
1.4 Windows on our world N2 Wild Coast Road Moloto Road Mt Edgecombe Interchange Cape-to-Namibia Highway
2 Funding Capital.....................................................................................................
2.1 Annual Income
2.2 Income trends
2.3 Annual expenditure
2.4 Profit/lossbeforetaxation
2.5 Toll roads under concession
3 Intellectual Capital................................................................................................
Innovative design and research Automated electronic toll payment Technical Innovation Hub Geotechnical solutions
811
15161617182021
2324
52
58

INTEGRATED REPORT 2018
7
4 Social and Relationship Capital............................................................................
4.1 empowerment, job creation and skills building SMME contracts Creating employment Training of workers
4.2 Community development Empowerment and job creation Training and skills building Concessionaires building small business and providing jobs
4.3 Road safety interventions Safer road infrastructure Road safety education Effective incident response Concession-holders road safety activities
4.4 university partnerships
4.5 Concession holders building social capital
5 Natural Capital......................................................................................................
5.1 Conservation on major projects
5.2 environmental impact assessments
5.3 Statutory developments
5.4 Concession holders’ environmental initiatives
6 Human Capital.......................................................................................................
6.1 Profileofemployees Employee development Technical Excellence Academy Scholarships and external bursaries Internships Employee wellness programme
7 Enabling Value Creation: Communication and Information Systems...............
7.1 Communication and marketing Stakeholder engagement Mass media campaigns Media engagement and editorial coverage In-house publications Social media
7.2 Information technology Converged data centre systems Management of cyber security Office 365 Governance Focus areas 2018/19
60
72
78
84
THE SOUTH AFRICAN NATIONAL ROADS AGENCY SOC LIMITED
8
Chairperson’s Report
The South African National Roads Agency (SANRAL) reached a critical juncture during the 2017/18 financial year. Two decades after its establishment by the first democratic government, the agency decided to undertake a comprehensive review of its mandate, vision and strategic objectives.
This resulted in the publication of Horizon 2030, a comprehensive new strategy that will serve as the roadmap for this vital government agency over the next decade and beyond.
The decision to develop a new long-term strategy reflects the dynamic nature of the organisation. Over the years SANRAL has exceeded expectations in managing South Africa’s primary road network, which is the
country’s most valuable infrastructural asset.
Our approach is best reflected in our purpose statement in Horizon 2030:
“Our purpose is to deliver a safe, efficient, reliable and resilient national road transport system for the benefit of all the people of South Africa.”
As the outgoing Chairperson of the Board, I am exceptionally proud of the fact that we were able to deliver such a visionary strategy as the product of a broad process of consultation, both within SANRAL and with external stakeholders.
Vision 2030 confirms SANRAL’s position as a leading road agency on the global stage and one which is ahead of the curve in terms of planning, engineering, construction and maintenance of a strategic primary road network.
As a state-owned agency within a developmental state we willingly assume our responsibilities in terms of contributing to socio-economic development and the building of a more equitable and stable country.
Commitment to training and research
Among SANRAL’s successes during the term of the current Board are our contributions to education, training, research and knowledge-creation. During this reporting period alone, 161 students received SANRAL bursaries to pursue studies at tertiary institutions and 203 high school learners were enrolled in our scholarship programmes.
We work closely with local universities to improve educational outcomes in critical subjects such as science, technology, engineering and mathematics. Our sponsorship of chairs of higher learning at the Universities of Cape Town, Stellenbosch and the Free State contributes to original research in areas such
INTEGRATED REPORT 2018
9
as construction, transportation and road safety, and to improved science and maths education.
At our SANRAL Technical Excellence Academy we enable new graduates in engineering to make a successful transition from the academic environment into professional careers. This is a programme that is already benefiting the broader construction and built environments.
This culture of excellence has also taken root within our own organisation where we are making significant investments in the training of employees through our learning and development strategy.
Corporate governance and transformation
Internal transformation is managed through employment equity plans and skills development initiatives. We continue to attract top professionals in the engineering and construction environments, and ensure their progress within the ranks of the organisation through our skills pipeline.
During the past year we were able to make senior appointments to critical management positions both at head office and in the SANRAL regions from within our own ranks – a positive indication that our human capital development strategy is achieving results.
SANRAL prides itself on its commitment to good governance and we fully subscribe to the principles of King IV report on corporate governance. This commitment is reflected in this Integrated Report in our reporting on performance, identification of risks and description of systems of control and governance.
To date, in all twenty years of SANRAL’s existence, it has not fallen foul of the principles of good governance.
As a state-owned company we endeavour to move beyond the concept of good corporate citizenship. We recognise the role that a well-
managed primary road network can play in the broader socio-economic development of the country and we embrace government initiatives that will contribute to the rise of a new dawn in South Africa.
The accelerated implementation of the National Development Plan 2030 will be at the core of government initiatives over the next decade. There can be little doubt that the quality of the country’s primary road network will be critical to the success of the NDP.
Futurefinancing
The development of Horizon 2030 offered SANRAL an opportunity to take a critical look at our business model and, especially, our funding policy. It has become clear that SANRAL cannot continue on the growth trajectory of the previous two decades during which the size of the network expanded without commensurate funding.
2017/18 was also a watershed in that SANRAL found it necessary for the first time to transfer an amount of R1 667m from the non-toll business to the toll road portfolio. This transfer, made with the concurrence of the Minister of Transport, was in order to reduce losses incurred as a result of sustained non-payment of toll fees by users of the roads constructed under the Gauteng Freeway Improvement Project (GFIP). The transferred amount was in addition to the special grant of R406m made by Treasury to off-set the reduced income on GFIP.
All other toll roads managed directly by SANRAL and through concessions operated smoothly – with increased use of e-tags on these routes – and were economically viable.
SANRAL is alert to the fact that we operate in a climate where there is widespread resistance to payment by users of public services such as water and electricity and this is exacerbated by the adverse economic climate. In this context, the financing of new roads through
THE SOUTH AFRICAN NATIONAL ROADS AGENCY SOC LIMITED
10
private financing and toll collection becomes increasingly challenging.
Horizon 2030 recognises that National Treasury will remain the primary source of funding the development and maintenance of roads but that it will continue to be necessary to explore opportunities for public-private partnerships. The imperative for comprehensive consultation with communities and stakeholders ahead of such partnerships cannot be overstated. The notion of “buy in” takes on a very real meaning when public infrastructure is to be funded, wholly or partly, by user payment.
Acknowledgements
Towards the end of the financial year we welcomed the appointment of a new Minister of Transport, Dr Bonginkosi Blade Nzimande. Within a short period SANRAL has begun to benefit from his wisdom and energy.
It would be remiss of me if I did not acknowledge the previous Minister of Transport, Mr Joe Maswanganyi, for his endorsement of the long-term strategy, Horizon 2030, and draft Transformation Policy, both of which he launched.
I also want to pay tribute to the leadership and support given by the Deputy Minister of Transport Sindisiwe Chikunga, managers at the Department of Transport, and our partners in provincial and local government departments and other infrastructure-related agencies.
The term of the current Board will come to a close during the current financial year. I have been privileged to serve on the Board since 2011 and wish to thank my colleagues on the Board for their devotion to the organisation and their commitment to good corporate governance.
I also want to pay tribute to the employees of SANRAL, from administrative staff, through the professional ranks to senior management. Your loyalty and professionalism has helped to create an organisation that is a national asset. I have great faith in the management of the
organisation, under the leadership of our CEO, Skhumbuzo Macozoma, and its ability to ensure SANRAL realises its new vision and strategic objectives.
As South Africa commemorates the 100th birthday of Nelson Rolihlahla Mandela we can state with considerable pride that, through our mandate for road development and management, we have contributed to the economic progress of our country and its journey towards social justice and inclusivity.
Roshan Morar CHAIRPERSON
INTEGRATED REPORT 2018
11
SANRAL starts its third decade with a fresh vision and mandate and clearly defined strategic objectives. During the past year we have taken fundamental decisions that will determine the trajectory of the organisation and position SANRAL as a catalyst for future economic growth in the country and on the continent of Africa.
The publication of Horizon 2030 – our new long-term strategy – was a seminal moment in SANRAL’s development as the state-owned company responsible for managing South Africa’s primary road network.
The strategy provides the organisation with a new, shared vision and identifies the actions that are required to meet our objectives
over the next decade. It confirms SANRAL’s reputation as a progressive entity within the South African public sector and a leading agency in the fields of engineering, construction and road management within the global environment.
Horizon 2030 was accompanied by the Transformation Policy which affirms SANRAL’s commitment to the broader developmental objectives of the country as defined by the National Development Plan.
It recognises our catalytic role within the construction and engineering sectors and explores opportunities for SANRAL to leverage this position. We embrace the challenge to use our procurement and tender processes in shaping the long-term growth path of the construction and related industries.
The transformation policy sets clear and unambiguous targets for the participation of black contractors, professionals and suppliers in all projects commissioned by SANRAL. We are intentionally exploiting to the full the provisions of prevailing economic empowerment legislation with the clear aim of breaking down monopolies in the supply chains for materials, equipment, technologies and professional services.
SANRAL went the extra mile in consulting with industry stakeholders, labour formations and communities through a series of meetings across all nine provinces. We welcomed the feedback we received and took care to accommodate the views of stakeholders in our final proposals.
The year in perspective
At the operational level, 2017/18 was a complex year. On the one hand, the agency had a large number of capital projects in process – a total of 223 covering 848km of roadway. But spending on capital projects was considerably lower than in 2016/17, reflecting a slowdown in construction, with a high proportion of projects running behind schedule.
ChiefExecutiveOfficer’sReport

THE SOUTH AFRICAN NATIONAL ROADS AGENCY SOC LIMITED
12
In addition to this, while some exciting new construction projects were initiated during the year, there was a sharp decline in the number of contracts issued – from 172 in 2016/17 to 60 in the reporting year – and there was a similar trend in relation to design phase contracts.
Within the toll road portfolio, SANRAL deliberately exercised restraint in issuing construction tenders because of the financing difficulties referred to in the Chairperson’s Report.
Factors largely beyond SANRAL’s control accounted for the decline in tenders awarded and work undertaken on non-toll roads.
The tendering process was impeded by difficulties SANRAL experienced in applying new tender requirements of National Treasury. Both parties recognise the considerable impact this problem has had on the construction industry and therefore have a mutual interest in resolving matters.
A far more disturbing development accounts for the slowdown of work on a number of existing projects. It has been referred to in the media as “tender-jacking” – attempts by business interest groups in areas close to road construction works to coerce principal contractors to give them sub-contracts without any tendering processes. These demands are sometimes backed by threats of violence, damage to property and, occasionally, serious physical harm to individuals on site.
Reasons for pressing these demands may differ, from a perception of entitlement based on a misreading of empowerment legislation to plain criminal intent. SANRAL has intensified its community engagement efforts in an effort to pre-empt these conflicts and supported contractors in securing police protection where needed.
Milestones and highlights
Against this difficult background, there were some significant highpoints that served to remind us just how important the national road network is in facilitating the movement of goods and services and connecting people to economic opportunities.
• On the N2 Wild Coast Road we started with the construction of the 1.1km long bridge across the Mtentu Gorge. On completion this will be the longest main span cantilever bridge on the African continent. An upgraded N2 will significantly cut down travel time between Durban and East London and create new opportunities for growth and development along the eastern seaboard.
• Inland we started with major improvements to three intersections on the N14 between Olifantshoek and Kathu. This road connects the Northern Cape with the urban metros in Gauteng and plays a vital road in the lives of people who live in contiguous rural communities.
• On the N2 north of Durban we are nearing completion of a major capital project to upgrade the Mount Edgecombe intersection. This improved stretch of road and intersection will bring relief from congestion for commuters travelling to the KwaZulu-Natal North Coast and further stimulate the growth of the tourism and leisure industries in the region.
• In Mpumalanga work is progressing on the N11 near Middelburg in the Steve Tshwete District. This includes the reconstruction of the existing road and the widening of the Kranspoort Pass, an infrastructure investment of more than R415m.
On all contracts, from major new construction projects to routine maintenance work, SANRAL ensures that primary contractors allocate significant portions of the work to emerging enterprises, especially those owned by black people, women and young people.

INTEGRATED REPORT 2018
13
In the 2017/18 financial year work to the value of R3 087m was contracted to SMMEs for construction, rehabilitation and maintenance projects. Construction and maintenance projects also generated the equivalent of 15 299 full-time jobs while a total of 3 421 individuals received training and skills upgrading through these projects.
Commitment to transformation
A primary objective of our transformation policy is to grow the share of work done by black-owned enterprises beyond the statutory threshold and to expect of our primary contractors to commit to a more focused and inclusive empowerment and skills transfer programmes.
SANRAL believes its transformation drive starts from within - by amending its supply chain management policies to ensure inclusive investment in the construction industry and economy and working with stakeholders to deliver on government’s promise to move South Africa forward.
Our primary objectives are to grow the construction and engineering sectors and attract new entrants, especially black contractors who can build businesses and create jobs.
Technological advancement
SANRAL’s expertise and technical prowess are widely recognised among our peers in the regional and global environments We are a member of the World Road Association (PIARC) and later this year we will host the 2018 PIARC International Seminar in Cape Town.
Similarly, we have embraced the initiatives by the United Nations to promote road safety through its Decade of Action programme. SANRAL is among those road agencies that have adopted the “safe systems” approach where the emphasis is on engineering solutions to create safer road environments.
We are also deepening our road safety awareness campaigns in collaboration with researchers and academics and in partnership with provincial education departments, schools and communities situated close to the SANRAL road network.
Embracing change
Our commitment to research and knowledge creation is also evident in our partnerships with universities, our endowment of research chairs and our growing support to programmes that aim to enrich teaching and learning of science, mathematics and technology.
Through our scholarship and bursary programmes we contribute to the identification and training of the next generation of engineers and professionals in the construction and built environments. At the SANRAL Technical Excellence Academy we enable young engineers to make the transition from academia to the work sphere through on-the-job training.
The year under review has, indeed, been a period of change for SANRAL. We welcomed the appointment of Dr Bonginkosi Emmanuel Nzimande as the new Minister of Transport and are bidding farewell to our Chairman, Roshan Morar, and members of our Board as they come to the end of their terms.
As a dynamic organisation which places high value on innovation and modernisation, we embrace the changes and are looking forward to work with new and existing stakeholders on our journey towards Horizon 2030.
Skhumbuzo Macozoma CHIEF ExECUTIVE OFFICER

THE SOUTH AFRICAN NATIONAL ROADS AGENCY SOC LIMITED
14
INTEGRATED REPORT 2018
15
SECTION 1
Our vision, mission and core values 16
Our mandate and principal tasks 16
Overview of Strategy 17
Looking ahead 18
Our Board of Directors 20
Our Executive Team 21
THE SOUTH AFRICAN NATIONAL ROADS AGENCY SOC LIMITED
COMPANY OVERVIEW
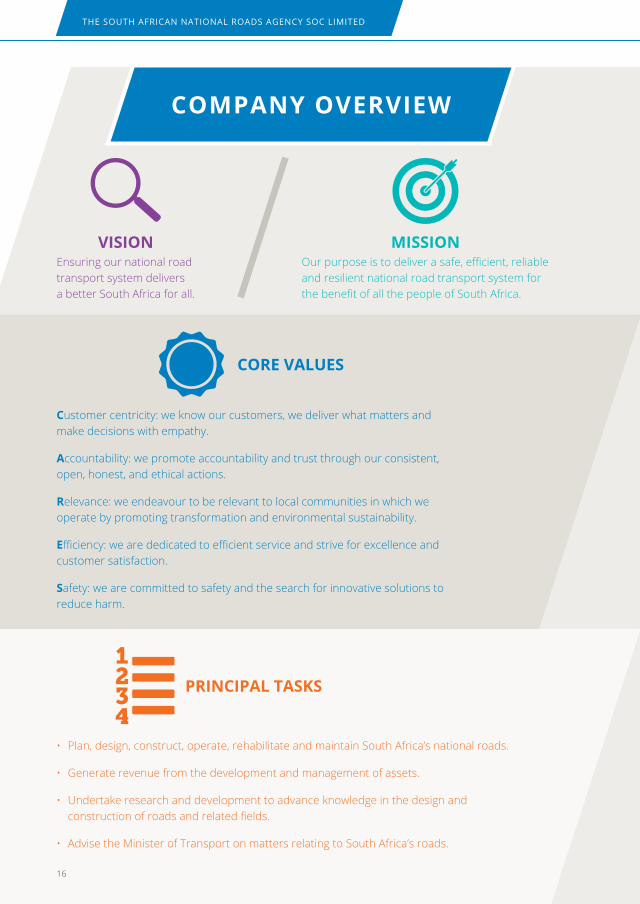
Ensuring our national road transport system delivers a better South Africa for all.
Our purpose is to deliver a safe, efficient, reliable and resilient national road transport system for the benefit of all the people of South Africa.
Customer centricity: we know our customers, we deliver what matters and make decisions with empathy.
Accountability: we promote accountability and trust through our consistent, open, honest, and ethical actions.
Relevance: we endeavour to be relevant to local communities in which we operate by promoting transformation and environmental sustainability.
Efficiency: we are dedicated to efficient service and strive for excellence and customer satisfaction.
Safety: we are committed to safety and the search for innovative solutions to reduce harm.
MISSION
CORE VALuES
VISION
• Plan, design, construct, operate, rehabilitate and maintain South Africa’s national roads.
• Generate revenue from the development and management of assets.
• Undertake research and development to advance knowledge in the design and construction of roads and related fields.
• Advise the Minister of Transport on matters relating to South Africa’s roads.
PRINCIPAL TASkS
16
INTEGRATED REPORT 2018
Overview of Strategy
On 13 December 2016, SANRAL embarked on a process of developing its long-term strategy - also known as Horizon 2030. This strategy outlines SANRAL’s long-term vision and perspective; acknowledges the major successes of the past 19 years; and seeks to build on them.
The approach adopted in the development of Horizon 2030 took into consideration all the realities facing SANRAL as well as the strategic opportunities that may arise in the next decade.
Subsequently SANRAL launched both Horizon 2030 and a Transformation Policy on 29 September 2017. These documents formed the basis for consultative, round table, stakeholder engagement sessions throughout the country.
Horizon 2030 identifies the key pillars that support the organisation, enablers to help delivery of its mandate for the future, and refines SANRAL’s vision, mission, core values and strategic objectives.
The four pillars of delivery on SANRAL’s mandate are:
• Roads – the delivery and maintenance of high quality road infrastructure remain at the core of SANRAL’s endeavours
• Road safety – the strategy outlines a more comprehensive approach to road safety in line with global trends
• Stakeholders – acknowledging that SANRAL serves a wide spectrum of stakeholders whose expectations must be addressed through research, consultation and pro-active communication
• Mobility – SANRAL will facilitate stronger integration of road infrastructure into transport planning and operations
Among the key focus areas of Horizon 2030 is SANRAL’s intention to pursue an integrated funding strategy comprised of fiscal allocations from National Treasury, own revenue generation and a reaffirmation of private finance.
Other key strategic imperatives are:
• demonstrating relevance to South Africans
• enhancing the community development programme
• public transport enablement
• transformation, both internally and in the construction sector
• exploring opportunities in Africa and beyond.
Over the past year SANRAL embarked on a process of extensive consultation with industry associations, professional bodies, stakeholders and communities in all nine provinces to explain its proposals for transformation and to ensure alignment with these objectives.
SANRAL continues to strengthen the country’s expertise in engineering and construction through the accelerated development of its own professionals as well as strategic interventions in education and research designed to promote knowledge and expertise.
Through bursaries and learnerships it enables young people at schools and universities to continue their studies; through partnerships with tertiary institutions it improves the quality of teaching in maths and science; and through sponsorships it encourages advanced research that contributes to knowledge creation in the transport and engineering industries.
Through the SANRAL Technical Excellence Academy in Port Elizabeth it offers a structured programme for graduate engineers to
17

THE SOUTH AFRICAN NATIONAL ROADS AGENCY SOC LIMITED
18
equip them with advanced knowledge and competencies. Graduates are exposed to real design projects under the guidance of mentors and they progressively assume more responsibilities until they are able to work independently.
Looking Ahead
SANRAL’s long-term strategy - Horizon 2030 - has several key strategic themes which set the tone for the organisation to exploit potential opportunities:
• Rebuilding of public trust
• Ensuring greater collaboration and synergy in the area of road safety within the transport and related industries
• Developing an operating model to deliver on SANRAL’s long-term objectives
• Continuing with the implementation of efficient and effective road network management principles, to ensure that SANRAL is financially sustainable and avoids a fiscal cliff
• Leveraging partnerships with both the public and private sectors to extract value for the economy
• Demonstrating relevance to the public through SANRAL’s delivery programme and the enhancement of the community development programme, resulting in infrastructure that touches communities and fosters ownership
• Implementing sustainable transformation by ensuring that SANRAL’s projects contribute to the transformation of the industry with a strong emphasis on the inclusion of black business
• Growing the pool of engineers through the Technical Excellence Academy
• Strengthening the Technical Innovation Hub by pursuing cutting-edge research and development to leverage on advancements in technology.
Horizon 2030 outlines that SANRAL will pursue an integrated funding strategy that includes fiscal allocations from National Treasury, own revenue generation and capital raised through private finance – from domestic and international bond markets. SANRAL recognises the realities facing all organs of state – insufficient budgets that are declining in real terms; an economy under pressure; the triple challenges of poverty, unemployment and inequality which have also contributed to protests and disruptions at various project sites.
These realities contributed to SANRAL’s decision to develop a new Transformation Policy, a 14-Point Plan and sub-sector strategies to enhance inclusivity.
The integrated funding strategy is a critical component of SANRAL’s strategic objectives and consists of three pillars:
The first is fiscal allocations from National Treasury. Horizon 2030 demonstrates how these allocations have grown since SANRAL’s inception in tandem with the size of the network. Public funding is a critical source of revenue for SANRAL and will continue to play a definitive role in the agency’s funding envelope.
The second pillar is private finance. Horizon 2030 makes a strong case on how valuable this alternative financing has been to enable SANRAL to broaden the scope of its funding envelope and deliver more road infrastructure than if it had only been reliant on public funds.

INTEGRATED REPORT 2018
19
This enabled SANRAL to implement strategic and flagship projects, and major works which include network expansion, greenfield- and brownfield upgrades.
The third pillar – generation of own revenue – marks a material deviation from the past. This entails an assessment of every potential revenue generating opportunity within SANRAL and developing a business development strategy. This is critical for the sustainability of the agency and fits into government’s review of state-owned entities.
It also presents an opportunity to manage certain business units along commercial lines, stabilise the agency’s financial position and drive an entrepreneurial culture within the
agency. The initial starting point would be to only explore opportunities where value can be derived by all parties.
Generation of own revenue fits well with the ‘Africa and Beyond’ theme outlined in Horizon 2030. SANRAL has amassed considerable expertise in the fields of engineering, tolling, asset management and operations. The agency frequently hosts visits by other African road authorities and actively participates in ASANRA, SADC and AU structures involved in road management and transportation issues. There is, thus, significant potential to provide services on a fee basis to other countries where toll projects are being actively pursued and engineering expertise is required.
THE SOUTH AFRICAN NATIONAL ROADS AGENCY SOC LIMITED
20
Board of DirectorsNon-executive directors
Executive Director Company Secretary
ROShAN MORAR
Chairperson CA (SA) CFE
ALLYSON LAWLESS
Pr Eng C Eng BSc (Civ Eng) (Natal) MSc (Lond) DIC (Imp Lond) DEng hc (Stellenbosch) FREng FSAICE FIStructE
ChRISTOPhER hLABISA
BTech (Civil) MDP Pr Tech Eng MSAICE
DAPhNE MAShILE-NkOSI
Small Business Management Diploma
AVRIL hALSTEAD
BCom (Hons) (Mathematics) MBA MA (Advanced Organisational Consulting) MSc (Economic Policy)
MATETE MATETE
BSc (Hons) Transportation Planning MBA
ZIBuSISO kGANYAGO
BCom Diploma in Advanced Property Practice
SkhuMBuZO MACOZOMA
Chief Executive Officer BSc (Civ Eng) MSc (Civ Eng)
ALICE MAThEW
BSc MBA FCIS
INTEGRATED REPORT 2018
21
Executive Management
Regional Management
INGE MuLDER
Chief Financial Officer BCompt (Hons) CTA CA (SA)
LOGAShRI SEWNARAIN
Eastern Region BSc (Civ Eng) Pr Eng Pr CPM MSAICE FAArb
hEIDI A hARPER
Corporate Services Executive BSoc Sci MBA Pr CHRP (SABPP) IPMSP (IPM) PGDip Leadership Development Cum Laude
WILLEM SChALk VAN DER MERWE
Northern Region BEng (Civ) MEng (Transportation) Pr Eng Pr CPM MSAICE
LOuW kANNEMEYER
Engineering Executive BEng (Civ) MEng (Transportation) Cum Laude Pr Eng Pr CPM
MBuLELO SIMON PETERSON
Southern Region BSc (Maths and Applied Maths) BSc (Civ Eng) MSc (Strategic Planning) MBA Pr Eng MSAICE
kOBuS VAN DER WALT
Western Region BEng (Civ) Pr Eng

THE SOUTH AFRICAN NATIONAL ROADS AGENCY SOC LIMITED
22

INTEGRATED REPORT 2018
23
Manufactured Capital 24
Funding Capital 52
Intellectual Capital 58
Social & Relationship Capital 60
Natural Capital 72
Human Capital 78
Enabling Value Creation: Communication and
Information Systems 84
SECTION 2
THE SOUTH AFRICAN NATIONAL ROADS AGENCY SOC LIMITED
24
SANRAL is directly responsible for improving, maintaining and managing 94% of South Africa’s 22 214km national road network, while the remaining 6% of the network is managed through public-private partnerships that centre on 30-year concessions on various national toll routes.
The national road network is not a static entity and has, in fact, expanded on an annual basis as various provincial roads have been incorporated. It is expected to grow in the medium-term to approximately 25 000km.
The great majority of roads under SANRAL’s direct management – 87% of the total national network – are not subject to tolling, but selected routes, comprising 7% of the total national road system, are toll-routes operated by SANRAL.
A common asset management system spans the entire national road network. This involves close monitoring of the condition of all roads in order to predict their future performance and set priorities for major upgrading and rehabilitation. Routine maintenance is undertaken across the entire network on a continual basis.
SANRAL’s roads are maintained to a very high standard, measured against recognised international benchmarks, and its major construction projects reveal the extraordinary design, engineering and construction skills the agency is able to leverage.
The toll roads managed under concession and the companies responsible for them are as follows:
• Trans African Concessions (TRAC) which is responsible for the N4 eastward from Pretoria to Maputo in terms of a cross-border concession made in 1997.
• The N3 Toll Concession (RF) Proprietary Limited (N3TC) which was granted a concession in 1999 in respect of the N3 between Cedara in KwaZulu-Natal and Heidelberg in Gauteng.
• Bakwena Platinum Corridor Concessionaire (Bakwena) which has managed two routes since 2001: the N1 between Pretoria and Bela Bela in Limpopo, and the N4 going west from Pretoria to the Botswana border.
1.1 Road development, improvement and rehabilitation
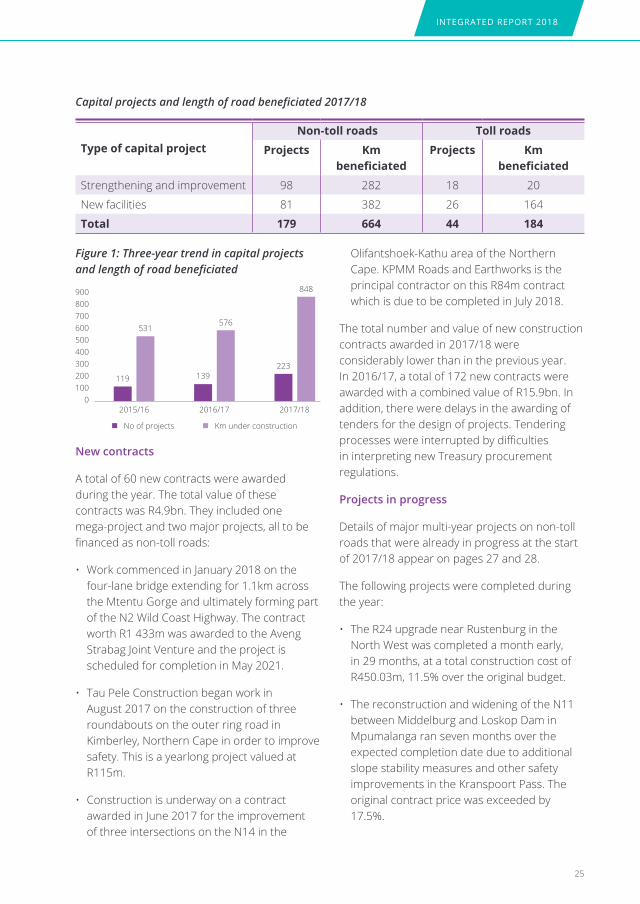
During 2017/18 SANRAL undertook a total of 223 projects to build new roads, improve existing roads, and rehabilitate roads in a sub-optimal condition. These projects on non-toll and toll roads directly under the agency’s management involved a total of 848km of roadway.
Because each project is unique, a simple head-count of projects undertaken and the length of improved or new pavement are inexact indicators of the volume and quality of work. However, they serve as a rough measure and indicate that SANRAL’s output increased in 2017/18 relative to previous years (Figure 1 - see next page).
Four out of five construction projects during the year were undertaken on non-toll roads and, overall, strengthening and improvement projects on existing roads comprised 52% of total capital projects. On toll routes, however, projects for the construction of new facilities outnumbered those for the strengthening and improvement of existing roads.
1 Manufactured Capital
INTEGRATED REPORT 2018
25
Type of capital projectNon-toll roads Toll roads
Projects km beneficiated
Projects km beneficiated
Strengthening and improvement 98 282 18 20
New facilities 81 382 26 164
Total 179 664 44 184
Capital projects and length of road beneficiated 2017/18
Figure 1: Three-year trend in capital projects and length of road beneficiated
900800700600500400300200100
0
119
2015/16 2016/17 2017/18
139223
531576
848
No of projects Km under construction
New contracts
A total of 60 new contracts were awarded during the year. The total value of these contracts was R4.9bn. They included one mega-project and two major projects, all to be financed as non-toll roads:
• Work commenced in January 2018 on the four-lane bridge extending for 1.1km across the Mtentu Gorge and ultimately forming part of the N2 Wild Coast Highway. The contract worth R1 433m was awarded to the Aveng Strabag Joint Venture and the project is scheduled for completion in May 2021.
• Tau Pele Construction began work in August 2017 on the construction of three roundabouts on the outer ring road in Kimberley, Northern Cape in order to improve safety. This is a yearlong project valued at R115m.
• Construction is underway on a contract awarded in June 2017 for the improvement of three intersections on the N14 in the
Olifantshoek-Kathu area of the Northern Cape. KPMM Roads and Earthworks is the principal contractor on this R84m contract which is due to be completed in July 2018.
The total number and value of new construction contracts awarded in 2017/18 were considerably lower than in the previous year. In 2016/17, a total of 172 new contracts were awarded with a combined value of R15.9bn. In addition, there were delays in the awarding of tenders for the design of projects. Tendering processes were interrupted by difficulties in interpreting new Treasury procurement regulations.
Projects in progress
Details of major multi-year projects on non-toll roads that were already in progress at the start of 2017/18 appear on pages 27 and 28.
The following projects were completed during the year:
• The R24 upgrade near Rustenburg in the North West was completed a month early, in 29 months, at a total construction cost of R450.03m, 11.5% over the original budget.
• The reconstruction and widening of the N11 between Middelburg and Loskop Dam in Mpumalanga ran seven months over the expected completion date due to additional slope stability measures and other safety improvements in the Kranspoort Pass. The original contract price was exceeded by 17.5%.
THE SOUTH AFRICAN NATIONAL ROADS AGENCY SOC LIMITED
26
• The improvement of the R570 from the N4 to Jeppes Reef in Mpumalanga was completed in 36 months, three months later than planned. The duration of the project was extended due to community protests, obstacles to accessing a quarry and borrow pits, rain delays and the construction of local access roads and drainage. Additional costs amounted to 8.5% of the original contract price.
• The improvement of the N7 between Citrusdal and Cederberg in the Western Cape was completed 1% under the original budget although it exceeded the planned completion date by five months as additional slope stabilisation was required.
• The project to realign the N7 in order to cater for the planned increase in the capacity of the Clanwilliam Dam was brought in on budget about two months later than the scheduled.
• The construction of a new two-lane carriageway on the N1 from Trompsburg to Fonteintjie in the Free State was completed at a cost of R413m. It was delivered about 14 months late and about R100m over budget due to difficulties securing borrow pit materials and the impact of drought in the area.
Delays were experienced on a high proportion of projects despite the efforts of project managers in SANRAL’s regional offices to work with contractors to avoid or minimise delays.
The reasons for delays range from additional construction work required for slope stability measures and safety reasons, to disputes that arise either in the labour relations field or with community role-players in respect of local sub-contracting. The last factor has become a substantial risk to construction projects in several provinces and sometimes poses a serious threat to the safety of contractors.
SANRAL is totally committed to the participation of local communities in road projects and has formalised this through project liaison committees, which are now a requirement for all projects. Generally local participation expedites projects, but it becomes an obstacle when community groups misunderstand the formal processes for local participation or when there are divisions and competition within communities.
The agency is devoting more resources to managing local-level stakeholder relations with the objective of improving communication, avoiding disputes and eliminating all avoidable time extensions.

INTEGRATED REPORT 2018
27
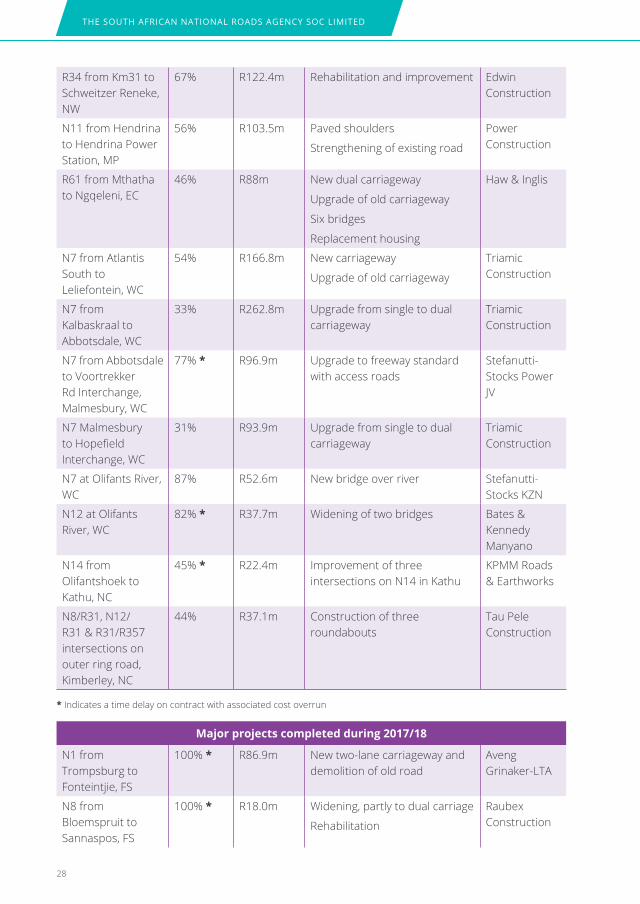
Major construction and rehabilitation projects in progress 2017/18
Section of roadPercent
complete
Value of work done
2017/18Scope of work
Main contractor
R61 from Baziya to Mthatha, EC
88% * R108.9m Widening
Upgrade of intersections
New bridges, culverts & pedestrian underpasses
Basil Read
R61 from All Saints to Baziya, EC
92% * R36.7m Construction of new road
Earthworks, pavement & sealing
New bridges & culverts
Aveng Grinaker-LTA
R72 from Port Alfred to Fish River, EC
85% R153.8m Improved alignment Concor
R72 from Birah River to Openshaw Village, EC
35% R133.5m Improved alignment Trianic
N6 from Rouxville to Smithfield, FS
33% R114.9m Rehabilitation WBHO Construction
N2 Mount Edgecombe Interchange, KZN
96% * R174.3m Upgrade of interchange to four-level free-flow system
CMC di Ravenna South Africa
N3 Hammarsdale Interchange, KZN
51% * R93.4m Mass earthworks
Six new on- and off-ramps, partial clover configuration
New five-lane overpass bridge
Demolition of old bridge
Stefanutti Stocks
N5 from Harrismith to Industriqua, FS
98% * R128.3m Upgrade to dual carriageway
New interchange
Edwin Construction
R573 from Siyabuswa to Marble Hall, LP
33% * R69.6m Addition of shoulders
Rehabilitation
New roundabout at N11 junction
KPMM-CBE JV
R505 from Wolmaransstad to N14, NW
52% * R256.3m Partial reconstruction Power Construction
N4 from Pampoennek to R512, NW
40% * R67.8m New dual carriageway
Extra climbing lanes
Partial clover leaf interchange
Environmental rehabilitation
Aveng- Lubocon JV
Projects on non-toll roads
THE SOUTH AFRICAN NATIONAL ROADS AGENCY SOC LIMITED
28
R34 from Km31 to Schweitzer Reneke, NW
67% R122.4m Rehabilitation and improvement Edwin Construction
N11 from Hendrina to Hendrina Power Station, MP
56% R103.5m Paved shoulders
Strengthening of existing road
Power Construction
R61 from Mthatha to Ngqeleni, EC
46% R88m New dual carriageway
Upgrade of old carriageway
Six bridges
Replacement housing
Haw & Inglis
N7 from Atlantis South to Leliefontein, WC
54% R166.8m New carriageway
Upgrade of old carriageway
Triamic Construction
N7 from Kalbaskraal to Abbotsdale, WC
33% R262.8m Upgrade from single to dual carriageway
Triamic Construction
N7 from Abbotsdale to Voortrekker Rd Interchange, Malmesbury, WC
77% * R96.9m Upgrade to freeway standard with access roads
Stefanutti-Stocks Power JV
N7 Malmesbury to Hopefield Interchange, WC
31% R93.9m Upgrade from single to dual carriageway
Triamic Construction
N7 at Olifants River, WC
87% R52.6m New bridge over river Stefanutti-Stocks KZN
N12 at Olifants River, WC
82% * R37.7m Widening of two bridges Bates & Kennedy Manyano
N14 from Olifantshoek to Kathu, NC
45% * R22.4m Improvement of three intersections on N14 in Kathu
KPMM Roads & Earthworks
N8/R31, N12/R31 & R31/R357 intersections on outer ring road, Kimberley, NC
44% R37.1m Construction of three roundabouts
Tau Pele Construction
Major projects completed during 2017/18
N1 from Trompsburg to Fonteintjie, FS
100% * R86.9m New two-lane carriageway and demolition of old road
Aveng Grinaker-LTA
N8 from Bloemspruit to Sannaspos, FS
100% * R18.0m Widening, partly to dual carriage
Rehabilitation
Raubex Construction
* Indicates a time delay on contract with associated cost overrun
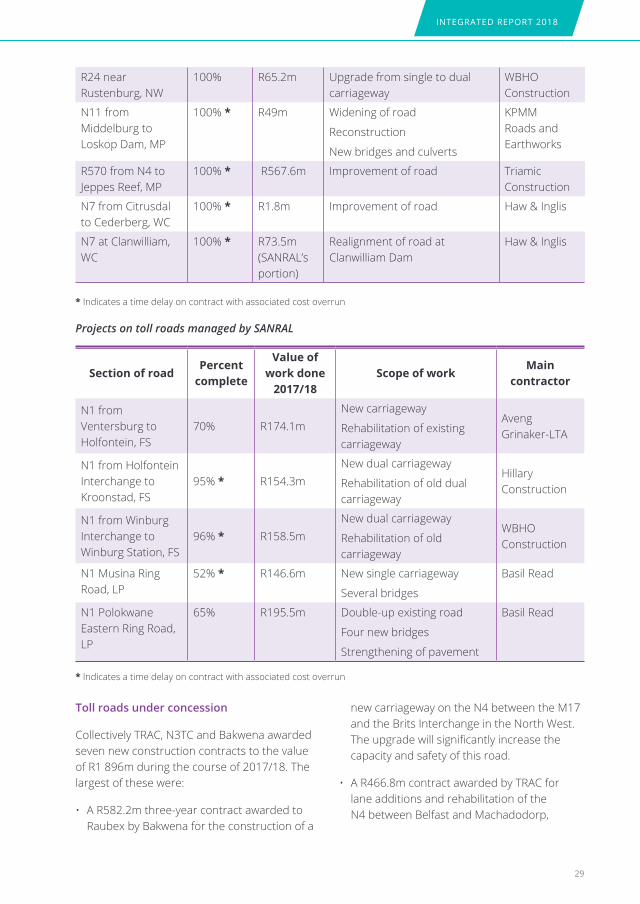
INTEGRATED REPORT 2018
29
R24 near Rustenburg, NW
100% R65.2m Upgrade from single to dual carriageway
WBHO Construction
N11 from Middelburg to Loskop Dam, MP
100% * R49m Widening of road
Reconstruction
New bridges and culverts
KPMM Roads and Earthworks
R570 from N4 to Jeppes Reef, MP
100% * R567.6m Improvement of road Triamic Construction
N7 from Citrusdal to Cederberg, WC
100% * R1.8m Improvement of road Haw & Inglis
N7 at Clanwilliam, WC
100% * R73.5m (SANRAL’s portion)
Realignment of road at Clanwilliam Dam
Haw & Inglis
* Indicates a time delay on contract with associated cost overrun
Projects on toll roads managed by SANRAL
Section of roadPercent
complete
Value of work done
2017/18Scope of work
Main contractor
N1 from Ventersburg to Holfontein, FS
70% R174.1mNew carriageway
Rehabilitation of existing carriageway
Aveng Grinaker-LTA
N1 from Holfontein Interchange to Kroonstad, FS
95% * R154.3mNew dual carriageway
Rehabilitation of old dual carriageway
Hillary Construction
N1 from Winburg Interchange to Winburg Station, FS
96% * R158.5mNew dual carriageway
Rehabilitation of old carriageway
WBHO Construction
N1 Musina Ring Road, LP
52% * R146.6m New single carriageway
Several bridges
Basil Read
N1 Polokwane Eastern Ring Road, LP
65% R195.5m Double-up existing road
Four new bridges
Strengthening of pavement
Basil Read
Toll roads under concession
Collectively TRAC, N3TC and Bakwena awarded seven new construction contracts to the value of R1 896m during the course of 2017/18. The largest of these were:
• A R582.2m three-year contract awarded to Raubex by Bakwena for the construction of a
new carriageway on the N4 between the M17 and the Brits Interchange in the North West. The upgrade will significantly increase the capacity and safety of this road.
• A R466.8m contract awarded by TRAC for lane additions and rehabilitation of the N4 between Belfast and Machadodorp,
* Indicates a time delay on contract with associated cost overrun
THE SOUTH AFRICAN NATIONAL ROADS AGENCY SOC LIMITED
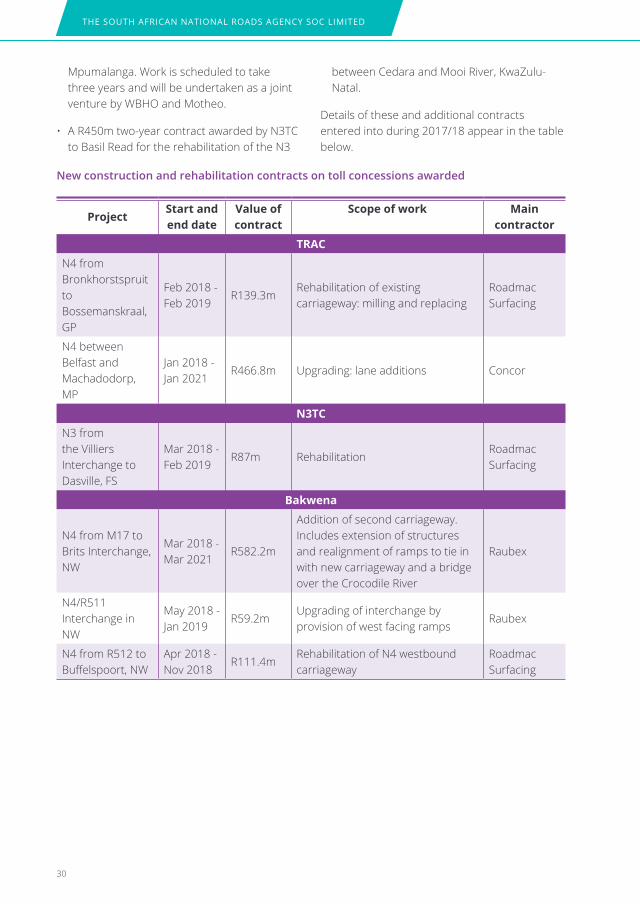
30
ProjectStart and end date
Value of contract
Scope of work Main contractor
TRAC
N4 from Bronkhorstspruit to Bossemanskraal, GP
Feb 2018 - Feb 2019
R139.3mRehabilitation of existing carriageway: milling and replacing
Roadmac Surfacing
N4 between Belfast and Machadodorp, MP
Jan 2018 - Jan 2021
R466.8m Upgrading: lane additions Concor
N3TC
N3 from the Villiers Interchange to Dasville, FS
Mar 2018 - Feb 2019
R87m RehabilitationRoadmac Surfacing
Bakwena
N4 from M17 to Brits Interchange, NW
Mar 2018 - Mar 2021
R582.2m
Addition of second carriageway. Includes extension of structures and realignment of ramps to tie in with new carriageway and a bridge over the Crocodile River
Raubex
N4/R511 Interchange in NW
May 2018 - Jan 2019
R59.2mUpgrading of interchange by provision of west facing ramps
Raubex
N4 from R512 to Buffelspoort, NW
Apr 2018 - Nov 2018
R111.4mRehabilitation of N4 westbound carriageway
Roadmac Surfacing
New construction and rehabilitation contracts on toll concessions awarded
Mpumalanga. Work is scheduled to take three years and will be undertaken as a joint venture by WBHO and Motheo.
• A R450m two-year contract awarded by N3TC to Basil Read for the rehabilitation of the N3
between Cedara and Mooi River, KwaZulu-Natal.
Details of these and additional contracts entered into during 2017/18 appear in the table below.
INTEGRATED REPORT 2018
31
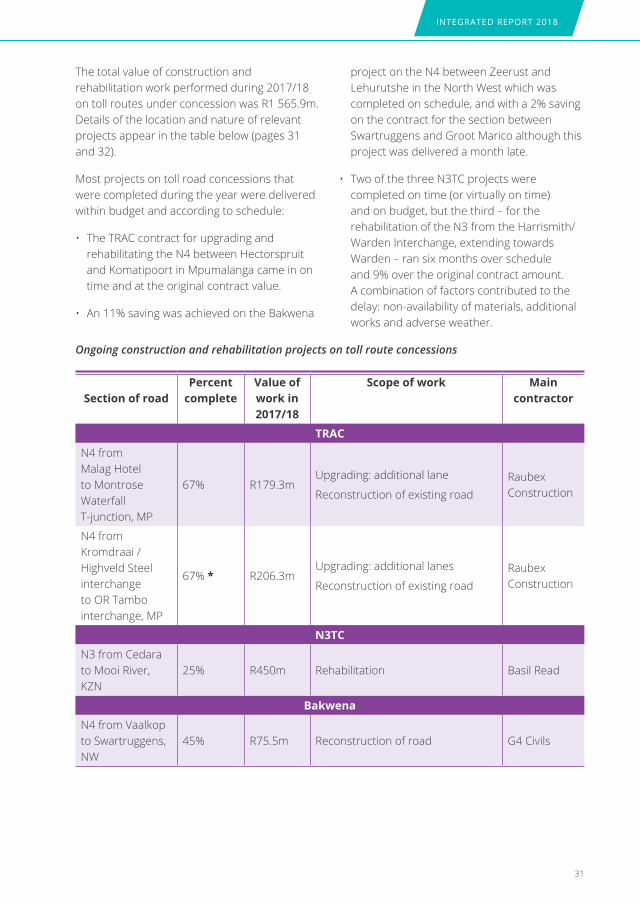
The total value of construction and rehabilitation work performed during 2017/18 on toll routes under concession was R1 565.9m. Details of the location and nature of relevant projects appear in the table below (pages 31 and 32).
Most projects on toll road concessions that were completed during the year were delivered within budget and according to schedule:
• The TRAC contract for upgrading and rehabilitating the N4 between Hectorspruit and Komatipoort in Mpumalanga came in on time and at the original contract value.
• An 11% saving was achieved on the Bakwena
project on the N4 between Zeerust and Lehurutshe in the North West which was completed on schedule, and with a 2% saving on the contract for the section between Swartruggens and Groot Marico although this project was delivered a month late.
• Two of the three N3TC projects were completed on time (or virtually on time) and on budget, but the third – for the rehabilitation of the N3 from the Harrismith/Warden Interchange, extending towards Warden – ran six months over schedule and 9% over the original contract amount. A combination of factors contributed to the delay: non-availability of materials, additional works and adverse weather.
Ongoing construction and rehabilitation projects on toll route concessions
Section of roadPercent
completeValue of work in 2017/18
Scope of work Main contractor
TRAC
N4 from Malag Hotel to Montrose Waterfall T-junction, MP
67% R179.3mUpgrading: additional lane
Reconstruction of existing roadRaubex Construction
N4 from Kromdraai / Highveld Steel interchange to OR Tambo interchange, MP
67% * R206.3mUpgrading: additional lanes
Reconstruction of existing road Raubex Construction
N3TC
N3 from Cedara to Mooi River, KZN
25% R450m Rehabilitation Basil Read
Bakwena
N4 from Vaalkop to Swartruggens, NW
45% R75.5m Reconstruction of road G4 Civils

THE SOUTH AFRICAN NATIONAL ROADS AGENCY SOC LIMITED
32
Completed construction and rehabilitation projects on toll route concessions
Section of roadPercent
completeValue of work in 2017/18
Scope of work Main contractor
TRAC
N4 between Hectorspruit and Komatipoort, MP
100% R80.8mUpgrading: lane additions
Reconstruction of existing roadRaubex
N3TC
N3 from Harrismith/Warden Interchange in the direction of Warden, FS
100% * R127m RehabilitationRoadmac Surfacing
N3 from Frere Interchange to Colenso/Winterton Interchange and onward almost to Bergville Interchange
100% R109m ResealingRoadmac Surfacing
N3 from Warden Interchange to Wilge Plaza, FS
100% R46m RehabilitationRoadmac Surfacing
Bakwena
N4 between Zeerust and Swartruggens, NW
100% R83.6m Rehabilitation WBHO
N4 between Swartruggens and Groot Marico, NW
100% * R121.4m Rehabilitation G4 Civils
N1 between Pumulani Toll Plaza and Hammanskraal, GP
100% R113.9m RehabilitationMurray and Robberts
* Indicates a time delay on contract with associated cost overrun

INTEGRATED REPORT 2018
33
1.2 Road network management and maintenance
The national road infrastructure is an asset of immense value and requires active management in order to preserve it and expand it in response to changing road use patterns occasioned by urban growth and socio-economic development.
SANRAL undertakes a never-ending cycle of surveillance of the state of national roads, utilising both automated systems and human observation. This data, combined with information on traffic flows and predictions on future road use, forms the basis of planning for road development, improvement, rehabilitation and maintenance.
The integration of information and communication technology (ICT) systems into the management of some of the busiest freeways in the country has taken road network management to another level, with real-time information on traffic flows and incidents available to traffic control centres which activate emergency response services. The installation, maintenance and upgrading of these ICT systems has now become an essential part of road management on these urban freeways.
Pavement management
SANRAL accords the highest priority to road maintenance in order to protect road assets and prevent deterioration. Maintenance includes routine tasks such as drain clearance, grass cutting and pothole filling, as well as periodic interventions, such as resealing and new overlays.
The effectiveness of the agency’s maintenance programme is measured against internationally used measurements:
• Road roughness, for which the desired standard is less than 4.2m/km.
• Rut depth, where standard is less than 20mm. Depressions deeper than this can hold water and cause vehicles to aquaplane.
• Macro-texture, where the desired texture is higher than 0.4mm. The coarseness of the road surface affects friction and safety at speeds exceeding 60km/h in wet conditions.
South Africa’s national roads scored very highly in 2017/18: between 97% and 99% of travel on these roads met the minimum requirement. The figures have been stable over the last three years showing consistency in road maintenance. In recent years, some provincial roads in sub-optimal condition have been added to the national network. SANRAL has made a concerted effort to improve the newly incorporated roads and this attention has ensured that overall performance has remained high.
See map on Pavement Condition on next page.
Percent of travel in 2017/18 on roads meeting international standards
Road roughness
97%
Rut depth
99%
Macro-texture
99%

THE SOUTH AFRICAN NATIONAL ROADS AGENCY SOC LIMITED
34
Pavement condition on national roads 2017/18
INTEGRATED REPORT 2018
35
Bridge management
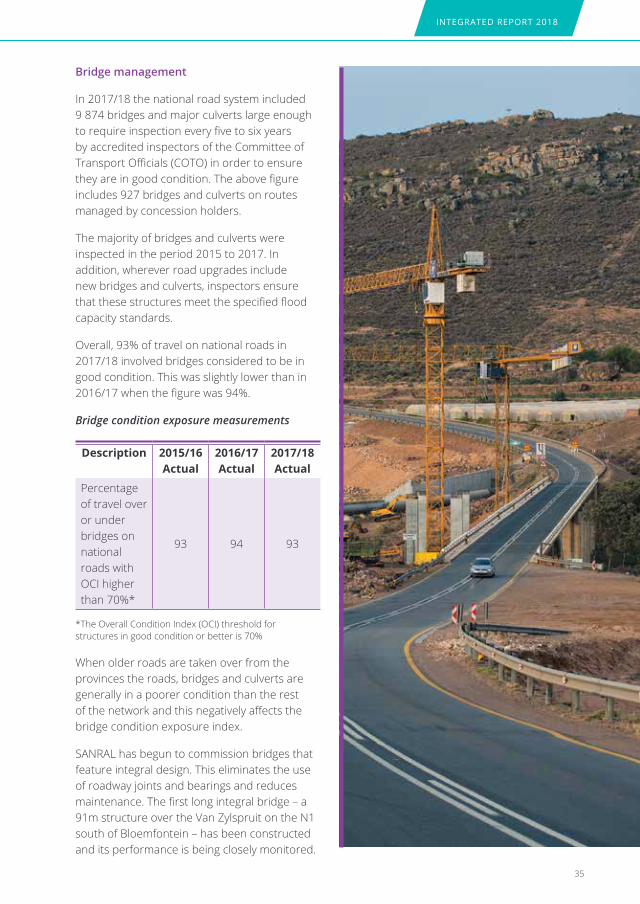
In 2017/18 the national road system included 9 874 bridges and major culverts large enough to require inspection every five to six years by accredited inspectors of the Committee of Transport Officials (COTO) in order to ensure they are in good condition. The above figure includes 927 bridges and culverts on routes managed by concession holders.
The majority of bridges and culverts were inspected in the period 2015 to 2017. In addition, wherever road upgrades include new bridges and culverts, inspectors ensure that these structures meet the specified flood capacity standards.
Overall, 93% of travel on national roads in 2017/18 involved bridges considered to be in good condition. This was slightly lower than in 2016/17 when the figure was 94%.
Bridge condition exposure measurements
Description 2015/16 Actual
2016/17 Actual
2017/18 Actual
Percentage of travel over or under bridges on national roads with OCI higher than 70%*
93 94 93
*The Overall Condition Index (OCI) threshold for structures in good condition or better is 70%
When older roads are taken over from the provinces the roads, bridges and culverts are generally in a poorer condition than the rest of the network and this negatively affects the bridge condition exposure index.
SANRAL has begun to commission bridges that feature integral design. This eliminates the use of roadway joints and bearings and reduces maintenance. The first long integral bridge – a 91m structure over the Van Zylspruit on the N1 south of Bloemfontein – has been constructed and its performance is being closely monitored.
THE SOUTH AFRICAN NATIONAL ROADS AGENCY SOC LIMITED
36
Slope management
SANRAL undertakes proactive management of unstable slopes in all regions.
In the Northern and Eastern Regions, personnel responsible for routine road maintenance (RRM) monitor the condition of slopes with the assistance of specialist service providers and action is instituted to mitigate risks where necessary. In the Southern and Western Regions, long-term contracts are in place for the management of high cut-and-fill slopes. These long-term contracts will be extended to the other regions in due course.
In the Western Region, 945 slopes have been assessed according to SANRAL’s slope management system, while in the Southern Region about 2 300, or 60% of the total number
in the region have been assessed. Overall, about 80% of roadside slopes assessed in the two regions were in fair to good condition, while about 20% are in need of attention. These are now being prioritised.
Detailed visual inspections of the concrete retaining structures in place on various slopes are to be assessed in the next phase. Ground anchors will also be inspected, stress tested and maintained during this phase.
RRM contractors are required to report regularly on slope-related incidents in their areas so that remedial measures can be taken. In the Southern Region eight serious incidents were reported by road maintenance teams during 2017/18 and assessed by the specialist contractor.
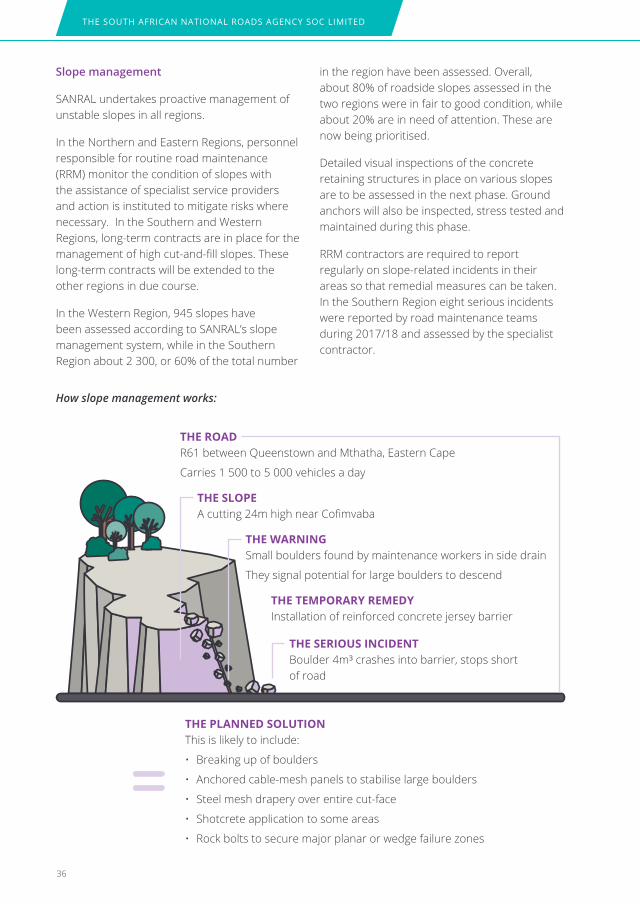
How slope management works:
ThE PLANNED SOLuTION This is likely to include:
• Breaking up of boulders
• Anchored cable-mesh panels to stabilise large boulders
• Steel mesh drapery over entire cut-face
• Shotcrete application to some areas
• Rock bolts to secure major planar or wedge failure zones
ThE ROAD R61 between Queenstown and Mthatha, Eastern Cape
Carries 1 500 to 5 000 vehicles a day
ThE SLOPE A cutting 24m high near Cofimvaba
ThE WARNING Small boulders found by maintenance workers in side drain
They signal potential for large boulders to descend
ThE TEMPORARY REMEDY Installation of reinforced concrete jersey barrier
ThE SERIOuS INCIDENT Boulder 4m³ crashes into barrier, stops short of road
INTEGRATED REPORT 2018
37
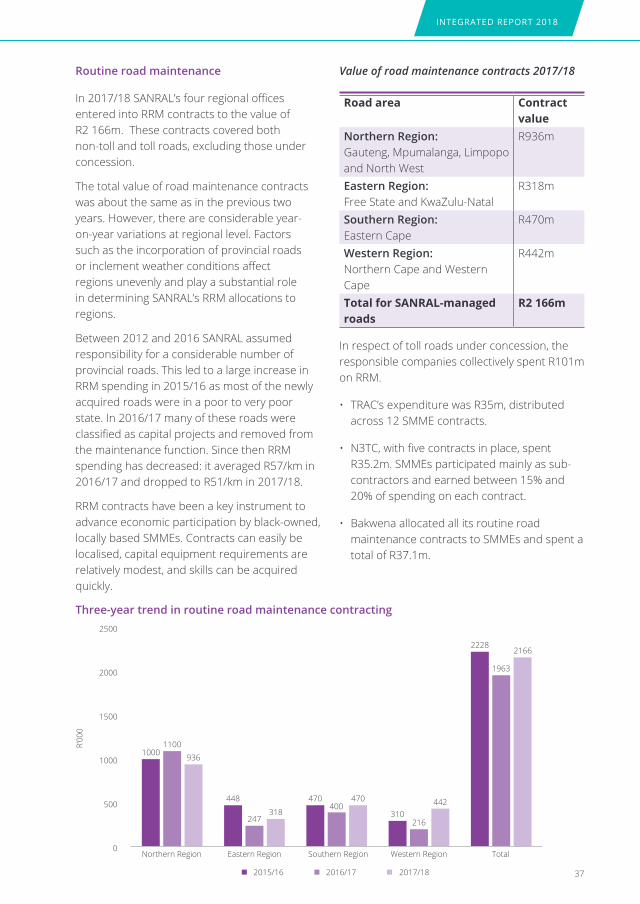
Routine road maintenance
In 2017/18 SANRAL’s four regional offices entered into RRM contracts to the value of R2 166m. These contracts covered both non-toll and toll roads, excluding those under concession.
The total value of road maintenance contracts was about the same as in the previous two years. However, there are considerable year-on-year variations at regional level. Factors such as the incorporation of provincial roads or inclement weather conditions affect regions unevenly and play a substantial role in determining SANRAL’s RRM allocations to regions.
Between 2012 and 2016 SANRAL assumed responsibility for a considerable number of provincial roads. This led to a large increase in RRM spending in 2015/16 as most of the newly acquired roads were in a poor to very poor state. In 2016/17 many of these roads were classified as capital projects and removed from the maintenance function. Since then RRM spending has decreased: it averaged R57/km in 2016/17 and dropped to R51/km in 2017/18.
RRM contracts have been a key instrument to advance economic participation by black-owned, locally based SMMEs. Contracts can easily be localised, capital equipment requirements are relatively modest, and skills can be acquired quickly.
Value of road maintenance contracts 2017/18
Road area Contract value
Northern Region: Gauteng, Mpumalanga, Limpopo and North West
R936m
Eastern Region: Free State and KwaZulu-Natal
R318m
Southern Region: Eastern Cape
R470m
Western Region: Northern Cape and Western Cape
R442m
Total for SANRAL-managed roads
R2 166m
In respect of toll roads under concession, the responsible companies collectively spent R101m on RRM.
• TRAC’s expenditure was R35m, distributed across 12 SMME contracts.
• N3TC, with five contracts in place, spent R35.2m. SMMEs participated mainly as sub-contractors and earned between 15% and 20% of spending on each contract.
• Bakwena allocated all its routine road maintenance contracts to SMMEs and spent a total of R37.1m.
Three-year trend in routine road maintenance contracting2500
2000
1500
1000
500
0Northern Region Eastern Region Southern Region Western Region
2015/16
1000
2228
1963
2166
1100
936
448
247318
470 470400
310216
442
2016/17 2017/18
Total
R’00
0
THE SOUTH AFRICAN NATIONAL ROADS AGENCY SOC LIMITED
Smart road systems
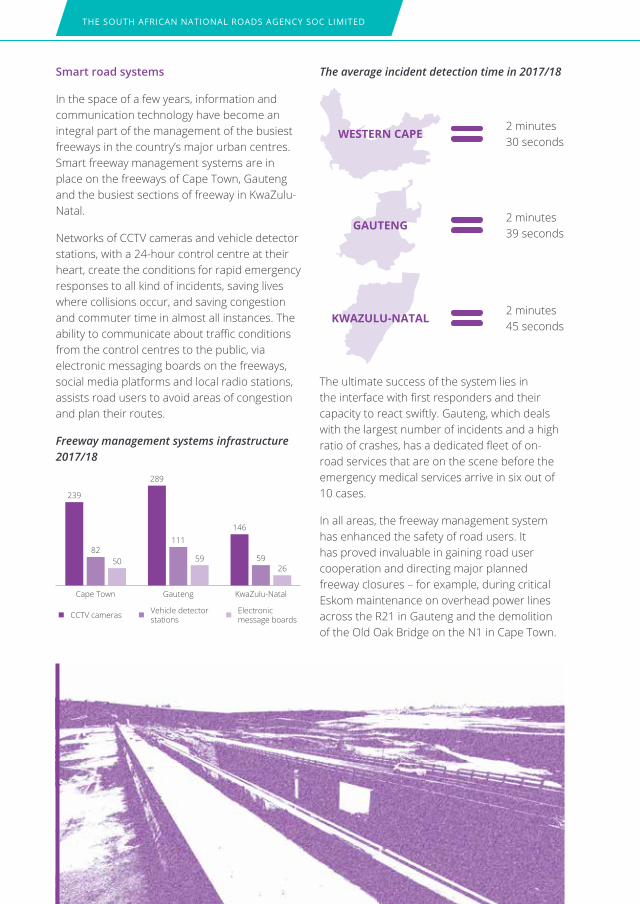
In the space of a few years, information and communication technology have become an integral part of the management of the busiest freeways in the country’s major urban centres. Smart freeway management systems are in place on the freeways of Cape Town, Gauteng and the busiest sections of freeway in KwaZulu-Natal.
Networks of CCTV cameras and vehicle detector stations, with a 24-hour control centre at their heart, create the conditions for rapid emergency responses to all kind of incidents, saving lives where collisions occur, and saving congestion and commuter time in almost all instances. The ability to communicate about traffic conditions from the control centres to the public, via electronic messaging boards on the freeways, social media platforms and local radio stations, assists road users to avoid areas of congestion and plan their routes.
Freeway management systems infrastructure 2017/18
Cape Town Gauteng KwaZulu-Natal
CCTV cameras Electronic message boards
Vehicle detector stations
239
8250
289
111
59
146
5926
The average incident detection time in 2017/18
WESTERN CAPE
GAuTENG
kWAZuLu-NATAL
2 minutes 30 seconds
2 minutes 39 seconds
2 minutes 45 seconds
The ultimate success of the system lies in the interface with first responders and their capacity to react swiftly. Gauteng, which deals with the largest number of incidents and a high ratio of crashes, has a dedicated fleet of on-road services that are on the scene before the emergency medical services arrive in six out of 10 cases.
In all areas, the freeway management system has enhanced the safety of road users. It has proved invaluable in gaining road user cooperation and directing major planned freeway closures – for example, during critical Eskom maintenance on overhead power lines across the R21 in Gauteng and the demolition of the Old Oak Bridge on the N1 in Cape Town.

INTEGRATED REPORT 2018
Freeway management systems: incidents and crashes 2017/18
Cape Town Gauteng KwaZulu-Natal
Incidents Crashes
21 000
30 000
10 000
3 2005 200
1 600
Freeway management systems also facilitate sophisticated analysis of traffic and incident data, enabling management teams to identify high risk areas and plan accordingly.
In all three metro areas:
• Software refinements are ongoing in order to improve the functionality of the system and increase access to information.
• There is continual improvement in the use of digital communication systems – websites, social media platforms and message boards on highways – to supply real-time information to road users.
In Cape Town, the addition of a mobile CCTV trailer and experimental use of a camera with panoramic surveillance capability have extended the system in a flexible way. For example, the mobile facility was used to monitor a crime hot spot and to ensure safety outside Parliament during the State of the Nation address in 2018.
Information and communication technology have also been deployed in automated toll fee administration and the development of an integrated system for this countrywide. The three concession holders on national toll routes have all cooperated to make this possible.
Combatting vehicle overloading
Overloading of heavy vehicles is a major problem on South African roads and takes a toll in terms of damage to roads and risks to road safety. SANRAL has set up weighbridges on national routes across the country and works with local law enforcement authorities to impose penalties for overloading.
In 2017/18 approximately 10.5m vehicles were screened using weigh-in-motion devices at weighbridges. A total of 1.78m vehicles that were possibly overloaded were directed for weighing on the static scale.
Vehicles weighed at SANRAL weighbridges and number overloaded
2015/16 2016/17 2017/18
1 782 281
391 272
893 608
214 818
1 731 664
390 310
Vehicles weighed Vehicles overloaded

THE SOUTH AFRICAN NATIONAL ROADS AGENCY SOC LIMITED
In recent years the number of vehicles weighed has almost doubled and the value of fines imposed increased from R19m in 2015/16 to R33m in 2017/18. However, the value of fines recovered relative to fines imposed has dropped below one in five Rands, while the rate of overloading remains high, at 22% of all vehicles statically weighed. The number of drivers charged in 2017/18 amounted to just 8% of the number of overloaded vehicles.
Traffic control centre data
Established trafficcontrol centres (12-month data)
Total- Including ER sites
Vehicles weighed
1 696 647 1 782 281
Vehicles overloaded
388 873 391 272
Drivers charged
28 324 30 623
Drivers arrested
1 001 1044
Fines issued R31 313 000 R 33 452 300
Fines paid R6 041 000 R 6 277 975
Value of fines issued at SANRAL weighbridges vs value of fines collected
Overloading measures by concession-holders
The three toll road concession holders all have facilities to weigh vehicles and relationships with relevant traffic authorities to impose sanctions where required. Data on overloading are collected and analysed. At Bakwena weighbridges fines to the value of R7.4m were imposed and R2.3m in fines was collected during the year.
Number of vehicles weighed and number overloaded
TRAC N3TC BakwenaTotal number of vehicles weighed
>844 300 185 579 364 405
Overloaded but within grace limit
- 46 168
Overloaded 8 707 5 674 6 928
Vehicle safety Inspections
SANRAL has eight vehicle inspection facilities at major weighbridges which tested 10 652 vehicles in 2017/18. Of these, 30% failed to meet road safety standards. Traffic police on site either issued fines to the drivers or removed the vehicles from the road.
2015/16 2016/17 2017/18
33,4
19
4,5
21,7
4,16,3
Value of fines issued (Rm) Value of fines collected (Rm)
40
35
30
25
20
15
10
5
0
Rm

INTEGRATED REPORT 2018
41
THE SOUTH AFRICAN NATIONAL ROADS AGENCY SOC LIMITED
42
Traffic monitoring
Traffic and weigh-in-motion (WIM) monitoring is undertaken with the purpose of measuring and analysing traffic and vehicle characteristics – such as numbers of vehicles, operating speeds and axle loads – in order to manage, plan and design road networks and infrastructure.
Automatic monitoring services may only be provided by service providers and system suppliers in possession of valid certificates.
Three traffic monitoring contracts were active during the 2017/18. There were 936 long-term traffic-monitoring stations in operation and 789 short-term traffic-monitoring counts were conducted.
1.3 Going forward: sector transformation
SANRAL has a proven track record for effective management of South Africa’s national roads. The agency’s contractual relationships with construction companies of the highest calibre have resulted in outstanding design and the innovative application of the best available technology in major road development projects.
SANRAL is proud of this reputation and confident it can be enhanced by taking a more assertive stance on economic transformation and the building of a more equitable and stable country.
The strengthening of the construction industry and the empowerment of black business and professionals within this industry are not opposing goals but compatible strengths. SANRAL’s task in the next few years is to build confidence and the social will within the
industry, among potential black investors, in the labour movement and civil society more broadly to advance economic transformation while upholding competence, creativity and responsibility.
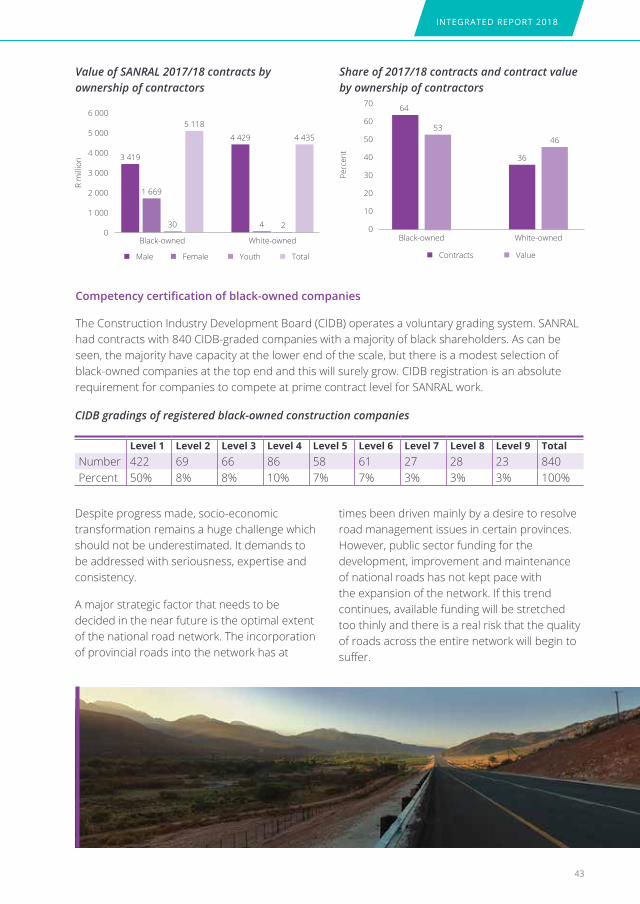
Already 64% of contracts – representing 53% of contract value – are being awarded to companies in which the majority of shares are owned by black people.
SANRAL’s Transformation Policy seeks to build on this substantial foundation. It should be noted that the empowerment of black entrepreneurs has allowed black women to rise within this sector. Black women held 38% of all contracts with black-owned companies. This is in sharp contrast to the virtual absence of women among the white owners of construction companies.
TRANSFORMATION POLICY
OF THE SOUTH AFRICAN NATIONAL ROADS AGENCY SOC LIMITED
INTEGRATED REPORT 2018
43
Share of 2017/18 contracts and contract value by ownership of contractors
6 000
5 000
4 000
3 000
2 000
1 000
0
R m
illio
n
Black-owned White-owned
3 419
1 669
30
5 118
4 2
4 429 4 435
Male Female Youth Total
70
60
50
40
30
20
10
0
Perc
ent
Black-owned White-owned
64
53
36
46
Contracts Value
Competency certification of black-owned companies
The Construction Industry Development Board (CIDB) operates a voluntary grading system. SANRAL had contracts with 840 CIDB-graded companies with a majority of black shareholders. As can be seen, the majority have capacity at the lower end of the scale, but there is a modest selection of black-owned companies at the top end and this will surely grow. CIDB registration is an absolute requirement for companies to compete at prime contract level for SANRAL work.
Despite progress made, socio-economic transformation remains a huge challenge which should not be underestimated. It demands to be addressed with seriousness, expertise and consistency.
A major strategic factor that needs to be decided in the near future is the optimal extent of the national road network. The incorporation of provincial roads into the network has at
times been driven mainly by a desire to resolve road management issues in certain provinces. However, public sector funding for the development, improvement and maintenance of national roads has not kept pace with the expansion of the network. If this trend continues, available funding will be stretched too thinly and there is a real risk that the quality of roads across the entire network will begin to suffer.
CIDB gradings of registered black-owned construction companies
Level 1 Level 2 Level 3 Level 4 Level 5 Level 6 Level 7 Level 8 Level 9 TotalNumber 422 69 66 86 58 61 27 28 23 840Percent 50% 8% 8% 10% 7% 7% 3% 3% 3% 100%
Value of SANRAL 2017/18 contracts by ownership of contractors

THE SOUTH AFRICAN NATIONAL ROADS AGENCY SOC LIMITED
44
The N2 Wild Coast Road is a project of many parts. But fundamentally it is about economic and social redress for a region that was arguably apartheid’s most neglected backwater. Still isolated and deeply impoverished, this part of the Eastern Cape cannot dream of a brighter future without physical connection to the economic and social mainstream.
This is precisely what the N2 Wild Coast Road will offer.
The project involves the construction and upgrading of 410km of road between East London and Port Edward. There are long stretches of brownfields work, involving the upgrading of the R61. This has been under way for several years.
Then there is the greenfields stretch, 96km of new highway passing through largely undeveloped countryside from Ndwalane to Lusikisiki and onward, almost to Port Edward.
The landscape is postcard perfect: endless green hills and deep river gorges. The construction challenges of this scenic beauty can by gauged from the need for seven major bridges and two mega-bridges on the greenfields section alone.
Work on one of the mega-bridges, over the Mtentu River near Lusikisiki, began in January 2018. When it is completed – in about three years’ time – this main-span cantilever structure will be the highest bridge in Africa, rising 220m above the river and extending for 1.1km.
The bridge construction contract was award to the Aveng Strabag Joint Venture, which
harnesses a combination of European and South African expertise. The contractor has earmarked R100m for SMME contractors and suppliers, and R30m for wages for local workers.
In all, the greenfields component is expected to contribute R2.7bn to SMMEs and R400m in wages for unskilled and semi-skilled workers. This is a powerful economic injection into a remote rural region where people depend largely on social grants and the salaries of migrant workers.
But development comes at a price and road construction is rarely confined to stone and asphalt. In preparation for the mega-bridge projects, SANRAL has dealt with a range of sensitive issues – from the relocation of graves and homes to a search and rescue operation involving the relocation of 30 000 plants.
The fact that residents have accepted the give-and-take of development speaks partly to SANRAL’s investment of effort in community relations, but also to local people’s grasp of the bitter price of isolation.
When the N2 Wild Coast Road is complete, travel time between East London and Durban will be reduced by three hours. The Wild Coast may begin to realise its massive tourism potential. A string of rural towns and villages will be linked to each other and to cities. The perils of travel on inferior roads will be eliminated and hospitals, high schools, colleges and commercial centres will at once be within reach.
N2 Wild Coast
Road out of isolation

INTEGRATED REPORT 2018
45
THE SOUTH AFRICAN NATIONAL ROADS AGENCY SOC LIMITED
46
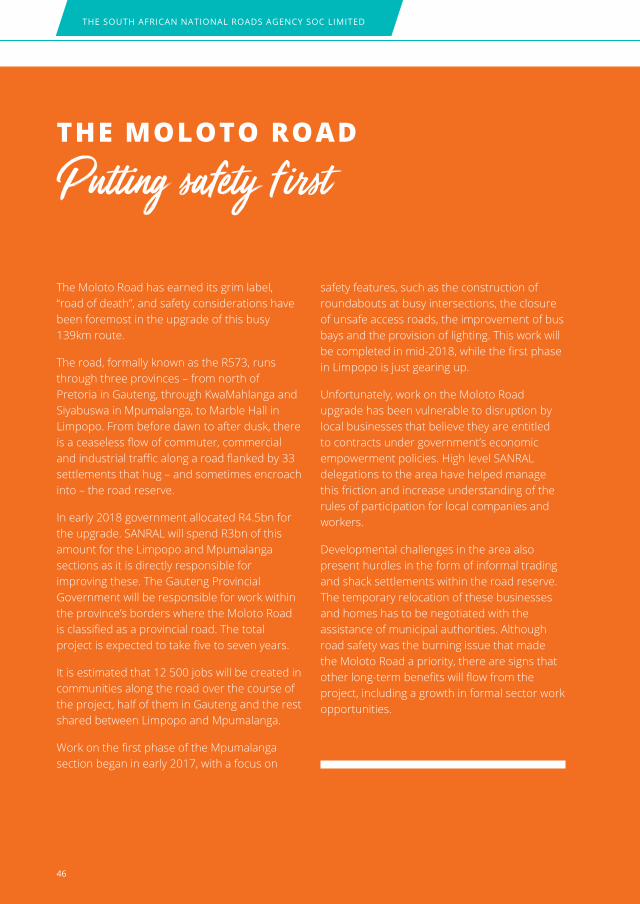
the Moloto Road
The Moloto Road has earned its grim label, “road of death”, and safety considerations have been foremost in the upgrade of this busy 139km route.
The road, formally known as the R573, runs through three provinces – from north of Pretoria in Gauteng, through KwaMahlanga and Siyabuswa in Mpumalanga, to Marble Hall in Limpopo. From before dawn to after dusk, there is a ceaseless flow of commuter, commercial and industrial traffic along a road flanked by 33 settlements that hug – and sometimes encroach into – the road reserve.
In early 2018 government allocated R4.5bn for the upgrade. SANRAL will spend R3bn of this amount for the Limpopo and Mpumalanga sections as it is directly responsible for improving these. The Gauteng Provincial Government will be responsible for work within the province’s borders where the Moloto Road is classified as a provincial road. The total project is expected to take five to seven years.
It is estimated that 12 500 jobs will be created in communities along the road over the course of the project, half of them in Gauteng and the rest shared between Limpopo and Mpumalanga.
Work on the first phase of the Mpumalanga section began in early 2017, with a focus on
safety features, such as the construction of roundabouts at busy intersections, the closure of unsafe access roads, the improvement of bus bays and the provision of lighting. This work will be completed in mid-2018, while the first phase in Limpopo is just gearing up.
Unfortunately, work on the Moloto Road upgrade has been vulnerable to disruption by local businesses that believe they are entitled to contracts under government’s economic empowerment policies. High level SANRAL delegations to the area have helped manage this friction and increase understanding of the rules of participation for local companies and workers.
Developmental challenges in the area also present hurdles in the form of informal trading and shack settlements within the road reserve. The temporary relocation of these businesses and homes has to be negotiated with the assistance of municipal authorities. Although road safety was the burning issue that made the Moloto Road a priority, there are signs that other long-term benefits will flow from the project, including a growth in formal sector work opportunities.
INTEGRATED REPORT 2018

THE SOUTH AFRICAN NATIONAL ROADS AGENCY SOC LIMITED
48
In March 2018, the ramps to the Mt Edgecombe Interchange in eThekwini opened and vehicles flowed freely over the magnificent set of bridges created to ease the traffic congestion caused by urban development in the north of the metropolis.
The interchange links the N2 and M41, connecting residents of Phoenix and uMhlanga with the city of Durban and the North Coast of KwaZulu-Natal. About 40 000 vehicles a day join or leave the N2 at this point and traffic used to back up a long distance up the M41.
The construction of the interchange was funded jointly by SANRAL and the KwaZulu-Natal Department of Transport and the work was undertaken by the South African branch of the Italian construction company, CMC di Ravenna.
The design features four levels of roadway and facilitates the free flow of traffic in all directions.
Two incrementally launched bridges – constructed simultaneously in sections from both ends – contribute to the elegance of the solution. The longer bridge, 948m in length and supported by 23 piers, is the longest incrementally launched bridge in South Africa.
In August 2017, the north and south decks of this bridge were “stitched” together by the in
situ casting of the final bit. Motorists simply went on their way oblivious to the moment of triumph being marked far above their heads.
Corné Roux, Project Manager for SANRAL Eastern Region, remarked: “Constructing one of the longest structures in South Africa over one of the busiest intersections in KwaZulu-Natal without closing any of the roads permanently, bears testimony to the success of the construction methods and materials.”
A pedestrian bridge has been constructed close to the interchange to ensure safe crossing of the N2 and connects to footpaths on either side.
The five-year project will be completed by June 2018 at a cost just under R900m.
At the height of activity, more than 800 individuals were at work on site. A total of 461 workers on the project – mostly young people – received training in skills such as steel-fixing, erection of scaffolding and the operation of construction tools. Despite the sophistication of the project, there was room for 21 SMMEs to participate and earn R59m.
This imposing interchange with its daring design has finally been brought to fruition by hundreds of humble workers.
Mt edgeCoMbe iNteRChaNge
Engineering wizardry in motion

INTEGRATED REPORT 2018
49

THE SOUTH AFRICAN NATIONAL ROADS AGENCY SOC LIMITED
Cape-to-NaMibia highWay
The N7 along the West Coast is steadily being upgraded and presently SANRAL is focused on a busy 40km stretch relatively close to Cape Town.
Eventually the improved N7 will support trade with Namibia while benefiting the fruit farmers of Citrusdal and Piketberg, seasonal tourists drunk on Namaqua flower power, and workers commuting daily into Cape Town.
The current R2.37bn upgrade extends roughly from Melkbosstrand to Hopefield and consists mainly of doubling the capacity of the road by creating a dual carriageway. Inevitably, this also involves the construction of wider bridges and improvement of multiple intersections to ensure safety under changed traffic conditions. Better management of pedestrian traffic around towns has been a major consideration.
The project has provided work for 600 local residents and business opportunities worth R297m for SMMEs in the area.
A feature of this initiative is the youth learnership programme that started in and
around Malmesbury with an investment of R1.4m by SANRAL’s construction partners, Aecom, Stefanutti Stocks and Power Construction. This enabled 22 learners to complete NQF level 3 and 4 certificates in various construction disciplines. A special certification ceremony was held in Malmesbury Town Hall in November 2017.
The learnership initiative is being replicated by other contractors on the N7 upgrade and another 30 learners are expected to qualify.
The last phase of the current project is scheduled to be completed only in January 2020. But already the design phase has begun for further N7 upgrades, from Hopefield as far as the Piekenierskloof Pass. This will complete the N7 makeover because beyond the pass the road to Clanwilliam and onward to the Vioolsdrift border post has already been improved and is adequate for the traffic it carries.
Doubling up for tourism and trade

INTEGRATED REPORT 2018

THE SOUTH AFRICAN NATIONAL ROADS AGENCY SOC LIMITED
52
As a state-owned company incorporated under the Companies Act and a national public entity in terms of the PFMA, SANRAL’s financial management must meet the requirements of both statutes. Details of the agency’s finances and governance appear in Volume 2 of this report. The following summary serves to indicate how SANRAL’s management of funding capital complements other aspects of its value creation.
SANRAL has two distinct areas of business, the operation of toll roads and the operation of non-toll roads, which are funded in different ways.
• An annual grant from the national fiscus, under Budget Vote 35, funds the development, upgrading, repair and maintenance of national roads that are not subject to tolling. These comprise 87% of the national road network.
• Toll levies and borrowings on commercial markets are the main sources of finance for the development, upgrading, repair, maintenance and operation of national toll roads directly under SANRAL’s management, which constitute some 7% of the national road network.
SANRAL’s toll roads comprise the following:
• Sections of the N1 in the Western Cape, Free State, Gauteng and Limpopo north of Bela Bela.
• A section of the R31 near Brandfort in the Free State.
• Several sections of the N2 in the Eastern Cape and KwaZulu-Natal, including near King Shaka Airport.
• A short stretch of the N4 just west of Pretoria.
• The N17 from Gauteng through to Ermelo in Mpumalanga.
2 Funding Capital• The Gauteng freeway system (N1/N3 and
R21).
In addition, there are toll roads – comprising the remaining 6% of the national road network – for which 30-year concessions have been granted to private companies. These companies, TRAC, N3TC and Bakwena, have concluded public-private partnerships with SANRAL for the construction, maintenance and operation of the relevant routes.
Under these arrangements, the concession holders are responsible for raising capital for road construction, servicing this debt and funding all upgrades, rehabilitation and maintenance as well as operational costs. Toll revenue on these routes accrues to the concession holders. At the end of the concession period the roads are to be transferred back to SANRAL and must comply with specified standards at the time of transfer.
2.1 Annual income
In 2017/18, SANRAL recorded total revenue of R16.285bn (2016/17: R13.95bn). An annual grant from the fiscus of R15.9bn was received. Of this grant:
• An amount of R463m (VAT incl) was earmarked for the Gauteng Freeway Improvement Project (GFIP), to off-set the loss of income resulting from lower toll fees under the dispensation announced by government in 2015.
• A further R1 900m (VAT incl) was also transferred to toll operations.
• The balance was allocated to non-toll roads and R6.3bn of this was apportioned to capital projects. At the end of the financial year, R2.9bn of the capital budget was unspent but committed to multiyear projects.
SANRAL recorded income amounting to R5 194bn from toll fees in 2017/18.

INTEGRATED REPORT 2018
Revenue for non-toll operations is invested until required and this yielded income of R1.07bn in 2017/18. Other income is derived from rental on investment property, sundry and toll road concessions.
Sources of SANRAL income 2017/18
2.2 Grant income trends
The annual grant made by National Treasury to SANRAL in respect of capital and operational expenditure on non-toll national roads amounted to R15 481m in 2017/18. This grant has increased steadily at a rate above inflation since SANRAL’s inception.
GFIP is the only SANRAL toll route that receives a government grant. This grant is intended to offset the discounts on tariffs which were instituted in response to public opposition
Government grant
Toll income
GFIP subsidy
Investments
Other
49%
6%6%
11%
28%
2015/16 2016/17 2017/18
18 000
16 000
14 000
12 000
10 000
8 000
6 000
4 000
2 000
0
R’00
0
Govt grant GFIP subsidy
264
12 542
373
13 490
406
15 481
Note: All grants are net of VAT. In 2017/18 an amount of R1 667m (in addition to the GFIP subsidy) was transferred from the general grant of R15 481m to the toll road portfolio.
to tolling on Gauteng freeways. The amount has increased each year since the grant was instituted in 2015/16.
The Minister of Transport, representing SANRAL’s sole shareholder, also approved a transfer of R1 667m (net of VAT) to the GFIP account from the non-toll government grant in order to reduce the expected shortfall on this project. This is the first time such a transfer from non-toll to toll operations has occurred.
Growth in government grants to SANRAL 2015/16 to 2017/18
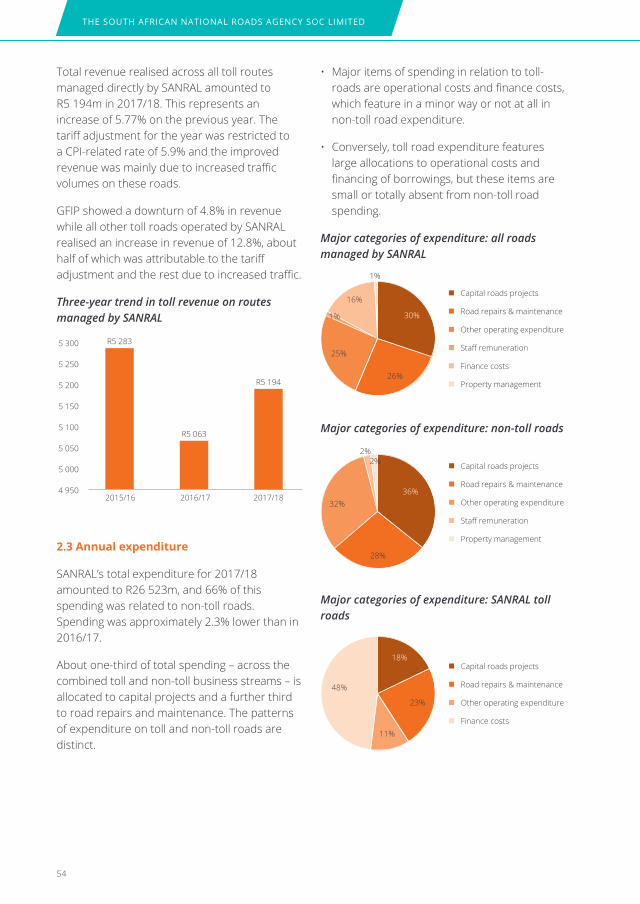
THE SOUTH AFRICAN NATIONAL ROADS AGENCY SOC LIMITED
54
Total revenue realised across all toll routes managed directly by SANRAL amounted to R5 194m in 2017/18. This represents an increase of 5.77% on the previous year. The tariff adjustment for the year was restricted to a CPI-related rate of 5.9% and the improved revenue was mainly due to increased traffic volumes on these roads.
GFIP showed a downturn of 4.8% in revenue while all other toll roads operated by SANRAL realised an increase in revenue of 12.8%, about half of which was attributable to the tariff adjustment and the rest due to increased traffic.
Three-year trend in toll revenue on routes managed by SANRAL
2015/16 2016/17 2017/18
5 300
5 250
5 200
5 150
5 100
5 050
5 000
4 950
R5 283
R5 063
R5 194
2.3 Annual expenditure
SANRAL’s total expenditure for 2017/18 amounted to R26 523m, and 66% of this spending was related to non-toll roads. Spending was approximately 2.3% lower than in 2016/17.
About one-third of total spending – across the combined toll and non-toll business streams – is allocated to capital projects and a further third to road repairs and maintenance. The patterns of expenditure on toll and non-toll roads are distinct.
• Major items of spending in relation to toll-roads are operational costs and finance costs, which feature in a minor way or not at all in non-toll road expenditure.
• Conversely, toll road expenditure features large allocations to operational costs and financing of borrowings, but these items are small or totally absent from non-toll road spending.
Major categories of expenditure: all roads managed by SANRAL
Capital roads projects
Other operating expenditure
Road repairs & maintenance
Staff remuneration
Finance costs
Property management
30%1%
1%
26%
25%
16%
Capital roads projects
Other operating expenditure
Road repairs & maintenance
Staff remuneration
Property management
36%32%
2%
28%
2%
Major categories of expenditure: non-toll roads
18%
23%
11%
48%
Major categories of expenditure: SANRAL toll roads
Capital roads projects
Other operating expenditure
Road repairs & maintenance
Finance costs
INTEGRATED REPORT 2018
55
2.4Profit/lossbeforetaxation
In 2017/18, SANRAL recorded a loss of R260m after the deduction of finance costs and before taxation. This was lower than the losses of R4 962m recorded in 2017/18 and R954.2m in 2015/16.
There was an operating deficit of R801m in respect of non-toll functions in 2017/18, compared to a deficit of R380m in the previous year and a surplus of R0.2m in 2015/16. This deficit was partly due to the transfer of funds from the non-toll business to toll.
Due to the improved revenue flow for toll roads, the cost of operating these roads were lower than revenue and the net profit (after deduction of finance costs) for the 2017/18 year was R541m. This was higher than the loss incurred in 2016/17 (R4 582m), largely due to the transfer from the non-toll business and exceeded the 2015/16 deficit of R1 125m.
Three-year profit/loss before taxation
Year Non-toll operations Toll operations Total
2015/16 +R0.2m -R1 125m -R954m
2016/17 -R380m -R4 582m -R4 962m
2017/18 -R801m +R541m -R260m
THE SOUTH AFRICAN NATIONAL ROADS AGENCY SOC LIMITED
56
2.5 Toll roads under concession
The toll roads under concession and the companies responsible are as follows:
• TRAC manages the N4 eastward to Maputo for the period 1997 - 2028.
• N3TC holds the concession for the N3 between Cedara in KwaZulu-Natal and Heidelberg in Gauteng for the period 1999 - 2029.
• Bakwena manages two routes: the N1 between Pretoria and Bela Bela in Limpopo and the N4 going west from Pretoria to the Botswana border and this concession is for the period 2001 - 2031.
All three companies are non-listed entities purpose-built for toll road management. Their shareholders are various, but all three include the Public Investment Corporation (PIC) which is responsible for investing the Unemployment Insurance Fund and the Government Employees Pension Fund.
Initial capital for construction of the toll roads under concession was raised by the relevant companies by shareholder contributions and borrowings on capital markets. The servicing of this debt is entirely the responsibility of the concession holders.
Revenue
The combined toll revenue of TRAC, N3TC and Bakwena during 2017/18 was R4 694m.
The companies retain this revenue.
Road infrastructure expenditure
The total expenditure of the three companies on capital road improvement projects in 2017/18 amounted to R1 566m and spending on road maintenance was R101m.
The second figure does not include the considerable operational costs of the toll system – the personnel, technology and infrastructure required to administer the collection of tariffs.
All three concession companies realised profit after tax on their annual operations in 2017/18.
Property portfolio management
Over the years, SANRAL has acquired a property portfolio in order to meet its mandate of building and improving roads. In the processes of acquiring land for road development it is inevitable that portions of some properties are left without access or rendered useless to their owners. In such cases, SANRAL also buys these portions and therefore has both road reserves and surplus land in its portfolio.
A total of 383 were leased in 2018/19 and realised income of R21m during the year. Rentals in arrears for 90 days or more amounted to R826 696.
Properties include SANRALS head office and its regional offices. Some of these have been recently constructed according to green building specifications and it is estimated that this has achieved savings of 40% on operating costs of the relevant building.
While road reserves are maintained by means of routine road maintenance contracts, the surplus land is managed by a specialised service provider who provides surveying, valuing and general property management services and maintains all SANRAL’s offices. This contract was concluded in 2015 for an initial period of five years and has a value of R943.4m.
The contract requires the service provider to sub-contract at least 50% of its work in order to provide opportunities to black-owned SMMEs and smaller companies in the property sector. Despite keen competition for the services of black land surveyors and valuers, this target has been exceeded.
The SANRAL Act requires the agency to acquire property by agreement, where possible, but in exceptional cases the agency may request the Minister to expropriate property in terms of the Expropriation Act No 63 of 1975, which determines compensation.
INTEGRATED REPORT 2018
57
SANRAL’s predecessors were not bound to take transfer of property that they acquired for purposes of road development and the agency has made a considerable effort to identify this land and transfer it to SANRAL. This entails tracing the land owners and requesting them to sign documents to create a legal foundation for the transfer. Where property owners have refused to cooperate, the Minister has been asked to expropriate.

THE SOUTH AFRICAN NATIONAL ROADS AGENCY SOC LIMITED
58
The design and engineering of roads and the management of road systems are dynamic fields with great opportunity for innovation. The scope and ambition of SANRAL’s major projects present opportunities for the best professionals in the industry to produce creative and technologically advanced engineering solutions.
The agency takes pride, for example, in having commissioned the design of the longest and highest – and perhaps the loveliest – bridges in Africa. In 2017, the tender for the construction of the first of these bridges on the N2 Wild Coast Route was, in effect, a search for the highest order of engineering and construction expertise.
SANRAL has also developed in-house capacity for innovation in the application of smart technology to road management and the pioneering of geotechnical solutions to road engineering challenges.
3.1 Innovative design and research
SANRAL commissioned the construction of a major integral design bridge at Van Zylspruit in the Free State. The design, which eliminates the installation of metal expansion joints and bearings, has the potential to extend the life of the bridge.
The big question is: how well will the bridge hold up in South Africa’s dry climate with wide daily temperature fluctuations? SANRAL decided to answer the question proactively by partnering with researchers from the University of Pretoria to monitor the performance of the bridge.
The research team has installed a battery of instruments on the bridge, including strain gauges to measure stress on the deck, temperature sensors, tilt meters and earth pressure sensors. Readings are constantly reported via the internet and analysed by the research team. The study will inform decisions on the wider use of integral design in South Africa.
3 Intellectual CapitalThe project has received a Fulton Award for Innovation in Concrete from the Concrete Society of Southern Africa.
3.2 Automated electronic toll payment
A national transaction clearing house for toll payments was developed as part of the Gauteng electronic toll collection system. It was the foundation of interoperability for electronic toll transactions across all toll plazas on national roads.
For the road user, this means that a single toll fee account and one tag fitted to a vehicle opens up cashless travel through all toll plazas across the country.
During 2017/18 the linkage of the last toll plazas was completed and the value of electronic toll transactions at “conventional” toll plazas rose 42%, from R1 430m in 2016/17 to R2 040m in 2017/18. The market share of electronic toll transactions at conventional toll plazas has reached almost 19%. The adoption of the electronic payment option by many road users has reduced congestion at toll plazas during busy periods.
3.3 Technical Innovation hub
SANRAL’s Technical Innovation Hub in Cape Town is powered by mechatronic and electrical engineering graduates who qualified with the assistance of SANRAL bursaries and are currently registered as candidate engineers with the Engineering Council of South Africa.
The central purpose of the hub is to produce smart solutions to challenges in areas such as road safety, asset preservation, and environmental and energy conservation. The following are examples of its early work:
• A pilot study on the use of a drone to inspect the state of rockfall catch fences in Sir Lowry’s Pass, Western Cape. This is a new twist on the use of drones in inspecting bridges and slopes. It yielded images of high quality that

INTEGRATED REPORT 2018
enabled geotechnical experts to conduct a visual inspection. The use of drones not only fast-tracks the inspection of steep slopes and inaccessible cuts, but also reduces safety risks by eliminating the need for abseiling into these areas.
• The development of a robotic flagger for roadworks on hazardous high-volume routes. This device, which would reduce the safety risk to road flaggers, is currently being tested. Its usefulness in the dark has already been established and its use over extended periods is being investigated.
• The development of a panoramic camera system – in reality a device utilising multiple cameras – to eliminate “blind spots” in freeway incident detection systems. The device uses image-stitching software to create a coherent panoramic image and initial tests in the Western Cape have been promising.
3.4 Geotechnical solutions
Nanotechnology stabilisation of materials
SANRAL technical experts have developed a theoretical solution to stabilising inherently unstable road building materials by the application of nanotechnology-based resins normally used in industrial processes.
If the theoretical approach is sound, a wide range of lower grade and marginal stone materials could be stabilised and successfully used. This would make road-building more affordable and reduce its environmental impact by making it easier to source materials close to the construction site. The agency intends to test the solution when a suitably situated construction project of modest size comes on stream.
Rehabilitation approach for new contractors
A technique has been developed that will enable new contractors to undertake the reinforcement of pavement in climbing lanes on mountain passes. The approach was successfully demonstrated during a SANRAL project in the Abel Erasmus Pass in Limpopo. It is based on the extensive experience of construction company Roux, Hatting and Van Zyl and overcomes skills and equipment constraints which often put geotechnical rehabilitation projects beyond the reach of emerging contractors. This concept emerged from innovative work done in conjunction with Teichmann and Terra Strata. A new product developed by Tosas would be ideal for use in future projects.

THE SOUTH AFRICAN NATIONAL ROADS AGENCY SOC LIMITED
60
SANRAL takes seriously its potential to help alleviate the major social and economic challenges of our country: widespread poverty, high unemployment and extreme inequality. It does so principally by incorporating strong social transformation principles into the conduct of its core business.
The terms of all the agency’s contracts are such that SMMEs – and particularly black-owned SMMEs – are prioritised for sub-contracts in all construction projects and road maintenance work. In addition, there is an attempt to promote local sourcing of services and the participation of women and youth, not only through sub-contracting but through employment on these projects and associated training.
Further avenues for creating social value are:
• SANRAL’s community development projects, which enhance road infrastructure in communities close to but generally off the national road network.
• Its road safety programme, which combines the engineering of safer roads with road safety education and interventions to improve the response to road incidents.
• The contribution it makes to universities in terms of their training of engineers and road transport professionals, the research they undertake and their projects to improve performance in maths and science at school level.
Toll road concession companies are all contractually obliged to undertake social programmes and they fulfil this responsibility in different ways, according to local needs and their corporate culture.
4.1 Empowerment, job creation and skills building
Contracting SMMEs
SANRAL provided 1 886 opportunities for SMMEs to participate in road construction,
4 Social and Relationship Capitalrehabilitation and maintenance projects during 2017/18 and the total amount earned through these contracts was R3 087m. Black-owned SMMEs derived the greatest benefit, accounting for 59% of contracts awarded and 77% of the value of work performed. SMMEs described as “non-compliant” accounted to 29% of tenders.
Percentage share of SMME contracts and value of work 2017/18
Note: Non-compliant SMMEs are companies whose certificates expired during the contract period
The number of contracts awarded to SMMEs dipped in 2016/17 and only slightly recovered in this reporting year. The total value of SMME tenders has declined substantially. Unforeseen tender management challenges experienced during 2017/18 in the awarding of principal contracts would also have constrained SMME sub-contracting.
2 500
2 000
1 500
1 000
500
0
100908070605040302010
0
Perc
ent
Black-owned White-owned Non-compliant
59
77
12 14
29
9
Contracts Value
Three-year trend in SMME contracts awarded
2015/16 2016/17 2017/18
Black White Non-compliant Total
1 0041 051
2 055
0
1 045
788
0
1 833
540
234
1 112
1 886
Note: Non-compliant SMMEs are companies whose certificates expired during the contract period

INTEGRATED REPORT 2018
61
Note: Non-compliant SMMEs are companies whose certificates expired during the contract period
Creating employment
The contracting of SANRAL projects resulted in the creation of 36 678 work opportunities in 2017/18. Many of these opportunities arose from limited-term projects and were temporary in nature. They translated to the equivalent of 15 299 full-time jobs (FTEs).
• One in four work opportunities was taken up by a woman.
• Young men and women under the age of 35 years filled 57% of positions.
Share of 2017/18 work opportunities by age and gender
However, contracts awarded to black-owned SMMEs have increased, both in absolute numbers and percentage terms. Similar trends are apparent in relation to the value of work undertaken by black-owned SMMEs. These figures indicate the successful implementation of prevailing empowerment polices in SANRAL.
Three-year trend in value of work performed by SMMEs
Fluctuations in work opportunities have been smaller than those related to the FTE index. This suggests that the length of work opportunities has been quite variable. The ratio of work opportunities for woman workers has increased somewhat in three years, from 20% to 24% while the youth component has dropped slightly from 59% to 57%.
Training of workers
Contracts opened up training opportunities for 3 421 workers in 2017/18 and the total number of courses undertaken was 6 237. The downward trend in work opportunities is reflected in the decrease in the volume of training compared to 2016/17.
Three-year trend in training provided on SANRAL projects
4 500
4 000
3 500
3 000
2 500
2 000
1 500
1 000
500
0
R m
illio
n
2015/16 2016/17 2017/18
2 1091 887
4 033
0
1 9601 605
3 565
0
2 383
3087
273 431
Male 18-35 years
Female 18-35 years
Male >35 years
Female >35 years
41%
9%
35%
15%
Three-year trend in work opportunities on SANRAL projects
2015/16 2016/17 2017/18
Work opportunities Full time equivalent
37 913
15 721
39 809
19 047
36 678
15 299
2015/16 2016/17 2017/18
Trainees Courses
3 421 3 421
6 748
4 257
8 604
6 237
Black White Non-compliant Total
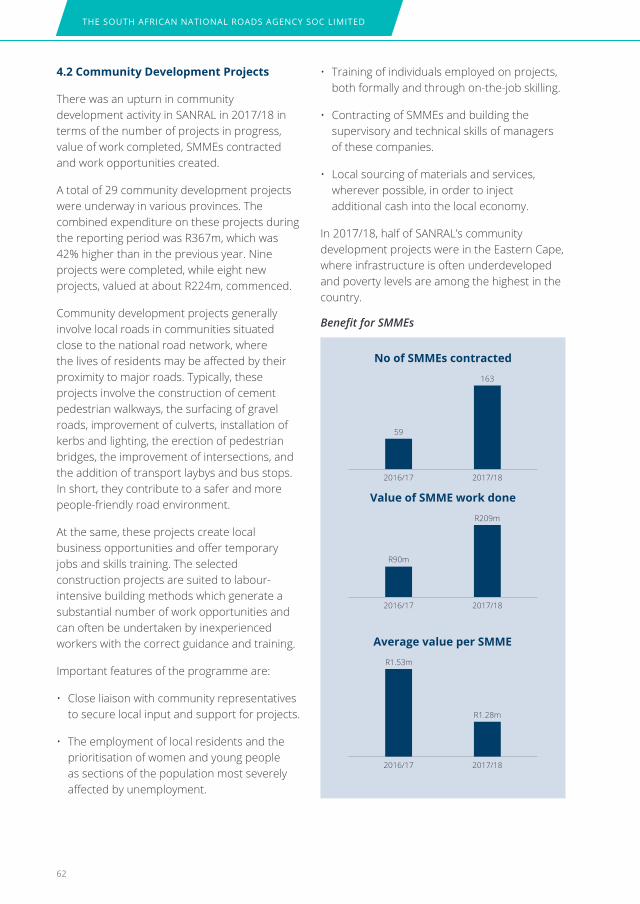
THE SOUTH AFRICAN NATIONAL ROADS AGENCY SOC LIMITED
62
4.2 Community Development Projects
There was an upturn in community development activity in SANRAL in 2017/18 in terms of the number of projects in progress, value of work completed, SMMEs contracted and work opportunities created.
A total of 29 community development projects were underway in various provinces. The combined expenditure on these projects during the reporting period was R367m, which was 42% higher than in the previous year. Nine projects were completed, while eight new projects, valued at about R224m, commenced.
Community development projects generally involve local roads in communities situated close to the national road network, where the lives of residents may be affected by their proximity to major roads. Typically, these projects involve the construction of cement pedestrian walkways, the surfacing of gravel roads, improvement of culverts, installation of kerbs and lighting, the erection of pedestrian bridges, the improvement of intersections, and the addition of transport laybys and bus stops. In short, they contribute to a safer and more people-friendly road environment.
At the same, these projects create local business opportunities and offer temporary jobs and skills training. The selected construction projects are suited to labour-intensive building methods which generate a substantial number of work opportunities and can often be undertaken by inexperienced workers with the correct guidance and training.
Important features of the programme are:
• Close liaison with community representatives to secure local input and support for projects.
• The employment of local residents and the prioritisation of women and young people as sections of the population most severely affected by unemployment.
• Training of individuals employed on projects, both formally and through on-the-job skilling.
• Contracting of SMMEs and building the supervisory and technical skills of managers of these companies.
• Local sourcing of materials and services, wherever possible, in order to inject additional cash into the local economy.
In 2017/18, half of SANRAL’s community development projects were in the Eastern Cape, where infrastructure is often underdeveloped and poverty levels are among the highest in the country.
2016/17
59
2017/18
163
No of SMMEs contracted
2016/17
R90m
2017/18
R209m
Value of SMME work done
2016/17
R1.53m
R1.28m
2017/18
Average value per SMME
Benefit for SMMEs
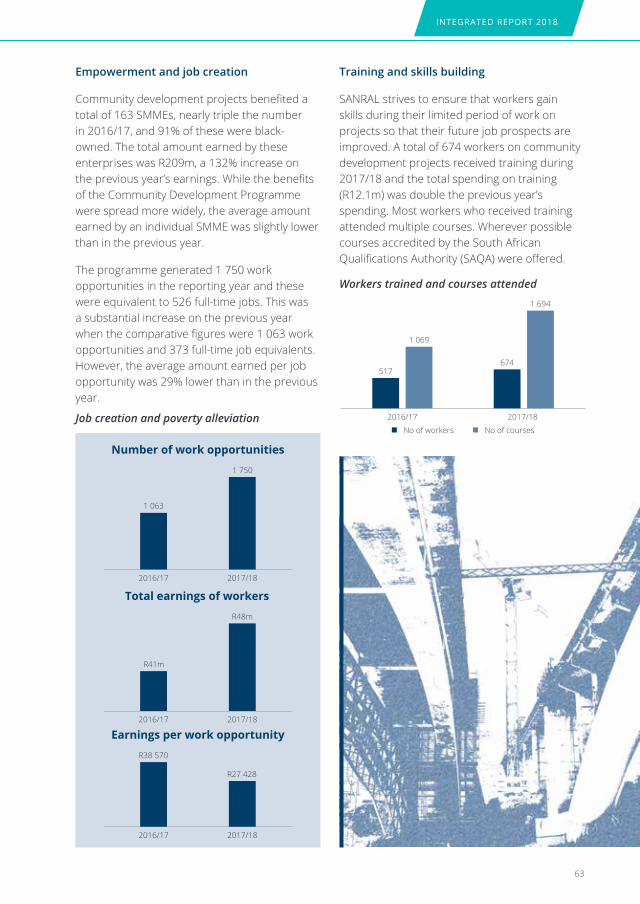
INTEGRATED REPORT 2018
63
2016/17 2017/18
1 063
1 750
Number of work opportunities
2016/17
R41m
2017/18
R48m
Total earnings of workers
2016/17
R38 570
R27 428
2017/18
Earnings per work opportunity
Job creation and poverty alleviation
Training and skills building
SANRAL strives to ensure that workers gain skills during their limited period of work on projects so that their future job prospects are improved. A total of 674 workers on community development projects received training during 2017/18 and the total spending on training (R12.1m) was double the previous year’s spending. Most workers who received training attended multiple courses. Wherever possible courses accredited by the South African Qualifications Authority (SAQA) were offered.
Workers trained and courses attended
2016/17 2017/18
No of workers No of courses
517
1 069
1 694
674
Empowerment and job creation
Community development projects benefited a total of 163 SMMEs, nearly triple the number in 2016/17, and 91% of these were black-owned. The total amount earned by these enterprises was R209m, a 132% increase on the previous year’s earnings. While the benefits of the Community Development Programme were spread more widely, the average amount earned by an individual SMME was slightly lower than in the previous year.
The programme generated 1 750 work opportunities in the reporting year and these were equivalent to 526 full-time jobs. This was a substantial increase on the previous year when the comparative figures were 1 063 work opportunities and 373 full-time job equivalents. However, the average amount earned per job opportunity was 29% lower than in the previous year.
THE SOUTH AFRICAN NATIONAL ROADS AGENCY SOC LIMITED
64
Concessionaires building small businesses and creating jobs
TRAC N3TC BakwenaEmpowerment of small business
Value of SMME work R35m
Value of SMME work R142m
Value of SMME work R57m
Job creation in construction sector
Permanent jobs in South Africa and Mozambique: 620 (average per month)
Route patrol jobs: 42
SMME jobs: 104 (average per month)
Jobs created through contracts: > 2 400
Total number of jobs created for road repair, design and operation (including route services): 1 201
837 jobs were created: 52 managerial, 103 supervisory, and 682 for unskilled or semi-skilled work
4.3 Road safety interventions
SANRAL’s approach to road safety falls squarely within the strategy set out by the United Nations Decade for Action on Road Safety, which draws to a close in 2020. This global initiative seeks to save millions of lives by developing road safety management capacity, improving the safety of road infrastructure, enhancing the safety of vehicles, improving road-user behaviour and improving the response to crashes.
In particular, SANRAL has taken on board the roles of developing safer road infrastructure, influencing road-user behaviour and improving the response to crashes on South Africa’s national roads. The agency’s approach is also consistent with the National Road Safety Strategy 2016 - 2030.
SANRAL participated in local, regional and international conferences and forums on road safety. These included two working groups on road safety of the World Road Association (PIARC) where the agency strove to increase the focus on challenges faced in low and middle-income countries.
Safer road infrastructure
All road improvement programmes are, to a degree, safety interventions. But some are undertaken specifically to tackle hazards, eradicate crash “hot spots” and introduce safety features that compensate for the fallibility of road users.
Examples of this are:
• A series of projects to double the capacity of single carriageway roads in order to accommodate the major increase in road traffic on many routes. This assists safe overtaking and reduces the risk of head-on collisions.
• The replacement of a dangerously narrow bridge over the Olifants River, near Vanrhynsdorp in the Western Cape, with a new bridge that complies with specifications for the relevant traffic flow.
• The development of roundabouts at several intersections of national roads and regional roads where serious crashes have occurred.
• Multiple projects for the construction of dedicated pedestrian facilities, such as paved sidewalks and pedestrian bridges over busy highways.
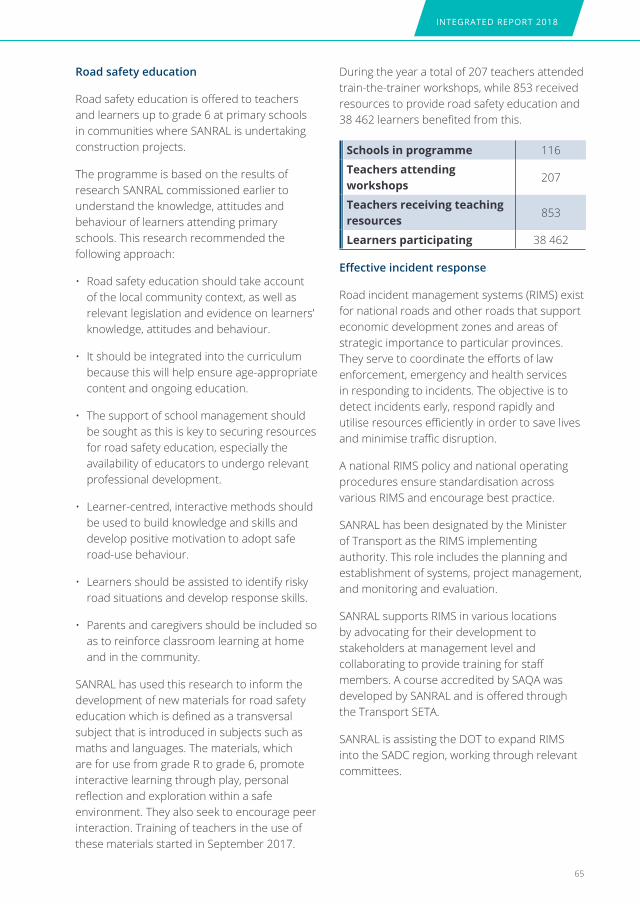
INTEGRATED REPORT 2018
65
Road safety education
Road safety education is offered to teachers and learners up to grade 6 at primary schools in communities where SANRAL is undertaking construction projects.
The programme is based on the results of research SANRAL commissioned earlier to understand the knowledge, attitudes and behaviour of learners attending primary schools. This research recommended the following approach:
• Road safety education should take account of the local community context, as well as relevant legislation and evidence on learners’ knowledge, attitudes and behaviour.
• It should be integrated into the curriculum because this will help ensure age-appropriate content and ongoing education.
• The support of school management should be sought as this is key to securing resources for road safety education, especially the availability of educators to undergo relevant professional development.
• Learner-centred, interactive methods should be used to build knowledge and skills and develop positive motivation to adopt safe road-use behaviour.
• Learners should be assisted to identify risky road situations and develop response skills.
• Parents and caregivers should be included so as to reinforce classroom learning at home and in the community.
SANRAL has used this research to inform the development of new materials for road safety education which is defined as a transversal subject that is introduced in subjects such as maths and languages. The materials, which are for use from grade R to grade 6, promote interactive learning through play, personal reflection and exploration within a safe environment. They also seek to encourage peer interaction. Training of teachers in the use of these materials started in September 2017.
During the year a total of 207 teachers attended train-the-trainer workshops, while 853 received resources to provide road safety education and 38 462 learners benefited from this.
Schools in programme 116
Teachers attending workshops
207
Teachers receiving teaching resources
853
Learners participating 38 462
Effective incident response
Road incident management systems (RIMS) exist for national roads and other roads that support economic development zones and areas of strategic importance to particular provinces. They serve to coordinate the efforts of law enforcement, emergency and health services in responding to incidents. The objective is to detect incidents early, respond rapidly and utilise resources efficiently in order to save lives and minimise traffic disruption.
A national RIMS policy and national operating procedures ensure standardisation across various RIMS and encourage best practice.
SANRAL has been designated by the Minister of Transport as the RIMS implementing authority. This role includes the planning and establishment of systems, project management, and monitoring and evaluation.
SANRAL supports RIMS in various locations by advocating for their development to stakeholders at management level and collaborating to provide training for staff members. A course accredited by SAQA was developed by SANRAL and is offered through the Transport SETA.
SANRAL is assisting the DOT to expand RIMS into the SADC region, working through relevant committees.

THE SOUTH AFRICAN NATIONAL ROADS AGENCY SOC LIMITED
66
A RIMS SNAPShOT: kWAZuLu-NATAL
Eight RIMS in the province covering:
• National routes
• Provincial economic routes
• Economic and social hubs in major cities
Smart systems on major freeways are part of RIMS
Strong multi-stakeholder approach
Commitment to training of operational staff
• Multidisciplinary theoretical workshops
• Simulation exercises
• Training of radio staff
Joint decision-making at incident scenes
Retrospective analysis of responses to major incidents.
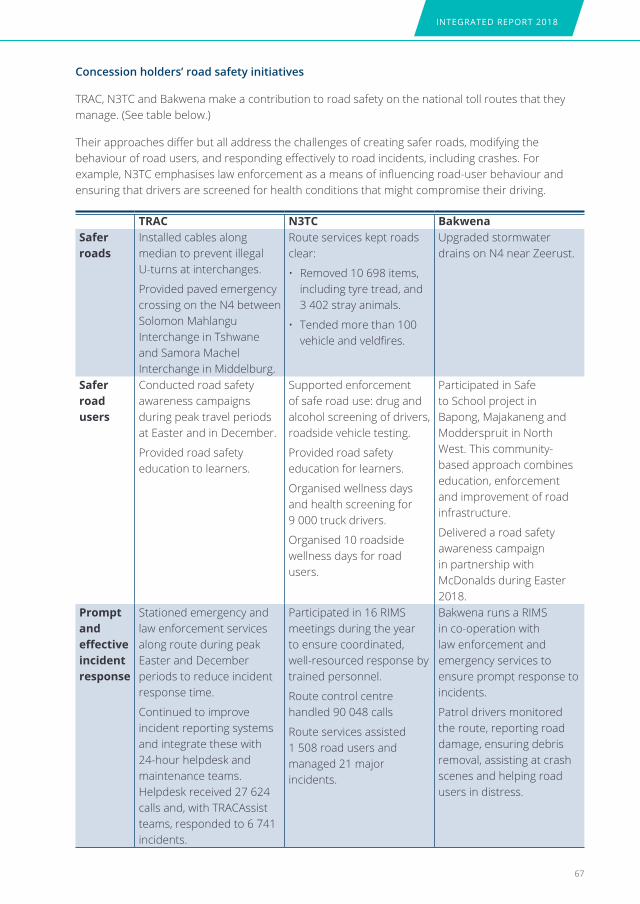
INTEGRATED REPORT 2018
67
Concession holders’ road safety initiatives
TRAC, N3TC and Bakwena make a contribution to road safety on the national toll routes that they manage. (See table below.)
Their approaches differ but all address the challenges of creating safer roads, modifying the behaviour of road users, and responding effectively to road incidents, including crashes. For example, N3TC emphasises law enforcement as a means of influencing road-user behaviour and ensuring that drivers are screened for health conditions that might compromise their driving.
TRAC N3TC BakwenaSafer roads
Installed cables along median to prevent illegal U-turns at interchanges.
Provided paved emergency crossing on the N4 between Solomon Mahlangu Interchange in Tshwane and Samora Machel Interchange in Middelburg.
Route services kept roads clear:
• Removed 10 698 items, including tyre tread, and 3 402 stray animals.
• Tended more than 100 vehicle and veldfires.
Upgraded stormwater drains on N4 near Zeerust.
Safer road users
Conducted road safety awareness campaigns during peak travel periods at Easter and in December.
Provided road safety education to learners.
Supported enforcement of safe road use: drug and alcohol screening of drivers, roadside vehicle testing.
Provided road safety education for learners.
Organised wellness days and health screening for 9 000 truck drivers.
Organised 10 roadside wellness days for road users.
Participated in Safe to School project in Bapong, Majakaneng and Modderspruit in North West. This community-based approach combines education, enforcement and improvement of road infrastructure.
Delivered a road safety awareness campaign in partnership with McDonalds during Easter 2018.
Prompt and effectiveincident response
Stationed emergency and law enforcement services along route during peak Easter and December periods to reduce incident response time.
Continued to improve incident reporting systems and integrate these with 24-hour helpdesk and maintenance teams. Helpdesk received 27 624 calls and, with TRACAssist teams, responded to 6 741 incidents.
Participated in 16 RIMS meetings during the year to ensure coordinated, well-resourced response by trained personnel.
Route control centre handled 90 048 calls
Route services assisted 1 508 road users and managed 21 major incidents.
Bakwena runs a RIMS in co-operation with law enforcement and emergency services to ensure prompt response to incidents.
Patrol drivers monitored the route, reporting road damage, ensuring debris removal, assisting at crash scenes and helping road users in distress.

THE SOUTH AFRICAN NATIONAL ROADS AGENCY SOC LIMITED
68
4.4 university Partnerships
SANRAL’s partnerships with universities centre on a shared interest in:
• Increasing relevant research and post-graduate study in engineering and related fields.
• Promoting the learning and teaching of science and mathematics at school level with the aim of ensuring a strong flow of talented young people into the engineering professions.
The partnerships increase the public visibility of SANRAL, help the agency meet its own demand for engineering professionals and relevant research, and contribute to a dynamic engineering sector with world class expertise in road design, construction and management.
SANRAL has endowed three specialised chairs at universities. They are:
• The SANRAL Chair in Pavement Engineering at Stellenbosch University (SU), Western Cape which has a dual teaching and research function. It has played a strong role in empowering black professionals and a significant proportion of post-graduate students are drawn from other African countries.
• The SANRAL Chair in Transport Planning at the University of Cape Town (UCT) which enriched the teaching of transport engineering at this institution. Research undertaken places a strong emphasis on the potential impact of transport planning on social equity and alleviating poverty.
• The SANRAL Chair in Mathematics, Natural Science and Technology Education at the University of the Free State (UFS) which directs its energies at post-graduate research on the teaching of maths, science and technology and the training of teachers for these subjects. Between 2014 and 2017, the programme produced 14 PhD and five MEd graduates. It is also conducting a School
Change Project at the request of the Free State Education Department.
An exciting three-way partnership exists between SANRAL, the Council for Scientific and Industrial Research (CSIR) and UP for the establishment and management of an integrated set of National Reference and Research Laboratories for development and testing of materials used in transport and transport infrastructure. The facilities, situated at the CSIR and two campuses of UP, are to be staffed by highly skilled professionals.
The status of the Integrated Laboratory Facility on the UP Hillcrest campus is that the final tender documentation is being prepared. Construction will start, as planned, during the second half of 2018 with completion to the end of 2019.
The agency’s investment in improving maths and science teaching at school level flows through well-established programmes run by two universities.
• Science-for-the-Future is an initiative of the UFS and it has three distinct components, two of which have also been adopted by Nelson Mandela University (NMU).
- The ICT Laboratory for Science is geared to the needs of learners in grades 9 – 12 who show promise in maths and science. Total participants from 2009 to 2017 amount to 18 171. Over the course of two or three years, the programme enables learners to participate in 30 laboratory sessions on the Bloemfontein and QwaQwa campuses of the university. Content from the science curriculum is presented to them in novel and creative ways, utilising information technology. Many of these students go on to study science-related subjects at university. The ICT Laboratory is now also offered at NMU’s Missionvale campus and teachers from under-resourced schools are encouraged to use the lab during the mornings as a classroom. They are assisted by programme staff.

INTEGRATED REPORT 2018
- Key Concepts in Science covers the grade 8 and 9 natural science curriculum and seeks to enhance school teachers’ ability to present and explain scientific principles. It emphasises active, hands-on learning and equips teachers with worksheets and activity materials to support this approach. UFS intends to expand this programme through collaborations with other universities and NMU was the first to come on board.
- The Family Math and Family Science Programme seeks to excite interest in maths and science among younger school children and build their confidence in studying these subjects. It does so through a triangular strategy that trains and equips teachers to adopt novel teaching methods which they then use in the classroom and in special workshops with parents of learners. The design and supply of learning materials and activities is central to the strategy. The programme started in 2009 in
the Free State and Northern Cape and has since expanded to include Gauteng and the Eastern Cape.
• In addition to offering the ICT Laboratory and Key Concepts in Science programmes pioneered by UFS, NMU runs the GATE programme of academic support in science and maths for selected learners in grade 10 - 12. The objective is to boost their performance to the extent that they will be eligible for science-related tertiary studies.
The ICT Lab’s record 2009 - 2017
university Learners Student teachers & BSc students
Free State 4 326 1 794
Nelson Mandela
2 468 177
Total 6 794 1 971
Who benefits from Family Math and Family Science?*
Province Schools Teachers Learners Parents Student teachers
Subject advisors
Eastern Cape 52 94 9 023 6 819 0 3
Free State 89 228 26 535 2 116 2 994 11
Gauteng 10 49 3 790 2 644 0 2
Northern Cape 127 260 26 955 7 637 0 22
Total 278 631 66 303 19 216 2 994 38
*Figures relate to period 2009 - 2017. Provinces joined the programme in different years.

THE SOUTH AFRICAN NATIONAL ROADS AGENCY SOC LIMITED
70
Programme achievements since 2009
Number of Family Math and family Science project participants
Period Area Teachers Subject Advisors
Schools Learners Parents Student teachers
2009-2017
Free State 228 11 89 26 535 2 116 2 994
2009-2017
Northern Cape
260 22 127 26 955 7 637 0
2012-2017
Eastern Cape
94 3 52 9 023 6 819 0
2016-2017
Gauteng 49 2 10 3 790 2 644 0
Total 631 38 278 66 303 19 216 2 994
*A total number of 89182 participants during 2015-2017
Study of learners’ in region before and after intervention
Regions Period Avg % before
Avg % after
Improvement Instrument
Free State
Gr 3 FM ThabaNchu/Botshabelo
2012-2014 35.4 60.5 25.1 ANA Results
Gr 3 FM ThabaNchu/Botshabelo
2015-2016 51 60 9 Common Papers
Gr 4 FM ThabaNchu/Botshabelo
2015-2016 37 50 13 Common Papers
Northern Cape
Gr 3 FM Heuningvlei 2015-2016 55.6 61.8 5.2 School Based
Tshwane North
Gr 3 FM Hammanskraal 2015-2016 72 88.5 16.5 School Based
Eastern Cape
Gr 3 FM Mthatha 2015-2016 53.2 62.8 9.5 School Based
Libode 2015-2016 59.2 71.9 12.7 School Based
*Results from a thorough study in the specific region, it should be taken into consideration that the ANA as well as the Common Papers and School based assessments showed the same tendency and indicated an improvement.
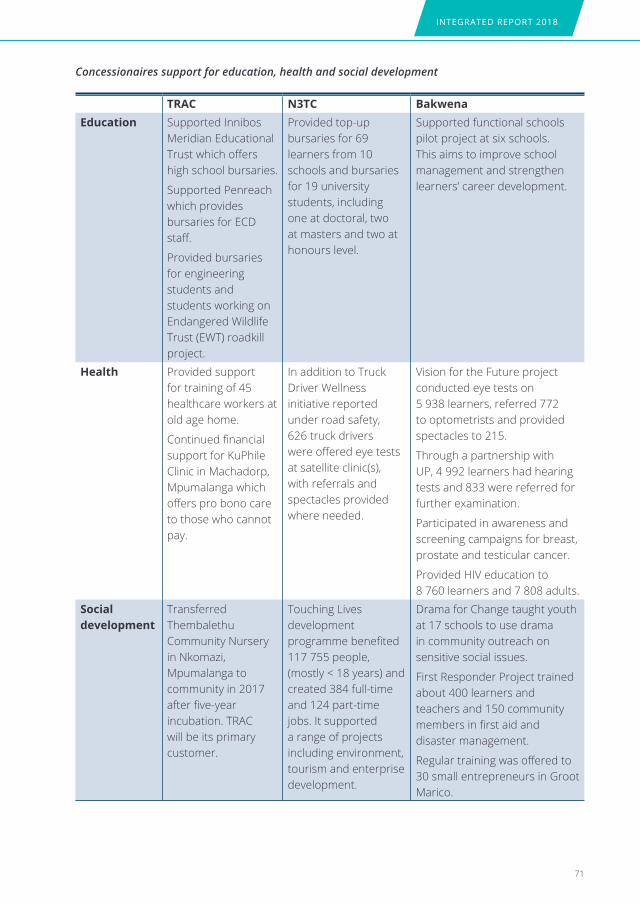
INTEGRATED REPORT 2018
71
Concessionaires support for education, health and social development
TRAC N3TC BakwenaEducation Supported Innibos
Meridian Educational Trust which offers high school bursaries.
Supported Penreach which provides bursaries for ECD staff.
Provided bursaries for engineering students and students working on Endangered Wildlife Trust (EWT) roadkill project.
Provided top-up bursaries for 69 learners from 10 schools and bursaries for 19 university students, including one at doctoral, two at masters and two at honours level.
Supported functional schools pilot project at six schools. This aims to improve school management and strengthen learners’ career development.
health Provided support for training of 45 healthcare workers at old age home.
Continued financial support for KuPhile Clinic in Machadorp, Mpumalanga which offers pro bono care to those who cannot pay.
In addition to Truck Driver Wellness initiative reported under road safety, 626 truck drivers were offered eye tests at satellite clinic(s), with referrals and spectacles provided where needed.
Vision for the Future project conducted eye tests on 5 938 learners, referred 772 to optometrists and provided spectacles to 215.
Through a partnership with UP, 4 992 learners had hearing tests and 833 were referred for further examination.
Participated in awareness and screening campaigns for breast, prostate and testicular cancer.
Provided HIV education to 8 760 learners and 7 808 adults.
Social development
Transferred Thembalethu Community Nursery in Nkomazi, Mpumalanga to community in 2017 after five-year incubation. TRAC will be its primary customer.
Touching Lives development programme benefited 117 755 people, (mostly < 18 years) and created 384 full-time and 124 part-time jobs. It supported a range of projects including environment, tourism and enterprise development.
Drama for Change taught youth at 17 schools to use drama in community outreach on sensitive social issues.
First Responder Project trained about 400 learners and teachers and 150 community members in first aid and disaster management.
Regular training was offered to 30 small entrepreneurs in Groot Marico.
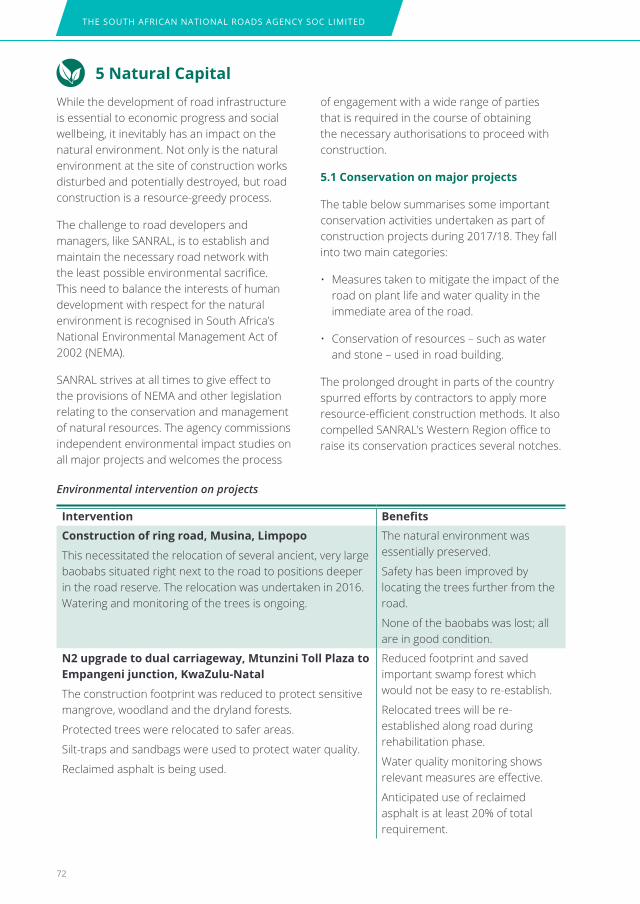
THE SOUTH AFRICAN NATIONAL ROADS AGENCY SOC LIMITED
72
While the development of road infrastructure is essential to economic progress and social wellbeing, it inevitably has an impact on the natural environment. Not only is the natural environment at the site of construction works disturbed and potentially destroyed, but road construction is a resource-greedy process.
The challenge to road developers and managers, like SANRAL, is to establish and maintain the necessary road network with the least possible environmental sacrifice. This need to balance the interests of human development with respect for the natural environment is recognised in South Africa’s National Environmental Management Act of 2002 (NEMA).
SANRAL strives at all times to give effect to the provisions of NEMA and other legislation relating to the conservation and management of natural resources. The agency commissions independent environmental impact studies on all major projects and welcomes the process
5 Natural Capitalof engagement with a wide range of parties that is required in the course of obtaining the necessary authorisations to proceed with construction.
5.1 Conservation on major projects
The table below summarises some important conservation activities undertaken as part of construction projects during 2017/18. They fall into two main categories:
• Measures taken to mitigate the impact of the road on plant life and water quality in the immediate area of the road.
• Conservation of resources – such as water and stone – used in road building.
The prolonged drought in parts of the country spurred efforts by contractors to apply more resource-efficient construction methods. It also compelled SANRAL’s Western Region office to raise its conservation practices several notches.
Intervention Benefits
Construction of ring road, Musina, Limpopo
This necessitated the relocation of several ancient, very large baobabs situated right next to the road to positions deeper in the road reserve. The relocation was undertaken in 2016. Watering and monitoring of the trees is ongoing.
The natural environment was essentially preserved.
Safety has been improved by locating the trees further from the road.
None of the baobabs was lost; all are in good condition.
N2 upgrade to dual carriageway, Mtunzini Toll Plaza to Empangeni junction, kwaZulu-Natal
The construction footprint was reduced to protect sensitive mangrove, woodland and the dryland forests.
Protected trees were relocated to safer areas.
Silt-traps and sandbags were used to protect water quality.
Reclaimed asphalt is being used.
Reduced footprint and saved important swamp forest which would not be easy to re-establish.
Relocated trees will be re-established along road during rehabilitation phase.
Water quality monitoring shows relevant measures are effective.
Anticipated use of reclaimed asphalt is at least 20% of total requirement.
Environmental intervention on projects
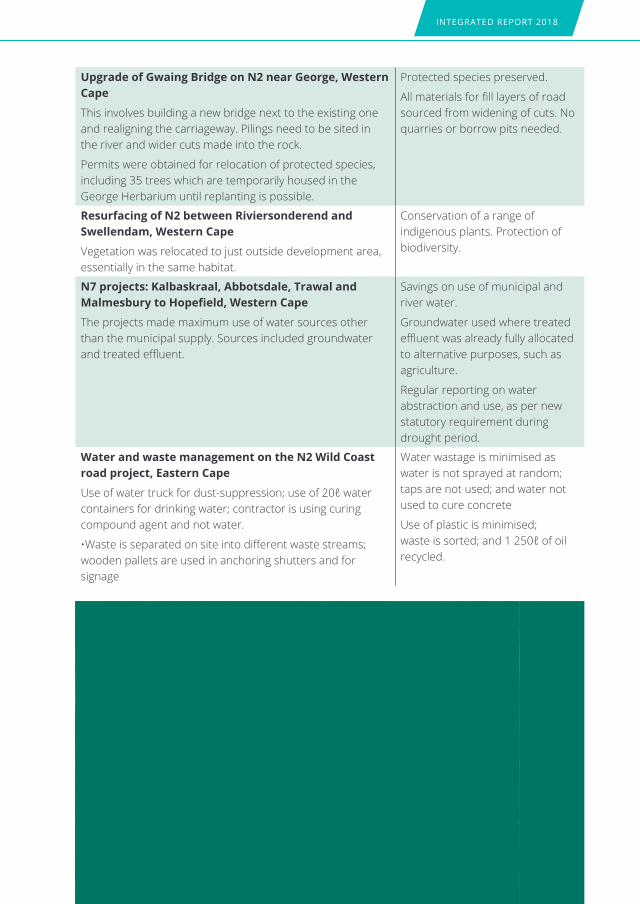
INTEGRATED REPORT 2018
upgrade of Gwaing Bridge on N2 near George, Western Cape
This involves building a new bridge next to the existing one and realigning the carriageway. Pilings need to be sited in the river and wider cuts made into the rock.
Permits were obtained for relocation of protected species, including 35 trees which are temporarily housed in the George Herbarium until replanting is possible.
Protected species preserved.
All materials for fill layers of road sourced from widening of cuts. No quarries or borrow pits needed.
Resurfacing of N2 between Riviersonderend and Swellendam, Western Cape
Vegetation was relocated to just outside development area, essentially in the same habitat.
Conservation of a range of indigenous plants. Protection of biodiversity.
N7 projects: kalbaskraal, Abbotsdale, Trawal and MalmesburytoHopefield,WesternCape
The projects made maximum use of water sources other than the municipal supply. Sources included groundwater and treated effluent.
Savings on use of municipal and river water.
Groundwater used where treated effluent was already fully allocated to alternative purposes, such as agriculture.
Regular reporting on water abstraction and use, as per new statutory requirement during drought period.
Water and waste management on the N2 Wild Coast road project, Eastern Cape
Use of water truck for dust-suppression; use of 20ℓ water containers for drinking water; contractor is using curing compound agent and not water.
•Waste is separated on site into different waste streams; wooden pallets are used in anchoring shutters and for signage
Water wastage is minimised as water is not sprayed at random; taps are not used; and water not used to cure concrete
Use of plastic is minimised; waste is sorted; and 1 250ℓ of oil recycled.

THE SOUTH AFRICAN NATIONAL ROADS AGENCY SOC LIMITED
74
Biodiversity saved and/or maintained on N2 Wild Coast road project, Eastern Cape
Flora
The plant rescue plan requires the identification, removal and where possible, rescue or relocation of threatened or protected plant species. Botanical surveys were undertaken during numerous field trips, within all the various demarcated areas requiring search & rescue.
Flora
Team members identified, photographed, recorded and tagged vulnerable flora. In some cases, where whole plants could not be rescued, seeds or cuttings were taken. Seeds were dried, cleaned and prepared for propagation at the temporary holding area.
Mthentu haul roads: 25 000 plants rescued
Msikaba haul roads: 5 600 plants rescued
Opportunities have been provided to traditional healers to collect of plants with medicinal value. Some medicinal plants rescued are known to treat skin rashes, sooth stomach cramps, cleansing “dirty blood” and some are used to prevent excess bile in the gall bladder.
Biodiversity saved and/or maintained on N2 Wild Coast road project, Eastern Cape
Fauna
There was concern around possible negative impacts on the Cape Griffon vulture colony in the Msikaba gorge.
Fauna
Monitoring by independent specialists during blasting revealed no noticeable negative impact on the breeding vultures.
Repair of wash-away at Abel Erasmus Pass, Limpopo
Modified dry-bound macadam basecourse layers were applied. This meant:
Locally available materials were used.
Only the natural moisture content of the coarse aggregate and fine aggregate (river sand and local soil) was used. No additional compaction water or slushing were required.
Thinner, more durable layers were applied.
Water saving of 71% (compared to usual construction method) was obtained.
No slushing of the course aggregate base layer was done.
The use of the modified dry-bound macadam proved viable.
Tree planting on R24 in Rustenburg, North West
A total number of 32 trees were planted. The trees were also chosen for their tolerance of the local climatic conditions.
All trees selected and planted are indigenous, hardy, water-wise and low maintenance. They are: Aloe barberae (Tree Aloe), Aloe marlothii (Mountain Aloe), Celtis Africana (White Stinkwood), Combretum molle (Velvet Bushwillow), Olea europeaea subsp. Africana (Wild Olive).

INTEGRATED REPORT 2018
75
These dealt with:
• Air quality and aquatic systems
• Vegetation and biodiversity
• Heritage, archaeology and palaeontological resources
• Socio-economic issues
• Town planning, land uses and land rights
• Noise and aesthetic issues.
The socio-economic and town planning studies evoked most interest. No appeals were lodged against the authorisations granted for the proposed ring roads.
SANRAL commenced a basic assessment for the upgrade of the R37 from Modikwa Mine to Burgersfort, Limpopo. The two most important environmental impacts pertain to the Steelpoort River and the marula trees situated in the road reserve. Proposed mitigation measures will be included in environmental management plan which will be submitted along with the assessment to the DEA.
Statutory developments
New regulations on environmental impact assessments and associated listing notices were published in 2017 and became effective at the end of the reporting period. The objective of these amendments was to achieve a higher level of integration between the DEA and Departments of Mineral Resources (DMR) and Water and Sanitation (DWS) in respect of environmental management of mining activities. The regulations affect environmental authorisation applications for SANRAL’s borrow pits and quarries and the agency’s environmental practitioners have engaged the DEA to clarify the changes and processes to be followed.
Western Region office
SANRAL, along with all residents and businesses in the Western Cape, was compelled by the severe drought to make adjustments to its water-use practices.
• Recycled, treated effluent obtained from a local sewerage plant is now used to flush toilets and water gardens twice weekly. No municipal water is used on gardens.
• Tap availability in bathrooms has been restricted and all taps in the building have been fitted with aerators to decrease water flow.
• Water features in the garden have been covered with a liquid pool blanket to reduce evaporation.
Environmental impact assessments
Three environmental authorisations were granted during the year and a basic assessment got underway for a proposed road improvement project in Limpopo.
The Department of Environmental Affairs (DEA) issued an authorisation in November for the improvement of the R510 from the North West/Limpopo border to Bierspruit, Limpopo. This followed the conduct of a basic assessment which identified possible impacts on the streams and/or drainage lines, as well as possible traffic delays during construction. Measures to mitigate these impacts were contained in the environmental management plan submitted to the DEA.
SANRAL also received environmental authorisations for two proposed ring roads on the N2, at Butterworth and Idutywa in the Eastern Cape. The granting of the authorisations was the culmination of extensive public participation activities involving residents and various interest groups and the compilation of eight specialist reports over a five-year period.
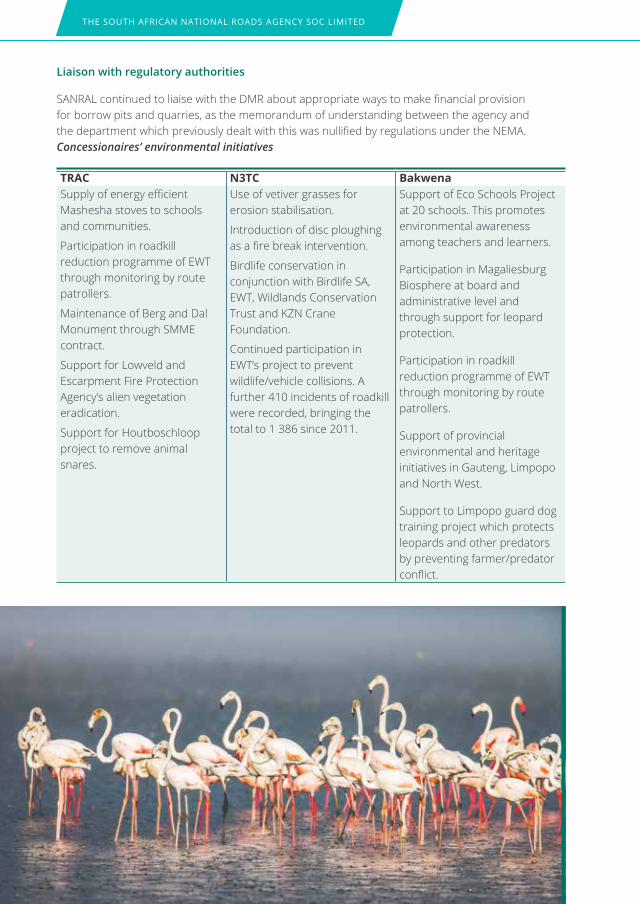
THE SOUTH AFRICAN NATIONAL ROADS AGENCY SOC LIMITED
Liaison with regulatory authorities
SANRAL continued to liaise with the DMR about appropriate ways to make financial provision for borrow pits and quarries, as the memorandum of understanding between the agency and the department which previously dealt with this was nullified by regulations under the NEMA. Concessionaires’ environmental initiatives
TRAC N3TC BakwenaSupply of energy efficient Mashesha stoves to schools and communities.
Participation in roadkill reduction programme of EWT through monitoring by route patrollers.
Maintenance of Berg and Dal Monument through SMME contract.
Support for Lowveld and Escarpment Fire Protection Agency’s alien vegetation eradication.
Support for Houtboschloop project to remove animal snares.
Use of vetiver grasses for erosion stabilisation.
Introduction of disc ploughing as a fire break intervention.
Birdlife conservation in conjunction with Birdlife SA, EWT, Wildlands Conservation Trust and KZN Crane Foundation.
Continued participation in EWT’s project to prevent wildlife/vehicle collisions. A further 410 incidents of roadkill were recorded, bringing the total to 1 386 since 2011.
Support of Eco Schools Project at 20 schools. This promotes environmental awareness among teachers and learners.
Participation in Magaliesburg Biosphere at board and administrative level and through support for leopard protection.
Participation in roadkill reduction programme of EWT through monitoring by route patrollers.
Support of provincial environmental and heritage initiatives in Gauteng, Limpopo and North West.
Support to Limpopo guard dog training project which protects leopards and other predators by preventing farmer/predator conflict.
INTEGRATED REPORT 2018
77
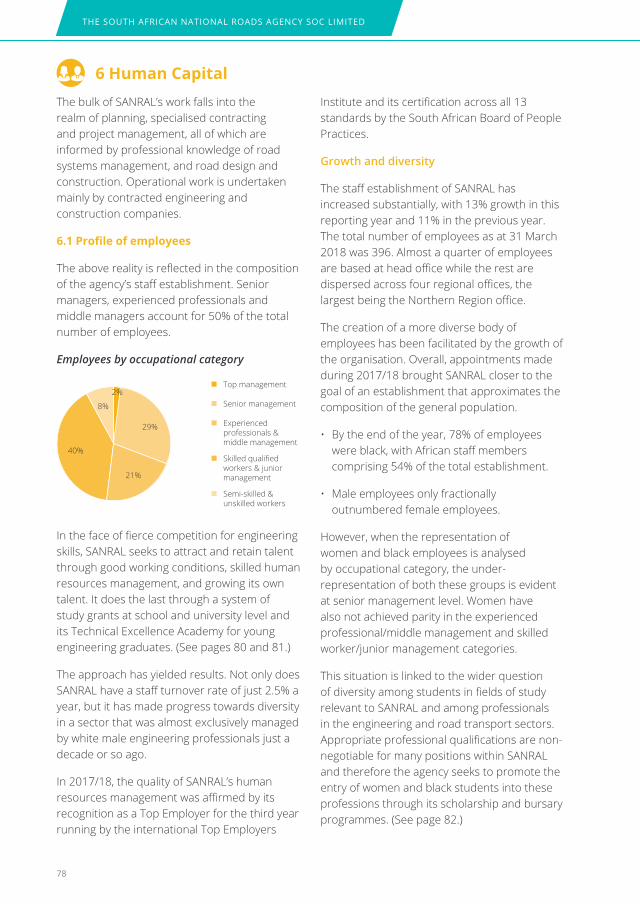
THE SOUTH AFRICAN NATIONAL ROADS AGENCY SOC LIMITED
78
The bulk of SANRAL’s work falls into the realm of planning, specialised contracting and project management, all of which are informed by professional knowledge of road systems management, and road design and construction. Operational work is undertaken mainly by contracted engineering and construction companies.
6.1Profileofemployees
The above reality is reflected in the composition of the agency’s staff establishment. Senior managers, experienced professionals and middle managers account for 50% of the total number of employees.
Employees by occupational category
6 human Capital
Top management
Experienced professionals & middle management
Senior management
Skilled qualified workers & junior management
Semi-skilled & unskilled workers
29%
2%
8%
21%
40%
In the face of fierce competition for engineering skills, SANRAL seeks to attract and retain talent through good working conditions, skilled human resources management, and growing its own talent. It does the last through a system of study grants at school and university level and its Technical Excellence Academy for young engineering graduates. (See pages 80 and 81.)
The approach has yielded results. Not only does SANRAL have a staff turnover rate of just 2.5% a year, but it has made progress towards diversity in a sector that was almost exclusively managed by white male engineering professionals just a decade or so ago.
In 2017/18, the quality of SANRAL’s human resources management was affirmed by its recognition as a Top Employer for the third year running by the international Top Employers
Institute and its certification across all 13 standards by the South African Board of People Practices.
Growth and diversity
The staff establishment of SANRAL has increased substantially, with 13% growth in this reporting year and 11% in the previous year. The total number of employees as at 31 March 2018 was 396. Almost a quarter of employees are based at head office while the rest are dispersed across four regional offices, the largest being the Northern Region office.
The creation of a more diverse body of employees has been facilitated by the growth of the organisation. Overall, appointments made during 2017/18 brought SANRAL closer to the goal of an establishment that approximates the composition of the general population.
• By the end of the year, 78% of employees were black, with African staff members comprising 54% of the total establishment.
• Male employees only fractionally outnumbered female employees.
However, when the representation of women and black employees is analysed by occupational category, the under-representation of both these groups is evident at senior management level. Women have also not achieved parity in the experienced professional/middle management and skilled worker/junior management categories.
This situation is linked to the wider question of diversity among students in fields of study relevant to SANRAL and among professionals in the engineering and road transport sectors. Appropriate professional qualifications are non-negotiable for many positions within SANRAL and therefore the agency seeks to promote the entry of women and black students into these professions through its scholarship and bursary programmes. (See page 82.)

INTEGRATED REPORT 2018
79
Growth in SANRAL staffing
450
400
350
300
250
200
150
100
50
02015/16
314349
396
2016/17 2017/18
Head office
Western Region
Eastern Region
Northern Region
Southern Region
23%16%
28%18%
16%
Distribution of employees
Distribution of employees by population group
60
50
40
30
20
10
0African Coloured Indian White
4648
54
14 13 13 13 12 10
27 27
22
2015/16 2016/17 2017/18
Male: female ratio in main occupational categories
Semi- & unskilled
Skilled & jnr management
Professionals & mid-
management
Snr management
Top management
0 20 40 60 80 100
25 75
44 56
44 56
73 27
50 50
Male Female
Breakdown of main occupational categories by population group
Semi- & unskilled
Skilled & jnr management
Professionals & mid-
management
Snr management
Top management
0 20 40 60 80 100
80 16 4
38 3812 12
12 12 1362
39 8 9 41 3
56 16 12 16
African Coloured Indian White Foreign
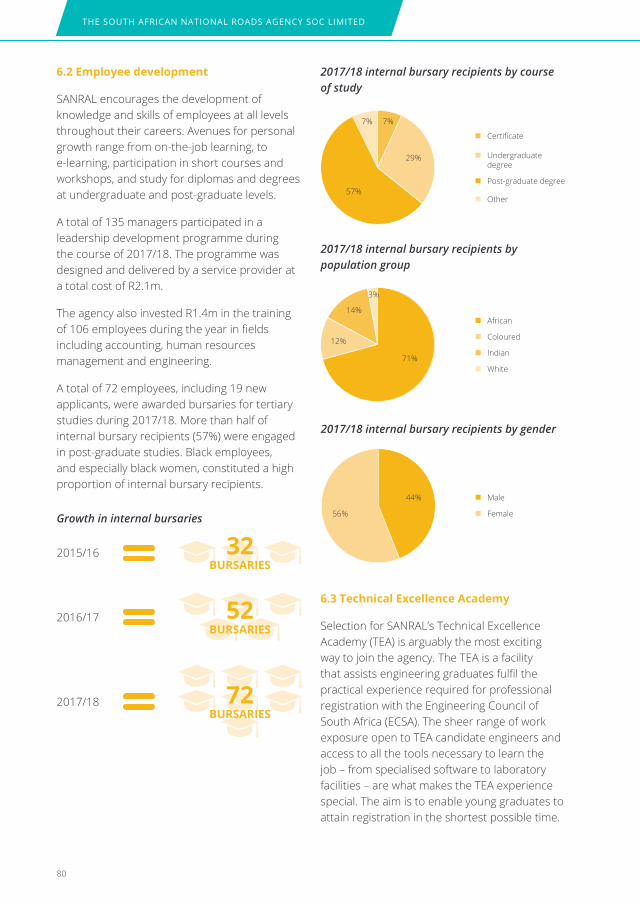
THE SOUTH AFRICAN NATIONAL ROADS AGENCY SOC LIMITED
80
6.2 Employee development
SANRAL encourages the development of knowledge and skills of employees at all levels throughout their careers. Avenues for personal growth range from on-the-job learning, to e-learning, participation in short courses and workshops, and study for diplomas and degrees at undergraduate and post-graduate levels.
A total of 135 managers participated in a leadership development programme during the course of 2017/18. The programme was designed and delivered by a service provider at a total cost of R2.1m.
The agency also invested R1.4m in the training of 106 employees during the year in fields including accounting, human resources management and engineering.
A total of 72 employees, including 19 new applicants, were awarded bursaries for tertiary studies during 2017/18. More than half of internal bursary recipients (57%) were engaged in post-graduate studies. Black employees, and especially black women, constituted a high proportion of internal bursary recipients.
2015/16 BuRSARIES
32
2016/17 BuRSARIES
52
2017/18 BuRSARIES
72
Growth in internal bursaries
2017/18 internal bursary recipients by population group
2017/18 internal bursary recipients by gender
African
Indian
Coloured
White
Male
Female
71%
44%
3%
14%
2017/18 internal bursary recipients by course of study
Certificate
Post-graduate degree
Undergraduate degree
Other
29%
7%7%
57%
12%
56%
6.3 Technical Excellence Academy
Selection for SANRAL’s Technical Excellence Academy (TEA) is arguably the most exciting way to join the agency. The TEA is a facility that assists engineering graduates fulfil the practical experience required for professional registration with the Engineering Council of South Africa (ECSA). The sheer range of work exposure open to TEA candidate engineers and access to all the tools necessary to learn the job – from specialised software to laboratory facilities – are what makes the TEA experience special. The aim is to enable young graduates to attain registration in the shortest possible time.
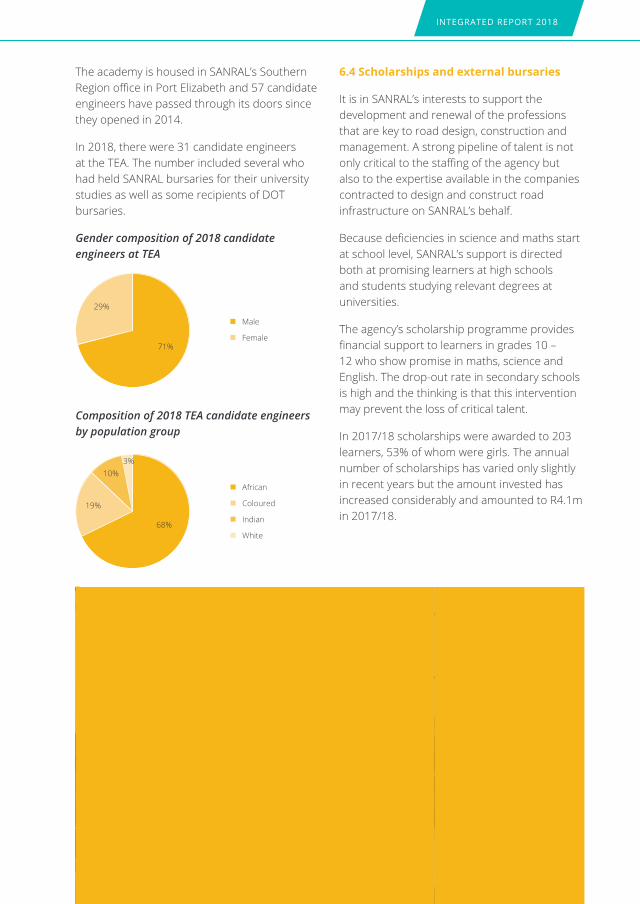
INTEGRATED REPORT 2018
The academy is housed in SANRAL’s Southern Region office in Port Elizabeth and 57 candidate engineers have passed through its doors since they opened in 2014.
In 2018, there were 31 candidate engineers at the TEA. The number included several who had held SANRAL bursaries for their university studies as well as some recipients of DOT bursaries.
Gender composition of 2018 candidate engineers at TEA
6.4 Scholarships and external bursaries
It is in SANRAL’s interests to support the development and renewal of the professions that are key to road design, construction and management. A strong pipeline of talent is not only critical to the staffing of the agency but also to the expertise available in the companies contracted to design and construct road infrastructure on SANRAL’s behalf.
Because deficiencies in science and maths start at school level, SANRAL’s support is directed both at promising learners at high schools and students studying relevant degrees at universities.
The agency’s scholarship programme provides financial support to learners in grades 10 – 12 who show promise in maths, science and English. The drop-out rate in secondary schools is high and the thinking is that this intervention may prevent the loss of critical talent.
In 2017/18 scholarships were awarded to 203 learners, 53% of whom were girls. The annual number of scholarships has varied only slightly in recent years but the amount invested has increased considerably and amounted to R4.1m in 2017/18.
Male
Female71%
29%
Composition of 2018 TEA candidate engineers by population group
African
Indian
Coloured
White68%
3%10%
19%
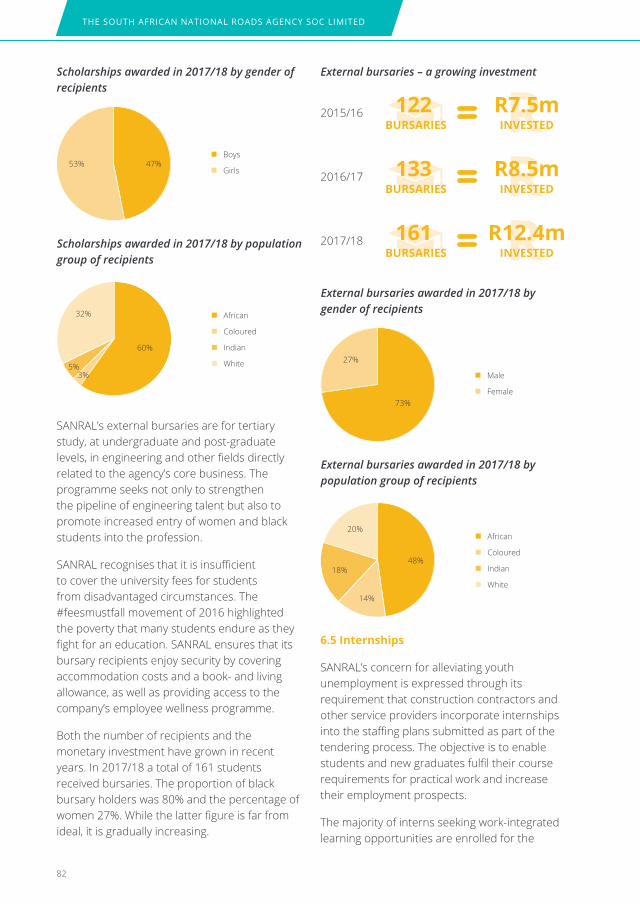
THE SOUTH AFRICAN NATIONAL ROADS AGENCY SOC LIMITED
82
Scholarships awarded in 2017/18 by gender of recipients
SANRAL’s external bursaries are for tertiary study, at undergraduate and post-graduate levels, in engineering and other fields directly related to the agency’s core business. The programme seeks not only to strengthen the pipeline of engineering talent but also to promote increased entry of women and black students into the profession.
SANRAL recognises that it is insufficient to cover the university fees for students from disadvantaged circumstances. The #feesmustfall movement of 2016 highlighted the poverty that many students endure as they fight for an education. SANRAL ensures that its bursary recipients enjoy security by covering accommodation costs and a book- and living allowance, as well as providing access to the company’s employee wellness programme.
Both the number of recipients and the monetary investment have grown in recent years. In 2017/18 a total of 161 students received bursaries. The proportion of black bursary holders was 80% and the percentage of women 27%. While the latter figure is far from ideal, it is gradually increasing.
Boys
Girls
Male
Female
47%
73%
53%
27%
Scholarships awarded in 2017/18 by population group of recipients
External bursaries awarded in 2017/18 by population group of recipients
External bursaries awarded in 2017/18 by gender of recipients
African
Indian
Coloured
White
African
Indian
Coloured
White
60%
48%
3%
14%
5%
18%
32%
20%
External bursaries – a growing investment
2015/16 BuRSARIES122
INVESTEDR7.5m
2016/17 BuRSARIES133
INVESTEDR8.5m
2017/18BuRSARIES161
INVESTEDR12.4m
6.5 Internships
SANRAL’s concern for alleviating youth unemployment is expressed through its requirement that construction contractors and other service providers incorporate internships into the staffing plans submitted as part of the tendering process. The objective is to enable students and new graduates fulfil their course requirements for practical work and increase their employment prospects.
The majority of interns seeking work-integrated learning opportunities are enrolled for the
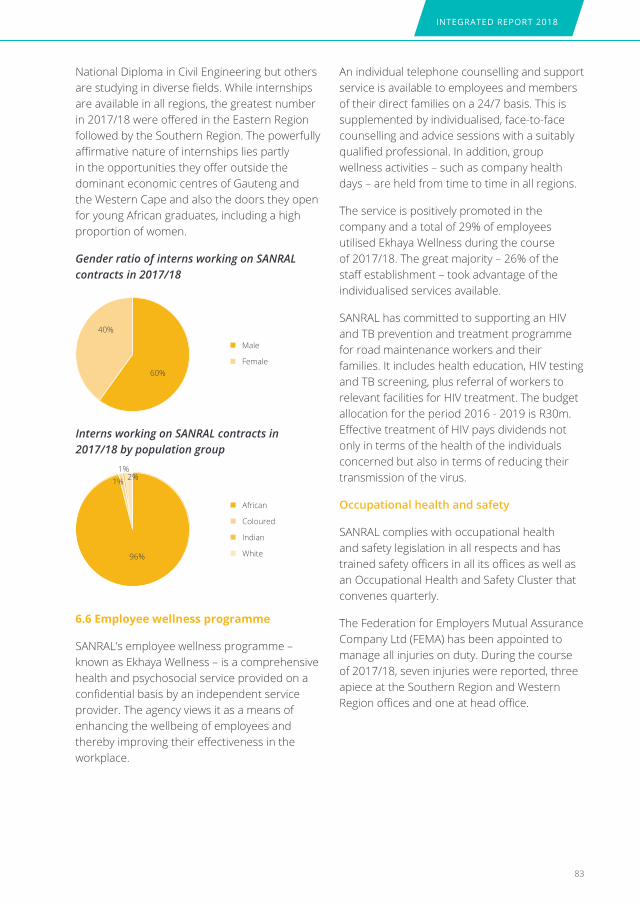
INTEGRATED REPORT 2018
83
Male
Female60%
40%
Interns working on SANRAL contracts in 2017/18 by population group
African
Indian
Coloured
White96%
1%1%
2%
6.6 Employee wellness programme
SANRAL’s employee wellness programme – known as Ekhaya Wellness – is a comprehensive health and psychosocial service provided on a confidential basis by an independent service provider. The agency views it as a means of enhancing the wellbeing of employees and thereby improving their effectiveness in the workplace.
National Diploma in Civil Engineering but others are studying in diverse fields. While internships are available in all regions, the greatest number in 2017/18 were offered in the Eastern Region followed by the Southern Region. The powerfully affirmative nature of internships lies partly in the opportunities they offer outside the dominant economic centres of Gauteng and the Western Cape and also the doors they open for young African graduates, including a high proportion of women.
Gender ratio of interns working on SANRAL contracts in 2017/18
An individual telephone counselling and support service is available to employees and members of their direct families on a 24/7 basis. This is supplemented by individualised, face-to-face counselling and advice sessions with a suitably qualified professional. In addition, group wellness activities – such as company health days – are held from time to time in all regions.
The service is positively promoted in the company and a total of 29% of employees utilised Ekhaya Wellness during the course of 2017/18. The great majority – 26% of the staff establishment – took advantage of the individualised services available.
SANRAL has committed to supporting an HIV and TB prevention and treatment programme for road maintenance workers and their families. It includes health education, HIV testing and TB screening, plus referral of workers to relevant facilities for HIV treatment. The budget allocation for the period 2016 - 2019 is R30m. Effective treatment of HIV pays dividends not only in terms of the health of the individuals concerned but also in terms of reducing their transmission of the virus.
Occupational health and safety
SANRAL complies with occupational health and safety legislation in all respects and has trained safety officers in all its offices as well as an Occupational Health and Safety Cluster that convenes quarterly.
The Federation for Employers Mutual Assurance Company Ltd (FEMA) has been appointed to manage all injuries on duty. During the course of 2017/18, seven injuries were reported, three apiece at the Southern Region and Western Region offices and one at head office.
THE SOUTH AFRICAN NATIONAL ROADS AGENCY SOC LIMITED
84
Road infrastructure touches daily on the lives of millions of people in all parts of South Africa and therefore effective communication to the public makes a critical difference to the way SANRAL fulfils its mandate of managing the national road system.
Communication is also an intrinsic element of SANRAL’s road safety programme, raising awareness of behaviour that poses risks on the road and encouraging mutual responsibility among road users. In addition, the agency’s social investment programmes, and its scholarship, bursary and internship initiatives, require marketing in order to reach the intended sections of the population.
Besides this broad public communication, SANRAL has a complex tapestry of stakeholders who not only require clear and relevant information but also have a need to be heard on those aspects of SANRAL’s work that affect their businesses and their interests.
Communication, marketing and stakeholder outreach therefore play a substantial role in SANRAL’s performance of its unique role in the economy and social life of the country.
Information systems fulfil a closely related enabling function, not only as a medium of communication but also, in the SANRAL context, for their role in planning and managing complex projects and monitoring performance.
7.1 Communication and marketing
Periods of change create a thirst for communication. In 2017/18, the adoption of SANRAL’s new strategy, Horizon 2030, and its Transformation Policy called for extensive dialogue with affected stakeholders.
The agency’s Heads of Transformation, Strategy and Stakeholder Relations devoted themselves to a nationwide roadshow, which visited every province and involved 40 intense dialogue
7 Enabling Value Creation: Communication and Information Systems
sessions with some 2 000 participants. This process is described in greater detail on page 85.
In the face of this special communication initiative, SANRAL’s regular programme of communication and marketing activities was not only maintained but intensified:
• About R123m was invested in mass media advertising, advertorial and the distribution of newspaper inserts to keep communities informed about SANRAL and its work in their areas.
• Two 13-part radio dramas were developed for regional broadcast in order to support major road developments.
• There was regular interaction with journalists on issues related to the national road system: 110 media releases and 109 traffic advisories were distributed and 40 interviews conducted.
• SANRAL’s publication facility worked fulltime to produce 16 supplements (for distribution as inserts in newspapers), 11 newsletters, and 10 booklets and special publications.
• Scores of community and stakeholder events, ranging from discussions with local and provincial governments to corporate functions and career exhibitions, were organised during the year.
Stakeholder relations management
Interpersonal communication is invaluable especially in situations where people are facing change, as in the building of new roads or the introduction of new procurement policies.
SANRAL creates multiple opportunities for specific groups of stakeholders and members of the public to engage with its representatives. It is impossible to document all of them but some are described below.
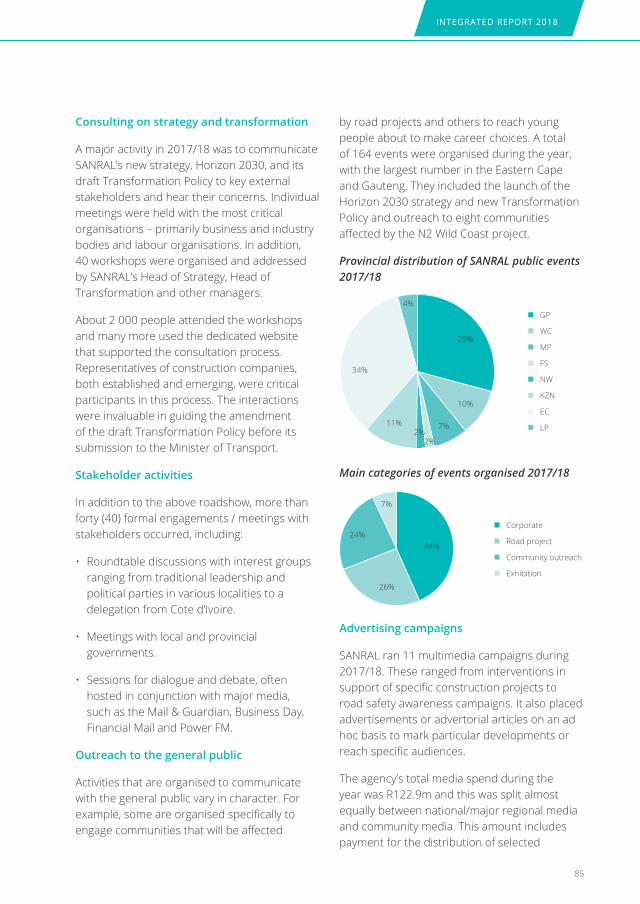
INTEGRATED REPORT 2018
85
Consulting on strategy and transformation
A major activity in 2017/18 was to communicate SANRAL’s new strategy, Horizon 2030, and its draft Transformation Policy to key external stakeholders and hear their concerns. Individual meetings were held with the most critical organisations – primarily business and industry bodies and labour organisations. In addition, 40 workshops were organised and addressed by SANRAL’s Head of Strategy, Head of Transformation and other managers.
About 2 000 people attended the workshops and many more used the dedicated website that supported the consultation process. Representatives of construction companies, both established and emerging, were critical participants in this process. The interactions were invaluable in guiding the amendment of the draft Transformation Policy before its submission to the Minister of Transport.
Stakeholder activities
In addition to the above roadshow, more than forty (40) formal engagements / meetings with stakeholders occurred, including:
• Roundtable discussions with interest groups ranging from traditional leadership and political parties in various localities to a delegation from Cote d’Ivoire.
• Meetings with local and provincial governments.
• Sessions for dialogue and debate, often hosted in conjunction with major media, such as the Mail & Guardian, Business Day, Financial Mail and Power FM.
Outreach to the general public
Activities that are organised to communicate with the general public vary in character. For example, some are organised specifically to engage communities that will be affected
by road projects and others to reach young people about to make career choices. A total of 164 events were organised during the year, with the largest number in the Eastern Cape and Gauteng. They included the launch of the Horizon 2030 strategy and new Transformation Policy and outreach to eight communities affected by the N2 Wild Coast project.
Provincial distribution of SANRAL public events 2017/18
GP
NW
MP
EC
WC
KZN
FS
LP
29%
10%
7%
2%2%
11%
34%
4%
Main categories of events organised 2017/18
Corporate
Community outreach
Road project
Exhibition
44%
26%
24%
7%
Advertising campaigns
SANRAL ran 11 multimedia campaigns during 2017/18. These ranged from interventions in support of specific construction projects to road safety awareness campaigns. It also placed advertisements or advertorial articles on an ad hoc basis to mark particular developments or reach specific audiences.
The agency’s total media spend during the year was R122.9m and this was split almost equally between national/major regional media and community media. This amount includes payment for the distribution of selected
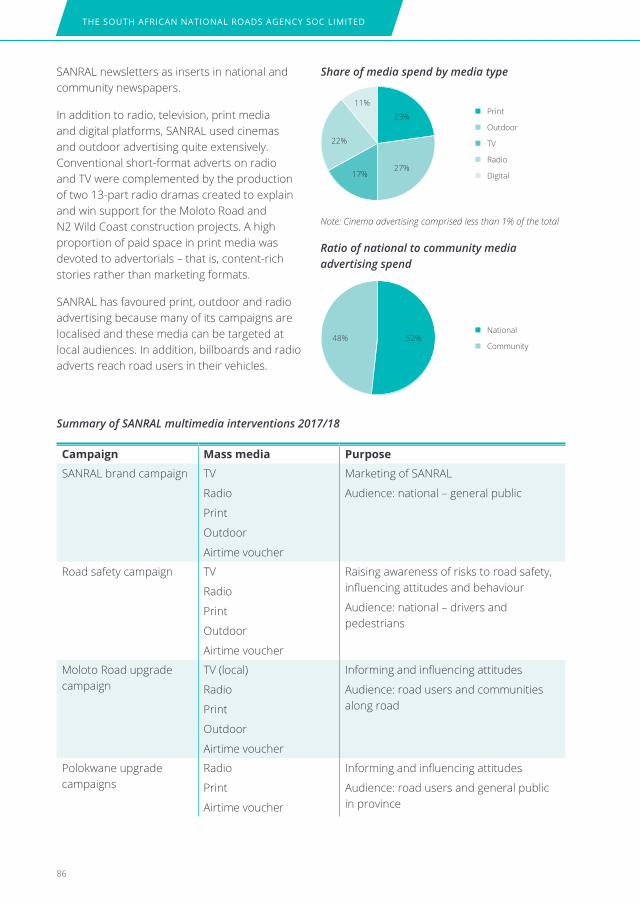
THE SOUTH AFRICAN NATIONAL ROADS AGENCY SOC LIMITED
86
SANRAL newsletters as inserts in national and community newspapers.
In addition to radio, television, print media and digital platforms, SANRAL used cinemas and outdoor advertising quite extensively. Conventional short-format adverts on radio and TV were complemented by the production of two 13-part radio dramas created to explain and win support for the Moloto Road and N2 Wild Coast construction projects. A high proportion of paid space in print media was devoted to advertorials – that is, content-rich stories rather than marketing formats.
SANRAL has favoured print, outdoor and radio advertising because many of its campaigns are localised and these media can be targeted at local audiences. In addition, billboards and radio adverts reach road users in their vehicles.
Note: Cinema advertising comprised less than 1% of the total
Ratio of national to community media advertising spend
Summary of SANRAL multimedia interventions 2017/18
TV
Outdoor
Radio
Digital
National
Community
23%
52%
27%17%
22%
48%
11%
Share of media spend by media type
Campaign Mass media Purpose
SANRAL brand campaign TV
Radio
Outdoor
Airtime voucher
Marketing of SANRAL
Audience: national – general public
Road safety campaign TV
Radio
Outdoor
Airtime voucher
Raising awareness of risks to road safety, influencing attitudes and behaviour
Audience: national – drivers and pedestrians
Moloto Road upgrade campaign
TV (local)
Radio
Outdoor
Airtime voucher
Informing and influencing attitudes
Audience: road users and communities along road
Polokwane upgrade campaigns
Radio
Airtime voucher
Informing and influencing attitudes
Audience: road users and general public in province
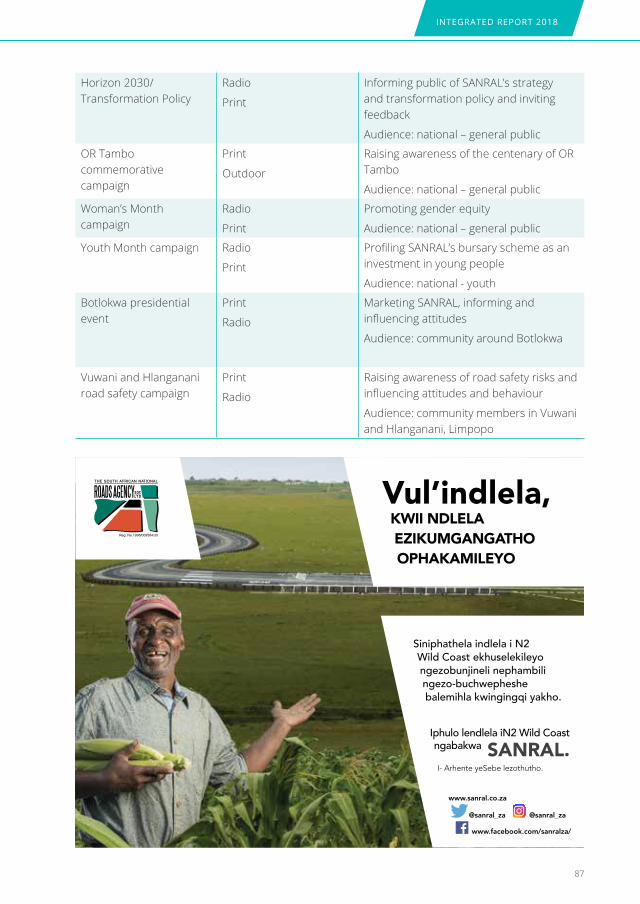
INTEGRATED REPORT 2018
87
Horizon 2030/ Transformation Policy
Radio
Informing public of SANRAL’s strategy and transformation policy and inviting feedback
Audience: national – general public
OR Tambo commemorative campaign
Outdoor
Raising awareness of the centenary of OR Tambo
Audience: national – general public
Woman’s Month campaign
Radio
Promoting gender equity
Audience: national – general public
Youth Month campaign Radio
Profiling SANRAL’s bursary scheme as an investment in young people
Audience: national - youth
Botlokwa presidential event
Radio
Marketing SANRAL, informing and influencing attitudes
Audience: community around Botlokwa
Vuwani and Hlanganani road safety campaign
Radio
Raising awareness of road safety risks and influencing attitudes and behaviour
Audience: community members in Vuwani and Hlanganani, Limpopo
Siniphathela indlela i N2 Wild Coast ekhuselekileyo ngezobunjineli nephambili ngezo-buchwepheshe balemihla kwingingqi yakho.
I- Arhente yeSebe lezothutho.
Iphulo lendlela iN2 Wild Coast ngabakwa SANRAL.
Vul’indlela,KWII NDLELA EZIKUMGANGATHO OPHAKAMILEYO

THE SOUTH AFRICAN NATIONAL ROADS AGENCY SOC LIMITED
88
FLORAH BLOSSOMS IN A MALE-DOMINATED INDUSTRY.
www.facebook.com/sanralza/
@sanral_za @sanral_za
www.sanral.co.za
To us, Soshanguve-born Florah Mokwena is the answer to the question ‘What can we do to empower women and inspire them to improve the lives of other women?’
We gave her all the support she needed so she could obtain a National Diploma in Human Resources at the Durban University of Technology – and again when she decided to further her studies with a B. Tech in Human Resources Management at the Tshwane University of Technology.
Florah is now a Human Resources Practitioner at our Northern Region offi ces and an inspiration to young women who want to break down doors in all other industries that are currently unoffi cial boys’ clubs. Take a bow, Florah.
SANRAL. Beyond roads.An agency of the Department of Transport.
Building South Africa through better roads.
PRINT ADS
ROAD SAFETY IS ABOUT GOING BEYOND THE EXPECTED.
SANRAL is committed to delivering world-
class roads to South Africa. This goes
beyond just the concrete and bitumen,
it is also about making sure that all our
road users are safe at all times.
Where possible, we retrofi t the road
environment to provide safe walkways
and bridges for pedestrians and
cyclists.
This is our commitment to road
safety.
SANRAL. Beyond roads.An agency of the Department of Transport.
All it took was a random high school visit to the longest
bridge in South Africa for young Daniel Govender
to know he was an engineer at heart. Admiring the
magnifi cent structure and what went into its design
and construction, he decided that day that that was
what he wanted to do with his life.
After excelling in matric, SANRAL awarded him
a bursary so he could pursue a career in civil
engineering. Today, Daniel boasts a BSc
(Hons) civil engineering degree from the
University of KwaZulu-Natal.
He’s now in Richards Bay on the Eteza
Overload Control Facility and Interchange
project for further training as a candidate
engineer. As SANRAL, this is proof that
we are committed to not only building
roads, but South Africa’s youth too.
SANRAL. Beyond roads.An agency of the Department of Transport.
WE ARE PROUD TO HELP DANIEL CROSS THE BRIDGE TO GREAT POSSIBILITIES.
Daniel Govender - Eastern Region Trainee Project Manager.
BEYOND ROADS IS LOVE.
There are times when a telephone call, an SMS or Whats-app message just won’t do.
That’s when you get onto our national road network, where we connect you with your favourite family members. There you’ll get a really tight hug, a kiss, a good laugh and the time to tell those really long stories - and reminisce over shared memories, well into the night.
So, why wait, let us connect you with what matters to you most, family.
Because beyond roads is love.
BLU
EPR
INT
156
8/E
SANRAL. Beyond roads.An agency of the Department of Transport.
CELEBRATING 100 YEARS OF OLIVER REGINALD TAMBO.On the 27th October 2017, we’ll celebrate the centenary of the birth of Oliver Reginald Tambo. His ideas
live on in our constitution and his vision for an inclusive, just and equitable society lives in our hearts. Join
us as we refl ect on our heritage and pay tribute to this revolutionary, thinker, humanist and mentor.
“Using the power you derive from the discovery of the truth about racism in South Africa, you will help us
to remake our part of the world into a corner of the globe on which all - of which all of humanity can be
proud.”
Oliver Reginald Tambo. 1917 - 1993
SANRAL. Beyond roads. An agency of the Department of Transport.
BLU
EPR
INT
169
5/E/
1
Reg. No. 1998/009584/30
Vul’indlela FOR FUTURE GENERATIONS.
The Eastern Cape’s untouched natural beauty is South Africa’s best-kept secret. Out here, we have magnifi cent grasslands, indigenous trees, game, bird and marine life. So, as we introduce the new N2 Wild Coast Road, bringing sustainable development for local communities, we work closely with the Eastern Cape Parks and Tourism Agency to minimise any negative impact on the environment. For a self-sustaining region, Vul’indlela.Vul’ i-Eastern Cape.
SANRAL. An agency of the Department of Transport.
N2 Wild Coast Road Project by
BLU
EPR
INT
173
9/E
TOGETHER ON THE ROAD AHEAD.
Growing the economy requires scanning the road ahead. Horizon 2030 is a strategy that will turn SANRAL into an organisation that better meets the needs of the South African people and economy. We are reviewing our operating and funding models as well as ensuring that our Transformation Policy prioritises ownership, equitable access, community empowerment, entry into rigid supply chains and SMME development and support in the construction and related industries. We are working together to enhance our core functions and drive greater effi ciency.
For more information and to comment on our Horizon 2030 strategy, email us at [email protected].
To comment on our Draft Transformation Policy, email us at [email protected].
You can also visit our website or write to us at PO Box 415, Pretoria, 0001. We also accept hand-delivered comments at our regional offi ces in Pietermaritzburg, Port Elizabeth, Western Cape or Pretoria (Menlo Park). (See website for addresses.)
Reg. No. 1998/009584/30
SANRAL. Beyond roads.An agency of the Department of Transport.
BLU
EPR
INT
180
4//E

INTEGRATED REPORT 2018
89
Media engagement and editorial coverage
SANRAL recognises the value of news coverage of its work on radio and TV and in print and online media. The agency strives to engage journalists pro-actively and to respond promptly to all queries from the media.
In 2017/18 the total value of coverage devoted to SANRAL was R95.1m, when measured at advertising value equivalence. Coverage generated proactively by SANRAL amounted to R37.2m or 39% of all coverage on the agency. It was secured through the issuing of media releases and traffic advisories, generation of opinion pieces, and arrangement of interviews, as well as responding to media queries.
As the graphs indicate, media coverage on SANRAL was driven less by controversy than in previous years. The number of journalist queries was down and the number of print articles that
In-house publications
SANRAL produces a range of printed and digital publications for the general public, various stakeholders and its own staff members. Most of these are regular publications, distributed on a monthly, quarterly or annual basis.
There are three basic methods of distribution: as supplements inserted in community, regional and national newspapers, digital distribution, and direct distribution in selected communities and at toll plazas through the agency’s regional offices.
Media releases Media queriesInterviews
166
90110
7940
129
347 356
200
2015/16 2016/17 2017/18
were neutral or positive in tone consistently exceeded those that expressed negative sentiment. Since positive media coverage included advertorials and supplements, the more revealing indicator of reporting sentiment is the low level of negative articles.
Measures of media engagement
Note: media releases exclude traffic advisories, 109 of which were issued in 2017/18
Sentiment of print articles on SANRAL in 2017/18
Apr
Num
ber o
f art
icle
s
600
500
400
300
200
100
0
May Jun Jul Aug Sep Oct Nov Dec Jan Feb Mar
Positive
Neutral
Negative
Mixed*
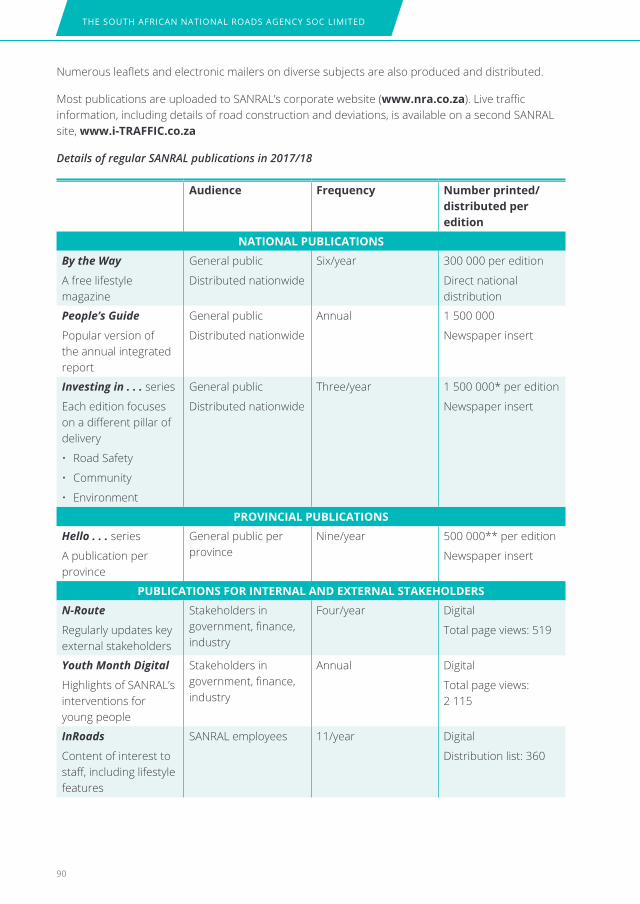
THE SOUTH AFRICAN NATIONAL ROADS AGENCY SOC LIMITED
90
Numerous leaflets and electronic mailers on diverse subjects are also produced and distributed.
Most publications are uploaded to SANRAL’s corporate website (www.nra.co.za). Live traffic information, including details of road construction and deviations, is available on a second SANRAL site, www.i-TRAFFIC.co.za
Details of regular SANRAL publications in 2017/18
Audience Frequency Number printed/distributed per edition
NATIONAL PuBLICATIONS
By the Way
A free lifestyle magazine
General public
Distributed nationwide
Six/year 300 000 per edition
Direct national distribution
People’s Guide
Popular version of the annual integrated report
General public
Distributed nationwide
Annual 1 500 000
Newspaper insert
Investing in . . . series
Each edition focuses on a different pillar of delivery
• Road Safety
• Community
• Environment
General public
Distributed nationwide
Three/year 1 500 000* per edition
Newspaper insert
PROVINCIAL PuBLICATIONS
Hello . . . series
A publication per province
General public per province
Nine/year 500 000** per edition
Newspaper insert
PuBLICATIONS FOR INTERNAL AND ExTERNAL STAkEhOLDERS
N-Route
Regularly updates key external stakeholders
Stakeholders in government, finance, industry
Four/year Digital
Total page views: 519
Youth Month Digital
Highlights of SANRAL’s interventions for young people
Stakeholders in government, finance, industry
Annual Digital
Total page views: 2 115
InRoads
Content of interest to staff, including lifestyle features
SANRAL employees 11/year Digital
Distribution list: 360
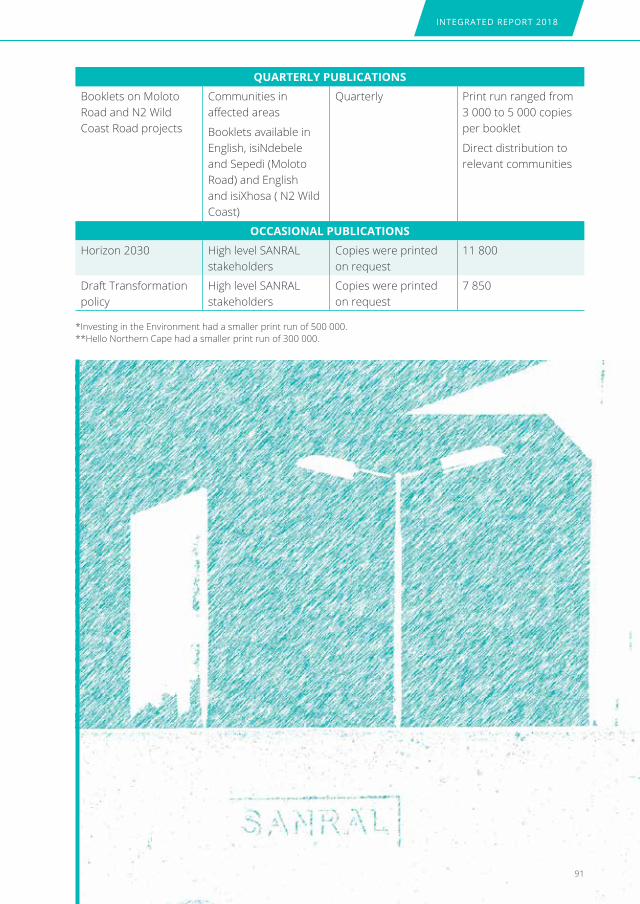
INTEGRATED REPORT 2018
91
QuARTERLY PuBLICATIONS
Booklets on Moloto Road and N2 Wild Coast Road projects
Communities in affected areas
Booklets available in English, isiNdebele and Sepedi (Moloto Road) and English and isixhosa ( N2 Wild Coast)
Quarterly Print run ranged from 3 000 to 5 000 copies per booklet
Direct distribution to relevant communities
OCCASIONAL PuBLICATIONS
Horizon 2030 High level SANRAL stakeholders
Copies were printed on request
11 800
Draft Transformation policy
High level SANRAL stakeholders
Copies were printed on request
7 850
*Investing in the Environment had a smaller print run of 500 000. **Hello Northern Cape had a smaller print run of 300 000.
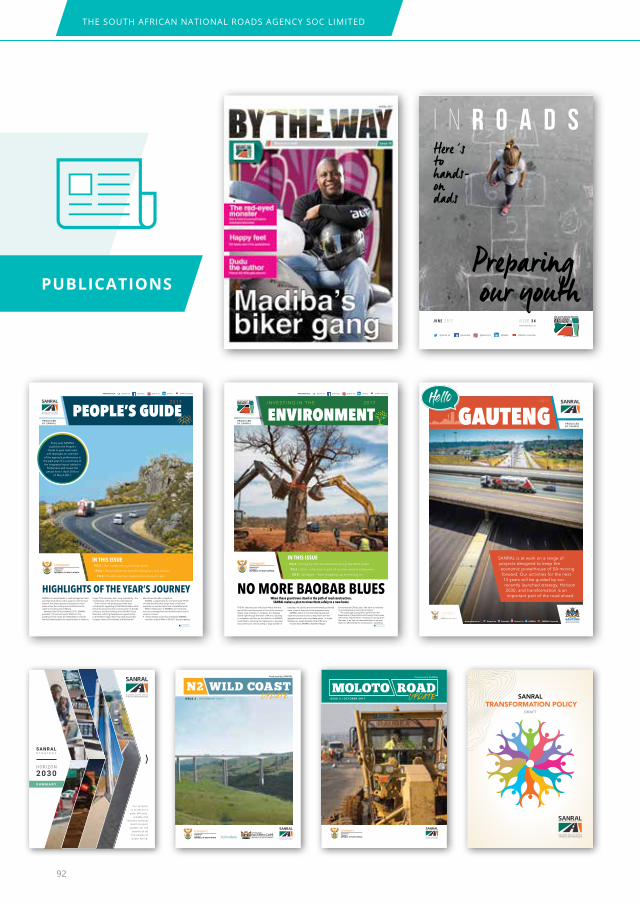
THE SOUTH AFRICAN NATIONAL ROADS AGENCY SOC LIMITED
92
J U N E 2 0 1 7 i s s u e 3 4
i n r o a d sHere ’s to hands-on dads
www.sanral.co.za
@sanralza SANRAL Corporate @sanral_za @sanral_za
our youthPreparing
SANRAL
SANRAL is a world leader in road management and provides South Africa with a superior national road network that allows goods and people to move easily across the country and contributes to the nation’s economy and wellbeing.
Between April 2016 and March 2017, SANRAL awarded 172 contracts worth R16bn for the building of new roads, the rehabilitation of those that had deteriorated, the improvement of roads no
HIGHLIGHTS OF THE YEAR’S JOURNEYlonger fit for purpose, and – very importantly – the maintenance of the rest of the road network.
Some critical new projects got under way, including the upgrading of the Moloto Road, which links three provinces and is notorious for its deadly collisions, and the building of the N2 Wild Coast Road that will bring development opportunities to the Eastern Cape. New ring roads around the Limpopo towns of Polokwane and Musina will
alleviate acute traffic congestion.SANRAL is responsible for maintaining 22 197km
of roads and this takes a high level of technical expertise, as well as careful use of available funds.
While infrastructure is SANRAL’s core business, economic development and transformation also lie close to its heart.• Small, medium and micro enterprises (SMMEs)
earned a total of R4bn in 2016/17 by participating
TURN TO PAGE 2
PG 3 | Our roads are a priceless asset
PG 6 | Smart solutions benefit designers and drivers
PG 8 | Private partners extend corridors of care
IN THIS ISSUE
@sanralza SANRAL Corporate @sanral_za @sanral_za SANRALwww.sanral.co.za
PRODUCED BY SANRAL
PEOPLE’S GUIDE2017
Every year SANRAL publishes the People’s
Guide to give road users and taxpayers an overview
of the agency’s performance in the past year. It is a summary of the integrated report tabled in
Parliament and covers the period from 1 April 2016 to
31 March 2017.
5194_SANRAL_People's guide REPRO.indd 1 2017/11/28 2:56 PM
ENVIRONMENTINVESTING IN THE 2017
THE N1 national route links South Africa with the rest of Africa and forms part of one of the country’s largest road networks. In Limpopo, the highway roared right through the heart of Musina, resulting in congestion and the risk of collisions, so SANRAL committed to rerouting the highway to a ring road around the town. Unfortunately, a large number of
NO MORE BAOBAB BLUESbaobabs, the sacred and environmentally protected trees, stood in the path of the proposed route.
SANRAL called in environmental experts and experienced tree movers to help them with the gargantuan task of moving these giants – a single baobab can weigh between 20 and 80 tons.
Victoria Bota, SANRAL’s Northern Region
Environmental Officer, said: “We want to minimise or avoid adverse environmental impact.”
The roads agency acquired a permit from the Department of Agriculture and Forestry that comes with certain requirements. “Instead of cutting down the trees, if we can, we relocated them to an area that’s not affected by the construction,” said Bota.
TURN TO PAGE 2
PG 3 | Caring for the environment along the Wild Coast
PG 6 | Litter collection is part of routine road maintenance
PG 8 | Spillages – from mopping up to moving on
IN THIS ISSUE
@sanralza SANRAL Corporate @sanral_za @sanral_za SANRALwww.sanral.co.za
PRODUCED BY SANRAL
When these giant trees stand in the path of road construction, SANRAL makes a plan to move them safely to a new home
5099_SANRAL_Investing in the environment supplement_REPRO.indd 1 2017/09/14 12:31 PM
SANRAL is at work on a range of projects designed to keep the economic powerhouse of SA moving forward. Our activities for the next 13 years will be guided by our recently launched strategy, Horizon 2030, and transformation is an important part of the road ahead
www.sanral.co.za @sanralza SANRAL Corporate @sanral_za @sanral_za SANRAL
2017
PRODUCED BY SANRAL
2017
GAUTENG
CORPORATE IDENTITY mANuAlLOGO FORmAT
GAUTENGPROVINCIAL GOVERNMENTREPUBLIC OF SOUTH AFRICA
OffICE Of ThE PREMIER REPUBLIC OF SOUTH AFRICA
GAUTENG PROVINCE
GAUTENGPROVINCIAL GOVERNMENTREPUBLIC OF SOUTH AFRICA
Gauteng Provincial Government Stacked logo
Gauteng Provincial Government Horizontal logo
Gauteng Provincial Government Department logo
S U M M A R Y
HORIZON 2030
S T R A T E G Y SANRAL
Our purpose is to del iver a
safe , eff ic ient , re l iable and
resi l ient nat ional road transpor t system for the
benef i t of a l l the people of South Afr ica. Vul’indlela
N2 WILD COASTI SSUE 3 | DECEMBER 2017 U P DA T E
Produced by SANRAL
Province of the
REPUBLIC OF SOUTH AFRICAEASTERN CAPE
MOLOTO ROADI SSUE 2 | OCTOBER 2017
Produced by SANRAL
SANRAL TRANSFORMATION POLICY
DRAFT
5135 Transformation policy booklet_REPRO.indd 1 2017/09/26 4:27 PM
PuBLICATIONS

INTEGRATED REPORT 2018
93
Social media
SANRAL has a presence on multiple social media platforms and posted thousands of items – including traffic updates – during the course of the year. There was strong growth across all platforms in terms of followers and their level of engagement.
Although live traffic news may be the information that attracts people to SANRAL social media, the agency ensures that fresh posts on a wide range of its activities are always available.
Summary of SANRAL social media following and activity
Type of social media platform
Total followers/ fans/subscribers 31 March 2018
Annual growth in followers/ fans/subscribers
SANRAL posts/tweets/ uploads
Engagement
Facebook 113 492 115% 1 772 posts 67 094 pageviews
850 conversations
Twitter 15 630 120% 4 405 tweets 10 451 retweets
4 650 replies
1 117 conversations
YouTube 388 31% 39 videos 273 likes
Instagram 1 895 35% 597 posts 3 155 likes
200 comments
595 conversations
LinkedIn 3 377 14% 102 posts 65 comments
103 conversations
7.2 Information Technology
The activities of the Information Technology Department in the past year have focused on enabling SANRAL employees with mobile apps and cloud-based capabilities that offer expanded options to work with consistent functionality from anywhere and on any device.
The department has undertaken major strategic IT projects at a total investment of R185m. They included the following:
• Completion of the data centre and network upgrade
• Managed cyber security services
• Office 365 deployment
• Wifi installation at head office and all regional offices
• Improvement of IT facilities at the Technical Excellence Academy.
Converged data centre systems
The planned upgrade of SANRAL’s outdated data centre and the related modernisation of business processes were achieved during the course of 2017/18. The benefits of the new systems include:
• Improved operational cost, workload efficiency and ability to rapidly scale up new workloads.
• Enabling staff and business operations through high-performing business applications.
• Agile infrastructure that requires less staff time to deploy and support.
THE SOUTH AFRICAN NATIONAL ROADS AGENCY SOC LIMITED
94
The complex data centre upgrade was successfully concluded without any downtime or data losses. This was a remarkable achievement and required close coordination between business and information technology stakeholders.
Management of cyber security
SANRAL is fully alert to the need to prioritise investment in cyber security. Its managed cyber security service recently undertook a complex upgrade and refresh of all information security hardware and tools within SANRAL. The service includes intrusion detection, mobile device management, replacement of perimeter and internal firewalls, vulnerability scanning and anti-virus services.
The decision to procure a managed cyber security service has been hugely beneficial in terms of ensuring that security receives dedicated attention from specialists while the in-house IT team supports SANRAL’s general business requirements. In particular, the arrangement provides access to:
• Specialised, up-to-date security technology and teams of seasoned security experts who can respond in real-time to an attack.
• An advanced security operations centre, delivering cutting-edge threat detection, threat intelligence, incident response and security device management.
• Enhanced capacity to find, fix and remediate vulnerabilities, with more predictable and manageable security costs.
Office 365
The deployment of Office 365 has enabled SANRAL’s employees to embrace new capabilities for working digitally and productively. Office 365 has:
• Streamlined knowledge-sharing through document management.
• Enhanced mobile access for anywhere, anytime productivity.
In short it has enabled all employees to accomplish tasks and work with files, co-workers and external stakeholders to move the business forward, remaining productive and effective regardless of geographical location.
The data centre upgrade, managed security service and introduction of Office 365 have been complemented by the successful incorporation of video conferencing practices and wide area network (WAN) deployments.
The video conferencing facility installed the previous year paid dividends in 2017/18 in terms of increased meeting productivity and a reduction in the cost and time expended on travel between regions and head office.
Governance
The IT Governance Steering Committee is mandated by the Board to ensure the ethical and effective management of IT resources. In addition, audits are periodically undertaken by Business Innovation Group (BIG) – a contracted service provider – which examines the following:
• IT general controls
• SAP basis controls
• Application system controls (ITIS)
• IT governance.
The 2017 audit yielded good ratings with zero findings.
The Steering Committee has identified the following strategic and information governance objectives:
• Develop a new five-year information technology strategy aligned with the strategic objectives of Horizon 2030.
• Develop a better integrated IT scorecard that incorporates in-house and outsourced projects.
• Continue to improve and maintain organisational structures, relationships and frameworks.

INTEGRATED REPORT 2018
95
• Manage technology resources and assets, including information, in an efficient and effective manner in order to derive value from such assets.
• Establish performance criteria aligned with operational expectations of the business.
Focus areas in 2018/19
A priority for the coming year is a major upgrade of SAP systems in order to simplify and integrate SANRAL’s IT infrastructure which is currently
characterised by fragmentation that hampers efficiency.
The agency also intends to explore the possibility of building a private wide area network (WAN) that would connect the SANRAL offices, the toll plazas and traffic control centres. SANRAL has granted servitudes on its land to telecommunications service providers in order for them to roll out their fibre infrastructure. The agency will investigate whether it would be possible to utilise this fibre to develop its own WAN.

THE SOUTH AFRICAN NATIONAL ROADS AGENCY SOC LIMITED
96
ACRONYMS AND ABBREVIATIONS
AVE Advertising value equivalence
Bakwena Bakwena Platinum Corridor Concessionaire
BBBEE Broad-based black economic empowerment
CCTV Closed circuit television cameras
CEO Chief executive officer
cidb Construction Industry Development Board
COTO Committee of Transport Officials
CSIR Council for Scientific and Industrial Reseach
DEA Department of Environmental Affairs
DMR Department of Mineral Resources
DOT Department of Transport
DWS Department of Water and Sanitation
EC Eastern Cape
EWT Endangered Wildlife Trust
FS Free State
FMS Freeway management system
FTE Full-time equivalent
GDP Gross domestic product
GFIP Gauteng Freeway Improvement Project
GP Gauteng
ICT Information communication technology
IT Information technology
Km Kilometres
KZN KwaZulu-Natal
INTEGRATED REPORT 2018
LP Limpopo
MP Mpumalanga
NC Northern Cape
NEMA National Environmental Management Act
NMU Nelson Mandela University
NW North West
N3TC N3 Toll Concession (RF) Proprietary Limited
OCI Overall condition index
PFMA Public Finance Management Act
PPP Public-private partnerships
RRM Routine Road Maintenance
SANRAL South African National Roads Agency SOC Limited
SAQA South African Qualifications Authority
SIP Strategic Integrated Projects
SMME Small, medium and micro enterprise
SOC State-owned company
STEM PP Science Technology Engineering and Mathematics Pipeline Project
SU Stellenbosch University
TEA Technical Excellence Academy
TRAC Trans African Concessions
UCT University of Cape Town
UFS University of the Free State
UP University of Pretoria
WIM Weigh-in-motion

THE SOUTH AFRICAN NATIONAL ROADS AGENCY SOC LIMITED
98
NOTES

INTEGRATED REPORT 2018
99

ThE SOuTh AFRICAN NATIONAL ROADS AGENCY SOC LTD (SANRAL)Head office
48 Tambotie Avenue, Val de Grace, PretoriaPO Box 415, Pretoria, 0001 South Africa
Tel: +27 (0) 12 844 8000Fax: +27(0) 12 844 8200
www.sanral.co.za
Registration Number: 1998/009584/30RP 179/2017
ISBN: 978-0-621-46606-5
Produced by Communications and Marketing SANRAL, PretoriaTel: +27 (0) 12 844 8000
Contact Details for SANRAL’s Fraud Hotline/Tip-Offs AnonymousToll-Free Phone No: 0800 204 558
Toll-Free Fax No: 0800 007 788E-mail: [email protected]
Postal address: Tip-Offs Anonymous, Freepost DN 298, Umhlanga Rocks
2018 INTEGRATED REPORTVolume 2
Corporate GoVernanCe & FinanCial StatementS
Goals can only be achieved if efforts and courage are driven by purpose and direction
THE SOUTH AFRICAN NATIONAL ROADS AGENCY SOC LIMITED
2
INTEGRATED REPORT 2018
3
Integrated Report 2017/18
The South African National Roads Agency SOC Limited
Reg no: 1998/009584/30

4
tHe SoutH aFriCan national roaDS aGenCY SoC limiteD
The South African National Roads Agency SOC Limited
About the SANRAL Integrated Report 2018
The 2018 Integrated Report of the South African National Roads Agency (SANRAL) covers the period 1 April 2017 to 31 March 2018 and describes how the agency gave effect to its statutory mandate during this period.
The report is available in printed and electronic formats and is presented in two volumes:• Volume 1: Integrated Report is a narrative and statistical description of major developments during the year and value
generated in various ways.• Volume 2: Corporate Governance and Annual Financial Statements contains the sections on corporate governance,
performance against key performance indicators, and annual financial statements.
2018 is the second year in which SANRAL has adopted the practice of integrated reporting, having previously been guided solely by the approach adopted in terms of the Public Finance Management Act (PFMA). The agency has attempted to demonstrate the varied dimensions of its work and indicate how they are strategically coherent. It has continued to comply with the reporting requirements of the PFMA while incorporating major principles of integrated reporting.
This new approach is supported by the adoption of an integrated planning framework in SANRAL’s new strategy, Horizon 2030.
In selecting qualitative and quantitative information for the report the agency has been guided by Horizon 2030 and the principles of disclosure and materiality. SANRAL has attempted to provide concise but reasonably comprehensive information that enables the reader to make an assessment of the agency. The following criteria guided the selection of content
Internal criteria External criteria
Company vision, mission, mandate and values, plus published code of ethics
Developments in the global and national economic and political environment that present challenges and opportunities for the agency
Objectives, shareholder targets, associated key performance indicators (KPIs), policies, processes and procedures
Regulatory changes that impact on SANRAL’s operations
Expectations and feedback from stakeholders, including the shareholder, employees, suppliers, customers, communities where we operate, regulators and environmental organisations
Guidance provided by independent expert advisors
Key risks affecting the company and guidance provided by SANRAL’s management, specialist employees and auditors about the risk response
Factors impacting reputation
The report presents certain data by racial category, population group and gender. This is purely in the interests of monitoring progress in terms of transformation and not because SANRAL attaches any other importance to such distinctions.
5
inteGrateD report 2018
Table of contents SECTION 3: CORpORATE GOVERNANCE....................................................................................
1 King IV Declaration...........................................................................................
2 Corporate Performance Information...............................................................
3 Report of the Audit and Risk Committee........................................................
SECTION 4: CONSOLIdATEd FINANCIAL STATEmENTS...........................................................
1 Report of Auditor-General................................................................................
2 Directors’ Report...............................................................................................
3 Statement of Responsibility by Board of Directors.......................................
4 CertificateofCompanySecretary...................................................................
5 Audited Financial Statements..........................................................................
7
8
24
30
35
36
44
52
53
54

THE SOUTH AFRICAN NATIONAL ROADS AGENCY SOC LIMITED
6
INTEGRATED REPORT 2018
7
sEcTION 3
King IV Declaration 8
Corporate Performance Information 24
Report of the Audit and Risk Committee 30
THE SOUTH AFRICAN NATIONAL ROADS AGENCY SOC LIMITED
8
Section 3: Corporate Governance
1. King IV declaration
SANRAL subscribes to King IV and recognises its importance in listing principles and practices to guide corporate governance practice.
SANRAL prides itself on its commitment to good governance practice as it delivers on its mandate of providing an effective national road network using state and investor funding. The tone for ethical business practice is set by the accounting authority (the Board) and it filters through the fabric of the organisation.
SANRAL believes that it applies the first 16 principles of King IV (which are relevant to SANRAL) in the conduct of its business, to ensure efficient service delivery and to achieve an ethical culture, good performance, effective control and legitimacy. This section explains the application of each of the 16 principles within SANRAL.
1.1 Leadership, ethics and corporate citizenship
LeadershipPrinciple 1: The accounting authority (Board, governing body) should lead ethically and effectively.The functioning and conduct of the Board and its committees are guided by charters and the Board code of conduct. These are reviewed and approved annually.
The importance of acting in the best interest of SANRAL is understood by all Board members. The avoidance of conflicts of interest is proactively managed by an annual disclosure of interests in writing and also by disclosure at every Board and committee meeting. In terms of the Board charter and code of conduct, members may not contract with SANRAL in their individual capacities.
The Board is provided with training as required with respect to governance and the core functions of SANRAL. This is to enable the Board to set strategic direction, monitor implementation and performance, oversee risk management and ensure adequate, responsible disclosure of activities and performance within the current social, economic and environmental context.
Organisational ethicsPrinciple 2: The accounting authority should govern the ethics of the organisation in a way that supports the establishment of an ethical culture.The Board approves SANRAL’s human resources (HR) policy, which incorporates the code of conduct for employees. Important principles include the annual declaration of interests with updates as and when there may be potential conflicts of interest. Such declaration of interests is required from Board members, employees and suppliers (as part of the tender process). The maintenance of confidentiality, transparency, independence of decisions and clean procurement processes are part of the code of conduct which becomes binding on signature of the employment contract. There is, in addition, a code of conduct for supply chain management (SCM) which all SANRAL’s SCM practitioners sign on an annual basis.
Ad hoc checks are done on SANRAL employees through the Companies and Intellectual Property Commission (CIPC) website to establish whether they hold directorships of companies which could lead to a conflict of interest.
Employee induction presentations and the annual governance, risk and compliance roadshows are attended by all employees in order to reinforce the importance of ethical behaviour.
The Board reviews the Anti-Fraud and Corruption Policy and Risk Management Policy annually.
SANRAL has a fraud hotline for employees and external parties, including service providers, to report suspected fraud anonymously. The line is independently monitored.
SANRAL has a zero-gift policy – employees may not accept from service providers any gifts offered to them by virtue of being SANRAL employees. This is to ensure that there is no compromise of independence and transparency in decision-making. Should any clause of the code of conduct or relevant policies be breached, consequence management is mandatory and this may include disciplinary action.
All supplier contracts include a requirement to disclose any conflicting interests. Employees serving as bid specification, evaluation and adjudication committee members for the evaluation and awards of bids must disclose any conflict of interest and recuse themselves from any further involvement. The same goes for any directors involved in the award of major contracts.

INTEGRATED REPORT 2018
9
The recruitment and appointment of employees is preceded by the necessary checks on personal credentials, criminal history, credit standing, qualifications and references.
Corporate citizenshipPrinciple 3: The accounting authority should ensure that the organisation is, and is seen to be, a responsible corporate citizen.Given SANRAL’s responsibility for managing a major national asset – the national road network – the agency seeks to contribute to the wellbeing, development and empowerment of citizens of the country. It does so in diverse ways, including internal and external transformation initiatives. Internally, these include the practice of equity, respect for diversity and the provision of skills development opportunities to employees. External initiatives target the development of SMMEs and communities through job creation and enterprise development opportunities. They also include skills development through scholarships, bursaries, internships and partnerships with universities. Site or contractor staff are provided project-related training in both business management and technical skills. Community development projects ensure the provision of access and mobility in rural communities and road safety projects improve safety on roads through infrastructure such as sidewalks and pedestrian bridges.
(a) Employees - SANRAL endeavours to demonstrate that it values its employees through HR practices including the following:
Employment equity: SANRAL has a three-year Employment Equity Plan, the implementation of which is monitored by the Social, Ethics and Transformation Committee (SETC). Performance against targets is reported to the Board and the Minister of Transport annually.
Fair remuneration: Measures to ensure fair remuneration include a yearly salary review, based on an industry comparison and performed by an external company. This ensures that SANRAL’s remuneration structure is in line with the market. The SETC and Board approve yearly remuneration adjustment levels. Positions are evaluated and graded annually to ensure that employees undertaking a particular scope of work are remunerated in accordance with experience and skills.
Safety, health and dignity: SANRAL offers a comprehensive wellness programme in the interests of employees.
Employee development: The work skills plan, which is derived from each individual’s development plan, determines the career development path for each employee. There are other initiatives, such as internal bursaries, for staff who have an interest in further education.
(b) Economy: SANRAL endeavours to provide the nation with an effective network of highways and freeways. The national road network is critical for the movement of people and goods across the nation and the infrastructure must be maintained in optimal condition to service the South African economy.
SANRAL ensures that all contracts valued above R40m are registered with the Department of Labour. An occupational health and safety practitioner is appointed to oversee the site and ensure that all plans comply with safety regulations.
All contracts stipulate a minimum percentage for locally sourced workers and this contributes to the development of communities. All contractors must comply with the legal wage levels and adhere to the Basic Conditions of Employment Act. SANRAL also provides opportunities to SMMEs and small contractors to work on its projects. SANRAL’s community development projects improve mobility within communities.
SANRAL’s draft Transformation Policy was launched by the Minister of Transport in September 2017 for consultation with various stakeholders. The document has been subjected to extensive examination by external stakeholders and now awaits further consultations with and final recommendations from government stakeholders. Several measures have been implemented to fast-track transformation within the construction industry, with more under consideration for implementation.
(c) Environment - Integrated thinking and practice has been entrenched in SANRAL for years. SANRAL has adopted, the principle of continual improvement from the ISO 14000 series of environmental standards. SANRAL has reported over the years on environmental management and sustainability, in line with its corporate strategies, environmental policy and objectives. Reporting covers compliance with legislative requirements, as well as other material topics that fall within the realm of business goals and sustainability. These topics include policy, research and its applications, cooperative governance, key environmental impact assessments, and national priorities such as skills development and climate change mitigation efforts. Reports highlight the links between governance and risk management, as well as overall organisational performance in terms of environmental compliance and impact management, setting and meeting suitable sustainability goals and targets, and continuing the culture of corporate citizenship.
THE SOUTH AFRICAN NATIONAL ROADS AGENCY SOC LIMITED
10
(d) Society - SANRAL provides scholarships, external bursaries and internships to enable skills development. SANRAL also supports the Chair in Mathematics, Natural Science and Technology Education at the University of the Free State, the Chair in Pavement Engineering at the University of Stellenbosch and the Chair in Transport Planning at the University of Cape Town. SANRAL’s Technical Excellence Academy in Port Elizabeth provides the required training to accelerate professional registration of engineering graduates.
The impact of SANRAL’s road construction projects on society is carefully monitored and discussed with the communities they affect through planned stakeholder engagements.
Targets pertaining to some of the above performance areas have been included in Annual Performance Plan, performance against which are monitored on a quarterly basis generally.
1.2 Strategy, performance and Reporting
Strategy and performancePrinciple 4: The accounting authority should appreciate that the organisation’s core purpose, its risks and opportunities, strategy, business model, performance and sustainable development are all inseparable elements of the value chain. The Board is responsible for setting strategic direction. In 2017/18, the Board approved SANRAL’s strategy framework until 2030. It was launched by the Minister of Transport in September 2017. The Board also reviews the risks which could influence the achievement of strategic objectives and is accountable for risk management.
Strategic objectives are backed by key performance indicators which have specific annual targets, most of which are monitored quarterly, or else semi-annually or annually. These KPIs are also linked to the individual performance agreements of employees. The KPIs measure the performance of important aspects of SANRAL’s business such as road asset performance, road safety, transformation efforts, finance, research, stakeholder relations and environmental management.
The ultimate aim is for SANRAL to deliver against its mandate and to make a real contribution to the lives and businesses of the stakeholders affected by SANRAL’s activities. The stakeholders include the employees, road users and communities along the national network.
ReportingPrinciple 5: The accounting authority should ensure that reports issued by the organisation enable stakeholders to make informed assessments of the organisation’s performance, and its short-, medium- and long-term prospects.SANRAL’s Integrated Report which includes the annual financial statements, is published on the SANRAL website. The Integrated Report includes the governance disclosures with respect to the King IV Code.
The Integrated Report provides information on SANRAL’s contribution to the national road infrastructure, transformation and empowerment, performance with respect to targets and financial performance.
1.3 Governing Structures and delegation
primary role and responsibilities of the accounting authorityPrinciple 6: The accounting authority should serve as the focal point and custodian of corporate governance in the organisation. The Board’s role and responsibilities are detailed in the Board charter. The functions include the setting of strategic direction, the approval of policy, the oversight of implementation and accountability through appropriate disclosure in the Integrated Report and through performance management and reporting. The Board is comfortable that it has fulfilled its responsibilities in line with the Board charter and the Board code of conduct, and it has served as the custodian of corporate governance within the organisation.
The Board has engaged actively with the shareholder representative, the Minister of Transport, and with other Government and political stakeholders to deal with various challenges, such as the funding crisis faced by SANRAL due to non-payment of e-tolls on the Gauteng Freeway Improvement Project (GFIP). Another matter of concern has been the protest action at project sites and the resultant disruption of work, which is also being dealt with by Management, the Board and relevant provincial authorities.
The Board held nine meetings during the year, with attendance as in the table below.
The Shareholder Meeting (AGM) 2017 was held on 30 October 2017.

INTEGRATED REPORT 2018
11
2017 2018
director position 4 may*
30 may
4 July*
15 Aug
22 Aug*
8 Nov
28 Nov*
30 Jan
27 mar
Mr R Morar Chairperson, non-executive
√ √ A √ √ √ √ √ √
Mr C Hlabisa Non-executive √ √ √ A A √ √ √ √
Ms Z Kganyago Non-executive √ √ √ √ A A √ √ √
Ms A Lawless Non-executive √ √ √ A √ √ √ √ A
Ms Mashile- Nkosi
Non-executive A √ A √ √ A A √ √
Mr M Matete Non-executive √ √ √ √ √ √ √ √ √
Ms A Halstead Non-executive √ √ A A A √ √ √ √
Mr S Macozoma CEO Executive
√ √ √ √ √ √ √ A √
*: Special meetings√: PresentA: Absent
Composition of the accounting authorityPrinciple 7: The accounting authority should comprise the appropriate balance of knowledge, skills, experience, diversity and independence for it to discharge its governance role and responsibilities objectively and effectively. SANRAL’s sole shareholder is the government, represented by the Minister of Transport. Most Board members are appointed by the Minister of Transport in terms of the SANRAL Act No 7 of 1998, as amended.
The Board comprises eight members. Ms Avril Halstead, is a non-executive member representing National Treasury and is appointed by the Minister of Finance. Mr Chris Hlabisa represents the Department of Transport. The CEO is the only executive member.
The other five members are non-executive, independent members who serve for a maximum of two terms of three years each.
Board members include four engineers, one chartered accountant and three finance and business specialists. They are considered to represent a good mix of skills relevant to SANRAL.
There is an equal number of male and female members.
Experience of SANRAL Board members
director position in SANRAL Age Length of service on Board
Othersignificantboardmembership/shareholding/professionalpositions
Mr R Morar Chairperson, non-executive, independent
51 6 years 4 months Capital Appreciation LimitedMorar IncorporatedHarith Fund Managers
As a chartered accountant and certified fraud examiner, Mr Morar has extensive experience relating to financial and business management. He has undertaken audit and forensic assignments in both the public and private sectors. He has served on various public- and private-sector boards, where his positions have included chairperson and chair of the audit committee.
Ms A Halstead Non-executive 41 2 years None
Ms Halstead has been a Chief Director at National Treasury for more than 11 years. She is responsible for overseeing approximately 40 state-owned enterprises. Prior to joining National Treasury, she worked for McKinsey & Company, Old Mutual and Wipcapital, a subsidiary of Wiphold.

THE SOUTH AFRICAN NATIONAL ROADS AGENCY SOC LIMITED
12
Mr C Hlabisa Non-executive 56 4 years 6 months Roadside Abattoir (Pty) Ltd, Amangotsha Enterprises CC
As Deputy Director-General: Roads Transport in the Department of Transport (DoT), Mr Hlabisa is responsible for road engineering standards, road infrastructure and industry development, road regulation, driving licence card entity oversight, public entity oversight and Strategic Integrated Projects (SIPs). Prior to his appointment to the DoT in 2013, he was Head of Department at the KZN Department of Transport.
Ms Z Kganyago
Non-executive, independent
51 3 years Tsogo Sun Gaming, Hospitality Property Fund and Arctograph Investments (Pty) Ltd
Ms Kganyago’s experience is in the area of property planning, development and management.
Dr A Lawless Non-executive, independent
65 3 years SAICE Professional Development and ProjectsAllyson Lawless and Associates (Pty) LtdTortoise Investments (Pty) Ltd
As MD of SAICE Professional Development and Projects since 2004, Dr Lawless has launched many engineering skills development initiatives, and has served on many national structures relating to engineering qualifications, skills and innovation. Her early career was in consulting. With the emergence of desktop computers, she became a pioneer in developing the local civil engineering software market.
Ms D Mashile- Nkosi
Non-executive, independent
59 3 years Kalagadi Manganese (Pty) Ltd, Temoso Telecommunications, Women’s Development Bank Investment Holdings (Pty) Ltd, Eyesizwe Mining (Pty) Ltd
Ms Mashile-Nkosi has a strong development background as an activist on gender issues. She encourages business to improve the quality of life of poor communities and to nurture women entrepreneurs and business leaders.
Mr M Matete Non-executive, independent
49 3 years 3M Consulting
Mr Matete has been in business since 2001 and has more than seven years’ experience as a non-executive member of boards. He has been involved in the civil engineering and transportation engineering fields for more than 21 years. He has experience in business establishment and development.
Mr S Macozoma
CEO, executive 42 1 year 4 months None
Following 10 years at the Council for Scientific and Industrial Research (CSIR), as a trainee engineer and research engineer, Mr Macozoma joined the DoT as a Chief Director from 2005, he was responsible for road, rail and aviation infrastructure. He served on the 2010 FIFA World Cup Organising Committee and was responsible for transport, logistics, accommodation and hospitality. He then served as MD of the Johannesburg Roads Agency and for a short period as CEO of the Electronic Toll Concession Ltd. He joined SANRAL as CEO in December 2016.
Experience of external advisors to the Audit and Risk Committee:
Advisor position in SANRAL Age Length of service as advisor
Othersignificantboardmembership/shareholding/professionalpositions
Mr Akhter Hoosen Moosa
Advisor – Audit and Risk Committee
65 2 years Pitlake Investments (Pty) Ltd, Taycar Property Investments (Pty) Ltd, South African Airways, Competition Tribunal, SAA Technical (Pty) Ltd, Encha (PMB) (Pty) Ltd, Distribution and Warehousing Network (Pty) Ltd, Manzanilla (Pty) Ltd
Mr Moosa was CEO and later chair of MSGM Masuku, a firm of auditors and accountants which subsequently merged with PricewaterhouseCoopers (PwC). He then served on the executive committee of PwC and later on its governing board. He also led the firm’s transport and logistics industry group, until his retirement in 2013.
Mr Mhleli Papama Nkukwana
Advisor – Audit and Risk Committee
49 6 months None
Mr Nkukwana has over 25 years’ experience in the information and communication technology field, enhancing the performance of organisations in South Africa and abroad through effective deployment of ICT solutions.

INTEGRATED REPORT 2018
13
Chairperson of the Board:The Chairperson is an independent, non-executive member of the Board.
A lead independent member has not been appointed. The Board appoints another member to chair meetings in the absence of the Chairperson.
Committees of the accounting authorityPrinciple 8: The accounting authority should ensure that its arrangements for delegation within its own structures promote independent judgment and assist with balance of power and the effective discharge of its duties.Section 16 (1) of the SANRAL Act No 7 of 1998, states that “the Board may from time to time appoint one or more committees to assist the Board in performing its functions”.
The Board has established four committees to assist it: the Contracts Committee, the Audit and Risk Committee, the Social, Ethics and Transformation Committee, and the Assets and Liabilities Committee. The committees do not assume any management or operational responsibilities but have oversight over the implementation of their recommendations. All committees are also responsible for monitoring the managing of risks within their area of oversight.
The Board appoints the members of committees on the basis of the skills required to fulfil the functions of the respective committees. The tenure of the committees is concurrent with that of the Board.
The Board may appoint external, independent members or advisors to committees should their skills be required for the effective functioning of the committees.
Contracts CommitteeThe Contracts Committee functions in terms of its charter, which is reviewed on an annual basis and approved by the Board.
The Contracts Committee is responsible for the adjudication and award of major contracts and for the authorisation of contract expenditure. It also has oversight of SANRAL’s transformation efforts in the construction industry and the empowerment of SMMEs and small contractors.
The committee comprises three non-executive members and the CEO. Their qualifications and experience are detailed on pages 11 and 12.
The committee has not had any external advisors or invitees who attended its meetings regularly. The Committee Secretary attends all meetings of this committee, while the Engineering Executive, the Contracts Manager, the Legal Advisor, the CFO and the Company Secretary attend by invitation.
Key areas of focus during the year were the development and communication of the draft Transformation Policy and the provision of opportunities for smaller contractors.
Eleven meetings were held during the year and attendance at meetings is indicated in the table below:
2017
director position 10 April
9 may
6 June
4 July
14 Aug
5 Sept
3 Oct
1 Nov
6 dec
Ms Z Kganyago Non-executive chairperson
√ √ √ √ √ - - - -
Mr M Matete Non-executive member/ chairperson
√ √ √ √ √ √ √ √ √
Mr C Hlabisa Non-executive member
√ A A √ √ A √ A A
Mr R Morar Non-executive member
- - - - - √ A √ √
Mr S Macozoma Executive member
√ √ √ √ √ √ √ √ √

THE SOUTH AFRICAN NATIONAL ROADS AGENCY SOC LIMITED
14
2018
director position 9 Feb 6 mar
Ms Z Kganyago Non-executive chairperson
- -
Mr M Matete Non-executive member/ chairperson
√ √
Mr C Hlabisa Non-executive member
√ A
Mr R Morar Non-executive member
A √
Mr S Macozoma Executive member
√ √
The qualifications and experience of the members are listed on pages 11 and 12.
√: PresentA: Absent-: Not a member on date indicated
The Committee is satisfied that it fulfilled its responsibilities in accordance with its charter during 2017/18.
Audit and Risk CommitteeThe Audit and Risk Committee (ARC) functions in terms of its charter, which is reviewed on an annual basis and approved by the Board. The three committee members are independent, non-executive directors. Their qualifications and experience are detailed on pages 11 and 12.
The Board has appointed two advisors to the committee. Mr Moosa supports and strengthens the committee’s financial literacy, skills and experience. Mr Nkukwana provides the necessary IT advice and support. The committee meets at least once a year with the internal and external auditors, respectively, without management present. This is to facilitate an exchange of views and concerns that may not be appropriate for discussion in an open forum.
The charter sets out the functions of the committee, acting on behalf of the Board, as:• Independent oversight of the Integrated Report and the annual financial statements.• Internal control and oversight of internal audit.• Independent oversight of combined assurance including external audit.• Oversight of compliance, risk management and anti-fraud and corruption measures.• Information technology governance.• Other functions, such as oversight of the annual performance plan, performance report, annual budget and public liability
claims.
The internal audit team and the external audit team attend all ARC meetings by invitation. The Committee Secretary attends every meeting. The CEO, CFO, Management Accountant, Corporate Services Executive, Risk Manager and the Company Secretary attend by invitation, as do other managers who have matters on the agenda. Key focus areas during the year included the oversight of the internal audit team, audits related to GFIP, risk management, IT governance and the management and follow-up of audit findings by operational teams.
Five meetings were held during the year and attendance is shown in the table below:
director position 25 may 2017
27 July 2017
24 Oct 2017
23 Jan 2018
14 mar 2018
Ms A Lawless Non-executive, independent chairperson
√ √ √ √ A
Ms Z Kganyago Non-executive, independent member
- - √ √ √
Ms D Mashile-Nkosi Non-executive, independent member
A √ √ A √
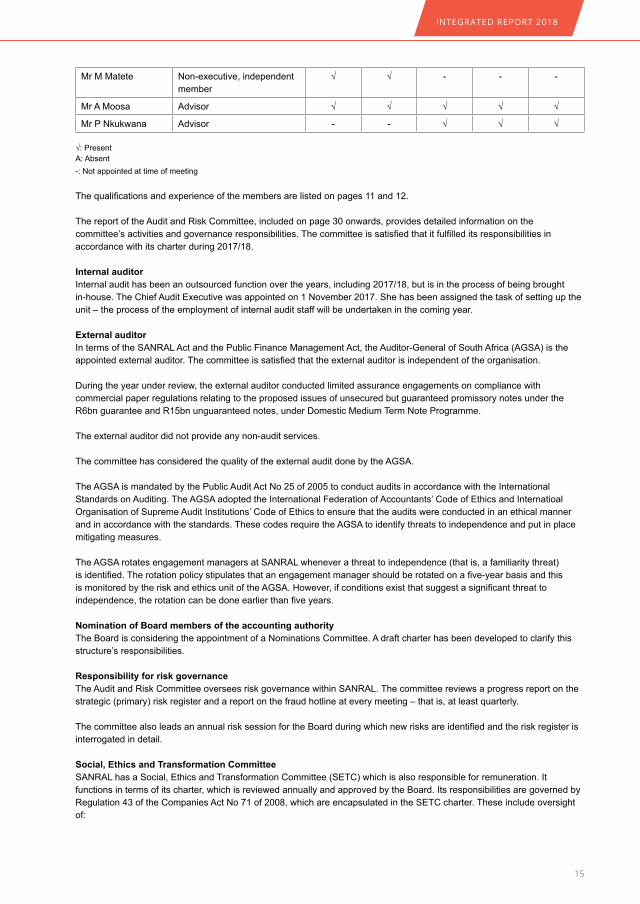
INTEGRATED REPORT 2018
15
Mr M Matete Non-executive, independent member
√ √ - - -
Mr A Moosa Advisor √ √ √ √ √
Mr P Nkukwana Advisor - - √ √ √
√: PresentA: Absent-: Not appointed at time of meeting
The qualifications and experience of the members are listed on pages 11 and 12.
The report of the Audit and Risk Committee, included on page 30 onwards, provides detailed information on the committee’s activities and governance responsibilities. The committee is satisfied that it fulfilled its responsibilities in accordance with its charter during 2017/18.
Internal auditorInternal audit has been an outsourced function over the years, including 2017/18, but is in the process of being brought in-house. The Chief Audit Executive was appointed on 1 November 2017. She has been assigned the task of setting up the unit – the process of the employment of internal audit staff will be undertaken in the coming year.
External auditorIn terms of the SANRAL Act and the Public Finance Management Act, the Auditor-General of South Africa (AGSA) is the appointed external auditor. The committee is satisfied that the external auditor is independent of the organisation.
During the year under review, the external auditor conducted limited assurance engagements on compliance with commercial paper regulations relating to the proposed issues of unsecured but guaranteed promissory notes under the R6bn guarantee and R15bn unguaranteed notes, under Domestic Medium Term Note Programme.
The external auditor did not provide any non-audit services.
The committee has considered the quality of the external audit done by the AGSA.
The AGSA is mandated by the Public Audit Act No 25 of 2005 to conduct audits in accordance with the International Standards on Auditing. The AGSA adopted the International Federation of Accountants’ Code of Ethics and Internatioal Organisation of Supreme Audit Institutions’ Code of Ethics to ensure that the audits were conducted in an ethical manner and in accordance with the standards. These codes require the AGSA to identify threats to independence and put in place mitigating measures.
The AGSA rotates engagement managers at SANRAL whenever a threat to independence (that is, a familiarity threat) is identified. The rotation policy stipulates that an engagement manager should be rotated on a five-year basis and this is monitored by the risk and ethics unit of the AGSA. However, if conditions exist that suggest a significant threat to independence, the rotation can be done earlier than five years.
Nomination of Board members of the accounting authorityThe Board is considering the appointment of a Nominations Committee. A draft charter has been developed to clarify this structure’s responsibilities.
Responsibility for risk governanceThe Audit and Risk Committee oversees risk governance within SANRAL. The committee reviews a progress report on the strategic (primary) risk register and a report on the fraud hotline at every meeting – that is, at least quarterly.
The committee also leads an annual risk session for the Board during which new risks are identified and the risk register is interrogated in detail.
Social, Ethics and Transformation Committee SANRAL has a Social, Ethics and Transformation Committee (SETC) which is also responsible for remuneration. It functions in terms of its charter, which is reviewed annually and approved by the Board. Its responsibilities are governed by Regulation 43 of the Companies Act No 71 of 2008, which are encapsulated in the SETC charter. These include oversight of:
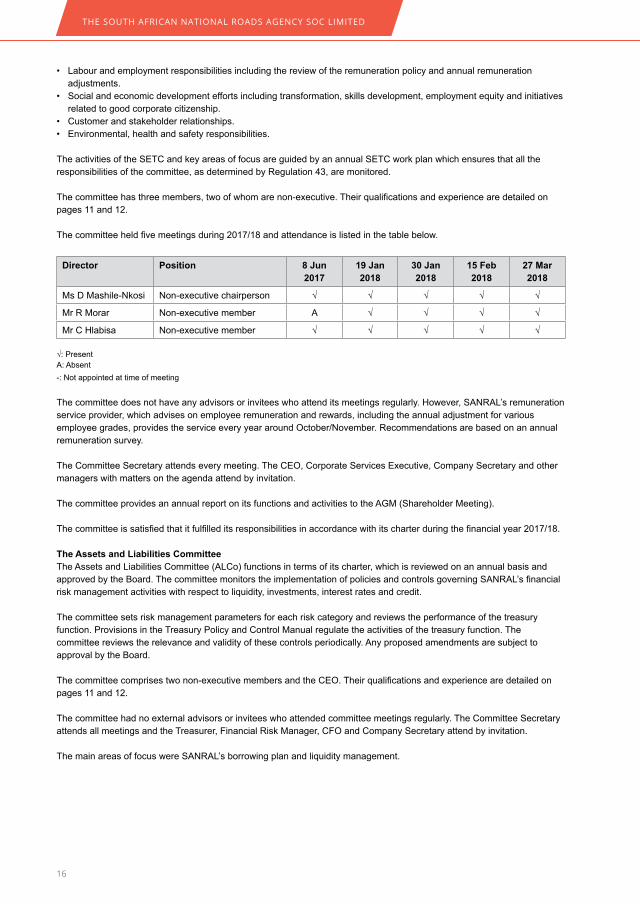
THE SOUTH AFRICAN NATIONAL ROADS AGENCY SOC LIMITED
16
• Labour and employment responsibilities including the review of the remuneration policy and annual remuneration adjustments.
• Social and economic development efforts including transformation, skills development, employment equity and initiatives related to good corporate citizenship.
• Customer and stakeholder relationships.• Environmental, health and safety responsibilities.
The activities of the SETC and key areas of focus are guided by an annual SETC work plan which ensures that all the responsibilities of the committee, as determined by Regulation 43, are monitored.
The committee has three members, two of whom are non-executive. Their qualifications and experience are detailed on pages 11 and 12.
The committee held five meetings during 2017/18 and attendance is listed in the table below.
director position 8 Jun 2017
19 Jan 2018
30 Jan 2018
15 Feb 2018
27 mar 2018
Ms D Mashile-Nkosi Non-executive chairperson √ √ √ √ √
Mr R Morar Non-executive member A √ √ √ √
Mr C Hlabisa Non-executive member √ √ √ √ √
√: PresentA: Absent-: Not appointed at time of meeting
The committee does not have any advisors or invitees who attend its meetings regularly. However, SANRAL’s remuneration service provider, which advises on employee remuneration and rewards, including the annual adjustment for various employee grades, provides the service every year around October/November. Recommendations are based on an annual remuneration survey.
The Committee Secretary attends every meeting. The CEO, Corporate Services Executive, Company Secretary and other managers with matters on the agenda attend by invitation.
The committee provides an annual report on its functions and activities to the AGM (Shareholder Meeting).
The committee is satisfied that it fulfilled its responsibilities in accordance with its charter during the financial year 2017/18.
The Assets and Liabilities Committee The Assets and Liabilities Committee (ALCo) functions in terms of its charter, which is reviewed on an annual basis and approved by the Board. The committee monitors the implementation of policies and controls governing SANRAL’s financial risk management activities with respect to liquidity, investments, interest rates and credit.
The committee sets risk management parameters for each risk category and reviews the performance of the treasury function. Provisions in the Treasury Policy and Control Manual regulate the activities of the treasury function. The committee reviews the relevance and validity of these controls periodically. Any proposed amendments are subject to approval by the Board.
The committee comprises two non-executive members and the CEO. Their qualifications and experience are detailed on pages 11 and 12.
The committee had no external advisors or invitees who attended committee meetings regularly. The Committee Secretary attends all meetings and the Treasurer, Financial Risk Manager, CFO and Company Secretary attend by invitation.
The main areas of focus were SANRAL’s borrowing plan and liquidity management.
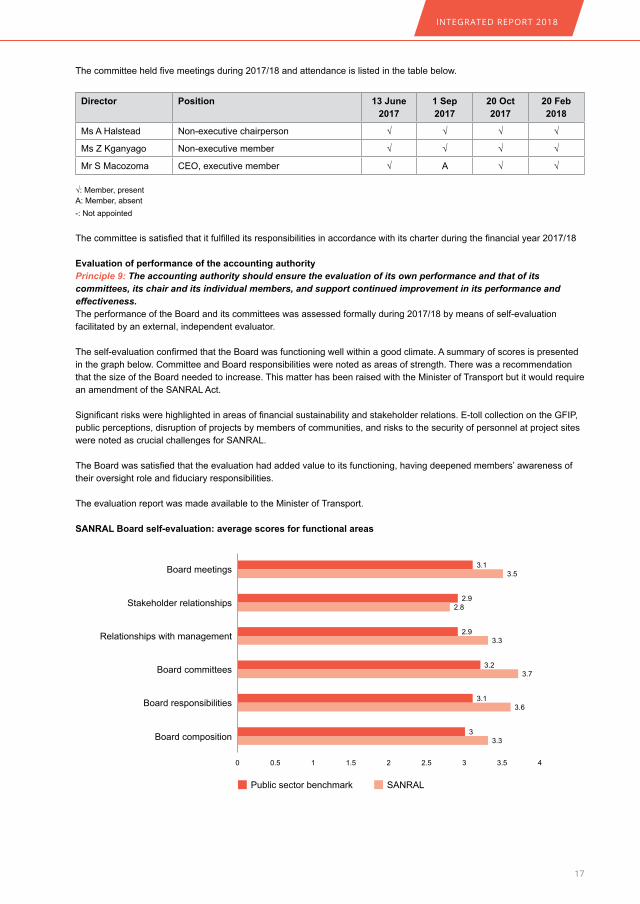
INTEGRATED REPORT 2018
17
The committee held five meetings during 2017/18 and attendance is listed in the table below.
director position 13 June 2017
1 Sep 2017
20 Oct 2017
20 Feb 2018
Ms A Halstead Non-executive chairperson √ √ √ √
Ms Z Kganyago Non-executive member √ √ √ √
Mr S Macozoma CEO, executive member √ A √ √
√: Member, presentA: Member, absent-: Not appointed
The committee is satisfied that it fulfilled its responsibilities in accordance with its charter during the financial year 2017/18
Evaluation of performance of the accounting authorityPrinciple 9: The accounting authority should ensure the evaluation of its own performance and that of its committees, its chair and its individual members, and support continued improvement in its performance and effectiveness. The performance of the Board and its committees was assessed formally during 2017/18 by means of self-evaluation facilitated by an external, independent evaluator.
The self-evaluation confirmed that the Board was functioning well within a good climate. A summary of scores is presented in the graph below. Committee and Board responsibilities were noted as areas of strength. There was a recommendation that the size of the Board needed to increase. This matter has been raised with the Minister of Transport but it would require an amendment of the SANRAL Act.
Significant risks were highlighted in areas of financial sustainability and stakeholder relations. E-toll collection on the GFIP, public perceptions, disruption of projects by members of communities, and risks to the security of personnel at project sites were noted as crucial challenges for SANRAL.
The Board was satisfied that the evaluation had added value to its functioning, having deepened members’ awareness of their oversight role and fiduciary responsibilities.
The evaluation report was made available to the Minister of Transport.
SANRAL Board self-evaluation: average scores for functional areas
Board meetings 3.1
2.9
3.5
2.8
2.93.3
3.23.7
3.13.6
3.3
0.5 1.5 2.5 3.50 1 2 3 4
3
Stakeholder relationships
Relationships with management
Board committees
Board responsibilities
Board composition
Public sector benchmark SANRAL
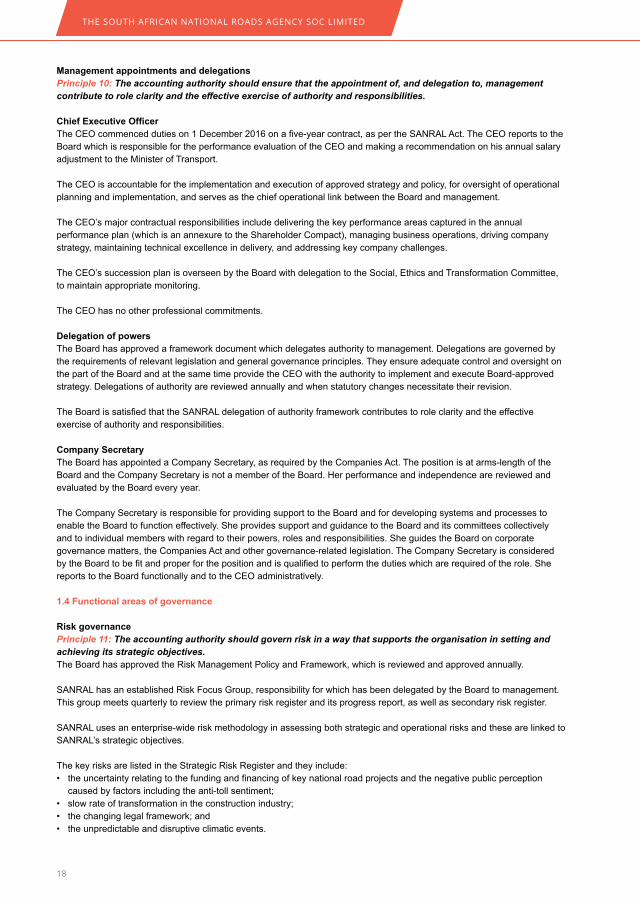
THE SOUTH AFRICAN NATIONAL ROADS AGENCY SOC LIMITED
18
management appointments and delegationsPrinciple 10: The accounting authority should ensure that the appointment of, and delegation to, management contribute to role clarity and the effective exercise of authority and responsibilities.
ChiefExecutiveOfficerThe CEO commenced duties on 1 December 2016 on a five-year contract, as per the SANRAL Act. The CEO reports to the Board which is responsible for the performance evaluation of the CEO and making a recommendation on his annual salary adjustment to the Minister of Transport.
The CEO is accountable for the implementation and execution of approved strategy and policy, for oversight of operational planning and implementation, and serves as the chief operational link between the Board and management.
The CEO’s major contractual responsibilities include delivering the key performance areas captured in the annual performance plan (which is an annexure to the Shareholder Compact), managing business operations, driving company strategy, maintaining technical excellence in delivery, and addressing key company challenges.
The CEO’s succession plan is overseen by the Board with delegation to the Social, Ethics and Transformation Committee, to maintain appropriate monitoring.
The CEO has no other professional commitments.
delegation of powersThe Board has approved a framework document which delegates authority to management. Delegations are governed by the requirements of relevant legislation and general governance principles. They ensure adequate control and oversight on the part of the Board and at the same time provide the CEO with the authority to implement and execute Board-approved strategy. Delegations of authority are reviewed annually and when statutory changes necessitate their revision.
The Board is satisfied that the SANRAL delegation of authority framework contributes to role clarity and the effective exercise of authority and responsibilities.
Company SecretaryThe Board has appointed a Company Secretary, as required by the Companies Act. The position is at arms-length of the Board and the Company Secretary is not a member of the Board. Her performance and independence are reviewed and evaluated by the Board every year.
The Company Secretary is responsible for providing support to the Board and for developing systems and processes to enable the Board to function effectively. She provides support and guidance to the Board and its committees collectively and to individual members with regard to their powers, roles and responsibilities. She guides the Board on corporate governance matters, the Companies Act and other governance-related legislation. The Company Secretary is considered by the Board to be fit and proper for the position and is qualified to perform the duties which are required of the role. She reports to the Board functionally and to the CEO administratively.
1.4 Functional areas of governance
Risk governancePrinciple 11: The accounting authority should govern risk in a way that supports the organisation in setting and achieving its strategic objectives.The Board has approved the Risk Management Policy and Framework, which is reviewed and approved annually.
SANRAL has an established Risk Focus Group, responsibility for which has been delegated by the Board to management. This group meets quarterly to review the primary risk register and its progress report, as well as secondary risk register.
SANRAL uses an enterprise-wide risk methodology in assessing both strategic and operational risks and these are linked to SANRAL’s strategic objectives.
The key risks are listed in the Strategic Risk Register and they include:• the uncertainty relating to the funding and financing of key national road projects and the negative public perception
caused by factors including the anti-toll sentiment;• slow rate of transformation in the construction industry;• the changing legal framework; and• the unpredictable and disruptive climatic events.
INTEGRATED REPORT 2018
19
The strategic risk progress report monitored by the Audit and Risk Committee and the Board tracks the progress and effectiveness of risk management by the business.
Internal Audit monitors the effectiveness of the risk management function.
Planned areas of future focus are determined annually during an annual Board risk workshop.
The annual governance, risk and compliance roadshow to all SANRAL offices provides a reminder to all employees about the agency’s risk management and anti-fraud and -corruption philosophy. It is also an opportunity to highlight the risks and failures experienced and to caution against such failures in the future.
The Board is ultimately accountable for risk management and the Audit and Risk Committee monitors risk management on an ongoing basis on behalf of the Board.
Technology and information governancePrinciple 12: The accounting authority should govern technology and information in a way that supports the organisation setting and achieving its strategic objectives.The Information Technology Governance Committee (ITGC) is constituted as a management committee in respect of all duties that the Board has assigned to it as per the SANRAL ICT Charter and ICT Governance Policy Framework. The ITGC has no decision-making powers except where expressly provided by the Board through the delegation of authority framework and approved policies.
The ITGC oversees the development and implementation of ICT governance policies. These are integrated with the business strategy process and enable the achievement of SANRAL’s strategic objectives.
The Audit and Risk Committee, on behalf of the Board, has oversight responsibility for IT governance.
The following policies have been reviewed and updated, and were approved by the Board:• ICT Charter• ICT Governance Framework• ICT Project Governance Framework.
The 2030 ICT strategy is being developed and it will align with the Horizon 2030 business strategy.
The following are major activities and acquisitions made:• IT hardware refresh projects• Information security service project• Video-conferencing facilities and services.
The ITGC reports quarterly to the Audit and Risk Committee on its performance. This is to ensure that processes are capable of delivering the intended outcomes cost-effectively. These measures focus on key aspects of IT capability, such as: systems performance, availability, agility and integrity, development of new solutions, SANRAL’s ability to operate reliable and secure services in an increasingly demanding technical environment, and the development of human resources and skills.
Strategy development will encompass the following activities:• Initiating the design of a unified communications solution, integrated with the newly deployed video-conferencing
solution.• Maturing ICT governance practices.• Reducing IT complexity.• Upgrading the Enterprise Resource Planning system.• Focusing on innovative practices and creating a more enabling and strategic IT set-up.
Compliance governancePrinciple 13: The accounting authority should govern compliance with applicable laws and adopted, non-binding rules, codes and standards in a way that supports ethical organisational conduct and good corporate citizenship.Compliance is a non-negotiable part of SANRAL’s collective character and is integral to every activity and operation of the organisation. The governance, risk and compliance roadshow to all employees alerts staff to the importance of compliance within every function. A Compliance Policy has been adopted and it underscores SANRAL’s commitment to comply not only with legislation but also codes, standards and best practice.
THE SOUTH AFRICAN NATIONAL ROADS AGENCY SOC LIMITED
20
The continuous monitoring of and reporting on compliance in a pro-active, ongoing and positive manner are at the forefront of SANRAL’s compliance culture. A database has been created identifying all sections of legislation which impact on SANRAL. Compliance with procurement legislation is also closely monitored through SANRAL’s Supply Chain Management Unit, which is required to convey and implement any changes and manage challenges immediately in all SANRAL offices. Procurement-related compliance is an area of special focus. Strict adherence to SCM regulations is critical as is the avoidance of any real or perceived conflict of interest.
There have been no regulatory penalties, sanctions or fines for non-compliance or contravention of statutory obligations by Board members or senior management since SANRAL’s inception.
Remuneration governancePrinciple 14: The accounting authority should ensure that the organisation remunerates fairly, responsibly and transparently so as to promote the achievement of strategic objectives and positive outcomes in the short-, medium- and long-term.The HR policy contains a chapter on remuneration which describes the policy and process for determining the remuneration of employees. The policy is updated annually and approved by the Board, on the recommendation of the Social, Ethics and Transformation Committee. It is also tabled and approved at the Shareholder Meeting.
SANRAL has appointed consultants to conduct remuneration surveys to ensure market-related remuneration for employees. The remuneration comparator group research provides information which allows for market-related remuneration scales for all employee grades. Any adjustment to remuneration has to be within limits approved by the Board.
The performance of employees is appraised annually and remuneration adjustments are based on the performance rating received by each employee.
The short-term incentive scheme is fully performance based.
SANRAL’s remuneration philosophy is supported by its business strategy, namely delivering value for South Africa in a responsible and sustainable manner.
The HR Policy contains a chapter on remuneration which includes the policy and process for determining the remuneration of employees. The Policy is updated annually and approved by the Board, on the recommendation of the Social, Ethics and Transformation Committee (SETC). It is also tabled and approved at the Shareholder Meeting. The Policy was approved at the previous AGM on 30 October 2017.
The purpose of the SANRAL Remuneration Policy and implementation strategy is to attract, retain, motivate and reward high-performing employees who constructively contribute to the achievement of SANRAL’s objectives. On an annual basis, SANRAL engages the services of a specialist service provider that has a unique combination of technical capabilities, market intelligence and analytics to help the entity with a broad range of emerging reward issues, including: senior executive reward and governance; tax and regulatory compliance; ‘total’ reward strategy and analytics; competitive benchmarking and development of reward structures; as well as incentive design and linkage to performance management. The SETC was satisfied with the independence of the service provider. The annual research provides information on comparator groupings in the industry and state-owned environment which allows for the development of suitable SANRAL market-related remuneration scales for all employee grades. Salary adjustments must always be within the limits approved by the board. Executive remuneration is determined and approved by the CEO, and is influenced by the organisation’s performance as well as movement in the external environment. Annual adjustments to the SANRAL salary scales assists in the determination of remuneration packages which are needed to attract, retain and motivate high performing executive management and specialist staff members.
Remuneration adjustment for each employee is based on the individual performance rating agreed to by line managers and employees at the conclusion of the annual review cycle. Performance targets are agreed through a performance contract with each employee at the start of a financial year, with appraisals done twice a year. This rating, combined with measures of performance for each region, focus group and SANRAL overall performance measures, form the basis of the short-term incentive calculation. These incentive calculations are audited prior to payment.
The Minister annually approves the scale of remuneration for the chairperson and the members of the board. The Board is then remunerated at a daily rate for every day spent on SANRAL business. Board and senior management remuneration is published in the integrated report.
INTEGRATED REPORT 2018
21
COmpONENTS OF REmUNERATION SANRAL has two components of remuneration, namely total cost to company guaranteed- package (which includes benefits) and short-term incentives in the form of its STI scheme. The details of these two components are outlined below:
TOTAL COST TO COmpANY GUARANTEEd pACKAGEThe guaranteed package is the total annual guaranteed cost to a company of employing an incumbent.
What is its composition?The guaranteed package includes components such as cash salary, travel allowance and the company’s contributions towards retirement funding and the medical scheme. All guaranteed benefits are funded from the total guaranteed package. Retirement funding contributions range between 20.5% and 27.5% of pensionable emolument and the key features of the retirement fund are as follows: • Retirement savings component with member investment options and a trustee default option• Insured death and disability • Preservation options when exiting the fund.
Membership of a medical scheme and contributions for employees are funded from their total guaranteed package. All employees are eligible for membership of the Discovery Health Medical Scheme, and employees can choose any option available on the scheme annually. These options aim to accommodate the different healthcare needs and affordability of the diverse membership of the scheme.
Under specific circumstances SANRAL also offers employees post-retirement medical benefits. All details in this regard are disclosed in the annual financial statements.
Only employees who are required to travel for business purposes receive travel allowances, which are funded from their total guaranteed packages.
How is total guaranteed package benchmarked? Guaranteed packages are benchmarked against the 50th percentile of the market for comparable companies utilising independent salary surveys. SANRAL currently uses the PwC REM channel’s national survey, engineering circle and state-owned data for the annual salary surveys.
Annual review process The Board approves the increase percentage on total guaranteed packages for the organisation on an annual basis. Adjustments to total guaranteed packages depend upon the employee’s salary grade, average performance, overall percentage granted to the employee’s respective grade and his/her overall performance. The CEO, who attends all committee meetings by invitation, can propose increases to the guaranteed remuneration packages, excluding his own, during such review meetings.
Fair and responsible remuneration across SANRALSANRAL is committed to the principle of fair and responsible remuneration for the whole company. Actions in this regard include: • Assessment of remuneration conditions between employees at the same level in accordance with the principle of “equal
pay for work of equal value” to identify and address any unjustifiable remuneration disparities.• Investing in its people initiatives, which include: talent management; development opportunities for all employees;
various training courses as per identified needs and an employee value proposition aligned to the corporate values and culture.
VARIABLE pAY: SHORT TERm INCENTIVE SCHEmEEmployees are eligible to receive variable pay in the form of a Short-Term Incentive Scheme (STIS) bonus in accordance with the approved STIS rules. It is important for SANRAL to practice recognition of performance which is target driven and transparent.
The organisation-wide STI scheme will:• Give concrete support for organisational objectives and the scheme rules will be objective and transparent • Be measurable and tie in with the performance management process • Have the “buy-in” of the majority of participants• Be consistent – have rules which are respected and applied consistently• Be clearly defined in terms of rules and quanta and be part of the annual budgeting cycle• Attract, retain and motivate• Drive organisational strategy – specifically in the areas of cash flows and employment equity• Embed an entrepreneurial spirit

THE SOUTH AFRICAN NATIONAL ROADS AGENCY SOC LIMITED
22
• Change the focus from process to outputs• Align employee behaviour with shareholder expectations • Have pay-outs which are meaningful – this will address the issue of SANRAL remuneration lagging behind the market
with respect to bonuses.
ELIGIBILITY ANd QUANTUmThe organisational performance criterion is summarised in the SANRAL performance agreement with the Minister of Transport which is agreed and updated annually.
Grades A-G are eligible. The STIS bonuses are only to be paid out after the AGSA has signed off the SANRAL financial statements which is in mid-year, and therefore the September payroll date is the earliest date when the bonus becomes payable.
Employees who are under any investigation or have disciplinary action taken against them which is pending, will not be eligible for a performance bonus. Only after the finalisation of the investigations and/or disciplinary action proceedings will the performance bonus pay-out be considered and, where applicable, that employee will be entitled to retrospective payments. Interest will be added for STIS bonuses paid retrospectively.
FUNdING Incentive payments under the STIS will be funded out of the budget of SANRAL and shall be fully provided for in the budget.
HOW IS THE STI CALCULATEd?The payment is driven by performance, and the particular performance measures (company and/or team and/or individual performance) would vary based on the level of the incumbent and his/her particular influence and line of sight.
The STI is calculated using the annual guaranteed pay x STI % x performance score. The STIS percentage (%) is targeted at the median of the market. These amounts will be capped at twice (2 times) the market median for any given financial year. This information will be adjusted as and when required.
SANRAL employees earn guaranteed pay for doing what is expected and should only earn variable pay such as STIS bonuses for exceeding performance expectations. The STI is aimed at driving excellence through excellent efforts. The performance thresholds at each level were:• SANRAL – 100%. If not achieved, can still score on other 3 levels• Region – 100%. If not achieved, can still score on other 3 levels• Cluster – 100%. If not achieved, can still score on other 3 levels• Individuals – are expected to exceed the “meets requirements” element of performance management. If basic objectives
of the role are not achieved, individuals will not benefit from the STI for that financial year. It is therefore critical that each individual’s objectives must be formalised in a performance agreement and communicated on time.
In the event of resignation before financial year end or dismissal for just cause all STI will be forfeited.
Review of calculationsAs a principle, the SANRAL Internal Auditors will review the calculations done for the STIS bonus, prior to payment.
SOCIAL, ETHICS ANd TRANSFORmATION COmmITTEE ROLEThe responsibility for the monitoring and the implementation of the Policy rests with the SETC. The role of the Committee is to assist the board to ensure that SANRAL has implemented an effective policy and plan for remuneration that will enhance the entity’s ability to meet its strategic objectives.
The committee ensures that:• The remuneration policy and system are appropriate for the achievement of business objectives;• Interests of all stakeholders are aligned;• The entity adheres to good corporate governance practices and all applicable regulation; and• The setting of remuneration of the chief executive officer is the responsibility of the board on advice of the SETC. The
CEO’s remuneration adjustment must be approved by the Minister of Transport with the concurrence of the Minister of Finance.
Executive employment contracts All employees other than the CEO do not have fixed-term contracts but are employed in terms of the company’s standard contract of employment applicable to all employees. The notice period for termination of service is from one to three months and the normal retirement age is 65.

INTEGRATED REPORT 2018
23
Upon termination of employment, any payments made to employees will be as required in terms of legislation, and the payment of the STI will be governed by the rules of the STI Scheme based on the reasons for the termination of employment.
AssurancePrinciple 15: The accounting authority should ensure that assurance services and functions enable an effective control environment, and that these support the integrity of information for internal decision-making and the organisation’s external reports.Internal Audit has confirmed to the Audit and Risk Committee that, for 2017/18, there was no material breakdown in the functioning of the systems, procedures and controls, which could lead to material losses, contingencies or uncertainties or require disclosure in the financial statements. Any control deficiencies identified by the internal and external auditors were brought to the attention of the Committee and management implemented corrective action. Where internal controls did not operate effectively throughout the year, compensating controls or corrective action or both were used to eliminate or reduce risks.
With regard to this Integrated Report, the internal and external audit (AGSA) are key assurers of the financial statements and the performance reports. Management provides assurance for the veracity of the other sections of the Report. Project specific information is often vetted by project consultants, project managers and Management. The Board is satisfied with the integrity of the information provided in the Integrated Report 2018.
Please refer to the Audit and Risk Committee’s report on page 30.
1.5 Stakeholder relationships
StakeholdersPrinciple 16: In the execution of its governance role and responsibilities, the accounting authority should adopt a stakeholder-inclusive approach that balances the needs, interests and expectations of material stakeholders in the best interests of the organisation over time.As a corporate citizen, SANRAL is enjoined by prescripts and good governance practices such as the King IV Report on Corporate Governance to place stakeholder engagement at the heart of its operations.
This principle is premised on the fact that, for a corporate to function optimally, it must adhere to tenets that are inclusive. It further posits that an organisation should adopt a stakeholder-inclusive approach that balances the needs, interests and expectations of material stakeholders in the best interest of the organisation over time. This was evidenced in the reporting period by the number and nature of engagements undertaken, particularly at project flashpoints. These included interactions with chambers of commerce and information sessions with communities affected by SANRAL’s projects, such as those living and trading along the Moloto Road. Other valuable interactions included the official opening of the Botlokwa Bridge by the President and the Minister of Transport in October 2017, and presentations to provincial governments about some key projects, including the presentation on interoperability/shesha lanes to the KwaZulu-Natal Congress of South African Trade Unions (COSATU). In all of these engagements SANRAL sought to address expectations of stakeholders. It is believed that, over time dialogue will bear fruit and affected stakeholders will begin to participate, to a greater or lesser extent, in the decision-making processes entailed in road projects affecting them. SANRAL’s strategic approach during this period was a deliberate stakeholder and active outreach programme in all regions. Special attention was paid to those projects that had the potential to become flashpoints because they impacted on people’s way of life and their interests. The Moloto Road improvement and the green-fields sections of the N2 Wild Coast Road were two such projects. Through key stakeholder engagement programmes such as the Financial Mail Lounge, which took place in Johannesburg, and the Business Day Dialogue, which took place in Mthatha in the Eastern Cape, SANRAL interacted with high-level role players in the construction and financial sectors who also had an opportunity to interact with the CEO. SANRAL’s Horizon 2030 strategy, its draft Transformation Policy and the progress of major road projects were discussed.
The focus on major projects with regard to stakeholder such as the N2 Wild Coast will continue in the coming year.

THE SOUTH AFRICAN NATIONAL ROADS AGENCY SOC LIMITED
24
2. Corporate performance Information
Programme1-Strategicobjective1:Managethenationalroadnetworkeffectivelyandefficientlyprogramme performance indicator
Reporting period
Baseline: Actual 2016/17
Annual target
Achieved 2017/18
Variance Comments/reasonsforvariance
1.1 Smooth travel exposure (STE)
Quarterly 97.0% ≥ 95% 96.73% +1.82% Accelerated reseal projects
1.2 Low rut exposure (LRE)
Quarterly 99.9% ≥ 95% 99.47% +4.70% Accelerated reseal projects
1.3 High texture exposure (HTE)
Quarterly 99.5% ≥ 95% 99.22% +4.44% Accelerated reseal projects
1.4 Bridge condition exposure (BCE)
Quarterly 93.6% ≥ 90% 92.81% +3.12% Latest bridge data combined with traffic data has been used
1.5 Routine maintenance (km)
Quarterly 22 197km 22 203km 22 214km +0.04% Incorporation of Beitbridge Road, realignments and sections through small town
1.6 Network resurfaced (km)
Annual 1 891km 1 000km 1 631km +63.1% Reseal projects on newly incorporated roads accelerated to minimise deterioration of roads
1.7 New roads and roads strengthened and improved (km)
Annual 575km 500km 601km +20.2% Projects on newly incorporated roads accelerated to address sections in poor to very poor condition
1.8 SIP-1 annual maintenance: N1, N4, R33, R510, R511 and R520 national road to Lephalale (km)
Annual 885km 885km 885km 0% Active routine road maintenance on all routes
1.9 SIP-4 annual maintenance of national roads in North West (km)
Annual 2 598km 2 598km 2 598km 0% Active routine road maintenance on all routes
1.10 Traffic information collection and dissemination on freeway management system network
Annual Information on full network of 450km received
Establishment of links with one strategic entity
Agreement in place with Tolcon for traffic monitoring
0% Signed agreement in place
Note: 1.5 The length of the SANRAL road network is subject to continuous amendment (increase or decrease) during a financial year due to the publication of various declaration gazettes by the Minister of Transport. As these amendments are also approved by the Minister of Transport, their impact on network length (increase or decrease) will be reflected in the quarterly targets and actualsNote: 1.5, 1.6 and 1.7 As in SANRAL Roadworks Classification document and under constructionNote: 1.10 Collection and dissemination of information on 100% of FMS network continues. In addition to the target of establishing links with strategic entities, SANRAL’s engagement will include: SAPS, eThekwini Transport Authority, N3 Toll Concession, ACSA, Metro Police, Fire and Disaster Management, Emergency Services etc that have direct influence on improving operations and co-ordination of services. The establishment of the link allows the Operator (Tolcon) to effectively operate the tunnel to reduce and minimise the impact to traffic on this route because of emergencies, maintenance activities or crashes at the tunnel. This link and access to real time information therefore allows the Operator (Tolcon) to understand real-time traffic conditions en route to the tunnel to make informed decisions on the tunnel operations
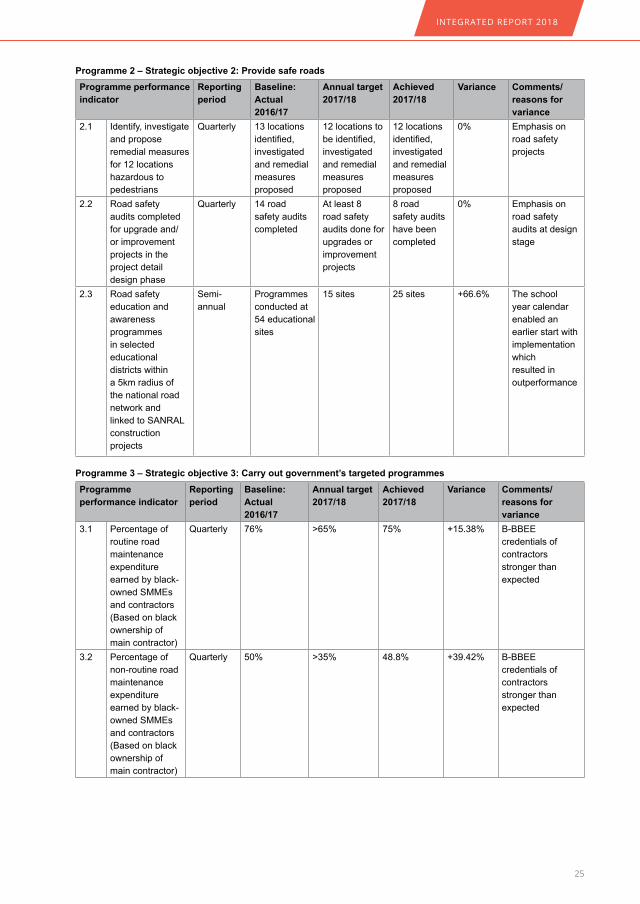
INTEGRATED REPORT 2018
25
programme 2 – Strategic objective 2: provide safe roadsprogramme performance indicator
Reporting period
Baseline: Actual 2016/17
Annual target 2017/18
Achieved 2017/18
Variance Comments/reasons for variance
2.1 Identify, investigate and propose remedial measures for 12 locations hazardous to pedestrians
Quarterly 13 locations identified, investigated and remedial measures proposed
12 locations to be identified, investigated and remedial measures proposed
12 locations identified, investigated and remedial measures proposed
0% Emphasis on road safety projects
2.2 Road safety audits completed for upgrade and/or improvement projects in the project detail design phase
Quarterly 14 road safety audits completed
At least 8 road safety audits done for upgrades or improvement projects
8 road safety audits have been completed
0% Emphasis on road safety audits at design stage
2.3 Road safety education and awareness programmes in selected educational districts within a 5km radius of the national road network and linked to SANRAL construction projects
Semi-annual
Programmes conducted at 54 educational sites
15 sites 25 sites +66.6% The school year calendar enabled an earlier start with implementation which resulted in outperformance
programme 3 – Strategic objective 3: Carry out government’s targeted programmes
programme performance indicator
Reporting period
Baseline: Actual 2016/17
Annual target 2017/18
Achieved 2017/18
Variance Comments/reasons for variance
3.1 Percentage of routine road maintenance expenditure earned by black-owned SMMEs and contractors (Based on black ownership of main contractor)
Quarterly 76% >65% 75% +15.38% B-BBEE credentials of contractors stronger than expected
3.2 Percentage of non-routine road maintenance expenditure earned by black-owned SMMEs and contractors (Based on black ownership of main contractor)
Quarterly 50% >35% 48.8% +39.42% B-BBEE credentials of contractors stronger than expected
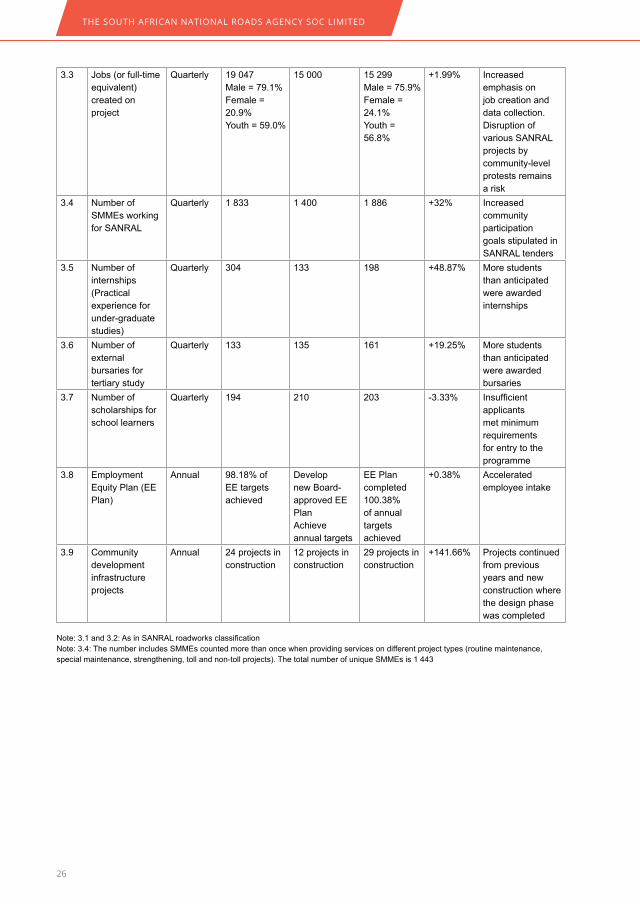
THE SOUTH AFRICAN NATIONAL ROADS AGENCY SOC LIMITED
26
3.3 Jobs (or full-time equivalent) created on project
Quarterly 19 047Male = 79.1%Female = 20.9%Youth = 59.0%
15 000 15 299Male = 75.9%Female = 24.1%Youth = 56.8%
+1.99% Increased emphasis on job creation and data collection. Disruption of various SANRAL projects by community-level protests remains a risk
3.4 Number of SMMEs working for SANRAL
Quarterly 1 833 1 400 1 886 +32% Increased community participation goals stipulated in SANRAL tenders
3.5 Number of internships (Practical experience for under-graduate studies)
Quarterly 304 133 198 +48.87% More students than anticipated were awarded internships
3.6 Number of external bursaries for tertiary study
Quarterly 133 135 161 +19.25% More students than anticipated were awarded bursaries
3.7 Number of scholarships for school learners
Quarterly 194 210 203 -3.33% Insufficient applicants met minimum requirements for entry to the programme
3.8 Employment Equity Plan (EE Plan)
Annual 98.18% of EE targets achieved
Develop new Board-approved EE PlanAchieve annual targets
EE Plan completed100.38% of annual targets achieved
+0.38% Accelerated employee intake
3.9 Community development infrastructure projects
Annual 24 projects in construction
12 projects in construction
29 projects in construction
+141.66% Projects continued from previous years and new construction where the design phase was completed
Note: 3.1 and 3.2: As in SANRAL roadworks classificationNote: 3.4: The number includes SMMEs counted more than once when providing services on different project types (routine maintenance, special maintenance, strengthening, toll and non-toll projects). The total number of unique SMMEs is 1 443

INTEGRATED REPORT 2018
27
Category Number (Instances)
Black EME 845
Black QSE 266
White EME 186
White QSE 48
Non-compliant 541
Total 1 886
* Exempted micro-enterprises, which are entities with an annual turnover of R10m or less.** Qualifying small enterprises, which are entities with an annual turnover of between R10m and R50m.
programme 4 – Strategic objective 4: Co-operative working relationships with all spheres of government and SAdC member countries programme performance indicator
Reporting period
Baseline: Actual 2016/17
Annual target 2017/18
Achieved 2017/18
Variance Comments/reasons for variance
4.1 Ensure minimum of 2 annual meetings for each Committee of Transport Officials (COTO) sub-committee chaired by SANRAL
Annual 2 meetings/year
2 meetings/year
2 meetings/year
0% Required meetings held as scheduled
4.2 Revise specified TRH/TMH guidelines through COTO sub-committees and submit to COTO for approval
Annual Revised TRH8, TRH13, TRH21 and circulated to COTO sub-committee
TRH5 and TRH14 to be revised
0 (delayed by SANAS test procedure finalisation and approval)
-100% Delayed due to awaiting SANAS approval
4.3 Revision of the COTO standard specifications for road and bridge works
Annual 100% Closed
4.4 Construction of Botswana border bridge at Notwane River
Annual Construction completed
Closed
4.5 National Technical Committee to produce 4 incident management systems reports for COTO
Quarterly 4 reports produced, sent to COTO and signed off by DoT and SANRAL
Production of 4 reports for COTO
4 reports produced for COTO
0% Regular production of reports
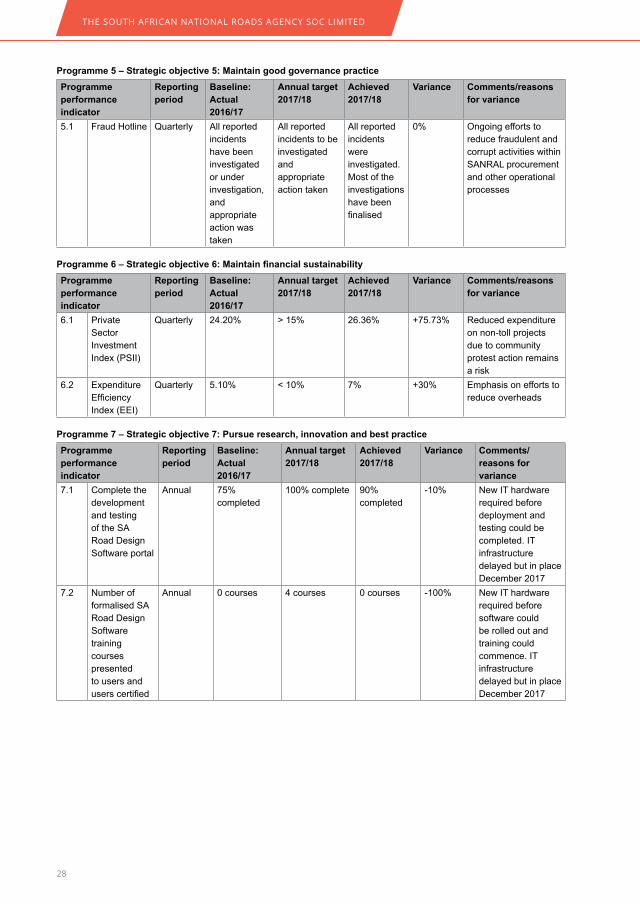
THE SOUTH AFRICAN NATIONAL ROADS AGENCY SOC LIMITED
28
programme 5 – Strategic objective 5: maintain good governance practiceprogramme performance indicator
Reporting period
Baseline: Actual 2016/17
Annual target 2017/18
Achieved 2017/18
Variance Comments/reasonsfor variance
5.1 Fraud Hotline Quarterly All reported incidents have been investigated or under investigation, and appropriate action was taken
All reported incidents to be investigated and appropriate action taken
All reported incidents were investigated. Most of the investigations have been finalised
0% Ongoing efforts to reduce fraudulent and corrupt activities within SANRAL procurement and other operational processes
Programme6–Strategicobjective6:Maintainfinancialsustainability
programme performance indicator
Reporting period
Baseline: Actual 2016/17
Annual target 2017/18
Achieved 2017/18
Variance Comments/reasonsfor variance
6.1 Private Sector Investment Index (PSII)
Quarterly 24.20% > 15% 26.36% +75.73% Reduced expenditure on non-toll projects due to community protest action remains a risk
6.2 Expenditure Efficiency Index (EEI)
Quarterly 5.10% < 10% 7% +30% Emphasis on efforts to reduce overheads
programme 7 – Strategic objective 7: pursue research, innovation and best practiceprogramme performance indicator
Reporting period
Baseline: Actual 2016/17
Annual target 2017/18
Achieved 2017/18
Variance Comments/reasons for variance
7.1 Complete the development and testing of the SA Road Design Software portal
Annual 75% completed
100% complete 90% completed
-10% New IT hardware required before deployment and testing could be completed. IT infrastructure delayed but in place December 2017
7.2 Number of formalised SA Road Design Software training courses presented to users and users certified
Annual 0 courses 4 courses 0 courses -100% New IT hardware required before software could be rolled out and training could commence. IT infrastructure delayed but in place December 2017
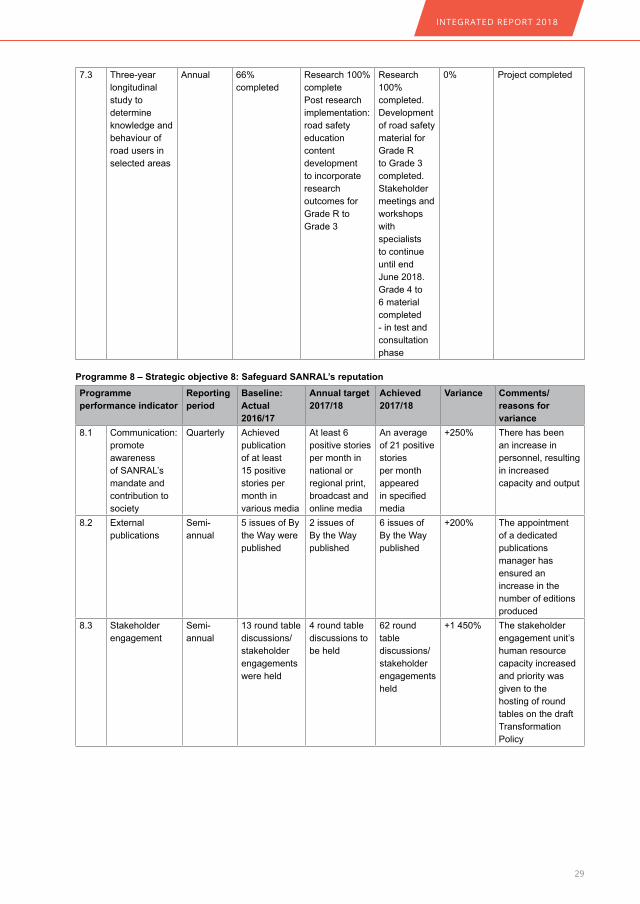
INTEGRATED REPORT 2018
29
7.3 Three-year longitudinal study to determine knowledge and behaviour of road users in selected areas
Annual 66% completed
Research 100% completePost research implementation: road safety education content development to incorporate research outcomes for Grade R to Grade 3
Research 100% completed.Development of road safety material for Grade R to Grade 3 completed.Stakeholder meetings and workshops with specialists to continue until end June 2018. Grade 4 to 6 material completed - in test and consultation phase
0% Project completed
programme 8 – Strategic objective 8: Safeguard SANRAL’s reputation
programme performance indicator
Reporting period
Baseline: Actual 2016/17
Annual target 2017/18
Achieved 2017/18
Variance Comments/reasons for variance
8.1 Communication: promote awareness of SANRAL’s mandate and contribution to society
Quarterly Achieved publication of at least 15 positive stories per month in various media
At least 6 positive stories per month in national or regional print, broadcast and online media
An average of 21 positive stories per month appeared in specified media
+250% There has been an increase in personnel, resulting in increased capacity and output
8.2 External publications
Semi-annual
5 issues of By the Way were published
2 issues of By the Way published
6 issues of By the Way published
+200% The appointment of a dedicated publications manager has ensured an increase in the number of editions produced
8.3 Stakeholder engagement
Semi-annual
13 round table discussions/stakeholder engagements were held
4 round table discussions to be held
62 round table discussions/stakeholder engagements held
+1 450% The stakeholder engagement unit’s human resource capacity increased and priority was given to the hosting of round tables on the draft Transformation Policy
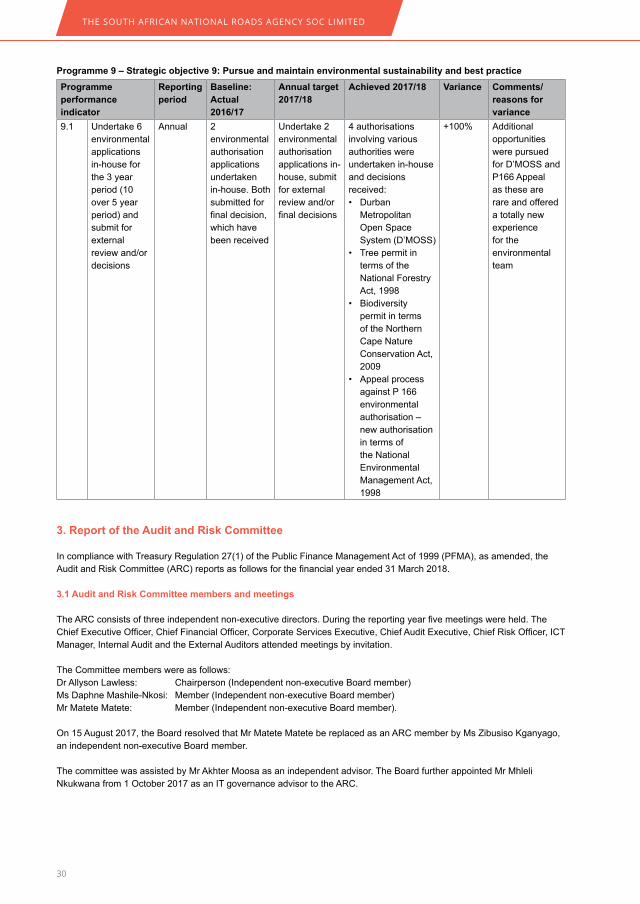
THE SOUTH AFRICAN NATIONAL ROADS AGENCY SOC LIMITED
30
programme 9 – Strategic objective 9: pursue and maintain environmental sustainability and best practiceprogramme performance indicator
Reporting period
Baseline: Actual 2016/17
Annual target 2017/18
Achieved2017/18 Variance Comments/reasons for variance
9.1 Undertake 6 environmental applications in-house for the 3 year period (10 over 5 year period) and submit for external review and/or decisions
Annual 2 environmental authorisation applications undertaken in-house. Both submitted for final decision, which have been received
Undertake 2 environmental authorisation applications in-house, submit for external review and/or final decisions
4 authorisations involving various authorities were undertaken in-house and decisions received:• Durban
Metropolitan Open Space System (D’MOSS)
• Tree permit in terms of the National Forestry Act, 1998
• Biodiversity permit in terms of the Northern Cape Nature Conservation Act, 2009
• Appeal process against P 166 environmental authorisation – new authorisation in terms of the National Environmental Management Act, 1998
+100% Additional opportunities were pursued for D’MOSS and P166 Appeal as these are rare and offered a totally new experience for the environmental team
3. Report of the Audit and Risk Committee
In compliance with Treasury Regulation 27(1) of the Public Finance Management Act of 1999 (PFMA), as amended, the Audit and Risk Committee (ARC) reports as follows for the financial year ended 31 March 2018.
3.1 Audit and Risk Committee members and meetings
The ARC consists of three independent non-executive directors. During the reporting year five meetings were held. The Chief Executive Officer, Chief Financial Officer, Corporate Services Executive, Chief Audit Executive, Chief Risk Officer, ICT Manager, Internal Audit and the External Auditors attended meetings by invitation.
The Committee members were as follows:Dr Allyson Lawless: Chairperson (Independent non-executive Board member)Ms Daphne Mashile-Nkosi: Member (Independent non-executive Board member)Mr Matete Matete: Member (Independent non-executive Board member).
On 15 August 2017, the Board resolved that Mr Matete Matete be replaced as an ARC member by Ms Zibusiso Kganyago, an independent non-executive Board member.
The committee was assisted by Mr Akhter Moosa as an independent advisor. The Board further appointed Mr Mhleli Nkukwana from 1 October 2017 as an IT governance advisor to the ARC.
INTEGRATED REPORT 2018
31
3.2 Responsibilities of the ARC
The ARC is constituted in terms of the Companies Act of 2008, as amended, as a statutory Board committee. The ARC has adopted the Audit and Risk Committee Charter, which has been confirmed by the Board. The charter sets out the mandate of the committee.
During the reporting year the committee conducted its affairs with integrity, impartiality and objectivity. It complied with its roles and responsibilities as stated in the Act and its charter.
In executing its duties during the reporting period, the ARC:• Reviewed and considered the Integrated Report and Financial Statements.• Monitored and supervised the effective operation of the internal control and internal audit functions.• Oversaw the external audit process and the review of the report of the Auditor-General.• Ensured that an effective, efficient and transparent system of risk management is maintained.• In reviewing the reports from internal and external audit and reports from the internal risk function, it fulfilled an oversight
role to ensure compliance with laws and regulations.• Assisted the Board in carrying out its IT governance responsibilities.• Assisted the Board with the following:
o Reviewing the strategic plan and annual performance plan prior to Board approval.o Reviewing the annual budget prior to Board approval.o Reviewing the summary of public liability claims and other legal actions prior to Board approval.o Considering the concerns raised with regard to SANRAL’s going concern status as a result of the low collection of tolls on the Gauteng Freeway Improvement Project (GFIP) and proposing actions to the Board to mitigate this risk.o Performing such other oversight functions as may be determined by the Board.
3.3 Adequacy of internal controls
SANRAL’s system of internal control is designed to provide reasonable assurance that assets are safeguarded and that liabilities and working capital are efficiently managed.
The ARC is pleased to report that nothing came to its attention suggesting that any material breakdown had occurred in the functioning of the systems, procedures and controls that could lead to material losses, contingencies or uncertainties that would require disclosure in the financial statements.
Any control deficiencies identified by the internal and external auditors were brought to the attention of the committee and management implemented corrective action. Where internal controls did not operate effectively throughout the year, compensating controls or corrective action or both were used to eliminate or reduce risks.
For GFIP, a specific risk realisation process concluded that no material errors or breaches materialised as a result of the control weaknesses identified. Additional substantive tests were performed to ensure that reported financial results were materially accurate.
The committee has further reviewed the written assessment from Internal Audit on the design, implementation and effectiveness of the internal financial controls. Based on the results of this review, the committee is of the opinion that the internal financial controls form a sound basis for the preparation of reliable financial statements.
3.4 Internal audit
The internal audit function is outsourced. The appointed service provider for three years from 1 March 2016 is Business Innovation Group (BIG). The committee has considered and reviewed the performance of the service provider on a continuous basis and has been kept informed by both the Chief Financial Officer (CFO) and the external auditor.
The CFO managed the internal audit function until 31 October 2017. The Board resolved to separate this function and appointed a Chief Audit Executive as of 1 November 2017. The Chief Audit Executive has reported functionally to the ARC and administratively to the CEO since appointment.
THE SOUTH AFRICAN NATIONAL ROADS AGENCY SOC LIMITED
32
The ARC reviewed and amended the Internal Audit Charter, which stipulates the terms of reference for the internal audit function. The internal audit function’s annual operational and three-year-plans were considered and approved by the ARC. All internal audit work performed, internal audit reports and progress reports were reviewed by the ARC.
The internal audit function also participated in SANRAL’s Risk Cluster, identifying and assessing risks as observers.
3.5ExpertiseandeffectivenessofChiefFinancialOfficerandfinancefunction
The ARC examines and reviews the competence of the CFO and the finance function annually. It is satisfied that the CFO and the finance function have the appropriate expertise and experience. It further considered and satisfied itself of the overall appropriateness of expertise and adequacy of resources of the finance function.
Accordingly, the committee considered the CFO and the finance function to be sufficiently effective to: • Ensure and maintain effective, efficient and transparent systems of financial and risk management and internal control.• Manage available working capital efficiently and economically.• Manage and safeguard the assets of the agency and manage its revenue. expenditure and liabilities.• Comply with any tax, levy, duty, pension, and audit commitments as required by legislation.
3.6Evaluationofannualfinancialstatements
The committee has:• Reviewed and discussed with the Auditor-General and the Board of Directors the audited financial statements to be
included in the report.• Reviewed the Auditor-General’s management and audit reports.• Reviewed changes in accounting policies and practices.• Reviewed significant adjustments resulting from the audit.• Reviewed the Integrated Report and recommended it to the Board for approval.
The ARC concurs and accepts the conclusions of the Auditor-General on the annual financial statements and is of the opinion that the audited financial statements be accepted and read together with the report of the Auditor-General.
3.7 Risk management
The ARC has oversight of fraud and information technology risks. The committee fulfils an oversight role regarding financial reporting risks, internal financial controls, fraud and information technology risks as they relate to financial reporting.
3.8 Going concern
The committee assessed the going concern premise of SANRAL, for the foreseeable future, and confirms this status to the Board.
Allyson LawlessOn behalf of the Audit and Risk Committee as at 31 March 2018Date: 22 May 2018
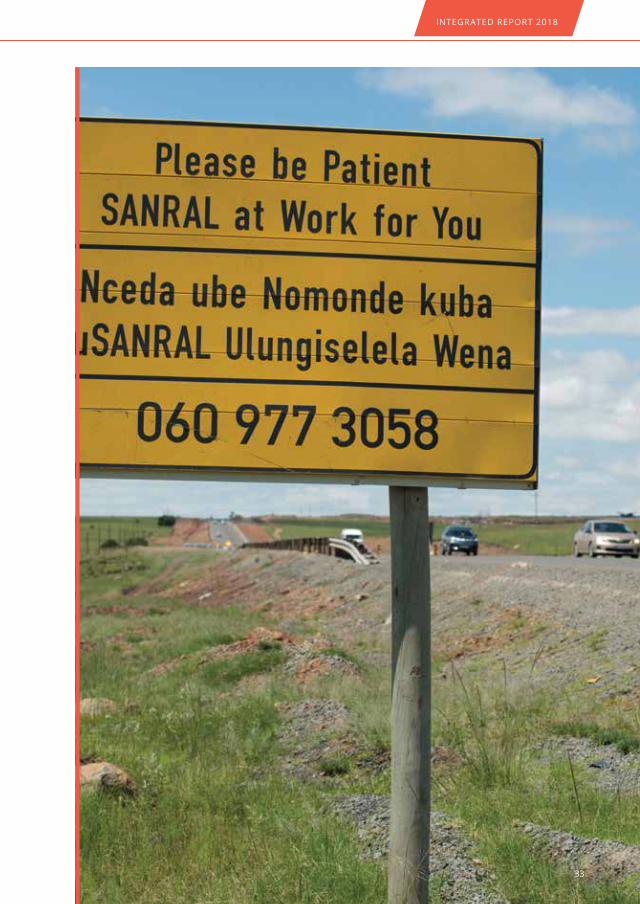
INTEGRATED REPORT 2018
33
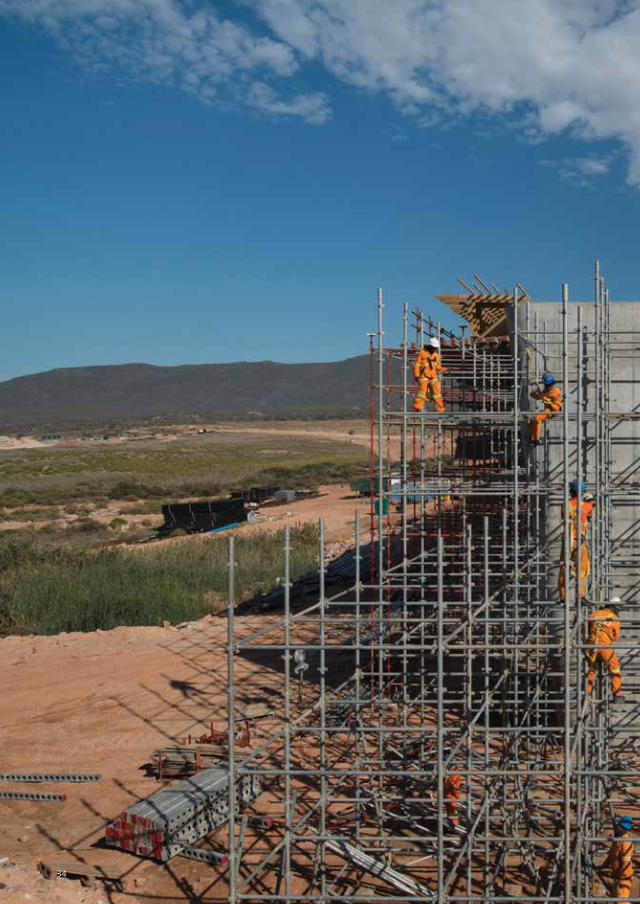
THE SOUTH AFRICAN NATIONAL ROADS AGENCY SOC LIMITED
34
INTEGRATED REPORT 2018
35
Report of Auditor-General 36
Directors’ Report 44
Statement of Responsibility by Board of Directors 52
Certificate of Company Secretary 53
Audited Financial Statements 54
sEcTION 4

THE SOUTH AFRICAN NATIONAL ROADS AGENCY SOC LIMITED
Section 4: Annual Financial Statements
1. Report of the auditor-general to parliament on the South African National Roads Agency (SOC) Limited
REpORT ON THE AUdIT OF THE FINANCIAL STATEmENTS
Opinion
1. I have audited the financial statements of the South African National Roads Agency SOC Ltd (SANRAL) set out on pages 54 to 137, which comprise the statement of financial position as at 31 March 2018, the statement of profit or loss and other comprehensive income, statement of changes in equity and statement of cash flows for the year then ended, as well as the notes to the financial statements, including a summary of significant accounting policies.
2. In my opinion, the financial statements present fairly, in all material respects, the financial position of SANRAL as at 31 March 2018, and its financial performance and cash flows for the year then ended in accordance with International Financial Reporting Standards (IFRS) and the requirements of the Public Finance Management Act of South Africa, 1999 (Act No. 1 of 1999) (PFMA) and the Companies Act of South Africa, 2008 (Act No. 71 of 2008) (Companies Act).
Basis for opinion
3. I conducted my audit in accordance with the International Standards on Auditing (ISAs). My responsibilities under those standards are further described in the auditor-general’s responsibilities for the audit of the financial statements section of this auditor’s report.
4. I am independent of the public entity in accordance with the International Ethics Standards Board for Accountants’ Code of ethics for professional accountants (IESBA code) and the ethical requirements that are relevant to my audit in South Africa. I have fulfilled my other ethical responsibilities in accordance with these requirements and the IESBA code.
5. I believe that the audit evidence I have obtained is sufficient and appropriate to provide a basis for my opinion.
Key audit matters
6. Key audit matters are those matters that, in my professional judgement, were of most significance in my audit of the financial statements of the current period. These matters were addressed in the context of my audit of the financial statements as a whole and in forming my opinion, and I do not provide a separate opinion or conclusion on these matters.
Key audit matter How the matter was addressed in the auditImpairment and collectability of trade receivables (toll)As disclosed in note 9 to the financial statements, allowances for impairment losses comprise mainly e-toll debtors. The impairment losses provided for in the current financial year amount to R6,4 billion, of which R6,06 billion relates to the e-toll debtors.
The assessment and calculation of impairment losses of e-toll debtors require management to make significant estimations and use significant judgement. Due to the subjectivity of the estimations and judgement, and the significant increase in the impairment losses, I consider the impairment and collectability of trade receivables (toll) to be a key audit matter.
I assessed the validity of outstanding trade receivables (toll) by confirming the individual transactions from a gantry pass to when a transaction is recognised in the receivables account. I also considered payments received subsequent to year-end and past payment history to identify potentially impaired balances.
The assessment of the appropriateness of the allowance for trade receivables (toll) comprised a variety of audit procedures, including:• evaluating the appropriateness and reasonableness of the assumptions applied
in management’s assessment of the impairment of e-toll debtors;• assessing the nature and extent of documentation supporting the assumptions;• verifying receipts from trade receivables (toll) subsequent to year-end as well as
considering past payment history;• considering the completeness and accuracy of the disclosures relating to the
impairment and trade receivables (toll roads).
To address the risk of management bias, I evaluated the results of my procedures against those relating to other key balances to assess whether there was an indication of bias.
I was satisfied that the trade receivables (toll) were fairly valued and adequately provided for where doubt existed. I further considered whether the impairment was misstated and concluded that it was appropriate, and disclosures relating to trade receivables (toll) in the annual financial statements were appropriate.
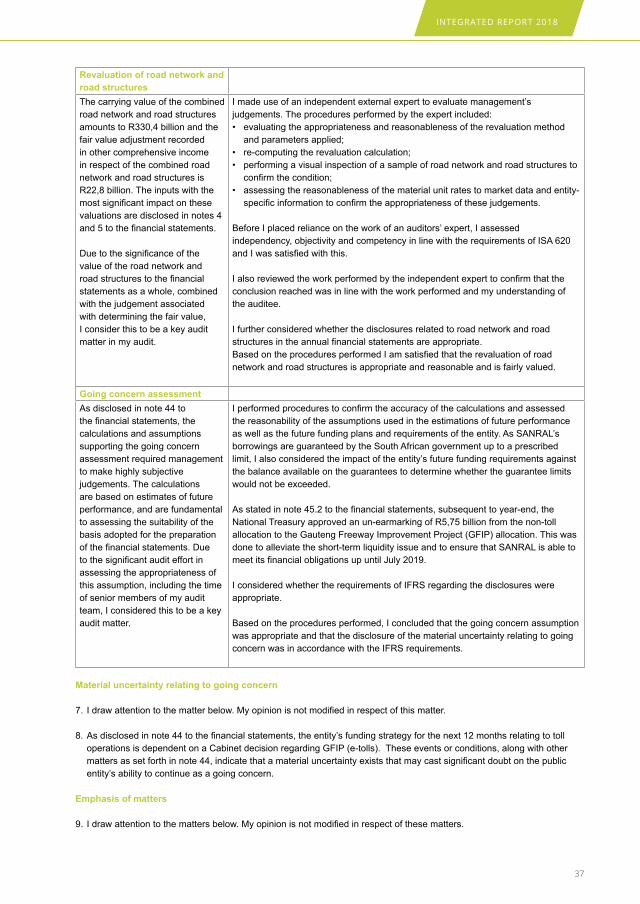
INTEGRATED REPORT 2018
37
Revaluation of road network and road structuresThe carrying value of the combined road network and road structures amounts to R330,4 billion and the fair value adjustment recorded in other comprehensive income in respect of the combined road network and road structures is R22,8 billion. The inputs with the most significant impact on these valuations are disclosed in notes 4 and 5 to the financial statements.
Due to the significance of the value of the road network and road structures to the financial statements as a whole, combined with the judgement associated with determining the fair value, I consider this to be a key audit matter in my audit.
I made use of an independent external expert to evaluate management’s judgements. The procedures performed by the expert included:• evaluating the appropriateness and reasonableness of the revaluation method
and parameters applied;• re-computing the revaluation calculation; • performing a visual inspection of a sample of road network and road structures to
confirm the condition;• assessing the reasonableness of the material unit rates to market data and entity-
specific information to confirm the appropriateness of these judgements.
Before I placed reliance on the work of an auditors’ expert, I assessed independency, objectivity and competency in line with the requirements of ISA 620 and I was satisfied with this.
I also reviewed the work performed by the independent expert to confirm that the conclusion reached was in line with the work performed and my understanding of the auditee.
I further considered whether the disclosures related to road network and road structures in the annual financial statements are appropriate.Based on the procedures performed I am satisfied that the revaluation of road network and road structures is appropriate and reasonable and is fairly valued.
Going concern assessmentAs disclosed in note 44 to the financial statements, the calculations and assumptions supporting the going concern assessment required management to make highly subjective judgements. The calculations are based on estimates of future performance, and are fundamental to assessing the suitability of the basis adopted for the preparation of the financial statements. Due to the significant audit effort in assessing the appropriateness of this assumption, including the time of senior members of my audit team, I considered this to be a key audit matter.
I performed procedures to confirm the accuracy of the calculations and assessed the reasonability of the assumptions used in the estimations of future performance as well as the future funding plans and requirements of the entity. As SANRAL’s borrowings are guaranteed by the South African government up to a prescribed limit, I also considered the impact of the entity’s future funding requirements against the balance available on the guarantees to determine whether the guarantee limits would not be exceeded.
As stated in note 45.2 to the financial statements, subsequent to year-end, the National Treasury approved an un-earmarking of R5,75 billion from the non-toll allocation to the Gauteng Freeway Improvement Project (GFIP) allocation. This was done to alleviate the short-term liquidity issue and to ensure that SANRAL is able to meet its financial obligations up until July 2019.
I considered whether the requirements of IFRS regarding the disclosures were appropriate.
Based on the procedures performed, I concluded that the going concern assumption was appropriate and that the disclosure of the material uncertainty relating to going concern was in accordance with the IFRS requirements.
material uncertainty relating to going concern
7. I draw attention to the matter below. My opinion is not modified in respect of this matter.
8. As disclosed in note 44 to the financial statements, the entity’s funding strategy for the next 12 months relating to toll operations is dependent on a Cabinet decision regarding GFIP (e-tolls). These events or conditions, along with other matters as set forth in note 44, indicate that a material uncertainty exists that may cast significant doubt on the public entity’s ability to continue as a going concern.
Emphasis of matters
9. I draw attention to the matters below. My opinion is not modified in respect of these matters.
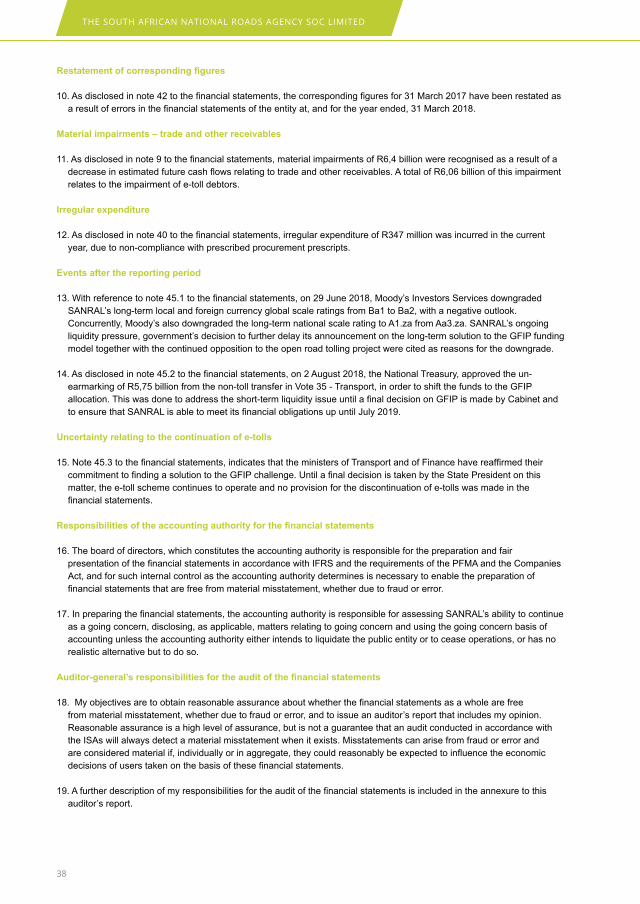
THE SOUTH AFRICAN NATIONAL ROADS AGENCY SOC LIMITED
38
Restatementofcorrespondingfigures
10. As disclosed in note 42 to the financial statements, the corresponding figures for 31 March 2017 have been restated as a result of errors in the financial statements of the entity at, and for the year ended, 31 March 2018.
material impairments – trade and other receivables
11. As disclosed in note 9 to the financial statements, material impairments of R6,4 billion were recognised as a result of a decrease in estimated future cash flows relating to trade and other receivables. A total of R6,06 billion of this impairment relates to the impairment of e-toll debtors.
Irregular expenditure
12. As disclosed in note 40 to the financial statements, irregular expenditure of R347 million was incurred in the current year, due to non-compliance with prescribed procurement prescripts.
Events after the reporting period
13. With reference to note 45.1 to the financial statements, on 29 June 2018, Moody’s Investors Services downgraded SANRAL’s long-term local and foreign currency global scale ratings from Ba1 to Ba2, with a negative outlook. Concurrently, Moody’s also downgraded the long-term national scale rating to A1.za from Aa3.za. SANRAL’s ongoing liquidity pressure, government’s decision to further delay its announcement on the long-term solution to the GFIP funding model together with the continued opposition to the open road tolling project were cited as reasons for the downgrade.
14. As disclosed in note 45.2 to the financial statements, on 2 August 2018, the National Treasury, approved the un-earmarking of R5,75 billion from the non-toll transfer in Vote 35 - Transport, in order to shift the funds to the GFIP allocation. This was done to address the short-term liquidity issue until a final decision on GFIP is made by Cabinet and to ensure that SANRAL is able to meet its financial obligations up until July 2019.
Uncertainty relating to the continuation of e-tolls
15. Note 45.3 to the financial statements, indicates that the ministers of Transport and of Finance have reaffirmed their commitment to finding a solution to the GFIP challenge. Until a final decision is taken by the State President on this matter, the e-toll scheme continues to operate and no provision for the discontinuation of e-tolls was made in the financial statements.
Responsibilitiesoftheaccountingauthorityforthefinancialstatements
16. The board of directors, which constitutes the accounting authority is responsible for the preparation and fair presentation of the financial statements in accordance with IFRS and the requirements of the PFMA and the Companies Act, and for such internal control as the accounting authority determines is necessary to enable the preparation of financial statements that are free from material misstatement, whether due to fraud or error.
17. In preparing the financial statements, the accounting authority is responsible for assessing SANRAL’s ability to continue as a going concern, disclosing, as applicable, matters relating to going concern and using the going concern basis of accounting unless the accounting authority either intends to liquidate the public entity or to cease operations, or has no realistic alternative but to do so.
Auditor-general’sresponsibilitiesfortheauditofthefinancialstatements
18. My objectives are to obtain reasonable assurance about whether the financial statements as a whole are free from material misstatement, whether due to fraud or error, and to issue an auditor’s report that includes my opinion. Reasonable assurance is a high level of assurance, but is not a guarantee that an audit conducted in accordance with the ISAs will always detect a material misstatement when it exists. Misstatements can arise from fraud or error and are considered material if, individually or in aggregate, they could reasonably be expected to influence the economic decisions of users taken on the basis of these financial statements.
19. A further description of my responsibilities for the audit of the financial statements is included in the annexure to this auditor’s report.

INTEGRATED REPORT 2018
39
REpORT ON THE AUdIT OF THE ANNUAL pERFORmANCE REpORT
Introduction and scope
20. In accordance with the Public Audit Act of South Africa, 2004 (Act No. 25 of 2004) (PAA) and the general notice issued in terms thereof, I have a responsibility to report material findings on the reported performance information against predetermined objectives for selected objectives presented in the annual performance report. I performed procedures to identify findings but not to gather evidence to express assurance.
21. My procedures address the reported performance information, which must be based on the approved performance planning documents of the public entity. I have not evaluated the completeness and appropriateness of the performance indicators included in the planning documents. My procedures also did not extend to any disclosures or assertions relating to planned performance strategies and information in respect of future periods that may be included as part of the reported performance information. Accordingly, my findings do not extend to these matters.
22. I evaluated the usefulness and reliability of the reported performance information in accordance with the criteria developed from the performance management and reporting framework, as defined in the general notice, for the following selected objectives presented in the annual performance report of the public entity for the year ended 31 March 2018:
Objectives pages in the annual performance reportObjective 1 – Manage the national road network effectively and efficiently 24Objective 2 – Provide safe roads 25Objective 3 – Carry out government's targeted programmes 25 - 27Objective 6 – Maintain financial sustainability 28
23. I performed procedures to determine whether the reported performance information was properly presented and whether performance was consistent with the approved performance planning documents. I performed further procedures to determine whether the indicators and related targets were measurable and relevant, and assessed the reliability of the reported performance information to determine whether it was valid, accurate and complete.
24. I did not raise any material findings on the usefulness and reliability of the reported performance information for the following objectives:• Objective 1 - Manage the national road network effectively and efficiently• Objective 2 - Provide safe roads• Objective 3 - Carry out government’s targeted programmes• Objective 6 - Maintain financial sustainability
OTHER mATTERS
25. I draw attention to the matters below.
Achievement of planned targets
26. Refer to the annual performance report on pages 24 to 30 for information on the achievement of planned targets for the year and explanations provided for the under/overachievement of a number of targets. This information should be considered in the context of the findings on the usefulness and reliability of the reported performance information in paragraph 24 of this report.
Adjustment of material misstatements
27. I identified a material misstatement in the annual performance report submitted for auditing. This material misstatement was on the reported performance information of Objective 3 - Carry out government’s targeted programmes. As management subsequently corrected the misstatement, I did not raise any material findings on the usefulness and reliability of the reported performance information.
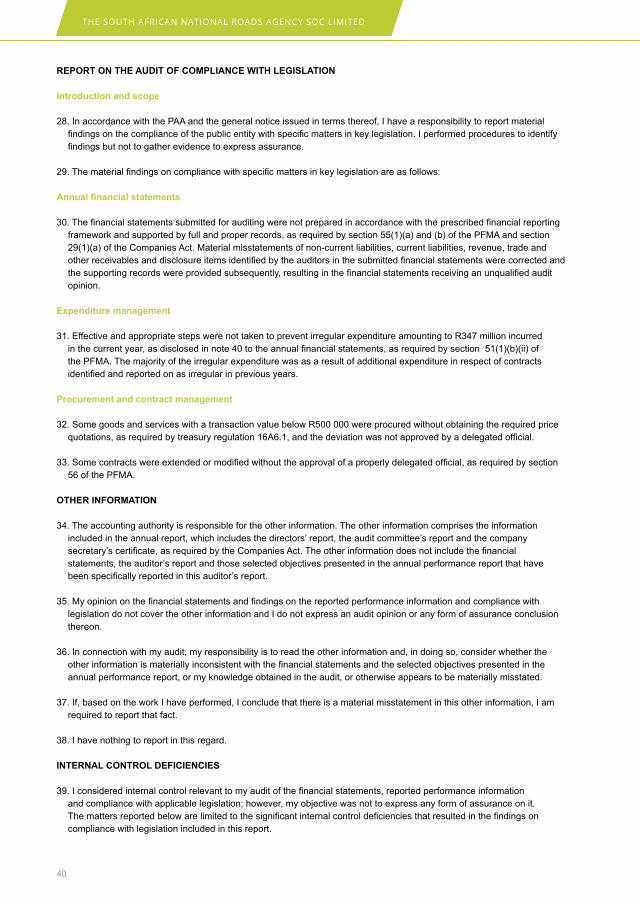
THE SOUTH AFRICAN NATIONAL ROADS AGENCY SOC LIMITED
40
REpORT ON THE AUdIT OF COmpLIANCE WITH LEGISLATION
Introduction and scope
28. In accordance with the PAA and the general notice issued in terms thereof, I have a responsibility to report material findings on the compliance of the public entity with specific matters in key legislation. I performed procedures to identify findings but not to gather evidence to express assurance.
29. The material findings on compliance with specific matters in key legislation are as follows:
Annualfinancialstatements
30. The financial statements submitted for auditing were not prepared in accordance with the prescribed financial reporting framework and supported by full and proper records, as required by section 55(1)(a) and (b) of the PFMA and section 29(1)(a) of the Companies Act. Material misstatements of non-current liabilities, current liabilities, revenue, trade and other receivables and disclosure items identified by the auditors in the submitted financial statements were corrected and the supporting records were provided subsequently, resulting in the financial statements receiving an unqualified audit opinion.
Expenditure management
31. Effective and appropriate steps were not taken to prevent irregular expenditure amounting to R347 million incurred in the current year, as disclosed in note 40 to the annual financial statements, as required by section 51(1)(b)(ii) of the PFMA. The majority of the irregular expenditure was as a result of additional expenditure in respect of contracts identified and reported on as irregular in previous years.
procurement and contract management
32. Some goods and services with a transaction value below R500 000 were procured without obtaining the required price quotations, as required by treasury regulation 16A6.1, and the deviation was not approved by a delegated official.
33. Some contracts were extended or modified without the approval of a properly delegated official, as required by section 56 of the PFMA.
OTHER INFORmATION
34. The accounting authority is responsible for the other information. The other information comprises the information included in the annual report, which includes the directors’ report, the audit committee’s report and the company secretary’s certificate, as required by the Companies Act. The other information does not include the financial statements, the auditor’s report and those selected objectives presented in the annual performance report that have been specifically reported in this auditor’s report.
35. My opinion on the financial statements and findings on the reported performance information and compliance with legislation do not cover the other information and I do not express an audit opinion or any form of assurance conclusion thereon.
36. In connection with my audit, my responsibility is to read the other information and, in doing so, consider whether the other information is materially inconsistent with the financial statements and the selected objectives presented in the annual performance report, or my knowledge obtained in the audit, or otherwise appears to be materially misstated.
37. If, based on the work I have performed, I conclude that there is a material misstatement in this other information, I am required to report that fact.
38. I have nothing to report in this regard.
INTERNAL CONTROL dEFICIENCIES
39. I considered internal control relevant to my audit of the financial statements, reported performance information and compliance with applicable legislation; however, my objective was not to express any form of assurance on it. The matters reported below are limited to the significant internal control deficiencies that resulted in the findings on compliance with legislation included in this report.
INTEGRATED REPORT 2018
41
Leadership
40. There has been a slow response by senior management to address previously reported deficiencies relating to oversight regarding the financial reporting process, including detailed reviews of the financial reports by delegated officials, compliance and related internal controls. Although an action plan to address audit findings was compiled by management, the plan was ineffective in timeously addressing the reported control deficiencies, as an appropriate level of management and governance structures did not monitor the status of addressing the findings and did not ensure that the lack of progress was escalated for further intervention.
OTHER REpORTS
41. I draw attention to the following engagements conducted by various parties that had, or could have, an impact on the matters reported in the public entity’s financial statements, reported performance information, compliance with applicable legislation and other related matters. These reports did not form part of my opinion on the financial statements or my findings on the reported performance information or compliance with legislation.
Investigations
42. An investigation into allegations of maladministration and irregular procurement processes relating to the Gauteng e-toll contracts was conducted by the Public Protector, in terms of section 182 of the Constitution of the Republic of South Africa, 1996 (Act No. 108 of 1996). This investigation was concluded on 30 January 2018.
43. The Directorate for Priority Crime Investigation is currently investigating offences perpetrated against SANRAL by various construction companies. This investigation has been ongoing since 2013.
Audit-related services
44. As requested by SANRAL, a limited assurance engagement was conducted during the year under review on the compliance review relating to the proposed issues by SANRAL (the ‘issuer’) of guaranteed promissory notes (the ‘Notes’) under its government guarantee of ZAR6 000 000 000 (Money and Capital Market Instruments guarantee), dated 16 November 1999, with the relevant provisions of the commercial paper regulations (Government Notice 2172 published in Government Gazette No. 16167 of 14 December 1994) issued by the registrar of banks (the ‘notice’), as required by paragraph 3(5)(j) of the notice. This report covered the period 1 April 2017 to 31 March 2018 and was issued on 27 March 2018 as requested by the accounting authority.
Auditor-GeneralPretoria27 August 2018
THE SOUTH AFRICAN NATIONAL ROADS AGENCY SOC LIMITED
42
Annexure – Auditor-general’s responsibility for the audit1. As part of an audit in accordance with the ISAs, I exercise professional judgement and maintain professional scepticism
throughout my audit of the financial statements, and the procedures performed on reported performance information for selected objectives and on the public entity’s compliance with respect to the selected subject matters.
Financial statements
2. In addition to my responsibility for the audit of the financial statements as described in this auditor’s report, I also:
• identify and assess the risks of material misstatement of the financial statements whether due to fraud or error, design and perform audit procedures responsive to those risks, and obtain audit evidence that is sufficient and appropriate to provide a basis for my opinion. The risk of not detecting a material misstatement resulting from fraud is higher than for one resulting from error, as fraud may involve collusion, forgery, intentional omissions, misrepresentations, or the override of internal control
• obtain an understanding of internal control relevant to the audit in order to design audit procedures that are appropriate in the circumstances, but not for the purpose of expressing an opinion on the effectiveness of the public entity’s internal control
• evaluate the appropriateness of accounting policies used and the reasonableness of accounting estimates and related disclosures made by the board of directors, which constitutes the accounting authority.
• conclude on the appropriateness of the use of the going concern basis of accounting by the board of directors, which constitutes the accounting authority in the preparation of the financial statements. I also conclude, based on the audit evidence obtained, whether a material uncertainty exists related to events or conditions that may cast significant doubt on SANRAL’s ability to continue as a going concern. If I conclude that a material uncertainty exists, I am required to draw attention in my auditor’s report to the related disclosures in the financial statements about the material uncertainty or, if such disclosures are inadequate, to modify the opinion on the financial statements. My conclusions are based on the information available to me at the date of this auditor’s report. However, future events or conditions may cause a public entity to cease continuing as a going concern
• evaluate the overall presentation, structure and content of the financial statements, including the disclosures, and whether the financial statements represent the underlying transactions and events in a manner that achieves fair presentation
Communication with those charged with governance
3. I communicate with the accounting authority regarding, among other matters, the planned scope and timing of the audit and significant audit findings, including any significant deficiencies in internal control that I identify during my audit.
4. I also confirm to the accounting authority that I have complied with relevant ethical requirements regarding independence, and communicate all relationships and other matters that may reasonably be thought to have a bearing on my independence and, where applicable, related safeguards.
5. From the matters communicated to those charged with governance, I determine those matters that were of the most significance in the audit of the financial statements of the current period and are therefore key audit matters. I describe these matters in this auditor’s report unless law or regulation precludes public disclosure about the matter or when, in extremely rare circumstances, I determine that a matter should not be communicated in this auditor’s report because the adverse consequences of doing so would reasonably be expected to outweigh the public interest of such communication.

INTEGRATED REPORT 2018
43

THE SOUTH AFRICAN NATIONAL ROADS AGENCY SOC LIMITED
44
2. directors’ Report
2.1 Introduction
The directors present their annual report as part of the audited annual financial statements of SANRAL for the year ended 31 March 2018.
SANRAL is incorporated as a state-owned company in South Africa in terms of the Companies Act No 71 of 2008 and is listed as a national public entity in schedule 3A of the Public Finance Management Act No 1 of 1999 (PFMA), as amended.
The Board of Directors acts as the accounting authority in terms of the PFMA, section 49(2) (a).
2.2 principal activities
The principal activities of SANRAL are the financing, management, control, planning, development, maintenance and rehabilitation of South Africa’s proclaimed national road network, as prescribed by the South African National Roads Agency Limited and National Roads Act No 7 of 1998 (SANRAL Act).
The declared national road network on 31 March 2018 was 22 214km. Non-toll roads comprise 87% of the total and toll roads constitute 13%. The non-toll roads are fully funded from the fiscus through an annual grant.
Although national roads account for 3.6% of the proclaimed road network in South Africa, they carry about 34.1% of all vehicle kilometres travelled and more than 70% of long-distance road freight. Travel density measured in vehicle kilometres decreased by 0.9% in 2017/18 across the entire SANRAL network, driven primarily by an overall decrease in vehicle travel as seen from a decrease in fuel sales.
During 2017/18, R3 654.8m (2017: R4 073.4m) was spent directly on toll roads. This comprised R1 560.7m for capital projects and R2 094.1m for maintenance. During the same period, R12 025.5m (2017: R12 368.9m) was spent directly on non-toll roads, with capital works absorbing R6 285.2m and maintenance R5 740.4m.
The Minister of Transport launched SANRAL’s strategy for the period leading up to 2030, Horizon 2030, and its draft Transformation Policy on 29 September 2017. This was followed by 40 public meetings across the country inviting comments on the published draft documents. The comments were reviewed and the documents updated during March 2018. The Board approved the implementation of the Transformation Policy to the extent that it does not require legislative changes or other approvals. The final documents will be submitted to the shareholder for approval.
The implementation of the 14 Point Plan to address community participation in projects, helped ensure that projects provide opportunities for local residents both in terms of work opportunities and business. It also provides opportunities for the community to express their needs in terms of development.
Work on the R573 Moloto Road continued. This project is intended to improve road safety and is a SIP 1 project, one of 20 infrastructure projects prioritised for accelerated implementation and reported at Cabinet level. The road was transferred to SANRAL in 2015/16 and Phase I of the multi-year project, which involves capital expenditure for work on the Limpopo and Mpumalanga sections, commenced in January 2017 with site establishment.
The Mpumalanga portion is scheduled for completion in June 2018 and these works include the upgrading of intersections, the incorporation of bus bays and pedestrian crossings. The phase in Limpopo is scheduled for completion in May 2019 and works include upgrading of the existing single carriageway, surfaced shoulders, upgrading of intersections, and installation of drainage structures, guardrails and fencing where required.
Excessive demands for employment and SMME participation and the over-subscription and misreading of the 30% sub-contracting requirement have led to site disruptions, threats to staff, unsafe working conditions and an inability to implement critical work. This is an ongoing risk and SANRAL developed a 14 Point Plan that stipulates the principles concerning project liaison, sub-contracting and labour sourcing on all SANRAL projects. This along with the Transformation Policy will further seek to mitigate the unrest and stabilise the construction environment in which excessive demands for opportunities are exacerbated by the economic downturn.
SANRAL and the Minister of Transport conducted several stakeholder engagement sessions in order to facilitate smooth implementation of the Moloto Road project and the creation of work opportunities for local communities. The planning and design of the latter phases of the project are at an advanced stage.
INTEGRATED REPORT 2018
45
The Mtentu Bridge, one of two mega bridges on the N2 Wild Coast, was handed over to the contractor on 8 January 2018. The contractor has, among others, entered into an empowerment deal worth R54m for the supply of aggregate with a local businessman. The Msikaba Bridge was re-tendered and the tender closed on 11 April 2018. Three international contractors, all with local joint venture partners, tendered. The tender is currently being evaluated and an award is planned by August/September 2018. All the haul roads leading to both bridges have been completed. Five community development projects have been launched on the Wild Coast route. These projects are meant to capacitate, develop and empower local communities and SMMEs.
SANRAL continued with its efforts to improve collections of outstanding toll payments from the Gauteng Freeway Improvement Project (GFIP). The initiatives are focused on the issuing of civil summonses to road users with toll payments in arrears. In instances where summonses were issued and SANRAL has received notices to defend, these matters will be dealt with by the applicable courts. During 2018, SANRAL will continue pursuing legal remedies against road users who are in arrears. The issuing of summonses in bulk will commence. SANRAL also has the option in terms of the SANRAL Act to institute criminal prosecution.
2.3 Human capital investment
During the year under review SANRAL continued its commitment to building a competent skills base in South Africa and its support of the objectives of the National Development Plan (NDP) while also achieving its transformation objectives. This is evident from the internal and external bursary programme; the investment in youth through the scholarship programme; and involvement in the training of communities in areas close to major road projects where there is the benefit of infrastructural improvements.
A total of 74 new staff members have been employed to address the professional skills gap in the organisation. Included in this grouping are nine graduates from the SANRAL bursary scheme who completed their studies. The entity is currently appointing a service provider to review its operating model and evaluate its effectiveness against the current challenges which the organisation faces.
Since 1998 SANRAL has operated using a flat structure with minimal management layers and has maintained a strong focus on technical skills and professionalism. The growth in kilometres under management and the increased administrative requirements emanating from the external control environment have necessitated a review of the organisational operating model.
SANRAL continues to support tertiary education through initiatives at the University of the Free State, Nelson Mandela University, University of Cape Town and Stellenbosch University. Each of these commitments aims to address national skills priorities through partnerships.
The newly developed and extensively consulted Transformation Policy is one of the critical enablers contained in Horizon 2030, the strategy framework which articulates the SANRAL agenda for development and transformation. Horizon 2030 calls for SANRAL to intensify its community development programme in order to increase the agency’s relevance in the lives of rural and urban South Africans.
Organisational structure SANRAL is managed in three clusters: finance, engineering and corporate services. These were headed by Ms I Mulder, Mr K Smit and Ms H Harper respectively in the year under review. During the year Mr K Smit retired and Mr L Kannemeyer was appointed as the Chief Engineer from 1 November 2017.
Mr I Essa was appointed as the Head of Transformation and Mr T Malahleha as the Head of Strategy. Ms B Mgqibi joined SANRAL on 1 February 2018 as the Risk Officer. The Board also appointed a Chief Audit Executive, Ms L Pitse, from 1 November 2017.
SANRAL is further divided into four regional offices and a corporate office. The regional managers were Mr W van der Merwe – acting (Northern Region – Pretoria), Mr K van der Walt (Western Region – Cape Town), Mr M Peterson (Southern Region – Port Elizabeth) and Ms L Sewnarain (Eastern Region – Pietermaritzburg).
Mr K van der Walt was appointed as the Head of the Technical Excellence Academy. Ms L Sewnarain resigned on 2 March 2018.
As of 1 April 2018, Mr P Hlahla was appointed as the regional manager for the Northern Region, Mr D Nkabinde for the Eastern Region and Mr R Cable for the Western Region.

THE SOUTH AFRICAN NATIONAL ROADS AGENCY SOC LIMITED
46
2.4 Financial resultsIn terms of legislation, funding for toll roads and non-toll roads respectively is ring-fenced. SANRAL separates the business activities and accounting records into toll operations and non-toll operations. Non-toll roads are financed through parliamentary appropriations under the vote of the National Department of Transport.
For toll roads, the debt used to finance the initial construction of the road is amortised over a period of 30 years using the proceeds collected through tolling.
The financial statements on pages 54 to 137 set out fully the financial position, results of operations, changes in equity and cash flows of SANRAL for the financial year ended 31 March 2018. Important features are highlighted below.
Reviewofprofitandloss
RevenueRevenue from non-toll operations was R9 018m for the year, which is a 4% increase on the previous year. To comply with International Financial Reporting Standards (IFRS), the portion of the grant received from government, which is utilised for capital projects, is deferred over the life of the asset. The total grant received from government was R13 581.5m, excluding the GFIP grant and amount transferred to toll roads.
Of this, R6 361m was capitalised and deferred for the year as it was spent on capital projects. The portion of previously deferred grants which was realised in the current year amounted to R1 669.4m.
Included in other income are contributions from other spheres of government and the private sector amounting to R262m. These relate to projects where a cost-sharing mechanism is used either to fund additional work on a SANRAL asset requested by private sector entities, such as developers, or to extend a SANRAL project to include work on adjacent roads for which other spheres of government are responsible. The full project expenditure is included in the total expenditure reported in the financial results.
The toll revenue from operations was R5 194m for the year, which is a 5.77% increase on the previous year. The GFIP revenue decreased by 4.83%. The main contributor is the significant decrease in the effects of IAS 39 discounting, whereas the CPI tariff adjustment was 5.9%. The alternative tariff was not recognised as revenue due to the probability that a discount would be granted. Revenue is therefore net of alternative tariff.
An amount of R463.5m (VAT inclusive) was received from government as a GFIP grant and there was a R1 900m transfer from the non-toll grant to address the shortfall as a result of the low toll tariff payments. The revenue is net of the impairment of R2 506m for the year.
The revenue from conventional toll routes increased by 12.4%, with the same CPI tariff adjustment of 5.9%. The growth in traffic volumes on toll routes contributed 6.5% to the increase in this revenue.
• On conventional “boom down” SANRAL-funded toll roads, the comprehensive toll road operations and maintenance (CTROM) contract model consolidates responsibility for operational activities and risks. Under this arrangement, the main contractor is responsible for the total operation of the specific toll route, together with assuming the associated risks. The operator pays the actual gross income (tariff x vehicle) to SANRAL and then claims discounts, concessions and violations as a cost, based on an agreed cost matrix. In essence the operator assumes the risk of collection.
• For the GFIP toll route, a service provider was appointed to manage the operations and collection. The operator is paid for services rendered to operate the tolling system and collects the toll on behalf of SANRAL. The risk of non-payment remains with SANRAL. The agreement with the operator includes performance clauses, as well as a performance guarantee in favour of SANRAL.
Finance chargesNet finance charges (finance costs less investment income) in 2018 were R82.03m more than the previous year. Due to the depleting cash, the interest on bank deposits reduced by R45m.
The shorter dated bonds issued to refinance existing debt were at a reduced rate and this resulted in the interest expense on liabilities declining by R349m (8.36%). The shorter dated instruments proved to be cost-effective but represent a much higher refinancing risk due to short maturities of approximately 12 months. Further details of finance costs are included in note 27 to the financial statements.
INTEGRATED REPORT 2018
47
ProfitbeforetaxationThe loss after the deduction of finance costs amounted to R260.4m (2017: R4 962m).
The non-toll operating loss, after finance charges, for the year ended 31 March 2018 was R801.13m (2017: loss of R380m). Income, mainly comprising the grant received from Government, increased by 1.6%, as a result of the transfer of R1 900m (VAT incl) to toll. Expenditure reduced by 12.3%, mainly as a result of maintenance expenditure on roads declining by 13.8%. Simultaneously, the continued slowdown in capital expenditure, involving rehabilitation and strengthening projects, resulted in a reduction in depreciation of R114.2m.
The toll operating profit after finance charges for the year ended 31 March 2018 was R540.8m. There was a 37.5% increase in income for toll operations, mainly as a result of the grant transferred from non-toll. Repairs and maintenance reduced by R63.4m (3%). Normal depreciation (including concession assets) increased by R153.4m (10.7%) due to increased spending on completed capital works in the toll portfolio. Finance costs decreased by R211.8m (4.6%) as a result of decreased borrowing.
TaxationSANRAL was exempted from income tax in the Government Gazette of 22 December 2003 (Revenue Laws Amendment Act, 2003 section 1(l) and 2(d)). This exemption was backdated to the inception of the entity, and therefore no provision is made for income tax or deferred tax.
dividendsNo dividends have been declared by SANRAL.
Reviewoffinancialposition
Share capitalThe shareholding for the current year has remained unchanged. The government, represented by the Minister of Transport, holds all shares issued by SANRAL.
LandSANRAL’s property management is undertaken by a service provider with the skills and resources required to manage and maintain our large land portfolio consisting of road reserve and adjacent severed properties. The service provider is a single entity that delivers all aspects of land surveying, property valuation, maintenance and management services. The service provider is managed by a team of SANRAL staff located in our regional and head offices.
The contractual targets include a requirement that 50% of all work be sub-contracted. This provides opportunities for small and previously disadvantaged firms to obtain property work from SANRAL. The contractor has complied with contractual requirements related to the provision of training, promotion of economic development, addressing skills shortages and making work available to targeted groups.
In line with the SANRAL Act, SANRAL ensures that all land acquired by it or its predecessors, whether inside or outside of the road reserve, is identified and transferred into SANRAL’s name. All land acquired by SANRAL since its inception has been so transferred. The land identification process and the transfer of land to SANRAL will continue where further roads are added to the network.
Land outside of road reserves is categorised as investment property or “other” land if it has insignificant or no investment value. The road reserve consists of 32 737 properties, while investment property comprises 2 232 properties. property, plant and equipmentRoad assets are valued on a depreciated replacement cost basis. The valuation of the road network and structures was reviewed at year-end and increased by R22 813m (-1.9%).
The increase in road network and structures was as a result of: • Unit rates increasing by 5.96%, mainly due to material prices increasing by 7.2% and fuel by 17.8% over the period. • An increase in traffic volume of 4.98%, mostly due to updated traffic data on previously incorporated roads.
The value of land within the road reserve was reviewed at year-end and decreased by R367.7m (-1.9%) due to:• The average strip value decreasing from R579 587/ha to R518 411/ha (-10.6%). The value of property is significantly
influenced by economic activity in the surrounding area. • An increase of 2.28% in the total area of land. This increase of 2 338 ha is mostly due to updated data on the previously
incorporated roads that were mainly in rural areas and therefore have lower strip values.
THE SOUTH AFRICAN NATIONAL ROADS AGENCY SOC LIMITED
48
The remaining life of these assets is considered when determining their depreciated replacement cost, taking the condition of the pavement into account. In the financial year the average condition of national roads improved due to the completion of capital strengthening projects and lower rainfall. Further information is available in notes 4 and 5 of the financial statements.
SANRAL currently applies the benchmark treatment of International Accounting Standard (IAS) 16 on “property, plant and equipment”, which allows for the valuation of assets at fair value. SANRAL has adopted this principle as opposed to depreciated cost. Fair value in this instance represents the depreciated replacement cost, due to the special nature of these assets. This methodology takes the unit cost for road bed, layers and structures into account, as well as the condition or remaining life of the road asset.
In terms of IAS 36, assets must be assessed annually and impairments recorded if their income-generating potential is estimated to be less than the carrying value. Non-toll assets have been identified as a non-cash-generating unit. IFRS does not prescribe the impairment of non-cash-generating units and allows other standards to apply in such instances. SANRAL has elected to apply the International Public Sector Accounting Standard 21 to determine the carrying amount of a non-cash-generating unit. InvestmentsNo significant acquisitions or disposals occurred in the period under review.
Financial instruments in the market-making portfolio are used to manage the risks that SANRAL is exposed to in the capital markets.
Cash and cash equivalentsAt 31 March 2018, cash and cash equivalents held amounted to R7 647m (2017: R6 570m). In the normal course of business, SANRAL limits liquidity risk by maintaining a healthy liquidity buffer equivalent to three times the agency’s estimated monthly expenditure. The weighted average investment rate for the current financial year was 7.88% (2017: 7.81%).
Going concernThe going concern basis has been adopted in preparing the financial statements.
IAS 1, paragraph 25, requires an entity to assess its ability to continue as a going concern when preparing financial statements. It further indicates that it is a requirement to prepare financial statements as a going concern, unless the management intends to liquidate the entity or cease trading or has no realistic alternative but to do so.
SANRAL’s assessment considered the following:
AssetsAs a stand-alone company, SANRAL’s significant asset base of R387 659m and net asset value of R271 300m are regarded as very healthy. As a provider of national roads, the asset base would never be considered for liquidation or sold. The probability that government would consider the scrapping or selling of national roads is remote as they constitute a national asset which helps drive the economy of the country.
LiquiditySANRAL receives an annual grant from the fiscus to fund the non-toll portfolio. In the year under review this amounted to R15 581.5m. Since SANRAL’s inception the annual increase in this grant has exceeded inflation. This amount covers operational and capital expenditure on non-toll roads which comprise 87% of SANRAL’s portfolio. Budget Vote 35 indicated that this grant would increase to R19 785.9m in 2020/21.
Revenue from conventional toll routes added R3 426m to cash receipts in the year under review and is expected to increase annually with traffic growth and tariff adjustments.
During the same period GFIP collected R719m and received an additional grant from the fiscus of R463.5m (VAT incl). Due to the low collection rate on GFIP, cash receipt projections are conservatively assumed to be the same as the past eight to 10 months. The shareholder and the Minister of Finance approved a transfer of R1 900m (VAT incl) from the non-toll allocation to toll in order to strengthen the portfolio is the short term. The Board has requested the shareholder to address the impact of the poor collection rate with Cabinet to ensure the sustainability of SANRAL. The shareholder, the Minister of Transport, and the President committed to resolve this matter by 31 May 2018.
In reviewing cash requirements to September 2019, SANRAL requires a minimum of R9 478m. Of this, R7 149m is required to refinance maturing debt.
INTEGRATED REPORT 2018
49
In the year under review, SANRAL was successful in launching a promissory note programme of R1 900m, under its R6 000m guarantee and managed to raise R1 224m. The NRA028 bond was also tapped for R225m as investors found value in the pricing of the non-guaranteed bond.
SANRAL’s funding strategy for 2018/19 is dependent on government’s decision with regard to GFIP.
In the current market conditions, where local investor sentiment in relation to long-term investments is negative, short-term floating rate notes are readily accessible and SANRAL will certainly continue to tap this market to supplement other funding strategies. The promissory notes issued under the R6 000m guarantee will be rolled over upon maturity in March 2019, ensuring utilisation of this guarantee. Upon completion of the updates to the domestic medium-term note (DMTN) programmes and approval from noteholders, set for 6 June 2018, these instruments may be utilised.
Furthermore, various guarantees from government total R37 910m (comprising the R31 910m and R6 000m guarantees) and R29 747m of these facilities had been utilised at 31 March 2018. Projections based on current funding requirements indicate that the total guarantee limit would only be breached after March 2020. Apart from the conservative approach to GFIP receipts, the projections assume no new toll roads and limited capital expenditure on roads, where this is possible without compromising the asset. A request to increase the total guarantee to R43 000m and the borrowing limit to R54 000m (from R47 910m), was submitted in late 2016. R40 050m (nominal) of the borrowing limit was used by 31 March 2018.
SANRAL also has the option of issuing non-guaranteed debt under the R15 000m non-guaranteed DMTN programme. At 31 March 2018, R4 800m was available to issue new bonds or tap existing bonds. This was successfully done in the year under review and can be pursued in the near future.
Government has also committed to providing an additional grant of R463.4m per annum, adjusted for inflation, to supplement GFIP revenues. This, as well as the transfer of R1 900m (R1 667m excl VAT) from non-toll to toll, clearly reflects government’s continued support to ensure SANRAL’s viability.
However, if all of the above fails, government may step in to service the debt, in terms of the R31 910m guarantee agreement (clause 6.2).
Additional considerationsSANRAL may not be placed under judicial management or in liquidation except by an act of Parliament (Section 10 of the SANRAL Act). This is an implied guarantee from government.
The Board of Directors therefore supports management’s assessment that SANRAL will remain a going concern in the foreseeable future.
2.5 Auditors
The Auditor-General of South Africa (AGSA) is the external auditor of SANRAL, as prescribed in section 36(3)(a) of the SANRAL Act.
2.6 materiality framework
A materiality framework has been developed for reporting losses through criminal conduct, irregular, fruitless and wasteful expenditure, or significant transactions that require ministerial approval, as envisaged in section 54(2) of the PFMA. The framework was finalised by SANRAL after consultation with external and internal auditors, and formally approved by the Board on 25 May 2004. The framework was updated in March 2018 to incorporate the latest approved budget, resulting in a materiality value of R56m.
2.7 Contingent liabilities
Among the most significant contingent liabilities are possible legal claims, mainly resulting from road-related incidents. These are estimated at R249.7m (2017: R275.7m) but the outflow of cash is remote as during the past several years SANRAL has won the majority of relevant court cases. Cases that were not won by SANRAL were covered by insurance.
The potential liability arising from the levying of municipal rates on SANRAL’s land holdings is estimated at R114.3m (2017: R47.8m). These rates have not yet been introduced.
In addition, potential claims may arise due to failure to take steps to protect the pavement and increase tolls as stipulated in the contract with the concessionaire on the Maputo development corridor. The value of such claims is estimated at R82.8m.
THE SOUTH AFRICAN NATIONAL ROADS AGENCY SOC LIMITED
50
2.8 Credit rating
SANRAL’s debt mainly comprises bonds that are listed and traded on the Johannesburg Stock Exchange (JSE), although there are a few unlisted instruments. The borrowing limit approved by government is approximately R47 910m (depending on CPI assumptions). Up to R37 910m of this amount can be guaranteed.
To facilitate investment in SANRAL debt related to its toll portfolio, the agency has been rated by the international credit rating agency, Moody’s, since March 2007. The credit rating enables SANRAL to raise non-guaranteed and guaranteed debt competitively
Following the sovereign downgrade, Moody’s Ratings Agency downgraded SANRAL’s global scale rating on 12 June 2017 to Ba1 from Baa3, long-term, and NP from P-3 for short-term. The national scale rating was affirmed at Aa3, which is positive because SANRAL has only issued in the domestic market to date.
The ratings agency’s view of the South African sovereign credit risk had a significant impact on this move to downgrade most SOCs. In addition, Moody’s cited as a reason that SANRAL’s ability to enforce e-toll payments is largely dependent on the continued support of government. This together with high debt levels and a weak liquidity position stemming from continued opposition to GFIP were reasons for the ratings review.
The rating, as at 31 March 2018, is as follows:
National Scale Issuer Ratings: Long-Term: Aa3.zaShort-Term: P-1.za Global Scale Issuer Ratings:Long-Term: Ba1Short-Term: NP
On 28 November 2017, Moody’s placed SANRAL on review for a downgrade along with another 14 South African sub-sovereigns. This was based on the potential weakening of the South African government’s credit profile.
On 28 March 2018, Moody’s confirmed its decision to maintain the rating on review for a downgrade.
2.9 public-private partnerships
In addition to its parliamentary appropriation, SANRAL has implemented public-private partnerships (PPPs) as an alternative means of financing and operating the national road network, with the costs recovered through user charges. PPPs allow SANRAL to leverage funding available in the private sector to meet identified infrastructure and service delivery needs in a manner that is cost-effective and appropriate to each project. Furthermore, they ensure that financing is set aside for the improvement and preservation of the country’s road assets for periods well beyond government’s three-year expenditure horizon. Annually the benefit is reflected in the increased values under Property, Plant and Equipment (PPE) under Concession, as the concessionaires upgrade the roads which belong to SANRAL.
The agreement with Trans African Concessions (Pty) Ltd (TRAC) became effective on 6 February 1998 and terminates on 5 February 2028. This includes the extension of the N4 as agreed during the 2005 financial year.
The agreement with N3 Toll Concessions (RF) Proprietary Limited (N3TC) became effective on 2 November 1999 and terminates on 1 November 2029.
The agreement with the N1-N4 Bakwena Platinum Corridor Concessionaire (Pty) Ltd (Bakwena) became effective on 27 August 2001 and terminates on 26 August 2031. SANRAL has considered the implications of International Financial Reporting Interpretation Code 12 and the Accounting Standards Board’s guideline in terms of accounting for assets under concession and has decided to account for these assets by recording them as property, plant and equipment. In the absence of clear accounting guidance from these guidelines, SANRAL has set out its interpretation in note 4. 2.10 Subsequent events
• CreditRatingOn 29 June 2018, Moody’s Investors Services downgraded SANRAL’s long-term local and foreign currency global
INTEGRATED REPORT 2018
51
scale ratings from Ba1 to Ba2, with a negative outlook. Moody’s affirmed the short-term global scale of NP (Not Prime). Concurrently, Moody’s also downgraded the long-term national scale rating to A1.za from Aa3.za and affirmed the short-term national scale rating of P-1.za. Moody’s cited the “ongoing liquidity pressure which is exacerbated by the national government’s decision to further delay its announcement on the long-term solution to SANRAL’s Gauteng Freeway Improvement Project (GFIP) funding model”.
• GoingConcern
On 2 August 2018, National Treasury approved the un-earmarking of R5.75bn (VAT incl) from the non-toll transfer in Vote 35, in order to shift the funds to the GFIP allocation. This was done to address the short term liquidity issue until the final decision with regards to GFIP is made by Cabinet. The amount is sufficient to ensure SANRAL is able to meet all its obligations up to July 2019. The appetite of investors can also be tested as this transfer will strengthen the view that Government will continue to ensure SANRAL’s sustainability. In light of the R5.75bn intervention, the SANRAL board is reviewing the decision to stop issuing debt in the bond market with a view to re-entering the bond market to secure capital for the toll road portfolio. The Ministers of Transport and Finance have reaffirmed their commitment to finding a solution to the GFIP challenge and will recommend to the State President that engagements in this regard should include the Gauteng ANC Chairman who is also the Premier of the provincial government. Until a final decision is taken by the State President on this matter, the e-toll scheme continues to operate and SANRAL will continue with legal and administrative processes that are aimed at ensuring continued toll operations and improved debt recovery. These events have not had any impact on the annual financial statements, as SANRAL remains a going concern and its mandate has not changed.
2.11 directors and Secretary
Since 1 March 2015 the Board, as appointed by the Minister, has comprised the following individuals:
• Executive director S Macozoma (Chief Executive Officer) • Non-executive directors R Morar (Chairperson) A Halstead (Public official)* C Hlabisa (Public official)** Z Kganyago A Lawless D Mashile-Nkosi M Matete * Ms Halstead is the appointed representative of the Minister of Finance and is an employee of National Treasury.** Mr Hlabisa is the appointed representative of the Minister of Transport and is an employee of the Department of Transport.
For the year under review Ms A Mathew held the position of Company Secretary.
directors’ interests in contracts All directors and officers of SANRAL have confirmed that they had no interest in any contract of significance with SANRAL which could have resulted in a conflict of interest during the current year.
2.12 AddressesSANRAL’s business, postal and registered addresses are as follows:
Business address postal address Registered address 48 Tambotie Avenue P.O. Box 415 48 Tambotie AvenueVal de Grace Pretoria Val de GracePretoria 0001 Pretoria 0184 0184
31 March 2018
THE SOUTH AFRICAN NATIONAL ROADS AGENCY SOC LIMITED
52
3. Statement of Responsibility by the Board of directors
The directors are responsible for the preparation, integrity and fair presentation of the financial statements of the South African National Roads Agency Limited. The financial statements presented on pages 54 to 137 have been prepared in accordance with International Financial Reporting Standards (IFRS) and include amounts based on judgments and estimates made by management. The directors also prepared the other information included in the Integrated Report and are responsible for both its accuracy and its consistency with the financial statements.
The going concern basis has been adopted in preparing the financial statements. In light of the projected Medium-term Expenditure Framework (MTEF) allocations and the policy of adjusting the toll tariffs in line with the Consumer Price Index (CPI), the directors believe SANRAL will be a going concern in the foreseeable future. These financial statements support the viability of SANRAL.
The financial statements have been audited by independent auditors, who were given unrestricted access to all financial records and related data, including minutes of all meetings of the Board of Directors and committees of the Board.
The directors believe that all representations made to the independent auditors during their audit are valid and appropriate.
The Audit Report of the Office of the Auditor-General is presented on pages 36 to 41.
The financial statements were approved by the Board of Directors on 29 May 2018 and are signed on its behalf.
Roshan morarChairperson
INTEGRATED REPORT 2018
53
4.CertificateofCompanySecretary
I hereby confirm in terms of the Companies Act No 71 of 2008, as amended, that for the year ended 31 March 2018, the South African National Roads Agency SOC Limited has lodged with the Companies and Intellectual Property Commission all returns as required in terms of this Act and that all such returns are true, correct and up to date.
Alice mathewCompany Secretary
31 May 2018
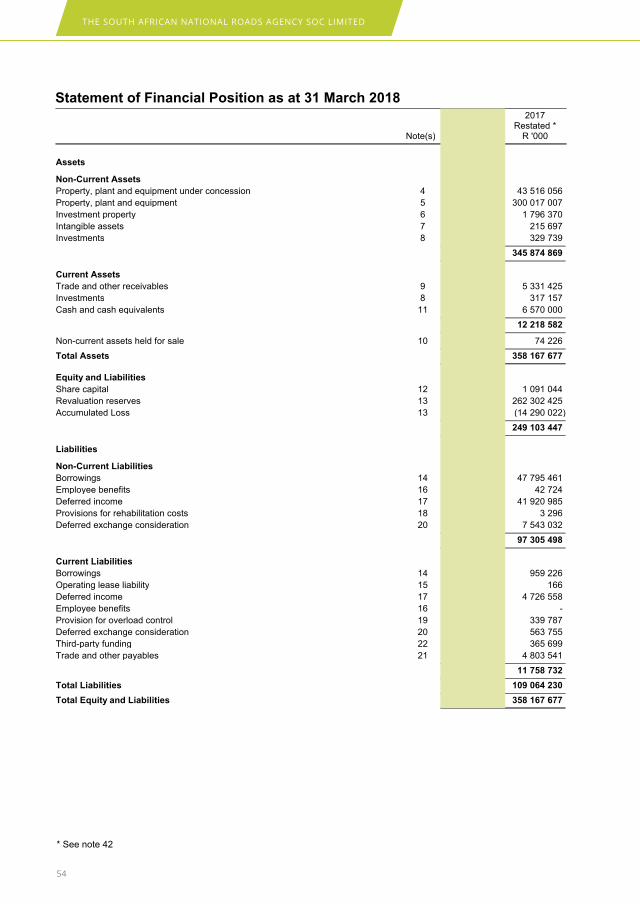
THE SOUTH AFRICAN NATIONAL ROADS AGENCY SOC LIMITED
54
South African National Roads Agency SOC Limited(Registration number 1998/009584/30)Financial Statements for the year ended 31 March 2018
Statement of Financial Position as at 31 March 20182018 2017
Restated *Note(s) R '000 R '000
Assets
Non-Current Assets
Property, plant and equipment under concession 4 47 023 996 43 516 056
Property, plant and equipment 5 325 745 115 300 017 007
Investment property 6 1 810 430 1 796 370
Intangible assets 7 185 206 215 697
Investments 8 372 562 329 739
375 137 309 345 874 869
Current Assets
Trade and other receivables 9 4 801 036 5 331 425
Investments 8 42 800 317 157
Cash and cash equivalents 11 7 646 576 6 570 000
12 490 412 12 218 582
Non-current assets held for sale 10 30 940 74 226
Total Assets 387 658 661 358 167 677
Equity and Liabilities
Share capital 12 1 091 044 1 091 044
Revaluation reserves 13 284 748 043 262 302 425
Accumulated Loss 13 (14 539 072) (14 290 022)
271 300 015 249 103 447
Liabilities
Non-Current Liabilities
Borrowings 14 45 908 214 47 795 461
Employee benefits 16 48 038 42 724
Deferred income 17 46 429 543 41 920 985
Provisions for rehabilitation costs 18 3 477 3 296
Deferred exchange consideration 20 8 093 289 7 543 032
100 482 561 97 305 498
Current Liabilities
Borrowings 14 4 200 963 959 226
Operating lease liability 15 86 166
Deferred income 17 4 723 320 4 726 558
Employee benefits 16 1 162 -
Provision for overload control 19 323 068 339 787
Deferred exchange consideration 20 548 238 563 755
Third-party funding 22 281 607 365 699
Trade and other payables 21 5 797 641 4 803 541
15 876 085 11 758 732
Total Liabilities 116 358 646 109 064 230
Total Equity and Liabilities 387 658 661 358 167 677
* See Note 42
4
* See note 42
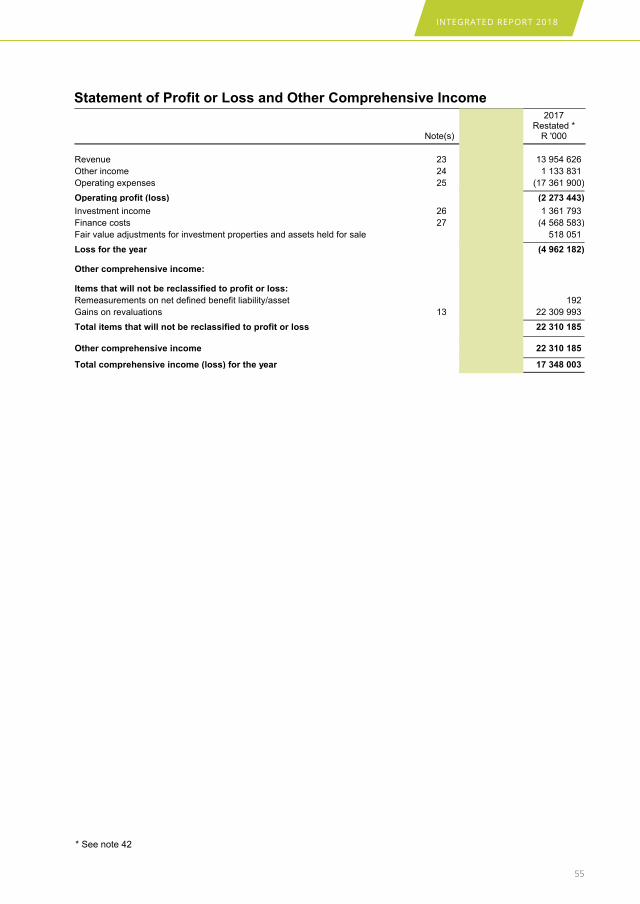
INTEGRATED REPORT 2018
55
South African National Roads Agency SOC Limited(Registration number 1998/009584/30)Financial Statements for the year ended 31 March 2018
Statement of Profit or Loss and Other Comprehensive Income2018 2017
Restated *Note(s) R '000 R '000
Revenue 23 16 285 005 13 954 626
Other income 24 1 059 655 1 133 831
Operating expenses 25 (14 298 965) (17 361 900)
Operating profit (loss) 3 045 695 (2 273 443)
Investment income 26 1 067 919 1 361 793
Finance costs 27 (4 356 741) (4 568 583)
Fair value adjustments for investment properties and assets held for sale (17 231) 518 051
Loss for the year (260 358) (4 962 182)
Other comprehensive income:
Items that will not be reclassified to profit or loss:
Remeasurements on net defined benefit liability/asset (110) 192
Gains on revaluations 13 22 445 618 22 309 993
Total items that will not be reclassified to profit or loss 22 445 508 22 310 185
Other comprehensive income 22 445 508 22 310 185
Total comprehensive income (loss) for the year 22 185 150 17 348 003
* See Note 42
5
* See note 42
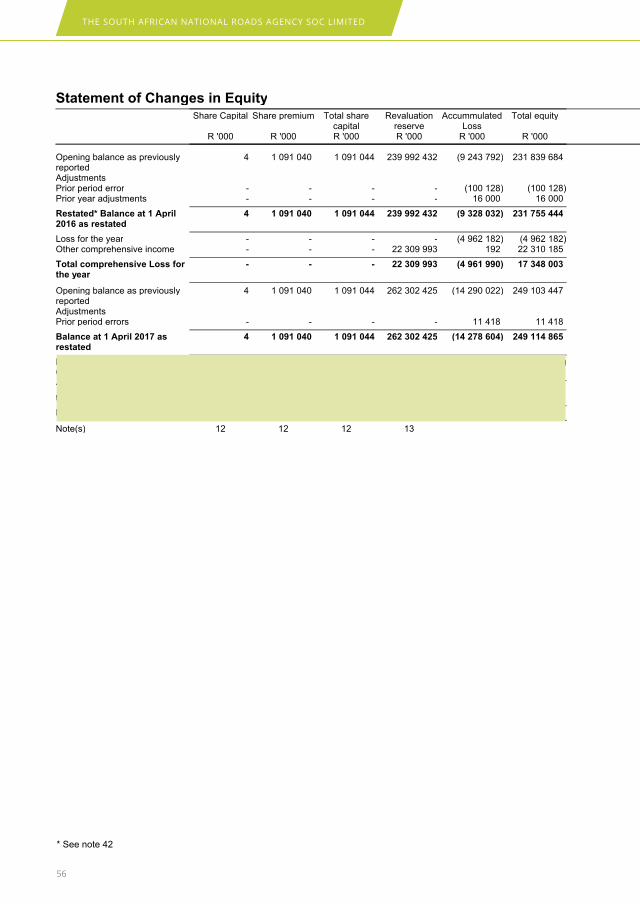
THE SOUTH AFRICAN NATIONAL ROADS AGENCY SOC LIMITED
56
South African National Roads Agency SOC Limited(Registration number 1998/009584/30)Financial Statements for the year ended 31 March 2018
Statement of Changes in EquityShare Capital Share premium Total share
capitalRevaluation
reserveAccummulated
LossTotal equity
R '000 R '000 R '000 R '000 R '000 R '000
Opening balance as previouslyreported
4 1 091 040 1 091 044 239 992 432 (9 243 792) 231 839 684
AdjustmentsPrior period error - - - - (100 128) (100 128)Prior year adjustments - - - - 16 000 16 000
Restated* Balance at 1 April2016 as restated
4 1 091 040 1 091 044 239 992 432 (9 328 032) 231 755 444
Loss for the year - - - - (4 962 182) (4 962 182)Other comprehensive income - - - 22 309 993 192 22 310 185
Total comprehensive Loss forthe year
- - - 22 309 993 (4 961 990) 17 348 003
Opening balance as previouslyreported
4 1 091 040 1 091 044 262 302 425 (14 290 022) 249 103 447
AdjustmentsPrior period errors - - - - 11 418 11 418
Balance at 1 April 2017 asrestated
4 1 091 040 1 091 044 262 302 425 (14 278 604) 249 114 865
Loss for the year - - - - (260 358) (260 358)Other comprehensive income - - - 22 445 618 (110) 22 445 508
Total comprehensive Loss forthe year
- - - 22 445 618 (260 468) 22 185 150
Balance at 31 March 2018 4 1 091 040 1 091 044 284 748 043 (14 539 072) 271 300 015
Note(s) 12 12 12 13
* See Note 42
6
* See note 42

INTEGRATED REPORT 2018
57
South African National Roads Agency SOC Limited(Registration number 1998/009584/30)Financial Statements for the year ended 31 March 2018
Statement of Cash Flows2018 2017
Restated *Note(s) R '000 R '000
Cash flows from operating activities
Cash receipts from customers 31 13 226 758 12 002 516
Cash paid to suppliers and employees 30 (8 729 606) (10 203 685)
Cash generated from operations 29 4 497 152 1 798 831
Interest income received 851 144 902 299
Finance costs (4 088 591) (4 636 620)
Net cash from operating activities 1 259 705 (1 935 490)
Cash flows from investing activities
Purchase of property, plant and equipment 5 (8 880 915) (7 652 171)
Proceeds from sale of assets 5 - 43 227
Sale of investment property 6 33 118 -
Purchase of intangible assets 7 (4 693) (5 820)
Disposal of other intangible assets 7 2 -
Proceeds from investments 158 322 216 040
Net cash from investing activities (8 694 166) (7 398 724)
Cash flows from financing activities
Third party funding (84 092) (21 094)
Proceeds from borrowings 2 234 217 742 151
Capital portion of government grant 6 360 912 5 693 050
Net cash from financing activities 8 511 037 6 414 107
Net increase/(decrease) in cash and cash equivalents for the period 1 076 576 (2 920 107)
Cash and cash equivalents at the beginning of the period 6 570 000 9 490 107
Total cash and cash equivalents at end of the period 11 7 646 576 6 570 000
* See Note 42
7
* See note 42
THE SOUTH AFRICAN NATIONAL ROADS AGENCY SOC LIMITED
58
South African National Roads Agency SOC Limited(Registration number 1998/009584/30)Financial Statements for the year ended 31 March 2018
Accounting Policies
1. Significant accounting policies
The financial statements have been prepared in accordance with International Financial Reporting Standards, the CompaniesAct No. 71 of 2008, the Public Finance Management Act, No. 1 of 1999 and the South African National Roads Agency Limitedand National Roads Act No. 7 of 1998. The financial statements have been prepared on the historic cost convention, except forthe following:
Held-for-trading financial instruments within the toll segment (measured at fair value) Land (measured at revalued amount) Road network and road structures assets (measured at revalued amount) Investment property (measured at fair value).
The financial statements incorporate the principal accounting policies set out below. They are presented in South AfricanRands, the functional currency of the company, and are rounded to the nearest thousand.
These accounting policies are consistent with the previous period except where there are changes in the accounting standardsand reporting framework. Refer to note 2.
Going concern
The directors have, at the time of approving the annual financial statements, a reasonable expectation that SANRAL will haveadequate resources to continue in operational existence for the foreseeable future. Thus the going concern basis of accountingin preparing the annual financial statements continues to be adopted. Further details are contained in the Directors' Report andnote 44.
1.1 Statement of compliance
Public Finance Management Act (PFMA)
The PFMA chapter 6 para 55 (1)(b) requires the South African National Roads Agency SOC Limited (SANRAL) to report interms of Generally Recognised Accounting Practice (GRAP).
The nature of SANRAL’s operations is such that large amounts of finance are required from time to time. This finance iscurrently raised through debt that is publicly traded.
Directive 12 issued by Accounting Standard Board (ASB)
Directive 12 requires SANRAL to apply the standards of GRAP as a reporting framework from 1 April 2018. SANRAL hasapplied to be exempted from applying GRAP (to continue applying IFRS as its reporting framework). Approval was thereforegranted by National Treasury for SANRAL to prepare its annual financial statements in accordance with International FinancialReporting Standards (IFRS).
1.2 Significant judgments and sources of estimation uncertainty
The preparation of financial statements in conformity with IFRS requires management to make judgments, estimates andassumptions that affect the application of policies and reported amounts of assets, liabilities, income and expenses. Theseestimates and associated assumptions are based on experience and various other factors that are believed to be reasonableunder the circumstances. They form the basis of judgments about carrying values of assets and liabilities that are not readilyapparent from other sources. Actual results may differ from these estimates.
The estimates and underlying assumptions are reviewed on an ongoing basis. Revisions to accounting estimates arerecognised in the period in which the estimate is revised if the revision only affects that period, or in the period of the revisionand the future periods if the revision affects both current and future periods.
The estimates and assumptions that have a significant risk of causing a material adjustment to the carrying amounts of assetsand liabilities in the next financial year are outlined below.
The following are the critical judgments, apart from those involving estimations, that SANRAL has made in the process ofapplying the accounting policies and that have the most significant effect on the amounts recognised in the annual financialstatements.
8

INTEGRATED REPORT 2018
59
South African National Roads Agency SOC Limited(Registration number 1998/009584/30)Financial Statements for the year ended 31 March 2018
Accounting Policies
1.2 Significant judgments and sources of estimation uncertainty (continued)Going concern
The assumptions relating to going concern are dependent on the conclusion of the funding model on e-tolls.
Gauteng Open Road Tolling
Revenue recognition
For the purpose of measuring revenue arising from e-toll activities, which is measured at the fair value of the considerationreceived or receivable, SANRAL has reviewed its historic data in order to determine the probability of receipt of payment andexpected future economic benefits.
Probability of future economic benefits
SANRAL only recognises revenue to the extent that it is probable that future economic benefits will flow to the entity. Inestimating the probability of future economic benefits that will flow to the entity, management bases its estimates on pastexperience. In making this judgment SANRAL makes a distinction among users based on their payment patterns. The revenuerecognised takes cognisance of payment patterns.
As a result, revenue is not initially recognised from transactions where future inflow of economic benefits is assessed asimprobable on the date of the transaction.
Discount allowed
SANRAL measures revenue at the fair value of the consideration received or receivable, net of discounts. The estimateddiscounts allowed are based on SANRAL's past experience with similar transactions.
Changes in estimates
As SANRAL's historical data and experience increases, management is able to continuously refine estimates relating to theamount of revenue that qualifies for recognition, estimates of discounts to be applied, and estimates relating to subsequentimpairments. These changes in estimates affect current and future periods' revenue and debtors are adjusted prospectively inthe year that new information becomes available.
As a result of the uncertainties inherent in business activities, many items in financial statements cannot be measured withprecision but can only be estimated. Estimation involves judgments based on the latest available, reliable information.
Property, plant and equipment including assets under concession
Useful lives and residual values
The estimated useful lives and residual values are reviewed annually taking cognisance of the forecast commercial andeconomic realities.
Refer to note 1.4 for the estimated useful lives for property, plant and equipment and note 1.5 for intangible assets.
Provisions
Provisions were raised and management determined an estimate based on the information available. SANRAL's weightedaverage cost of capital rate on the decommissioning liability is 9.43%. Additional disclosure of these estimates of provisions isincluded in note 18 and 19.
Impairment of assets
Assets are assessed for impairment annually. Property, plant and equipment including those under concession and wayleavesare assessed annually for impairment using the LSR (Loans supported by revenue) method.
Refer to notes 4, 5 and 7 for estimates and assumptions made for impairment of assets.
The impairment of investment property debtors is based on the values per the age analysis. These figures are calculated by theproperty administrators.
9
THE SOUTH AFRICAN NATIONAL ROADS AGENCY SOC LIMITED
60
South African National Roads Agency SOC Limited(Registration number 1998/009584/30)Financial Statements for the year ended 31 March 2018
Accounting Policies
1.2 Significant judgments and sources of estimation uncertainty (continued)
Contingent liabilities
Management applies its judgment to the facts, patterns and advice it receives from its attorneys, advocates and other advisorsin assessing if an obligation is probable or remote. This judgment is used to determine if the obligation is recognised as aliability or disclosed as a contingent liability (note 34).
Commitments
Commitments comprise of estimated capital expenditure as approved by the board of directors, and minimum lease paymentsrelating to operating leases which are measured in terms of IAS17 (note 33).
Post-employment benefit obligations
In applying its judgment to defined benefit plans, management consulted with external experts in the accounting and post-employment benefit obligation industry. The critical estimates as used in each benefit plan are detailed in note 16 to thefinancial statements. The actuarial gains and losses on employees' benefits are calculated in terms of three main components,namely: the effect of changes to the economic assumptions, number of members, and changes in the experience compared towhat was expected as at the previous valuation.
Revaluation of property, plant and equipment and investment property
Refer to notes 4, 5 and 13 for revaluation of property, plant and equipment and note 6 for revaluation of investment property.
Impairment of trade receivables
Toll tariffs are charged in terms of an Act of Parliament, the South African National Roads Agency Limited and National RoadsAct No. 71 of 1998, which provides that the non-payment of toll fees is an offence. The Act allows SANRAL to pursue bothcriminal and civil action against a non-payer. Additionally, section 51(1)(b)(i) of the PFMA states that all revenue due to thestate must be collected. Toll debt shall be written off in the event of death of a debtor.
Trade receivables, specifically toll debtors, were objectively assessed for impairment or collectibility, given the legislativeframework. Allowances for estimated irrecoverable amounts were made, which included the following:
Debt older than three years Debtors currently in liquidation or under business rescue.
In assessing toll debtors for impairment, the following were the significant judgments considered, based on the prevailingconditions and historical trends:
As a result of toll debtors being mainly LSM 9 consumers, SANRAL management considered the toll tariffs as affordable forthese users given the percentage of household income and the monthly caps which apply. The refusal to pay was not regardedas an inability to pay.
Corporates under business rescue or in liquidation are considered to be a loss event as they are in financial difficulty and theoutcome is unknown. The probability of the full amount being recovered was not certain therefore these amounts wereimpaired.
The reduction in the standard rate in 2015, announced as part of the new dispensation, was considered by management as aloss event for toll debt which preceded the new standard tariff. Based on the current and historical payment patterns theprobability of the full amount being recovered was not certain therefore these amounts were impaired.
Accounts under R500 are considered a loss event by management, as the cost of recovery may exceed the debt thereforethese amounts were impaired.
Debt older than three years is considered to be a loss event by management, as there is a probability that the civil claim of thedebt may prescribe after three years. While still pursuing with civil and criminal prosecution a conservative approach was takenon the probability of recovering the full amounts outstanding and these amounts were impaired.
10
INTEGRATED REPORT 2018
61
South African National Roads Agency SOC Limited(Registration number 1998/009584/30)Financial Statements for the year ended 31 March 2018
Accounting Policies
1.2 Significant judgments and sources of estimation uncertainty (continued)Fair value estimation
The fair value of financial instruments traded in active markets (such as trading and available-for-sale securities) is based onquoted market prices at the end of the reporting period. The quoted market price used for financial assets held by SANRAL isthe current bid price.
The fair value of financial instruments that are not traded in an active market (for example, over-the-counter derivatives) isdetermined by using valuation techniques. SANRAL uses a variety of methods and makes assumptions that are based onmarket conditions existing at the end of each reporting period. Quoted market prices or dealer quotes for similar instrumentsare used for long-term debt. Other techniques, such as estimated discounted cash flows, are used to determine fair value forthe remaining financial instruments. The fair value of interest rate swaps is calculated as the present value of the estimatedfuture cash flows. The fair value of forward foreign exchange contracts is determined using quoted forward exchange rates atthe end of the reporting period.
The fair value of trade receivables and trade payables is determined by using discounted cash flows. The fair value of financialliabilities for disclosure purposes is estimated by discounting the future contractual cash flows at the current market interestrate that is available to SANRAL for similar financial instruments.
1.3 Investment property
SANRAL's primary responsibility relates to the construction and maintenance of national roads, but in execution of its normalresponsibilities SANRAL may also become the owner of surplus land (outside road reserve). Although such land is oftenalienated, SANRAL does not, per se, hold it for sale as part of its ordinary course of business. All surplus land that is not "owneroccupied" is considered to be investment property taking into account the company policy (R10 000 threshold).
Investment property is recognised as an asset when, and only when, it is probable that the future economic benefits that areassociated with the investment property bought during the year will flow to the enterprise, and the cost of the investmentproperty bought during the year can be measured reliably. Investment property is held either to earn rental income or for capitalappreciation or for both purposes.
Investment property (including those bought during the year) is initially recognised at cost including transaction and directlyattributable costs but excluding day to day servicing cost. Susequent to initial measurement, investment properties are stated atfair value which is considered to be market value at year end. Gains and losses from changes in fair values are included inprofit or loss in the year they arise.
When the use of investment property changes such that it is reclassified as property, plant and equipment, its carrying value/cost is the fair value on the date of reclassification for subsequent accounting. For more information on valuation of investmentproperty see note 6.
Investment property is derecognised when on disposal or when the investment property is withdrawn from use and no futureeconomic benefits are expected. When investment property is derecognised, the carrying value is eliminated from thestatement of financial position and the gains or losses arising from the disposal are recognised in profit or loss and othercomprehensive income in the year of disposal.
Fair value
Subsequent to initial measurement investment property is measured at fair value.
A gain or loss arising from a change in fair value is included in net profit or loss for the period in which it arises.
There are no property interests held under operating leases which are recognised as investment property during the year.
1.4 Property, plant and equipment
Property, plant and equipment are tangible assets which the entity holds for its own use or for rental to others and which areexpected to be used for more than one year.
The cost of an item of property, plant and equipment shall be recognised as an asset if, and only if:
(a) It is probable that future economic benefits associated with the item will flow to the entity; and
11
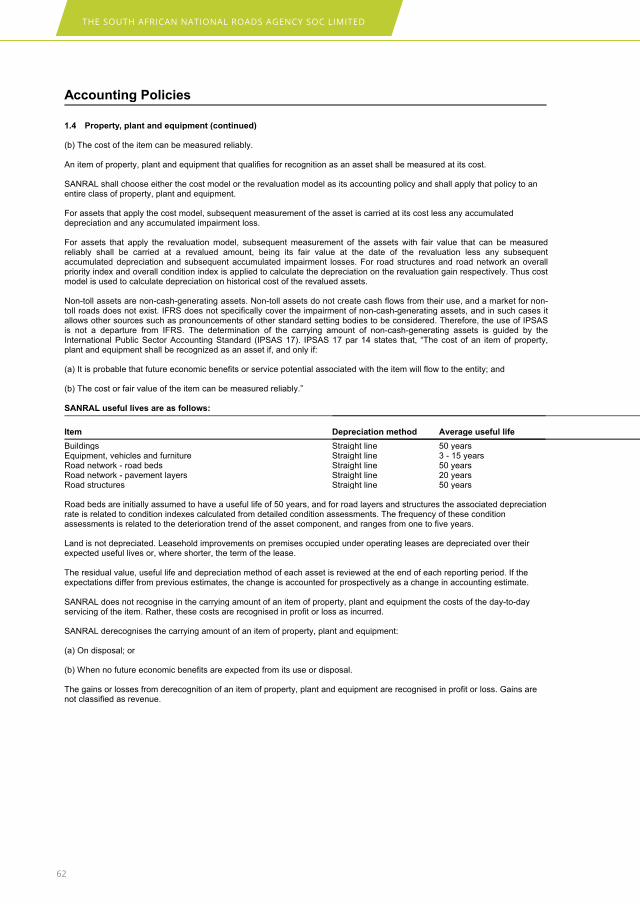
THE SOUTH AFRICAN NATIONAL ROADS AGENCY SOC LIMITED
62
South African National Roads Agency SOC Limited(Registration number 1998/009584/30)Financial Statements for the year ended 31 March 2018
Accounting Policies
1.4 Property, plant and equipment (continued)
(b) The cost of the item can be measured reliably.
An item of property, plant and equipment that qualifies for recognition as an asset shall be measured at its cost.
SANRAL shall choose either the cost model or the revaluation model as its accounting policy and shall apply that policy to anentire class of property, plant and equipment.
For assets that apply the cost model, subsequent measurement of the asset is carried at its cost less any accumulateddepreciation and any accumulated impairment loss.
For assets that apply the revaluation model, subsequent measurement of the assets with fair value that can be measuredreliably shall be carried at a revalued amount, being its fair value at the date of the revaluation less any subsequentaccumulated depreciation and subsequent accumulated impairment losses. For road structures and road network an overallpriority index and overall condition index is applied to calculate the depreciation on the revaluation gain respectively. Thus costmodel is used to calculate depreciation on historical cost of the revalued assets.
Non-toll assets are non-cash-generating assets. Non-toll assets do not create cash flows from their use, and a market for non-toll roads does not exist. IFRS does not specifically cover the impairment of non-cash-generating assets, and in such cases itallows other sources such as pronouncements of other standard setting bodies to be considered. Therefore, the use of IPSASis not a departure from IFRS. The determination of the carrying amount of non-cash-generating assets is guided by theInternational Public Sector Accounting Standard (IPSAS 17). IPSAS 17 par 14 states that, “The cost of an item of property,plant and equipment shall be recognized as an asset if, and only if:
(a) It is probable that future economic benefits or service potential associated with the item will flow to the entity; and
(b) The cost or fair value of the item can be measured reliably.”
SANRAL useful lives are as follows:
Item Depreciation method Average useful life
Buildings Straight line 50 yearsEquipment, vehicles and furniture Straight line 3 - 15 yearsRoad network - road beds Straight line 50 yearsRoad network - pavement layers Straight line 20 yearsRoad structures Straight line 50 years
Road beds are initially assumed to have a useful life of 50 years, and for road layers and structures the associated depreciationrate is related to condition indexes calculated from detailed condition assessments. The frequency of these conditionassessments is related to the deterioration trend of the asset component, and ranges from one to five years.
Land is not depreciated. Leasehold improvements on premises occupied under operating leases are depreciated over theirexpected useful lives or, where shorter, the term of the lease.
The residual value, useful life and depreciation method of each asset is reviewed at the end of each reporting period. If theexpectations differ from previous estimates, the change is accounted for prospectively as a change in accounting estimate.
SANRAL does not recognise in the carrying amount of an item of property, plant and equipment the costs of the day-to-dayservicing of the item. Rather, these costs are recognised in profit or loss as incurred.
SANRAL derecognises the carrying amount of an item of property, plant and equipment:
(a) On disposal; or
(b) When no future economic benefits are expected from its use or disposal.
The gains or losses from derecognition of an item of property, plant and equipment are recognised in profit or loss. Gains arenot classified as revenue.
12
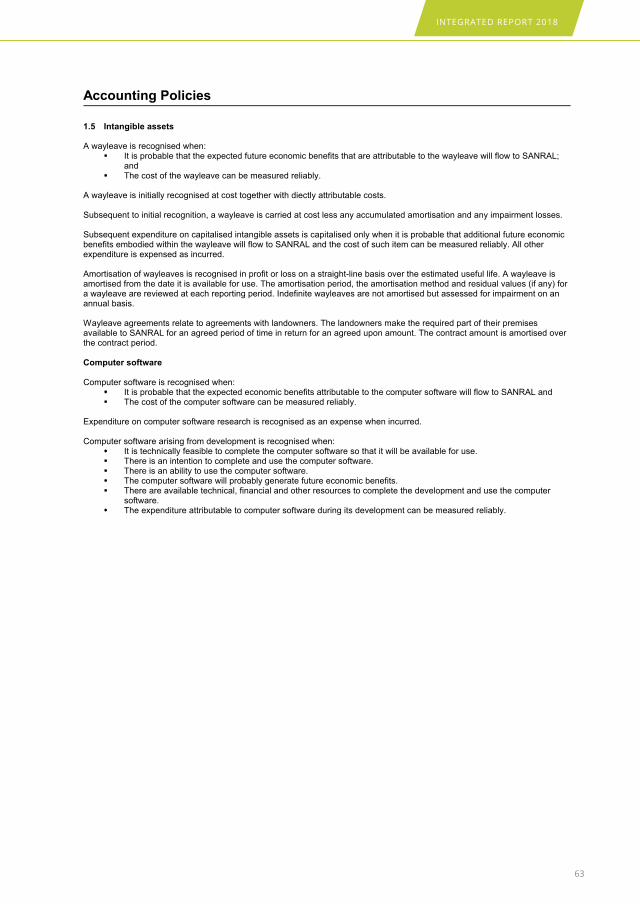
INTEGRATED REPORT 2018
63
South African National Roads Agency SOC Limited(Registration number 1998/009584/30)Financial Statements for the year ended 31 March 2018
Accounting Policies
1.5 Intangible assets
A wayleave is recognised when: It is probable that the expected future economic benefits that are attributable to the wayleave will flow to SANRAL;
and The cost of the wayleave can be measured reliably.
A wayleave is initially recognised at cost together with diectly attributable costs.
Subsequent to initial recognition, a wayleave is carried at cost less any accumulated amortisation and any impairment losses.
Subsequent expenditure on capitalised intangible assets is capitalised only when it is probable that additional future economicbenefits embodied within the wayleave will flow to SANRAL and the cost of such item can be measured reliably. All otherexpenditure is expensed as incurred.
Amortisation of wayleaves is recognised in profit or loss on a straight-line basis over the estimated useful life. A wayleave isamortised from the date it is available for use. The amortisation period, the amortisation method and residual values (if any) fora wayleave are reviewed at each reporting period. Indefinite wayleaves are not amortised but assessed for impairment on anannual basis.
Wayleave agreements relate to agreements with landowners. The landowners make the required part of their premisesavailable to SANRAL for an agreed period of time in return for an agreed upon amount. The contract amount is amortised overthe contract period.
Computer software
Computer software is recognised when: It is probable that the expected economic benefits attributable to the computer software will flow to SANRAL and The cost of the computer software can be measured reliably.
Expenditure on computer software research is recognised as an expense when incurred.
Computer software arising from development is recognised when: It is technically feasible to complete the computer software so that it will be available for use. There is an intention to complete and use the computer software. There is an ability to use the computer software. The computer software will probably generate future economic benefits. There are available technical, financial and other resources to complete the development and use the computer
software. The expenditure attributable to computer software during its development can be measured reliably.
13

THE SOUTH AFRICAN NATIONAL ROADS AGENCY SOC LIMITED
64
South African National Roads Agency SOC Limited(Registration number 1998/009584/30)Financial Statements for the year ended 31 March 2018
Accounting Policies
1.5 Intangible assets (continued)
Computer software is carried at cost less any accumulated amortisation and any impairment losses.
Subsequent expenditure is capitalised only when it is probable that additional future economic benefits embodied within thecomputer software will flow to SANRAL and the cost of such item can be measured reliably. All other expenditure is expensedwhen incurred.
Amortisation of computer software is recognised in profit or loss on a straight-line basis over the asset's estimated useful life.Computer software is amortised from the date it is available for use. The amortisation period and amortisation method forcomputer software is reviewed at each reporting period
SANRAL ceases amortisation at the earlier date the computer software or wayleave is classified as held for sale (or included ina disposal group that is classified as held for sale) in accordance with IFRS 5 Non-current Assets Held for sale andDiscontinued Operations and the date the computer software or wayleave is derecognised.
SANRAL derecognises the carrying amount of intangible asset:
(a) On disposal; or
(b) When no future economic benefits are expected from its use.
The gains or losses from derecognition of an intangible asset are recognised in profit or loss. Gains are not classified asrevenue.
Item Useful lifeComputer software 10 yearsWayleave agreements (definite) Contract periodWayleave agreements (indefinite) Not amortised
1.6 Financial instruments
Classification
The entity classifies financial assets and financial liabilities into the following categories: Financial assets at fair value through profit or loss Loans and receivables Financial liabilities at fair value through profit or loss Financial liabilities measured at amortised cost.
Classification depends on the purpose for which the financial instruments were obtained and takes place at initial recognition.Classification is re-assessed on an annual basis, except for derivatives (held-for-trading financial liabilities) and financialinstruments designated as at fair value through profit or loss, which are not to be reclassified out of the fair value through profitor loss category.
Initial recognition and measurement
Financial instruments are recognised initially when the entity becomes a party to the contractual provisions of the instruments.Regular way purchases and sales of financial assets are accounted for at trade date; which is the date that the companycommits itself to purchase or sell the asset.
When a financial asset or financial liability is recognised initially, SANRAL measures it at its fair value plus, in the case of afinancial asset or financial liability not at fair value through profit or loss, transaction costs that are directly attributable to theacquisition or issue of the financial asset or liability
Transaction costs on financial instruments at fair value through profit or loss are recognised in profit or loss when incurred.
14
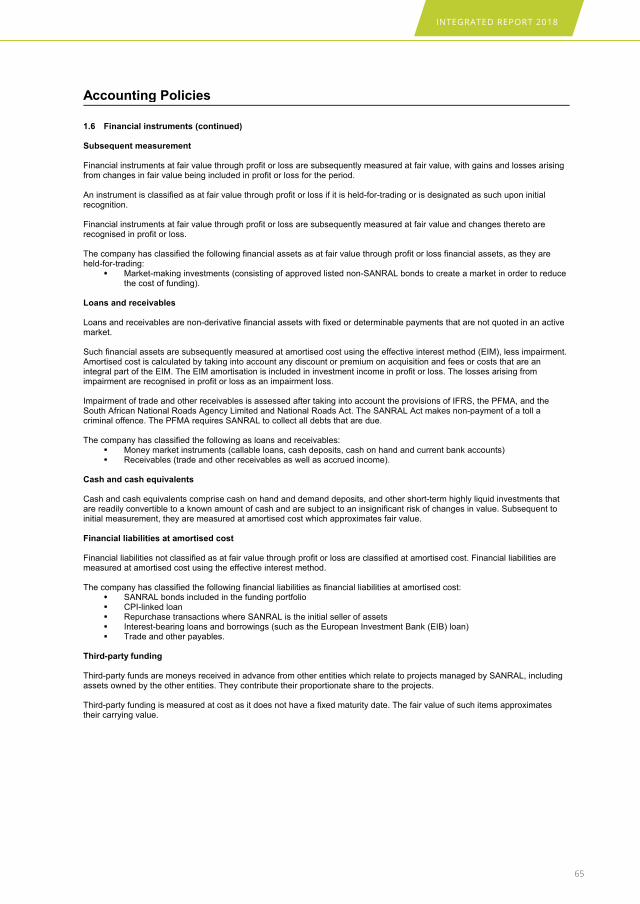
INTEGRATED REPORT 2018
65
South African National Roads Agency SOC Limited(Registration number 1998/009584/30)Financial Statements for the year ended 31 March 2018
Accounting Policies
1.6 Financial instruments (continued)
Subsequent measurement
Financial instruments at fair value through profit or loss are subsequently measured at fair value, with gains and losses arisingfrom changes in fair value being included in profit or loss for the period.
An instrument is classified as at fair value through profit or loss if it is held-for-trading or is designated as such upon initialrecognition.
Financial instruments at fair value through profit or loss are subsequently measured at fair value and changes thereto arerecognised in profit or loss.
The company has classified the following financial assets as at fair value through profit or loss financial assets, as they areheld-for-trading:
Market-making investments (consisting of approved listed non-SANRAL bonds to create a market in order to reducethe cost of funding).
Loans and receivables
Loans and receivables are non-derivative financial assets with fixed or determinable payments that are not quoted in an activemarket.
Such financial assets are subsequently measured at amortised cost using the effective interest method (EIM), less impairment.Amortised cost is calculated by taking into account any discount or premium on acquisition and fees or costs that are anintegral part of the EIM. The EIM amortisation is included in investment income in profit or loss. The losses arising fromimpairment are recognised in profit or loss as an impairment loss.
Impairment of trade and other receivables is assessed after taking into account the provisions of IFRS, the PFMA, and theSouth African National Roads Agency Limited and National Roads Act. The SANRAL Act makes non-payment of a toll acriminal offence. The PFMA requires SANRAL to collect all debts that are due.
The company has classified the following as loans and receivables: Money market instruments (callable loans, cash deposits, cash on hand and current bank accounts) Receivables (trade and other receivables as well as accrued income).
Cash and cash equivalents
Cash and cash equivalents comprise cash on hand and demand deposits, and other short-term highly liquid investments thatare readily convertible to a known amount of cash and are subject to an insignificant risk of changes in value. Subsequent toinitial measurement, they are measured at amortised cost which approximates fair value.
Financial liabilities at amortised cost
Financial liabilities not classified as at fair value through profit or loss are classified at amortised cost. Financial liabilities aremeasured at amortised cost using the effective interest method.
The company has classified the following financial liabilities as financial liabilities at amortised cost: SANRAL bonds included in the funding portfolio CPI-linked loan Repurchase transactions where SANRAL is the initial seller of assets Interest-bearing loans and borrowings (such as the European Investment Bank (EIB) loan) Trade and other payables.
Third-party funding
Third-party funds are moneys received in advance from other entities which relate to projects managed by SANRAL, includingassets owned by the other entities. They contribute their proportionate share to the projects.
Third-party funding is measured at cost as it does not have a fixed maturity date. The fair value of such items approximatestheir carrying value.
15
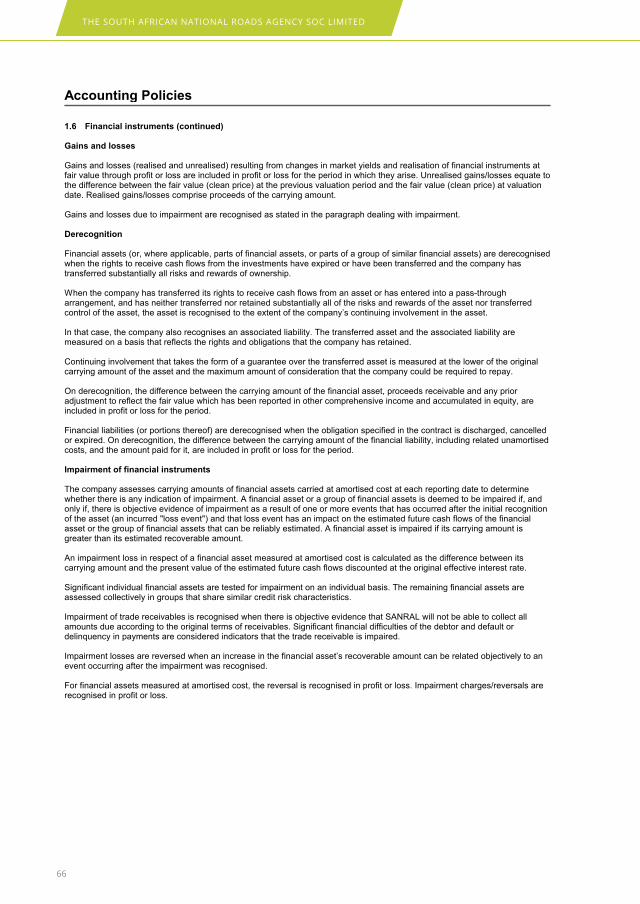
THE SOUTH AFRICAN NATIONAL ROADS AGENCY SOC LIMITED
66
South African National Roads Agency SOC Limited(Registration number 1998/009584/30)Financial Statements for the year ended 31 March 2018
Accounting Policies
1.6 Financial instruments (continued)
Gains and losses
Gains and losses (realised and unrealised) resulting from changes in market yields and realisation of financial instruments atfair value through profit or loss are included in profit or loss for the period in which they arise. Unrealised gains/losses equate tothe difference between the fair value (clean price) at the previous valuation period and the fair value (clean price) at valuationdate. Realised gains/losses comprise proceeds of the carrying amount.
Gains and losses due to impairment are recognised as stated in the paragraph dealing with impairment.
Derecognition
Financial assets (or, where applicable, parts of financial assets, or parts of a group of similar financial assets) are derecognisedwhen the rights to receive cash flows from the investments have expired or have been transferred and the company hastransferred substantially all risks and rewards of ownership.
When the company has transferred its rights to receive cash flows from an asset or has entered into a pass-througharrangement, and has neither transferred nor retained substantially all of the risks and rewards of the asset nor transferredcontrol of the asset, the asset is recognised to the extent of the company’s continuing involvement in the asset.
In that case, the company also recognises an associated liability. The transferred asset and the associated liability aremeasured on a basis that reflects the rights and obligations that the company has retained.
Continuing involvement that takes the form of a guarantee over the transferred asset is measured at the lower of the originalcarrying amount of the asset and the maximum amount of consideration that the company could be required to repay.
On derecognition, the difference between the carrying amount of the financial asset, proceeds receivable and any prioradjustment to reflect the fair value which has been reported in other comprehensive income and accumulated in equity, areincluded in profit or loss for the period.
Financial liabilities (or portions thereof) are derecognised when the obligation specified in the contract is discharged, cancelledor expired. On derecognition, the difference between the carrying amount of the financial liability, including related unamortisedcosts, and the amount paid for it, are included in profit or loss for the period.
Impairment of financial instruments
The company assesses carrying amounts of financial assets carried at amortised cost at each reporting date to determinewhether there is any indication of impairment. A financial asset or a group of financial assets is deemed to be impaired if, andonly if, there is objective evidence of impairment as a result of one or more events that has occurred after the initial recognitionof the asset (an incurred "loss event") and that loss event has an impact on the estimated future cash flows of the financialasset or the group of financial assets that can be reliably estimated. A financial asset is impaired if its carrying amount isgreater than its estimated recoverable amount.
An impairment loss in respect of a financial asset measured at amortised cost is calculated as the difference between itscarrying amount and the present value of the estimated future cash flows discounted at the original effective interest rate.
Significant individual financial assets are tested for impairment on an individual basis. The remaining financial assets areassessed collectively in groups that share similar credit risk characteristics.
Impairment of trade receivables is recognised when there is objective evidence that SANRAL will not be able to collect allamounts due according to the original terms of receivables. Significant financial difficulties of the debtor and default ordelinquency in payments are considered indicators that the trade receivable is impaired.
Impairment losses are reversed when an increase in the financial asset’s recoverable amount can be related objectively to anevent occurring after the impairment was recognised.
For financial assets measured at amortised cost, the reversal is recognised in profit or loss. Impairment charges/reversals arerecognised in profit or loss.
16
INTEGRATED REPORT 2018
67
South African National Roads Agency SOC Limited(Registration number 1998/009584/30)Financial Statements for the year ended 31 March 2018
Accounting Policies
1.6 Financial instruments (continued)
Derivatives
Derivative financial instruments are initially recognised at fair value with transaction costs being accounted for in profit or losson the date on which a derivative contract is entered into. Subsequent to initial recognition, derivatives are measured at fairvalue and changes in the fair value of the derivatives are recognised immediately in profit or loss. Derivatives are carried asfinancial assets when the fair value is positive and as financial liabilities when the fair value is negative.
Sale and repurchase agreements
A repurchase agreement is an agreement to transfer a financial asset to another party in exchange for cash or otherconsideration and a concurrent obligation to reacquire the financial asset at a future date for an amount equal to the cash orother consideration exchanged plus interest, effectively providing the transferee with a lender’s rate of return. Repurchaseagreements are utilised to place or borrow short-term cash with different institutions. The difference between the amount paidfor the purchase of financial assets and the amount received for the sale of financial assets represents interest.
SANRAL entered into repurchase agreements (repo) as part of its trading activities.
When entering a repo transaction, SANRAL either becomes the outright owner (borrowing stock, investing cash), or fullytransfers ownership (lending stock, borrowing cash) of the bonds to the counterparty. There are no restrictions on the bondsduring the period of the repo transaction for either party, other than that the second leg of the repo transaction has to behonoured by both parties.
Securities purchased under agreements to resell are recognised under “receivables” as “repurchase agreements”. Theunderlying securities purchased under repurchase agreements are not recognised by the company. Likewise, underlyingsecurities sold under repurchase agreements are not derecognised by the company. A payable is recognised for therepurchase transaction, and recognised as “repurchase obligations” under “payables”.
The risk that the company is exposed to is discussed in note 37.
The differences between the purchase and sale prices are treated as interest and are accrued using the effective interestmethod.
Offset
Financial assets and liabilities are offset and the net amount presented in the statement of financial position when, and onlywhen, the company has a legal right to offset the amounts and intends either to settle on a net basis or to realise the asset andsettle the liability simultaneously.
Loans to shareholders, directors, managers and employees
These financial assets are classified as loans and receivables.
17
THE SOUTH AFRICAN NATIONAL ROADS AGENCY SOC LIMITED
68
South African National Roads Agency SOC Limited(Registration number 1998/009584/30)Financial Statements for the year ended 31 March 2018
Accounting Policies
1.6 Financial instruments (continued)
Trade and other receivables
Trade receivables are initially measured at fair value, and are subsequently measured at amortised cost using the effectiveinterest rate method. In the case of SANRAL, trade and other receivables mainly constitute e-tolls. Impairment (estimatedirrecoverable amounts) is recognised in profit or loss when there is objective evidence that the asset is impaired. Significantfinancial difficulties of the debtor, probability that the debtor will enter bankruptcy or financial reorganisation, and default ordelinquency in payments are considered indicators that the trade receivable is impaired. The allowance recognised ismeasured as the difference between the asset’s carrying amount and the present value of estimated future cash flowsdiscounted at the effective interest rate computed at initial recognition.
The carrying amount of the asset is reduced through the use of an allowance account, and the amount of the loss is recognisedin profit or loss within operating expenses. When a trade receivable is uncollectable, it is written off against the allowanceaccount for trade receivables. Subsequent recoveries of amounts previously written off are credited against operating expensesin profit or loss.
Trade receivables, specifically toll debtors, were objectively assessed for impairment or collectibility, given the legislativeframework. Allowances for estimated irrecoverable amounts were made, which included the following:
Debt older than three years Debtors currently in liquidation or under business rescue.
Trade and other receivables are classified as loans and receivables.
Trade and other payables
Trade payables are initially measured at fair value, and are subsequently measured at amortised cost, using the effectiveinterest rate method.
1.7 Tax
SANRAL was exempted from income tax in the Government Gazette of 22 December 2003, in terms of S10(1)(t)(iii) of theIncome Tax Act of 1962. This exemption was backdated to the inception of the company.
1.8 Leases
A lease is classified as a finance lease if it transfers substantially all the risks and rewards incidental to ownership. A lease isclassified as an operating lease if it does not transfer substantially all the risks and rewards incidental to ownership.
Upon initial recognition, the leased asset is measured at an amount equal to the lower of its fair value and the present value ofminimum lease payments. Subsequent to initial recognition, the asset is accounted for in accordance with the accounting policyapplicable to that asset.
Operating leases - lessor
Operating lease income is recognised as an income on a straight-line basis over the lease term.
Initial direct costs incurred in negotiating and arranging operating leases are added to the carrying amount of the leased assetand recognised as an expense over the lease term on the same basis as the lease income.
Operating leases – lessee
Operating lease payments are recognised as an expense on a straight-line basis over the lease term. The difference betweenthe amounts recognised as an expense and the contractual payments is recognised as an operating lease asset/liability. Thisasset is not discounted.
Any contingent rents are expensed in the period they are incurred.
18
INTEGRATED REPORT 2018
69
South African National Roads Agency SOC Limited(Registration number 1998/009584/30)Financial Statements for the year ended 31 March 2018
Accounting Policies
1.9 Non-current assets held for sale
Non-current assets or (disposal groups comprising assets and liabilities) are classified as held for sale if their carrying amountwill be recovered principally through a sale transaction and not through continuing use. The condition is regarded as met onlywhen the sale is highly probable and the asset (or disposal group) is available for immediate sale in its present condition. Theseassets may be a component of the company, a disposal group or an individual non-current asset. Management must becommitted to the sale, which should be expected to qualify for recognition as a completed sale within one year from the date ofclassification.
Immediately before classification as held for sale, the assets (or components of a disposal group) are remeasured inaccordance with the company’s accounting policies. Thereafter, the assets (or disposal group) are generally measured at thelower of their carrying amount and fair value less costs to sell. Impairment losses on initial classification as held for sale andsubsequent gains or losses on re-measurement are recognised in profit or loss. Gains are not recognised in excess of anycumulative impairment loss.
1.10 Impairment of assets
Impairment of toll assets (Road construction assets self-funded through toll fees)
At each reporting date, the company reviews the carrying amounts of its toll assets to determine whether there is any indicationthat those assets may be impaired. If any such indication exists, the recoverable amount of the asset is estimated in order todetermine the extent of the impairment loss (if any). Where it is not possible to estimate the recoverable amount for anindividual asset, the recoverable amount is determined for the cash-generating unit to which the asset belongs.
The recoverable amount of toll assets is the greater of an asset’s fair value less cost to sell and value in use. In assessingvalue in use, the estimated future cash flows are discounted to their present value using a pre-tax discount rate that reflectscurrent market assessments of the time value of money and the risks specific to the asset. For an asset that does not generatecash inflows largely independent of those from other assets, the recoverable amount is determined for the cash generating unitto which the asset belongs.
Impairment of non-toll assets (State-funded through government grants)
The recoverable amount of non-toll assets is the greater of an asset’s fair value less cost to sell and value in use. Non-tollassets are non-cash-generating assets. Non-toll assets do not create cash flows from their use, and a market for non-toll roadsdoes not exist. IFRS does not specifically cover the impairment of non-cash-generating assets, and in such cases allows othersources such as pronouncements of other standard setting bodies to be considered. The determination of the carrying amountof non-cash-generating assets are discussed in International Public Sector Accounting Standard 21 (IPSAS 21). In accordancewith IPSAS 21 value in use of a non-cash-generating asset is the present value of the asset’s remaining service potential. Thepresent value of the remaining service potential of the asset is determined using depreciated replacement cost. The companymeasures its non-toll assets (road network, structures and land) on the revaluation model, based on depreciated replacementcost. Therefore the company’s valuation already takes any impairment effect into consideration, and no further specificimpairment test is performed on non-toll assets. The remaining assets (equipment, vehicles, furniture, buildings and assetsunder construction) are measured on the cost model.
Impairment loss
An impairment loss is recognised whenever the carrying amount of an asset or its cash-generating unit exceeds its long termrecoverable amount. Impairment losses are recognised in profit or loss.
An impairment loss is only reversed if there is an indication that the impairment loss may no longer exist and there has been achange in the estimates used to determine the recoverable amount. Where an impairment loss subsequently reverses, thecarrying amount of the asset (cash-generating unit) is increased to the revised estimate of its recoverable amount. Theincreased carrying amount does not exceed the carrying amount that would have been determined had no impairment lossbeen recognised for the asset (cash-generating unit) in prior years. A reversal of an impairment loss is recognised as incomeimmediately in profit or loss.
Revalued assets
Impairment loss on revalued assets are recognised as a decrease in the revaluation reserve in other comprehensive income. Areversal of impairment loss is recognised as an increase in the revaluation reserve in other comprehensive income, limited tothe assets’ revalued amount.
19
THE SOUTH AFRICAN NATIONAL ROADS AGENCY SOC LIMITED
70
South African National Roads Agency SOC Limited(Registration number 1998/009584/30)Financial Statements for the year ended 31 March 2018
Accounting Policies
1.11 Share capital and equity
An equity instrument is any contract that evidences a residual interest in the assets of an entity after deducting all of itsliabilities.
Currently the company has normal issued share capital and share premium accounted for as equity instruments. Directlyattributable costs with issuing of equity instruments are deducted against equity.
1.12 Employee benefits
Defined contribution plans
The company operates a defined contribution plan, the assets of which are held in a separate trustee-administered fund. Theprovident fund is funded by payments from the company, taking into account the recommendations of independent qualifiedactuaries. The company’s contributions to the defined contribution plans are recognised in profit or loss account as anemployee benefit expense in the year to which they relate.
The company has employees who are members of the Government Employee Pension Fund (GEPF). Contributions to theGEPF are recognised in profit or loss account in the year to which they relate as part of cost of employment. The company hasno legal or constructive obligation to pay further contributions if the GEPF does not hold sufficient assets to pay all employeestheir benefits relating to employee service in the current and prior periods.
Defined benefit plans
For defined benefit plans (post retirement medical aid) the cost of providing the benefits is determined using the projected unitcredit method.
Separate actuarial valuations are conducted for this plan on an annual basis by independent actuaries.
Consideration is given to any event that could impact the funds up to the end of the reporting period where the interim valuationis performed at an earlier date.
Past service costs are recognised immediately to the extent that the benefits are already vested, and are otherwise amortisedon a straight-line basis over the average period until the amended benefits become vested.
Actuarial gains and losses are recognised in the year in which they arise, in other comprehensive income.
Gains or losses on the curtailment or settlement of a defined benefit plan is recognised when the entity is demonstrablycommitted to curtailment or settlement.
When it is virtually certain that another party will reimburse some or all of the expenditure required to settle a defined benefitobligation, the right to reimbursement is recognised as a separate asset. The asset is measured at fair value. In all otherrespects, the asset is treated in the same way as plan assets. In profit or loss, the expense relating to a defined benefit plan ispresented as net of the amount recognised for a reimbursement.
The amount recognised in the statement of financial position represents the present value of the defined benefit obligation asadjusted for unrecognised actuarial gains and losses and unrecognised past service costs, and reduces by the fair value ofplan assets.
Any asset is limited to unrecognised actuarial losses and past service costs, plus the present value of available refunds andreduction in future contributions to the plan.
1.13 Provisions
Provisions for rehabilitation costs
Provisions for rehabilitation costs is recognised when: SANRAL has a present obligation as a result of damage to the environment from digging burrow pits It is probable that an outflow of resources embodying economic benefits will be required to settle the obligation A reliable estimate can be made of the obligation.
20

INTEGRATED REPORT 2018
71
South African National Roads Agency SOC Limited(Registration number 1998/009584/30)Financial Statements for the year ended 31 March 2018
Accounting Policies
1.13 Provisions (continued)
The amount of a provision is the best estimate of the expenditure expected to be required to settle the obligation. Where theeffect of discounting to present values is material, provisions are adjusted to reflect the time value of money, and whereappropriate, the risk specific to the liability. The unwinding of discount is recognised as finance cost.
Provision for rehabilitation costs are based on the contractual agreement signed with the contractors maintaining orconstructing the road networks and increased over the life span of the project. Once the project is complete, the provision forrehabilitation costs is reversed as the actual cost has been incurred and paid for.
Provision for rehabilitation costs for projects that are capital in nature are capitalised to the respective assets. Rehabilitationcosts for projects that are operational in nature are expensed in profit or loss when incurred.
Provisions are not recognised for future losses.
Provision for overload control
Provision for overload control is recognised when: SANRAL has a present obligation as a result of damage caused by overloading on roads operated by
concessionaires It is probable that an outflow of resources embodying economic benefits will be required to settle the obligation A reliable estimate can be made of the obligation.
The amount of a provision is the best estimate of the expenditure expected to be required to settle the obligation. Where theeffect of discounting to present value is material, provisions are adjusted to reflect the time value of money, and whereappropriate, the risk specific to the liability. The unwinding of discount is recognised as finance cost.
Provision for overload controls is based on the contractual agreement signed with the concessionaires regarding control ofoverloading on the road network operated by concessions. SANRAL expects concessionaires to claim amounts due within ayear, as they rehabilitate the road network.
Provisions are not recognised for future operating losses.
1.14 Government grants
Government grants are recognised when there is reasonable assurance that: The entity will comply with the conditions attached to them. The grants will be received.
Government grants received that compensate the company for capital expenditure (the cost of an asset) are included in non-current liabilities as deferred income and are released to income on a systematic basis in subsequent years over the estimatedlife of the related assets. Government grants received as compensation for acquisition of land are recognised as income whenreceived, because land is not deferred.
Government grants that compensate the company for expenses incurred are recognised in profit or loss immediately. Theunspent portion of a grant is included in non-current liabilities as deferred income.
1.15 Revenue
Revenue is measured at the fair value of the consideration received or receivable. Revenue is reduced for rebates and similarallowances.
Revenue from services rendered is recognised in profit or loss in proportion to the stage of completion of the transaction atfinancial position date.
Revenue from contracts is recognised on the accrual basis in accordance with the substance of the relevant agreements.SANRAL recognises revenue when the amount of revenue can be reliably measured; when it is probable that economicbenefits will flow to the entity; and when specific criteria have been met for each of the SANRAL activities as described below.SANRAL bases its estimate for discounts on historical results, taking into account the type of customer, the transaction and thetype of arrangement
21
THE SOUTH AFRICAN NATIONAL ROADS AGENCY SOC LIMITED
72
South African National Roads Agency SOC Limited(Registration number 1998/009584/30)Financial Statements for the year ended 31 March 2018
Accounting Policies
1.15 Revenue (continued)Toll income
Toll income from conventional plazas comprises the value of toll tariffs charged in respect of the toll operations, net of valueadded tax. Toll income is recognised when toll fees are received.
Concession income
Concession income is recognised on a straight-line basis over the term of the concession contract.
Gauteng Open Road Tolling
Revenue recognition
Gauteng Open Road Tolling (GORT) revenue is recognised when it is probable that the economic benefits associated with thetransaction will flow to the entity and the amount of revenue can be measured reliably. Management uses accumulatedexperience to estimate the probability of economic benefits flowing to SANRAL based on historic data.
E-toll revenue is recognised when a vehicle (class A to C) has passed through the GORT gantry and the vehicle has beenidentified as a valid e-toll passage. (A valid e-toll passage is when a vehicle passes a gantry and all the identification processesare completed.)
Measurement
E-toll revenue is measured at the fair value of the consideration received or receivable. Revenue is measured as per the latestgazzetted tarrifs, less VAT and discounts provided for in the latest gazette as well as any further gazetted tariff adjustments anddiscounts which may be published from time to time. Accumulated experience is used to determine the timing of receipts.
Revenue received in advance
E-toll revenue received in advance is deferred and recognised only when the vehicle (class A to C) has passed through theGORT gantry and the vehicle has been identified as a valid e-toll passage.
Revenue received in advance is measured at the fair value of the consideration received.
1.16 Other income
Other income includes contributions from other spheres of government and the private sector. For managing projects thisincludes assets owned by other entities and they contribute their proportionate share to the projects for SANRAL’smanagement.
Rental income from investment property is recognised in profit or loss on a straight-line basis over the term of the lease.
1.17 Investment income and finance cost
Investment income comprises interest income on funds invested and changes in fair value of financial assets held-for-trading.Finance expenses comprise interest expenses on funds borrowed and changes in fair value of held-for-trading financialliabilities.
Interest income and expenses are recognised on a time proportion basis, taking account of the principal outstanding and theeffective interest rate over the period to maturity. Interest income and expenses are recognised in profit or loss for all interest-bearing instruments on an accrual basis using the effective interest method, except for market-making financial assets andliabilities.
The coupon interest of bonds included in market-making financial assets and liabilities is included under interest income andexpense respectively. The remaining difference between interest calculated on amortised cost based on the effective interestand coupon interest is disclosed as part of held-for-trading gains and losses. Where financial assets have been impaired,interest income continues to be recognised on the impaired value, based on the original effective interest rate.
Interest income and expense include the amortisation of any discount or premium or other differences between the initialcarrying amount of an interest-bearing instrument and its amount at maturity calculated on an effective interest method basis.
22

INTEGRATED REPORT 2018
73
South African National Roads Agency SOC Limited(Registration number 1998/009584/30)Financial Statements for the year ended 31 March 2018
Accounting Policies
1.18 Borrowing costs
Borrowing costs comprise interest and other costs that the company incurs in connection with the borrowing of funds.
A qualifying asset comprises an asset that necessarily takes a substantial period of time to get ready for its intended use orsale
Borrowing costs that are directly attributable to the acquisition, construction or production of a qualifying asset are capitalisedas part of the cost of that asset. Other borrowing costs are recognised as an expense in the period in which they have beenincurred.
1.19 Public private partnerships (PPPs)
PPPs entail private entities taking substantial risks for financing a project’s capital and operating costs, designing and building afacility, and managing its operations to specified standards, normally over a significant period of time. In a PPP, the landtypically belongs to the public institution, not to the private party, and the property, plant and equipment developed in terms ofthe PPP are thus state property.
Concession revenues
Where concessionaires have the right to charge and collect tolls, the company does not recognise any revenue. Incircumstances where the concessionaire is required to pay a fee to the company, this amount is recognised as concessionincome and included in revenue.
Assets and depreciation
Toll concessions give the concessionaire the right to use the toll assets, while the company retains the title and ownership ofthe assets. Items of property, plant and equipment under concession agreements are recognised and measured in accordancewith policies for property, plant and equipment.
Guarantees
Concessionaires are required to obtain guarantees in the form of performance bonds in favour of the company, relating toconstruction work, operation and maintenance activities of the concessionaire.
1.20 Irregular and fruitless and wasteful expenditure
Irregular expenditure means expenditure incurred in contravention of, or not in accordance with, a requirement of the PFMA.Fruitless and wasteful expenditure means expenditure that was made in vain and would have been avoided had reasonablecare been exercised. All irregular, fruitless and wasteful expenditure is recorded as expenditure in the year that it was incurred.After an investigation is conducted and it was found that an official was negligent, income is recognised with a correspondingdebtor.
23
THE SOUTH AFRICAN NATIONAL ROADS AGENCY SOC LIMITED
74
South African National Roads Agency SOC Limited(Registration number 1998/009584/30)Financial Statements for the year ended 31 March 2018
Accounting Policies
1.21 Segment information
Operational segment identification
For management purposes, SANRAL is currently organised into two divisions: toll and non-toll operations. These businesssegments' operating results are regularly reviewed by the entity's chief operating decision maker, and used to make decisionsabout resources to be allocated to the segments, as well as to assess their performance.
SANRAL considered the following factors during the identification of the reportable segments: Nature of the products/services rendered by the segment Nature of revenues generated by the segment Nature of expenses incurred by the segment Nature of the funding used to finance segment activities.
Segment results, assets and liabilities include items directly attributable to a segment as well as those that can be allocated ona reasonable basis. Unallocated items comprise investments (other than investment properties) and related revenue, loans andborrowings and related expenses, corporate assets (primarily head office) and head office expenses. There are no transactionsbetween the business segments. Segment assets consist primarily of land, buildings, roads and equipment. Segment liabilitiescomprise deferred income and long-term liabilities.
Segment capital expenditure is the total cost incurred during the period to acquire property, plant and equipment and intangibleassets other than goodwill and is directly attributable to the segment or can be allocated to the segment on a reasonable basis.
Source of segment revenue
The toll operating segment derives its revenue from levying toll fees from toll road users, as well as from concession fees fromthe concession contracts entered into with the concessionaires of certain national roads in South Africa. Specific grants fromgovernment for toll funding are also recognised as revenue, to the extent they have been realised. The balance is deferred.
The non-toll operating segment derives its revenue from government funding in the form of government grants.
Measurement of items reported in segment reporting
The amount of each segment item reported is the measure reported to the chief operating decision-maker for the purposes ofmaking decisions about allocating resources to the segments and assessing their performance.
2. New Standards and Interpretations
2.1 Standards and interpretations effective and adopted in the current year
In the current year, the entity has adopted the following standards and interpretations that are effective for the currentfinancial year and that are relevant to its operations:
Standard/ Interpretation: Effective date:Years beginning on orafter
Expected impact:
Amendments to IAS 7: Disclosure initiative 1 January 2017 The adoption of thisstandard has not had amaterial impact on theresults of the company, buthas resulted in moredisclosure than would havepreviously been providedin the financial statements
24
INTEGRATED REPORT 2018
75
South African National Roads Agency SOC Limited(Registration number 1998/009584/30)Financial Statements for the year ended 31 March 2018
Notes to the Financial Statements
2. New Standards and Interpretations (continued)
2.2 Standards and interpretations not yet effective
The entity has chosen not to adopt the following standards and interpretations early, which have been published and aremandatory for the entity’s accounting periods beginning on or after 1 April 2018 or later periods:
The core principle of IFRS 15 (revenue from contracts with customers) is to recognise revenue when all the five prescribedsteps are met. The steps are identification of the contract with the customer, identification of the separate performanceobligations in the contract, determine the transaction price, allocation of the transaction price to the separate performanceobligations and recognition of revenue as and when each performance obligation is satisfied. SANRAL anticipate adecrease in revenue and increase in future credit losses (IFRS 9) in 2019 financial year as the recognition of revenue will belimited to what is recoverable.
IFRS 9 (financial instruments) replaces IAS 39; it is not expected that the adoption of IFRS will change the classification ofour financial assets and liablities significantly. The measurement and disclosures in 2019 financial statements will beupdated to comply with the requirements of the new standards.
Standard/ Interpretation: Effective date:Years beginning on orafter
Expected impact:
Insurance Contracts 1 January 2021 Impact is currently beingassessed
IFRS 16 Leases 1 January 2019 Impact is currently beingassessed
IFRS 9 Financial Instruments 1 January 2018 The entity has adopted thenew standard with effectfrom 1 April 2018
IFRS 15 Revenue from Contracts with Customers 1 January 2018 The entity has adopted thenew standard with effectfrom 1 April 2018
Amendments to IFRS 15: Clarifications to IFRS 15 Revenuefrom Contracts with Customers
1 January 2018 The entity has adopted thenew standard with effectfrom 1 April 2018
25
THE SOUTH AFRICAN NATIONAL ROADS AGENCY SOC LIMITED
76
South African National Roads Agency SOC Limited(Registration number 1998/009584/30)Financial Statements for the year ended 31 March 2018
Notes to the Financial Statements
3. Fair value
SANRAL measures financial instruments, such as investments, bonds, and borrowings, at fair value at each reporting date.The fair value of financial instruments measured at amortised cost is disclosed should it be determined that the carryingvalue of these instruments does not reasonably approximate their fair value at each reporting date.
Fair value is the price that would be received for selling an asset or paid for the transfer of a liability in an orderly transactionbetween market participants at the measurement date. The fair value measurement is based on the presumption that thesale or transfer takes place either:
In the market for the asset/liability; or In the absence of a principal market, in the most advantageous market for the asset or liability.
The principal or the most advantageous market must be accessible to SANRAL.
The fair value of an asset or a liability is measured using the assumptions that market participants would use when pricingthe asset or liability, assuming that market participants act in their economic best interest. A fair value measurement of non-financial assets takes into account a market participant`s ability to generate economic benefits by using the asset in itshighest and best use or by selling it to another market participant that would use the asset in its highest and best use.
SANRAL uses valuation techniques that are appropriate in the circumstances and for which sufficient data are available tomeasure fair value, maximising the use of relevant observable inputs and minimising the use of unobservable inputs. Allassets and liabilities for which fair value is measured or disclosed in the financial statements are categorised within the fairvalue hierarchy, described as follows, based on the lowest level input significant to the fair value measurement as a whole:
Level 1 - Quoted (unadjusted) market prices in active markets for identical assets or liabilities.
Level 2 - Valuation techniques for which the lowest level input that is significant to the fair value measurement is directly orindirectly observable.
Level 3 - Valuation techniques for which the lowest level input that is significant to the fair value measurement isunobservable.
For assets and liabilities that are recognised in the financial statements on a recurring basis, SANRAL determines whethertransfers have occurred between the levels in the hierarchy by re-assessing categorisation (based on the lowest level inputthat is significant to the fair value measurement as a whole) at the end of each reporting period.
For the purpose of fair value disclosures, SANRAL has determined classes of assets and liabilities on the basis of thenature, characteristics and risks of the asset or liability and the level of the fair value hierarchy as explained above.
26

INTEGRATED REPORT 2018
77
South African National Roads Agency SOC Limited(Registration number 1998/009584/30)Financial Statements for the year ended 31 March 2018
Notes to the Financial Statements
4. Property, plant and equipment under concession
31 March2018R'000
31 March2017R'000
Cost /valuation
R'000
Accumulateddepreciation
R'000
CarryingvalueR'000
Cost /valuation
R'000
Accumulateddepreciation
R'000
CarryingvalueR'000
Buildings 967 228 (174 801) 792 427 967 613 (155 518) 812 095Road structures 7 820 713 (882 783) 6 937 930 7 386 933 (931 541) 6 455 392Equipment 507 279 (269 096) 238 183 470 214 (243 572) 226 642Property, plant andequipment under construction
2 230 796 - 2 230 796 2 075 646 - 2 075 646
Road network 45 932 530 (9 107 870) 36 824 660 42 003 705 (8 057 424) 33 946 281
Total 57 458 546 (10 434 550) 47 023 996 52 904 111 (9 388 055) 43 516 056
27

THE SOUTH AFRICAN NATIONAL ROADS AGENCY SOC LIMITED
78
So
uth
Afr
ican
Nati
on
al R
oad
s A
gen
cy S
OC
Lim
ite
d(R
eg
istr
atio
n n
um
be
r 1
99
8/0
09
58
4/3
0)
Fin
an
cia
l S
tate
me
nts
fo
r th
e y
ea
r e
nd
ed
31
Ma
rch
20
18
No
tes t
o t
he F
inan
cia
l S
tate
men
ts
4.
Pro
pe
rty,
pla
nt
an
d e
qu
ipm
en
t u
nd
er
co
nc
es
sio
n (c
on
tin
ue
d)
Re
co
nc
ilia
tio
n o
f p
rop
ert
y,
pla
nt
an
d e
qu
ipm
en
t u
nd
er
co
nc
es
sio
n
- 2
01
8
Op
en
ing
ba
lan
ce
R'0
00
Ad
dit
ion
s
R'0
00
Dis
po
sa
ls/
Wri
te o
ffs
R'0
00
Tra
ns
fers
R'0
00
Re
va
lua
tio
nD
ep
rec
iati
on
R'0
00
To
tal
R'0
00
Bu
ildin
gs
81
2 0
95
-(3
17
)-
-(1
9 3
51
)7
92
42
7R
oa
d s
tru
ctu
res
6 4
55
39
22
1 5
28
--
47
3 1
55
(12
14
5)
6 9
37
93
0E
qu
ipm
en
t2
26
64
28
45
1(1
6)
28
63
6-
(25
53
0)
23
8 1
83
Pro
pe
rty,
pla
nt
an
d e
qu
ipm
en
t u
nd
er
co
nstr
uctio
n
2 0
75
64
69
88
94
5-
(83
3 7
95
)-
-2
23
0 7
96
Ro
ad
ne
two
rk3
3 9
46
28
16
4 0
54
(33
51
7)
80
5 1
59
2 4
06
06
8(3
63
38
5)
36
82
4 6
60
43
51
6 0
56
1 0
82
97
8(3
3 8
50
)-
2 8
79
22
3(4
20
41
1)
47
02
3 9
96
Re
co
nc
ilia
tio
n o
f p
rop
ert
y,
pla
nt
an
d e
qu
ipm
en
t u
nd
er
co
nc
es
sio
n
- 2
01
7
Op
en
ing
ba
lan
ce
R'0
00
Ad
dit
ion
s
R'0
00
Dis
po
sa
ls
R'0
00
Tra
ns
fers
R'0
00
Re
va
lua
tio
ns
R'0
00
De
pre
cia
tio
n
R'0
00
To
tal
R'0
00
Bu
ildin
gs
83
1 1
09
--
--
(19
01
4)
81
2 0
95
Ro
ad
str
uctu
res
5 9
32
61
81
08
45
7-
-4
24
71
9(1
0 4
02
)6
45
5 3
92
Eq
uip
me
nt
30
9 9
79
19
23
2(8
4 9
56
)2
1 3
43
-(3
8 9
56
)2
26
64
2P
rop
ert
y,
pla
nt
an
d e
qu
ipm
en
t u
nd
er
co
nstr
uctio
n
1 3
33
44
81
26
9 2
78
-(5
27
08
0)
--
2 0
75
64
6R
oa
d n
etw
ork
2
9 0
70
37
58
2 0
72
-5
05
73
74
61
9 3
12
(33
1 2
15
)3
3 9
46
28
1
37
47
7 5
29
1 4
79
03
9(8
4 9
56
)-
5 0
44
03
1(3
99
58
7)
43
51
6 0
56
28
INTEGRATED REPORT 2018
79
South African National Roads Agency SOC Limited(Registration number 1998/009584/30)Financial Statements for the year ended 31 March 2018
Notes to the Financial Statements
4. Property, plant and equipment under concession (continued)
Pledged as security
There is no PPE under concession pledged as security for liabilities.
A register containing the information required by Regulation 25(3) of the Companies Regulations, 2011 is available forinspection at the registered office of the company.
Depreciation method
Property, plant and equipment under concession are depreciated on a straight-line basis over its useful life.
Impairment assessment
Property, plant and equipment under concession has been assessed for impairment.
Revaluation
Revaluation of road network and structures
Road network and structures are valued at depreciated replacement cost based on the estimated present cost ofconstructing existing assets by the most appropriate current method of construction, reduced by factors for the age andcondition of the asset. The estimated present material unit costs are assumed to be uniform across the country. The prioryear unit rate was adjusted by Construction Price Adjustment (CPA) factor to determine the 2018 revalued amount at yearend.
The depreciated replacement cost methodology, where replacement cost is based on that of modern equivalent asset, asutilised by SANRAL, is in direct alignment with the recommendations contained in International Infrastructure ManagementManual (IIMM) for specialised assets which are rarely, if ever, sold on the open market. This manual is used internationallyin Australia, New Zealand, United Kingdom, Canada, South Africa and other countries. The replacement cost is calculatedusing unit rates adjusted by CPA factor.
The depreciation of the asset is then calculated using straight-line depreciation for the roadbed portion and condition-baseddepreciation for the pavement layers and structures. Pavement condition data is collected using survey vehicles equippedwith lasers and 2D/3D cameras enabling the determination of various pavement condition indicators for each 10m of theroad network on a two-year basis. The bridges are inspected by certified independent inspectors on a five-year basis.
The actual condition is then used to determine the depreciation rate that should be applied to the pavement layers for each1km of road and to the structures.
Factors impacting on the value of SANRAL roads:
a. Percentage network change: In 1998, SANRAL had just less than 7000km of roads in its asset portfolio. Theincorporation of roads from provinces has increased this over the period, bringing the total to 22 214km at March 2018. Thisexpansion has had a significant impact on the value of assets.
b. Percentage CPA change: In determining replacement cost, the cost of construction is driven by various input costs suchas the cost of bitumen (crude oil), diesel for construction plant operations, cement, steel and aggregate. Stats SA publishesthe Construction Price Adjustment (CPA) factor, which all construction contracts are linked to, on a monthly basis.
c. Percentage good condition: Any reseal, overlay, or strengthening work performed on the assets impacts on thecondition of the asset, the remaining life of the asset and thus the condition-based depreciation of the asset.
d. Percentage with > 5000 vehicles per day: The volume and composition of traffic (light/heavy vehicles) which a roadcarries determine the standard to which the road must be built or maintained. This means that a road carrying 200 000vehicles a day, will require additional lanes per direction and more pavement layers using higher quality materials than aroad carrying less than 500 vehicles a day. This impacts on the replacement cost of the 1km section of road.
e. The topography (flat, rolling or mountainous) has an impact on the size and extent of cuttings and fills and thus on thereplacement cost of the 1 km section of road.
f. The climate — arid, moderate or wet climate has an impact on the number of pavement layers, the quality of the materialwithin layers; thus replacement cost of the 1 km section of road.
29
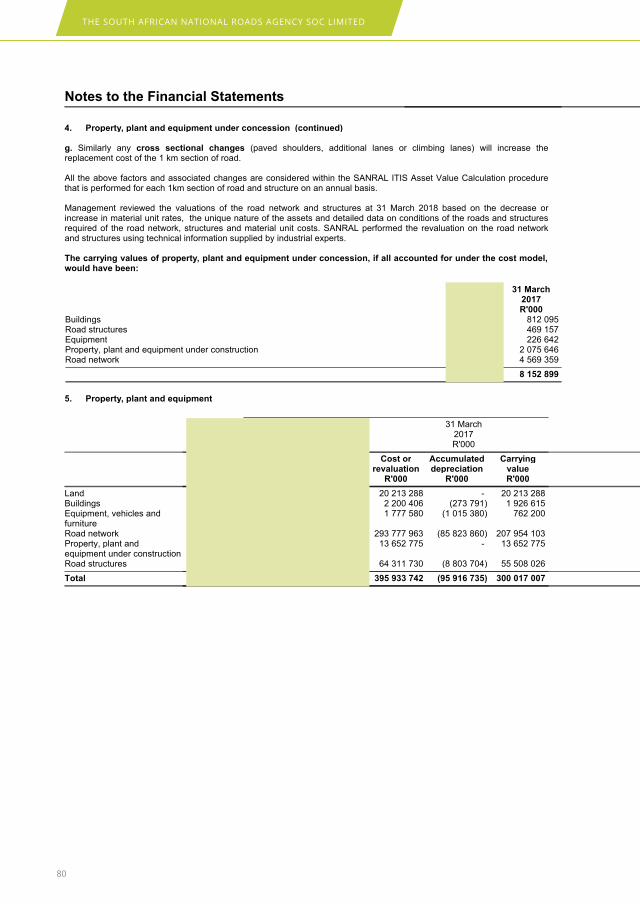
THE SOUTH AFRICAN NATIONAL ROADS AGENCY SOC LIMITED
80
South African National Roads Agency SOC Limited(Registration number 1998/009584/30)Financial Statements for the year ended 31 March 2018
Notes to the Financial Statements
4. Property, plant and equipment under concession (continued)
g. Similarly any cross sectional changes (paved shoulders, additional lanes or climbing lanes) will increase thereplacement cost of the 1 km section of road.
All the above factors and associated changes are considered within the SANRAL ITIS Asset Value Calculation procedurethat is performed for each 1km section of road and structure on an annual basis.
Management reviewed the valuations of the road network and structures at 31 March 2018 based on the decrease orincrease in material unit rates, the unique nature of the assets and detailed data on conditions of the roads and structuresrequired of the road network, structures and material unit costs. SANRAL performed the revaluation on the road networkand structures using technical information supplied by industrial experts.
The carrying values of property, plant and equipment under concession, if all accounted for under the cost model,would have been:
31 March2018R'000
31 March2017R'000
Buildings 792 427 812 095Road structures 478 539 469 157Equipment 238 183 226 642Property, plant and equipment under construction 2 230 796 2 075 646Road network 5 255 592 4 569 359
8 995 537 8 152 899
5. Property, plant and equipment
31 March2018R'000
31 March2017R'000
Cost orrevaluation
R'000
Accumulateddepreciation
R'000
CarryingvalueR'000
Cost orrevaluation
R'000
Accumulateddepreciation
R'000
CarryingvalueR'000
Land 19 929 488 - 19 929 488 20 213 288 - 20 213 288Buildings 2 193 524 (310 830) 1 882 694 2 200 406 (273 791) 1 926 615Equipment, vehicles andfurniture
1 895 812 (1 093 784) 802 028 1 777 580 (1 015 380) 762 200
Road network 326 457 865 (98 064 461) 228 393 404 293 777 963 (85 823 860) 207 954 103Property, plant andequipment under construction
16 480 515 - 16 480 515 13 652 775 - 13 652 775
Road structures 67 608 250 (9 351 264) 58 256 986 64 311 730 (8 803 704) 55 508 026
Total 434 565 454 (108 820 339) 325 745 115 395 933 742 (95 916 735) 300 017 007
30

INTEGRATED REPORT 2018
81
So
uth
Afr
ica
n N
ati
on
al
Ro
ad
s A
gen
cy S
OC
Lim
ite
d(R
eg
istr
atio
n n
um
be
r 1
99
8/0
09
58
4/3
0)
Fin
an
cia
l S
tate
me
nts
fo
r th
e y
ea
r e
nd
ed
31
Ma
rch
20
18
No
tes
to
th
e F
ina
nc
ial
Sta
tem
en
ts
5.
Pro
pert
y,
pla
nt
an
d e
qu
ipm
en
t (c
on
tin
ue
d)
Re
co
nc
ilia
tio
n o
f p
rop
ert
y,
pla
nt
an
d e
qu
ipm
en
t -
20
18
Op
en
ing
ba
lan
ce
R'0
00
Ad
dit
ion
s/
Re
cla
ss
ifie
d
R'0
00
Bo
rro
win
gc
os
tsc
ap
ita
lis
ed
R'0
00
Dis
po
sa
ls/
wri
te o
ffs
R'0
00
Tra
ns
fers
R'0
00
Re
va
lua
tio
ns
R'0
00
De
pre
cia
tio
n
R'0
00
To
tal
R'0
00
La
nd
20
21
3 2
88
83
70
1-
--
(36
7 5
01
)-
19
92
9 4
88
Bu
ildin
gs
1 9
26
61
51
65
-(1
10
7)
--
(42
97
9)
1 8
82
69
4E
qu
ipm
en
t, V
eh
icle
s a
nd
Fu
rnitu
re7
62
20
01
21
89
8-
(1 0
76
)-
-(8
0 9
94
)8
02
02
8R
oa
d n
etw
ork
2
07
95
4 1
03
89
61
21
62
40
5(9
38
5)
4 9
33
14
41
7 6
59
05
9(2
39
5 5
34
)2
28
39
3 4
04
Pro
pe
rty,
pla
nt
an
d e
qu
ipm
en
t u
nd
er
co
nstr
uctio
n1
3 6
52
77
58
53
7 7
58
(16
2 4
05
)-
(5 5
47
61
3)
--
16
48
0 5
15
Ro
ad
str
uctu
res
55
50
8 0
26
--
(7)
61
4 4
69
2 2
74
83
7(1
40
33
9)
58
25
6 9
86
30
0 0
17
00
78
83
3 1
34
-(1
1 5
75
)-
19
56
6 3
95
(2 6
59
84
6)
32
5 7
45
11
5
Re
co
nc
ilia
tio
n o
f p
rop
ert
y,
pla
nt
an
d e
qu
ipm
en
t -
20
17
Op
en
ing
ba
lan
ce
R'0
00
Ad
dit
ion
s
R'0
00
Bo
rro
win
gc
os
tsc
ap
ita
lis
ed
R'0
00
Dis
po
sa
ls
R'0
00
Tra
ns
fers
R'0
00
Re
va
lua
tio
ns
R'0
00
Re
cla
ss
ifie
dD
ep
rec
iati
on
R'0
00
Imp
air
me
nt
los
s
R'0
00
To
tal
R'0
00
La
nd
18
68
7 0
10
67
30
3-
--
1 4
58
97
5-
--
20
21
3 2
88
Bu
ildin
gs
1 5
93
18
02
74
--
34
9 8
88
-2
8 9
86
(38
48
9)
(7 2
24
)1
92
6 6
15
Eq
uip
me
nt,
Ve
hic
les a
nd
Fu
rnitu
re9
70
79
32
3 5
55
-(4
50
0)
51
90
2-
(16
6 9
70
)(1
11
51
2)
(1 0
68
)7
62
20
0
Ro
ad
ne
two
rk
19
4 9
23
85
3-
1 6
36
-4
82
1 5
66
10
62
7 6
21
-(2
42
0 5
73
)-
20
7 9
54
10
3P
rop
ert
y,
pla
nt
an
de
qu
ipm
en
t u
nd
er
co
nstr
uctio
n
11
77
9 4
27
7 6
62
02
5(1
63
6)
(6 6
67
)(5
78
0 3
74
)-
--
-1
3 6
52
77
5
Ro
ad
str
uctu
res
49
92
9 9
53
--
-5
57
01
95
17
9 4
29
-(1
58
37
5)
-5
5 5
08
02
6
27
7 8
84
21
67
75
3 1
57
-(1
1 1
67
)1
17
26
6 0
25
(13
7 9
84
)(2
72
8 9
49
)(8
29
2)
30
0 0
17
00
7
20
17
clo
sin
g b
ala
nce
wa
s r
esta
ted
to
co
rre
ct
the
pri
or
pe
rio
d e
rro
r o
n a
sse
ts r
ecla
ssifie
d t
o in
tan
gib
le a
sse
ts;
refe
r to
no
te 7
31

THE SOUTH AFRICAN NATIONAL ROADS AGENCY SOC LIMITED
82
South African National Roads Agency SOC Limited(Registration number 1998/009584/30)Financial Statements for the year ended 31 March 2018
Notes to the Financial Statements
5. Property, plant and equipment (continued)
Impairment Assessment
An assessment on property, plant and equipment (PPE) was made and no impairment was identified for 2018
Property, plant and equipment encumbered as security
No property, plant and equipment is pledged as security for liabilities
A register containing the information required by Regulation 25(3) of the Companies Regulations, 2011 is available forinspection at the registered office of the company
Useful lives
The estimated useful lives are described in the accounting policies property, plant and equipment section 1.4
Property, plant and equipment under construction
Property, plant and equipment under construction refer to capital expenditure on roads such as strengthening,improvements, new roads building and highway monitoring equipment. No impairment testing was considered for assetsunder construction as the risk of impairment is transferred to the contractor.
Land identification process
In terms of the identification process, which was initiated on 1 April 1998, SANRAL has identified 32 737 (2017: 31 186)properties falling within road reserves and 2 232 (2017: 2 495) investment properties which fall outside of the road reserve.The values are shown in the financial statements. For investment property values refer to note 6.
Depreciation method
Property, plant and equipment are depreciated on a straight-line basis over their useful lives.
Revaluation
Revaluation of land
The land component of the road reserve was valued in terms of the depreciated replacement cost. The replacement cost ofland is determined based on recent selling prices of vacant land with comparable location and, where applicable, adjustedin respect of engineering services' status and development rights on the road reserves. The valuation of land at 31 March2018 was determined by using prior year values adjusted by CPA factor.
Revaluation of road network and structures
Road network and structures are valued at depreciated replacement cost based on the estimated present cost ofconstructing existing assets by the most appropriate current method of construction, reduced by factors for the age andcondition of the asset. The estimated present material unit costs are assumed to be uniform across the country. The prioryear unit rate was adjusted by Construction Price Adjustment (CPA) factor to determine the 2018 revalued amount at yearend.
The depreciated replacement cost methodology, where replacement cost is based on that of a modern equivalent asset, asutilised by SANRAL, is in direct alignment with the recommendations contained within International InfrastructureManagement Manual (IIMM) for specialised assets which are rarely, if ever, sold on the open market. This manual is usedinternationally in Australia, New Zealand, United Kingdom, Canada, South Africa, and other countries. The replacementcost is calculated using unit rates adjusted by CPA factor for 2018.
The depreciation of the asset is then calculated using straight-line depreciation for the roadbed portion and condition-baseddepreciation for the pavement layers and structures. Pavement condition data is collected using survey vehicles equippedwith lasers and 2D/3D cameras enabling the determination of various pavement condition indicators for each 10m of theroad network on a two-year basis. The bridges are inspected by certified independent inspectors on a five-year basis.
The actual condition is then used to determine the depreciation rate that should be applied to the pavement layers for each1km of road and to the structures.
For factors impacting on the value of SANRAL roads refer to note 4.
32
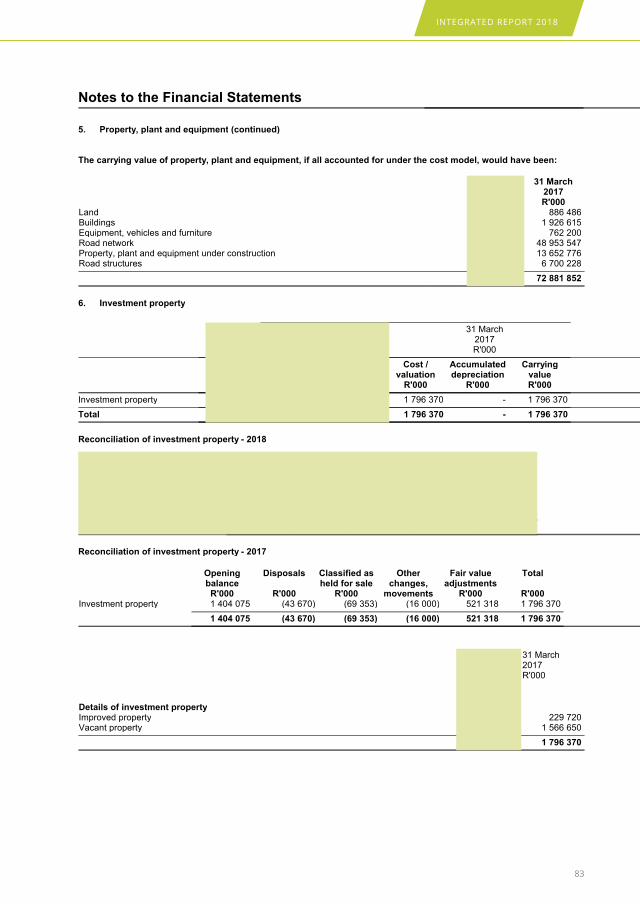
INTEGRATED REPORT 2018
83
South African National Roads Agency SOC Limited(Registration number 1998/009584/30)Financial Statements for the year ended 31 March 2018
Notes to the Financial Statements
5. Property, plant and equipment (continued)
The carrying value of property, plant and equipment, if all accounted for under the cost model, would have been:
31 March2018R'000
31 March2017R'000
Land 970 351 886 486Buildings 1 882 694 1 926 615Equipment, vehicles and furniture 802 028 762 200Road network 51 727 788 48 953 547Property, plant and equipment under construction 16 480 515 13 652 776Road structures 7 174 357 6 700 228
79 037 733 72 881 852
6. Investment property
31 March2018R'000
31 March2017R'000
Cost /valuation
R'000
Accumulateddepreciation
R'000
CarryingvalueR'000
Cost /valuation
R'000
Accumulateddepreciation
R'000
CarryingvalueR'000
Investment property 1 810 430 - 1 810 430 1 796 370 - 1 796 370
Total 1 810 430 - 1 810 430 1 796 370 - 1 796 370
Reconciliation of investment property - 2018
OpeningbalanceR'000
Classified asheld for sale
R'000
Held for saleproperty
reclassifiedfrom prior
year
Netgains/(losses)
from FVadjustments
R'000
Total
R'000
Investment property 1 796 370 (1 414) 15 955 (481) 1 810 430
1 796 370 (1 414) 15 955 (481) 1 810 430
Reconciliation of investment property - 2017
OpeningbalanceR'000
Disposals
R'000
Classified asheld for sale
R'000
Otherchanges,
movements
Fair valueadjustments
R'000
Total
R'000Investment property 1 404 075 (43 670) (69 353) (16 000) 521 318 1 796 370
1 404 075 (43 670) (69 353) (16 000) 521 318 1 796 370
31 March2018R'000
31 March2017R'000
Details of investment propertyImproved property 229 720 229 720Vacant property 1 580 710 1 566 650
1 810 430 1 796 370
33
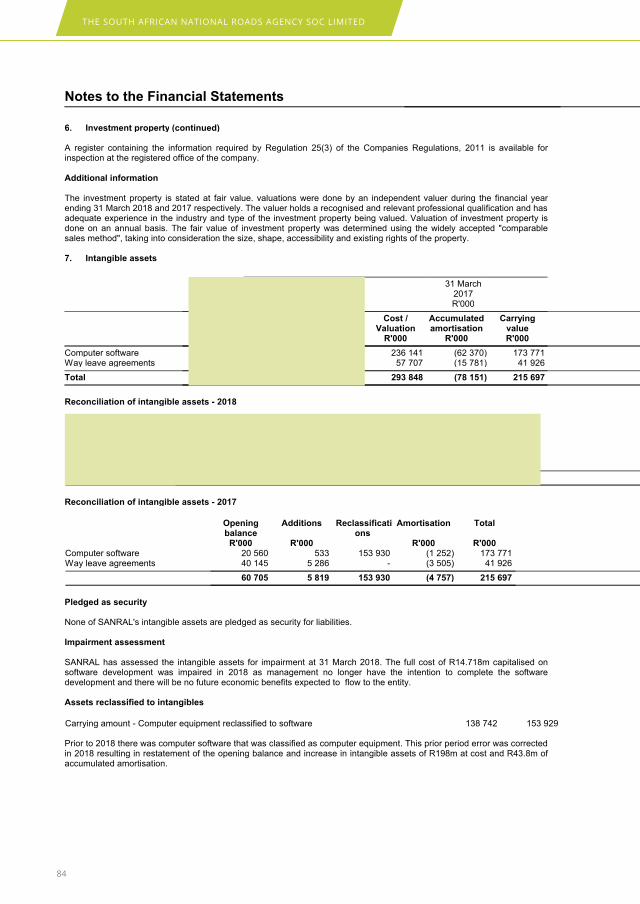
THE SOUTH AFRICAN NATIONAL ROADS AGENCY SOC LIMITED
84
South African National Roads Agency SOC Limited(Registration number 1998/009584/30)Financial Statements for the year ended 31 March 2018
Notes to the Financial Statements
6. Investment property (continued)
A register containing the information required by Regulation 25(3) of the Companies Regulations, 2011 is available forinspection at the registered office of the company.
Additional information
The investment property is stated at fair value. valuations were done by an independent valuer during the financial yearending 31 March 2018 and 2017 respectively. The valuer holds a recognised and relevant professional qualification and hasadequate experience in the industry and type of the investment property being valued. Valuation of investment property isdone on an annual basis. The fair value of investment property was determined using the widely accepted "comparablesales method", taking into consideration the size, shape, accessibility and existing rights of the property.
7. Intangible assets
31 March2018R'000
31 March2017R'000
Cost /Valuation
R'000
Accumulatedamortisation
R'000
CarryingvalueR'000
Cost /Valuation
R'000
Accumulatedamortisation
R'000
CarryingvalueR'000
Computer software 235 943 (92 956) 142 987 236 141 (62 370) 173 771Way leave agreements 62 400 (20 181) 42 219 57 707 (15 781) 41 926
Total 298 343 (113 137) 185 206 293 848 (78 151) 215 697
Reconciliation of intangible assets - 2018
OpeningbalanceR'000
Additions
R'000
Disposals Amortisation
R'000
Impairmentloss
Total
R'000Computer software 173 771 - (2) (16 064) (14 718) 142 987Way leave agreements 41 926 4 693 - (4 400) - 42 219
215 697 4 693 (2) (20 464) (14 718) 185 206
Reconciliation of intangible assets - 2017
OpeningbalanceR'000
Additions
R'000
Reclassifications
Amortisation
R'000
Total
R'000Computer software 20 560 533 153 930 (1 252) 173 771Way leave agreements 40 145 5 286 - (3 505) 41 926
60 705 5 819 153 930 (4 757) 215 697
Pledged as security
None of SANRAL's intangible assets are pledged as security for liabilities.
Impairment assessment
SANRAL has assessed the intangible assets for impairment at 31 March 2018. The full cost of R14.718m capitalised onsoftware development was impaired in 2018 as management no longer have the intention to complete the softwaredevelopment and there will be no future economic benefits expected to flow to the entity.
Assets reclassified to intangibles
Carrying amount - Computer equipment reclassified to software 138 742 153 929
Prior to 2018 there was computer software that was classified as computer equipment. This prior period error was correctedin 2018 resulting in restatement of the opening balance and increase in intangible assets of R198m at cost and R43.8m ofaccumulated amortisation.
34

INTEGRATED REPORT 2018
85
South African National Roads Agency SOC Limited(Registration number 1998/009584/30)Financial Statements for the year ended 31 March 2018
Notes to the Financial Statements2018 2017
R '000 R '000
8. Investments
At fair value through profit or loss - held for tradingMarket-making investmentsMarket-making investments consist of bonds. These bonds yielded interest rates ofbetween 6.93% and 8.94% as at 31 March 2018 (31 March 2017: 8.09 to 9.81%).Market-making investments are held to manage liquidity and to reduce the cost ofborrowing.
42 800 317 157
Loans and receivables at amortised costCapped insurance receivableSANRAL has a long term insurance agreement with Centriq Insurance Company Ltdwhich is reviewed annually. SANRAL made an upfront deposit, and all claims up to thebalance of the deposit are recovered from the funds deposited.
The agreement provides for the repayment of the balance of the deposit at the end ofthe agreement period. These funds earned interest at the three-month Jibar-baseddeposit rate of 7% (31 March 2017: 7%).
372 562 329 739
415 362 646 896
Non-current assetsLoans and receivables at amortised cost 372 562 329 739
Current assetsAt fair value through profit or loss - held for trading 42 800 317 157
415 362 646 896
9. Trade and other receivables
Trade receivables (toll) 10 840 403 8 798 399Bad debts written off (17 566) (33 100)Other receivables 60 686 186 620Other receivables due from related parties 178 310 139 163Accrued interest 81 698 73 850Other receivables due from third party funding 11 932 11 932Impairment losses - toll and other receivables (6 354 427) (3 845 439)
4 801 036 5 331 425
Trade and other receivables comprise mainly toll debtors. R6.056bn (2017: R3.613bn) of the impairment losses relate to theimpairment of e-toll (VPC) debtors.
35
THE SOUTH AFRICAN NATIONAL ROADS AGENCY SOC LIMITED
86
South African National Roads Agency SOC Limited(Registration number 1998/009584/30)Financial Statements for the year ended 31 March 2018
Notes to the Financial Statements2018 2017
R '000 R '000
9. Trade and other receivables (continued)
Reconciliation of credit losses (impairment)
Opening balance (3 845 439) (91 844)Impairment (2 508 988) (3 753 595)
Closing balance (6 354 427) (3 845 439)
Toll tariffs are charged in terms of an Act of Parliament, the South African National Roads Agency Limited and NationalRoads Act, which provides that the non-payment of toll fees is an offence. The Act allows SANRAL to pursue both criminaland civil action against a non-payer. Additionally, section 51 (1)(b)(i) of the PFMA states that all revenue due to the statemust be collected.
Trade receivables, specifically toll debtors, were objectively assessed for impairment or collectibility, given the legislativeframework. Allowances for estimated irrecoverable amounts were made, which included the following:
Debt older than three years Debtors currently in liquidation or under business rescue.
In assessing toll debtors for impairment, the following were the significant judgments considered, based on the prevailingconditions and historical trends:
As a result of toll debtors being mainly LSM 9 consumers, SANRAL management considered the toll tariffs as affordable forthese users given the percentage of household income and the monthly caps which apply. The refusal to pay was notregarded as an inability to pay.
Corporates under business rescue or in liquidation are considered to be a loss event as they are in financial difficulty andthe outcome is unknown. The probability of the full amount being recovered was not certain therefore these amounts wereimpaired.
The reduction in the standard rate in 2015, announced as part of the new dispensation, was considered by management asa loss event for toll debt which preceded the new standard tariff. Based on current and historical payment patterns, theprobability of the full amount being recovered was not certain therefore these amounts were impaired.
Accounts under R500 are considered a loss event by management, as the cost of recovery may exceed the debt thereforethese amounts were impaired.
Debt older than three years is considered to be a loss event by management, as there is a probability that the civil claim ofthe debt may prescribe after three years. While still pursuing civil and criminal prosecution, a conservative approach wastaken on the probability of recovering the full amounts outstanding and these amounts were impaired.
36

INTEGRATED REPORT 2018
87
South African National Roads Agency SOC Limited(Registration number 1998/009584/30)Financial Statements for the year ended 31 March 2018
Notes to the Financial Statements2018 2017
R '000 R '000
10. Assets classified as held for sale
Assets and liabilities
Assets of disposal groups Opening balance 74 226 20 096Investment property sold during the year (14 373) (11 956)Additions to investment property held for sale 1 414 69 353Fair value adjustments (14 372) (3 267)Reclassified property (no longer held for sale) (15 955) -
30 940 74 226
Investment property held for sale comprises excess land which was acquired initially for future road construction and itscarrying amount will be recovered principally through sale rather than continuing use.
Reclassified of held for sale propertities
These assets relate to properties that no longer meet the IFRS 5 requirements to be held for sale. In 2018 held for saleproperties were reclassified as it was no longer probable that the sale will take place. There is no other effect, caused bythis reclassification.
Comparative figures are not required to be restated in terms of IFRS 5.
11. Cash and cash equivalents
Cash and cash equivalents consist of:
Cash on hand 9 14Bank balances 54 848 45 107Money market deposits 7 591 719 6 524 879
7 646 576 6 570 000
Cash and cash equivalents held by the entity that are not available for use by the entity(restricted cash)
1 503 1 323
The effective interest rates on bank balances and money market funds were between 4.86% and 7.99% (31March 2017: 4.81% and 8.03%), and the deposits have an average maturity of 36.2 days (31 March 2017: 26 days).
Restricted Cash
The cash and cash equivalents disclosed above and in the statement of cash flows include R1.5m (2017: R1.3m), for tenant
deposits, which are held in a trust account by Hornby Smyly Glavovic Trust . These deposits are subject to terms andconditions in lease contracts and are therefore not available for general use by SANRAL.
12. Share capital
Authorised4000 ordinary shares of R1 each 4 4
Issued4000 ordinary shares of R1 each 4 4Share premium (4 000 ordinary shares issued at a premium of R272 760 per share) 1 091 040 1 091 040
1 091 044 1 091 044
Shares are held by the the Government of South Africa, represented by the Minister of Transport.
37
THE SOUTH AFRICAN NATIONAL ROADS AGENCY SOC LIMITED
88
South African National Roads Agency SOC Limited(Registration number 1998/009584/30)Financial Statements for the year ended 31 March 2018
Notes to the Financial Statements2018 2017
R '000 R '000
13. Reserves
Revaluation reserve
Revaluation reserves are not distributable.
The revaluation reserve relates to the revaluation of the following property, plant and equipment components:
Land 18 965 511 19 333 012Road network assets (comprising road layers, road beds and road structures) (PPEincluding PPE under concession)
265 782 532 242 969 413
284 748 043 262 302 425
A breakdown of the revaluation movement for the period affecting the statement of profit or loss and other comprehensiveincome is reflected below:
Increase/(decrease) in revaluation amount for land (367 501) 1 458 975Increase/(decrease) in revaluation amount for road network assets (PPE includingPPE under concession) (comprising road layers, road beds and road structures)
22 813 119 20 851 018
22 445 618 22 309 993
Accumulated lossAccumulated loss (14 539 072) (14 290 022)
38
INTEGRATED REPORT 2018
89
South African National Roads Agency SOC Limited(Registration number 1998/009584/30)Financial Statements for the year ended 31 March 2018
Notes to the Financial Statements2018 2017
R '000 R '000
14. Borrowings
At fair value through profit or lossDesignated at fair value through profit or lossBorrowings - SANRAL capital market loan (Long-term)At fair value through profit or loss: Held for trading
4 462 992 4 298 582
Borrowings - SANRAL capital market loan (Short term) 219 206 300 970Market-making liability (non-SANRAL) bonds 59 437 251 657
4 741 635 4 851 209
Held at amortised costBorrowings - capital market loan (Long-term) 40 410 366 42 298 177
Borrowings - capital market loan (short term) 2 404 820 -Borrowings - CPI-linked loan (Long-term) - 80 453
Borrowings - CPI-linked loan (Short-term)The CPI-linked loan is repayable in monthly CPI-linked instalments at a real interestrate of 3.91% per annum (31 March 2017 3.91%) until 31 October 2018. This loan isguaranteed by government equal to the original loan. This loan has its own separateguarantee.
78 308 187 153
Borrowings - EIB loan (Long-term) 1 020 389 1 051 472
Borrowings - EIB loan (Short-term)SANRAL has entered into a loan agreement with the European Investment Bank (EIB).The loan was drawn in two tranches of R572 784 000 and R573 918 000 respectivelyduring the 2011 financial year. The tranches bear interest at a fixed rate of 8.315% and9.227% respectively. The loan is repayable over 20 years in semi-annual instalments.Repayments are made in South African Rands and commenced in the 2015 financialyear. This loan is guaranteed by government, under the R31.91 billion guarantee.
31 083 28 529
Borrowings - ECA supported loan (Long-term) 14 467 66 777
Borrowings - ECA supported loan (Short-term)SANRAL has entered into a loan facility with ABSA bank amounting to R523 102 562for the purchase of goods or services to support the open road tolling system of GFIP.The first tranche of R182 184 245 was drawn during the 2012 financial year. Thetranche bears interest at a rate of three-months Jibar plus 1.75%. The loan isrepayable over 10 years commencing in June 2012. The loan is supported by theRepublic of Austria through Oesterreichische Kontrollbank Aktiengesellschaft, anExport Credit Agency (ECA). The loan may be declared due and payable in the eventof SANRAL's Moody`s rating falling below investment grade Baa3. It provides for aperiod of negotiation to amend the finance documents in such an event.
52 310 52 310
Borrowings - repurchase agreements 5 768 13 607
Borrowings - call bondsSANRAL has issued call bonds under its R6 billion guarantee to meet its short-termfinancing requirements. The call bonds, which are repayable on demand, yield interestat the money market rate which at 31 March 2018 was 6.95% (2017: 7.30%)
212 000 125 000
Promissory Notes (short term)SANRAL has issued promissory notes under its R6 billion guarantee to meet its short-term financing requirements. The promissory notes, which are repayable on one yearmaturity, yeild an interest rate linked to Jibar which was 8.50% at 31 March 2018.
1 138 031 -
45 367 542 43 903 478
50 109 177 48 754 687
Non-current liabilities
39
THE SOUTH AFRICAN NATIONAL ROADS AGENCY SOC LIMITED
90
South African National Roads Agency SOC Limited(Registration number 1998/009584/30)Financial Statements for the year ended 31 March 2018
Notes to the Financial Statements2018 2017
R '000 R '000
14. Borrowings (continued)Fair value through profit or loss 4 462 992 4 298 582At amortised cost 41 445 222 43 496 879
45 908 214 47 795 461
Current liabilitiesFair value through profit or loss 278 643 552 627At amortised cost 3 922 320 406 599
4 200 963 959 226
50 109 177 48 754 687
Capital market loans
In September 2017 the South African government issued an updated and reworded guarantee of R31.91bn for borrowingsby SANRAL, for which the payment obligations are limited to a maximum nominal value of R31.910bn. SANRAL has issuedbonds with a nominal value of R23.22bn as at 31 March 2018 (31 March 2017: R24.55bn) under a guaranteed DomesticMedium Term Note (DMTN) programme (HWAY bonds). The redemption amount of capital market loans, including interestaccrued, issued under the R31.91bn guarantee at 31 March 2018 was R30.67bn (31 March 2017: R30.33bn). The fundsraised through these borrowings can only be used for toll operations.
On 16 November 1999, the South African Government issued guarantees for borrowings (SZ bonds) by SANRAL up to anominal value of R6bn. SANRAL has issued bonds with a nominal value of R5.27bn as at 31 March 2018 (31 March 2017:R4bn) under this guarantee. The funds raised through these borrowings can only be used for toll operations.
The government also approved an unguaranteed borrowing capacity of up to a nominal value of R15bn. SANRAL issuedbonds with a nominal value of R10.15bn as at 31 March 2018 (31 March 2017: R9.98bn) under the non-guaranteed DMTNprogramme (NRA bonds). The funds raised through these borrowings can only be used for toll operations.
For further terms and conditions, including risk management information, refer to note 37.
15. Operating lease liability
Balance brought forward 166 2 594Amount realised in profit or loss (80) (2 428)
86 166
The operating lease liability arises from the straight-lining of lease payments over the period of the contract. Leasecontracts run over various periods of time and the last contract ends in 2021.
40
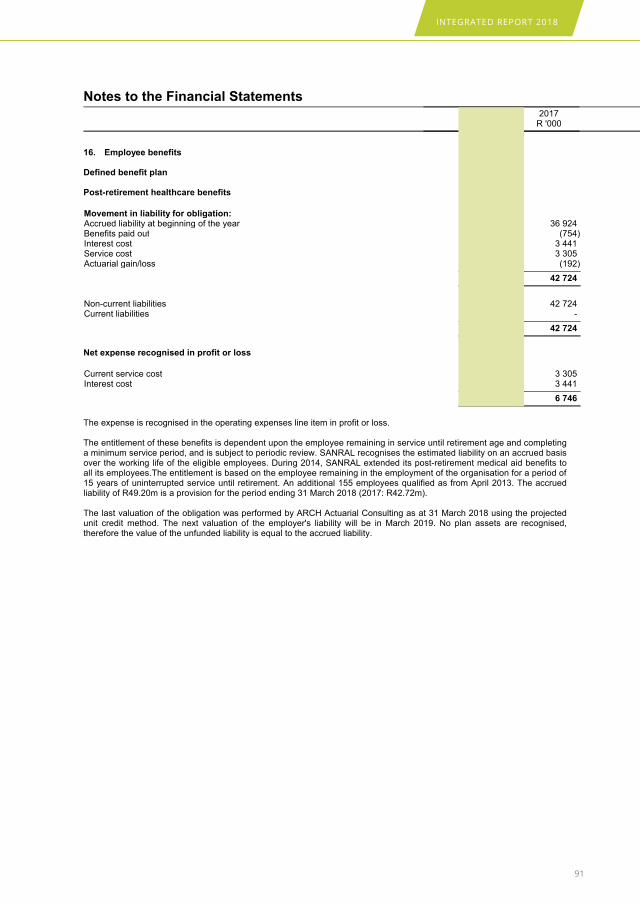
INTEGRATED REPORT 2018
91
South African National Roads Agency SOC Limited(Registration number 1998/009584/30)Financial Statements for the year ended 31 March 2018
Notes to the Financial Statements2018 2017
R '000 R '000
16. Employee benefits
Defined benefit plan
Post-retirement healthcare benefits
Movement in liability for obligation:Accrued liability at beginning of the year 42 724 36 924Benefits paid out (1 023) (754)Interest cost 3 738 3 441Service cost 3 651 3 305Actuarial gain/loss 110 (192)
49 200 42 724
Non-current liabilities 48 038 42 724Current liabilities 1 162 -
49 200 42 724
Net expense recognised in profit or loss
Current service cost 3 651 3 305Interest cost 3 738 3 441
7 389 6 746
The expense is recognised in the operating expenses line item in profit or loss.
The entitlement of these benefits is dependent upon the employee remaining in service until retirement age and completinga minimum service period, and is subject to periodic review. SANRAL recognises the estimated liability on an accrued basisover the working life of the eligible employees. During 2014, SANRAL extended its post-retirement medical aid benefits toall its employees.The entitlement is based on the employee remaining in the employment of the organisation for a period of15 years of uninterrupted service until retirement. An additional 155 employees qualified as from April 2013. The accruedliability of R49.20m is a provision for the period ending 31 March 2018 (2017: R42.72m).
The last valuation of the obligation was performed by ARCH Actuarial Consulting as at 31 March 2018 using the projectedunit credit method. The next valuation of the employer's liability will be in March 2019. No plan assets are recognised,therefore the value of the unfunded liability is equal to the accrued liability.
41
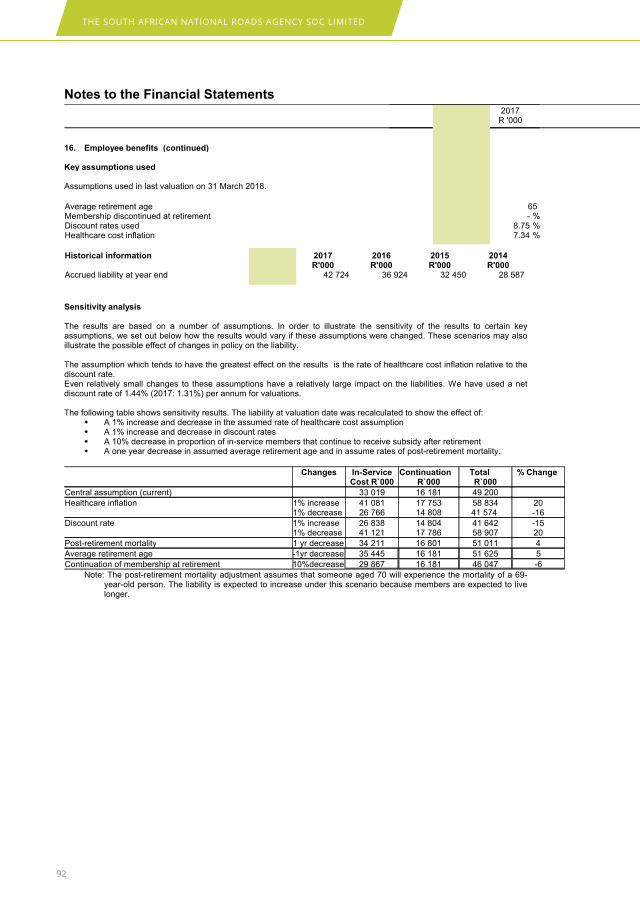
THE SOUTH AFRICAN NATIONAL ROADS AGENCY SOC LIMITED
92
South African National Roads Agency SOC Limited(Registration number 1998/009584/30)Financial Statements for the year ended 31 March 2018
Notes to the Financial Statements2018 2017
R '000 R '000
16. Employee benefits (continued)
Key assumptions used
Assumptions used in last valuation on 31 March 2018.
Average retirement age 65 65Membership discontinued at retirement %- %-Discount rates used %8.82 %8.75Healthcare cost inflation %7.28 %7.34
Historical information 2018R'000
2017R'000
2016R'000
2015R'000
2014R'000
Accrued liability at year end 49 200 42 724 36 924 32 450 28 587
Sensitivity analysis
The results are based on a number of assumptions. In order to illustrate the sensitivity of the results to certain keyassumptions, we set out below how the results would vary if these assumptions were changed. These scenarios may alsoillustrate the possible effect of changes in policy on the liability.
The assumption which tends to have the greatest effect on the results is the rate of healthcare cost inflation relative to thediscount rate.Even relatively small changes to these assumptions have a relatively large impact on the liabilities. We have used a netdiscount rate of 1.44% (2017: 1.31%) per annum for valuations.
The following table shows sensitivity results. The liability at valuation date was recalculated to show the effect of: A 1% increase and decrease in the assumed rate of healthcare cost assumption A 1% increase and decrease in discount rates A 10% decrease in proportion of in-service members that continue to receive subsidy after retirement A one year decrease in assumed average retirement age and in assume rates of post-retirement mortality.
Changes In-ServiceCost R`000
ContinuationR`000
TotalR`000
% Change
Central assumption (current) 33 019 16 181 49 200
Healthcare inflation 1% increase1% decrease
41 08126 766
17 75314 808
58 83441 574
20-16
Discount rate 1% increase1% decrease
26 83841 121
14 80417 786
41 64258 907
-1520
Post-retirement mortality 1 yr decrease 34 211 16 801 51 011 4
Average retirement age -1yr decrease 35 445 16 181 51 625 5
Continuation of membership at retirement 10%decrease 29 867 16 181 46 047 -6
Note: The post-retirement mortality adjustment assumes that someone aged 70 will experience the mortality of a 69-year-old person. The liability is expected to increase under this scenario because members are expected to livelonger.
42
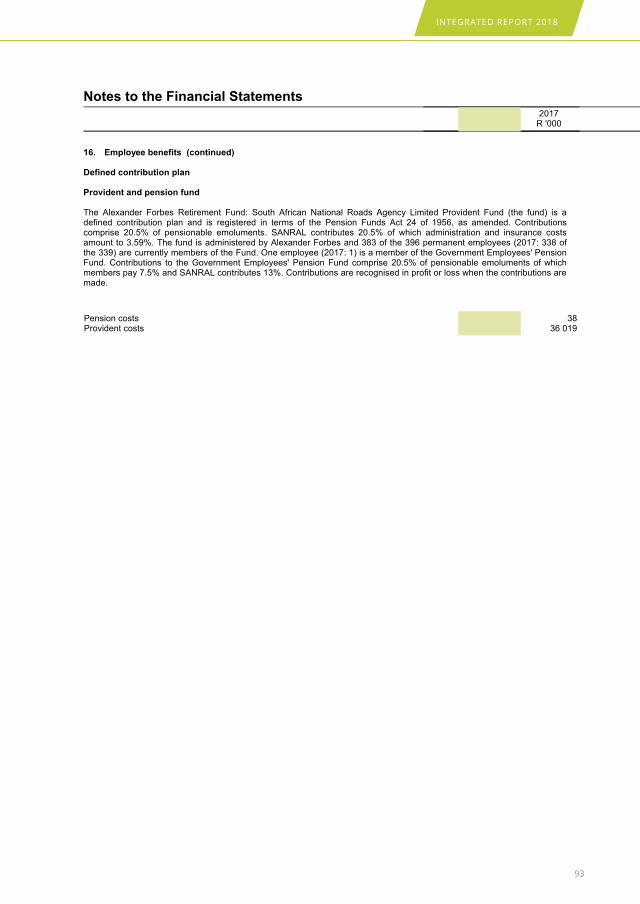
INTEGRATED REPORT 2018
93
South African National Roads Agency SOC Limited(Registration number 1998/009584/30)Financial Statements for the year ended 31 March 2018
Notes to the Financial Statements2018 2017
R '000 R '000
16. Employee benefits (continued)
Defined contribution plan
Provident and pension fund
The Alexander Forbes Retirement Fund: South African National Roads Agency Limited Provident Fund (the fund) is adefined contribution plan and is registered in terms of the Pension Funds Act 24 of 1956, as amended. Contributionscomprise 20.5% of pensionable emoluments. SANRAL contributes 20.5% of which administration and insurance costsamount to 3.59%. The fund is administered by Alexander Forbes and 383 of the 396 permanent employees (2017: 338 ofthe 339) are currently members of the Fund. One employee (2017: 1) is a member of the Government Employees' PensionFund. Contributions to the Government Employees' Pension Fund comprise 20.5% of pensionable emoluments of whichmembers pay 7.5% and SANRAL contributes 13%. Contributions are recognised in profit or loss when the contributions aremade.
Pension costs 42 38Provident costs 39 922 36 019
43
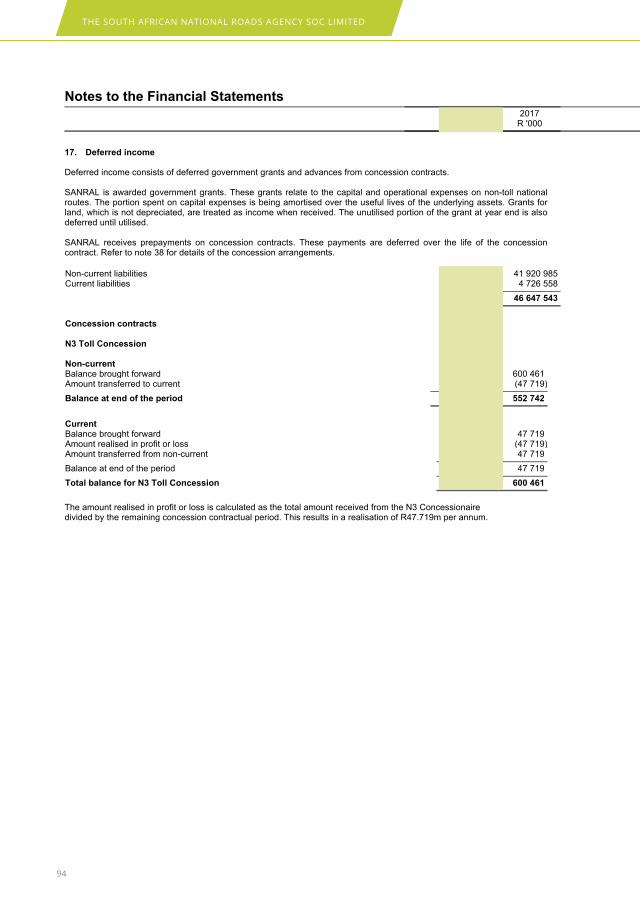
THE SOUTH AFRICAN NATIONAL ROADS AGENCY SOC LIMITED
94
South African National Roads Agency SOC Limited(Registration number 1998/009584/30)Financial Statements for the year ended 31 March 2018
Notes to the Financial Statements2018 2017
R '000 R '000
17. Deferred income
Deferred income consists of deferred government grants and advances from concession contracts.
SANRAL is awarded government grants. These grants relate to the capital and operational expenses on non-toll nationalroutes. The portion spent on capital expenses is being amortised over the useful lives of the underlying assets. Grants forland, which is not depreciated, are treated as income when received. The unutilised portion of the grant at year end is alsodeferred until utilised.
SANRAL receives prepayments on concession contracts. These payments are deferred over the life of the concessioncontract. Refer to note 38 for details of the concession arrangements.
Non-current liabilities 46 429 543 41 920 985Current liabilities 4 723 320 4 726 558
51 152 863 46 647 543
Concession contracts
N3 Toll Concession
Non-currentBalance brought forward 552 742 600 461Amount transferred to current (47 719) (47 719)
Balance at end of the period 505 023 552 742
CurrentBalance brought forward 47 719 47 719Amount realised in profit or loss (47 719) (47 719)Amount transferred from non-current 47 719 47 719
Balance at end of the period 47 719 47 719
Total balance for N3 Toll Concession 552 742 600 461
The amount realised in profit or loss is calculated as the total amount received from the N3 Concessionairedivided by the remaining concession contractual period. This results in a realisation of R47.719m per annum.
44
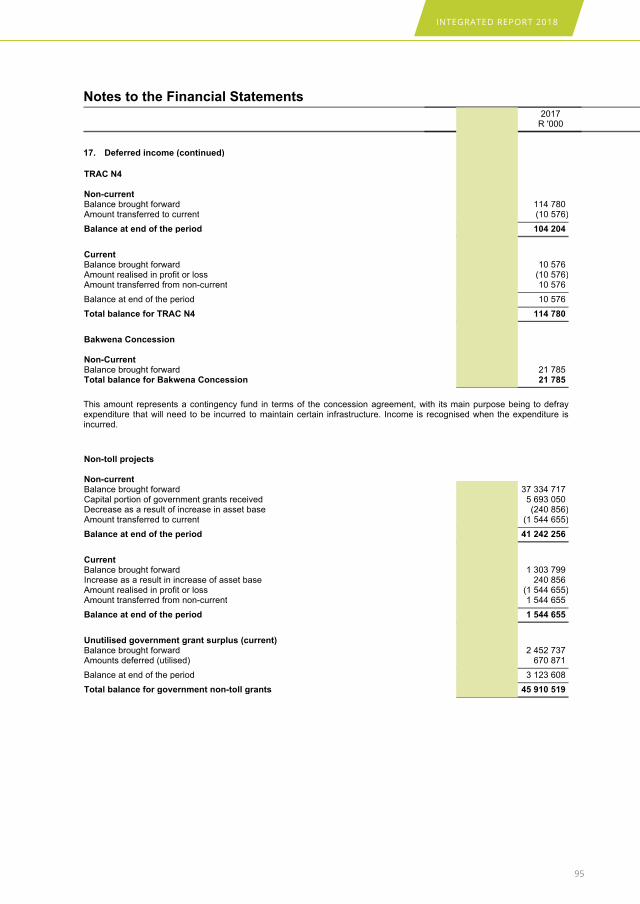
INTEGRATED REPORT 2018
95
South African National Roads Agency SOC Limited(Registration number 1998/009584/30)Financial Statements for the year ended 31 March 2018
Notes to the Financial Statements2018 2017
R '000 R '000
17. Deferred income (continued)
TRAC N4
Non-currentBalance brought forward 104 204 114 780Amount transferred to current (10 576) (10 576)
Balance at end of the period 93 628 104 204
CurrentBalance brought forward 10 576 10 576Amount realised in profit or loss (10 576) (10 576)Amount transferred from non-current 10 576 10 576
Balance at end of the period 10 576 10 576
Total balance for TRAC N4 104 204 114 780
Bakwena Concession
Non-CurrentBalance brought forward 21 785 21 785Total balance for Bakwena Concession 21 785 21 785
This amount represents a contingency fund in terms of the concession agreement, with its main purpose being to defrayexpenditure that will need to be incurred to maintain certain infrastructure. Income is recognised when the expenditure isincurred.
Non-toll projects
Non-currentBalance brought forward 41 242 256 37 334 717Capital portion of government grants received 6 360 912 5 693 050Decrease as a result of increase in asset base (124 702) (240 856)Amount transferred to current (1 669 357) (1 544 655)
Balance at end of the period 45 809 109 41 242 256
CurrentBalance brought forward 1 544 655 1 303 799Increase as a result in increase of asset base 124 703 240 856Amount realised in profit or loss (1 669 357) (1 544 655)Amount transferred from non-current 1 669 357 1 544 655
Balance at end of the period 1 669 358 1 544 655
Unutilised government grant surplus (current)Balance brought forward 3 123 608 2 452 737Amounts deferred (utilised) (127 941) 670 871
Balance at end of the period 2 995 667 3 123 608
Total balance for government non-toll grants 50 474 134 45 910 519
45
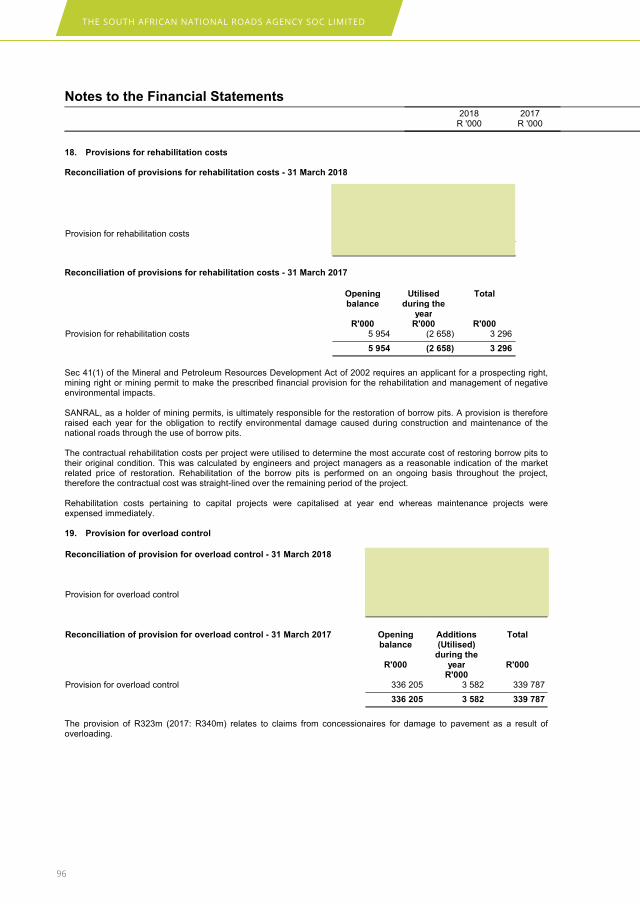
THE SOUTH AFRICAN NATIONAL ROADS AGENCY SOC LIMITED
96
South African National Roads Agency SOC Limited(Registration number 1998/009584/30)Financial Statements for the year ended 31 March 2018
Notes to the Financial Statements2018 2017
R '000 R '000
18. Provisions for rehabilitation costs
Reconciliation of provisions for rehabilitation costs - 31 March 2018
Openingbalance
R'000
Additions Total
R'000Provision for rehabilitation costs 3 296 181 3 477
3 296 181 3 477
Reconciliation of provisions for rehabilitation costs - 31 March 2017
Openingbalance
R'000
Utilisedduring the
yearR'000
Total
R'000Provision for rehabilitation costs 5 954 (2 658) 3 296
5 954 (2 658) 3 296
Sec 41(1) of the Mineral and Petroleum Resources Development Act of 2002 requires an applicant for a prospecting right,mining right or mining permit to make the prescribed financial provision for the rehabilitation and management of negativeenvironmental impacts.
SANRAL, as a holder of mining permits, is ultimately responsible for the restoration of borrow pits. A provision is thereforeraised each year for the obligation to rectify environmental damage caused during construction and maintenance of thenational roads through the use of borrow pits.
The contractual rehabilitation costs per project were utilised to determine the most accurate cost of restoring borrow pits totheir original condition. This was calculated by engineers and project managers as a reasonable indication of the marketrelated price of restoration. Rehabilitation of the borrow pits is performed on an ongoing basis throughout the project,therefore the contractual cost was straight-lined over the remaining period of the project.
Rehabilitation costs pertaining to capital projects were capitalised at year end whereas maintenance projects wereexpensed immediately.
19. Provision for overload control
Reconciliation of provision for overload control - 31 March 2018 Openingbalance
R'000
Utilisedduring the
yearR'000
Total
R'000Provision for overload control 339 787 (16 719) 323 068
339 787 (16 719) 323 068
Reconciliation of provision for overload control - 31 March 2017 Openingbalance
R'000
Additions(Utilised)
during theyear
R'000
Total
R'000
Provision for overload control 336 205 3 582 339 787
336 205 3 582 339 787
The provision of R323m (2017: R340m) relates to claims from concessionaires for damage to pavement as a result ofoverloading.
46
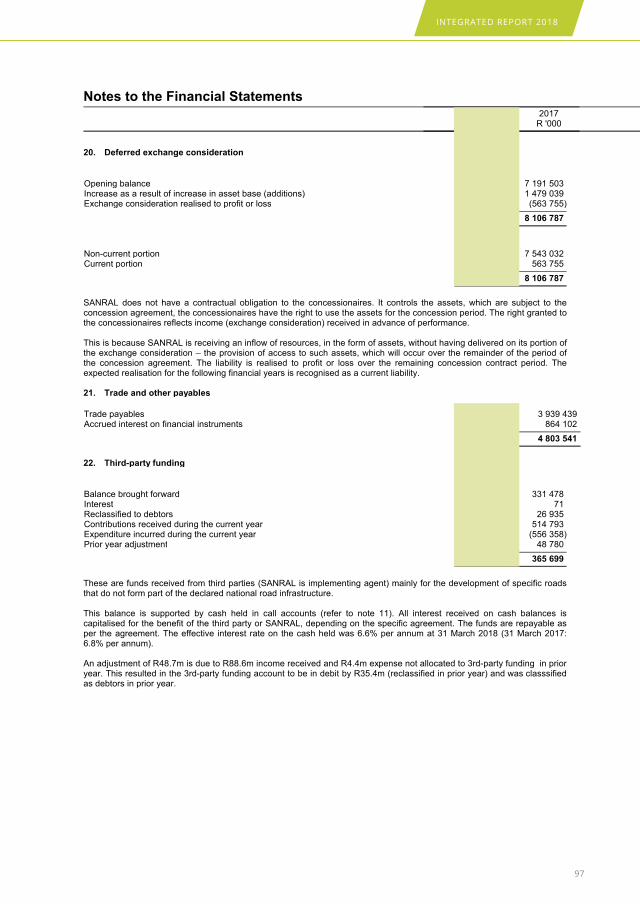
INTEGRATED REPORT 2018
97
South African National Roads Agency SOC Limited(Registration number 1998/009584/30)Financial Statements for the year ended 31 March 2018
Notes to the Financial Statements2018 2017
R '000 R '000
20. Deferred exchange consideration
Opening balance 8 106 787 7 191 503Increase as a result of increase in asset base (additions) 1 082 978 1 479 039Exchange consideration realised to profit or loss (548 238) (563 755)
8 641 527 8 106 787
Non-current portion 8 093 289 7 543 032Current portion 548 238 563 755
8 641 527 8 106 787
SANRAL does not have a contractual obligation to the concessionaires. It controls the assets, which are subject to theconcession agreement, the concessionaires have the right to use the assets for the concession period. The right granted tothe concessionaires reflects income (exchange consideration) received in advance of performance.
This is because SANRAL is receiving an inflow of resources, in the form of assets, without having delivered on its portion ofthe exchange consideration – the provision of access to such assets, which will occur over the remainder of the period ofthe concession agreement. The liability is realised to profit or loss over the remaining concession contract period. Theexpected realisation for the following financial years is recognised as a current liability.
21. Trade and other payables
Trade payables 4 710 449 3 939 439Accrued interest on financial instruments 1 087 192 864 102
5 797 641 4 803 541
22. Third-party funding
Balance brought forward 365 699 331 478Interest 74 71Reclassified to debtors - 26 935Contributions received during the current year 221 253 514 793Expenditure incurred during the current year (305 419) (556 358)Prior year adjustment - 48 780
281 607 365 699
These are funds received from third parties (SANRAL is implementing agent) mainly for the development of specific roadsthat do not form part of the declared national road infrastructure.
This balance is supported by cash held in call accounts (refer to note 11). All interest received on cash balances iscapitalised for the benefit of the third party or SANRAL, depending on the specific agreement. The funds are repayable asper the agreement. The effective interest rate on the cash held was 6.6% per annum at 31 March 2018 (31 March 2017:6.8% per annum).
An adjustment of R48.7m is due to R88.6m income received and R4.4m expense not allocated to 3rd-party funding in prioryear. This resulted in the 3rd-party funding account to be in debit by R35.4m (reclassified in prior year) and was classsifiedas debtors in prior year.
47
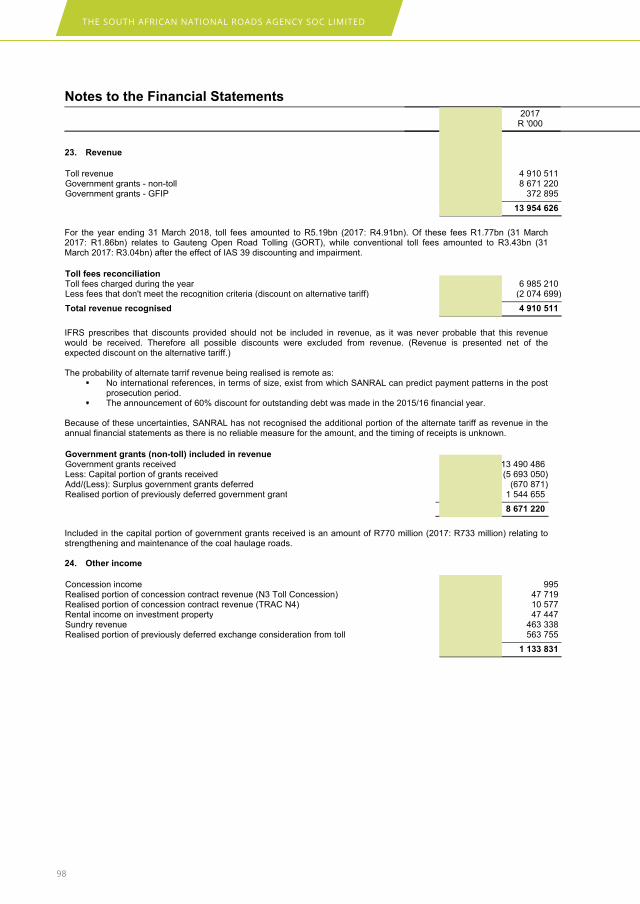
THE SOUTH AFRICAN NATIONAL ROADS AGENCY SOC LIMITED
98
South African National Roads Agency SOC Limited(Registration number 1998/009584/30)Financial Statements for the year ended 31 March 2018
Notes to the Financial Statements2018 2017
R '000 R '000
23. Revenue
Toll revenue 5 194 034 4 910 511Government grants - non-toll 9 017 849 8 671 220Government grants - GFIP 2 073 122 372 895
16 285 005 13 954 626
For the year ending 31 March 2018, toll fees amounted to R5.19bn (2017: R4.91bn). Of these fees R1.77bn (31 March2017: R1.86bn) relates to Gauteng Open Road Tolling (GORT), while conventional toll fees amounted to R3.43bn (31March 2017: R3.04bn) after the effect of IAS 39 discounting and impairment.
Toll fees reconciliationToll fees charged during the year 7 147 768 6 985 210Less fees that don't meet the recognition criteria (discount on alternative tariff) (1 953 734) (2 074 699)
Total revenue recognised 5 194 034 4 910 511
IFRS prescribes that discounts provided should not be included in revenue, as it was never probable that this revenuewould be received. Therefore all possible discounts were excluded from revenue. (Revenue is presented net of theexpected discount on the alternative tariff.)
The probability of alternate tarrif revenue being realised is remote as: No international references, in terms of size, exist from which SANRAL can predict payment patterns in the post
prosecution period. The announcement of 60% discount for outstanding debt was made in the 2015/16 financial year.
Because of these uncertainties, SANRAL has not recognised the additional portion of the alternate tariff as revenue in theannual financial statements as there is no reliable measure for the amount, and the timing of receipts is unknown.
Government grants (non-toll) included in revenueGovernment grants received 13 581 464 13 490 486Less: Capital portion of grants received (6 360 912) (5 693 050)Add/(Less): Surplus government grants deferred 127 941 (670 871)Realised portion of previously deferred government grant 1 669 357 1 544 655
9 017 850 8 671 220
Included in the capital portion of government grants received is an amount of R770 million (2017: R733 million) relating tostrengthening and maintenance of the coal haulage roads.
24. Other income
Concession income 87 957 995Realised portion of concession contract revenue (N3 Toll Concession) 47 719 47 719Realised portion of concession contract revenue (TRAC N4) 10 577 10 577Rental income on investment property 48 667 47 447Sundry revenue 316 497 463 338Realised portion of previously deferred exchange consideration from toll 548 238 563 755
1 059 655 1 133 831
48

INTEGRATED REPORT 2018
99
South African National Roads Agency SOC Limited(Registration number 1998/009584/30)Financial Statements for the year ended 31 March 2018
Notes to the Financial Statements2018 2017
R '000 R '000
25. Operating expenses
Operating profit (loss) for the year is stated after accounting for the following:
Technical and computer services 320 491 395 244Other administration 748 030 783 698Advertising 160 064 160 291Straight-lining of leases 12 259 14 384Amortisation on intangible assets 20 463 4 757Depreciation on property, plant and equipment 2 659 846 2 728 950Depreciation - concession assets 420 411 399 587Employee costs 312 308 268 379Repairs and maintenance of roads 6 983 998 8 538 175Auditors' remuneration 38 138 38 684Bank charges 20 024 98 665Director and management emoluments 31 062 27 573Impairment on PPE - 8 291Impairment for debtors 2 508 988 3 753 595Bad debts written off 17 612 33 105Loss on sale of assets 30 553 108 522Impairment on intangible assets 14 718 -
14 298 965 17 361 900
26. Investment income
Gains on financial instruments
Net change in fair value of financial assets at fair value through profit or loss 8 486 10 879Interest incomeInterest on bank deposits 615 203 660 810Interest income on repurchase agreements 87 608 208 411Short-term interest 17 259 24 641Interest income on financial assets at fair value through profit or loss 9 746 12 428Other interest income 2 832 5 206Interest on trade receivables and other 326 785 439 418
1 067 919 1 361 793
27. Finance costs
Net change in fair value on financial liabilities at fair value through profit or loss 207 465 31 570Interest on financial liabilities measured at amortised cost 3 868 165 4 174 331Interest on financial liabilities at fair value through profit and loss 443 516 463 670Borrowing costs capitalised for the year (162 405) (100 988)
4 356 741 4 568 583
The weighted average cost of capital of 9.43% (2017: 9.23%) was used as the capitalisation rate to determine the amountof borrowing costs eligible for capitalisation in the 2018 financial year. The accumulated borrowing costs capitalised toqualifying assets amounted to R904m (2017: R830m) at 31 March 2018.
28. Taxation
SANRAL was exempted from taxation in the Government Gazette of 22 December 2003 in terms of S10(1)(t)(iii) of IncomeTax Act, 1962. This exemption was backdated to the inception of the entity, therefore no provision has been made forincome tax.
49
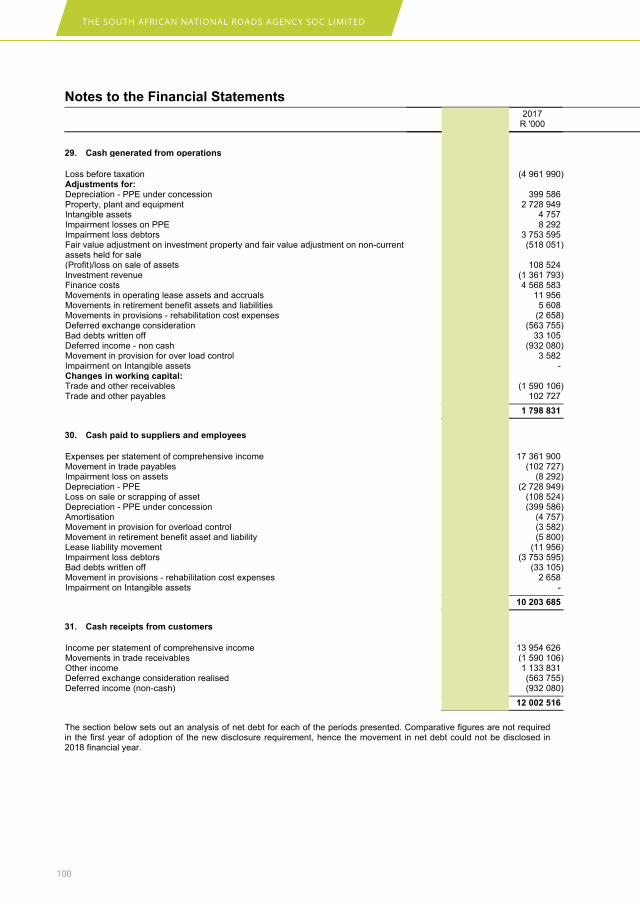
THE SOUTH AFRICAN NATIONAL ROADS AGENCY SOC LIMITED
100
South African National Roads Agency SOC Limited(Registration number 1998/009584/30)Financial Statements for the year ended 31 March 2018
Notes to the Financial Statements2018 2017
R '000 R '000
29. Cash generated from operations
Loss before taxation (260 358) (4 961 990)Adjustments for:Depreciation - PPE under concession 420 412 399 586Property, plant and equipment 2 659 846 2 728 949Intangible assets 20 463 4 757Impairment losses on PPE - 8 292Impairment loss debtors 2 508 988 3 753 595Fair value adjustment on investment property and fair value adjustment on non-currentassets held for sale
17 231 (518 051)
(Profit)/loss on sale of assets 30 553 108 524Investment revenue (1 067 919) (1 361 793)Finance costs 4 356 741 4 568 583Movements in operating lease assets and accruals (80) 11 956Movements in retirement benefit assets and liabilities 6 476 5 608Movements in provisions - rehabilitation cost expenses 181 (2 658)Deferred exchange consideration (548 238) (563 755)Bad debts written off 17 612 33 105Deferred income - non cash (1 855 592) (932 080)Movement in provision for over load control (16 719) 3 582Impairment on Intangible assets 14 718 -Changes in working capital:Trade and other receivables (1 714 072) (1 590 106)Trade and other payables (93 091) 102 727
4 497 152 1 798 831
30. Cash paid to suppliers and employees
Expenses per statement of comprehensive income 14 298 965 17 361 900Movement in trade payables 93 091 (102 727)Impairment loss on assets - (8 292)Depreciation - PPE (2 659 846) (2 728 949)Loss on sale or scrapping of asset (30 553) (108 524)Depreciation - PPE under concession (420 412) (399 586)Amortisation (20 463) (4 757)Movement in provision for overload control 16 719 (3 582)Movement in retirement benefit asset and liability (6 476) (5 800)Lease liability movement 80 (11 956)Impairment loss debtors (2 508 988) (3 753 595)Bad debts written off (17 612) (33 105)Movement in provisions - rehabilitation cost expenses (181) 2 658Impairment on Intangible assets (14 718) -
8 729 606 10 203 685
31. Cash receipts from customers
Income per statement of comprehensive income 16 285 005 13 954 626Movements in trade receivables (1 714 072) (1 590 106)Other income 1 059 655 1 133 831Deferred exchange consideration realised (548 238) (563 755)Deferred income (non-cash) (1 855 592) (932 080)
13 226 758 12 002 516
The section below sets out an analysis of net debt for each of the periods presented. Comparative figures are not requiredin the first year of adoption of the new disclosure requirement, hence the movement in net debt could not be disclosed in2018 financial year.
50

INTEGRATED REPORT 2018
101
South African National Roads Agency SOC Limited(Registration number 1998/009584/30)Financial Statements for the year ended 31 March 2018
Notes to the Financial Statements2018 2017
R '000 R '000
31. Cash receipts from customers (continued)
Net debt reconciliationCash and cash equivalents 7 646 576 6 570 000Liquid/current investments 42 800 317 157Less Borrowings – repayable within one year (including any overdraft) (4 200 963) (959 226)Less Borrowings – repayable after one year (45 908 214) (47 795 461)
(42 419 801) (41 867 530)
32. Capital portion of government grant and deferred income
N3 Trac concession contract realised in the statement of comprehensive income (47 719) (47 719)TRAC concession realised in the statement of comprehensive income (10 577) (10 577)Government grant (non-toll) charged to statement of comprehensive income (1 669 357) (1 544 655)Government grant (non-toll) realised in statement of comprehensive income (127 941) 670 871
Total income realised (1 855 594) (932 080)Movement in deferred income 8 216 506 6 625 130
6 360 912 5 693 050
Summary of capital portion of government grant receivedCapital portion of government grant - non-toll (note 17 and 23) 6 360 912 5 693 050
6 360 912 5 693 050
33. Commitments
Estimated capital expenditure
Contracts for capital expenditure authorised - toll 3 608 092 4 754 852 Contracts for capital expenditure authorised - non-toll 12 372 901 13 133 804
15 980 993 17 888 656
The expenditure will be financed from government grants, toll income and financial instruments issued to the private sectorand is expected to be incurred as follows:
Within one year - toll 1 400 073 2 148 125Within one year - non-toll 6 239 258 5 672 770Two years and beyond - toll 2 208 019 2 606 726Two years and beyond - non-toll 6 133 643 7 461 035
15 980 993 17 888 656
Operating leases – as lessee (expense)
Minimum lease payments dueWithin one year 10 655 10 715Two to five years and beyond 5 486 8 463
16 141 19 178
ETC leases kiosks under operating leases and pays the lessor on behalf of SANRAL. The operating lease rental includes acharge for rental, parking, fixed services and storage space. The lease contracts make provision for escalations annually,and renewal options if SANRAL wants to renew the lease at the end of the lease term.
51

THE SOUTH AFRICAN NATIONAL ROADS AGENCY SOC LIMITED
102
South African National Roads Agency SOC Limited(Registration number 1998/009584/30)Financial Statements for the year ended 31 March 2018
Notes to the Financial Statements2018 2017
R '000 R '000
34. Contingent liabilities
Claims against SANRAL due to South African National Road Agency Limited and National Road Act.
In terms of section 61 of the South African National Roads Agency Limited and National Roads Act, 1998, legal proceedingsinstituted against the then South African Roads Board with the cause of action arising before the incorporation date ofSANRAL must be instituted against the Minister of Transport as respondent. Due to the nature of these claims and the factthat judgments in these cases could be to the detriment of SANRAL, it was agreed (at the time of establishing SANRAL)that, although the actions be instituted against the Minister, SANRAL will bear the costs and be actively involved indefending such action.
Contingent liabilities estimated at R249.7m (2017: R275.69m) exist regarding possible claims against SANRAL, mainlyresulting from road related accidents. The outflow of cash is remote as during the past several years SANRAL has won themajority of the court cases. The cases that were not won by SANRAL were covered by insurance.
Claims against SANRAL due to the Municipality Property Rates Act
Individual municipalities have discretionary powers to levy rates on Public Service Infrastructure (PSI), including nationalroads, in terms of the Municipal Property Rates Act, No 6 of 2004. Not all municipalities have chosen to exercise thisstatutory power and some have not yet implemented the Act. The property rates used, as well as the valuation amount ofSANRAL's infrastructure, have not been determined by the municipalities. In order to arrive at an estimate of the potentialrates liability, nationally, actual rates levied by some municipalities were applied to the entire declared national roadnetwork, arriving at an estimated figure of R114.3m (2017: R47.8m).
Maputo Development Corridor
The concessionaire has claimed that the Mozambican government has not protected the pavement as stipulated in theconcession agreement. In their opinion, this has caused deterioration of the road significantly earlier than calculated bythem. In the event that such a claim succeeds and that compensation is due to the concessionaire, the Mozambicangovernment will become liable to compensate the concessionaire. In the event that the Mozambican government fails tocompensate the concessionaire according to the determined claim amount, the South African government throughSANRAL, will become liable for compensating the concessionaire in terms of the “mutually and severally liability” clauses inthe concession agreement. The value of the claim was estimated at R27.7m at 31 March 2018 (in 2017 the value could notbe reasonably established).
Non-adjustments of toll tariffs by Mozambique government
In terms of the N4/Maputo development corridor contract, the independent engineer shall determine the tariff adjustmentsamount within 14 days after having been called upon to do so in writing by the concessionaire. This has not been donewhich resulted in a revenue shortfall. At 31 March 2018, the value was estimated at R55.1m (2017: R10.5m) in the eventthat the Mozambican government fails to compensate the concessionaire according to the determined claim amount, theSouth African government through SANRAL, will become liable for compensating the concessionaire in terms of the“mutually and severally liability” clauses in the concession agreement.
Udumo trading Pty Ltd claim against SANRAL
Udumo Trading constructed pedestrian and cyclist facilities on the N12. SANRAL and Udumo Trading did not agree on thefinal payment certificate amount due to Udumo Trading and Udumo is suing SANRAL for R3. 3m. SANRAL is still waiting forthe outcome of the court case.
52
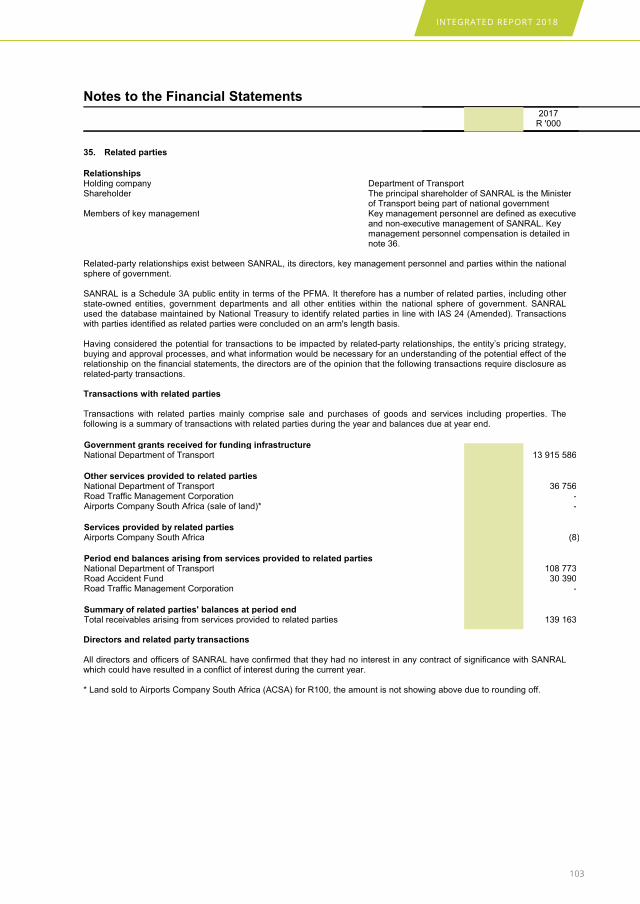
INTEGRATED REPORT 2018
103
South African National Roads Agency SOC Limited(Registration number 1998/009584/30)Financial Statements for the year ended 31 March 2018
Notes to the Financial Statements2018 2017
R '000 R '000
35. Related parties`
RelationshipsHolding company Department of TransportShareholder The principal shareholder of SANRAL is the Minister
of Transport being part of national governmentMembers of key management Key management personnel are defined as executive
and non-executive management of SANRAL. Keymanagement personnel compensation is detailed innote 36.
Related-party relationships exist between SANRAL, its directors, key management personnel and parties within the nationalsphere of government.
SANRAL is a Schedule 3A public entity in terms of the PFMA. It therefore has a number of related parties, including otherstate-owned entities, government departments and all other entities within the national sphere of government. SANRALused the database maintained by National Treasury to identify related parties in line with IAS 24 (Amended). Transactionswith parties identified as related parties were concluded on an arm's length basis.
Having considered the potential for transactions to be impacted by related-party relationships, the entity’s pricing strategy,buying and approval processes, and what information would be necessary for an understanding of the potential effect of therelationship on the financial statements, the directors are of the opinion that the following transactions require disclosure asrelated-party transactions.
Transactions with related parties
Transactions with related parties mainly comprise sale and purchases of goods and services including properties. Thefollowing is a summary of transactions with related parties during the year and balances due at year end.
Government grants received for funding infrastructureNational Department of Transport 15 944 823 13 915 586
Other services provided to related partiesNational Department of Transport 36 912 36 756Road Traffic Management Corporation 258 -Airports Company South Africa (sale of land)* - -
Services provided by related partiesAirports Company South Africa (3) (8)
Period end balances arising from services provided to related partiesNational Department of Transport 145 684 108 773Road Accident Fund 32 368 30 390Road Traffic Management Corporation 258 -
Summary of related parties' balances at period endTotal receivables arising from services provided to related parties 178 310 139 163
Directors and related party transactions
All directors and officers of SANRAL have confirmed that they had no interest in any contract of significance with SANRALwhich could have resulted in a conflict of interest during the current year.
* Land sold to Airports Company South Africa (ACSA) for R100, the amount is not showing above due to rounding off.
53
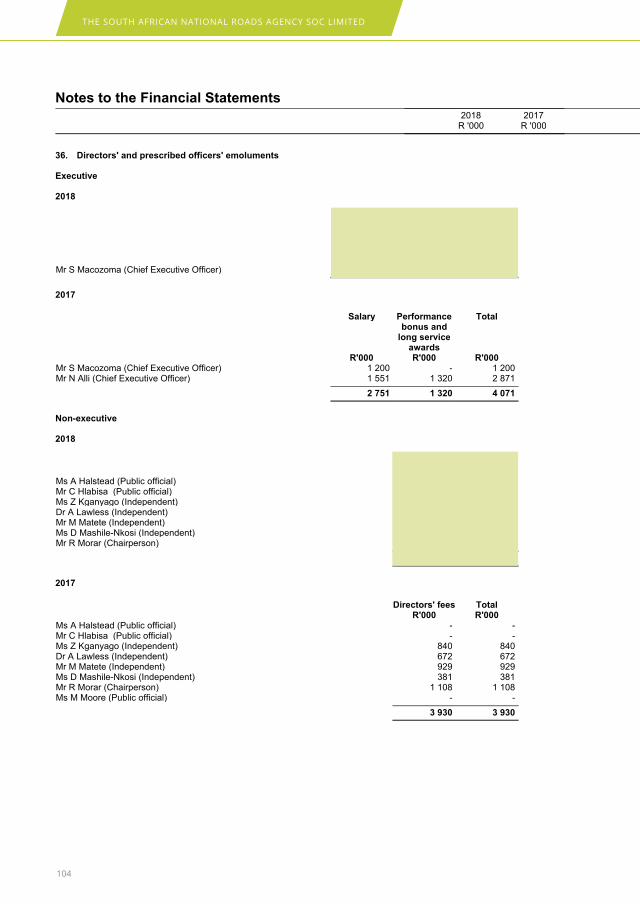
THE SOUTH AFRICAN NATIONAL ROADS AGENCY SOC LIMITED
104
South African National Roads Agency SOC Limited(Registration number 1998/009584/30)Financial Statements for the year ended 31 March 2018
Notes to the Financial Statements2018 2017
R '000 R '000
36. Directors' and prescribed officers' emoluments
Executive
2018
Salary
R'000
Performancebonus and
long serviceawardsR'000
Total
R'000Mr S Macozoma (Chief Executive Officer) 3 600 616 4 216
2017
Salary
R'000
Performancebonus and
long serviceawardsR'000
Total
R'000Mr S Macozoma (Chief Executive Officer) 1 200 - 1 200Mr N Alli (Chief Executive Officer) 1 551 1 320 2 871
2 751 1 320 4 071
Non-executive
2018
Directors' feesR'000
TotalR'000
Ms A Halstead (Public official) - -Mr C Hlabisa (Public official) - -Ms Z Kganyago (Independent) 697 697Dr A Lawless (Independent) 685 685Mr M Matete (Independent) 1 110 1 110Ms D Mashile-Nkosi (Independent) 508 508Mr R Morar (Chairperson) 1 116 1 116
4 116 4 116
2017
Directors' feesR'000
TotalR'000
Ms A Halstead (Public official) - -Mr C Hlabisa (Public official) - -Ms Z Kganyago (Independent) 840 840Dr A Lawless (Independent) 672 672Mr M Matete (Independent) 929 929Ms D Mashile-Nkosi (Independent) 381 381Mr R Morar (Chairperson) 1 108 1 108Ms M Moore (Public official) - -
3 930 3 930
54
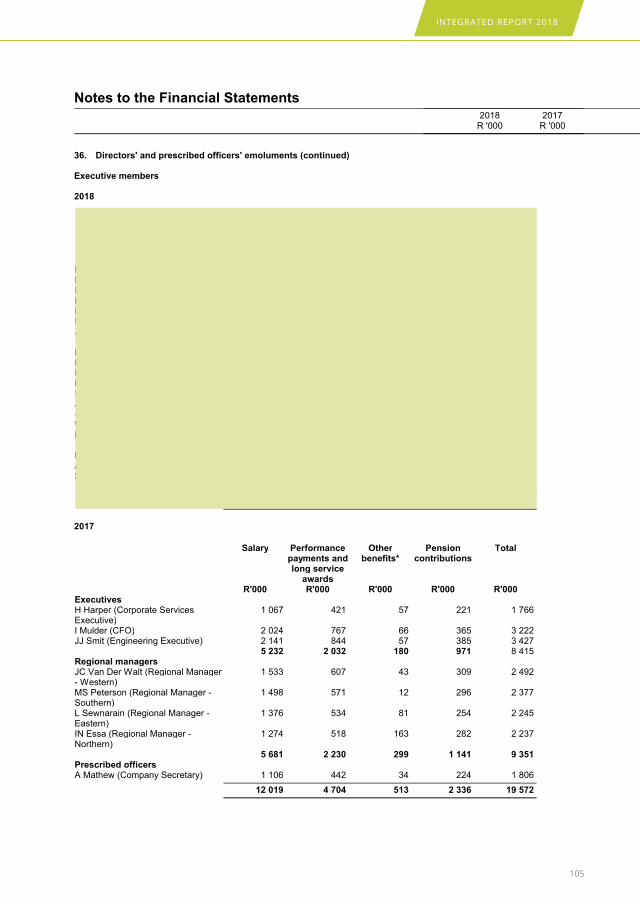
INTEGRATED REPORT 2018
105
South African National Roads Agency SOC Limited(Registration number 1998/009584/30)Financial Statements for the year ended 31 March 2018
Notes to the Financial Statements2018 2017
R '000 R '000
36. Directors' and prescribed officers' emoluments (continued)
Executive members
2018
Salary
R'000
Performancepayments andlong service
awardsR'000
Otherbenefits*
R'000
Pensioncontributions
R'000
Total
R'000ExecutivesH Harper (Corporate ServicesExecutive)
1 325 472 63 272 2 132
L Kannemeyer (EngineeringExecutive)
1 452 542 166 317 2 477
I Mulder (CFO) 2 204 825 72 397 3 498JJ Smit (Engineering Executive) 466 761 - - 1 227
5 447 2 600 301 986 9 334Regional managersL Sewnarain (Regional Manager -Eastern)
1 442 633 78 263 2 416
MS Peterson (Regional Manager -Southern)
1 716 678 12 339 2 745
JC Van Der Walt (Regional Manager- Western)
1 667 687 47 336 2 737
WS Van Der Merwe (Acting RegionalManager - Northern)
1 465 510 100 404 2 479
6 290 2 508 237 1 342 10 377Prescribed officersA Mathew (Company Secretary) 1 308 494 38 264 2 104SL Pitse (Chief Audit Executive) 553 - 10 98 661
1 861 494 48 362 2 765
13 598 5 602 586 2 690 22 476
2017
Salary
R'000
Performancepayments andlong service
awardsR'000
Otherbenefits*
R'000
Pensioncontributions
R'000
Total
R'000ExecutivesH Harper (Corporate ServicesExecutive)
1 067 421 57 221 1 766
I Mulder (CFO) 2 024 767 66 365 3 222JJ Smit (Engineering Executive) 2 141 844 57 385 3 427
5 232 2 032 180 971 8 415Regional managersJC Van Der Walt (Regional Manager- Western)
1 533 607 43 309 2 492
MS Peterson (Regional Manager -Southern)
1 498 571 12 296 2 377
L Sewnarain (Regional Manager -Eastern)
1 376 534 81 254 2 245
IN Essa (Regional Manager -Northern)
1 274 518 163 282 2 237
5 681 2 230 299 1 141 9 351Prescribed officersA Mathew (Company Secretary) 1 106 442 34 224 1 806
12 019 4 704 513 2 336 19 572
55
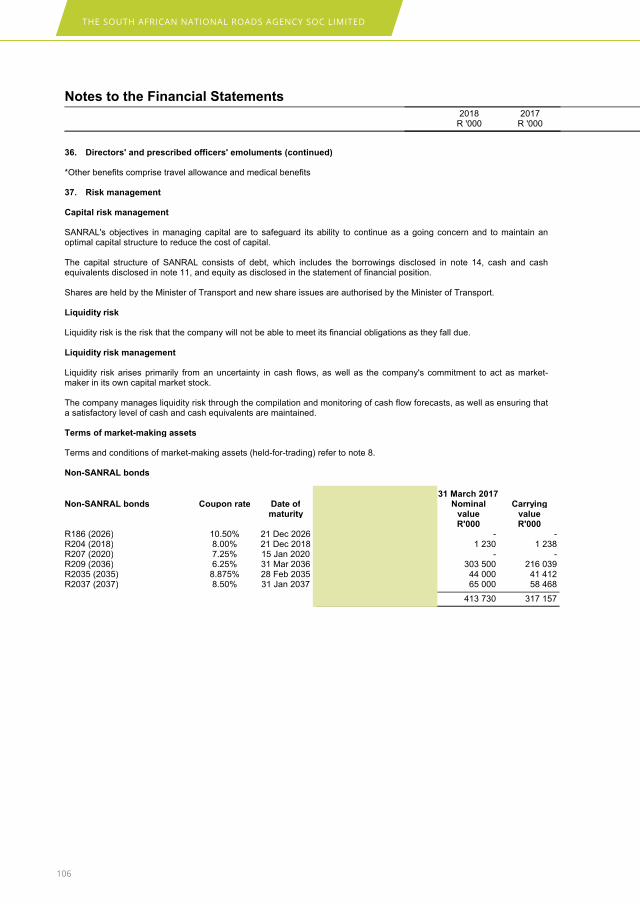
THE SOUTH AFRICAN NATIONAL ROADS AGENCY SOC LIMITED
106
South African National Roads Agency SOC Limited(Registration number 1998/009584/30)Financial Statements for the year ended 31 March 2018
Notes to the Financial Statements2018 2017
R '000 R '000
36. Directors' and prescribed officers' emoluments (continued)
*Other benefits comprise travel allowance and medical benefits
37. Risk management
Capital risk management
SANRAL's objectives in managing capital are to safeguard its ability to continue as a going concern and to maintain anoptimal capital structure to reduce the cost of capital.
The capital structure of SANRAL consists of debt, which includes the borrowings disclosed in note 14, cash and cashequivalents disclosed in note 11, and equity as disclosed in the statement of financial position.
Shares are held by the Minister of Transport and new share issues are authorised by the Minister of Transport.
Liquidity risk
Liquidity risk is the risk that the company will not be able to meet its financial obligations as they fall due.
Liquidity risk management
Liquidity risk arises primarily from an uncertainty in cash flows, as well as the company's commitment to act as market-maker in its own capital market stock.
The company manages liquidity risk through the compilation and monitoring of cash flow forecasts, as well as ensuring thata satisfactory level of cash and cash equivalents are maintained.
Terms of market-making assets
Terms and conditions of market-making assets (held-for-trading) refer to note 8.
Non-SANRAL bonds
`
31 March 2018 31 March 2017Non-SANRAL bonds Coupon rate Date of
maturityNominal
valueR'000
CarryingvalueR'000
NominalvalueR'000
CarryingvalueR'000
R186 (2026) 10.50% 21 Dec 2026 34 750 40 149 - -R204 (2018) 8.00% 21 Dec 2018 1 230 1 241 1 230 1 238R207 (2020) 7.25% 15 Jan 2020 1 400 1 410 - -R209 (2036) 6.25% 31 Mar 2036 - - 303 500 216 039R2035 (2035) 8.875% 28 Feb 2035 - - 44 000 41 412R2037 (2037) 8.50% 31 Jan 2037 - - 65 000 58 468
37 380 42 800 413 730 317 157
56

INTEGRATED REPORT 2018
107
South African National Roads Agency SOC Limited(Registration number 1998/009584/30)Financial Statements for the year ended 31 March 2018
Notes to the Financial Statements
37. Risk management (continued)
Terms of market-making liability (non-SANRAL) bonds
Refer to note 14 for terms and conditions of market-making liabilities.
`
31 March 2018 31 March 2017Non-SANRAL bonds Coupon rate Date of
maturityNominal
valueR'000
CarryingvalueR'000
NominalvalueR'000
CarryingvalueR'000
R186 (2026) 10.50% 21 Dec 2026 - - 176 900 195 757R207 (2020) 7.25% 15 Jan 2020 - - 56 600 55 900R209 (2036) 6.25% 31 Mar 2036 76 500 59 437 - -
76 500 59 437 233 500 251 657
Funding portfolio at amortised cost and at fair value
Terms and conditions of outstanding loans are reflected in the table that follows. For further terms and conditions refer tonote 14.
31 March 2018 31 March 2017Funding portfolio atamortised cost
Guaranteed bonds
Coupon rate Date ofmaturity
NominalvalueR'000
CarryingvalueR'000
NominalvalueR'000
CarryingvalueR'000
SZ25 9,00% 30 Sep 2025 2 432 784 2 458 963 2 432 784 2 461 515HWAY20 9,75% 31 Jul 2020 5 781 300 5 828 800 5 781 300 5 846 712HWAY23 5,50%+CPI 07 Dec 2023 2 917 353 8 614 638 2 917 353 8 413 856HWAY24 5,50%+CPI 07 Dec 2024 1 499 000 4 594 793 1 499 000 4 491 577HWAY33 2,25%+CPI 28 Feb 2023 1 401 000 1 536 429 1 401 000 1 464 872HWAY34 9,25% 31 Jul 2034 4 065 800 3 975 651 4 065 800 3 973 503HWAY35 9,25% 31 Jul 2035 1 544 000 1 511 413 1 544 000 1 510 797HWF08 8,79% 15 Jul 2019 1 000 000 997 806 1 000 000 1 000 387HWF09 8,79% 19 Sep 2019 1 838 000 1 832 087 1 838 000 1 836 908HWF010U 8,90% 30 Sep 2019 700 000 698 055 700 000 699 745Unguaranteed bondsNRA18 12,25% 30 Nov 2018 2 385 623 2 404 820 2 390 623 2 437 477NRA22 12,25% 31 Oct 2022 2 623 000 2 753 322 2 623 000 2 774 703NRA23 5,00%+CPI 31 May 2023 889 750 1 577 771 909 750 1 557 395NRA28 12,25% 30 Nov 2028 3 676 769 4 030 640 3 476 769 3 828 730
32 754 379 42 815 188 32 579 379 42 298 177
57
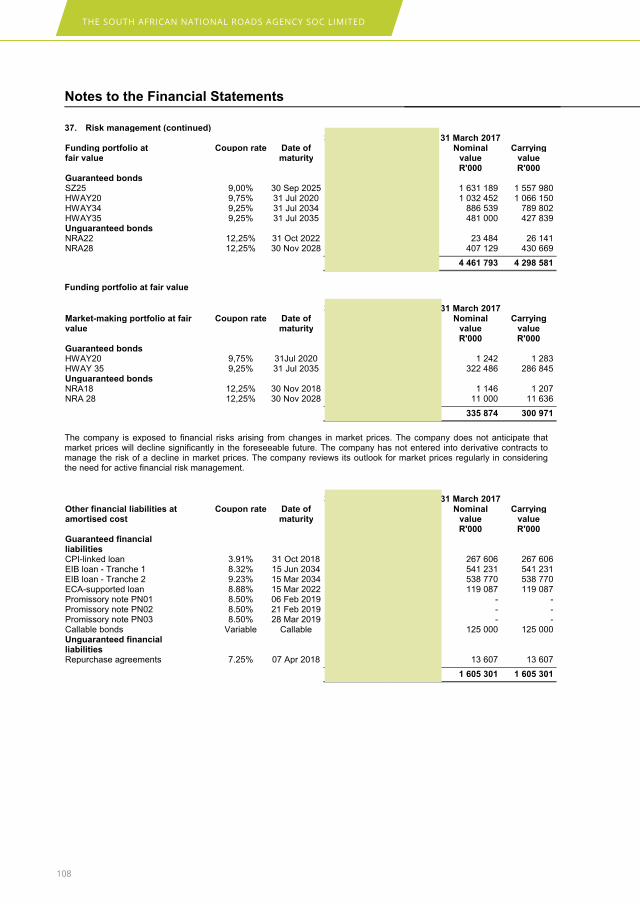
THE SOUTH AFRICAN NATIONAL ROADS AGENCY SOC LIMITED
108
South African National Roads Agency SOC Limited(Registration number 1998/009584/30)Financial Statements for the year ended 31 March 2018
Notes to the Financial Statements
37. Risk management (continued)31 March 2018 31 March 2017
Funding portfolio atfair value
Guaranteed bonds
Coupon rate Date ofmaturity
NominalvalueR'000
CarryingvalueR'000
NominalvalueR'000
CarryingvalueR'000
SZ25 9,00% 30 Sep 2025 1 610 095 1 609 221 1 631 189 1 557 980HWAY20 9,75% 31 Jul 2020 951 863 990 000 1 032 452 1 066 150HWAY34 9,25% 31 Jul 2034 728 403 690 919 886 539 789 802HWAY35 9,25% 31 Jul 2035 561 000 533 214 481 000 427 839Unguaranteed bondsNRA22 12,25% 31 Oct 2022 22 688 25 670 23 484 26 141NRA28 12,25% 30 Nov 2028 552 549 613 968 407 129 430 669
4 426 598 4 462 992 4 461 793 4 298 581
Funding portfolio at fair value
31 March 2018 31 March 2017Market-making portfolio at fairvalue
Guaranteed bonds
Coupon rate Date ofmaturity
NominalvalueR'000
CarryingvalueR'000
NominalvalueR'000
CarryingvalueR'000
HWAY20 9,75% 31Jul 2020 12 455 12 954 1 242 1 283HWAY 35 9,25% 31 Jul 2035 216 051 205 351 322 486 286 845Unguaranteed bondsNRA18 12,25% 30 Nov 2018 877 901 1 146 1 207NRA 28 12,25% 30 Nov 2028 - - 11 000 11 636
229 383 219 206 335 874 300 971
The company is exposed to financial risks arising from changes in market prices. The company does not anticipate thatmarket prices will decline significantly in the foreseeable future. The company has not entered into derivative contracts tomanage the risk of a decline in market prices. The company reviews its outlook for market prices regularly in consideringthe need for active financial risk management.
31 March 2018 31 March 2017Other financial liabilities atamortised cost
Guaranteed financialliabilities
Coupon rate Date ofmaturity
NominalvalueR'000
CarryingvalueR'000
NominalvalueR'000
CarryingvalueR'000
CPI-linked loan 3.91% 31 Oct 2018 78 308 78 308 267 606 267 606EIB loan - Tranche 1 8.32% 15 Jun 2034 526 696 526 696 541 231 541 231EIB loan - Tranche 2 9.23% 15 Mar 2034 524 776 524 776 538 770 538 770ECA-supported loan 8.88% 15 Mar 2022 66 777 66 777 119 087 119 087Promissory note PN01 8.50% 06 Feb 2019 510 000 475 558 - -Promissory note PN02 8.50% 21 Feb 2019 550 000 511 191 - -Promissory note PN03 8.50% 28 Mar 2019 164 000 151 282 - -Callable bonds Variable Callable 212 000 212 000 125 000 125 000Unguaranteed financialliabilitiesRepurchase agreements 7.25% 07 Apr 2018 5 768 5 768 13 607 13 607
2 638 325 2 552 356 1 605 301 1 605 301
58
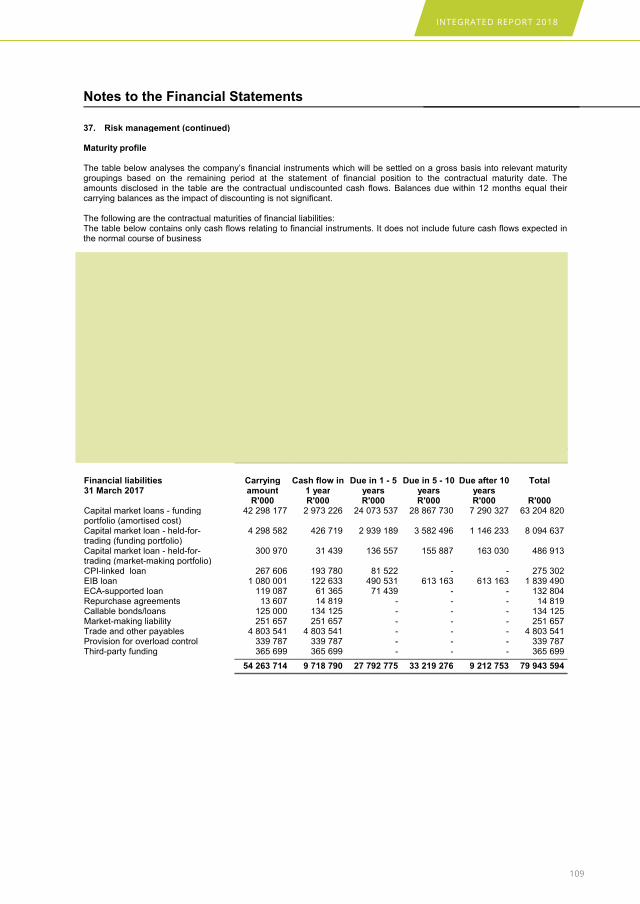
INTEGRATED REPORT 2018
109
South African National Roads Agency SOC Limited(Registration number 1998/009584/30)Financial Statements for the year ended 31 March 2018
Notes to the Financial Statements
37. Risk management (continued)
Maturity profile
The table below analyses the company’s financial instruments which will be settled on a gross basis into relevant maturitygroupings based on the remaining period at the statement of financial position to the contractual maturity date. Theamounts disclosed in the table are the contractual undiscounted cash flows. Balances due within 12 months equal theircarrying balances as the impact of discounting is not significant.
The following are the contractual maturities of financial liabilities:The table below contains only cash flows relating to financial instruments. It does not include future cash flows expected inthe normal course of business
Financial liabilities31 March 2018
CarryingamountR'000
Cash flow in1 yearR'000
Due in 1 - 5yearsR'000
Due in 5 - 10yearsR'000
Due after 10yearsR'000
Total
R'000Capital market loans - amortisedcost (funding portfolio)
42 815 186 4 991 544 20 172 768 23 053 535 8 616 309 56 834 156
Capital market loans - held-for-trading (funding portfolio)
4 462 992 427 451 2 476 665 2 906 079 1 255 380 7 065 575
Capital market loans - held-for-trading (market-making portfolio)
219 206 22 172 94 510 99 924 99 924 316 530
CPI-linked loan 78 308 79 370 - - - 79 370EIB loan 1 051 472 122 633 490 531 613 163 613 163 1 839 490ECA-supported loan 66 777 56 507 14 821 - - 71 328Promissory notes 1 138 031 1 230 548 - - - 1 230 548Repurchase agreements 5 768 6 186 - - - 6 186Callable loans 212 000 226 734 - - - 226 734Market-making liability 59 437 59 437 - - - 59 437Provision for overload control 323 068 323 068 - - - 323 068Third-party funding 281 607 281 607 - - - 281 607Trade and other payables 5 797 641 5 797 641 - - - 5 797 641
56 511 493 13 624 898 23 249 295 26 672 701 10 584 776 74 131 670
Financial liabilities31 March 2017
CarryingamountR'000
Cash flow in1 yearR'000
Due in 1 - 5yearsR'000
Due in 5 - 10yearsR'000
Due after 10yearsR'000
Total
R'000Capital market loans - fundingportfolio (amortised cost)
42 298 177 2 973 226 24 073 537 28 867 730 7 290 327 63 204 820
Capital market loan - held-for-trading (funding portfolio)
4 298 582 426 719 2 939 189 3 582 496 1 146 233 8 094 637
Capital market loan - held-for-trading (market-making portfolio)
300 970 31 439 136 557 155 887 163 030 486 913
CPI-linked loan 267 606 193 780 81 522 - - 275 302EIB loan 1 080 001 122 633 490 531 613 163 613 163 1 839 490ECA-supported loan 119 087 61 365 71 439 - - 132 804Repurchase agreements 13 607 14 819 - - - 14 819Callable bonds/loans 125 000 134 125 - - - 134 125Market-making liability 251 657 251 657 - - - 251 657Trade and other payables 4 803 541 4 803 541 - - - 4 803 541Provision for overload control 339 787 339 787 - - - 339 787Third-party funding 365 699 365 699 - - - 365 699
54 263 714 9 718 790 27 792 775 33 219 276 9 212 753 79 943 594
59
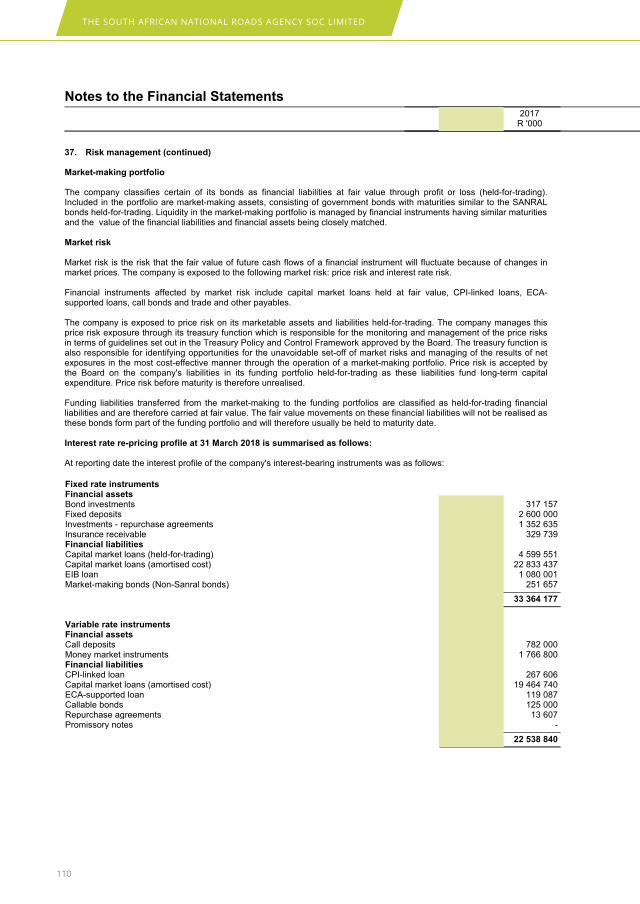
THE SOUTH AFRICAN NATIONAL ROADS AGENCY SOC LIMITED
110
South African National Roads Agency SOC Limited(Registration number 1998/009584/30)Financial Statements for the year ended 31 March 2018
Notes to the Financial Statements2018 2017
R '000 R '000
37. Risk management (continued)
Market-making portfolio
The company classifies certain of its bonds as financial liabilities at fair value through profit or loss (held-for-trading).Included in the portfolio are market-making assets, consisting of government bonds with maturities similar to the SANRALbonds held-for-trading. Liquidity in the market-making portfolio is managed by financial instruments having similar maturitiesand the value of the financial liabilities and financial assets being closely matched.
Market risk
Market risk is the risk that the fair value of future cash flows of a financial instrument will fluctuate because of changes inmarket prices. The company is exposed to the following market risk: price risk and interest rate risk.
Financial instruments affected by market risk include capital market loans held at fair value, CPI-linked loans, ECA-supported loans, call bonds and trade and other payables.
The company is exposed to price risk on its marketable assets and liabilities held-for-trading. The company manages thisprice risk exposure through its treasury function which is responsible for the monitoring and management of the price risksin terms of guidelines set out in the Treasury Policy and Control Framework approved by the Board. The treasury function isalso responsible for identifying opportunities for the unavoidable set-off of market risks and managing of the results of netexposures in the most cost-effective manner through the operation of a market-making portfolio. Price risk is accepted bythe Board on the company's liabilities in its funding portfolio held-for-trading as these liabilities fund long-term capitalexpenditure. Price risk before maturity is therefore unrealised.
Funding liabilities transferred from the market-making to the funding portfolios are classified as held-for-trading financialliabilities and are therefore carried at fair value. The fair value movements on these financial liabilities will not be realised asthese bonds form part of the funding portfolio and will therefore usually be held to maturity date.
Interest rate re-pricing profile at 31 March 2018 is summarised as follows:
At reporting date the interest profile of the company's interest-bearing instruments was as follows:
Fixed rate instrumentsFinancial assetsBond investments 42 800 317 157Fixed deposits 3 000 000 2 600 000Investments - repurchase agreements 611 694 1 352 635Insurance receivable 372 562 329 739Financial liabilitiesCapital market loans (held-for-trading) 4 682 198 4 599 551Capital market loans (amortised cost) 22 963 608 22 833 437EIB loan 1 051 472 1 080 001Market-making bonds (Non-Sanral bonds) 59 437 251 657
32 783 771 33 364 177
Variable rate instrumentsFinancial assetsCall deposits 2 190 000 782 000Money market instruments 1 767 178 1 766 800Financial liabilitiesCPI-linked loan 78 308 267 606Capital market loans (amortised cost) 19 851 578 19 464 740ECA-supported loan 66 777 119 087Callable bonds 212 000 125 000Repurchase agreements 5 768 13 607Promissory notes 1 138 031 -
25 309 640 22 538 840
60

INTEGRATED REPORT 2018
111
South African National Roads Agency SOC Limited(Registration number 1998/009584/30)Financial Statements for the year ended 31 March 2018
Notes to the Financial Statements2018 2017
R '000 R '000
37. Risk management (continued)
Price risk sensitivity of variable rate instruments
An increase of 100 basis points (2017: 100 basis points) in interest rates at the reporting date would decrease profit by theamounts shown below. A decrease in 100 basis points would increase profit by the same amount. The analysis assumesthat all other variables remain constant. Variable rate instruments are capital market bonds held in the funding portfolio,loans held in the funding portfolio, market-making portfolio held-for-trading and variable rate money market instruments.
100 basis points increase (effect on profit or loss) 243 700 247 609
Credit risk
Credit risk is the risk of financial loss to the company if a customer or counterparty to a financial instrument fails to meet itscontractual obligations leading to financial loss.
Credit risk consists mainly in cash deposits, cash equivalents, financial instruments and trade debtors. The company onlydeposits cash with banks with good credits and limits exposure to any one single counter-party. Credit exposure to anycounterparty is managed by setting transaction exposure limits, as authorised by the Asset and Liability Committee. Thecredit qualities of counterparties are also reviewed on a continuous basis.
Ongoing credit evaluations are performed on the financial condition of receivable counterparties. Trade receivables arepresented net of the allowance for impairment.
The company is exposed to credit-related losses in the event of non-performance by counterparties of capital marketinvestments as well as a price risk in the event of the downgrading of their credit rating. Capital market investments are heldwith counterparties who have a short-term credit rating of A1 and above and/or a long-term credit rating of A and above.SANRAL continually monitors its positions and the credit ratings of its counterparties, and limits the extent to which it entersinto contracts with any one party.
Exposure to credit risk
The carrying amount of financial assets represents the maximum credit exposure. For the fair values of the financialinstruments refer to the fair values analysis in note 41. The maximum exposure to credit risk at the reporting date was:
`
Market-making investments - bonds 42 800 317 157Insurance receivable 372 562 329 739Trade and other receivables 4 801 036 5 331 424Cash and cash equivalents 7 646 576 6 570 000
Concentrations of credit risk ValueR'000
Percentage%
ValueR'000
Percentage%
Market-making investments - bonds 42 800 - 317 157 2Insurance receivable 372 562 3 329 739 3Trade and other receivables 4 801 036 37 5 331 424 42Cash and cash equivalents 7 646 576 60 6 570 000 53
12 862 974 100 12 548 320 100
At 31 March 2018, the company did not consider there to be any significant concentration of credit risk that had not beeninsured or adequately provided for.
Collateral is held against repurchase investments in the form of government or corporate bonds approved by the Assets andLiabilities Committee. Repurchase and bond investments are held with counterparties with a minimum of an A rating.
Property portfolioThe maximum exposure to credit risk relating to the rental receivables at the reporting date by geographic region was:
61
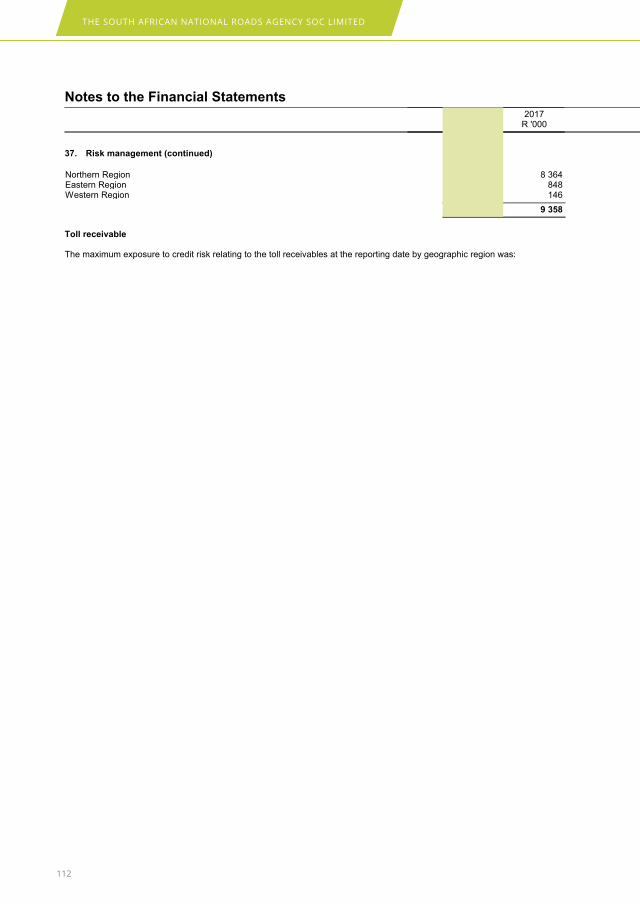
THE SOUTH AFRICAN NATIONAL ROADS AGENCY SOC LIMITED
112
South African National Roads Agency SOC Limited(Registration number 1998/009584/30)Financial Statements for the year ended 31 March 2018
Notes to the Financial Statements2018 2017
R '000 R '000
37. Risk management (continued)
Northern Region 2 730 8 364Eastern Region 1 871 848Western Region 146 146
4 747 9 358
Toll receivable
The maximum exposure to credit risk relating to the toll receivables at the reporting date by geographic region was:
62

INTEGRATED REPORT 2018
113
South African National Roads Agency SOC Limited(Registration number 1998/009584/30)Financial Statements for the year ended 31 March 2018
Notes to the Financial Statements2018 2017
R '000 R '000
37. Risk management (continued)Northern Region 10 840 403 8 798 399
Sundry debtors
The maximum exposure to credit risk relating to the sundry debtors at the reporting date by geographic region was:
Northern Region 52 945 120 580Eastern Region 22 870 8 197Western Region 7 827 36 173Southern Region 111 885 111 874Head office 166 434 109 210
361 961 386 034
Past due analysis
The ageing of property portfolio (rental receivables) at the reporting date was:
GrossR'000
ImpairmentR'000
GrossR'000
ImpairmentR'000
Due 1 to 30 days 1 666 - 644 (73)Past due 31 - 60 days 2 190 - 171 (77)Past due 61 - 90 days 61 - 817 (52)Past due 91 - 120 days 61 (57) 119 (53)More than 120 days 769 (769) 7 607 (300)
4 747 (826) 9 358 (555)
The ageing of toll receivables at the reporting date was
GrossR'000
ImpairmentR'000
GrossR'000
ImpairmentR'000
0 - 30 days 736 156 - 1 723 916 -Past due 31 - 60 days 152 352 (5 544) 268 516 -Past due 61 - 90 days 149 560 (3 172) 323 089 -More than 91 days 9 802 335 (4 784 055) 6 482 878 (3 523 465)
10 840 403 (4 792 771) 8 798 399 (3 523 465)
The ageing of sundry debtors at the reporting date was:
GrossR'000
ImpairmentR'000
GrossR'000
ImpairmentR'000
0 - 30 days 13 385 - 134 050 -Past due 31 - 60 days 44 835 - 13 900 -Past due 61 - 120 days 121 - 88 -More than 120 days 303 620 (298 087) 237 996 (230 130)
361 961 (298 087) 386 034 (230 130)
The movement in the allowance for impairment in respect of rental receivables during the year was as follows:
Balance 1 April 555 421Impairment loss recognised 318 139Bad debt written off (46) (5)
827 555
63
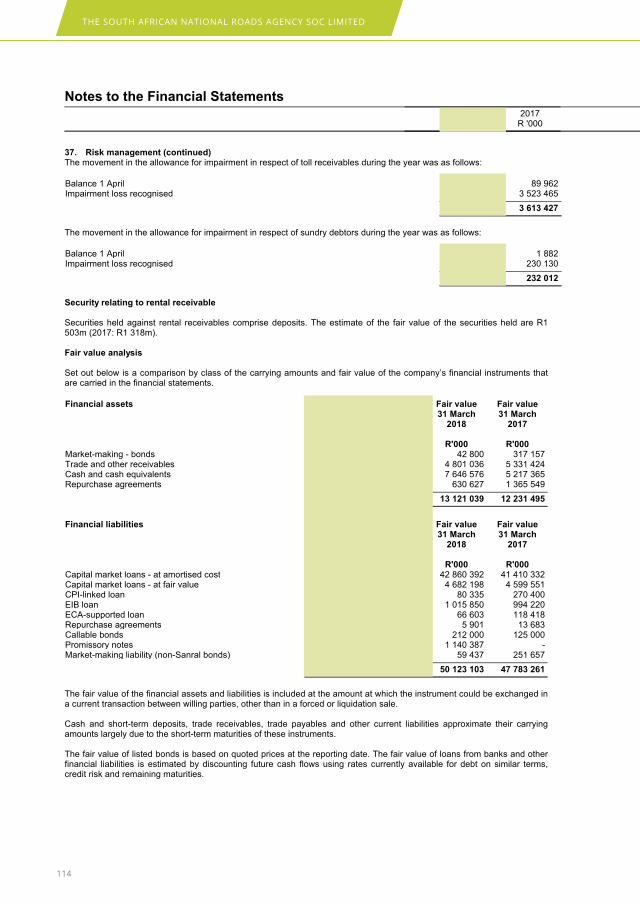
THE SOUTH AFRICAN NATIONAL ROADS AGENCY SOC LIMITED
114
South African National Roads Agency SOC Limited(Registration number 1998/009584/30)Financial Statements for the year ended 31 March 2018
Notes to the Financial Statements2018 2017
R '000 R '000
37. Risk management (continued)The movement in the allowance for impairment in respect of toll receivables during the year was as follows:
Balance 1 April 3 613 427 89 962Impairment loss recognised 2 442 643 3 523 465
6 056 070 3 613 427
The movement in the allowance for impairment in respect of sundry debtors during the year was as follows:
Balance 1 April 232 012 1 882Impairment loss recognised 66 075 230 130
298 087 232 012
Security relating to rental receivable
Securities held against rental receivables comprise deposits. The estimate of the fair value of the securities held are R1503m (2017: R1 318m).
Fair value analysis
Set out below is a comparison by class of the carrying amounts and fair value of the company’s financial instruments thatare carried in the financial statements.
Financial assets Carryingvalues
31 March2018R'000
Carryingvalues
31 March2017R'000
Fair value31 March
2018
R'000
Fair value31 March
2017
R'000Market-making - bonds 42 800 317 157 42 800 317 157Trade and other receivables 4 801 036 5 331 424 4 801 036 5 331 424Cash and cash equivalents 7 646 576 5 217 365 7 646 576 5 217 365Repurchase agreements 611 694 1 352 635 630 627 1 365 549
13 102 106 12 218 581 13 121 039 12 231 495
Financial liabilities Carryingvalues
31 March2018R'000
Carryingvalues
31 March2017R'000
Fair value31 March
2018
R'000
Fair value31 March
2017
R'000Capital market loans - at amortised cost 42 815 186 42 298 177 42 860 392 41 410 332Capital market loans - at fair value 4 682 198 4 599 551 4 682 198 4 599 551CPI-linked loan 78 308 267 606 80 335 270 400EIB loan 1 051 472 1 080 001 1 015 850 994 220ECA-supported loan 66 777 119 087 66 603 118 418Repurchase agreements 5 768 13 607 5 901 13 683Callable bonds 212 000 125 000 212 000 125 000Promissory notes 1 138 031 - 1 140 387 -Market-making liability (non-Sanral bonds) 59 437 233 500 59 437 251 657
50 109 177 48 736 529 50 123 103 47 783 261
The fair value of the financial assets and liabilities is included at the amount at which the instrument could be exchanged ina current transaction between willing parties, other than in a forced or liquidation sale.
Cash and short-term deposits, trade receivables, trade payables and other current liabilities approximate their carryingamounts largely due to the short-term maturities of these instruments.
The fair value of listed bonds is based on quoted prices at the reporting date. The fair value of loans from banks and otherfinancial liabilities is estimated by discounting future cash flows using rates currently available for debt on similar terms,credit risk and remaining maturities.
64

INTEGRATED REPORT 2018
115
South African National Roads Agency SOC Limited(Registration number 1998/009584/30)Financial Statements for the year ended 31 March 2018
Notes to the Financial Statements
38. Public private partnerships - toll collection service concession arrangements
Description of the arrangements
SANRAL contracted partners in the private sector (concession contracts) as an alternative means for long term financing,operating, maintaining and improving national road network infrastructure, with cost being recovered through toll chargeslevied. Currently there are three concessions; N3 Toll Concession RF Pty Ltd (N3TC), N1/ N4 Bakwena Platinum CorridorConcessionaire (Bakwena) and N4 Trans African Concessions (TRAC). Under these contracts, each concessionaire isresponsible for the design, financing, construction, maintaining and operating its contracted/specified portion of the roadnetwork:.
Bakwena is responsible for the toll road between Pretoria and Bela-Bela on N1 highway and Pretoria and Botswana borderpost on N4 west for a period of 30 years ending August 2031 . Bakwena is also contracted for the Trans-Kalahari Highwaybetween Walvis bay and Maputo. N3TC is responsible for toll route from Cedara to Heidelberg on N3 highway for a periodof 30 years ending November 2029. TRAC is a cross broader concessionaire responsible for toll road from SolomonMahlangu Road in Pretoria to Maputo in Mozambique on the N4 highway east for a period of 30 years ending February2028.
The TRAC concession contract was extended from the Gauteng-Mpumalanga border to the Tshwane metropolitan border.An amount of R251m was received on 28 February 2005 and is being amortised over the remaining life of the concession.
Significant terms of the arrangements
For the N3 Toll route, SANRAL received an upfront payment of R1.380bn and an additional payment of R52m during the2008 financial year. The concessions are for a specified period of 30 years. For the N1/N4 route no payment was receivedfrom the concessionaire. Significant terms that may affect the amount, timing or certainty of future cash flows aresummarised below.
The concessionaires on the N3 and N4 Maputo toll roads are also required to pay SANRAL a Highway Usage Fee (HUF) incertain circumstances (section 2.5 of the concession contract and annexure 15 to the concession contract). The HUF is amechanism for limiting the return on the project which can be distributed by the concessionaire to its shareholders. On theN4 Platinum a revenue share mechanism is achieving the same objective.
SANRAL does not guarantee the minimum third-party revenue that the concessionaire will collect. SANRAL is not requiredto compensate the concessionaire if the traffic on the highway is less than expected.
The nature and extent of the arrangement
Right of use of specified assets
The costs of acquiring the site were borne by SANRAL. Once the site has been delivered to the concessionaire, theproperty is “under the care, custody and control of the concessionaire” and the concessionaire bears the risks associatedwith the property (section 15.5 of the concession contract).
The concession contract specifically states that the concessionaire has “no title to, ownership interest in, or liens orleasehold rights or any other rights” in the site and title to the site remains with SANRAL. SANRAL is required to ensure thatthe concessionaire has access to and the right of use in respect of the site and equipment (as necessary for it to perform itsobligations in terms of the contract) throughout the concession period.
Should the concessionaire discover any “fossils, coins, articles of value or antiquity, and structures and other remains orthings of geological or archaeological interest or burial sites” on the site during the concession period, these will be theproperty of SANRAL. SANRAL has ownership of the road and related facilities (e.g. toll plaza buildings) throughout theconcession period.
Obligations to deliver or rights to receive specified assets at the end of the concession period
The ownership of any drawings, data, books, reports, documents, software, any other information owned by theconcessionaire or any of the subcontractors for the purpose of the project is required to be transferred to SANRAL at theend of the concession period. Furthermore, the concessionaire is required to hand over the highway and its rights or interestin the developments to SANRAL, free of charge. These assets are required to be free from any liens, claims, encumbrancesand liabilities and are required to be in a specified condition with a specified remaining useful life.
Obligations to provide or rights to expect provision of services
The concession contract requires the concessionaire to operate and perform routine maintenance works, on the roadnetwork, to ensure proper operation and maintenance of the highway.
65
THE SOUTH AFRICAN NATIONAL ROADS AGENCY SOC LIMITED
116
South African National Roads Agency SOC Limited(Registration number 1998/009584/30)Financial Statements for the year ended 31 March 2018
Notes to the Financial Statements
38. Public private partnerships - toll collection service concession arrangements (continued)
The contracts also require consessionaires to acquire or build items of property, plant and equipment; Initial construction works relating to the highway and associated facilities (as specified in the concession contract
and including, for example repairs and replacements relating to specified sections of the highway and theconstruction/repair of toll plazas).
Additional construction works relating to the road and related facilities (that is, required construction work otherthan the initial construction works).
Upgrade works according to the provisions in the contract.
Renewal and termination options
The concession rights will terminate if either SANRAL or the concessionaire terminates the concession contract.
SANRAL has the right to terminate the concession contract in any of the following circumstances: There is court action for the dissolution and/or liquidation of the concessionaire. The concessionaire receives a court order to be placed under judicial management or to commence liquidation
procedures. The concessionaire fails to complete the initial construction works within three years of commencement of the
concession contract. The concessionaire ceases to operate and maintain the highway. All (or substantially all) of the concessionaire’s indebtedness becomes due and payable as a result of default by
the concessionaire. The concessionaire fails to report a material related-party transaction (as required by the concession contract) The concessionaire commits a material breach of the provisions of the concession contract.
If any of the abovementioned is not remedied by the concessionaire within a specific period, then SANRAL has the right toappoint a substitute entity in the place of the concessionaire.
The concessionaire has the right to terminate the concession contract in any of the following circumstances: SANRAL commits a material breach of the provisions of the concession contract. There is a material impairment of the concession rights as a result of the concessionaire being nationalised or
expropriated or the project land/highway being compulsorily acquired from the concessionaire by the state. Certain material adverse governmental action takes place.
Other rights and obligations
The concessionaire is only permitted to raise debt (from lenders) as specified in the concession contract. SANRAL isrequired to approve any additional indebtedness of the concessionaire. SANRAL would take over the concessionaire'sindebtedness in the event of concessor default.
Classification
SANRAL recognises no revenue from services provided to the public for these concessions, except where HUF are payableto SANRAL by the concessionaire according to the service concession agreement.
SANRAL recognises no operational costs related to the operations of the public infrastructure under concession.
SANRAL recognises no obligations to restore infrastructure to a specified level of serviceability.
SANRAL recognises the upfront payment received from operators over the period of the concession arrangement.
66
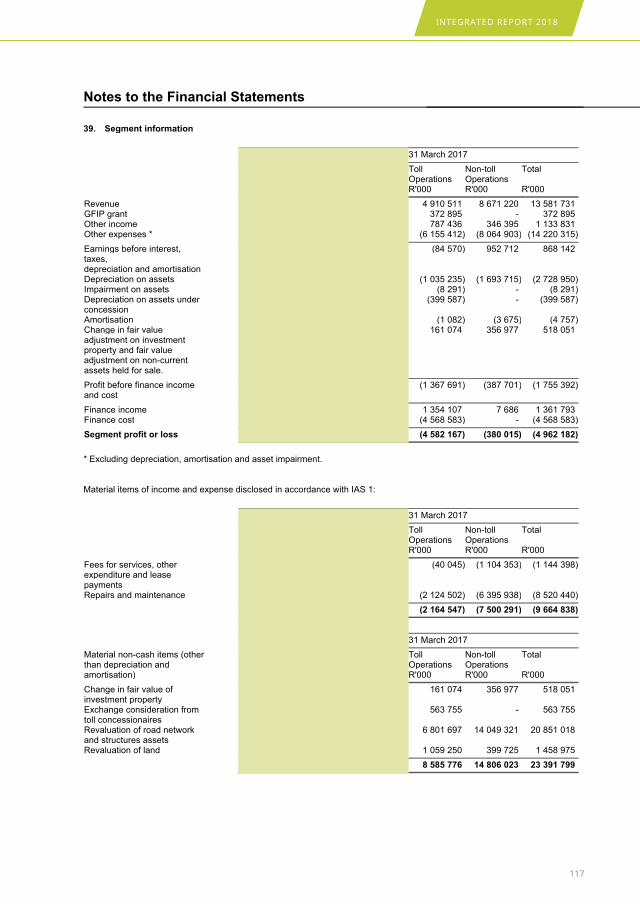
INTEGRATED REPORT 2018
117
South African National Roads Agency SOC Limited(Registration number 1998/009584/30)Financial Statements for the year ended 31 March 2018
Notes to the Financial Statements
39. Segment information
31 March 2018 31 March 2017
TollOperationsR'000
Non-tollOperationsR'000
Total
R'000
TollOperationsR'000
Non-tollOperationsR'000
Total
R'000
Revenue 5 194 034 9 017 849 14 211 883 4 910 511 8 671 220 13 581 731GFIP grant 2 073 122 - 2 073 122 372 895 - 372 895Other income 895 341 164 057 1 059 398 787 436 346 395 1 133 831Other expenses * (2 724 934) (8 458 335) (11 183 269) (6 155 412) (8 064 903) (14 220 315)
Earnings before interest,taxes,depreciation and amortisation
5 437 563 723 571 6 161 134 (84 570) 952 712 868 142
Depreciation on assets (1 167 786) (1 491 340) (2 659 126) (1 035 235) (1 693 715) (2 728 950)Impairment on assets - (14 718) (14 718) (8 291) - (8 291)Depreciation on assets underconcession
(421 132) - (421 132) (399 587) - (399 587)
Amortisation (16 629) (3 834) (20 463) (1 082) (3 675) (4 757)Change in fair valueadjustment on investmentproperty and fair valueadjustment on non-currentassets held for sale.
- (17 231) (17 231) 161 074 356 977 518 051
Profit before finance incomeand cost
3 832 016 (803 552) 3 028 464 (1 367 691) (387 701) (1 755 392)
Finance income 1 065 493 2 426 1 067 919 1 354 107 7 686 1 361 793Finance cost (4 356 741) - (4 356 741) (4 568 583) - (4 568 583)
Segment profit or loss 540 768 (801 126) (260 358) (4 582 167) (380 015) (4 962 182)
* Excluding depreciation, amortisation and asset impairment.
Material items of income and expense disclosed in accordance with IAS 1:
31 March 2018 31 March 2017
TollOperationsR'000
Non-tollOperationsR'000
Total
R'000
TollOperationsR'000
Non-tollOperationsR'000
Total
R'000
Fees for services, otherexpenditure and leasepayments
(355 757) (913 078) (1 268 835) (40 045) (1 104 353) (1 144 398)
Repairs and maintenance (2 064 554) (4 919 444) (6 983 998) (2 124 502) (6 395 938) (8 520 440)
(2 420 311) (5 832 522) (8 252 833) (2 164 547) (7 500 291) (9 664 838)
31 March 2018 31 March 2017
Material non-cash items (otherthan depreciation andamortisation)
TollOperationsR'000
Non-tollOperationsR'000
Total
R'000
TollOperationsR'000
Non-tollOperationsR'000
Total
R'000
Change in fair value ofinvestment property
- (17 231) (17 231) 161 074 356 977 518 051
Exchange consideration fromtoll concessionaires
548 238 - 548 238 563 755 - 563 755
Revaluation of road networkand structures assets
16 043 621 6 769 498 22 813 119 6 801 697 14 049 321 20 851 018
Revaluation of land (3 732 918) 3 365 417 (367 501) 1 059 250 399 725 1 458 975
12 858 941 10 117 684 22 976 625 8 585 776 14 806 023 23 391 799
67

THE SOUTH AFRICAN NATIONAL ROADS AGENCY SOC LIMITED
118
South African National Roads Agency SOC Limited(Registration number 1998/009584/30)Financial Statements for the year ended 31 March 2018
Notes to the Financial Statements
39. Segment information (continued)31 March 2018 31 March 2017
Statement of FinancialPositionReportable segment assetsNon-current assets
TollOperationsR'000
Non-tollOperationsR'000
Total
R'000
TollOperationsR'000
Non-tollOperationsR'000
Total
R'000
Investments - 372 562 372 562 - 329 739 329 739Property, plant and equipmentincluding those underconcession, and Intangibleassets
142 761 586 230 192 732 372 954 318 129 282 224 214 434 186 343 716 410
Investment property 1 132 406 708 963 1 841 369 1 163 168 723 428 1 886 596
143 893 992 231 274 257 375 168 249 130 445 392 215 487 353 345 932 745Current assets 12 456 925 33 487 12 490 412 11 821 652 432 334 12 253 986
Total assets 156 350 917 231 307 744 387 658 661 142 267 044 215 919 687 358 186 731
31 March 2018 31 March 2017
Statement of FinancialPositionReportable segment liabilitiesNon-current liabilities
TollOperationsR'000
Non-tollOperationsR'000
Total
R'000
TollOperationsR'000
Non-tollOperationsR'000
Total
R'000
Deferred income * 5 594 460 45 558 403 51 152 863 737 024 45 910 519 46 647 543Deferred exchangeconsideration
8 641 527 - 8 641 527 7 543 032 - 7 543 032
Other non-current liabilities ** 45 935 684 24 045 45 959 729 47 816 929 24 552 47 841 481
60 171 671 45 582 448 105 754 119 56 096 985 45 935 071 102 032 056Current liabilities 10 331 456 273 071 10 604 527 4 152 696 2 830 698 6 983 394
Total liabilities 70 503 127 45 855 519 116 358 646 60 249 681 48 765 769 109 015 450
* Non-current and current portion included.
** Excluding deferred income and deferred exchange consideration.
31 March 2018 31 March 2017
Capital expenditure TollOperationsR'000
Non-tollOperationsR'000
Total
R'000
TollOperationsR'000
Non-tollOperationsR'000
Total
R'000
Additions to property, plantand equipment
2 153 830 6 679 304 8 833 134 1 890 494 5 862 664 7 753 158
Property, plant and equipment- borrowing costs capitalisedto work in progress
162 405 - 162 405 100 988 - 100 988
Additions to intangible assets 1 628 3 065 4 693 750 5 069 5 819
2 317 863 6 682 369 9 000 232 1 992 232 5 867 733 7 859 965
31 March 2018 31 March 2017
TollOperationsR'000
Non-tollOperationsR'000
Total
R'000
TollOperationsR'000
Non-tollOperationsR'000
Total
R'000
Capital expenditure - underconcession
1 082 978 - 1 082 978 1 479 039 - 1 479 039
Capitalisation of rehabilitationcosts for borrow pits
20 568 (24 045) (3 477) (21 256) 24 552 3 296
68
INTEGRATED REPORT 2018
119
South African National Roads Agency SOC Limited(Registration number 1998/009584/30)Financial Statements for the year ended 31 March 2018
Notes to the Financial Statements
39. Segment information (continued)
Amendments to internal reporting organisation
No changes were made to the structure of SANRAL's internal organisational structure that could have caused thecomposition of its reportable segments to change.
Entity-wide disclosures
SANRAL's operations are situated within South Africa. All revenues from external customers, as well as non-current assets,are attributable to SANRAL's South African domicile. The income, expense, assets and liabilities reported in the segmentsabove have been measured in the same way as it is reported in the annual financial statement of the entity and to decision-makers/management, as such IFRS (accrual basis) was used as the basis of accounting framework.
There is no systematic method followed to allocated transactions and balances. Transactions are recorded to the segmentthey belong when incurred.No customers were identified as major for segment reporting purpose.
Its not an IFRS requirement to restate prior year figures for segment reporting. A net impact of R16.4 was restated oncomputer equipment, vehicles and furniture. Refer to note 42 for prior year corrections.
69
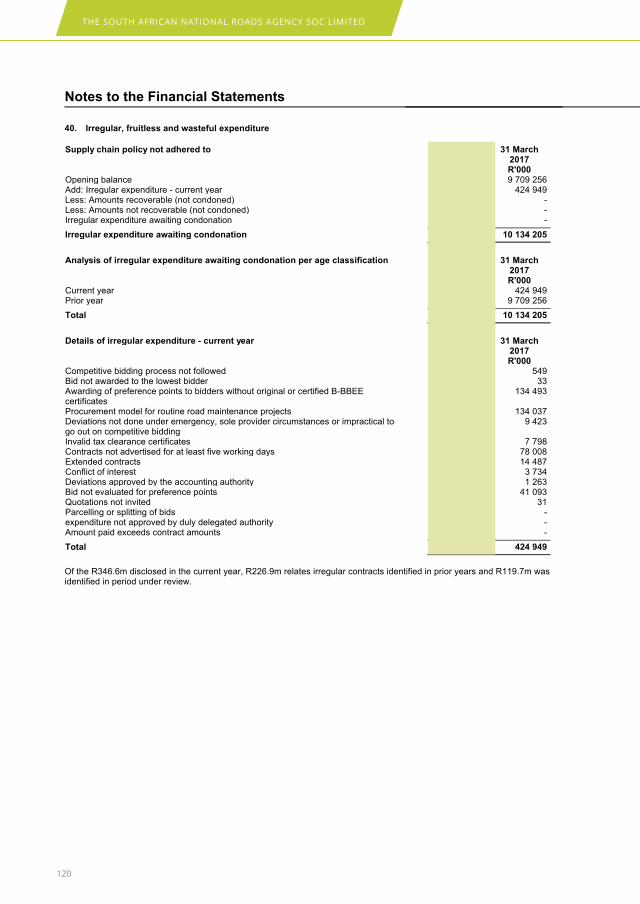
THE SOUTH AFRICAN NATIONAL ROADS AGENCY SOC LIMITED
120
South African National Roads Agency SOC Limited(Registration number 1998/009584/30)Financial Statements for the year ended 31 March 2018
Notes to the Financial Statements
40. Irregular, fruitless and wasteful expenditure
Supply chain policy not adhered to 31 March2018R'000
31 March2017R'000
Opening balance 10 134 205 9 709 256Add: Irregular expenditure - current year 346 649 424 949Less: Amounts recoverable (not condoned) - -Less: Amounts not recoverable (not condoned) - -Irregular expenditure awaiting condonation - -
Irregular expenditure awaiting condonation 10 480 854 10 134 205
Analysis of irregular expenditure awaiting condonation per age classification 31 March2018R'000
31 March2017R'000
Current year 346 649 424 949Prior year 10 134 205 9 709 256
Total 10 480 854 10 134 205
Details of irregular expenditure - current year 31 March2018R'000
31 March2017R'000
Competitive bidding process not followed - 549Bid not awarded to the lowest bidder - 33Awarding of preference points to bidders without original or certified B-BBEEcertificates
62 470 134 493
Procurement model for routine road maintenance projects 1 157 134 037Deviations not done under emergency, sole provider circumstances or impractical togo out on competitive bidding
- 9 423
Invalid tax clearance certificates 2 940 7 798Contracts not advertised for at least five working days 228 662 78 008Extended contracts 13 042 14 487Conflict of interest 7 943 3 734Deviations approved by the accounting authority - 1 263Bid not evaluated for preference points 8 949 41 093Quotations not invited - 31Parcelling or splitting of bids 11 169 -expenditure not approved by duly delegated authority 506 -Amount paid exceeds contract amounts 9 811 -
Total 346 649 424 949
Of the R346.6m disclosed in the current year, R226.9m relates irregular contracts identified in prior years and R119.7m wasidentified in period under review.
70
INTEGRATED REPORT 2018
121
South African National Roads Agency SOC Limited(Registration number 1998/009584/30)Financial Statements for the year ended 31 March 2018
Notes to the Financial Statements
40. Irregular, fruitless and wasteful expenditure (continued)
31 March 2018
The following are the matters that resulted in irregular expenditure disclosed above:
Awarding of preference points to tenders without original or certified Broad-based Black Economic Empowerment (B-BBEE)certificates
Bidders were appointed and contracted without an original or certified copy of B-BBEE certificates in 2015 and 2016financial years. This resulted in expenditure in this financial year of R62.5m as their contracts are still in progress. Adisciplinary process was followed in the previous financial years, however the contracts were still running in 2018 hence theincrease in irregular expenditure.
Procurement model for routine road maintenance projects
The disclosed amount of R1.157m is the part of the RRM contracts awarded using the University of Pretoria statisticalmethod in prior years. Since the 2014 financial year SANRAL has awarded RRM contracts based on the lowest bidder. Thiswas disclosed in prior years. As part of SANRAL’s strategy to develop small contractors as per Government’s aims andobjectives, SANRAL used a procurement model that would ensure that the prices tendered protect and develop Small Microand Medium Enterprises (SMMEs). The model is aimed at appointing an implementing/management contractor who wouldsub-contract 80% of routine maintenance work to qualifying SMMEs, 90% of which were B-BBEE companies.
Invalid tax clearance certificates
The amount of R2.9m disclosed in this current year relates to prior years` irregular contracts; five projects to the value ofR3.40m that were awarded with invalid tax clearance certificate.Only original tax clearance certificate are permissible forbidding purpose.
Contracts not advertised for at least 5 working days
The tender notices of winning bidders were not placed on the CIDB i-tender website for at least 5 working days and in otherinstances proof of advertisements could not be provided or found. The value of these amounted to R228.6 in current year.
Extended contracts
The amount of R13m disclosed in this current year relates to prior years` irregular contracts where contracts were extendedwithout National Treasury's approval for extensions exceeding the variation order thresholds in terms or the applicablepractise note.
Conflict of interest
Conflict of interest was identified in the 2015-16 financial year by a member of the evaluation committee not declaringinterest resulting in irregular expenditure of R7.9m in current year. Disciplinary action was instituted against the employeewho was dismissed.
Bidders not evaluated for preference points
Bidders who had negative scores were excluded from evaluation for preferential points. This resulted in scores forevaluation of bidders incorrectly calculated leading to payments to the value of R8.9m regarded as irregular.
Splitting of bids (uncompetitive process followed)
For an amount of R11.17m, project X.002-046-2015/1 was unbundled into two contracts, the intended transformationrequirements were not met as they were won by one contractor anyway. If it went out as one contract then the CIDBrequirement would have been a CIDB 8 contractor; the successful contractor would not have been able to tender and biggercontractors would have.
Expenditure not approved by duly delegated authority
SCM deviated from normal procurement processes. A sole supplier sourcing should have been approved by a delegatedofficial which is MBAC in terms of the Delegation of Authority of 15 August 2017 and not the regional manager whoapproved this instance. This resulted in irregular expenditure of R506 000.
71
THE SOUTH AFRICAN NATIONAL ROADS AGENCY SOC LIMITED
122
South African National Roads Agency SOC Limited(Registration number 1998/009584/30)Financial Statements for the year ended 31 March 2018
Notes to the Financial Statements
40. Irregular, fruitless and wasteful expenditure (continued)
Amount paid exceeds approved contract amounts
Total expenditure paid on information technology support agreements (Lanlink network, EDS enterprise solutions and Epi-
use) exceeds the approved amounts. The contracts were signed in 2006/07 years. The initial approvals did not incorporateincrease of costs in terms of CPI. This resulted in irregular expenditure of R9.811m for the amount above the approvedmemorandum.
31 March 2017
Competitive bidding process not followed
In the 2016 financial year, irregular expenditure was identified as a result of SANRAL inviting quotations and appointing aservice provider above the threshold of R500 000. At the time the price excluding VAT was below the limit but with VATincluded, it surpassed the threshold and tenders should have been called for. This has led to irregular expenditure in theamount of R548 968. Disciplinary proceedings were instituted in 2016.
Bid not awarded to the lowest bidder
Two quotations to the value of R32 943 were not awarded to the bidder with the lowest quote. In the first instance, thesuccessful bidder could not provide SANRAL with all of the documentation required in terms of the Financial IntelligenceCentre Act and subsequently the second lowest bidder was awarded the contract. In the second instance, the lowest biddercould not deliver the required goods as per the quotation to SANRAL and the next bidder was finally awarded the quote.The necessary documentation in both instances was not kept up to date.
Awarding of preference points to tenders without original or certified B-BBEE certificates
Irregular expenditure was identified in 2015 and 2016 financial years where SANRAL did not have an original or certifiedcopy of the successful tenderers B-BBEE certificates in hand, but only copies thereof. This resulted in expenditure in thisfinancial year of R134m. A disciplinary process was followed in the previous financial years.
Procurement model for routine road maintenance (RRM) projects
As part of SANRAL’s strategy to develop small contractors as per Government’s aims and objectives, SANRAL uses aprocurement model that would ensure that the prices tendered protect and develop Small Micro and Medium Enterprises(SMMEs). The model was aimed at appointing an implementing/management contractor who would sub-contract 80% ofroutine maintenance work qualifying to SMMEs, 90% of which were B-BBEE companies.
The work would be procured through a tender process in smaller work packages, which SMMEs were more capable ofundertaking. Due to the size (smaller economy of scale) of the nature of work the price/rates at which SMMEs could do thework for, was generally higher than a main/big contractor.
SANRAL used a proven mathematical formula, calculated independently by the University of Pretoria, to determine thelowest acceptable tender price that allowed the appointment of a contractor with the best/lowest acceptable rates suitablefor SMMEs. The tender methodology and adjudication method were clearly stipulated in the bid documents and were fairand reasonable to SMMEs and the management contractor. This deviation from PPPFA was not approved by the Minister ofFinance as required by the Treasury Regulation (TR).
The disclosed amount is the balance of the RRM contracts awarded using the University of Pretoria statistical method.Since the 2014 financial year SANRAL has awarded RRM contracts based on the lowest bidder.
Deviations not done under emergency, sole provider circumstances or where sourcing competitive bidding wasimpractical
Projects to the value of R5.96m were extended for a short period to allow for the drafting of new contract documentation tounbundle the project into smaller portions. The unbundling of the projects into smaller projects was as a result of a policychange that the Board was investigating at that stage to encourage transformation of the industry by allowing lower gradeCIDB contractors the opportunity to compete. The extensions were not justifiable as they did not constitute an emergency, asole provider or impractical to go out on a competitive bids.
72
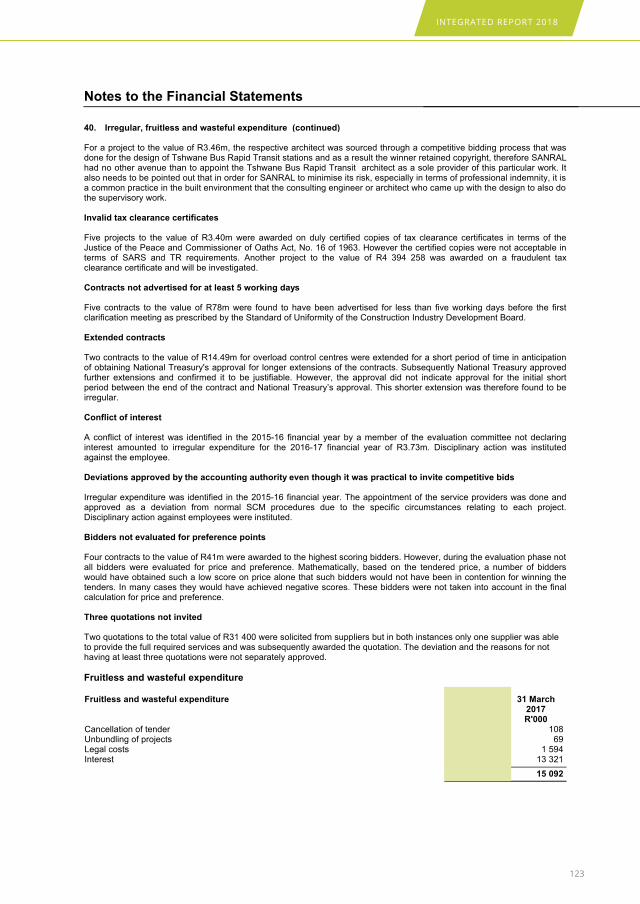
INTEGRATED REPORT 2018
123
South African National Roads Agency SOC Limited(Registration number 1998/009584/30)Financial Statements for the year ended 31 March 2018
Notes to the Financial Statements
40. Irregular, fruitless and wasteful expenditure (continued)
For a project to the value of R3.46m, the respective architect was sourced through a competitive bidding process that wasdone for the design of Tshwane Bus Rapid Transit stations and as a result the winner retained copyright, therefore SANRALhad no other avenue than to appoint the Tshwane Bus Rapid Transit architect as a sole provider of this particular work. Italso needs to be pointed out that in order for SANRAL to minimise its risk, especially in terms of professional indemnity, it isa common practice in the built environment that the consulting engineer or architect who came up with the design to also dothe supervisory work.
Invalid tax clearance certificates
Five projects to the value of R3.40m were awarded on duly certified copies of tax clearance certificates in terms of theJustice of the Peace and Commissioner of Oaths Act, No. 16 of 1963. However the certified copies were not acceptable interms of SARS and TR requirements. Another project to the value of R4 394 258 was awarded on a fraudulent taxclearance certificate and will be investigated.
Contracts not advertised for at least 5 working days
Five contracts to the value of R78m were found to have been advertised for less than five working days before the firstclarification meeting as prescribed by the Standard of Uniformity of the Construction Industry Development Board.
Extended contracts
Two contracts to the value of R14.49m for overload control centres were extended for a short period of time in anticipationof obtaining National Treasury's approval for longer extensions of the contracts. Subsequently National Treasury approvedfurther extensions and confirmed it to be justifiable. However, the approval did not indicate approval for the initial shortperiod between the end of the contract and National Treasury’s approval. This shorter extension was therefore found to beirregular.
Conflict of interest
A conflict of interest was identified in the 2015-16 financial year by a member of the evaluation committee not declaringinterest amounted to irregular expenditure for the 2016-17 financial year of R3.73m. Disciplinary action was institutedagainst the employee.
Deviations approved by the accounting authority even though it was practical to invite competitive bids
Irregular expenditure was identified in the 2015-16 financial year. The appointment of the service providers was done andapproved as a deviation from normal SCM procedures due to the specific circumstances relating to each project.Disciplinary action against employees were instituted.
Bidders not evaluated for preference points
Four contracts to the value of R41m were awarded to the highest scoring bidders. However, during the evaluation phase notall bidders were evaluated for price and preference. Mathematically, based on the tendered price, a number of bidderswould have obtained such a low score on price alone that such bidders would not have been in contention for winning thetenders. In many cases they would have achieved negative scores. These bidders were not taken into account in the finalcalculation for price and preference.
Three quotations not invited
Two quotations to the total value of R31 400 were solicited from suppliers but in both instances only one supplier was ableto provide the full required services and was subsequently awarded the quotation. The deviation and the reasons for nothaving at least three quotations were not separately approved.
Fruitless and wasteful expenditure
Fruitless and wasteful expenditure 31 March2018R'000
31 March2017R'000
Cancellation of tender - 108Unbundling of projects - 69Legal costs - 1 594Interest - 13 321
- 15 092
73
THE SOUTH AFRICAN NATIONAL ROADS AGENCY SOC LIMITED
124
South African National Roads Agency SOC Limited(Registration number 1998/009584/30)Financial Statements for the year ended 31 March 2018
Notes to the Financial Statements
40. Irregular, fruitless and wasteful expenditure (continued)
31 March 2018
There was no fruitless and wasteful expenditure identified for the year ended 31 March 2018.
31 March 2017
Cancellation of tender and unbundling of projects
Two projects were re-advertised as the projects were unbundled into smaller projects.The unbundling of the projects intosmaller projects was as a result of a policy change that the Board was investigating at that stage to encouragetransformation of the industry by allowing lower grade CIDB contractors the opportunity to compete.
Legal costs and interest
As part of the unsolicited bid of service provider on the N1/N2 Winelands toll road, interest and financial charges had to bepaid to the service provider as the scheme developer in the event that the project would not go ahead. Compound interestwas paid while the agreement was silent as to whether interest was compounded or simple, therefore simple interest shouldhave been paid and not compound interest. The difference between the two types of interest was regarded as fruitless andwasteful expenditure.
74

INTEGRATED REPORT 2018
125
South African National Roads Agency SOC Limited(Registration number 1998/009584/30)Financial Statements for the year ended 31 March 2018
Notes to the Financial Statements
41. Fair value information
Financial Instruments measured at fair value
Levels of fair value measurements
Level 1
Recurring fair value measurements
Assets Note(s)
Financial assets at fair value through profit or loss 8Investments - market-making 42 800 317 157Investments - repurchase agreements 630 627 1 365 549
673 427 1 682 706
Cash and cash equivalents 11Cash and cash equivalents 7 646 576 6 570 000
Liabilities Note(s)
Financial liabilities at fair value through profit or loss 14Market making liabilities - non-sanral bonds 59 437 251 657Capital market loans - at fair value 4 682 198 4 599 551
4 741 635 4 851 208
Financial liabilities held at amortised costRepurchase agreements 5 901 13 683Capital market loans - held at amortised cost 42 860 392 41 410 332
42 866 293 41 424 015
Level 2
Recurring fair value measurements
Assets Note(s)
Liabilities Note(s)
Other Liabilities 14EIB loan 1 015 850 994 220CPI-linked loan 80 335 270 400ECA loan 66 603 118 418Promissory notes 1 140 387 -
2 303 175 1 383 038
75

THE SOUTH AFRICAN NATIONAL ROADS AGENCY SOC LIMITED
126
South African National Roads Agency SOC Limited(Registration number 1998/009584/30)Financial Statements for the year ended 31 March 2018
Notes to the Financial Statements
41. Fair value information (continued)
Information about valuation techniques and inputs used to derive level 2 fair values
CPI-linked loan
Valuation technique
The CPI-linked loan is an inflation linked amortising loan where the future monthly real payments are predetermined. Thesereal payments are adjusted for inflation each month.
The nearest comparable inflation-linked guaranteed debt SANRAL has is the HWAY23 bond.
The HWAY23 yield was 2.88% (31 March 2017: 3.02%) on 31 March 2018. Assuming future inflation remains at 6% (31March 2017: 6%) to the maturity date of the HWAY23 at internal rate of return (IRR) of 8.99% (2017: 9.11%).
The loan, given the outstanding CPI-adjusted payments, which would equalise the IRR to 8.99% is R80.3m at 31 March2018 (2017: R270.4m at IRR of 9.11%).
Significant observable inputs
HWAY23
Sensitivity
A change of 20 basis points in IRR changes the value of the loan by 0.01%, or R5 000 (March 2017: 0.13%, or R351 500).
EIB loan
Valuation technique
The EIB loan is an amortising loan in two tranches, each tranche payable semi-annually. The tranches are notsynchronised, resulting in quarterly payments. Final payment will be on 30 June 2034. The rate is fixed.
The nearest SANRAL bond is the HWAY34 with a yield of 9.89% on 31 March 2018 (31 March 2017: 10.64%). This equatesto an IRR of 10.13% on 31 March 2018 (31 March 2017: 10.92%).
The loan, given all the outstanding payments to give an IRR of 10.13%, is equal to R1.016m as at 31 March 2018 (2017:R994m at IRR of 10.91%).
Significant observable inputs
HWAY34
Sensitivity
A change of 20 basis points in IRR changes the value of the loan by 1.10%, or R11 150 000 (2017: 1.11%, or R10 936420).
ECA-supported loan
Valuation technique
The ECA-supported loan is non-guaranteed and amortising with quarterly payments. Because the total facility was neverdrawn down and capital repayments are based on the total facility, resulting in a rapid repayment of the loan. The interestrate on this loan is linked to 3-month Jibar.
Spreads on non-guaranteed SANRAL debt have widened significantly over the last two years. Spreads vary from 180 pointsfor short-dated bonds to 275 points for longer-dated bonds. A spread of 250 points for this loan was assumed. The BEASSAcurve as at 31 March 2018 was used and 250 basis points (2017: 250 points) was added to the total. The outstandingpayments were discounted using the rates derived as described above, resulting in a loan amount of R66.6m ((2017:R118.4m).
Significant observable inputs
76
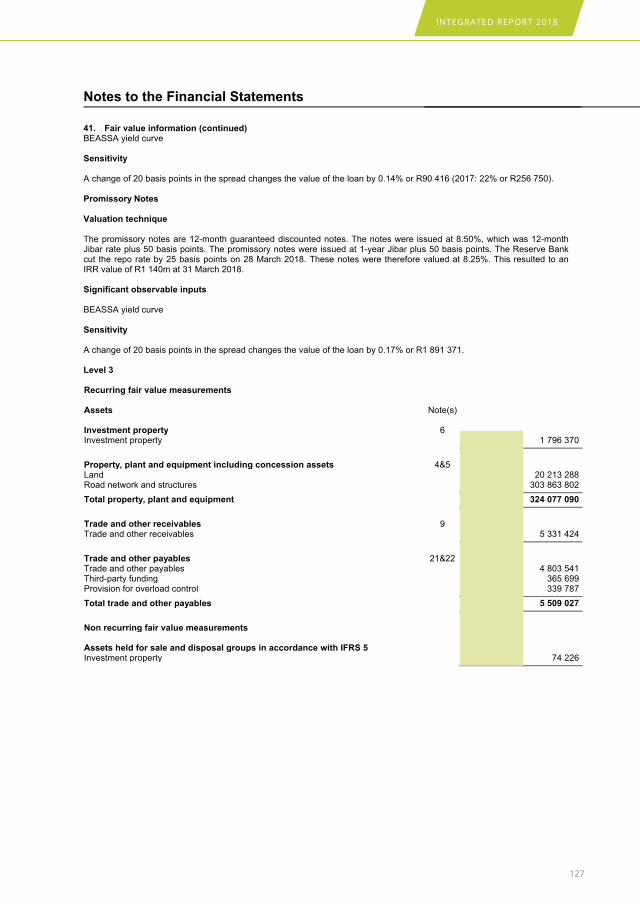
INTEGRATED REPORT 2018
127
South African National Roads Agency SOC Limited(Registration number 1998/009584/30)Financial Statements for the year ended 31 March 2018
Notes to the Financial Statements
41. Fair value information (continued)BEASSA yield curve
Sensitivity
A change of 20 basis points in the spread changes the value of the loan by 0.14% or R90 416 (2017: 22% or R256 750).
Promissory Notes
Valuation technique
The promissory notes are 12-month guaranteed discounted notes. The notes were issued at 8.50%, which was 12-monthJibar rate plus 50 basis points. The promissory notes were issued at 1-year Jibar plus 50 basis points. The Reserve Bankcut the repo rate by 25 basis points on 28 March 2018. These notes were therefore valued at 8.25%. This resulted to anIRR value of R1 140m at 31 March 2018.
Significant observable inputs
BEASSA yield curve
Sensitivity
A change of 20 basis points in the spread changes the value of the loan by 0.17% or R1 891 371.
Level 3
Recurring fair value measurements
Assets Note(s)
Investment property 6Investment property 1 810 430 1 796 370
Property, plant and equipment including concession assets 4&5Land 19 969 674 20 213 288Road network and structures 330 412 981 303 863 802
Total property, plant and equipment 350 382 655 324 077 090
Trade and other receivables 9Trade and other receivables 4 801 036 5 331 424
Trade and other payables 21&22Trade and other payables 5 797 641 4 803 541Third-party funding 281 607 365 699Provision for overload control 323 068 339 787
Total trade and other payables 6 402 316 5 509 027
Non recurring fair value measurements
Assets held for sale and disposal groups in accordance with IFRS 5Investment property 30 940 74 226
77

THE SOUTH AFRICAN NATIONAL ROADS AGENCY SOC LIMITED
128
So
uth
Afr
ican
Nati
on
al R
oad
s A
gen
cy S
OC
Lim
ite
d(R
eg
istr
atio
n n
um
be
r 1
99
8/0
09
58
4/3
0)
Fin
an
cia
l S
tate
me
nts
fo
r th
e y
ea
r e
nd
ed
31
Ma
rch
20
18
No
tes t
o t
he F
inan
cia
l S
tate
men
ts
41
.F
air
va
lue
in
form
ati
on
(c
on
tin
ue
d)
Re
co
nc
ilia
tio
n o
f a
ss
ets
an
d l
iab
ilit
ies
me
as
ure
d a
t le
ve
l 3
No
te(s
)O
pe
nin
gb
ala
nc
e
R'0
00
Ga
ins
(lo
ss
es
)re
co
gn
ise
d i
np
rofi
t (l
os
s)
R'0
00
Ga
ins
(lo
ss
es
)re
co
gn
ise
d i
no
the
rc
om
pre
he
ns
ive
inc
om
eR
'00
0
Pu
rch
as
es
/a
dd
itio
ns
/tra
ns
fers
/e
xp
en
dit
ure
R'0
00
Sa
les
/re
ce
ipts
R'0
00
Cla
ss
ifie
d a
sh
eld
fo
r s
ale
R'0
00
Imp
air
me
nt
los
s/
de
pre
cia
tio
n
R'0
00
Ba
d d
eb
tsw
ritt
en
off
R'0
00
Pa
ym
en
ts
R'0
00
Clo
sin
gb
ala
nc
e
R'0
00
Co
mp
an
y -
20
18
Assets
Inv
es
tme
nt
pro
pe
rty
6&
10
Inve
stm
en
t p
rop
ert
y
1 7
96
37
0(4
81
)-
15
95
5-
(1 4
14
)-
--
1 8
10
43
0N
on
-cu
rre
nt
asse
tsh
eld
fo
r sa
le7
4 2
26
(14
37
2)
-(1
5 9
55
)(1
4 3
73
)1
41
4-
--
30
94
0
To
tal
inv
es
tme
nt
pro
pe
rty
1 8
70
59
6(1
4 8
53
)-
-(1
4 3
73
)-
--
-1
84
1 3
70
Pro
pe
rty,
pla
nt
an
de
qu
ipm
en
t4
&5
La
nd
20
21
3 2
88
-(3
67
50
1)
83
70
1-
--
--
19
92
9 4
88
Ro
ad
Ne
two
rk a
nd
str
uctu
res
30
3 8
63
80
2-
22
81
3 1
19
3 7
36
06
0-
--
--
33
0 4
12
98
1
To
tal
pro
pe
rty,
pla
nt
an
d e
qu
ipm
en
t3
24
07
7 0
90
-2
2 4
45
61
83
81
9 7
61
--
--
-3
50
34
2 4
69
Tra
de
an
d o
the
rre
ce
iva
ble
s9
Tra
de
an
d o
the
rre
ce
iva
ble
s5
33
1 4
24
--
-1
99
6 2
12
-(2
50
8 9
88
)(1
7 6
12
)-
4 8
01
03
6
Tra
de
an
d o
the
rp
aya
ble
s2
1
78
INTEGRATED REPORT 2018
129
So
uth
Afr
ican
Nati
on
al R
oad
s A
gen
cy S
OC
Lim
ite
d(R
eg
istr
atio
n n
um
be
r 1
99
8/0
09
58
4/3
0)
Fin
an
cia
l S
tate
me
nts
fo
r th
e y
ea
r e
nd
ed
31
Ma
rch
20
18
No
tes t
o t
he F
inan
cia
l S
tate
men
ts
No
te(s
)O
pe
nin
gb
ala
nc
eG
ain
s/l
os
se
sre
co
gn
ise
d i
np
rofi
t o
r lo
ss
Ga
ins
/lo
ss
es
rec
og
nis
ed
in
oth
er
co
mp
reh
en
siv
e i
nc
om
e
Pu
rch
as
es
/ad
dit
ion
s/
tra
ns
fers
Sa
les
/re
ce
ipts
Cla
ss
ifie
d a
sh
eld
fo
r s
ale
Imp
air
me
nts
los
s/
de
pre
cia
tio
n
Ba
d d
eb
tsw
ritt
en
off
Pa
ym
en
tsC
los
ing
ba
lan
ce
41
.F
air
va
lue
in
form
ati
on
(c
on
tin
ue
d)
Tra
de
an
d o
the
rp
aya
ble
s4
80
3 5
41
--
99
4 1
00
--
--
-5
79
7 6
41
Th
ird
-pa
rty f
un
din
g3
65
69
9-
-(3
05
41
9)
22
1 3
27
--
--
28
1 6
07
Pro
vis
ion
fo
r o
ve
rlo
ad
co
ntr
ol
33
9 7
87
--
(16
71
9)
--
--
-3
23
06
8
To
tal
tra
de
an
d o
the
rp
aya
ble
s5
50
9 0
27
--
67
1 9
62
22
1 3
27
--
--
6 4
02
31
6
To
tal
33
6 7
88
13
7(1
4 8
53
)2
2 4
45
61
84
49
1 7
23
2 2
03
16
6-
(2 5
08
98
8)
(17
61
2)
-3
63
38
7 1
91
Co
mp
an
y -
20
17
Assets
Inv
es
tme
nt
pro
pe
rty
6In
ve
stm
en
t p
rop
ert
y 1
1 4
04
07
55
21
31
8-
-(5
9 6
70
)(6
9 3
53
)-
--
1 7
96
37
0N
on
-cu
rre
nt
asse
tsh
eld
fo
r sa
le2
0 0
96
(3 2
67
)-
69
35
3(1
1 9
56
)-
--
-7
4 2
26
To
tal
inv
es
tme
nt
pro
pe
rty
1 4
24
17
15
18
05
1-
69
35
3(7
1 6
26
)(6
9 3
53
)-
--
1 8
70
59
6
Pro
pe
rty,
pla
nt
an
de
qu
ipm
en
t4
&5
La
nd
18
68
7 0
10
-1
45
8 9
75
67
30
3-
--
--
20
21
3 2
88
Ro
ad
Ne
two
rk a
nd
str
uctu
res
27
9 8
56
79
9-
20
85
1 0
81
6 0
76
48
7-
-(2
92
0 5
65
)-
-3
03
86
3 8
02
To
tal
pro
pe
rty,
pla
nt
an
d e
qu
ipm
en
t2
98
54
3 8
09
-2
2 3
10
05
66
14
3 7
90
--
(2 9
20
56
5)
--
32
4 0
77
09
0
Tra
de
an
d o
the
rre
ce
iva
ble
s9
Tra
de
an
d o
the
rre
ce
iva
ble
s7
05
0 1
55
--
(35
40
5)
5 4
22
29
1-
(3 7
53
59
5)
(33
10
5)
(3 3
18
91
7)
5 3
31
42
4
79

THE SOUTH AFRICAN NATIONAL ROADS AGENCY SOC LIMITED
130
So
uth
Afr
ican
Nati
on
al R
oad
s A
gen
cy S
OC
Lim
ite
d(R
eg
istr
atio
n n
um
be
r 1
99
8/0
09
58
4/3
0)
Fin
an
cia
l S
tate
me
nts
fo
r th
e y
ea
r e
nd
ed
31
Ma
rch
20
18
No
tes t
o t
he F
inan
cia
l S
tate
men
ts
No
te(s
)O
pe
nin
gb
ala
nc
eG
ain
s/l
os
se
sre
co
gn
ise
d i
np
rofi
t o
r lo
ss
Ga
ins
/lo
ss
es
rec
og
nis
ed
in
oth
er
co
mp
reh
en
siv
e i
nc
om
e
Pu
rch
as
es
/ad
dit
ion
s/
tra
ns
fers
Sa
les
/re
ce
ipts
Cla
ss
ifie
d a
sh
eld
fo
r s
ale
Imp
air
me
nts
los
s/
de
pre
cia
tio
n
Ba
d d
eb
tsw
ritt
en
off
Pa
ym
en
tsC
los
ing
ba
lan
ce
41
.F
air
va
lue
in
form
ati
on
(c
on
tin
ue
d)
Tra
de
an
d o
the
rp
aya
ble
sT
rad
e a
nd
oth
er
pa
ya
ble
s(3
83
6 7
12
)-
-(9
66
82
9)
--
--
-(4
80
3 5
41
)
Th
ird
-pa
rty f
un
din
g(3
31
47
9)
--
-1
4 5
60
--
--
(31
6 9
19
)P
rovis
ion
fo
r o
ve
rlo
ad
co
ntr
ol
(33
6 2
05
)-
-(3
58
2)
--
--
-(3
39
78
7)
To
tal
tra
de
an
d o
the
rp
aya
ble
s(4
50
4 3
96
)-
-(9
70
41
1)
14
56
0-
--
-(5
46
0 2
47
)
To
tal
30
2 5
13
73
95
18
05
12
2 3
10
05
65
20
7 3
27
5 3
65
22
5(6
9 3
53
)(6
67
4 1
60
)(3
3 1
05
)(3
31
8 9
17
)3
25
81
8 8
63
* G
ain
s a
nd
lo
sse
s r
eco
gn
ise
d i
n p
rofit
or
loss a
re i
nclu
de
d i
n o
the
r in
co
me
on
th
e s
tate
me
nt
of
co
mp
reh
en
siv
e i
nco
me
, e
xce
pt
for
ga
ins a
nd
lo
sse
s o
n f
ina
ncia
l a
sse
ts a
nd
lia
bili
tie
sw
hic
h h
ave
be
en
in
clu
de
d in
fa
ir v
alu
e a
dju
stm
en
ts.
# G
ain
s a
nd
lo
sse
s r
eco
gn
ise
d in
oth
er
co
mp
reh
en
siv
e in
co
me
are
in
clu
de
d in
ga
ins a
nd
lo
sse
s o
n p
rop
ert
y r
eva
lua
tio
n.
** T
his
co
lum
n r
efe
rs t
o t
he
am
ou
nt
of
tota
l g
ain
s o
r lo
sse
s in
clu
de
d in
pro
fit
or
loss t
ha
t is
att
rib
uta
ble
to
th
e c
ha
ng
e in
un
rea
lise
d g
ain
s o
r lo
sse
s f
or
asse
ts a
nd
lia
bili
tie
s h
eld
at
the
en
do
f th
e r
ep
ort
ing
pe
rio
d.
Info
rma
tio
n a
bo
ut
va
lua
tio
n t
ec
hn
iqu
es
an
d i
np
uts
us
ed
to
de
riv
e l
ev
el
3 f
air
va
lue
s
La
nd
80

INTEGRATED REPORT 2018
131
South African National Roads Agency SOC Limited(Registration number 1998/009584/30)Financial Statements for the year ended 31 March 2018
Notes to the Financial Statements
41. Fair value information (continued)
Valuation technique(s)
The valuation technique adopted for land is based on the “across the fence” method using comparable sales (stripvaluation).
Significant unobservable inputs
Significant unobservable inputs were adjustments to development rights, engineering services or crop improvements.
Sensitivity
The carriageway length of the road network increased from 23 765 km to 24 637 km (+3.67%) from 2017 to 2018 financialyear. As a result the total land area increased by 2 337ha (2.28%). The average strip value decreased from R579 587/ha(10.5%) to R518 412 due to changes in economic activities and updated sales information that became available. For 2018financial year the market value of the road reserve/land decreased by R283.6m (1.4%) which is in line with long-termproperty value growth.
Investment property
Valuation technique(s)
Direct comparison of selling prices achieved in respect of comparable prices.
Significant unobservable inputs
Selling prices of comparable properties. Subjective adjustments by the valuer to account for differences between the subjectproperty and comparable properties sold in terms of location, physical features, current and future land use as well asprevalent market conditions at dates of sale.
Sensitivity
In 2017 financial year the SANRAL Investment Property (IP) policy was amended to only consider properties >R10,000 invalue outside of declared road reserve, and those properties with valid lease income. Investment properties decreased (by8.7%) from 2 445 in 2017 to 2 232 in 2018.
Trade and other receivables and trade and other payables
Trade and other receivables and payables are accounted for in terms of IAS 39 and IFRS 9. Discounting is applied to tradeand other receivables.
Valuation technique(s)
Cash flows are discounted using SANRAL's weighted average overdraft rate for consumers from the Reserve Bank website.
Significant unobservable inputs
Weighted average overdraft rate for consumers.
Sensitivity
During the year under review, the weighted average overdraft rates were used to discount trade and other receivables. Therate for 2018 was 9.87%
81
THE SOUTH AFRICAN NATIONAL ROADS AGENCY SOC LIMITED
132
South African National Roads Agency SOC Limited(Registration number 1998/009584/30)Financial Statements for the year ended 31 March 2018
Notes to the Financial Statements
41. Fair value information (continued)
Road network and structures
Valuation technique
Depreciated replacement cost
Significant unobservable inputs
Replacement cost
Sensitivity
The following factors impact the annual change in the gross replacement cost and depreciated replacement cost ofSANRAL roads:
Change in network length: The incorporation of the remainder of strategic and primary road network from provinces duringa year, as well as the upgrading of roads from single carriageway to four-lane road or dual carriageway, impacts on thevalue of assets, as asset value is calculated for every carriageway km of road as at 31 March of each year. The carriagewaylength increased by 0.10% to 24 662km in 2018.
Change in unit rates: Change in standard unit rates from one year to another are influenced by exchange rate fluctuations,crude oil prices (impacts bitumen and diesel prices), steel prices, cement prices, equipment prices, labour costs, marketconditions (supply and demand that determines mark-up of contractors). The unit rates increase by 5.96% in 2018
Change in condition: Since the depreciation of the pavement layer component and the structures component are directlyrelated to condition of the asset, deterioration in condition ( due to traffic and climate) will result in a decrease in depreciatedreplacement cost. The opposite also applies if the condition of asset improved due to maintenance actions. As can beappreciated, for each carriageway-km as used in asset valuation, the condition will be changing based on numerous localclimate, traffic and maintenance impacts. The length of good condition decreased by 3.41% to 13 850km.
Maintenance: Any reseal, overlay, or strengthening work performed on the assets impacts on the condition of the asset,the remaining life of the asset and thus the condition-based depreciation of each carriageway-km of road is affected.
Change in traffic: Since the depreciated replacement cost (DRC) method is based on modern equivalent asset (MEA) ontoday's prices, based on the traffic expected over the next 25 years, the impact of change in traffic is obvious. If the roaddesign class is close to a transition interface, then a small increase in traffic over year, can result in a change in the MEArequired (more layers and/or higher quality materials), with associated cost increases for specific road assets. The oppositeapplies if the traffic decreases. SANRAL has over 1 000 traffic monitoring stations on the network. On some sections trafficincreases and on others it decreases from one year to another. The length on network with more than 5 000 vehicles perday increased by 4.98% to 8 972km.
Change in dimensions: Since the DRC method is based on replacing current road width with the MEA, any change in roadwidth or structure area from one year to the other, due to maintenance actions, addition of paved shoulders, addition oflanes and addition of climbing lanes, will increase the replacement cost of each carriageway-km of road affected. Theavearge cross section of network increased by 0.25% to 11.88m.
82

INTEGRATED REPORT 2018
133
South African National Roads Agency SOC Limited(Registration number 1998/009584/30)Financial Statements for the year ended 31 March 2018
Notes to the Financial Statements2018 2017
R '000 R '000
42. Prior period errors
42.1 Assets with acquisition value of R1/2/R3 in assets register
It was found in the current financial year that there was property, plant and equipment items that were incorrectly capitalisedat nil book values in prior years. The estimated acquisition values of the assets were capitalised in the current financial yearusing the applicable useful lives of the asset in the same class during those years. The impact of the error noted on theprior year financial statements is as follows:
2016 and prior period
Restatement of Cost of Building fittings and computer equipment
Increase in computer equipment 17 417
Increase in building fittings 22
Increase in furniture at 3 565
Increase in vehicles 321
Decrease in accumulated loss (previously expensed) (21 325)
2017 (opening balance)
Buildings
Increase in accumulated depreciation (2)
Decrease in retained Income 2
Equipment, vehicles and furniture
Increase accumulated depreciation (53 790)
Decrease retained income 53 790
42.2 Expenses on 3rd party were not Recognised in 2017
An amount of R88m was erroneously recognised as an sundry income instead of third-party funding. This resulted in anamount of R35m being recognised as a debtor. If the income was accounted for correctly the third-party funding accountshould not have been in debit. Another account was also in credit by R4.2m due to prior year expenses not correctlyallocated (settled) to the correct third-party account. The impact of the correction is as follows:
Increase 3rd party liability (84 184)
Decrease retained income 84 184
42.3 Transfer to MAJV (property management company) was expensed in 2017 instead of bank transfer
An amount of R11m was erroneously accounted for as an expense not as a transfer of amounts to MAJV. The impact of thecorrection is as follows:
Increase in intersite account 11 397
Decrease in accumulated loss (11 397)
83
THE SOUTH AFRICAN NATIONAL ROADS AGENCY SOC LIMITED
134
South African National Roads Agency SOC Limited(Registration number 1998/009584/30)Financial Statements for the year ended 31 March 2018
Notes to the Financial Statements2018 2017
R '000 R '000
42. Prior period errors (continued)
42.4 ETC asset unbundled
ETC equipment to the value of R1.3bn was recognised as one asset in prior years instead of recognising vehicles, furnitureand computer equipment separately with different useful lives. This error was corrected in 2018. The impact of the priorperiod error is as follows:
2017 (restatement of opening balance)
Cost
Increase in buildings 36 510
Increase in computer software 197 757
Increase in vehicles 34 939
Decrease computer equipment (269 207)
2017 (restatement of opening balance)
Computer Software
Increase in accumulated depreciation computer software 43 829
Decrease in accoumulated depreciation computer equipment (43 829)
Buildings
Increase in accumulated depreciation 7 545
Decrease in accumulated depreciation computer equipment (7 545)
Vehicles
Increase accumulated depreciation 7 764
Decrease in accumulated depreciation computer equipment (7 764)
42.5 Southern region (SR) building unbundled
The furnished SR building with its road network, equipment and furniture were initially recognised as one asset in January2017. This error was corrected in the current year resulting in a prior period error. The impact on the accummulateddepreciation is regarded as immaterial. The impact on cost of assets is as follows:
2017 (restatement of opening balance)
Computer equipment - Cost
Increase in road network 6 875
Increase in computer equipment 45 279
Increase in furniture 831
Decrease in buildings (52 985)
84
INTEGRATED REPORT 2018
135
South African National Roads Agency SOC Limited(Registration number 1998/009584/30)Financial Statements for the year ended 31 March 2018
Notes to the Financial Statements2018 2017
R '000 R '000
42. Prior period errors (continued)
42.6 Land sold to RAF in 2006/7 financial year
In 2007 financial year, a portion of land (IAS 40 investment property) was sold to Road Accident Fund (RAF, public entity)for R16m. However, the legal transfer of ownership has not passed to RAF, to date, due to certain contractual terms andconditions not yet fulfilled. RAF took occupation and built its offices on the land. The selling price is held in a trust account ofthe seller (SANRAL). RAF has control over the benefits flowing from this asset. SANRAL does not have the intention to takeits land back or remove RAF from the land, therefore, the land should have been removed from the books of SANRAL. Atthe time of sale, a debtor was created (being selling price held in trust account) and credited profit and loss on sale of landaccount with the full amount.
2017 (restatement of opening balance)
Investment property
Decrease in retained income (previously incl in P/L) 16 000
Decrease in investment property (16 000)
42.7 Prior period errors with no impact on retained income
The following items were restated in 2018, however they do not have any impact on the profit/loss and retained income:
(a) The repairs and maintenance cost was published at R8 520 440 instead of R8 538 175. The prior year TB on case-warebalance was correct at R8 538 175. The difference was taken to adminstration cost in note 25. With this correction totalexpenses remain the same as published at R17 361 900.
(b) Guarantee cost R67.8m was accrued and disclosed in note 25 as bank charges, this was corrected in 2018 financialyear, resulting in line item for administration cost to increase to R801.4m.
43. Change in accounting estimates
Property, plant and equipment
The estimated useful lives of computer equipment, furniture and vehicles was reviewed in the current period. The usefullives was revised during the annual assessment of useful lives as it was noted that these assets are still in good condition tobe used longer than initial estimates. The effect of this revision has decreased the depreciation charges for the currentperiod by R460 000. It is impracticable to estimate the effect of change in estimate for future periods. The table belowreflects the effect:
Effect of change in useful lives
Asset class Depreciationper revisedestimates
Depreciationper old
estimates
Effect ofchange
increase/(decrease)
Computer equipment 563 (590) (27)Vehicles 215 (288) (73)Furniture 59 (419) (360)
837 (1 297) (460)
85
THE SOUTH AFRICAN NATIONAL ROADS AGENCY SOC LIMITED
136
South African National Roads Agency SOC Limited(Registration number 1998/009584/30)Financial Statements for the year ended 31 March 2018
Notes to the Financial Statements2018 2017
R '000 R '000
43. Change in accounting estimates (continued)
Intangible assets
The useful life of computer software was estimated in prior years to be 8 years. In the current period management haverevised their estimates to 10 years. This was because management noted that these assets gets fully amortised while theyare still usable and in good condition. Prior to change of estimate the amortisation was R25.858m and R16.064m after therevision. The effect of this revision has decreased the amortisation for the current periods by R9.794m. It is impracticable toestimate the effect of change in estimate for future periods.
44. Going concern
The going concern basis has been adopted in preparing the financial statements.
International Accounting Standard (IAS) 1, paragraph 25, requires an entity to assess its ability to continue as a goingconcern, in preparing financial statements. It further indicates that it is a requirement to prepare financial statements as agoing concern, unless the management either intends to liquidate the entity or to cease trading, or has no realisticalternative but to do so. SANRAL’s assessment of this principle considered the following critical areas:
Assets
As a stand-alone company, SANRAL’s significant asset base of R388bn and net asset value of R271bn is regarded as veryhealthy. As a provider of national roads, the asset base would never be considered for liquidation or sold. The probabilitythat the government would consider the scrapping or selling of national roads is remote as it is a national asset which drivesthe economy of the country.
Liquidity
SANRAL receives an annual grant from the fiscus to fund the non-toll portfolio. In the year under review this amounted toR15.4bn. Since SANRAL’s inception the annual increase in this grant has exceeded inflation. This amount coversoperational and capital expenditure on non-toll roads which comprise 87% of SANRAL’s portfolio. Budget Vote 35, indicatedthat this grant would increase to R19.79bn in 2020/21.
During the same period GFIP collected cash of R726m and received a grant from the fiscus of R463.4m. Due to the lowcollection rate on the GFIP, the cash receipt projections are assumed to be the same as the past eight to 10 months inorder to have a conservative forecast. The shareholder and the Minister of Finance approved a transfer of R1.9bn (inclVAT) from the non-toll allocation to toll in order to strengthen the portfolio in the short term. The Board has requested theshareholder to address the impact of the poor collection rate with cabinet to ensure the sustainability of SANRAL Theshareholder, Minister of Transport, and the President committed to resolve this matter by 31 May 2018.
In reviewing the cash requirements for the next 12 months to March 2019, SANRAL requires a minimum of R4.3bn. Of this,R3.8bn is required to refinance maturing debt. In the year under review, SANRAL was successful in launching a promissorynote programme of R1.9bn, under its R6bn guarantee and managed to raise R1.22bn. The NRA028 bond was also tappedfor R225m as investors found value in the pricing of the non-guaranteed bond.
SANRAL’s funding strategy for 2018-19 is dependent on the Cabinet decision on GFIP.
In the current market conditions, where local investor sentiment is negative towards long-term investments, short-termfloating rate notes are readily accessible and SANRAL will certainly continue to tap this market to supplement other fundingstrategies. The promissory notes issued under the R6bn guarantee will be rolled over upon maturity, in March 2019, whichwill ensure the utilisation of this guarantee. Upon completion of the updates to the Domestic Medium-Term Note (DMTN)programmes and approval from note-holders, set for 6 June 2018, these instruments can be utilised, depending on marketappetite.
Furthermore, the government issued guarantees totaling R37.91bn, being the R31.91bn and R6bn guarantees. Variousguarantees from government to the value of R37.91bn, being the R31.91bn and R6bn guarantees, of which R24.30bn hasbeen utilised as at 31 March 2018. The current funding requirements project that this limit will only be breached after March2020. Apart from the conservative approach to GFIP receipts, the projections assume no new toll roads and limited capitalexpenditure on roads, where possible and without compromising the asset. The request to increase the total guarantee toR43bn and the borrowing limit to R54bn (from R47,91bn), was submitted in late 2016. R40bn (nominal) of the borrowinglimit was used by 31 March 2018.
86
INTEGRATED REPORT 2018
137
South African National Roads Agency SOC Limited(Registration number 1998/009584/30)Financial Statements for the year ended 31 March 2018
Notes to the Financial Statements2018 2017
R '000 R '000
44. Going concern (continued)
SANRAL also has the option of issuing non-guaranteed debt under the R15bn non-guaranteed DMTN programme; R4.8bn,at 31 March 2018, being available to issue new bonds or tap existing bonds. This was successfully done in the year underreview and can be pursued in the near future.
Government has also committed to providing an additional grant of R463m per annum, adjusted for inflation, to supplementGFIP revenues. This as well as the R1.9bn transfer from non-toll to toll, clearly reflects Government’s continued support toensure SANRAL’s viability. However, should all of the above fail, the government has the right to step-in to service the debt,in terms of the R31.91bn guarantee agreement (clause 6.2).
Additional considerations
SANRAL may not be placed under judicial management or in liquidation except by an act of Parliament (Section 10 of theSouth African National Roads Agency and National Roads Act). This is an implied guarantee from the government. TheBoard of Directors therefore supports management’s assessment that SANRAL will remain a going concern in theforeseeable future.
45. Events after the reporting period
45.1 Credit rating
On 29 June 2018, Moody`s Investors Services, downgraded SANRAL’s long-term local and foreign currency global scaleratings from Ba1 to Ba2, with a negative outlook. Moody`s affirmed the short-term global scale of NP (Not Prime).Concurrently, Moody`s also downgraded the long-term national scale rating to A1.za from Aa3.za and affirmed the short-term national scale rating of P-1.za.
Moody`s cited the “ongoing liquidity pressure which is exacerbated by the national government’s decision to further delay itsannouncement on the long-term solution to SANRAL’s Gauteng Freeway Improvement Project (GFIP) funding model andthe opposition to the open-road tolling project”.
45.2 Going concern
On 2 August 2018, National Treasury, approved the un-earmarking of R5.75bn (incl. VAT) from the non-toll transfer in Vote35, in order to shift the funds to the GFIP allocation. This was done to address the short-term liquidity issue until the finaldecision with regards to GFIP is made by Cabinet. The amount is sufficient to ensure SANRAL is able to meet all itsobligations up to July 2019. The appetite of investors can also be tested as this transfer will strengthen the view thatGovernment will continue to ensure SANRAL’s sustainability. In light of the R5.75bn intervention, the SANRAL board isreviewing the decision to stop issuing debt in the bond market with a view to re-entering the bond market to secure capitalfor the toll road portfolio
45.3 E-toll
The Ministers of Transport and Finance have reaffirmed their commitment to finding a solution to the GFIP challenge andwill recommend to the State President that engagements in this regard should include the Gauteng ANC Chairman who isalso the Premier of the provincial government. Until a final decision is taken by the State President on this matter, the e-tollscheme continues to operate and SANRAL will continue with legal and administrative processes that are aimed at ensuringcontinued toll operations and improved debt recovery.
These events have not had any impact on the annual financial statements, as SANRAL remains a going concern and itsmandate has not changed.
87

THE SOUTH AFRICAN NATIONAL ROADS AGENCY SOC LIMITED
138
Abbreviations and Acronyms
ARC Audit and Risk Committee
Bakwena Bakwena Platinum Corridor Concessionaire
BBBEE Broad-based black economic empowerment
BEE Black economic empowerment
CEO Chief executive officer
COTO Committee of Transport Officials
CPI Consumer price index
CSI Corporate social investment
DEA Department of Environmental Affairs
DMR Department of Mineral Resources
DoE Department of Education
DWS Department of Water and Sanitation
EIA Environmental impact assessment
EMP Environmental management plan
EWT Endangered Wildlife Trust
FMS Freeway management system
GDP Gross domestic product
GFIP Gauteng Freeway Improvement Project
IAS International Accounting Standard
ICT Information communication technology
IDP Integrated development plan
IFRS International Financial Reporting Standards
IT Information technology
ITS Intelligent transport system
Km Kilometres
M Metres
MoU Memorandum of understanding
NMU Nelson Mandela University
N3TC N3 Toll Concession
OCI Overall condition index
ORT Open road tolling
OUTA Opposition to Urban Tolling Alliance
PFMA Public Finance Management Act
PPP Public-private partnerships
RRM Routine Road Maintenance
RSE Road Safety Education
RTMS Road Traffic Management System
INTEGRATED REPORT 2018
139
SANRAL South African National Roads Agency SOC Limited
SAPS South African Police Service
SETC Social, Ethics and Transformation Committee
SIP Strategic Integrated Projects
SMME Small, medium and micro enterprise
SOC State-owned company
SOE State-owned enterprise
STEM PP Science Technology Engineering and Mathematics Pipeline Project
TMC Traffic management centre
TRAC Trans African Concessions
UFS University of the Free State
Wits University of the Witwatersrand

140
NOTEs
tHe SoutH aFriCan national roaDS aGenCY SoC limiteD

141
inteGrateD report 2018
THE sOUTH AFRIcAN NATIONAL ROADs AGENcY sOc LTD (sANRAL)Head office
48 Tambotie Avenue, Val de Grace, PretoriaPO Box 415, Pretoria, 0001 South Africa
Tel: +27 (0) 12 844 8000Fax: +27(0) 12 844 8200
www.sanral.co.za
Registration Number: 1998/009584/30RP 179/2017
ISBN: 978-0-621-46606-5
Produced by Communications and Marketing SANRAL, PretoriaTel: +27 (0) 12 844 8000
Contact Details for SANRAL’s Fraud Hotline/Tip-Offs AnonymousToll-Free Phone No: 0800 204 558
Toll-Free Fax No: 0800 007 788E-mail: [email protected]
Postal address: Tip-Offs Anonymous, Freepost DN 298, Umhlanga Rocks