2018 Game Status and Trend Report - WDFW
398
2018 Game Status and Trend Report STATE OF WASHINGTON
-
Upload
khangminh22 -
Category
Documents
-
view
0 -
download
0
Transcript of 2018 Game Status and Trend Report - WDFW

2018 Game Status and Trend Report
STATE OF WASHINGTON


AN OFFICIAL PUBLICATION OF THE STATE OF WASHINGTON
2018 GAME STATUS AND TREND REPORT
July 1, 2017 – June 30, 2018
Washington Department of Fish and Wildlife 600 Capitol Way North
Olympia, WA 98501-1091
STATE OF WASHINGTON Jay Inslee Governor
WASHINGTON DEPARTMENT OF FISH AND WILDLIFE Dr. Kelly Susewind
Director
WILDLIFE PROGRAM Eric Gardner
Assistant Director
GAME DIVISION Anis Aoude
Game Division Manager
This Program Receives Federal Aid in Wildlife Restoration, Project W-96-R, Statewide Wildlife Management.
This report should be cited as:
Washington Department of Fish and Wildlife. 2018. 2018 Game status and trend report. Wildlife Program, Washington Department of Fish and Wildlife, Olympia, Washington, USA.


TABLE OF CONTENTS
Deer .................................................................................................................................................. 1 Blue Mountains Mule Deer Management Zone ....................................................................... 2 Columbia Plateau Mule Deer Management Zone ................................................................... 6 East Columbia Gorge Mule Deer Management Zone ............................................................13 East Slope Cascades Mule Deer Management Zone ..............................................................17 Naches Mule Deer Management Zone ................................................................................... 23 Northern Rocky Mountains Mule Deer Management Zone ...................................................27 Okanogan Highlands Mule Deer Management Zone .............................................................30 Blue Mountains White-tailed Deer Management Zone .......................................................... 33 Columbia Basin White-tailed Deer Management Zone .......................................................... 36 North Cascade Mountains White-tailed Deer Management Zone ..........................................39 Okanogan Highlands White-tailed Deer Management Zone .................................................. 42 Palouse White-tailed Deer Management Zone ....................................................................... 45 Selkirk White-tailed Deer Management Zone ........................................................................ 49 Islands Black-tailed Deer Management Zone ......................................................................... 54 North Cascade Mountains Black-tailed Deer Management Zone ..........................................57 Olympic Peninsula Black-tailed Deer Management Zone ..................................................... 61 South Cascade Mountain Black-tailed Deer Management Zone ............................................ 66 Willapa Hills Black-tailed Deer Management Zone............................................................... 72
Elk .................................................................................................................................................. 77 Blue Mountains Elk Herd ....................................................................................................... 78 Colockum Elk Herd ................................................................................................................ 86 Mount Saint Helens Elk Herd .................................................................................................95 North Cascade Elk Herd .......................................................................................................106 North Rainier Elk Herd .........................................................................................................115 Olympic Elk Herd ................................................................................................................. 129 Selkirk Elk Herd ................................................................................................................... 140 South Rainier Elk Herd .........................................................................................................152 Willapa Hills Elk Herd ......................................................................................................... 162 Yakima Elk Herd .................................................................................................................. 171
Mountain Goat ............................................................................................................................ 181 Statewide Summary ..............................................................................................................182 Region 2, Chelan County ...................................................................................................... 185 Region 2, Methow ................................................................................................................ 189 Region 3, Blazed Ridge, Bumping River, Naches Pass........................................................191 Region 4, Mt. Baker and Boulder River North Areas .......................................................... .195 Region 5, Goat Rocks, Smith Creek, Mt. St. Helens ............................................................ 199 Region 6, Olympic Mountains .............................................................................................. 206
Bighorn Sheep ............................................................................................................................. 211 Statewide Summary .............................................................................................................. 212 Region 1, Blue Mountains .................................................................................................... 218 Region 1, Hall Mountain and Vulcan Mountain .................................................................. 224 Region 1, Lincoln Cliffs ....................................................................................................... 232 Region 2, Mt. Hull and Sinlahekin ....................................................................................... 238 Region 2, Swakane, Chelan Butte, and Manson ................................................................... 245 Region 3, Quilomene, Cleman Mtn., Umtanum/Selah Butte, and Tieton ............................ 255

Moose ........................................................................................................................................... 263 Statewide Summary .............................................................................................................. 264
Cougar ......................................................................................................................................... 269 Statewide Summary .............................................................................................................. 270
Black Bear ................................................................................................................................... 281 Statewide Summary .............................................................................................................. 282
Band-Tailed Pigeon and Mourning Dove ................................................................................. 290 Statewide Summary .............................................................................................................. 291
Waterfowl .................................................................................................................................... 298 Breeding Populations and Production ..................................................................................299 Winter Populations and Harvest ........................................................................................... 319
Wild Turkey ................................................................................................................................ 345 Statewide Summary .............................................................................................................. 346
Pheasant ...................................................................................................................................... 351 Statewide Summary .............................................................................................................. 352
Chukar ......................................................................................................................................... 359 Statewide Summary .............................................................................................................. 360
Quail ............................................................................................................................................ 363 Statewide Summary .............................................................................................................. 364
Grouse.......................................................................................................................................... 369 Statewide Summary .............................................................................................................. 370
Private Lands Access .................................................................................................................. 375 Statewide Summary .............................................................................................................. 376
Wildlife Conflict Management & Prevention........................................................................... 383 Statewide Summary .............................................................................................................. 384

Deer
1

Deer Status and Trend Report 2018
Blue Mountains Mule Deer Management Zone MARK VEKASY, Wildlife Biologist PAUL WIK, Wildlife Biologist Introduction
The Blue Mountains Mule Deer Management Zone (MDMZ) is located in southeast Washington and consists of 13 GMUs (145, 149, 154, 157, 162, 163, 166, 169, 172, 175, 178, 181, and 186; Figure 1), with GMU 157 being closed to human entry except by permit.
Management Guidelines and Objectives
The Department’s objective within this MDMZ is to maintain a stable population based on abundance and harvest estimates. Additional management objectives include managing for a post-hunt population with a sex ratio of 15-19 bucks:100 does in predominantly agricultural areas and 20-24 bucks:100 does in predominantly public land units.
Population Surveys Post-hunt aerial surveys conducted between 2012 and 2014 in portions of the Snake River Breaks and the agricultural and grassland ecoregion indicated a population of approximately 20,000 mule deer in the survey area. Individual sightability surveys yielded estimates of 3,353 (90% CI = 2,980-3,726) for most of GMU 181 in 2012, 10,799 (90% CI = 9,986-11,612) for GMU 145 and portions of adjacent units, and 6,052 (90%CI = 5,719-6,385) for approximately half of GMU 149. The mean buck:doe ratio estimate from ground and aerial surveys conducted between 2007 and 2016 was 18.8:100 (ranging from a low estimate of 11.5:100 to a high estimate of 26.6:100, Figure 2). Post-hunt aerial surveys were not conducted in 2016, but ground composition surveys indicated a buck:doe ratio of 11.5:100 (95% CI: 7.7-15.3, n = 584). While ground and aerial surveys covered ~60% of the zone, where habitat is more open and current survey methods are most effective, mule deer that occur in the higher-elevation forested areas are difficult to monitor and population information is limited to that gleaned from annual harvest estimates.
We conducted post-hunt aerial surveys in December 2017 that covered the western, northcentral, and northeast portions of the District. We revised subunits and sampling strategy to produce a statistically robust population estimate for that portion of the District in one year as opposed to
Figure 1. GMUs and generalized land cover types within the Blue Mountains MDMZ.
2

Deer Status and Trend Report 2018
previous surveys conducted over multiple years from 2012-2014. We plan to repeat surveys for 3-years which will help characterize population abundance and distribution, and also help to refine methods and develop survey methodology for the remaining portions of the District.
In December 2017, we counted 8,221 mule deer in 1,141 groups across 54 of 149 subunits. The sightability estimate for the survey area was 18,368 mule deer (95% CI = 15,728 - 22,293), with estimated ratio of 14.1 bucks:100 does (95% CI = 11.2-17.0) and 49.6 fawns:100 does (95% CI = 43.3-56.0). This population estimate is very similar to the combined estimates from previous surveys, which falls with the 95% CIs.
a) b) Figure 2. Estimates of buck (black) and fawn (red) ratios per 100 does and post-hunt buck objectives (dashed line) for, (a) pre-hunt (ground-based) and (b) post-hunt (ground and aerial) surveys in the Blue Mountains MDMZ, 2008–2017.
Hunting Seasons and Recreational Harvest Recent harvest estimates for 2008-2017 general seasons (Figure 3a) have been relatively stable for 10-years, although there is currently a 5-year downward trend. Improving harvest metrics in some GMUs, particularly 145 and 149, have allowed for increased antlerless permit harvest, but antlerless permit numbers may need to be reduced if the current downward trend continues. Rough indicators of hunter effort (hunter days; Figure 3b) and harvest rate (kills/day; Figure 3b) also mirror recent downward trends. It is important to note that hunter days and kills/day represent all deer hunting in the zone, including white-tailed deer.
a) b) Figure 3. Harvest estimates and 10-yr means (dashed lines) for (a) General BM Zone Harvest (gray) and General + Permit BM Zone Harvest (blue); and (b) general season estimates and 10-yr mean for hunter days (black) and harvest/day (blue); b) in the Blue Mountains MDMZ, 2008–2017.
3

Deer Status and Trend Report 2018
Survival and Mortality
No estimates of pregnancy, fetal, or survival rates are available for mule deer herds in the Blue Mountains MDMZ. In addition to legal hunter harvest, other potential sources of mule deer mortality include predators such as cougars, wolves, golden eagles, and coyotes, collisions with vehicles, and poaching. Other predator species living within this zone include bobcat, black bear, and domestic dogs. While these mortality sources may influence population abundance, particularly in the forested habitats, habitat condition and availability likely have the greatest impact to mule deer populations, particularly here in the Blue Mountains MDMZ where most of the deer population at lower elevation is likely to be summer-range limited.
We recently began a mule deer survival and movement study, and placed GPS radio-collars on 5 mule deer in the eastern Snake River Canyon. Collar deployment was interrupted, but we plan to deploy another 45-48 collars across the District in December 2018.
Habitat Limited habitat is the major impediment to increasing deer numbers and hunting opportunity within the Blue Mountains MDMZ. The Blue Mountains MDMZ has been altered by landscape changes including conversion to croplands, wildfire suppression and burning, road construction, invasion of noxious weeds, extensive wind power development, and urban-suburban development. Although no single factor has had a direct, large-scale effect on mule deer populations in the Blue Mountains, the cumulative effects of such alterations have likely been detrimental to mule deer habitat over time.
Human-Wildlife Interaction The agricultural damage prevention program managed by WDFW has changed over the last few years, with responsibilities being shifted from the Enforcement Program to the Wildlife Program. 2014 saw the institution of “damage tags” which must be purchased through the licensing program. Landowners are still entitled to 2 free kill permits, with the requirement of reporting directly to the Conflict Specialist, and are the predominant tags issued in damage situations. Any additional permits are issued as damage permits with the requirement of purchasing a damage tag and reporting through the licensing system. Conflict biologists reported 18 hunters successfully filling kill permits between July 2017 and March 2018, including a mix of mule and white-tailed deer. Seventeen hunters reported successfully filling a damage tag out of 28 reporting using a tag, but only ten of these were mule deer. Most hunts occurred in GMU 149 and 154 in areas where there would be very little hunting opportunity otherwise, such as in the winery and orchard areas around Walla Walla and Burbank.
Management Concerns With the mule deer population apparently stable in the Blue Mountains MDMZ, the biggest management concern is habitat alteration and extreme climatic events (i.e., drought and winter conditions). The Conservation Reserve Program (CRP) acres across the zone have probably played the largest role in stabilizing the mule deer population in this agriculture-dominated landscape, but CRP acreages have been declining, and incidental information indicates significant acreages will be removed from the program to be farmed in the next few years. Winter range along the breaks of the Snake and Grande Ronde Rivers is probably secure in the short term, but
4

Deer Status and Trend Report 2018
development of estates with river views on the north side of the river indicates that this range faces threats in the long term. With the majority of mule deer habitat being in private ownership, there is little WDFW can do to protect the long-term security of mule deer in SE Washington.
Management Conclusions Mule deer populations in the Blue Mountains MDMZ are currently at management objective based on the 10-year mean for post-hunt buck:doe ratio, but the 2 years in a row of low post-hunt buck:doe ratio estimates gives reason to closely monitor the population. General season antlerless opportunity is fairly limited, and since population abundance is most sensitive to doe survival, managing antlerless permits is one of the few tools available to influence population changes. Available population survey and harvest data indicate stable to increasing populations where habitat availability and quality allow.
5

Deer Status and Trend Report 2018
Columbia Plateau Mule Deer Management Zone DAVID P. VOLSEN, Wildlife Biologist MICHAEL ATAMIAN, Wildlife Biologist JASON FIDORRA, Wildlife Biologist SEAN Q. DOUGHERTY, Wildlife Biologist DEVON COMSTOCK, Wildlife Biologist CARRIE LOWE, Wildlife Biologist ELLA ROWAN, Wildlife Biologist Introduction The Columbia Plateau MDMZ is located in central-eastern Washington and consists of 21 GMUs (127, 130, 133, 136, 139, 142, 248, 254, 260, 262, 266, 269, 272, 278, 284, 290, 371, 372, 373, 379, and 381; Figure 1).
This MDMZ is dominated by a mix of uncultivated shrub and grassland, and agriculture. Crops consist of a mixture of dryland and irrigated farming. Dryland crops are predominantly wheat while irrigated crops are much more diverse; including crops commonly foraged upon by mule deer such as orchards, irrigated and dryland wheat, alfalfa and corn.
This MDMZ encompasses about 16,500 square miles and approximately 3,000 (18%) are in state and federal ownership, much of which is open to public hunting.
Management Guidelines and Objectives The Department’s objective within this MDMZ is to maintain a stable population, and to evaluate its status based on abundance surveys and harvest trend data. Additional management objectives include managing for a post-hunt population with a sex ratio of 15 - 19 bucks per 100 does. Quality Deer hunts in the Desert Subarea (GMU 290) are the exception, where post-hunt population management objectives are for a sex ratio of 30 bucks per 100 does via limited-entry drawing permit opportunities.
Figure 1. GMUs and generalized land cover types within the Columbia Basin MDMZ.
6

Deer Status and Trend Report 2018
Population Surveys Mule deer are present throughout most of the Columbia Plateau MDMZ at varying densities. Highest densities are seasonally associated with cropland with adjacent shrub-steppe or riparian habitat. Lowest densities are associated within large monotypic blocks of either agricultural crops or uncultivated ground. While no estimates of mule deer abundance exist for the entire zone, estimates are available for portions of this MDMZ where higher densities occur (Figure 2). These subherds loosely represent expected population segments within this MDMZ.
Odessa Subherd
Odessa Subarea population estimates from aerial sightability surveys conducted from 2012-2014 resulted in population estimates ranging from 10,980 to 13,582 (Figure 3). Buck to doe ratios based on annual ground surveys between 2010 and 2017 have been above management objectives ever year except 2016, but the majority of bucks observed are yearlings (Figure 4). The decline in buck to doe ratios observed in 2016 is likely tied to low recruitment due to decreased fawn survival in 2015 associated with drought conditions. Again, the post season buck population is highly dependent on yearlings. Fawn to doe ratios based on ground surveys have ranged from 57 to 72 fawns per 100 does, except during 2015 when they decreased to 43 fawns (Figure 4).
Figure 2. Subherd area boundaries for post-hunt aerial mule deer population surveys in the Columbia Plateau MDMZ, 2017.
Figure 3. Abundance estimates and 90% confidence intervals from aerial mule deer surveys of the Odessa Subherd in the Columbia Plateau MDMZ, 2012-2014.
0
2,000
4,000
6,000
8,000
10,000
12,000
14,000
16,000
18,000
2008 2009 2010 2011 2012 2013 2014 2015 2016 2017
Popu
latio
n E
stim
ate
Figure 4. Fawn:doe (red) and buck:doe (black) ratio estimates and 90% confidence intervals from ground-based mule deer surveys of the Odessa Subherd in the Columbia Plateau MDMZ, 2010-2017.
0
10
20
30
40
50
60
70
80
90
100
2008 2009 2010 2011 2012 2013 2014 2015 2016 2017
Rat
io E
stim
ate
7

Deer Status and Trend Report 2018
Benge Subherd Benge Subherd population estimates from aerial sightability surveys conducted from 2009-2011 and 2015 have ranged from 11,990 to 13,589 (Figure 5). Estimates of buck to doe ratios based on ground surveys have been above management objectives ever year except 2016; but, similar to the Odessa Subherd, the majority of bucks observed were yearlings (Figure 6). The decline in the buck to doe ratio estimates observed in 2016 was likely due in part to decreased fawn survival in 2015, presumably associated with drought conditions. Fawn to doe ratio estimates based on ground surveys have remained relatively stable with a 10-yr average of 63 fawns per 100 does (range = 56 – 74; Figure 6).
Desert Unit (GMU 290) Desert Unit (GMU 290) buck to doe ratio estimates have been at, or above, management objectives since 2006 (range = 30 - 55 bucks per 100 does: Figure 7), except in 2017 when the estimate decreased to 24. Fawn to doe ratios have been low relative to other populations within the zone (range = 29 - 58 fawns per 100 does; Figure 8).
Figure 6. Fawn:doe (red) and buck:doe (black) ratio estimates and 90% confidence intervals from ground-based mule deer surveys of the Benge Subherd in the Columbia Plateau MDMZ, 2008 - 2017.
0
10
20
30
40
50
60
70
80
90
100
2008 2009 2010 2011 2012 2013 2014 2015 2016 2017
Rat
io E
stim
ate
Figure 5. Abundance estimates and 90% confidence intervals from aerial mule deer surveys of the Benge Subherd in the Columbia Plateau MDMZ, 2009 - 2011 and 2015.
0
2,000
4,000
6,000
8,000
10,000
12,000
14,000
16,000
18,000
2008 2009 2010 2011 2012 2013 2014 2015 2016 2017
Popu
latio
n E
stim
ate
0
10
20
30
40
50
60
70
80
90
100
2006 2007 2008 2009 2010 2011 2012 2013 2014 2015 2016 2017
B:D
Rat
io
Figure 7. Buck:doe ratio estimates and 90% confidence intervals from aerial mule deer surveys of the Desert Unit in the Columbia Plateau MDMZ, 2006 - 2017.
0
10
20
30
40
50
60
70
80
90
100
2006 2007 2008 2009 2010 2011 2012 2013 2014 2015 2016 2017
F:D
Rat
io
Figure 8. Fawn:doe ratio estimates and 90% confidence intervals from aerial mule deer surveys of the Desert Unit in the Columbia Plateau MDMZ, 2006 - 2017.
8

Deer Status and Trend Report 2018
Douglas Subherd Douglas Subherd buck to doe ratio estimates have been at, or above, management objectives since 2008 (average = 22:100; Figure 9). The majority of bucks classified during these surveys are in the juvenile age class because most legal bucks are harvested each year due to open cover and high road densities. In areas where landowners restrict access to large expanses of habitat, numbers of older age-class bucks increase. Fawn to doe ratio estimates have been stable over that same period (average = 60:100; Figure 9). Post-hunt ratios are estimated from annual ground-based composition surveys conducted along established routes within the subherd. The first comprehensive post-hunt aerial survey of mule deer in the Douglas Subherd was conducted in 2017 and resulted in a population abundance of 12,860 mule deer (90% CI = 10,299 - 16,735). This estimate will provide a baseline for evaluating future population changes.
Hunting Seasons and Recreational Harvest More mule deer are harvested in the Columbia Plateau MDMZ than in any other zone and harvest has been stable to increasing over the past decade with the exception of 2016 and 2017 (Figure 10a). The decline in 2016 harvest likely was due to poor fawn recruitment in 2015 associated with drought conditions in 2015; although reduced numbers of hunters may have contributed to fewer deer being harvested. Measures of hunter effort in the zone have generally been stable during the past 10 years (Figure 10b). Estimates of hunter effort (i.e., hunter days; Figure 10b) in this zone are not mule deer specific and include days spent hunting white-tailed deer. Because harvest data are specific to mule deer, kills/day estimates are consequently biased low.
a) b)
Figure 10. Harvest estimates and 10-yr means (dashed lines) for (a) General State Harvest (gray) and General + Permit State Harvest (blue); and (b) general season estimates and 10-yr mean for hunter days (black) and kills/day (blue) in the Columbia Plateau MDMZ, 2008–2017.
Figure 9. Fawn:doe (red) and buck:doe (black) ratio estimates and 90% confidence intervals from ground-based mule deer surveys of the Douglas Subherd in the Columbia Plateau MDMZ, 2008-2017.
0
10
20
30
40
50
60
70
80
90
100
2008 2009 2010 2011 2012 2013 2014 2015 2016 2017
Rat
io E
stim
ate
9

Deer Status and Trend Report 2018
Survival and Mortality Field studies conducted in the eastern portion of this zone between 2000 and 2008 indicated annual survival (�̂�𝑠 = 0.92, 95% CI = 0.91 – 0.93), pregnancy (�̂�𝑝 = 0.96, 90% CI = 0.91-1.0), and fetal rates (𝑓𝑓 = 1.44, 90% CI = 1.20-1.68) of adult female mule deer were sufficient to maintain stable populations (WDFW 2016). Cause-specific mortality for radio-marked juvenile mule deer (30 marked as neonates, 35 marked at 6 months of age) indicated legal hunting and coyotes were the most frequent sources of mortality (n = 28). Juvenile survival rates during the first summer (�̂�𝑠 =0.52) and the first winter (fawns transitioning into the yearling age class; �̂�𝑠 = 0.90) were sufficient to maintain stable populations (Johnstone-Yellin et al. 2009, WDFW 2016).
While not observed during recent field studies of marked deer, other sources of mule deer mortality likely include predation, collisions with vehicles, perishing in irrigation canals, and poaching. Predator species living within this zone include cougars, bobcats, black bears, coyotes, golden eagles, and domestic dogs. Availability of suitable habitat, disease events and other factors will influence survival, pregnancy rates, and fetal rates; therefore, former studies results are not necessarily indicative of the status of the current population.
Habitat Loss of important habitat, particularly shrub-steppe, riparian, and wet meadow habitat, is the most important issue facing wildlife managers in the Columbia Plateau MDMZ. Land conversion is the most obvious source of habitat loss, but in this zone, wildfires have become more frequent and more intense in recent years. These fires often result in a rapid invasion of exotic plant species such as cheatgrass that have little or no nutritional value to mule deer and can increase fire return intervals. Restoration of native vegetation requires intensive, expensive, long-term effort to be successful. In some areas of the zone, where crop fields have been enrolled in the Conservation Reserve Program (CRP), the increase in associated cover and introduction of beneficial plant species may partially mitigate losses of shrub-steppe, especially important during fawning season.
Human-Wildlife Interaction Mule deer in the Columbia Plateau MDMZ are largely migratory and often stage in large numbers on the way to, and at, the wintering grounds along the Snake River breaks and the Wilson Creek area. These large congregations are cause for concern from wheat farmers, although research suggests crop depredation by large ungulates does not influence grain yield, provided it occurs before the joint stage when plants begin to invest in their reproductive phase (Austin and Urness 1995, Dunphy et al. 1982). However, grazing on alfalfa and hay fields does have the potential to reduce crop production (Austin et al. 1998). Currently, four Deer Areas occur within this zone to address impacts associated with these congregation areas. Nuisance damage in suburban areas can also be a problem. WDFW provides additional antlerless hunting opportunities to address these issues (Figure 11). The Wildlife Conflict Section staff at WDFW work with producers to provide
10

Deer Status and Trend Report 2018
technical assistance in both lethal and non-lethal control of deer on agricultural lands including orchards and vineyards with high value crops favored by deer.
Management Concerns
As previously discussed, habitat loss and habitat degradation are management concerns in this area. While expansion of agricultural crops is currently at a standstill throughout much of this zone, habitat conversion through urban sprawl and small ranch development is slowly taking a toll. Recent changes to the Farm Service Bill may allow for cattle grazing and harvest of CRP lands, which will have negative impacts for wildlife due to loss of forage and cover. Impacts from wildfires vary depending upon the type of habitat burned, expanse of the burn, season of burn, and intensity of the burn. Short-term impacts may include reduced habitat suitability, which is particularly damaging during the summer fawning season and/or when precipitation fails to initiate fall green-up and animals are unable to increase nutritional reserves that them to meet the demand of a harsh winter. Long-term benefits of fire within the Columbia Plateau landscape depend on fire history and prevalence of invasive vegetation. Areas with older shrub-steppe habitat and good species diversity are limited and declining annually, due to fires and housing development. High-value shrub-steppe habitat can take over 50 years to develop, and combating encroachment by invasive species is a difficult and expensive battle once intact habitat burns.
Management Conclusions Mule deer populations in the Columbia Plateau MDMZ are currently at management objective based on buck to doe ratio estimates. Demographic and survey data indicate stable populations between years. Zone-wide harvest has been stable over the long term, but declined the past two years.
Literature Cited Austin, D. D., P. J. Urness, and D. Duersch. 1998. Alfalfa hay crop loss due to mule deer
depredation. Journal of Range Management 51:29-31. Austin, D. D. and P. J. Urness. 1995. Wild Ungulate depredation on winter wheat: effects on
grain yield. Great Plains Wildlife Damage Control Workshop Proceedings. Paper 422:51-55.
Dunphy, D. J., M. E. McDaniel, and E. C. Holt. 1982. Effect of forage utilization on wheat grain
yield. Crop Science 22:106-109.
Figure 11. Deer Areas within the Columbia Plateau MDMZ, 2017.
11

Deer Status and Trend Report 2018
Johnstone-Yellin, T. L., L. A. Shipley, W. L. Myers, and H. S. Robinson. 2009. To twin or not to
twin? Trade-offs in litter size and fawn survival in mule deer. Journal of Mammalogy 90:453–460.
Washington Department of Fish and Wildlife. 2016. Washington State mule deer management plan. Wildlife Program, Washington Department of Fish and Wildlife, Olympia, WA. 144 p.
12

Deer Status and Trend Report 2018
East Columbia Gorge Mule Deer Management Zone CARLY WICKHEM, Wildlife Biologist STEFANIE BERGH, Wildlife Biologist Introduction The East Columbia Gorge MDMZ, located in south central Washington, is the smallest of the seven mule deer management zones and consists of two GMUs, 382 and 388 (Figure 1).
Management Guidelines and Objectives The Department’s objective within this MDMZ is to maintain a stable population based on field surveys and harvest estimates. Additional management objectives include managing for a post-hunt population with a sex ratio of 15 - 19 bucks:100 does.
Population Surveys Mule deer are present throughout the East Columbia Gorge MDMZ with the highest densities observed during January through April on the low elevation winter ranges. Post-hunt aerial surveys conducted in 2017 in the zone resulted in a buck:doe ratio estimate of 16:100 (95%CI = 8 – 24, n = 1,808), which is within management objective. The post-hunt fawn:doe ratio estimate for 2017 was 64:100 (95% CI = 44 – 84, n = 1,808).
Hunting Seasons and Recreational Harvest Harvest estimates indicate a decline in harvest (Figure 2a) that likely reflects, in part, lower hunter numbers and related hunter effort (Figure 2b) as well as population declines within the zone in recent years. Estimates of kills/day had increased slightly over time, until declining in 2016 and 2017 (Figure 2b).
Figure 1. GMUs and generalized land cover types within the East Columbia Gorge MDMZ.
13

Deer Status and Trend Report 2018
a) b)
Survival and Mortality There are no current data on annual survival rates of mule deer in East Columbia Gorge MDMZ. In addition to legal hunting, common mortality sources include disease, predation, and deer-vehicle collisions. Lice infestations and hair loss syndrome have been documented in mule deer (Bernatowicz et al. 2011) and likely contribute to the decline in mule deer numbers. Common predator species include cougar, bobcat, black bear, and coyote. The winter of 2016-17 was very severe with persistent snow down to river level from December through February, making forage unavailable in key wintering habitat. However, the winter of 2017-2018 was mild to average, with moderate temperatures and only sporadic snow cover in lower elevations. Spring 2018 productivity surveys showed a fawn:adult ratio of 50:100, which is close to the previous 10-year average of 55:100. Annual post-hunt aerial surveys in December 2018 will hopefully shed some light on the recovery of this population from the severe winter of 2016-17. In the summer of 2017, an outbreak of Adenovirus Hemorrhagic Disease (AHD) was confirmed in the area just east of Goldendale in both GMUs 382 and 388. Most of the dead deer reported were fawns, which is typical with this disease. This type of AHD is specific to deer and is not uncommon in other states. An outbreak was reported in The Dalles, Oregon in the spring of 2017, and AHD has been confirmed in California and other western states in the past. Given the relative commonness of AHD, the disease has probably been present in Washington before, but was not detected. The last report of AHD in the Goldendale area was in September 2017 and there were no confirmed reports of AHD in 2018.
Habitat The East Columbia Gorge MDMZ has experienced extensive alternative energy development and agricultural land conversion in recent years. Electricity generated by wind power currently is one of the fastest growing alternative energy sources in the region with large wind power sites already in operation along the Columbia River. Although wind power is generally considered a “green” energy source, there may well be effects on mule deer and the habitat upon which they depend (Sawyer et al. 2002). More direct effects on the population have occurred in the form of habitat loss from agricultural conversion and associated roadways necessary to access such development, as well as increased mortality from vehicle collisions.
Figure 2. Harvest estimates and 10-yr means (dashed lines) for (a) General State Harvest (gray) and General + Permit State Harvest (blue); and (b) general season estimates and 10-yr mean for hunter days (black) and kills/day (blue); in the East Columbia Gorge MDMZ, 2008–2017.
14

Deer Status and Trend Report 2018
Human-Wildlife Interaction Agricultural damage to crops such as hay, alfalfa, wheat, berries, and grapes occurs at low levels in the East Columbia Gorge MDMZ. Wildlife Conflict Specialists work closely with producers by developing Damage Prevention Cooperative Agreements (DPCAs), which identify a plan to reduce the amount of damage incurred to agricultural crops using non-lethal and lethal methods. Wildlife Conflict Specialists and landowners use a variety of non-lethal means to discourage deer including: electrified fladry fencing, noisemakers (e.g., birdbangers, critter gitters, and propane cannons), hazing and herding, scarecrow-like electronic devices, and odor-based repellents such as Plantskyyd. There were three DPCAs related to deer in the East Columbia Gorge MDMZ along with one kill and one damage permit issued in 2017-2018. No deer were harvested as a result of these permits. In many circumstances, the Department addresses damage complaints by working with landowners to increase access to their property during hunting seasons so that hunters can help to resolve the damage.
Management Concerns Hairloss syndrome was observed in Klickitat County for the first time in 2000. Hairloss was first documented in GMU 382 in the spring of 2006. Approximately 2.8% of deer observed during road-based surveys conducted in March 2018 in and around the Klickitat Wildlife Area had noticeable signs of the syndrome, which is lower than rates observed in the past. Late 1990s declines in harvest, increases in buck mortality rates, and reduced productivity all roughly coincide with the onset of the hairloss syndrome. We will continue to monitor for this disease during spring surveys. Habitat loss is the greatest concern for mule deer in the East Columbia Gorge MDMZ. Increased development, especially in vineyards and wind power, has the potential to negatively impact this herd. Associated roads and fencing also have an indirect negative impact. Many of the deer in this zone are migratory and winter in the lower elevations, typically preferring habitat with a strong oak (Quercus garryana) component (McCorquodale 1996). Increased human activity and habitat conversion in lower elevation wintering areas can cause these deer to unnecessarily expend energy during the winter months when resources are limited, resulting in lower survival and reproduction rates.
Management Conclusions Mule deer populations in the East Columbia Gorge MDMZ are currently within buck:doe management objective, though harvest estimates were very low in 2017 when compared to previous seasons, indicating a decrease in the population. After the 2017 season, managers greatly reduced the number of special permits for antlerless harvest to support a more stable population. Annual survey efforts will allow managers to continue monitoring the population and determine future management needs.
Literature Cited Bernatowicz, J. A., K. Mansfield, J. W. Mertins, and W. Moore. 2011. Hair-loss syndrome in deer
in south central Washington. S. M. McCorquodale, editor. Proceedings of the 8th Western States and Provinces Deer and Elk Workshop – 2009. Washington Department of Fish and Wildlife. Olympia, WA.
15

Deer Status and Trend Report 2018
McCorquodale, S. M. 1996. Ecology and co-management of black-tailed deer in the Klickitat Basin of Washington. Yakama Nation Wildlife Program Report. Yakima, WA. 118p.
Sawyer, H., F. Lindzey, D. McWhirter, and K. Andrews. 2002. Potential effects of oil and gas development on mule deer and pronghorn populations in western Wyoming. Transactions of the 67th North American Wildlife and Natural Resources Conference. 67:350-365.
16

Deer Status and Trend Report 2018
East Slope Cascades Mule Deer Management Zone SCOTT FITKIN, Wildlife Biologist DAVID P. VOLSEN, Wildlife Biologist JEFFREY A. BERNATOWICZ, Wildlife Biologist Introduction The East Slope Cascades MDMZ, home to Washington’s major migratory mule deer populations, spans three wildlife districts (districts 6, 7, and the northern portion of 8) in north-central Washington and is comprised of 22 GMUs (203, 209, 215, 218, 224, 231, 233, 239, 242, 243, 244, 245, 246, 247, 249, 250, 251, 328, 329, 330, 334, and 335; Figure 1).
Management Guidelines and Objectives The Department’s objective within this MDMZ is to maintain stable populations based on field surveys and harvest estimates and manage for a post-hunt buck:doe ratio objective of 15-19 bucks:100 does in the southern and northern portions, and a minimum of 25 bucks: 100 does in the central portion.
Population Surveys Mule deer are present throughout the East Slope Cascades MDMZ with the highest densities observed during January through March on the low elevation traditional winter ranges. Populations within the zone are comprised of 4 general subherds, from north to south they are the Methow and Okanogan (western Okanogan County), Chelan (Chelan County), and Kittitas (Kittitas County north of I-90) subherds. The last zone-wide post-hunt aerial sightability surveys indicate approximately 47,000 mule deer reside within the East Slope Cascades MDMZ (WDFW 2013).
Methow and Okanogan Subherds Post-hunt aerial surveys conducted in early December in 2017 for the Methow subherd (District 6) produced a population estimate of 15,292 mule deer (95% CI = 11,027-22,623). The post-hunt buck:doe ratio estimate (Figure 2a) was 19:100 (95% CI = 16-23, n = 1,580). The mean buck:doe ratio estimate from aerial surveys conducted between 2008 and 2017 was 23:100 (range = 16 - 34).
The post-hunt fawn:doe ratio (an index of productivity) in 2017 was 65:100 (95% CI = 47-82, n = 2,180; Figure 2a). This is noticeably below the 10-year average of 76:100 (range = 64 – 82). In 2018, ground counts produced a spring fawn:adult ratio (Figure 2b) of 25:100 (95% CI = 22-28,
Figure 1. GMUs and generalized land cover types within the East Slope Cascades MDMZ.
17

Deer Status and Trend Report 2018
n = 2,092). These data yielded a rough over-winter fawn mortality rate of 57%, just above the 10-year average of 52%. Conditions during the last two winters were qualitatively somewhat harsher than the several years prior and came on the heels of two years of historically large fires that consumed tens of thousands of acres of deer winter range shrub forage.
a) b)
Buck:doe ratios for the northern subherds have been meeting or exceeding the management objective of 15:100 does (Figures 2a). A combination of rugged topography and limited road access in many GMUs allows for high escapement and results in a higher proportion of older age-class bucks in the population. A larger than average proportion of older bucks were harvested in 2015, moving the post-season age-class distribution toward younger males; however, escapement of older bucks has improved during the last two seasons increasing to almost half (49%) of bucks classified in 2017. Fawn recruitment varies year to year, although the quality of summer range habitats yield significant production (Figures 2b & 3b). Survey efforts have largely focused on the Methow subherd during the last 4 years due to concurrent research investigating survival rates for that subherd. However, ratio data have also been collected for the Okanogan subherd every few years and trends seen for mule deer in the Methow subherd likely track with those of the Okanogan subherd.
Chelan Subherd Poor winter flying conditions in the central portion of the zone (District 7) have limited yearly post-hunt aerial surveys for population estimates (including in 2017). Spring aerial surveys resulted in population estimates of 14,870 mule deer (90% CI = 12,085-19,679) in 2016 and 11,061 mule deer (90% CI = 9,317-13,865) in 2017. These estimates are comparable to post-hunt population estimates from 2010 and 2011 (Figure 3b). Deer numbers declined in the central portion of the zone following the 2016-2017 winter.
Management of the Chelan subherd is conservative with a post hunt buck ratio objective of 25+ bucks per 100 does. Since 2008, estimates of post-hunt buck:doe ratios have been sustained at or above this objective. While overall survey coverage was limited in 2017, the buck:doe ratio estimate was 18.7:100 (90% CI = 12.0 – 25.4; Figure 3a). The combination of high buck harvests
0.0
10.0
20.0
30.0
40.0
50.0
60.0
70.0
80.0
90.0
100.0
2008 2009 2010 2011 2012 2013 2014 2015 2016 2017
Ratio
Est
imat
es
0.0
10.0
20.0
30.0
40.0
50.0
60.0
2009 2010 2011 2012 2013 2014 2015 2016 2017 2018
Faw
n:AD
ult R
atio
Est
imat
esFigure 2. Post-hunt (a) buck:doe ratio estimates (black) and fawn:doe ratio estimates (red), and buck:doe ratio management objective (dashed line), 2008 - 2017; and (b) spring fawn:adult ratios with 10-year average (dashed line), 2009 - 2018; for mule deer in the northern subherds of the East Slope Cascades MDMZ.
18

Deer Status and Trend Report 2018
in 2015 and 2016, along with the effects of the 2016-17 winter appear to be responsible for the decline. The 2017 fawn:doe ratio estimate was 61.5:100 (90% CI =51.1 – 71.84; Figure 3a).
a) b)
Kittitas Subherd In 2016, spring population surveys were conducted in southern portion of the zone (Kittitas Subherd; District 8). The estimate was 3,718 deer (90% CI = 3,307-4,494). The southern population was down 40% from 2003 and 10% from the last survey in 2013.
Hunting Seasons and Recreational Harvest Mule deer harvest in much of the East Slope Cascades MDMZ is greatly influenced by the interaction of modern firearm general season dates and weather conditions during this season. A later than average season ending date and significant early high country snow combined to produce a harvest spike in 2015. For the last two years, the calendar cycle has produced slightly earlier general season ending dates and early fall weather conditions have been relatively mild.
Conservative harvest of antlerless mule deer is generally designed to maintain population stability while still providing some recreational opportunity. Liberal harvest of antlerless mule deer is used at times to limit herd growth, or reduce deer numbers in damage areas, or for responses to dramatic changes in carrying capacity such as those associated with large wildfires.
Overall harvest estimates from the last two years indicate a decreasing trend following the harvest increase in 2015, with the total in 2017 falling a little below the 10-year average (Figure 4a). By contrast, hunter days have been up the last two years, so a decline in kills/day in recent seasons is not surprising (Figure 4b).
0
10
20
30
40
50
60
70
80
90
100
2008 2009 2010 2011 2012 2013 2014 2015 2016 2017
Rat
io E
stim
ate
0
5,000
10,000
15,000
20,000
25,000
2008 2009 2010 2011 2012 2013 2014 2015 2016 2017
Popu
latio
n E
stim
ate
Figure 3. Estimates of (a) post-hunt buck:doe (black) and fawn:doe ratios (red) with 90% confidence intervals, and the buck:doe ratio management objective (dashed line) and, (b) abundance estimates with 90% confidence intervals from aerial surveys conducted post-hunt in fall 2010 and 2011 (diamonds) and spring in 2016 and 2017 (triangles), for the Chelan subherd in the East Slope Cascades MDMZ between 2008 and 2017.
19

Deer Status and Trend Report 2018
a) b)
Survival and Mortality Data from past research in the central portion of the East Slope Cascades MDMZ on pregnancy (�̂�𝑝 = 0.95) and fetal rates (𝑓𝑓 = 1.66) , coupled with a high annual adult doe survival rate (�̂�𝑠 = 0.92, n = 50) indicate sufficient recruitment to support a stable to increasing population in this portion of the zone (WDFW 2016). Research investigating survival of adult mule deer in the Methow subherd is ongoing and should provide important insights into population status in coming years.
Habitat The productive, high mountain habitats in this zone make the East Slope Cascades MDMZ extremely important to mule deer. These optimal habitat conditions provide nutritious forage for lactating does and contribute to high fawn survival and recruitment. These habitats are not limited, face little threat of alteration, and are at present self-sustaining. On winter ranges, mule deer move to a small portion of the overall landscape to avoid deep snow, and find forage and thermal cover. This lower elevation habitat is under greater threat of alteration and disturbance; however, 25+ years of securing conservation status for critical areas has improved the long-term outlook.
Habitat related considerations in this zone include continued development and fragmentation of low-elevation habitats, growing use and distribution of off-road vehicles, and increasing disturbance on winter ranges. This is compounded by recent landscape level fires at low elevation and increasing spread of invasive weeds, which result in a reduction of shrub vegetation communities.
Human-Wildlife Interaction Most deer conflict is restricted to the lower elevation irrigated agriculture lands throughout the Zone. Specific Deer Areas have been established in the northern portion of this Zone with antlerless permit hunt seasons designed to target and reduce deer damage. Permit numbers within each Deer Area fluctuate with the level of reported damage incidents. To date, the program is operating smoothly and appears to be helpful in reducing deer damage complaints.
Damage Prevention Cooperative Agreements (DPCA) and Kill permits are also conservatively issued to reduce deer damage throughout the Zone. In 2017, WDFW Conflict Specialists issued
Figure 4. Harvest estimates and 10-yr means (dashed lines) for (a) General State Harvest (gray) and General + Permit State Harvest (blue); and (b) general season estimates and 10-yr mean for hunter days (black) and kills/day (blue); in the East Slope Cascades MDMZ, 2008–2017.
20

Deer Status and Trend Report 2018
only 40 deer (Mule or White-tailed deer) permits to address deer damage throughout the entire East Slope Cascades Mule Deer Management Zone.
Significant road kill occurs in the northern portion of this zone along State Highways 20 and 153 in the Methow Valley and along a 12.5 mile segment of State Highway 97 in the Okanogan Valley. The Okanogan Trails Mule Deer Foundation Chapter and others are working with the WA Department of Transportation to create underpasses(s) along this segment to reduce road kill and provide safer passage. In the central portion of the zone, State Highways 97 and 97A are the major contributors to deer vehicle collisions.
Research A large scale predator-prey study with a mule deer component began in the northern portion of the zone in January 2017. By the end of January 2018 biologists had radio-marked 100 mule deer does. Project staff follow up on mortalities to determine mortality source and where applicable, predation type to the extent possible. Researchers intend to redeploy the collars from deceased deer to maintain a sample size of about 100 throughout the course of the study. The radio-marked animals are also being used to develop a sightability for population estimation for the East Slope Cascades MDMZ that hopefully, will be adapted to other parts of Washington as well.
Management Concerns Extensive loss of winter range shrub forage (primarily to fire) is currently the major management concern in the northern three-fourths of the zone. Modest increases in antlerless harvest were implemented for a few years in the most heavily impacted GMUs. These increases in combination with two moderately tough winters appear to have met the objective of stabilizing or slightly decreasing the local population in the short-term to bring deer numbers in line with the landscape’s reduced carrying capacity, and avoid over-browsing of recovering winter range shrubs. Antlerless harvest levels have returned to conservative pre-fire levels. The issue of winter range shrub loss is compounded by the post-fire conversion of these communities toward invasive weeds, decreasing the capability of the landscape to support deer. These affects are most prominent on dry shallow soils on steep aspects; areas where conditions limit restoration success. In the northern portion of the zone, recent composition counts have documented a decline in post-season fawn:doe ratios reaching a 12-year low in 2017. This occurred during a period of intense summer drought for 3 of the last 4 years, which may be a significant factor in the decline given the importance of high quality summer range for productivity and overall deer health.
Management Conclusions Mule deer populations in the East Slope Cascades MDMZ are currently above the minimum management objective in the north (15-19 bucks:100 does) and the central portion (25 bucks:100 does), and slightly lower in the south, suggesting current buck harvest strategies are sustainable. Recent survey data indicate a decline in the overall population in the zone, supporting a reduction in antlerless harvest. A reversal of the current population trend is anticipated to the extent that winter shrub forage continues to recover, winter conditions moderate, and summer moisture improves.
21

Deer Status and Trend Report 2018
Literature Cited Washington Department of Fish and Wildlife. 2013. Game status and trend report. Wildlife
Program, Washington Department of Fish and Wildlife, Olympia, WA.
Washington Department of Fish and Wildlife. 2016. Washington State mule deer management plan. Wildlife Program, Washington Department of Fish and Wildlife, Olympia, WA. 144 p.
22

Deer Status and Trend Report 2018
Naches Mule Deer Management Zone JEFFREY A. BERNATOWICZ, Wildlife Biologist Introduction The Naches MDMZ is located in central Washington (Figure 1) and includes GMUs 336, 340, 342, 346, 352, 356, 360, 364, and 368.
Management Guidelines and Objectives The Department’s objective within this MDMZ is to maintain a stable population based on field surveys and harvest estimates. Additional management objectives include managing for a post-hunt population with a sex ratio of 15 - 19 bucks:100 does.
Population Surveys Mule deer are present throughout the Naches MDMZ, with the highest densities observed March and April on low elevation winter ranges as the green-up progresses. Spring aerial surveys have been conducted in the zone since 2003 to estimate abundance. In March 2003, the population was estimated at 7,865 deer (90% CI = 7,114-9,086). Spring aerial population surveys have continued in portions of the zone most years and indicated about a 50% decline by 2007 in those portions of the zone surveyed. In 2013, the abundance estimate for the MDMZ was 4,997 (90% CI = 4,587-5,625), down 36% from the zone-wide 2003 estimate (WDFW 2013). In 2017 and 2018 only the northern portion of the zone was flown. The population in the northern portion decreased about 43% from 2015 to 2017, but rebounded slightly in 2018.
Ground surveys have been conducted periodically since the early 1990’s to estimate post-hunt buck:doe ratios for the zone. Surveys were attempted in December 2017, but low sample size precluded a reliable ratio estimate.
Hunting Seasons and Recreational Harvest State harvest trend for the past 10 years has been variable annually, but relatively stable overall (Figure 2). Neither Native American tribe hunting the Naches MDZ officially reports harvest. The Yakama Nation season for bucks is year-round, with antlerless take allowed September through December. The Muckleshoot Indian Tribe restricts harvest to buck-only during the fall.
Figure 1. GMUs and generalized land cover types within the Naches MDMZ.
23

Deer Status and Trend Report 2018
a) b)
Survival and Mortality Telemetry studies conducted by the Muckleshoot Indian Tribe (MIT) started in 2013 are ongoing and will provide managers with some zone-specific survival and movement information. A total of 160 adult female mule deer have been radio-marked by the MIT, and 82 mortalities have been documented to date. Estimates of annual survival rates for adult female mule deer were 0.82 (CI = ± 0.07), 0.81 (CI = ± 0.07), and 0.67 (CI = ± 0.08) for the first 3 years of the study, respectively (D. Vales, unpublished data). Survival estimates are based on a biological year running from 05/15 to 05/14. These estimates are consistent with adult female survival documented in other mule deer populations throughout the west (Bleich and Taylor 1998, Unsworth et al. 1999, Bishop et al. 2005, Hurley et al. 2011, Monteith et al. 2014). However, the survival estimates are lower than observed in the Department’s research conducted in the Columbia Plateau, East Slope Cascades, and Okanogan Highlands MDMZs (WDFW 2016). Predation by cougars has accounted for the highest proportion of the radio-marked deer mortalities in this MDMZ (≈40%). The second and third highest proportions of total mortality were attributed to malnutrition and human-caused mortality, at 26% and 16% of total mortalities, respectively.
Since 2004, some deer in this zone were affected by hair-loss syndrome, a condition caused by an exotic louse. The mule deer population declined in the mid-2000s in this MDMZ and the contributing factors are suspected to have been hair-loss syndrome and exacerbating winter mortality (Bernatowicz et al. 2011). Another suspected, but unconfirmed, pathogen may have been adenovirus. The population has not rebounded to recent historic levels noted before 2004.
Habitat Deer radioed in the northern portion of the winter range disperse through much of the MDMZ, but densities are highest in GMU’s 340 and 342. Harvest data match radio-marked deer distribution. There are currently no measures of habitat quality for this deer zone. Fire, post-fire salvage, and thinning/control burns to reduce fuel have probably affected deer habitat in the last decade. In portions of important range in GMU’s 340 and 342, fire/human alteration has generally increased browse production. The exception has been in more arid portions of GMU 342 where fires have converted shrub-steppe to grassland. Thinning/burning in GMU 352 appears to have converted
Figure 2. Harvest estimates and 10-yr means (dashed lines) for (a) General State Harvest (gray) and General + Permit State Harvest (blue); and b) general season estimates and 10-yr mean for hunter days (black) and harvest/day (blue) in the Naches MDMZ, 2008–2017.
24

Deer Status and Trend Report 2018
many areas to park-like ponderosa pine/grass. The radio-marked deer have made limited use of those areas.
Human-Wildlife Interaction Deer conflicts with agriculture in the Naches District are typically minimal. In 2017-18, there were 8 damage prevention and 4 landowner kill permits issued. Reporting on the permits is generally poor, but harvest is assumed to be low.
Management Concerns
The largest concern in the Naches MDMZ is that deer density remains below historic levels. Surveys and harvest indicate the population is at one of the lowest levels in modern history. During ideal conditions, the population creeps slightly higher, but likely is limited by cougar predation. During recent drought and moderate winters, population declines were significant. Bleich and Taylor (1998) and Robinson et al. (2002) found cougar predation was a limiting factor in some deer populations, but also suggested other factors could be involved. The same may be true in the Naches MDMZ. Cougars are a significant cause of mortality for deer in this zone, but it is unknown if habitat is also a factor.
Wildfires, thinning, and control burns are increasing and may increase browse production in more moist forest zones. In shrub-steppe, fires have converted the range to grass. “Restoration” in arid environments is rarely successful, especially in shallow soil. “Restoration” also involves native plants only, which may limit potential benefits to deer. In light winters following summers with adequate moisture, the population will increase slowly, but will significantly decline during droughts and moderate to severe winters.
Management Conclusions Mule deer populations in the Naches MDMZ are low compared to historic levels. Recent data suggest the population may not recover to historic levels in the near future. There is a trend towards hotter and drier summers, which will make any recovery more difficult. The buck population is typically within the minimum management objective of 15-19 bucks per 100 does. Survey approaches in this MDMZ are still being refined.
Literature Cited Bernatowicz, J. A., K. Mansfield, J. W. Mertins, and W. Moore. 2011. Hair-loss syndrome in deer
in south-central Washington. in McCorquodale, S. M., ed. Proceedings of the 8th Western States and Provinces Deer and Elk Workshop – 2009. Washington Department of Fish and Wildlife, Olympia.
Bishop, C. J., J. W. Unsworth, and E. O. Garton. 2005. Mule deer survival among adjacent
populations in southwest Idaho. Journal of Wildlife Management 69:311-321. Bleich, V.C., and Taylor, T.J. 1998. Survivorship and cause-specific mortality in five populations
of mule deer. Great Basin Naturalist 58:265–272.
25

Deer Status and Trend Report 2018
Hurley, M. A., J. W. Unsworth, P. Zager, M. Hebblewhite, E. O. Garton, D. M. Montgomery, J. R. Skalski, and C. L. Maycock. 2011. Demographic response of mule deer to experimental reduction of coyotes and mountain lions in southeastern Idaho. Wildlife Monographs 178.
Monteith, K. L., V. C. Bleich, T. R. Stephenson, B. M. Pierce, M. M. Conner, J. G. Kie, and
R. T. Bowyer. 2014. Life-history characteristics of mule deer: effects of nutrition in a variable environment. Wildlife Monographs 186.
Robinson, H. S., R. B. Wielgus, and J. C. Gwilliam. 2002. Cougar predation and population growth
of sympatric mule deer and white-tailed deer. Canadian Journal of Zoology 80:556-568. Unsworth, J. W., D. F. Pac, G.C. White, and R. M. Bartmann. 1999. Mule deer survival in
Colorado, Idaho, and Montana. Journal of Wildlife Management 63: 315-326. Washington Department of Fish and Wildlife. 2013. Game status and trend report. Wildlife
Program, Washington Department of Fish and Wildlife, Olympia, WA. Washington Department of Fish and Wildlife. 2016. Washington State Mule Deer Management
Plan, Wildlife Program, Washington Department of Fish and Wildlife, Olympia, WA, USA. 144p.
26

Deer Status and Trend Report 2018
Northern Rocky Mountains Mule Deer Management Zone ANNEMARIE PRINCE, Wildlife Biologist BEN TURNOCK, Wildlife Biologist MIKE ATAMIAN, Wildlife Biologist CARRIE LOWE, Wildlife Biologist Introduction The Northern Rocky Mountains MDMZ is located in northeast Washington and consists of six GMUs (105, 108, 111, 113, 117, and 124; Figure 1).
Management Guidelines and Objectives The Department’s objective within this MDMZ is to maintain a stable population, based on harvest estimates and other best-available information. Additional management objectives include managing for a post-hunt population with a sex ratio of 15-19 bucks:100 does. While mule deer are present at low numbers, the habitat is better suited to white-tailed deer which are the primary focus of management in this zone.
Population Surveys No estimates of mule deer abundance are available for populations within this zone, but the overall mule deer numbers are low given the limited high quality mule deer habitat in the zone.
Hunting Seasons and Recreational Harvest Subsequent to 2006 harvest estimates have fluctuated over time (Figure 2a). Estimates of hunter effort (i.e., hunter days; Figure 2b) and harvest rate (i.e., kills/day; Figure 2b) in this zone include days spent hunting white-tailed deer as well, and are consequently skewed with regard to mule deer-specific harvest. Because this zone is predominantly hunted for white-tailed deer, the true number of days spent hunting only mule deer are substantially lower, and harvest rates higher, than indicated.
Figure 1. GMUs and generalized land cover types within the Northern Rocky Mountains MDMZ.
27

Deer Status and Trend Report 2018
a) b)
Survival and Mortality No estimates of pregnancy, fetal, or survival rates are available for mule deer herds in the Northern Rocky Mountains MDMZ. Cougars, black bears, grizzly bears, and coyotes occur within this MDMZ, as well as 8 wolf packs as of December 31, 2017 (Washington Department of Fish and Wildlife et al. 2018). The effects of predation on this population of mule deer are unknown. Mule deer harvest estimates have fluctuated in the past 10 years with a stable trend over the last 5 years.
Habitat Habitat within the Northern Rocky Mountains MDMZ is predominantly conifer forest, comprising over 70 % of the total land cover within the zone. Forest types include dry forest at low elevations, mainly composed of ponderosa pine and Douglas-fir, to high elevation forest composed of subalpine fir, western larch, Engelmann spruce, whitebark pine, and lodgepole pine. More mesic sites at any elevation contain western red cedar, western hemlock, and grand fir. Outside the winter season mule deer tend to be found at high elevation ridges and basins, except in GMU 124 where they are found year around along the Spokane River and associated tributaries. Most of these high elevation summer ranges are on public land managed for multiple uses, including wildlife conservation. Lands under private ownership are typically managed for long-term timber production. Hence, there appears to be little threat of habitat conversion on mule deer summer ranges within the Northern Rocky Mountains MDMZ. The one exception to this is in GMU 124 where residential development along the Spokane River and tributaries is resulting in loss of habitat. Mule deer are apparently adapting to this development and are often reported as nuisance or damage issues in the towns along the river.
Human-Wildlife Interaction Most mule deer observed within the Northern Rocky Mountains MDMZ are in places where the deer are generally appreciated. Hence, there have been no conflicts reported specific to mule deer, outside of the Spokane area, and all Damage Prevention Cooperative Agreements filed within this zone have been specific to conflicts with white-tailed deer in low elevation farmlands. Within the Spokane area the conflicts with mule deer have typically involved damage to landscaping, and human safety issues, predominantly vehicle deer collisions along Hwy 291 and Northwest Blvd, have also occurred.
Figure 2. Harvest estimates and 10-yr means (dashed lines) for (a) General State Harvest (gray) and General + Permit State Harvest (blue); and (b) general season estimates and 10-yr mean for hunter days (black) and kills/day (blue); in the Northern Rocky Mountains MDMZ, 2008–2017.
28

Deer Status and Trend Report 2018
Management Concerns The primary management concerns for mule deer in the Northern Rocky Mountains MDMZ are that numbers appear to be low and restricted in range by suitable habitat,
Management Conclusions
Mule deer populations in the Northern Rocky Mountains MDMZ are not considered to be at risk based upon hunter harvest metrics. The estimated harvest for 2017 was below the 10-year average, and the lowest harvest observed in the last 10 years.
Literature Cited
Washington Department of Fish and Wildlife, Confederated Colville Tribes, Spokane Tribe of Indians, USDA-APHIS Wildlife Services, and U.S. Fish and Wildlife Service. 2018. Washington Gray Wolf Conservation and Management 2017 Annual Report. Washington Department of Fish and Wildlife, Wenatchee, WA, USA.
Washington Department of Fish and Wildlife. 2016. Washington State mule deer management plan. Wildlife Program, Washington Department of Fish and Wildlife, Olympia, WA. 144 p.
29

Deer Status and Trend Report 2018
Okanogan Highlands Mule Deer Management Zone JEFF HEINLEN, Wildlife Biologist BEN TURNOCK, Wildlife Biologist ANNEMARIE PRINCE, Wildlife Biologist Introduction The Okanogan Highlands MDMZ is located in north-central Washington and includes GMUs 101, 121, and 204 (Figure 1).
Management Guidelines and Objectives The Department’s objective within this MDMZ is to maintain a stable population based on field surveys and harvest estimates. Additional management objectives include managing for a post-hunt population with a sex ratio of 15 – 19 bucks:100 does.
Population Surveys Mule deer are present throughout the Okanogan Highlands MDMZ but are more common in the western portion. Pre-hunt road surveys are conducted for white-tailed deer in the eastern portion of the zone but sample sizes are not sufficient to provide useful information for mule deer.
Hunting Seasons and Recreational Harvest Harvest trends for the past 10 years have been relatively stable (Figure 2a). Hunter days have declined in recent years due to shortened season length and kills/day have remained stable (Figure 2b).
Figure 1. GMUs and generalized land cover types within the Okanogan Highlands MDMZ.
30

Deer Status and Trend Report 2018
a) b)
Survival and Mortality A study involving adult female mule deer in the zone, conducted between 2000 and 2007, indicated survival (𝒔𝒔� = 0.89, 95%CI = 0.87 – 0.91), pregnancy rates (𝒑𝒑� = 0.93, 90%CI = 0.81 – 1.00), and fetal rates (𝒇𝒇� = 1.44, 90%CI = 1.03 – 1.85) in the Okanogan Highlands MDMZ were sufficient to support stable populations (WDFW 2016). The study also found that cougars and deer-vehicle collisions were the most common sources of mortality (WDFW 2016). As of 2014, the Department has been working in collaboration with the University of Washington to provide updated survival information for this zone over the next few years. Predators in the Okanogan Highlands MDMZ include cougars, black bears, coyotes, golden eagles, and wolves (8 wolf packs, occurring mostly in the eastern portion of the zone, have been documented as of December 31, 2017; WDFW 2018).
Habitat Habitat within the Okanogan Highlands MDMZ is predominantly conifer forest, contributing approximately 61% of the total land cover within the zone. Shrub lands combined with upland grass and herbaceous along with agricultural lands make up the next highest level in land cover classes, altogether comprising approximately 33% of the Okanogan Highlands MDMZ area. The Okanogan Highlands MDMZ can also be broken down to about 28% public land and 27% private lands with the remaining 45% comprised of the Colville and Spokane Indian Reservations (WDFW 2016).
Threats to habitat quality within the Okanogan Highlands MDMZ include continued development and fragmentation of low-elevation habitats, increasing use and distribution of off-road vehicles, and increasing prevalence of invasive weeds. In 2015, approximately 272,800 acres were burned by multiple wildfires within the Okanogan Highlands MDMZ. The fires were of varying severities and in some areas mule deer habitat burned very intensely. In 2017, approximately 10,601 acres burned within the Okanogan Highlands MDMZ.
Human-Wildlife Interaction Most deer conflict is restricted to the lower elevation irrigated agriculture lands throughout the Zone. Specific Deer Areas have been established in the western edge of this Zone with antlerless permit hunt seasons designed to target and reduce deer damage. Permit numbers within each Deer
Figure 2. Harvest estimates and 10-yr means (dashed lines) for (a) General State Harvest (gray) and General + Permit State Harvest (blue); and (b) general season estimates and 10-yr mean for hunter days (black) and kills/day (blue); in the Okanogan Highlands MDMZ, 2008– 2017.
31

Deer Status and Trend Report 2018
Area fluctuate with the level of reported damage incidents. To date, the program is operating smoothly and appears to be helpful in reducing deer damage complaints.
The town of Republic has a resident in-town mule deer population that causes property damage and poses a safety threat. In addition to the Deer Area permits, the town of Republic is generally issued kill permits on a yearly basis, so the local police department can address deer issues.
Damage Prevention Cooperative Agreements (DPCA) and Kill permits are also conservatively issued to reduce deer damage throughout the Zone. In 2017, WDFW Conflict Specialists issued 25 mule deer permits to address deer damage throughout the entire Okanogan Highlands MDMZ.
Research
Two research projects dealing with mule and white-tailed deer are ongoing within the Okanogan Highlands MDMZ and a third has recently been completed (Dellinger et al. 2018). All three are in conjunction with the University of Washington dealing with the effects of wolf re-colonization on deer. The two ongoing projects are investigating deer fawn mortality with emphasis on coyotes in areas with and without wolves, and the impacts of recolonizing gray wolves on deer-plant interactions.
Management Concerns Approximately 28% of the land base comprising the Okanogan Highlands MDMZ is in public ownership. Thus, maximizing hunting opportunities largely depends on securing access to private lands. Major sources of mortality to deer, other than hunting, in this zone include predation by native carnivores and vehicle collisions. Severe winter conditions periodically result in a decline in over-winter survival of mule deer in this zone, generally affecting fawns more so than adults. The influence of these factors can complicate how best to balance deer hunting opportunity with herd sustainability.
Management Conclusions Mule deer populations in the Okanogan Highlands MDMZ are considered stable based on harvest data trend.
Literature Cited Dellinger, J.A., Shores, C.R., Marsh, M., Heithaus, M.R., Ripple, W.J. and Wirsing, A.J., 2018.
Impacts of recolonizing gray wolves (Canis lupus) on survival and mortality in two sympatric ungulates. Canadian Journal of Zoology, 96(7) 760-768.
Washington Department of Fish and Wildlife. 2016. Washington State mule deer management plan. Wildlife Program, Washington Department of Fish and Wildlife, Olympia, WA. 144 p.
Washington Department of Fish and Wildlife, Confederated Colville Tribes, Spokane Tribe of Indians, USDA-APHIS Wildlife Services, and U.S. Fish and Wildlife Service. 2017. Washington Gray Wolf Conservation and Management 2016 Annual Report. Washington Department of Fish and Wildlife, Colville, WA, USA.
32

Deer Status and Trend Report 2018
Blue Mountains White-tailed Deer Management Zone
MARK VEKASY, Wildlife Biologist PAUL WIK, Wildlife Biologist Introduction The Blue Mountains White-tailed Deer Management Zone (WDMZ) is located in southeast Washington and consists of 11 GMUs (154, 157, 162, 163, 166, 169, 172, 175, 178, 181, and 186; Figure 1).
Management Guidelines and Objectives The Department’s objective within this WDMZ is to maintain a stable population based on available survey data and harvest estimates. Additional management objectives include managing for a post-hunt population with a sex ratio of 15 - 19 bucks:100 does (WDFW 2010).
Population Surveys White-tailed deer occur throughout the zone but densities are generally greater in the foothills and higher-elevation agricultural areas. Pre-hunt ground surveys are conducted each year to estimate sex and age ratios for both mule and white-tailed deer in portions of the zone and some additional information is recorded for white-tailed deer during post-hunt aerial mule deer surveys. Estimates from our 2017 monitoring effort indicate a slight increase in both buck:doe and fawn:doe ratios (Figures 2a and 2b), suggesting that populations are stable to increasing in the zone.
Figure 1. GMUs and generalized land cover types within the Blue Mountains WDMZ.
33

Deer Status and Trend Report 2018
a) b) Figure 2. Estimates of buck (black) and fawn (red) ratios per 100 does and post-hunt buck objectives (dashed line) from, (a) pre-hunt (ground-based) and (b) post-hunt (aerial and ground) composition surveys in the Blue Mountains WDMZ, 2008–2017. Years where ground counts were below 100 deer have been excluded.
Hunting Seasons and Recreational Harvest Harvest estimates for the past 10 years (Figure 3a) have been stable, as have the number of hunter days and kills/day (Figure 3b). Estimates of hunter days and kills/day are for white-tailed and mule deer combined.
a) b)
Survival and Mortality No estimates of pregnancy, fetal, or survival rates are available for white-tailed deer herds in the Blue Mountains WDMZ. In addition to legal hunter harvest, other potential sources of white-tailed deer mortality include predation, collisions with vehicles, disease (EHD and Bluetongue), and poaching. Predator species living within this zone include cougar, wolves, bobcat, black bear, coyote, golden eagles, and domestic dogs.
Habitat Similar to mule deer in this area, white-tailed deer populations are generally habitat limited. Habitat limitations include conversion to croplands from CRP, grazing by domestic livestock, wildfire suppression, invasion of noxious weeds, extensive wind power development, and urban-
Figure 3. Harvest estimates and 10-yr means (dashed lines) for (a) General (gray) and General + Permit (blue); and (b) general season estimates and 10-yr mean for hunter days (black) and kills/day (blue); in the Blue Mountains WDMZ, 2008–2017.
34

Deer Status and Trend Report 2018
suburban development have been detrimental to available habitat in this zone. Dry conditions that develop during the summer growing season, particularly on the east side of the Blue Mountains, are likely a limiting factor to productivity for white-tailed deer.
Human-Wildlife Interaction The agricultural damage prevention program is managed by WDFW Wildlife program to minimize crop damage through permits in designated Deer Areas, hazing, and Damage Prevention Contract Agreement (DPCA) permits. Landowners are entitled to 2 free kill permits, with the requirement of reporting directly to the Conflict Specialist. Kill Permits make up the majority of damage tags given to landowners. Any additional permits are issued as damage permits with the requirement of purchasing a damage tag and reporting through the licensing system. Most of the harvest has occurred where there would be very little hunting opportunity otherwise, such as in the winery and orchard areas around Walla Walla.
Management Concerns One of the biggest management concerns for white-tailed deer in the District over the past decade has been the occurrence of epizootic hemorrhagic disease (EHD) or Bluetongue outbreaks. The disease is spread by a biting midge (Culicoides spp.), and outbreaks generally occur during drought years when there is limited open water and ample mud for midge breeding habitat, and deer are concentrated near water sources. Our only management option is to gauge the severity of the outbreak, and adjust antlerless permits as appropriate. Habitat conversion is an ongoing issue that has mainly resulted in increasing white-tailed deer damage conflicts. Expansion of residential areas and conversion of crop acreage to wineries and orchards has brought deer into conflict with landowners by eating ornamental shrubs, fruit trees, and vines.
Management Conclusions White-tailed deer populations in the Blue Mountains WDMZ are currently at management objective and harvest data indicate stable to increasing populations where habitat availability and quality allow.
Literature Cited Washington Department of Fish and Wildlife. 2010. Washington State deer management plan:
white-tailed deer. Wildlife Program, Washington Department of Fish and Wildlife, Olympia, WA. 124 p.
35

Deer Status and Trend Report 2018
Columbia Basin White-tailed Deer Management Zone MICHAEL ATAMIAN, Wildlife Biologist CARRIE LOWE, Wildlife Biologist SEAN DOUGHERTY, Wildlife Biologist ELLA ROWAN, Wildlife Biologist DAVID P. VOLSEN, Wildlife Biologist DEVON COMSTOCK, Wildlife Biologist JASON FIDORRA, Wildlife Biologist Introduction The Columbia Basin White-tailed Deer Management Zone (WDMZ) is located in east-central Washington and consists of 8 GMUs (136, 272, 278, 284, 290, 373, 379, and 381; Figure 1).
Management Guidelines and Objectives The Department’s objective within this WDMZ is to maintain a stable population based on harvest trends. The Columbia Basin is not optimal white-tailed deer habitat and there is no management objective to change the distribution or numbers of the few white-tailed deer that reside there (WDFW 2010).
Population Surveys GMUs within this zone are primarily managed for mule deer, but white-tailed deer are present at low densities throughout the Columbia Basin WDMZ. No survey work specific to white-tailed deer is being conducted in this WDMZ at this time.
Hunting Seasons and Recreational Harvest Harvest estimates have remained low but relatively stable over the past decade (Figure 2a), commensurate with availability of preferred habitat. Measures of hunter effort (hunter days; Figure 2b) and harvest rate (kills/day; Figure 2b) in the zone include days spent hunting all deer (i.e., mule deer) so are less useful as indicators of population trend, but indicate generally stable conditions. The decline in harvest and kills/day in 2015 and 2016 is likely due to the 2015 drought and associated Bluetongue outbreak resulting in reduced white-tailed deer numbers and recruitment. The low harvest in 2017 is likely due to a continuing effect of the Bluetongue
Figure 1. GMUs and generalized land cover types within the Columbia Basin WDMZ.
36

Deer Status and Trend Report 2018
outbreak and private landowners (the majority of this zone is private agricultural land) not opening their land to hunters due to perceived low white-tailed deer numbers.
a) b)
Survival and Mortality No estimates of pregnancy, fetal, or survival rates are available for white-tailed deer in the Columbia Basin WDMZ. Similar to mule deer, other sources of mortality in this zone likely include collisions with vehicles, drowning in irrigation canals, poaching, and predation. Predator species living within this zone include cougars, bobcats, black bears, gray wolves (transients have been observed but there are no known packs confirmed within this WDMZ at the time of this writing), coyotes, golden eagles, and domestic dogs. Black bears are not common in open shrub-steppe landscapes, but do occur at low levels in some parts of the Columbia Basin. Cougars are comparatively more common.
Habitat The Columbia Basin zone represents the periphery of white-tailed distribution in central Washington, and habitats present are generally more suitable for mule deer. The overall numbers of white-tailed deer are low in all GMUs within the zone; generally, white-tailed deer are found mostly in the eastern portion of the zone and in association with habitats of very limited extent, such as riparian areas along creeks and streams, CRP grasslands, and non-intensive agricultural tracts. White-tailed deer use in the extensive tracts of shrub-steppe within the zone is not common.
Human-Wildlife Interaction Given the relatively small number of white-tailed deer in this zone there are no significant white-tailed deer specific issues.
Management Concerns Drought and loss of riparian habitat are the most important issue facing white-tailed deer in the Columbia Basin WDMZ. Bluetongue (BT) and Epizootic Hemorrhagic Disease (EHD) also occur in this zone and have caused a relatively small number of isolated mortalities every year. The drop in harvest and kills/day in 2015-2017is likely related to the 2015 drought and associated BT
Figure 2. Harvest estimates and 10-yr means (dashed lines) for General State Harvest (gray) and General + Permit State Harvest (blue); a), and general season estimates and 10-yr mean for hunter days (black) and kills/day (blue); b) in the Columbia Basin WDMZ, 2008–2017.
37

Deer Status and Trend Report 2018
outbreak, although few mortalities were reported in this WDMZ, those reported were all in GMU 136. The western portion of the WDMZ has had a low level of occurrence of these pathogens.
Management Conclusions White-tailed deer populations in the Columbia Basin WDMZ are currently within management objective based on harvest data that indicate a stable population.
Literature Cited Washington Department of Fish and Wildlife. 2010. Washington State deer management plan:
white-tailed deer. Wildlife Program, Washington Department of Fish and Wildlife, Olympia, WA. 124 p.
38

Deer Status and Trend Report 2018
North Cascade Mountains White-tailed Deer Management Zone SCOTT FITKIN, Wildlife Biologist JEFF HEINLEN, Wildlife Biologist Introduction The North Cascade Mountains White-tailed Deer Management Zone (WDMZ) is located in north-central Washington and consists of 11 GMUs (209, 215, 218, 224, 231, 233, 239, 242, 243, 247, and 250; Figure 1).
Management Guidelines and Objectives The Department’s objective within this WDMZ is to maintain stable populations based on harvest estimates (WDFW 2010).
Population Surveys GMUs within the North Cascade Mountains WDMZ are primarily managed for mule deer but white-tailed deer are present at low densities throughout the zone. No formal surveys uniquely designed for white-tailed deer are conducted in this WDMZ.
Hunting Seasons and Recreational Harvest Harvest estimates for the last 10 years have been low compared with mule deer harvest but relatively stable (Figure 2a). Estimates of hunter effort (which include mule deer hunters as well) and harvest rates have been variable in recent years, generally tracking the trends seen with mule deer (Figure 2b). This is to be expected since many hunters will harvest either species opportunistically during the general seasons.
Figure 1. GMUs and generalized land cover types within the North Cascade Mountains WDMZ.
39

Deer Status and Trend Report 2018
a) b)
Survival and Mortality No estimates of pregnancy, fetal, or survival rates are available for white-tailed deer in the North Cascade Mountains WDMZ. Mortality sources in this zone include legal hunting, vehicle collisions, domestic dogs, poaching, and predation. Several predators occur within the North Cascade Mountains WDMZ including coyotes, black bears, cougars, and wolves (2 wolf packs have been documented within the zone as of this writing) but the effects of predation on white-tailed deer in this zone are unknown.
Habitat Habitat related considerations in this zone include continued development and fragmentation of low-elevation habitats, increasing use and distribution of off-road vehicles, and increasing prevalence of invasive weeds.
Human-Wildlife Interaction Most deer conflict is restricted to the lower elevation irrigated agriculture lands throughout the Zone. Specific Deer Areas have been established in the northern portion of this Zone with antlerless permit hunt seasons designed to target and reduce deer damage. Permit numbers within each Deer Area fluctuate with the level of reported damage incidents. To date, the program is operating smoothly and appears to be helpful in reducing deer damage complaints.
Damage Prevention Cooperative Agreements (DPCA) and Kill permits are also conservatively issued to reduce deer damage throughout the Zone. In 2017, WDFW Conflict Specialists issued only 18 deer (Mule or White-tailed deer) permits to address deer damage throughout the entire North Cascade Mountains White-tailed Deer Management Zone.
Significant road kill occurs in the northern portion of this zone in the Methow Valley and along a 12.5 mile segment of State Highway 97. The Okanogan Trails Mule Deer Foundation Chapter and others are working with the WA Department of Transportation to create underpasses along Hwy 97 to reduce road kill and provide safer passage.
Figure 2. Harvest estimates and 10-yr means (dashed lines) for (a) General State Harvest (gray) and General + Permit State Harvest (blue); and (b) general season estimates and 10-yr mean for hunter days (black) and kills/day (blue); in the North Cascade Mountains WDMZ, 2008–2017.
40
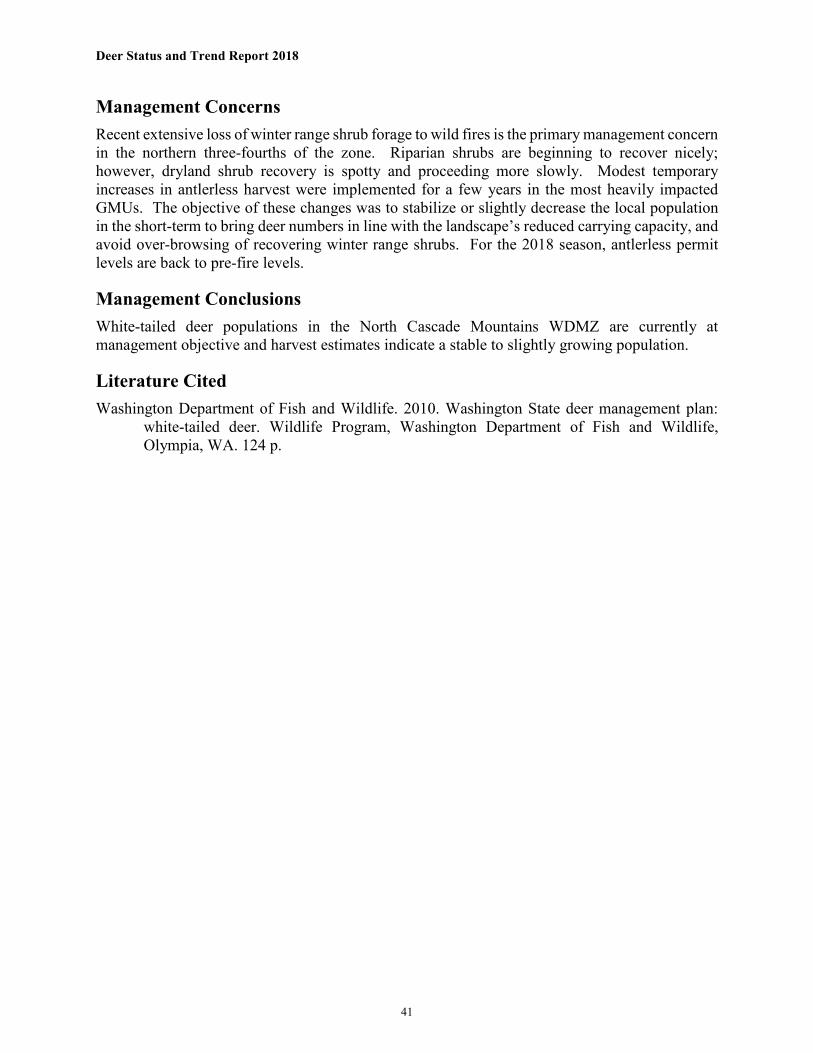
Deer Status and Trend Report 2018
Management Concerns Recent extensive loss of winter range shrub forage to wild fires is the primary management concern in the northern three-fourths of the zone. Riparian shrubs are beginning to recover nicely; however, dryland shrub recovery is spotty and proceeding more slowly. Modest temporary increases in antlerless harvest were implemented for a few years in the most heavily impacted GMUs. The objective of these changes was to stabilize or slightly decrease the local population in the short-term to bring deer numbers in line with the landscape’s reduced carrying capacity, and avoid over-browsing of recovering winter range shrubs. For the 2018 season, antlerless permit levels are back to pre-fire levels.
Management Conclusions White-tailed deer populations in the North Cascade Mountains WDMZ are currently at management objective and harvest estimates indicate a stable to slightly growing population.
Literature Cited Washington Department of Fish and Wildlife. 2010. Washington State deer management plan:
white-tailed deer. Wildlife Program, Washington Department of Fish and Wildlife, Olympia, WA. 124 p.
41

Deer Status and Trend Report 2018
Okanogan Highlands White-tailed Deer Management Zone
JEFF HEINLEN, Wildlife Biologist ANNEMARIE PRINCE, Wildlife Biologist Introduction The Okanogan Highlands White-tailed Deer Management Zone is located in north-central Washington and includes GMUs 101 and 204 (Figure 1).
Management Guidelines and Objectives The Department’s objective within this WDMZ is to maintain stable populations based on field surveys and harvest estimates. Additional management objectives include managing for a post-hunt population with a sex ratio of 15-19 bucks:100 does (WDFW 2010).
Population Surveys White-tailed deer are present throughout the Okanogan Highlands WDMZ but are more common in the eastern portion. Because estimates of total white-tailed deer abundance in this zone are not practical, pre-hunt ground surveys are conducted in the eastern half of the zone to estimate buck:doe ratios (a rough annual measure of the effect of harvest on the population) over time. The pre-hunt buck:doe ratio estimate for 2017 was 32:100 (n = 154) and is consistent with the average ratio for the last 7 years (2011 – 2017) of 32:100 (range = 24 - 38, n = range of 128 - 266 deer classified each year). However, the forested landscape and limited visibility experienced during road surveys in this zone generally result in low sample sizes which prevent calculation of confidence intervals and limit any conclusions that can be made about the status of population in the Okanogan Highlands.
Hunting Seasons and Recreational Harvest Harvest estimates have been mostly stable over the last decade (Figure 2a). Except for a slight increase in 2015 of kills/day, number of hunter days reported and kills/day have been stable (Figure 2b).
Figure 1. GMUs and generalized land cover types within the Okanogan Highlands WDMZ.
42

Deer Status and Trend Report 2018
a) b)
Survival and Mortality No estimates of pregnancy, fetal, or survival rates are available for white-tailed deer in the Okanogan Highlands WDMZ.
In addition to legal hunter harvest, other potential sources of white-tailed deer mortality include disease, poaching, collisions with vehicles, and predation. Predator species living within this zone include cougar, bobcat, black bear, gray wolf (7 packs were documented as of December 31, 2017; WDFW et al. 2018), coyote, golden eagles, and domestic dogs.
Habitat Habitat within the Okanogan Highlands WDMZ is predominantly conifer forest, contributing approximately 55% of the total land cover within the zone. Shrub land combined with grassland, pasture, and cultivated crops make up the next highest level in land cover classes, altogether comprising approximately 41% of the Okanogan Highlands WDMZ area. These cover classes combined produce the highest densities of white-tailed deer, particularly in the valley bottoms where deer have both forage and cover resources in close proximity. Although cultivated crops alone account for only 0.7% of the aforementioned land cover, their influence on support of the white-tailed deer population cannot be overstated. The Okanogan Highlands WDMZ can also be broken down to about 31% public land and 19% private lands with the remaining 50% comprised of the Colville Indian Reservation (WDFW 2010).
Threats to habitat quality within the Okanogan Highlands WDMZ include continued development and fragmentation of low-elevation habitats, increasing use and distribution of off-road vehicles, and increasing prevalence of invasive weeds. In 2015, approximately 208,800 acres were burned by multiple wildfires within the Okanogan Highlands WDMZ.
Human-Wildlife Interaction Most deer conflict is restricted to the lower elevation irrigated agriculture lands throughout the Zone. Specific Deer Areas have been established in the western edge of this Zone with antlerless permit hunt seasons designed to target and reduce deer damage. Permit numbers within each Deer Area fluctuate with the level of reported damage incidents. To date, the program is operating
Figure 2. Harvest estimates and 10-yr means (dashed lines) for (a) General State Harvest (gray) and General + Permit State Harvest (blue); and (b) general season estimates and 10-yr mean for hunter days (black) and kills/day (blue); b) in the Okanogan Highlands WDMZ, 2008–2017.
43

Deer Status and Trend Report 2018
smoothly and appears to be helpful in reducing deer damage complaints. Damage Prevention Cooperative Agreements (DPCA) and kill permits are also issued to reduce deer damage throughout the Zone.
Research Two research projects dealing with mule and white-tailed deer are ongoing within the Okanogan Highlands MDMZ and a third has recently been completed (Dellinger et al. 2018). All three are in conjunction with the University of Washington dealing with the effects of wolf re-colonization on deer. The two ongoing projects are investigating deer fawn mortality with emphasis on coyotes in areas with and without wolves, and the impacts of recolonizing gray wolves on deer-plant interactions.
Management Concerns As less than half the land base comprising the Okanogan Highlands WDMZ is in public ownership (31%), maximizing hunting opportunities largely depends on securing access to private lands. Closely coupled to this concern is the availability of cultivated crop land cover, particularly cereal grain and alfalfa hay to the deer. Cultivated crops are a major driver to white-tailed deer density and productivity in northeastern Washington and beyond. Besides hunting the other major sources of mortality to deer in this zone include predation by both native carnivores and domestic dogs, and road kills from collision with automobiles. Periodically, but unpredictably, a severe winter will cause major deer loss. Also unpredictable are summer heat and drought that foster conditions for severe outbreaks of hemorrhagic disease. The influence of these diverse factors can greatly complicate how best to balance deer hunting opportunity with herd sustainability.
Management Conclusions White-tailed deer populations in the Okanogan Highlands WDMZ are currently at management objective and harvest data indicate a stable population.
Literature Cited Dellinger, J.A., Shores, C.R., Marsh, M., Heithaus, M.R., Ripple, W.J. and Wirsing, A.J., 2018.
Impacts of recolonizing gray wolves (Canis lupus) on survival and mortality in two sympatric ungulates. Canadian Journal of Zoology, 96(7) 760-768.
Washington Department of Fish and Wildlife, Confederated Colville Tribes, Spokane Tribe of Indians, USDA-APHIS Wildlife Services, and U.S. Fish and Wildlife Service. 2018. Washington Gray Wolf Conservation and Management 2017 Annual Report. Washington Department of Fish and Wildlife, Colville, WA, USA.
Washington Department of Fish and Wildlife. 2010. Washington State deer management plan: white-tailed deer. Wildlife Program, Washington Department of Fish and Wildlife, Olympia, WA. 124 p.
44

Deer Status and Trend Report 2018
Palouse White-tailed Deer Management Zone MICHAEL ATAMIAN, Wildlife Biologist MARK VEKASY, Wildlife Biologist PAUL WIK, Wildlife Biologist CARRIE LOWE, Wildlife Biologist Introduction The Palouse White-tailed Deer Management Zone is located in east-central Washington and consists of 7 GMUs in Districts 2 and 3 (127, 130, 133, 139, 142, 145, 149; Figure 1).
Management Guidelines and Objectives The Department’s objective within this WDMZ is to maintain a stable population based on available survey data and harvest trends. Additional management objectives include managing for a post-hunt population with a sex ratio of 15 to 19 bucks per 100 does (WDFW 2010).
Population Surveys White-tailed deer are present at moderate to high densities throughout the Palouse WDMZ. The Palouse WDMZ is split into two areas for management purposes; the North Palouse comprised of those GMUs north of the Snake River (GMUs 127 – 142; District 2) and the South Palouse comprised of those GMUs south of the Snake River (GMUs 145 and 149; District 3).
North Palouse Pre-hunt ground surveys are conducted throughout the North Palouse. The goal of these surveys is to estimate deer herd composition not population size, therefore routes are altered annually, as needed, to reflect changes in habitat and agricultural crops. Routes are run twice each year; once in August for buck to doe ratios to estimate buck recruitment and once in September for fawn to doe ratios to estimate fawn production. Though the ratio data indicate stable recruitment of bucks, production of fawns has been low the past two years. Drought conditions and the associated Bluetongue (BT) outbreak in 2015 were likely factors in the decrease seen in 2016 (Figure 2) and a hard winter in 2016-2017 likely contributed to the low fawn to doe ratio in 2017. Ratio estimates should not be interpreted as an index to population abundance, they are a relative annual measure of the effect of harvest and reproduction on deer populations and provide a general indication of whether a population is stable, increasing, or decreasing. In conjunction with harvest estimates, these measures are used to inform management decisions each year.
Figure 1. GMUs and generalized land cover types within the Palouse WDMZ.
45

Deer Status and Trend Report 2018
South Palouse White-tailed deer are not a management focus in the South Palouse, where they comprise roughly one-quarter of the total deer harvest, most of the management is directed towards mule deer, and any population information for white-tailed deer is incidental to that collected for mule deer. Pre-hunt ground surveys are conducted throughout the 2 GMUs, but sample sizes for white-tailed deer from ground composition surveys are too small and variable to be useful. For a baseline reference, we conducted an aerial survey in December 2017, sampling across portions of GMUs 145 and 149 and obtained a raw count of 669 white-tailed deer. We flew surveys following sightability model protocols, but the model was not designed nor validated for white-tailed deer, so we did not calculate a survey area estimate. The post-hunt buck:doe ratio was 31.8 (90% CI = 22.9-44.3), and the fawn:doe ratio was 65.6 (90% CI = 57.9-74.3). We conducted a previous survey of a similar area during December 2014, in the northern half of GMU 149 and obtained a raw count of 369 white-tailed deer, with a post-hunt buck:doe ratio of 26.3 (90% CI = 19.8-32.8) and a fawn:doe ratio of 46.9 (90% CI = 37.6-56.3). White-tailed deer numbers are higher in the southern half of the GMU, so the small number counted during aerial surveys is not surprising.
Hunting Seasons and Recreational Harvest Harvest has remained relatively stable over the past decade (Figure 3a). Estimates of hunter effort for the zone have generally been stable during the past 10 years while estimates of kills/day have fluctuated in response to absolute harvest values (Figure 3b). Estimates of hunter effort (i.e., hunter days; Figure 3b) in this zone are not white-tailed specific and include days spent hunting mule deer, while kill data is specific to white-tailed deer, therefore kills/day estimates are biased low. Similar to ratio estimates discussed above, the low harvest and decline in kills/day in 2015 and 2016 was likely due to the 2015 drought and associated BT outbreak resulting in immediate mortalities and poor recruitment the following year. The low harvest and kills/day in 2017 is likely due to a lag effect of the BT outbreak and the hard winter of 2016-17. White-tailed deer populations in the Palouse appear to be slowly recovering from these events.
Figure 2. Estimated pre-hunt fawn:doe (◊) and buck:doe (◊) ratios and associated 90% confidence intervals in North Palouse WDMZ (GMUs 127 – 142), 2008–2017.
46

Deer Status and Trend Report 2018
a) b)
Survival and Mortality No estimates of pregnancy, fetal, or survival rates are available for white-tailed deer in the Palouse WDMZ. Similar to mule deer, sources of mortality in this zone include harvest, collisions with vehicles, poaching, and predation. Predator species living within this zone include cougars, bobcats, black bears, coyotes, golden eagles, and domestic dogs.
Habitat The Palouse WDMZ includes five broad habitat types: active agricultural fields, Conservation Reserve Program (CRP) fields (primarily grasslands), a native grass/shrub complex (primarily along the breaks of the Snake River), coniferous forest, and riparian. Locations obtained during aerial and ground surveys have shown a relationship between white-tailed deer and riparian corridors, primarily the Palouse, Spokane, Little Spokane, Touchet, Tucannon, and Walla Walla Rivers and some creeks and hollows, such as Rock, Union Flat, Meadow, and Deadman Creeks.. We observed fewer white-tailed deer than mule deer along the Snake River breaks and unbroken CRP fields, and more whitetails associated with shrubby draws intermixed with active agricultural fields. Coniferous forest habitat exists primarily in the north of this WDMZ and is intensively used by white-tailed deer, especially when it is associated with agricultural fields. White-tailed deer have also taken advantage of larger acreage (10-20 acre) semi-rural development where forage and cover is present and predation risk (human and non-human) is reduced.
Human-Wildlife Interaction High numbers of vehicle collisions with white-tailed and mule deer are a problem along State Highways 195, 26 and 2, and Interstate 90 in the North Palouse WDMZ. WDFW is working with the Washington State Department of Transportation to identify hot spots and come up with solutions.
Additionally, crop damage is reported annually in some portions of all GMUs in the North Palouse and is likely to increase as farmers switch to higher value crops like garbanzo beans. Antlerless harvest is the primary tool used to address crop damage; we apply it both at a broad (GMU-wide) scale through general season antlerless opportunity for archery, muzzleloader, youth, senior,
Figure 3. Harvest estimates and 10-yr means (dashed lines) for (a) General State Harvest (gray) and General + Permit State Harvest (blue); and (b) general season estimates and 10-yr mean for hunter days (black) and kills/day (blue);in the Palouse WDMZ, 2008–2017.
47

Deer Status and Trend Report 2018
disabled, and antlerless only second deer tags (1150 in 2017), as well as at the individual landowner scale through damage and kill permits (118 issued in 2017).
Deer crop damage complaints in the South Palouse WDMZ, as measured by damage permits issued, account for approximately 44% of the permits issued across District 3, but the majority of complaints are related to mule deer. There are isolated damage issues with white-tailed deer along the boundary of GMU 149 with GMU 154 near Walla Walla, where some orchard, vineyard, and strawberry damage is attributable to whitetails. In response to increasing damage complaints, antlerless permit numbers since 2013 have increased by 200 across both GMUs, with 45 of those permits specifically for white-tailed deer.
Management Concerns Mass conversion of natural habitats to agriculture occurred over the past century, but represent relatively minor changes today. Gains have been made in deer habitat with enrollment of agricultural acres into the Conservation Reserve Program (CRP). However, with current wheat, lentil, garbanzo bean, and hay prices, several landowners have chosen not to re-enroll in CRP after their contracts expired. In addition, there has been a recent reduction in funding available for CRP, and many expiring contracts have not been eligible for renewal.
Habitat loss due to development is of concern in GMUs 127 and 130, with the redistribution of Spokane’s urban populations outward into rural settings. High-density development (>1house per acre) removes less habitat than low-density development (<1house per 10 acres), but tends to permanently displace deer. While low-density development incorporates more habitat, direct disturbance is less, and more habitat is usable by deer post-construction. However, these deer tend to become damage/nuisance deer. Currently the district promotes high-density clustered development with larger open space areas, with the hope of maintaining larger tracts of habitat that supply some connectivity.
Bluetongue (BT) and Epizootic Hemorrhagic Disease (EHD) occur in this zone and likely cause a small number of isolated mortalities every year. During droughts, these disease events can be more severe and can affect white-tailed deer herds across multiple Management Zones. This occurred in 2015 when white-tailed deer deaths related to BT were reported in the Palouse, Columbia Basin, and Selkirk WDMZs.
Management Conclusions Based on harvest metrics and limited survey data, white-tailed deer populations in the Palouse WDMZ appear to be meeting management objective.
Literature Cited Washington Department of Fish and Wildlife. 2010. Washington State deer management plan:
white-tailed deer. Wildlife Program, Washington Department of Fish and Wildlife, Olympia, WA. 124 p.
48

Deer Status and Trend Report 2018
Selkirk White-tailed Deer Management Zone MICHAEL ATAMIAN, Wildlife Biologist ANNEMARIE PRINCE, Wildlife Biologist CARRIE LOWE, Wildlife Biologist Introduction The Selkirk WDMZ is located in northeast Washington and consists of 7 Game Management Units (GMUs 105, 108, 111, 113, 117, 121, and 124; Figure 1).
Management Guidelines and Objectives The Department’s objective within this WDMZ is to maintain a stable population based on harvest estimates and available survey data. Additional management objectives include managing for a post-hunt population with a sex ratio of 15 to 19 bucks:100 does (WDFW 2010).
GMUs 105 through 121 have similar rural characteristics, climatic traits, land ownership patterns, and cover types; hence management prescriptions and white-tailed deer hunting regulations are uniform throughout these 6 GMUs.
GMU 124, however, is dominated by the metropolitan area of Spokane in the south of the unit and extensive small agricultural properties in the north valleys interspersed with conifer forest in the foothills and mountains. Many of these small, private property owners do not allow hunting, thus functioning as quasi-sanctuaries. This combined with the generally milder winters in GMU 124 results in greater deer abundance than in the northern GMUs. Consequently, hunting regulations are formulated to be more liberal as a mechanism to help keep the white-tailed deer population within local landowner tolerance.
Population Surveys To date, a reliable estimate of the deer population size for this zone has been unattainable due to forest cover, deer behavior, and staff and funding limitations. As a result, ground surveys are conducted in the Selkirk zone to estimate age and sex ratios which provide managers with a relative measure of the effect of harvest (bucks:100 does) and reproduction (fawns:100 does) on deer
Figure 1. GMUs and generalized land cover types within the Selkirk WDMZ.
49

Deer Status and Trend Report 2018
population status within the zone. These measures are used to inform management decisions each year. The pre-hunt buck:doe ratio estimates from surveys conducted in GMUs 105-121 during the last 10 years (Figure 2) indicate no significant change since 2014. The fawn:doe ratio estimate was 46:100 (90% CI = 36-55, n = 725) in 2017, near the 10-year average of 48:100.
In GMU 124, the pre-hunt buck:doe ratio estimate was 27:100 (90% CI = 14-50, n = 251) in 2017, similar to the 10-yr average of 28:100. The fawn:doe ratio estimate was 56:100 (90% CI = 49-63, n = 358) in 2017, near the 10-year average of 57:100.
Hunting Seasons and Recreational Harvest Estimates of white-tailed deer harvest in this zone indicate a decline between 2008 and 2011, coincident with two consecutive harsh winters in 2008 and 2009 which suppressed fawn recruitment. White-tailed deer populations generally rebound quickly from such temporary weather- and disease-related events, due to their naturally high reproductive potential (McCullough 1987). To support faster recovery WDFW also reduced antlerless harvest opportunity. Estimates of harvest and kills/day (Figure 3), as well as ratio estimates from our annual ground surveys, indicate populations have recovered from the 2 harsh winters deer populations experienced in the zone a decade ago.
a) b)
Survival and Mortality Estimates of survival of adult does in the zone (�̂�𝑠 = 0.87, SD = 0.05; Henderson 2014) and the stable trend seen in fawn:doe ratio estimates over the last decade indicate recruitment is sufficient to support continued population growth in the Selkirk WDMZ. Mortalities documented during the
0
10
20
30
40
50
60
70
80
90
100
2008 2009 2010 2011 2012 2013 2014 2015 2016 2017
Rat
io E
stim
ate
Figure 2. Estimated pre-hunt buck:doe ratios, 90% CIs, and 10-yr average (dotted line) for GMUs 105-121 in the Selkirk WDMZ, 2008-2017.
Figure 3. Harvest estimates and 10-yr means (dashed lines) for (a) General State Harvest (gray) and General + Permit State Harvest (blue); and (b) general season estimates and 10-yr mean for hunter days (black) and kills/day (blue); in the Selkirk WDMZ, 2008–2017.
50

Deer Status and Trend Report 2018
study were predominantly due to cougars, domestic dogs, and deer-vehicle collisions (Henderson 2014). Other predators in this zone include black bear, grizzly bear, coyote, wolves (10 packs have been documented in this zone as of this writing [WDFW et al. 2018]), and golden eagles.
Regarding recent disease concerns in the zone, white-tailed deer populations throughout the country can be affected, to varying degrees, each fall by different hemorrhagic diseases; most often Epizootic Hemorrhagic Disease (EHD) and Bluetongue Disease. Bluetongue and EHD both naturally occur in this zone and typically cause a relatively small number of mortalities every year. During severe droughts, as happened in fall 2015, these disease events can be more pronounced and affect localized white-tailed deer herds in multiple Management Zones. Because regional weather patterns can substantially affect the scale and locality of an outbreak, incidences are neither predictable nor preventable. Though intense outbreaks, like that experienced in the Selkirk WDMZ in 2015, can be alarming, white-tailed deer appear to be well adapted to survive such ecological challenges due to high reproductive potential (McCullough 1987).
Habitat Habitat within the Selkirk WDMZ is predominantly conifer forest, contributing approximately 68% of the total land cover within the zone. Shrub land combined with grassland, pasture, and cultivated crops make up the next highest level in land cover classes, altogether comprising nearly 21% of the Selkirk WDMZ area. These cover classes combined produce the highest densities of white-tailed deer, particularly within the farm and forest mosaic where deer have both forage and cover resources in close proximity. Although cultivated crops alone account for only 2.4% of the aforementioned land cover, their influence on support of the white-tailed deer population cannot be overstated. The Selkirk WDMZ can also be broken down to about 37% public land and 57% private lands with the remaining 6% in other categories (WDFW 2010).
Human-Wildlife Interaction The Selkirk WDMZ is home to the largest populations of white-tailed deer in the state. Areas with large concentrations of agricultural and suburban land uses tend to attract and perpetuate greater densities of white-tailed deer than would normally occur in the wild. This interaction often leads to increased incidence of human-wildlife conflict and increased deer mortality due to vehicle collisions. A study looking at collision rates in Washington indicates that deer-vehicle collisions in this zone are consistently among the highest in the state (Myers et al. 2008). To reduce vehicle collision rates and complaints due to deer damage, the Department has worked with local landowners and county and municipal stakeholders to provide increased antlerless harvest opportunity and reduce deer densities in specific high-risk Deer Areas. A total of 118 white-tailed deer damage prevention permits and 17 kill permits were issued within this zone to landowners dealing with deer damage and enrolled in Damage Prevention Cooperative Agreements in 2017.
51

Deer Status and Trend Report 2018
Research Henderson (2014) examined how habitat quality influences migratory strategy of female white-tailed deer within the Selkirk WDMZ. Using GPS-collared female white-tailed deer, an evaluation was accomplished on the influence of deer access to high quality winter habitat based upon the probability of an individual migrating, the differences in seasonal habitat use between and within migratory and resident classes of deer, and the effects of this decision on the survival of female white-tailed deer. Study results found little difference between annual and seasonal rates of deer survival and that the presence of partial migration within this white-tail population may be a response to competition for high quality habitat (Henderson 2014).
Management Concerns As less than half the land base comprising the Selkirk WDMZ is in public ownership (37%), maximizing hunting opportunities largely depends on securing access to private lands. Closely coupled to this concern is the availability of cultivated crop land cover, particularly cereal grain and alfalfa hay to the deer. Cultivated crops are a major driver to white-tailed deer density and productivity in northeastern Washington and beyond. Besides hunting the other major sources of mortality to deer in this zone include predation by both native carnivores and domestic dogs, and road kills from collision with automobiles on public roadways. Periodically, but unpredictably, a severe winter will cause major deer loss. Also unpredictable are summer heat and drought that foster conditions for severe outbreaks of hemorrhagic disease. The influence of these diverse factors can greatly complicate how best to balance deer hunting opportunity with herd sustainability.
Management Conclusions White-tailed deer populations in this zone are considered stable and within management objectives based on harvest, survey, and survival data available for the zone.
Literature Cited Henderson, C. R. 2014. Habitat quality influences migratory strategy of female white-tailed deer.
Thesis, University of Montana, Missoula, USA.
McCullough, D. R. 1987. The theory and management of Odocoileus populations. Pages 535-549 in C. M. Wemmer, ed. Biology and Management of the Cervidae. Smithsonian Institution Press, Washington, D.C.
Myers, W. L., W. Y. Chang, S. S. Germaine, W. M. Vander Haegen, and T. E. Owens. 2008. An analysis of deer and elk-vehicle collision sites along state highways in Washington State. Completion Report. Washington Department of Fish and Wildlife. Olympia, WA. 40 p.
Washington Department of Fish and Wildlife. 2010. Washington State deer management plan: white-tailed deer. Wildlife Program, Washington Department of Fish and Wildlife, Olympia, WA. 124 p.
52

Deer Status and Trend Report 2018
Washington Department of Fish and Wildlife, Confederated Colville Tribes, Spokane Tribe of Indians, USDA-APHIS Wildlife Services, and U.S. Fish and Wildlife Service. 2018. Washington Gray Wolf Conservation and Management 2017Annual Report. Washington Department of Fish and Wildlife, Wenatchee, WA, USA.
53

Deer Status and Trend Report 2018
Islands Black-tailed Deer Management Zone RUTH MILNER, Wildlife Biologist MATT HAMER, Wildlife Biologist
Introduction
The Islands Black-tailed Deer Management Zone (BDMZ) is located in the Puget Sound in northwest Washington and consists of 11 GMUs (410-417 and 419-422; Figure 1).
Management Guidelines and Objectives The Department’s objective within this BDMZ is to maintain or reduce the population based on best available knowledge for each island.
Population Surveys There are no population surveys being conducted in the Islands BDMZ at this time.
Hunting Seasons and Recreational Harvest Harvest trend over the last decade indicates an increase, (Figure 2a) similar to the number of hunter days and kills/day (Figure 2b). Harvest in 2017 was slightly below the 10 year mean.
a) b)
Figure 2. Harvest estimates and 10-yr means (dashed lines) for (a) General State Harvest (gray) and General + Permit State Harvest (blue); and (b) general season estimates and 10-yr mean for hunter days (black) and kills/day (blue); in the Islands BDMZ, 2008–2017.
Figure 1. GMUs and generalized land cover types within the Islands BDMZ.
54

Deer Status and Trend Report 2018
Most of the islands in the BDMZ offer antlerless only second tag special permits as a means to reduce deer densities and increase hunting opportunity. Publicly owned land is extremely limited in the BDMZ; public land owners that allow hunting on some properties include the Washington Department of Natural Resources, Bureau of Land Management, San Juan County Land Bank, and Washington Department of fish and Wildlife, and Island County Public Works Department. Contact information for these agencies in the Islands BDMZ is found in the “2018 District 13 Hunting Prospects”, available on the WDFW website. Survival and Mortality No information regarding vital rates is available for black-tailed deer in the Islands BDMZ. In addition to legal hunter harvest, other potential sources of mortality include predation by coyotes on Whidbey, Camano, Guemes and Vashon Islands (the sole large predator in this zone, but absent in the San Juan Archipelago), collisions with vehicles, and poaching.
Habitat Habitat in the Islands BDMZ generally consists of a mosaic of alder, big-leaf maple or second growth Douglas fir forests intermixed with openings created by small regenerating clear cuts, agricultural fields, hobby farms and horticultural plantings associated with homes and gardens. Although small towns exist on most of the larger islands serviced by the Washington Department of Transportation (WSDOT) ferries, most of the islands retain a highly rural character that provides abundant habitat for black-tailed deer. Human development affects the amount of habitat available for deer in the island GMUs, particularly on the larger islands where local deer populations are apparently very robust. This may be a response to edge habitats and inadvertent forage enhancements such as gardens and ornamental plantings, which provide abundant food in safe environments where hunting is limited or prohibited.
Human-Wildlife Interaction Vehicle collisions are common on all the larger islands in this BDMZ. Deer may be encountered any time during the day or night and complaints from residents about deer on roadways are frequent. Tolerance for high deer populations vary among island residents. Some are anti-hunting and often feed the deer while others favor aggressive reductions in the current populations.
Damage complaints regarding deer depredation on farm crops, ornamental plantings, and conifer seedlings occur throughout the Islands BDMZ. In 2017, seven deer in the Islands BDMZ were harvested under permits issued to landowners experiencing agricultural damage by deer. Deer depredation has altered the understory habitat conditions and resulted in reduced diversity of avian species on many islands (Martin et al. 2013). Deer predation has also been identified as a key factor hindering the recovery of the Island Marble Butterfly on San Juan Island, where deer browse flowering plants containing butterfly eggs and larvae (Lambert 2014). Deer also browse the flowers of Golden Paint Brush on Whidbey Island prohibiting the plants from setting seed that is needed for restoration projects.
55

Deer Status and Trend Report 2018
Management Concerns In 2013, most of the islands in the BDMZ were split into individual GMUs, in an effort to better understand hunter access and harvest trends on each island where deer occur. Previously, all of the islands were lumped into one or two large GMUs. In spite of outreach efforts to educate hunters of the change, hunters continue to report their harvest using the previously assigned GMU number, thus hindering our ability to assess deer management on an island-by island basis. Although accurate reporting improved in 2017, erroneous GMU reporting continues, complicating harvest assessments for individual islands.
Management Conclusions Based on our harvest data, black-tailed deer populations in the Islands BDMZ are currently at or above management objective with an increasing trend.
Literature Cited
Lambert, A.M. 2014. Island Marble Butterfly (Euchloe ausonides insulanus) Deer herbivory research, 2013. American Camp. San Juan Island National Historical Park, National Park Service unpublished report.
Martin, T.G, P. Arcese, P.M. Kuhnert, A.J. Gaston and J.-L Martin. 2013. Prior information reduces uncertainty about the consequences of deer overabundance on forest birds. Biological Conservation 165:10-17.
56

Deer Status and Trend Report 2018
North Cascade Mountains Black-tailed Deer Management Zone ROBERT WADDELL, Wildlife Biologist MIKE SMITH, Wildlife Biologist
Introduction
The North Cascade Mountains Black-tailed Deer Management Zone (BDMZ) is located in northwest Washington and consists of 11 GMUs (407, 418, 426, 437, 448, 450, 454, 460, 466, 485, and 490; Figure 1).
Management Guidelines and Objectives The Department’s objective within this BDMZ is to maintain a stable population, based on harvest estimates and other best available information. Additional management objectives include managing for a post-hunt population with a sex ratio of approximately 15 - 19 bucks:100 does.
Population Surveys Due to the difficulties of surveying black-tailed deer in the dense habitats they occupy, no formal estimates of abundance are available in this zone. However, annual harvest estimates indicate that this population is fairly stable.
Hunting Seasons and Recreational Harvest Harvest estimates for the past 10 years indicate a slow rise in harvest, commensurate with increases in hunter effort in the zone (Figures 2a and 2b). However, the 2017 harvest estimate, including general season, special permits, and tribal harvests, and the kills/day decreased below the 10-year average (Figure 2a and 2b). Overall population stability in the zone is supported by consistent long-term harvest rates (kills/day; Figure 2b).
Figure 1. GMUs and generalized land cover types within the North Cascade Mountains BDMZ.
57

Deer Status and Trend Report 2018
a) b)
Survival and Mortality No estimates of pregnancy or survival rates are available for black-tailed deer herds specific to the North Cascade Mountains BDMZ. However, vital rates of adult does are thought to be sufficient based on harvest trends. In general, estimates of annual survival of black-tailed bucks in Washington State have averaged 50% in forested landscapes with hunting identified as the primary source of mortality (Bender et al. 2004).
Cougars, black bears, bobcats, and coyotes occur within this BDMZ. Although the effects of predation on this population of black-tailed deer are unknown, deer harvest metrics have remained stable.
Habitat Black-tailed deer habitat has been reduced in western Washington due to human encroachment, a reduction in timber harvest, and the natural progression of aging timber stands.
Road closures continue to increase and may buffer the influences of increased human disturbance throughout deer ranges in Whatcom and Skagit counties. Increased use of herbicides on private timber lands has been observed over the last three to five years. This practice had declined on state and federally owned lands over the last ten years and was considered to be of minimal concern when compared to historical herbicide use levels. It will be necessary to monitor this activity in order to evaluate actual impacts on local deer habitats.
In general, the long-term trend in GMU 454 deer habitat is for a continued decline. This is consistent with the housing and commercial development of habitat currently used by deer. However, deer in GMU 454, and elsewhere in the North Cascade Mountains BDMZ, are taking advantage of 1 to10 acre tracts that are cleared for homes. These tracts still provide and may even improve deer forage availability, particularly during winter months, thereby improving overall
Figure 2. Harvest estimates and 10-yr means (dashed lines) for (a) General State Harvest (gray), General State + Permit State Harvest (blue), and General + Permit + Tribal Harvest (green); and (b) general season estimates and 10-yr mean for hunter days (black) and kills/day (blue); in the North Cascade Mountains BDMZ, 2008–2017.
58

Deer Status and Trend Report 2018
body condition. This alone can lead to higher productivity and increased survival. Further, because many of these private lands are not open to general public, hunting mortality may be reduced. This can lead to increasing deer densities and may prompt some deer dispersal to surrounding habitats that are accessible to hunters in GMU 454.
The significant majority of GMU 460 is managed for timber production. Annual timber harvests create a mosaic of seral stages that can be beneficial to deer. Openings of 1 to 10 acres exist that provide a good forage base as well as riparian corridors protected by the Washington Forest and Fish Law. The forest stands in these corridors provide older age classes that diversify habitat and help intercept snow during harsh winters. This may provide deer access to forage in these sites, serve as travel corridors, and provide added winter shelter.
In 2004, King County announced the purchase of development rights on the King County portion of the Snoqualmie Forest (app. 90,000 acres). This will protect a large area of commercial forest as open space and de facto deer habitat. Additional research into the relationship between current landscape conditions, herbicide application, deer populations, and habitat quality is needed. Deer habitat trends in GMU 466 and 485 are dependent on timber management and subsequent seral stage development that determines forage availability. There are several thousand acres of timberlands managed primarily for wood fiber production, with considerations for recreational opportunities, fish, and wildlife.
Human-Wildlife Interaction Deer-related damage to private property has remained a problem throughout the mainland portions of north Region Four. No damage payments were made in this general area in 2017. Eighteen damage permits were issued by WDFW Conflict Specialists in Skagit and Whatcom Counties resulting in a harvest of 5 deer. The majority of permits focused on lands engaged in the production of raspberry, strawberry, and blueberries. Eight damage permits were issued in King and Snohomish Counties resulting in no harvested deer. Half of these permits were focused on lands involved in the production of nursery crops and half vegetable crops. Deer Area 4541 was created in GMU 454 to offer additional opportunity and assist with damage complaints in the most densely populated portion of the unit.
Management Concerns Safety concerns associated with increased human development, combined with changing attitudes towards hunting have resulted in fewer areas open to hunters in the North Cascades BDMZ. Public hunting sites are limited in many of the North Cascade GMUs. We continue to look for opportunities to partner with private landowners to open more opportunity to hunters.
59

Deer Status and Trend Report 2018
Management Conclusions Limited information is available for black-tailed deer populations in the North Cascade Mountains BDMZ but populations are considered stable based upon harvest metrics.
Literature Cited Bender, L. C., G. A. Schirato, R. D. Spencer, K. R. McAllister, and B. L. Murphie. 2004. Survival,
cause-specific mortality, and harvesting of male black-tailed deer in Washington. Journal of Wildlife Management 68:870–878.
60

Deer Status and Trend Report 2018
Olympic Peninsula Black-tailed Deer Management Zone BRYAN MURPHIE, Wildlife Biologist
Introduction The Olympic Peninsula Black-tailed Deer Management Zone (BDMZ) is located in northwest Washington and consists of 16 Game Management Units (601, 602, 603, 607, 612, 615, 618, 621, 624, 627, 633, 636, 638, 642, 648, and 651; Figure 1).
Management Guidelines and Objectives Black-tailed deer (Odocoileus hemionus columbianus) in this zone are managed to maintain productive populations, while providing for multiple uses; including recreational, educational, aesthetic, and a sustainable annual harvest (WDFW 2014). We attempt to achieve these objectives largely through manipulating hunting seasons. Hunting regulations for Olympic BDMZ Game Management Units (GMUs) generally provide liberal buck hunting and a conservative antlerless harvest.
Population Surveys Monitoring is primarily achieved via mandatory hunter reporting. When funding is available we conduct composition surveys or more targeted projects related to specific GMUs or study areas. Tribal game harvest reports are compiled and published annually by the Northwest Indian Fisheries Commission (for data referred to in this document, see the NWIFC Big Game Harvest Reports for Western Washington Treaty Tribes; 2008-2017/18). Tribal research and monitoring also provides valuable information on black-tailed deer in this BDMZ, through work conducted both independently and in cooperation with WDFW. There were no surveys conducted during this review period.
Hunting Seasons and Recreational Harvest The 2017 deer hunting season regulations were similar to previous years in the Olympic BDMZ. Most general season hunting opportunity was any buck, while antlerless harvest was limited to certain weapon types and/or by special permit. Deer Area 6020 was open to the harvest of any deer during the general season for all weapon types. Additional hunting opportunity was provided in the Olympic BDMZ during the 2017 season with 740 special permits offered through the Department’s special permit system; of these, 332 hunters reported killing 103 deer in 2017.
Figure 1. GMUs and generalized land cover types within the Olympic Peninsula BDMZ.
61

Deer Status and Trend Report 2018
Estimates from harvest reports indicate a drop in buck harvest (Figure 2a) and kills/day (Figure 2b) during the 2017 season, in constrast to recent years. Hunter participation was below the 10-year average, but similar to 2016 (Figure 2b). The decline in buck harvest in 2017 was not limited to the Olympic BDMZ. Deer harvest in other areas of the state also declined. On average, tribal harvest, which accounts for 9% of the deer harvest in the Olympic BDMZ, also declined in 2017.
The cause of the decline cannot clearly be determined with the data available. Three factors that may have contributed are, 1) buck harvest in 2016 was at a period high, 2) drier than normal summers in 2015, 2016 and 2017 in the Olympic BDMZ may have contributed to lower fawn recruitment. and 3) drier than normal conditions during the general rifle season may have contributed to lower hunter success.
a) b)
Survival and Mortality Survival and mortality have been studied in some GMUs and inferences can be made from these data in a general sense regarding black-tailed deer in the Olympic BDMZ.
The Makah Tribe estimated adult doe survival rates in the Hoko (GMU 601) ranged from 79-87% and average annual fawn survival to be 33% (95% CI = 24-43; McCoy et al. 2014). Predation accounted for the majority of all fawn mortality in the Hoko in this study, but fawn survival was strongly influenced by the presence of hair-loss syndrome (HLS). Fawns with HLS had a lower over-winter survival probability than fawns without HLS (57% with HLS versus 80% without HLS; McCoy et al. 2014). The loss of hair directly affects their ability to maintain body temperature. They are also affected indirectly through an alteration of behavior. Afflicted deer will spend less time feeding and more time scratching or grooming (Murphie 2010). Modeling black-tail population trends assuming both with and without HLS present, indicated that HLS, coupled with predation, was likely limiting the deer population in the Hoko (McCoy et al. 2014). This was the first study to illustrate how HLS may be negatively influencing black-tailed deer populations, particularly in the coastal habitats on the Olympic Peninsula of Washington.
The Department initiated a study of the effects of forest management practices on doe survival and reproduction in 2009 (see Research section below). The field portion of the study is now complete and data are currently being analyzed.
Figure 2. Harvest estimates and 10-yr means (dashed lines) for (a) General State Harvest (gray), General State + Permit State Harvest (blue), and General + Permit + Tribal Harvest (green); and (b) general season estimates and 10-yr mean for hunter days (black) and kills/day (blue); in the Olympic Peninsula BDMZ, 2008–2017.
62

Deer Status and Trend Report 2018
In 2014, the Elwha Tribe initiated studies of fawn and buck survival and causes of mortality in the Pysht (GMU 603). Their projects are anticipated to last until 2017 (Sager-Fradkin, personal communication).
Habitat Black-tailed deer in the Olympic BDMZ have access to a wide range of habitat types, from alpine meadows in the Olympic Mountains, to coastal marine estuaries along the outer coast and inland marine waters. Black-tailed deer have a selective foraging strategy preferring to consume the most nutritious plants (Nelson et al. 2008). They consume a variety of browse including woody shrubs, forbs, lichens, and some grasses. Woody shrubs and forbs are typically more abundant in younger, more recently disturbed sites (<20 years old) with less canopy cover than sites in mid to late-seral stages that are created predominately through active logging. Units heavily logged years ago with vast areas of single-aged stands in the mid to late-seral stage of forest succession are the least productive for ungulate forage. Active timber harvest in some GMUs continues to create early seral habitat that include a diverse mix of stand-ages and provides the most benefit to black-tailed deer.
Some common plants present in black-tailed deer diets include, vine maple (Acer circinatum), red alder (Alnus rubra), cascara (Rhamnus purshiana), Himalayan blackberry (Rubus discolor), evergreen blackberry (Rubus laciniatus), salmonberry (Rubus spectabilis), trailing blackberry (Rubus ursinus), elderberry (Sambucus spp.), red huckleberry (Vaccinium parvifolium), fireweed (Epilobium angustifolium), willowherb (Epilobium watsonii), hairy cat’s ear (Hypocharis radicata), big deervetch (Lotus crassifolius), oxalis (Oxalis oregana), and violets (viola spp.) (Nelson et al. 2008, Ulapa 2015).
Research
The effects of forest management strategies, particularly the use of herbicides and decreased burning are poorly understood, but may negatively influence ungulate forage and ultimately deer abundance. Two studies were recently initiated to examine these effects, as they relate to black-tailed deer.
From 2009-2017 the Department conducted a study of the effects of forest management practices on black-tailed deer doe survival and reproduction. For this study, adult female deer were captured and fitted with GPS collars to determine their habitat use and their fawns were captured and monitored for survival. This project had study sites in 8 locations in western Washington, 4 on private commercial timberlands and 4 on land managed by the Washington Department of Natural Resources. Over the course of the project, 212 does and 235 fawns were captured for monitoring. Of those, 80 does and 125 fawns were captured in GMUs 601, 621, 627, 633, and 651, within the Olympic Black-tailed Deer Management Zone. Data from this study are currently being analyzed and results are forthcoming.
Ulappa (2015) initiated a project studying how timber management practices influence the availability and quality of forage for black-tailed deer. She found that the use of herbicides reduced the amount and quality of forage available to deer during the first three years following treatment. However, overall forage was still more abundant in these early seral stands than those 14 or more
63

Deer Status and Trend Report 2018
years old. Funding and in-kind contributions were provided by WDFW, the Muckleshoot Tribe, National Council for Air and Steam Improvement, and Weyerhaeuser.
WDFW has initiated a new project with the intent to generate estimates of black-tailed deer abundance or population trends at the GMU level. The field component of this effort began in May 2017 and is expected to last at least 5 years. GPS collars are being deployed on a sample of bucks distributed across western Washington with an objective of maintaining a sample of up to 50 bucks during each year of the 5-year study. Monitoring of these bucks will provide information on buck survival, causes of mortality, and vulnerability to harvest. Additionally, these collars will automatically record a position fix every thirteen hours, providing a fairly detailed account of the area used by these collared bucks.
Human-Wildlife Interaction In the Olympic BDMZ, most of the deer conflict issues occur in urban areas where natural mortality is considered low. Management actions generally revolve around liberalizing hunting seasons, or adding second deer permits in an attempt to increase harvest. These efforts often have limited value due to local shooting ordinances that can reduce deer hunting activity despite liberalized seasons. In response to damage/conflict issues, landowners can work cooperatively with WDFW through Damage Prevention Cooperative Agreements (DPCAs), which are plans designed to proactively prevent, minimize, or correct damage caused by wildlife to crops or livestock and may include both lethal and nonlethal measures. There were 4 DPCAs in the Olympic BDMZ in 2017.
In response to damage/conflict issues, liberal deer hunting seasons have been established in GMUs 624, 627, and 633. Forty, second-deer permits were available in the portion of GMU 624 designated as Deer Area 6020, but participation and success were quite low; 4 hunters reported harvesting 2 does. General season antlerless hunting is also provided during the general season for all three weapon types in Deer Area 6020. Although general season harvest is not reported at the Deer Area level, the combined general season antlerless harvest in GMU 624 was reported to be 50 in 2017 and the 10-year average is 53. At times, master hunters are used to help address deer conflicts. In Region 6, 20 permits were issued to master hunters in 2017; of these, three hunters killed two does. The Department also issued 30 damage prevention/kill permits to landowners in the Olympic BDMZ, which resulted in the removal of 10 deer.
Management Concerns Our primary objective for black-tailed deer management in Olympic Black-tailed Deer Management Zone is to maintain productive populations, while providing for multiple uses. Currently, WDFW does not use formal estimates or indices of population size to monitor black-tail deer populations. Instead, trends in harvest, hunter success, and catch per unit effort are used as surrogates. Provided harvest and participation are robust, these statistics can provide a reasonable indicator of population trend. However, deer harvest can be influenced by factors other than density. Changes to hunting regulations and a recent trend of timber companies restricting or limiting access to hunt, make it difficult to compare harvest estimates across years. WDFW is currently evaluating new approaches to monitor black-tailed deer populations that are independent of harvest data.
64

Deer Status and Trend Report 2018
Management Conclusions Based on harvest data, black-tailed deer populations in the Olympic Peninsula BDMZ are likely within management objectives, with stable populations where habitat allows.
Literature Cited McCoy, R. H., S. L. Murphie, M. Szykman-Gunther, and B. L. Murphie. 2014. Influence of hair
loss syndrome on black-tailed deer fawn survival. The Journal of Wildlife Management 78(7):1177-1188.
Murphie, S. L. 2010. Effect of hair loss syndrome on survival, behavior, and habitat-selection of black-tailed deer fawns. Thesis, Humboldt State University, Arcata, CA, USA.
Nelson, J., D. Cottam, E. W. Holman, D. J. Lancaster, S. McCorquodale, D. K. Person. 2008.
Habitat guidelines for black-tailed deer: coastal rainforest ecoregion. Mule Deer Working Group, Western Association of Fish and Wildlife Agencies.
Ulappa, A. 2015. Using foraging dynamics to answer landscape management questions: the
nutritional ecology of black-tailed deer. Dissertation, Washington State University, Pullman, WA, USA.
Washington Department of Fish and Wildlife. 2014. 2015-2021 Game Management Plan. Wildlife
Program, Washington Department of Fish and Wildlife, Olympia, Washington, USA.
65

Deer Status and Trend Report 2018
South Cascade Mountain Black-tailed Deer Management Zone NICHOLLE STEPHENS, Wildlife Biologist ERIC HOLMAN, Wildlife Biologist
Introduction The South Cascade Mountains Black-tailed Deer Management Zone (BDMZ) is located in the southwest portion of the Cascade Mountains and consists of 22 GMUs (503, 505, 510, 513, 516, 520, 522, 524, 550, 554, 556, 560, 564, 568, 572, 574, 578, 652, 653, 654, 666, and 667; Figure 1).
Management Guidelines and Objectives The Department’s objective within this BDMZ is to maintain a stable population based on field surveys and harvest estimates and a post-hunt population with a sex ratio of approximately 15 - 19 bucks:100 does.
Population Surveys Estimates of black-tailed deer abundance and post-season ratios are not available for populations within South Cascade Mountains BDMZ, but deer are generally more abundant at lower elevations in the zone.
Hunting Seasons and Recreational Harvest Hunting seasons in the South Cascade Mountains BDMZ vary by GMU. Most hunting is structured to focus harvest on bucks and hunting is allowed on a general season basis with no antler-restrictions in place. An exception is GMU 578, which is managed with a 3-point minimum antler restriction. In many GMUs, archers are allowed to harvest antlerless deer during general seasons. Certain GMUs targeted for deer population control also allow antlerless opportunity for modern firearm under special permit drawings. Harvest estimates have remained stable over the past 10 years with 2016 seeing the highest harvest since 2007 (Figure 2a). A decrease in deer harvest during the 2017 season was observed statewide likely due in part to the severe winter of 2016-17 and drier than normal conditions during the 2017 hunting season. While hunter effort has declined steadily since 2008, the catch-per-unit effort (kills/hunter-day) has increased slightly over the past 10 years (Figure 2b).
Figure 1. GMUs and generalized land cover types within the South Cascade Mountains BDMZ.
66

Deer Status and Trend Report 2018
a) b)
Survival and Mortality Common predator species in the South Cascade Mountains BDMZ include cougar, bobcat, black bear, and coyote. At this time there are no documented gray wolf packs in the herd area (WDFW et al. 2018). Previous estimates of annual survival rates for black-tailed deer bucks in Washington have indicated a mean of 0.50 in forested landscapes, with mortalities primarily due to legal harvest (McCorquodale 1999, Bender et al. 2004). In more urbanized habitat, the annual buck survival rate is closer to 0.86 and mortalities are generally not the result of harvest (Bender et al. 2004). McCorquodale (1999a) estimated typical doe annual survival as 82% in the Klickitat basin and Gilbert et al. (2007) estimated doe survival as 75% in commercial forest on the western slope of the Cascade Range in west-central Washington. McNay and Voller (1995) found adult doe survival on Vancouver Island to be lower for resident does (77%) than migratory does (90%), while does of unknown migration status had annual survival of just 2%.
Habitat Habitat in the South Cascade Mountains BDMZ is roughly divided into thirds with U.S. Forest Service managed lands in the east; Industrial and State (DNR) managed forestlands in the middle; and urban, sub-urban, rural and agricultural lands in the western portion of the Zone. Increasing urbanization in the lower elevation portions of the South Cascade Mountains BDMZ has resulted in loss of quality habitat for black-tailed deer. This situation is most acute in the urbanized areas of Pierce, Thurston, and Clark Counties.
The industrial forestlands consist of a mosaic of clearcuts, relatively open young regeneration stands, dense second growth stands of timber, and stream buffers lined with second growth forest. Industrial timber management practices benefit deer by increasing the quantity of early seral habitats and the subsequent forage base. While beneficial to deer, management practices are not conducted to purposefully increase or improve habitat. Additionally, intensive forest management practices including the planting of dense stands of fast-growing conifer seedlings and the application of herbicides during re-establishment of the timber stand may also be affecting overall productivity due to reduced forage quality and availability. These effects work in tandem by reducing the amount of favorable plants available as forage in the early term and completion of
Figure 2. Harvest estimates and 10-yr means (dashed lines) for General State Harvest (gray), General State + Permit State Harvest (blue), and General + Permit + Reported Tribal Harvest (green); a), and general season estimates and 10-yr mean for hunter days (black) and catch-per-unit-effort (blue); b) in the South Cascade Mountains BDMZ, 2008–2017.
67

Deer Status and Trend Report 2018
forest canopy closure (typically approximately age 12), far earlier than would occur in a naturally regenerated stand. The magnitude of those effects is influenced by site specific types of post- timber harvest treatments, plant compositions, weather, and the number of years since timber harvest. A commonality among all of these varying factors is that the best quality and most quantity of favorable forage seems to occur approximately 3 to 14 years after timber harvest whether herbicide treatments are applied or not. However, the differences between available, favorable forage in that time period for treated and untreated stands can still be substantial. A full treatise on the complexity of these habitat interactions is beyond the scope of this report and we refer the reader to Ulappa (2015) and Geary et al. (2012) for a more comprehensive understanding of this research. In contrast, very limited timber harvest on federal forests in the last three decades has led to a generally declining trend in habitat quality for deer.
Human-Wildlife Interaction Deer damage reports occur at relatively low levels in the South Cascade Mountains BDMZ, however, complaints of damage to home gardens and ornamental plants has been increasing in parts of the South Cascades BDMZ with higher human populations. Wildlife Conflict specialists work closely with producers by developing Damage Prevention Cooperative Agreements (DPCAs), which identify a plan to reduce the amount of damage incurred to agricultural crops using non-lethal and lethal methods. In the South Cascade Mountains BDMZ in 2017-2018, there were eight DPCAs in place. Two Damage Prevention Permits were issued to landowners associated with these DPCAs. Conflict specialists and landowners use a variety of non-lethal means to discourage deer including: temporary electrified fladry fencing, permanent fencing, noisemakers (birdbangers, critter gitters, and propane cannons), hazing and herding, scarecrow-like electronic devices, and odor-based repellents such as Plantskyyd. Damage on commercial agriculture production over the past year has occurred in blueberry fields, peach orchards, and ornamental flower crops.
In many circumstances, the Department addresses damage complaints by working with landowners to increase access to their property during hunting seasons so that hunters can help to resolve the damage. Master Hunters are sometimes deployed to hunt outside of established hunting seasons to directly address damage issues.
Research
From 2009-2017 the Department conducted a study of the effects of forest management practices on black-tailed deer ecology. For this study, adult female deer were captured and fitted with GPS collars to determine their habitat use and their fawns were captured and monitored for survival. This project had study sites in 8 locations in western Washington, 4 on private commercial timberlands and 4 on land managed by the Washington Department of Natural Resources. Over the course of the project, 212 does and 235 fawns were captured for monitoring. Of those, 82 does and 88 fawns were captured in GMUs 550, 568, and 667, within the South Cascade Mountains Black-tailed Deer Management Zone. Data from this study are currently being analyzed and results are forthcoming.
WDFW initiated a new project in 2017 with the intent to generate estimates of black-tailed deer abundance or population trends at the GMU level. The field component of this effort began in
68

Deer Status and Trend Report 2018
May 2017 and is expected to last at least 5 years. GPS collars are being deployed on a sample of bucks distributed across western Washington with an objective of maintaining a sample of up to 50 bucks during each year of the 5-year study. Monitoring of these bucks will provide information on buck survival, causes of mortality, and vulnerability to harvest. Additionally, these collars will automatically record a position fix every thirteen hours, providing a detailed account of the area used by these collared bucks.
Management Concerns Habitat Conditions on Federally Managed Lands Habitat conditions on federally managed lands within the South Cascades Zone are of concern. Large scale fire, timber harvest, disease or other succession re-setting events are largely absent from the federal lands. The resulting landscape is dominated by closed-canopy forest, much of which was harvested from roughly 1950-1990 and subsequently replanted with dense Douglas fir trees. These stands provide little in the way of ungulate forage and lack the diversity and forage resources of either older or younger forests. In recent years, USFS has conducted limited forest thinning and created forest openings to provide more robust forage resources for deer and elk. While beneficial, the scale of these efforts is minimal when compared to the size of the landscape. WDFW should continue to work with USFS to encourage more of this proactive management.
Fee-Only Hunting Access Restrictions In 2013 and 2014, the largest industrial forestland owner within the South Cascades Zone implemented a fee-only access system for hunting and other recreation on their lands. This system limits the number of individuals allowed access to these lands and has continued in the years that have followed. This has primarily affected GMUs 520, 524, 550, 556, 568, and 667. The ramifications of this limited access to deer hunting opportunity are difficult to quantify as the landowners don’t own entire Game Management Units, some individuals elect to pay the access fee, some individuals elect to hunt in another area, and some may decide to quit hunting. Up to this point, the total deer harvest has remained similar, on average, in these GMUs before and after the change in recreational access opportunities. The number of people hunting in these GMUs, however, has decreased by approximately one-third across the six GMUs mentioned above.
Hair Loss Syndrome “Hair loss syndrome” (HLS) of black-tailed deer was first described in Washington in 1995. In 1996 initial reports in the South Cascades Mountains BDMZ came from GMUs 501, 504, 506, and 530. The condition is caused by a heavy infestation of a Eurasian louse of poorly defined taxonomic status in the genus Damalinia (Cervicola) sp. The normal hosts of this louse are non-native deer and antelope, which are not seriously affected by the lice.
When black-tailed deer become infested with this foreign louse, they tend to develop a hypersensitivity (severe allergic) reaction to the lice. The reaction causes irritation of the skin and excessive grooming by the deer. Eventually, this excessive grooming leads to loss of the guard hairs, leaving yellow or white patches along the sides. Infestations are heaviest during late winter and early spring and many affected deer, especially fawns, die during this time. The geographical distribution of HLS has steadily expanded since its first appearance and now affects black-tailed deer throughout their range in western Washington.
69

Deer Status and Trend Report 2018
Over a three-year period, Bender and Hall (2004) reported rates of “hair-slip syndrome” in fawns as 46-74% from 1999-2001. They concluded that HLS was not significant in increasing fawn winter mortality and called for future research to better determine effects HLS has on black-tailed deer populations. Continued study since then has largely determined that HLS in black-tailed deer is generally not additive to winter mortality. However, HLS may increase predation risk due to poor overall body condition. Poor body condition is attributed to a combination of potential factors including poor forage, low birth weight, timing of birth; as well as afflictions including, but not limited to HLS.
Many HLS affected individuals tend to rebound in condition and health if they survive the winter. Ultimately, HLS is very likely only a portion of the regular annual mortality factors acting synergistically in given local populations.
WDFW provides more information regarding hair loss syndrome at our Wildlife Health website: http://wdfw.wa.gov/conservation/health/hair_loss/index.html
In addition to reports of HLS, WDFW annually receives reports of animals with slipper foot, deer warts, and lethargy/unknown illness. While these afflictions can affect the behavior and survival of individual deer, they do not pose a population concern.
Management Conclusions Black-tailed deer populations in the South Cascade Mountains BDMZ are currently within management objectives and harvest data indicate a stable population. However, habitat related concerns such as the lack of early seral forests on the federally managed lands and direct loss of habitat to urbanization remain a concern and the progression towards limited, fee-based hunting access programs, and hair loss syndrome complicate deer management in the zone. Monitoring black-tailed deer populations is a perennial challenge due to the dense understory favored by deer in these landscapes, but the Department continues to investigate new methods that might provide additional information about population status in the future.
Literature Cited Bender, L. C., G. A. Schirato, R. D. Spencer, K. R. McAllister, and B. L. Murphie. 2004. Survival,
cause-specific mortality, and harvesting of male black-tailed deer in Washington. Journal of Wildlife Management 68:870–878.
Bender, L. C. and P. Briggs Hall. 2004. Winter fawn survival in black-tailed deer populations affected by hair loss syndrome. Journal of Wildlife Diseases 40(3):444-451.
Geary, A.B., J. G. Cook, R. C. Cook, and E. H. Merrill. 2012. Herbicide and Herbivory Effects on Elk Forages at Mt. St. Helens. Final research report. University of Alberta and National Council for Air and Stream Improvement. 44 pp.
Gilbert, B.A., K.J. Raedeke, J.R. Skalski, and A.B. Stringer. 2007. Black-tailed deer population dynamics modeling using structured and unstructured approaches. Journal of Wildlife Management 71:144-154.
70

Deer Status and Trend Report 2018
McCorquodale, S. 1999. Movements, survival, and mortality of black-tailed deer in the Klickitat Basin of Washington. Journal of Wildlife Management 63:861–871.
McNay, R.S. and J.M. Voller. 1995. Mortality causes and survival estimates for adult female Columbian black-tailed deer. Journal of Wildlife Management 59(1):138-146.
Ulappa, A. 2015. Using foraging dynamics to answer landscape management questions: the
nutritional ecology of black-tailed deer. Dissertation, Washington State University, Pullman, WA, USA.
Washington Department of Fish and Wildlife, Confederated Colville Tribes, Spokane Tribe of Indians, USDA-APHIS Wildlife Services, and U.S. Fish and Wildlife Service. 2018. Washington Gray Wolf Conservation and Management 2017 Annual Report. Washington Department of Fish and Wildlife, Wenatchee, WA, USA.
71

Deer Status and Trend Report 2018
Willapa Hills Black-tailed Deer Management Zone ANTHONY NOVACK, Wildlife Biologist
Introduction The Willapa Hills Black-tailed Deer Management Zone (BDMZ) is located in the southwest corner of Washington and includes the southern coast of Washington. The total area consists of 12 GMUs (501, 504, 506, 530, 658, 660, 663, 672, 673, 681, 684, and 699 (Figure 1).
Management Guidelines and Objectives The Department’s objective within this BDMZ is to maintain stable populations based on field surveys and harvest estimates. Additional management objectives include a post-hunt sex ratio of approximately 15 - 19 bucks:100 does.
Population Surveys Conventional surveys are not possible due to the dense forest structure in this zone. Populations are currently monitored using harvest data. Tribal game harvest reports are compiled and published annually by the Northwest Indian Fisheries Commission (for data referred to in this document, see the NWIFC Big Game Harvest Reports for Western Washington Treaty Tribes; 2008-2017).
Hunting Seasons and Recreational Harvest Estimates from harvest reports for the past decade indicate harvest has generally been stable although 2017 was the lowest estimated harvest during the entire 2008-2017 timeframe (Figure 2a). Hunter effort has generally declined since 2008 (Figure 2b) while kills/day (e.g., Catch per Unit Effort or CPUE) had been increasing since 2008 and peaked in 2016. Last year (2017) recorded the fourth lowest rate of deer kills per day afield since 2008.
Figure 1. GMU boundaries with county lines, and public lands within the Willapa Hills BDMZ.
72

Deer Status and Trend Report 2018
a) b)
The vast majority of deer harvested in 2017, and since 2008, were bucks. Any buck seasons are in effect for all GMUs open during the modern firearm seasons. The majority of GMUs are open for any buck during muzzleloader season with the exception of GMU 684 (any deer) and 699 (no muzzleloader season). The majority of units are open for any deer during archery seasons. GMUs 506, 681, and 699 are limited to any buck during archery seasons. Limited permit opportunities are available for both antlerless deer and bucks throughout the Willapa Hills BDMZ.
Survival and Mortality No estimates of pregnancy, fetal, or survival rates are currently available for black-tailed deer in the Willapa Hills BDMZ. Sources of mortality for deer in this BDMZ include hunting, disease, malnutrition, poaching, deer-vehicle collisions, and predation. Common predator species in the Willapa Hills BDMZ include cougar, bobcat, black bear, and coyote. Previous estimates of annual survival rate for black-tailed deer bucks in western Washington revealed a mean survival rate of 0.50 in forested landscapes, with mortalities primarily due to legal harvest (McCorquodale 1999, Bender et al. 2004). Ongoing research will provide some additional data on survival and mortality of female deer and fawns within the BDMZ (see Research section).
Habitat The majority of forestland in the Willapa BDMZ is managed to maximize revenue from timber production. Both the privately owned industrial forestlands and, a large portion of the publicly owned lands, consist of a mosaic of clearcuts, relatively open young regeneration stands, dense second growth stands of timber, and stream buffers lined with second-growth forest. This mosaic changes on a yearly basis due to ongoing timber cutting operations. Although timber harvest is generally beneficial to deer, timber management practices are not intended to improve deer habitat.
The timber management practices implemented within the Willapa Hills BDMZ is broadly benefiting deer by increasing the quantity of early seral habitats which improves the forage base. Standard forest management practices include; planting dense stands of fast-growing conifer seedlings and, applying herbicides during re-establishment to reduce competitive plant growth. Ulappa (2015) found that herbicide use decreased the amount of understory biomass useable for foraging deer and decreased their daily digestible energy intake, especially in the first 3 years of
Figure 2. Harvest estimates and 10-yr means (dashed lines) for General State Harvest (gray), General State + Permit State Harvest (blue), and General + Permit + Tribal Harvest (green); a), and general season estimates and 10-yr mean for hunter days (black) and kills/day (blue); b) in the Willapa Hills BDMZ, 2008-2017.
73

Deer Status and Trend Report 2018
stand establishment. Despite the widespread use of herbicide, the early seral habitats will still provide more forage and higher daily energy intake for deer than closed canopy stands. Canopy closure for intensely managed forest typically occurs at around 12 years post-planting while more naturally regenerated stands can continue to produce improved levels of forage through the first 30 years. Pre-commercial and commercial thinning of second-growth stands can greatly improve the available deer forage until canopy closure reoccurs.
Human-Wildlife Interaction
Deer conflicts with commercial agricultural activities occur at low levels in the Willapa Hills BDMZ. Wildlife Conflict specialists work closely with producers by developing Damage Prevention Cooperative Agreements (DPCAs) which identify a plan to reduce the amount of damage incurred to agricultural crops using non-lethal and lethal methods. These conflict specialists and landowners use a variety of non-lethal means to discourage deer which may include: electrified fladry fencing, noisemakers, hazing and herding, scarecrow-like electronic devices, and odor-based repellents such as Plantskyyd. The total number of DPCAs in the Region related to deer for 2017-2018 was fifteen with no resulting harvest from 11 permits issued (Table 1). Deer within this zone primarily cause damage to commercially produced cranberries, wine grapes, blueberries, orchards, and non-commercial garden and ornamental plants.
Table 1. Sum of Deer related Damage Prevention and Control Agreements with resulting deer permits issued and total harvest by GMU in the Willapa Hills BDMZ, 2017-18.
Game Management Unit DPCA’s Permits Issued Deer Removed 658 8 10 0 672 1 1 0 684 6 0 0 Sum 15 11 0
In many circumstances, WDFW addresses damage complaints by working with landowners to increase access to their property during hunting seasons so that hunters can help to resolve the damage. Certified Master Hunters may be deployed to harvest animals outside of the regularly established hunting seasons.
Research From 2009-2017, the Department conducted a study of black-tailed deer throughout western Washington to determine black-tailed deer fawn production and survival under a variety of forest management scenarios and conditions. Does were captured in eight different clusters across western Washington with half of those clusters predominately located on private industrial timber land, while the other half were located on Washington Department of Natural Resources (DNR) lands. Black-tailed deer does were captured in late winter or spring and fitted with GPS tracking collars and their fawns were subsequently collared shortly after birth for survival monitoring. A single cluster of does was located within the Willapa Hills BDMZ on state owned lands within Capitol Forest (GMU 663). Data from this study are currently being analyzed and results are forthcoming.
The Department initiated a new project in 2017 with the intent to generate estimates of black-tailed deer abundance or population trends at the GMU level. The field component of this effort began
74

Deer Status and Trend Report 2018
in May 2017 and is expected to last at least 5 years. GPS collars are being deployed on a sample of bucks distributed across western Washington with an objective of maintaining a sample of up to 50 bucks during each year of the 5-year study. Monitoring of these bucks will provide information on buck survival, causes of mortality, and vulnerability to harvest. Additionally, these collars will automatically record a position fix every thirteen hours, providing a fairly detailed account of the area used by these collared bucks. Thus far, none of the collared bucks are located within the Willapa Hills BDMZ.
Management Concerns Hunter Access WDFW actively works with timber companies to maintain hunting access. The vast majority of lands that provide deer hunting opportunities in the Willapa Hills BDMZ are privately owned industrial timberlands. There is an increasing trend among the timber companies to restrict public access or require an access permit to hunt or recreate on their lands. Implementation of fee for access programs has reduced hunter participation in the Willapa Hills BDMZ. In some instances, the number of access permits issued is lower than previous hunter participation rates. For other areas, the cost of the permit is considered too much of an added financial burden for hunters. Although the addition of access permits has caused the number of hunters to decline in some GMUs, hunter success has sometimes increased as fewer hunters are afield. Furthermore, access may also be restricted due to the risk of fire, which predominately affects early season archery and muzzleloader hunters.
Hair Loss Syndrome
“Hair loss syndrome” (HLS) of black-tailed deer was first described in Washington in 1995 and reports came from GMU’s 501, 504, 506, 530, in 1996. The condition is caused by a heavy infestation with a Eurasian louse of poorly defined taxonomic status in the genus Damalinia (Cervicola) sp. The normal hosts of this louse are non-native deer and antelope, which are not seriously affected by the lice.
When black-tailed deer become infested with this foreign louse, they tend to develop a hypersensitivity (severe allergic) reaction to the lice. The reaction causes irritation of the skin and excessive grooming by the deer. Eventually, this excessive grooming leads to loss of the guard hairs, leaving yellow or white patches along the sides. Infestations are heaviest during late winter and early spring, and many affected deer, especially fawns, die during this time. The geographical distribution of HLS has steadily expanded since its first appearance and now affects black-tailed deer throughout their range in western Washington.
Over a three-year period Bender and Hall (2004) reported rates of “hair-slip syndrome” in fawns as 46-74% from 1999-2001. They concluded that HLS was not significant in increasing fawn winter mortality and called for future research to better determine effects HLS has on black-tailed deer populations. Continued study since then has largely determined that HLS in black-tailed deer is generally not additive to winter mortality. However, HLS may increase predation risk due to poor overall body condition. Poor body condition is attributed to a combination of potential factors including poor forage, low birth weight, timing of birth; as well as afflictions including, but not limited to, HLS.
75

Deer Status and Trend Report 2018
Many HLS affected individuals tend to rebound in condition and health if they survive the winter. Ultimately, HLS is very likely only a portion of the regular annual mortality factors acting synergistically in given local populations. WDFW provides more information regarding hair loss syndrome at our Wildlife Health website: http://wdfw.wa.gov/conservation/health/hair_loss/index.html
Management Conclusions Black-tailed deer populations in the Willapa Hills BDMZ appear to be within management objective based on a harvest trend that indicates a stable population. The low harvest in 2017 may be due in part to the greater than average harvest during the preceding years and drier than normal conditions during the 2017 hunting season. Habitat conditions are expected to support a stable to increasing trend into the near future.
Literature Cited Bender, L. C. and P. Briggs Hall. 2004. Winter fawn survival in black-tailed deer populations
affected by hair loss syndrome. Journal of Wildlife Diseases 40(3):444-451. Bender, L. C., G. A. Schirato, R. D. Spencer, K. R. McAllister, and B. L. Murphie. 2004. Survival,
cause-specific mortality, and harvesting of male black-tailed deer in Washington. Journal of Wildlife Management 68:870–878.
McCorquodale, S. 1999. Movements, survival, and mortality of black-tailed deer in the Klickitat Basin of Washington. Journal of Wildlife Management 63:861–871.
Ulappa, A. 2015. Using foraging dynamics to answer landscape management questions: the nutritional ecology of black-tailed deer. Dissertation, Washington State University, Pullman, WA, USA.
76

Elk
77

Elk Status and Trend Report 2018
Blue Mountains Elk Herd PAUL WIK, Wildlife Biologist MARK VEKASY, Wildlife Biologist
Introduction The Blue Mountains elk herd area is located in southeast Washington and consists of 13 GMUs, including 145 (Mayview), 149 (Prescott), 154 (Blue Creek), 157 (Mill Creek Watershed), 162 (Dayton), 163 (Marengo), 166 (Tucannon), 169 (Wenaha), 172 (Mountain View), 175 (Lick Creek), 178 (Peola), 181 (Couse), and 186 (Grande Ronde) (Figure 1). The landscape is dominated by agricultural land in the prairie and foothill regions, with interspersed grassland areas and brushy draws. The most common habitat in the Blue Mountains is characterized by second growth forests consisting primarily of Ponderosa pine, Douglas fir, grand fir, and subalpine fir. The Blue Mountains have been characterized as a high plateau dissected by deep draws and canyons carved by numerous creeks and rivers.
Figure 1. Dominant land use cover types within the 13 game management units that comprise the Blue Mountains elk herd area.
78

Elk Status and Trend Report 2018
Management Guidelines and Objectives The Department is currently in the process of updating the Blue Mountains Elk Herd Plan (WDFW 2001), which includes a population objective of maintaining herd size during spring between 4,950 and 6,050 elk. Additional objectives include maintaining a post-hunt population with a bull:cow ratio of 22–28 bulls:100 cows and maintaining an annual survival rate of 0.50 for bulls when bull mortality is monitored (WDFW 2018).
Population Surveys The Department monitors population status by conducting aerial surveys in the early spring and uses a sightability model developed for elk in Idaho (Unsworth et al. 1999) to generate estimates of elk abundance, age ratios, and sex ratios. In the early spring 2017, the Department estimated total elk abundance to be 4,396 elk (90% CI 4,231–4,561), which is below the management objective of 4,950–6,050 elk. Abundance estimates indicate the Blue Mountains elk herd has been within objective since 2009, but dropped substantially below in 2017 (Figure 2). The estimated bull:cow ratio in spring 2017 was 33 bulls:100 cows, which is above the management objective of 22–28 bulls:100 cows (Figure 3), and the estimated calf:cow ratio in spring 2017 was 18 calves:100 cows. Estimated calf:cow ratios were consistently near 30 calves:100 cows, 2006–2016, and dropped to one of the lowest recorded levels in 2017 (Figure 4). No aerial surveys were conducted in the Spring of 2018. Ground surveys were conducted in the early Spring of 2018, some of those results are listed below.
Figure 2. Sightability corrected estimates of total elk abundance with associated 90% confidence intervals in the Blue Mountains elk herd area, 2009–2018. The dashed lines represent management objectives for total elk abundance (4,950–6,050 elk).
79

Elk Status and Trend Report 2018
Figure 3. Estimates and associated 90% confidence intervals of post-hunt bull:cow ratios in the Blue Mountains elk herd area, spring 2009–2018. The dashed lines represent the objective range of 22-28 bulls:100 cows. 2018 data are based on ground sampling of historic elk winter ranges and are not thought to accurately reflect the true population ratios due to low observability of bulls from the ground.
Figure 4. Estimates and associated 90% confidence intervals of post-hunt calf:cow ratios in the Blue Mountains elk herd area, spring 2009–2018. The dashed line represents a calf:cow ratio of 30 calves:100 cows that should promote herd stability or growth. 2018 survey data are based on ground sampling of historic elk winter ranges.
80

Elk Status and Trend Report 2018
Hunting Seasons and Recreational Harvest The Department restricts general season bull harvest to spikes and offers opportunities to harvest branch-antlered bulls under special permits in all GMUs. The Department generally focuses most opportunities to harvest antlerless elk in areas associated with private land to help alleviate agricultural damage. Estimates of General State Harvest and Total State Harvest have averaged 166 and 369 elk, respectively, 2008–2017, and were relatively stable 2010–2015 (Figure 5). Estimates of hunter effort during general seasons have been relatively stable since 2008 (Figure 8), while estimates of CPUE have varied, but similar in most years (Figure 9).
Figure 5. Estimated number of antlered and antlerless elk harvested in the Blue Mountains elk herd area during recreational hunting seasons (general and permit opportunities combined) established by the Department, 2008–2017. Estimates do not include elk harvested in association with damage permits (see Human Wildlife Interaction below). Estimates also do not include harvest that occurred during established Tribal seasons because that data is not collected.
81

Elk Status and Trend Report 2018
Figure 6. Estimated percentage of recreational antlered harvest in the Blue Mountains elk herd area that occurred during general and permit seasons, 2008–2017.
Figure 7. Estimated percentage of recreational antlerless harvest in the Blue Mountains elk herd area that occurred during general and permit seasons, 2008–2017.
82

Elk Status and Trend Report 2018
Figure 8. Estimated number of days hunters spent pursuing elk in the Blue Mountains elk herd area during recreational seasons that provided general over-the-counter opportunities, 2008–2017.
Figure 9. Estimated number of elk harvested for every 100 hunter days spent pursuing elk in the Blue Mountains elk herd area during recreational seasons that provided general over-the-counter opportunities, 2008–2017.
83

Elk Status and Trend Report 2018
Survival and Mortality Common predators of elk in the Blue Mountains include black bears, cougars, and gray wolves. Black bears and cougars occur throughout the area, but black bears are more abundant in forested areas. At the time of this writing, there are 3 confirmed wolf packs within the Blue Mountains elk herd area (WDFW et al. 2018).
Extreme weather events that strongly affect the survival of elk in the Blue Mountains elk herd area are typically rare, but extreme winter weather did occur during the 2016/2017 winter. Calf ratios declinded dramatically as did adult survival. Dead elk were commonly reported or observed during the later portions of the winter in 2017.
There are no ongoing research projects to estimate survival and cause-specific mortality rates for elk in the Blue Mountains elk herd area. The most recent elk survival study occurred 2003–2006 and we (McCorquodale et al 2011) estimated yearling bull survival across the herd area to be 0.41 (95% CI = 0.29–0.53), branch-antlered bull survival to be 0.83 (95% C.I. = 0.76–0.88), and adult cow survival to be 0.80 (95% C.I. = 0.69–0.88). The leading cause of mortality for all sex and age classes monitored was associated with human harvest.
Human-Wildlife Interaction While actual elk damage claims are low, complaints from farmers are very common and elk damage continues to be a problem in some units and is largely being addressed by issuance of landowner depredation permits. The largest damage issues occur in GMU-154 Blue Creek, GMU-162 Dayton, GMU-178 Peola, and GMU-181 Couse. Damage tags are typically valid from July 1 – March 31, with restrictions on the harvest of antlered elk. Damage issues in GMU-181 have remained high in the Cloverland area. Periodically, high numbers of elk move into the western portion of the unit (Couse), with this trend remaining over the past 3 years. During the reporting period, 205 Kill permits and 38 DPCA permits were issued within the Blue Mountains elk herd area. From these, approximately 38 elk were harvested with Kill Permits and 3 with DPCA, although only 6 of the 38 DPCA permit holders reported. This approach to reducing the damage elk cause private landowners is currently accomplishing its goal in a majority of the herd range. This results in more targeted hunts that directly alter elk distribution at the smaller scale.
Research There is no ongoing elk research being conducted within the Washington portion of the Blue Mountains at this time. The results from the Washington Blue Mountains Elk Vulnerability Study were published in the Journal of Wildlife Management (McCorquodale et al. 2011) and through a department report, which was made available to the public in 2011.
Management Concerns Road densities in some portions of the Blue Mountains elk herd area are above recommended levels and have the potential to reduce use of important summer range because of human disturbance associated with those roads. The USFS has closed several old roads and reduced overall road densities, but more work is needed to address elk habitat and security needs. In addition, anecdotal evidence suggests elk habitat use in early spring has changed in some portions of the Blue Mountains elk herd area due to disturbance caused by people looking for shed antlers.
84

Elk Status and Trend Report 2018
Shed antler hunting and other activities on traditional winter range continue to be a concern in the Blue Mountains because these activities put elk under stress at a critical time of year. Shed antler hunting activity in GMUs 154, 162, 166, 169, 172, and 175 can be extremely intense during March and April and disturbance associated with these activities has changed elk use patterns in these areas. Bull groups are broken and scattered into the upper elevation timber and snow, while cow/calf groups can be redistributed onto agricultural lands.
Although winter calf ratios improved from 2017, they remained relatively low during this reporting period (Figure 3), likely attributed to the potential carryover effects from the previous winter. Low calf recruitment is thought to be the major factor still preventing Wenaha elk from increasing in numbers.
The Grizzly Complex fire that burned during the summer of 2015 altered tens of thousands of acres in the Washington portion of the Wenaha-Tucannon Wilderness. This burn was predominantly a positive event for the Wilderness, which should improve habitat quality and quantity within it’s footprint. The improved habitat will hopefully increase recruitment and attract elk from adjacent private lands in GMU 172.
Literature Cited McCorquodale, S. M., P. A. Wik, and P. E. Fowler. 2011. Elk survival and mortality causes in
the Blue Mountains of Washington. Journal of Wildlife Management 75:897–904. Unsworth, J. W., F. A. Leban, E. O. Garton, D. J. Leptich, and P. Zager. 1999. Aerial
Survey:User’s Manual. Electronic Edition. Idaho Department of Fish and Game, Boise, Idaho, USA.
Washington Department of Fish and Wildlife. 2001. Blue Mountains Elk Herd Plan. Wildlife
Program, Washington Department of Fish and Wildlife, Olympia, WA. Washington Department of Fish and Wildlife. 2014. 2015–2021 Game Management Plan. Wildlife
Program, Washington Department of Fish and Wildlife, Olympia, WA. Washington Department of Fish and Wildlife, Confederated Colville Tribes, Spokane Tribe of Indians,
USDA-APHIS Wildlife Services, and U.S. Fish and Wildlife Service. 2018. Washington Gray Wolf Conservation and Management 2017 Annual Report. Washington Department of Fish and Wildlife, Wenatchee, WA, USA.
85

Elk Status and Trend Report 2018
Colockum Elk Herd JEFFERY A. BERNATOWICZ, Wildlife Biologist Introduction The Colockum elk herd area is located in central Washington along the eastern foothills of the Cascades and consists of 6 GMUs, which include 249 (Alpine), 251 (Mission), 328 (Naneum), 329 (Quilomene), 330 (West Bar), 334 (Ellensburg), and 335 (Teanaway) (Figure 1).
Management Guidelines and Objectives The Department’s current objective is to maintain elk abundance in the surveyed winter range during spring between 4,275 and 4,725 elk (i.e., 4,500 ± 5%; WDFW 2006). Additional objectives include maintaining a post-hunt population with a bull:cow ratio of 12–20 bulls:100 cows and maintaining an annual survival rate of 0.50 for bulls when bull mortality is monitored (WDFW 2014).
Population Surveys The Department monitors population status for Colockum elk by conducting aerial composition surveys in the spring and uses a sightability model developed for elk in Idaho (Unsworth et al.
Figure 1. Dominant land use cover types within the 6 game management units that comprise the Colockum elk herd area.
86

Elk Status and Trend Report 2018
1999) to estimate elk abundance, age ratios, and sex ratios in a large surveyed area. The Department conducted post-hunt composition surveys in March 2018 and estimated total elk abundance on core winter range to be 4,289 elk (90% CI = 4,267–4,365), which is within the objective. Estimates of total elk abundance steadily increased 2006–2015, but have declined the last 3 years (Figure 2). Recently observed declines are a result of increased antlerless harvest, an extended drought in 2015, and severe winter conditions during the winter of 2016/2017. With the herd now within the Department’s established management objective, opportunities to harvest antlerless elk have subsequently been reduced.
The Department estimated post-hunt calf:cow and bull:cow ratios in March 2018 to be 30:100 (90% CI = 30-31) and 14:100 (90% CI =13–15 ), respectively (Figures 3, 4).
Figure 2. Sightability corrected estimates of total elk abundance with associated 90% confidence intervals in the Colockum elk herd area, spring 2009–2018. The dashed lines represent management objectives for total elk abundance (4,275–4,725 elk).
87

Elk Status and Trend Report 2018
Figure 3. Estimates and associated 90% confidence intervals of post-hunt bull:cow ratios in the Colockum elk herd area, spring 2009–2018. The dashed lines represent the objective range of 12-20 bulls:100 cows.
Figure 4. Estimates and associated 90% confidence intervals of post-hunt calf:cow ratios in the Colockum elk herd area, spring 2009–2018. The dashed line represents a calf:cow ratio of 30 calves:100 cows that should promote herd stability or growth.
88

Elk Status and Trend Report 2018
Hunting Seasons and Recreational Harvest The Department restricts general season bull harvest to true-spikes (1×1 bulls) in the Colockum and offers opportunities to harvest branch-antlered bulls under special permits in all GMUs except GMU 334. In 2012, the Department began to increase opportunities to harvest antlerless elk throughout the herd area to bring the herd within the established management objective, and antlerless harvest steadily increased as a result before peaking in 2015 (Figure 5). As the population approached objective (Figure 2), the Department has subsequently reduced those opportunities and antlerless harvest has declined accordingly, 2015–2017 (Figure 5). Proportions of antlered and antlerless harvest during general and special permit seasons are shown in Figures 6 and 7. Hunter effort declined in 2010, likely in response to the Department implementing “true-spike” restrictions in 2009, but it increased 2012–2017 as opportunities to harvest antlerless elk were increased (Figure 8). Hunter kills per 100 days of effort are shown in Figure 9.
Figure 5. Estimated number of antlered and antlerless elk harvested in the Colockum elk herd area during recreational hunting seasons (general and permit opportunities combined) established by the Department, 2008–2017. Estimates do not include elk harvested in association with damage permits (see Human Wildlife Interaction below). Estimates also do not include harvest that occurred during Tribal seasons because those data are currently not provided.
89

Elk Status and Trend Report 2018
Figure 6. Estimated percentage of recreational antlered harvest in the Colockum elk herd area that occurred during general and permit seasons, 2008–2017.
Figure 7. Estimated percentage of recreational antlerless harvest in the Colockum elk herd area that occurred during general and permit seasons, 2008–2017.
90

Elk Status and Trend Report 2018
Figure 8. Estimated number of days hunters spent pursuing elk in the Colockum elk herd area during recreational seasons that provided general over-the-counter opportunities, 2008–2017.
Figure 9. Estimated number of elk harvested for every 100 hunter days spent pursuing elk in the Colockum elk herd area during recreational seasons that provided general over-the-counter opportunities, 2008–2017.
91

Elk Status and Trend Report 2018
Survival and Mortality Common elk predators that occur within the Colockum elk herd area include black bears, cougars, and gray wolves. Black bears and cougars occur throughout the herd area, but black bears are more abundant in forested habitats. At the time of this writing, there was one confirmed wolf pack within the Colockum elk herd area (WDFW et al. 2018), but not within the core range east of US-97.
The Colockum elk herd, like most elk herds, is typically robust to severe winters. The Department monitored the survival of 105 adult cow elk captured on core winter range 2008–2012 and estimated annual survival rates to be 0.92 (95% CI = 0.87–0.96); 73% of all mortalities were attributed to hunter-harvest (S. McCorquodale, WDFW, unpublished data). The Department also monitored the survival and movements of radiomarked branch-antlered bulls, 2013–2017. Fifty-five radiomarked bulls were monitored; annual survival was estimated to be 0.81 (95% CI = 0.61–0.94) for subadult bulls and 0.63 (95% CI = 0.49–0.76) for mature bulls. Twenty-five bull mortalities were documented, 21 of which were attributed to hunter-harvest (S. McCorquodale, WDFW, unpublished data). Bracken and Musser (1993) attributed all Colockum elk mortality in an earlier study to humans.
Although survival was not monitored directly, biologists observed a substantial number of elk carcasses during their annual survey following the winter of 2015/2016, which is uncommon and an indication that over-winter survival rates were reduced across all age and sex classes. Observed calf ratios in spring 2017 (19:100; Figure 4), which were the lowest documented in more than a decade also indicated over-winter survival rates of calves were substantially reduced during the winter of 2016/2017.
Habitat Timber harvest in the Colockum elk herd area increased as timber companies logged heavily 10-20 years ago, prior to selling their lands. The logging was followed by the 42,000+ acre Table Mountain fire in 2012. Wildfires also burned more than 100,000 acres of winter range in 2013. Smaller fires have occurred annually. In summer range, fires increase forage quantity and quality, but reduce security in a heavily roaded landscape. On arid portions of winter range, fires typically convert vegetion to grass (cheatgrass on south slopes). This likely has a negative impact on elk because of reduced plant diversity.
Human-Wildlife Interaction The Colockum herd is not fenced from private lands, and damage is being managed by hunting, damage permits, and hazing. The boundaries of the hunts are adjusted frequently, depending on where damage is occurring. In 2004, the damage season was extended to August 1 – February 28th. In recent years, the general damage season closed in mid-December. Additional problem elk are being managed through hazing, Damage Prevention Cooperative Agreements (DPCAs), and Master Hunter Permits. The goal is to displace elk that have developed a habit of foraging on agricultural lands. In 2017, conflict staff issued 289 permits in response to damage complaints, with a reported harvest of 49 elk. However, less than half of the permitees reported on their hunting activity, so the number of elk harvested was probably higher.
During winter 2015-2016, elk were crossing Interstate-90, presumably in search of suitable forage immediately adjacent to the highway or in the median. The Department of Transportation
92

Elk Status and Trend Report 2018
documented at least 70 elk/vehicle collisons on Interstate-90 adjacent to the Colockum elk herd core winter range, mostly in the westbound lanes. There currently is no barrier to keep elk off the highway, nor engineered wildlife crossings. WDFW responded to this issue in 2016 by hazing elk away from the highway and installing a temporary 3-D fence to keep elk from approaching the highway. However, the effectiveness of these approaches are limited, so WDFW will have to work closely with the Department of Transportation to identify long-term solutions if similar events occur in the future. Elk-vehicle conflicts were much lower the last 2 winters.
Research The previous research projects on Colockum elk have been concluded. No new research is planned for the near future.
Management Concerns The Colockum herd has decreased in recent years and is now at the lower end of the desired total population objective. The main factors contributing to that decrease were increases in antlerless harvest and severe winter events during the winters of 2015/2016 and 2016/2017. To prevent further declines, the Department has reduced permit opportunities for modern firearm and muzzleloader hunters to harvest antlerless elk, in addition to shortening the general archery antlerless season. It is unknown if further reductions in opportunity will be needed to prevent the Colockum herd from declining below objective. Agricultural damage is frequently a concern for some landowners in the Colockum elk herd area. There are many factors that cause elk to move into areas where they are in conflict with private landowners. Cultivated lands and irrigated pasture are attractive foraging areas for elk. Human disturbance can be high on public lands, especially during late summer, during fall hunting seasons, and in late-winter when people begin hunting for shed antlers. Elk are widely distributed during times of the year when human disturbance is low, but they become concentrated in areas associated with the Coffin Game Reserve when human disturbance is high. The reserve offers security for elk. The main tool to manage damage has been to issue damage permits and have long Master Hunter seasons. Harvesting elk is less desirable than preventing elk from entering fields. Some funding for cooperative fencing recently became available. The most efficient fence would be a boundary fence along irrigated fields where elk come off public land. For fences to be effective, all landowners along the boundary would need to agree to a fence so there would not be gaps. Unfortunately, WDFW has not been able to obtain full landowner agreement.
Much of the Colockum elk herd area also has a high road density and limited security cover. The high road density and lack of cover historically resulted in high yearling bull vulnerability to hunting. The true-spike regulation has more than doubled yearling recuitment and the overall bull population. In 2016 and 2017, the estimated bull:cow ratio was above objective for the traditional winter range that is surveyed. However, in most years a proportion of the mature bull subpopulaton is difficult to detect or are not located on the surveyed portion of the winter range. New techniques/methods may need to be adopted to better estimate the total bull subpopulation.
93

Elk Status and Trend Report 2018
Management Conclusions The Colockum herd is now at the lower end of the desired total population objective and may continue to decline if reductions in harvest opportunities do not result in substantial reductions in antlerless harvest. The Colockum herd has reached bull:cow ratio objectives. True-spike general season hunting has reduced yearling bull mortality to the point where branch-antlered bull opportunity can be increased, while maintaining enough adult bulls to keep the herd within the 12-20:100 cows objective. Adjustment of the current survey structure is needed to better estimate the full complement of adult bulls in the population.
Literature Cited Bracken, E. and J. L. Musser. 1993. Colockum elk study. Wash. Dept. Fish and Wildlife. Fed.
Aid Wildl. Restor. Rep. Proj. 129 p.
Unsworth, J. W., F. A. Leban, E. O. Garton, D. J. Leptich, and P. Zager. 1999. Aerial Survey: User’s Manual. Electronic Edition. Idaho Department of Fish and Game, Boise, Idaho, USA.
Washington Department of Fish and Wildlife. 2006. Colockum Elk Herd Plan. Wildlife Program, Washington Department of Fish and Wildlife, Olympia, WA.
Washington Department of Fish and Wildlife. 2014. 2015–2021 Game Management Plan. Wildlife
Program, Washington Department of Fish and Wildlife, Olympia, WA. Washington Department of Fish and Wildlife, Confederated Colville Tribes, Spokane Tribe of Indians,
USDA-APHIS Wildlife Services, and U.S. Fish and Wildlife Service. 2018. Washington Gray Wolf Conservation and Management 2017 Annual Report. Washington Department of Fish and Wildlife, Wenatchee, WA, USA.
94

Elk Status and Trend Report 2018
Mount St. Helens Elk Herd ERIC HOLMAN, Wildlife Biologist Introduction The Mount St. Helens elk herd is located in southwest Washington and is comprised of 14 GMUs, which includes 505 (Mossyrock), 520 (Winston), 522 (Loo-Wit), 524 (Margaret), 550 (Coweeman), 554 (Yale), 556 (Toutle), 560 (Lewis River), 564 (Battle Ground), 568 (Washougal), 572 (Siouxon), 574 (Wind River), 578 (West Klickitat), and 388 (Grayback) (Figure 1).
Figure 1. Dominant land use cover types within the 14 game management units that comprise the Mount St. Helens elk herd area.
Management Guidelines and Objectives In response to the frequency and magnitude of winter mortality events in the 2000s, the Department began liberalizing opportunities to harvest antlerless elk in 2007 with the objective of reducing the Mount St. Helens elk herd by 35% (WDFW 2006). The Department’s current objective is to promote population stability as indexed by estimates of total elk abundance in spring. Additional
95

Elk Status and Trend Report 2018
herd objectives include maintaining a post-hunt population with a bull:cow ratio of 12–20 bulls:100 cows and maintaining an annual survival rate of 0.50 for bulls when bull mortality is monitored (WDFW 2014). The Mount St. Helens Elk Herd Management Plan (WDFW 2006) also outlines objectives to continue efforts to monitor and improve winter habitat and wintering elk populations in the Toutle River valley. In addition, plan objectives address minimizing damage conflicts, increasing public appreciation of the elk resource, and using sound science to monitor the herd.
Population Surveys The Department began monitoring population trend in 2009 by indexing total elk abundance within the core herd area (GMUs 520, 522, 524, 550, 556) using a sightability model developed specifically for the Mount St. Helens elk herd (McCorquodale et al. 2014). In March 2018, the Department estimated total elk abundance within the core herd area to be 1,865 elk (95% CI 1,811–1,997). Estimates of total elk abundance had been relatively stable since the Department reduced opportunities to harvest antlerless elk following the 2012 season (Figure 2), however, after the severe winter of 2016-17 the abundance estimate declined by roughly 33%. In March 2018 the Department estimated post-hunt bull:cow and calf:cow ratios to be 42:100 and 31:100, respectively. Bull:cow ratios have increased since 2010 during the period of purposeful herd reduction and are well above management objective (Figure 3). Calf:cow ratios have ranged from 25-44:100 over the past 10 years (Figure 4).
Figure 2. Sightability corrected estimates of total elk abundance with associated 95% confidence intervals in the core range of the Mount St. Helens elk herd area (GMUs 520, 522, 524, 550, 556), spring 2009–2018.
96

Elk Status and Trend Report 2018
Figure 3. Estimates and associated 95% confidence intervals of post-hunt bull:cow ratios in the core range of the Mount St. Helens elk herd area (GMUs 520, 522, 524, 550, 556), spring 2009–2018. The dashed lines represent the objective range of 12-20 bulls:100 cows.
Figure 4. Estimates and associated 95% confidence intervals of post-hunt calf:cow ratios in the core range of the Mount St. Helens elk herd area (GMUs 520, 522, 524, 550, 556), spring 2009–2018. The dashed line represents a calf:cow ratio of 30 calves:100 cows that should promote herd stability or growth.
97

Elk Status and Trend Report 2018
Hunting Seasons and Recreational Harvest The Department manages harvest opportunities in the Mount St. Helens elk herd with a combination of general season and special permit hunts. During the period of time this review covers, the Department restricted all elk harvest in GMUs 522 and 556 to permit only opportunities. The Department restricted elk harvest in GMU 524 to special permit only from 1983 through 2014, then changed management strategies by allowing general season opportunities for branch-antlered bulls starting in 2015.
Estimates of General State Harvest have averaged 1,174 elk since 2008, and have steadily declined during this 10-year period (Figure 5). Estimates of Total State Harvest have averaged 1,856 elk since 2008, varied 2008–2012, and declined precipitously after the Department reduced opportunities to harvest antlerless elk in 2013 (Figure 5). Harvest of antlered elk in the Mount St. Helens Herd area occurs primarily during general seasons and most hunts are managed with a 3-point or larger antler point restriction (Figure 6). In contrast, the majority of antlerless elk harvest occurs during permit-only seasons. However, limited opportunities to harvest antlerless elk during general seasons do occur in areas where the Department’s objective is to maintain low numbers of elk or in areas where the population is robust enough to sustain general season harvest of females (Figure 7). Elk harvest within tribal hunting seasons are minimal in the Mount St. Helens Herd area, totaling just 9 antlered and 2 antlerless elk during 2008-17 (Figures 6 and 7).
Figure 5. Estimated number of antlered and antlerless elk harvested in the Mount St. Helens elk herd area during recreational hunting seasons (general and permit opportunities combined) established by the Department and during established Tribal seasons (<1% of Total Harvest), 2008–2017. Estimates of Tribal harvest were derived from annual harvest reports compiled by the Northwest Indian Fisheries Commission. Estimates do not include elk harvested in association with damage permits (see Human Wildlife Interaction below).
98

Elk Status and Trend Report 2018
Figure 6. Estimated percentage of recreational antlered harvest in the Mount St. Helens elk herd area that occurred during general and permit seasons, 2008–2017. Harvest during established tribal seasons accounted for <1% of the antlered harvest and is not represented in the figure.
Figure 7. Estimated percentage of recreational antlerless harvest in the Mount St. Helens elk herd area that occurred during general and permit season, 2008–2017. Harvest during established tribal seasons accounted for <1% of the antlerless harvest and is not represented in the figure.
99

Elk Status and Trend Report 2018
Hunter effort within the Mount St. Helens Herd area has steadily declined since 2008 (Figure 8). In contrast, catch per unit effort (CPUE) has varied considerably during 2008-17, but reached a lowpoint for this period during the 2017 hunting season (Figure 9).
Figure 8. Estimated number of days hunters spent pursuing elk in the Mount St. Helens elk herd area during recreational seasons that provided general over-the-counter opportunities, 2008–2017.
Figure 9. Estimated number of elk harvested for every 100 hunter days spent pursuing elk in the Mount St. Helens elk herd area during recreational seasons that provided general over-the-counter opportunities, 2008–2017.
100

Elk Status and Trend Report 2018
Survival and Mortality Common predators that occur throughout the Mount St. Helens elk herd area include black bears and cougars. At the time of this writing, there are no documented gray wolf packs in the herd area (WDFW et al. 2018).
Some elk in portions of the Mount St. Helens elk herd area are susceptible to increased overwinter mortality events when severe winter and dry summer-fall conditions persist (McCorquodale et al. 2014). Since 1999, the Department has conducted an annual winter elk mortality survey on the Mount St. Helens Wildlife Area and documented the number of elk carcasses detected. Since that time, the number of elk carcasses detected has varied annually, averaging 36 per year and has been above the 20-year average on 7 separate occasions, most recently in 2014. Twenty-seven carcasses were located during the 2018 survey. The Department is currently monitoring the survival and movements of adult cow elk in GMUs 520, 522, 524, 550, and 556. The study of elk in this portion of the Mount St. Helens elk herd area is an effort to determine the effects of treponeme-associated hoof disease (TAHD) on elk survival and reproduction. The project began in February 2015 with the capture of 81 elk. The Department has not analyzed this information to date. The Department (McCorquodale et al. 2014) monitored the survival of branch-antlered bulls and adult female elk from 2009–2013, but did not attempt to account for elk mortalities by cause beyond distinguishing between hunting-related and natural causes (e.g., predation, disease, winter mortality, etc. combined). Estimated annual survival of adult female elk in GMUs 520, 522, 524, and 556 was 0.85 (95% CI 0.78–0.91) from 2009–2011 and 0.52 (95% CI 0.38–0.65) in 2012. Estimated annual survival rates of adult female elk in GMU 550 from 2009–2011, were 0.64 (95% CI 0.48–0.78) and 0.52 (95% CI 0.38–0.65) in 2012. Estimated branch-antlered bull survival was 0.56 (95% CI 0.43–0.67) across years and GMUs. Most mortality events were associated with harvest-related causes in 2009–2011, while the reduced survival in 2012 was attributed to increased winter-mortality.
Habitat The majority of the landscape that comprises the Mount St. Helens elk herd area is a roughly even split of private industrial forestlands and U.S. Forest Service (USFS) managed lands. Smaller portions of the herd area are made up of State Department of Natural Resources (DNR) managed forestlands, agricultural areas, urban/suburban lands, small forestland ownerships, etc.
The industrial forestlands consist of a mosaic of clearcuts, relatively open young regeneration stands, dense second growth stands of timber, and stream buffers lined with second-growth forest. Industrial timber management practices benefit elk by increasing the quantity of early seral habitats and the subsequent forage base. While beneficial to elk, management practices are not conducted to purposefully increase or improve elk habitat. Additionally, intensive forest management practices including the planting of dense stands of fast-growing conifer seedlings and the application of herbicides during re-establishment of the timber stand may also be affecting overall productivity due to reduced forage quality and availability. These effects work in tandem by reducing the amount of favorable plants available as forage in the early term and completion of
101

Elk Status and Trend Report 2018
forest canopy closure (typically approximately age 12), far earlier than would occur in a naturally regenerated stand. The magnitude of those effects is influenced by site specific types of post- timber harvest treatments and plant compositions; and the number of years since timber harvest. A commonality among all of these varying factors is that the best quality and most quantity of favorable forage seems to occur approximately 3 to 14 years after timber harvest whether herbicide treatments are applied or not. However, the differences between available, favorable forage in that time period for treated and untreated stands can still be substantial. A full discussion on the complexity of these habitat interactions is beyond the scope of this report and we refer the reader to Ulappa (2015) and Geary et al. (2012) for a more comprehensive understanding of this research.
In contrast, very limited timber harvest on federal forests in the last three decades has led to a general decline in the quality of elk habitat.
The Department continues to take steps to enhance forage quality on the North Fork Toutle River mudflow portion of the Mount St. Helens Wildlife Area within GMU 522. Forage enhancement efforts have included planting and fertilizing forage plots, mowing pastures, controlling Scotch broom and non-native invasive blackberries, planting trees in upland areas and along the banks of the North Fork Toutle River to reduce bank erosion and reestablish tree cover in areas where Scotch broom had been removed, and controlling yellow and mouse-ear hawkweed.
In addition, activities on approximately 15,000 acres of mitigation lands managed by Pacificorps include forest canopy removal, fertilization, establishment of forage plots, treatment of invasive plants, maintenance of farmlands and meadows for elk habitat, and creation of meadows and openings within the forested landscape. These enhanced habitats provide high-quality foraging opportunities for elk.
Human-Wildlife Interaction Conflicts with the production of agricultural crops occur throughout the lower-elevation portions of the Mount St. Helens Elk Herd area. Elk damage complaints have decreased in recent years, reflecting the reduced elk populaton. A variety of crops are impacted by elk damage, but most of the damage occurs on fields used for hay production.
Wildlife Conflict Specialists work closely with producers by developing Damage Prevention Cooperative Agreements (DPCAs), which identify a plan to reduce the amount of damage incurred to agricultural crops using non-lethal and lethal methods. Non-lethal methods of discouraging elk use are an important component to reducing elk damage and are generally attempted prior to the use of lethal response. Conflict Specialists and landowners use a variety of non-lethal means including: electrified fladry fencing; noisemakers (birdbangers, critter gitters, propane cannons); hazing and herding on foot, with a vehicle or with a dog, scarecrow-like electronic devices; and odor-based repellents such as Plantskyyd.
Lethal methods of deterring elk are also used. These efforts include special late and early season damage hunts within specified elk areas, a region-wide pool of Master Hunters, Youth Hunters and Hunters with Disabilities for immediate response to damage issues, as well as landowner damage permits. Collectively, these hunts are designed to decrease the number of elk causing the damage and/or to haze elk from the area.
102

Elk Status and Trend Report 2018
In recent years, the most acute situation of elk damage to agricultural crops has been associated with the mid-elevation valleys of Trout Lake and portions of the Glenwood and Gilmer valleys within GMU 578. These valleys provide year-round habitat and are considered historic winter-range for elk occupying the south Cascade mountains. The aggressive use of landowner kill permits and some non-lethal deterrents have failed to reduce this conflict over the course of many years. In order to help with this conflict, the Department proposed and the Commission approved, a liberalized late muzzleloader season in GMU 578 starting in 2018.
Table 1 shows a summary of permits issued to to landowers allowing the take of elk causing agricultural damage in the Mount St. Helens Elk Herd during 2017-18. Collectively, these hunts are designed to decrease the number of elk causing damage and/or to haze elk from the area. Table 1. Number of Permits to Lethally Remove Elk Causing Damage to Agricultural Crops and Resulting Kills, Mt. St. Helens Elk Herd, 2017-18.
Game Management Unit Permits Issued Elk Removed 505 7 1
520 3 2
554 4 3
568 2 1
574 3 3
578 36 29
TOTAL 55 39
Research The research associated with TAHD discussed above is scheduled to continue through 2019. It is anticipated that this effort will shed light on the impacts of TAHD on the survival and reproductive fitness of adult female elk. Additional information will include survival rates and reproductive fitness of elk not afflicted with TAHD, habitat use, cause-specific mortality among study animals, and other variables.
Management Concerns Treponeme-associated hoof disease TAHD of elk results in abnormal hoof growth, cavitating sole ulcers, and in severe cases, eventual sloughing of the hoof capsule. Elk severely affected by TAHD often have reduced mobility and condition. Consequently, it seems reasonable to assume elk would have a reduced probability of survival or reproductive potential. However, it is unknown how TAHD affects the population dynamics of herds where TAHD occurs. This is the focus of ongoing research. The Department is also conducting research to better estimate the distribution and prevalence of TAHD. To learn more about the Department’s efforts associated with investigating TAHD, please visit the Department’s hoof disease webpage: http://wdfw.wa.gov/conservation/health/hoof_disease/.
103

Elk Status and Trend Report 2018
Habitat Conditions on Federal Lands Habitat conditions on federally managed lands within the Mount St. Helens elk herd area are of concern. Large scale fire, timber harvest, disease, or other succession re-setting events are largely absent from the federal lands. The resulting landscape is dominated by closed-canopy forest, much of which was harvested from roughly 1950-1990 and subsequently replanted with dense Douglas fir trees. These stands provide little in the way of elk forage and lack the diversity and forage resources of either older or younger forests. While some forest thinnings have been completed by the USFS and do provide more robust forage resources, at least temporarily, elk forage and therefore elk populations will continue to be suppressed in GMUs 560, 572, and 574.
Fee-Only Hunting Access Restrictions In 2014, the largest industrial forestland owner within the Mount St. Helens elk herd area implemented a fee-only access system for hunting and other recreation on their lands. This system limited the number of individuals allowed access to these lands and has continued in the years that have followed. The ramifications of this limited access to elk hunting opportunity are difficult to quantify as the landowners don’t own entire Game Management Units, some individuals elect to pay the access fee, some individuals elect to hunt in another area, and some may decide to quit hunting. It is probable that the reduction in participation over the years illustrated in Figure 8 above partially reflects this reduction in free, unlimited hunting access within a large portion of the Mount St. Helens elk herd area. Ramifications of reduced hunter access and participation are twofold in as much as it impacts the Department’s goals to maximize recreational access to wildlife and likely reduces hunter participation and recruitment, therefore undermining capacity to manage elk and other wildlife.
Management Conclusions Harvest and survey data indicate the Mount St. Helens elk herd has declined in accordance with the Department’s objective of reducing herd size by 35%. The Department began managing for population stability in 2012. Estimates of total elk abundance indicated a stable population during the period spanning 2013–2016.
The winter of 2016-17 was unusually severe. Population surveys conducted in the spring of 2017 indicated a decline of roughly one-third in the surveyed portion of the Mount St. Helens elk herd. However, estimated calf:cow ratios indicate calf recruitment rates are at levels that would promote population growth or stability. In addition, recent estimates of bull survival indicate the Department is achieving its management objective of maintaining annual survival rates of 0.50 for bulls. Opportunites to harvest antlerless elk were reduced for the 2017 hunting season and have been further reduced for 2018 as a means of moderating the effect of the severe winter. Surveys conducted in the spring of 2018 indicated a very slight increase in the elk population following the low-point reached in 2017.
The effects of the 2016-17 winter, treponeme associated hoof disease, habitat condition on federal lands, and fee-access systems remain concerns for the Mount St. Helens elk herd.
An updated herd plan is needed for the Mount St. Helens elk herd. The existing plan is now more than 10 years old and does not reflect current conditions. Specifically, the plan was written before
104

Elk Status and Trend Report 2018
the presence of hoof disease in southwest Washington elk and prior to the organizational change of wildlife management staff addressing wildlife-human conflicts.
Literature Cited Geary, A.B., J. G. Cook, R. C. Cook, and E. H. Merrill. 2012. Herbicide and Herbivory Effects on
Elk Forages at Mt. St. Helens. Final research report. University of Alberta and National Council for Air and Stream Improvement. 44 p.
McCorquodale, S. M., P. J. Miller, S. M. Bergh, and E. W. Holman. 2014. Mount St. Helens elk
population assessment: 2009–2013. Washington Department of Fish and Wildlife, Olympia, Washington, USA.
Ulappa, A. 2015. Using foraging dynamics to answer landscape management questions: the
nutritional ecology of black-tailed deer. Dissertation, Washington State University, Pullman, WA, USA.
Washington Department of Fish and Wildlife, Confederated Colville Tribes, Spokane Tribe of
Indians, USDA-APHIS Wildlife Services, and U.S. Fish and Wildlife Service. 2018. Washington Gray Wolf Conservation and Management 2017 Annual Report. Washington Department of Fish and Wildlife, Wenatchee, WA, USA.
Washington Department of Fish and Wildlife. 2014. 2015–2021 Game Management Plan. Wildlife Program, Washington Department of Fish and Wildlife, Olympia, WA.
Washington Department of Fish and Wildlife. 2006. Mt. St. Helens Elk Herd Plan. Wildlife
Program, Washington Department of Fish and Wildlife, Olympia, WA.
105

Elk Status and Trend Report 2018
North Cascade Elk Herd ROBERT WADDELL, Wildlife Biologist Introduction The North Cascade elk herd (NCEH) is the smallest of 10 herds formally managed by the Wasshington Department of Fish and Wildlife (WDFW). The herd area is located in northwest Washington and consists of 5 GMUs (Figure 1), which includes 407 (North Sound), 418 (Nooksack), 437 (Sauk), 448 (Stillaquamish), and 450 (Cascade).
Figure 1. Dominant land use cover types within the 5 game management units that comprise the North Cascade elk herd area.
Management Guidelines and Objectives The Department recently completed the NCEH Plan (WDFW 2018). Current objectives include maintaining a post-hunt population with a bull:cow ratio of 12–20 bulls:100 cows and maintaining an annual survival rate of greater than 0.50 for bulls, when bull mortality is monitored (WDFW 2014).
106

Elk Status and Trend Report 2018
Population Surveys The Department, in cooperation with the Point Elliot Treaty Tribes, conducts aerial composition surveys during spring in areas associated with the core herd area (GMU 418 and the Skagit River Valley in GMU 437). We derive estimates of total elk abundance and estimates of the bull and cow subpopulations within the survey area using a variant of mark-resight known as the logit-normal mixed effects model (McCorquodale et al. 2011, 2013), whenever the required replicate flights during a survey period can be performed.
Due to weather issues, biologists were only able to conduct a single aerial survey in spring of 2018, instead of the standard two flights, thus total elk abundance was based on a Lincoln-Petersen estimate. In spring 2018, biologists estimated total elk abundance within the core herd area to be 1,593 (±716) elk (Figure 2). Estimates of bull:cow and calf:cow ratios derived from uncorrected observation data in spring 2018 were 25:100 and 32:100, respectively. Bull:cow ratios remain at levels above the post-hunt management objective of 12–20 bulls:100 cows (Figure 3), and calf:cow ratios have represented good-excellent calf recruitment rates in most years (Figure 4).
Figure 2. Estimates of total elk abundance using a variant of mark-resight or a Lincoln-Petersen estimator with associated 95% confidence intervals in the core range of the North Cascade elk herd area (GMU 418 and Elk Area 4941), spring 2009–2018.
107
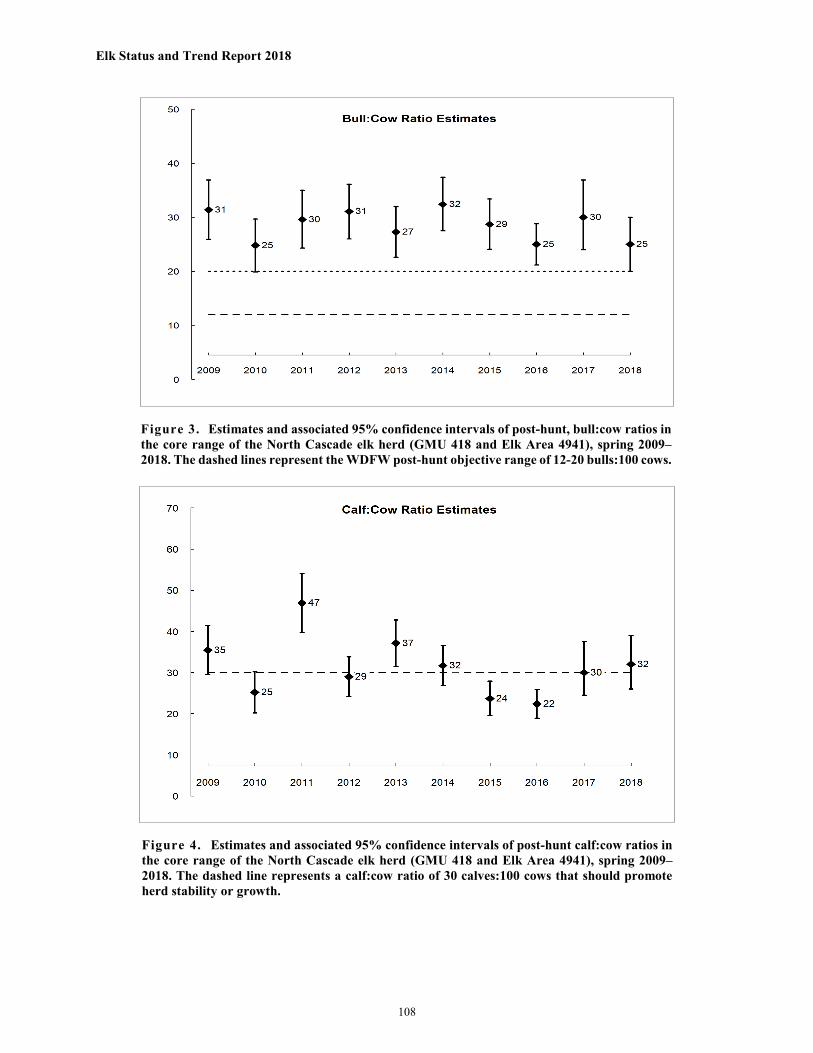
Elk Status and Trend Report 2018
Figure 3. Estimates and associated 95% confidence intervals of post-hunt, bull:cow ratios in the core range of the North Cascade elk herd (GMU 418 and Elk Area 4941), spring 2009–2018. The dashed lines represent the WDFW post-hunt objective range of 12-20 bulls:100 cows.
Figure 4. Estimates and associated 95% confidence intervals of post-hunt calf:cow ratios in the core range of the North Cascade elk herd (GMU 418 and Elk Area 4941), spring 2009–2018. The dashed line represents a calf:cow ratio of 30 calves:100 cows that should promote herd stability or growth.
108

Elk Status and Trend Report 2018
Hunting Seasons and Recreational Harvest The Department and Point Elliot Treaty Tribes implemented a harvest moratorium throughout most of the herd area during 1997–2006 because managers believed the herd had declined to as few as 300 elk. Managers reinstated limited opportunities to harvest bulls in 2007 and allocated those opportunities equally between state and tribal hunters; that approach continues to this day. General season opportunities continue to be limited, but managers have increased special permit opportunities as the population has increased. Antlerless harvest is primarily limited to situations involving agricultural damage complaints, but harvest levels have been substantial in some years (e.g., 2013; see below) when abnormal winter conditions concentrated elk in the Skagit River Valley, where conflict with agricultural producers can be high.
Estimates of antlerless harvest have remained steady since 2014, whereas estimates of antlered harvest have increased during the same period (Figure 5). The wide variability in harvest estimates 2011–2016 have largely been associated with increased opportunities to harvest antlerless elk to mitigate damage to agricultural crops. Estimates of antlered harvest during 2015–2017 have remained high (Figure 5), compared to previous years, due to increases in estimated elk abundance, increases in special permit opportunities, high estimated bull:cow ratios (Figure 3), and a need to address crop damage concerns. In 2017, Tribal seasons accounted for a higher percentage of estimated antlered harvest and a lower percentage of estimated antlerless harvest, compared to general and permit seasons (Figures 6 and 7).
The estimated number of days hunters spent pursuing elk during general recreational seasons, where over-the-counter license opportunities are available, has remained steady since 2015 (Figure 8). During the same general recreational seasons and period, the estimated number of elk harvested for every 100 hunter days has steadily increased (Figure 9), likely due to increased elk numbers in these areas.
109

Elk Status and Trend Report 2018
Figure 5. Estimated number of antlered and antlerless elk harvested in the North Cascade elk herd area during recreational hunting seasons (general and permit opportunities combined) established by the Department and during established Tribal seasons, 2008–2017. Estimates of Tribal harvest were derived from annual harvest reports compiled by the Northwest Indian Fisheries Commission. Estimates do not include elk harvested in association with damage permits (see Human Wildlife Interaction below).
Figure 6. Estimated percentage of recreational antlered harvest in the North Cascade elk herd area that occured during general and permit seasons and the percentage of harvest that occurred during established tribal seasons, 2008–2017.
110

Elk Status and Trend Report 2018
Figure 7. Estimated percentage of recreational antlerless harvest in the North Cascade elk herd area that occured during general and permit seasons and the percentage of harvest that occurred during established tribal seasons, 2008–2017.
Figure 8. Estimated number of days hunters spent pursuing elk in the North Cascade elk herd area during recreational seasons that provided general over-the-counter opportunities, 2008–2017.
111

Elk Status and Trend Report 2018
Survival and Mortality Common predators of elk that occur throughout the NCEH area include black bears and cougars. The Department has documented the presence of gray wolves in the upper Skagit River system near the U.S./Canada border since the early 1990s and collared a single wolf in Skagit County in 2017, but at the time of this writing there were no documented wolf packs within the NCEH area (WDFW et al. 2018).
Although biologists have never documented a substantial winter effect on elk survival, it can influence the distribution of this herd. When severe winter conditions persist, elk become concentrated in the Skagit River Valley, where the potential for conflict with agricultural producers is high.
The Department monitored the survival of adult female elk and branch-antlered bulls in the NCEH area 2005–2011 and estimated annual survival rates to be >0.90 for both sex classes prior to the reinstatement of harvest opportunities in 2007 (McCorquodale et al. 2011). Following the resumption of opportunities to harvest bulls, we estimated survival of branch-antlered bulls to be 0.68 (95% CI = 0.50–0.82). In addition, of the 270 mortality events we documented during that study, we attributed 77% to harvest-related causes, 14% to elk-vehicle collisions, and only 4% to natural causes (e.g., predation, disease, accidents, etc., combined).
Figure 9. Estimated number of elk harvested for every 100 hunter days spent pursuing elk in the North Cascade elk herd area during recreational seasons that provided general over-the-counter opportunities, 2008–2017.
112

Elk Status and Trend Report 2018
Habitat Forest management practices on private industrial and state forestlands continue to benefit the NCEH by creating a mosaic of habitat types. Specifically, clearcuts and young regenerating stands provide a forage base that is commonly absent in mature forests. Conversely, a large portion of the NCEH area is under federal ownership and dominated by mature timber that provides little benefit to elk.
Human-Wildlife Interaction The damage removal period for deer and elk ran from July 1, 2017 thru March 31, 2018. During that time period, WDFW received 74 elk-related complaints with a majority of complaints involving agricultural land. The remainder of complaints came from individuals not engaged in agricultural or livestock production (i.e., trees, gardens, landscaping, etc.)
A total of 51 elk damage permits were issued in 2017-2018 to address elk damage in GMUs 407, 418, and 437. The majority of the damage permits were focused in Elk Area 4941 during the state authorized removal period. Of the 51 issued permits, there were 33 elk removed via harvest throughout the three GMUs.
Research No formal research was conducted on the NCEH during 2017. The Department has assisted the Point Elliott Treaty Tribes in using clover traps to capture and collar elk, with application of VHF and GPS collars to track elk movements and for use in population monitoring. In 2017, 11 elk were captured, collared, and released.
Management Concerns Treponeme-associated hoof disease The Department confirmed the presence of Treponeme-associated hoof disease (TAHD) in the NCEH area in 2016. One confirmed case occurred in the Skagit River Valley, while the other confirmed case occurred near the town of Acme. TAHD of elk results in abnormal hoof growth, cavitating sole ulcers, and in severe cases, eventual sloughing of the hoof capsule. Elk severely affected by TAHD often have reduced mobility and condition. Consequently, it seems reasonable to assume they would have a reduced probability of survival or reproductive potential. However, it is unknown how TAHD affects the population dynamics of herds where it occurs. The Department is currently investigating the effects of TAHD on elk population dynamics in the Mount St. Helens elk herd area, as well as conducting research to better estimate the distribution and prevalence of TAHD. To learn more about the Department’s efforts associated with investigating TAHD, please visit the Department’s hoof disease webpage: http://wdfw.wa.gov/conservation/health/hoof_disease/.
Management Conclusions Estimates of total elk abundance and calf:cow ratios within the core herd area indicate the NCEH has steadily increased since 2007 and that calf recruitment rates have been at levels that would promote population growth or stability in most years. In addition, estimated bull:cow ratios and recent estimates of bull survival indicate the Department is exceeding its objective of maintaining
113

Elk Status and Trend Report 2018
an annual survival rate of 0.50 for bulls. Consequently, in the absence of abnormal weather conditions or exceedingly high harvest rates for adult female elk, the Department expects the NCEH to continue to increase.
Literature Cited McCorquodale, S., S. Knapp, M. Davison, J. Bohannon, and C. Danilson. 2011. A population
assessment for the North Cascades elk herd: 2006–2011. Washington Department of Fish and Wildlife, Olympia, WA.
McCorquodale, S. M., S. M. Knapp, M. A. Davison, J. S. Bohannon, C. D. Danilson, and W. C.
Madsen. 2013. Mark-resight and sightability modeling of a western Washington elk population. Journal of Wildlife Management 77:359–371.
Washington Department of Fish and Wildlife. 2014. 2015–2021 Game Management Plan.
Wildlife Program, Washington Department of Fish and Wildlife, Olympia, WA. Washington Department of Fish and Wildlife. 2018. North Cascade Elk Herd Plan. Wildlife
Program, Washington Department of Fish and Wildlife, Olympia, WA. USA. 35pp Washington Department of Fish and Wildlife, Confederated Colville Tribes, Spokane Tribe of
Indians, USDA-APHIS Wildlife Services, and U.S. Fish and Wildlife Service. 2018. Washington Gray Wolf Conservation and Management 2017 Annual Report. Washington Department of Fish and Wildlife, Wenatchee, WA.
114

Elk Status and Trend Report 2018
North Rainier Elk Herd MICHELLE TIRHI, Wildlife Biologist MIKE SMITH, Wildlife Biologist
Introduction The North Rainier elk herd area is located in west-central Washington and consists of 8 GMUs, which includes 454 (Issaquah), 460 (Snoqualmie), 466 (Stampede), 485 (Green River), 490 (Cedar River), 652 (Puyallup), 653 (White River), and 654 (Mashel) (Figure 1). Elk are primarily found only in the eastern halves of GMUs 454 and 652. The primary land use of the North Rainier herd area is forest, accounting for nearly 50% of the total area. These lands occur in the eastern portion of the herd area and dominate the landscape in GMUs 460, 466, 485, 490, 653, and 654. Developed lands make up more than 25% of the herd area. Undeveloped lands, which include designated open space, exceed 10%, but are largely intermingled with developed land. A relatively small amount of agricultural land is found scattered in the eastern parts of GMUs 454 and 652.
Figure 1. Dominant land use cover types within the 8 game management units that comprise the North Rainier elk herd area.
115

Elk Status and Trend Report 2018
Management Guidelines and Objectives The Department is currently updating the North Rainier Elk Herd Plan (WDFW 2002). Population objectives for the updated plan are in development at the time of this writing. Management objectives include maintaining a post-hunt population with a bull:cow ratio of 12–20 bulls:100 cows, maintaining an annual survival rate of 0.50 for bulls when bull mortality is monitored, and managing for a post-hunt population where 6-point (or better) bulls account for 2%–10% of the bull sub-population (WDFW 2014). Calf:cow ratios are also monitored as indicative of herd dynamics and a ratio of 30:100 indicates a herd that is potentially stable while anything above that indicates a herd that is potentially increasing.
Population Surveys A formalized monitoring program to estimate elk abundance for the entire herd area is currently lacking. However, there are several monitoring efforts that occur within the herd area at smaller scales. The Muckleshoot Indian Tribe (MIT) conducts aerial composition surveys in GMU 653 and annually estimates elk abundance using mark-resight, in addition to estimating post-hunt sex and age ratios. Surveys typically only occur in the eastern half of the GMU and cover approximatey 65% of the GMU, so estimates of abundance are not reflective of the entire GMU. However, the western half of the GMU was also surveyed in 2012, 2015, and 2017 with few elk observed. This supports the conclusion that the eastern GMU survey area contains the majority of elk (MIT and WDFW unpubl. data).
MIT estimated elk abundance in GMU 653 to be 1,257 (95% CI = 945–1,569) elk in spring 2017. Resulting estimates of post-hunt bull:cow and calf:cow ratios were 17:100 (95% CI = 13–21) and 25:100 (95% CI = 19–30), respectively (MIT unpubl. Data; Figures 2-4). Estimates of elk abundance steadily increased 2007–2012, but have been stable 2013–2017. Estimates of post-hunt bull:cow ratios have been relatively stable since 2011 and generally within targetted range, while estimates of post-hunt calf:cow ratios have generally been high indicating population stability and likely growth. MIT estimated elk abundance and post-hunt ratios within GMU 653 during spring 2018, but data were not available at the time of this writing. However, resulting estimates did indicate a stable population and adequate recruitment of calves.
MIT also conducts annual aerial composition surveys and uses mark-resight to estimate elk abundance in GMU 485. They estimated elk abundance to be 610 (95% CI = 504–716) elk in spring 2018. Resulting estimates of post-hunt bull:cow and calf:cow ratios were 16:100 (95% CI = 11–21) and 34:100 (95% CI = 26–41), respectively. Estimates of elk abundance have steadily increased since 2007 (Figure 5). Estimates of post-hunt bull:cow ratios have varied, but have consistently been within objective (Figure 6). Estimates of post-hunt calf:cow ratios have also varied, but have generally been at or above levels that should promote population stability (Figure 7).
116

Elk Status and Trend Report 2018
Figure 2. Mark-resight estimates of total elk abundance with associated 95% confidence intervals in GMU 653, spring 2009–2017 (MIT unpubl. data). The dashed line represents the 2002 management objective for total elk abundance (900 elk) for GMU 653 that will increase when the updated North Rainier Elk Herd Plan is adopted.
Figure 3. Estimates and associated 95% confidence intervals of post-hunt bull:cow ratios in GMU 653, spring 2009–2017 (MIT unpubl. data). The dashed lines represent the objective range of 12-20 bulls:100 cows.
117

Elk Status and Trend Report 2018
Figure 4. Estimates and associated 95% confidence intervals of post-hunt calf:cow ratios in GMU 653, spring 2009–2017 (MIT unpubl. data). The dashed line represents a calf:cow ratio of 30 calves:100 cows that should promote herd stability or growth.
Figure 5. Mark-resight estimates and associated 95% confidence intervals of total elk abundance in GMU 485, spring 2009–2018 (MIT unpubl. data.). The dashed line represents the 2002 management objective for total elk abundance (525 elk) that will likely change when the updated North Rainier Elk Herd Plan is adopted.
118

Elk Status and Trend Report 2018
Figure 6. Estimates and associated 95% confidence intervals of post-hunt bull:cow ratios in GMU 485, spring 2009–2018 (MIT unpubl. data). The dashed lines represent the objective range of 12-20 bulls:100 cows.
Figure 7. Estimates and associated 95% confidence intervals of post-hunt calf:cow ratios in GMU 485, spring 2009–2018 (MIT unpubl. data). The dashed line represents a calf:cow ratio of 30 calves:100 cows that should promote herd stability or growth.
119

Elk Status and Trend Report 2018
Other efforts to monitor elk abundance in the North Rainier elk herd area occur in Elk Areas 4601, 6013, and 6014 and Mount Rainier National Park. The volunteer-based Upper Snoqualmie Valley Elk Management Group (USVEMG) have estimated elk abundance in Elk Area 4601 using ground-based mark-resight surveys since 2010. Estimates of elk abundance indicate elk numbers in Elk Area 4601 have been relatively stable since 2010 except for a significant increase in 2018 (Figure 8). Both the USVEMG and WDFW don’t believe this represents an actual increase in the elk population but is instead a function of the model used to estimate this elk herd size.
WDFW in partnership with NW Trek and MIT launched a pilot citizen science elk monitoring project in Elk Areas 6013 and 6014 in 2015. A driving route with designated observation points was established and volunteers were trained to conduct monthly dusk or dawn surveys to record elk by sex and age and record observation location. A limited number of volunteers participated in this first year pilot but increased in 2016 and collected meaningful data. WDFW intends to work more closely with volunteers in the future and make slight alterations to the project criteria.
WDFW and MIT conducted a survey of elk area 6013 and 6014 combined in 2017 and located 192 elk in total with bull:cow and calf:cow ratios of 15:100 and 37:100, respectively (WDFW unpubl.data).
The Department has also collaborated with MIT, the U.S. Geological Survey, National Park Service, and Puyallup Tribe of Indians to estimate elk abundance in the subalpine meadows of Mount Rainier National Park (MRNP) (Griffen et al. 2013). Those surveys only include a small portion of the North Rainier elk herd, a group refered to as the White River elk. Although WDFW no longer participates in this survey, the partners continued to survey thru 2015 and used the model to estimate a population of 408 elk in the subalpine meadows of MRNP in 2015. Based on historical data from collared elk in the 1980s (WDFW unpublished data) about 15% of the White River elk did not migrate to higher elevations in the late spring while the remaining 85% migrated to high elevation areas in MRNP. More recently, studies conducted by MIT in 1998 indicated that about half of the White River elk migrate to MRNP while the remainder remain outside the park with some being non-migratory and some making short local migrations to nearby ridges.
Figure 8. Mark-resight estimates and associated 95% confidence intervals of total elk abundance in in Elk Area 4601, spring 2011–2018.
120

Elk Status and Trend Report 2018
Hunting Seasons and Recreational Harvest The Department limits most general season harvest opportunities in the North Rainier elk herd area to branch-antlered bulls and offers most opportunities to harvest antlerless elk through the special permit system. However, limited opportunities to harvest antlerless elk during general seasons do occur during general archery and muzzleloader seasons and in areas where the Department’s objective is to maintain low elk numbers. The Department restricts all elk harvest in GMUs 485 and 653 to special permit only opportunities. Estimates of General State Harvest and Total State Harvest (e.g., general and permit combined) in the North Rainier elk herd area have averaged 332 and 383 elk, respectively, 2008–2017 (Figures 9-11). Reported tribal harvest averaged 97, while estimates of Total Harvest (e.g., total state and tribal harvest) have averaged 480 elk. All three harvest estimates steadily increased 2007–2013, General State Harvest and Total State Harvest declined slightly 2014-2015, all three estimates increased again in 2016 and decreased again in 2017. Eighty percent of the antlerless harvest within the herd area occurs during the general season (Figure 11). Hunter effort steadily increased, 2008–2017, while CPUE was stable, 2008–2011, increased sharply in 2012, declined for three years, increased sharply again in 2016 and declined slightly in 2017 (Figures 12 and 13).
Figure 9. Estimated number of antlered and antlerless elk harvested in the North Rainier elk herd area during recreational hunting seasons (general and permit opportunities combined) established by the Department and during established Tribal seasons, 2008–2017. Estimates of Tribal harvest were derived from annual harvest reports compiled by the Northwest Indian Fisheries Commission. Estimates do not include elk harvested in association with damage permits (see Human Wildlife Interaction below).
121

Elk Status and Trend Report 2018
Figure 10. Estimated percentage of recreational antlered harvest in the North Rainier elk herd area that occured during general and permit seasons and the percentage of harvest that occurred during established tribal seasons, 2008–2017.
Figure 11. Estimated percentage of recreational antlerless harvest in the North Rainier elk herd area that occured during general and permit seasons and the percentage of harvest that occurred during established tribal seasons, 2008–2017.
122
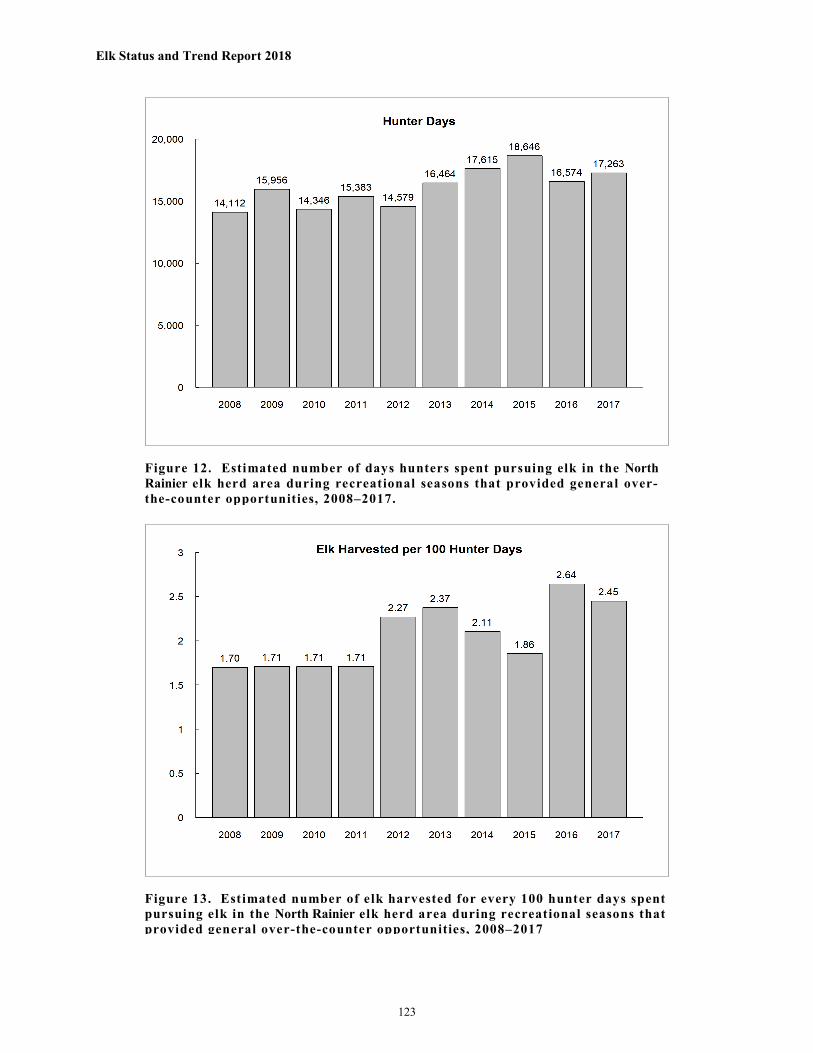
Elk Status and Trend Report 2018
Figure 12. Estimated number of days hunters spent pursuing elk in the North Rainier elk herd area during recreational seasons that provided general over-the-counter opportunities, 2008–2017.
Figure 13. Estimated number of elk harvested for every 100 hunter days spent pursuing elk in the North Rainier elk herd area during recreational seasons that provided general over-the-counter opportunities, 2008–2017
123

Elk Status and Trend Report 2018
Treponeme-associated Hoof Disease (TAHD) in elk Sporadic reports of lame elk or elk with overgrown or missing hooves have been received in southwest Washington since the mid-1990s. Reports of “hoof disease” have been increasing, and hunters have regularly seen and sometimes harvested elk with this condition. At times, observers have reported many individuals in a group limping and showing signs of hoof disease, which has been noted in males and females and old and very young animals. TAHD has been confirmed in at least one sample submitted from the North Rainier Elk Herd range and several more are suspect. For more information on Elk Hoof Disease, please visit the WDFW website: https://wdfw.wa.gov/conservation/health/hoof_disease/
Survival and Mortality Common predators of elk that occur throughout the North Rainier elk herd area include black bears and cougars. At the time of this writing, there were no documented wolf packs within the herd area (WDFW et al. 2018).
Severe winter conditions are rare in the North Rainier elk herd area and are unlikely to influence the population dynamics of this herd. However, extreme drought conditions that persist through summer and fall have the potential to reduce the availability of high quality forages that elk need to accrue adequate fat stores for winter.
MIT has monitored the survival of adult female elk and calves in GMUs 485, 490, and 653, 1998–present (MIT unpubl. data). During that same period, they estimated annual adult female survival rates that were as low as 0.70–0.75 in some years, but typically ranged between 0.80–0.90. Cougars accounted for 63% and 33% of all adult cow mortalities in GMUs 485 and 653, respectively, prior to MIT implementing a cougar reduction program (see below) and 33% and 25%, respectively, following cougar removals.
Estimates of calf survival were quite variable and ranged from a low of 0.09 in 1999 to a high of 0.82 in 2006. Cougars accounted for 43–88% of all calf mortalities; bears only accounted for 6–11% of calf mortalities. Calf annual mortality rates due to cougar ranged 0.20–0.71. The lowest estimates of cow and calf survival from the MIT research occurred in the late 1990s and early 2000s and indicated cougars were the leading cause of mortality for both adult females and calves.
In response to these findings, MIT implemented a cougar reduction program from 2001 to 2007 to reduce cougar densities in GMUs 485, 466, and 653. Elk survival rates increased during the same time period. In addition to more conservative hunting season structures, a gate closure program to reduce poaching, and ongoing habitat improvement projects during that same time period, this work does suggest that predation was one factor affecting the overall performance of the elk population. By 2017, female and calf survival was still occuring at levels that should promote elk population growth and stability (D. Vales, MIT, pers. Comm.).
Habitat A large portion of the North Rainier elk herd area consists of lands administered by the USFS. The Huckleberry Land Exchange transferred over 9,000 acres of commercial timberland in the White River drainage to the USFS to be managed mostly as late successional reserve with minimal timber harvest. Restricting timber harvest reduces the amount of forest openings and can, in turn,
124

Elk Status and Trend Report 2018
reduce forage availability to elk and the number of animals a landscape can support. In response, the USFS created 400-500 acres of permanent openings to increase forage production for elk and deer in this area under the Greenwater Elk Forage Management Project (USFS 2008). In general, the North Rainier elk herd benefits most from forest management practices on private and state industrial forestlands, where frequent harvesting of mature timber creates a mosaic of early seral habitats that provide an important forage base for this herd.
Elk winter range is a priority habitat under the WDFW Priority Habitats and Species (PHS) Program. PHS is the principal means by which WDFW provides important fish, wildlife, and habitat information to local governments, state and federal agencies, private landowners, consultants, and tribal biologists for land use planning purposes. As such, Pierce County Planning and Land Services has adopted elk winter range as a Habitat of Local Importance within Title 18E.40. (Regulated Fish and Wildlife Species and Habitat Conservation Areas). Land use development permits within mapped elk winter range are regulated by the county under four management goals: 1) minimize human activity that would disturb elk, 2) maximize retention of undisturbed vegetation – particularly forest cover, 3) avoid activities that serve to exclude elk, and 4) protecting private property.
Human-Wildlife Interaction Elk damage to ornamental shrubs, gardens, crops and pastures is a problem in all of the GMUs to some degree and complaints are received every year. Wildlife Conflict specialists work closely with agricultural producers by developing Damage Prevention Cooperative Agreements (DPCAs) which identify a plan to reduce damage incurred to crops using non-lethal and lethal methods. Non-lethal methods of discouraging elk use are a very important component to reducing elk damage and are generally attempted prior to the use of lethal measures. WDFW Conflict Specialists and landowners use a variety of non-lethal methods including: electrified fladry fencing, noisemakers (birdbangers, critter gitters, propane cannons), hazing and herding on foot, with a vehicle or with a dog, scarecrow-like electronic devices, and odor-based repellents such as Plantskyyd.
Lethal methods of deterring elk are also used to reduce damage to crops. These efforts include hunts within specified elk areas, pools of Master Hunters, as well as landowner damage permits. See Table 1 for a summary of permits issued to landowners allowing the taking of elk causing agricultural damage in the North Rainier Elk Herd during 2017-18. Collectively, these hunts are designed to decrease the number of elk causing the damage and/or to haze elk from the area.
125

Elk Status and Trend Report 2018
Table 1. Number of Permits to Lethally Remove Elk Causing Damage to Agricultural Crops and Resulting Kills, North Rainier Elk Herd, 2017-18.
Game Management Unit DPCA’s Issued Permits Issued Elk Removed
454 6 16 4
460 2 4 2
466 0 0 0
485 0 0 0
490 0 0 0
652 25 53 15
653 0 0 0
654 4 10 7
TOTAL 37 83 28
In GMU 460, elk damage is a notable problem for some golf courses, Christmas tree farms, nurseries, blueberry farms and other agricultural crops. Vehicle-elk collisions have increased as well. GMU 460 has good elk habitat, primarily on managed forestlands and the potential to support about 450-550 elk without damage concerns. However, damage complaints within the city limits of North Bend and Snoqualmie and vehicle-elk collisions on I-90 have raised concerns. As a result, the Upper Snoqualmie Valley Elk Management Group was formed in 2008. The group is made up of citizens, WDFW wildlife and enforcement personnel, city and county staff. The primary role of the group is to address the problems associated with the herd. Further, Washington Department of Transportation has initiated monitoring and collaborative academic studies to examine vehicle-elk collisions along I-90. Researchers are examining elk use of corridors and movement patterns related to the use of corridors.
Additional elk hunting opportunities aimed at reducing private property damage were initiated in 2014 within Elk Area 4601 and in 2015 in Elk Area 6014. The harvest of antlerless elk was added to general season hunts, aimed at reducing the herd in these localized areas. Regional master hunter permits were also issued in 6014 to further curtail damage.
Elk in GMUs 485, 466 and 653 have largely not been a problem to private property owners with few nuisance complaints received. However, continued monitoring of herd growth and opportunities to track any emigration from these GMUs will be valuable as surrounding communities continue to expand and develop adjacent to core herd use areas.
Research WDFW is a member of the White River Elk Herd Technical Committee comprised of state, federal, and tribal biologists and researchers who cooparatively manage the White River elk group. There is no collective partnership for the entire herd area. Members of the Committee collaborated on a Hybrid Double-observer Sightability Model for Aerial Surveys research project from 2008-2014
126
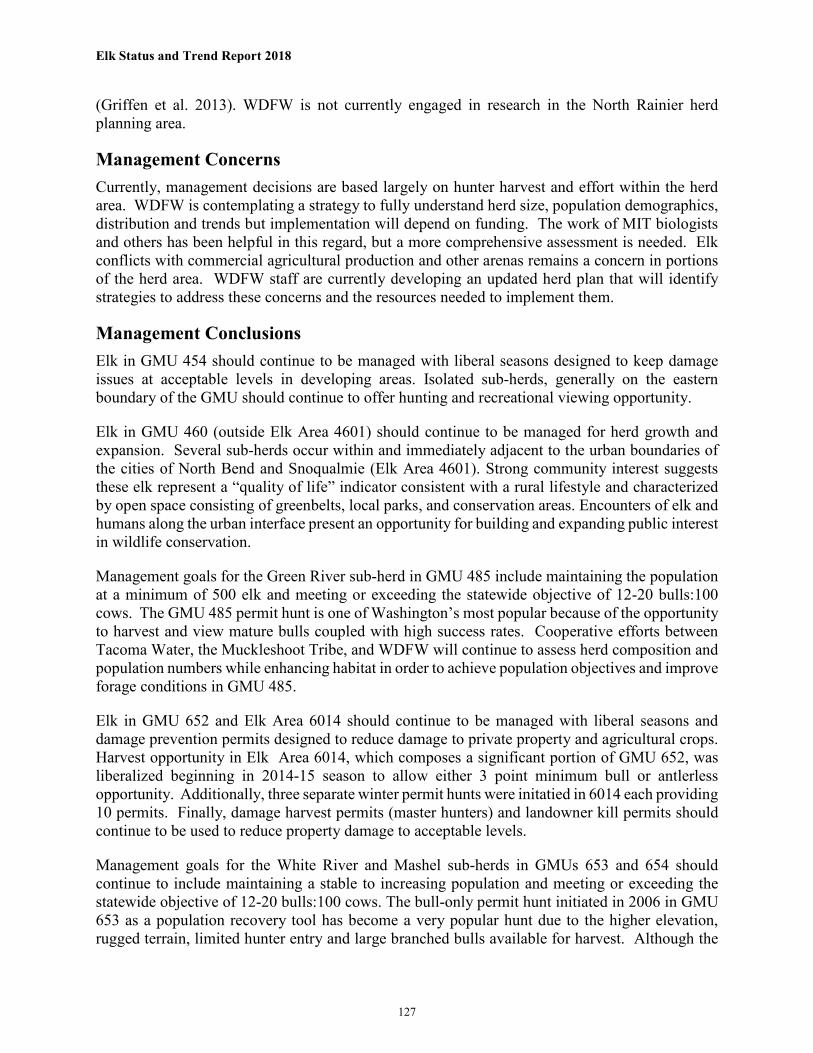
Elk Status and Trend Report 2018
(Griffen et al. 2013). WDFW is not currently engaged in research in the North Rainier herd planning area.
Management Concerns Currently, management decisions are based largely on hunter harvest and effort within the herd area. WDFW is contemplating a strategy to fully understand herd size, population demographics, distribution and trends but implementation will depend on funding. The work of MIT biologists and others has been helpful in this regard, but a more comprehensive assessment is needed. Elk conflicts with commercial agricultural production and other arenas remains a concern in portions of the herd area. WDFW staff are currently developing an updated herd plan that will identify strategies to address these concerns and the resources needed to implement them.
Management Conclusions Elk in GMU 454 should continue to be managed with liberal seasons designed to keep damage issues at acceptable levels in developing areas. Isolated sub-herds, generally on the eastern boundary of the GMU should continue to offer hunting and recreational viewing opportunity.
Elk in GMU 460 (outside Elk Area 4601) should continue to be managed for herd growth and expansion. Several sub-herds occur within and immediately adjacent to the urban boundaries of the cities of North Bend and Snoqualmie (Elk Area 4601). Strong community interest suggests these elk represent a “quality of life” indicator consistent with a rural lifestyle and characterized by open space consisting of greenbelts, local parks, and conservation areas. Encounters of elk and humans along the urban interface present an opportunity for building and expanding public interest in wildlife conservation.
Management goals for the Green River sub-herd in GMU 485 include maintaining the population at a minimum of 500 elk and meeting or exceeding the statewide objective of 12-20 bulls:100 cows. The GMU 485 permit hunt is one of Washington’s most popular because of the opportunity to harvest and view mature bulls coupled with high success rates. Cooperative efforts between Tacoma Water, the Muckleshoot Tribe, and WDFW will continue to assess herd composition and population numbers while enhancing habitat in order to achieve population objectives and improve forage conditions in GMU 485.
Elk in GMU 652 and Elk Area 6014 should continue to be managed with liberal seasons and damage prevention permits designed to reduce damage to private property and agricultural crops. Harvest opportunity in Elk Area 6014, which composes a significant portion of GMU 652, was liberalized beginning in 2014-15 season to allow either 3 point minimum bull or antlerless opportunity. Additionally, three separate winter permit hunts were initatied in 6014 each providing 10 permits. Finally, damage harvest permits (master hunters) and landowner kill permits should continue to be used to reduce property damage to acceptable levels.
Management goals for the White River and Mashel sub-herds in GMUs 653 and 654 should continue to include maintaining a stable to increasing population and meeting or exceeding the statewide objective of 12-20 bulls:100 cows. The bull-only permit hunt initiated in 2006 in GMU 653 as a population recovery tool has become a very popular hunt due to the higher elevation, rugged terrain, limited hunter entry and large branched bulls available for harvest. Although the
127

Elk Status and Trend Report 2018
herd exceeded 2002 management plan recovery objectives in GMU 653 and this bull only permit hunt may no longer be needed as a recovery tool, the uniqueness and popularity of this hunt may justify maintaining it. Elk in GMU 654 will also be managed to meet or exceed the statewide objective of 12-20 bulls:100 cows and harvest opportunity while reducing elk damage to crops. Elk damage permit hunt opportunity will continue in the expanded Elk Area 6054 which should help control private property damage and provide additional recreational opportunity.
Literature Cited Griffin, P. B. Lubow, K. Jenkins, D.Vales, B. Moeller, M. Reid, P. Happe, S. Mccorquodale,
M.Tirhi, J. Schaberl, K. Beirne. 2013. A Hybrid Double-Observer Sightability Model for Aerial Surveys. The Journal of Wildlife Management 77(8):1532–1544.
U.S. Forest Service. 2008. Greenwater Elk Forage Management Project Decision Memo. Mount Baker-Snoqualmie National Forest, Mountlake Terrace, WA.
Washington Department of Fish and Wildlife. 2014. 2015–2021 Game Management Plan. Wildlife
Program, Washington Department of Fish and Wildlife, Olympia, WA. Washington Department of Fish and Wildlife. 2002. North Rainier Elk Herd Plan. Wildlife
Program, Washington Department of Fish and Wildlife, Olympia, WA. Washington Department of Fish and Wildlife, Confederated Colville Tribes, Spokane Tribe of Indians,
USDA-APHIS Wildlife Services, and U.S. Fish and Wildlife Service. 2018. Washington Gray Wolf Conservation and Management 2017 Annual Report. Washington Department of Fish and Wildlife, Wenatchee, WA, USA.
128

Elk Status and Trend Report 2018
Olympic Elk Herd BRYAN MURPHIE, Wildlife Biologist Introduction The Olympic elk herd area is located on the Olympic Peninsula and consists of 14 GMUs, 601 (Hoko), 602 (Dickey), 603 (Pysht), 607 (Sol Duc), 612 (Goodman), 615 (Clearwater), 618 (Matheny), 621 (Olympic), 624 (Coyle), 633 (Mason), 636 (Skokomish), 638 (Quinault Ridge), 642 (Copalis), 648 (Wynoochee), and 651 (Satsop) (Figure 1). Much of the land utilized by elk in this area is in public ownership. Federal lands include over 922,000 acres in the Olympic National Park (ONP) consisting of the core of the Olympic Mountains proper, as well as portions of coastal areas along the Pacific coast. Olympic National Forest (ONF) lands adjacent to ONP include an additional 643,000 acres. The State of Washington Department of Natural Resources, manages 368,000 acres of forest lands in the herd area, of which the 168,000 acre Clearwater Block is the largest. Indian Reservation lands encompass over 255,000 acres, the largest being 208,000 acres in the Quinault Indian Nation Reservation. The remainder of the land is in private residential, agriculture, or industrial timber company lands.
Figure 1. Dominant land use cover types within the 14 game management units that comprise the Olympic elk herd area.
129

Elk Status and Trend Report 2018
Management Guidelines and Objectives The Olympic Elk Herd Plan identifies a population objective of 11,350 elk outside Olympic National Park (WDFW 2004). However, that objective is likely to change when the plan is updated. The Department has not identified a formalized monitoring strategy to estimate elk abundance or composition throughout the herd area. Consequently, the Department generally manages for stable to increasing elk populations, while providing for multiple uses; including recreational, educational and aesthetic, as well as a sustainable annual harvest. Additional objectives include managing for a pre-season population with 15–35 bulls:100 cows and/or a post-hunt population with 12–20 bulls:100 cows (WDFW 2004) and maintaining an annual survival rate of 0.50 for bulls when bull mortality is monitored (WDFW 2014). We attempt to achieve these objectives largely through manipulating hunting seasons.
Population Surveys The Department and several Treaty Tribes that have hunting rights on the Olympic Peninsula periodically conduct aerial or ground-based composition surveys in the Olympic elk herd area. Formalized estimators (e.g., sightability models, mark-resight, distance sampling, etc.) to correct observed data for detection probabilities that vary among age and sex classes are generally not applied. Even though those data are likely biased and managers must make conservative inferences, it still provides some insight into the current composition of this herd.
Estimates of pre-hunt bull:cow ratios declined over the 2008–2013 time period but have been at or above the management objective of 15–35 bulls:100 cows since 2014 (Figure 2). Estimates of post-hunt bull:cow ratios are often reported as below the management objective of 12–20 bulls:100 cows (Figure 5), however these ratios are thought to be biased low, as post-hunt surveys are conducted in late-winter with effort focused on the main cow and calf groups. This is also a period when most mature bulls are travelling independently or in small bachelor groups making them less detectable during survey flights. Estimates of pre-hunt calf:cow ratios averaged 39:100 cows (range = 31:100 to 46:100) (Figure 3), while estimates of post-hunt calf:cow ratios averaged 29:100 cows (range = 24:100 to 34:100) (Figure 5).
130

Elk Status and Trend Report 2018
Figure 2. Estimates and associated 95% confidence intervals of pre-hunt bull:cow ratios in the Olympic elk herd area, autumn 2008–2017. The dashed lines represent the objective range of 15-35 bulls:100 cows.
Figure 3. Estimates and associated 95% confidence intervals of pre-hunt calf:cow ratios in the Olympic elk herd area, autumn 2008–2017.
131

Elk Status and Trend Report 2018
Figure 4. Estimates and associated 95% confidence intervals of post-hunt bull:cow ratios in the Olympic elk herd area, spring 2009–2018. The dashed lines represent the objective range of 12-20 bulls:100 cows. Post-hunt ratios from 2014 and 2016 are not included because biologists only conducted surveys in a single GMU during these years.
Figure 5. Estimates and associated 95% confidence intervals of post-hunt calf:cow ratios in the Olympic elk herd area, spring 2009–2018. The dashed line represents a calf:cow ratio of 30 calves:100 cows that should promote herd stability or growth. Post-hunt ratios from 2014 and 2016 are not included because biologists only conducted surveys in a single GMU during these years.
132
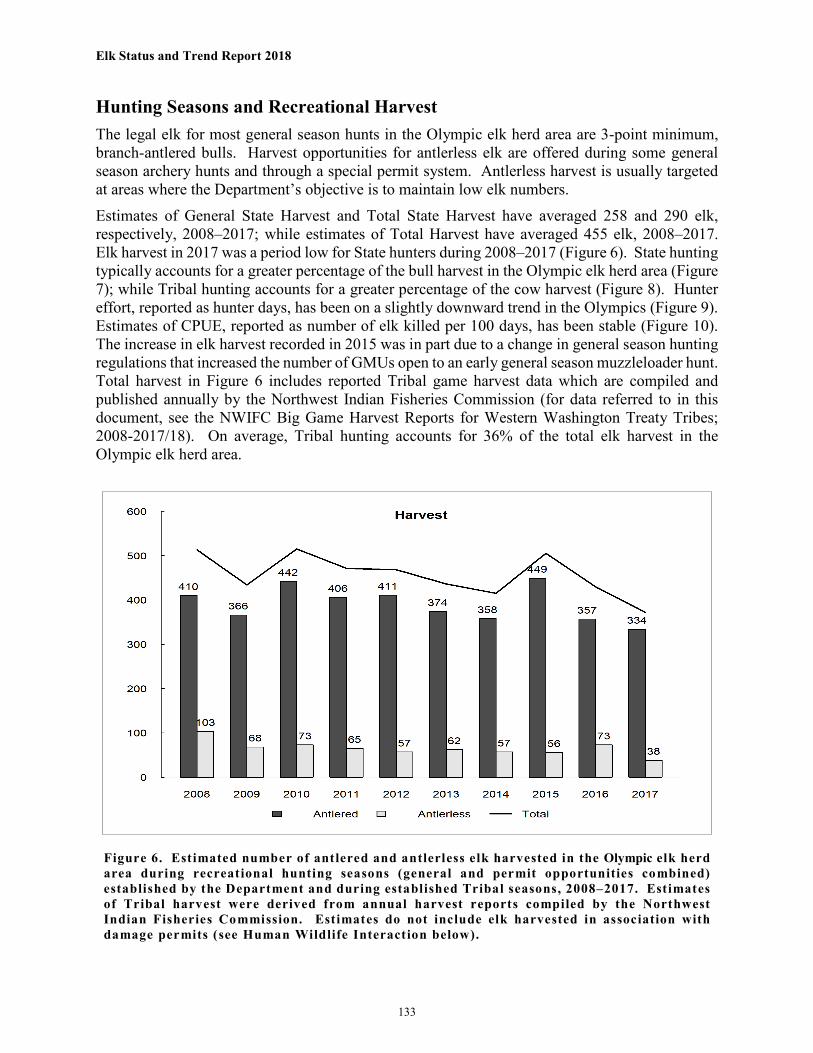
Elk Status and Trend Report 2018
Hunting Seasons and Recreational Harvest The legal elk for most general season hunts in the Olympic elk herd area are 3-point minimum, branch-antlered bulls. Harvest opportunities for antlerless elk are offered during some general season archery hunts and through a special permit system. Antlerless harvest is usually targeted at areas where the Department’s objective is to maintain low elk numbers. Estimates of General State Harvest and Total State Harvest have averaged 258 and 290 elk, respectively, 2008–2017; while estimates of Total Harvest have averaged 455 elk, 2008–2017. Elk harvest in 2017 was a period low for State hunters during 2008–2017 (Figure 6). State hunting typically accounts for a greater percentage of the bull harvest in the Olympic elk herd area (Figure 7); while Tribal hunting accounts for a greater percentage of the cow harvest (Figure 8). Hunter effort, reported as hunter days, has been on a slightly downward trend in the Olympics (Figure 9). Estimates of CPUE, reported as number of elk killed per 100 days, has been stable (Figure 10). The increase in elk harvest recorded in 2015 was in part due to a change in general season hunting regulations that increased the number of GMUs open to an early general season muzzleloader hunt. Total harvest in Figure 6 includes reported Tribal game harvest data which are compiled and published annually by the Northwest Indian Fisheries Commission (for data referred to in this document, see the NWIFC Big Game Harvest Reports for Western Washington Treaty Tribes; 2008-2017/18). On average, Tribal hunting accounts for 36% of the total elk harvest in the Olympic elk herd area.
Figure 6. Estimated number of antlered and antlerless elk harvested in the Olympic elk herd area during recreational hunting seasons (general and permit opportunities combined) established by the Department and during established Tribal seasons, 2008–2017. Estimates of Tribal harvest were derived from annual harvest reports compiled by the Northwest Indian Fisheries Commission. Estimates do not include elk harvested in association with damage permits (see Human Wildlife Interaction below).
133
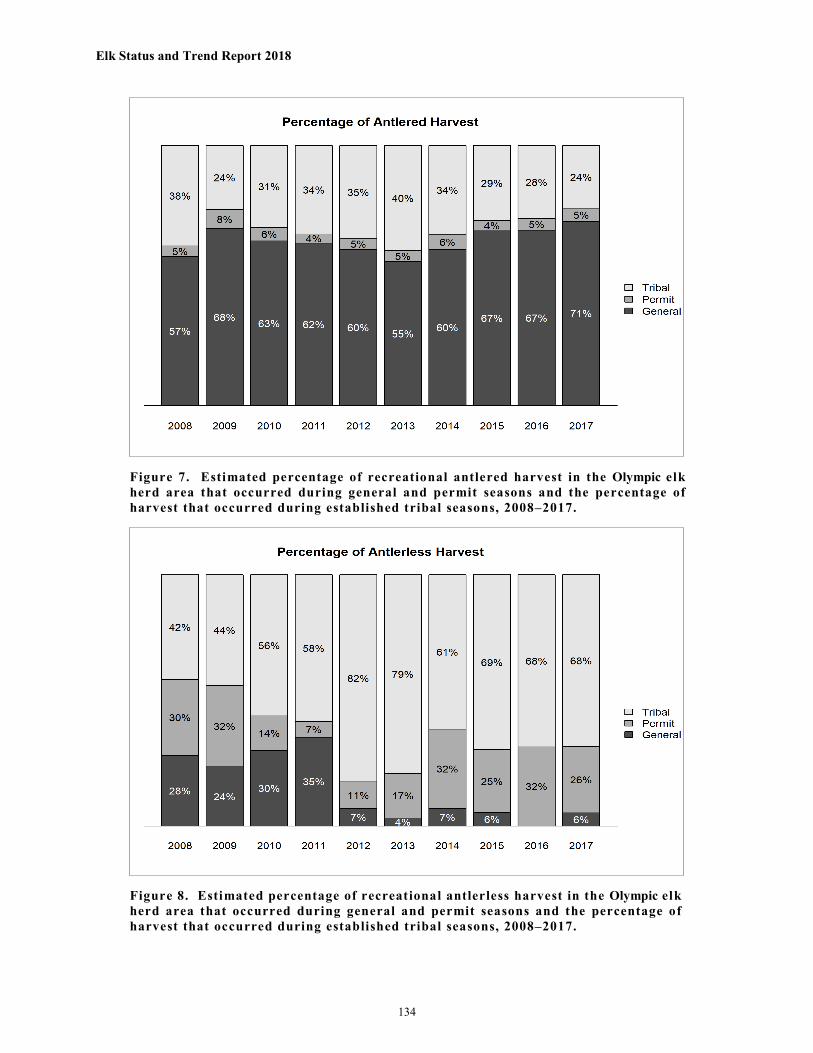
Elk Status and Trend Report 2018
Figure 7. Estimated percentage of recreational antlered harvest in the Olympic elk herd area that occurred during general and permit seasons and the percentage of harvest that occurred during established tribal seasons, 2008–2017.
Figure 8. Estimated percentage of recreational antlerless harvest in the Olympic elk herd area that occurred during general and permit seasons and the percentage of harvest that occurred during established tribal seasons, 2008–2017.
134

Elk Status and Trend Report 2018
Figure 9. Estimated number of days hunters spent pursuing elk in the Olympic elk herd area during recreational seasons that provided general over-the-counter opportunities, 2008–2017.
Figure 10. Estimated number of elk harvested for every 100 hunter days spent pursuing elk in the Olympic elk herd area during recreational seasons that provided general over-the-counter opportunities, 2008–2017.
135

Elk Status and Trend Report 2018
Survival and Mortality There have been no comprehensive studies to estimate the survival of elk throughout the Olympic elk herd area during a specific time period; however, the Department and several Treaty Tribes have conducted numerous projects in specific GMUs. Cow survival is generally higher than 80% (Smith et al. 1994; WDFW, unpublished data; R. McCoy, Makah Tribe, unpublished data). Bull survival has been documented to be 23% (Smith et al. 1994) and 29% (R. McCoy, Makah Tribe, unpublished data). Calf survival ranged from 27–40% in one study conducted in GMUs 601 and 602 by the Makah Tribe (R. McCoy, unpublished data).
Causes of mortality among Olympic elk include nutritional stress, predation, legal harvest, poaching, and a variety of other natural and human-related causes (vehicle collision, for example). Malnutrition and predation are the most common factors associated with the mortality of cows and calves (Smith et al. 1994; WDFW, unpublished data; R. McCoy, Makah Tribe, unpublished data). Hunter harvest is the most common cause of mortality among bulls (Smith et al. 1994; R. McCoy, Makah Tribe, unpublished data). Poaching related mortality accounted for 2.5% among bulls and cows in the Olympic herd in one study (Smith et al. 1994).
Habitat The Olympic elk herd area encompasses a diverse array of habitat types rising in elevation from the coastal and inland marine ecosystems at sea level through a series of forested zones that change with increasing elevation and rainfall. These zones include forests dominated by Sitka spruce (Picea sitchensis), then western hemlock (Tsuga heterophylla) and Pacific silver fir (Abies amabilis), until reaching the subalpine forests dominated by mountain hemlock (Tsuga mertensiana) and subalpine fir (Abies lasiocarpa) at higher elevations (Franklin and Dyrness 1973). Douglas fir (Pseudotsuga menziesii) and western red cedar (Thuja plicata) are also common in the Sitka spruce and western hemlock zones, while areas in the subalpine zones often have open parklands and subalpine meadows (Franklin and Dyrness 1973, Henderson et al. 1989).
The western hemlock zone is the most extensive within the Olympic elk herd area and, along with areas in the Sitka spruce zone, has probably undergone the most significant alteration through timber harvest and replanting, often with Douglas fir (WDFW 2004). Elk demographics (survival and productivity, for example) are strongly influenced by forest management practices that have created a patchwork of stand types and ages, each with varying degrees of value for elk. Early seral stands, riparian zones, and mature to old growth forests tend be of most value to elk, while those stands 20-30 years after clearcutting have the least value (Lopez-Perez, 2004). Early seral stands are most common on private and state lands currently managed for timber production. Following fairly robust timber harvest in the 1970s and 1980s, recent management of USFS lands within the Olympic elk herd area tend to promote the persistence of mid- to late seral forests, which are of less value to elk. However, the USFS is conducting habitat enhancement activities, including thinning and forage seeding, for elk in some areas.
WDFW actively manages 2,034 acres of land in the Olympic elk herd area specifically to provide habitat for elk either as mitigation for lost habitat due to dam construction (Wynoochee Mitigation Unit, 1,030 acres of habitat, including pastures planted to provide elk winter forage) or as a means to reduce agricultural crop damage on adjacent private land (Olympic Unit, 963 acres; Anderson Homestead, 41 acres). Private pasture land, planted for other agricultural purposes, can also be an
136

Elk Status and Trend Report 2018
important component of elk habitat in many GMUs, but in many cases, agricultural landowners do not welcome elk on their property.
The effect of weather on elk is mostly related to those conditions that influence the quality and availability of forage. Unusually dry and hot conditions during summer and early fall will reduce the availability of forage during a critical time for elk, as they attempt to recover lost energy stores from the previous winter, prepare for the next winter, and for some, raise a calf. The Olympic elk herd area experienced slightly above normal tempertures and below normal precipitation during the summer of 2017.
In winter, a period when forage conditions naturally decline, snow accumulation, if substantial and persistent can reduce access to what forage is available and reduce or hinder elk movement. These snow effects usually occur when accumulations are persistent and approach 20 inches or more (Poole and Mowat, 2005). Fortunately, weather conditions over much of the Olympic elk herd area tend to be mild and temperate (Washington Climate Center Data) and snow accumulations are most likely to have a more pronounced effect on elk at higher elevations in the Olympic National Park and Olympic Wildnerness Areas of USFS lands. The heavy, wet snow typical of the Olympic Peninsula is subject to repeated thawing and freezing, which can create a thick crust of snow and ice reducing access to forage.
Human-Wildlife Interaction Elk conflict in the Olympic elk herd area generally falls into two categories: public safety and property damage. Public safety concerns occur where elk and urban development overlaps and where elk routinely cross roadways or highways. Two of the most notable areas of public safety concern involves elk near the towns of Sequim and Forks. Elk damage usually occurs on private agricultural lands and pastures and can create significant costs for the landowner and WDFW. Private pastureland in the Wynoochee, Satsop, and Skokomish River valleys receive chronic elk damage. In some areas, public safety concerns and damage overlap. The Department employs Wildlife Conflict Specialists to work directly with landowners and communities to address elk conflicts using lethal and non-lethal activities; often through formal agreements termed Damage Prevention Cooperative Agreements (DPCAs). The intent of these activities is to reduce damage, increase landowner tolerance of elk, or reduce risk to human safety by reducing the number of elk and/or the amount of time elk spend on these lands. Non-lethal activities involve hazing and fencing, but may also include the deployment of traffic signs that warn drivers traveling through areas where elk routinely cross roads. Lethal removals are conducted either through permits issued to landowners, special permit hunts, or during general season hunts within a designated Elk Area.
In 2017/18, there were 26 DPCAs within the Olympic elk herd area. The Department issued 82 permits and removed 41 elk (Table 1). Additionally, eight Master Hunters removed five elk in 2017 (Table 1).
137

Elk Status and Trend Report 2018
Table 1. The number of damage prevention cooperative agreements, permits issued and elk removed, and the number of Master Hunters deployed and their harvest in 2017/18 for Game Management Units (GMU) in the Olympic elk herd area.
DPCAs Permits Issued
Elk Removed
Master Hunter Deployed
Master Hunter Harvest
607 2 7 1 0 0 615 1 3 0 0 0 624 9 4 4 4 636 2 14 11 0 0 642 4 6 4 0 0 648 9 23 10 3 0 651 8 20 11 1 1
Total 26 82 41 8 5
Management Concerns The Olympic Elk Herd Plan (WDFW 2004) provided management objectives and guidance for monitoring from 2005-2010, but needs to be updated. A formalized monitoring strategy is under development, as the herd plan is updated. Monitoring during this interim period has been limited to specific GMUs or portions thereof. WDFW has relied primarily on hunting harvest data as the basis for management decisions and the work of the Olympic Peninsula Treaty Tribes for herd demographics and other information.
Management Conclusions Elk harvest in the Olympic elk herd area declined during 2010 to 2014, increased in 2015, but again dropped below the 10-year average in 2016 and 2017. The increase in harvest recorded in 2015 occurred during the general season and was in part due to a regulation change adding general season muzzleloader hunting opportunities in several GMUs; general archery season elk harvest was also up in 2015.
Literature Cited Franklin, J. F. and C. T. Dyrness. 1973. Natural vegetation of Oregon and Washington. U.S.D.A.
Forest Service General Technical Report PNW-8. 417 pp. Pacific Northwest Forrest and Range Experiment Station, Portland, OR.
Henderson, J.A., D.H. Peter, R. D. Lesher, and D. C. Shaw. 1989. Forested plant associations of the Olympic National Forest. USDA Forest Service, Pacific Northwest Region. R6 Ecol. Technical Paper 001-88.
Lopez-Perez, E. 2006. Natural selenium and planted forages: effects on mule deer and elk in Washington. Dissertation, Washington State University, Pullman, USA. 112pp.
Poole, K. G. and G. Mowat. 2005. Winter habitat relationships of deer and elk in the temperate interior mountains of British Columbia. Wildlife Society Bulletin 33(4): 1288-1302.
138

Elk Status and Trend Report 2018
Smith J. L., W. A. Michaelis, K. Sloan, J. L. Musser and D. J. Pierce. 1994. An analysis of elk poaching losses and other mortality sources in Washington using biotelemetry. Washington Department of Fish and Wildlife, Federal Aid in Wildlife Restoration Project Report. 79 pp.
Washington Department of Fish and Wildlife. 2004. Olympic Elk Herd Plan. Wildlife Program, Washington Department of Fish and Wildlife, Olympia, WA.
Washington Department of Fish and Wildlife. 2014. 2015–2021 Game Management Plan. Wildlife Program, Washington Department of Fish and Wildlife, Olympia, WA.
139

Elk Status and Trend Report 2018
Selkirk Elk Herd ANNEMARIE PRINCE, Wildlife Biologist CARRIE LOWE, Wildlife Biologist JEFF HEINLEN, Wildlife Biologist BEN TURNOCK, Wildlife Biologist MICHAEL ATAMIAN, Wildlife Biologist
Introduction The Selkirk elk herd is located in northeast Washington and includes the Pend Oreille and Spokane sub-herds. The Pend Oreille sub-herd consists of 9 GMUs, including 101 (Sherman), 105 (Kelly Hill), 108 (Douglas), 111 (Aladdin), 113 (Selkirk), 117 (49 Degrees North), 121 (Huckleberry), 124 (Mount Spokane), and 204 (Okanogan East) (Figure 1). The Spokane sub-herd consists of 6 GMUs, including GMUs 127 (Mica Peak), 130 (Cheney), 133 (Roosevelt), 136 (Harrington), 139 (Steptoe), and 142 (Almota) (Figure 1).
Figure 1. Dominant land use cover types within the 15 game management units that comprise the Selkirk elk herd area.
Management Guidelines and Objectives The Department’s objective is to increase elk abundance in the Pend Oreille sub-herd area to 1,500–2,500 elk and to maintain 1,000–1,500 elk in the Spokane sub-herd area (WDFW 2014a).
140

Elk Status and Trend Report 2018
Additional objectives include maintaining populations with a pre-hunt bull:cow ratio of 15–35 bulls:100 cows or post-hunt bull:cow ratio of 12–20 bulls:100 cows (WDFW 2014a) and maintaining an annual survival rate of 0.50 for bulls when bull mortality is monitored (WDFW 2014b).
Population Surveys Habitat and terrain within the Pend Oreille sub-herd area present a sampling environment that is not conducive to conducting typical aerial composition surveys because the dense and largely unbroken forests impede the ability of observers to detect elk. Consequently, the Department does not currently conduct surveys to monitor the Pend Oreille sub-herd.
The Department collaborates with the U.S. Fish and Wildlife Service (USFWS) to conduct pre-hunt aerial composition surveys on the Turnbull National Wildlife Refuge (TNWR), located in the Spokane sub-herd area. However, these surveys only include a small portion of the Spokane sub-herd and are not likely to be representative of the entire sub-herd. The number of elk observed during these surveys since 2006 has ranged from 154–460 elk and varies annually (Figure 2). The decline observed in this population since 2010 is the result of a concerted effort by WDFW and TNWR, through antlerless hunts on TNWR, to reduce this local population due to elk suppression of aspen regeneration on the refuge. However, the population reduction is not only a result of direct mortality from hunting on the refuge, but also likely due to elk leaving the TNWR survey area for other nearby areas with more hunting pressure. Estimated calf:cow ratios have been relatively stable (Figure 4), while estimated bull:cow ratios have shown more variability, but have been consistently within or above the management objective of 15–35 bulls:100 cows (Figure 3).
Hunting Seasons and Recreational Harvest Most general season harvest opportunities in the Pend-Oreille sub-herd area are for any bull. Most opportunities to harvest antlerless elk are through limited, special permit opportunities. However, opportunities to harvest antlerless elk do occur throughout the sub-herd area during general archery seasons and for all weapon types in GMU 124 where the Department’s objective is to maintain elk numbers within landowner tolerance. Estimates of General State Harvest and Total State Harvest (including special permits) have averaged 281 and 308 elk, respectively, 2008–2017, and have been stable 2010–2017 (Figure 5). Hunter effort and CPUE have also been stable since 2009 (Figures 8-9).
The Department allows the harvest of any elk during all general seasons in the Spokane sub-herd area and collaborates with the USFWS to implement special permit harvest opportunities on TNWR. Estimates of General State Harvest and Total State Harvest in the Spokane sub-herd area averaged 232 and 246 elk, respectively for 2008-2017 (Figure 10). Both harvest estimates (Figure 10) and estimates of hunter effort (Figure 13) vary annually in this sub-herd. Likely much of this variation is a reflection of the access to private lands and the patchy distribution of elk in this area, rather than true variation in the elk population. The increase in general harvest after 2009 is likely due to the implementation of the TNWR permit hunts pushing animals off the refuge during the general season.
141

Elk Status and Trend Report 2018
Figure 2. Number of elk observed during aerial composition surveys in autumn on the Turnbull National Wildlife Refuge, autumn 2008–2017.
Figure 3. Estimates and associated 95% confidence intervals of pre-hunt bull:cow ratios on the Turnbull National Wildlife Refuge, autumn 2008–2017. The dashed lines represent the objective range of 15-35 bulls:100 cows.
142

Elk Status and Trend Report 2018
Figure 4. Estimates and associated 95% confidence intervals of pre-hunt calf:cow ratios on the Turnbull National Wildlife Refuge, autumn 2008–2017.
Figure 5. Estimated number of antlered and antlerless elk harvested in the Pend-Oreille sub-herd area during recreational hunting seasons (general and permit opportunities combined) established by the Department, 2008–2017. Estimates do not include elk harvested in association with damage permits (see Human Wildlife Interaction below). Estimates also do not include harvest that occured during established Tribal seasons because that data is currently not available.
143

Elk Status and Trend Report 2018
Figure 6. Estimated percentage of recreational antlered harvest in the Pend-Oreille sub-herd area that occurred during general and permit seasons, 2008–2017.
Figure 7. Estimated percentage of recreational antlerless harvest in the Pend-Oreille sub-herd area that occurred during general and permit seasons, 2008–2017.
144

Elk Status and Trend Report 2018
Figure 8. Estimated number of days hunters spent pursuing elk in the Pend-Oreille sub-herd area during recreational seasons that provided general over-the-counter opportunities, 2008–2017.
Figure 9. Estimated number of elk harvested for every 100 hunter days spent pursuing elk in the Pend-Oreille sub-herd area during recreational seasons that provided general over-the-counter opportunities, 2008–2017.
145

Elk Status and Trend Report 2018
Figure 10. Estimated number of antlered and antlerless elk harvested in the Spokane sub-herd area during recreational hunting seasons (general and permit opportunities combined) established by the Department, 2008–2017. Estimates do not include elk harvested in association with damage permits (see Human Wildlife Interaction below). Estimates also do not include harvest that occured during established Tribal seasons because that data is currently not available.
Figure 11. Estimated percentage of recreational antlered harvest in the Spokane sub-herd area that occurred during general and permit seasons, 2008–2017.
146

Elk Status and Trend Report 2018
Figure 12. Estimated percentage of recreational antlerless harvest in the Spokane sub-herd area that occurred during general and permit seasons, 2008–2017.
Figure 13. Estimated number of days hunters spent pursuing elk in the Spokane sub-herd area during recreational seasons that provided general over-the-counter opportunities, 2008–2017.
147

Elk Status and Trend Report 2018
Survival and Mortality Common predators that occur throughout the Pend Oreille sub-herd area include black bears, cougars, and gray wolves. The Department documented the first wolf pack in the Pend Oreille sub-herd area in 2009. As of December 31, 2017, the Department had documented 16 wolf packs whose range currently occurs wholly or partially within the Pend Oreille sub-herd area (WDFW et al. 2018).
Black bears and cougars also occur throughout the Spokane sub-herd area. Both habitat conditions and hunter harvest suggest that bear and cougar numbers are likely higher north of the Spokane River in the Pend Oreille sub-herd area than in the Spokane sub-herd area (WDFW 2014a). Most cougar and black bear populations are managed to maintain a stable population. At the time of this writing, there were no documented gray wolf packs in the Spokane sub-herd area (WDFW et al. 2018).
Although the Department has never documented any increased mortality events, severe winter events do occur within the Pend Oreille and Spokane sub-herd areas and likely have the potential to reduce the overwinter survival of elk. In addition, extreme drought conditions that persist through summer and fall have the potential to reduce the availability of high quality forages that elk rely on to accrue adequate fat stores for winter.
Obtaining elk survival estimates and causes of mortality for the Pend-Oreille sub-herd is one goal of the predator-prey project (see research section), but because the project is only in year two of
Figure 14. Estimated number of elk harvested for every 100 hunter days spent pursuing elk in the Spokane sub-herd area during recreational seasons that provided general over-the-counter opportunities, 2008–2017.
148

Elk Status and Trend Report 2018
five, there are no estimates currently available. There have been no comprehensive efforts to monitor the survival of elk in the Spokane sub-herd area.
Habitat Timber harvest is common on state forestlands and even more intensive on private lands. Timber harvest is limited on federal forests. Logging potentially benefits the Pend Oreille sub-herd by increasing the amount of early seral habitats. In addition, the Colville National Forest, with grant money from the Rocky Mountain Elk Foundation (RMEF), has implemented habitat enhancement projects on approximately 58,000 acres to benefit elk. Most of the projects involved prescribed burning to enhance winter forage production, but there were also projects to restore aspen stands and reclaim roadbeds for improved habitat. The RMEF also funded a prescribed burn on 390 acres of elk habitat on the WDFW Chesaw Wildlife Area within the Pend Oreille sub-herd area. Over 350,000 acres within the Pend Oreille sub-herd area were burned by wildfires in the summer of 2015 and approximately 10,601 more acres burned in 2017. These burns will likely benefit elk in the long term, but some areas burned completely and with high intensity, thus it may be years before any benefits to elk are realized.
Conversion of native Palouse Prairie and shrub-steppe habitat in the Spokane sub-herd area to agricultural lands has and continues to reduce the amount of native elk habitat. In addition, the expansion of urban populations associated with the main Spokane metropolitan area continues to result in habitat degradation or loss in GMUs 127 and 130. Consequently, it is likely that social tolerance within agricultural and suburban areas will limit the growth and expansion of the Spokane sub-herd.
Human-Wildlife Interaction Most elk conflict is restricted to the lower-elevation agriculture lands in the Pend Oreille sub-herd. In 2017, there were approximately 12 damage permits and 33 kill permits issued to landowners experiencing agricultural damage within GMUs 101, 108, 111, 113, 117, 121, and 204 with the bulk of the permits issued in GMUs 117, 121, and 204. All damage and kill permits issued were for antlerless elk only. Hunting regulations for GMU 204 were modified in 2016 to allow Early Archery while Late Muzzleloader season was switched to Early Muzzleloader to match the rest of the sub-herd area and to have hunting seasons during the time of year when most damage occurs.
Complaints of agricultural damage caused by the Spokane sub-herd have increased recently; much of the damage has been associated with land that has been converted to legume crops (e.g., garbanzo beans, peas, and lentils). A total of 24 damage permits and 19 kill permits were issued to private landowners for elk in the Spokane sub-herd range. Department staff, Master Hunters, and local sportsman’s groups assisted with hazing efforts in some of these areas.
Research The Predator-Prey Project began in the winter of 2016/17 and seeks to quantify the effects of recolonizing wolf populations on co-occurring ungulate species and another top predator, the cougar. The two primary objectives of this project are to 1) examine the effects of wolf predation on ungulate demography and population growth and 2) investigate the impacts of recolonizing wolves on cougar population dynamics, space use, and foraging behavior. This project consists of
149

Elk Status and Trend Report 2018
two study areas; one in northeast Washington encompassing the majority of Stevens and Pend Oreille counties, where the wolf population is larger and more widely distributed, and the other in Okanogan county in north-central Washington where the wolf population is smaller and portions of suitable habitat remain unoccupied. There is increasing understanding that a multi-species approach to predator-prey studies is relevant to account for the various interactions among apex predators and their prey.
To implement a system-based approach, the Department and University of Washington project personnel are attempting to capture and radio-collar 50 elk and 65 white-tailed deer in NE Washington, 100 mule deer in the Okanogan, and 10 cougars in each study area. The project will also attempt to maintain at least two active GPS collars on wolves in each project study pack. Research efforts were initiated in December 2016 and are slated to continue through 2021. Ungulate capture efforts began in late-January 2017 and the capture crew was able to aerial-dart and collar 34 elk in GMUs 117 and 121. The additional elk were captured and collared in the winter of 2017/18 for a total of 50 collared elk.
During March of 2018, WDFW biologists conducted aerial composition surveys by locating collared cows and classifying elk observed in the vicinity. Biologists counted a total of 414 elk, which resulted in an observed calf:cow ratio of 30 calves per 100 cows.
Management Concerns Federal, state, and private land managers have implemented numerous road closures in recent years that have likely benefited this herd by reducing human disturbance in areas that provide quality elk habitat.
The special permit hunt on TNWR was created to address habitat damage by elk on the Refuge. Elk counts were low during the annual aerial survey in the Turnbull area the past three years. However, reported sightings and increased damage complaints to agricultural crops in the area suggest this was due in part to movement of elk out of the area in response to drought and hunting pressure rather than a true population decline. Future surveys will consider revising the survey area to reflect recent known activities of these elk. The Department will continue to work with TNWR to assess the hunt and if it is accomplishing its objectives.
Management Conclusions According to harvest estimates and public perception, elk numbers seem to be either stable or slightly increasing within the Pend Oreille sub-herd area. Recent wildfires will likely improve habitat conditions that favor elk.
According to harvest estimates and landowner perceptions elk numbers seem to be increasing within the Spokane sub-herd area. The Department will continue to allow harvest of any elk during the general season for all weapon types in the Spokane sub-herd range, as well as GMU 124 in the Pend Oreille sub-herd range, to help balance these elk populations with landowner tolerance.
Literature Cited Washington Department of Fish and Wildlife. 2014. Selkirk Elk Herd Plan. Wildlife Program,
Washington Department of Fish and Wildlife, Olympia, WA.
150

Elk Status and Trend Report 2018
Washington Department of Fish and Wildlife. 2014. 2015–2021 Game Management Plan. Wildlife Program, Washington Department of Fish and Wildlife, Olympia, WA.
Washington Department of Fish and Wildlife, Confederated Colville Tribes, Spokane Tribe of Indians, USDA-APHIS Wildlife Services, and U.S. Fish and Wildlife Service. 2018. Washington Gray Wolf Conservation and Management 2017 Annual Report. Washington Department of Fish and Wildlife, Wenatchee, WA, USA.
151
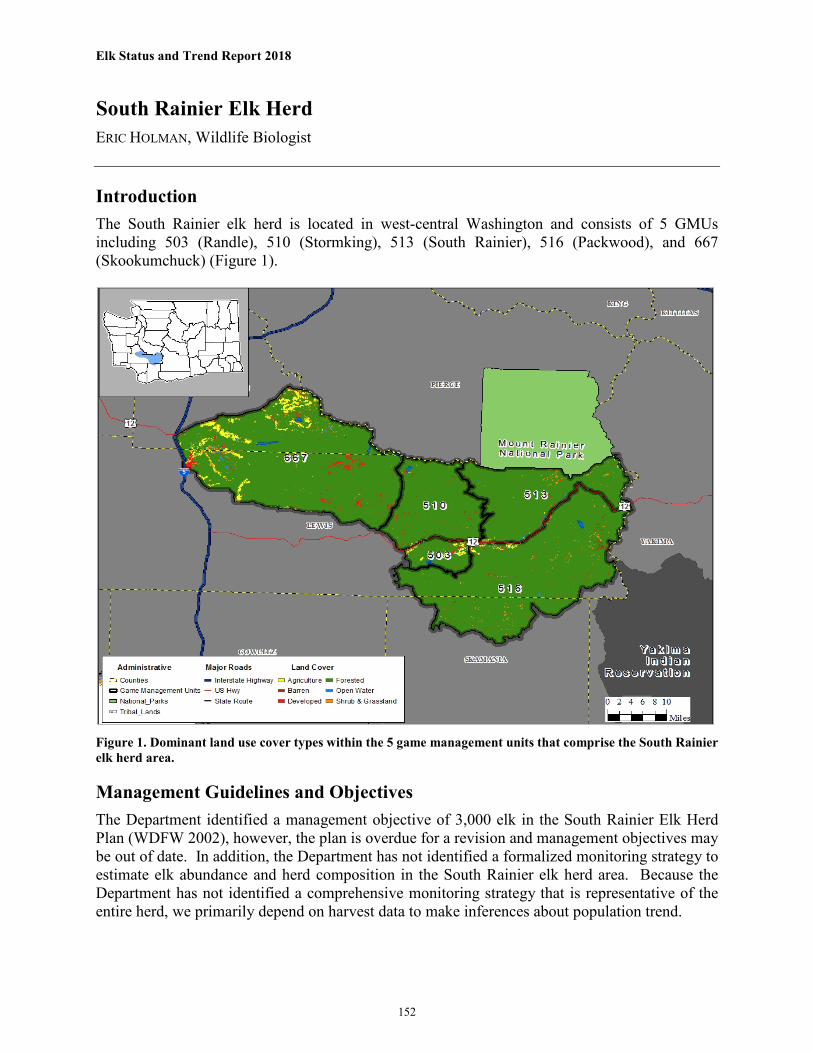
Elk Status and Trend Report 2018
South Rainier Elk Herd ERIC HOLMAN, Wildlife Biologist Introduction The South Rainier elk herd is located in west-central Washington and consists of 5 GMUs including 503 (Randle), 510 (Stormking), 513 (South Rainier), 516 (Packwood), and 667 (Skookumchuck) (Figure 1).
Figure 1. Dominant land use cover types within the 5 game management units that comprise the South Rainier elk herd area.
Management Guidelines and Objectives The Department identified a management objective of 3,000 elk in the South Rainier Elk Herd Plan (WDFW 2002), however, the plan is overdue for a revision and management objectives may be out of date. In addition, the Department has not identified a formalized monitoring strategy to estimate elk abundance and herd composition in the South Rainier elk herd area. Because the Department has not identified a comprehensive monitoring strategy that is representative of the entire herd, we primarily depend on harvest data to make inferences about population trend.
152

Elk Status and Trend Report 2018
Population Surveys The Puyallup Tribe of Indians conducts aerial composition surveys and estimates elk abundance in the upper Cowlitz River basin using a sightability model they developed specific to that area (Gilbert and Moeller 2008). The surveys are conducted in early spring and include portions of GMUs 503, 510, 513, and 516. The results of these surveys are illustrated in Figure 2 (Moeller 2018).
Figure 2. Sightability corrected estimates of total elk abundance in the Cowlitz River Basin (portions of GMUs 503, 510, 513, and 516), spring 2009–2018. Data are collected and provided by the Puyallup Tribe of Indians.
The Department has also collaborated with the Muckleshoot Indian Tribe, the U.S. Geological Survey, National Park Service, and Puyallup Tribe of Indians to estimate elk abundance in the high alpine meadows of Mount Rainier National Park (MRNP) (Griffen et al. 2013). However, those surveys only include a small portion of the South Rainier elk herd (<550 elk). Additionally, it is unknown what proportion of those elk move outside MRNP, what portion may join either the Yakima or North Rainier elk herds, or what portion could be included in the spring survey conducted by the Puyallup Tribe.
The Department has also periodically conducted late winter surveys on the Centralia Mine portion of GMU 667 since 2010. Survey results produce an average bull:cow ratio of 17:100 while the calf:cow ratio averaged 32:100.
153

Elk Status and Trend Report 2018
Hunting Seasons and Recreational Harvest The Department limits most general season harvest opportunities in the South Rainier elk herd area to branch-antlered bulls. Opportunities to harvest antlerless elk do occur during some general archery and muzzleloader seasons within GMUs 503 and 667 and by permit in areas where the Department’s objective is to maintain low elk numbers. Estimates of annual General State Harvest and Total State Harvest (general and permit harvest combined) have averaged 272 and 302 elk respectively, 2008–2017, while estimates of Total Harvest (Total State + Tribal) have averaged 381 elk during this time span. All three harvest estimates varied annually 2008–2012, but have been more stable recently (Figure 3). Figures 4 and 5 respectively display the percentage of antlered and antlerless elk harvest comprised of General State Harvest, Special Permit State Harvest and Tribal harvest. Estimates of hunter effort have been stable 2011–2017 (Figure 6). Estimates of hunter success (expressed as catch per unit effort; CPUE) varied annually 2008–2012 but stabilized during 2013–2017 (Figure 7).
Figure 3. Estimated number of antlered and antlerless elk harvested in the South Rainier elk herd area during recreational hunting seasons (general and permit opportunities combined) established by the Department and during established Tribal seasons, 2008–2017. Estimates of Tribal harvest were derived from annual harvest reports compiled by the Northwest Indian Fisheries Commission. Estimates do not include elk harvested in association with damage permits (see Human Wildlife Interaction below).
154

Elk Status and Trend Report 2018
Figure 4. Estimated percentage of recreational antlered harvest in the South Rainier elk herd area that occurred during general and permit seasons and the percentage of harvest that occurred during established tribal seasons, 2008–2017.
Figure 5. Estimated percentage of recreational antlerless harvest in the South Rainier elk herd area that occurred during general and permit seasons and the percentage of harvest that occurred during established tribal seasons, 2008–2017.
155

Elk Status and Trend Report 2018
Figure 6. Estimated number of days hunters spent pursuing elk in the South Rainier elk herd area during recreational seasons that provided general over-the-counter opportunities, 2008–2017.
Figure 7. Estimated number of elk harvested for every 100 hunter days spent pursuing elk in the South Rainier elk herd area during recreational seasons that provided general over-the-counter opportunities, 2008–2017.
156

Elk Status and Trend Report 2018
Survival and Mortality Common predators of elk that occur throughout the South Rainier elk herd area include black bears and cougars. At the time of this writing, there were no documented wolf packs within the herd area (WDFW et al. 2018).
Severe winter events are thought to rarely affect the South Rainier elk herd. However, extreme drought conditions that persist through summer and fall have the potential to reduce the availability of high quality forages that elk rely on to accrue adequate fat stores for winter.
There have been no recent studies to monitor the survival of elk in the South Rainier elk herd area.
Habitat The majority of the South Rainier elk herd area consists of lands administered by the U.S. Forest Service (USFS). The remainder of the herd area is comprised of private industrial forestland, State Department of Natural Resources (DNR) forestland, national park land, agricultural areas, and suburban/rural residential land use. The herd continues to benefit from the creation of early seral habitats on private industrial forests and DNR forests.
The industrial forestlands consist of a mosaic of clearcuts, relatively open young regeneration stands, dense second growth stands of timber, and stream buffers lined with second-growth forest. Industrial timber management practices benefit elk by increasing the quantity of early seral habitats and the subsequent forage base. While beneficial to elk, management practices are not conducted to purposefully increase or improve elk habitat. Additionally, intensive forest management practices including the planting of dense stands of fast-growing conifer seedlings and the application of herbicides during re-establishment of the timber stand may also be affecting overall productivity due to reduced forage quality and availability. These effects work in tandem by reducing the amount of favorable plants available as forage in the early term and completion of forest canopy closure (typically approximately age 12), far earlier than would occur in a naturally regenerated stand. The magnitude of those effects is influenced by site specific types of post- timber harvest treatments and plant compositions; and the number of years since timber harvest. A commonality among all of these varying factors is that the best quality and most quantity of favorable forage seems to occur approximately 3 to 14 years after timber harvest whether herbicide treatments are applied or not. However the differences between available, favorable forage in that time period for treated and untreated stands can still be substantial. A full discussion on the complexity of these habitat interactions is beyond the scope of this report and we refer the reader to Ulappa (2015) and Geary et al. (2012) for a more comprehensive understanding of this research.
In contrast, very limited timber harvest on federal forests in the last three decades has led to a generally declining trend in habitat quality for elk. Forest thinning projects have partially offset the losses of quality habitat on USFS lands. These projects have been cooperative efforts among the Puyallup Tribe, the Rocky Mountain Elk Foundation, and USFS. From 2004-16, 1,366 acres were enhanced through thinning, weed treatments, and slash piling. Additional thinnings are scheduled (Moeller, 2017).
A large number of elk in the South Rainier elk herd area concentrate on the valley floor in the Upper Cowlitz River Basin during winter. However, the continued development of this area for
157

Elk Status and Trend Report 2018
agricultural, recreational, and housing purposes continues to result in a loss of critical winter habitat. Currently, elk numbers in the Upper Cowlitz River Basin are higher than some segments of the public would prefer.
Human-Wildlife Interaction Complaints of damage to agricultural crops occur within the range of the South Rainier elk herd. The most severe conflicts are concentrated in the upper Cowlitz River valley and the Hanaford area. In the upper Cowlitz River, a narrow band of low-elevation privately owned land is surrounded by mountainous and forested public and industrial forestland. The upper Cowlitz valley is winter range for elk and their presence is most common in winter and early spring but persists year-round. Elk damage complaints in this area have persisted for many years and are unlikely to be abated given the juxtaposition of attractive food sources and large amount of forestland. A variety of crops are impacted by elk damage but most of the damage is on hay fields. In the Hanaford Area of Lewis County, elk also cause damage to agriucultural crops. Elk populations that move between the Centralia Mine and the Skookumchuck Wildlife Area have been increasing over the years. Access to the Centralia Mine is restricted by federal regulations, which reduces the number of elk that may be harvested there. However, the landowner has worked with WDFW to allow two weekend hunts for senior hunters and two weekend hunts for disabled hunters under special draw permit seasons to help control this elk population. Additionally, three permit-only elk seasons, designed to address agricultural damage, have been implemented in the Hanaford elk control area (Elk Area 6069).
Wildlife Conflict Specialists work closely with agricultural producers by developing Damage Prevention Cooperative Agreements (DPCAs), which identify a plan to reduce the amount of damage incurred to crops using non-lethal and lethal methods. Non-lethal methods of discouraging elk use are a very important component to reducing elk damage and are generally attempted prior to the use of lethal response. Conflict Specialists and landowners use a variety of non-lethal methods including: electrified fladry fencing; noisemakers (birdbangers, critter gitters, propane cannons); hazing and herding on foot, with a vehicle or with a dog; scarecrow-like electronic devices; and odor-based repellents such as Plantskyyd. Lethal methods of deterring elk are also used to reduce damage to crops. These efforts include hunts within specified elk areas, pools of Master Hunters, Youth and Hunters with Disabilities for immediate response to damage issues, as well as landowner damage permits. See Table 1 for a summary of permits issued to landowers allowing the taking of elk causing agricultural damage in the South Rainier elk herd area during 2017-18 and note that these removals are in adition to the elk harvests discussed in Hunting Seasons and Recreational Harvests above. Collectively, these hunts are designed to decrease the number of elk causing damage and/or to haze elk from the area.
158

Elk Status and Trend Report 2018
Table 1. Number of Permits to lethally remove elk causing damage to agricultural crops and resulting number of elk removed, South Rainier elk herd, 2017-18.
Game Management Unit Permits Issued Elk Removed
513 10 5
516 11 5
667 21 13
Total 42 23
In addition to conflicts with agriculture, elk in the Upper Cowlitz River Valley are regularly in close proximity to people. This situation is most acute in the town of Packwood where elk are abundant within the city limits, presenting a challenging scenario where many residents very much enjoy the presence of the animals but others do not. A County ordinance does not allow the use of firearms in town so these animals are largely not hunted, which has created a refuge effect allowing the elk to feed and loaf in town without fear of humans. Because the elk are somewhat habituated to people, direct interaction among elk and people is not uncommon. Additionally, the elk commonly present a hazard along State Highway 12.
Management Concerns Treponeme-associated hoof disease Treponeme-associated hoof disease (TAHD) of elk results in abnormal hoof growth, cavitating sole ulcers, and in severe cases, eventual sloughing of the hoof capsule. Elk severely affected by TAHD often have reduced mobility and condition. Consequently, it seems reasonable to assume they would have a reduced probability of survival or reproductive potential. However, it is unknown how TAHD affects the population dynamics of herds where TAHD occurs; this is the focus of ongoing research. The Department is also conducting research to better estimate the distribution and prevalence of TAHD. To learn more about the Department’s efforts associated with investigating TAHD, please visit the Department’s hoof disease webpage: http://wdfw.wa.gov/conservation/health/hoof_disease/
Habitat Conditions on Federal Lands Habitat conditions on federally managed lands within the South Rainier Elk herd area are of concern. Large-scale fire, timber harvest, disease, or other succession resetting events are largely absent from the federal lands. The resulting landscape is dominated by closed-canopy forest, much of which was harvested from roughly 1950-1990 and subsequently replanted with dense Douglas fir trees. These stands provide little in the way of elk forage and lack the diversity and forage resources of either older or younger forests. While some forest thinnings have been completed and do provide more robust forage resources at least temporarily, elk forage and likely elk populations will continue to be suppressed in GMUs 513 and 516.
Fee-Only Hunting Access Restrictions The largest industrial forestland owner within the South Rainier elk herd area implemented a fee-only access system for hunting and other recreation on their lands several years ago. This system
159
Elk Status and Trend Report 2018
limited the number of individuals allowed access to these lands and has continued in the years that have followed. The ramifications of this limited access to elk hunting opportunity are difficult to quantify as the landowners don’t own entire Game Management Units, some individuals elect to pay the access fee, some individuals elect to hunt in another area, and some may decide to quit hunting. Ramifications of reduced hunter access and participation are twofold in as much as it impacts the Department’s goals to maximize recreational access to wildlife and likely reduces hunter participation and recruitment, therefore undermining capacity to manage elk and other wildlife.
Conflict with Agricultural Land Uses in the Upper Cowlitz River Valley The situation of conflict among agricultural land uses and elk in the Upper Cowlitz River Valley is not likely to conclude in the near term. The close proximity of relatively abundant elk on forestlands surrounding the valley with attractive food resources likely guarantees that these conflicts will continue. Furthermore, large-scale habitat changes such as forest fires or extensive timber harvest on the federal lands, which could generate improved habitat conditions and draw elk away from the valley floor, are unlikely to occur in the near future. However, the forest industry including the USFS have begun to reconsider fuel loading and fire management practices in the face of the megafires of the 21st century (Natl. Acad. Sci., Eng., Med. 2017). Large amounts of funding that would be needed for extensive fencing of agricultural areas is not available and even if funding was available, installation of large-scale fencing would restrict wildlife movement, require maintenance, and be aesthetically unappealing.
Management Conclusions Harvest data, WDFW winter surveys, spring surveys conducted by the Puyallup Tribe of Indians, and surveys of alpine habitats on the south side of Mt. Rainier National Park all indicate a stable elk population. While none of these methods provides a comprehensive index of elk abundance in the South Rainier herd area, together they do serve as a surrogate means of monitoring the population. Nonetheless, development and implementation of a method to monitor the entirety of the South Rainier elk herd including demographic characteristics (i.e., bull and calf to cow ratios) is a management need.
Conflicts with agricultural producers, especially in the Upper Cowlitz River Valley and the Hanaford area are ongoing and will require continuing attention from Wildlife Conflict staff. Additionally, the development of bacterial hoof disease in southwest Washington elk has the potential to impact elk in the South Rainier herd area. The extent of the disease in the South Rainier herd area is not known but the condition is extensive in both the Mount St. Helens herd area and Willapa Hills herd areas to the south and west. Research on the condition is currently being conducted in the Mount St. Helens elk herd area and may shed light on management options in the South Rainier herd.
An updated herd plan is needed for the South Rainier herd. The existing plan is now more than 10 years old and does not reflect current conditions. Specifically, the plan was written before the presence of hoof disease in southwest Washington elk and prior to the organizational change of hiring wildlife management staff to specifically address wildlife-human conflicts. Finally, the existing plan prescribes an elk population goal of 3,000 but there is no method currently available to monitor the entire population.
160

Elk Status and Trend Report 2018
Literature Cited Geary, A.B., J. G. Cook, R. C. Cook, and E. H. Merrill. 2012. Herbicide and Herbivory Effects on
Elk Forages at Mt. St. Helens. Final research report. University of Alberta and National Council for Air and Stream Improvement. 44 p.
Gilbert, B. A. and B. J. Moeller. 2008. Modeling elk sightability bias of aerial surveys during
winter in the central Cascades. Northwest Science, 82:3, 222-228. Griffin, P. B. Lubow, K. Jenkins, D.Vales, B. Moeller, M. Reid, P. Happe, S. Mccorquodale,
M.Tirhi, J. Schaberl, K. Beirne. 2013. A Hybrid Double-Observer Sightability Model for Aerial Surveys. The Journal of Wildlife Management 77(8):1532–1544.
Moeller, B. 2018. South Rainier Elk Population Survey Results. Unpublished Data. Puyallup
Tribe of Indians. Moeller, B. 2017. Elk Status and Trend Report: Region 5. Unpublished Data. Puyallup Tribe of
Indians. National Academies of Sciences, Engineering, and Medicine. 2017. A Century of Wildland Fire
Research: Contributions to Long-term Approaches for Wildland Fire Management: Proceedings of a Workshop. Washington, DC: The National Academies Press. https://doi.org/10.17226/24792.
Ulappa, A. 2015. Using foraging dynamics to answer landscape management questions: the
nutritional ecology of black-tailed deer. Dissertation, Washington State University, Pullman, WA, USA.
Washington Department of Fish and Wildlife, Confederated Colville Tribes, Spokane Tribe of Indians, USDA-APHIS Wildlife Services, and U.S. Fish and Wildlife Service. 2018. Washington Gray Wolf Conservation and Management 2017 Annual Report. Washington Department of Fish and Wildlife, Wenatchee, WA, USA.
Washington Department of Fish and Wildlife. 2002. South Rainier Elk Herd Plan. Wildlife Program, Washington Department of Fish and Wildlife, Olympia, WA.
161

Elk Status and Trend Report 2018
Willapa Hills Elk Herd ANTHONY NOVACK, Wildlife Biologist Introduction The Willapa Hills elk herd is located in southwest Washington and consists of 12 GMUs (Figure 1), which includes 501 (Lincoln), 504 (Stella), 506 (Willapa Hills), 530 (Ryderwood), 658 (North River), 660 (Minot Peak), 663 (Capitol Peak), 672 (Fall River), 673 (Williams Creek), 681 (Bear River), 684 (Long Beach), and 699 (Long Island). The herd area covers more than 1.7 million acres, of which 22% is in public ownership and 78% is in private ownership. Most of the herd area, is industrial forestland, owned by a variety of private corporations. Small private timber holdings and small farms occur along the major drainages.
Figure 1. Dominant land use cover types within the 12 game management units that comprise the Willapa Hills elk herd area.
Management Guidelines and Objectives The Department completed the Willapa Hills Elk Herd Plan in 2014 and identified a population objective of managing this herd for a stable to increasing population (WDFW 2014a). Additional objectives include managing for a pre-hunt population with 15–35 bulls:100 cows or a post-hunt
162

Elk Status and Trend Report 2018
population with 12–20 bulls:100 cows and maintaining an annual survival rate of 0.50 for bulls when bull mortality is monitored (WDFW 2014b).
Population Surveys Historically, the Department conducted pre-hunt (August-September) or post-hunt (March-April) aerial composition surveys to assess trends in age and sex ratios. However, surveys lacked a formalized sampling design and did not account for biases that are commonly associated with observing elk in densely vegetated habitats (Samuel et al. 1987). Consequently, estimated ratios were not reflective of the entire herd and were likely biased (WDFW 2014a).
In 2014, the Department began efforts to develop a formalized sampling design that will index total elk abundance across the entire herd area using a sightability model developed for elk in the Mount St. Helens elk herd area (McCorquodale et al. 2014). That development continued into 2017. The design includes two survey areas separated by the Willapa River Valley that will be surveyed biannually.
In spring 2018, elk abundance was estimated for the survey area that encompasses the southern portion of the herd area (GMUs 506, 530, 673, and 681). The Department estimated total elk abundance to be 2,863 (95% CI = 2,555–3,273) elk. Resulting estimates of post-hunt bull:cow and calf:cow ratios were 22:100 (95% CI = 17–26) (Figure 2) and 33:100 (95% CI = 29–37), respectively (Figure 3).
In spring 2017, elk abundance was estimated for the survey area that encompasses the northern portion of the herd area. Sampling efforts for 2017 occurred in GMUs 501, 658, 660, and 672. The Department estimated total elk abundance to be 1,269 (95% CI = 975–1,851) elk. Resulting estimates of post-hunt bull:cow and calf:cow ratios were 18:100 (95% CI = 10–26) and 41:100 (95% CI = 31–51), respectively.
Figure 2. Estimates and associated 95% confidence intervals of post-hunt bull:cow ratios in the Willapa Hills elk herd area, spring 2009–2018. The dashed lines represent the objective range of 12-20 bulls:100 cows. Post-hunt ratios were not comprehensively estimated prior to spring 2013. Estimates were derived from data collected in the South Willapa survey area (GMUs 506, 530, 673, and 681) in 2013, 2014, 2016, and 2018 and from the North Willapa survey area (GMUs 501, 658, 660, and 672) in 2015 and 2017.
163

Elk Status and Trend Report 2018
Figure 3. Estimates and associated 95% confidence intervals of post-hunt calf:cow ratios in the Willapa Hills elk herd area, spring 2009–2018. The dashed line represents a calf:cow ratio of 30 calves:100 cows that should promote herd stability or growth. Post-hunt ratios were not comprehensively estimated prior to spring 2013. Estimates were derived from data collected in the South Willapa survey area (GMUs 506, 530, 673, and 681) in 2013, 2014, 2016, and 2018 and from the North Willapa survey area (GMUs 501, 658, 660, and 672) in 2015 and 2017.
Hunting Seasons and Recreational Harvest The Department limits most general season harvest opportunities in the Willapa Hills elk herd area to branch-antlered bulls and offers most opportunities to harvest antlerless elk through our permit system. Limited opportunities to harvest antlerless elk occur during general archery seasons or in areas where the Department’s objective is to maintain low elk numbers. The estimated general season elk harvest by state hunters averaged 1,143 elk since 2008 (Figure 4). Total elk harvest, including special permits, averaged 1,333 elk in the same timeframe. Both general season and total harvest have been generally stable over the ten year timeframe although, 2017 had the lowest reported harvested since 2008. No tribal harvest was reported for 2017 and has averaged less than 1% of the overall elk harvest for the past 10 years (Figures 5 and 6). An estimated 65% of the toal antlerless harvest in 2017 was taken by non-tribal general season hunters, while the remaining 35% is attributed to permit hunters (Figure 6). Nearly all harvest of antlered elk occurs during general seasons (Figure 5). Hunter effort has declined since 2008 (Figure 7), while catch-per-unit-effort (CPUE) steadily increased during that same period (Figure 8).
164

Elk Status and Trend Report 2018
Figure 4. Estimated number of antlered and antlerless elk harvested in the Willapa Hills elk herd area during recreational hunting seasons (general and permit opportunities combined) established by the Department and during established Tribal seasons, 2008–2017. Estimates of Tribal harvest were derived from annual harvest reports compiled by the Northwest Indian Fisheries Commission. Estimates do not include elk harvested in association with damage permits (see Human Wildlife Interaction below).
Figure 5. Estimated percentage of recreational antlered harvest in the Willapa Hills elk herd area that occurred during general and permit seasons, 2008–2017. Harvest during established tribal seasons accounted for <1% of the antlered harvest and is not represented in the figure.
165

Elk Status and Trend Report 2018
Figure 6. Estimated percentage of recreational antlerless harvest in the Willapa Hills elk herd area that occurred during general and permit seasons, 2008–2017. Harvest during established tribal seasons accounted for <1% of the antlered harvest and is not represented in the figure.
Figure 7. Estimated number of days hunters spent pursuing elk in the Willapa Hills elk herd area during recreational seasons that provided general over-the-counter opportunities, 2008–2017.
166

Elk Status and Trend Report 2018
Survival and Mortality Common predators that occur throughout the Willapa Hills elk herd area include black bears and cougars. At the time of this writing, there were no documented gray wolf packs in the herd area (WDFW et al. 2018).
Severe winter conditions rarely occur that affect the overwinter survival of elk in the Willapa Hills elk herd area. However, extreme drought conditions that persist through summer and fall have the potential to reduce the availability of high quality forages that elk rely on to accrue adequate fat stores for winter. The greatest source of mortality for bulls in the Willapa Hills elk herd is likely recreational harvest. There have been no comprehensive studies to estimate the survival of elk in the Willapa Hills elk herd area. However, the Department monitored bull survival for 78 adult bulls in GMU 673, 2005–2009 and estimated annual survival to be 0.37 (95% CI = 0.27–0.48), attributing 93% of all mortalities to legal harvest (W. Michaelis, WDFW, unpublished data). Poaching, wounding loss, predation, and malnutrition combined, accounted for <6% of adult bull mortality. Because this study only occurred in GMU 673 and the western third of GMU 506, estimated cause-specific mortality and survival rates may not be representative of the entire Willapa Hills elk herd.
No studies have occurred in the Willapa Hills elk herd area with the specific goal of estimating annual survival rates of cow elk. However, 22 female elk in GMUs 506 and 672 were monitored
Figure 8. Estimated number of elk harvested for every 100 hunter days spent pursuing elk in the Willapa Hills elk herd area during recreational seasons that provided general over-the-counter opportunities, 2008–2017.
167

Elk Status and Trend Report 2018
in 2001 and 2002 as part of a larger study evaluating the relationship between nutritional condition and survival of adult female elk in the Pacific Northwest. During that study Bender et al. (2008) reported a mean annual adult female elk survival rate of 0.92 (95% C.I.= 0.82–0.99).
Habitat The majority of forestland in the Willapa Hills herd area is managed to maximize revenue from timber production. Both the privately owned industrial forestlands and a large portion of the publicly owned lands consist of a mosaic of clearcuts, relatively open young regeneration stands, dense second growth stands of timber, and stream buffers lined with second-growth forest. This mosaic changes on a yearly basis due to ongoing timber cutting operations. Forest management practices on private industrial and state forestlands have generally benefited the Willapa Hills elk herd by creating a mosaic of habitats that increases the forage base for this herd.
Industrial timber management practices have also resulted in a high density road system that has increased human access to remote areas. A number of large industrial timber company landowners have begun restricting access to their lands. These restrictions can include land leasing and fee permit requirements, which may limit the total number of hunters that access those areas.
Recently, there have been no major changes in the status of elk habitat in the Willapa Hills herd area. At a more localized scale (e.g., GMU) habitat trends are directly related to the proportion of timber stands that are in early seral stages. In recent years, logging has increased in several GMUs, which has resulted in an increase of foraging habitats within those GMUs.
Human-Wildlife Interaction Elk damage complaints continue to be a substantial management concern in the Willapa Hills elk herd. Chronic damage persists in several GMUs across the entire elk herd area. Management actions in response to elk conflicts generally increase hunting activity at the focal damage zones. These damage zones can cover an entire GMU or, be organized into a special Elk Area. Some focal GMU’s include 506 (Willapa Hills), GMU 660 (Chehalis River valley), GMUs 672 (Fall River), 673 (Willapa River valley) and GMU 684 (Long Beach). Within these GMUs, some localized elk areas have been created that target crop depredating elk. These elk areas include 5056 (Grays River Valley) and 6010 (Mallis).
Elk damage occurs on Christmas tree farms, hay and silage fields, cranberries, corn, peas, and commercial seed crops such as carrot, Swiss chard, bok choy, and other agricultural crops. Elk also damage agriculture infrastructure such as fences or irrigation systems. Overall reports of elk conflicts to agriculture for 2017 were similar to past years.
Wildlife Conflict Specialists work closely with producers by developing Damage Prevention Cooperative Agreements (DPCAs). These agreements involve nonlethal measures to prevent elk damage and increase hunter access to modify elk behavior and control group size. Nonlethal measures include herding and hazing by Master Hunters, producers, and WDFW staff, pyrotechnics, and electric fladry fencing. All DPCAs include a public hunting component to increase pressure on groups of elk causing problems. For 2017-18, Wildlife Conflict Specialists managed at least 18 active DPCAs and worked with many additional landowners without a DPCA.
168

Elk Status and Trend Report 2018
A minimum of 60 elk permits were issued directly to landowners with a DPCA resulting in 16 animals harvested (Table 1).
Table 1: Sum of elk related Damage Prevention and Control Agreements with associated total of elk permits issued and resulting harvest by GMU in the Willapa Hills elk herd area, 2017-18.
Game Management Unit DPCAs Permits Issued Elk Removed
506 1 9 3
530 2 7 5
658 2 22 2
660 2 4 2
663 2 3 2
672 4 9 0
673 4 2 0
681 1 2 2
684 0 2 0
Total 18 60 16
In addition to the use of DPCAs and the issuance of elk permits to landowners, general season regulations may be liberalized to address elk conflicts within an area. Additionally, special permit seasons can be a tool to address elk conflicts within Elk areas or GMUs. Finally, the Department maintains regional pools of permit hunters that can be deployed to a property incurring agricultural damage. The regional pools of permit hunters are primarily those hunters that have achieved certification as master hunters. Master hunters who draw these permits are deployed directly by WDFW staff to address localized conflicts. Very few elk were harvested within the Willapa Hills elk herd area by this regional pool of permittees.
Research There is no ongoing elk research being conducted within the Willapa Hills herd area at this time.
Management Concerns Treponeme-associated hoof disease Treponeme-associated hoof disease (TAHD) of elk results in abnormal hoof growth, cavitating sole ulcers, and in severe cases, eventual sloughing of the hoof capsule. We find TAHD afflicted elk throughout the majority of the Willapa Hills herd area. Elk severely affected by TAHD often times have reduced mobility and condition. Consequently, they would have a reduced probability of survival or reproductive potential, however, the true effects of TAHD on the population dynamics of herds is unknown. Ongoing research in the Mount St Helens herd area will attempt to identify the specific population level impacts of TAHD on elk.
169

Elk Status and Trend Report 2018
The Department is also conducting research to better estimate the distribution and prevalence of TAHD. In 2014, a citizen science effort incorporated volunteers to conduct road surveys to locate elk and identify both the number of animals affected and, the geographic distribution of the disease. To learn more about the Department’s efforts associated with investigating TAHD, please visit the Department’s hoof disease webpage: http://wdfw.wa.gov/conservation/health/hoof_disease/
Private Land Access Private timber companies own >70% of the Willapa Hills elk herd land base. Consequently, recreational harvest of the Willapa Hills elk herd has largely been dependent on the willingness of these companies to allow hunters access. If these companies chose to preclude hunter access or charge increased fees, recreational hunting will decline. Since 2011, GMUs that had large quantities of private lands transferred to fee-access programs have seen large declines in hunter participation although overall harvest has remained stable.
Management Conclusions Harvest data indicate the Willapa Hills elk herd has been relatively stable during the period of 2008–2017 although the 2017 harvest total was the lowest reported for that period of time. Survey data indicate that the Department is meeting or exceeding its management objective of maintaining populations with a post-hunt bull:cow ratio of 12–20 bulls:100 cows. However, the number of mature bulls (5 pt or better) observed during surveys is extremely low. Calf recruitment rates in recent years have been at levels that should promote population stability or growth. While these herd metrics generally indicate a robust and stable elk population; hoof disease, and fee-access systems remain concerns for the Willapa Hills elk herd.
Literature Cited Bender, L. C., J. G. Cook, R. C. Cook, and P. B. Hall. 2008. Relations between nutritional
condition and survival of North American elk Cervus elaphus. Wildlife Biology 14:70–80. McCorquodale, S. M., P. J. Miller, S. M. Bergh, and E. W. Holman. 2014. Mount St. Helens elk
population assessment: 2009–2013. Washington Department of Fish and Wildlife, Olympia, Washington, USA.
Samuel, M. D., E. O. Garton, M. W. Schlegel, and R. G. Carson. 1987. Visibility bias during
aerial surveys of elk in north central Idaho. Journal of Wildlife Management 51:622–630. Washington Department of Fish and Wildlife. 2014. Willapa Hills Elk Herd Plan. Wildlife
Program, Washington Department of Fish and Wildlife, Olympia, WA. Washington Department of Fish and Wildlife. 2014. 2015–2021 Game Management Plan. Wildlife
Program, Washington Department of Fish and Wildlife, Olympia, WA. Washington Department of Fish and Wildlife, Confederated Colville Tribes, Spokane Tribe of Indians,
USDA-APHIS Wildlife Services, and U.S. Fish and Wildlife Service. 2018. Washington Gray Wolf Conservation and Management 2017 Annual Report. Washington Department of Fish and Wildlife, Wenatchee, WA, USA.
170

Elk Status and Trend Report 2018
Yakima Elk Herd JEFFERY A. BERNATOWICZ, Wildlife Biologist JASON C. FIDORRA, Wildlife Biologist Introduction The Yakima elk herd area is located in central Washington and consists of 11 GMUs, which includes 336 (Taneum), 340 (Manastash), 342 (Umtanum), 346 (Little Naches), 352 (Nile), 356 (Bumping), 360 (Bethel), 364 (Rimrock), 368 (Cowiche), 371 (Alkali), and 372 (Rattlesnake Hills) (Figure 1). The Yakima elk herd includes the Rattlesnake Hills sub-herd that is located on the Arid Lands Ecology Reserve (ALE) and surrounding lands in GMU 372. The Yakima elk herd is the only herd in the state where the Department maintains an annual winter feeding program for elk.
Figure 1. Dominant land use cover types within the 11 game management units that comprise the Yakima elk herd area.
Management Guidelines and Objectives The Department’s current management objective is to manage for a spring population of approximately 9,000–10,000 elk in the greater Yakima elk herd area and <350 elk in the Rattlesnake Hills sub-herd area (WDFW 2002). Additional objectives include managing for a post-hunt sex ratio of 12–20 bulls:100 cows and maintaining an annual survival rate of 0.50 for bulls when bull mortality is monitored (WDFW 2002, WDFW 2014).
171

Elk Status and Trend Report 2018
Population Surveys The Department estimates elk abundance in the Yakima herd area in spring by combining ground count data collected at established feed sites with estimates of elk abundance derived from areas adjacent to feed sites. We derive estimates of abundance and ratios in areas adjacent to feed sites by conducting helicopter surveys and using a sightability model developed for elk in Idaho to correct observed data for biases associated with effects of cover and group sizes (Unsworth et al. 1999). The Department does not conduct the aerial surveys when mild winter conditions fail to concentrate elk at lower elevations (2014, 2015, 2018). In February 2017, the Department estimated elk abundance within the survey area to be 8,326 elk (Figure 2), which is below objective. The bull:cow ratio had been increasing in recent years (Figure 3). The increase was attributable to winter weather making bulls more visible, as well as decreasing cow numbers. Estimates of post-hunt calf:cow ratios were relatively stable 2007–2016, but fell to a record low of 22 calves per 100 cows in 2017 (Figure 4).
Feedsites with elk, as well as some surrounding winter range was ground surveyed in February 2018. A total of 3,908 elk were classified with resulting ratio estimates of 30 calves and 7 bulls per 100 cows. Based on harvest and recrutiment, the population likely declined during 2017-2018. Low total calves in 2016 led to low spike harvest in 2017, as well as record low recruitment of spikes into the bull population.
Figure 2. Sightability corrected estimates of total elk abundance with associated 95% confidence intervals in the greater Yakima elk herd area, spring 2009–2018. The dashed lines represent management objectives for total elk abundance (9,025–9,975 elk).
172

Elk Status and Trend Report 2018
Figure 3. Estimates of post-hunt bull:cow ratios in the greater Yakima elk herd area, spring 2009–2018. The dashed lines represent the objective range of 12-20 bulls:100 cows. Estimates in 2018 are based on ground sampling and are not thought to accurately reflect the true population ratios due to low observability of bulls from the ground.
Figure 4. Estimates of post-hunt calf:cow ratios in the greater Yakima elk herd area, spring 2009–2018. The dashed line represents a calf:cow ratio of 30 calves:100 cows that should promote herd stability or growth.
173
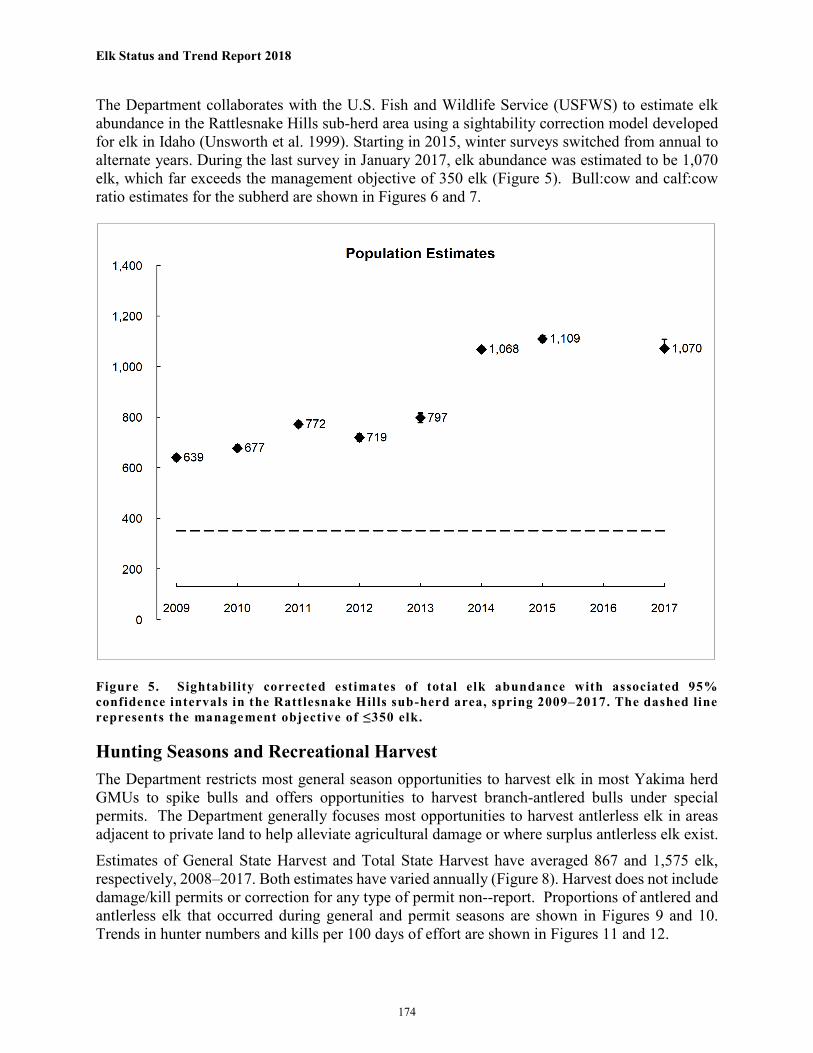
Elk Status and Trend Report 2018
The Department collaborates with the U.S. Fish and Wildlife Service (USFWS) to estimate elk abundance in the Rattlesnake Hills sub-herd area using a sightability correction model developed for elk in Idaho (Unsworth et al. 1999). Starting in 2015, winter surveys switched from annual to alternate years. During the last survey in January 2017, elk abundance was estimated to be 1,070 elk, which far exceeds the management objective of 350 elk (Figure 5). Bull:cow and calf:cow ratio estimates for the subherd are shown in Figures 6 and 7.
Figure 5. Sightability corrected estimates of total elk abundance with associated 95% confidence intervals in the Rattlesnake Hills sub-herd area, spring 2009–2017. The dashed line represents the management objective of ≤350 elk.
Hunting Seasons and Recreational Harvest The Department restricts most general season opportunities to harvest elk in most Yakima herd GMUs to spike bulls and offers opportunities to harvest branch-antlered bulls under special permits. The Department generally focuses most opportunities to harvest antlerless elk in areas adjacent to private land to help alleviate agricultural damage or where surplus antlerless elk exist. Estimates of General State Harvest and Total State Harvest have averaged 867 and 1,575 elk, respectively, 2008–2017. Both estimates have varied annually (Figure 8). Harvest does not include damage/kill permits or correction for any type of permit non--report. Proportions of antlered and antlerless elk that occurred during general and permit seasons are shown in Figures 9 and 10. Trends in hunter numbers and kills per 100 days of effort are shown in Figures 11 and 12.
174

Elk Status and Trend Report 2018
Figure 6. Estimates and associated 95% confidence intervals of post-hunt bull:cow ratios in the Rattlesnake Hills sub-herd area, spring 2009–2017. The dashed lines represent the objective range of 12-20 bulls:100 cows.
Figure 7. Estimates and associated 95% confidence intervals of post-hunt calf:cow ratios in the Rattlesnake Hills sub-herd area, spring 2009–2017. The dashed line represents a calf:cow ratio of 30 calves:100 cows that should promote herd stability or growth.
175

Elk Status and Trend Report 2018
Figure 8. Estimated number of antlered and antlerless elk harvested in the Yakima elk herd area during recreational hunting seasons (general and permit opportunities combined) established by the Department, 2008–2017. Estimates do not include elk harvested in association with damage permits (see Human Wildlife Interaction below). Estimates also do not include harvest that occured during established Tribal seasons because that data is currently not available.
Figure 9. Estimated percentage of recreational antlered harvest in the Yakima elk herd area that occurred during general and permit seasons, 2008–2017.
176

Elk Status and Trend Report 2018
Figure 10. Estimated percentage of recreational antlerless harvest in the Yakima elk herd area that occurred during general and permit seasons, 2008–2017.
Figure 11. Estimated number of days hunters spent pursuing elk in the Yakima elk herd area during recreational seasons that provided general over-the-counter opportunities, 2008–2017.
177

Elk Status and Trend Report 2018
Figure 12. Estimated number of elk harvested for every 100 hunter days spent pursuing elk in the Yakima elk herd area during recreational seasons that provided general over-the-counter opportunities, 2008–2017.
Survival and Mortality Common predators of elk that occur throughout the Yakima elk herd area include black bears and cougars, but black bears are more abundant in forested habitats. At the time of this writing, there were no documented wolf packs in the herd area (WDFW et al. 2018). The Yakima elk herd has never been historically prone to winter mortality. This is partially due to up to 70% of the herd being fed during normal and severe winters. That appears to have changed during the winters of 2015/2016 and 2016/2017. The magnitude of the population decline was documented in spring 2017 when the calf:cow ratio was the lowest observed in more than a decade. Drought in the summer of 2015 may have been a factor affecting the amount and the quality of available forage and elk body condition moving into winter. Substantial antlerless hunting opportunity also occurred in the fall of 2015 and 2016.
The Department (S. McCorquodale, WDFW, unpublished data) monitored the survival of adult female elk and branch-antlered bulls in the Yakima elk herd area, 2003–2006, and estimated bull survival to be 0.63 (95% CI = 0.52–0.73). Estimated cow survival was 0.58 (95% CI = 0.39–0.75) in GMUs 336, 340, 342, and 346 in 2005 and 0.83 (95% CI = 0.73–0.90) during 2003, 2004, and 2006. Estimated cow survival across other portions of the herd area and across all study years was 0.88 (95% CI = 0.84–0.92). WDFW documented causes of mortality for 69 elk during that study
178

Elk Status and Trend Report 2018
and attributed 88% of all mortalities to human causes; one (<2%) mortality was attributed to predation (S. McCorquodale, WDFW, unpublished data).
Habitat The USFS and Washington Department of Natural Resources (DNR) manage the majority of summer range within the Yakima elk herd area. Habitat quality for elk varies across these ownerships, depending on land management and underlying land cover types. A large portion of the herd migrates to wilderness areas, where the only factor impacting habitat is fire. In recent years, the USFS has opted to let some fires burn, which has increased long-term habitat quality. Outside wilderness, the USFS has emphasized reducing the potential for large fires by thinning and underburning. The impact of the thin/burn projects on elk habitat can vary, but should increase forage availability long-term. The main concern is the high road-density in many areas and reduced security cover. Elk may avoid large areas due to disturbance, even if forage quantity/quality increases. WDFW is now treating some of their lands with the goal of stands resilient to fire. Large tracts of open forest may result in elk distribution different than currently observed.
Human-Wildlife Interaction In 2017-18, there were 151 damage/kill permits issued in the core Yakima herd. Although permitees are required to report, only 19 did so, with a resulting harvest of 14 antlerless elk. As such, we believe the level of harvest was substantially higher than reported. The Rattlesnake Hills subherd population remains above management objectives and crop damage is a constant concern amongst producers near the Arid Lands Ecology reserve, which provides refuge for the majority of the subherd year round. There are no elk feeding sites near the Rattlesnake Hills. Conflict Section staff work with landowners on preventative control efforts and lethal removal of elk to deter elk from visiting croplands that include wheat, orchards, and vineyards. From April 2017 thru March 2018, 221 damage prevention and 17 kill permits were issued to landowners in the Rattlesnake subherd area, resulting in a minimum harvest of 57 elk. In addition to these permits, the use of non-lethal deterrants and public hunting have reduced conflict despite an increasing elk population over the past decade.
Management Concerns The Yakima elk herd had been at or above objective for much of the last decade and has been very productive. The surplus of elk allowed for significant recreational opportunity, including antlerless harvest. Recreational harvest, drought, and severe winter weather in 2015-2016 have reduced herd size and hunting opportunity. The herd has historically rebounded quickly after poor recruitment years, but did not in 2017. It will likely take some time to bring elk numbers back to objective. This may mean reduced antlerless opportunity. In 2018, all GMU’s will still be open to general season archery hunting, but the seasons will be shortened in an attempt to prevent overharvest.
There are often questions about the winter feeding program and if there are ways to get elk to move from feedsites to natural winter range. WDFW owns or leases (from DNR) much of the available elk winter range. One of the management issues with elk feeding is human disturbance. Feedsites are closed to all access, but away from feedsites winter range is open to recreation throughout the winter. WDFW lands were originally obtained for elk and deer winter range, but these areas have
179

Elk Status and Trend Report 2018
become very popular for recreation. Elk seek security from human disturbance and would likely concentrate on closed areas even if they were not fed. Closing access to winter range can be controversial. For the foreseeable future, a large portion of the Yakima elk herd will be fed when winter dictates the need.
The trend of managing lands for fire resilency may lead to more open stands with little security for elk. This is expected to result in a change in elk distribution. When elk do enter high road density areas with minimal cover during hunting seasons, there may be increased harvest. Managing for a specific harvest to meet population objectives could become more difficult.
Management Conclusions The Department had been meeting its management objective of maintaining a population with 12–20 bulls:100 cows in the post-hunt population and expects that to continue. However, the overall number of bulls recruited into the population has declined as a result of poor calf recruitment in 2017 and an overall reduction in the number of cows in the population. As such, the Department may need to reduce opportunities to harvest bulls in the future to maintain bull:cow ratios that are within objective, in addition to reducing antlerless harvest to prevent further declines in the overall population. Finally, the Rattlesnake Hills sub-herd remains above objective because hunting is not allowed on ALE or the adjacent federal Hanford Site, which limits the Department’s ability to manage this sub-herd.
Literature Cited Unsworth, J. W., F. A. Leban, E. O. Garton, D. J. Leptich, and P. Zager. 1999. Aerial Survey:
User’s Manual. Electronic Edition. Idaho Department of Fish and Game, Boise, Idaho, USA.
Washington Department of Fish and Wildlife. 2014. 2015–2021 Game Management Plan. Wildlife
Program, Washington Department of Fish and Wildlife, Olympia, WA. Washington Department of Fish and Wildlife. 2002. Yakima Elk Herd Plan. Wildlife Program,
Washington Department of Fish and Wildlife, Olympia, WA. Washington Department of Fish and Wildlife, Confederated Colville Tribes, Spokane Tribe of Indians,
USDA-APHIS Wildlife Services, and U.S. Fish and Wildlife Service. 2018. Washington Gray Wolf Conservation and Management 2017 Annual Report. Washington Department of Fish and Wildlife, Wenatchee, WA, USA.
180

Mountain Goat
181

Mountain Goat Status and Trend Report 2018
Mountain Goat Status and Trend Report STATEWIDE RICHARD B. HARRIS, Special Species Section Manager
Management Guidelines and Objectives The population monitoring objective for mountain goats is to be able to detect i) substantial declines in population size reliably within a 4-year period, and ii) increases sufficient to justify an increase in harvest opportunity within a 4-year period. The harvest objective is to provide recreational hunting opportunities in individual mountain goat herds that have been documented as large and robust enough to support it, while at the same time goat population size remains stable or increasing. Specific guidelines for managing harvest within sustainable limits are discussed in WDFW (2014). The harvest guidelines are to limit harvest opportunity to 4% or less of the total population (excepting kids) in contiguous areas containing 100 or more mountain goats, and limit harvest of nannies (females) to 30% or less. In a refinement of the “4% , 30%” guidelines, WDFW has begun revising permit limits every 3-years, with reference to whether or not the previous 3-years’ harvest of females has exceeded 1.2% of the total estimated local population (excepting kids). Mandatory carcass inspection, instituted in 2015, has increased the accuracy of our knowledge of female harvest, as well as provided valuable information on ages, disease status, and location of harvests.
Population Surveys With one exception, surveys were conducted using a helicopter and generally occurred between July and late August. (Surveys in the Lake Chelan area have recently been using winter-time boat-based surveys). For most surveys, the total number of goats on an area-wide basis was estimated using a sightability correction model (Rice et al. 2009) developed specifically for use in Washington State. Because the funding level was not sufficient to survey all goat units, priority was given to hunted units.
Hunting Seasons and Recreational Harvest Mountain goat hunting opportunity in Washington is limited by permit. Permit availability (and therefore hunter opportunity) decreased substantially beginning in the 1990s (Figure 1), and is currently considerably lower than during the 1980s (which, in turn, was a reduction from the peak years of permit availability during the 1960s and 1970s, Rice and Gay 2010). Twenty-nine (27 general permits, 1 raffle and 1 auction permit) were available in 10 goat management units in 2017; however, due to a fire that precluded access to one of the goat hunt units, 3 permits were returned to WDFW under the provisions of an emergency rule promulgated by the Washington Fish and Wildlife Commission. Thus, 24 mountain goat hunters were actually permitted in 2017. The 2017 mountain goat season provided 77 days of mountain goat hunting (September 15 to November 30; except that archery hunters, auction, and raffle permit hunters’ seasons began September 1, and Conflict Reduction hunt permittees had shorter seasons). Hunters were able to use any legal weapon and harvest any adult goat with horns greater than 4 inches (although hunters were encouraged to select billies (males).
182

Mountain Goat Status and Trend Report 2018
Of the 24 permits available in 2013, 23 were reported used by hunters. These hunters reported harvesting 19 goats. Winners of both the statewide auction hunts both harvested goats. Estimated success (including raffle and auction hunts) of hunters using their permits was thus 84%. Two of the four unsuccessful hunters had permits for the East Olympic Mountain unit; the other had a permit for the Avalanche Gorge area of Mt. Baker.
Given the sensitive nature of mountain goat populations (Rice and Gay 2010) and their generally small sizes (see Population status and trend analysis, below), only goat populations that are surveyed annually, and meet or exceed population guidelines described in WDFW 2008 are considered for recreational hunting.
Survival and Mortality Mountain goat populations have declined in Washington relative to estimated historical levels. Goat populations within the state were considered by Johnson (1983) to have exceeded 10,000 animals (including those within federally-managed areas; within state-managed areas, the guesstimate was 8,555) as recently as 1961 (although documentation for these numbers is weak). Rice (2012) estimated 2,815 (with lower and upper estimates of 2,401 and 3,184 respectively) within Washington during the period 2004-07, of which about 800 were in areas not managed by WDFW. As of 2017, our best estimate is that mountain goats within Washington numbered approximately 3,690 (lower and upper 90% confidence bounds of 3,110 and 4,370). Of these, about 1,043 live primarily within National Parks. As of 2017, we estimate that approximately 2,650 (90% confidence bounds 2,250 to 3,230) lived in the Cascade Mountains but not in National Parks. Hunting opportunity has responded accordingly, and current permit levels represent 4% or less of estimated population in herds that are stable or increasing, and which have been surveyed routinely. Despite the overall declining trend in goat numbers and range, a few populations are
0
50
100
150
200
250
1992
1994
1996
1998
2000
2002
2004
2006
2008
2010
2012
2014
2016
Perm
its a
nd h
arve
st
Harvest
Permits
Figure 1. Special permits (line) and mountain goat harvests (vertical bars) in Washington 1992-2017. These numbers do not include auction or raffle permit hunts.
183

Mountain Goat Status and Trend Report 2018
doing well. Goat populations around Mt. Baker, along the lower Cascade crest, in Goat Rocks, and along the north shore of Lake Chelan appear to be stable, and populations in the Naches Pass and Bumping Units are approximately stable. Goat populations south of Darrington in the Boulder River Wilderness have increased to the level where a modest hunting season was initiated in 2015. There are suggestions that goats are recovering southeast of the Boulder River Wilderness, as well as on Glacier Peak. Mountain goats have recently been documented as increasing (from essentially none to approximately 250) in and around Mt. St. Helens.
Habitat Fire suppression policies and natural forest succession continues to degrade critical mountain goat foraging habitat. Fire suppression allows conifers to invade these natural openings and decreases their foraging value for goats. The degradation and loss of alpine meadows, coupled with increasing recreational human use and disturbance of alpine habitat are likely the two greatest negative impacts to mountain goats. Climate change may pose challenges of an uncertain nature for mountain goat populations in the future.
Management Conclusions The largest obstacles to effective mountain goat management are i) a consistent funding base to assess the status of goats, ii) difficulty of estimating the size and defining biologically-meaningful boundaries of individual herds, and iii) the existence of large areas of suitable goat habitat where goats are absent. Management activities are now being directed toward a goat translocation project to begin rebuilding goat populations in areas of vacant suitable habitat within the Cascade Mountains.
Literature Cited Johnson. R. L. 1983. Mountain goats and mountain sheep of Washington. Washington Department
of Game Biological Bulletin No. 18. 196 p. Rice, C. 2012. Status of mountain goats in Washington. Northern Wild Sheep and Goat Council
18: 64-70. Rice, C.G., K. J. Jenkins, and W.Y. Chang. 2009. A sightability model for mountain goats. Journal
of Wildlife Management 73(3):468–478. Rice, C.G., and D. Gay. 2010. Mountain goat harvest in Washington State: effects on historic and
contemporary populations. Northwest Naturalist 91: 40–57. Washington Department of Wildlife. 2014. 2015-2021 Game Management Plan. Wildlife
Program, Washington Department of Fish and Wildlife, Olympia, WA.
184

Mountain Goat Status and Trend Report 2018
Mountain Goat Status and Trend Report: Region 2 Chelan County DAVID P. VOLSEN, Wildlife Biologist DEVON COMSTOCK, Wildlife Biologist Management Guidelines and Objectives The statewide management goals for mountain goats are to ensure healthy productive populations and native habitats, to provide opportunities for a wide range of non-consumptive uses, and to enhance populations to provide sustained recreational hunting opportunities. Statewide mountain goat strategies recommend that prior to a population being hunted, that it be surveyed to determine its population size and trend, and that the population numbers a minimum 100 goats within the management unit. For stable or increasing goat populations meeting these guidelines, harvest is limited to no more than 4% of the total population (excluding kids), with harvest of females below1.2% of the estimated population excluding kids (WDFW 2014).
Population Surveys As part of a hydropower license agreement, the Chelan Public Utility District (PUD) annually completes 12 winter wildlife surveys by boat on Lake Chelan along both north and south shores. For Lake Chelan, the total number of known goats is the result of comparing results from all surveys completed during each winter. This is the only annually collected, long-term data for Chelan County mountain goats. During the 2017-2018 survey, there was an estimated minimum count of 62 mountain goats on both the north and south shores. Despite this relatively low estimated minimum count kid: adult ratios have remained stable, approximately 23 kids:100 adults each year (Pope and Cordell, 2018). Year to year counts vary widely due to snow accumulation and weather conditions along the lake. In general, during heavy snow years, goats concentrate in higher densities along the lake to winter, providing a better opportunity to observe them. Due to the available terrain, rugged topography and tree cover, mountain goats can be incredibly difficult to survey from a boat. For this reason, WDFW is exploring opportunities to conduct aerial surveys of the Lake Chelan populations in the future. Low snowfalls in recent years have created difficult conditions in which to survey. With adequate snowfall, goats move down to lower elevations where observation increases. Surveys during mild winters, such as 2014-15, return low counts that will bias population trends downward when not accounted for. As a comparison to ongoing boat-based survey methods, in February 2015 we conducted a helicopter-based aerial survey using sightability correction to estimate goat numbers in a subsection of habitat on the North Shore Lake Chelan. Although this survey was not exhaustive, results showed that large numbers of goats occupying habitat in the survey units were not available for observation from a boat-based survey platform. The aerial sightability survey returned an estimate of 91 goats (90% CI = 74-108). In comparison, the maximum count from boat-based surveys conducted the next day totaled 15 goats (Pope and Cordell-Stein 2015). These results provide justification for our assumption the population is larger than the boat-based surveys indicate. Winter counts conducted along driven survey routes in mountain goat areas in other sections of Chelan County returned increasing numbers over time, which suggests that the population is increasing. Additionally, volunteer led survey efforts, using hiking routes, sought to determine
185

Mountain Goat Status and Trend Report 2018
presence of goats in portions of the Alpine Lakes Wilderness for which we had no data. Surveys from 2008-2015 averaged a high count of 65 mountain goats per year, which was comparable to previously compiled estimates of 50-75 animals (Rice 2012). This effort helped document the current mountain goat distribution and galvanized support for initiating aerial surveys to obtain a population estimate. In 2017, attempts to conduct aerial surveys of mountain goats in the Alpine Lakes Wilderness were canceled due to wildfires that lead to poor visibility and appropriated helicopter resources. Surveys were rescheduled for 2018.
Hunting Seasons and Recreational Harvest Until 2001, no goat harvest had occurred in Chelan County in over 20 years. In 2001, 2 permits were authorized for North Lake Chelan, and two male goats were harvested. Only one permit was issued each year from 2002-2008, with permits again increased to two in 2009. In the past ten years, hunter success has been variable, with hunters in the North Lake Chelan unit enjoying an 80% success rate compared to a 60% success rate for the South Lake Chelan unit. Rugged terrain and remote wilderness with restricted access limits hunter success and makes finding adult males difficult. In the North Lake Chelan unit, six of the 13 goats harvested by permit hunters since 2008, have been nannies.
A single permit will be issued for the South Lake Chelan unit for the fall 2018 season. The unit has been open for six hunting seasons, opening in 2012. Hunters have harvested three male goats in the 6 years this unit has been open. Difficult access to areas with goats is the main factor in the low success rate.
Mountain goat populations within the East-central Cascades (Chiwawa, East Stevens Pass, North Wenatchee Mtns, and Stehekin) are not surveyed intensively enough to confidently estimate their
Table 1A: Summary of Mountain Goat Harvest for North Lake Chelan, 2008-2017 Year Permits Hunters Harvest Male Female Success Days Hunted2008 1 1 1 0 1 100 82009 2 2 2 2 0 100 82010 2 2 2 2 0 100 52011 2 2 2 0 2 100 28
2012* 2 2 2 1 1 100 72013* 2 2 0 0 0 0 02014 2 1 1 1 0 100 52015 2 1 0 0 0 0 02016 2 2 2 1 1 100 272017 2 1 1 0 1 100 5Total 19 16 13 7 6 80% 93
Table 1B: Summary of Mountain Goat Harvest for South Lake Chelan, 2012-20172012 1 0 0 0 0 0 02013 1 1 1 1 0 100 62014 1 1 0 0 0 0 02015 1 1 1 1 0 100 62016 1 1 1 1 0 100 102017 1 1 0 0 0 0 13Total 6 5 3 3 0 60% 35
*For 2012 and 2013 additional harvest of 1 mountain goat from raffle/auction hunter harvest not included
186

Mountain Goat Status and Trend Report 2018
population size, and are currently closed to hunting. Surveys conducted since 2008 via driving and hiking routes suggest that goat numbers in the North Wenatchee Mountains Unit are increasing, and warrant formal helicopter sightability surveys to develop a population estimate.
Survival and Mortality Mountain goat populations in Chelan County remain below historic levels of the 1960s. Observational data suggest that numbers are increasing from historical low numbers of 30 years ago. The Lake Chelan population (which the Chelan PUD has monitored since 1982) appears, to be stable (Table 3). From 1982-2017, the kid: adult ratios were adequate for population growth, with the long-term average of 23 kids:100 adults (2008-2018). From 2015-2018, boat-based survey observations averaged 82 goats (range: 62-115), with 23 kids:100 adults (range: 20-26) (Pope & Cordell 2018). Goat counts for the Lake Chelan population have decreased over the last 4 years, although it is unknown if this is a true population decline or a problem with boat-based visibility, which causes high sighting variability.
Table 2: Compiled minimum counts from ground and boat-based surveys in Chelan County 2008-2017
Area North Lake
Chelan*
North Lake Chelan
Adult:Kid*
South Lake
Chelan*
South Lake
Chelan Adult:Kid*
Stehekin Chiwawa North
Wenatchee Mtns
East Stevens
Pass
2008-09 94 21 66 26 15 23 20 2009-10 81 16 128 31 9 69 22 2010-11 78 27 94 53 8 38 10 2011-12 43 30 116 28 1 71 12 2012-13 74 32 103 26 56 2013-14 45 23 50 10 78 2014-15 48 30 45 29 117** 2015-16 65 30 50 22 2016-17 30 25 40 18 2017-18 30 38 32 6
* Data from Chelan PUD Winter Boat Surveys. **Increase due to volunteer survey effort. Adult:Kid ratios calculated from total positively identified animals only
Habitat
Fire suppression during the last 50 years has decreased habitat for mountain goats in Chelan County. Most mountain goat habitat is within wilderness areas managed by Okanogan-Wenatchee National Forest. Wilderness designation precludes most forms of habitat alteration, with changes in habitat condition occurring from forest fires. Fires are anticipated to reduce habitat initially, but increased forage post-fire will be beneficial to mountain goats. Over the last decade, several major fires in the Lake Chelan Basin (both shores), and North Wenatchee Mountains (Icicle and Tumwater Canyons) have burned substantial mountain goat habitat and range. The subsequent increase in early seral stage vegetation and forage may have contributed to the increase in mountain goat counts during the same time period (both in terms of increased production and visibility). The fires of summer 2015 may provide an additional opportunity to test this hypothesis. In 2015 the 65,000-acre Wolverine Fire burned across mountain goat habitat on South Lake Chelan. The fire burned over areas which were recovering from the 2007 Domke Lake fire, the 2004 Deep Harbor fire, and the 2014 Duncan fire.
187

Mountain Goat Status and Trend Report 2018
Research A statewide mountain goat research project was initiated to determine habitat use, seasonal range, population status, methods of survey, and population limiting factors in 2002. There were 3 adult nannies fitted with GPS collars during 2004 in District 7. One was collared on Nason Ridge, and one each on the North and South Lake Chelan Units. In 2005-2006, all goats were found to concentrate their activity in 4-5 mi2 areas near their capture locations.
Insight was also gained on gene flow and interaction between populations. This was highlighted by two nannies collared on Gamma Ridge on Glacier Peak who traveled 10-12 miles east to the south shore of Lake Chelan. Permit numbers for the South Lake Chelan unit take into account the potential harvest of goats from Region 4. 3 goats collared, on Gamma Ridge in fall 2006 traveled into the Chiwawa region of Chelan County, highlighting movement and interchange between populations.
Management Conclusions Most mountain goat populations in Chelan County are below historic levels and are not hunted. Population trends in areas outside the Lake Chelan area cannot be effectively monitored without additional survey resources. Based on Chelan PUD survey data, average kid production is likely stable in both the north and south shore populations, however annual counts have recently been declining. Resources are being redirected to establish regular helicopter surveys near Lake Chelan to produce a sightability-corrected abundance estimate (Rice et al. 2009). Additional emphasis should be placed on new surveys in other sections of District 7’s mountain goat habitat, particularly those in the East-central Cascades to better understand trends in mountain goat populations and their distribution. Given the large fire events in the past ten years in the Lake Chelan area and the number of recurring fires, it is important to understand how mountain goats utilize landscapes post-fire. Improved survey efforts will provided a better understanding of those relationships.
Literature Cited Pope, V. R. and Cordell-Stine, K. A. 2015. Lake Chelan Annual Winter Wildlife Survey Report:
Winter of 2014-2015. Chelan Public Utility District, Wenatchee WA.
Pope, V. R. and Cordell, K. A. 2018. Lake Chelan Annual Winter Wildlife Survey Report: Winter of 2017-2018. Chelan Public Utility District, Wenatchee WA.
Rice, C.G., K. J. Jenkins, and W.Y. Chang. 2009. A sightability model for mountain goats. Journal of Wildlife Management 73(3):468–478.
Rice, C.G. 2012. Status of Mountain Goats in Washington. 18th Biennial Symposium of the Northern Wild Sheep and Goat Council 18: 64-70.
Washington Department of Wildlife. 2014. 2015-2021 Game Management Plan. Wildlife Program, Washington Department of Fish and Wildlife, Olympia, WA.
188

Mountain Goat Status and Trend Report 2018
Mountain Goat Status and Trend Report: Region 2
Methow SCOTT FITKIN, Wildlife Biologist JEFF HEINLEN, Wildlife Biologist
Management Guidelines and Objectives
The Methow unit (Goat Unit 2-2) is currently being managed for population growth and increased distribution. We encourage the public to take advantage of watchable wildlife opportunities at the salt lick along the Hart’s Pass Road and on Grandview Mountain just northwest of Palmer Lake.
Population Surveys As resources allow, we conduct annual surveys to determine minimum population size and herd productivity. These data are used to generate hunting permit allocations in accordance with statewide management guidelines. Annual surveys were consistent through 2007 however; limited resources have precluded surveys for most years thereafter. Poor survey conditions and timing produced suboptimal surveys in 2009 and 2013. Surveys occurred in 2016 with good conditions and timing: however, only 38 goats were observed (table 2).
Hunting Seasons and Recreational Harvest Over the long-term mountain goat populations have declined significantly in some portions of the North Cascades. Research findings suggest historical hunting levels may have been unsustainably high for goats. As a result, statewide mountain goat management guidelines do not recommend harvest permits until surveys indicate a population size of at least 100 goats in a population management unit. Limited resources caused a gap in survey data over a five year period and resulted in the suspension of harvest in the unit for 3 years (2009-2011) (Table 1). Anecdotal reports during this time suggested a total Methow Unit population of over 100 animals, and possibly some limited range expansion. As a result, a single annual harvest permit was offered in both the 2012 and 2013 seasons. Due to subsequent surveys yielding low numbers of animals, harvest has been suspended since 2014.
Table 2. Population composition counts from the Methow Unit.
Year Kids Yearling Adults Minimum Population
Kids:100 Adults
1995 -- -- -- -- -- 1996 16 -- 41 57 39 1997 20 -- 49 69 41 1998 -- -- -- -- 44 1999 -- -- -- -- -- 2000 11 -- 36 47 31 2001 10 -- 50 60 20 2002 19 -- 61 80 31 2003 8 -- 45 53 18 2004 13 17 52 82 *25 2005 18 13 65 96 *28 2006 7 5 31 43 *23 2007 18 5 38 61 *47 2008 -- -- -- -- -- 2009 5 -- 13 18 *38 2010 -- -- -- -- -- 2011 -- -- -- -- -- 2012 -- -- -- -- -- 2013 6 5 15 26 *40 2014 -- -- -- -- -- 2015 -- -- -- -- -- 2016 10 2 26 38 *38 2017 -- -- -- -- -- 2018 -- -- -- -- -- *Starting in 2004 adults and yearlings were classified separately. Prior to 2004 yearlings were classified as adults. Therefore, the ratio K:100 has changed to exclude yearlings starting in 2004.
189

Mountain Goat Status and Trend Report 2018
Survival and Mortality This unit had been monitored closely from 2000-2007 with a stable population being observed. Since 2009, surveys suggest a decline in the population size. Continued annual aerial counts in very early summer will be needed to adequately document the status and trend in this population. Incidental observations outside of the traditional hunting unit verify that small numbers of goats are persisting in pockets scattered throughout suitable habitat in the Okanogan District. Little survey work has been done in these areas due to lack of resources. Population size and trend are unknown for these animals.
Habitat Goats in the Okanogan District dealt with an average snow pack during the 2016/2017 winter. Goat habitat is almost entirely within secured areas and habitat availability remains stable. Habitat quality varies noticeably throughout goat range in the Okanogan District due to past wildfires of varying ages. Overall, the unit is currently characterized by a mosaic of successional stages. Much of the district’s goat habitat is in wilderness areas. As a result, changes in habitat quality will occur primarily through natural, unpredictable events such as wildfires and avalanches, rather than human intervention.
Management Conclusions
Management objectives should continue to focus on population growth and distribution expansion. Resources are needed to allow for a consistent and methodical survey effort annually in late June to better determine population size and trend.
Significant differences in productivity between the north and south portions of the unit may be developing. Limited data from telemetry and survey flights suggests fairly minimal interchange occurs between the two herd segments. In addition, suitable goat habitat adjacent to this unit is sparsely populated and could likely support more animals than exist currently. Efforts to augment the Methow Unit with goats from Washington’s Olympic Mountains are planned for September 2018. The goal of this augmentation is to boost genetic diversity and improve overall population numbers. Also, the Handcock Ridge band spends significant time west of the Cascade Crest to the northwest of the Methow Unit boundary, and occupied goat range extends beyond the unit boundary to the south. As a result, redrawing and/or splitting the Methow into two units extending across administrative district boundaries should be explored.
Table 1. Summary of harvest information for mountain goats in the Methow Unit.
Year Permits Hunters Harvest Success Goats
seen/hunter 1995 8 8 8 100% 31 1996 8 8 5 63% 8 1997 5 5 4 80% 20 1998 5 5 3 60% 22 1999 5 5 4 80% 32 2000 5 5 5 100% 23 2001 2 2 0 0% 11 2002 2 2 1 50% 26 2003 2 2 2 100% 31 2004 2 2 1 50% 26 2005 2 2 1 50% 48 2006 2 1 1 100% 23 2007 2 1 1 50% 4 2008 2 2 2 100% 38 2009 -- -- -- -- -- 2010 -- -- -- -- -- 2011 -- -- -- -- -- 2012 1 1 1 100% 11 2013 1 1 1 100% 16 2014 -- -- -- -- --
190

Mountain Goat Status and Trend Report 2018
Mountain Goat Status and Trend Report: Region 3 Blazed Ridge, Bumping River, Naches Pass JEFFREY A. BERNATOWICZ, Wildlife Biologist Management Guidelines and Objectives The statewide goals for mountain goats are:
1. Preserve, protect, perpetuate, and manage mountain goats and their habitats to ensure healthy, productive populations.
2. Manage mountain goats for a variety of recreational, educational, and aesthetic purposes including hunting, scientific study, cultural and ceremonial uses by Native Americans, wildlife viewing and photography.
3. Enhance mountain goat populations and manage for sustained yield. 4. For populations to be hunted, a minimum of 100 goats older than kids. 5. Harvest should not exceed 4% of a stable population (defined as animals older than kids),
with no more than 30% of the harvest being females.
Population Surveys
Tables 1-4 show annual survey results for mountain goat units.
Hunting Seasons and Recreational Harvest Mountain goat seasons are open only to hunters drawing a special permit or winning a raffle or auction. In 2017, there were originally 6 permits distributed among 2 units (Tables 1-3) in Region 3. The Naches Pass Unit was closed to access by the USFS due to a fire for the entire season. Those 3 permits were eventually cancelled for 2017 and rolled over to 2018. The Statewide raffle winner hunted the Region in 2017. Four goats were known harvested, including one outside the legal unit. Three were billies, but the illegal harvest was a yearling.
Survival and Mortality
The status of mountain goat populations is assessed using aerial surveys (Rice et al. 2009) and, as an ancillary data source, interviews with hunters, guides, and other people knowledgeable about local mountain goats.
All goat populations in the Region probably declined from historic levels due to over-harvest. WDFW planning calls for harvests being no more than approximately 4% of the adult (older-than-kid) population. Goats were historically managed with more liberal permit numbers and with harvest rates often over 10%. Since 1996, harvest has been more conservative and populations have probably increased, although there is no obvious trend in the last 6 years. The trend for Kachess Ridge is unknown, as no surveys have been conducted since 2005.
191

Mountain Goat Status and Trend Report 2018
Habitat The majority of goats in the Bumping and Naches Pass areas spend summers in wilderness areas where short- term, habitat is mostly influenced by weather cycles. A 2017 fire in Naches Pass has temporarily reduced forage and cover. Long-term, summer habitat should improve, but the lack of cover may impact winter survival. Insect outbreaks in the last 10 years has also killed timber, which may improve forage. There have been a number of small fires due to lightning that the USFS is now inclined to let burn in wilderness. Recreational use could also be influencing use of available habitat. There is no comprehensive documentation of where these goats winter. Outside the wilderness, timber harvest and road building may impact habitat.
The Blazed Ridge and Kachess Units are mostly outside wilderness areas. Timber harvest in both units in the last 10-15 years may have impacted winter habitat. The north portion of the Blazed Ridge unit has been particularly heavily logged. The timber cutting has probably improved summer habitat, but may have removed winter cover. Road and trail densities have also increased. There are often roads at the top and bottom of every ridge. Off-road vehicle use and general recreation is heavy in the Blazed Ridge unit.
It is unknown how goats react to roads and human activity, which have increased with Washington’s population. Major highways (e.g., I-90) have probably limited movements among herds over time. Smaller highways and developments (e.g., ski areas) could also limit movement and use of some areas. This may limit re-colonization and recovery of some areas and may have long-term implications for genetic diversity.
Management Conclusions Goat populations in Region 3 have generally been increasing since harvest has been restricted to 4%. Hunters have generally been good at selecting billies, and recruitment in recent years has been good. The last 3 winters have been moderate, which combined with fire may have impacted Naches Pass. The Blazed Ridge Unit is a mystery. Population estimates for Blazed Ridge have varied between 46 and 104 goats the last 5 years. The large swings are larger than would be expected from survey-related sampling variation alone, and may reflect movements in and out of the survey area.
Unit boundaries may not correspond to biological populations. It is likely that gene flow occurs among all goats south of I-90. Hunting units have changed over time. Previously, Blazed Ridge was lumped with Naches Pass. Lines have arbitrarily been drawn in the past, using little knowledge of population structure or movements. In recent years, this led to a conservative harvest. Following decades of overharvest, it was prudent to be conservative. Now that populations are recovering, it may soon be time to revisit objectives for populations and harvest. For units south of I-90, there were an estimated 440 total goats and 306 adults in 2015. A 4% take quota would have allowed 12 permits instead of 6 had the population been viewed at a larger scale. The estimate of 440 goats likely remains biased low. The visibility correction model (Rice et al. 2009) can only adjust for groups of goats seen, and not all groups are seen within a unit on a given survey. Surveys do not cover all habitats. The northwest 1/3 of the Bumping unit is not surveyed, and the unit abuts Mount Rainer National Park. Groups of goats are known to cross the park boundary. That said, local overharvest can occur if harvest – particularly of nannies - is concentrated within a small area, even if it is numerically sustainable on a larger geographic scale.
192

Mountain Goat Status and Trend Report 2018
North of I-90, the Kachess unit population was probably the smallest in the state and has limited habitat. It is unlikely the unit ever had 100 adult goats. A meaningful subdivision of the population would probably stretch between I-90 and Hwy 2. The entire area has never been surveyed, but observations suggest there may be over 100 adult goats between these highways. If surveyed, there may be justification for additional hunting opportunity.
Goal #5 (4%) may be overly general. Game populations are much more impacted by female harvest than male harvest. Other states use a point system, where harvest of females is accounted for differently than harvest of males. The initiation of mandatory carcass inspection following harvest has allowed WDFW to begin using a point system that accounts for the demographic distinction between harvesting billies and nannies.
Literature Cited Rice, C.G., K. J. Jenkins, and W.Y. Chang. 2009. A sightability model for mountain goats. Journal
of Wildlife Management 73(3):468–478. Table 1. Harvest and Surveys for Bumping River (Mountain goat Unit 3-7) 2007 to present.
Harvest Information
Survey Data (for 2009 and later, figures represent
points estimates from sightability-corrected model; Rice et al. 2009)
Year
Permits Hunters Harvest (of which, females in
parentheses)
Kids Older than kids
Total K:100
2007 2 2 1 9 40 71a 22
2008 2 3* 3* 15 53 68 28
2009 2 2 2 17 46 63 27
2010 1 1 1
2011 1 1 1 28 75 103 37
2012 1 1 1 39 103 142 38
2013 1 1 1 (0) 43 108 151 39
2014 2 2 1 (0) No Survey
2015 3 3 3 (1) 44 101 147 a 44 2016 3 3 3 (0) No Survey
2017 3 3 3 (1) No Survey
2018 3 33 94 127 36
* Includes auction/raffle a Includes unclassified/yearling
193

Mountain Goat Status and Trend Report 2018
Table 2. Harvest and surveys for Naches/Corral Pass (Mountain goat Unit 3-6 and 4-38) 2007 to Present.
Harvest Information
Survey Data (for 2009 and later, figures represent points estimates from sightability-corrected model; Rice et al. 2009)
Year
Permits Hunters Harvest (of which, females in
parentheses)
Kids Older than kids
Total K:100
2007 2 1 1 25 67 107 37
2008 2 3* 3* 37 79 116 47
2009 1 1 1 41 106 147 39
2010 1 1 1 29 74 103 39
2011 1 1 1 37 96 133 38
2012 1 1 1 34 112 147 32
2013 1 1 1 (0) 45 104 169a 43
2014 2 2 1 (0) No Survey
2015 3 3 3 (0) 61 125 193 a 49
2016 3 4* 4 (3)* No Survey
2017 3 0 0 No Survey
2018 4 17 115 132 15
* Includes auction/raffle/tribal a Includes unclassified
Table 3. Harvest and surveys for Blazed Ridge (Mountain goat Unit 3-10) 2007 to Present.
Harvest Information
Survey Data (for 2009 and later, figures represent points estimates from sightability-corrected model; Rice et al. 2009)
Year
Permits Hunters Harvest (of which, females in
parentheses)
Kids Older than kids
Total K:100
2007 2 1 1 22 56 78 39
2008 2 2 1 22 50 72 44
2009 1 1 0 15 52 67 22
2010 1 1 1
2011 1 1 1 14 32 46 44
2012 1 1 1 26 78 104 33
2013 1 1 1 (0) 14 53 67 27
2014 1 1 1 (0) No Survey
2015 0 n/a n/a 19 80 102 24
2016 0 0 0 No Survey
2017 0 1* 1 22 78 100 28
* Includes auction/raffle a Probable double count of ~15 animals
194

Mountain Goat Status and Trend Report 2018
Mountain Goat Status and Trend Report: Region 4 Mt. Baker and Boulder River North Areas ROBERT WADDELL, Wildlife Biologist RUTH MILNER, Wildlife Biologist
Management Guidelines and Objectives The management objective for mountain goat units in northern Region 4 is to maintain stable populations in all units for public viewing and harvest opportunities. Specific guidelines for managing harvest within sustainable limits are discussed in WDFW’s Game Management Plan (2014). The harvest guidelines are to limit harvest to 4% or less of the total estimated population (excluding kids), only allow harvest in goat populations meeting or exceeding 100 total animals, and limit nanny harvest to 30%. After being closed for many years, the Mt. Baker area was reopened on a limited basis for mountain goat hunting in 2007. As surveys suggested increasing populations (see previous Status and Trend reports), hunting opportunity was gradually increased (Table 1). Beginning in 2012, mountain goat surveys in the Boulder River Wilderness Area suggested greater abundance than had been seen in the early 2000s. In 2014, mountain goats in this area were documented as having met the requirements set forward in the Game Management Plan (WDFW 2014), and a hunting season was initiated in the Boulder River North Goat Hunt Unit beginning in the 2015 hunting season. A single permit is allocated to State hunters in this unit. Population Surveys Population surveys were not conducted by WDFW in the Boulder River Wilderness prior to 2012, due to low population numbers in earlier years and the fact that all units within the Darrington Ranger District of the Mount Baker Snoqualmie National Forest were closed to hunting in 1995. WDFW reinitiated surveys in this area in 2012 (Figure 1). Beginning in 2014, WDFW went to a system of biennial surveys; thus mountain goats were not surveyed by WDFW at Boulder River (Figure 1) or at Mt. Baker (Figure 2) in 2015 or 2017. In 2016, WDFW surveys estimated a total of 159 goats (95% CI = 146–172; Figure 1)in the Boulder River North Hunt Unit area and a total of 392 goats (95% CI = 372–412; Figure 2) in the Mt. Baker area. Surveys conducted during 2017 in the Mt. Baker area by the Swinomish and Upper Skagit Tribes estimated a total of 282 goats (90% CI = 268–302; Figure 2). Due to inconsistent classification of adults and yearlings in previous surveys, individual goats will be classified as either an adult or a kid beginning with surveys in 2019.
195

Mountain Goat Status and Trend Report 2018
0
20
40
60
80
100
120
140
160
180
200
2012 2013 2014 2016
# of
Indi
vidu
als
Year
Boulder River North Hunt Unit Goat Population Estimates (2012-2016)
Kids
Yearlings
Adults
0
50
100
150
200
250
300
350
400
450
2012 2013 2014 2015 2016 2017
# of
Indi
vidu
als
* Includes Black Buttes, Chowder Ridge, Coleman Pinnacle, Heliotrope, Lava Divide, and Sholes Glacier survey blocks only
Mount Baker* Goat Population Estimates (2012-2017)
Kids
Yearlings
Adults
Figure 1. Results from WDFW mountain goat aerial surveys in the Boulder River North Hunt Unit from 2012-2016.
Figure 2. Population estimates from WDFW and Tribal mountain goat aerial surveys in the Mt. Baker Area from 2012–2017.
196

Mountain Goat Status and Trend Report 2018
Table 1. Hunting permits, hunters, harvest, hunter success rates, and total days hunted, Mt. Baker and Boulder River North mountain goat hunt units, 2009-2017.
Hunt Unit Year Permits Hunters Harvest Success (%) Days hunted
Chowder Ridge
2009 1 1 1 100 2
2010 1 1 1 100 3
2011 1 1 1 100 5
2012 2 2 2 100 N/A
2013 1 1 1 100 0
2014 2 2 2 100 5
2015 1 1 1 100 23
2016 1 1 0 0 3
2017 1 1 1 100 1
Lincoln Peak
2009 1 1 1 100 8
2010 2 2 2 100 5
2011 2 2 2 100 19
2012 1 1 0 0 0
2013 1 0 0 0 0
2014 1 1 1 100 4
2015 2 2 2 100 33
2016 2 2 1 50 3
2017 2 2 2 100 6
Avalanche Gorge
2009 1 1 1 100 1
2010 1 1 1 100 4
2011 1 0 0 0 0
2012 0 - - - -
2013 2 2 1 50 14
2014 2 2 2 100 17
2015 3 5* 3 75 91
2016 3 3 2 50 15
2017 3 3 2 67 18
Boulder River North
2015 1 1 1 100 8
2016 1 1 1 100 2
2017 1 1 1 100 2
197

Mountain Goat Status and Trend Report 2018
Survival and Mortality Historically, the majority of historical information regarding goat numbers and distribution has been derived from harvest report cards and questionnaires returned by permitted hunters. Historically, goat management units 4-2, 4-3, 4-4 and 4-5 collectively encompassed the Mt. Baker range in Whatcom and Skagit Counties. Harvest in these units during the period 1969-85 totaled 121 animals with an average harvest of 13 goats per season. For the period 1986-95, harvest totaled 26 animals with a 6 goat per season average. By 1996, all of the Mt. Baker GMUs were closed to hunting due to declines in harvest and goats reported by permit hunters. In 2007, Mount Baker units 4-3 (Chowder Ridge) and 4-7 (Avalanche Gorge) were reopened with one permit issued per unit. The Mt. baker area now includes units 4-3, 4-7, and 4-4 (Lincoln Peak), with a conservative approach limiting the annual allocation of permits in 2017 to 6 permits. Within the Boulder River North hunting unit, the population appears stable, with the estimated population (not including kids) exceeding 100 animals in all years post 2012 (Figure 1).
Habitat The Mount Baker area mountain goat population has rebounded substantially since the low abundances in the 1980s and 1990s. It is currently unclear whether the increasing trend seen over the past few years can be sustained, or alternatively, if the population is reaching the capacity of the area to maintain goats. Conservative hunting, which was reestablished in 2007, appears to be having negligible effects on population size, age/sex structure, and population trend.
The majority of goats in the Mount Baker area are within the Mount Baker Wilderness area on the Mount Baker-Snoqualmie National Forest and the adjacent North Cascades National Park. Federal land management restrictions are protective of habitat qualities critical for the maintenance of a robust mountain goat population. However, this area has seen an increase of recreational uses including hiking, backcountry skiing, and snowmobiling. Discussions on goat management between WDFW and the Tribes are ongoing and remain a high priority.
The Boulder River North unit lies within the Boulder River Wilderness managed by the Darrington District of the Mount Baker/Snoqualmie National Forest. This area is seeing a population rebound similar to the increases seen on Mount Baker, suggesting that habitat quality in this area of the North Cascades is sufficient for mountain goats.
Literature Cited Rice, C.G., K.J. Jenkins, and W. Chang 2009. A sightability model for mountain goats. Journal of
Wildlife Management 73(3): 468-478. Washington Department of Wildlife. 2014. 2015-2021 Game Management Plan. Washington
Department of Fish and Wildlife. Olympia, WA.
198

Mountain Goat Status and Trend Report 2018
Mountain Goat Status and Trend Report: Region 5 Goat Rocks, Smith Creek, Mt. St. Helens STEFANIE BERGH, Wildlife Biologist Introduction Region 5 of the Washington Department of Fish and Wildlife (WDFW) contains multiple areas inhabited by mountain goats. Three mountain goat population management units have been monitored aerially in recent years; Smith Creek (Goat Unit 5-3), Goat Rocks/Tieton River (Goat Unit 5-4/3-9), and the Mt. St. Helens National Volcanic Monument (Goat Units 5-6 and 5-7). The Goat Rocks/Tieton River Unit has historically contained one of the largest goat populations of any goat unit in the state of Washington (Rice 2012). For several years, a cooperative ground based survey for mountain goats has been conducted in the Mt. St. Helens National Volcanic Monument and the first aerial survey was done in 2017. Several other areas within Region 5 support mountain goats including the Mt. Adams and Dark Divide Wilderness and the Tatoosh Mountains. Individual and small groups of mountain goats are reported throughout the southern Cascades region. Management Guidelines and Objectives WDFW’s mountain goat management objectives are to manage mountain goats and their habitat to maintain or expand current population levels. In addition, mountain goats are to be managed for recreational, educational, and aesthetic purposes. Recreational management is to be consistent with a stable or increasing population. Population Surveys In 2017, the Goat Rocks/Tieton River Unit was surveyed aerially, yielding 244 animals observed (Table 1) and a sightability-corrected population estimate of 254 (90% confidence interval 243-264; Table 2). The sightability-corrected population of adult mountain goats in that unit was estimated at 213 (90% confidence interval: 204-222). The Smith Creek Unit was also surveyed from the air in 2017, yielding a sightability corrected estimate of 14 goats (90% confidence interval: 9-18; Table 2). In 2017, the first ever aerial survey of the Mt. St. Helens and Mt. Margaret Backcounty was conducted. A total of 223 goats were observed during the flight, which resulted in a sightability corrected estimate of 246 goats (90% confidence interval: 232-260; Table 2). The sightability corrected population of adult mountain goats in that unit was estimated at 188 (90% confidence interval: 178-199). All aerial surveys were conducted using the sightability method developed by WDFW (Rice et al. 2009).
199

Mountain Goat Status and Trend Report 2018
Table 1: Raw Survey Data from Mountain Goat Flights - Region 5 (2005-2017) Goat Unit Year Adult Kid Unknown Total Kid:Adult
Goat Rocks/Tieton River 2017 204 40 0 244 20:100 2015 224 86 0 310 38:100 2014 No Survey in 2014 2013 236 72 0 308 30:100 2012 168 33 0 231 23:100 2011 222 31 0 253 15:100 2010 195 36 0 231 20:100 2009 203 73 0 276 43:100 2008 201 60 7 268 34:100 2007 No Survey in 2007 2006 217 71 0 290 35:100 2005 235 66 0 303 35:100
Smith Creek 2017 10 2 0 12 22:100 2014 No Survey in 2014 2013 No Survey in 2013 2012 36 14 0 50 44:100 2011 No Survey in 2011 2010 34 8 0 42 29:100 2009 No Survey in 2009
2008 11 4 2 17 44:100 2007 28 6 0 34 21:100 2006 22 5 0 27 31:100 2005 21 11 0 32 73:100 Mt. St. Helens/Mt. Margaret 2017 169 54 0 223 32:100
200

Mountain Goat Status and Trend Report 2018
Table 2: Sightability Corrected Mountain Goat Survey Results – Region 5 (2005-2017) Goat Unit Year Population Estimate (90% CI)
Goat Rocks/Tieton River 2017 254 (243-264) 2015 325 (309-341) 2013 232 (307-338) 2012 246 (232-261) 2011 259 (250-268) 2010 224 (213-236) 2009 285 (274-297) 2008 282 (No CI) 2006 308 (291-326) 2005 341 (322-359)
Smith Creek 2017 14 (9-18) 2012 64 (48-79) 2010 41 (33-49) 2008 32 (No CI)
Mt. St. Helens/Mt. Margaret 2017 246 (232-260) Mountain goats were formally surveyed on Mt. St. Helens and the associated Mt. Margaret Backcountry in August of 2014, 2015, 2016, and 2017. The ground-based effort involved simultaneous survey and documentation of all goat groups by multiple teams of observers at pre-arranged stations. The 2014 and 2015 surveys of Mt. St. Helens and in the Mt. Margaret Backcountry yielded a minimum goat population of 63 and 150, respectively. In 2016, despite fog and low clouds impacting visibility, the survey yielded a minimum goat population of 151. In 2017, the survey was conducted the day before the aerial survey and a minimum of 162 mountain goats were counted. The project is a cooperative effort among WDFW, the U.S. Forest Service, the Cowlitz Tribe of Indians, and volunteers associated with the Mt. St. Helens Institute. Additional surveys are planned for the Mt. St. Helens area in the future as methodology and logistics are refined. A summary of aerial and ground surveys of Region 5 mountain goats over the past 10 years indicates a stable population in the Goat Rocks, an increasing population in the Mt. St. Helens area, and possible decline in the Smith Creek area (Figure 1).
201

Mountain Goat Status and Trend Report 2018
Figure 1. Estimated Region 5 Mountain Goat Populations No additional mountain goat areas in Region 5 were surveyed during 2017 due to a lack of funding and because hunting permits are not currently offered for these smaller populations. Unsurveyed areas populated with mountain goats in Region 5 include the Tatoosh Mountains, Dark Divide, and areas between Indian Heaven Wilderness and Mt. Adams. Finally, individual and small groups of mountain goats are commonly observed throughout the southern Cascades in Region 5. Sightability corrected aerial surveys conducted over the past several years suggest stability in the Goat Rocks population and a possible decline in the Smith Creek goat population. Aerial surveys conducted in the mid-2000s by WDFW indicate that mountain goat populations in the Tatoosh unit have declined. The back to back ground and aerial surveys of the Mt. St. Helens population indicates that the ground survey is greatly underestimating the total population. The ground survey provided critical information on an increasing goat population as well its distribution providing impetus and direction for an aerial survey. Hunting Seasons and Recreational Harvest Hunting opportunity for mountain goats in Washington is allowed only to those selected in the Special Permit Drawing. Those fortunate enough to draw a mountain goat tag may hunt only within a specified goat unit. During 2017 hunters were allowed to hunt only with archery equipment from September 1-14 and were allowed to use any legal weapon from September 15 through November 30. The bag limit is one goat of either sex, with horns longer than 4 inches, although hunters are encouraged to refrain from shooting nannies. Beginning in 2018, hunters who draw a permit will be required to successfully complete an online mountain goat gender identification training administered by WDFW. Tag allocation for each unit is conservative in
202

Mountain Goat Status and Trend Report 2018
nature; with dual goals of providing a high-quality hunt for those successful in the permit draw and having little or no effect on the goat population. Mountain goat studies completed by WDFW have led to a new population guideline to direct harvest management (WDFW 2015). A goat unit must have an estimated population of 100 or more to allow harvest. Furthermore, harvest levels are designed to remove 4% or less of the adult (i.e., older than kid) population (WDFW 2015). Within Region 5, only the Goat Rocks/Tieton River Unit and the Mt. St. Helens area consist of populations large enough to support hunting under this guideline. Since the 2017 aerial survey in the Mt. St. Helens and Mt. Margaret Backcountry indicated a goat population much greater than 100 individuals, a proposal for two new goat units (Mt. St. Helens South and Mt. Margaret Backcountry) with one goat tag each was sent to and approved by the WDFW Commission for the 2018 season. Surveys of other areas supporting goats will be conducted periodically. Should populations surpass 100 individuals in these areas, hunts could be considered. Five tags were offered in the Goat Rocks/Tieton River Goat Unit during 2017. Four of the permit holders reported killing a billy while one reported killing a nanny (Table 3). Information on harvest by Tribal hunters during 2017 indicated the harvest of one male and one female goat from the Goat Rocks population (NWIFC 2017). Neither the auction nor the raffle goat permits were used in the Goat Rocks/Tieton River Unit in 2017. A proposal to divide the Goat Rocks/Tieton River Unit into two separate units (Goat Rocks West and Goat Rocks East) was sent to and approved by the WDFW Commission for the 2018 season. The purpose of this division is for better spatial distribution of harvest within the Goat Rocks area so that the majority of the harvest and hunting pressure are not concentrated in one small area.
Table 3: Hunter Survey Summary Goat Rocks (2008-2017) Year WDFW
Permits Issued
WDFW Permit Harvest
Tribal Harvest*
Total Harvest
Total Billies
Harvested
Total Nannies
Harvested 2017 5 5 2 7 5 2 2016 5 5 3 8 5 3 2015 5 4 1 5 4 1 2014 3 3 1 4 4 0 2013 3 3 1 4 3 1 2012 3 3 1 4 4 0 2011 3 4 0 4 4 0 2010 5 4 2 6 4 2 2009 5 5 0 5 5 0 2008 5 5 0 5 5 0
Note: Harvest exceeded permit numbers in 2011 due to hunting by Auction and Raffle Permit holders. *As reported by the Northwest Indian Fisheries Commission
Habitat High elevation openings characteristic of goat habitat are being lost in the Smith Creek Unit due to conifer encroachment. Alpine meadows are critical mountain goat foraging areas. Given the limited extent of suitable goat habitat in the Smith Creek Unit, the loss of habitat represents a threat
203

Mountain Goat Status and Trend Report 2018
to the sustained viability of this goat population. Results of the cooperative Cispus Adaptive Management Area (AMA) project indicate that in the four study areas (Stonewall Ridge, South Point Ridge, Smith Ridge, and Castle Butte) a total of 404 acres of alpine meadow were lost in the period spanning 1959- 1990 (Kogut 1996). High alpine meadows are thought to be primarily created through disturbance such as avalanche, disease, wind-throw, and fire (Hemstrom 1979). Periodic fire is considered to be one of the most important factors in the creation and maintenance of alpine meadow (Olmsted 1979). U.S. Forest Service policy currently dictates the suppression of both man-made and naturally occurring fires. This policy has probably resulted in the losses of alpine meadow documented in the above study. In the years since the completion of this study, the loss of meadow has likely continued. Thus, the need for restoration and preservation of these areas is paramount to continued healthy goat populations. Budgetary, logistical, safety, and other constraints in both the USFS and WDFW make the possibility of a prescribed burn program in the foreseeable future unlikely. However, naturally occurring high-elevation fires have occurred recently in areas associated with Mt. Adams and could occur elsewhere. Another possible avenue to address conifer encroachment is through the use of girdling and snag creation. Management Concerns Disease testing on a limited number of samples collected by hunters in 2015 revealed evidence that 1 of 19 mountain goats tested may have been exposed to the bacterium Mycoplasma ovipneumoniae (M. ovi), which is associated with pneumonia outbreaks in bighorn sheep. This serological sample was collected from a goat harvested in the Goat Rocks. In 2017, all hunter harvested goats were sampled and all were negative for M. ovi. In 2016 both volunteers and WDFW staff conducted visual observations of goats in the Goat Rocks. The purpose of these surveys was to 1) observe goats for any signs of respiratory disease, and 2) count goats, including kids, for evidence of any unusually high levels of early mortality that might be evidence of pneumonia infection. During the surveys no mountain goat carcasses were found, nor were goats with signs of lethargy, coughing, head shaking, or other indications of respiratory disease observed. Observations made by WDFW staff observed kid:nanny ratios of approximately 0.38. Pneumonia due to M. ovi is believed to be the cause of a decline in at least one mountain goat population in Nevada. The significance of the positive M. ovi-antibody test result from a single mountain goat in Washington is not known at this time. Nonetheless, WDFW will continue disease monitoring efforts in the Goat Rocks population via samples collected by hunters and opportunistic sampling, and will continue to collaborate with veterinary researchers at Washington State University to better understand the health of mountain goats in Washington.
Management Conclusions Mountain goats in Region 5 are valued for both viewing and hunting opportunities. Additionally, the goats are of particular cultural value to the native peoples of southwest Washington. Consequently, harvest quotas are kept at conservative levels to maximize both the consumptive and non-consumptive recreational attributes of these populations. Management direction dictates that two of the traditionally hunted units in Region 5 (Smith Creek and Tatoosh) remain closed until populations increase. The increase in the goat population around Mt. St. Helens has been a benefit to viewing opportunities at the popular Mt. St. Helens National Volcanic Monument visitors centers and trails. Now, with a population nearly as large as Goat Rocks, hunting opportunities are available as well.
204

Mountain Goat Status and Trend Report 2018
Raffle and auction permit holders sometimes select the Goat Rocks unit as it has one of the highest numbers of goats and has a long history of successful goat hunting. As such, harvest by raffle and auction permit holders must be factored into and considered when setting the permit level for Goat Rocks. A proposed system of multi-year quotas for each sex may address this issue and is prescribed for development in the most recent Game Management Plan (WDFW 2015). The continuation of biennial aerial surveys is needed to document trends in population and productivity. In most cases, sightability-adjusted aerial surveys provide the least biased and most efficient method of population estimation, particularly considering the large expanse of area involved. However, the ground-based survey of goats associated with Mt. St. Helens and the Mt. Margaret Backcountry shows promise to become a useful and more cost effective method in those locations. Based upon the results of the cooperative Cispus AMA study, alpine meadow restoration in the Smith Creek Unit is recommended. Fire management in potential goat habitat will also play an important role in the expansion of goat populations outside of the Goat Rocks. Literature Cited Hemstrom, M. A. 1979. A recent disturbance history of the forest ecosystems of Mount Rainier
National Park. Ph. D. Thesis, Oregon State University, Corvallis, OR. 67 p. Kogut, T. 1996. Trends in Natural Meadows within Mountain Goat Habitat, Cispus Adaptive
Management Area. USFS Gifford Pinchot Nat. For. Unpublished Report. 9 p. Northwest Indian Fisheries Commission. 2017. Big Game Harvest Report Western
Washington Treaty Tribes. Olmsted, J. 1979. Mountain goat winter habitat study. Job completion report, W_88 R_3. Wash.
Dept. Of Game, Olympia WA. 50 p. Rice, C., K. J. Jenkins and W-Y. Chang. 2009. A Sightability Model for Mountain Goats. Journal
of Wildlife Management. 73 (3): 468-478. Rice, C. 2012. Status of mountain goats in Washington. Northern Wild Sheep and Goat Council
18: 64-70. Washington Department of Wildlife. 2014. 2015-2021 Game Management Plan. Washington
Department of Fish and Wildlife. Olympia, WA.
205

Mountain Goat Status and Trend Report 2018
Mountain Goat Status and Trend Report: Region 4 Mt. Baker and Boulder River North Areas ROBERT WADDELL, Wildlife Biologist RUTH MILNER, Wildlife Biologist
Management Guidelines and Objectives The management objective for mountain goat units in northern Region 4 is to maintain stable populations in all units for public viewing and harvest opportunities. Specific guidelines for managing harvest within sustainable limits are discussed in WDFW’s Game Management Plan (2014). The harvest guidelines are to limit harvest to 4% or less of the total estimated population (excluding kids), only allow harvest in goat populations meeting or exceeding 100 total animals, and limit nanny harvest to 30%. After being closed for many years, the Mt. Baker area was reopened on a limited basis for mountain goat hunting in 2007. As surveys suggested increasing populations (see previous Status and Trend reports), hunting opportunity was gradually increased (Table 1). Beginning in 2012, mountain goat surveys in the Boulder River Wilderness Area suggested greater abundance than had been seen in the early 2000s. In 2014, mountain goats in this area were documented as having met the requirements set forward in the Game Management Plan (WDFW 2014), and a hunting season was initiated in the Boulder River North Goat Hunt Unit beginning in the 2015 hunting season. A single permit is allocated to State hunters in this unit. Population Surveys Population surveys were not conducted by WDFW in the Boulder River Wilderness prior to 2012, due to low population numbers in earlier years and the fact that all units within the Darrington Ranger District of the Mount Baker Snoqualmie National Forest were closed to hunting in 1995. WDFW reinitiated surveys in this area in 2012 (Figure 1). Beginning in 2014, WDFW went to a system of biennial surveys; thus mountain goats were not surveyed by WDFW at Boulder River (Figure 1) or at Mt. Baker (Figure 2) in 2015 or 2017. In 2016, WDFW surveys estimated a total of 159 goats (95% CI = 146–172; Figure 1)in the Boulder River North Hunt Unit area and a total of 392 goats (95% CI = 372–412; Figure 2) in the Mt. Baker area. Surveys conducted during 2017 in the Mt. Baker area by the Swinomish and Upper Skagit Tribes estimated a total of 282 goats (90% CI = 268–302; Figure 2). Due to inconsistent classification of adults and yearlings in previous surveys, individual goats will be classified as either an adult or a kid beginning with surveys in 2019.
206

Mountain Goat Status and Trend Report 2018
0
20
40
60
80
100
120
140
160
180
200
2012 2013 2014 2016
# of
Indi
vidu
als
Year
Boulder River North Hunt Unit Goat Population Estimates (2012-2016)
Kids
Yearlings
Adults
0
50
100
150
200
250
300
350
400
450
2012 2013 2014 2015 2016 2017
# of
Indi
vidu
als
* Includes Black Buttes, Chowder Ridge, Coleman Pinnacle, Heliotrope, Lava Divide, and Sholes Glacier survey blocks only
Mount Baker* Goat Population Estimates (2012-2017)
Kids
Yearlings
Adults
Figure 1. Results from WDFW mountain goat aerial surveys in the Boulder River North Hunt Unit from 2012-2016.
Figure 2. Population estimates from WDFW and Tribal mountain goat aerial surveys in the Mt. Baker Area from 2012–2017.
207

Mountain Goat Status and Trend Report 2018
Table 1. Hunting permits, hunters, harvest, hunter success rates, and total days hunted, Mt. Baker and Boulder River North mountain goat hunt units, 2009-2017.
Hunt Unit Year Permits Hunters Harvest Success (%) Days hunted
Chowder Ridge
2009 1 1 1 100 2
2010 1 1 1 100 3
2011 1 1 1 100 5
2012 2 2 2 100 N/A
2013 1 1 1 100 0
2014 2 2 2 100 5
2015 1 1 1 100 23
2016 1 1 0 0 3
2017 1 1 1 100 1
Lincoln Peak
2009 1 1 1 100 8
2010 2 2 2 100 5
2011 2 2 2 100 19
2012 1 1 0 0 0
2013 1 0 0 0 0
2014 1 1 1 100 4
2015 2 2 2 100 33
2016 2 2 1 50 3
2017 2 2 2 100 6
Avalanche Gorge
2009 1 1 1 100 1
2010 1 1 1 100 4
2011 1 0 0 0 0
2012 0 - - - -
2013 2 2 1 50 14
2014 2 2 2 100 17
2015 3 5* 3 75 91
2016 3 3 2 50 15
2017 3 3 2 67 18
Boulder River North
2015 1 1 1 100 8
2016 1 1 1 100 2
2017 1 1 1 100 2
208

Mountain Goat Status and Trend Report 2018
Survival and Mortality Historically, the majority of historical information regarding goat numbers and distribution has been derived from harvest report cards and questionnaires returned by permitted hunters. Historically, goat management units 4-2, 4-3, 4-4 and 4-5 collectively encompassed the Mt. Baker range in Whatcom and Skagit Counties. Harvest in these units during the period 1969-85 totaled 121 animals with an average harvest of 13 goats per season. For the period 1986-95, harvest totaled 26 animals with a 6 goat per season average. By 1996, all of the Mt. Baker GMUs were closed to hunting due to declines in harvest and goats reported by permit hunters. In 2007, Mount Baker units 4-3 (Chowder Ridge) and 4-7 (Avalanche Gorge) were reopened with one permit issued per unit. The Mt. baker area now includes units 4-3, 4-7, and 4-4 (Lincoln Peak), with a conservative approach limiting the annual allocation of permits in 2017 to 6 permits. Within the Boulder River North hunting unit, the population appears stable, with the estimated population (not including kids) exceeding 100 animals in all years post 2012 (Figure 1).
Habitat The Mount Baker area mountain goat population has rebounded substantially since the low abundances in the 1980s and 1990s. It is currently unclear whether the increasing trend seen over the past few years can be sustained, or alternatively, if the population is reaching the capacity of the area to maintain goats. Conservative hunting, which was reestablished in 2007, appears to be having negligible effects on population size, age/sex structure, and population trend.
The majority of goats in the Mount Baker area are within the Mount Baker Wilderness area on the Mount Baker-Snoqualmie National Forest and the adjacent North Cascades National Park. Federal land management restrictions are protective of habitat qualities critical for the maintenance of a robust mountain goat population. However, this area has seen an increase of recreational uses including hiking, backcountry skiing, and snowmobiling. Discussions on goat management between WDFW and the Tribes are ongoing and remain a high priority.
The Boulder River North unit lies within the Boulder River Wilderness managed by the Darrington District of the Mount Baker/Snoqualmie National Forest. This area is seeing a population rebound similar to the increases seen on Mount Baker, suggesting that habitat quality in this area of the North Cascades is sufficient for mountain goats.
Literature Cited Rice, C.G., K.J. Jenkins, and W. Chang 2009. A sightability model for mountain goats. Journal of
Wildlife Management 73(3): 468-478. Washington Department of Wildlife. 2014. 2015-2021 Game Management Plan. Washington
Department of Fish and Wildlife. Olympia, WA.
209

210

Bighorn Sheep
211

Bighorn Sheep Status and Trend Report 2018
Bighorn Sheep Status and Trend Report
STATEWIDE RICHARD B. HARRIS, Special Species Section Manager Management Guidelines and Objectives In 2014, biologists managing bighorn sheep herds in Washington convened to reconsider herd-specific population objectives that had existed for years, been enshrined in previous Game Management Plans (WDFW 2008), but not recently subjected to updated, rigorous consideration. We referenced updated bighorn herd boundary maps (most created using telemetry data), as well as USFS bighorn habitat model maps. We used pre-disease die-off densities of bighorn sheep in the Blue Mountains as a reference for potential densities, but deviated from this to account for differences in habitat productivity and land-use. Rather than articulate a single objective for each herd, the consensus view was that it made more sense to delineate short-term objectives and long-term potential population sizes (both, expressed in terms of upper and lower bounds). Short-term objectives were considered to coincide with the operational 6-year Game Management Plan (WDFW 2014), and thus used the year 2021 as a target. These objectives were developed in light of most recently-estimated herd sizes, as well as constraints that are unlikely to be overcome before the year 2021 (e.g., presence of persistent pneumonia, long-owner tolerance). Long-term potential herd sizes were envisioned as reflecting the capability of the local habitat to support bighorns, independent of current population sizes, and assuming that existing impediments to population growth might, at some point, be removed. Both short-term objectives and long-term potentials are shown in Table 1. In some cases, short-term objectives coincide with long-term population potentials. Table 1. Herd-specific short-term objectives and long-term herd potentials, Washington bighorn sheep herds, as developed by district biologists in 2014. Shown are lower and upper bounds. No short-term objective was developed for the currently extirpated Tieton herd; ‘nd’ = not determined.
Herd Short-term objective Long-term potential
Hall Mountain 25-35 nd Vulcan 70-90 80-110 Lincoln Cliffs 100-120 180-220 Asotin 130-170 240-240 Black Butte 60-100 585-585 Wenaha/Mtn View 130-170 375-375 Tucannon 40-80 160-160 Mt. Hull 80-100 80-100 Sinlahekin 50-80 100-150 Chelan Butte 150-170 150-170 Manson 100-120 200-200 Swakane 130-170 150-180 Cleman Mountain 170-220 170-220 Quilomene 150-170 150-170 Umtanum/Selah Butte 250-300 300-350 Tieton - 200-250
212

Bighorn Sheep Status and Trend Report 2018
Harvest objectives for bighorn sheep are to maintain a harvest success that averages >85% over a 3-year period, while at the same time bighorn population size remains stable or increasing. Strategies and harvest thresholds to obtain these objectives are described in the WDFW’s Game Management Plan (2014).
Washington Department of Fish and Wildlife continues cooperative work with the Foundation for North American Wild Sheep, Idaho Department of Fish and Game, Oregon Department of Fish and Wildlife, U.S. Forest Service, and the Bureau of Land Management on restoration of bighorn sheep within Hells Canyon. Project activities included monitoring lamb production and mortality, sightability surveys, and disease investigations related to spillover of pathogens from domestic to bighorn sheep.
Population Surveys All bighorn sheep herds in Washington are surveyed annually. In 2016, both ground counts and aerial surveys were used to survey and classify sheep as lambs, ewes, or rams. In some herds, rams were further classified as yearling, less than 3/4 curl, or greater than 3/4 curl; in other herds, rams were classified according to the Class I-IV system. Surveys were conducted at differing times throughout the year, with a general pattern for most regions being to survey total herd composition in winter. Some herds were also surveyed post-lambing in early summer.
Hunting Seasons and Recreational Harvest Bighorn sheep hunting opportunity in Washington is limited to permit-only hunting. Permit availability, and therefore hunter opportunity, steadily increased in Washington until 2011, but has dropped since that time. (Figure 1). In 2017, 33 special season permits, 1 auction permit, and 4 raffle permit were available (including the potential from multi-species raffles) in 9 different sheep management units. Most 2017 bighorn sheep seasons were September 15 to October 10, (except 4 areas; either October 1-10 or November 3-30). Hunters had the choice of any legal weapon to harvest any bighorn ram (no curl restrictions), as well as ewe (in selected herds). In the Chelan Butte herd, selected hunters could also harvest only a juvenile ram. Of the 38 permits available in 2017 (including the auction and raffles), reports were received from 37 hunters, who reported killing 34 sheep (hunter success rate = 92%). Considering only ‘any ram’ draw permits, a total of 19 were available in 2017, of which 18 were reported harvested (one disabled hunter with a permit to take a juvenile ram did not report). Eleven ewes were taken from 14 available permits.
213

Bighorn Sheep Status and Trend Report 2018
0
5
10
15
20
25
30
35
40
45
50
1987
1989
1991
1993
1995
1997
1999
2001
2003
2005
2007
2009
2011
2013
2015
2017
Bigh
orn
harv
est a
nd p
erm
it le
vel
Year
TotalHarvestRamsharvestTotalPermitsRampermits
Figure 1. Regular draw permits (line) and harvest (bars) of all bighorn sheep in Washington, 1990-2015 (rams only indicated by triangle).
Survival and Mortality Survey results indicate bighorn populations are stable in most areas (see regional reports), with some populations having increased since the 1990s, but others declined. Notable exceptions are the Hall Mountain and Tucannon bighorn herds, which have remained small (and are not currently hunted). In recent years, there are suggestions that the Blue Mountain herds, most of which have recently experienced disease outbreaks, have increased. Two herds in the Yakima area (Region 3) have also recently experienced pneumonia-related die-offs: Umtanum/Selah in the Yakima Canyon (during winter 2009-10) and the Tieton Herd (in winter/spring 2013). The Cleman Mountain, Chelan Butte, and Swakane herds were evidently at record high numbers in 2015. The Cleman Mountain herd has remained approximately stable since that time; surveys of the Chelan Butte and Swakane herds have been incomplete, but there is no evidence to suggest appreciable changes since 2015. .
Rocky Mountain bighorns in the Blue Mountains continue to struggle as they recover from the 1995 pneumonia outbreak. Lamb mortality has remained high and ewe survival has declined in several herds; however, the total sheep population has remained fairly stable, with a sizable mature ram component.
214

Bighorn Sheep Status and Trend Report 2018
Mycoplasma ovipneumoniae induced pneumonia continues to plague 4 of the 5 Blue Mountain bighorn populations; Asotin, Black Butte, Wenaha, and Mountain View. The Tucannon herd has not experienced pneumonia caused mortality, but do carry scabies (Psoroptes ovis). Bighorn populations in the Blue Mountains have not recovered from the pneumonia die-off as quickly as some herds, possibly from re-infection from domestic sheep and goats that exist within the range of multiple herds. The presence of domestic sheep and goats within and adjacent to bighorn sheep range presents a constant and substantial risk of another major epizootic. WDFW actively works with landowners near bighorn sheep herds to make sure accurate information is available and options to minimize contact are made available. As of 2017, we have increasing optimism that the Asotin Herd may have cleared the bacteria responsible for pneumonia: researchers have been unable to document its presence, and lamb recruitment appears to have returned to normal levels. However, it will require a few more years before we can be confident of this. The Asotin herd has recently lost an excessive number of mature rams to treat-rights hunting.
Other government agencies have encouraged landowners to use domestic goats for weed control. This type of weed control program presents a substantial risk to bighorn sheep populations in southeast Washington. WDFW has recently completed a study of the motivations, knowledge, and attitudes of owners of small domestic sheep or goat flocks in the in the vicinity of bighorn herds in Chelan, Yakima, Kittitas, and Asotin counties. The results of this work appear in Heinse et al. (2016). Efforts to work with these small flock owners to reduce the risk of disease transmission are ongoing. WDFW has begun working with the Department of Corrections, Washington State University, and local sheep producers to begin a pilot project of raising domestic sheep free of M. ovipneumoniae. We hope ultimately to provide for owners of small herds near susceptible bighorn herds a source of sheep free of this particular pathogen, thus reducing the risk to bighorns.
‘California’ bighorn populations remained stable in most herds (see individual herd reports). In December 2009, an outbreak of pneumonia was discovered at the north end of Umtanum. M. ovipneumoniae was documented in the Umtanum/Selah Butte herd. Forty-four sheep are known to have died from December 2009-May 2010. Forty-two were found in the north portion of Umtanum and only 2 at the south end. No natural mortalities were found east of the river in Selah Butte. Recognizing the long-term effects of this disease in bighorn sheep, the Department initiated a culling action of bighorns with clinical signs of pneumonia in the Umtanum herd. Sixty-nine sheep were culled from the herd in an attempt to slow the spread of the disease, increase subsequent lamb recruitment, and better understand the disease distribution. All animals culled from west of the river tested positive for some degree of pneumonia or presence of M. ovipneumoniae. East of the river, there did not appear to be significant signs of disease, but M. ovipneumoniae could not be ruled out in a few individuals. By August 2010, lamb survival was very low on both sides of the river. Observations of coughing sheep and samples from hunter harvested rams in September confirmed that the disease had spread to Selah Butte. Two of 4 sheep sampled in Umtanum during September were clear of pneumonia, possibly because the disease outbreak was waning. No significant adult mortality has been observed on either side of the river since early 2010, and both lamb and adult survival was high in both 2011 and 2012. While there may have been some double counting of ewes and lambs during aerial surveys in 2012, the herd had, by 2012 recovered to within objectives. In early 2013, we captured and radio-collared 25 ewes and 5 rams from the Umtanum/Selah Butte herd, to monitor post-recovery lambing and survival. Although initial survival in summer 2013 was high, we documented poor survival in late summer, resulting in poor
215

Bighorn Sheep Status and Trend Report 2018
recruitment herd-wide during 2013, 2015, and 2015. Thus, it appears that the pneumonia has yet to completely clear from the Umtanum/Selah Butte herd (Bernatowicz et al. 2016). In early 2013, the Tieton herd became the latest casualty of pneumonia. We began documenting an unusual number of road-killed animals in late winter 2013. By late March, it was clear that a major die-off had been underway for some weeks, and we surveyed the herd using a helicopter. Where we’d estimated approximately 150 sheep in this population in late 2011 (and as many as 200 or so earlier), we were able to account for only 35 live animals (with almost as many carcasses visible). Veterinary sampling confirmed that all animals had gross lesions consistent with pneumonia, and molecular testing confirmed the presence of M. ovipneumoniae in all animals. Because of the virulence of the disease (indicated by the rapid on-set and incidence of mortality), and the proximity to the uninfected Cleman Mountain herd, WDFW decided to remove all remaining animals in the Tieton Herd. As of late mid-September 2013, the combination of agency, USDA Wildlife Services, and independent contractors had removed all but 3 animals, and indications were that these had either died or dispersed far from the Tieton area (Bernatowicz et al. 2016). Also in early 2013, the Sinlahekin herd experienced either a dramatic die-off, or an unexpected and unexplained range shift. From an estimated 90-95 animals in 2011 (from a count of 82), we were able to document only 26 animals during repeated counts in 2013. This herd had earlier been documented to have contracted scabies from the mite Psoroptes ovis, but large-scale mortality from this mange mite is usually considered rare. In early February 2014, we captured and tested 11 animals from the Sinlahekin herd; none tested positive for active infection or antibodies to Mycoplasma ovipneumoniae. These animals were also outfitted with GPS radio-collars, and their status will be monitored. The Sinlahekin herd has evidently begun to bounce back, as recent counts have been closer to the recent peak observed in 2011. In 2014, WDFW obtained 2 young rams belong to the Lookout herd in Oregon from the Oregon Department of Fish and Wildlife, both of which were placed in the Tucannon Herd, to increase genetic diversity. In January 2016, we moved an additional 7 adult ewes from the Lookout Herd to the Tucannon Herd. In March 2016, with the cooperation of the U.S. Fish and Wildlife Service and the Kalispel Tribe, WDFW obtained 21 short-yearling bighorn sheep from the National Bison Range (NBR) in western Montana. The NBR herd had grown to record size, and the USFWS was considering euthanizing most of these animals. After confirming that none of the 21 were infected or had been exposed to M. ovipneumoniae, we brought 11 animals to the Tucannon Herd, and 10 to the Hall Mountain Herd.
Habitat Range conditions for bighorn sheep varied from poor to excellent. Recent fires in the vicinity of the Mt. Hull, Tucannon, Swakane, Manson, Umtanum, and Lake Chelan herds have rejuvenated vegetation and reduced conifer encroachment, improving habitat conditions generally for bighorns. Conversely, noxious weed invasion, primarily yellow-star thistle, continued to be a major concern for many bighorn sheep ranges (particularly in the Blue Mountains). Grazing also is a concern in several areas of the Blue Mountains and Yakima River basin.
216

Bighorn Sheep Status and Trend Report 2018
Management Conclusions Bighorn sheep management in Washington centers on four main issues at this time: 1) minimizing the probability of new disease outbreaks, 2) helping herds infected with pneumonia-causing bacteria cope with, and ultimately recover from, persistent disease; 3) recovering depleted herds via augmentation; and 4) maintaining, and where possible increasing, habitat quantity and quality. WDFW continues to consider the possibility of establishing new self-sustaining herds in the few remaining areas of unoccupied habitat where land ownership might allow it, but implementation is currently a lower priority than maintaining existing herds.
Disease outbreaks associated with domestic-bighorn interactions is the primary concern for several herds. Disease has decimated or threatens at least 7 bighorn sheep herds at present. For those herds, eliminating the risk of disease transmission between domestic and bighorn sheep is the priority.
Noxious weed control is important for maintaining quality forage habitat for sheep and aggressive programs aimed at eliminating invading species and restoring native grasses are essential. Noxious weed control can be accomplished only in conjunction with better overall range grazing practices. Where the potential exists for conflicts between bighorn sheep and domestic sheep, particularly on federal lands, we should seek cooperative agreements that place a priority on the restoration of native species (i.e., bighorn sheep).
Literature Cited Bernatowicz, J., D. Bruning, E. F. Cassirer, R. B. Harris, K. Mansfield, and P. Wik. 2016.
Management responses to pneumonia outbreaks in 3 Washington State bighorn herds: lessons learned and questions yet unanswered. Biennial Symposium Northern Wild Sheep and Goat Council 20:38–61.
Heinse, L. M., L. M. Hardesty, and R. B. Harris. 2016. Risk of pathogen spillover from domestic
sheep and goat flocks on private land. Wildlife Society Bulletin 40:625–633. Washington Department of Fish and Wildlife. 2008. July 2009-June 2015 Game Management
Plan. Wildlife Program, WDFW, Olympia, Washington, USA.
Washington Department of Wildlife. 2014. 2015-2021 Game Management Plan. Washington Department of Fish and Wildlife. Olympia, WA.
217

Bighorn Sheep Status and Trend Report 2018
Bighorn Sheep Status and Trend Report: Region 1 Blue Mountains
PAUL WIK, Wildlife Biologist MARK VEKASY, Wildlife Biologist
Introduction Bighorn sheep (Ovis canadensis) were first restored in the Blue Mountains on the W.T. Wooten Wildlife Area (Tucannon River) during the early 1960s, and consisted of bighorns transplanted from the Sinlahekin Wildlife Area. Since that re-introduction, four additional herds of bighorn sheep have been established in the Blue Mountains; Asotin Creek, Black Butte, Mountain View (formerly known as the Cottonwood herd), and Wenaha.
The Hells Canyon Initiative (HCI) was established in 1996, with representatives from Washington Department of Fish & Wildlife, Idaho Department of Fish and Game, Oregon Department of Fish and Wildlife, U.S. Forest Service, Bureau of Land Management, and the Wild Sheep Foundation (formerly known as Foundation for North American Wild Sheep (FNAWS)). HCI coordinates disease research, develops population survey methodology, conducts transplants, coordinates intergovernmental management activities, and implements projects designed to improve bighorn sheep habitat. All five of southeast Washington’s bighorn sheep populations are included in the HCI; Black Butte, Mountain View, Wenaha, Tucannon, and Asotin Creek.
Management Guidelines and Objectives Population objectives for each herd are based on habitat conditions, habitat availability, and minimizing herd expansion into new habitats that may increase the risk of contact and disease transmission with domestic sheep or goats. In 2015, WDFW recognized the utility of differentiating short-term objectives from long-term objectives (http://wdfw.wa.gov/conservation/game/). Short-term objectives take 2014 population sizes as a starting point, account for existing constraints to population growth, and account for what can realistically be achieved within the 6-year planning horizon that WDFW uses (WDFW, 2014). Long-term objectives reflect the potential of habitat to support bighorns assuming that constraints such as disease and land-owner tolerance can be resolved. For the Tucannon herd, short-term objective was identified as being in the range 40-80, and the long-term potential was estimated to be approximately 160. For the Mountain View and Wenaha herds combined, short-term objective was bounded by 130-170, with the long-term potential estimated at 375. The short-term objective for the Asotin Creek herd was estimated at 120-130, whereas the potential of the area was estimated to be 240 animals. The short-term objective for the Black Butte herd were estimated to be 50-60 animals, and the long-term potential, reflecting the past abundance of this herd, was estimated to be 585. Thus, for the Blue Mountains herds in aggregate, the short-term objective is to have 340-440 animals; we estimate that ideally the area could ultimately support approximately 1,360 if disease and landowner tolerance issues were resolved.
218

Bighorn Sheep Status and Trend Report 2018
Population Surveys Aerial surveys have historically been conducted in February and March using a sightability model developed through the Hells Canyon Initiative. These surveys are conducted to determine population estimates, trend, and herd composition at the low point of the annual population cycle. Radio telemetry locations are obtained frequently throughout the year from the ground and/or aircraft, supplementing the helicopter surveys.
Aerial surveys have not been conducted since 2015 because ground counts have proven adequate for estimating population parameters. Ground counts were obtained for the five herds during March and April of 2018. The minimum population estimate for 2018 (for all herds aggregated) was 330 (172 ewes, 67 lambs, 92 rams, i.e., ratios of 53 (90% CI: 30-48) rams and 39 (90% CI: 30-48) lambs (just prior to them becoming yearlings) per 100 ewes (Table 1) . A population estimate using the sightability correction has not been developed for 2018 at this time, but we estimate that there were approximately 330-350 bighorns in the 5 herds, of which a number inhabit Oregon throughout the year. Lamb recruitment during the 2017-2018 biological year was the highest recorded since the 1996-1997 die-off.
Hunting Seasons and Recreational Harvest Recreational hunting opportunity was limited to one raffle permit in 2017. Poor recruitment, research removals, past harvest, and tribal harvest limited the available opportunity. One ram was harvested from the Mountain View herd during 2017. Efforts are being made to work with local tribes with treaty rights to limit the current harvest to allow for recovery of the male segment of the population.
Survival and Mortality Survival analysis has not been completed at this time for the 2017-2018 biological year. The Hells Canyon Restoration Committee will produce an annual report during the fall of 2018 that captures this information.
Habitat Habitat conditions are moderate to good in most areas. However, the spread of noxious weeds, mostly yellow star-thistle (Centaurea solstitialis), thistle (Cirsium spp.), and rush skeleton weed (Chondrilla juncea) are threatening ranges in the Blue Mountains. Although the School Fire (2005) had immediate negative effects on the Tucannon bighorn sheep population (direct mortality), it appears that the range has recovered. Noxious weeds are not dominating the landscape in the core bighorn range and the grasses and forbs appear to be healthy. During the summer of 2015, the Grizzly Complex wildfire burned a large portion of the Wenaha herd range. It is not yet clear what effect this may have on the habitat within this herd range.
Human-Wildlife Interaction Bronchopneumonia caused or facilitated by the bacteria Mycoplasma ovipneumoniae (M. ovi, hereafter) continues to affect 4 of the 5 Blue Mountain bighorn populations in Washington; Asotin, Black Butte, Wenaha, and Mountain View. Bighorn populations in the Hells Canyon area generally (which includes the Washington Blue Mountain herds, but also nearby herds in Oregon and Idaho) have not recovered from bronchopneumonia die-offs as quickly as some herds in other
219

Bighorn Sheep Status and Trend Report 2018
states, possibly because of reinfection from adjacent herds or from domestic sheep and goats that exist within the range of multiple herds. The presence of domestic sheep and goats within and adjacent to bighorn sheep range presents a constant and substantial risk of another major epizootic. WDFW actively works with landowners near bighorn sheep herds to insure accurate disease information is available to stock owners and options to minimize contact between domestics and wild sheep are made available.
Some land-management agencies have encouraged landowners to use domestic goats for weed control. This type of weed control program when used near the range of bighorn sheep presents a risk to bighorn sheep populations in southeast Washington. WDFW staff actively work to explain the risk of using domestic Caprinae species within the ranges of bighorn sheep.
Population Augmentation No population augmentations occurred during this reporting period. Research As part of the Hells Canyon Restoration committee, WDFW is actively participating in research on M. ovi-associated pneumonia in bighorn sheep (e.g., Bernatowicz et al. 2016, Manlove et al. 2014, Cassirer et al. 2017, 2018). For the past 4 years, WDFW and IDFG researchers have been capturing ewes and lambs in the Asotin, Black Butte, Mountain View, Wenaha, and herds in Oregon and Idaho to determine the bacterial shedding status of animals within those populations. Efforts have been made to remove the chronic shedders of M. ovi in the Asotin herd, ideally increasing the survival and recruitment of lambs in the future. Work in the Black Butte and Mountain View herds began in 2015 and will continue through the next few years. Additional information can be found at the 2016-17 Hells Canyon Initiative Annual Report.
Management Concerns Disease and harvest amongst the co-managers remain the biggest challenges for bighorn sheep in the Blue Mountains. A long-term solution to pneumonia spreading within and amongst herds of bighorns has eluded researchers and managers for many years. In the Blue Mountains, disease has been proven to be the limiting factor for population growth for more than 20 years. Co-managers will need to continue investing in this problem in order to eliminate future outbreaks and recover from existing exposures. Within the Washington Blue Mountains, 3 government entities have harvest rights to the bighorn sheep herds (WDFW, Confederated Tribes of the Umatilla Indian Reservation, and Nez Perce Tribe). These 3 entities have begun working toward common population goals and harvest regimes to maintain these goals. This will likely be a multi-year process, but coming to an equitable approach for all entities will be the ultimate goal. Management Conclusions Four of the five bighorn sheep herds in the Blue Mountains are struggling with M. ovi induced bronchopneumonia. The Black Butte, Wenaha, and Mountain View herds still experience periodic pneumonia outbreaks, which result in high lamb mortality and sporadic adult mortalities. It is unclear what path the Asotin herd will take with the recent disease infection and research action
220

Bighorn Sheep Status and Trend Report 2018
that occurred there, although the past 2 years show promise. The Tucannon herd has avoided contracting pneumonia causing bacteria, but suffered a major die-off after being infected with scabies in 1999. This herd has experienced high lamb mortality (not bronchopneumonia related) for the past 3 years. We suspect that predation on this small herd is limiting its recovery, and that it is unlikely to recover without continued management action.
Domestic sheep and goats continue to be a major threat for bighorn sheep in the Blue Mountains. Rural landowners continue to use domestic sheep and goats to control weeds, posing a severe threat to all herds in Hells Canyon. HCI research has shown that a large amount of inter-herd movement occurs (F. Cassirer, IDFG, pers. comm.). Numerous bighorn sheep have been removed, either lethally or transferred to captive research facilities, to minimize the possibility of transmitting diseases. In early 2008, District 3 wildlife management staff authored response guidelines to be implemented when bighorn sheep are located in “high risk” areas, or domestic sheep or goats are located within bighorn range. However, the general practice has been to lethally remove bighorns that move to the lower reaches of Asotin Creek if a captive facility does not have the ability to house the animal.
Literature Cited Bernatowicz, J., D. Bruning, E. F. Cassirer, R. B. Harris, K. Mansfield, and P. Wik. 2016.
Management responses to pneumonia outbreaks in 3 Washington State bighorn herds: lessons learned and questions yet unanswered. Biennial Symposium Northern Wild Sheep and Goat Council 20:38–61.
Cassirer, E. F., K. R. Manlove, R. K. Plowright, and T. E. Besser. 2017. Evidence for strain-
specific immunity to pneumonia in bighorn sheep. Journal of Wildlife Management 81: 133-143.
Cassirer, E. F., K. R. Manlove, E. S. Almberg, P. L. Kamath, M. Cox, P. Wolff, A. Roug, J.
Shannon, R. Robinson, R. B. Harris, B. J. Gonzales, R. K. Plowright, P. J. Hudson, P. C. Cross, A. Dobson, and T. E. Besser. 2018. Pneumonia in bighorn sheep: risk and resilience. Journal of Wildlife Management 82: 32-45.
Hells Canyon Initiative, Annual Report 2014-2015. 2015. Idaho Fish and Game, Lewiston, USA. Manlove, K.R., E. F. Cassirer, P. C. Cross R. K. Plowright, and P. J. Hudson. 2014 Costs and
benefits of group living with disease: a case study of pneumonia in bighorn lambs (Ovis canadensis). Proc. R. Soc. B 281: 20142331. http://dx.doi.org/10.1098/rspb.2014.2331
Washington Department of Fish and Wildlife. 2008. 2009-2015 Game Management Plan. Washington Department of Fish and Wildlife, Olympia, WA.
Washington Department of Wildlife). 2014. 2015-2021 Game Management Plan, Wildlife
Program. Washington Department of Fish and Wildlife, Olympia, WA.
221

Bighorn Sheep Status and Trend Report 2018
Ram Population
Year Lambs Ewes CI CII CIII CIIIB* CIV Total Total Lambs Rams2009 18 48 1 9 6 0 1 17 84 38 (20, 55) 35 (19, 52)2010 17 46 12 10 12 0 3 37 100 37 (20, 54) 80 (51, 110)2011 23 40 6 12 16 0 4 38 101 57 (33, 82) 95 (60, 130)2012 12 26 6 8 10 0 7 31 69 46 (20, 73) 119 (67, 171)2013 2 22 4 6 15 1 1 27 51 9 (0, 20) 122 (65, 180)2014 9 29 1 5 16 3 2 27 65 31 (12,50) 93 (52, 134)2015 13 25 1 1 12 4 0 18 56 52 (23, 81) 72 (30, 114)2016 16 32 0 3 11 0 0 24 72 53 (26, 80) 80 (44, 116)2017 15 40 3 19 74 37 (19,56) 47 (26, 69)2018 16 47 6 7 4 1 18 81 34 (18, 50) 38 ( 21, 56)
Table 2. Asotin herd 10-year survey history.
Ram Population
Year Lambs Ewes CI CII CIII CIIIB CIV Total Total Lambs Rams2009 0 25 1 10 7 2 1 21 47 0 (0,0) 84 (43, 125)2010 1 19 0 2 2 1 0 5 25 5 (0, 14) 26 (5, 48)2011 1 25 1 1 5 2 0 9 35 4 (0, 11) 36 (13, 59)2012 3 24 0 2 4 0 1 7 34 12 (0, 25) 29 (9, 50)2013 7 26 1 3 5 0 1 10 43 27 (8, 46) 38 (15, 62)2014 2 25 3 2 0 0 0 5 32 8 (0, 18) 20 (4, 36)2015 3 11 0 1 2 0 0 3 17 27 (0, 56) 27 (0, 59)2016 5 10 4 1 1 2 0 8 25 50 (5, 95) 80 (18, 142)2017 10 14 2 4 3 1 1 11 35 71 (23, 120) 79 (26, 131)2018 5 16 5 3 6 3 17 38 31 (5, 58) 106 (45, 167)
Table 3. Black Butte herd 10-year survey history
Rams Ratio (90% CI)
Rams Ratios (90% CI)
222

Bighorn Sheep Status and Trend Report 2018
PopulationYear Lambs Ewes CI CII CIII CIIIB CIV Total Total Lambs Rams2009 0 7 0 4 2 0 0 6 13 0 86 (7, 164)2010 2 18 2 6 6 0 0 14 34 11 (0, 25) 66 (32, 123)2011 2 21 1 1 3 0 3 8 31 10 (0, 21) 38 (12, 64)2012 8 16 1 1 5 0 2 9 33 50 (14, 86) 56 (18, 95)2013 6 23 0 5 3 0 1 9 38 26 (6, 46) 39 (14, 64)2014 4 26 1 2 3 0 0 6 36 15 (2, 29) 23 (6, 40)2015 11 30 9 1 2 1 0 13 54 37 (15, 58) 43 (17, 70)2016 15 28 2 1 4 15 58 54 (25, 82) 54 (25, 82)2017 14 44 2 5 5 4 15 90 32 (16, 48) 34 (17, 51)2018 24 36 7 4 6 1 21 80 67 (38, 96) 58 (32, 85)
Table 4. Mountain View herd 10-year survey history.
PopulationYear Lambs Ewes CI CII CIII CIIIB CIV Total Total Lambs Rams2009 0 7 0 1 0 0 1 2 9 0 29 (0, 66)2010 2 5 0 1 2 0 0 3 10 40 (0, 95) 60 (0, 132)2011 3 6 1 1 1 0 0 3 12 50 (0, 108) 50 (0, 108)2012 4 12 3 1 1 5 21 33 (2, 65) 42 (5, 78)2013 3 12 3 1 2 0 6 21 25 (0, 52) 50 (9, 91)2014 2 12 1 2 3 0 0 6 22 16 (0, 38) 50 (9, 91)2015 1 10 1 5 2 1 0 9 22 10 (0, 27) 90 (17, 163)2016 0 17 1 4 4 0 0 9 26 0 (0, 0) 53 (17, 89)2017 2 13 2 3 3 0 0 8 23 15 (0, 34) 62 (16, 107)2018 3 14 2 1 1 4 21 21 (0, 44) 29 (2, 55)
Table 5. Tucannon herd 10-year survey history.
Population
Year Lambs Ewes CI CII CIII CIIIB CIV Total Total Lambs Rams2009 11 44 0 10 8 0 3 21 76 25 (11, 39) 48 (27, 69)2010 8 32 3 8 4 1 1 17 57 25 (9, 41) 53 (27, 79)2011 8 37 0 3 12 3 1 19 62 22 (8, 35) 51 (28, 75)2012 9 35 4 2 9 1 5 21 65 26 (10, 42) 60 (33, 87)2013 6 31 1 3 12 1 2 19 56 19 (5, 34) 61 (32, 91)2014 12 39 1 5 6 1 2 15 66 31 (14, 47) 38 (19, 58)2015 6 37 2 6 3 1 2 14 57 16 (4, 28) 38 (17, 58)2016 22 42 23 87 52 (29, 75) 55 (31, 78)2017 24 53 7 5 5 3 23 120 45 (27, 64) 43 (26, 61)2018 19 59 6 14 6 1 32 110 32 (18,46) 54 (35, 74)
Table 6. Wenaha herd 10-year survey history
Rams Ratios (90% CI)
Rams Ratios (90% CI)
Rams Ratios (90% CI)
223
Bighorn Sheep Status and Trend Report 2018
Bighorn Sheep Status and Trend Report: Region 1 Hall Mountain and Vulcan Mountain ANNEMARIE PRINCE, Wildlife Biologist
Introduction District 1 has two bighorn sheep populations, both resulting from reintroductions. Rocky Mountain bighorn sheep were initially introduced to Hall Mountain in Pend Oreille County, Washington from Alberta, Canada in 1972 (Johnson 1983). The founder herd included 5 rams and 13 ewes. In 1981, 2 additional ewes were translocated to Hall Mountain from Thompson Falls, Montana. California bighorn sheep were introduced to the Vulcan Mountain area of northern Ferry County, Washington in 1971. Eight bighorn sheep, consisting of 2 rams and 6 ewes, were translocated from the Colockum State Wildlife Area to U.S. Bureau of Land Management land near Little Vulcan Mountain.
Management Guidelines and Objectives An earlier objective for the Hall Mountain herd was to maintain a population of 40–70 Rocky Mountain bighorn sheep (WDFW 2014). However, population objectives have recently been revised to reflect updated mapping of suitable habitat (http://wdfw.wa.gov/conservation/game/). Short-term early winter herd objectives are between 25 and 35 animals. The earlier long-term population goal for the Vulcan Mountain bighorn sheep herd was to maintain 80-110 animals on the available range. However, population objectives have recently been revised to reflect updated mapping of suitable habitat (http://wdfw.wa.gov/conservation/game/). Short-term early winter herd objectives for the Vulcan herd are from 70 to 90 animals. Long-term, we estimate that the Vulcan area could support 80 to 110 animals.
Population Surveys No aerial surveys of the Hall Mountain herd were conducted during 2018. The WDFW sponsored flight for 2018 was canceled due to helicopter availability. Table 1 summarizes the maximum number of sheep observed during previous aerial surveys.
224

Bighorn Sheep Status and Trend Report 2018
Table 1. Counts of Hall Mountain bighorn sheep, 2001 – 2017. Note: The last year of winter feeding was in 2003.
Year Lambs Ewes Rams Total* Lambs: 100 Ewes: Rams 2001 4 11 8 23 36 : 100 : 73 2002 7 13 4 24 54 : 100 : 31 2003 - - - No Data No Data 2004 - - - No Data No Data 2005 7 14 6 27 50: 100: 43 2006 5 7 7 19 71: 100: 100 2007 4 11 7 22 36: 100: 64 2008 9 16 4 29 56: 100:25 2009 5 14 4 23 36: 100: 29 2010 9 11 0 24 82: 100: 0 2011 5 9 1 15 56 : 100 : 11 * 2012 2 6 4 12 33: 100: 67 2013 0 5 3 8 0: 100: 60 2014 3 7 11 21 43:100:157 2015 No surveys conducted 2016 0 5 8 12 0:100:160** 2017 0 6 9 15 0:100:150
* Total counts some years include unclassified bighorn sheep. ** Ground-based surveys conducted in spring before translocation of NBR sheep. The Vulcan herd is surveyed annually with ground-based surveys conducted along an automobile route on county roads as well as from private, primitive roads. During the survey, biologists attempt to classify every detected bighorn sheep, but recognize that the effort likely never results in a complete count, and classification is not possible for animals at extreme distances. In 2017, a ground-based survey was conducted in September. The count recorded was 44 bighorn sheep (27 ewes, 14 lambs, 3 rams). In addition to a ground survey, in 2018 we also conducted a single aerial survey in March 2018. The focus of this survey, was to guage over-winter lamb survival. During the aerial survey, we observed 55 sheep (26 ewes, 10 lambs, 1 yearling, and 18 rams), which was 4 lambs less than observed in the fall, but quite a few more rams (Table 2).
225

Bighorn Sheep Status and Trend Report 2018
Table 2. Annual population composite counts of the Vulcan Mountain bighorn sheep, 2001 – 2018.
--- Rams ---
Year Lambs Ewes Yearling <3/4 curl
>3/4 curl
All rams Total* Lambs:100
Ewes: Rams 2001 5 8 0 2 2 4 17 63 : 100 : 50 2002 5 8 3 2 4 9 22 63 : 100 : 113 2003 9 17 3 4 3 10 36 53 : 100 : 59 2004 9 20 5 7 5 17 46 45 : 100 : 85 2005 21 32 4 11 7 22 75 66 : 100 : 69 2006 10 24 3 6 4 13 47 42 : 100 : 54 2007 21 39 5 4 6 15 75 54 : 100 : 38 2008 19 42 5 8 5 18 79 45 : 100 : 43 2009 15 43 2 14 7 23 81 35 : 100 : 53 2010 9 24 7 8 4 19 52 38 : 100 : 79 2011** 7 9 - - - 15 31 78 : 100 :167 2012** 4 9 1 3 9 13 26 44 : 100 :144 2013 6 15 1 2 7 10 31 40 : 100 : 67 2014 7 19 2 5 1 7 36 37 : 100 : 37 2015 13 19 13 6 7 13 45 68:100:68 2016 11 26 5‡ 4 4 13 50 46:100:54 2018** 10 26 1 6 12 19 55 38:100:73
* Total counts some years include unclassified bighorn sheep. **These counts were conducted by helicopter. ‡ All males. Hunting Seasons and Recreational Harvest The Hall Mountain herd is open for the Rocky Mountain special raffle permit hunt, however, there have been no bighorn sheep harvested there since 2010. Both general public hunters (State) and members of the Colville Confederated Tribes (CCT) hunt bighorn sheep within the Vulcan Mountain Unit. Agency and Tribal biologists annually confer prior to developing their respective permit recommendations. There were no state permits or tribal permits allocated for 2017.
226

Bighorn Sheep Status and Trend Report 2018
Table 3. Summary of State permit numbers and State hunter harvest of bighorn sheep from the Vulcan Mountain Unit, 2005 – 2016.
Year State State Hunter Harvest 2005 1 1 ram 2006 1 1 ram 2007 2 2 rams 2008 3 1 ram, 2 ewes 2009 4 1 ram, 3 ewes 2010 4 1 ram, 3 ewes 2011 2 1 ram 2012 1 1 ram 2013 1 None 2014 1 1 ram 2015 1 1 ram 2016 1 None 2017 0 None
Survival and Mortality Predators that occur throughout the Hall Mountain herd area include coyotes, black bears, cougars, and gray wolves. Three mortalities (all females) were documented among 8 GPS-collared sheep introduced from the National Bison Range (See below). One mortality was attributed to a cougar and the other two were classified as unknown; all mortalities occurred during the winter. Predators that occur throughout the Vulcan herd area include coyotes, black bears, cougars, and gray wolves. During 2016, three mortalities (2 ewes, 1 ram) were documented among 15 radio-collared sheep. All mortalities were attributed to cougars. One of the sheep that died was recently translocated from the Cleman Mountain herd. It wandered off by itself into new habitat soon after translocation and this probably made it more susceptible to predation. One collared sheep died in January 2018 and the suspected cause of death was a cougar.
Habitat Northeastern Washington is densely forested and the Hall Mountain bighorn sheep depend upon the steep terrain, open grasslands, and other scattered sub-alpine openings for forage and predator avoidance. Non-forested escape terrain is limited and fragmented within the range of the Hall Mountain herd including Sullivan Mountain, Crowell Ridge, Gypsy Ridge, and Hall Mountain. Sheep migrating between these and other peaks and ridges have to travel through valley bottoms and dense forest where vulnerability to predators may increase. The U.S. Forest Service (USFS) owns the vast majority of the land within the range of the Hall Mountain herd. Consequently, there are no immediate threats to habitat quality and quantity. The USFS plans to actively manage portions of the winter range habitat with prescribed burns subject to funding (Suarez 2001). In July and August of 2017, an approximately 4,000 acre fire burned portions of the Hall Mountain bighorn sheep range. This fire should increase forage quality in the future for this herd. Currently, there is no domestic livestock grazing within the national forest area used by the Hall Mountain bighorn sheep.
227
Bighorn Sheep Status and Trend Report 2018
Several projects to enhance habitat for the Vulcan Mountain Bighorn Sheep have been carried out in recent years. These include broad-range weed control, selective logging, forage plant seeding, water source development, and temporary fencing at Moran Meadow to enhance controlled cattle grazing. Partners accomplishing these projects included several local private landowners, the Wild Sheep Foundation (WSF, formerly Foundation for North America Wild Sheep, FNAWS), the Safari Club International (SCI), the Inland Northwest Wildlife Council (INWC), the USFS, the Bureau of Land Management (BLM), and the WDFW. One large-scale project was the completion of a BLM timber sale within the core sheep range in 2004. This helicopter-logging project was partially designed to improve predator avoidance for bighorn sheep by enhancing sight distances within the most densely forested portions of their range, and to increase forage production (Doloughan 2004). There are no domestic sheep grazing allotments within the Vulcan herd range. Human-Wildlife Interaction A winter feeding station was maintained for the Hall Mountain bighorn sheep for many years until it began attracting cougars, posing a risk to humans and an unnatural vulnerability for the sheep. Consequently, winter feeding was discontinued in 2003. More recently, there is concern about bighorn sheep straying beyond their traditional range and increasing the risk of contact with domestic sheep that could harbor M. ovipneumoniae (M. ovi.), a bacterium that causes pneumonia in bighorn sheep. Population Augmentation In March of 2016, 10 short-yearling (born in spring 2015) bighorn sheep (8 ewes, 2 rams) were translocated from the National Bison Range in Montana to Hall Mountain. All sheep were fitted with GPS radio-collars, tested negative for Mycoplasma ovipneumoniae on both nasal swabs and serology, and released at the historic feeding station in the USFS Noisy Creek campground. Unfortunately, two of these translocated ewes moved into residential areas and had to be euthanized because of potential interaction with and transmission of pathogens from domestic sheep and/or goats. There is one collar still functioning and present on Hall Mountain at the time of this writing. Cooperators in this project included the U.S. Fish and Wildlife Service, the Kalispel Tribe, Pend Oreille Sportsman’s Club, the Montana Department of Fish, Wildlife, and Parks, the Confederated Salish and Kootenai Tribes, and Global Wildlife Resources. In January of 2017, 8 sheep were translocated from the Cleman Mountain herd to the Vulcan herd area. All were fitted with GPS radio-collars and released at Vulcan Mountain. As of this writing, 6 of the sheep are still alive and spend the majority of their time on Vulcan Mountain (Figure 1).
228

Bighorn Sheep Status and Trend Report 2018
Research In 2016, the Kalispel Tribe, WDFW, the US Forest Service, and the Pend Oreille Sportsman’s Club began a collaborative research project at Hall Mountain. Objectives of the study are as follows:
1. Estimate ewe and lamb abundance with the assistance of VHF telemetry during multiple helicopter flights.
2. Determine adult and lamb (up to 1 year) survival rates and when possible cause-specific mortality of radio-collared adult sheep.
3. Determine habitat use and movement patterns of Hall Mountain bighorn sheep using GPS locations of radio-collared individuals. Compare GPS locations from radio-collared sheep to the USFS habitat suitability model; determine the proportion of GPS locations that fall within the USFS model. Evaluate bighorn sheep movement and timing of movement between Hall Mountain (US Selkirk Mountains) and the BC Selkirk Mountains.
4. Use DNA collected at bait/capture sites in Washington and BC to understand the genetic relatedness and diversity within the Hall Mountain sheep population. If genetic diversity is low, investigate the possibility of releasing Rocky Mountain bighorns from another herd to increase genetic diversity.
5. Assess general health of Hall Mountain and BC bighorn sheep. Conduct disease testing, pregnancy tests, check for external parasites, and determine body condition (via ultrasound) during captures.
Figure 1a. Map of GPS locations from 5 translocated ewes from the Cleman Mtn. herd, September 2017 – September 2018
Figure 1b. Map of GPS locations from 3 resident ewes, September 2017 – September 2018.
229

Bighorn Sheep Status and Trend Report 2018
A bait station was established during the winter of 2015 and 2016 to attract sheep into a corral for capture and subsequent radio-collaring. Unfortunately, no sheep came to the capture site. However, 10 sheep were translocated from the National Bison Range in Montana to Hall Mountain in an effort to address objective four above and to provide a sample of radio-collared sheep for addressing the other objectives. Aerial captures to radiocollar additional sheep were scheduled for the winter of 2017/18, but an accident involving the capture company (not at Hall Mtn.) prevented any capture attempts. In late winter of 2017/18, the Kalispell Tribe deployed 5 radiocollars on sheep north of the US border to determine movement between BC sheep and the Hall Mountain population. As of this writing, the sheep have largely remained north of the border. In February 2016, WDFW, with assistance from Leading Edge Aviation, captured 7 adult bighorn ewes at Vulcan Mountain. Six of the sheep were fitted with GPS radio-collars and all of the sheep were screened for pathogens and diseases of interest. In addition, 8 radio-collared sheep were added to the Vulcan herd from the Cleman Mountain herd. Radio-collared ewes will be used to locate lambs and assess recruitment into the population. In addition, the collars will aid in finding sheep during any future helicopter surveys. As of this writing, there are currently 8 active and functioning collars in the Vulcan Herd area. Management Concerns Growth of the Hall Mountain bighorn sheep herd appears to be limited and the cause(s) of this limitation is undetermined. Current research efforts are underway to help WDFW address this concern. The Hall Mountain bighorn herd is considered a clean herd by WDFW, meaning there are no documented cases of M. ovipneumoniae. However, recent collar data indicates this herd may wander farther than previously thought and interactions with domestic sheep and goat herds is a concern. The Vulcan bighorn sheep population declined dramatically in the late 1990s mainly as a result of complications from exceptionally high internal parasite loads. Domestic goats were known to share part of the Vulcan bighorn sheep range. Evidently the parasite Muellerius capillaris using slugs and snails as intermediate hosts was able to jump from domestic goats to the bighorn sheep. Native bighorn sheep, having less natural resistance than domestic goats to Muellerius capillaris, likely succumbed to pneumonia that this parasite brings about (Hall 2002). After 2001, the Vulcan herd appeared healthy and began producing lambs annually, suggesting that the overall health of the herd was acceptable. Nevertheless, we know of at least 3 flocks of domestic sheep near the periphery of the Vulcan range, and are concerned about the potential for pathogen transmission from domestic sheep and goats to the Vulcan herd. In addition, in 2014, 3 bighorn sheep that wandered away to the town of Republic from what we suspect was the Vulcan herd were euthanized after they began interacting with domestic sheep and we became concerned that their disease risk was elevated. Management Conclusions More intensive monitoring and research will help the Department better understand the dynamics of the Hall Mountain herd and determine the future potential of sustaining and/or increasing this herd. The decline observed in the Vulcan herd 2009-2012 is of considerable concern, but there is some
230

Bighorn Sheep Status and Trend Report 2018
evidence (survey numbers) that the population has increased during the past few years. The population estimate has nearly doubled since 2012. There are currently 8 radio-collared sheep in the Vulcan herd and in subsequent years, we hope to better understand the limiting factors for this herd by monitoring these animals. Literature Cited Borysewicz, M. 2012. Colville National Forest: Sullivan Lake Ranger District. Personal
communication. Doloughan, K. U.S. Dept. of Interior: Bureau of Land Management. Personal communication,
2004. Hall, P. B. Washington Department of Fish and Wildlife. Personal communications, 1999-2002. Johnson, R.L. 1983. Mountain Goats and Mountain Sheep of Washington. Biol. Bull. No. 18.
Wash. State Game Dept., Olympia. 196 p. Krausz, E. Colville Confederated Tribes. Personal communications, 2006-2012. Mansfield, K. Washington Department of Fish and Wildlife. Personal communication in 2007. Suarez, R.V. 2001. Lake Basin Prescribed Burn. Sullivan Lake Ranger District, Colville National
Forest. Rocky Mountain Elk Foundation Project Completion Report - Unpublished. 2 p. Washington Department of Wildlife. 2014. 2015-2021 Game Management Plan. Washington
Department of Fish and Wildlife. Olympia, WA.
231

Bighorn Sheep Status and Trend Report 2018
Bighorn Sheep Status and Trend Report: Region 1 Lincoln Cliffs MICHAEL T. ATAMIAN, Wildlife Biologist CARRIE L. LOWE, Wildlife Biologist
Introduction
Bighorn sheep were reintroduced into the Lincoln Cliffs area in 1990. Sheep distribution was historically centered on the original 1990 release site, a parcel owned by the Bureau of Land Management (BLM), just south of the town of Lincoln. This was an area jointly selected by WDFW and BLM as suitable habitat. The sheep now regularly occupy two main areas throughout the year: the residential community of Lincoln and the cliffs above it, and the cliffs around Whitestone Rock, about 7 miles downriver from Lincoln. Bighorn sheep have also been observed frequently using the cliffs above Sterling Valley, the area between Lincoln and Whitestone. Agricultural fields above cliffs and in valley bottoms are also used regularly by the bighorns. Observations of bighorn sheep have been reported as far east as Porcupine Bay on the Spokane Arm of Lake Roosevelt and to the east side of Banks Lake in Grant County.
Management Guidelines and Objectives
The objective for the Lincoln Cliffs herd is to manage bighorn sheep numbers for a self-sustaining population capable of supporting both consumptive and non-consumptive recreation, while remaining within the local landowners’ tolerance. The short-term objective for the Lincoln Cliffs herd is to maintain a population size of 100-120 (http://wdfw.wa.gov/conservation/game/). This is likely the largest feasible herd size (and thus also the long-term objective) due to increasing landowner concerns and available habitat constraints.
Population Surveys Aerial surveys have been the preferred method for surveying this herd due to the cliff habitat and lack of road access. Prior to 2002, aerial surveys were inconsistent due to limitations of funding and personnel. From 2002-2013, a concerted effort was made to conduct two aerial surveys per year, one in the spring to assess lamb production (Table 1), and one in late fall to assess ram numbers (Table 2). Review of that data showed that the fall flight produced greater ram and ewe counts 90% of the years and greater lamb count 50% of the time. Consequently, it was decided to fly only the fall aerial survey beginning in 2014.
Minimum population estimates are based on the highest count of rams and ewes from all helicopter surveys in a given year (Figure 1). These surveys indicate the Lincoln Cliffs population experienced a period of steady growth 2007–2014, after which it has stabilized (Fig. 1). There was a decline in ewes in 2005 followed by a decline of rams in 2006. The decline in rams also followed three consecutive years of 2 rams being removed, a result of the auction and raffle permit holders selecting the Lincoln herd to hunt. The ram population rebounded immediately after 2006 and had, until 2013, remained fairly stable at around 20 animals. In 2014, 38 rams were observed during aerial surveys, which was the largest number since regular surveys began in 2002. In particular, the number of younger (¼- and ½-curl) age classes showed a considerable increase.
232

Bighorn Sheep Status and Trend Report 2018
The total number of bighorns observed on the 2017 flight, including lambs, was 95 (25 rams, 48 ewes, 22 lambs). One collared ewe not located on the flight was subsequently observed from the ground, and it is suspected she was among a group that was missed on the flight. Herd composition results from the aerial surveys have varied from 39 to 80 rams per 100 ewes over the last 10 years (Table 2). The lamb per 100 ewe ratio has remained relatively stable, although yearly 90% confidence intervals are large (Table 1). The exception was in 2014, when concerns were raised as only 7 lambs were located during the fall aerial survey, all in the Whitestone area. This confirmed what had been reported from public ground observations of the Lincoln group. The cause for this one off year is unknown, testing during the 2015 capture (see research section below) indicate that Mycoplasma ovipneumoniae was not present in this population.
Ground counts are conducted whenever possible to supplement the aerial surveys; however, these are often very limited due to terrain and limited access to private property. Ground counts for ewes and lambs have been relatively easy to obtain in the Lincoln group, but less so for the Whitestone group. Ram counts in both areas have proven largely unsuccessful from the ground. Ground counts were conducted regularly during the spring and summer of 2015 and occasionally in 2016– 2018 to monitor lamb production and survival. Lamb counts have indicated the recruitment failure of the Lincoln sub-herd in 2014 has not recurred. Residents in Lincoln have also been very helpful in reporting counts and other observations of this group.
Hunting Seasons and Recreational Harvest One ram permit for this herd was offered each year from 1997–2013. In 2014, based on ram numbers and population size, general draw ram permits were increased to two. In addition to the annual permit, the statewide 2003 and 2005 auction winners and the 2004 raffle winner all selected Lincoln Cliffs to harvest their rams. Lincoln Cliffs herd was closed to the raffle and auction winners from 2006-2014, in 2015-2017 it was open but none of the winners chose to hunt in this herd.
Permit hunters have spent an average of 5 days hunting per kill, however days hunted has varied widely from 1 to 14 days. The area is almost entirely composed of private property and days/kill often reflects how much time was spent prior to the hunt gathering permission to access the local properties. Hunter success has remained at 100% for this hunt, which had 2,218 applicants in 2017.
Survival and Mortality
Since 1997, 48 known sheep mortalities (38 rams, 10 ewes) have been documented in this herd: 26 from hunting, 2 from vehicle collisions, 7 from cougar predation, and 13 from unknown causes. The last reported non-hunting mortality occurred in May 2017, when residents witnessed two cougars chase a ewe off a cliff in Sterling Valley. Frequent cougar activity was reported in Lincoln during the spring and summer of 2018; it is unknown if lamb and/or adult survival were affected.
233

Bighorn Sheep Status and Trend Report 2018
Habitat Habitat within the range of the Lincoln Cliffs bighorn sheep is primarily private land. Where intact, it includes sparse ponderosa pine, bunchgrasses, forbs, shrubs, and rock outcrops. The cliffs along the bank of Lake Roosevelt provide escape terrain and lambing areas. The flats above the cliffs are mainly dry land agricultural fields such as wheat and barley. Fields used by the sheep adjacent to roads in valley bottoms contain irrigated alfalfa and other crops. Much of the area has been broken into small parcels and developed, and landscaped residential areas are frequented by the sheep. Human-Wildlife Interaction Damage complaints related to bighorns in both the Lincoln and Whitestone areas are on the rise. With the growth of this herd, agricultural activities adjacent to escape terrain, and recent drought conditions some local producers are experiencing significant seasonal damage to crops such as winter wheat and alfalfa. WDFW staff and Master Hunters were used periodically in 2014 to haze sheep from fields with little success. Growth in the local human population and associated construction of new housing continue to be a concern in Lincoln. The Lincoln group of sheep spends substantial amounts of time near residences, so this may become an issue in the future if landowner tolerance changes. At the request of some residents, WDFW is working with the Wild Sheep Foundation to install sheep crossing signs in Lincoln, where roads are driven frequently by visitors and risk of collision is significant.
Population Augmentation The Lincoln Cliffs population was started with an introduction of 11 ‘California’ bighorns from Northwest Trek in December 1990. Three additional sheep from Vulcan Mountain were released in March 1991 and 5 from Kamloops, British Columbia in 1996. The population showed a steady increase over the following years, and reportedly peaked at around 100 animals in June 1998 (personal communication, J. Hickman). As a result of such growth, the herd was used to augment other populations in the state from 1999–2001. Sixteen ewes and 1 ram lamb were translocated to Lake Chelan, and 11 ewes were captured and released on Cleman Mountain. Aerial and ground surveys in 2002 indicated that population was not recovering from the removal of ewes. As a result, 15 sheep were translocated from Nevada to the Lincoln Cliffs and Whitestone areas in January 2003 (12 ewes, 1 ram, and 2 lambs). There have been no augmentations to this population since 2003. Research In February 2015, 10 sheep (8 ewes and 2 rams) were captured and fitted with GPS-enabled radio collars. Animals captured in 2015 were in overall good condition, with moderate to good body fat levels, low parasite loads, and no scabies infestations. With concern over poor lamb recruitment in 2014, all animals were also tested for Mycoplasma ovipneumoniae (M. ovi) exposure and active infection. M. ovi, a respiratory pathogen that predisposes wild sheep to pneumonia, is associated with domestic sheep or goat contact. An outbreak can cause high lamb mortality and persist in populations for decades. All bighorns captured in 2015 tested negative for M. ovi. Radio collars deployed in this capture aided in location of sheep during lamb monitoring and during aerial surveys. In addition, the GPS data collected from the collars provided insight into the movements and habitat use of the ewes and rams in the Lincoln and Whitestone groups. There appears to be
234

Bighorn Sheep Status and Trend Report 2018
little to no interaction between ewes in the Lincoln and Whitestone groups, although the rams showed regular movement between the two areas (Figure 2). None of the collared sheep went on any large forays out of the known use area during their collar lifetime. To date, one known mortality has occurred for the 10 sheep that were radio-collared in the February 2015 capture. This ewe was killed by a cougar in September 2015, though later testing indicated she had contracted the bluetongue virus and was in poor condition. One ewe’s collar battery failed before the end of May 2015; this collar was an older collar redeployed on this capture. Though the collar’s GPS and VHF are no longer functioning, the ewe has been seen on subsequent survey flights. One ewe that was marked only with an ear-tag was also seen on the 2015 and 2016 flights. Additionally, one ram collar stopped its GPS transmittal in March 2016; the fate of that ram is unknown as it was not seen or the VHF heard on any subsequent aerial or ground surveys. All remaining collars in this herd have now stopped transmitting; the remaining ewe collars failed during the fall of 2017, and the ram collar failed in August 2018.
Management Concerns Though the Lincoln Cliffs herd is considered “clean,” (i.e., there have been no documented cases of M. ovi.) disease continues to be a concern, given the close proximity to rural private lands. This is important should it ever be considered as a source population to augment failing herds in Washington. In addition, there are over 200 bighorn sheep on the Hellgate Game Reserve, located across Lake Roosevelt within the Colville Reservation boundaries. In 2015 an ear-tagged ewe was observed in Lincoln from the Hellgate population, indicating that movement between the two populations occurs at least occasionally. Thus, a pneumonia outbreak in either could affect both populations. There are no known large domestic sheep or goat operations in the range of the Lincoln Cliffs bighorns at this time. With increased residential development in the area there is potential for contact with domestic sheep or goats via 4-H and small scale hobby farms, though none of these were identified during this reporting period. Additionally, information regarding the potential of disease interactions between domestic sheep and goats with bighorns was provided to the local 4-H extension for inclusion in the newsletter. Outreach to small farm operations, new residents, and local organizations should continue in order to minimize risk of outbreak. GPS collar data has allowed WDFW to better delineate the herd’s home range and movements, and thus where to target education and outreach efforts regarding these threats. Management Conclusions The Lincoln Cliffs herd is estimated to be near the stated goal of 100-120 animals for this population if lambs are included (http://wdfw.wa.gov/conservation/game/). Given the expansion of this herd to Whitestone Rock, regular use of Sterling Valley, and the addition of GPS marked individuals, available habitat should be reviewed for this herd. Lincoln Cliffs sheep are living primarily on private land, both in the residential area of Lincoln and the agricultural fields above Whitestone. As Lincoln continues to be split into smaller parcels and developed, and the sheep consume agricultural crops, there is an increasing need to explore tools to address damage. In early 2016, WDFW staff held a public meeting in Lincoln to update residents on current management and listen to concerns and ideas regarding future management of this herd. Outreach
235

Bighorn Sheep Status and Trend Report 2018
to residents and local producers should continue as management decisions are considered. Addition of a limited ewe hunt was proposed to the public as part of the 2018-2020 hunting season setting process. The proposal was supported and two ewe permits were issued for the 2018 season, one in the Lincoln subherd and one in the Whitestone subherd. Table 1. Lincoln cliffs herd lamb ratios. *2014 – 2017 data are from fall aerial survey, prior to 2014 data are from spring aerial survey.
Year Ewes Lambs Lambs:100 Ewe
Lower 90% CI
Upper 90% CI
2008 34 14 41 19 63
2009 33 11 33 14 52
2010 37 16 43 22 64
2011 34 11 32 14 50
2012 37 12 32 14 50
2013 34 18 53 28 78
2014* 49 7 14 5 23
2015* 39 24 62 36 88
2016* 47 31 66 41 91
2017* 48 22 46 27 65 Table 2. Lincoln cliffs herd ram ratios from fall aerial surveys.
Year Ewes Rams Rams:100 Ewe
Lower 90% CI
Upper 90% CI
2008 30 15 50 24 76
2009 31 18 58 30 86
2010 41 16 39 20 58
2011 42 26 62 37 87
2012 49 21 43 25 61
2013 55 32 58 37 79
2014 49 38 78 50 106
2015 39 29 74 44 104
2016 47 29 62 38 86
2017 48 25 52 31 73
236

Bighorn Sheep Status and Trend Report 2018
Figure 1. Lincoln Cliffs minimum population estimate by sex for 2002–2017. Shown are the maximum count from all helicopter surveys conducted each year, beginning in 2002, the year regular helicopter surveys were initiated.
Figure 2. Left-hand panel: Radio locations for 6 Lincoln Cliffs bighorn ewes August 2016–July 2017. Whitestone ewes (3) are in green; Lincoln ewes (3) are in red. Right-hand panel: Radio locations for Whitestone ram August 2016–July 2017 in green.
237

Bighorn Sheep Status and Trend Report 2018
Bighorn Sheep Status and Trend Report: Region 2 Mt. Hull and Sinlahekin SCOTT FITKIN, Wildlife Biologist JEFF HEINLEN, Wildlife Biologist Management Guidelines and Objectives Mt. Hull Herd The objective for the Mt. Hull herd is to manage bighorn sheep numbers for a self-sustaining population capable of supporting both consumptive and non-consumptive recreation, while remaining within the capability of the limited land base to support it. The short-term objective for the Mt. Hull herd is to maintain a population size of 80-100 (http://wdfw.wa.gov/conservation/game/). Currently, the estimated herd size is above this level at 130-135 animals. The current management focus is to maintain or slightly reduce the current population level while minimizing the risk of disease and agricultural damage. This population supports a conservative, any ram and adult ewe permit harvest to the extent it is compatible with herd demographics.
Sinlahekin Herd The objective for the Sinlahekin herd is to manage bighorn sheep numbers for a self-sustaining population capable of supporting both consumptive and non-consumptive recreation. The short-term objective for the Sinlahekin herd is to attain a population size of 50-80 (http://wdfw.wa.gov/conservation/game/). Long-term, we estimate that the Sinlahekin sheep habitat could support 100 to 150 animals. The population reached a high in 2011 at an estimated 90-95 animals. In 2012, surveys indicated the population declined by as much as two-thirds, but has been slowly recovering since. Most recent surveys estimate the herd size at of 65-70 animals. The decline occurred in association with the discovery of the ectoparasitic mite Psoroptes ovis in the herd, although it is unclear whether there is a causative relationship. The current objective for the Sinlahekin herd is to increase the population size and reestablish harvest permits.
Table 1. Summary of harvest information for bighorn sheep in the Mt. Hull Unit.
Year WDFW Permits
WDFW Harvest
CCTa Permits
CCT Harvest
1995 1 ram 0 1 ewe 0 1996 1 ram 1 ram 1 ewe 0 1997 1 ram 1 ram 1 ewe 0 1998 1 ram 1 ram 1 ewe 1 ewe 1999 1 ram 1 ram 1 any 1 ram 2000 0 -- 1 any 0 2001 0 -- 1 any 0 2002 0 -- 1 any 0 2003 1 ram 1 ram 1 any 1 ram 2004 1 ram 1 ram 1 any 0 2005 1 ram 1 ram 1 any 0 2006 2 rams 2 rams 2 any 1 ram 2007 2 rams 2 rams 1 any 1 ram 2008 2 rams 2 rams 1 any 1 ram
2009 1 ram 2 ewe
1 ram 1 ewe
1 any 2 ewe
1 ram 1 ewe
2010 1 ram 2 ewe
1 ram 2 ewe
1 any 2 ewe
0 ram 2 ewe
2011 1 ram 2 ewe
1 ram 1 ewe
1 any 2 ewe
1 ram 1 ewe
2012 1 ram 2 ewe
1 ram 2 ewe
1 any 2 ewe
0 ram * ewe
2013 2 ram 2 ewe
2 ram 1 ewe
2 any 2 ewe
0 ram 1 ewe
2014 5 ram 2 ewe
5 ram 2 ewe
2 any 2 ewe
2 ram * ewe
2015 1 ram 2 ewe
1 ram 1 ewe
4 any 2 ewe
3 ram 0 ewe
2016 1 ram 2 ewe
0 ram 1 ewe
1 any 2 ewe
1 ram *ewe
2017 1 ram 2 ewe
1 ram 2 ewe
1 any 2 ewe
* ram *ewe
a CCT=Colville Confederated Tribes * Not Reported
238

Bighorn Sheep Status and Trend Report 2018
Population Surveys Population surveys are generally conducted annually to determine composition and trend on both the Mt. Hull and Sinlahekin herds (Tables 2, 3). The surveys are conducted in late fall or early winter and consist of helicopter and/or ground count efforts. An attempt is made to classify all sheep in each herd, and although a complete count is generally not achieved, the majority of animals are typically documented by observers. This result represents a minimum count from which a population estimate is generated.
Mt. Hull Herd WDFW biologists conducted a ground survey of the Mt Hull Unit in 2017 classifying 72 sheep. Observed lamb recruitment was 27 lambs per 100 ewes. Ram recruitment was 15 rams per 100 ewes. Sinlahekin Herd WDFW biologists conducted a ground survey of the Sinlahekin Unit in December 2015 classifying 63 sheep, including 11 rams and 11 lambs. This yielded a lamb: ewe ratio of 27:100 (Table 3). Multiple survey attempts in 2016 and 2017 failed to produce adequate sample sizes... Hunting Seasons and Recreational Harvest Mt. Hull Herd Permit harvest was closed in 2000 due to wildfire burning a substantial portion of the sheep range. Permit harvest resumed in 2003 with permit numbers varying over time with herd size and ram demographics. Beginning in 2009, ewe permits were offered to help achieve herd reduction goals. Permits are split between the Washington Department of Fish and Wildlife (WDFW) and the Colville Confederated Tribe (CCT). Table 1 shows permit levels and harvest success during 1995-2016. During the 2014 hunting season, statewide auction and raffle hunters, as well as the north-central Washington multi-species raffle hunter all took rams from the Mt. Hull herd. For this reason, WDFW ram harvest was reduced to a single permit in 2015 (although ewe permits remained at 2 animals to reduce the rate of herd increase). In 2017, WDFW permits remained at 1 ram and 2 ewes.
Sinlahekin Herd In past years, herd demographics supported the issuance of one ram permit annually from 2010 through 2012, and hunters successfully filled all three permits. Since then herd demographics have not met management guidelines for harvest. If herd demographics improve and meet management guidelines opportunities for harvest will again be considered.
239

Bighorn Sheep Status and Trend Report 2018
Survival and Mortality Mt. Hull Herd Observational data suggests that the Mt. Hull herd grew fairly steadily following reintroduction in 1970. Numbers peaked at 80-90 animals around 1990 following several mild winters. The population declined noticeably in the 1990s, particularly following the severe winter of 1992-93. Herd numbers climbed gradually over the next 10 years until the Rocky Hull fire burned a significant portion of the range in 2000. Robust herd growth has prevailed at least through 2014, likely due to fire’s rejuvenating effect on preferred forage plants. The herd reached its highest observed abundance in 2014 at 128 animals. This is above population objectives. The ram cohort fluctuated significantly in the early 2000s in response to fire activity in the US and Canada, but is now quite robust.
In 2001, WDFW augmented the herd with 8 ewes and 3 rams from the Cleman Mountain herd. Additional augmentation occurred in 2003 with 5 animals from John Day, Oregon. Augmentation efforts are primarily designed to maintain genetic diversity. Population growth is achieved largely through natural production. Given the limited range and insular characteristic of the sheep range on Mt. Hull, current herd size is likely near the maximum the landscape can sustainably support.
Table 2. Population composition counts from the Mt Hull area. <3/4 = less than 3/4 curl rams, >3/4 = greater than or equal to 3/4 curl rams, and L:100:R is lambs (L) and rams (R) per 100 ewes (100).
Rams
Count Population
Year Lambs Ewes <3/4 >3/4 Total Unknown Total Estimate L:100:R 1992 0 26 1 7 8 0 34 40-60 0-100-31 1993 0 17 2 7 9 0 26 40-50 0-100-53 1994 5 28 2 8 10 0 53 50-60 18-100-36 1995 11 16 6 11 17 0 44 55 69:100:106 1996 0 5 10 6 16 0 21 40-60 0:100:320 1997 8 25 -- -- 8 0 41 55-65 32:100:32 1998 -- -- -- -- -- -- -- -- -- 1999 19 24 15 8 23 0 66 70 80:100:96 2000 21 30 9 0 9 0 60 60-65 70:100:30 2001 10 30 15 4 19 0 59 60-70 33:100:63 2002 11 40 6 4 10 0 61 65-70 28:100:25 2003 20 39 9 12 21 0 80 80-90 51:100:54 2004 9 32 7 10 17 0 58 70-90 28:100:53 2005 16 48 16 10 16 0 90 90-100 60:100:33 2006 8 40 25 5 30 0 77 100+ 20:100:75 2007 13 54 17 6 23 0 90 100+ 24:100:43 2008 18 52 20 13 33 0 103 110-120 35:100:63 2009 17 58 11 10 21 0 96 100+ 36:100:29 2010 19 43 6 3 9 0 71 80-100 44:100:21 2011 8 38 13 18 31 0 77 80-100 21:100:82 2012 8 38 26 17 43 0 89 90-100 21:100:113 2013 12 50 17 8 25 3 90 90-100 24:100:50 2014 28 52 27 12 39 9 128 130-135 54:100:75 2015 -- -- -- -- -- -- -- -- -- 2016 -- -- -- -- -- -- -- -- -- 2017 13 48 5 2 7 4 72 80-90 27:100:15
240

Bighorn Sheep Status and Trend Report 2018
As herd growth increased, by the mid-2000s the bighorn sheep where coming down in elevation to forage on irrigated agricultural lands and crossing state highway 97 in the process. These behaviors led to an increase in bighorn sheep road kills and agricultural damage complaints which spiked in 2006-2007. To reduce herd size, trapping and relocating animals was accomplished in 2009 and 2011 in cooperation with the Colville Confederated Tribes and helped establish the Hellsgate bighorn sheep herd on the Colville Reservation. In addition to these translocation efforts, ewe-only permits were issued starting in 2009 to help reduce herd size towards management objectives. These permits continue to the present. Changes in private land use during this time also lead to reduced complaints. The number of road kills and agriculture damage complaints decreased substantially after these herd reduction efforts and private land changes were achieved. Adequate natural forage away from the highway and farmland may also play a role in reduced complaints and road kills. Recently, agriculture damage complaints and roadkills have increased. Implementation of more aggressive herd reduction may be necessary to maintain range health and reduce the potential for increases in highway crossings and damage incidents. Domestic dogs have also been documented chasing bighorn sheep on Mt. Hull and, in one case, causing injury to a lamb.
Sinlahekin Herd Initially, the herd grew rapidly following reintroduction in 1957. High productivity and continued expansion allowed for translocation of sheep to other ranges in Washington. During the 1990s, the population declined, incurring particularly heavy losses during the winter of 1992-93. In 2003, WDFW augmented the Sinlahekin herd with 10 animals from Oregon to improve genetic diversity and bolster production. Herd demographics had improved with survey results showing an increasing population through 2011. This was likely a function of the herd expanding its range into previously unused habitat to the north, genetic mixing through augmentation, and improved survey accuracy. Since 2012, surveys show a dramatic decrease in the population which likely reflects an actual herd reduction rather than an artifact of survey timing. Causes of this decline are currently unknown; however, Psoroptic mange may be a factor as discussed below. In 2010, WDFW and Washington State University initiated a research project to gather data on herd range expansion, seasonal animal movements, and to evaluate the effectiveness of timber harvest and prescribed fire as sheep habitat enhancement tools in the Sinlahekin Wildlife Area. The thesis by Tiffany Baker, entitled “Habitat Selection and Spatial Responses of Bighorn Sheep to Forest Canopy in North-Central Washington” was completed and successfully defended in 2015. Psoroptic mange was discovered in the Sinlahekin herd during the 2011 research capture effort. The reaction to this parasite in a bighorn herd can vary from no signs at all (a few mites in the ears) to fatal infections. We speculate (but do not know) that psoroptic mange may have contributed to the low observed population size and lamb production since 2012. In 2014, 11 bighorn sheep were captured in the Sinlahekin herd and tested for multiple potential pathogens and parasites. Nothing was found that would explain the reduction in the herd size. However, Psoroptes mites continued to persist within the herd. In 2016 and 2017 six bighorn sheep mortalities were documented. Investigations could not determine cause of death. However, predation was ruled out and nasal swabs to detect pneumonia were negative.
241

Bighorn Sheep Status and Trend Report 2018
Eight of these sheep captured in 2014 were fitted with GPS radio collars to increase survey accuracy. The apparent increase in the Sinlahekin population, based on the count obtained in 2015, was much too dramatic to have been caused by reduction in lamb recruitment. More likely, shifts in herd range use during the 2012-2014 period caused the large variation in annual counts. Also possible, although less likely, is that groups of animals emigrated, and then they or other sheep later immigrated to the Sinlahekin herd. Movements among bighorn herds in the Okanogan Valley and environs are not uncommon (see below).
Table 3. Population composition counts from the Sinlahekin area. <3/4 = less than 3/4 curl rams, >3/4 = greater than 3/4 curl rams, and L:100:R is lambs (L) and rams (R) per 100 ewes (100).
Rams
Count Population
Year Lambs Ewes <3/4 >3/4 Total Unknown Total Estimate L:100:R 1990 -- -- -- -- -- -- -- -- -- 1991 -- -- -- -- -- -- -- -- -- 1992 6 30 -- -- 15 0 41 -- 20:100:50 1993 2 17 -- -- 4 0 23 -- 12:100:24 1994 1 21 -- -- 1 0 23 -- 5:100:5 1995 9 24 5 6 11 0 44 -- 38:100:46 1996 2 20 7 0 7 0 29 30-45 10:100:35 1997 -- -- -- -- -- -- -- 25-40 -- 1998 -- -- -- -- -- -- -- 25-40 -- 1999 0 0 0 0 0 0 0 25-40 -- 2000 -- -- -- -- -- -- 14 20-30 -- 2001 6 16 4 0 4 3 29 30-35 38:100:25 2002 8 20 6 0 6 0 34 35-40 40:100:30 2003 -- -- -- -- -- -- -- -- -- 2004 -- -- -- -- -- -- -- -- -- 2005 2 13 3 2 5 0 20 30-40 15:100:38 2006 3 24 2 3 5 0 32 35-40 12:100:21 2007 2 37 5 7 12 0 51 50-60 15:100:32 2008 7 21 2 3 5 0 33 35-40 33:100:24 2009 15 48 14 9 23 0 86 90-95 31:100:48 2010 15 31 9 5 14 7 67 70-90 48:100:45 2011 4 55 18 5 23 0 82 90-95 7:100:42 2012 2 15 2 0 9 0 26 30-35 13:100:60 2013 4 29 3 2 5 0 38 40-45 14:100:17 2014 7 16 2 2 4 0 27 30-35 44:100:25 2015 11 41 8 3 11 0 63 65-70 27:100:27 2016 -- -- -- -- -- -- -- -- -- 2017 3 7 6 1 7 5 22 -- 21:100:50
242

Bighorn Sheep Status and Trend Report 2018
Habitat Mt. Hull Herd The Mt. Hull range has generally remained in good shape, but this may be changing. The Rocky Hull fire in 2000 appeared to initially reinvigorate natural forage production, and sheep use became more concentrated in the portion of the range that burned. Since then, increased population and noxious weed invasions may have reduced range quality. In the past, programs such as the Forest Service’s aggressive weed control effort funded by the Foundation for North American Wild Sheep (now Wild Sheep Foundation), have been helpful.
In 2017, staff of the US Forest Service Tonasket Ranger District initiated an analysis of the Mt Hull herd’s habitat conditions within the District’s boundaries. Potential management actions being analyzed include conducting prescribed fire, weed control, and other efforts to benefit bighorn sheep habitat. On the ground implementation is anticipated to begin in 2019.
Radio collar data indicates that the current landscape supports functional connectivity between the Mt. Hull herd and the bighorn sheep herd at Omak Lake to the south and the Vaseux Lake herd in British Columbia, Canada, to the north. Radio collared sheep from both the Omak Lake and the Vaseux Lake herds have traveled into the Mt. Hull herd (2010 and 2016 respectively) and then returned to their original herds. DNA testing of the Omak Lake herd indicated all animals tested but one are genetically linked to the Sinlahekin herd. The one remaining individual was genetically linked to the Mt. Hull herd. This connectivity may increase genetic mixing, but may also increase the chances of disease transmission between these herds.
Sinlahekin Herd Since the early 2000s, the majority of the Sinlahekin herd has moved north out of its traditional use area on Aeneas Mountain with the exception of a small group that continues to use the area from Aeneas Mountain south to Blue Lake within the Sinlahekin Wildlife Area. Over the years, the amount of available sheep habitat on Aeneas Mountain and in the Sinlahekin Wildlife Area had likely declined due to tree encroachment and forest succession. Management activities have been reversing this trend in recent years.
In 2005, an extensive timber thinning and prescribed fire program to reduce tree encroachment and increase forage conditions began on the Sinlahekin Wildlife Area. To date, approximately 2,500 acres within the Sinlahekin Wildlife Area has been treated with prescribed fire. Of that, approximately 1,260 acres were also thinned to reduce conifer stocking levels. The project’s ultimate goal is to thin and/or conduct prescribed fire on 2,700 acres overall. In addition, the 2015 Okanogan Complex fire burned 7,000 acres within the Sinlahekin Wildlife Area. Many of these acres are within the southern end of the Sinlahekin herds range. An aggressive weed control program, in addition to the thinning and burning efforts, should improve habitat conditions for sheep and other ungulates on the Sinlahekin Wildlife Area.
Much of the sheep foraging habitat for the Sinlahekin herd is not under WDFW control. The WADNR and US BLM maintain cattle grazing on their permits in sheep range, and most of the adjacent private land is intensively grazed. These pressures are likely to continue.
243

Bighorn Sheep Status and Trend Report 2018
Road mortality has been a minor issue in the Sinlahekin herd. Vehicles collisions have killed four mature bighorn rams and one lamb in the last 10 years.
An additional threat to both the Mt. Hull and Sinlahekin herds is the presence of domestic sheep and goats within and adjacent to their range. Wild sheep are often in close proximity to these domestic herds. This interaction may lead to the transfer of disease into these bighorn sheep herds, especially Mycoplasma ovipneumoniae, the bacterial pathogen associated with bighorn die-offs. WDFW biologists and conflict specialists have been working to encourage holders of small herds of sheep and goats to minimize risk to bighorns.
Management Conclusions Mt. Hull Herd Generally, the Mt. Hull herd has thrived in recent years, aided by improved post-fire forage conditions and genetic mixing through augmentation with neighboring herds. Changes in sheep behavior over the last few years suggest that the habitat is being strained by the increase in herd size. This herd is currently exceeding the population management objectives of 55-80 animals. Past efforts by WDFW to curb the Mt. Hull herd population growth, along with changes in land use and favorable weather have previously increased range quality, and reduced road mortalities and landowner conflicts. However, the recent increase in road mortalities and landowner complaints may indicate forage resources are becoming limiting. The proposed range improvements on USFS lands should reinvigorate range quality. WDFW supports these efforts and continues to work on improving habitat, reducing the factors associated with vehicle collisions, landowner conflicts, and separation of bighorn sheep from domestic sheep and goats.
Sinlahekin Herd The herd appears to be recovering from the precipitous decline earlier in the decade either from immigration, improved productivity, or a combination of both. Extensive prescribed fire and thinning treatments in association with weed control strategies are producing improved habitat on the Sinlahekin Wildlife Area. Maintaining separation between bighorn sheep and domestic sheep and goats is a current management priority.
244

Bighorn Sheep Status and Trend Report 2018
Bighorn Sheep Status and Trend Report: Region 2 Swakane, Chelan Butte, Manson DAVID P. VOLSEN, District Wildlife Biologist DEVON COMSTOCK, Assistant District Wildlife Biologist
Management Guidelines and Objectives Three herds of ‘California’ bighorn sheep are found in Chelan County. The Swakane herd was established in 1969 with the translocation of nine bighorn sheep from the Colockum herd (which, in turn, were descended from animals brought from near Williams, Lake, British Columbia). Between 1999-2001, 47 sheep from multiple Washington herds and 21 sheep from British Columbia were reintroduced to the north shore of Lake Chelan to establish the Manson herd, and most recently, in 2004, 35 bighorn sheep from the Cleman herd were reintroduced to establish the Chelan Butte herd. In addition, bighorn sheep from the Quilomene herd use areas in Chelan County along near Tarpiscan Creek, and along Jumpoff Ridge.
Management objectives for the Wenatchee District are: (1) increase the size and range of existing populations; (2) ensure genetic health by augmenting existing populations with bighorns from other areas; (3) minimize risk of disease from domestic sheep grazing allotments on public land, and provide information to the public about the importance of separating wild and domestics sheep; (4) reintroduce bighorn sheep into suitable unoccupied historic habitat within the District; and (5) provide recreational opportunities.
The short-term objective for the Swakane herd is to maintain a population size of 130-170 animals long-term; we estimate the habitat can support 150-180 animals (WDFW 2014). The short term objective for the Manson herd is 100-120 sheep, while the long-term objective estimates that the available habitat could support up to 200 sheep. The Chelan Butte herd has expanded from an original release of 35 in 2004, to a current estimate of roughly 200 bighorns. Although habitat analysis (Musser and Dauer 2003) suggests sufficient habitat exists for a population of 195-390 sheep in the area currently occupied by the Manson herd, concerns regarding possible movement of animals out of their core range into areas where they may encounter domestic sheep or goats have led WDFW to propose an objective of 150-170 bighorns (WDFW 2014).
Population Surveys Prior to 2009, herd population data were collected primarily from incidental reports from WDFW personnel, permit hunters, public sightings, and occasionally aerial and ground surveys during the spring and rut periods (Table 1, 2, 3). All three herds were surveyed in 2009 and uncorrected minimum counts were produced. In March of 2009, 12 sheep were outfitted with telemetry collars in both the Swakane and Manson herds (18 ewes and 6 rams). VHF collars were placed on 12 ewes and 4 rams, and GPS collars were place on 6 ewes and 2 rams. These collars improved our ability to locate sheep during ground and aerial surveys, improving survey data, population estimates, and knowledge of home range and habitat use. In 2014, an additional 13 bighorns were outfitted with GPS telemetry collars in the Manson herd to continue monitoring efforts. Typically,
245

Bighorn Sheep Status and Trend Report 2018
two ground surveys are conducted on each herd annually; a spring survey to document lamb production and a fall survey focusing on rams during the rut. Minimum population counts are produced from high counts based on sex/age composition. In 2017 the Manson herd was surveyed by helicopter in June and again by boat in the fall. Additionally, Chelan PUD made counts of bighorns as part of the 11 wildlife boat surveys on Lake Chelan (Pope and Cordell 2018). Opportunistic counts (limited survey efforts added onto other formal aerial survey projects) of the Chelan and Swakane herds were conducted by air in spring 2017, but did not produce a comprehensive estimate. In fall 2017, ground counts were conducted during the rutting period to obtain minimum counts and ratio estimates. Ground counts for both the Swakane and Chelan Butte herds follow vehicle-accessible routes along public highways, county roads and unimproved roads. However due to topographic relief and the limits of optics, these ground counts certainly underestimate herd sizes. Additionally, Chelan PUD conducted annual boat surveys along Lake Chelan that included bighorn sheep counts when possible (Pope and Cordell 2018).
Hunting Seasons and Recreational Harvest In 1999, the first ram permit was offered for the Swakane herd, followed by one permit per year from 2000-2015, increasing to 2 in 2016. Additional Swakane harvests occurred in 2009 and 2016 by statewide auction tag winners (Table 4). Currently, the bighorn season in the Swakane runs September 15-October 10. All hunters have been successful at killing a mature ram (>3/4 curl). No bighorn permit was offered in the Swakane in 2009 due to the high number of vehicle collision mortalities along SR 97A in 2008. Highway mortalities were significantly reduced with the construction of a wildlife fence along SR 97A. A drawing permit for the harvest of one bighorn ram was reinstated for the 2010 hunting season.
Two permits have been offered in the Manson unit since the hunt began in 2005. Both auction tag holders and raffle tag holders regularly harvested rams from the Manson herd. There will be two drawing permits offered for the Manson herd along the north shore of Lake Chelan for 2018.
The Chelan Butte herd was hunted for the first time in 2010, with hunters harvesting mature rams in each year since. Aerial and ground surveys of the area have confirmed an increasing herd. A second drawing permit for hunters with disability was offered in 2015. WDFW is offering two additional ram permits for the 2018 season, for a total opportunity to harvest four adult rams, as well as four ewe permits. In 2018, hunters with disabilities will have the opportunity to be drawn for 5 permits, three for bighorn ewes, and two for juvenile rams.
Survival and Mortality From 1996 to 2000, the Swakane bighorn population increased slowly (Table 1). In 2001, the population was estimated at 51 sheep, representing a 46 percent increase from the 1992-2000 average. The increased count in 2001 resulted after Swakane bands increased use of the cliffs and breaks along the Columbia River and SR 97A, allowing for better monitoring. The proliferation of residential developments and their associated ornamental plantings along the west shore of the Rocky Reach pool may have enticed bighorns to cross Highway 97A with increasing frequency. For over 30 years, no bighorn mortalities were attributed to vehicle collisions. However, the number of bighorn sheep being killed by vehicles rose steadily with numerous sheep being killed on Hwy 97A. In response to these events, multiple agencies and conservation groups, including
246

Bighorn Sheep Status and Trend Report 2018
Washington Department of Transportation, State Patrol, WDFW, and the Wenatchee Sportsmen’s Association convened a working group to address deer and bighorn sheep vehicle collisions on SR 97A, and developed plans for a wildlife fence to reduce wildlife-vehicle collisions. This wildlife fence spans nine miles, starting at milepost 203 and extending to milepost 212. Prior to being fenced this stretch of highway was identified as having some of the highest vehicle strikes in the state. While vehicle collisions have not stopped, collision rates for bighorn sheep have dropped significantly, with only five vehicle collisions in 2017 (WSDOT unpublished data).
Data collected during focused ground surveys has increased minimum counts, and in 2017 the best estimate based on multiple surveys was approximately 150 sheep. From 2011 through 2014, Swakane herd counts increased steadily. The current 2017 counts are based on fall ground surveys. Because these surveys are not exhaustive, their results are being used for ratio comparisons not population estimates. Year to year variation in the distribution of bighorns insert significant variability into minimum counts and populations estimates. When surveys return a reduced number of observations, and no other supporting data suggesting populations declines, the previous year’s count may continue to be the best estimate.
The Manson herd on Lake Chelan exhibited rapid population growth typical of a founder population in excellent quality unoccupied habitat. In 2004, June survey data were used to calculate 2002-2004 population trends, indicating a 3-year average annual population growth rate of roughly 38%. This increase seems to have slowed. Locations from telemetry data show that several bands have centralized their core use area westward up lake into steeper, rockier, habitat. Compared to the other 2 herds in this District, this herd consistently has lower lamb production. Due to the remote nature of the habitat of this herd, and the difficulty in locating sheep from the water, the population estimate of 101-122 is used from 2009, as a conservative estimate. The 2014 survey returned an observation of 113 sheep, matching 2009. The collars allowed for a productive aerial survey, where we documented the herd’s highest observed count (Table 2). In 2017, a late spring aerial survey focused on lamb production and recruitment and returned a low count of only 65 sheep, while fall boat surveys observed a minimum of 77 sheep. Chelan PUD recorded a higher minimum count of 96 bighorn sheep during their winter surveys on Lake Chelan that same year, with an estimated lamb ratio of 15.3 (Pope and Cordell 2018). The low number may have been the result of sheep being distributed differently than was anticipated for the survey. Future efforts will focus on producing a reliable herd estimate.
The Chelan Butte herd has shown rapid growth and is now expanding their range north of Chelan Butte into Deer Mtn. and Howard Flats. Recent observations of bighorns south of Knapp Coulee suggest that expansion is continuing to occur. An aerial survey of this herd was conducted to assess production and estimate numbers in 2009. A total of 84 sheep were observed in 2009, and the population was estimated at 84-98. Since 2009, this herd has shown an average 17% increase in the observed minimum count annually to a high of 207 in 2017 (Table 3). The majority of herd counts occur on the main portion of the herd on the Chelan Butte Wildlife Area Unit, so an estimate of two hundred plus sheep represents a minimum. The current 2017 counts are based on multiple-observer ground based survey conducted during the fall rut.
We estimate that roughly 20 bighorns seasonally use the Colockum and Jumpoff Ridge areas in Chelan County. These sheep are considered part of the Quilomene herd. A group of 10-15 rams
247

Bighorn Sheep Status and Trend Report 2018
are regularly seen east and south of Jumpoff Ridge. Residents report a small group of 5-9 ewes and lambs on Jumpoff Ridge and that these animals reside there from spring to fall. Due to the consistant use of these areas by the Quilomene herd, the boundary of the hunt unit was extended northward to include those sheep, allowing hunters to pursure them where possible.
Habitat Both the Chelan Butte and Swakane herds occupy low elevation sites characterized primarily by Columbia Basin grasslands and shrub-steppe habitats. These areas are dominated by bluebunch wheatgrass and big sagebrush, transitioning to arid ponderosa pine and Douglas fir forests at higher elevations. The current habitat conditions for these two herds is driven by historic land uses, the current fire regime, and the success of active habitat restoration. Although fires can be beneficial to bighorn sheep by reducing conifer encroachment and increasing the forage quality of perennial grasses and forbs, fire regimes have been altered in modern times due to fire suppression, silvicultural and grazing practices, and increased human-caused ignitions. In general, the lower elevation shrub-steppe and grassland habitat fires are increasing in frequency and are primarily human caused. As a result, vegetation communities are is being altered by reduction of the shrub component and increased invasive annual grasses and weeds. This has been the scenario in the range of the Swakane herd, with successive human caused fires in 2007, 2009, 2010 and again in 2014, which cumulatively burned 48,600 acres. In 2015, the Chelan Complex fire burned through steep canyon habitats within the northern range of the Chelan Butte herd, including an area known for holding bighorn sheep groups.
WDFW manages both the Chelan Butte and Swakane Units of the Chelan Butte Wildlife Area and has implemented active restoration projects to restore previously farmed dryland agricultural fields back to native perennial grass and shrub communities. Over the past 8 years, the agency has been successful in transforming 27 fields on Chelan Butte to native habitat with grasses, forbs and shrubs. By the end of 2017, all the fields had been seeded with native grass. Restoration of the fields has provided visible benefits to Chelan Butte’s bighorn sheep herd. By 2022, the agriculture field restoration on Chelan Butte is expected to be completed.
The Manson herd on the north shore of Lake Chelan occupies somewhat different habitat types spanning a range of ecotypes from cool season grasslands and shrubsteppe to ponderosa and lodgepole pine forests, mixed with true firs. Habitat conditions here are generally excellent, with wildfires providing disturbance to maintain high quality herbaceous forage. During summer 2001, the Rex Creek fire on the north shore of Lake Chelan burned over 53,000 acres. However, only a small portion of this burn was known occupied bighorn habitat. During summer 2002, the Deer Point fire on the north shore of Lake Chelan, and down-lake from the Rex Creek fire, burned over 43,000 acres, including most of the occupied bighorn habitat of grass, bitterbrush, mixed shrubs, and ponderosa and lodgepole pine. In October 2002, at least 25 bighorns moved northerly to the Point-No-Point area of the Rex Creek burn, apparently to take advantage of the new forage; they continue to utilize this area. In 2013, the 2,100-acre 25-Mile fire reburned a section of the Deer Point Fire.
The Manson herd occurs almost entirely on land managed by the USFS, with a few private lake front properties at the southeastern end of their range. Their occupied terrain is extremely rugged
248

Bighorn Sheep Status and Trend Report 2018
and remote with few roads. Unlike the Chelan Butte and Swakane herds, the Manson herd is not realistically threatened by development and land use conversion. However, the continued development of the community of Manson and the development of desirable parcels in the unincorporated areas north and east of the city of Chelan may present connectivity barriers for exchange between the Manson and Chelan Butte herds.
Several springs were developed or improved for bighorn sheep within the range of the Swakane herd along the breaks of the Columbia River. Prior to fence construction, ewe bands regularly moved to the river to access native riparian and ornamental forage. Completion of the SR 97A fence excluded sheep from a small amount of habitat, as they have always spent most of their time in habitats west of the highway. While developed springs are likely used by sheep, their presence is not thought to be critical to the herd.
Telemetry data indicate that sheep have not altered their seasonal use habitat patterns use in response to the newly constructed wildlife fence. The fence eliminated the bighorn’s use of a narrow band of habitat between SR 97A and the Columbia River. Those same areas are actively being developed, and the ornamental vegetation associated with houses was thought to be an attractant, drawing sheep onto and across the highway where they suffered multiple vehicle collisions. Maintaining habitat connectivity at lower elevations is a priority for managing Chelan County’s bighorn sheep herds. Between 2000 and 2015 Chelan County saw significant population growth with the addition of over 5,500 residences. Most development occurs below 2,000 ft. on slopes less than 20%. From 2017 to 2037 the unincorporated population of Chelan County is expected to grow by 3,751 people, requiring an additional 1,405 residences (Chelan County 2017).
Human-Wildlife Interaction Few official reports of agricultural damage attributed to bighorns were received in 2017; however, reports have been received in recent years from orchardists in the Swakane and Chelan Butte about the presence of bighorns in their orchards. They have expressed concerns of damage to young trees; yet no claims for damage have been filed. Observations indicate that the sheep are feeding mainly on grass within the irrigated orchards, but will feed on orchard trees. New plantings suffer the greatest damage from bighorn when this occurs. In an effort to reduce occurrences of bighorns feeding in orchards, old fences on the Chelan Butte Wildlife Area have been replaced and or upgraded. The public lands on which these bighorn sheep herds range are increasingly attracting new types, and previously unanticipated levels of recreation that may have a negative impact on bighorn sheep. This is especially true for the Chelan Butte and Swakane herds, which occupy land that is adjacent to a highly traveled interstate highway and contains numerous maintained and unmaintained roads and trails. Both mountain biking and cross-country hiking are popular activities in the Swakane Canyon and Chelan Butte areas. The creation and use of unauthorized trails on public lands creates wildlife disturbance, soil erosion and vectors for noxious weeds. In 2017, WDFW had received a proposal to establish a multi-use recreational trail on the Chelan Wildlife Area, which could potentially disrupt bighorn sheep in the area. Research conducted in other parts of the U.S. and Canada indicate that sheep exhibit a stress response to approaching humans, especially those with dogs (MacArthur et al. 1982), and can be displaced by or alter
249
Bighorn Sheep Status and Trend Report 2018
feeding habits in response to non-motorized recreation (Lowrey and Longshore 2017, Wiedmann and Bleich 2014). Discussions are under way both within WDFW and with user groups to craft solutions that meet the management objectives of the wildlife area. Due to their high visibility both the Swakane and Chelan Butte sheep herds offer excellent wildlife viewing opportunities. Because these herds do not make long distance seasonal migrations, it is possible to view rams, ewes and lambs throughout the year. The famous horn clashing battles of bighorn rams are on display each fall. With persistent searching, it is not unreasonable to expect to see 50 to 100 bighorns during the peak of the breeding season. The lack of safe pullouts along SR 97A near fall sheep congregation can sometimes create traffic hazards.
Population Augmentation There have been no bighorn sheep population augmentations in Chelan County since 2004, and no plans to translocated bighorns in the immediate future. Chelan County bighorns herds may serve as sources populations for future bighorns translocations inside Washington State, and possibly for out of state translocations. Plans are in place to trap sheep at Chelan Butte the winter of 2018-2019, allowing WDFW to capture, mark, obtain veterinary samples, and assess the herd’s heath. Research There is no formal research currently being conducted on bighorn sheep in Chelan County. Efforts to improve survey methods, and management are ongoing.
Management Conclusions The risk of disease transmission from domestic sheep is substantial for both the Swakane and Chelan Butte herds (Lyons et al. 2016). Domestic sheep were documented 6 times within the core habitat of Swakane bighorns from 2000-2007. Domestic sheep were euthanized by WDFW (with permission from owners) in 2003 and 2007.
Bighorn rams were documented in domestic sheep grazing allotments twice during 2000. WDFW and the Okanogan-Wenatchee National Forest have reduced the risk to bighorns from domestic sheep on Forest Service lands, however, no final solutions have been developed. Bighorns in Swakane are still at risk for disease transmission from domestic animals. In both 2013 and 2014, four bighorn ewes were seen multiple times near and within occupied domestic grazing allotments in the Entiat Valley. Efforts to locate and remove the bighorn sheep were unsuccessful. WDFW continues to work closely with the USFS to minimize encounters between bighorn and domestic sheep.
Also of concern are small unregistered hobby farms where domestic goats or sheep may be raised in pastures adjacent to bighorn sheep ranges. To the extent possible local WDFW staff works to identify and educate local landowners about the risks of disease transmission from domestic livestock to bighorn sheep.
250

Bighorn Sheep Status and Trend Report 2018
The Swakane bighorn population is highly accessible for viewing during the winter months. Viewing opportunities, in particular large adult rams, are highly valued by the public. Harvest management should continue to be conservative to maintain viewing opportunities.
As the population of Chelan County grows and the demand for year-round recreational opportunities on public lands increases, managers will necessarily have to evaluate and make difficult decisions regarding impacts to sensitive wildlife populations, such as bighorn sheep. Opportunities to engage in land use planning at federal, state and local levels should be a priority to secure bighorn sheep populations into the future.
The population objective of 150 sheep for the Manson herd on the north shore of Lake Chelan is conservative, based on the low potential for conflicts, US Forest Service management emphasis for bighorn sheep habitat, and the increase in habitat resulting from wildfires. Recent WDFW minimum counts have been lower than expected which may be due to a change in habitat use by bighorn sheep, due to the terrain ruggedness that results in reduce visability, or from a yet undiscovered source of additional mortality. A more consistent and intensive aerial survey design is needed to better estimate the Manson herd.
Literature Cited Chelan County. 2017. Chelan County Comprehensive Plan 2017-2037. 284 pp. Lowrey, C. & Longshore, K.M. 2017. Tolerance to disturbance regulated by attractiveness of
resources: A case study of Desert bighorn sheep within the River Mountains, Nevada. Western North American Naturalist. 77(1). 82-98
Lyons, A.L., Gaines, W.L., & Begley, J. 2016. Application of the Bighorn Sheep Risk of Contact Model on the Okanogan-Wenatchee National Forest, Final Report. Washington Conservation Science Institute. 49 pp.
MacArthur, R.A., Geist, R. & Johnston, H. 1982. Cardiac and Behavioral Responses of Mountain Sheep to Human Disturbance. Journal of Wildlife Management. 46. 351-358.
Musser, J., and P. Dauer. 2003. Bighorn reintroduction site evaluation. USDI-BLM WenatcheeResource Area. 14p. Washington Department of Wildlife. 2008. 2009-2015 Game Management Plan. Wildlife Program, WDFW, Olympia, Washington, USA.
Pope, V. R. and Cordell, K. A. 2018. Lake Chelan Annual Winter Wildlife Survey Report: Winter of 2017-2018. Chelan Public Utility District, Wenatchee WA.
Washington Department of Wildlife. 2014. 2015-2021 Game Management Plan. Washington Department of Fish and Wildlife. Olympia, WA.
Wiedmann, B.P. & Bleich, V.C. 2014. Demographic Responses of Bighorn Sheep to Recreational Activities. A Trial of a Trail. Wildlife Society Bulletin. 38(4). 773-782.
251

Bighorn Sheep Status and Trend Report 2018
Table 1. Observed population composition of the Swakane bighorn sheep herd, 2008-2017
Table 2. Observed population composition of the Manson bighorn sheep herd, 2008-2017
Year Lambs Ewes Yrl<3/4 curl
>3/4 curl
Total rams
Total sheep
Lambs: 100 ewes
Rams: 100 ewes
2008 6 31 7 4 5 16 98* 19 522009 11 59 5 7 26 43 113 19 732010 11 58 15 17 32 101 19 552011 10 51 6 21 25 86 20 492012 15 52 2 7 13 22 89 29 42
2013* 18 65 6 11 18 101 28 262014 23 66 6 7 11 24 113 35 382015 - - - - - - - - -2016 7 49 0 7 2 9 65 14 18
2017** 5 24 0 25 5 30 77 21 125
**2017 counts include unclassified sheep2017 ram:ewe ratio based on limited fall counts
* Spring 2013 count incomplete. **2017 counts include unclassified sheep
Year Lambs Ewes Yrl <3/4curl > 3/4 curl
Total rams
Total sheep
Lambs: 100 ewes
Rams: 100 ewes
2008 13 24 5 4 12 21 58 54 88 2009 17 34 5 5 20 30 81 50 88 2010 17 44 13 13 26 87 39 59 2011 13 63 14 16 23 107 22 48 2012 24 58 4 17 19 40 122 41 67 2013 27 63 12 29 41 131 43 65 2014 31 62 6 17 23 46 139 50 74 2015 - - - - - - - - -
2016* 6 30 0 9 13 22 57 30 73 2017** 4 55 0 42 23 65 150 7 118
* High counts from multiple surveys. **2017 counts include unclassified sheep 2017 ram:ewe ratio based on limited fall counts
252

Bighorn Sheep Status and Trend Report 2018
Table 3. Observed population composition of the Chelan Butte bighorn sheep herd, 2008-2017
Table 4A: 10 Yr. Summary of ram harvest: Swakane
Year Lambs Ewes Yrl <3/4 curl >3/4 curlTotal rams
Total sheep
Lambs: 100 ewes
Rams: 100 ewes
2008 10 32 21 63 31 662009 12 48 7 3 14 24 84 25 502010 16 50 17 18 35 101 32 702011 19 46 15 13 28 93 41 612012 13 72 8 10 25 43 128 18 582013 25 97 17 26 41 163 26 422014 34 97 9 11 32 52 183 35 542015 - - - - - - - - -
2016* 21 34 4 11 21 32 130 64 702017** 34 90 0 29 21 50 207 38 56
* High counts from multiple surveys. **2017 counts include unclassified sheep
Year Permits Harvest Comments2008 1 12009 0 0 **2010 1 12011 1 12012 1 12013 1 12014 1 12015 1 12016 3 3 *2017 2 2Total 12 12
* Includes harvest by Auction tag holder.** No tag offered due to excessive vehicle mortalities.
253

Bighorn Sheep Status and Trend Report 2018
Table 4B: 10 Yr. Summary of ram harvest: Manson
Table 4C: 10 Yr. Summary of ram & ewe harvest: Chelan Butte
Year Permits Harvest Comments2008 2 22009 2 12010 2 4 *2011 2 4 *2012 2 3 *2013 2 3 *2014 2 22015 2 22016 2 22017 2 2Total 20 25
* Includes harvest by Auction and/or Raffle tag holders.
Year Permits Disabled Hunt Permits Harvest Comments2010 1 ₋ 12011 1 ₋ 12012 1 ₋ 12013 1 ₋ 12014 1 ₋ 12015 4 3 5 *2016 6 4 7 *2017 6 4 5Total 21 11 22
* Includes harvest by Auction and/or Raffle tag holders.* First ewe tags offered in 2015
254

Bighorn Sheep Status and Trend Report 2018
Bighorn Sheep Status and Trend Report: Region 3 Quilomene, Cleman Mountain, Umtanum/Selah Butte, and Tieton
JEFFREY BERNATOWICZ, Wildlife Biologist
Management Guidelines and Objectives The statewide goals for bighorn sheep are:
1. Preserve, protect, perpetuate, and manage bighorn sheep and their habitats to ensure healthy, productive populations.
2. Manage bighorn sheep for a variety of recreational, educational and aesthetic purposes including hunting, scientific study, cultural and ceremonial uses by Native Americans, wildlife viewing and photography.
3. Manage for sustained yield. 4. Numerical goals for each herd are provided in Tables 2-5.
Population Surveys Quilomene and Umtanum/ Selah Butte had historically been surveyed via helicopter in July. The survey timing was not a good index to actual recruitment or optimal for detecting disease problems. In 2014, surveys were changed to March. Cleman Mountain is surveyed at the feeding station in December/January.
Umtanum and Selah Butte were surveyed from helicopter and the ground numerous times from late 2009 through 2016, due to a disease outbreak and research project. Ground surveys are conducted in August/September to index early lamb recruitment. Final recruitment surveys are done in February/March. In 2017, all surveys were done from ground. All available information is used to estimate the total population. Survey results are given in Tables 2- 5.
Hunting Seasons and Recreational Harvest Region 3 supports three populations of ‘California’ Bighorn Sheep: Cleman Mountain, Umtanum/Selah Butte, and Quilomene. The Tieton herd was removed due to a pneumonia outbreak in 2013. Hunting is by permit. The number of permits (WDFW only) and harvest are given in Table 1. The Yakama Nation (YN) typically matches WDFW permits one to one for all herds. The Muckleshoot Indian Tribe also issues permits for the Cleman Mountain and Umtanum/Selah Butte herds. YN does not report harvest, but their hunters are often encountered by the public/WDFW enforcement. When YN harvest is available to WDFW, it is included in Table 1.
Survival and Mortality Bighorn sheep were native to Region 3, but had been eliminated by over hunting and disease by the early 1900s. All existing populations are the result of reintroductions.
The Quilomene reintroduction was the first in the region (early 1960s) and the population was estimated at over 100 animals by the late 1960s. The population then crashed in the early 1970s.
255

Bighorn Sheep Status and Trend Report 2018
The cause of the decline was unknown, but the population had reportedly died out by 1990. Reintroduction occurred again in 1993. By 1996, 41 bighorns had been released in the area. The Quilomene population quickly grew to over 160 sheep (Table 2). Poor recruitment, observations of coughing sheep, and reports of mortalities indicated a disease outbreak circa 2004-2006. Adult ewe counts had been declining and reached lows in 2014. In 2013, a large, fast-moving fire went through the north portion of the herd area. Post-fire, sheep were difficult to find. This was apparently due to a shift in range, as numbers rebounded to expected levels in 2015. Lamb recruitment has been fairly low, but the population is at objective. The herd was augmented with 8 ewes, 7 lambs, and 6 rams obtained from the Cleman Mountain herd in January 2017. This augmentation increase Quilomene to the highest level since re-introduction.
The Cleman Mountain population was established in 1967 with the release of 8 animals. The herd remained relatively stable for over 20 years. A portion of the population was captured, tested, and treated with antibiotics in 1990. Augmentation included 27 animals during 1989-96. Production increased after 1996, and the population exceeded 150 animals by 2000 (Table 2). Over 165 sheep have been captured and translocated from this herd since 2001. Another 150 sheep have been harvested during that period and the population is still above objective. The Cleman Mountain herd continues to produce a large number of lambs and continues to grow. The Cleman herd is at high risk of contracting bacteria associated with pneumonia outbreaks due to nearby domestic sheep grazing allotments. Concerns have led to frequent testing; the most recent testing was in January 2017. No evidence of pneumonia or associated bacteria was detected.
The Cleman herd has been very strong, and it had been difficult keeping the herd at objective. Winter 2016-17 was relatively severe for Cleman sheep, with deep crusted snow persisting into March. The bighorns are fed by WDFW during winter, but oddly most adult rams stopped coming to the feed site in early January of 2017. Fifteen adult rams died within 1 mile of the feed site that winter. Most carcasses were decomposed upon investigation, but starvation was initially suspected. A taxidermist cleaning the skulls reported corn in the throat of many of the rams. A well-meaning person may have fed corn to animals, causing corn toxicity (acidosis), which is fairly common in ruminants. The die-off decreased the ram portion of the population, but another banner lamb crop pushed the herd back over objective. Ewe permits have been increased for 2018.
The Umtanum herd was established in 1970 with the release of 8 bighorns west of the Yakima River. Within 15 years, the population grew to an estimated 200 animals, and some sheep crossed the Yakima River. Originally, sheep on the east side of the river were considered a separate herd (Selah Butte). Surveys have shown that animals cross the river in both directions, and it is now considered a single herd. In 2001, 11 sheep were released at the south end of the canyon, near Roza Dam.
Population estimates for Umtanum/Selah Butte varied between 170 and 200 animals until 2002. Dispersal, winter mortality, and the removal of 52 sheep for augmenting other populations probably kept the numbers stable. The increase, after 2002, was largely due to the release of 11 animals and a subsequent increase in lamb production. Harvest was increased during this period to maintain a stable population.
In December 2009, an outbreak of pneumonia was discovered at the north end of Umtanum. Disease loss and culling removed approximately 50% of the Umtanum herd by April 2010. The
256

Bighorn Sheep Status and Trend Report 2018
bacterial pneumonia jumped to the east of the river (Selah Butte) in summer 2010, but no significant adult mortality was noted. By August 2010, low lamb survival was apparent on both sides of the river. Lamb and adult survival was very high in 2011 and 2012. It appeared the herd had recovered and was back at objective. However, testing of 31 animals in February 2013 found Mycoplasma ovipneumoniae (M. ovi) in one young ram. Adult survival has been high since 2013, but lamb recruitment was low during 2013 through 2017. Samples were collected from sheep on both sides of the river, pneumonia was confirmed, as was the same strain of M. ovi that evidently entered the population in 2010. Bernatowicz et al. (2016) provides a full accounting of the experience with pneumonia in the Umtanum/Selah herds (available at http://media.nwsgc.org/proceedings/NWSGC-2016/Bernatowicz_NWSGC20_38-61.pdf). In early fall 2015, there was also an apparent outbreak of blue-tongue virus. Two ram carcasses tested positive, as did one road-killed ewe. Current harvest rates on this herd are probably not sustainable.
The Tieton herd was established with the release of 54 sheep during 1998-2002. Subsequent radio-telemetry indicated relatively low mortality and high lamb recruitment. An aerial survey in 2008 confirmed the population was over objective. Sixty-five animals were removed for translocation during 2009-2012. During the captures, crews confirmed population estimates, and the herd was found to be disease free (last capture March 2012). Harvest removed 49 animals during 2009-2012 in an attempt to keep the population near population objectives. In March 2013, a pneumonia outbreak was confirmed. Mortality appeared to be high, and a decision was made to euthanize the remaining animals to prevent spread to the nearby healthy Cleman Mountain herd. A total of 57 bighorns were euthanized. Pneumonia and M. ovi were confirmed in all samples. The strain of M. ovi in the Tieton herd was different than that found in the Yakima River Canyon sheep.
Habitat Forage resources vary annually with moisture. Precipitation had been near or above average 2010-2012, undoubtedly increasing forage production. Drought conditions returned in 2013-2016. A significant portion of the north Quilomene range burned in 2013. The impact of fire is unknown. In forested areas, fires can decrease cover and increase browse. In more arid climates, fires can reduce plant diversity. Moisture was high fall 2016 through spring 2017, increasing total forage for all herbivores.
Population Augmentation The Quilomene herd received 21 sheep from the Cleman Mountain herd in January 2017. This augmentation was more driven by opportunity than necessity. The Cleman herd has been over objective and are easy to trap at the winter feed site. There was also a desire to learn more about Quilomene sheep via GPS collars.
No habitat enhancement projects have been funded for bighorn sheep in the region. In general, bighorn habitat is difficult to work in and success of any habitat projects would be limited due to shallow soils and arid conditions. Sheep at Cleman Mountain are fed during the winter, mostly to make periodic trapping easier.
The most beneficial projects to bighorn populations would be to reduce/eliminate contact with domestic sheep/goats. In 2006, a large private ranch in Quilomene was purchased by WDFW, and
257

Bighorn Sheep Status and Trend Report 2018
domestic sheep grazing was subsequently eliminated. Similar efforts have secured habitat and reduced risk of domestic/bighorn interactions within the Cleman Mountain herd range.
Management Conclusions The main threat to bighorn sheep in the region is bacterial pneumonia caused by contact with domestic sheep/goats. The Tieton herd was eliminated and current plans call for holding off on reintroduction until the risk of contact with domestic sheep or goats is substantially reduced. The Yakima River Canyon herd initially rebounded from die-off during winter 2009-10, but currently suffers from low lamb recruitment most years and is decreasing slowly. The low recruitment also means a population that has more old than young animals. If a mangememt action such as “Test and Cull” were to be done in the Yakima Canyon herd, it should be done soon while the herd still has productive ewes.
Disease outbreaks are not unexpected because domestic sheep and/or goats have been documented in close proximity to bighorns in every herd in the Region. Reducing/eliminating risk of contact between bighorns and domestics is essential to the long-term viability and health of bighorns. It may be possible to develop M. ovi-free animals in small-sized domestic herds grazed on private lands. This would reduce the risk of pneumonia. For some herds (e.g., Tieton), the larger risk comes from domestic sheep grazing on public (USFS) land.
Literature Cited Bernatowicz, J., D. Bruning, E. F. Cassirer, R. B. Harris, K. Mansfield, and P. Wik. 2016.
Management responses to pneumonia outbreaks in three Washington state bighorn herds: lessons learned and questions yet unanswered. Biennial Symposium of the Northern Wild Sheep and Goat Council 20: 38-61.
258

Bighorn Sheep Status and Trend Report 2018
Table 1. Summary of bighorn sheep ram harvest in Region 3 since 2007. Area Year Permits Harvest Comments Cleman Mountain 2007 10 10 Harvest includes raffle hunter, 1 no report 2008 10 11 Harvest includes raffle, auction, tribal 2009 6 9 Harvest includes tribal 2010 6 8 Harvest includes raffle hunter, tribal 2011 6 13 Harvest includes raffle hunter, tribal 2012 12 24 Harvest includes raffle hunter, tribal 2013 10 18 Harvest includes raffle hunter, tribal 2014 8 11 Harvest includes raffle hunter, tribal 2015 6 6 Harvest includes tribal
2016
6 Ram,10
Ewe 8 Ram,11
Ewe Harvest includes tribal
2017 3 Ram. 10
ewe 5 ram, 7
ewe Harvest includes tribal Umtanum/Selah Butte 2007 10 9 1 no report 2008 10 14 Harvest includes tribal (2 ewes, 2 rams) 2009 15 18 Harvest includes auction, tribal 2010 10 15 Harvest includes raffle hunter, tribal 2011 8 12 Harvest includes tribal 2012 5 11 Harvest includes tribal 2013 5 9 Harvest includes tribal 2014 6 8 Harvest includes tribal 2015 5 8 Harvest includes raffle hunter, tribal 2016 4 8 Harvest includes raffle hunter, tribal 2017 4 8 Harvest includes raffle hunter, tribal Quilomene 2007 6 6 2008 4 5 Harvest includes tribal 2009 4 5 Harvest includes tribal 2010 4 4 2011 4 5 Harvest includes auction hunter 2012 3 4 Harvest includes tribal 2013 3 4 Harvest includes tribal 2014 3 3 2015 2 2 2016 2 2 2017 2 3 Harvest includes tribal
259

Bighorn Sheep Status and Trend Report 2018
Table 2. Quilomene Population Composition Total Adult Total Estimated Short-term
Year Lambs Ewes Rams Rams Count Population Objective 2007 44 75 32 26 151 160 2008 33 77 14 11 124 160 2009 27 86 32 23 145 160 2010 25 57 20 14 102 160 2011 11 48 15 15 74 150 2012 41 65 43 37 149 160 2014 18 34 28 20 83 100 2015 20 93 47 44 160 160 2016 17 73 72 54 162 170 2017 No Survey 2018 23 95 69 58 187 190 200
Table 3. Cleman Mt. Population Composition
Total Adult Total Estimated Short-term Year Lambs Ewes Rams Rams Count Population Objective 2007 20 100 68 50 198 2008 40 85 64 40 174 2009 30 98 70 45 198 2010 35 83 60 48 201 201 2011 34 83 88 65 205 205 2012 30 78 59 59 167 180 2013 45 101 60 50 206 210 2014 235 2015 50 129 80 60 259 260 2016 30 145 40 30 215 215 2017 42 152 46 35 240 250 170-220
260

Bighorn Sheep Status and Trend Report 2018
Table 4. Umtanum/Selah Butte Population Composition
Total Adult Total Estimated Short-term Year Lambs Ewes Rams Rams Count Population Objective 2007 54 120 68 55 242 300 2008 63 156 60 51 *279 300 2009 47 149 62 52 257 300 2010 23 90 63 60 176 210 2011 33 109 53 50 195 220 2012 65 155 68 57 *288 270 2013 42 80 13 135 270 2014 14 168 85 58 267 270 2015 13 168 57 49 238 265 2016 33 144 30 26 233 260 2017 11 160 46 40 217 240 2018 11 121 31 26 152 230 250-300
* Probable double count of ewes and lambs Table 5. Tieton Maximum June Population
Total Adult Total Estimated Long-term Year Lambs Ewes Rams Rams Count Population Potential 2000 11 24 11 46 46 2001 13 35 19 67 67 2002 10 30 8 8 48 70 2003 10 40 20 11 70 80 2004 19 33 5 57 90 2005 20 88 4 3 112 110 250 2006 35 55 40 37 130 135 250 2007 23 63 7 0 93 160 250 2008 54 81 32 16 167 200 250 2009 200 250 2010 40 72 89 48 200 250 2012 33 66 24 16 125 150 250 2013 Herd Eliminated 250
261

262

Moose
263

Moose Status and Trend Report 2018
Moose Status and Trend Report STATEWIDE
RICHARD B. HARRIS, Special Species Section Manager ANNEMARIE PRINCE, Wildlife Biologist MICHAEL ATAMIAN, Wildlife Biologist CARRIE LOWE, Wildlife Biologist JARED OYSTER, Wildlife Biologist DANA L. BASE, Wildlife Biologist
Introduction Moose (Alces alces) apparently migrated on their own accord into eastern Pend Oreille County, Washington in the 1950s. The first official state documentation of moose in Washington occurred in 1954 (Poelker 1972), although the literature reports a bull moose that was taken by hunting on the Colville Indian Reservation in 1929 (Scheffer and Dalquest 1944). In the decades since, moose have increased both in numbers and distribution and are now common in northeast Washington and can be found in smaller populations in the Okanogan and Blue Mountains; a few scattered individuals have colonized the east slopes of the Cascades. Moose have been documented to wander into many other places throughout the state including the high desert country of the Columbia Basin (WDFW 2014). Management Guidelines and Objectives The statewide goals for moose (WDFW 2014) are to:
1. Preserve, protect, perpetuate, and manage moose and their habitats to ensure healthy, productive populations.
2. Manage moose for a variety of recreational, educational, and aesthetic purposes including hunting, scientific study, cultural and ceremonial uses by Native Americans, wildlife viewing, and photography.
3. Manage statewide moose populations for a sustained yield. 4. Manage moose populations with a rigorous, data-based system.
Population Surveys District level surveys were conducted using a helicopter and generally occurred between December and February. These surveys assisted district biologists in crafting permit level recommendations, and generally supported information from hunts indicating a continued positive trend in the moose population in northeastern Washington (Harris et al., 2015). A more rigorous aerial survey protocol that covered the entire northeastern WA moose population was initiated in winter 2013/14 and continued through the winter of 2015/16. The intent of this survey was to provide a baseline population estimate from which future trends will be assessed. A full report appears as Oyster et al. (2018).
264
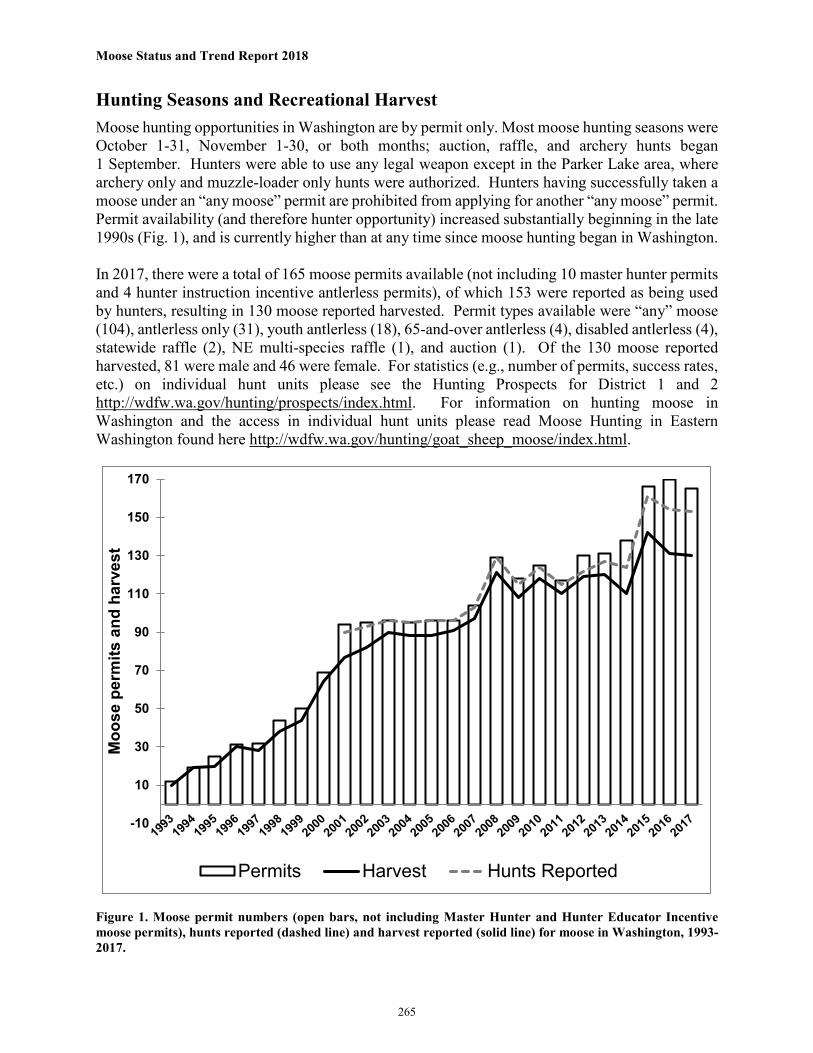
Moose Status and Trend Report 2018
Hunting Seasons and Recreational Harvest Moose hunting opportunities in Washington are by permit only. Most moose hunting seasons were October 1-31, November 1-30, or both months; auction, raffle, and archery hunts began 1 September. Hunters were able to use any legal weapon except in the Parker Lake area, where archery only and muzzle-loader only hunts were authorized. Hunters having successfully taken a moose under an “any moose” permit are prohibited from applying for another “any moose” permit. Permit availability (and therefore hunter opportunity) increased substantially beginning in the late 1990s (Fig. 1), and is currently higher than at any time since moose hunting began in Washington. In 2017, there were a total of 165 moose permits available (not including 10 master hunter permits and 4 hunter instruction incentive antlerless permits), of which 153 were reported as being used by hunters, resulting in 130 moose reported harvested. Permit types available were “any” moose (104), antlerless only (31), youth antlerless (18), 65-and-over antlerless (4), disabled antlerless (4), statewide raffle (2), NE multi-species raffle (1), and auction (1). Of the 130 moose reported harvested, 81 were male and 46 were female. For statistics (e.g., number of permits, success rates, etc.) on individual hunt units please see the Hunting Prospects for District 1 and 2 http://wdfw.wa.gov/hunting/prospects/index.html. For information on hunting moose in Washington and the access in individual hunt units please read Moose Hunting in Eastern Washington found here http://wdfw.wa.gov/hunting/goat_sheep_moose/index.html.
Figure 1. Moose permit numbers (open bars, not including Master Hunter and Hunter Educator Incentive moose permits), hunts reported (dashed line) and harvest reported (solid line) for moose in Washington, 1993-2017.
-10
10
30
50
70
90
110
130
150
170
Moo
se p
erm
its a
nd h
arve
st
Permits Harvest Hunts Reported
265

Moose Status and Trend Report 2018
Habitat Moose prefer 10-20 year old clear-cuts, burned areas, or thinned stands on mesic sites. Forested cover is important during summer heat and deep winter snow (Costain 1989). As timber harvest has declined on public lands, private industrial timberlands have come to provide a large portion of moose range in Washington. Forest regeneration in these areas tends to produce dense stands of willow, serviceberry, ceanothus, and other shrubs which are preferred browse. However, recently private industrial forests have begun using herbicides to control shrubs to reduce competition for regenerating coniferous trees. Moose can be found at any elevation in Washington, but are most likely found in the 3,000 to 5,000 foot elevation band and are commonly drawn to north slopes or east flowing drainages, which are cool and moist.
Human-Wildlife Interaction Individual moose can create human safety or nuisance concerns, especially within the metropolitan area of Spokane. The procedure for addressing moose within the urban/suburban area is outlined in the WDFW Dangerous Wildlife Policy. WDFW’s Enforcement Program takes the lead on moose incident reports in and near the city. Incidents range from single moose sightings in semi-rural areas resulting in dissemination of literature and discussion on living with wildlife; to moose in dangerous situations requiring immobilization and translocation or euthanization. The number of moose incidents per year has been as high as 87 in 2001, and as low as 16 in 2009. A Master Hunter moose damage/nuisance hunt was initiated in 2009 and has continued through 2017 in District 2 (GMUs 124-142). This hunt is a limited entry hunt (10 Master Hunters only) and runs from August 1 through March 31. These permits are not activated until damage has occurred and viability for a hunt has been determined by WDFW Enforcement. Research With financial and logistic support from WDFW, the University of Montana (UM) has taken the lead in understanding factors controlling demographic parameters of moose in 2 study areas north of Spokane. A total of 74 cow moose were fitted with radio-collars during December 2013, 2014, and 2016. Survival rates of these cohorts are being estimated, as well as cause of death (in most cases). We have not captured or instrumented calves, but are monitoring their survival indirectly by ground-based monitoring of their mothers. UM discontinued their lead role on field work in May 2018; we expect a Ph.D. thesis and attendant publications in spring 2020.
Management Concerns Fire suppression, reduced timber harvest, herbicide treatment of broadleaf shrubs that moose browse in regenerating forest, and human development continue to degrade moose foraging habitat. Moose are adapted to colonize forested areas post-disturbance. They can persist at low densities in Washington’s forested areas without disturbance, but we expect to see a tempering of population increase unless early seral habitats (e.g., shrub-fields) can be sustained in a mosaic with mature forest (as needed for cover). Climate change may pose challenges for moose populations in the future, both from the direct energetic effects (moose are adapted to cold climates and become heat stressed, both in summer and winter, when temperatures exceed their thermo-neutral tolerances), and indirect effects (if
266

Moose Status and Trend Report 2018
parasites typically harbored by moose become excessively numerous). From 2014 through 2017, WDFW also monitored for the presence and prevalence of the arterial worm Eleaophora schneideri, whose typical host is mule deer but has been documented in moose elsewhere in the lower 48 US states. A total of 126 carcasses were inspected, of which we were able to determine presence or absence of E. schneideri in 80. E. schneideri was detected in the arteries of 3 of these 80 moose; however none of these moose showed outward signs of infection. Histology performed at the Washington Disease Diagnostic Laboratory at Washington State University detected additional damage to the carotid artery of a number of moose, but whether or not these animals were infected with E. schneideri remains unclear. Moose are susceptible to morbidity and mortality from the brain worm Parelaphostrongylus tenuis, whose normal host is the white-tailed deer. P. tenuis has not yet been documented in or west of the Rocky Mountains. Management Conclusions In contrast to many areas along the southern extent of their North American distribution, moose have done well in Washington over the past few decades (WDFW 2015, Base et al. 2006, Nadeau et al. 2017). Hunter demand continues to far exceed supply, thus even if permit levels are increased, moose hunting will be a rare (and generally once-per-lifetime) experience for Washingtonians. Although the new aerial survey protocol is showing promise, tracking moose population trends long-term over large areas will likely always be approximate, and prone to time-lags. Moose may continue to increase outside of their base in Northeastern Washington, and it is possible that, in the future, hunting opportunities can be developed in other parts of the state. We believe we have begun seeing a marked decline, as the moose population has likely exceeded the capacity of available forage and as other natural factors (e.g., predators, parasites) respond to their abundance.
Literature Cited Base, D.L., S. Zender, and D. Martorello. 2006. History, status, and hunter harvest of moose in
Washington state. Alces 42:111-114. Costain, B. 1989. Habitat Use Patterns and Population Trends Among Shiras Moose, MS degree,
U. of Montana. Harris, R.B., M. Atamian, H. Ferguson, and I. Keren. 2015. Estimating moose abundance and
trends in northeastern Washington state: Index counts, sightability models, and reducing uncertainty. Alces 51:1-13.
Nadeau, M. S., N. J. DeCesare, D. G. Brimeyer, E. J. Bergman, R. B. Harris, K. R. Hersey, K. K.
Huebner, P. E. Matthews, and T. P. Thomas. 2017. Status and trends of moose populations and hunting opportunity in the western United States. Alces 53: 99-112.
Oyster, J. H., I. N. Keren, S. J. K. Hansen, and R. B. Harris. 2018. Hierarchical mark‐recapture
distance sampling to estimate moose abundance. Journal of Wildlife Management 82: 1668-1679.
267

Moose Status and Trend Report 2018
Poelker, R. J. 1972. The Shiras Moose in Washington. Unpublished administrative report. Washington Department of Game, Olympia, Washington, USA.
Scheffer, V. B., and W. W. Dalquest. 1944. Records of mountain goat and moose from
Washington State. Journal of Mammalogy 25: 412-413. Washington Department of Fish and Wildlife. 2014. 2015-2021 Game Management Plan. Wildlife
Program, Washington Department of Fish and Wildlife, Olympia, WA.
268

Cougar
269
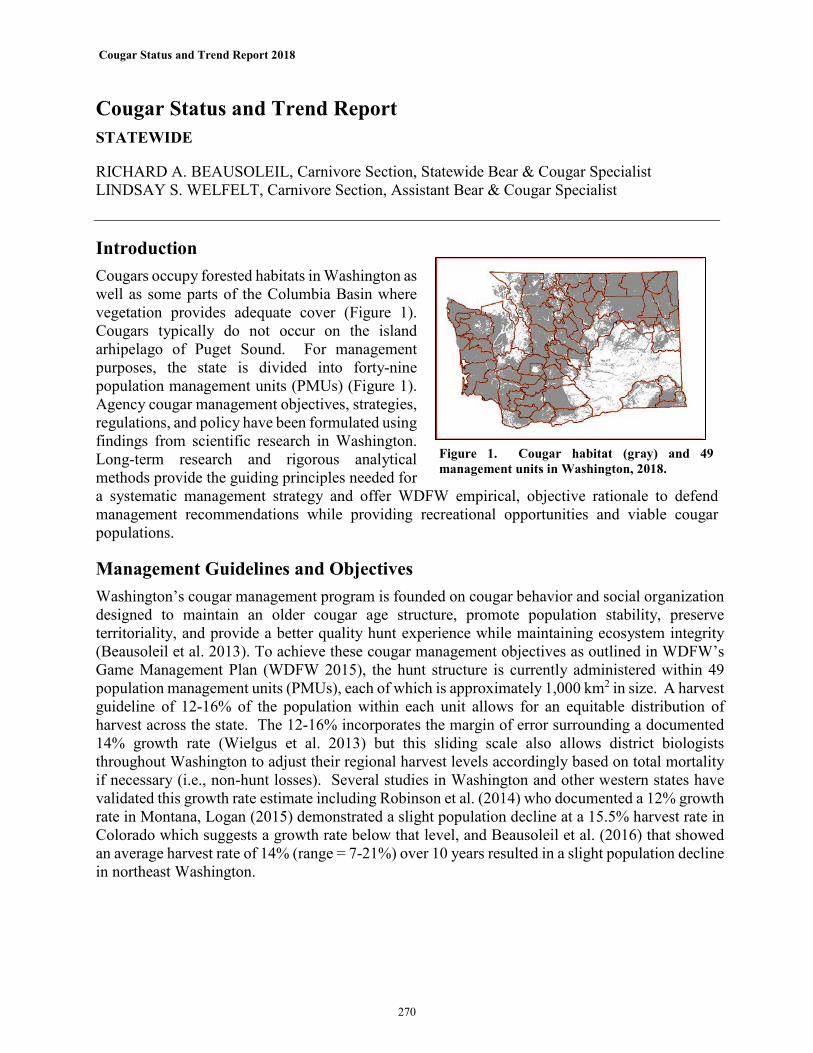
Cougar Status and Trend Report 2018
Cougar Status and Trend Report STATEWIDE
RICHARD A. BEAUSOLEIL, Carnivore Section, Statewide Bear & Cougar Specialist LINDSAY S. WELFELT, Carnivore Section, Assistant Bear & Cougar Specialist
Introduction Cougars occupy forested habitats in Washington as well as some parts of the Columbia Basin where vegetation provides adequate cover (Figure 1). Cougars typically do not occur on the island arhipelago of Puget Sound. For management purposes, the state is divided into forty-nine population management units (PMUs) (Figure 1). Agency cougar management objectives, strategies, regulations, and policy have been formulated using findings from scientific research in Washington. Long-term research and rigorous analytical methods provide the guiding principles needed for a systematic management strategy and offer WDFW empirical, objective rationale to defend management recommendations while providing recreational opportunities and viable cougar populations.
Management Guidelines and Objectives Washington’s cougar management program is founded on cougar behavior and social organization designed to maintain an older cougar age structure, promote population stability, preserve territoriality, and provide a better quality hunt experience while maintaining ecosystem integrity (Beausoleil et al. 2013). To achieve these cougar management objectives as outlined in WDFW’s Game Management Plan (WDFW 2015), the hunt structure is currently administered within 49 population management units (PMUs), each of which is approximately 1,000 km2 in size. A harvest guideline of 12-16% of the population within each unit allows for an equitable distribution of harvest across the state. The 12-16% incorporates the margin of error surrounding a documented 14% growth rate (Wielgus et al. 2013) but this sliding scale also allows district biologists throughout Washington to adjust their regional harvest levels accordingly based on total mortality if necessary (i.e., non-hunt losses). Several studies in Washington and other western states have validated this growth rate estimate including Robinson et al. (2014) who documented a 12% growth rate in Montana, Logan (2015) demonstrated a slight population decline at a 15.5% harvest rate in Colorado which suggests a growth rate below that level, and Beausoleil et al. (2016) that showed an average harvest rate of 14% (range = 7-21%) over 10 years resulted in a slight population decline in northeast Washington.
Figure 1. Cougar habitat (gray) and 49 management units in Washington, 2018.
270

Cougar Status and Trend Report 2018
Population Surveys Over the past 16 years rigorous population surveys and analyses have been conducted through long-term cougar research throughout the state. In past status and trend reports, the Department provided adult only (>2 years old) population estimates but recently included all independent aged cougars (>18 months), currently the average density of cougars is 2.2 cougars/100km2 in Washington. When multiplied by the available habitat the independent-aged statewide population is estimated at 2,300 cougars. Due to their social behavior and because territories of male cougars are strongly defended against other males while overlapping home ranges of several females, an average density of cougars can be used with a high degree of confidence. Therefore, territories of adult males are often arranged on the landscape like pieces of a puzzle, with relatively low overlap; females are similarly arranged but they are typically not territorial. Similar densities from long-term studies have been demonstrated in throughout western North America (Quigley and Hornocker 2010). Through this behavioral-based territoriality, cougar population size is limited by the amount of available habitat. With a greater understanding of this type of social organization, Washington managers can incorporate and consider the impacts of differing levels of cougar harvest on population growth as well as social organization.
Hunting Seasons and Recreational Harvest Hunting with the aid of hounds has been banned by voter Initiative 655 for 22 years. Since then, cougar harvest has increased an average of 58%, a result of longer seasons which provide more opportunity. The cougar hunting season is currently 242 days, an increase from 212 days in the late 1990’s and early 2000’s, and from 60-70 days the 2 decades prior (Figure 2). Washington currently uses a split recreational harvest season structure (early and late season); which only allows for closure of PMUs that reach the harvest guideline beginning January 1. Over the past 10 years Washington’s average annual cougar hunter harvest is 169 animals and when incorporating all mortality types averages 206 animals annually (Table 1). Under the current harvest guidelines which are applied to all 49 population management units statewide, WDFW is able to provide older-aged animals on the landscape, allowing harvest to be more equitable across the entire jurisdiction and the state. Additionally, when closures do occur, the current approach does not apply to a large-scale landscape resulting in less impact to hunter experience During the 6 years using the current structure, an average of 29% of PMU’s closed during the season (range = 16-46%) but harvest is expanding as intended. Over time several methods have been implemented to collect information from hunter-harvested cougars including collecting cougar teeth via mandatory sealing since 1985 and DNA since 2003. The Department also has maintained a cougar harvest reporting hotline since 2004.
271

Cougar Status and Trend Report 2018
Table 1. Cougar mortalitya in Washington by year, sex, and type, 2008-2018.
Year Hunt
Season Male
Hunt Season Female
Hunt Season Sex Unknown
Otherb Male
Mortality
Otherb Female
Mortality
Otherb Unknown Sex
Mortality
Total Mortality
2008-09 62 94 4 13 10 1 184 2009-10 69 67 2 14 17 0 169 2010-11 82 74 1 11 17 0 185 2011-12 62 54 7 20 9 3 155 2012-13 60 82 5 18 13 1 179 2013-14 78 100 4 28 17 2 229 2014-15 68 88 7 26 13 2 204 2015-16 82 87 3 24 15 2 213 2016-17 110 107 5 33 19 2 276 2017-18 95 124 3 22 22 1 267
Total 768 877 41 209 152 14 2061 aDoes not include tribal cougar harvest bOther mortality includes unknown mortality type (44%), Depredation (35%), landowner kill (9%) roadkill (6%) and poaching (5%).
Figure 2. Cougar hunting seasons and numbers of cougar harvested in Washington 1979-2017, WDFW 2018.
272

Cougar Status and Trend Report 2018
Survival and Mortality Hunting is the main source of mortality for cougar populations across all study areas in Washington at an average of 48%. In areas of low hunt pressure, natural mortality resulting from intraspecific strife is the leading source of mortality, ranging from 12 to 44% depending on the region of the state. Male survival is typically lower than female, however female survival is the most important factor in determining population growth. Department research estimates annual female survival at an average of 67%, which is dependent on locale.
Habitat Available cougar habitat was recently reassessed in 2018 using research data and the current habitat estimate encompasses approximately 104,500 km2 throughout Washington; 91,000 km2 of which WDFW manages hunting opportunity for. The National Parks and tribal lands do not fall under WDFW’s management authority but many tribes conduct their own harvest management. Washington is the smallest of the western states and has the least amount of available cougar habitat. Idaho has approximately 99% more habitat, there is 84% more habitat in Montana, and 61% more habitat in Oregon. Because cougars are generally mediated by forested cover (Warren et al. 2016) and the majority of cougar habitat in Washington is in federal or State ownership, the core of cougar habitat is relatively secure but is susceptible to wildfire. Since 2007, approximately 10,000km2 have burned in Washington with 50% of that occurring since 2015.
Human-Wildlife Interactions Minimizing human-wildlife conflict is a management priority for WDFW (WDFW 2015). Because human populations continue to expand in Washington (currently 7.4 million), it is imperative to use a comprehensive outreach and information program to prevent negative human-wildlife interactions. During the past 10 years, complaints have averaged 195 statewide and decreased 26% from 224 to 166 annually. Overwhelmingly, the common causes of interactions identified by staff include the feeding of deer and turkey, which brings cougars closer to human development and husbandry practices of both livestock and domestic animals. Development patterns and increasing human occupation into the rural areas also contributes to conflict. Understanding how to reduce deer attractants and installing affordable electric fencing for goats, sheep, and fowl is the best approach to avoiding or minimizing potential interactions. Information and outreach materials are a mandatory component of staff response to potential conflict events. In 2018, an updated cougar brochure was developed (Figure 3).
Population Augmentation No population augmentation takes place for cougars in Washington. Research Significant long-term research of cougar populations has occurred statewide in 8 study areas across
Figure 3. Cougar information brochure developed in 2018 in cooperation with Western Wildlife Outreach.
273

Cougar Status and Trend Report 2018
Washington. These research efforts resulted in numerous peer-reviewed, published scientific manuscripts. Research topics include abundance and density (Lambert et al. 2006, Beausoleil et al. 2013, Beausoleil et al. 2016), growth rate (Wielgus et al. 2014), using DNA to evaluate gender ID (Beausoleil and Warheit 2015) and genetic structure (Warren et al. 2016), effects of hunting (Robinson et al. 2008, Cooley et al. 2009a, Cooley et al 2009b, Maletzke et al. 2014. Keehner et al. 2015a, Keehner et al. 2015b), prey use (Robinson et al. 2002, Cooley at al. 2008 White et al. 2010, Kertson et al. 2011a), habitat use (Kertson at al. 2011b) and response to human development (Kertson et al. 2013, Maletzke et al. 2017). In 2016, WDFW and University of Washington began a predator-prey research project. The goal of the research is to assess how hunting and predation may affect Washington’s ungulate population dynamics as well to document wolf-cougar interactions and assess survival and causes of mortality.
Management Concerns Exceeding harvest beyond management objectives continues to be a concern. On average, 29% of the PMUs close within a given hunt season close (range = 16-45%) and of the 44 PMUs with harvest limits, 17% go beyond the upper end of the harvest guideline (Table 2). About half of the overages occur prior to January 1 (when harvest limits do not yet apply) and the other half after harvest guidelines take effect and hunters must call within 72 hours; this causes a lag time in closure. Percent female harvest may also be a concern as changes in adult female and kitten survival are the most influential parameters to population growth (Martorello and Beausoleil 2003). Over the past 10 years, females average 53% of the harvest but it is unknown if that percentage of the harvest rate is at a level where this would be a management concern. Finally, harvest that occurs outside of WDFW’s management authority remain unknown and are not accounted for in harvest guidelines. These additional harvests are an additive source of take particularly in the northeast and Olympic peninsula regions of Washington. Accounting for that unknown additional harvest and evaluating its effect is difficult without accurate data records.
Management Conclusions The current cougar management structure allows the Department to address concerns of various constituencies. For hunters, it provides older aged animals on the landscape thus a better quality hunt, it allows harvest to be equitable across the entire jurisdiction, and when closures do occur, it does not impact a large-scale landscape forcing hunters to travel long distances. For non-consumptive users, it recognizes their values by maintaining population stability, social structure, and ecosystem integrity. For managers, it’s defensibly based in science, ensures credibility, it’s simple for multiple user groups to understand, inexpensive to implement, and satisfies multi-stakeholder interests. The current structure of distributing harvest equitably across the landscape is being demonstrated as harvest clusters are declining and distribution of harvest is increasing. Two potential solutions to avoid exceeding harvest guidelines is to revert back to the 24-hour closure Washington and to the single season structure, both used prior 2013. Snow conditions are strongly correlated with cougar harvest and affect hunter success. Being able to respond to hunting conditions would improve the Department’s ability to manage harvest and direct hunters to nearby open PMUs during optimal hunting conditions. The majority of agencies throughout the west utilize a 24-hour closure when harvest guidelines are met. Additionally, establishing an agreement to document tribal harvest of cougar would benefit statewide management in the future. Finally,
274

Cougar Status and Trend Report 2018
further developing a cougar education program focused on preventing conflicts needs more attention.
275

Cougar Status and Trend Report 2018
2012-13 2013-14 2014-15 2015-16 2016-17 2017-18
1 101 7-9 1 5 10 2 8 9105 2 2 2 4 2 5 2
108, 111 5-6 6 6 7 8 11 12113 4-6 3 5 6 3 4 6117 6-8 9 12 12 10 11 12121 5-6 7 5 8 4 17 9
124, 127, 130 7-9 8 5 8 4 11 11 145, 166, 175, 178 3-4 7 6 7 3 6 6
149, 154, 157, 162, 163 4-6 10 10 4 6 12 15 169, 172, 181, 186 3-4 4 4 1 2 7 3
2 203 4-6 0 0 0 0 0 0204 6-8 4 5 1 7 2 6
209, 215 4-5 4 2 4 3 3 5 218, 231 4-6 2 3 2 1 5 0
224 2-3 1 2 1 0 3 2 233, 239 3-4 2 0 1 1 6 1 242, 243 4-6 4 4 3 1 3 2
244, 246, 247 5-6 3 3 0 2 5 7 245, 250 5-6 2 0 4 1 6 3 249, 251 5-6 6 6 2 1 6 1
3 328, 329, 335 6-8 10 9 7 8 11 8 336, 340, 342, 346 5-7 8 5 6 8 6 12
352, 356, 360, 364, 368 5-7 6 5 6 5 10 7
382, 388 3-4 4 10 1 3 3 34 407 none 2 1 2 1 1 3
418, 426, 437 11-15 1 2 0 8 3 4 448, 450 9-13 0 0 0 0 0 3
454 none 0 2 3 0 0 1460 5-7 2 1 0 2 0 2
466, 485, 490 2-3 0 2 0 1 0 05 501, 504, 506, 530 7-10 1 1 2 1 1 1
503, 505, 520, 550 6-8 0 2 7 0 2 1 510, 513 3-4 0 1 2 3 1 2
516 3-5 1 3 3 0 3 2 522, 524, 554, 556 3-4 1 0 0 1 1 2
560 5-6 1 4 1 3 1 3 564, 568 3-4 2 4 0 4 1 4
572 3-4 1 2 1 3 0 1 574, 578 3-5 3 5 4 5 3 5
6 601, 602, 603, 612 5-7 1 3 2 1 1 0 607, 615 4-5 0 1 0 1 2 2
618, 636, 638 4-5 2 4 4 0 1 4 621, 624, 627, 633 none 2 5 1 2 8 2
642, 648, 651 6-8 10 6 6 3 5 10 652, 666 none 2 1 1 0 1 0 653, 654 4-6 1 1 1 2 3 1
658, 660, 663, 672, 673, 681, 684, 699 9-12 1 1 1 0 3 7
667 3-4 1 3 7 3 5 3
1, 2, 3
133, 136, 139, 142, 248, 254, 260, 262, 266, 269, 272, 278, 284, 290, 330, 334, 371, 372, 373, 379,
381
none 11 13 10 14 22 17
Table 2. Harvest objectives and actual harvest, by PMU and season 2012-13 to 2017-18. Shaded areas depict PMU closure and bordered areas indicate harvest objectives were exceeded, WDFW 2018.
Region PMUHarvest
ObjectiveActual Harvest
276

Cougar Status and Trend Report 2018
Literature Cited Beausoleil, R. A., G. M. Koehler, B. T. Maletzke, B. N. Kertson, and R. B. Wielgus. 2013.
Research to regulation: cougar social behavior as a guide for management. Wildlife Society Bulletin 37:680–688.
Beausoleil, R. A. and K. A. Warheit. 2015. Using DNA to evaluate field identification of cougar
sex by agency staff and dog hunters. Wildlife Society Bulletin 39(1) 203-209. Beausoleil R. A., J. D. Clark, and B. Maletzke. 2016. A long-term evaluation of biopsy darts and
DNA to estimate cougar density: an agency/citizen science collaboration. Wildlife Society Bulletin 40(3): 583–592
Cooley, H. S., R. B. Wielgus, G. M. Koehler, H. S. Robinson, and B. T. Maletzke. 2009a. Does
hunting regulate cougar populations? A test of the compensatory mortality hypothesis. Ecology 90:2913–2921
Cooley, H. S., R. B. Wielgus, G. M. Koehler, and B. T. Maletzke. 2009b. Source populations in
carnivore management: cougar demography and emigration in a lightly hunted population. Animal Conservation 12:321–328.
Cooley, H. S., H. S. Robinson, R. B. Wielgus, and C. S. Lambert. 2008. Cougar prey selection in
a white-tailed deer and mule deer community. Journal of Wildlife Management 72:99–106. Cooley, H. S., H. S. Robinson, R. B. Wielgus, and C. S. Lambert. 2008. Cougar prey selection in
a white-tailed deer and mule deer community. Journal of Wildlife Management 72:99–106. Keehner, J. R., R. B. Wielgus, B. T. Maletzke, and M. E. Swanson. 2015a. Effects of male targeted
harvest regime on sexual segregation in mountain lion. Biological Conservation 192:142-147.
Keehner, J. R., R. B. Wielgus, and A. M. Keehner. 2015b. Effects of male targeted harvest regimes
on prey switching by female mountain lions: Implications for apparent competition on declining secondary prey. Biological Conservation 192:142-147
Kertson, B. N., R. D. Spencer, and C. E. Grue. 2013. Demographic influences on cougar residential
use and interactions with people in western Washington. Journal of Mammalogy 94:269–281.
Kertson, B. N., R. D. Spencer, and C. E. Grue. 2011a. Cougar prey use in a wildland–urban
environment in western Washington. Northwestern Naturalist 92:175–185. Kertson, B. N., R. D. Spencer, J. M. Marzluff, J. Hepinstall-Cymerman, and C. E. Grue. 2011b.
Cougar use and movements in the wildland–urban landscape of western Washington. Ecological Applications 21:2866–2881.
277

Cougar Status and Trend Report 2018
Lambert, M. S., R. B. Wielgus, H. S. Robinson, D. D. Katnik, and H. S. Cruickshank. 2006. Cougar population dynamics in the Pacific Northwest. Journal of Wildlife Management.70:246–254.
Logan, K. 2015. Puma population responses to sport-hunting on the Uncompahgre Plateau,
Colorado. Federal Aid Project Number W-204-R4. Colorado Parks and Wildlife, Denver, Colorado, USA.
Maletzke, B. T., R. Wielgus, G. M. Koehler, M Swanson, H. Cooley & J. Richard. 2014. Effects
of hunting on cougar spatial organization. Ecology 4 (11) 2178–2185. Maletzke, B, B. Kertson, M. Swanson, G. Koehler, R. Beausoleil, H. Cooley, and R. Wielgus.
2017. Cougar response to a gradient of human development. Ecosphere 8(7):e01828 Martorello, D. A. and R. A. Beausoleil. 2003. Characteristics of cougar harvest with and without
the use of dogs. Pages 129-135 In S.A. Becker, D. D. Bjornlie, F. G. Lindzey, and D. S. Moody. Editors. Proceedings of the Seventh Mountain Lion Workshop. Wyoming Game and Fish Department, Lander, Wyoming, USA.
Quigley, H., and M. Hornocker. 2010. Cougar population dynamics. Pages 59–75 In M. G.
Hornocker, and S. Negri, editors. Cougar ecology and conservation. University of Chicago Press, Chicago, Illinois, USA.
Robinson, H. S., R. B. Wielgus, and J. C. Gwilliam. 2002. Cougar predation and population growth
of sympatric mule deer and white-tailed deer. Canadian Journal of Zoology 80:556–568. Robinson, H. S., R. B. Wielgus, H. S. Cooley, and S. W. Cooley. 2008. Sink populations in
carnivore management: cougar demography and immigration in a hunted population. Ecological Applications 18:1028–1037.
Robinson, H. S., T. Ruth, J. A. Gude, D. Choate, R. DeSimone, M. Hebblewhite, K. Kunkel, M.
R. Matchett, M. S. Mitchell, K. Murphy, and J. Williams. 2015. Linking resource selection and mortality modeling for population estimation of mountain lions in Montana. Ecological Modeling 312:11-25.
Warren, M, J., D. O. Wallin, R A. Beausoleil, and K. I. Warheit. 2016. Forest cover mediates
genetic connectivity of northwestern cougars. Conservation Genetics 17(5) 1011–1024. Washington Department of Wildlife. 2014. 2015-2021 Game Management Plan. Washington
Department of Fish and Wildlife. Olympia, WA.
White, K. R., G. M. Koehler, B. T. Maletzke, and R. B. Wielgus. 2010. Differential Prey Use by Male and Female Cougars in Washington. The Journal of Wildlife Management 75(5):1115–1120; 2011.
278

Cougar Status and Trend Report 2018
Wielgus, R. B., D. E. Morrison, H. S. Cooley, and B. Maletzke. 2013. Effects of male trophy
hunting on female carnivore population growth and persistence. Biological Conservation 167 (2013) 69–75
279

280

Black Bear
281

Black Bear Status and Trend Report 2018
Black Bear Status and Trend Report STATEWIDE RICHARD A. BEAUSOLEIL, Carnivore Section, Statewide Bear & Cougar Specialist LINDSAY S. WELFELT, Carnivore Section, Assistant Bear & Cougar Specialist
Introduction Black bears (Ursus americanus) occupy all forested areas throughout Washington. Only the northern island counties within the Puget Sound archipelago and the shrub-steppe habitat of the Columbia Basin do not support resident black bear populations. For management purposes, the state is divided into 9 black bear management units (BBMUs, Figure 1) consisting of the Olympic Peninsula or Coastal (1), Puget Sound (2), North Cascades (3), South Cascades (4), Okanogan (5), East Cascades (6), Northeast (7), Blue Mountains (8) and Columbia Basin (9) units.
Management Guidelines and Objectives Black bears are an important game species in Washington and WDFW objectives include managing for a variety of recreational and aesthetic purposes (WDFW 2015). Management to preserve, protect, and perpetuate black bears and their habitats to ensure healthy productive populations, while minimizing conflict with people, are goals outlined in the agency’s Game Management Plan (WDFW 2015). Currently, the greatest management priority is to acquire a better understanding of bear abundance, density, growth rate, and harvest rate; which will provide a scientifically-based population estimate and an improved harvest management.
Population Surveys No formal population estimate for black bears in Washington exists at this time (see Research section below). Similar to other states, the Department collects hunt statistics and relies on age and sex ratios from hunter harvest to infer population size and trend (Garshelis 1991, Beecham and Rohlman 1994, Folta 2011). Although there is no mandatory agency inspection for hunter-killed bears, hunters are required to report hunt activity and submit a tooth from their kill. Since 1982, the Department has implemented a mandatory tooth submission process whereby all successful black bear hunters statewide must submit a premolar tooth from each harvested bear (per WAC 220-415-090). This allows WDFW to age harvested animals using cementum annuli. Although there was a slight increase in reporting for 2017, unfortunately, submission rates have typically been low, with the most recent 5-and 10-year averages being 25% and 24%, respectively (Table 1), These low submission rates compromise the Department’s ability to assess harvest impacts. Age structure of a portion of harvested bears is used for population reconstruction and trend indices using sex ratios and median ages from that subsample.
Figure 1. Black bear distribution (in gray) and 9 black bear management units in Washington 2018.
282

Black Bear Status and Trend Report 2018
Table 1. Tooth submission results, by sex, of all known black bear mortalities in Washington, 2008-2017a.
Year Total Mortality
# Male Teeth Aged
# Female Teeth Aged
% Male Teeth Aged
% Female Teeth Aged
Total % Teeth Aged
2008 2384 277 169 18 20 19 2009 1607 216 164 21 30 24 2010 2228 342 211 24 26 25 2011 1817 283 136 N/A N/A 22 2012 1811 282 183 23 31 26 2013 1378 185 107 20 24 21 2014 1592 231 142 22 26 23 2015 1742 254 168 22 27 23 2016 1621 275 135 25 24 25 2017 1632 322 190 30 35 31
17812 2667 1605 23 27 24 adoes not include tribal hunting mortality
Hunting Seasons and Recreational Harvest The Department provides fall recreational hunting opportunity for black bears and an additional spring special permit hunt with limited permits being authorized. Licensed hunters have up to 167 days of hunting annually, including spring permit and fall general hunts. The timber damage removal program also occurs in spring and early summer but is managed separately from general season and spring permit hunts. Timber companies that have been granted removal permits for black bear select hunters authorized by WDFW to participate in the timber depredation removal effort. Over the past 10 years Washington’s average annual black bear mortality is the 2nd highest in the western U.S. at 1781, behind Idaho; following Washington is California, Montana and Oregon. Fall hunts occur in all 9 BBMUs and spring hunts take place in 5 BBMUs. The highest percentage of bear harvest from the fall general hunt takes place in the Northeast BBMU and the least from Blue Mountains BBMU (excluding the Columbia Basin BBMU), whereas spring special permit harvest is generally related to number of permits granted. When viewed by mortality type at a statewide level over the past 10 years, most bear mortality occurs in fall hunting season (85%), followed by timber removals (7%) and spring special permit hunts (5%) (Table 2). Although not currently prohibited by law, the Department has urged hunters not to shoot cubs or a female with cubs. The use of dogs and bait to hunt bears has been prohibited in Washington for over two decades (RCW 77.15.245) but the use of dogs is allowed for timber damage removals on commercial timber lands in the spring.
Survival and Mortality Hunter harvest was documented as the primary source of mortality for radio-collared bears from the 3 WDFW funded research projects on 6 study areas throughout Washington (Koehler and Pierce 2005, Beausoleil et al. 2012, WDFW unpublished information). Nearly all mortality was human related, with 77% from hunting, 8% wounding loss, 5% human-conflict, 3% vehicle collisions, 3% poaching, and 2% from unknown causes. Male survival is typically lower than female, but female survival is the most important factor in determining population growth.
283

Black Bear Status and Trend Report 2018
Department research projects estimated yearly average female survival ranged from 0.56 (Capitol Forest) to 0.95 (Okanogan) with the Copalis, Snoqualmie, and Lake Wenatchee regions falling in between depending on hunting pressure and human access.
Table 2. Black bear mortality, by type and year, in Washington, 2008-2017a.
Year Total
Fall Hunt Total
Spring Hunt Total
Timber Hunt Totalb Other Total Mortality
2008 2116 69 157 42 2384 2009 1309 78 183 37 1607 2010 1900 62 175 91 2228 2011 1503 61 182 71 1817 2012 1557 75 135 44 1811 2013 1148 85 117 28 1378 2014 1389 85 90 28 1592 2015 1488 94 92 68 1742 2016 1376 124 86 35 1621 2017 1373 139 94 26 1632
15159 872 1311 470 17812 aDoes not include tribal harvest bOther includes unknown mortality type (35%), human conflict (32%), and roadkill (33%)
Habitat The amount of available black bear habitat in Washington is estimated at 88,000km2. Washington is the smallest of the western states and has the least amount of bear habitat as compared to 114,000km2 in Oregon, 116,000km2 in Montana, 142,000km2 in Idaho and 145,000km2 in California. Approximately 75% of the black bear habitat in Washington is in federal, State, or private industrial timber ownership, so while the core of black bear habitat is relatively secure it is susceptible to environmental disturbance. Human-Wildlife Interaction Human-bear conflict occurs statewide given the distribution of people and bears in Washington and the prevalence of high calorie attractants like garbage, bird feeders, and fruit trees. Over the past 10 years, Washington has averaged 489 documented human-bear interactions annually and an average of 462 in the past 5 years, a decrease of 6%. The human population in Washington is currently estimated at 7.4 million and most human-bear interactions take place in King County; Washington’s most densely human populated area with 2.2 million people. Human-bear conflict activity reflects the variability of environmental conditions and the availability of attractants and is therefore not a good indicator of
Figure 2. Black bear pocket guides developed for Washington in 2016 in a partnership with author Linda Masterson.
284

Black Bear Status and Trend Report 2018
population status (Spencer et al. 2007). For example, in 2010 human-bear complaints were at an all-time high at 890, the same year Washington experienced a late spring with poor natural forage conditions for black bear, followed by a poor fall huckleberry crop. Managers agree that garbage management and the removal of attractants is the single best way to reduce bear-human interactions; to that end, entities intentionally or unintentionally feeding bears may be fined under state law (RCW 77.15.790, 77.15.792). In 2016, the Department partnered with author Linda Masterson to produce information and outreach pocket guides to further information sharing (Figure 2). However, these are not part of any formal black bear education and conflict prevention program.
Population Augmentation No population augmentation takes place for black bears in Washington. Research Black bear management in Washington began in the mid- to late-1960s when basic demographic information was collected and used to establish black bear management guidelines (Poelker and Hartwell 1973). In the 40+ years since, relatively few black bear studies have taken place but most have occurred in the Olympic peninsula region and the central Cascades. These include an investigation of population response pre-and post-timber harvest (Lindzey et al. 1986) in the 1970s and survival, habitat use, home range size, and cause specific mortality in three ecoregions (Olympic peninsula, Snoqualmie, and Okanogan) in Washington in the mid-1990s (Koehler et al. 2001; Koehler and Pierce 2003; Koehler and Pierce 2005). In the late 1990s, the Department conducted bait station surveys as a population index of bear abundance (Rice et al. 2001) but analysis indicated the technique was an unreliable way to detect a change in population trajectory. This past decade, home range size and habitat use were evaluated pre-removal of the Elwha Dam (Sager-Fradkin et al. 2008), and a study of survival and population size took place in Capitol State Forest (Beausoleil et al. 2012). In 2013, the Department launched a research project, in collaboration with Washington State University (WSU), to assess population density and growth rates, den timing and characteristics, and develop methods to survey bears statewide in the the future. The study occurs on both the east and west slopes of the Cascade Mountains using 2 concurrent techniques: capture/collar and DNA collection via barbed-wire hair collection stations. The project includes two wildland study areas, which represent much of the environmental variation and hunting pressure observed in Washington. To date, staff have collared 227 individual bears 344 times, made 1,237 detections of 537 bears via DNA, and visited 231 winter dens.The first stage of that population estimation effort is currently being published (Welfelt et al. in review) and will be available for incorporation into the next Game Management Plan revision in 2020. Additionally, stable isotope analysis of hair from captured bears was used to examine human-bear interactions and impacts of human foods on black bears. Finally, carnivore section staff published two manuscripts regarding management implications of orphaned and rehabilitated black bears (Beecham et al. 2015, Beecham et al. 2016).
285

Black Bear Status and Trend Report 2018
Management Concerns Collecting teeth from harvested black bears is one of the least expensive and time efficient tools managers have available and it facilitates a working relationship with the hunting public. However, the response rate is low and therefore much of the information Washington uses for black bear management, such as median age (Table 3), percent females in the harvest (Table 4), and population reconstruction, is limited and provides minimal information for long-term management. Harvest data can demonstrate both increasing and decreasing population trajectories as each can exhibit the same age structure (Clark 1999) and/or sex ratio (Garshelis 1991) and trends may not be consistent with the true population trajectory (Noyce and Garshelis 1997, Beston and Mace 2012, McLellan et al. 2017). Black bear managers agree that median age is not a reliable technique for management or population estimation. A low median age could be because many of the adults have died or because cub production is high, as both situations can demonstrate a similar age structure. A higher median age may be because hunters are more willing to provide a tooth from older-aged animals and less likely to submit for younger animals, since they already know the age. Generally, median ages can be a reflection of hunting pressure and tend to be lower in areas with greater access (Table 3), but when higher harvest situations are monitored, median age tends to decrease and then remain constant, so it is not sensitive to changes in harvest and likely not useful to managers. Historically, Washington used population reconstruction (Bender 1997) from tooth submissions and extrapolations of density to habitat availability, but currently does not have statewide science-based field estimates of black bear abundance and density, thus making an estimate of a true harvest rate difficult. Reconstruction does not account for non-harvest mortality and the age structure of harvest may not be representative of the larger population (Williams et al. 2002), and if small changes in harvest rates occur, population estimates can become considerably biased over time (Davis et al. 2007). However, harvest data are important and could be used along with other data collection in a more integrated approach to monitor population trend (Skalski 2012). But while tooth collection for aging harvest mortalities is critically important, mandatory submission rates in Washington have been low (21%) for decades and further attention and effort is needed to gather this important data. Black bear density is not uniform across the landscape and can vary based on habitat quantity and quality, levels of hunting and non-hunt mortality, and local bear population growth rate. To analyze harvest objectives, the Department uses a BBMU-scale approach or simply looks at harvest on a statewide basis. While areas need to be large enough to be meaningful for modeling and other analyses, there is a tradeoff with respect to female harvest. The larger the management unit, the less sensitive it is to female harvest rate and percent females in the harvest. Finding that balance of the appropriate scale at which to monitor harvest will continue to be a challenge as most biologists agree that female harvest is more of a management concern. Finally, acquiring and implementing a science-based population estimate and basing harvest objectives on the estimate rather than median ages would improve the Department’s black bear management program.
The Department does not have a formal black bear education and conflict prevention program. Section staff recently collaborated on an educational book titled Living with Bears Handbook (Masterson 2016), developed the educational pocket guides mentioned above, give presentations opportunistically when requested, and work with Western Wildlife Outreach identifying educational needs. However, more agency attention should be given towards working with city
286

Black Bear Status and Trend Report 2018
councils and homeowners associations on education and conflict prevention in communities where attractants are a perpetual concern.
Management Conclusions Incorporating research results and updating the black bear management plan is a priority as management has remained consistent since the 1990’s. Over the next year, WDFW will begin to implement a strategy developed by researchers to monitor black bear populations within each District. These results, combined with data from research projects, will allow WDFW to generate an accurate statewide population estimate that accounts for variation in habitat types and management activities. Currently staff are using research data and working with local governments to reduce bear-human conflict by implementing the use of bear-resistant garbage cans and minimizing other attractants. These were priority needs and objectives outlined in the 2015 Game Management Plan.
Table 4. Percent female black bear mortality, by year and BBMU in Washington, 2008-2017. Gray areas show where management objective was exceeded.
Percent Female Mortality 2008 2009 2010 2011 2012 2013 2014 2015 2016 2017 10-yr Avg 5-yr Avg BBMU 1 36 39 36 N/A 30 32 28 27 29 35 29 30 BBMU 2 39 38 44 N/A 36 42 39 34 43 36 35 39 BBMU 3 40 27 35 N/A 36 32 38 31 42 26 30 34 BBMU 4 33 32 39 N/A 31 31 44 24 37 35 31 34 BBMU 5 24 35 31 N/A 33 27 32 27 32 36 27 31 BBMU 6 34 37 36 N/A 27 30 34 34 35 31 30 33 BBMU 7 33 33 35 N/A 33 31 33 34 32 37 30 33 BBMU 8 33 38 39 N/A 35 29 29 38 37 29 30 32 BBMU 9 N/A N/A N/A N/A N/A N/A N/A N/A N/A N/A N/A N/A
287

Black Bear Status and Trend Report 2018
Literature Cited Beausoleil, R. A., W. A. Michaelis, and B. T. Maletzke. 2012. Black bear research in Capitol State
Forest, Washington - Final Report. Washington Department of Fish and Wildlife, Olympia, Washington, USA.
Beecham, J.J. and J. Rohlman. 1994. A shadow in the forest: Idaho’s black bear. University of
Idaho Press, Moscow, Idaho, USA. Beecham, J. J., K. Loeffler and R.A. Beausoleil. 2016. Strategies for captive rearing and
reintroduction of orphaned bears. Journal of Wildlife Rehabilitation 36 (1):7–16. Beecham, J. J., A. A. Karamanlisis, R. A. Beausoleil, K Burgess, D. H. Jeong, M. Binks, L.
Bereczsky, M. DeGabriel Hernando, K. Skripova, L. Rhodin, J. Auger, B. K. Lee, H. Masan-Myeon. 2015. Management implications for releasing orphaned, captive-reared bears back to the wild. Journal of Wildlife Management 79(8) 1327-1336.
Bender, L. C. 1997. Estimating black bear population size and trend in Washington State. Pages
63–68 In R. A. Beausoleil and S. Pozzanghera. Editors. Proceedings of the 6th Western Black Bear Workshop. Washington Department of Fish and Wildlife, Olympia, Washington, USA.
Beston, J. A., and R. D. Mace. 2012. What can harvest data tell us about Montana’s black bears?
Ursus 23:30–41. Clark, J. D. 1991. Ecology of black bear (Ursus americanus) populations in the interior highlands
of Arkansas. Dissertation. University of Arkansas, Fayetteville, Arkansas, USA. Clark, J. D. 1999. Black bear population dynamics in the Southeast: some new perspectives on
some old problems. Eastern Black Bear Workshop Proceedings 15:97–115. Folta, J. E. 2011. Monitoring American black bear (Ursus americanus) populations across North
America: a survey of state and provincial wildlife management agencies. Pages 36–44 In Proceedings of the 20th Eastern Black Bear Workshop. Hendersonville, NC, USA.
Garshelis, D. L. 1991. Monitoring effects of harvest on black bear populations in North America:
a review and evaluation of techniques. Eastern Workshop of Black Bear Research and Management 10:102–144.
Koehler, G. M., P. Briggs, M. H. Norton, and D. J. Pierce. 2001. Implant vs collar transmitter use
on black bears. Wildlife Society Bulletin 29 (2): 600-605. Koehler, G.M. and D.J. Pierce. 2003. Black bear home-range sizes in Washington: climatic,
vegetative, and social influences. Journal of Mammology, 84(1): 81-91. Koehler, G.M. and D.J. Pierce. 2005. Survival, cause-specific mortality, sex and ages of American
black bears in Washington state, USA. Ursus 16(2): 157-166.
288

Black Bear Status and Trend Report 2018
Masterson, L. 2016. Living wih Bears Handbook. Pixyjack Press, Masonville, Colorado, USA. McLellan, B. N., G. Mowat, T. Hamilton, and I. Hatter. 2017. Sustainability of the grizzly bear
hunt in British Columbia, Canada. Journal of Wildlife Management 81:218–229. Noyce, K. V, and D. L. Garshelis. 1997. Influence of natural food abundance on black bear
harvests in Minnesota. Journal of Wildlife Management 61:1067–1074. Poelker, R.J. and H. D. Hartwell. 1973. Black bear of Washington. Bulletin 14. Washington
State Game Department, Olympia, WA USA. Rice, C. G., J Rohlman,J. Beecham, and S. Pozzanghera. 2001. Power analysis of bait stations in
Idaho and Washington. Ursus 12:227-236. Sager-Fradkin, K.A., K.J. Jenkins, P.J. Happe, J.J. Beecham, R.G. Wright, and R.A. Hoffman.
2008. Space and habitat use by black bears in the Elwha Valley prior to dam removal. Northwest Science, 82: 164-178.
Spencer, R. D., R. A. Beausoleil, and D. A. Martorello. 2007. How agencies respond to human
black bear conflicts: a survey of wildlife agencies in North America. Ursus 18:217–229. Washington Department of Wildlife. 2014. 2015-2021 Game Management Plan. Washington
Department of Fish and Wildlife. Olympia, WA.
Welfelt, L. S., R. A. Beausoleil, and R. B. Wielgus. In review. Improving agency bear management through density model validation. Journal of Wildlife Management.
289

Band-Tailed Pigeon and Mourning Dove
290

Band-tailed Pigeon/Mourning Dove Status and Trend Report 2018
Band-Tailed Pigeon / Mourning Dove Status and Trend Report STATEWIDE KYLE A. SPRAGENS, Waterfowl Section Manager
Introduction Pacific Coast band-tailed pigeons and mourning doves are managed cooperatively with the U.S. Fish and Wildlife Service (USFWS) and western states through the Pacific Flyway Council (PFC). The PFC has developed management plans for these populations, and in 1994 established a population objective for band-tailed pigeons in Washington based on the WDFW call-count survey (PFC 1994). Since that time, PFC has revised the population objective and established closure thresholds based on a new mineral site survey (PFC 2010). Population objectives for mourning doves are being developed as part of the national mourning dove harvest strategy.
Population Surveys Methods Band-tailed Pigeon call-count Survey The WDFW band-tailed pigeon call-count survey was initiated in 1975, and was patterned after the mourning dove survey. A total of 50 routes, 5.7 miles in length comprised the survey, conducted in western Washington below 1,000 ft. elevation. Surveys were completed during a 16-day period beginning the Saturday closest to June 21, as designed by Jeffrey (1989). Data were sent to USGS in Laurel, MD (Bill Kendall) for analysis using route regression programs developed for the mourning dove survey (Sauer et al., 2003). The WDFW call-count survey was discontinued after 2003, but is presented in this report for comparison to the mineral site survey. Band-tailed Pigeon Mineral Site Survey In 2001, USGS-BRD (California Science Center) received a grant from USFWS to design a population index survey for use throughout the range of the Pacific Coast population of band-tailed pigeons. USGS conducted mineral site surveys at 8 western Washington locations in 2001-03 (Overton and Casazza 2004). These included two in Region 4 (Oyster Creek - Pigeon Point and Sumas Springs), one in Region 5 (Cedar Creek), and five in Region 6 (Lilliwaup, McAllister Creek, Mud Bay, Potlatch, and Red Salmon Creek). As part of an earlier grant, USGS-BRD evaluated several population survey techniques, and found that an optimally timed mineral site survey offered statistical advantages over other surveys, including the WDFW call-count survey.
A final report on the mineral site survey was completed in 2004, and coastal states adopted the new mineral site survey as the official index for this population. In 2004, WDFW expanded surveys to 15 sites, as specified under protocols developed for the Pacific Flyway (Overton and Casazza 2004). The 15 sites included the 8 locations established in 2001, along with two in Region 4 (Lake Cavenaugh Rd.-Pefley and Warm Beach), four in Region 5 (Altoona, Newaukum River, St. Martin’s Hot Springs, and Upper Kalama) and one in Region 6 (Willapa Estuary). Since 2004, the site list has been modified due to access restrictions or other changes in status. Cooperators from WDFW and USFWS completed 15 surveys during the July 10-20, 2015 survey period. In
291

Band-tailed Pigeon/Mourning Dove Status and Trend Report 2018
2016, the Naselle River mineral site was added as operational to the index as it met the minimum criteria of a known naturally occurring mineral site and at least 2 annual counts (Table 2).
Mourning Dove call-count Survey The mourning dove survey was discontinued by USFWS after the 2013 survey (Seamans and Sanders 2014). WDFW staff in Districts 1, 3, 4, 9, and 17 participated in evaluation of a new point-distance sampling method during 2015, but results are not yet available.
Results Band-tailed Pigeon call-count Survey Past call-count survey results are presented in Table 1 and Figure 1.
Band-tailed Pigeon Mineral Site Survey Mineral site survey raw data summaries are presented in Table 2 and Figure 1. Complete 2018 survey results are available through USFWS (Seamans 2018).
Figure 1 and Table 1 show that based on the call-count survey, the band-tailed pigeon population generally increased from 1975-2003. The route regression method was less precise in determining short-term trends than long-term trends, as evidenced by the large confidence intervals for the two-year trends in Table 1. The large spans of these intervals are caused by low sample size due to changing observers from year to year.
The mineral site survey in 2001-2003 exhibited the same general trend as the call-count survey when the two surveys were run concurrently (Figure 1). This rough correlation can be used in the future to develop population objectives for WA consistent with the PFC management plan (PFC 2010).
Hunting Seasons and Recreational Harvest
The band-tailed pigeon season was closed in Washington from 1991-2001. A limited season was reopened in 2002 and has continued since then, with season dates of September 15-23 and bag/possession limits of 2/4. The mourning dove season was September 1-15 from 1980 through 2007, and September 1-30 since 2008. Bag/possession limits have been 10/20 since 1980.
0
50
100
150
200
0
0.5
1
1.5
2
2.5
3
3.5
4
1975
1977
1979
1981
1983
1985
1987
1989
1991
1993
1995
1997
1999
2001
2003
2005
2007
2009
2011
2013
MIN
SITE
IND
EX
CC
IND
EX
CCINDEX CCI-LONG-TERM AVE-MINSITE
Figure 1. Band-tailed pigeon call-count results and mineral site raw data summaries.
292

Band-tailed Pigeon/Mourning Dove Status and Trend Report 2018
Methods
Band-tailed Pigeon Harvest Survey Band-tailed pigeon harvest is estimated annually using mandatory harvest reporting. Written authorization and harvest reports have been required of band-tail hunters in western Washington since the season reopened in 2002. Hunters were required to return a harvest report card by September 30 to avoid a $10 penalty the following year. Reminders were sent out prior to the reporting deadline. Harvest reports returned by the deadline were included in the analysis as the ‘first wave’ of respondents. A special follow-up survey of non-respondents was conducted via a telephone survey through Washington State University. Responses from this survey were included as the ‘second wave’ and then the harvest estimates were computed accounting for the non-response bias.
Mourning Dove Harvest Estimation Mourning dove harvest was estimated as part of the statewide hunter survey conducted by WDFW (WDFW 2017).
Results Band-tailed Pigeon Harvest Harvest and hunter activity for the 2002-2017 seasons are summarized in Figures 2-3 and Table 3.
Mourning Dove Harvest As measured by WDFW (2017) small game surveys, harvest in 2017 was estimated at 52,911 doves, up 2.6% from 2016, and 1.4% below the recent 10-year average (Figure 4). Hunter numbers were estimated at 3,884, down 1.6% from 2016 and 5.5% below the recent 10-year average. Number of days hunted was 13,024, down 4.1% from 2016. However, despite long-term declines and depressed participation compared to the 1970s, when the number of dove harvest per hunter is considered, 2017, represents the third highest estimate since 1970 at 13.6 dove per hunter (Figure 4). The highest value was recorded in 2015 at 15.2 dove per hunter.
Figure 2. Band-tailed pigeon total harvest since 2002 when a season re-opened per Pacific Flyway Management Plan.
Figure 3. Band-tailed pigeon 2002-2017 average annual harvest by county.
293

Band-tailed Pigeon/Mourning Dove Status and Trend Report 2018
Figure 4. Mourning dove statewide harvest and hunter numbers 1970-2017.
Literature Cited Jeffery, R. 1989. The band-tailed pigeon in Washington. Unpublished report. WDFW, Olympia
WA.
Overton, C. and M. Casazza. 2004. Pacific Coast mineral site survey for breeding band-tailed pigeons – Washington. Unpublished report. USGS, Dixon CA.
Pacific Flyway Council. 1994, 2010. Pacific Flyway management plan for the Pacific Coast Population of Band-tailed Pigeons. Pacific Coast Band-tailed Pigeon Subcomm., Pacific Flyway Study Comm. [c/o USFWS], Portland, OR. Unpubl. rept.
Seamans, M. E. 2018. Band-tailed pigeon population status, 2018. U.S. Department of the Interior, Fish and Wildlife Service, Division of Migratory Bird Management, Washington, D.C.
Sauer, J. R., J. E. Hines, and J. Fallon. 2003. The North American Breeding Bird Survey, Results and Analysis 1966 - 2002. Version 2003.1, USGS Patuxent Wildlife Research Center, Laurel, MD.
Seamans, M. E., and T. A. Sanders. 2014. Mourning dove population status, 2014. U.S. Department of the Interior, Fish andWildlife Service, Division of Migratory Bird Management, Washington, D.C.
WDFW 2017. 2016 game harvest report. http://wdfw.wa.gov/hunting/harvest/ WDFW, Olympia WA.
294

Band-tailed Pigeon/Mourning Dove Status and Trend Report 2018
Table 1. Band-tail call-count survey results - route regression method. Start Year End Year Change Lower 90% CI Upper 90% CI Routes Used Sig. level 1975 1992 -7.8% -14.0% -2.0% 63 p<0.05 1991 1992 10.1% -50.0% 75.0% 11 n.s. 1975 1993 -6.0% -11.0% -1.0% 65 p<0.05
1992 1993 44.0% -49.0% 152.0% 13 n.s. 1975 1994 -3.4% -8.2% 1.4% 69 n.s. 1993 1994 71.0% 1.4% 141.0% 24 p<0.05
1975 1995 -2.7% -9.8% 4.5% 70 n.s. 1994 1995 12.1% -31.3% 55.3% 12 n.s. 1975 1996 -0.8% -6.5% 4.9% 59 n.s. 1992 1996 24.3% 10.4% 38.2% 30 p<0.01
1995 1996 36.4% -35.9% 108.7% 18 n.s. 1975 1997 -0.8% -6.0% 4.3% 62 n.s 1993 1997 8.9% 0.2% 17.6% 32 p<0.10 1996 1997 -14.3% -35.4% 6.7% 18 n.s.
1975 -1.5% -5.5% 2.4% 65 n.s. 1994 1998 2.1% -8.7% 13.0% 34 n.s. 1997 1998 -11.0% -45.8% 23.9% 11 n.s. 1975 1999 -0.1% -4.1% 3.8% 67 n.s.
1995 1999 -3.3% -11.5% 4.9% 38 n.s. 1998 1999 26.7% -19.7% 73.1% 14 n.s. 1975 2000 -0.3% -6.2% 5.5% 70 n.s.
1996 2000 5.9% -2.3% 14.1% 41 n.s. 1999 2000 21.1% -12.5% 54.8% 24 n.s. 1975 2001 1.7% -2.3% 5.7% 70 n.s. 1997 2001 15.8% 8.0% 23.6% 44 p<0.01
2000 2001 1.8% -16.6% 20.2% 36 n.s. 1975 2002 0.7% -3.7% 5.0% 71 n.s. 1998 2002 9.4% 2.6% 16.2% 45 P<0.05 2001 2002 0.9% -27.5% 25.8% 32 n.s.
295

Band-tailed Pigeon/Mourning Dove Status and Trend Report 2018
Table 2: WA band-tailed pigeon mineral site survey raw data 2004-2018.2004 2005 2006 2007 2008 2009 2010 2011 2012 2013 2014 2015 2016 2017 2018
Altoona 64 0 5 0Cedar Cr. 215 185 231 191 312 163 154 142 181 267 207 306 246 145
L. Cavenaugh - Pefley 108 172 76 71 117 70 89 113 146 156 110 98 149 148 83
Lilliwaup 199 143 273 141 89 110 123 167 74 210 197 178 251 143 292
McAllister 124 174 87 25 136 46 134 107 102 77 78 90 105 111 78
Mud Bay 134 371 294 95 203 130 70 175 87 214 136 297 208 187 349
Oyster Cr. – Pigeon Pt. 474 542 293 157 331 314 190 344 121 51 39 14 6 226
Naselle River 184 115 37 42
Newaukum 634 167 335 309 219Potlatch 297 285 306 168 295 480 129 297 288 333 254 506 406 396 556
Red Salmon 179 103 64 33 107 41 0 47 5 93 43
Soda Springs 58 112 193 259 246 106
St. Martins 220 128 191 189 141 210 214 439 180 308 354 435 507 83 279
Sumas 46 68 78 17 82 74 78 96 152
U. Kalama 110 225 327 120 350 317 111 368 258 245 187 322 321 243 471
Totten -Oyster Bay 119 53 101 192 332 486 388 308 221
Warm Beach 48 58 62 83 36 29 29 72 10 60 33 223 57 16
Willapa 3 24 10 3 0 5 5 2
Uncorrected Totals 2855 2577 2622 1585 2336 1915 1367 2213 1633 2226 2028 3214 3238 2350 3016
296
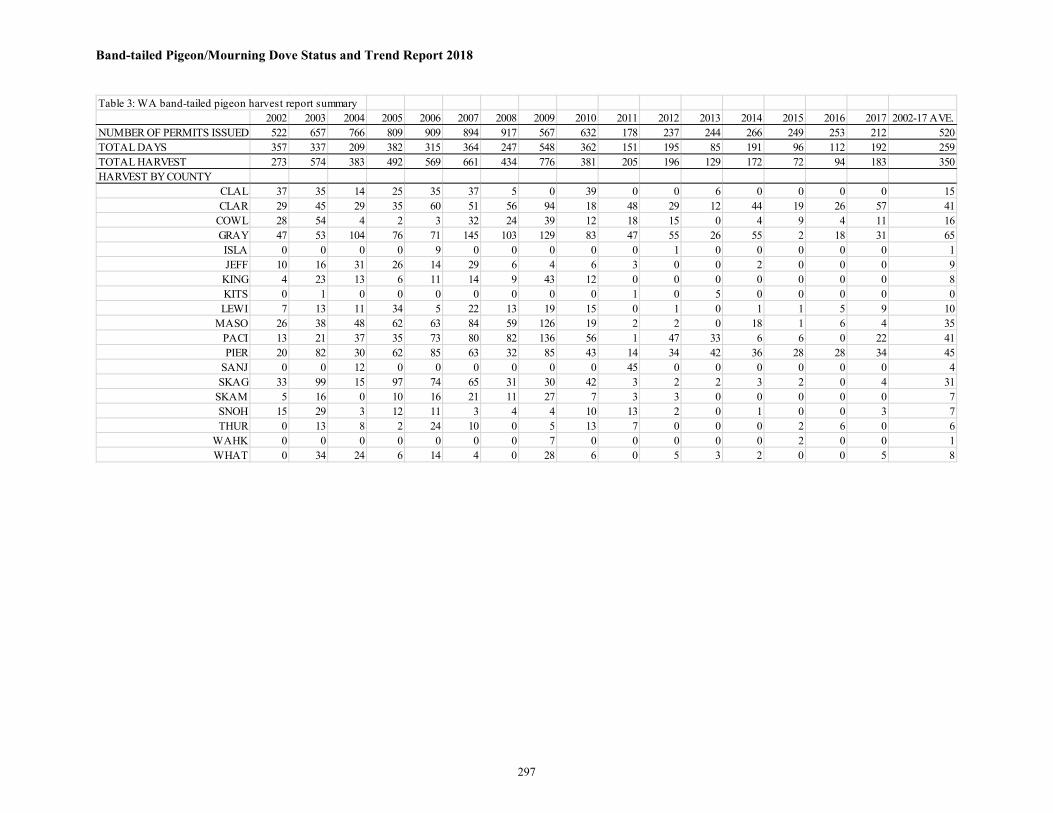
Band-tailed Pigeon/Mourning Dove Status and Trend Report 2018
Table 3: WA band-tailed pigeon harvest report summary2002 2003 2004 2005 2006 2007 2008 2009 2010 2011 2012 2013 2014 2015 2016 2017 2002-17 AVE.
NUMBER OF PERMITS ISSUED 522 657 766 809 909 894 917 567 632 178 237 244 266 249 253 212 520TOTAL DAYS 357 337 209 382 315 364 247 548 362 151 195 85 191 96 112 192 259TOTAL HARVEST 273 574 383 492 569 661 434 776 381 205 196 129 172 72 94 183 350HARVEST BY COUNTY
CLAL 37 35 14 25 35 37 5 0 39 0 0 6 0 0 0 0 15CLAR 29 45 29 35 60 51 56 94 18 48 29 12 44 19 26 57 41
COWL 28 54 4 2 3 32 24 39 12 18 15 0 4 9 4 11 16GRAY 47 53 104 76 71 145 103 129 83 47 55 26 55 2 18 31 65ISLA 0 0 0 0 9 0 0 0 0 0 1 0 0 0 0 0 1JEFF 10 16 31 26 14 29 6 4 6 3 0 0 2 0 0 0 9
KING 4 23 13 6 11 14 9 43 12 0 0 0 0 0 0 0 8KITS 0 1 0 0 0 0 0 0 0 1 0 5 0 0 0 0 0LEWI 7 13 11 34 5 22 13 19 15 0 1 0 1 1 5 9 10
MASO 26 38 48 62 63 84 59 126 19 2 2 0 18 1 6 4 35PACI 13 21 37 35 73 80 82 136 56 1 47 33 6 6 0 22 41PIER 20 82 30 62 85 63 32 85 43 14 34 42 36 28 28 34 45
SANJ 0 0 12 0 0 0 0 0 0 45 0 0 0 0 0 0 4SKAG 33 99 15 97 74 65 31 30 42 3 2 2 3 2 0 4 31
SKAM 5 16 0 10 16 21 11 27 7 3 3 0 0 0 0 0 7SNOH 15 29 3 12 11 3 4 4 10 13 2 0 1 0 0 3 7THUR 0 13 8 2 24 10 0 5 13 7 0 0 0 2 6 0 6
WAHK 0 0 0 0 0 0 0 7 0 0 0 0 0 2 0 0 1WHAT 0 34 24 6 14 4 0 28 6 0 5 3 2 0 0 5 8
297

Waterfowl
298

Waterfowl Status and Trend Report 2018
Waterfowl: Breeding Populations and Production Status and Trend Report
STATEWIDE MATTHEW T. WILSON, Statewide Waterfowl Specialist ____________________________________________________________________________________
Introduction This report summarizes waterfowl productivity data collected during 2018 in Washington State, including information on breeding waterfowl populations, duck broods, and goose nest surveys. Washington Department of Fish and Wildlife (WDFW), U.S. Army Corps of Engineers, U.S. Fish and Wildlife Service (USFWS), Yakama Indian Nation, Colville Confederated Tribes, Washington Waterfowl Association, and Chelan County Public Utility District contributed data.
Population Surveys Duck Breeding Population Survey Methods Historical surveys to estimate breeding duck populations in eastern Washington were conducted annually within seven strata in eastern Washington: West Okanogan Potholes, Omak-Douglas Potholes, Far East Potholes, Northeast, and Palouse Streams, Columbia Basin Irrigated, and Yakima Valley Irrigated (Fig. 1). Surveys were conducted by ground counts of transects or sections, except helicopter counts were used for the 1/4-sections in the Desert Wildlife Area (Frenchman and Winchester Wasteways) within the Columbia Basin Irrigated strata (Fig. 1). Samples were multiplied by weighting factors to provide an index to the total number of breeding ducks and coots within the defined areas (Tables 1-3). Weighting factors were determined from the proportion of areas within the strata that were sampled. Observations were treated as complete counts within sampling units (transects or quadrats) with no corrections for visibility bias.
Due to concerns about design of past surveys (lack of random sample selection and variance estimates), WDFW began the process of redesigning the eastern Washington waterfowl breeding population survey in 2008, in conjunction with staff from the USFWS Pacific Flyway office formerly in Portland, OR and the USFWS Branch of Population and Habitat Assessment in Laurel, MD. The new design consists of randomly selected ¼ mile helicopter transects to replace the past survey design. The goal of the new survey is to provide breeding population indices (with variance estimates) comparable to surveys conducted in other parts of the Pacific Flyway, for inclusion in the western mallard management protocols adopted by USFWS in 2008. The new and old survey designs were run concurrently for three years (2009-11), and the old design was discontinued after the 2011 survey. The new survey design (including the Irrigated, Potholes, and Northeast Highlands strata) was modified in 2012 to address continued safety and efficiency concerns for the Northeast Highlands stratum (Fig. 2). As a result, transects in this stratum were placed at 10 mile intervals on an east-west orientation across major river valleys. In addition, minor boundary adjustments were made to other stratum boundaries, including elimination of Saddle Mountain from the Irrigated stratum. Overall, in eastern Washington, observers surveyed approximately 1,688 transect miles over a 5 day period between May 4-8, 2018.
299

Waterfowl Status and Trend Report 2018
Beginning in 2010, line-transect surveys, similar to the new eastern Washington survey, were developed and flown for the new western Washington breeding waterfowl population survey (Fig. 3). Observers surveyed approximately 984 transect miles between April 29–May 3, 2018. The modifications to survey design and areas during the initial years of the aerial survey created difficulties in comparing results across years. To address this issue, survey results from 2009-2012 were reevaluated and standardized by matching strata boundaries to the surveys boundaries used in 2013. Transects and observations from 2009-12 that fell outside 2013 strata boundaries were dropped from analyses. Data from the Highlands in 2010 and 2011 were also excluded from analyses due to different survey methods. Methods for estimating total number of breeding ducks follow the Standard Operating Procedures of Aerial Waterfowl Breeding Ground Population and Habitat Surveys in North America (USFWS & CWS 1987). Breeding populations are estimated by multiplying the number of pairs, lone drakes, and flocked drakes (<5 male birds) by 2, and grouped birds (mixed or >5 males) by 1. Lone hens are multiplied by 1 for redhead, scaup, ring-necked duck, and ruddy duck only. These diver species are known to be late nesters and males significantly outnumber females. Results Total breeding duck counts numbered 220,610 (SE 21,133) within three eastern Washington strata (Table 4). Total mallards numbered 91,473 (SE 9,437). Gadwall was the second most numerous species on the survey (27,362, SE 4,688), followed by Ruddy duck (20,149 SE 17,069), Northern shoveler (16,422 SE 4,242), and Cinnamon teal (14,606 SE 2,379, Fig. 4). The Potholes stratum comprised 65.0% of the total duck count in 2018, followed by the Irrigated stratum (22.2%) and the Highlands stratum (12.8%). Compared to the 2017 survey, 2018 total breeding duck counts increased 31% in eastern Washington (Fig. 5, Table 4). The revised survey design for western Washington estimated the total breeding duck population at 60,490 (SE 4,884). Mallards numbered 33,462 (SE 3,348), followed by wood duck 7,987 (SE 1,472), ring necked duck (3,636 SE 1,192), and blue-winged teal (2,858 SE 2,456; Fig. 6, Table 5). The South Puget Lowlands stratum held the majority of breeding ducks in 2018 (35.0%), followed by the North Puget Lowlands (28.2%), Hood Canal (16.7%), Chehalis River Valley (11.3%), and Dungeness (8.8%; Fig. 7, Table 5). Statewide, the total breeding duck counts increased 16.1% compared to last year and are up 51.5% over the 3-year average. Mallards increased 20.9% (+50% 3-year average), American wigeon actually decreased 12.5%, but remain above the 3 year average (5.6%); gadwall were up 53% (54% 3-year average). Wood ducks increased 92.7% (+145% 3-year average) since last season (Fig. 8). Northern shovelers remained steady compared to 2017 (+0.1%) and remain very high over the long-term (+107%), as well as Blue-winged teal (+645%), and ruddy ducks (+131%, Fig. 8). Decreases were noted in Northern pintail (-57%0, +3% long term), bufflehead (-66%), and green-winged teal (-51%, 6% long term). These sustained increases were driven largely by average snow pack and continued uncommon water abundance in eastern Washington.
300

Waterfowl Status and Trend Report 2018
Duck Production Survey (Brood Survey) Methods The same sampling transects used for historic breeding duck surveys are used for brood surveys in the Potholes, Palouse, and Northeast strata (Fig. 1). These surveys are conducted in late June to early July. All broods observed are recorded by species. The numbers of broods observed are multiplied by the weighting factors for each stratum to provide an index to duck production. Average brood size is very difficult to estimate. Historic surveys in the Irrigated strata were designed to estimate average brood size. As a result the survey effort varied somewhat among years. To provide more consistency, the surveys in the Columbia Basin were redesigned in 1995 by using six sample sites to provide an index to production. Broods for most species are highly secretive and difficult to observe. The current year's growth of emergent vegetation is more developed than during breeding population surveys in May. Production surveys should be viewed as a rough estimate of production with greater value for long-term trends than for year-to-year changes. Results The brood survey is undergoing an evaluation to determine feasibility of sampling design, efficiency, and repeatability. For 2018, staffing shortages and issues with observability reduced the survey effort and did not provide enough data for comparisons to previous years under the current weighting factors. In 2017, the Potholes, Palouse, and Northeast strata declined 30% from 2016, and remains 26% below the long-term for all combined duck species (Fig. 9, Table 6). Brood production increased 9% in the Okanogan strata and 3% in the Northeast, and 8% in the Columbia Basin. The Channeled Scablands decreased 20% and continues falling to 68% below the long-term average. The Palouse stratum showed a slight decrease (-10%) compared to 2016, and is now even with the long-term average (Table 7).
Canada Goose Breeding Population Survey Methods Canada goose breeding populations are indexed by nest searches conducted within four major geographic areas, mainly along the Snake and Columbia rivers (Table 8). Surveys are conducted annually, biennially, or periodically. Total number of goose nest attempts is used as an index of the goose breeding population, and surveys are focused on areas with high densities of nesting geese. Some areas with relatively recent goose population expansions are not surveyed. Total geese observed during historic and new aerial breeding duck surveys also provide an index to the goose population in those areas not surveyed during nest searches. Results The 2018 goose nest index decreased about 1% statewide compared to last year, remaining 23% above the 1974-2017 average. The total eastern Washington index decreased about 1.6% compared to last year, remaining 23% above the 1974-2017 average (Fig. 10, Table 9). Nest indices remained unchanged in the upper Columbia (0%), and in the mid-Columbia (0%) due to variable year survey efforts. (Fig. 11, Fig. 12, Table 9).The lower Columbia was not surveyed again in 2018 due to extremely high water flows limiting access to islands and reducing available
301

Waterfowl Status and Trend Report 2018
nesting area. Counts were carried over most strata as it was a non-count year or due to access limitations. The lower Columbia section of this stratum is only surveyed every 5 years and was last surveyed in 2012. Therefore, counts from the previous year were used. Two out of 21 surveys were conducted according to the variable survey schedule. Most strata in the state are above their long-term averages (1974-2017) with the exception of the Upper Columbia River stratum, which began a steep decline starting in 2003 (-9%, Fig. 11, Table 9). The number of geese observed during the breeding duck surveys is presented in Figure 13 and Table 9. This index provides a better annual metric of total Canada Goose population including breeding and non-breeding segments of the population and additionally provides insights about the expansion of Canada geese into areas of Washington outside of our traditional goose nest index areas, and in general shows an increasing trend over the complete survey period. Potential Improvements to Waterfowl Breeding and Production Surveys • Compare new duck survey results with traditional survey results during concurrent years to
project long-term trends. • Evaluate the duck productivity and goose nest surveys for accuracy, frequency, and
completeness of surveys, including new methodologies that may be utilized for application in eastern and/or western Washington.
• Evaluate ways to combine goose nest surveys and aerial surveys into a more representative goose breeding population index survey.
Literature Cited U. S. Fish and Wildlife Service and Canadian Wildlife Service. 1987. Standard operating
procedures for aerial waterfowl breeding ground population and habitat surveys in North America; revised. Unpublished report.
302
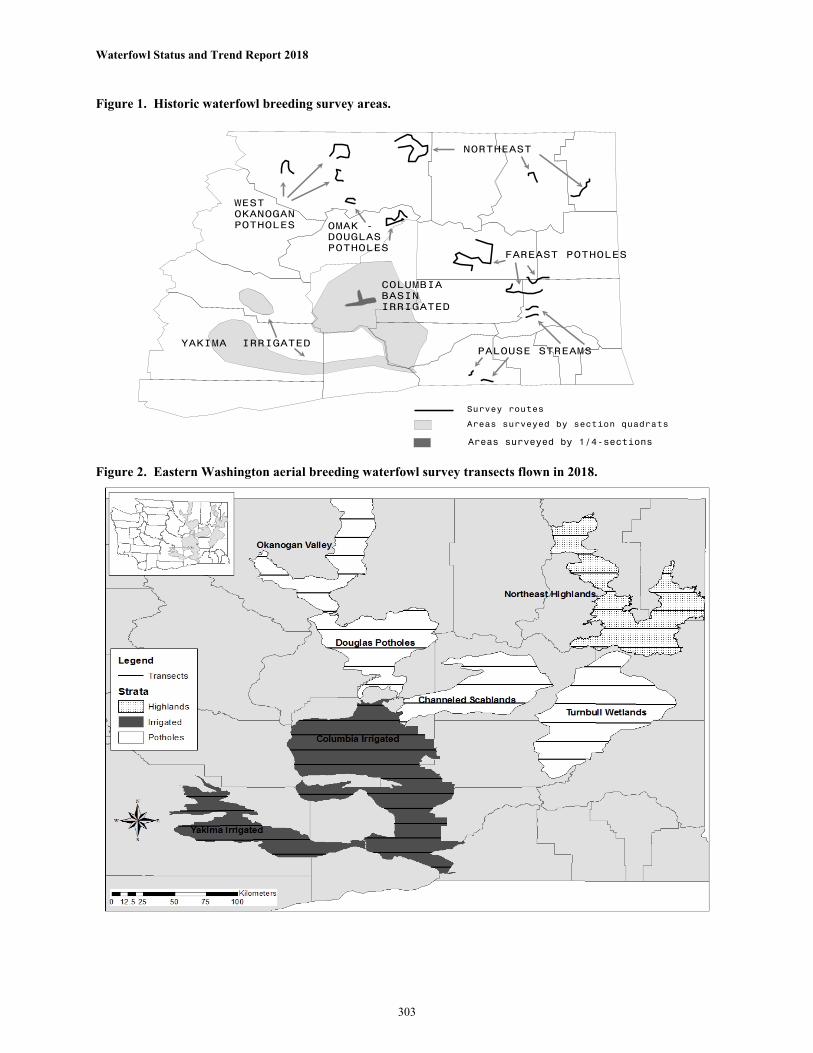
Waterfowl Status and Trend Report 2018
Figure 1. Historic waterfowl breeding survey areas.
Figure 2. Eastern Washington aerial breeding waterfowl survey transects flown in 2018.
303

Waterfowl Status and Trend Report 2018
Figure 3. Western Washington aerial breeding waterfowl survey transects flown in 2018.
Figure 4. Eastern Washington duck breeding population survey results by species, 2010-18.
0
20,000
40,000
60,000
80,000
100,000
120,000
Species
2010 2011 2012 2013 2014 2015 2016 2017 2018
304

Waterfowl Status and Trend Report 2018
Figure 5. Eastern Washington duck breeding population survey results by species and strata, 2018.
Figure 6. Western Washington duck breeding population survey results by species, 2010-18.
0100002000030000400005000060000700008000090000
100000
Species
Highlands Potholes Irrigated
05,000
10,00015,00020,00025,00030,00035,00040,00045,000
Species
2010 2011 2012 2013 2014 2015 2016 2017 2018
305

Waterfowl Status and Trend Report 2018
Figure 7. Western Washington duck breeding population survey results by species and strata, 2018.
Figure 8. Statewide duck breeding population survey results by species, 2011-18.
0
2000
4000
6000
8000
10000
12000
14000
Mallard Gadwall AmericanWigeon
Teal NorthernShoveler
NorthernPintail
Scaup Ring-neckedDuck
Bufflehead Mergansers Wood Duck
Species
Chehalis Valley Hood Canal South Puget Lowlands North Puget Lowlands Dungeness
0
20,000
40,000
60,000
80,000
100,000
120,000
140,000
Species
2011 2012 2013 2014 2015 2016 2017 2018
306

Waterfowl Status and Trend Report 2018
Figure 9. Brood index: Potholes, Palouse, Northeast Strata. 1979-2017.
Figure 10. Total Canada goose nests counted in in eastern Washington, 1982-2017.
307

Waterfowl Status and Trend Report 2018
Figure 11. Canada goose nest survey trends in eastern Washington, 1985-2018. UCR = Upper Columbia River; MCR = Middle Columbia River; SR = Snake River; CB= Columbia Basin.
Figure 12. Total Canada goose nests in the lower Columbia River stratum, 1987-2018.
0100200300400500600700800900
100019
82
1985
1988
1991
1994
1997
2000
2003
2006
2009
2012
2015
2018
Nes
t Att
empt
s
Year
UCR MCR SR CB
0
100
200
300
400
500
600
700
1987
1989
1991
1993
1995
1997
1999
2001
2003
2005
2007
2009
2011
2013
2015
2017
Nes
t Atte
mpt
s
Year
LCR Canada Goose Nests
308
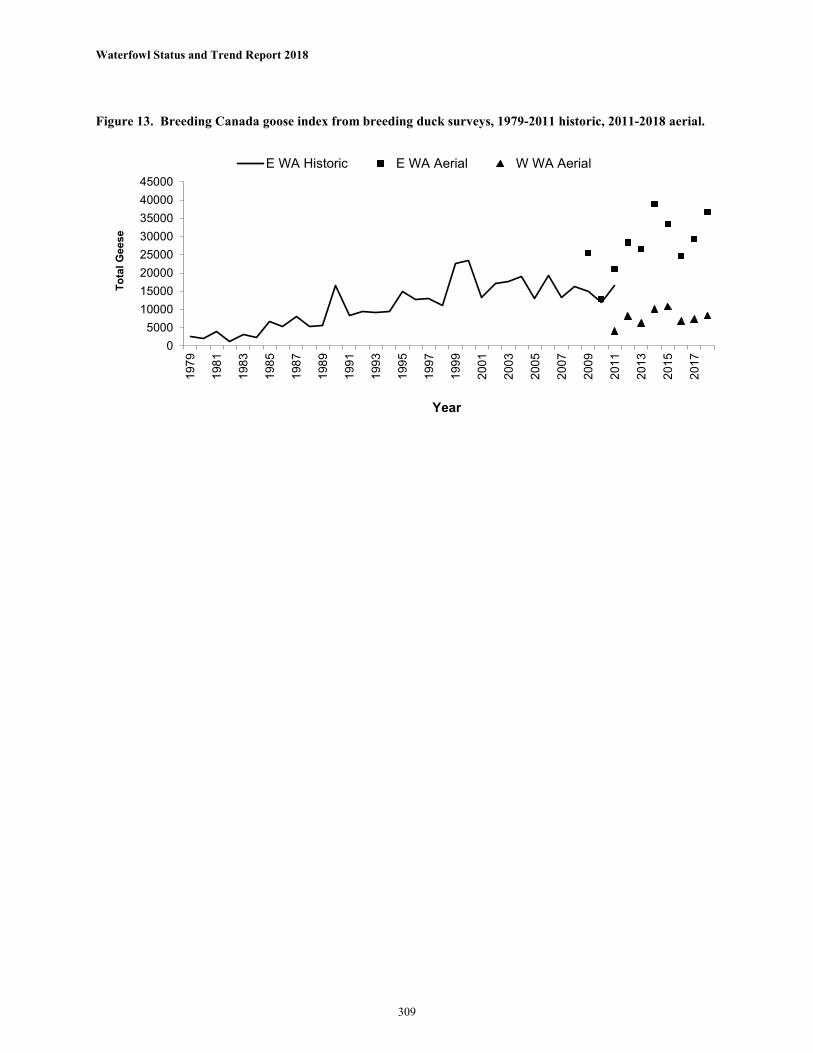
Waterfowl Status and Trend Report 2018
Figure 13. Breeding Canada goose index from breeding duck surveys, 1979-2011 historic, 2011-2018 aerial.
05000
1000015000200002500030000350004000045000
1979
1981
1983
1985
1987
1989
1991
1993
1995
1997
1999
2001
2003
2005
2007
2009
2011
2013
2015
2017
Tota
l Gee
se
Year
E WA Historic E WA Aerial W WA Aerial
309

Waterfowl Status and Trend Report 2018
Table 1. Areas and subareas historically surveyed with weighting factors for pond indices, and duck and goose breeding surveys. Weighting % of Total Area Subarea Survey Factor Area Sampled Potholes West Okanogan 14.06 7.1
Methow Valley Salmon Creek Sinlahekin
Omak Lake 9.83 10.2 Douglas County 15.26 6.5 Far East Potholes 18.69 5.3 Ewan-Revere Sprague-Lamont
Lincoln County 47.59 2.1 Highland Northeast 25.53 3.9 Colville Cusick Molson-Sidley Palouse Streams 32.52 3.1 Union Flat Palouse River Walla Walla River Touchet River Irrigated Columbia Basin – 65 sections 37.25 2.7 Wastewaysa – 19 ¼ -sections 10.05 9.9 Yakima – 35 sections 24.49 3.9 a Surveyed by helicopter beginning in 1994
310

Waterfowl Status and Trend Report 2018
Table 2. Weighted breeding duck population indices by species for eastern Washington historic survey areas (2002-2011).
Species 2002 2003 2004 2005 2006 2007 2008 2009 2010 2011 2002-2011
average Mallard 44676 39843 39958 40794 45485 46053 50647 47977 49160 54940 45953 Gadwall 18527 15353 15185 15665 17995 17165 14065 10277 10277 11735 14624 Am. Wigeon 6501 5028 5442 3439 6012 6240 2618 4283 2844 3248 4566 Am. green-winged teal 2673 1749 1477 2406 4095 4060 1590 1612 1844 1905 2341 Blue +cinnamon teal 13717 11274 14619 12404 9544 11999 11921 9282 8657 6645 11006 Northern shoveler 5968 7794 6293 4477 6581 5409 4898 5555 4199 6249 5742 Northern pintail 395 608 1096 644 1089 723 450 1198 542 2489 923 Wood duck 1863 616 1553 1375 1549 1870 1781 1327 2409 1527 1587 Redhead 11831 8117 8365 4978 8492 8265 7757 7156 6466 6072 7750 Canvasback 1507 919 618 610 1460 756 1132 873 385 765 903 Scaup spp. 9289 12722 4807 5741 9709 6530 4244 5982 2484 3429 6494 Ring-necked duck 1405 3063 850 2525 3640 2732 2995 2521 2381 2136 2425 Goldeneye spp. 4036 4713 3255 3567 2847 2837 3841 3686 3495 3121 3540 Bufflehead 1606 3034 1280 2425 6361 2809 3728 949 2701 6838 3173 Ruddy duck 9023 12175 9624 10150 10464 9538 8262 8378 6400 9306 9332 Merganser spp. 327 757 463 304 121 1279 969 1095 794 1848 796 Total ducks 133343 127764 114883 111503 135442 128265 120897 115663 105036 122254 121505
American coot 18171 19328 19085 12346 22151 33763 22069 25521 20511 16834 20978 Canada goose 17179 17596 19137 13022 19253 13244 16342 16023 12014 16511 16032
311

Waterfowl Status and Trend Report 2018
Table 3. Weighted breeding duck population indices by area for eastern Washington historic surveys (1979-2011).
Year Irrigated Potholes Palouse Northeast Total 1979 28948 57784 1951 9960 98643 1980 36870 58752 3057 15063 113742 1981 74711 58026 2341 13173 148252 1982 66161 63150 4455 12663 146429 1983 84969 48044 3545 12969 149527 1984 101486 73478 4618 16697 196278 1985 94789 95463 5984 19990 216226 1986 97901 79899 3837 22135 203771 1987 72503 80100 5073 25887 183564 1988 78137 103452 7068 53143 241799 1989 73411 50663 2341 35908 162323 1990 77838 56462 5138 29474 168912 1991 65698 50293 3382 21420 140793 1992 69547 22581 3252 20884 116264 1993 75969 42335 3577 27955 149836 1994 64537 43502 2699 13173 123912 1995 71513 46068 2472 26934 146987 1996 73364 62221 1691 25658 162933 1997 68589 85137 2667 16058 172451 1998 65503 96982 2341 20424 185251 1999 72697 101140 3089 23283 200210 2000 61126 70072 2537 22594 156328 2001 47438 70106 2537 26321 146402 2002 52341 59958 1106 19939 133342 2003 52648 49794 1170 24151 127764 2004 55098 39393 1041 19351 114883 2005 58339 35014 585 17564 111503 2006 72138 46672 1626 15650 135442 2007 63349 42119 2211 20271 128265 2008 62230 38710 1756 17999 120109 2009 50846 44020 1496 19301 115078 2010 55631 30351 1106 17948 105036 2011 71399 36352 1048 13454 122254
1979-2011 avg. 67204 58730 2812 21133 149834
312

Waterfowl Status and Trend Report 2018
Table 4. Summary of eastern Washington helicopter surveys for breeding waterfowl (2012-2018).
Re
gio
n
Ye
ar
Ma
lla
rd
Ga
dw
all
Am
eri
can
W
ige
on
Gre
en
-w
ing
ed
Te
al
Cin
na
mo
n
Te
al
Blu
e-w
ing
ed
T
ea
l
No
rth
ern
Sh
ove
ler
No
rth
ern
P
inta
il
Re
dh
ea
d
Ca
nva
sba
ck
Sca
up
Rin
g-n
eck
ed
D
uck
Go
lde
ne
ye
Bu
ffle
he
ad
Ru
dd
y D
uck
Co
mm
on
M
erg
an
ser
Ho
od
ed
M
erg
an
ser
Wo
od
Du
ck
TO
TA
L D
UC
KS
Am
eri
can
C
oo
t
Ca
na
da
G
oo
se
2012 25,192 1,943 96 287 2,229 127 955 64 955 0 1,656 287 605 2,102 573 64 0 510 37,644 1,369 7,102 4,275 454 76 188 1,113 101 475 53 406 0 679 122 388 860 279 50 0 354 4,663 439 1,502
2013 17,188 4,520 1,432 191 1,114 859 446 0 509 0 923 223 1,146 573 0 64 0 127 29,316 3,342 5,507 2,633 1,129 600 106 388 303 223 0 154 0 349 175 804 277 0 49 0 106 3,128 1,139 1,672
2014 25,815 4,902 1,464 764 3,247 382 637 127 1,114 0 382 127 0 382 0 127 0 446 39,915 7,830 7,639 5,350 1,707 469 349 1,768 254 454 69 420 0 175 59 0 181 0 71 0 171 5,963 3,075 1,696
2015 21,581 4,520 1,210 318 1,973 64 318 0 637 32 191 477 0 318 668 159 0 764 33,231 3,247 5,570 3,292 1,055 948 139 608 50 104 0 188 26 150 263 0 160 449 136 0 252 3,700 1,927 1,071
2016 15,406 3,024 509 828 2,228 382 796 127 1,305 0 859 191 0 64 32 0 0 382 26,133 2,515 3,024 2,145 683 175 333 456 137 529 69 838 0 373 87 0 54 25 0 0 165 2,569 1,348 1,010
2017 29,634 4,966 1,528 3,438 1,910 127 1,942 255 446 0 1,687 1,146 64 1,814 414 64 0 1,082 50,515 3,565 5,348 6,820 2,016 491 2,155 1,120 124 993 139 250 0 632 407 67 1,176 271 65 0 408 7,745 1,176 1,518
2018 32,351 4,966 668 1,241 3,310 509 1,337 0 700 0 1,432 796 64 64 0 477 0 987 49,083 3,438 8,913 6,425 1,691 247 591 1,223 295 613 0 494 0 687 507 62 62 0 303 0 394 6,909 2,625 2,113
2012 20,622 11,054 2,598 454 2,887 1,155 2,145 165 5,486 206 660 454 82 330 5,197 660 0 330 54,691 2,887 13,487 3,609 2,580 978 168 596 412 500 164 1,749 167 337 278 81 250 3,560 646 0 238 6,164 600 3,616
2013 21,564 9,854 2,515 495 5,937 536 2,062 0 8,494 247 1,855 165 82 165 3,876 165 82 247 58,424 15,709 11,462 5,468 3,028 1,416 265 1,852 249 738 0 4,292 173 901 170 85 160 1,660 161 85 133 8,205 7,924 3,661
2014 24,212 10,952 2,098 0 5,119 755 1,007 0 3,525 0 168 1,091 0 168 11,372 0 84 1,511 62,061 13,721 17,246 5,842 2,805 708 0 1,696 334 527 0 1,267 0 111 634 0 114 9,417 0 86 871 11,715 7,770 5,354
2015 24,367 13,895 3,463 1,649 6,350 495 1,484 165 3,876 0 82 3,834 82 330 19,626 0 0 247 79,946 7,092 19,337 5,809 4,863 2,355 442 1,840 334 571 162 1,235 0 85 2,278 85 263 17,031 0 0 169 19,075 5,642 7,525
2016 12,940 7,359 4,878 1,612 4,382 0 1,984 331 4,837 0 1,571 207 0 0 1,323 165 0 165 41,756 9,343 12,403 1,823 1,478 2,662 690 1,068 0 463 193 1,654 0 1,102 135 0 0 596 120 0 107 4,337 3,477 3,962
2017 27,913 10,308 5,278 7,257 3,628 82 10,390 4,783 6,391 165 1,567 4,370 0 4,041 7,422 742 165 660 95,160 13,853 15,049 5,175 1,462 1,408 1,469 1,492 81 2,329 1,520 1,702 162 1,268 1,027 0 1,850 3,322 445 115 316 7,961 3,469 4,494
2018 44,323 20,574 6,679 5,896 9,236 412 11,916 2,721 7,380 247 4,288 5,937 0 1,690 19,832 247 247 1,690 143,318 27,583 17,647 6,087 4,248 1,726 967 1,888 335 3,461 759 1,966 131 2,150 1,567 0 1,055 17,068 191 184 768 19,475 7,187 7,127
2012 10,582 832 238 79 238 238 396 0 357 0 0 198 159 238 0 79 79 1,704 15,417 436 8,719 1,896 250 112 50 112 157 127 0 149 0 0 122 105 66 0 46 50 621 2,042 148 2,810
2013 10,482 1,112 79 516 238 238 0 0 2,184 159 238 119 0 238 913 0 79 715 17,311 6,909 9,608 3,617 514 53 176 107 112 0 0 1,449 105 146 51 0 146 606 0 49 209 3,997 3,939 4,274
2014 10,697 3,526 317 0 832 317 238 0 1,426 79 713 2,060 317 1,189 2,853 158 0 1,585 26,308 10,539 13,946 2,994 1,527 160 0 341 210 157 0 785 52 362 560 121 249 1,831 61 0 494 4,031 6,230 4,323
2015 9,826 2,536 158 1,109 634 0 951 0 238 713 0 396 79 515 357 158 0 634 18,304 1,902 8,439 2,608 1,009 64 394 420 0 574 0 130 472 0 184 55 301 236 110 0 124 2,989 701 1,795
2016 4,884 2,541 318 0 874 0 0 0 1,271 0 159 476 79 0 913 556 0 318 12,389 1,112 9,252 1,132 868 130 0 263 0 0 0 809 0 78 240 49 0 638 325 0 140 1,837 464 3,151
2017 10,865 1,664 634 634 792 79 1,585 158 991 317 0 2,219 0 832 872 396 158 555 22,742 5,983 8,994 3,251 1,271 413 370 637 81 1,050 107 751 245 0 1,122 0 554 847 280 106 402 4,144 5,856 3,241
2018 14,620 1,823 792 911 2,060 158 3,170 79 1,228 0 396 555 158 238 317 79 357 1,268 28,209 4,913 10,103 3,274 1,038 463 397 773 149 2,376 81 671 0 403 318 161 156 170 71 280 520 4,426 4,253 4,102
2012 56,396 13,829 2,932 820 5,354 1,520 3,496 229 6,798 206 2,316 938 846 2,670 5,770 803 79 2,544 107,752 4,693 29,308 5,908 2,632 988 257 1,267 453 701 173 1,802 167 758 327 410 898 3,571 649 50 754 6,493 758 4,820
2013 49,234 15,486 4,027 1,202 7,289 1,634 2,507 0 11,187 406 3,017 507 1,228 976 4,789 229 162 1,089 105,051 25,960 26,577 7,065 3,273 1,539 336 1,895 408 771 0 4,533 202 977 250 808 352 1,767 169 98 270 9,127 8,922 5,870
2014 60,724 19,380 3,879 764 9,198 1,454 1,881 127 6,065 79 1,263 3,279 317 1,738 14,224 286 84 3,541 128,284 32,091 38,832 8,469 3,621 864 349 2,474 469 713 69 1,549 52 417 848 121 328 9,594 93 86 1,016 13,750 10,423 7,088
2015 55,774 20,950 4,831 3,077 8,957 558 2,753 165 4,750 745 273 4,708 162 1,163 20,651 318 0 1,645 131,482 12,240 33,347 7,168 5,077 2,540 608 1,983 337 816 162 1,256 473 173 2,301 101 430 17,039 175 0 328 19,659 6,003 7,810
2016 33,230 12,924 5,705 2,440 7,484 382 2,780 458 7,413 0 2,589 874 79 64 2,268 721 0 865 80,278 12,970 24,678 3,034 1,845 2,671 766 1,191 137 704 205 2,023 0 1,166 289 49 54 873 346 0 241 5,365 3,758 5,162
2017 68,403 16,937 7,439 11,328 6,331 289 13,917 5,196 7,827 482 3,254 7,735 64 6,687 8,707 1,202 323 2,297 168,417 23,401 29,390 9,157 2,796 1,548 2,634 1,972 169 2,741 1,530 1,877 294 1,417 1,574 67 2,260 3,439 530 156 654 11,855 6,907 5,745
2018 91,473 27,362 8,140 8,049 14,606 1,080 16,422 2,800 9,309 247 6,117 7,288 222 1,992 20,149 804 604 3,945 220,610 35,934 36,6629,437 4,688 1,804 1,201 2,379 470 4,242 764 2,135 131 2,293 1,677 173 1,069 17,069 365 335 1,007 21,133 8,754 8,491
±SE
±SE
±SE
±SE
Irri
ga
ted
Po
tho
les
Hig
hla
nd
sT
ota
l -
Ea
ste
rn W
ash
ing
ton
±SE
±SE
±SE
±SE
±SE
±SE
±SE
±SE
±SE
±SE
±SE
±SE
±SE
±SE
±SE
±SE
±SE
±SE
±SE
±SE
Species
±SE
±SE
±SE
±SE
313

Waterfowl Status and Trend Report 2018
Table 5. Summary of western Washington breeding waterfowl population survey (2012-2018).
Regio
n
Year
Mall
ard
Gadw
all
Amer
ican
Wige
on
Gree
n-wing
ed
Teal
Cinna
mon
Teal
Blue-w
inged
Te
al
Uncla
ssifie
d Te
al
North
ern
Shov
eler
North
ern
Pintai
l
Redh
ead
Canv
asba
ck
Scau
p
Ring-n
ecke
d Du
ck
Golde
neye
Buffl
ehea
d
Rudd
y Duc
k
Comm
on
Mer
gans
er
Hood
ed
Mer
gans
er
Woo
d Duc
k
TOTA
L DUC
KS
Amer
ican
Coot
Cana
da
Goos
e
2012 2,156 485 1,967 2,263 0 0 0 701 216 0 0 54 1,455 0 701 0 162 0 189 10,347 0 4581,349 470 729 1,954 0 0 0 515 209 0 0 52 1,349 0 379 0 162 0 148 2,952 0 261
2013 1,652 103 0 1,678 52 155 52 155 0 0 0 0 52 0 361 0 0 0 310 4,569 129 929675 70 0 1,304 54 112 42 149 0 0 0 0 50 0 257 0 0 0 92 1,509 146 736
2014 2,091 52 1,575 310 0 0 0 568 0 0 0 207 129 0 258 0 258 0 103 5,550 0 826473 50 1,400 182 0 0 0 476 0 0 0 234 98 0 125 0 89 0 65 1,593 0 382
2015 2,281 53 610 212 159 0 0 159 0 0 0 796 133 0 159 0 371 0 159 5,093 0 875790 51 554 151 153 0 0 105 0 0 0 903 89 0 128 0 239 0 59 1,375 0 266
2016 2,014 258 155 929 0 0 0 0 0 0 0 0 129 0 52 0 310 0 361 4,208 0 2581,015 248 149 893 0 0 0 0 0 0 0 0 65 0 42 0 313 0 231 1,439 0 154
2017 2,866 103 258 3,253 0 0 2,194 2,530 955 0 0 0 929 0 1,058 0 52 0 568 14,766 0 181672 107 204 1,806 0 0 1,562 1,710 918 0 0 0 263 0 499 0 52 0 126 3,211 0 110
2018 2,891 207 207 336 52 361 52 929 0 0 0 207 929 0 258 0 52 52 310 6,841 0 1136888 149 157 208 50 347 50 755 0 0 0 234 504 0 42 0 42 52 98 1,377 0 355
2012 2,619 0 607 192 0 0 0 0 0 0 0 0 831 0 256 0 0 256 415 5,175 0 735694 0 564 176 0 0 0 0 0 0 0 0 477 0 119 0 0 112 142 1,051 0 280
2013 2,080 63 0 63 0 0 126 0 0 0 0 0 63 0 851 0 126 126 126 3,624 0 851494 58 0 59 0 0 129 0 0 0 0 0 59 0 435 0 116 116 67 701 0 152
2014 3,466 0 0 0 0 0 126 63 0 0 0 0 32 63 189 0 0 378 189 4,380 0 10081,022 0 0 0 0 0 129 64 0 0 0 0 30 58 120 0 0 153 127 1,052 0 423
2015 2,822 0 127 127 0 0 0 0 0 0 0 0 190 0 190 0 0 0 761 4,090 0 380576 0 116 116 0 0 0 0 0 0 0 0 182 0 126 0 0 0 319 704 0 308
2016 3,963 0 63 0 0 0 0 0 0 0 0 0 412 0 507 0 0 190 285 5,422 63 666458 0 65 0 0 0 0 0 0 0 0 0 194 0 261 0 0 121 116 590 61 358
2017 4,159 0 347 0 0 0 0 0 0 0 0 0 662 0 819 0 63 126 441 6,617 0 284922 0 354 0 0 0 0 0 0 0 0 0 302 0 427 0 63 141 132 1,136 0 198
2018 6,217 64 157 208 0 0 0 0 0 0 0 0 446 64 128 0 64 765 2,200 10,074 0 1116958 58 128 0 0 0 0 0 0 0 0 0 298 63 120 0 63 271 596 1,216 0 398
2012 2,053 755 0 1,027 0 0 0 60 0 0 0 272 0 0 302 0 0 0 30 4,499 0 423885 737 0 840 0 0 0 65 0 0 0 252 0 0 99 0 0 0 33 1,452 0 300
2013 2,971 119 238 1,218 59 0 0 743 0 0 0 505 386 0 713 0 0 0 59 7,011 0 8611,241 121 162 843 64 0 0 759 0 0 0 471 205 0 292 0 0 0 57 1,796 0 893
2014 3,162 716 0 1,581 0 0 0 0 60 0 0 0 627 0 1,074 0 0 239 60 7,518 0 1581908 611 0 1,541 0 0 0 0 61 0 0 0 381 0 527 0 0 230 64 2,014 0 1128
2015 2,495 119 59 2,228 0 178 30 59 0 0 0 0 89 0 119 0 0 0 89 5,466 0 743665 84 57 2,278 0 120 32 64 0 0 0 0 83 0 115 0 0 0 66 2,384 0 537
2016 2,228 475 0 891 178 0 0 0 0 0 0 0 564 0 0 0 0 59 0 4,397 0 683777 393 0 847 132 0 0 0 0 0 0 0 269 0 0 0 0 61 0 1,252 0 440
2017 1,961 59 238 178 0 0 0 0 0 0 0 0 267 0 178 0 59 0 297 3,238 0 208790 64 129 182 0 0 0 0 0 0 0 0 176 0 123 0 61 0 109 860 0 116
2018 1,872 59 0 267 0 2,377 0 0 0 0 0 0 208 59 0 0 0 0 475 5,317 0 386592 61 0 137 0 2,430 0 0 0 0 0 0 114 57 0 0 0 0 298 2,526 0 383
2012 15,127 60 449 300 0 0 0 899 60 0 0 120 3,295 0 2,426 0 60 30 539 23,364 30 36843,569 61 283 218 0 0 0 589 61 0 0 125 1,153 0 585 0 56 28 221 3,868 28 1163
2013 10,274 734 499 2,495 0 0 59 2,789 0 0 0 0 2,407 59 2,671 0 59 176 822 23,043 29 24361,520 777 528 1,365 0 0 62 1,977 0 0 0 0 1,098 54 624 0 62 93 288 3,265 27 880
2014 7,359 0 493 0 0 0 92 954 0 0 0 0 431 0 985 0 185 62 1,293 11,854 31 3664932 0 392 0 0 0 95 600 0 0 0 0 227 0 417 0 109 61 182 1,291 28 878
2015 9,347 302 60 484 423 0 60 393 0 0 0 1,025 938 0 726 0 181 181 1,119 15,245 151 42951,680 208 63 374 433 0 64 260 0 0 0 627 307 0 249 0 101 132 315 1,986 106 924
2016 9,962 484 363 61 182 0 30 61 0 0 0 0 1,998 0 545 0 121 242 1,029 15,079 30 31791,271 266 344 57 140 0 33 63 0 0 0 0 789 0 256 0 68 100 336 1,627 33 637
2017 11,874 0 182 1,458 0 0 0 182 0 0 0 0 2,156 0 2,976 0 182 121 1,033 20,165 61 31891,576 0 128 690 0 0 0 127 0 0 0 0 1,700 0 1,193 0 169 113 223 2,719 56 1330
2018 12,190 363 121 0 60 60 907 363 0 0 0 60 1,633 0 1,422 0 302 423 3,267 21,174 60 35091,295 222 124 0 56 57 585 211 0 0 0 62 978 0 763 0 169 212 1,234 2,296 56 531
2012 11,034 532 199 399 0 66 66 798 266 0 0 665 931 0 1,363 0 332 0 1,130 17,781 0 26261,515 321 194 250 0 67 68 645 198 0 0 648 478 0 346 0 204 0 439 1,991 0 571
2013 7,869 150 449 1,107 60 0 539 180 748 0 0 0 60 60 479 0 209 0 1,316 13,224 0 13161,692 74 306 695 60 0 478 176 753 0 0 0 42 56 244 0 110 0 463 2,137 0 348
2014 9,664 60 180 2,693 120 0 0 1,885 359 0 0 329 180 0 509 0 2,513 120 957 19,567 0 30221,955 59 92 2,594 75 0 0 695 312 0 0 266 147 0 283 0 1,956 114 344 3,908 0 1238
2015 13,673 1,107 2,992 6,403 838 60 120 1,795 598 0 0 120 987 60 1,047 30 778 30 1,137 31,773 0 44883,393 517 1,581 3,689 433 56 83 955 504 0 0 113 319 60 524 29 541 29 312 5,481 0 1379
2016 8,467 419 60 449 299 0 0 0 359 0 0 0 90 0 180 0 658 120 987 12,087 0 2005419 268 60 251 310 0 0 0 301 0 0 0 64 0 122 0 494 73 376 2,427 0 673
2017 14,121 1,526 1,556 5,266 60 239 0 1,137 419 0 0 120 60 0 1,915 0 898 120 1,556 28,991 180 34112,682 828 1,012 3,207 61 157 0 842 359 0 0 122 62 0 653 0 469 79 320 4,563 130 1695
2018 10,292 359 180 1,825 60 60 0 60 0 0 0 60 419 479 778 0 180 598 1,735 17,083 0 21842,734 259 183 820 58 62 0 62 0 0 0 60 330 317 350 0 75 196 438 2,971 0 559
2012 32,989 1,832 3,223 4,180 0 66 66 2,457 541 0 0 1,110 6,511 0 5,047 0 554 285 2,303 61,166 30 79254,256 933 983 2,160 0 67 68 1,017 294 0 0 708 1,899 0 793 0 266 115 533 5,555 28 1384
2013 24,845 1,169 1,185 6,561 171 155 775 3,866 748 0 0 505 2,968 119 5,075 0 394 302 2,634 51,470 158 63942,722 795 632 2,182 103 112 501 2,130 753 0 0 471 1,120 78 889 0 171 148 560 4,607 149 1503
2014 25,742 828 2,247 4,584 120 0 92 3,470 419 0 0 536 1,398 63 3,015 0 2,956 798 2,603 48,869 210 101012,604 616 1,457 3,022 75 0 95 1,036 318 0 0 354 478 58 750 0 1,961 305 419 4,964 117 1975
2015 30,618 1,581 3,722 9,454 1,420 238 210 2,407 598 0 0 1,944 2,337 60 2,241 30 1,331 211 3,265 61,668 211 107823,966 566 1,678 4,356 631 132 109 997 504 0 0 1,105 494 60 618 29 599 135 554 6,485 123 1791
2016 26,634 1,637 641 2,330 659 0 30 61 359 0 0 0 3,194 0 1,283 0 1,089 612 2,664 41,192 94 67912,935 599 385 1,258 365 0 33 63 301 0 0 0 861 0 388 0 589 183 566 3,539 69 1097
2017 34,981 1,689 2,580 10,154 60 239 2,194 3,849 1,374 0 0 120 4,074 0 6,947 0 1,254 367 3,894 73,777 240 72723,406 838 1,106 3,749 61 157 1,562 1,910 986 0 0 122 1,756 0 1,515 0 509 197 444 6,369 141 2169
2018 33,462 1,052 635 2,428 172 2,858 959 1,352 0 0 0 327 3,636 602 2,585 0 597 1,839 7,987 60,490 60 83313,348 382 300 857 95 2,456 587 786 0 0 0 249 1,192 328 849 0 200 400 1,472 4,884 56 1013
Total
- Wes
tern W
ashin
gton
±SE
±SE
±SE
±SE
±SE
Cheh
alis V
alley
Hood
Cana
lDu
ngen
ess
South
Puge
t Low
lands
North
Puge
t Low
lands
±SE
±SE
±SE
±SE
±SE
±SE
±SE
±SE
±SE
±SE
±SE
±SE
±SE
±SE
±SE
±SE
±SE
±SE
±SE
±SE
±SE
±SE
±SE
±SE
±SE
±SE
±SE
±SE
±SE
±SE
±SE
±SE
±SE
±SE
±SE
Species
±SE
±SE
314

Waterfowl Status and Trend Report 2018
Table 6. Weighted duck brood indices by species for the Potholes, Palouse, and Northeast strata, 2004-2016.
2012 2013 2014 2015 2016 2017 2016 AverageMallard 1260 1284 1221 1200 1786 1419 1416 1035 1042 966 1597 2706 1017 1812 1277 1403 -30% -9%Gadwall 299 116 15 107 132 292 87 87 379 274 284 204 383 255 0 194 -100% -100%Wigeon 170 95 146 54 54 48 43 10 35 26 26 0 0 26 26 51 0% -49%Green-winged teal 158 14 26 118 94 151 183 176 233 272 244 204 179 51 26 142 -49% -82%Blue-winged teal 212 92 26 15 0 42 48 0 30 47 101 26 51 26 26 49 0% -47%Cinnamon teal 48 24 40 14 103 91 14 138 30 82 0 13 102 0 0 47 0% -100%Northern shoveler 238 63 0 29 15 59 44 49 19 19 19 0 25 0 0 39 0% -100%Northern pintail 158 20 0 0 0 0 0 0 0 14 0 0 0 0 0 13 0% -100%Wood duck 14 42 33 82 107 28 28 42 33 112 141 153 77 255 306 97 20% 216%Redhead 267 40 0 121 211 252 154 94 184 210 205 383 383 204 0 180 0% -100%Canvasback 128 26 15 65 26 90 0 32 0 77 14 51 51 0 0 38 0% -100%Scaup 82 0 0 20 14 21 94 17 34 0 26 102 76 26 51 37 96% 36%Ring-necked duck 26 85 0 108 26 50 14 86 23 14 26 51 77 0 26 41 0% -36%Goldeneye 26 266 163 438 444 412 331 275 391 231 138 332 255 204 230 276 13% -17%Bufflehead 26 0 26 0 40 14 24 43 14 26 179 0 0 0 0 26 0% -100%Scoter 0 0 0 0 0 0 0 0 0 0 26 0 0 0 0 2 0% -100%Ruddy duck 167 86 110 201 222 219 183 104 86 218 298 332 492 179 179 205 0% -13%Merganser 14 15 0 128 204 77 77 65 56 40 82 102 154 204 128 90 -37% 43%TOTAL BROODS 3089 3166 1819 4085 3477 3265 2741 2253 2588 2626 3402 4749 3322 3242 2275 3073 -30% -26%
% change fromSpecies 2003 2004 2005 20072006 2008 2009 2010 02-16 Avg2011
315

Waterfowl Status and Trend Report 2018
Table 7. Weighted duck brood indices for E. Washington strata and total unweighted brood counts for the Columbia Basin
YearChanneled Scablands Okanogan Northeast Palouse Total Broods
Columbia Basin
1979 6274 420 868 195 77571980 2598 936 715 33 42811981 4435 1041 485 98 60591982 2296 1131 1123 423 49731983 3349 1080 715 293 54371984 4806 1123 791 195 69151985 6133 1614 1123 325 91961986 4743 965 842 293 68431987 4574 1206 1072 325 71771988 1557 1112 749 434 38511989 2395 1023 894 358 46691990 1099 946 894 130 30681991 246 472 1506 130 23551992 317 434 1021 390 21631993 1232 590 613 390 28251994 2587 672 928 130 43161995 555 504 689 195 1943 1601996 3922 554 945 228 5649 2181997 1703 1345 1864 184 5095 1791998 5193 1837 894 163 8086 2791999 2816 1362 715 163 5055 1702000 2898 239 536 163 3836 1922001 2993 423 715 65 4196 1672002 2360 139 460 65 3024 1372003 2011 295 919 65 3291 1642004 440 905 791 130 2266 1472005 328 482 945 65 1819 1782006 450 986 1200 65 2701 No survey2007 435 984 1864 195 3477 1602008 945 1413 842 65 3265 612009 860 1160 689 33 2741 642010 703 854 664 33 2253 512011 1155 890 511 33 2588 612012 1018 731 842 98 2626 782013 1111 1376 817 No Survey 3402 472014 759 1633 918 No Survey 3310 762015 357 1889 970 26 3242 812016 859 787 868 195 2709 132017 690 860 895 176 2341 14LTA 2133 934 895 177 4123 123
2017 vs. 2016 -20% 9% 3% -10% -14% 8%2017 vs. LTA -68% -8% 0% 0% -43% -89%
316

Waterfowl Status and Trend Report 2018
Table 8. Goose nest survey areas in Washington
Survey Area
Year Survey
Initiated
Agency Conducting
Survey Frequency of
Survey UPPER COLUMBIA Hanford <1974 WDFW Biennial Priest Rapids <1974 WDFW Biennial Wanapum <1974 WDFW Periodic Rocky Reach 1975 Chelan Co. PUD Annual Rock Island <1974 Chelan Co. PUD Annual Wells 1980 WDFW Annual F.D.R. 1981 WDFW Periodic Rufus Woods 1981 Army Corps Annual Mouth of Yakima <1974 WDFW Biennial SNAKE RIVER
Snake River 1975 Army Corps Annual Snake River Cliff 1979 Army Corps Discontinued MID COLUMBIA
McNary <1974 USFWS Discontinued John Day <1974 Umatilla NWR Biennial Dalles <1974 Army Corps Periodic Bonneville 1982 Army Corps Periodic Tri-Cities 1982 WDFW Biennial COLUMBIA BASIN
Moses Lake 1981 WDFW Biennial Potholes Res. 1981 WDFW Biennial Lenore, Alkali, Park 1981 WDFW Periodic LOWER COLUMBIA
I-5 to Bonneville 1981 Army Corps Periodic I-5 to Puget Island 1981 WDFW Annual, Biennial
starting in 2012
317

Waterfowl Status and Trend Report 2018
Table 9. Number Canada goose nest counted per region (1974-2018), and total Canada geese observed on duck surveys.
Upper Snake Mid Columbia E WA Lower E WA E WA W WA
Year Columbia River Columbia Basin Total Columbia TOTAL Ground Aerial Aerial1974 279 363 642 6421975 297 50 344 691 6911976 310 51 345 706 7061977 358 51 384 793 7931978 329 51 330 710 7101979 303 87 292 682 682 25701980 393 112 339 844 844 19251981 500 145 318 249 1212 14 1226 40531982 509 160 480 484 1633 15 1648 12031983 656 171 520 541 1888 15 1903 32251984 618 132 466 601 1817 15 1832 23051985 630 150 500 757 2037 131 2168 66741986 641 136 507 765 2049 73 2122 52251987 745 130 670 702 2247 354 2601 79381988 794 229 723 742 2488 353 2841 54261989 799 227 627 500 2153 527 2680 56051990 808 180 634 518 2140 527 2667 166951991 923 199 637 414 2173 645 2818 84831992 916 236 633 538 2323 531 2854 94831993 858 319 629 628 2434 664 3098 91901994 806 290 662 595 2353 589 2942 93961995 929 261 702 477 2369 600 2969 150171996 944 236 777 501 2458 544 3002 127581997 798 210 711 676 2395 575 2970 130191998 744 210 693 610 2257 522 2779 111991999 783 187 811 315 2096 462 2558 225982000 797 207 816 313 2133 424 2557 234492001 790 214 835 539 2378 496 2874 133072002 751 199 872 629 2451 449 2900 171792003 793 199 782 374 2148 450 2598 175962004 728 199 782 350 2059 478 2537 191372005 626 199 689 584 2098 468 2566 130222006 593 248 753 544 2138 499 2637 192532007 489 217 734 442 1882 422 2304 132442008 451 197 727 485 1860 454 2314 163422009 461 243 749 594 2047 422 2469 14858 253642010 493 241 750 544 2028 403 2431 12014 127822011 499 259 725 599 2082 415 2497 16511 20993 40452012 462 255 728 628 2073 412 2485 28347 82312013 549 199 803 687 2238 412 2650 26577 63942014 508 263 814 624 2209 376 2585 38832 101012015 593 263 891 762 2509 376 2885 33347 107822016 584 263 891 731 2469 376 2845 24678 67912017 567 263 833 731 2394 376 2770 29390 72722018 567 263 833 717 2380 376 2756 36662 8331
2018 vs. 2017 0% 0% 0% -2% -1% 0% -1% 25% 15%Long Term Avg. 623 194 643 561 1927 402 2265 26701 7659
2018 vs. LTA -9% 36% 30% 28% 24% -6% 22% 37% 9%
Canada Goose NestsTotal Geese observed during
breeding duck surveys
318

Waterfowl Status and Trend Report 2018
Waterfowl: Winter Population and Harvest Status and Trend Report STATEWIDE MATTHEW T. WILSON, Waterfowl Specialist KYLE A. SPRAGENS, Waterfowl Section Manager Introduction This report summarizes the 2017-18 Washington winter waterfowl surveys, hunting regulations, harvest, and hunter trends. This summary compares current data with data collected over the past 30 years in the state as well as the Pacific Flyway. These data are part of a long-term database archived by the Washington Department of Fish and Wildlife (WDFW) Waterfowl Section. Several of the data sets extend back to the late 1940s.
Population surveys Methods Traditionally, the primary assessment to determine status of wintering waterfowl throughout the Pacific Flyway was the January Midwinter Waterfowl Survey (MWS). This was a coordinated, comprehensive, survey of the most important waterfowl wintering areas, using a combination of standardized surveys from fixed-winged aircraft and ground observation locations. The MWS combined efforts among several agencies; Oregon Department of Fish and Wildlife (ODFW), California Department of Fish and Wildlife, Yakama Nation, U.S. Fish and Wildlife Service (USFWS), and Canadian Wildlife Service. WDFW continues to conduct a portion of the MWS in Washington. WDFW also conducts special winter surveys focused on sea ducks during December and January, as part of the Puget Sound Ecosystem Monitoring Program (PSEMP). Consistent winter aerial surveys of greater Puget Sound began in 1993-94, and have been conducted each subsequent year (except for 2006-07 and 2017-18, due to funding limitations). Survey methods have been peer reviewed by a science panel as part of PSEMP. These surveys sample the entire marine shoreline and open water areas using six depth strata. The transects annually cover 7% to 8% of the marine waters in Puget Sound and the Strait of Juan de Fuca, totaling 6,400-7,100 km of transects. Population estimates from these surveys represent minimum estimates as observers are not able to detect all birds present within the transect, due to environmental conditions (e.g. glare, waves) and reactions of some species to aircraft (e.g. diving, flight). Because the MWS does not capture migration peaks or patterns of habitat use throughout the fall/winter, additional fixed-wing and ground surveys take place in key wintering areas from October–March. Specific age structure surveys also take place in the north Puget Sound area for snow geese, brant, and swans, along standard ground observation routes.
319

Waterfowl Status and Trend Report 2018
Midwinter Waterfowl Survey Results Beginning in 2016, the USFWS discontinued the Pacific Flyway midwinter index for total waterfowl. Changes in operational priorities for USFWS created the need for states to conduct surveys individually, leaving Washington, California, and Montana as the only Pacific Flyway states to conduct midwinter surveys. WDFW did not attempt surveys in January 2018. Yakama Nation personnel conducted a partial survey of the Yakima Basin survey in January 2018. The midwinter index for total waterfowl from 2007-2017 is in Table 1. Ducks In Washington, the 2017 total wintering duck population was 505,894, down 12% from 2016 levels and 27% below the 10-year average (Fig. 2). The Washington total duck count has represented 13.5% of the 10-year average from 2005-15 (Fig. 3). The 1991 MWS represents the highest proportion of Washington ducks to total Pacific Flyway (28.6%). The total number of mallards counted in Washington in 2017 was 194,071, a 17% reduction from the previous year, and 44% below the 10-year average (Table 1). Washington typically holds a high percentage of the Pacific Flyway mallard population with a 10-year average from 2005-15 of 41% (Fig. 4). Results for special Puget Sound winter surveys through 2016 are presented in Table 2. The most recent 3-year average for scoters is 55,407, which has declined significantly from the 1994-96 peak average of 107,214. Canada geese Canada geese are not well represented in midwinter surveys as they forage in widespread agricultural areas, making them difficult to locate during aerial surveys. Wintering Canada goose numbers began to build in the 1990s, when the MWS first indexed over 400,000 geese. The number of Canada geese wintering in Washington has been variable over the past 20 years. Canada geese numbered over 90,000 during the winter of 1998-99 and 2000-01. The 2016 total of 34,445 was up 3% from 2015 and 25 % below the 10-year average (Table 1, Fig. 5). Snow geese
The northern population of snow geese that over-winter in Skagit, Snohomish, and Island counties of NW Washington and the Fraser River Delta, B.C. nest primarily on Wrangel Island, Russia. Juvenile snow geese comprised 16.2% of the wintering population in the Fraser and Skagit River Deltas in December 2017. MWS snow goose aerial photo counts by WDFW in late December 2017 numbered 86,330. This represents a 16.7% decrease over the December 2016 count of 103,617, but remaining 17.3% above the 10-year average (Table 3, Fig. 6). Reports from the Wrangel Island Tundra River colony indicated a below-average juvenile recruitment and survival in 2017.
320

Waterfowl Status and Trend Report 2018
Brant The number of brant counted in Washington during the 2017 midwinter survey was 12,652, a 20% decrease from 2016, remaining nearly 28% below the 10-year average (Table 1, Fig. 7). The number of brant counted during the northern Puget Sound midwinter aerial survey on December 26, 2017 was 6,947; an increase of 9.2% from . The largest concentrations of brant were in Lummi, Padilla, and Samish bays. Breast color measurements were again taken from brant at Skagit County check stations in 2016-17. Seventy-five percent of harvested birds (n=61) were gray-bellied (WHA) brant (Mansell 4-8). Since 2006, the WHA harvest composition has ranged from 21% to 79%. Swans The 2017 northern Puget Sound (Skagit, Whatcom, Snohomish, King, and Island counties) trumpeter swan MWS totaled 17,473 (Table 3), a 1% decrease from the 2016 count of 17,644. Juveniles accounted for 14.3% of the trumpeter swans observed (Table 3). The 2017 northern Puget Sound tundra swan midwinter index was 929, increasing 58% from the 2016 index (588). Juveniles represented 12.6% of the population (Table 3). Since 1999, trumpeter swans and, to a lesser degree, tundra swans wintering in northwestern Washington and southwestern British Columbia have experienced high rates of mortality due to ingestion of lead shot pellets. Of the 2,332 carcasses collected from 2000-2011, the majority of deaths were lead-related (66%). An average of 18 lead and 7 steel pellets were recovered per gizzard of lead-exposed swans (n=1,736 gizzards, 43,767 pellets). From 2001-2005, a total of 315 trumpeter and tundra swans were trapped and blood samples collected for lead residue analysis. Trumpeter swans were outfitted with VHF radio transmitters (n=243) or satellite transmitters (n=6); 61 tundra swans were fitted with neck collars. Locations of radio-tagged swans were used to identify primary forage and roosting areas. Judson Lake, a major roost site on the Washington/British Columbia border, was identified as a potential source of lead shot ingestion. During the winters of 2006-2009, active hazing activities discouraged swans from using the lake, which coincided with an approximate 70% reduction in lead-caused swan mortalities during the first 3 winters (average 67 lead-related mortalities in 2006-09) when compared to the average of 227 lead-related mortalities per year over the previous five years (2001-06). Starting in 2009, hazing at Judson Lake focused on the area of highest lead shot concentration. Bamboo poles and fencing prevented swans from landing in the exclusion area, while allowing them use of about 50% of the lake. The barrier system was successful in excluding swans without an appreciable increase in lead related swan mortality or any swan injuries due to the barrier system. However, known trumpeter swan mortalities increased to 374 in 2014-15 with 203 (54%) showing signs of lead poisoning. This prompted a revamping of the exclusion area in November 2016. Winter 2017-18 represented the second post-revamp year related to monitoring efforts, and resulted in 195 encountered mortalities in the long-term monitoring region, of which 64 (33%) were confirmed lead poisoning, but with 39 (20%) undetermined-cause mortalities. Monitoring will continue for a third year in relation to the exclusion area to help inform the duration lag of lower mortalities.
321

Waterfowl Status and Trend Report 2018
Periodic Aerial Survey Results Aerial waterfowl surveys in northern Puget Sound were accomplished by WDFW. Surveys in the Columbia Basin were previously conducted cooperatively between WDFW and Yakama Nation biologists. These surveys are no longer conducted due to changes in funding and waterfowl survey design throughout the Pacific Flyway (Table 3). North Puget Sound The North Puget Sound January 2018 aerial survey totaled 193,630 dabbling ducks. The record high count for this area took place in December 2006 (n=974,180). Waterfowl frequently move between the Fraser River Delta and Boundary Bay, B.C. depending on weather conditions, resulting in high variability in the North Puget Sound survey. Eastern Washington Results of other periodic surveys in the Columbia and Yakima basins, if available, are presented in Table 3. Long-term monitoring of small Canada geese (Lesser and Taverner’s) staging on Stratford (Brooke) Lake and Round Lake has taken place since the early 1970s. These lakes are located near the town of Stratford in central Grant County. Both lakes are on private property and are not hunted. Population trends of Washington's small Canada geese have not been well documented because they forage in widespread agricultural areas and are mixed with other subspecies, making them difficult to survey from the air. October staging surveys were originally aerial counts but switched to ground counts in 2006. Survey results (1976-2015) are presented in Figure 8, with 9,338 counted in 2015. The highest historical count was 80,050 in 1984. This population is of concern due to past high harvest return rates of geese in the Columbia Basin that were banded in Alaska. It is thought the very low counts in 2014 and 2015 are a result of the implementation of a new water feed route through the lakes that has eliminated many of the preferred staging areas for small Canada geese. Surveys were not conducted in 2016 and were incomplete in 2017. It is not known at this time where these populations may have shifted.
Hunting Season Regulations The 2017-18 waterfowl harvest was regulated under Washington State regulations following federal framework recommendations (Table 4). The federal framework allowed the maximum (107 days) number of days under the Migratory Bird Treaty Act. Washington’s season length was 105 days statewide with two additional days for the statewide Youth Hunt on Sept. 16-17. The daily bag-limit was 7 ducks, to include not more than 2 hen mallard, 1 pintail, 3 scaup, 2 canvasback, and 2 redhead statewide; and to include not more than 1 harlequin (season limit), 2 scoter, 2 long-tailed duck, and 2 goldeneye in western Washington (Table 4). Substantial waterfowl populations in the Pacific Flyway over the last 15 years have allowed for liberal seasons and bag limits (Table 5). The season lengths between 1988-89 and 1993-94 were the most restrictive since 1950. Current regulations are among the most liberal ever offered in Washington and beginning with the 2014-15 season hunters could retain three times the daily bag in their possession for most waterfowl (Table 5).
322

Waterfowl Status and Trend Report 2018
WDFW instituted a new license format for the 1999-00 hunting season. A small game license and big game license replaced a general hunting license. For people who hunted a variety of small game species, there was little change in total costs. For people who hunted waterfowl exclusively, the new format resulted in an increase in cost. Before the 2002-03 hunting season, the cost of a migratory bird validation increased from $6.00 to $10.00 (excluding transaction and dealer fees). A 10% surcharge was added to all WDFW licenses in 2009-10 and 2010-11. The validation was replaced with a migratory bird permit in 2011, and the cost was $17.00 in 2015, and has remained through the 2017-18 season. Beginning in 2011-12, hunters of brant and snow geese in Goose Management Area 1, sea ducks in western Washington, and all geese in SW Washington were required to purchase a special $13.20 migratory bird authorization to obtain harvest record cards for these species (harvest record cards were free before then). The federal migratory bird stamp increased to $25.00 in 2015 (Table 5). Goose hunting regulations are structured to protect declining populations of Canada goose subspecies, increase recreational opportunities on expanding populations of Canada geese, simplify regulations, and address damage/nuisance complaints. The number of goose management areas remained at 5 for 2017-18 (Fig. 9). Prior to 1984, the goose season length in southwest Washington was 93 days, with bag/possession limits of 3/6. Since that time, the season has evolved to: 1) conserve the dusky Canada goose subspecies, which has declined in numbers since the 1970s; 2) provide control of agricultural damage resulting from higher numbers of other Canada geese in the area; and 3) provide greater recreational opportunity. Significant changes to the SW goose season in 2015-16 began with the closure of dusky Canada goose hunting. Check stations were expensive to operate and it was believed that significant numbers of hunters failed to report to check stations. Other major changes included; more season days and longer hunting hours, elimination of harvest recording, hunting hours extended to 30 minutes after official waterfowl hunting hours to 30 minutes before the end of official waterfowl hunting hours, and the inclusion of Clark and Grays Harbor counties in permit zones 2A and 2B, respectively. Historic season regulations for SW Washington are presented in Table 6. A special late season damage control hunt initiated in 1995-96 was continued in Area 2A and initiated in Area 2B during 2015-16. Beginning in 2016-17 Area 2A and 2B were combined into Area 2. The season was open Saturdays, Sundays and Wednesdays during February 10 – March 10, 2018 and open to all hunters possessing the SW goose authorization. Public lands remained closed during the late season. Beginning with the 2015-16 season, the Aleutian goose daily bag limit was eliminated, and Aleutians could be hunted as part of the normal Canada goose limit. Previously listed as both a federal and state endangered species, Aleutian Canada goose populations have experienced strong population growth in recent years and have caused crop and pasture depredation complaints in coastal agricultural areas, mainly in Oregon and California. Daily bag limits and possession limits during the September goose season were increased in Area 4 &5 from 3 and 6 to 5 and 10 respectively. Area 2 retained the previous limits for Area 2B, 5 daily and 15 in possession. Agricultural depredation by snow geese in Skagit County led to the development of the Snow Goose Quality Hunt Program on Fir Island. Presently, thousands of acres were available as Feel Free to Hunt or Register to Hunt. Numerous complaints of public safety concerns due to unethical snow goose hunting led to special restrictions in Skagit County. Hunters were restricted from
323

Waterfowl Status and Trend Report 2018
discharging a firearm within 100 feet of any paved public road for the purpose of hunting snow geese anywhere in Skagit County. Violation of these rules, trespass, exceeding the snow goose bag limit, or shooting across a paved road resulted in invalidation of the hunter’s snow goose authorization for the remainder of the current waterfowl season and the subsequent season. The January-only brant season took place in 2018, with 10 hunt days in Pacific County, 3 days in Clallam and Whatcom Counties, and 3 days in Skagit County (Table 4). The Skagit County brant hunt is dependent on a pre-season count of at least 3,000 brant, allowing a 3 day season, or more than 6,000 brant, allowing an 8 day season. On December 26, 2017, the Skagit County MWS estimated 3,867 brant. The count was conducted again on January 3, 2018 and estimated 4,793 brant (Table 3). The shortened 3 day season in Skagit County was allowed to proceed as scheduled.
Harvest Surveys Methods Harvest estimates were traditionally based on the Small Game Harvest Questionnaire sent to 10% of the hunting license buyers. Hunters were asked to report the numbers of ducks and geese they harvested by county. The species composition of the waterfowl harvest was derived from a Daily Waterfowl Harvest Report Card Survey. In this survey, cards were sent to over 2,500 waterfowl hunters prior to the start of the season to record the species of the birds they bagged. These data were used to tabulate the species composition of the waterfowl harvest. This survey was discontinued in 2017, and instead emphasis has been placed on sending a minimum of 3 biologists to participate in the Pacific Flyway Wingbee to assist in species, age and sex composition information that allows for incorporation into state-specific estimates. This has the added benefit of providing better training for personnel that participate in operational pre-season duck banding efforts each year. Because statewide surveys are not accurate enough to measure harvest of several priority waterfowl species, special surveys have been developed that utilize written hunting authorizations and mandatory reporting. The sea duck (harlequin, scoter and long-tailed duck), brant, and snow goose harvest is estimated annually using a mandatory harvest report card for each species. Written authorization and harvest reports have been required of sea duck hunters in all of western Washington since 2004, brant hunters in all hunt areas since 1990, and snow goose hunters in the primary harvest area (Skagit, Island, Snohomish counties) since 1993. Hunters must return a harvest report card in order to be included in the permit mailing the following year. Starting in 2012-13, hunters failing to turn in their harvest reports were charged a $10 administrative fee to obtain a harvest report card the following year. Harvest reports returned by the deadline are included in the analysis as the ‘first wave’ of respondents. Reminder notices are sent out to hunters with email addresses available, reminding them to return reports. Responses received after the reporting deadline are included as the ‘second wave’, and then the harvest estimates are computed accounting for non-response bias. Hunters were required to report harvest by species and county with mandatory harvest report cards by February 15, 2018. The harvest of dusky Canada was closed beginning with the 2015-16 season in Goose Management Area 2 during October through March (see above) in agreement and coordination with ODFW and USFWS. With removal of check stations, law enforcement checked hunter bags in Area 2 in order to determine compliance and were assisted by WDFW personnel specifically trained in
324

Waterfowl Status and Trend Report 2018
determining goose species. WDFW uses standardized criteria for classifying duskys, where a dusky was classified as a dark-breasted Canada goose (Munsell ≤5) with a culmen length of 40-50 mm. WDFW continued enhanced goose hunter training for people who wish to hunt geese in Area 2. The training program was initially developed in 1996, and revised in 1997 in conjunction with ODFW. In this program, hunters study a goose identification workbook and are advised to view a training video. The study materials, including the video, are available from the WDFW website. The workbook is also available through regular mail from WDFW and the video can be purchased from a vendor. Originally, hunters took a 40 question written test at one of eight testing locations and could choose from several testing dates. In 2007-08, WDFW provided the opportunity to take tests online, and by appointment at WDFW offices. Hunters are required to pass the test with a minimum score of 80%. Hunters who fail the test are required to wait 28 days before retesting. The test was updated in 2015 to reflect the dusky Canada goose season closure. And prior to the 2017-18 season the online test was modified to make it easier for hunters to purchase their license upon successfully passing the identification test. If a hunter takes a dusky Canada goose, or does not comply with field check requirements, the authorization will be invalidated and the hunter is not allowed to hunt geese in Goose Management Area 2 for the remainder of that waterfowl season.
Waterfowl Harvest Survey Results The 2016-17 Washington duck harvest of 443,590 was 5% lower than the 2016-17 harvest of 470,168. The duck harvest in Washington declined steadily from over 1,000,000 in the late 1960s, to a low of 242,516 in 1993-94 (Fig. 10). Duck harvest rates in Washington have stabilized over the past 10 years, averaging approximately 446,000 birds annually. As recently as 2015-16, Mallards comprised 54% of Washington’s, followed by American wigeon (17%), American green-winged teal (9%), and northern pintail (6%; Table 7). The total Canada goose harvest for 2017-18 was 75,782, over 5,000 higher than the 2016-17 harvest of 70,532, and higher by over 3,000 than the previous record of 72,721 in 2006-07. A record low harvest of 26,479 occurred in 2004-05. During recent years, the presence of resident large Canada geese has increased in Washington, which has contributed to an overall increasing trend in harvest (Fig. 11). The 2015-16 large Canada goose harvest (39,601) was up 2% from the previous year and 48% above the long-term average. The harvest of small Canada geese in 2015-16 (20,227) increased 32% from the previous year, and was 20% below the long-term average (Fig. 11). The highest recorded harvest of small Canada geese in Washington was 47,270 in 1979-80. The lowest harvest (8,880) took place in 2003-04. The reasons for the dynamic small goose harvest are uncertain. Waterfowl harvest is summarized by WDFW administrative regions in Table 8 and Fig. 12. Region 2 has traditionally represented the highest percentage of the state’s waterfowl harvest. However, for the 2016-17 and 2017-18 seasons, Region 4 accounted for 26% of the harvest followed by Region 2 (23%) and Region 3 (22%). The proportion of duck harvest was highest in Region 4 (28%), followed by Regions 2 (22%) and 3 (21%). Region 2 accounted for the highest proportion of goose harvest (32%), followed by Region 3 (22%), and Region 4 (18%).
325

Waterfowl Status and Trend Report 2018
Mandatory Harvest Reporting Results Restrictive bag limits for most sea ducks were maintained for western Washington in 2017-18. Concerns about low recruitment rates in sea ducks, increasing interest in sea duck hunting, and the unknown impact of reduced sea duck bag limits on compensatory species, particularly Barrow’s goldeneyes, led to the measure. The harvest survey indicated a total harvest of 1,444 scoters, 177 long-tailed ducks, 259 harlequin ducks and 474 goldeneyes (Fig. 13, Table 9). The reported goldeneye harvest included 45% common goldeneye. From 2,344 authorizations, an estimated 632 hunters were successful and hunted a total of 1,839 days, similar to 2016-17 days afield. Primary harvest areas included Island, Mason, Skagit, Clallam, Pierce, and Whatcom counties. The 2017-18 pre-season count of brant in Padilla/Samish/Fidalgo Bays was below the threshold of 6,000, but above 3,000, allowing the 3 day January brant season in Skagit County. An estimated 170 brant were harvested, a 3% increase of the estimated 165 harvested during the 3 day season in 2015-16. Brant hunting was allowed in Pacific county and harvest of brant was 58, 21% above the 2016-17 estimate of 46 (Fig. 14, Table 10). Additionally, for the first time in more than 25 years, harvest was allowed in Whatcom and Clallam counties resulting in 28 and 90 brant harvested, respectively, after winter counts had consistently placed the 3-year average above the 1,000 brant winter population threshold required to consider opening a county to potential harvest, per WDFW Game Management Plan objectives. The 2017-18 snow goose harvest was estimated at 5,660, decreasing % from the 2016-17 harvest of 6,742. Snow goose harvest in Washington is historically variable (Table 11, Fig. 15) depending on several factors including age and production of the Wrangel Island snow goose flock. In addition, the harvest of snow geese in northern Puget Sound is weather dependent, with high wind events leading to greater harvest. This factor, as well as proportion of juveniles, may be of greater importance to harvest than total abundance, because the erratic annual harvest (Fig. 15) does not follow the number of geese counted in Washington during the MWS (Fig.6). These geese have recently expanded their wintering range in northeastern Washington to portions of Snohomish and King Counties. Additionally, continued reports and coordinated survey efforts suggest that growing numbers of snow geese are being documented in the Lower Columbia River near Vancouver, Washington and in the mid-Columbia River stretch between Burbank, Washington, Umatilla and Boardman Oregon. In the southwest Washington goose season, hunters who passed the identification test in 1996-2017 and did not take a dusky Canada goose in 2016-17 were authorized to hunt in 2017-18. New hunters and those that illegally harvested a dusky in 2016-17 were required to take a new test to obtain an authorization. Hunters were not required to record harvest or report to check stations. A combination of uniformed and undercover officers documented hunter compliance through individual field checks throughout the regular and late seasons. Of 382 geese classified during bag checks (Table 12), 7 dusky Canada geese were recorded. Figure 16 shows number and species of geese brought to check stations 1969-2015. Hunter Numbers and Success The Washington small game hunter survey was used to estimate the number of waterfowl hunters in the state. During the 2017-18 season, an estimated 21,631 hunters participated in the Washington waterfowl season, down about 3% from 2016-17 (Fig. 17). Following a steep decline
326

Waterfowl Status and Trend Report 2018
in 2002, there has been a stable to slightly decreasing number for the last fifteen years, although waterfowl stamp and permit sales have been stable since the early 1990s. Prior to that, there was a steady decline in hunters through the 1980s (Fig. 17). The 2004-05 estimate of Washington waterfowl hunters (23,078) was the previous lowest on record. The estimated average number of ducks harvested per hunter in 2017-18 was just under 21. Hunter success, based on ducks harvested per hunter per year, has been on an upward trend since the mid-1990s (Fig. 18). Therefore, it appears the downward trend in duck harvest (Fig. 10) is more related to hunter numbers (Fig. 17) than decreased annual hunter success. The high success rate may indicate that the state has retained many avid and successful waterfowl hunters, but may be struggling to retain hunters that may hunt only a handful of days each season. WDFW continues to evaluate ways of better understanding this discrepancy. Members of the hunting public often believe the decline in hunter numbers is a result of the restrictive regulations that began in the mid-1980s (Table 5). This may have contributed to the reduced hunter participation (Fig. 17), but the downward trend in hunter numbers began in the early 1980s when there was a 7 duck daily bag limit, no special restrictions on mallards and pintails, and season lengths were 93 west and 100 east (Table 5). The decline in hunter numbers is likely a result of changes in social views on hunting and lack of recruitment of new hunters. The quality of waterfowl hunting opportunities in Washington is good, but certainly the diversity of waterfowl hunting styles (e.g. dabbling ducks, diving ducks, sea ducks, geese and brant) present challenges in accessibility and educating traditional hunting style traditions (e.g. sea ducks and brant). Decreased hunter numbers result in lower hunter densities in the field and success has remained stable to increasing. In addition, the state is holding a large percentage of the Pacific Flyway's ducks. Urban encroachment in traditional hunting areas will be one of the biggest challenges faced by waterfowl hunters and managers. Regardless, the value of Washington’s waterfowl resources remains high and provides unique and enjoyable hunting recreation for the state’s hunting population. WDFW has recognized a decline of quality hunting opportunities found on public hunting areas. In response, WDFW has developed initiatives to address public hunting opportunities on public and private lands. In 2017-18 there were 6 regulated access areas (RAA) on WDFW lands, including Winchester Ponds, Frenchman Ponds, and North Potholes in Region 2, and Bailie Youth Ranch, Mesa Lake, and Windmill Ranch in Region 3. WDFW also continued the Waterfowl Quality Hunt in Region 4 and maintained and expanded a private lands access program for waterfowl hunting in Regions 2, 3, and 4. Some of these programs featured limited access designed to reduce hunter crowding and/or limit waterfowl disturbance. However, there is continued recognition that habitat enhancements are key to achieving improved hunting experiences, and will be emphasized, over “quality”, in the upcoming seasons.
Recommendations
• Attempt to minimize harvest regulation adjustments over the next three year period and continue to evaluate harvest opportunities and access limitations.
• Provide summary of mallard and Canada goose band returns in future reports.
327

Waterfowl Status and Trend Report 2018
0123456789
Mill
ions
Fig. 1 Midwinter Inventory (MWS) Total Ducks in the Pacific Flyway
NO
SURV
EY
0%5%
10%15%20%25%30%35%
Fig. 3. Proportion of Pacific Flyway ducks in Washington during MWS
NO
SURV
EY
0%10%20%30%40%50%60%70%
Fig. 4. Proportion of Pacific Flyway mallards in Washington during MWS
NO
SURV
EY
0
20000
40000
60000
80000
100000
120000Fig. 6. Skagit Valley MWS: Snow Geese
328
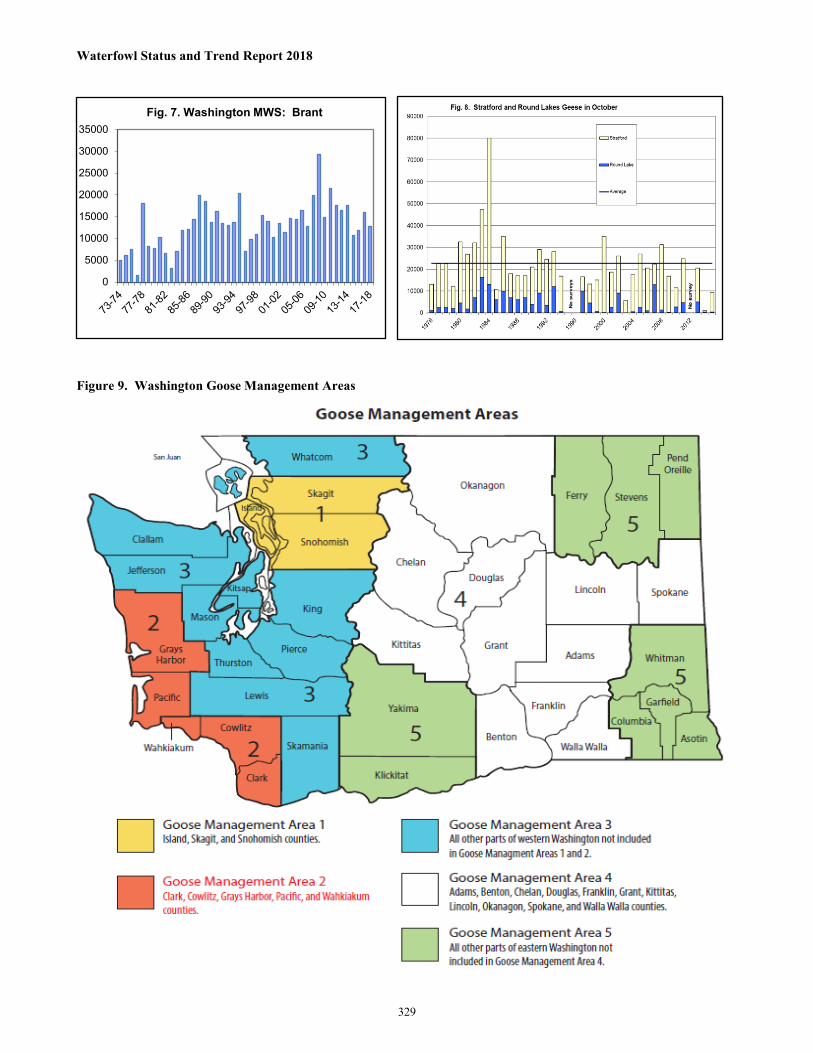
Waterfowl Status and Trend Report 2018
Figure 9. Washington Goose Management Areas
0
5000
10000
15000
20000
25000
30000
35000Fig. 7. Washington MWS: Brant
329

Waterfowl Status and Trend Report 2018
Figure 10. Total harvest of ducks in Washington (1962 – 2018).
Figure 11. Small and large Canada goose harvested in Washington (1962-2017).
0
200
400
600
800
1000
1200
Thou
sand
s
0
10
20
30
40
50
Thou
sand
s
Small Canada Geese
0
10
20
30
40
50Th
ousa
nds
Large Canada Geese
Region 112%
Region 223%
Region 322%
Region 426%
Region 58%
Region 69%
Fig 12. Waterfowl Harvest by Region
48
1110
286 259 177 260 214
-100100300500700900
11001300
Blac
k Sc
oter
Surf
Sco
ter
Whi
te-w
inge
d Sc
oter
Harle
quin
Long
-taile
d
Barr
ow's
Gold
eney
e
Com
mon
Gol
dene
ye
Fig. 13 Sea Duck harvest
330

Waterfowl Status and Trend Report 2018
Figure 16. Southwest Washington goose harvest as determined at check stations, Goose Management Areas 2A and 2B, 1970-2015. Check stations were discontinued 2015.
0500
100015002000250030003500400045005000
Fig. 14. Washington brant harvest
0
2000
4000
6000
8000
10000
12000
14000
16000Fig. 15. Skagit snow goose harvest
0500
100015002000250030003500400045005000
1961
-70
1971
-80
1981
-83
1984
-85
1985
-86
1986
-87
1987
-88
1988
-89
1989
-90
1990
-91
1991
-92
1992
-93
1993
-94
1994
-95
1995
-96
1996
-97
1997
-98
1998
-99
1999
-00
2000
-01
2001
-02
2002
-03
2003
-04
2004
-05
2005
-06
2006
-07
2007
-08
2008
-09
2009
-10
2010
-11
2011
-12
2012
-13
2013
-14
2014
-15
total other vancouver western lesser taverner's dusky cackler
0
20000
40000
60000
80000
100000
120000Fig. 17. Washington waterfowl hunters
0
5
10
15
20
25
Duc
ks p
er h
unte
r
Fig. 18. Duck hunter success rates
331

Waterfowl Status and Trend Report 2018
Table 1. Washington Department of Fish and Wildlife Midwinter Waterfowl Survey (MWS) – January 2018.
Species 2007 2008 2009 2010 2011 2012 2013 2014 2015 2016 2017 2018 18 vs 17 18 vs. 10yr 09-18avg.
Mallard 494597 313871 254655 405604 349790 282601 254057 529671 381428 227894 194071 96885 -50% -67% 297666 Gadwall 5314 5854 5324 6877 4149 3790 4236 2209 2845 3148 2498 861 -66% -76% 3594 Wigeon 90734 89614 207236 126059 106149 101072 102264 112831 123440 132633 115949 84451 -27% -30% 121208
Green-winged Teal 30947 15506 15175 11554 18795 16225 8559 14196 22277 36805 12728 16986 33% -2% 17330 B.W. & Cinn. Teal 272 2 12 20 335 9 3 4 4 19 2 3 50% -93% 41
Shoveler 8763 2210 2671 2474 919 5419 2793 3872 2121 3110 3807 2964 -22% -2% 3015 Pintail 113949 45848 117235 40787 71083 73635 66024 71339 109825 100585 73239 63035 -14% -20% 78679
Wood Duck 99 378 309 1406 501 380 150 9796 220 149 340 55 -84% -96% 1331 Redhead 3645 2443 4668 3550 4015 2501 3226 1132 761 1731 1377 25 -98% -99% 2299
Canvasback 1501 3790 3239 3789 3148 2157 1528 462 1489 3437 719 641 -11% -69% 2061
Scaup 29711 35052 40306 43003 31118 49304 52394 41984 42610 67746 59098 16957 -71% -62% 44452 Ringneck 12642 16568 19740 8763 5192 5415 3937 5327 8552 12625 19682 3180 -84% -66% 9241
Goldeneye 13973 15106 15976 14578 14457 11599 13570 10700 10507 13813 8260 572 -93% -95% 11403 Bufflehead 17511 21230 25510 21609 19451 24019 19830 29131 23964 22594 15261 3242 -79% -84% 20461
Ruddy Duck 2179 3096 1508 1428 1180 2026 1744 2353 2626 4755 1695 2373 40% 9% 2169
Eider 0 0 0 0 0 0 0 0 0 0 0 0 0% 0% 0 Scoter 15307 16742 12585 10445 11944 13432 13677 13287 14799 14320 922 294 -68% -97% 10571
Long-tailed Duck 804 504 547 439 663 652 722 867 872 690 95 13 -86% -98% 556 Harlequin 733 902 670 839 692 1067 918 961 1019 1101 78 0 -100% -100% 735
Merganser 7443 6377 6523 7894 8775 8302 8262 8771 8834 10239 6303 1953 -69% -74% 7586 Unidentified Ducks 4731 2515 9981 13440 5507 0 2765 9180 2846 5959 885 4783 440% -14% 5535
Snow Goose* 75141 82583 55016 66176 38976 49699 56973 50354 52023 71714 103617 -100% -100% 60505
White-fronted Goose 82 42 119 22 113 36 47 24 41 48 35 11 -69% -78% 50 Canada Goose 42759 60131 28629 53259 26999 45641 42686 82347 33564 34445 24863 22544 -9% -43% 39498
Brant 12712 19775 29243 14895 21457 17502 16454 17485 10706 11811 15878 12652 -20% -25% 16808 Tundra Swan** 3548 3570 3380 3211 2544 2247 1652 1171 1767 3654 2108 2403 14% 0% 2414
Trumpeter Swan** 9104 7747 9852 9457 9984 7603 11043 11623 14225 14201 18334 18404 0% 48% 12473
Unknown Swan** 842 292 1100 540 221 1775 2381 3609 2929 1823 826 1123 36% -31% 1633 Total Waterfowl 999043 771748 871209 872118 758157 728108 691895 1034686 876294 801049 682670 356410 -48% -54% 767260
Coot 72265 69305 101951 84543 54017 48978 51996 43827 69030 146899 122302 5993 72954 B.C. Snow Geese 8007 12276 2495 7788 24285 22265 10225 19633 17309 11954 14494
**Comprehensive western Washington swan surveys in 1989, 1991, 1996, 2001, 2006, 2011, 2016. 2018 data includes only western Washington.
332

Waterfowl Status and Trend Report 2018
Table 2. Puget Sound long-term winter survey estimates for sea ducks
Years POP SE % Change from 2015
% Change from LTA
% Change from 1994-
96 POP SE % Change from 2015
% Change from LTA POP SE
% Change from 2015
% Change from LTA POP SE
% Change from 2015
% Change from LTA POP SE
% Change from 2015
% Change from LTA POP SE
% Change from 2015
% Change from LTA
1994-1996 107,214 5,192 0% 52% 0% 42,872 1,802 0% 50% 62,010 3,429 0% 20% 3,588 310 0% 12% 8,543 882 0% 51% 16,378 1,104 0% 14%1995-1997 107,625 4,064 0% 52% 0% 39,272 1,903 -8% 37% 65,881 3,352 6% 27% 3,794 320 6% 18% 10,235 1,005 20% 80% 16,804 1,091 3% 17%1996-1998 93,185 3,567 -13% 32% -13% 29,250 1,618 -26% 2% 51,913 2,771 -21% 0% 3,867 344 2% 21% 6,836 654 -33% 20% 12,594 585 -25% -12%1997-1999 91,080 3,810 -2% 29% -15% 27,532 1,517 -6% -4% 46,654 1,434 -10% -10% 3,535 295 -9% 10% 6,210 555 -9% 9% 11,405 752 -9% -21%1998-2000 85,999 3,476 -6% 22% -20% 26,294 1,195 -4% -8% 42,322 1,263 -9% -18% 3,556 331 1% 11% 4,754 232 -23% -16% 10,424 678 -9% -27%1999-2001 84,250 3,241 -2% 19% -21% 28,959 1,414 10% 1% 48,362 1,617 14% -6% 3,425 324 -4% 7% 5,995 664 26% 6% 13,594 768 30% -5%2000-2002 77,003 2,697 -9% 9% -28% 28,787 1,446 -1% 1% 45,784 1,585 -5% -11% 3,349 334 -2% 4% 5,660 658 -6% 0% 13,231 575 -3% -8%2001-2003 66,580 2,371 -14% -6% -38% 30,125 1,325 5% 5% 54,778 1,720 20% 6% 3,040 266 -9% -5% 6,345 674 12% 12% 15,379 666 16% 7%2002-2004 63,613 2,343 -4% -10% -41% 29,233 1,322 -3% 2% 53,142 1,454 -3% 3% 3,226 247 6% 1% 4,547 376 -28% -20% 13,417 576 -13% -7%2003-2005 63,000 2,223 -1% -11% -41% 28,668 1,203 -2% 0% 55,862 1,394 5% 8% 3,236 221 0% 1% 5,080 384 12% -10% 14,544 557 8% 1%2004-2006 67,165 2,497 7% -5% -37% 26,314 1,124 -8% -8% 49,896 1,269 -11% -4% 3,232 224 0% 1% 4,753 378 -6% -16% 13,436 518 -8% -6%2005-2008 66,790 2,664 -1% -6% -38% 25,254 1,070 -4% -12% 49,353 1,274 -1% -5% 3,113 192 -4% -3% 5,028 336 6% -11% 13,342 561 -1% -7%2006-2009 60,548 2,558 -9% -14% -44% 25,087 1,188 -1% -12% 47,910 1,233 -3% -7% 2,916 186 -6% -9% 4,491 341 -11% -21% 12,598 559 -6% -12%2008-2010 52,264 2,251 -14% -26% -51% 24,853 1,295 -1% -13% 47,883 1,251 0% -7% 2,840 174 -3% -11% 4,542 361 1% -20% 13,571 643 8% -6%2009-2011 44,894 1,523 -14% -36% -58% 23,224 1,238 -7% -19% 44,687 1,170 -7% -14% 2,341 138 -18% -27% 4,596 347 1% -19% 13,446 604 -1% -6%2010-2012 46,118 1,405 3% -35% -57% 22,266 1,117 -4% -22% 48,863 1,307 9% -6% 2,649 145 13% -17% 4,706 325 2% -17% 14,380 643 7% 0%2011-2013 50,075 1,515 9% -29% -53% 22,706 1,112 2% -21% 48,033 1,229 -2% -7% 2,691 154 2% -16% 4,795 289 2% -15% 14,823 858 3% 3%2012-2014 53,248 2,387 6% -25% -50% 24,741 1,311 9% -13% 56,693 1,452 18% 10% 3,044 180 13% -5% 5,177 305 8% -9% 18,176 1,021 23% 27%2013-2015 54,239 2,664 2% -23% -49% 25,604 1,181 3% -10% 56,805 1,596 0% 10% 3,058 188 0% -5% 5,275 301 2% -7% 17,878 1,027 -2% 24%2014-2016 55,407 2,729 2% -22% -48% 25,813 1,211 1% -10% 56,142 1,680 -1% 9% 3,264 193 7% 2% 5,240 303 -1% -8% 16,830 829 -6% 17%
Scoters Goldeneye Bufflehead Harlequin Duck Long-tailed Duck Merganser
333

Waterfowl Status and Trend Report 2018
Table 3. 2017-18 waterfowl surveys conducted in the Columbia Basin; waterfowl surveys, snow goose photo counts, aerial brant surveys, age-ratio counts conducted in North Puget Sound.
North Columbia Basin Oct. Nov. Dec. Jan. Mallards Total Ducks Total Geese No No No No Total Swans Survey Survey Survey Survey Total Coots SURVEY TOTAL South Columbia Basin Oct. Nov. Dec. Jan. Mallards Total Ducks Total Geese No No No No Total Swans Survey Survey Survey Survey Total Coots SURVEY TOTAL Yakima Basin Oct. Nov. Dec. Jan. Mallards Total Ducks Total Geese No No No No Total Swans Survey Survey Survey Survey Total Coots SURVEY TOTAL Northern Puget Sound Oct. 9 Nov. Dec. Jan. 2 Mallards 23,645 75,075 Northern pintail 21,715 44,000 American wigeon 22,245 No No 63,385 Green-winged teal 3,104 Survey Survey 11,170 TOTAL DABBLERS 70,709 193,360
Snow Goose Counts
Date Skagit/ Snohomish/ Island Co.
Fraser
Survey Type % Young
12/21/2017 86,330 Aerial – Photo Count
15.4
2/9/2018 86,553 Aerial – Photo Count
n/a
Brant Aerial Surveys Date Skagit Co.
Whatcom Co. Survey Type
12/26/2017 3,867 Aerial – Visual
1/3/2018 4,793 Aerial – Visual/Photo
Swan Age Ratios - North Puget Sound
Species Sample size Juveniles % Young Trumpeter Swan 17,473 2,499 14.3%
Tundra Swan 929 117 12.6%
334

Waterfowl Status and Trend Report 2018
Table 4. 2016-17 Washington migratory bird season regulations
Species Area Season Dates (inclusive)/Restrictions Daily Bag Limit Possession Limit
Duck Statewide
Sept. 16-17 (Youth Hunting Onlya) 7b 14b
Oct. 14-18 & Oct. 21 - Jan. 28, except scaup season closed Oct. 14- Nov. 3
7b 21b
Coot Statewide Sept. 16-17 (Youth Hunting Onlya) 25 50
Oct. 14-18 & Oct. 21 - Jan. 28 25 75
Snipe Statewide Oct. 14-18 & Oct. 21 - Jan. 28 8 24
Canada Goose Early Seasons
Goose Mgmt Areas 1 & 3 Sept. 9-14 5c 15c
Goose Mgmt Area 2 Sept. 2-10 3c 9 c
Goose Mgmt Areas 4 & 5 Sept. 9-10 3c 6c
Statewide Sept. 16-17 (Youth Hunting Onlya) 4c 8c
Goose
(except Brant)
Goose Mgmt Area 1 Snow, Ross’, Blue, White-fronted Goose : Oct. 14 - Jan. 28d
4 12
Canada (except Brant): Oct. 14-26 & Nov. 4 - Jan. 28
Goose Mgmt Area 2
All areas except Ridgefield National Wildlife Refuge: Everyday Oct. 14-29, Saturdays, Sundays, & Wednesdays only Nov. 25- Jan. 14; Feb. 10 – Mar. 10e. During Feb. 10 – Mar. 10, public lands are closed to goose hunting in this area. 4f 12f
Ridgefield National Wildlife Refuge: Tuesdays, Thursdays, & Saturdays only Oct. 14 – 28 and Nov. 25 – Jan.13e 4f 12f
Goose Mgmt Area 3 Oct. 17-29 & Nov. 4 - Jan. 28 4 12
Goose Mgmt Area 4 Saturdays, Sundays, & Wednesdays only: Oct. 14 – Jan. 21; Nov. 10, 23, 24 ; Dec. 25, 26, 28, 29; Jan. 1, 15 ; & every day Jan. 22-28 4 12
Goose Mgmt Area 5 Oct. 14-16 & every day Oct. 21 - Jan. 28 4 12
Brant
Skagit County
Jan. 6, 7, 10, 13, 14, 17, 20, and 21 Note: If Skagit County pre-season brant population is 3,000 – 6,000 (determined by midwinter waterfowl survey), this season will be open only on the following dates: Jan. 6, 10, and 13. If the Skagit County pre-season brant population is below 3,000 (as determined by the midwinter waterfowl survey), this season will be canceled.
2 6
Clallam & Whatcom Jan. 6, 10, and 13
2 6
Pacific County Jan. 6, 7, 9, 11, 13, 14, 16, 18, 20, and 21
a. Special youth hunting season open to hunters under 16 years of age (must be accompanied by an adult at least 18 years old who is not hunting). b. Daily bag limit: 7 ducks, to include not more than 2 hen mallard, 1 pintail, 3 scaup , 2 canvasback, and 2 redhead statewide; and to include not
more than 1 harlequin, 2 scoter, 2 long-tailed duck, & 2 goldeneye in western Washington. Possession limit (Youth Hunting Weekend):14 ducks, to include not more than 4 hen mallard, 2 pintail, 6 scaup, 4 canvasback, and 4 redhead statewide; and to include not more than 1 harlequin, 4 scoter, 4 long-tailed duck, and 4 goldeneye in western Washington. Possession limit (regular Season): 21 ducks, to include not more than 6 hen mallard, 3 pintail, 6 canvasback, and 6 redhead statewide; and to include not more than 1 harlequin, 6 scoter, 6 long-tailed duck, and 6 goldeneye in western Washington. Season limit: 1 harlequin in western Washington.
c. Daily bag and possession limits: to include Canada geese only d. Skagit County Special Restrictions: While hunting snow geese, if a hunter is convicted of 1) trespass, 2) shooting from across or along the
maintained part of any public highway, 3) discharging a firearm for the purpose of hunting waterfowl within 100 feet of any paved public road on Fir Island or discharging a firearm for the purpose of hunting snow geese within 100 feet of any paved public road in other areas of Skagit County, or 4) exceeding the daily bag limit for snow geese, written authorization will be invalidated for the remainder of the current snow goose season and an authorization will not be issued for the subsequent snow goose season.
e. 30 minutes after the start of the official waterfowl hunting hours to 30 minutes before the end of the official waterfowl hunting hours. f. Daily bag limit: 4 geese, except for dusky Canada Geese. Possession limit: 12 geese, except for dusky Canada geese. Dusky Canada goose
season closed. A dusky Canada goose is defined as a dark breasted (Munsell 10 YR, 5 or less) Canada goose with a culmen (bill) length of 40-50 mm.
335

Waterfowl Status and Trend Report 2018
Table 5. Significant historical changes in duck hunting regulations.
Season Bag Limit Special Limits Stamp Fees Hunting License
Steel shot Regulation Year(s) East West East West Mallard Pintail State Federal
73-74
100
93
6
5 -
2 extra
-
$5.00
$6.50
-
74-75
100
93
6
5 -
-
-
5.00
6.50
-
75-76
100
93
7
7 -
-
-
5.00
6.50
-
76-77
100
93
7
7 -
-
-
5.00
7.50
-
77-79
100
93
7
7 -
-
-
5.00
7.50
3 zones1
79-80
100
93
7
7 -
-
-
7.50
7.50
" "
80-82
100
93
7
7 -
-
-
7.50
7.50
1 zone2
82-84
100
93
7
7 -
-
-
7.50
10.50
" "
84-85
100
93
7
7 -
4
-
7.50
10.50
" "
85-86
84
79
5
5
5 (1 ♀)
5 (1♀)
-
7.50 12.00
" "
86-87
86
79
5
5
4 (1 ♀)
4 (1♀)
5.00
7.50 12.00
Large zones3
87-88
86
79
5
5
4 (1 ♀)
4 (1♀)
5.00
12.00
12.00
" "
88-91
66
59
4
4
3 (1 ♀)
1
5.00
12.00
12.00
" "
91-94
66
59
4
4
3 (1 ♀)
1
6.00
15.00
15.00
Steel statewide
94-95
76
69
4
4
3 (1 ♀)
1
6.00
15.00
15.00
" "
95-96
100
93
6
6
6 (1 ♀)
2
6.00
15.00
15.00
Bismuth-tin added
96-97
100
93
7
7
7 (1 ♀)
2
6.00
15.00
15.00
" "
97-98
1065
1065
7
7
7 (2 ♀)
3
6.00
15.00
15.00
Tungsten-iron added
98-99
1065
1065
7
7
" "
1
6.00
15.00
15.00
Tungsten-polymer added
99-00
1065
1065
7
7
" "
1
6.00
15.00 30.004
Tungsten-matrix added
00-01
1056
1056
7
7
" "
1
6.00
15.00 30.00
" "
01-02 1056 1056 7 7
" "
1
6.00
15.00 30.00 Tungsten-nickel-iron added
02-03 1056 1056 7 7 " " 17 10.00 15.00 30.00 TINT8 added 03-04 1056 1056 7 7 " " 19 10.00 15.00 30.00 " " 04-05 1056 1056 7 7 " " 110 10.00 15.00 30.00 Tungsten-bronze &
tungsten-Tin-bismuth added
05-06 1056 1056 7 7 " " 1 10.00 15.00 30.00 " "
336

Waterfowl Status and Trend Report 2018
1Non-toxic shot zones were established at Barney Lake, Skagit Bay, and the Columbia River flood plain. 2Only Barney Lake was retained as a non-toxic shot zone. 3Steel shot in progressively larger zones from 86-87 through 91-92 when steel shot was required statewide. 4New small game license format. 5Youth hunt one additional day 6 Youth hunt two additional days 7pintail season limited to 62 days (Sept. 21-22; Oct.5-11; Oct 26-Dec. 17) 8tungsten-iron-nickel-tin shot 9 pintail season limited to 62 days (Sept. 20-21; Oct. 11-15, Dec. 2-Jan. 25) 10pintail season limited to 62 days (Sept. 18-19; Oct. 16-20; Dec. 7-Jan. 30) ascaup (lesser and greater) season limited to 86 days (Nov. 2-Jan. 26) bscaup (lesser and greater) season limited to 86 days (Nov. 1-Jan. 25) cscaup (lesser and greater) season limited to 86 days (Nov. 7-Jan. 31)
06-07 1056 1056 7 7 " " 1 10.00 15.00 30.00 Tungsten-iron-copper-nickel, Tungsten-tin-iron added
07-08 1056 1056 7 7 " " 1 10.00 15.00 30.00 Tungsten-tin-iron-nickel added
08-09 1056 1056 7 7 " " 1 10.00 15.00 30.00 09-10 1056 1056 7 7 " " 2 11.00 15.00 36.00 10-11 1056 1056 7 7 " " 2 11.00 15.00 36.00 11-12 12-13
1056
1056 1056
1056 7 7
7 7
" " " "
2 2
15.00 17.00
15.00 15.00
38.00 40.50
13-14 1056,a 1056,a 7 7 " " 2 17.00 15.00 40.50 14-15 1056,b 1056,b 7 7 " " 2 17.00 15.00 40.50 15-16 16-18
1056,c
1056,c 1056,c
1056,c 7 7
7 7
" " 7 (2 ♀)
2 1
17.00 17.00
25.00 25.00
40.50 40.50
Copper-clad iron added
337

Waterfowl Status and Trend Report 2018
Table 6. History of southwest Washington Canada goose season regulations
Year Season ID Class Quota Scheduled Dates (# days) Closure (# Days Hunted / Sched.)
2002-03 Regular
New 80 2A: Nov. 27-Jan. 26 (25-27)
2B: Nov. 9-Dec. 29 (23)
2A: RF (9/25)*, Others (27/27)
2B: No (23/23)
Late New 5 Feb. 1-Mar. 9 (17) – 2A* only No (17/17)
2003-04 Regular New 80 2A: Dec. 9-Jan. 24 (19)
2B: Nov. 15-Jan. 4 (15)
2A: RF (9/19)*, Others (19/19)
2B: No (15/15)
Late New 5 Jan. 31- Mar. 10 (12) – 2A* only No (12/12)
2004-05 Regular
New 80 2A: Nov. 27-Jan. 22 (15, RF 25)
2B: Oct. 16-Jan. 15 (14)
2A: No (15/15, RF 25/25)
2B: No (14/14)
Late New 5 Feb. 5 - Mar. 9 (10) – 2A* only No (10/10)
2005-06 Regular New 80 2A: Nov. 12-27, Dec. 7-Jan. 29 (30, RF 25)
2B: Oct. 15-Jan. 14 (27) 2A: No (30/30, RF 25/25)
2B: No (27/27)
Late New 5 Feb. 5 - Mar. 9 (10) – 2A* only No (10/10)
2006-07 Regular New 80 2A: Nov. 11-26, Dec. 6-Jan. 28 (32, RF 25)
P: Oct. 15-Jan. 14 (27) 2A: No (32/32, RF 25/25)
P: No (27/27)
Late New 5 Feb. 3 - Mar. 7 (10) – 2A* only No (10/10)
2007-08 Regular New 80 2A: Nov. 10-25, Dec. 5-Jan. 27 (32, RF 25)
P: Oct. 13-Jan. 12 (27) 2A: No (32/32, RF 25/25)
P: No (27/27)
Late New 5 Feb. 2 - Mar. 5 (10) – 2A* only No (10/10)
2008-09 Regular New 80 2A: Nov. 8-23, Dec. 3-Jan. 25 (32, RF 26)
P: Oct. 11–Jan. 10 (27)
2A: No (32/32, RF 26/26)
P: No (27/27)
Late New 5 Feb. 7 – Mar. 7 (9) No (9/9)
2009-10 Regular New 40 2A: Nov. 14-20, Dec. 9-Jan. 31 (31, RF 28)
P: Oct. 17–Jan. 16 (27)
2A: No (31/31, RF 28/28)
P: No (27/27)
Late New 5 Feb. 6 – Mar. 10 (10) No (10/10)
2010-11 Regular New 40 2A: Nov. 13-28, Dec. 8-Jan.30 (30, RF 27)
P: Oct. 16–Jan 15 (26)
2A: Yes (30/30, RF 5/27)
P: No (26/26)
338

Waterfowl Status and Trend Report 2018
Late New 5 2A: Feb. 5 – Mar. 9 (10) No (10/10)
2011-12 Regular New 40 2A: Nov. 12-27, Dec. 7-Jan.29 (30, RF 29)
P: Oct. 15–26 and Nov. 5-Jan 21 (26)
2A: Yes (30/30, RF 16/29)
P: No (26/26)
Late New 5 2A: Feb. 4 – Mar. 7 (10) No (10/10)
2012-2013 Regular New 40 2A: Nov. 10-25, Dec. 5-Jan. 27 (30, RF 28)
P: Oct. 13-24, Nov. 3-Jan. 19 (27)
2A: No (30/30, RF 28/28)
P: No (27/27)
Late New 5 2A: Feb. 2-Mar. 6 (10) No (10/10)
2013-2014 Regular New 40 2A: Nov. 9 – Dec. 1, Dec. 11-Jan. 26 (30, RF 29) P: Oct. 12-
23, Nov. 2-Jan. 26 (31)
2A: No (30/30, RF 28/28)
P: No (28/28)
Late New 5 2A: Feb. 1-Mar. 5 (10) No (10/10)
2014-2015 Regular New 80 2A: Nov. 8 – 30 & Dec. 10 – Jan. 25 (32, RF 28) P: Oct. 11-
25, Nov. 1-Jan. 17 (30)
2A: No (32/32, RF 28/28)
P: No (30/30)
Late New 5 2A: Feb. 4-Mar. 8 (10) No (10/10)
2015-2016 Regular New N/A** 2A: Nov. 14 – Dec 6; Dec. 16- Jan. 31 (32, RF 30) 2B: Oct.
17 – 25; Nov. 14 – Jan. 10 (32)
2A: No (32/32, RF 30/30)
2B: No (32/32)
Late New N/A** 2A and 2B: Feb. 10 – Mar. 9*** (13/13) 2A/2B: No (13/13)
2016-2017 Regular New N/A** 2: Oct. 15 – 23; Nov. 26 – Jan. 22 (31, RF 32) 2: No (31/31, RF 32/32)
Late New N/A** 2: Feb. 11 – Mar. 8*** (12/12) 2: No (12/12)
2017-2018 Regular New N/A** 2: Oct. 14 – 29; Nov. 26 – Jan. 22 (3139, RF 29) 2: No (39/39, RF 29/29)
Late New N/A** 2: Feb. 10 – Mar. 10*** (13/0) 2: No (13/13)
* 2A=Clark, Cowlitz, Wahkiakum; 2B=Grays Harbor, Pacific; C=Clark Private; CC=Clark-Cowlitz Private Lands; CSC=Clark/S. Cowlitz Private Lands; P=Pacific;
WNC=Wahkiakum/N. Cowlitz; PW=Pacific-Wahkiakum; PWNC=Pacific/Wahkiakum/N. Cowlitz; RF=Ridgefield; SC=S. Cowlitz; **Dusky harvest closed; ***public lands closed
339

Waterfowl Status and Trend Report 2018
Table 7. Waterfowl harvest by species in Washington (2015-16)1
Species Harvested Composition (%) Mallard 286,130 58 Northern pintail 20,824 5 American wigeon 66,792 16 Green-winged teal 38,646 9 Total ducks 482,866 Large Canada 39,601 61 Small Canada 20,227 31 Total geese 70,524 Total waterfowl 553,390
1The number of each species harvested is estimated from the Daily Waterfowl Harvest Report Card Survey. The total number of ducks and geese harvested is estimated from the more extensive Small Game Harvest Questionnaire, discontinued in 2016-17. Table 8. Waterfowl harvest by region (2017-18)
Region Ducks Harvested % of State Total Ducks Harvested Geese Harvested % of State Total Geese
Harvested
Region 1 51,808 12% 12,569 17%
Region 2 96,744 22% 24,447 32%
Region 3 94,675 21% 16,695 22%
Region 4 122,236 28% 13,450 18%
Region 5 35,200 8% 5,320 7%
Region 6 42,927 10% 3,301 4%
Table 9. Estimated number of sea ducks harvested in 2017-181
1 These figures are based on analysis of mandatory report returns, corrected for non-response bias.
Species Harvest Scoters 1444 Black Scoter 48 Surf Scoter 1110 White-winged Scoter 286 Harlequin 259 Long-tailed 177 Barrow’s Goldeneye 260 Common Goldeneye 214 TOTAL 2,354
340

Waterfowl Status and Trend Report 2018
Table 10. Brant harvest report summary1
1Figures based on mandatory report returns, corrected for non-response bias, days hunted estimate from 1990-08 include successful hunters only.
YEAR MONTH PERMITS ISSUED SUCCESSFUL HUNTERS
HUNTER DAYS
SEASON DAYS BY COUNTY
SKAGIT CO. HARVEST
WHATCOM CO.
HARVEST
CLALLAM CO.
HARVEST
PACIFIC CO. HARVEST
TOTAL HARVEST
1990 DEC 490 338 763 11 808 0 0 73 8811991 DEC 654 330 647 11 790 3 0 52 8451992 DEC 747 319 709 11 950 9 0 18 9771993 DEC 1194 496 765 11 1347 7 0 53 14071994 DEC 1069 287 484 9 825 0 0 23 8481995 DEC 1207 343 552 11 918 0 0 44 9621996 DEC 1445 254 549 11 1493 0 0 41 15341997 JAN 1331 197 326 5 597 0 0 59 6561998 JAN 1348 243 350 5 570 0 0 18 5881999 JAN 1336 218 386 9 581 0 0 86 6672000 JAN 1295 39 59 5* 0 0 0 108 1082001 NOV 5 56 0 0 20 762001 JAN 5 347 0 0 17 3642001 ALL 1436 187 277 10 403 0 0 37 4402002 NOV 5 18 0 0 9 272002 JAN 5* 0 0 0 33 332002 ALL 1387 27 277 10 18 0 0 42 602003 NOV 5 22 0 0 13 352003 JAN 5 235 0 0 64 2992003 ALL 1187 152 200 10 257 0 0 77 3342004 NOV 5 36 0 0 11 472004 JAN 5 308 0 0 34 3422004 ALL 1612 126 209 10 344 0 0 45 3892005 JAN 1707 220 336 5 504 0 0 53 5572006 JAN 1793 199 272 7 367 0 0 74 4412007 JAN 1795 166 243 7 341 0 0 112 4532008 JAN 2116 191 262 7S/10P 328 0 0 81 4092009 JAN 1681 232 510 8S/10P 545 0 0 31 5762010 JAN 1030 200 387 8S/10P 253 0 0 125 3782011 JAN 1232 214 502 8S/10P 638 0 0 80 7182012 JAN 1362 254 604 8S/10P 541 0 0 63 6042013 JAN 1364 192 651 8S/10P 479 0 0 26 5052014 JAN 1352 14 76 10P 0 0 0 40 402015 JAN 1366 193 236 3S/10P 165 0 0 34 1992016 JAN 1358 548 8S/10P 538 0 0 46 5842017 JAN 1450 130 388 3S/3W/3C/10P 170 28 90 58 349
341

Waterfowl Status and Trend Report 2018
Table 11. Snow goose harvest report summary
YEAR PERMITS ISSUED SUCCESSFUL HUNTERS DAYS HUNTED* ISLAND CO. HARVEST
SKAGIT CO. HARVEST
SNOHOMISH CO. HARVEST TOTAL HARVEST
1993 2298 572 1096 58 677 1124 1859
1994 2588 433 664 60 496 522 1078
1995 2313 221 373 57 99 331 487
1996 2363 427 996 39 381 1400 1820
1997 2795 424 812 38 545 749 1332
1998 3086 341 585 29 678 262 969
1999 3061 445 777 71 815 598 1484
2000 3076 460 1039 18 1058 919 1995
2001 3144 407 953 4 753 696 1453
2002 3196 442 1217 18 1419 1084 2522
2003 3013 530 1155 20 1465 889 2374
2004 3333 474 1075 37 1267 893 2160
2005 3546 895 2665 50 4588 2154 6792
2006 4068 1061 2566 7 3780 1876 5663
2007 4859 1662 5528 53 11462 4175 15690
2008 5583 1253 2912 117 6295 3743 10155
2009 4015 1370 9840 8 9979 2959 12946
2010 4830 770 5078 0 3388 1032 4420
2011 2776 1113 6011 0 6924 4079 11003
2012 2811 966 4359 0 3903 1956 6859
2013 2884 861 4013 126 4016 1579 5721
2014 3010 1110 4499 6 2069 683 2758
2015 3005 1099 4704 6 2373 1067 3446
2016 3240 6680 6742
2017 3494 6705 5660
*days hunted 1993-08 include successful hunters only **harvest estimate does not include wounding loss
342

Waterfowl Status and Trend Report 2018
Table 12. Southwest Washington Canada goose harvest summary
Season Period Aleutian Cackler Dusky Lesser Taverner Vancouver Western Other Total CAGO Snow Whitefront Total 1961-70 10 Year Ave. 1894 1971-80 10 Year Ave. 2624 1981-83 10 Year Ave. 4814 1984-85 Season Total 0 37 0 63 0 20 0 120 1985-86 Season Total 11 66 116 113 0 67 25 398 1986-87 Season Total 8 36 51 172 0 241 0 508 1987-88 Season Total 7 45 225 478 4 224 35 1018 1988-89 Season Total 17 43 136 617 0 763 7 1583 1989-90 Season Total 37 52 92 455 9 391 0 1036 1990-91 Season Total 28 65 165 555 20 383 3 1219 1991-92 Season Total 39 88 295 675 14 483 15 1609 1992-93 Season Total 84 91 270 1340 25 722 2 2534 1993-94 Season Total 93 90 299 944 8 697 4 2135 1994-95 Season Total 422 77 246 1011 31 704 6 2497 1995-96 Regular Season 321 57 134 787 12 515 1 1827 Late Season 13 2 10 75 0 21 0 121 Season Total 334 59 144 862 12 536 1 1948 1996-97 Regular Season 1001 32 327 1678 9 808 2 3857 Late Season 29 3 148 27 9 124 1 341 Season Total 1030 35 475 1705 18 932 3 4198 1997-98 Regular Season 1158 56 376 2042 31 672 5 4340 Late Season 153 2 16 155 2 70 0 398 Season Total 1311 58 392 2197 33 742 5 4738 1998-99 Regular Season 1588 44 292 1736 28 724 9 4421 Late Season 232 2 14 141 6 109 0 504 Season Total 1820 46 306 1877 34 833 9 4925 1999-00 Regular Season 1255 24 205 1150 140 540 32 3346 Late Season 200 3 4 115 15 83 1 421 Season Total 1455 27 209 1265 155 623 33 3767 2000-01 Regular Season 1310 30 130 1236 82 583 34 3405 Late Season 140 2 105 6 13 104 1 371 Season Total 1450 32 235 1242 95 687 35 3776 2001-02 Regular Season 664 22 130 601 87 430 11 1945 Late Season 94 1 0 43 25 66 0 229 Season Total 758 23 130 644 112 496 11 2174 2002-03 Regular Season 1183 37 152 836 88 551 60 2907 Late Season 108 1 1 60 5 40 1 216 Season Total 1291 38 153 896 93 591 61 3123 2003-04 Regular Season 598 24 102 470 73 372 19 1658 Late Season 76 4 2 13 5 41 0 141 Season Total 674 28 104 483 78 413 19 1799 2004-05 Regular Season 989 25 123 576 105 424 49 2291
343

Waterfowl Status and Trend Report 2018
Late Season 90 0 0 21 17 37 4 169 Season Total 1079 25 123 597 122 461 53 2460 2005-06 Regular Season 948 30 155 823 106 558 28 2648 Late Season 89 1 2 40 2 26 4 164 Season Total 1037 31 157 863 108 584 32 2812 2006-07 Regular Season 8 1085 26 141 580 110 410 44 2404 Late Season 127 1 2 48 14 40 1 233 Season Total 8 1212 27 143 628 124 450 45 2637 2007-08 Regular Season 2 1160 21 108 684 113 292 49 2429 Late Season 122 1 5 45 12 31 2 218 Season Total 2 1282 22 113 729 125 323 51 2647 2008-09 Regular Season 4 1636 43 154 887 195 406 41 3366 88 27 3481 Late Season 87 2 4 59 3 52 0 207 207 Season Total 4 1723 45 158 946 198 458 41 3573 88 27 3688 2009-10 Regular Season 13 1301 28 73 706 75 358 41 2595 8 19 2622 Late Season 111 4 3 30 12 25 1 186 186 Season Total 13 1412 32 76 736 87 383 42 2781 8 19 2808 2010-11 Regular Season 4 1245 17 94 525 57 297 37 2276 26 65 2367 Late Season 1 100 3 22 2 25 153 153 Season Total 5 1345 20 94 547 59 322 37 2429 26 65 2520 2011-12 Regular Season 1 1150 25 121 505 35 180 21 2038 16 60 2114 Late Season 154 3 4 20 3 43 227 227 Season Total 1 1304 28 125 525 38 223 21 2265 16 60 2341 2012-13 Regular Season 16 1168 17 101 503 25 231 1 2062 33 64 2159 Late Season 125 1 23 13 33 195 2 197 Season Total 16 1293 17 102 526 38 264 1 2257 35 64 2356 2013-14 Regular Season 4 1247 18 96 257 17 287 8 1934 35 17 1990 Late Season 160 2 1 12 12 54 241 1 3 245 Season Total 4 1407 20 97 269 29 341 8 2175 40 20 2235 2014-15 Regular Season 16 1424 42 137 431 20 249 14 2333 7 37 2377 Late Season 155 3 1 14 3 43 219 3 222 Season Total 16 1579 45 138 445 23 292 14 2552 10 37 2599 2015-16a Regular Seasonb 0 397 14 13 75 14 67 37 604 5 1 610 Late Seasonb 0 154 5 5 29 6 26 15 235 2 1 238 Season totalc 0 551 19 18 104 20 93 52 839 7 2 844 2016-17a Regular Seasonb 7 71 4 4 36 0 40 0 152 0 0 152 Late Seasonb 10 93 5 4 35 0 51 0 199 0 0 199 Season totalc 17 164 9 8 61 0 91 0 351 0 0 351 2017-18 a Regular Seasonb 2 122 4 5 29 1 27 1 188 0 0 188 Late Seasonb 2 113 4 5 27 1 25 1 175 0 0 175 Season totalc 3 234 7 9 56 1 51 1 362 0 0 362
Note: Mandatory check stations initiated in 1984-85 season, prior estimates from USFWS harvest survey. aCheck stations discontinued in 2015. bNumbers derived from % of species identified during bag checks and calculated for regular and late season. cTotal includes only measured birds from bag checks
344

Wild Turkey
345

Wild Turkey Status and Trend Report 2018
Wild Turkey Status and Trend Report STATEWIDE SARAH KINDSCHUH, Small Game and Furbearer Specialist
Management Guidelines and Objectives Wild turkeys were first successfully introduced in Washington in 1960. Population augmentation in the 1980s and 1990s expanded their distribution (Figure 1) and increased hunting and wildlife viewing opportunities (WDFW 2005).
In January 2006, the Department adopted a statewide turkey management plan (WDFW 2005) as a supplement to the Game Management Plan in response to increasing populations and issues related to turkey management. Population management strategies from this plan were included and updated in the 2015-2021 Game Management Plan (WDFW 2014).
Hunting Seasons and Recreational Harvest Hunter effort and hunter harvest of wild turkeys are estimated based on the analysis of mandatory hunter reports. Hunters report on all turkey tags, including tags they did not use. Successful hunters are required to submit the date, location, sex, and age of harvested birds. This mandatory reporting system has allowed for better estimates of harvest and hunter participation than estimates made prior to the reporting requirement.
Within Washington state, Game Management Units (GMUs) have been grouped to define seven turkey Population Management Units (PMUs, Table 1). Changes in harvest, as an indicator of population status, have been tracked at the PMU level. Improvements were made to the turkey harvest data analysis routine in 2011 and 2016, which could account for some variations in estimates, particularly when comparing data across years. Table 1: Game Management Units (GMUs) included in each Population Management Unit (PMU).
PMU PMU Name GMUs Included 10 Northeast 101-136 15 Southeast 139-186 20 North Central All 200 GMUs 30 South Central All 300 GMUs EXCEPT GMU 382 & 388 35 Klickitat GMUs 382, 388, 578, 574, 572, 568 40 Northwest All 400 GMUs PLUS GMUs 601-627 50 Southwest All 500 GMUs EXCEPT 568-578
PLUS GMUs 633-699
Figure 1: Primary current distribution of wild turkeys in Washington based on Game Management Units.
346

Wild Turkey Status and Trend Report 2018
Hunting seasons for wild turkeys have varied from a 2-day fall season in 1965 to the current 47-day spring general season with additional fall hunting opportunities that vary by GMU. No significant changes were made in 2017 from the 2016 regulations.
In 2006, a late fall permit hunt (Nov 20 - Dec 15) in northeast Washington was added for GMUs 101-124. This permit hunt was changed to a general season hunt in 2009 because hunting pressure did not meet management goals for that population. GMUs have since been added so the late fall general season includes almost all 100-series GMUs. A late fall permit hunt was added for GMUs in Okanogan County (218-231 and 242) in 2008, and in 2012 a permit hunt was added in GMU 335 in Kittitas County. All late fall seasons are either sex.
In 2009, the early fall general season was extended to Mica Peak (GMU 127), Roosevelt (GMU 133) and Blue Mountains GMUs (GMUs 145, 149-16, and 172-186). In 2016, the early fall general season was lengthened two weeks for GMUs 101-142. Klickitat County (GMUs 382, 388, 568-578) remains permit-only hunting.
Turkey hunting is open to shotgun, archery, and crossbow hunting during the spring and fall seasons. Dogs, baiting, electronic decoys, and electronic calls are not legal in Washington. Non-electronic decoys are permitted. In 2006, the Fish and Wildlife Commission adopted a regulation permitting falconers to hunt turkeys during the fall and winter. Current regulations are considered relatively conservative. Spring season timing results in harvest of gobblers after peak breeding. The season ends before most nests hatch, so disturbance is minimized. Records show that prior to turkey augmentation activity in the late 1980s, turkey hunter numbers fell to a low of 428 (1987) and turkey harvest averaged 65 birds per year (1983-1987). Spring turkey harvest remained relatively stable in 2017. An estimated 11,374 individuals hunted turkeys during the 2017 spring general season, taking an estimated 4,814 birds (Figure 2, Table 2). This represents a 3% decrease in harvest and a 19% increase in hunter participation from the spring 2016 season. There were 3,364 hunters that pursued turkeys during the 2017 fall general seasons in PMU 10 and 15 with a harvest of 1,815 birds. Permit hunters reported an additional 31 birds taken during fall permit hunts.
Harvest estimates show that turkey numbers in PMU 10 decreased by 3% in 2017, halting the growth of the last couple years. Recently, an increase in depredation on agricultural land and conflicts with humans has been documented in parts of PMU 10. Liberal fall general seasons are in place here to help address these issues. The Blue Mountains (PMU 15) harvest decreased by 15% in 2017. Here, too, a liberal fall general season is in place for conflict mitigation.
Local hunters have reported concern over decreasing populations in PMU 20 and 30. Though harvest declined sharply after a peak in 2010, recent harvest data indicate some stability. Harvest in PMU 20 increased by 23% in 2017 and is only 20% below the 2010 level. Additional fall hunting opportunity will continue to be available on a limited permit-only basis.
347

Wild Turkey Status and Trend Report 2018
With the exception of 2010 when harvest was unusually high, turkey harvest in PMU 35 has been steady over the past seven years. The population is believed to be stable and provides the majority of the hunting opportunity in southwest Washington.
Determining population trends for wild turkey in PMU 50 is limited by lack of data. Harvest in this unit doubled in 2017, but small sample sizes make interpretation difficult. Wild turkeys are likely reproducing at low levels but maintaining a viable population. Low harvest in this area may be due in part to more restrictive access policies put in place by private landowners.
Figure 2: Estimated statewide spring turkey harvest and hunter participation 2008-2017. Table 2: Estimated spring turkey harvest in each turkey Population Management Unit (PMU) 2008-2017.
PMU 2008 2009 2010 2011 2012 2013 2014 2015 2016 2017 P10 2,677 2,845 2,861 3,695 2,512 2,400 2,461 3,097 3,421 3,331 P15 578 761 731 866 642 533 500 531 590 499 P20 232 228 412 231 203 188 181 260 270 331 P30 172 245 418 234 162 143 137 157 208 175 P35 370 447 889 473 514 474 436 475 461 417 P40 3 5 13 8 5 5 1 3 2 5 P50 50 65 68 41 30 25 25 38 28 56
Total 4,082 4,596 5,392 5,548 4,068 3,768 3,741 4,561 4,980 4,814
Population Surveys Between 2004 and 2015, the Colville District carried out an annual winter survey of wild turkeys in northeastern Washington (PMU 10). The primary objective of these surveys was to initiate the development of an annual harvest-independent population index for wild turkeys as called for in the agency Game Management Plan. The pilot project tested methodology developed between
0
2000
4000
6000
8000
10000
12000
14000
2008 2009 2010 2011 2012 2013 2014 2015 2016 2017
HuntersHarvest
348

Wild Turkey Status and Trend Report 2018
2006-2010 and relied on volunteers to help collect data. The resulting benefit was that district biologists were able to gain valuable knowledge of local turkey range, movements, habitat availability, and usage. The survey protocol was modified in 2011 to standardize route lengths, increase the number of routes, and reduce the number of times each transect was surveyed. No quantifiable population estimate can be calculated from these surveys, but they do provide anecdotal information about the current sex ratios and can also provide biologists with some understanding of the number of mature males that would be available for harvest.
District 7 utilizes winter counts to track turkey numbers in Chelan County. Counts are taken at up to 33 sites in 5 GMUs using three replicate surveys to obtain a minimum count and sex ratio. Surveys have been conducted since 2008, though sites surveyed have varied across years. In the 2016-2017 winter count, 746 turkeys were observed, with at least 165 adult males. This is an increase from the 2015-2016 counts, but a formal analysis is needed to assess any trends.
Habitat Most of the turkey range in Region 1 is near agricultural lands that provide abundant food in the form of waste grain, as well as some berries and fruits during winter months. The Blue Mountains and surrounding areas have provided exceptional habitat for the Rio Grande turkey subspecies. Stevens, Pend Oreille, Ferry, and northern Spokane counties contain excellent habitat for the Merriam’s subspecies.
Ponderosa pine nuts are probably the most important winter food source for turkeys in eastern Washington. In Chelan, Kittitas, and Okanogan counties, the density and distribution of ponderosa pines is much less than in Ferry and Stevens counties where the largest turkey population can be found.
In general, occupied turkey habitat in Okanogan County is less productive than some other areas of the state, due to a lack of extensive mast or berry crops. Much of the habitat is intensively grazed, and turkeys may have to compete with livestock for certain plant foods. In addition, the lack of grain farming in the area may also limit population expansion.
Winter conditions in PMU 30 and in Klickitat County (PMU 35) can impact the resident turkey population. Most of PMU 30 is probably marginal turkey habitat. The forested zone is on the edge of higher elevations and receives significant snowfall. Mild winters and supplemental feeding most likely enabled these transplanted populations to establish. In Klickitat county, mild winters since 1996 have allowed the turkey population to increase and hunting has improved to current levels.
Although we do not specifically monitor habitat conditions related to turkeys in PMU 50, conditions should continue to be adequate. There have been no major changes in habitat management or weather conditions that would have changed turkey survival.
Population Augmentation There were no new releases of turkeys in any PMU across the state and none are planned in the future. Turkeys are present in most of the areas that would be considered suitable habitat. Concerns related to human-wildlife conflict have precluded introductions in the past. WDFW management
349

Wild Turkey Status and Trend Report 2018
plans identify trapping and translocation as a potential response to damage and nuisance complaints, but those actions are not a significant part of turkey management. Few translocation activities have occurred in recent years.
Management Conclusions Turkey populations across the state appear to be relatively stable with the largest concentrations in Region 1. The statewide spring hunter success rate has averaged between 25-35% since 2002. Management decisions will seek to maintain high hunter success rates in the spring, while also addressing human conflict issues.
Habitat enhancement priorities are identified in the 2015-2021 Game Management Plan (WDFW 2014). Of special interest are habitat improvements that increase habitat values for a variety of wildlife species in addition to turkeys. The Klickitat Oak Habitat Initiative began in May 2009 focusing on improving oak stand health and understory habitat on the Klickitat Wildlife Area and surrounding lands in Klickitat County. Other efforts have focused in northeast Washington to provide enhanced food resources through weed control, agricultural manipulation, and forest improvements. WDFW works closely with the National Wild Turkey Federation (NWTF) on efforts to promote and fund habitat enhancement work.
The turkey population along the eastern Cascade range may have reached the long-term carrying capacity of the habitat. The population will likely fluctuate with adverse and favorable weather conditions. Conflicts with turkeys had been escalating in the Methow and Okanogan watersheds of Okanogan County. Expansion of turkeys in the Methow area has been exacerbated by illegal releases of domestic turkeys. These birds end up as problem animals, particularly in winter when little natural forage is available. A fall permit season has been created for the Methow watershed to help manage conflicts with turkeys.
Turkey nuisance complaints are being received from areas within PMU 10 and PMU 15, especially Spokane County. Additional hunting opportunities have been created in these areas to help address these nuisance complaints. WDFW will be reviewing ways to focus hunter effort and other management tools in areas with private lands experiencing damage.
Literature Cited Washington Department of Fish and Wildlife. 2005. Wild Turkey Management Plan. Wildlife
Program, Washington Department of Fish and Wildlife, Olympia, Washington, USA.
Washington Department of Fish and Wildlife. 2014. 2015-2021 Game Management Plan. Wildlife Program, Washington Department of Fish and Wildlife, Olympia, Washington, USA.
350

Pheasant
351

Pheasant Status and Trend Report 2018
Pheasant Status and Trend Report STATEWIDE SARAH KINDSCHUH, Small Game and Furbearer Specialist
Population Guidelines and Objectives Management objectives for upland birds, including pheasant, are outlined in the Washington Department of Fish and Wildlife’s (WDFW) Game Management Plan (WDFW 2014). Goals are to bolster pheasant numbers through habitat enhancement to ensure healthy, productive populations for recreation. Additional strategies are described in the National Wild Pheasant Conservation Plan (Midwest Pheasant Study Group 2013) which focuses on maximizing the values of permanent herbaceous cover to enhance brood success. Washington-specific strategies are also outlined in the meeting summary from the 2003 Pheasant Workshop (WDFW 2003). Hunting Seasons and Recreational Harvest
Pheasant harvest has varied widely over the past 50 years. Statewide harvest was highest during the mid-to-late 1960s with another peak in the late 1970s when over 500,000 pheasants were harvested. Since that time, pheasant harvest has steadily declined. It is important to note that in 2001 WDFW changed the small game survey protocols. The 2001 protocol calls for a sample of 25,000 small game hunters to increase the precision of harvest and participation estimates. Additionally, the harvest data analysis routine was updated in 2009, 2011 and 2016, which may account for some variation across years.
Surveys (crowing count and brood index) conducted between 1982 and 1998 also evidenced the decrease in pheasant numbers in eastern Washington (Rice 2003). Harvest estimates and hunter participation over the past decade have continued to decline with some stabilization in the last five years (Figure 1).
Nearly all wild pheasant (i.e., not pen-raised) populations occur in eastern Washington. Estimates of harvest and hunter participation for this report include the following counties: Adams, Asotin, Benton, Chelan, Columbia, Douglas, Ferry, Franklin, Garfield, Grant, Kittitas, Klickitat, Lincoln, Okanogan, Pend Oreille, Spokane, Stevens, Walla Walla, Whitman, and Yakima. Due to previous methods of calculation, figures presented for statewide and basinwide hunter numbers in years prior to 2009 are likely higher than the actual participation at the time. Harvest estimates are assumed to be accurate.
352

Pheasant Status and Trend Report 2018
Figure 1: Estimated annual pheasant harvest (pen-raised and wild) and hunter participation in eastern Washington 2008 - 2017. A primary pheasant management zone was established in Washington where populations have been historically high. Within this primary zone, WDFW has delineated a southeast Washington pheasant focus area that includes portions of Columbia, Garfield, Walla Walla, and Whitman counties to focus pheasant management efforts where adequate rainfall (i.e., 14-inches and over) is most conducive to supporting desirable plant communities (Figure 2).
Since 1997, rooster pheasants have been released in the fall as part of the state-funded Eastern Washington Pheasant Enhancement Program (EWPEP). Harvest estimates have included both released and wild birds and therefore the harvest of wild pheasants is lower than depicted in Figure 1.
In 2009, the EWPEP was audited at the request of the legislature. The findings confirmed that WDFW was fulfilling its legislative mandate to release pheasants. Auditors concluded that pheasant populations continued to decline primarily due to loss of habitat and that releasing pen-raised pheasants was not effectively sustaining or improving pheasant populations in eastern Washington. In 2009, the legislature rescinded the requirement for the program to use 80% of EWPEP funding for purchasing domestically-reared pheasants for wild release in order to devote more funding to habitat enhancement projects on public and private lands. In 2017, WDFW released 9,720 pheasants in eastern Washington and are planning to release 9,720 in the fall of 2018. Funding that is allocated to habitat enhancements will help address objectives identified in the 2015-2021 Game Management Plan (WDFW 2014) to increase the amount of quality pheasant habitat in the pheasant focus area.
0
10000
20000
30000
40000
50000
60000
70000
2008
2009
2010
2011
2012
2013
2014
2015
2016
2017
Harvest
Hunters
353

Pheasant Status and Trend Report 2018
Harvest estimates for the Columbia, Snake River, and Yakima Basins have been used to monitor trends within the primary pheasant management zone. The number of pheasants harvested each year reflects decreasing trends in overall populations since 2008 (Figure 3), similar to the statewide harvest trend (Figure 1), though harvest did increase in 2017. For this report, the “Yakima River Basin” consists of Yakima and Benton counties, the “Snake River Basin” is made up of Asotin, Garfield, Columbia, Walla Walla, and Whitman counties, and the “Columbia River Basin” includes Lincoln, Adams, Grant, Douglas, and Franklin counties. Harvest increased in all three basins of the primary management zone in 2017. The 2017 estimated harvest in the Columbia River Basin was 17,122 pheasants, which is a 41% increase from 2016 and is equivalent to the 10-year average. In 2017, the Snake River Basin saw an estimated 16% increase in harvest from 2016, which is 15% below the 10-year average. The Yakima River Basin harvest increased 5% in 2017, which is 26% below the 10-year average. Hunter numbers have been in a long-term decline, but increased 10% in 2017 from 2016 (Figure 1). Over the past five years, eastern Washington pheasant hunters spent an average of 5 days afield and averaged 2.8 birds per hunter at a harvest rate of 0.6 birds per day. Though hunters are spending less time in the field than they were a decade ago, the average number of harvests per day has actually increased. While long-term pheasant population declines are apparent, it is not fully understood whether other factors such as limitations on hunting access, economic changes, or other factors might be playing a role in declining participation.
-
354

Pheasant Status and Trend Report 2018
Figure 3. Estimated annual pheasant harvest for eastern Washington river basins between 2008-2017.
Habitat Permanent cover is critical to pheasant production, particularly where the stands consist of a diverse mix of grasses and broadleaf, flowering plants (forbs). Diverse vegetation can produce more suitable nesting and brood-rearing habitat (Midwest Pheasant Study Group 2013). Research in many parts of the United States indicates that loss of habitat is the primary factor for declining pheasant populations (Labisky 1976, Warner et al. 1984). Of particular importance is the loss of nesting and brood-rearing habitat, winter cover and escape cover to elude predators (Warner 1979). Most of eastern Washington pheasant habitat is heavily influenced by agriculture and as a result, CRP is the driving force behind all contiguous pheasant habitat. WDFW leverages multiple programs to improve habitat quality for pheasant and other upland game birds including the State Acres for Wildlife Enhancement (a CRP program), Natural Resources Conservation Service’s Voluntary Public Access and Habitat Improvement Program, the Environmental Quality Incentive Program, and others. Private lands biologists provide technical assistance to landowners concerning the installation and enhancement of wildlife habitat. Private lands staff also assist with planting of high-diversity mixes of grasses and forbs, shrub cover plots, and food plots across eastern Washington that benefit upland birds and other wildlife. Recent habitat improvement projects include conversion of old agricultural fields to native grasses and forbs in the Swanson Lakes Wildlife Area and BLM Twin Lakes Recreational Area in Lincoln County. In 2017, Pheasants Forever donated 94 acres adjacent to the Revere Wildlife Area in Whitman County to WDFW, joining the wildlife area to nearby BLM land.
0
5000
10000
15000
20000
25000
30000
2008
2009
2010
2011
2012
2013
2014
2015
2016
2017
Year
Snake River Basin
Columbia River Basin
Yakima River Basin
355

Pheasant Status and Trend Report 2018
Evolving farming practices, pesticide and herbicide use and urban sprawl can contribute to declines in pheasant populations. Herbicide application to wheat stubble and reduced stubble height are considered a primary cause of pheasant population decline on the central High Plains (Rodgers 2002). In some areas of eastern Washington, wheat stubble may be the only cover available to pheasants at certain times of the year. The shorter stubble height increases a predator’s ability to see pheasants, thus making pheasants more vulnerable. Pesticide use in early spring reduces early germinating plants that are important food resources at that time of year (De Snoo, G. R. and J. De Leeuw 1996). Some insecticides, organophosphates for example, can have a direct effect on individual pheasants by sickening them and/or by killing them (Blus, L. J. and C. J. Henny 1997). Herbicide use reduces overall plant diversity, which is a crucial component of high quality pheasant habitat. Across all agricultural states, pesticides are used on an increasingly broader scale, and have negatively impacted pheasant habitat quality throughout the introduced range. Additionally, houses now occupy many of the areas where pheasants were abundant. This trend is especially apparent within the Columbia Basin and southwest Washington. Upland game bird fall population densities and related harvest also depend on spring weather conditions. Spring rains are needed to provide early plant growth for nesting cover while consistent warm early summer rains create insect-rich environments for pheasant chicks. Early spring drought conditions, even with normal temperatures, may decrease insect availability. A large portion of pheasant chick diets consist of calorically dense, high protein insects (Savory, C. J. 1989). When Washington experiences cold, wet springs there is a strong likelihood of poor pheasant production.
Population Surveys Upland bird surveys in Washington were discontinued in the late 1990s due to limited time and funding for district biologists. In 2010, two different pheasant surveys were established in the pheasant focus area with nine survey routes. The spring pheasant crowing survey was conducted twice each spring for seven years between April 15 and May 25 to develop a spring male pheasant breeding population index and to track land use changes over time. A formal analysis of these data is pending to determine whether the survey should be continued.
Research WDFW and Washington State University conducted research to determine the effects of different habitat types on the abundance of insects available to pheasant broods. Insect availability is believed to be a primary limiting factor for pheasant populations in the area (Savory, C. J. 1989). However, the study found that insect availability was not limiting in any of the habitat types sampled. The study determined that insect abundance was greater in CRP fields with a forb component, but there was no significant statistical difference between the native and nonnative forb plantings (Quinn 2015). An additional component of the study was added in 2013 that involved placing human-imprinted pheasant chicks in these various stand types to forage on insects and then evaluating their diet while on site. The diets of the pheasant chicks did not differ between plots with an average of 2% arthropods and the remainder consisting of seed, soil, and foliage. The pheasant chicks did travel twice as far while foraging in the existing CRP stand than in fields with forb plantings, which reflects the results discussed previously (Koepke 2014 and Quinn 2015).
356

Pheasant Status and Trend Report 2018
Management Conclusions Harvest data indicate that eastern Washington pheasant populations are experiencing a long-term decline, though 2017 indicated increasing numbers. Causes for the decline are not clearly understood, but habitat loss and land use changes are likely the primary causes. Suitable habitats are becoming increasingly fragmented and isolated or have been severely degraded. Diligent monitoring is needed in combination with increased efforts to improve habitat, especially nesting cover and brood-rearing habitat, to sustain viable pheasant populations in eastern Washington. Rooster pheasants will continue to be released only as put-and-take enhancement of hunting opportunity, not as a population management tool.
Literature Cited Blus, L. J. and C. J. Henny 1997. Field studies on pesticides and birds: Unexpected and unique
relations. Ecological Applications 7(4): 1125-1132. De Snoo, G. R. and J. De Leeuw 1996. Non-target insects in unsprayed cereal edges and aphid
dispersal to the adjacent crop. Journal of Applied Entomology 120(8): 501-504. Koepke, Brian Christopher. 2014. Effects of Forb Planting in Conservation Reserve Program on
Plant Communities and on Feeding Ecology of Ring-Necked Pheasant (Phasianus colchicus) Chicks. Masters Thesis, Washington State University.
Labisky, R. F. 1976. Midwest Pheasant Abundance Declines. Wildlife Society Bulletin 4(4):182-183. MacMullan, R. A. and L. L. Eberhardt 1953. Tolerance of Incubating Pheasant Eggs to Exposure. The Journal of Wildlife Management 17(3):322-330.
Midwest Pheasant Study Group. 2013. National wild pheasant conservation plan. N.B. Veverka
(ed.). Association of Fish and Wildlife Agencies. 111 p. Quinn, M.A. 2015. Invertebrate Population Responses to Diverse Improvements to CRP.
Washington Fish & Wildlife Project 11-1213 Report. Rice, C.G. 2003. Utility of Pheasant Call and Brood Counts for Monitoring Population Density
and Predicting Harvest. Western North American Naturalist.63 (2): 178-188. Rodgers, R. D. 2002. Effects of wheat-stubble height and weed control on winter pheasant
abundance. Wildlife Society Bulletin 30(4):1099-1112. Savory, C. J. 1989. The Importance of invertebrate food to chicks of gallinaceous species.
Proceedings of the Nutrition Society 48(1): 113-133. Warner, R. E. 1979. Use of Cover by Pheasant Broods in East-Central Illinois. The Journal of
Wildlife Management 43(2):334-346. Warner, R. E., S. L. Etter, et al. 1984. Declining Survival of Ring-Necked Pheasant Chicks in
Illinois Agricultural Ecosystems. The Journal of Wildlife Management 48(1):82-88.
357

Pheasant Status and Trend Report 2018
Washington Department of Fish and Wildlife. 2003. 2003 Pheasant Workshop - Identification of Key
Management Strategies for Washington State: Meeting Summary and Management Recommendations. Wildlife Program, Washington Department of Fish and Wildlife, Olympia, Washington, USA.
Washington Department of Fish and Wildlife. 2014. 2015-2021 Game Management Plan. Wildlife Program, Washington Department of Fish and Wildlife, Olympia, WA.
358

Chukar and Gray
Partridge
359

Chukar and Gray Partridge Status and Trend Report 2018
Chukar and Gray Partridge Status and Trend Report STATEWIDE
Sarah Kindschuh, Small Game and Furbearer Specialist
Management Guidelines and Objectives
Harvest management for chukar partridge (Alectoris chukar) and gray partridge (Perdix perdix) is designed to provide maximum recreation opportunity without negatively impacting populations. Management goals and objectives are outlined in the Game Management Plan (WDFW 2014). Additional strategies for enhancing chukar and gray partridge populations are outlined in the Western States Chukar and Gray Partridge Management Guidelines (Knetter et al. 2017) which were developed by a collaboration among western states. Hunting Seasons and Recreational Harvest Chukar and gray partridge hunting seasons have varied in length over the years and by regions. In the early 1960s and 1970s, Region 1 had a split early and late season while the rest of eastern Washington was regulated with one general season. Beginning in 1997, one standardized season started October 1 and ended the second Sunday in January. The season was changed again in 2003 to start on the first Saturday of October and extend to mid-January which remains in effect today. Currently, daily bag limits are six chukar and six gray partridge with 18 of each in possession during the general season.
Figure 1. Estimated statewide chukar and gray partridge hunters and harvest for 2008 – 2017.
In 2017, chukar harvest was estimated at 13,420 birds. This is a 35% increase from 2016 and is 31% above the 10-year average harvest of 10,255 (Figure 1). Gray partridge harvest increased 43% to 4,877 which is only 5% below the 10-year average. Chukar hunter numbers increased 26% from 2016 with an estimated 2,940 hunters participating in 2017, which is only 7% below the 10-
0
2000
4000
6000
8000
10000
12000
14000
16000
18000
20000
22000
2008 2009 2010 2011 2012 2013 2014 2015 2016 2017
Chukar Hunters
Gray Partridge Hunters
Chukar Harvest
Gray Partridge Harvest
360

Chukar and Gray Partridge Status and Trend Report 2018
year average. Gray partridge hunter participation increased 41% from 2016 with an estimated 1,886 hunters participating in 2017. The most productive counties for chukar harvest in 2017 were Chelan (3,177), Okanogan (2,470), Kittitas (1,584), Yakima (1,520) and Grant (1,498) counties.
Estimated chukar harvest for the past ten years in Regions 1, 2, and 3 is illustrated in Figure 2. Estimated chukar hunter participation increased in all three regions from 2016 numbers. Harvest was above the 10-year average in Regions 2 and 3 (76% and 10%, respectively), but was 31% below the 10-year average in Region 1.
Figure 2. Estimated chukar harvest for Regions 1, 2 and 3 for 2008 – 2017. Population Surveys Chukar populations were surveyed by helicopter from 1987 to 1997, when aerial surveys were terminated due to budget constraints. In some regions, field personnel note the abundance of broods during regular field operations and other surveys. Currently, no formal surveys are conducted.
Harvest and hunter effort have been used as an index to population trends. These data are estimated through post-season hunter surveys. Harvest trends suggest that both chukar and gray partridge populations are stabilizing, but are below long-term (>10 year) averages. Factors that should be considered when looking at this trend are the decline in hunter participation and subsequently harvest as well as weather events. Harvest survey analysis was updated in 2011 and 2015, which also needs to be considered when looking at long-term averages and trends. Breeding Bird Survey (BBS) information (Sauer et al., 2017) for Washington suggests a stable population of chukar for the last few years but data credibility is at a moderate level for this species due to low sample size. The BBS data for gray partridge suggest at stable to declining population with the same moderate level of confidence.
0
1,000
2,000
3,000
4,000
5,000
6,000
7,000
8,000
9,000
2008 2009 2010 2011 2012 2013 2014 2015 2016 2017
Region 1
Region 2
Region 3
361

Chukar and Gray Partridge Status and Trend Report 2018
Habitat Chukar habitat comprises arid areas with steep slopes, deep valleys, and rocky outcrops. This habitat type can be found where topography, combined with shallow soils, has prevented extensive agriculture and/or development. Cheatgrass is a staple of the chukar diet during spring and fall, and the availability of cheatgrass can have a significant impact on their populations. Encroachment of invasive plants such as yellow star-thistle (Centaurea solstitialis) along with fires that eliminate shrub habitat may be contributing to long-term population declines.
Gray partridge habitat can be found along the “margins” where agricultural fields and native shrub-steppe habitat meet. Their diet consists of cultivated grains, weed seeds such as cheatgrass, and clover. Due to “clean” farming conditions their habitat is decreasing. Farm Bill and state habitat programs should be investigated and applied to areas where gray partridge and other upland birds would benefit the most.
Management Conclusions The apparent long-term decline in both chukar and gray partridge populations is likely due to many factors including diminishing habitat quality, hunter participation, and climatic events. For example, the invasion of yellow star-thistle has taken over thousands of acres of quality habitat in southeastern Washington, reducing available food resources for chukars. Habitat quality in some portions of the state may have actually improved over time with the abundance of wildfires that influenced the spread of annual grasses. However, the concurrent loss of shrub habitat due to fires may be detrimental. Hunter participation for both species has been declining steadily but seems to have stabilized over the past six years. Lastly, chukar and gray partridge populations can be expected to fluctuate annually in response to weather variability. It is certain that chukar and gray partridge populations in Washington have experienced long-term declines. However, the recent increase in harvest rates indicates the populations may be stabilizing. A continued focus on habitat enhancement should benefit these populations into the future.
Literature Cited Knetter, J.M., D.A. Budeau, and S.P. Espinosa. 2017. Western States Chukar and Gray Partridge
Management Guidelines. Western States Partridge Working Group, Western Association of Fish and Wildlife Agencies, Cheyenne, Wyoming, USA. 32 pp.
Sauer, J. R., D. K. Niven, J. E. Hines, D. J. Ziolkowski, Jr, K. L. Pardieck, J. E. Fallon, and W.
A. Link. 2017. The North American Breeding Bird Survey, Results and Analysis 1966 - 2015. Version 2.07.2017 USGS Patuxent Wildlife Research Center, Laurel, MD.
Washington Department of Fish and Wildlife. 2014. 2015-2021 Game Management Plan.
Wildlife Program, Washington Department of Fish and Wildlife, Olympia, Washington, USA.
362

Quail
363
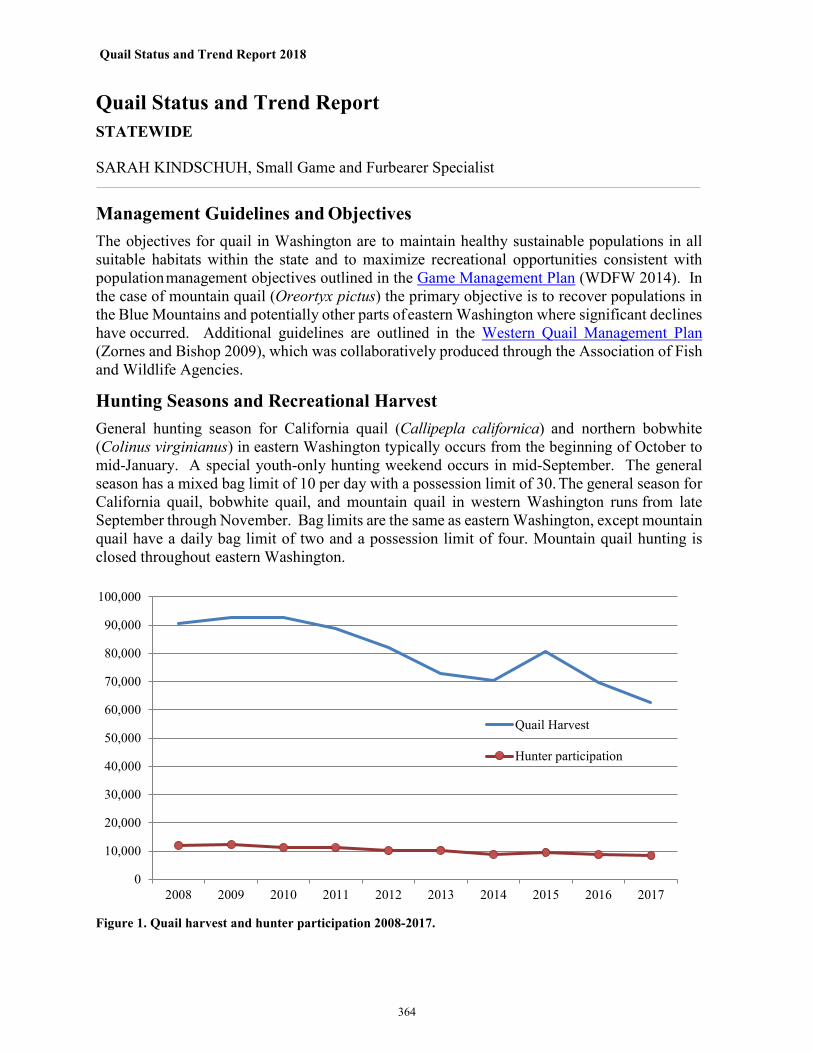
Quail Status and Trend Report 2018
Quail Status and Trend Report
STATEWIDE SARAH KINDSCHUH, Small Game and Furbearer Specialist
Management Guidelines and Objectives The objectives for quail in Washington are to maintain healthy sustainable populations in all suitable habitats within the state and to maximize recreational opportunities consistent with population management objectives outlined in the Game Management Plan (WDFW 2014). In the case of mountain quail (Oreortyx pictus) the primary objective is to recover populations in the Blue Mountains and potentially other parts of eastern Washington where significant declines have occurred. Additional guidelines are outlined in the Western Quail Management Plan (Zornes and Bishop 2009), which was collaboratively produced through the Association of Fish and Wildlife Agencies.
Hunting Seasons and Recreational Harvest General hunting season for California quail (Callipepla californica) and northern bobwhite (Colinus virginianus) in eastern Washington typically occurs from the beginning of October to mid-January. A special youth-only hunting weekend occurs in mid-September. The general season has a mixed bag limit of 10 per day with a possession limit of 30. The general season for California quail, bobwhite quail, and mountain quail in western Washington runs from late September through November. Bag limits are the same as eastern Washington, except mountain quail have a daily bag limit of two and a possession limit of four. Mountain quail hunting is closed throughout eastern Washington.
Figure 1. Quail harvest and hunter participation 2008-2017.
0
10,000
20,000
30,000
40,000
50,000
60,000
70,000
80,000
90,000
100,000
2008 2009 2010 2011 2012 2013 2014 2015 2016 2017
Quail Harvest
Hunter participation
364

Quail Status and Trend Report 2018
Quail harvest has been on a downward trend following a peak harvest of 190,062 in 2003 (Figure 1). The estimated statewide harvest in 2017 was 62,566, which represents a 10% decrease from the 2016 harvest and a 22% decrease from the 10-year average of 80,276. Approximately 99% of the statewide total harvest occurred in eastern Washington in 2017. Harvest has averaged about 8 birds per hunter since 2000 (Figure 2).
Figure 2. Quail harvest per hunter 2000-2017.
Population Surveys
All population and production surveys were discontinued in 1999 due to limited time and funding for district biologists. The post-hunting season questionnaire is now used to estimate harvest and currently provides the best index of population status. Based on harvest, it appears that quail populations in Washington are currently much lower than they were in the late 1970s and early 1980s. This decline is most likely related to “clean” farming practices introduced in the early 1980s that has encouraged the removal of shrubby cover along fence lines and draws. The US Geological Survey breeding bird survey information for Washington suggests an increasing trend for California quail populations (Sauer et al. 2017). Another indicator of population is harvest per hunter which has remained fairly stable since 2008 at 8 birds per hunter, with a drop to 7.05 in 2013 reflecting poor spring conditions and a rebound in 2015 to 8.4 (Figure 2). Given the right environmental conditions quail can be very productive, which may have been the factor that played into the 2015 peak harvest.
Habitat As with other agriculturally-associated wildlife, the quantity and quality of quail habitat has been declining for decades. Breeding habitat (including nesting and brood-rearing habitat), wintering habitat, and habitat that can provide escape cover are important for sustaining quail populations. Land development and “clean farming” practices have dramatically reduced and fragmented suitable habitat for all upland game birds.
0.00
2.00
4.00
6.00
8.00
10.00
12.00
2000 2001 2002 2003 2004 2005 2007 2008 2009 2010 2011 2012 2013 2014 2015 2016 2017
365

Quail Status and Trend Report 2018
A study looking at the food habits of quail was conducted in southeastern Washington (Anthony 1970). The study analyzed 157 California quail crops from March – September. The results showed that male and female quail were selective in their feeding habits, preferring leafy green plants in the spring and then transitioning to insects and seeds in the summer (Anthony 1970). The timing of herbicide use in agriculture often corresponds to the “spring green-up” and flushes of undesirable weeds which can reduce the abundance of those early season leafy greens that quail rely on which subsequently impacts quail populations.
The Conservation Reserve Program (CRP) has benefited Washington upland bird species. The program provides financial incentives to producers to establish perennial vegetation. However, dense vegetation, litter accumulation, and decreased species diversity of older CRP fields most likely limits the habitat value for some species (Rodgers 1999). Recently, CRP programs have been encouraging landowners to diversify their CRP lands through State Acres for Wildlife Enhancement (SAFE), Environmental Quality Incentives Program (EQIP) and simply requiring more diverse plantings to be reenrolled in the general CRP program. Flowering plants are very beneficial to upland birds because of the insects they attract. The insects in turn serve as an important food resource for newly hatched chicks allowing for greater brood rearing success. Continuation of these programs is considered to be vital to enhance upland bird habitat in eastern Washington.
Population Augmentation A three-year project to enhance mountain quail populations in southeast Washington was implemented in March 2005. Mountain quail were trapped in southwest Oregon for release in the Asotin Creek watershed. A subset of birds were fitted with transmitters for monitoring. Results are documented in a master’s theses (Stephenson 2008) and publication (Stephenson et al. 2011). The mountain quail augmentation effort was reinitiated in 2012. A new holding facility was constructed and 143 birds from western Oregon were released in southeast Washington over two years. Surveys on the small, dispersed populations of mountain quail are not cost effective. Therefore it is difficult to assess whether the augmentation effort was successful in reestablishing a viable population. Prior to any further releases, a full evaluation of the reintroduction effort will need to take place.
Management Conclusions Quail are an important upland game bird species and of significant interest to wildlife viewers. Habitat improvements, including the various Farm Bill programs, are vital to WDFW’s ongoing efforts to enhance upland game bird populations across the state. A full evaluation of the mountain quail augmentation project in southeastern Washington is needed to determine whether the methods are helping to reestablish a viable population or whether changes to the current strategy are needed. A first step in this evaluation should be a search for evaluations in the neighboring states of Oregon and Idaho where similar augmentation has been occurring. If a review of those efforts is inconclusive, field surveys may be necessary in Washington to examine the current status of mountain quail in the reintroduction area. Habitat enhancements may be needed in conjunction with future releases or as a next step in the recovery
366

Quail Status and Trend Report 2018
effort. Literature Cited Anthony, R. G. 1970. Food Habits of California quail in Southeastern Washington during the
Breeding Season. The Journal of Wildlife Management. 34(4): 950-953. Rodgers, R. D. 1999. Why Haven’t Pheasant Populations in Western Kansas Increased with
CRP? Wildlife Society Bulletin. 27(3): 654-665. Sauer, J. R., D. K. Niven, J. E. Hines, D. J. Ziolkowski, Jr, K. L. Pardieck, J. E. Fallon, and W.
A. Link. 2017. The North American Breeding Bird Survey, Results and Analysis 1966 - 2015. Version 2.07.2017 USGS Patuxent Wildlife Research Center, Laurel, MD.
Stephenson, John A. 2008. Ecology of Translocated Mountain Quail in Western Idaho and
Eastern Washington. Masters Thesis, University of Idaho. Stephenson, J. A., K. P. Reese, P. Zager, P. E. Heekin, P. J. Nelle, and A. Martins. 2011. Factors
Influencing Survival of Native and Translocated Mountain Quail in Idaho and Washington. The Journal of Wildlife Management. 75(6): 1315-1323.
Washington Department of Fish and Wildlife. 2014. 2015-2021 Game Mangament Plan. Wildlife
Program, Washington Department of Fish and Wildlife, Olympia, Washington, USA. Zornes, M, and R. A. Bishop. 2009. Western Quail Management Plan. Association of Fish and
Wildlife Agencies. Washington, DC. 92 pages.
367

368

Grouse
369

Grouse Status and Trend Report 2018
Forest Grouse Status and Trend Report STATEWIDE SARAH KINDSCHUH, Small Game and Furbearer Specialist
Management Guidelines and Objectives Forest grouse in Washington include dusky grouse (Dendragapus obscures), sooty grouse (Dendragapus fuliginosus), ruffed grouse (Bonasa umbellus), and spruce grouse (Falcipennis Canadensis). These four species occur throughout forested lands in Washington. Dusky and sooty grouse were once collectively classified as Blue Grouse. The WDFW Game Management Plan (WDFW 2014) outlines three specific management objectives for forest grouse:
1. Preserve, protect, perpetuate, and manage forest grouse and their habitats to ensure healthy, productive populations.
2. Manage for a variety of recreational, educational and aesthetic purposes including hunting, scientific study, wildlife viewing, cultural and ceremonial uses by tribes, and photography.
3. Manage statewide populations for sustained harvest.
Hunting Seasons and Recreational Harvest A statewide harvest estimate (based on a mailed hunter questionnaire) is the indicator used for monitoring long-term population trends. Developing estimates of forest grouse hunter numbers and harvest is challenging because of WDFW licensing structure that allows grouse harvest with a big game license or a small game license. Forest grouse harvest survey methods were modified in 1998 and 1999 due to 1) difficulty in separating effort among the grouse species, 2) inaccuracy in species identification by hunters, and 3) changes in hunting license structure that impacted hunter sample stratification. In addition, analysis methods were updated in 2011 and 2016. Comparison of forest grouse harvest information before and after these changes in survey methods should be done with caution.
The current September 1st to December 31st hunting season structure has been in place since 1987. A daily bag limit of three of any of the three species was in place from 1952 to 2009 when the bag limit was raised to four. The decision to increase the bag limit was made to increase opportunity not because there was an increase in grouse populations. Hunters had been taking approximately 0.4 grouse per day hunted for the past 50 years. Based on this average, management determined that increasing the bag limit would not impact overall populations. Interestingly, the harvest per day has been approximately 0.3 birds per day since the bag limit was increased. Beginning in 2015, the bag limits were changed again to address hunter concern regarding reduced numbers of grouse being seen by hunters. The regulation at this time is a daily limit of four forest grouse but only three of any one species.
370

Grouse Status and Trend Report 2018
Figure 1: Long-term trend in grouse harvest and hunter numbers, 1962-2017.
Estimated hunter numbers and harvest have declined from the historic highs of the 1970s and dropped sharply from 2009-2011 but have since leveled off over the past six years (Figure 1). In 2017, the statewide harvest of 55,716 birds was down 2% from the 2016 harvest. Estimated harvest increased in Region 1 (15%) and Region 3 (17%). The current 10-year statewide harvest average is 73,300 birds. This puts 2017 24% below the 10-year average. Harvest estimates continue to be closely tied to hunter participation. There was a slight decrease in hunter participation for 2017, but the average participation rate has remained relatively stable for the past seven years (Figure 1).
0
25,000
50,000
75,000
100,000
125,000
150,000
175,000
200,000
225,000
250,000
275,000
300,000
325,000
350,000
375,000
400,000
425,000
450,000
1962
1964
1966
1968
1970
1972
1974
1976
1978
1980
1982
1984
1986
1988
1990
1992
1994
1996
1998
2000
2002
2004
2006
2008
2010
2012
2014
2016
Harvest Hunters
371

Grouse Status and Trend Report 2018
Although grouse hunter and harvest estimates have varied substantially over time, annual estimates of harvest per hunter (an indicator of hunter success) have not declined as steadily. Estimates of hunter success since 2000 have been higher than, or similar to, the 1980s and 1990s (Figure 2).
The cause of the long-term harvest declines are not well understood, but reductions in hunter participation are likely a contributor. Loss or changes in forest habitat may also be affecting populations and harvest opportunities. Increased restrictions in motorized travel and new fee permit access programs within industrial timberlands may influence hunter participation and contribute to the downward trend.
Population Surveys Currently, WDFW does not conduct statewide population surveys for forest grouse. However, forest grouse wings were collected in north-central Washington each year (1993-2013) by placing barrels out for hunters to voluntarily deposit one wing from each grouse harvested (Schroeder 2013). The collected wings were then classified by species, sex, and age. In 2014, the wing collection effort ended in north-central Washington due to limited time and resources. We initiated a pilot grouse wing and tail collection effort in eastern Washington the fall of 2016. Results of this study are being analyzed.
Historic statewide wing collection efforts from 1993-95 provided several pieces of important information, including that more than 70% of forest grouse harvest occurs in September and early October, before modern firearm deer seasons. Therefore, current seasons that extend through December probably have very little impact on grouse populations. In addition, there is a tendency for hunters to misidentify grouse species, which has resulted in forest grouse species being combined for current harvest estimation purposes.
Based on long-term harvest trends, it appears that forest grouse populations may be declining. However, it is difficult to draw concrete conclusions due to the fact that harvest estimation methods have changed, hunter participation has declined, hunting access has been more restricted, and there could be other factors that influence harvest independently from population size. The fact that harvest per hunter has not varied much over time (Figure 2) may indicate that the number of grouse available to hunters has not changed as dramatically as the total harvest suggests. Since hunters are not able to consistently identify the species of forest grouse harvested, evaluating population trends for individual species is not possible at this time.
Annual production is greatly influenced by weather conditions during the peak of hatching (late May-early June). Wet and windy weather reduces chick survival due to exposure as well as reducing insect populations at the time when young grouse need a high-protein diet. Weather patterns in the spring are often a good predictor of fall harvest and population.
Figure 2: Estimated mean number of grouse harvested per hunter in Washington 1963-2017.
0.00
0.50
1.00
1.50
2.00
2.50
3.00
3.50
Harv
est p
er H
unte
r
372

Grouse Status and Trend Report 2018
Habitat Forest management and wildfire are the most significant factors influencing habitat condition and habitat loses for forest grouse populations statewide. Historically, timber harvest activities have been considered beneficial for most species of forest grouse. Recent changes to silviculture techniques such as using herbicide to control broadleaf species which are considered important food resources for grouse may play a significant role in the degree to which commercial forests provide benefits. Future benefits from timber harvest will depend on the manner in which regenerating forests are managed. Regeneration techniques that include extensive broad leaf tree and shrub control, reduced stocking rates and cover density, and replanting with tree species that provide fewer habitat benefits can negatively impact grouse populations.
Wildfires are an important factor influencing grouse habitat in eastern Washington. Several large fires have occurred in forested areas of Region 2 since the late 1980s. These areas are currently in early successional shrub communities, which should be beneficial to grouse for several years to come but this may be offset by loss of mature forest stands important to winter survival.
Supplementation of forest grouse populations is generally considered unnecessary in Washington. No large-scale efforts have been made to enhance habitat for forest grouse. However, WDFW Habitat Program staff frequently responds to Forest Practice Applications with recommendations to mitigate forest management impacts on wildlife. These recommendations commonly include the following: leaving large down logs in timber harvest areas as drumming logs for ruffed grouse; retaining large, “wolf-tree” Douglas-fir trees on ridge tops for blue grouse winter foraging and roosting, and seeding skid roads and log landings with clover and other grouse forage plants.
Management Conclusions Many factors may be influencing forest grouse harvest which historically has been used as the primary population status indicator. While harvest has declined, hunter success rates have been reasonably consistent which might suggest that grouse availability to hunters has not changed as significantly as total harvest suggests. The effect of spring weather on chick production and survival is a well-known factor influencing variation in populations; the wide range of variation between regions is vast. Changes in access for hunting may also play a role, as this can be attributed to variation within the sample of hunters surveyed from one year to the next, or it could be recent wildfires forced hunters to new locations.
Exploring a variety of survey-based population monitoring techniques may be necessary as well as studying the effect of hunter harvest and changing silvicultural practices. The collection of grouse wings and tails should provide some insights into population structure and allow for monitoring trends over time.
Literature Cited Schroeder, Michael A 2013. Harvest of Forest Grouse in the Okanogan Highlands-2013 Wing
Barrel Update. Unpublished report, Washington Department of Fish and Wildlife.
Washington Department of Fish and Wildlife. 2014. 2015-2021 Game Managment Plan. Wildlife Program, Washington Department of Fish and Wildlife, Olympia, Washington, USA.
373

374

Private Lands Access
375

Private Lands Status and Trend Report 2018
Private Lands Access Status and Trend Report STATEWIDE
CIERA E. STRICKLAND, Private Lands Access Program Manager
Introduction The Department’s Private Lands Access Program promotes cooperation with landowners across the state to provide public access to private property while emphasizing hunting and other outdoor recreational activities. The program’s goal is to encourage landowners to provide public access while addressing the costs that landowners incur when allowing the public on their property. A variety of incentives are available to landowners depending upon the property location, habitat(s), and current management of the property. These incentives can include monetary payments, land improvements or Farm Bill technical assistance. Our Private Lands Biologists help the landowners through this process by serving as the program specialists for the Private Lands and the Farm Bill program. Current program funding is primarily provided by Voluntary Public Access and Habitat Incentive Program (VPA-HIP), grants from the Natural Resources Conservation Service (NRCS) and Pittman-Robertson Wildlife and Sport Fish Restoration funds. The success of the program relies on partnerships with private landowners, sportsman’s groups and volunteers. Management Guidelines and Objectives
During this reporting period, the Department had active formal hunting access agreements with 540 landowners encompassing more than 1.35 million acres of private land in Washington (Tables 1 and 2). The majority of landowners have a formal agreement with the Department; however, some industrial timber managers and/or large land parcel owners often work closely with field staff to facilitate public access for hunters without formal agreements. Properties that do not have a formal agreement are not included in Table 1. The Private Lands Access Program operates and promotes the following five components of hunting access agreements:
• Feel Free to Hunt – This includes private lands where the Department has a management agreement with the landowner or organization to provide public access for hunting with minimal restrictions. This type of agreement provides the most open and unrestricted type of access for the public. Many Feel Free to Hunt properties house a wide variety of small game and big game species and provide ample hunting opportunity. Currently, there are 172 properties, with a total of 491,564 acres enrolled in Feel Free to Hunt agreements across the state (Table 2).
• Register to Hunt – This includes private lands where the Department has a management agreement with the landowner or organization to regulate hunting access by on-site registration. Hunters are required to sign in using a registration slip found at the designated parking area. Parking is usually limited for these properties, to limit the number of hunters. Currently, there are 16 properties, with a total of 17,325 acres enrolled in Register to Hunt across the state (Table 2).
376

Private Lands Status and Trend Report 2018
• Hunt by Reservation – This component of the private lands program launched in 2013. It
is attractive to many landowners and organizations because it allows access to specific reservation and hunter information via a landowner portal. The Hunt by Reservation program is managed through an online registration system where hunters create an account in order to reserve available properties. The Hunt by Reservation program allows landowners to manage hunting on their lands, without direct contact with hunters. Currently, there are 93 properties, with a total of 101,915 acres enrolled in Hunt by Reservation contracts across the state (Table 2).
• Hunt by Written Permission – This includes private lands where a landowner or organization voluntarily open their land to public hunting on a contact-for-permission basis. Hunt by Written Permission requires the hunter to make contact with the Landowner, usually by phone, and meet in person to obtain written permission to hunt that property. Written permission is validated by the possession of a written slip, provided to the hunter by the landowner. The Department provides these slips to the landowner at the beginning of the hunting season and we collect them at the end of the hunting season. The Hunt by Written Permission program allows for the greatest flexibility for landowners and is our most widely used access program. Currently, there are 254 properties, with a total of 624,895 acres enrolled in Hunt by Written Permission contracts across the state (Table 2).
• Landowner Hunting Permit (LHP) – This includes private lands where WDFW negotiates public hunting access to unique and/or high quality hunting opportunities. Landowners are allowed to work with the Department to set customized hunting season opportunities on their property. These opportunities are also advertised annually in the Big Game Hunting Regulations. Currently, there are 5 properties, with a total of 116,515 acres enrolled in Landowner Hunting Permit contracts across the state (Table 2).
In early 2018, it was determined that the current system that houses all of the private lands data and information is no longer able to meet both the growing needs of the program, and the needs of the public. The Department has made plans to migrate the current system and the corresponding program data into a new and improved platform that will be maintained through the state licensing system. Upgrades and developments for the new system began in 2018 and the new system should be launched by fall of 2019.
In 2018, the Department introduced an initiative that focuses on developing strategies for working with large industrial timber companies to acquire access for hunting and other forms of outdoor recreation. The Department is examining existing relationships and also analyzing areas where access to private lands are limited. It is the Department’s goal to continue to pursue new opportunities for the public in regards to access onto private industrialized timberland. The Department will also continue its focus on the development of new relationships, and maintaining current relationships with timber companies across the state.
377

Private Lands Status and Trend Report 2018
Population Surveys In 2016, we proposed using hunter surveys to gather baseline data for the Reservation System. Unfortunately, due to system issues, we were unable to complete a pre-hunt survey prior to the beginning of the 2017 and 2018 hunting seasons. Post hunt surveys are still being conducted. Survey response information provides valuable information on user experience, property information and desired system improvements. Survey responses are monitored by program staff and help guide management decisions and communication efforts with landowners. The post hunt survey is only available for individuals who reserved and completed a reservation hunt through the Reservation System. This survey is linked to the individual’s account and is administered via email. With the launch of the new system, surveys will continue to be a valuable administrative and management tool.
Table 1: FY18 Cooperators, Acreage, and Change from 2017.
Regional Information and Trends
Program objectives and priorities vary by region. The priorities are dependent on available habitat, species emphasis, and hunter access needs. The number of landowner contracts and acres under contract are summarized by region in Table 1, along with changes since the last reporting period. However, these figures do not represent the full scope of access opportunity. Many properties do not fall into the realm of formal agreements, therefore; those properties are not included in Table 1. With reductions in the Conservation Reserve Program (CRP) and in the economic value of certain crops, some landowners have chosen to return to farming land that was previously CRP ground. Landowners often prefer not to have hunters in areas where crops are being grown. Region 1 There were 299 cooperators and 603,447 acres enrolled in access agreements in Region 1. Region 1 is one of our most diverse regions due to the latitudinal range of the region. This diversity encompasses many different landscapes which provide unique hunting opportunities throughout the region. Region 1 continues to be a popular area for both upland bird hunting and big game hunting and possesses the largest acreage within the program.
Region Cooperators Acres Cooperators Acres Cooperators Acres1 299 603,447 282 563773 6.03 7.042 128 350,150 124 356509 3.23 -1.783 39 164,205 48 175663 -18.75 -6.524 51 163,525 51 164302 0.00 -0.475 15 69,782 14 69804 7.14 -0.036 8 1,105 8 1618 0.00 -31.71
State Total 540 1,352,214 527 1,331,669 2.47 1.54
FY 2018 Change from 2017 Percent Change
378

Private Lands Status and Trend Report 2018
Region 2 There were 128 cooperators and 350,150 acres enrolled in access agreements in Region 2. One of the region’s most popular programs is for waterfowl and upland bird hunters. The program offers landowners monetary incentives to allow access on croplands where corn stubble is left to provide food resources throughout the winter months for waterfowl. All of the corn stubble sites are managed through the Reservation System, but based upon certain availability criteria, can also operate as Register to Hunt sites. For more information, see http://wdfw.wa.gov/hunting/cbcs/. Region 3 There were 39 cooperators and 164,205 acres enrolled in the access agreements in Region 3. A large portion of the acres available in Region 3 are signed up through the Feel Free to Hunt program, primarily for deer and elk hunting. Within Kittitas county, just over 10,000 acres are available through the Hunt by Reservation program on the Puget Sound Energy Wild Horse Wind Facility. The region also enrolls croplands in the corn stubble retention program as described under Region 2. Region 4 There were 51 cooperators and 163,525 acres enrolled in access agreements in Region 4. Efforts in this region are largely focused on waterfowl and pheasant hunting access. Staff also work with landowners to improve access for deer, elk and bear hunting. In Fall of 2016, the Department extended recreational opportunities by signing agreements with landowners for wildlife viewing. Currently, there are 3 sites within the Region. The majority of contracts with large acreage parcels are with timber companies to facilitate deer, elk, and spring bear hunting access. Some of the waterfowl sites in Region 4 are in the Hunt by Reservation Program and are typically managed to provide quality experiences. These private land contracts in the northern part of the region also help landowners address crop damage problems posed by large numbers of snow geese migrating through the area. Region 5 There were 15 cooperators and 69,782 acres enrolled in access agreements in Region 5. The program in Region 5 has primarily focused on Klickitat County where the majority of the roughly 67,000 acres have been enrolled in the Feel Free to Hunt sub-program providing deer and turkey hunting opportunities. Other agreements within this region also provide upland bird hunting opportunities. More focus will be directed at securing additional acreage for deer and turkey hunting through the VPA-HIP grant in the upcoming years.
Region 6 There were 8 cooperators and 1,105 acres enrolled in access agreements in Region 6. Opportunities include waterfowl hunting in Grays Harbor and Mason counties and pheasant hunting on private lands in Kitsap County. As in Region 4, a great deal of the effort in Region 6 was devoted to working with large industrial timber companies that are not enrolled in formal contracts. The relationships built between the Private Lands Biologists and private landowners and industrial timber companies have facilitated public access and assisted the landowners with managing public recreation. Work in this area relies heavily on directing volunteer
379

Private Lands Status and Trend Report 2018
efforts to monitor use, discourage abuse of private lands, conduct cleanup of illegal dump sites, and maintain signage and gates. Much of the private industrial timberland acreage in Region 6 has landowner fee access requirements or is being privately leased. A few of these permit programs have limited hunter numbers. This trend is a growing concern for hunters who are finding it increasingly difficult to locate places to hunt, or they are not willing or able to pay fees for access. The Department’s Private Lands Access Program continues to be a valuable asset to the hunting public and to the landowners that choose to participate. Urban development and changing land uses have continued to reduce the amount of land available to hunters. The implementation of fee permits or exclusive lease access policies by industrial timberland owners is fast becoming a norm in western Washington. As a result of the fee permits, the Department has continued to engage communication efforts with those large landowners. Most of the fee based permit programs that have been implemented are of relatively high cost and have limited the ability of some hunters to acquire those permits. Presently, The Department does not have the resources to match the income potential of these programs. In some instances, the Department has been successful at encouraging landowners to increase the number of low-cost permits to allow additional hunters to access those properties. Hunters who are unwilling or unable to obtain permits are still forced to look elsewhere for hunting access, which will increase pressure on other private and public lands. The Department is determined to increase public access and hunter opportunity. As situations and opportunities arise, the Department will continue to pursue funding sources and/or no cost agreements to improve the recreational access for the public across the state of Washington. Literature Cited Washington Department of Fish and Wildlife, 2014. 2015-2021 Game Management Plan.
Wildlife Program, Washington Department of Fish and Wildlife, Olympia, WA.
380

Private Lands Status and Trend Report 2018
Table 2: Access Agreements and Acreage by County Feel Free to Hunt Hunt by Reservation Register to Hunt Hunt by Written Permission Landowner Hunt Permit County Totals
County Cooperators Acres Cooperators Acres Cooperators Acres Cooperators Acres Cooperators Acres Cooperators Acres Adams 8 7,277 0 0 0 0 48 112,534 0 0 56 119,811 Asotin 3 4,059 0 0 2 4,218 9 11,057 0 0 14 19,334 Benton 7 22,524 0 0 2 8,320 1 12,150 0 0 10 42,994 Chelan 2 178 0 0 0 0 0 0 0 0 2 178 Clallam 0 0 0 0 0 0 0 0 0 0 0 0 Clark 0 0 0 0 0 0 1 20 0 0 1 20 Columbia 16 28,827 0 0 0 0 11 18,976 0 0 27 47,803 Cowlitz 1 390 0 0 0 0 0 0 0 0 1 390 Douglas 7 9,351 0 0 0 0 28 78,497 0 0 35 87,848 Ferry 1 2,702 0 0 0 0 6 2,615 0 0 7 5,317 Franklin 10 18,160 0 0 0 0 5 11,604 0 0 15 29,764 Garfield 9 7,481 3 1,420 2 3,674 12 28,772 0 0 26 41,347 Grant 7 10,939 2 17,374 25 72,130 1 41,870 35 142,313 Grays Harbor 1 290 2 167 1 59 0 0 0 0 4 516 Island 4 1,577 0 0 0 0 0 0 0 0 4 1,577 Jefferson 0 0 1 118 0 0 0 0 0 0 1 118 King 0 0 0 0 0 0 0 0 0 0 0 0 Kitsap 0 0 0 0 0 0 0 0 0 0 0 0 Kittitas 0 0 2 10,080 0 0 0 0 0 0 2 10,080 Klickitat 4 66,568 4 1,765 0 0 3 780 0 0 11 69,113 Lewis 0 0 0 0 0 0 0 0 0 0 0 0 Lincoln 8 7,885 1 2,050 0 0 30 37,139 0 0 39 47,074 Mason 0 0 2 406 0 0 0 0 0 0 2 406 Okanogan 0 0 0 0 0 0 0 0 0 0 0 0 Pacific 0 0 0 0 0 0 1 65 0 0 1 65 Pend Oreille 4 115,929 1 238 0 0 1 120 0 0 6 116,287 Pierce 0 0 0 0 0 0 0 0 0 0 0 0 San Juan 0 0 0 0 0 0 0 0 0 0 0 0 Skagit 12 1,197 3 106 2 213 3 91,864 0 0 20 93,380 Skamania 0 0 0 0 0 0 0 0 0 0 0 0 Snohomish 5 779 4 253 1 10 0 0 0 0 10 1,042 Spokane 2 7,518 1 370 0 0 3 3,397 1 3,974 7 15,259 Stevens 2 70,963 3 1,680 0 0 16 16,118 0 0 21 88,761 Thurston 0 0 0 0 0 0 0 0 0 0 0 0 Wahkiakum 0 0 0 0 2 259 0 0 0 0 2 259 Walla Walla 37 89,718 4 11,563 0 0 17 26,976 0 0 58 128,257 Whatcom 8 1,178 6 866 2 252 1 65,230 0 0 17 67,526 Whitman 8 8,358 54 53,459 2 320 30 31,871 0 0 94 94,008 Yakima 6 7,716 0 0 0 0 3 2,980 3 70,671 12 81,367 Totals 172 491564 93 101915 16 17325 254 624895 5 116515 540 1,352,214
381

382

Wildlife Conflict Management &
Prevention
383

Wildlife Conflict Management & Prevention Status and Trend Report 2018
Wildlife Conflict Management & Prevention Status and Trend Report STATEWIDE
DAN BRINSON, Wildlife Conflict Management and Prevention Section Manager RALF SCHREINER, Wildlife Conflict Management and Prevention Program Specialist
Introduction In 2012, the Washington Department of Fish and Wildlife (WDFW) renewed its focus on human-wildlife conflict management. This report is intended to illustrate efforts to meet the Game Management Plan objectives (WDFW 2014) while creating a historical account of human-wildlife conflict management actions. WDFW has implemented programs providing opportunities for improved knowledge to develop specific strategies and tools for mitigating human-wildlife conflict in Washington for long-term sustainability of wildlife resources. Social tolerance can be a limiting factor for species recovery and maintaining sustainable wild animal populations. Negative human-wildlife interactions decrease social tolerance of wildlife populations using otherwise available habitat. Through the application of integrated wildlife management techniques designed to prevent or mitigate negative human-wildlife interactions, WDFW can improve social tolerance of wild animals. By doing so, wildlife managers can increase wildlife populations by increasing use of existing habitat on heavily human influenced landscapes. The convergence of human population expansion, nature-based tourism, and escalating interest in outdoor recreational opportunities in Washington are likely to result in increasing negative human-wildlife interactions. Maintaining a healthy ecosystem for humans and wildlife requires innovative approaches designed to minimize these conflicts. These approaches must include science based decision making that incorporate public opinion for social context. WDFW is committed to informing and assisting the public to employ proactive measures by providing timely, effective response when interactions and property damage occur (Conover 2001). WDFW conducted an opinion survey that identified 29% of the Washington public as having experienced negative situations or problems associated with wildlife (Duda et al. 2014). Deer and raccoons were the most commonly named species causing problems (35% and 25%, respectively), followed by bear (14%), geese (13%), and coyotes (10%; Duda et al. 2014). WDFW has not always conducted formal assessments of negative human-wildlife interaction complaints. Current trends indicate human-wildlife conflict resolution in Washington is a management necessity and traditional recreational harvest is not always effective in resolving negative interactions.

Wildlife Conflict Management & Prevention Status and Trend Report 2018
Management Guidelines and Objectives In December 2014, WDFW published the Game Management Plan (WDFW 2014), which outlined three goals and 10 human-wildlife conflict management objectives with strategies designed to create an integrated system of management actions, data collection, and information sharing. The goals for human-wildlife conflict management in Washington are to:
1) Improve our understanding and ability to predict human-wildlife conflict issues; 2) Enhance proactive measures to prevent negative human-wildlife interactions and improve agency response to interaction events; and 3) Minimize, mitigate, and manage negative human-wildlife interactions to maintain/increase human tolerance and perpetuate healthy and productive wildlife populations.
Management Actions WDFW management actions are designed to minimize negative human-wildlife interaction and assist landowners with prevention, mitigation, and when necessary, compensation for property damage or loss (as provided by law). An effective strategy for managing human-wildlife conflict is to allow staff a degree of flexibility to test and implement new techniques while improving existing preventative and mitigation tools. WDFW staff assess each scenario and use their professional judgment to determine the best course of action for interaction resolution. In addition to accounting for negative human-wildlife interaction issues when setting recreational harvest seasons and limits, WDFW will employ other tools when traditional recreational harvest cannot resolve the issue. WDFW has used hunters to assist with deer, elk, and turkey damage issues and hound handlers, trappers, and hunters to assist with bear and cougar depredation events. In each case, there are criteria that must be met and restrictions that direct the final disposition of the animal harvested. WDFW continues to use a three-category system to respond to human-wildlife conflict issues: 1) self-help, 2) public safety, and 3) non-public safety but requiring assistance. Self-help involves referring a customer to the WDFW web site to obtain an answer to a wildlife-related nuisance problem, directing the customer to a list of certified Wildlife Control Operators available for hire, or directing the customer to contact the United States Department of Agriculture Wildlife Services for help in solving a conflict situation. Often the self-help tools are used to assist with damage situations involving small game, furbearers, and unclassified species (e.g., raccoons, beavers, coyotes, etc.). The WDFW Law Enforcement Program is responsible for interactions affecting public safety that involve bear, cougar, moose, and wolves. Non-public safety wildlife issues, including depredations involving deer, elk, turkey, black bear timber damage, and wolves, are generally resolved through the WDFW Wildlife Program. Deer, elk, and turkey damage prevention and kill permits Depending upon the circumstances, landowners may enter into a Damage Prevention Cooperative Agreement with WDFW to use non-lethal mitigation tools for damage caused by deer, elk, and turkey. If these mitigation tools are ineffective, a Wildlife Conflict Specialist may issue a damage

Wildlife Conflict Management & Prevention Status and Trend Report 2018
prevention permit (DPP) or a kill permit (KP) to a landowner that allows for the removal of one or more offending animals through the use of licensed hunters or agency kill authority. During the 2017 damage season (April 2017–March 2018), a total of 2,514 permits were issued to remove offending deer, elk, and turkey (Table 1). Table 1. Total damage prevention (DPP) and kill permits (KP) issued by Washington Department of Fish and Wildlife Region for deer, elk, and turkey, April 2016–March 2017. Permit Region 1 Region 2 Region 3 Region 4 Region 5 Region 6 Total DPP Deer 386 24 59 14 – 30 513 KP Deer 201 29 16 18 – 32 296 DPP Elk 74 3 569 12 60 118 836 KP Elk 256 13 100 58 39 102 568 DPP Turkey 25 18 – – 7 – 50 KP Turkey 228 16 – 6 1 – 251 Total 1170 103 744 108 107 282 2514
Licensed hunters with a DPP must purchase a Damage Tag to participate in a deer or elk damage prevention hunt and can retain the deer or elk. Hunters purchased 1,060 deer and elk Damage Tags during the 2016-17 damage season; of those Damage Tag holders who reported, 114 deer and elk were harvested for an estimated success rate of 11% statewide (Table 2). Table 2. Total reported harvest by hunters with deer and elk Damage Tags for each Washington Department of Fish and Wildlife Region, April 2016–March 2017.
Damage Tag Type
Region 1
Region 2
Region 3
Region 4
Region 5
Region 6
Grand Total
Deer 163 5 18 3 - 4 193
Elk 13 - 92 4 20 36 165
Grand Total 176 5 110 7 20 40 358
Black bear timber damage Black bears emerge from winter dens when food sources are relatively scarce and may strip bark off certain species of trees to access the carbohydrate-rich cambium. Bark stripping or "peeling" may hinder the growth of the tree or kill it, causing the potential for financial loss to commercial timber growers. The damage period occurs from approximately April through June and ends once other food sources, such as berries, become more abundant. Commercial forest landowners and managers experiencing timber damage caused by black bears may request a black bear timber damage depredation permit. This permit request requires evidence of damage from the landowner/manager, typically in the form of a date-stamped photograph, and

Wildlife Conflict Management & Prevention Status and Trend Report 2018
must specify the damage location, requested removal method, and who will participate on the permit. The number of depredation permits issued (123 permits in 2012 and 101 permits in 2017) and the number of bears removed (Table 3) varied from 2012–2017 but have generally declined.
Figure 1. Number of male and female black bears removed annually during the bear timber damage period, 2012–2017.
A total of 94 bears were removed during the 2017 timber damage period, including 54 males (57%) and 40 females 43%. Bears were removed using a variety of methods, including hound hunting, trapping with snares, and Master Hunters (Table 4).
Figure 2. Number of bears removed during the black bear timber damage period by Game Management Unit (GMU), sex, and removal method, April–July 2017. MH = Master Hunter

Wildlife Conflict Management & Prevention Status and Trend Report 2018
The black bear harvest total for 2017, including the total recreational harvest, the spring permit hunt, and bear timber damage removals, was 1,606 bears statewide. Females represented 37.1% of the total statewide harvest. Black bear timber damage removals represented 5.8% of the total statewide harvest. Carnivore (black bear, cougar, and wolf) depredation on livestock Accounts of managing and response to livestock losses and injury caused by black bears and cougars are described under those sections. Please see the Wildlife Damage Claims section below for detail regarding compensation claims during fiscal year 2017. Cost-share and Prevention measures for livestock losses WDFW offers cost-sharing with livestock producers for deploying conflict prevention measures. Producers that sign a Damage Prevention Cooperative Agreement for Livestock (DPCA-L) may receive cost-share funds to assist them with installing and using non-lethal conflict prevention tools. The DPCA-Ls identify non-lethal measures that a producer can use to minimize livestock loss to wolves. The agreements can last up to one year. They may be signed at any time during a fiscal year and end at the close of the fiscal year. Potential prevention measures that may be included in a DPCA-L include: Sanitation (fencing bone yards, surrounding carcasses with fladry or removing carcasses), providing deterrence tools (screamers, range riders, guard dogs, radio-activated guard boxes, fladry, predator fencing, electric fencing, bio fencing), and protecting livestock rearing areas. The most common measures deployed by producers under DPCA-Ls are range riding and sanitation. Cost-share amounts can vary depending on the livestock operation, location of the livestock herd in relation to wolves, proactive measures selected, and duration. During fiscal year 2017 (July 1, 2016 – June 30, 2017), there were 34 DPCA-Ls written with livestock producers statewide. In addition to DPCA-Ls, WDFW also contracted Range Riders to assist ranchers in an effort to minimize livestock losses caused by wolves. Range riders are skilled at assessing potential wolf presence within the vicinity of livestock and provide a consistent human presence with livestock while on grazing allotments. Range rider duties include, but are not limited to: monitoring the health and behavior of a herd; seeking out any signs of wolf or other carnivore activity in the area; implementing tools and techniques that minimize predation risk; deploying non-lethal hazing techniques; trying more intensive livestock management, or any number of other techniques or combination of techniques; and frequent communication with the livestock producer and WDFW staff regarding planned livestock movements and grazing plans. During fiscal year 2017, WDFW had 9 range rider contracts which utilized up to 13 different riders throughout the year. Wildlife damage claims Agriculture Commercial agriculture producers who meet the definition of “eligible farmer” (Revised Code of Washington 82.08.855), who have cooperated with WDFW prior to claim initiation, and experience crop damage from deer and elk may be eligible for compensation from the state. Funds for compensation are appropriated through legislation. The payment of a claim is conditional on meeting specific criteria [Washington Administrative Code (WAC) 220-440-140 and 220-440-150] and the availability of specific funding for this purpose; Reimbursement for damage claims

Wildlife Conflict Management & Prevention Status and Trend Report 2018
is not guaranteed. The total compensation paid for deer and elk crop damage claims in fiscal year 2017 (July 1, 2016 – June 30, 2017) was $93,458.60. Livestock Additionally, commercial livestock producers who experience livestock loss caused by bear, cougar, or wolf may be eligible for compensation under WAC 220-440-170. Similar to the deer and elk claims, payment is conditional upon meeting specific criteria and the availability of specific funding for this purpose. Reimbursement for damage claims is not guaranteed. The total compensation paid for direct livestock losses (i.e., losses determined by WDFW to be confirmed or probable) caused by wolves in fiscal year 2017 was $16,539.70. The total compensation paid for direct livestock losses caused by cougars in fiscal year 2017 was $2,455.00. In the latter part of fiscal year 2016, the WDFW established an independent, five-member Livestock Review Board (LRB) to evaluate claims and make recommendations to WDFW for indirect livestock losses due to harassment by wolves, including greater than normal losses, reduced weight gains, and reduced pregnancy rates in livestock. The LRB consists of two livestock producers, two members from the environmental community, and a rangeland scientist. The department carefully evaluates and considers the recommendation from the LRB when considering settlement of an indirect livestock loss claim. Wildlife Control Operators Wildlife Control Operators (WCO) are private individuals who are certified by WDFW to assist landowners in the prevention or control of wildlife-related damage and charge a fee. A WCO is allowed to harass, control, and/or trap various small game, furbearer species, unclassified wildlife, and predatory birds. WCOs are not certified to handle nuisance issues involving deer, elk, cougar, bear, moose, wolf, bighorn sheep, mountain goats, or protected or endangered wildlife. The WCO program is administered through the Wildlife Conflict Management and Prevention Section at the WDFW office in Olympia. Classes for WCO certification are held a total of four times per year, alternating between the Olympia and Spokane WDFW offices. Once a person meets all the requirements for becoming a WCO (WAC 220-440-100) and completes and passes WCO training, they are presented with a certificate valid for three years that allows the individual to handle specific nuisance wildlife issues year-round and state-wide. 27 people completed training and were certified as WCOs in 2017 compared to 50 people in 2016. Beginning March 2016, a revision to WAC 220-440-100 went into effect and stipulates that a prospective WCO must demonstrate two years of trapping or wildlife damage management experience before they can take the WCO class and apply for WCO certification. Methods of documenting experience include, but are not limited to, possessing a trapper's license for two years, providing a letter of recommendation from a currently certified WCO or trapper, providing evidence of being employed in the wildlife abatement field for two years, providing a written statement verifying they are currently working with a certified WCO, or other method as identified by the department. The more stringent requirements under the revised rule explain the reduction in certifications between 2016 and 2017. Currently, there are 283 people in Washington State with valid WCO certificates.

Wildlife Conflict Management & Prevention Status and Trend Report 2018
Special Trapping Permit Property owners who are experiencing wildlife-related damage to their property are allowed to mitigate the problem by capturing and/or removing the species responsible, with exceptions. In some cases, when nonlethal measures have been deemed ineffective, a property owner may apply for a special trapping permit (STP), valid for 30 days, authorizing the use of one or more body-gripping traps. Body-gripping traps that may be authorized under a STP include a Conibear-type trap in water, a padded-jaw leg-hold trap, and a non-strangling foot snare. During 2017, 540 STPs were issued statewide which allowed for removal of certain wildlife causing damage to public or private property. The number of permits issued in 2017 is a slight decrease from the 559 permits issued in 2016. The most common authorization requested was for trapping mountain beaver within industrial timberlands. In 2017, requests for STPs and corresponding wildlife removals were variable by month, but the highest numbers generally occurred fall through spring. Special Trapping Permit requests and the number of animals removed using STPs were highest in western Washington counties.
Figure 3. Total number of individual animals reported trapped for the six most common wildlife species removed using Special Trapping Permits in 2017.

Wildlife Conflict Management & Prevention Status and Trend Report 2018
Figure 4. Total number of wild animals reported trapped with Special Trapping Permits (STP) and the total STPs in each month, 2017. The number of wildlife reported trapped in each month is based on reporting for 30-day permits that ended within a given month.
Figure 5. The total number of wildlife species reported trapped in the seven counties with the highest reported wildlife removals using Special Trapping Permits in 2017.

Wildlife Conflict Management & Prevention Status and Trend Report 2018
Management Conclusions Minimizing the potential for negative human-wildlife interaction is a critical key to North American wildlife management in the 21st century. Doing so increases the social tolerance of wildlife utilizing habitat that might otherwise be unavailable to many valuable species including big game. Managing and preventing wildlife conflict requires the use of a variety of adaptable tools and techniques to ensure sustainable wildlife populations without negatively impacting our natural resources or the livelihoods of Washington residents. Food resources, such as agriculture crops, livestock, or unnatural attractants in the vicinity of residences, are the motivating mechanism for potential conflict. During 2015, WDFW improved data collection methods, increased response to conflict issues, deployed new methods and techniques for managing conflict, and increased information sharing for mitigating negative encounters. The WDFW Wildlife Conflict Management and Prevention program is committed to its continued improvements in managing negative human-wildlife interactions using a combination of best science and best business practices. Some of the remaining challenges for effective human-wildlife conflict management include: 1) improving rules that address the primary conflict issues, 2) developing policies and procedures that facilitate a smooth process by which actions can be deployed, and 3) furthering appropriate data collection to direct management activities, and 4), testing new and evaluating existing wildlife management techniques targeted to mitigate or prevent conflict. An additional challenge and objective for the upcoming years is improving outreach and information sharing through the use of multimedia approaches (e.g., print, audio, and visual, and social media platforms). Literature Cited Conover, M. R. 2001. Resolving human-wildlife interactions: the science of wildlife damage
management. Lewis publishers, Boca Raton, Florida, USA.
Duda, M. D., M. Jones, T. Beppler, S. Butzen, S. J. Bissell, A. Criscione, P. Doherty, G. L. Hughes, P.E., E. Meadows, A. Lanier. 2014. Washington Residents’ Opinions on Bear and Wolf Management and Their Experiences with Wildlife That Cause Problems. Conducted for the Washington Department of Fish and Wildlife by Responsive Management.
Washington Department of Wildlife. 2014. 2015-2021 Game Management Plan. Washington Department of Fish and Wildlife. Olympia, WA.