2017 Lean and Computing in Construction Congress (LC
490
-
Upload
khangminh22 -
Category
Documents
-
view
2 -
download
0
Transcript of 2017 Lean and Computing in Construction Congress (LC


2017 Lean and Computing in Construction Congress (LC3)
Volume II – Part 1 ―
Proceedings of the
25th Annual Conference of the International Group for Lean
Construction (IGLC)
July 9–12, 2017 Heraklion, Crete, Greece
Edited by
Dr. Ken Walsh, San Diego State University, USA Dr. Rafael Sacks, Technion Israel Institute of Technology, Israel
Dr. Ioannis Brilakis, University of Cambridge, UK

Walsh, K., Sacks, R. and Brilakis, I. (2017). Lean and Computing in Construction Congress (LC3): Volume II – Proceedings of the 25th Annual Conference of the International Group for Lean Construction (IGLC), July 9-12, 2017, Heraklion, Crete, Greece.
Sponsored by:
• International Group for Lean Construction (IGLC)
Liability: Any statements expressed in these materials are those of the individual authors and do not necessarily represent the views of IGLC or the LC3 organisers, who take no responsibility for any statement made herein. IGLC and the LC3 organisers make no representation or warranty of any kind, whether express or implied, concerning the accuracy, completeness, suitability, or utility of any information, apparatus, product, or process discussed in this publication, and assumes no resulting liability. Anyone utilizing this information assumes all liability arising from such use, including but not limited to infringement of any patent or patents.
Reproduction: No part of this work may be reproduced, stored in a retrieval system, or transmitted in any form or by any means, electronic, mechanical, photocopying, microfilming, recording or otherwise, without written permission from the Publisher, with the exception of any material supplied specifically for the purpose of being entered and executed on a computer system, for exclusive use by the purchaser of the work. Furthermore, the authors of each paper retain the right to republish that paper, in whole or part, in any publication of which they are an author or editor, and to make other personal use of the work. Any republication or personal use of the work must however explicitly identify prior publication in the LC3 Proceedings, including page numbers.
Published and printed at Heraklion, Crete, Greece.
Copyright © 2017 by Kenneth Walsh, Editor.
ISBN 978-0-9565951-8-8 (Series) ISBN 978-0-9565951-7-1 (Volume II)
ISSN 2309-0979
All rights reserved © 2017

iii
LC3 PREFACE
The 2017 Lean and Computing in Construction Congress (LC3) was held in Heraklion, Crete, Greece over July 4-12, 2017. LC3 was a special, one-of-a-kind event, whose value proposition for researchers and industry stemmed from the integration of three conferences, two PhD summer schools and one industry day into four co-located events:
• The Joint Conference on Computing in Construction (JC3), comprised of:
o The 34th CIB W78 Information Technology for Construction Conference
o The 17th International Conference on Construction Applications of Virtual Reality
• The 25th Annual Conference of the International Group for Lean Construction (IGLC)
• Lean and BIM PhD Summer Schools • Lean and BIM Industry Day
The construction industry is undergoing two major, disruptive, changes, one technological and the other managerial: the broad adoption of BIM and other information technologies and the fundamental change to the management of production that Lean Construction brings. These two innovations are independent in theory, but are interdependent in implementation. The natural synergies between them have driven much of the adoption efforts in pioneering construction companies, and their interactions are the subject of growing academic research.
The idea to co-locate the leading international Construction IT and Lean Construction conferences was born from the recognition of the growing interest in the synergies of Lean Construction and BIM. We are thrilled to have made this a reality: co-located, consecutive conferences that offered a unique opportunity for researchers and practitioners to share ideas on the broad subjects of Construction IT and Lean Construction, but at the same time, maintained the unique identity of each of the individual conferences and their communities. In fact, some 25% of the participants in each of the JC3 and the IGLC conferences took part in both conferences.
We are also delighted to have succeeded in bringing together academics and industry practitioners to share ideas and experiences. The Lean and BIM Industry Day and the Lean and BIM PhD Summer Schools, which took place over the weekend following the JC3 and preceding the IGLC Conference, offered superb opportunities to exchange ideas; 143 people took part in the weekend activities. Overall, over 300 individuals took part in the various LC3 events.
In designing the LC3, we introduced many new quality features from academic events in computer science and other areas to increase the value proposition of the congress and highlight improvements to our communities for future use. We made abstract submission optional and focused the reviewing effort on the full papers. We adopted the IGLC practice

iv
and requested and published extended abstracts / A3 posters along with camera-ready papers and included them in the LC3 programme for both the JC3 and the IGLC conferences. We ensured that each paper received a DOI number and is freely available (open-access). We created parallel video proceedings on LC3’s YouTube channel to preserve the presentations and link them directly to the papers.
Kenneth Walsh, Ph.D., San Diego State University, IGLC Programme Chair
Frédéric Bosché Ph.D., Heriot-Watt University, JC3 Programme Chair
Rafael Sacks, Ph.D., Technion Israel Institute of Technology, LC3 Chair
Ioannis Brilakis, Ph.D., University of Cambridge, LC3 Chair
LC3 SPONSORS
We would like to thank our commercial sponsors for their generous contributions to the congress, in support of scholarships, awards, the industry day and the PhD summer schools.
v
IGLC PREFACE
The International Group for Lean Construction (IGLC), whose proceedings are contained in this volume, was founded in 1993. The organization is a network of professionals and researchers in architecture, engineering, and construction (AEC) who feel that the practice, education, and research of AEC have to be radically renewed in order to respond to the challenges ahead. The goal is to better meet customer demands and dramatically improve the AEC process as well as product. To achieve this, IGLC researchers are developing new principles and methods for product development and production management specifically tailored to the AEC industry, but akin to those defining lean production that proved to be so successful in manufacturing. The distinguishing trait of this Group is its emphasis on theory. IGLC views that the lack of an explicit theory of construction has been a major bottleneck for the progress in the AEC field.
Annual conferences are the main activity of the IGLC, and their locations rotate amongst the continents. Conference organization is managed independently by a group of volunteers in each sponsoring country. The present conference is the 25th annual event, an important milestone in the history of IGLC.
The IGLC conference received approximately 160 submissions (overall, LC3 received approximately 320 submissions) in nine lean construction tracks: Contract & Cost Management; Enabling Lean with Information Technology; Lean Theory; People, Culture, & Change; Product Development & Design Management; Production Planning & Control; Production System Design; Safety, Quality, & the Environment; and Supply Chain Management& Prefabrication
Following a rigorous full paper peer review process (with each full paper being reviewed by at least two reviewers drawn from the scientific committee of international experts, and final decisions being made collectively by the corresponding track and programme chairs), 113 outstanding full papers were ultimately included in the proceedings and presentation at the conference (72% acceptance rate). These papers represented a combined total of 244 authors.
The conference was divided into one day of plenary sessions with 12 papers. Papers were selected based on the recommendations of track chairs for the first two sessions. The third session was designed to present papers from the track that attracted the highest number of submissions (People, Culture, and Change). The first day also included two poster sessions, with 20 papers presented in this format. The remaining papers were presented in 23 parallel sessions over two days. The authors of the top ranked papers were invited to expand their work for submission to a special issue of a leading academic journal –the Journal of Construction Engineering and Management.
In addition to the technical content, the conference also provided opportunities for fellowship and networking in informal settings. The IGLC programme opened on the evening of July 9th 2017 with a welcome reception. The conference offered an optional half-day trip to Lassithi Plateau & the Village of Kritsa, an optional pre-conference full-day tour to Elounda and Spinalonga, and a conference dinner with a folklore night at Thea.
We would like to thank the IGLC scientific community, including both academic and industry members for their contributions and support; the programme committee (see

vi
specific acknowledgements below); as well as Lilia Sbokou and her team at Sbokos Tours, who managed the local organization matters of the event.
To all LC3 attendees: we sincerely appreciate your participation and involvement in this 25th anniversary event. We hope your conference experience provided opportunities to renew friendships and professional relationships, forge new ones, spark exciting new research ideas, and enjoy the scenery and surroundings in Crete!
Kenneth Walsh, Ph.D., San Diego State University, IGLC Programme Chair
Rafael Sacks, Ph.D., Technion Israel Institute of Technology, LC3 Chair
Ioannis Brilakis, Ph.D., University of Cambridge, LC3 Chair

vii
ACKNOWLEDGEMENTS
The LC3 Chairs and JC3 Programme Chair would like to thank the Area Track Chairs and the Technical Committee members for their contributions to the paper review and selection process. We would also like to thank the chairs of all the other committees for their invaluable contributions and hard work to deliver the Summer Schools, the Industry Day, and all the other Congress sessions and activities that took place in addition to the mainstream paper presentations.
IGLC AREA TRACK CHAIRS
CONTRACT & COST MANAGEMENT:
Paz Arroyo Pontificia Universidad Catolica de Chile
ENABLING LEAN WITH INFORMATION TECHNOLOGY:
Claudio Morgues Pontificia Universidad Catolica de Chile
LEAN THEORY: Olli Seppannen Aalto University
PEOPLE, CULTURE, & CHANGE: Zofia Rybkowski Texas A&M University
PRODUCT DEVELOPMENT & DESIGN MANAGEMENT:
Patricia Tzortzopoulos University of Huddersfield
PRODUCTION PLANNING & CONTROL:
Farook Hamzeh American University of Beirut
PRODUCTION SYSTEM DESIGN: Frode Drevland Norwegian University of Science and Technology
SAFETY, QUALITY, & THE ENVIRONMENT:
Christine Pasquire Nottingham Trent University
SUPPLY CHAIN MANAGEMENT & PREFABRICATION
Thais Alves San Diego State University
IGLC PROGRAMME COMMITTEE
• Muhamad Abduh, ITB • Hisham Abou Ibrahim, American University of Beirut • Tarcisio Abreu Saurin, UFRGS • Thais Alves, San Diego State University • Malak Al Hattab, American University of Beirut
viii
• Hasnaa Al Hussein, American University of Beirut • Luis Alarcón, Pontificia Universidad Católica de Chile • Panagiotis Angeloudis, Imperial College London • Ricardo Antunes, University of Auckland • Paz Arroyo, Pontificia Universidad Catolica de Chile • Sigmund Aslesen, Veidekke • Marcelo Azambuja, Southern Illinois University Edwardsville • Glenn Ballard, University of California, Berkeley • Mohammad Barakat, American University of Beirut • Audrey Bascoul, University of California, Berkeley • Dayana Bastos Costa, Federal University of Bahia • Nigel Blampied, University of California Berkeley • Trond Bolviken, Veidekke Entreprenør AS • Xavier Brioso, Pontifical Catholic University of Peru • Rafaella Broft, Arpa Training & Consultancy • David Kim Huat Chua, National University of Singapore • Stephen Coates, University of Salford • Piers Connor, PRC Rail Consulting Ltd. • Ype Cuperus, Delft University of Technology • Zakaria Dakhli, École Centrale de Lille • Patrick Dallasega, Free University of Bozen-Bolzano • Emmanuel Itodo Daniel, Nottingham Trent University
• Bhargav Dave, Aalto University
• Frode Drevland, Norwegian University of Science and Technology • Paul Ebbs, Nottingham Trent University • Fatima El Sakka, American University of Beirut • Jan Elfving, Skanska • Fidelis Emuze, Central University of Technology, Free State • Lincoln Forbes, East Carolina University • Daniel Forgues, ETS • Carlos Formoso, UFRGS • Roar Fosse, Skanska Norway • Adam Frandson, University of California Berkeley • Vicente Gonzalez, University of Auckland • Ariovaldo Denis Granja, Universidade Estadual de Campinas • Ralph Hage, American University of Beirut • Shervin Haghsheno, Karlsruhe Institute of Technology • Farook Hamzeh, American University of Beirut

ix
• Eduardo Luis Isatto, Universidade Federal do Rio Grande do Sul • Yuanshen Ji, University of Texas • Mike Kagioglou, University of Hudddersfield • Danny Kahler, KEG • Bo Terje Kalsaas, University of Agder • Arto Kiviniemi, University of Liverpool • Vegard Knotten, NTNU / Veidekke • Chien-Ho Ko, National Pingtung University of Science and Technology • Samuel Korb, Technion - Israel Institute of Technology • Lauri Koskela, University of Huddersfield • Ola Lædre, Norwegian University of Science and Technology • Zoubeir Lafhaj, École Centrale de Lille • Nadia Lehoux, Université Laval • Fernanda Leite, University of Texas at Austin • David Long, Lean Project • Ming Lu, University of Alberta • Ling Ma, Technion - Israel Institute of Technology • Rehan Masood, University of Auckland • Salvio Melo, Universidade Federal do Rio Grande do Norte • Luciana Miron, UFRGS • Raphael Negri Milion, Federal University of São Carlos • Ralf-Uwe Modrich, Webcor • Claudio Morgues, Pontificia Universidad Catolica de Chile • Hylton Olivieri, Aalto University • Danilo Fernando de Oliveira Gomes, University of Huddersfield • Pablo Orihuela, Pontificia Universidad Católica del Perú / MOTIVA S.A. • Kristen Parrish, Arizona State University • Christine Pasquire, Nottingham Trent University • Antti Peltokorpi, Aalto University • Ergo Pikas, Tallinn University of Technology • Lynn Rizk, American University of Beirut • Cecilia Rocha, UFRGS • Zofia Rybkowski, Texas A&M University • Ralph Salazar, Texas A&M University • Olli Seppannen, Aalto University • Annett Schöttle, Karlsruhe Institute of Technology • Bolivar Senior, Colorado State University • James Smith, Brigham Young University

x
• Lucila Sommer, UFRGS • Laurie Spitler, Autodesk • Muzafar Thameem, Texas A&M University • Patricia Tillman, UFRGS/Berkeley • Iris Tommelein, University of California, Berkeley • Cynthia Tsao, Navilean • Patricia Tzortzopoulos, University of Huddersfield • Daniela Viana, UFRGS • Ruben Vrijhoef, Delft University of Technology • Kenneth Walsh, San Diego State University • Nina Weinheimer, University of Stuttgart • Justin K.W. Yeoh, National University of Singapore • Fei Ying, Auckland University of Technology
OTHER CHAIRS
INDUSTRY DAY: Yiannis Xenidis, Aristotle University of Thessaloniki Ronen Barak, Tidhar Construction Inc.
BIM SUMMER SCHOOL: Lucio Soibelman, University of Southern California LEAN SUMMER SCHOOL: Bhargav Dave, Aalto University INNOVATION COMPETITION: Alan Hore, Dublin Institute of Technology PUBLICATIONS: Markus König, Ruhr-Universität Bochum
Thais Alves, San Diego State University PUBLICITY: Kleopatra Petroutsatou, Aristotle University of
Thessaloniki VIDEO PROCEEDINGS: Timo Hartmann, Technische Universität Berlin
ADDITIONAL SUPPORT
ASSISTANT PROGRAMME CHAIR: Enrique Valero, Heriot-Watt University VIDEO-PROCEEDINGS EDITORS: Erez Dror, Technion Israel Institute of Technology
Steve Vick, University of Cambridge Shmuel Korb, Technion Israel Institute of Technology Evangelia Agapaki, University of Cambridge Ruodan Lu, University of Cambridge
xi
CONTENTS
LC3 PREFACE ....................................................................................... III
IGLC PREFACE ..................................................................................... V
ACKNOWLEDGEMENTS ....................................................................... VII
CONTENTS ........................................................................................... XI
AUTHORS INDEX ................................................................................ XXI
PART 1
CONTRACT & COST MANAGEMENT ............................................ 1
Discrete Costing Versus Collaborative Costing ............................................................... 3
Sa'id Ahmed, Christine Pasquire and Emmanuel Manu
Impact of Supplier Evaluation on Product Quality ........................................................ 11
Thais Alves, Panthil Desai, Kim Needy, Ashleigh Hegwood and Sean Musick
Testing the Value of Best Value ........................................................................................ 19
Gerald Eke and Dr. John Elgy
Investigating Organizational Capability vis-à-vis Human Action to Minimize Post-Contract Transaction Costs in D&B Projects ................................................................. 27
Christy P. Gomez and Abdulazeez Umar Raji
Design-Build and Design-Bid-Build in Construction- A Comparative Review ....... 35
Titouan Plusquellec, Nadia Lehoux and Yan Cimon
Applying Choosing by Advantages in the Public Tendering Procedure ................... 45
Annett Schöttle, Paz Arroyo and Christine Haas Georgiev

xii
Motives for the Use of Competitive Dialogue ................................................................. 53
Paulos Wondimu, Jardar Lohne and Ola Lædre
A comparison of project alliancing and lean construction ........................................... 61
Brendan Young, Ali Hosseini and Ola Lædre
ENABLING LEAN WITH INFORMATION TECHNOLOGY ........ 69
Application of BIM for Supporting Decision-Making Related to Logistics in Prefabricated Building Systems ......................................................................................... 71
Fernanda S. Bataglin, Daniela D. Viana, Carlos T. Formoso and Iamara R. Bulhões
Integration of Lean Construction and Building Information Modeling in a Large Client Organization in Massachusetts .............................................................................. 79
Marzia Bolpagni, Luciana Burdi and Angelo Luigi Camillo Ciribini
Contribution of Information Technologies to Last Planner System Implementation ..................................................................................................................... 87
Camilo Ignacio Lagos, Rodrigo Fernando Herrera and Luis Fernando Alarcón
Integration of Lean and Information Technology to Enable a Customization Strategy in Affordable Housing ......................................................................................... 95
Eder Martinez, Iris D. Tommelein and Ariana Alvear
Development of Systematic Construction Logistics Using 'Intelligent Product' .... 103
Saeed Mirzaeifar, Bhargav Dave and Vishal Singh
Integrating BIM and Agent-Based Modelling for Construction Management Optimization ........................................................................................................................ 111
Francesco Livio Rossini, Francesco Rossini and Antonio Fioravanti
IT for Lean Construction - A Survey in India ............................................................... 119
Jyoti Singh, Mohit Mangal and Jack C.P. Cheng
Lean Production Controlling and Tracking Using Digital Methods ......................... 127
Jakob von Heyl and Jochen Teizer
LEAN THEORY .............................................................................. 135
Assessing the Impact of Lean Methods in Mining Development Projects .............. 137
Cristóbal Baladrón and Luis F. Alarcón

xiii
Ethical Dilemmas in Value Delivery: Theoretical Conditions ................................... 145
Frode Drevland, Jardar Lohne and Ole Jonny Klakegg
Assessment of Performance Measurement Frameworks Supporting the Implementation of Lean Construction ........................................................................... 153
Alexandros Hatzigeorgiou and Odysseas Manoliadis
A Portfolio/Process/Operations (PPO) Analysis of a Meta-Project Production System in Renovation Projects ........................................................................................ 161
Samuel Korb, Rafael Sacks and Otto Alhava
On Epistemology of Construction Engineering and Management ........................... 169
Lauri Koskela, Ergo Pikas, Jarkko Niiranen, Andrea Ferrantelli and Bhargav Dave
Platform Ecosystems: Unlocking the Subcontractors’ Business Model Opportunities ....................................................................................................................... 177
Enni Laine, Otto Alhava, Antti Peltokorpi and Olli Seppänen
An Application of Control Theory to Visual Management for Organizational Communication in Construction ..................................................................................... 185
Koichi Murata, Algan Tezel, Lauri Koskela and Patricia Tzortzopoulos
Hierarchy of Value Perceived by Groups of Users about Their Neighbourhood ... 193
Michelle Nascimento Da Silva and Luciana Miron
Integrating Delivery of a Large Hospital Complex ...................................................... 201
Dean Reed, Howard Ashcraft, Atul Khanzode, Martin Fischer, Leonardo Rischmoller and Peter Berg
Removing Waste while Preserving Slack: The Lean and Complexity Perspectives ......................................................................................................................... 209
Tarcisio Abreu Saurin
Application of Lean Production with VSM to the Blasting and Coating Industry 217
Wenchi Shou, Jun Wang, Peng Wu, Xiangyu Wang and Yongze Song
PEOPLE, CULTURE, & CHANGE ......................................................... 225
Learning Simulation Game for Takt Planning and Takt Control ............................. 227
Marco Binninger, Janosch Dlouhy, Svenja Oprach and Shervin Haghsheno
The Implementation of Building Information Modeling and Lean Construction in Design Firms in Massachusetts and its Correlation with Client's Requirements .. 235
Marzia Bolpagni, Luciana Burdi and Angelo Ciribini

xiv
Features, Roles and Processes of Performance Measurement in Lean Construction ........................................................................................................................ 243
Luis Felipe Cândido and José De Paula Barros Neto
Mobilizing BIM in a Collaborative Project Environment ........................................... 251
William Collinge and John Connaughton
Comparing Choosing by Advantages and Weighting, Rating and Calculating Results in Large Design Spaces ....................................................................................... 259
Maria Gabriela Correa Albornoz, Paz Arroyo, Claudio Mourgues and Forest Flager
Initial Euphoria to Sustained Change - Mainstreaming Lean Culture ..................... 267
Venkata Santosh Kumar Delhi, Raghavan N, Ashwin Mahalingam and Koshy Varghese
Implementation of Lean Construction in Client Organizations – An Analysis of the Status Quo ............................................................................................................................ 275
Janosch Dlouhy, Marco Binninger, Lisa Weichner and Shervin Haghsheno
Geographical Distribution in the Scientific Field of Lean Construction ................. 285
Atle Engebø, Frode Drevland, Nawras Shkmot, Ola Lædre and Jardar Lohne
How Research Can Help Transform the Construction Industry ............................... 293
Fritz Gehbauer, Glenn Ballard and Margarita Leonova
Socio-Constructivist Account of Collaboration in Concept Design ......................... 301
Danilo Gomes, Patricia Tzortzopoulos and Mike Kagioglou
Building a Lean Culture .................................................................................................... 309
Cory Hackler, Erika Byse, Dean Reed and Thais Alves
Cross-Functional Project Teams in Construction: A Longitudinal Case Study .... 317
Jean Laurent and Robert Leicht
Bottom-Up Strategy for Lean Construction On Site Implementation ...................... 325
Nero Lenotti Zanotti, Flávio Leal Maranhão and Vitor Levy Castex Aly
Strategies that Can Help Transform the Construction Industry ............................... 333
Margarita Leonova, Glenn Ballard and Fritz Gehbauer
Barriers and Challenges to Implement Integrated Project Delivery in China ........ 341
Shan Li and Qiuwen Ma
Design-Value in the Platform Approach ...................................................................... 349 Duncan W. Maxwell and Mathew Aitchison

xv
A Lean Construction Maturity Model for Organizations .......................................... 357 Claus Nesensohn
Shared Understanding: The Machine Code Of the Social in a Socio-Technical System ................................................................................................................................. 365
Christine Pasquire and Paul Ebbs
House of Cards – a Simulation of Lean Construction Principles ............................. 373 Paul Pollesch, Alexander Rovinsky, Raul Alvarado Iii and Thais Alves
Re(de)fining Project Delivery with Life Cycle BIM .................................................... 381 Adam Rendek
Automation of the Building Information Model Breakdown Structure .................. 389 Leonardo Rischmoller, Tony Dong, Martin Fischer and Atul Khanzode
Improving On-Site Meeting Efficiency by Using an Automated Model Breakdown Tool ...................................................................................................................................... 397
Leonardo Rischmoller, Tony Dong, Martin Fischer and Atul Khanzode
An Exploration of Compatibility of U.S. Army Culture and Lean Construction .. 405 Ralph Salazar, Zofia Rybkowski and Glenn Ballard
Knowledge Management and Information Flow through Social Networks Analysis in Chilean Architecture Firms ........................................................................................ 413
Lluís Segarra, Rodrigo Fernando Herrera, Luis Fernando Alarcón and Eugenio Pellicer
Implementation of Lean Practices among Finishing Contractors in the US .......... 421 James Smith and Khoi Ngo
Analysis and Assessment for Lean Construction Adoption: the DOLC Tool ....... 429 Bruno Soares De Carvalho and Sergio Scheer
Design Thinking as a Method of Improving Communication Efficacy .................. 437 Laurie Spitler and Laura Talbot
Lean Anti-Corruption Toolkit ......................................................................................... 445 Ahmed Stifi, Fritz Gehbauer and Sascha Gentes
Delivery Methods and Social Network Analysis of Unethical Behavior in the Construction Industry ....................................................................................................... 453
Muzafar Thameem, Zofia Rybkowski and James P. Smith
xvi
PART 2
PRODUCT DEVELOPMENT & DESIGN MANAGEMENT ........ 463
Design Management: Metrics and Visual Tools .......................................................... 465 Hisham Abou-Ibrahim and Farook Hamzeh
Mapping Waste in the Structural Design Process of South African Projects ........ 475 Adefemi Aka, Fidelis Emuze and Dillip Das
Waiting Times in Design Process: A Case Study ....................................................... 483 João Bosco P. Dantas Filho, Mariana Monteiro Xavier De Lima, Luiz Fernando Mahlmann Heineck, Patricia Tzortzopoulos and José De Paula Barros Neto
A Taxonomy of Client Product Value in Construction Projects .............................. 491 Frode Drevland and Ole Jonny Klakegg
Virtual Design and Construction: Aligning BIM and Lean in Practice .................. 499 Roar Fosse, Glenn Ballard and Martin Fischer
Strategic Considerations for Applying Choosing by Advantages in Design Process ................................................................................................................................. 507
Zoya Kpamma, Theophilus Adjei-Kumi, Joshua Ayarkwa and Emmanuel Adinyira
The ER Design Simulation Game: Experience and Reflect ...................................... 515 Helena Lidelöw
Visual Planning in Design: The Effect of Pre-Engineering ...................................... 526 Helena Lidelöw and Gustav Jansson
How BIM-Lean Integration Enhances the Information Management Process in the Construction Design ......................................................................................................... 531
Sajedeh Mollasalehi, Anushka Rathnayake, Ahmed Aboumoemen, Jason Underwood, Andrew Fleming, Udayangani Kulatunga and Paul Coates
Design Management in a Design Office: Development of the Knowledge Base .. 539 Ergo Pikas, Lauri Koskela and Roode Liias
Design Management in a Design Office: Solving the Problem of Relevance ........ 547 Ergo Pikas, Lauri Koskela and Olli Seppänen
Design Management in a Design Office: Development of the Model for 'To-Be' 555 Ergo Pikas, Lauri Koskela and Olli Seppänen

xvii
A Case Study on the Success Factors of Target Value Design ................................. 563 Patricia Tillmann, Doanh Do and Glenn Ballard
Review of Lean Design Management: Processes, Methods and Technologies ...... 571 Petteri Uusitalo, Hylton Olivieri, Olli Seppänen, Ergo Pikas and Antti Peltokorpi
How Evidence-Based Design Supports Better Value Generation for End-Users .. 579 Yufan Zhang, Patricia Tzortzopoulos and Mike Kagioglou
PRODUCTION PLANNING & CONTROL ............................................. 587
Project Flexibility and Lean Construction .................................................................... 589 Glenn Ballard and Hajnalka Vaagen
Visualizing Daily On-Site Space Use ............................................................................. 597 Audrey Bascoul and Iris Tommelein
Technical Takt Planning and Takt Control in Construction .................................... 605 Marco Binninger, Janosch Dlouhy and Shervin Haghsheno
Adjustment Mechanisms for Demand-Oriented Optimisation in Takt Planning and Takt Control ....................................................................................................................... 613
Marco Binninger, Janosch Dlouhy, Dominik Steuer and Shervin Haghsheno
A Balanced Dashboard for Production Planning and Control .................................. 621 Trond Bølviken, Sigmund Aslesen, Bo Terje Kalsaas and Lauri Koskela
Lean Metric System: Proposal for a Performance Measurement System for Construction Projects ....................................................................................................... 629
Juliana Carneiro, André Carneiro, Vitor Machado, Luis Felipe Cândido and José De Paula Barros Neto
Last Planner System – the Need for New Metrics ...................................................... 637 Ghali El Samad, Farook Hamzeh and Samir Emdanat
A Construction Delay Analysis Approach Based on Lean Principles ..................... 645 Huseyin Erol, Irem Dikmen and M. Talat Birgonul
Probability Density Function for Predicting Productivity in Masonry Construction Based on the Compatibility of a Crew .......................................................................... 655
Laura Florez and Jean C. Cortissoz
Digital Kanban Boards Used in Design and 3D Coordination ................................. 663 Ralf-Uwe Modrich and Bruce Cousins
xviii
Real-Time Tracking of Production Control: Requirements and Solutions ............ 671 Hylton Olivieri, Olli Seppänen and Antti Peltokorpi
Introducing New Capacity Planning Metrics in Production Planning .................... 679 Lynn Rizk, Farook Hamzeh and Samir Emdanat
Phase Schedule Implementation and the Impact for Subcontractors ...................... 687 Flora Seixas Ribeiro, Dayana Bastos Costa and Pedro Antunes Magalhães
Guidelines for Devising and Assessing Visual Management Systems in Construction Sites ............................................................................................................. 695
Caroline Valente, Fernanda Brandalise, Marinna Pivatto and Carlos Formoso
PRODUCTION SYSTEM DESIGN ......................................................... 703
Comparing Production Design Activities and Location-Based Planning Tools .... 705 Clarissa Biotto, Mike Kagioglou, Lauri Koskela and Patricia Tzortzopoulos
Standardized Work: Practical Examples in a Brazilian Construction Company .. 713 Angela de Bortoli Saggin, Taynah Ramos Mota, Felipe Loiola Brito and Carlos Alexandre M. Do Amaral Mourão
Lean Equipment Installation - Potentials of Using Takt Planning and Takt Control in the Equipment Installation of Industrial Buildings ................................................ 721
Janosch Dlouhy, Willem Grobler, Marco Binninger and Shervin Haghsheno
A Framework of Five-Stream Production System for Megaprojects ........................ 729
Michael Ibrahim, Klas Berghede, David Thomack, Panos Lampsas, Dave Kievet and Awad Hanna
Simulation of Production Line Improvement in Modular Home Manufacturing .. 737
Chelsea Ritter, Youyi Zhang, Roger Dupuis and Mohamed Al-Hussein
Collaborative Takt Time Planning of Non-Repetitive Work ..................................... 745
Iris Tommelein
SUPPLY CHAIN MANAGEMENT & PREFABRICATION ......................... 753
Value Stream Mapping: A Case Study in Structural Masonry .................................. 755
Luane Assunção Paiva Melo, Victor França Cavalcanti de Lima and Savio Melo
Just in Time in Construction: Description and Implementation Insights ............... 763
Flora Bamana, Nadia Lehoux and Caroline Cloutier

xix
Exploring the Application of Lean Principles to a Construction Supply Chain ..... 771
Rafaella Broft
3D Concrete Printing in the Service of Lean Construction ........................................ 781
Fatima El Sakka and Farook Hamzeh
Lean Opportunity Assessment of Contractors Supply Chain in South Africa ....... 789
Fidelis Emuze, Tebatjo Masoga and Cornelius Sebetlele
Supply Chain Design for Modular Construction Projects .......................................... 797
Pei-Yuan Hsu, Marco Aurisicchio and Panagiotis Angeloudis
Counterfeit, Fraudulent and Sub-Standard Materials: The Case of Steel in Norway ................................................................................................................................. 805
Nina Eklo Kjesbu, Atle Engebø, Ola Lædre and Jardar Lohne
Optimization of Supply Logistics-Constrained Module Assembly Processes in Industrial Construction ..................................................................................................... 813
Jing Liu and Ming Lu
Value Stream Mapping: Case Study in Columns Concreting .................................... 821
Nayara Jhéssica Marques Da Fonsêca, Andrezza Vagnielly Coutinho Germando, Artur Moura and Savio Melo
Value Stream Mapping - A Case Study of Cold-Formed Steel House Framing for Offsite Manufacturing Supply Chain .............................................................................. 829
Rehan Masood, Vicente Gonzalez and James B.P. Lim
Prefabrication of Single-Family Timber Houses - Problem Areas and Wastes ...... 837
Djordje Popovic, Tobias Schauerte and Jimmy Johansson
Lean Construction in Small-Medium Sized enterprises (SMEs): An Exploration of the Highways Supply Chain ............................................................................................. 845
Algan Tezel, Lauri Koskela and Zeeshan Aziz
Development of a Materials Management Strategy to Enable Continuous Work Flow On-Site ........................................................................................................................ 853
Cynthia Tsao and Helena Lidelöw
Flow and Resource Efficiency Measurement Method in Off-Site Production ........ 861
Brian Wernicke, Helena Lidelöw and Lars Stehn
Key Performance Indictor for Managing Construction Logistics Performance ..... 869
Fei Ying and John Tookey

xx
Off-Site Guarding: Look-Ahead Supply Scheduling for Risk Indication with BIM ........................................................................................................................................ 877
Ningshuang Zeng, Markus König and Jochen Teizer
SAFETY, QUALITY, & THE ENVIRONMENT ........................................ 885
Analysis of the Influence of Lean Construction and LEED Certification on the Quality of Construction Sites ........................................................................................... 887
Thais Cunha and Mariana Lima
Why Lean Projects Are Safer ........................................................................................... 895
Gregory Howell, Glenn Ballard and Sevilay Demirkesen
Safety Performance Measurement Systems Based on Resilience Engineering: A Literature Review ............................................................................................................... 903
Guillermina Peñaloza, Carlos Formoso and Tarcisio Abreu Saurin
Green Building and Lean Management: Synergies and Conflicts ............................ 913
Nina Weinheimer, Sarina Schmalz and Daniela Müller

xxi
AUTHORS INDEX
Abou-Ibrahim, H. 465 Aboumoemen, A. 531 Adjei-Kumi, T. 507 Adinyira, E. 507 Ahmed, S. 3 Aitchison, M. 349 Aka, A. 475 Al-Hussein, M. 737
Alarcón, L.F. 87, 137,413 Alhava, O. 161, 177 Alvarado III, R. 373 Alvear, A. 95 Alves, T. 11, 309, 373 Angeloudis, P. 797 Antunes Magalhães , P. 687 Arroyo, P. 45, 259 Ashcraft, H 201 Aslesen, S. 621 Assunção Paiva Melo, L. 755 Aurisicchio, M. 797 Ayarkwa J., 507 Aziz, Z. 845 Baladrón, C. 137 Ballard, G.293, 333, 405, 499, 563, 589, 895 Bamana, F. 763 Barros Neto, J.D.P. 243, 629 Bascoul, A. 597 Bastos Costa, D. 687
Bataglin, F.S. 71 Berg, P. 201 Berghede, K. 729 Binninger, M. 227, 275, 605, 613, 721 Biotto, C. 705 Birgonul, M.T. 645
Bolpagni, M. 79, 235
Bølviken, T. 621 Brandalise, F. 695 Broft, R. 771
Bulhões, I.R. 71 Burdi, L. 79, 235 Byse, E. 309 Cândido L.F., 243, 629 Carneiro, A. 629 Carneiro, J. 629
Cheng, J.C.P. 119 Cimon, Y. 35 Ciribini, A. 79, 235 Cloutier, C. 763 Coates, P. 531 Collinge, W. 251 Connaughton, J. 251 Correa Albornoz, M.G. 259 Cortissoz, J.C. 655 Cousins, B. 663 Coutinho Germando, A.V. 821 Cunha, T. 887 Dantas Filho, J.B.P. 483 Das, D. 475
Dave, B. 103, 169 De Bortoli Saggin, A. 713 Delhi, V.S.K. 267 Demirkesen, S. 895
Desai, P. 11 Dikmen, I.D. 645 Dlouhy, J. 227, 605, 613, 721 Do Amaral Mourão, C.A.M. 705 Do, D. 563 Dong, T. 389, 397 Drevland, F. 145, 285, 491 Dupuis, R. 737
xxii
Ebbs, P. 65 Eke, G. 19 El Sakka, F. 781 El Samad, G. 637
Elgy, J. 19 Emdanat, S. 637, 679 Emuze, F. 475, 789 Engebø, A. 285, 805 Erol, H. 645 Fernando Herrera, R. 413 Ferrantelli, A. 169 Fioravanti, A. 111 Fischer, M. 201, 389, 397, 499 Flager, F. 259 Fleming, A. 531 Florez, L. 655
Formoso, C.T. 71, 695, 903 Fosse, R. 499 França Cavalcanti de Lima, V. 755 Gehbauer, F. 293, 333, 445 Gentes, S. 445 Gomes, D. 301
Gomez, C.P. 27 Gonzalez, V. 829 Grobler, W. 721 Haas Georgiev, C. 45 Hackler, C. 309 Haghsheno, S. 227, 275, 605, 613, 721 Hamzeh, F. 465, 637, 679, 781 Hanna, A. 729 Hatzigeorgiou, A. 153 Hegwood, A. 11 Heineck, L.F.M. 483 Herrera, .F. 87, 413 Hosseini, A. 61 Howell, G. 895 Hsu, P. 797 Ibrahim, M. 729 Jansson, G. 523 Johansson, J. 837
Kagioglou, M. 301, 579, 705 Kalsaas, BT. 621 Khanzode, A. 201, 389, 397 Kievet, D. 729 Kjesbu, N.E. 805 Klakegg, O.J. 145, 491 König, M. 877 Korb, S. 161 Koskela, L.169, 185, 539, 547, 555, 621, 705, 845 Kpamma, Z. 507 Kulatunga, U. 531 Lædre, O. 53, 61, 285, 805 Lagos, C.I. 87 Laine, E. 177 Lampsas, P. 729 Laurent, J. 317 Leal Maranhão, F. 325 Lehoux, N. 35, 763 Leicht, R. 317 Lenotti Zanotti, N. 325 Leonova, M. 293, 333 Levy Castex Aly, V. 325 Li, S. 341 Lidelöw, H. 515, 523, 853, 861 Liias, R. 539 Lim, J.B.P. 829 Lima, M.M.X.D. 483, 887 Liu, J. 812
Lohne, J. 53, 145, 285, 805 Loiola Brito, F. 713 Lu, M. 813 Ma, Q. 341 Machado, V. 629 Mahalingam, A. 267 Mangal, M. 119 Manoliadis, O. 153 Manu, E. 3 Marques Da Fonsêca, N.J. 821 Martinez, E. 95

xxiii
Masoga, T. 789 Masood, R. 829 Maxwell, D. W. 349 Melo, S. 755, 821 Miron, L. 193 Mirzaeifar, S. 103 Modrich, R. 663 Mollasalehi, S. 531 Moura, A. 821 Mourgues, C.T. 259 Müller, D. 913 Murata, K. 185
Musick, S. 11 N, R. 267 Nascimento Da Silva, M. 193 Needy, K. 11 Nesensohn, C. 357 Ngo, K. 421 Niiranen, J. 169 Olivieri, H. 571, 671 Oprach, S. 227 Pasquire, C. 3, 365 Pellicer, E. 413 Peltokorpi, A. 177, 571, 671 Peñaloza, G. 903 Pikas, E. 169, 539, 547, 555, 571 Pivatto, M. 695 Plusquellec, T. 35 Pollesch, P. 373 Popovic, D. 837 Ramos Mota, T. 713 Rathnayake, A. 531 Reed, D. 201, 309 Rendek, A. 381 Rischmoller, L. 201, 389, 397 Ritter, C. 737 Rizk, L. 679
Rossini, F.L. 111 Rovinsky, A. 111, 373 Rybkowski, Z. 405, 453
Sacks, R. 161 Salazar, R. 405 Saurin, T.A. 209, 903 Schauerte, T. 837 Scheer, S. 429 Schmalz, S. 913
Schöttle, A. 45 Sebetlele, C. 789 Segarra, L. 413 Seixas Ribeiro, F. 687 Seppänen, O. 177, 547, 555, 571, 671 Shkmot, N. 285 Shou, W. 217 Singh, J. 119 Singh, V. 103 Smith, J.P. 421, 453 Soares De Carvalho, B. 429 Song, Y. 217 Spitler, L. 437 Stehn, L. 861 Steuer, D. 613 Stifi, A. 445 Talbot, L. 437 Teizer, J. 127, 877 Tezel, A. 185, 845 Thameem, M. 453 Thomack, D. 729 Tillmann, P. 563 Tommelein, I.D. 95, 597, 745 Tookey, J. 869 Tsao, C. 853 Tzortzopoulos, P. 185, 301, 483, 579, 705 Umar Raji, A. 27 Underwood, J. 531 Uusitalo, P. 571 Vaagen, H. 589 Valente, C. 695

xxiv
Varghese, K. 267 Viana, D.D. 71 von Heyl, J. 127 Wang, J. 217 Wang, X. 217 Weichner, L. 275 Weinheimer, N. 913 Wernicke, B. 861
Wondimu, P. 53 Wu, P. 217 Ying, F. 869 Young, B. 61 Zeng, N. 877 Zhang, Y. 579, 737

CONTRACT AND COST MANAGEMENT TRACK
Track Chair:
Paz Arroyo
Pontificia Universidad Catolica de Chile
1 | Proceedings IGLC | July 2017 | Heraklion, Greece

2 | Proceedings IGLC | July 2017 | Heraklion, Greece

Namadi, S., Pasquire, C., and Manu, E. (2017). “Discrete Costing Versus Collaborative Costing.” In: LC3 2017 Volume II – Proceedings of the 25th Annual Conference of the International Group for Lean Construction (IGLC), Walsh, K., Sacks, R., Brilakis, I. (eds.), Heraklion, Greece, pp. 3–10. DOI: https://doi.org/10.24928/2017/0341
DISCRETE COSTING VERSUS COLLABORATIVE COSTING
Sa’id A. Namadi1 , Christine Pasquire2, and Emmanuel Manu3
Abstract: The UK construction industry has witnessed a recent shift towards integrated and collaborative approaches. Such collaborative efforts include the use of integrated systems like BIM, lean and innovative procurement options which are now reshaping project delivery systems. However, in the UK, most efforts have focused primarily on the conventional project management system, which is coherent and contract-based and has brought the separation in the processes of costing/design and production. In fact, cost and design processes are still treated as independent and separate functions which are carried out discretely within the current project delivery system. This neglect, and the lack of a holistic and collaborative approach in costing, arguably accounts for much of the cost overrun that is still prevalent in the UK industry. Traditionally, cost management has been the chief duty of Quantity Surveyors (QSs) in the UK. Recently, Target Value Design (TVD) has emerged as a management approach under the lean philosophy that aims to deliver exactly what the customer needs in terms of value within stipulated project constraints. The technique is aimed at making the budget become an input in the design and decision making process rather than an outcome of a design. The growth of collaborative approaches such as TVD opens new opportunities for project participants to deliver more value for clients and work collaboratively. This paper reports on the literature review that aimed at developing a framework to improve the current cost management practice towards a more collaborative system against the existing discrete form of costing that inhibits collaboration.
Keywords: Discrete Costing, Collaborative Costing, Target Value Design, Cost Management, Quantity Surveying.
1. INTRODUCTION For many years now, UK construction industry has had several reports and recommendations by industry practitioners and government, stressing on collaborative working, value addition and the use of collaborative approaches to streamline design and construction processes (Egan, 1998, 2002; Latham, 1994). Among other targets set by the industry in the (Construction 2025 report HM Government, 2013) were cost reduction in the initial cost of construction and the whole life cost of built assets. In view of that, the UK government are now advocating for more collaborative approaches where project actors and processes are fully integrated (Sunil et al, 2013).
Lean construction as a collaborative system has been proposed to the industry as an antidote to many of the challenges faced, that aimed at transforming construction model
1PhD Research Student, Centre for Lean Projects, School of Architecture, Design and Built Environment, Nottingham Trent University, UK, +44(0)7592030388 sa’[email protected] 2Professor, School of Architecture, Design and Built Environment, and Director Centre for Lean Projects, Nottingham Trent University, UK, +44(0) 115 848 2095 [email protected] 3 Senior Lecturer, School of Architecture, Design and Built Environment, Projects, Nottingham Trent University, Nottingham NG1 4FQ, UK, +44(0) 7735083823 [email protected]
3 | Proceedings IGLC | July 2017 | Heraklion, Greece
Discrete Costing Versus Collaborative Costing
and delivery approach (Mossman, 2009). But, the lack of collaboration has proved to be a major challenge for the industry which has dominated the processes of design, planning and execution (Daniel et al, 2015). It worsens in the areas of cost management where cost target are still set by the client’s advisors in isolation who take sole ownership of cost advice.
Although, in 2012 there were efforts to improve collaboration in terms of costing that led to the introduction of new procurement models like cost-led procurement, integrated project insurance and two stage open book (cabinet office, 2014). Yet, they are still not patronised within the industry.
The alternative view is illustrated in the target value design (TVD) approach, which is derived from target costing as a management approach that allows cost to act as an input to design where the design process itself constantly updates the cost to align with client needs and constraints (Kaushik et al, 2014). Despite that, research has indicated no evidence of its implementation in the UK construction. Moreover, clients are still dissatisfied with project performances repeatedly exceeding the agreed budget and time parameters. (HM Government 2013). These consequences were also marched in Zimina et al (2012) who confirmed that the costing process (cost planning) in the UK, is still based on market driven estimates instead of the business case, which overturns the essence of value creation and encourages the use of contingencies.
Taking inspiration from the research above, this study aims to explore the idea of collaborative costing in contrast with the traditional cost management system using TVD as an exampler. Therefore, the study will focus on the costing and design interfaces. The next sections will present the methods adopted, review the current forms of costing and propose two distinct approaches (discrete and collaborative). This will be followed with analysis on how budgets are set from the two models, and a discussion of the differences and benefits.
2. METHODOLOGY The study reviews literature including published case studies of collaborative costing using TVD. This approach enables the current theory to be established in order to identify the ways costing processes are managed, understood and delivered. To achieve this, the study compares and contrasts the conventional cost management process in the UK, which is more discrete, and lean costing approaches using TVD as an exampler of a collaborative costing approach.
3. LITERATURE REVIEW
3.1 COLLABORATIVE COSTING WITHIN TVD
TVD was adopted from target costing which originates from the manufacturing industry in the 1930’s (Feil et al, 2004). The process was used by manufacturers and customers to manage product profitability (Cooper & Slagmulder, 1997). The main logic behind the process was to allow cost and value to anchor the design process instead of calculating cost after the design is complete (Tommelein & Ballard, 2016). The term was first used by Hal Macomber, Greg Howell and Jack Barberio in 2007 after the adoption of target costing into the construction environment (Macomber, et al, 2007). But it was first spotted in the Tostrud Fieldhouse project at St Olaf College, USA by the Boldt Company in 2002.
4 | Proceedings IGLC | July 2017 | Heraklion, Greece

Sa’id Ahmed Namadi, Christine Pasquire and Emmanuel Manu
TVD as a management approach flourish under collaborative environment where the client and project participants are all involved in a discussion to generate the values required (time, cost, features etc.) within the project constraint
According to Macomber et al (2007) TVD has five certain principles that allow collaborative approaches to flourish during project delivery. These principles are:- (a) target costing setting – This is where instead of estimating based on detailed design, the concept focuses more on detailed estimate; (b) collaboration – Instead of designing and then converging later for a group reviews and decisions, the concept emphasize on working together to define the issues and produce decisions then design to those decisions; (c) colocation – Instead of working in silos and separate rooms as prevailed traditionally, the method advocates for working in pairs or large groups and face to face; (d) Set based design – Rather than narrow choices to proceed with design, it allows several alternative solutions set far into the design process, where choosing by advantages is asserted, which allow the selection of different alternatives when multiple factors and criteria are being considered; (e) Work Structuring – Instead of evaluating the constructability of a design, it allows for designing what is constructible.
These succinct arrangements have created a common understanding, teamwork that allows a clear path to waste elimination in the processes of costing and design (Rubrich, 2012). These elements embedded with the method has clearly illustrate TVD as an example of collaborative costing. Therefore, it can be argued that collaborative costing (CC) is a relational system that stems from commitments and transparency, where trust is drastically improved and teams collaborate to effectively deliver projects. It is based on an open and honest interaction around cost between supply chain members working together with the production team to set the target cost and the allowable profit. This system is increasingly being used in the US construction industry aimed at achieving the maximum value while setting costs target lower than the market benchmark price (Ballard, 2012).
The TVD models as depicted in figure 1, 2 & 3 below shows a clear definition of CC approach and how it begins under a TVD setting. The process start with team assembly researching on the product and the money available as per the business case which is called allowable cost (AC). It then proceeds on to determine the market cost (MC) which is identified through a detailed collaborative benchmarking, where the selected team work extensively on the feasibility study to revealed the estimated maximum price for the project.
Based on that, the target cost is set and a common risk and profit pool is used to derive innovation through pain-gain share commercial mechanism (Ballard, 2012). At this stage, the cost and value are extended from assets level to the system level and managed concurrently by the cross-functional teams (Zimina et al, 2012). Values created within the process are totally in line with cost information provided using (over the shoulder costing approach) which is conducted in close collaboration with the team members to avoid running beyond the target cost. Hereafter, the method stresses on process and team collaboration that sees the inclusion of key supply chain member right from the outset.
This is clearly highlighted in the model figure 2 below, which illustrates the integrated team formation early on, that validates the cost target in relation to what the client is willing to build within (AC) using set base design alternative to steer the target below the (AC) and the stakeholders work within market constraints. Notably, in this model, the costing pressure is always downward working back to the design which allow excess savings to be reinvested. Designs are then created to meet the detail estimate rather than creating a detail estimate around a preliminary design. Significantly, the customer is not
5 | Proceedings IGLC | July 2017 | Heraklion, Greece

Discrete Costing Versus Collaborative Costing
the only client to the project as all information are shared early and the cross functional teams manage the costs with the inclusion of the supply chain during the product design.
Figure 1. Setting the Target Cost (Adapted from Kaushik et al, 2016).
Figure 2. Collaborative Costing Model Using TVD as an Example.
Beyond its transparency and collaboration, TVD has illustrated several benefits in projects, where costs worked are contained within the market price which makes the product competitive. Other advantages are; easier to design to target, easier to link design options to business objectives, more credible financial feasibility can be calculated, wastes are reduced and innovation (value creation) is promoted, life cycle costs impacts are considered at the design stage as well and owners get what they need within their affordability while service providers earn more when they increase value or decrease cost (Ballard, 2011). Thus, TVD is a cohesive approach in its entirety, that forester collaboration by increasing the level of shared understanding and communication among stakeholders (Russell-Smith et al, 2015).
3.2 DISCRETE COSTING WITHIN THE UK COST MANAGEMENT SYSTEM
Cost management has always been a primary function of the QSs in the UK. Its evolution began from the 17th century and was established as a practice by the royal institute of chartered surveyors (RICS) in the 1864 (Seeley and Winfield, 1999; Ashworth et al, 2014). Traditionally, the QSs offers cost advice and assist with alternative design solutions as well as on cost implications of design and procurement using the techniques of elemental cost planning and cost checking (Kirkham, 2007). Other duties include post contract cost management activities such as valuation, change management and valuing variation to final account (Ashworth, 2014).
However, both seminal reports of Latham (1994) and Egan (2002) have stressed on the absence of collaboration within projects and among participants which they believed has dented the industry’s image through several adversaries. Consequently, these adversaries and lack of collaboration has brought a divorce between the phases of design and production. Evidently now, project actors such as designers, consultants and the supply
Collaborative Costing Process Using TVD Method
Conceptual Stage Criteria Design Stage Detail Design Stage Implementation Documents Agency Coordination/Final Buy-out
Team Assembly Owner, Designer,
Design Consultants, Constructors
Validating the Business Plan and
setting Targets Including Agency,
Engineers, GC & Trade Constructors
Go/ No Go
Organising Cluster Groups &
Elements
Setting the overall System
and TargetsInnovate in Design
Structure the work
Design to Targets
Develop Design & Detailed Engineering
Go/No GO
6 | Proceedings IGLC | July 2017 | Heraklion, Greece

Sa’id Ahmed Namadi, Christine Pasquire and Emmanuel Manu
chain continued to work in silos and isolation focusing more on profit ahead of the overall project benefit that eventually reduces project value (Hanid et al, 2011). This separation has continued even in the current cost planning process, where the norm has always been design-estimate-redesign, with gaps and disconnects that leads to project delays, conflicts, ambiguities and value loss (Doloi, 2011; Kashiwagi & Savicky, 2000). It is even more prominent with cost consultants acting on behalf of clients (QSs) providing cost advice almost in total isolation without any input from the supply chain making project estimates mostly unrealistic. In fact, it is a commonplace now within this process that clients exert most project risks on contractors and designers in order to have more control (Osipova & Eriksson, 2011) which has compounds more wastes to production and encourage opportunistic behaviours (Sarhan et al, 2014).
Consequently, the lack of collaboration caused by these separations has now constitute more pressure from both sides that encouraged the attitude of mining for more profit from both the client & contactors to safe guard their interests (Pasquire et al, 2015). A typical example can be seen using D&B project, where client QSs are responsible for the cost planning in the briefing stage, and at the concept stages the contractor’s QSs are responsible for developing their cost plans internally and separately from the client side. This arrangement contributes to their separation and hampers their integration that often see risks transferred disproportionately where every team is trying to safe guard their team interest (Sarhan et al, 2014). Hence, this has also brought a mentality on both sides focusing more on what the product design will be that revert more pressure on the costing process.
The model for cost management process is presented in figure 3 below. It follows the RIBA plan of work 2013, and conforms with the new rules of measurement (NRM) suite of documents (RICS, 2014). It traditionally starts with business case development at the strategic level through feasibility study. The concepts of cost planning, cost checks and the Bill of quantities are introduced to exercise the development of approximate estimate that are later feed into the design formation.
After the estimation, detailed designs are produced at the concept and developed stages, which is followed with an iterative process of cost planning and cost checking that is done discretely with no involvement of any member of the supply chain. As illustrated in fig 4 below, the process leading to budget setting and the eventual production stages is still based on competitive tendering i.e. design-estimate-redesign. This is where the practice focuses more on costing the design drawings (Kirkham, 2007) through cost planning and cost checks. If the design hit snag, then the process of redesign is activated through the iterative cycle to balance the project costs.
Although, the model indicates contractor’s inclusion in the costing process, but their involvement was very late and deep into the technical design. The procedure is almost run by the client’s team in total isolation without any supply chain involvement, the design is passed on to the cost consultants with little or no team interaction (Zimina et al, 2012). So, the targeted cost is rolled down to the constructors to work without all parties having a clear picture and certainty of what should be delivered and at what cost.
7 | Proceedings IGLC | July 2017 | Heraklion, Greece

Discrete Costing Versus Collaborative Costing
Figure 3. Cost Management Process UK Model Adapted from the RIBA Plan of
work 2013.
4. DISCUSSION It is a prerequisite and vital in the lean philosophy for project stakeholders to collaborate early especially when embarking on TVD. The logic is to be able to manage the product and design process concurrently and share the risk and rewards equally (Tommelein & Ballard, 2016). The fundamental difference between CC in relation to the common/dominant UK practice, is that collaborative costing ensures that design process is waste free using the TVD method to steer design, collaborate fully down to production as well as defined the customers’ requirements and value streams to accomplished the objectives and constraints of the project. It is further attributed with stakeholders and supply chain involvement right at the outset sharing a common goal and a desired objective. This is a distinctive component that is lacking from the traditional process where the separation between stakeholders and the commercial friction that leads to eventual value loss and cost overruns. Besides, most cost estimates in traditional projects increases as the design becomes more apparent. Significantly, the lack of transparency and collaboration, heavily conceals several information that could add value to the client in the costing process.
The collaborative costing model has reveal some benefits and opportunities that can be drawn to have an impact on the UK costing model. But, because of the divorce in the commercial setup in design/costing up to production stages, it has mounted a challenge on the teams that even wants to collaborate at these stages. However, some inspirations could still be drawn from the UK perspective on collaborative costing agenda, as there are models such as Cost-led Procurement that was introduce in the UK in 2012. Although the model is currently not patronised within the industry, but it certainly has the right framework that would allow the industry to use and develop innovative solutions in the current costing model. It could further drive out waste in all parts of the process while maintaining the key targets of cost, time and quality in customer terms.
However, TVD is not the only approach that is moving towards collaborative costing. There are other approaches such as the IPD in the US that integrates people, systems, business structures and practices into a more collaborative process to optimize project results and increase value, reduce waste and maximize efficiency throughout the phases of design, fabrication and construction. Others are the Cost-led Procurement that was
Traditional Costing Process (Discrete Costing) Based on the RIBA Plan StagesPre
paratio
n and
Brief
Strate
gic
Defini
tionCo
ncept D
esign
Devel
oped D
esign
Techni
cal &
Specia
list
Desig
nIdentify Business
CaseStrategic Investment
Decision
Develop Initial Project Brief
Feasibility Studies Approximate Cost Estimation Cost Evaluation
Developed Concept Design
Cost Planning 1 Process by Client
QS
Developed Construction
Strategy
Design WorkshopsStructural & Other
Design Development
Detailed Elemental Cost Planning 2
Change Control/ Cost Checking
Developed Project Strategy
Sub- Contractor Inclusion
Final Cost Checks
Review Designs by Lead designer
Bill of Quantities Production
Pre & Post tender Estimate
Assembling project Team
Cost Checking/ Change Control
Cost Checks and Remedial actions
Contract Sum
Iterative Process
Working In Silo Working in Silo
Iterative Process
Working in Silo
Iterative process Iterative Process
Iterative Process
8 | Proceedings IGLC | July 2017 | Heraklion, Greece

Sa’id Ahmed Namadi, Christine Pasquire and Emmanuel Manu
introduce in the UK in 2012 as a procurement method that allows industry to use and develop innovative solutions. Nonetheless, TVD is the most matured approach to collaborative costing ahead of the Cos-led Procurement that is still in its infancy stages. The idea of collaborative costing is well integrated within the lean philosophy and processes such as lean project delivery system, building information modelling, big rooms, pull planning among others. Significantly, the TVD model has been used as a matured approach in collaborative costing that continue to strive and change cultural behaviours and identify values and waste during cost management processes. Starting Point between discrete and collaborative form of costing
Discrete C
osting Ap
proach
Collaborat
ive Costin
g Appr
oach Product Research Target Profit Allowable CostsTarget Price Design
Product Research Design Cost Estimating Value Engineering Target Profit Market Price
Iterative working
The idea here is to determine what the product cost will be? working towards to design
However, the idea here focused on what should the product design be? Working towards to price
Target Costs
Figure. 4 Starting Point Between Discrete and Collaborative Form of Costing.
5. CONCLUSION
Managing cost is a fundamental principle in any construction activity. It ensures that the main objectives of a project (cost, quality and time) are achieved as planned while commercial processes are satisfied. However, there are differences in the way the UK costing systems delivered these services compared to the TVD approach. This paper considered mainstream cost management process within UK and TVD as an exampler of CC, and presented a process models that portray the practices within the two approaches. Although, the two models share few similarities, but there were significant difference and disconnects in the depth of services delivered from the UK model.
A major distinction is that the traditional UK costing system is discrete which reveals a separation between design/costing and production stages and therefore requires different approach of delivery in CC. The TVD approach was found based on collaboration that incorporate the use of relational contracts which promotes the collaboration of stakeholders in a project. Henceforward, this study has broadened our understanding on the intricacies of TVD as a collaborative costing approach which differs from the dominant practices in the UK. However, the limitation of the present study was based on literature review but urges future empirical studies in this area, potentially probing on the issues earlier highlighted in this paper. In stark comparison to the TVD cost model, the UK cost management practice is yet to adopt the essential ingredients that incorporate collaboration in its costing approach despite the introduction of Cos-led Procurement by the government in 2012. Indeed, TVD is a key component that allow effective collaboration and better project delivery.
6. REFERENCES Ashworth, A., Hogg, K. and Higgs, C. (2014) Willis’s practice and procedure for the
quantity surveyor. 13th edn. Oxford, UK: Blackwell Publishing. Ballard, G. and Reiser, P. (2004) The St. Olaf College Fieldhouse Project: a case study in
designing to target cost. Paper presented at the 12th Annual Conference of the International Group for Lean Construction, Elsinore, Denmark, 3–5 August.
Ballard, G. (2011) Target value design: current benchmark. Lean Construction Journal, 6, 79-84.
9 | Proceedings IGLC | July 2017 | Heraklion, Greece

Discrete Costing Versus Collaborative Costing
Ballard, G. Target value design. DS 70: Proceedings of design at the 12th International Design Conference, Dubrovnik, Croatia, 2012.
Cooper, R. and Slagmulder, R. (1997) Target Costing and Value Engineering, Productivity Press, Portland, OH. Egan Report (1998): Rethinking Construction: The Report of the Construction Task Force.
United Kingdom, pp 1-39. Hanid, M., Siriwardena, M., & Koskela, L. (2011). What are the big issues in cost
management? Paper presented at the 19th Annual Conference of the International Group for Lean Construction, Lima, Peru.
HM Government, (2013) Construction 2025. Industrial Strategy: government and industry in partnership., (July), p.78. Available at: http://www.bis.gov.uk
Kaushik, A., Keraminiyage, K., Koskela, L., Tzortzopoulos Fazenda, P. & Hope, G. (2014) Knowledge Transfer Partnership: Implementation of target value design in the UK
construction industry. Kirkham, R. (2007) Ferry and Brandon’s cost planning of buildings. 8th ed. Oxford, UK:
Blackwell Publishing. Latham, M., (1994) Constructing the Team: The Final Report of the government/Industry
review of procurement & contractual arrangements in the UK Construction Industry London: HMSO.
Macomber, H., Howell, G. & Barberio, J. (2007) Target-value design: Nine foundational practices for delivering surprising client value. AIA Practice Management Digest.
Mossman, A., (2009) Why isn’t the UK construction industry going lean with gusto? Lean Construction Journal. www.leanconstructionjournal.org
Pasquire C., S. Sarhan, A.King (2015) A critical review of the safeguarding problems in construction procurement: Unpicking the coherent current model. 23rd Annual conference of the Int’l group for lean Construction www.iglc.net
Rubrich, L. (2012) An introduction to lean construction: applying lean to construction organizations and processes, Fort Wayne, IN, WCM Associates LLC.
RIBA. (2013), RIBA Plan of work 2013: overview, published by RIBA, www.ribaplanofwork.com (Accessed: 3rd November 2013).
RICS (2014) RICS New rules of measurements, volume 3 - order of cost estimating and cost planning for building maintenance works. 1st edn. UK: RICS.
Sarhan, S., Pasquire, C., and King, A., (2014) Institutional waste within the construction industry: An outline. In: Proc. 22nd Ann. Conf. of the Int’l. Group for Lean Construction. Oslo, Norway, Jun 25-27.
Seeley, I.H. and Winfield, R. (1999) Building quantities explained. London: Macmillan Education Limited.
Tommelein, I.T and Ballard, G. (2016) Target Value Design: Manual of Practice Report: Project Production Systems Laboratory University of California, Berkeley Version I.5.
Zimina, D., Ballard, G. & Pasquire, C. (2012) Target value design: using collaboration and a lean approach to reduce construction cost. Construction Management and Economics, 30, 383398.
10 | Proceedings IGLC | July 2017 | Heraklion, Greece
Alves T.C.L., Desai P., Needy K.L., Hegwood A., and Musick, S. (2017). “Impact of Supplier Evaluation on Product Quality” In: LC3 2017 Volume II – Proceedings of the 25th Annual Conference of the International Group for Lean Construction (IGLC), Heraklion, Greece, pp. 11–18. DOI: https://doi.org/10.24928/2017/0268
IMPACT OF SUPPLIER EVALUATION ON PRODUCT QUALITY
Thais da C. L. Alves1, Panthil Desai2, Kim L. Needy3, Ashleigh Hegwood4, and Sean Musick5
Abstract: Supplier evaluation and engagement are regular topics in the Lean literature at large. It is well known that Toyota extensively works with suppliers to develop their work and capabilities, and provides challenges and feedback to suppliers so that they can achieve the quality requirements defined by the company. In the construction industry, companies conduct evaluations of suppliers, but practitioners cite numerous reasons why supplier evaluations are not constantly shared with suppliers. Moreover, the topic of supplier evaluation and how suppliers’ ratings affect the delivery of products free of defects to construction projects has not received much attention by the IGLC community. This paper presents results of a study, which underscores the importance of conducting supplier evaluation as a means to assure quality products are delivered to construction projects. Findings show that suppliers with low ratings, or who are not evaluated, are assigned more hours of inspection, as are suppliers who subcontract portions of their work. This practice translates not only into additional budgets required to inspect suppliers, but also additional management-related costs.
Keywords: Lean construction, supplier evaluation, nonconformances, quality.
1 INTRODUCTION The topic of supplier evaluation is usually discussed as part of materials management and procurement evaluations (Construction Industry Institute [CII] 1999), as well as studies related to risk analysis in construction projects (Monckza et al. 2016). Suppliers are usually evaluated prior to being hired to deliver a purchase order (PO) through the use of “formal supplier evaluation systems,” and contractors are more likely to have these systems than owners (CII 1999). Despite having formal systems to evaluate suppliers, a recent study by CII RT308 revealed that contractors are evenly split (54.4% yes vs. 45.6% no) when it comes to the use of prior supplier evaluation to make decisions about future purchases. Owners who participated in the same study were even less likely to use prior performance evaluations to base their decisions to award POs (Alves et al. 2016b). This current practice goes against Lean principles that promote the use of indicators and information to support a transparent management of value streams and 1 Associate Professor, J.R. Filanc Construction Engineering and Management Program, Dept. of Civil,
Constr., and Env. Engineering, San Diego State University, USA, [email protected] 2 Graduate Research Assistant, Dept. of Civil, Constr., and Env. Engineering, San Diego State
University, USA, [email protected] 3 Dean, Graduate School and International Education, University of Arkansas, Fayetteville, AR, USA,
[email protected] 4 Industrial Engineer, Former University of Arkansas student, Fayetteville, USA,
[email protected] 5 Director, Performance Excellence, MEI Technologies, Inc. (MEIT), Houston, TX, USA
11 | Proceedings IGLC | July 2017 | Heraklion, Greece

Impact of Supplier Evaluation on Product Quality
working with suppliers to promote continuous improvement. Supplier ratings are collected but, unfortunately, not much is done with them. This paper discusses results of a recent survey with construction companies in the Engineering Procurement and Construction (EPC) industry. Hypotheses are developed and tested to verify the relationship between supplier ratings, inspection hours, and final product quality.
2 LITERATURE REVIEW
Suppliers play an important role in the literature on Lean practices throughout multiple phases of a product life-cycle, from the development of suppliers, through product design, manufacturing, and distribution. Liker's Toyota Way (2003) describes at least three principles that directly relate to the discussion presented in this paper: Principle 5: Build a culture of stopping to fix problems, to get quality right at the first time; Principle 17: Respect your extended network of partners and suppliers by challenging them and helping them improve; and, Principle 18: Go and See for yourself to thoroughly understand the situation (Genchi Genbutsu).
Liker's (2003) principles 5 and 18 are also supported by the discussion presented by Rother (2010, p.181), who stresses the importance of process improvement at Toyota and how it responds to process abnormalities: the responses to process abnormalities should be immediate; and, the response to process abnormalities should come from someone other than the production operators. The former statement underscores the importance of dealing with problems as soon as they happen so that adjustments can be made before any targets are missed and before the problems grow bigger. This suggests that a team leader should be appointed to help teams proactively resolve these problems.
Before becoming a preferred partner at Toyota, suppliers often work closely with the company for many years before they are ever awarded a PO. Toyota has high expectations for its suppliers and, during the years before the award of a PO, suppliers learn about these expectations and how they will work in practice (Liker 2003). The literature on supplier evaluation shows that suppliers who are frequently evaluated, receive feedback about their performance, and know what is expected from them perform better and are more committed to their clients as they can adjust their processes to match clients’ requirements (Kannan and Tan 2002; Prahinski and Fan 2007). Moreover, Walsh et al.'s (2015) study in the EPC industry revealed that companies that communicate more often with suppliers, use supplier ratings, track indicators like cost and time spent on POs, and use suppliers with quality management systems tend to find nonconformances (NCs) early in the life of a PO, preventing these NCs from reaching construction projects.
In addition to these principles that can be used to support a healthy environment to respect and grow the capabilities of an extended network of suppliers, another principle outlined by Liker (2003) supports the discussion presented herein: Principle 1: Base your long-term management decisions on a long-term philosophy, even at the expense of short-term financial goals. The study presented in this paper illustrates how suppliers with low ratings are hired at the expense of product quality. This often happens because of low PO costs offered by these suppliers, and the practice adopted by some companies to compensate this deficiency is to assign additional inspection hours to a PO instead of working with suppliers to improve their capabilities.
12 | Proceedings IGLC | July 2017 | Heraklion, Greece
Thais da C. L. Alves, Panthil Desai, Kim L. Needy, Ashleigh Hegwood, and Sean Musick
3 RESEARCH METHOD
This study was developed as part of the extension work of the research team 308 (RT308) funded by the Construction Industry Institute (CII) from 2015-2016. RT308 membership included academics (co-authors of this paper) and industry practitioners (owners, EPC contractors [co-author], and suppliers) referred to subject matter experts (SMEs) in this paper. As part of the team’s goal to define ways for companies to determine the fabrication and inspection capabilities of suppliers, the team developed a survey (PO instrument), which was initially tested within the team, revised, and later distributed to the CII membership. The PO instrument was developed based on RT308’s previous work (Walsh et al. 2015) and adapted to address one single material: shop fabricated piping. The SMEs suggested that the team should be able to collect data on this product which is present in virtually any project they developed, and in future efforts the PO instrument could be adapted to collect data for other materials so that fabrication and inspection capabilities can be defined for them as well.
The PO instrument, fully available at Alves et al. (2016b), contained 28 questions organized into four main parts: contact data from the respondent (to clarify any questions about the responses) and project demographics (name, type, dollar value, role of the respondent); basic data about the single PO being used in each survey (reference number, number of spools dollar value of the PO, inspection hours budgeted, location of supplier facility, and criticality level of the PO); pre-award evaluation (level of inspection assigned, existence of supplier evaluation/reasons for doing or not doing so, pre-award supplier evaluation using criteria discussed later in this paper); and post-execution evaluation (inspection hours utilized, existence of subcontracting, final level of inspection, comparison between planned vs. actual hours of inspection, total number of pipe spools received for the PO, number of unplanned quality events, post –award supplier evaluation using criteria discussed later in this paper). The institutional review boards (IRBs) at San Diego State University and the University of Arkansas, Fayetteville approved the survey distribution and handling of data obtained, which also complied with CII guidelines for data collection and analysis.
3.1 Hypotheses Testing
RT308 developed the hypotheses outlined in Table 1 to investigate the relationship between certain practices and characteristics of the PO indicated by respondents. Only hypotheses related to supplier ratings and product quality are discussed in this paper. A full discussion of all hypotheses tested can be found in Alves et al. (2016b).
The Mann-Whitney (M-W) test, also known as Wilcox-Mann-Whitney test, was used to evaluate the hypotheses given that the data was not normally distributed. The M-W test is considered a statistically powerful test among all non-parametric tests (Field 2012).
Data entries submitted through Qualtrics (an online survey platform) were reviewed and questions were cleared with respondents. The analysis was developed using IBM SPSS and data was organized and analyzed using Field's (2012) recommendations. The questions used to conduct the analysis are also shown in Table 1.
13 | Proceedings IGLC | July 2017 | Heraklion, Greece
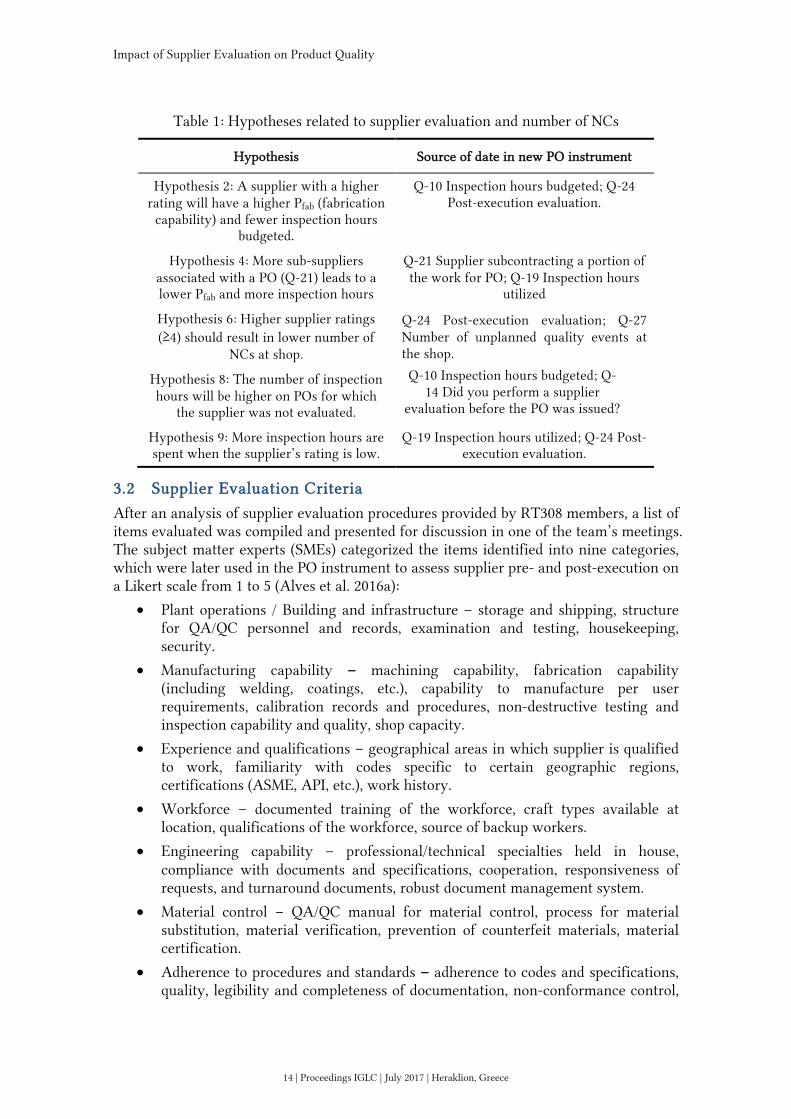
Impact of Supplier Evaluation on Product Quality
Table 1: Hypotheses related to supplier evaluation and number of NCs
Hypothesis Source of date in new PO instrument
Hypothesis 2: A supplier with a higher rating will have a higher Pfab (fabrication
capability) and fewer inspection hours budgeted.
Q-10 Inspection hours budgeted; Q-24 Post-execution evaluation.
Hypothesis 4: More sub-suppliers associated with a PO (Q-21) leads to a lower Pfab and more inspection hours
Q-21 Supplier subcontracting a portion of the work for PO; Q-19 Inspection hours
utilized
Hypothesis 6: Higher supplier ratings (≥4) should result in lower number of
NCs at shop.
Q-24 Post-execution evaluation; Q-27 Number of unplanned quality events at the shop.
Hypothesis 8: The number of inspection hours will be higher on POs for which
the supplier was not evaluated.
Q-10 Inspection hours budgeted; Q-14 Did you perform a supplier
evaluation before the PO was issued?
Hypothesis 9: More inspection hours are spent when the supplier’s rating is low.
Q-19 Inspection hours utilized; Q-24 Post-execution evaluation.
3.2 Supplier Evaluation Criteria
After an analysis of supplier evaluation procedures provided by RT308 members, a list of items evaluated was compiled and presented for discussion in one of the team’s meetings. The subject matter experts (SMEs) categorized the items identified into nine categories, which were later used in the PO instrument to assess supplier pre- and post-execution on a Likert scale from 1 to 5 (Alves et al. 2016a):
• Plant operations / Building and infrastructure – storage and shipping, structure for QA/QC personnel and records, examination and testing, housekeeping, security.
• Manufacturing capability – machining capability, fabrication capability (including welding, coatings, etc.), capability to manufacture per user requirements, calibration records and procedures, non-destructive testing and inspection capability and quality, shop capacity.
• Experience and qualifications – geographical areas in which supplier is qualified to work, familiarity with codes specific to certain geographic regions, certifications (ASME, API, etc.), work history.
• Workforce – documented training of the workforce, craft types available at location, qualifications of the workforce, source of backup workers.
• Engineering capability – professional/technical specialties held in house, compliance with documents and specifications, cooperation, responsiveness of requests, and turnaround documents, robust document management system.
• Material control – QA/QC manual for material control, process for material substitution, material verification, prevention of counterfeit materials, material certification.
• Adherence to procedures and standards – adherence to codes and specifications, quality, legibility and completeness of documentation, non-conformance control,
14 | Proceedings IGLC | July 2017 | Heraklion, Greece

Thais da C. L. Alves, Panthil Desai, Kim L. Needy, Ashleigh Hegwood, and Sean Musick
proper notification of inspection and hold points, Identification of parts – traceability.
• Safety adherence and record – written safety, health and environmental program, compliance to local/governmental safety and environmental requirements, experience modification Ratio (EMR), total recordable incidence rate (TRIR).
• Handling of subcontractors/sub-suppliers – outsourced/subcontracted product/service control, procedure to check subcontractor compliance with quality requirements, documented evidence of compliance, auditing subcontractors, ability to schedule and expedite subcontractors/sub-suppliers.
4 ANALYSIS OF RESULTS A total of 41 POs were received by RT308, however, not all submissions had answers to all questions, e.g., number of nonconformances at the site were not indicated, pre-award evaluation not available. This resulted in different numbers of POs being used to evaluate different questions. Only a few responses regarding pre-award supplier evaluation were submitted, however, most respondents had post-execution evaluations, which were used to analyze the hypotheses discussed in this paper. The team had originally hoped to evaluate differences between pre-award and post-execution, but due to the low number of data points for pre-award that was not possible. During both phases of RT308’s project, respondents to both PO surveys indicated multiple reasons for not evaluating suppliers (Alves et al. 2016a, b) including: supplier had been evaluated by owner of the project, evaluations had been updated with post-execution, existence of approved list of suppliers did not require additional evaluation, the client had issued the PO, and previous experience with the supplier.
4.1 Demographics
The data came from 10 companies representing 37 different projects. Out of that sample, owner companies submitted 10 POs (24%) and contractors submitted 31 (76%). One single company submitted 15 POs, and the authors understand that this is a limitation of this data set. The POs dollar values ranged from $255,000 to $50,660,888. The total dollar value of all submitted POs was $281,091,967. About 63% of the POs submitted had a dollar value between $1 million and $10 million, 20% were between $100,000 and $1 million, and 17% of the POs were over $10 million. The minimum number of spools in a single PO was 16 spools and the maximum number was 37,500 spools.
Among the 41 POs, about 90% of the POs were delivered by suppliers located in developed countries and 10% by suppliers in developing countries. For confidentiality reasons, the instrument did not collect data about the names of specific suppliers, only the location of the facility that manufactured the order was recorded. However, respondents indicated 19 specific cities, some of them appearing more than once, and others indicated only the country where the supplier’s facility was located (e.g., USA). Additionally, in 32% of the 41 POs, the supplier had subcontracted a portion of the PO. Data reveal that subcontracting is a common practice even for commodities such as shop fabricated piping. The analysis of the POs submitted revealed that 47.5% of the POs ended up with an inspection level higher than originally budgeted, 35% had a lower inspection level at the end, and only 17.5% had the inspection level to be equal to the budgeted level. The analysis revealed that inspection work was under planned for 14% of the POs submitted.
15 | Proceedings IGLC | July 2017 | Heraklion, Greece

Impact of Supplier Evaluation on Product Quality
4.2 Supplier rating cut-off: high vs. low ratings
Once the team started the analysis of the PO instrument data, a cut-off value of the 5-point Likert scale had to be selected to categorize high versus low supplier evaluations. At first, the cut-off value of 4 was chosen for high rating, and suppliers with a rating equal or higher than 4 would be considered highly rated, whereas anything below that would be treated as low rating. To confirm this decision, a sensitivity analysis was carried out to investigate if a different cut-off number should be used in the analysis.
The analysis used the supplier ratings for post-execution evaluation and the number of NCs found for a same PO. Cut-off values of 3, 3.5, 4, and 4.5 were evaluated and outliers were addressed. To see this detailed sensitivity analysis refer to Hegwood (2016). The analysis revealed that moving the cut-off to a supplier rating of 3 or 3.5 would allow too many data points where the specific PO had a high number of NCs associated with the product. Conversely, a cut-off rating of 4.5 left only a few suppliers with a low number of NCs. The lower the cut-off rate, the higher the number of discrepancies linking the numbers of NCs and the supplier ratings, and the higher the number of suppliers who would receive a good rating with a high number of NCs when compared to other suppliers in the sample. Finally, the analysis suggested that the cut-off rate of 4 was appropriate as suppliers with ratings of 4 and above did not consistently display a high number of NCs when compared to suppliers getting lower scores.
4.3 Analysis of Hypotheses
Table 2 shows the findings related to the hypotheses testing conducted by the team. Results are organized to indicate what matters when supplier ratings are considered. It is worth noting that the data used in this discussion was not normalized by the cost of the PO or the number of spools in a PO. When the data is normalized, results change in some cases (that is, results might not be significant). Results were discussed with the team’s SMEs and the non-normalized numbers presented herein where considered representative for this analysis. A full analysis can be found at Alves et al. (2016b).
The testing of Hypothesis 2 (a supplier with a higher rating will have a higher Pfab (fabrication capability) and fewer inspection hours budgeted) indicated that more inspection hours are budgeted when supplier ratings are low, that is lower than 4 (p=0.001, highly significant). Similarly, Hypothesis 4 (more sub-suppliers associated with a PO leads to lower Pfab and more inspection hours) was also confirmed (p=0.01, significant) as more inspection hours are used when portions of a PO are subcontracted.
Hypothesis 6 (higher supplier ratings should results in lower number of NCs at the shop) was confirmed as well (p=0.000, highly significant) as more NCs are found at the shop when the supplier rating, as measured using the criteria presented above, is low (below 4). Hypothesis 8 (the number of inspection hours will be higher on POs for which the supplier was not evaluated) was confirmed (p=0.018) in that more inspection hours are budgeted when the supplier is not evaluated. Finally, Hypothesis 9 (more inspection hours are spent when the supplier’s rating is low) was confirmed (p=0.000) as the analysis revealed that more inspection hours are spent when the supplier’s rating is low (below 4).
The analysis presented underscores the importance of selecting suppliers with good evaluations, and, more importantly, developing suppliers to achieve higher ratings and meeting clients’ demands and expectations. The analysis developed with the support of the team’s SMEs indicated that suppliers with low ratings usually have the lowest cost and are perceived by procurement professionals to provide the best deal for their projects.
16 | Proceedings IGLC | July 2017 | Heraklion, Greece

Thais da C. L. Alves, Panthil Desai, Kim L. Needy, Ashleigh Hegwood, and Sean Musick
This goes against the idea exposed in The Toyota Way’s Principle 1: Base your long-term management decisions on a long-term philosophy, even at the expense of short-term financial goals (Liker 2003). Also, suppliers who subcontract parts of their POs might display a low price tag at first, but costs add up when problems arise with their extended supply chain. The problem is, according to RT308’s SMEs, they do not always know about subcontracting practices ahead of time.
Table 2: Findings RT308’s project extension and practical implications
Description Does it make a difference?
How? Why? When?
Suppliers with low ratings in evaluations.
Yes More inspection hours budgeted and more NCs are found at the shop. This suggests that additional
money ends up being spent to assure quality when these suppliers are selected.
Subcontracting, even for portions of a
commodity like shop fabricated piping,
result in more hours of inspection budgeted.
Yes During the pre-award evaluations, subcontracting should be factored in as something that will increase
the costs of surveillance and quality assurance.
Pre-award evaluation of suppliers.
Yes More budgeted inspection hours are used when the supplier is NOT evaluated. This finding adds to
RT308’s previous findings in that both pre-award and post-award evaluation matter and should be
used in continuous improvement efforts.
When suppliers are not evaluated, organizations are unclear regarding what to expect and this results in additional budgeted hours to assure quality. Previous RT308’s findings indicated that companies often do not share potential feedback and ratings because of a fear of lawsuits (Walsh et al. 2015). Due to adversarial relationships found in the industry, often times suppliers and contractors do not receive the feedback they might have to share with one another, and lessons learned are not shared (Caldas et al. 2009). These attitudes do not help to build respect in these organizations extended networks of suppliers and it certainly does not help them improve.
Additionally, data on supplier evaluations and NCs are collected but not used to make decisions on new purchase orders or are erased as new POs are evaluated and included in companies’ databases (Alves et al. 2016a). Companies could use this data to develop predictive analytics, based on machine learning algorithms, to inform their supplier selection processes and improve the quality of products they use in projects.
5 CONCLUSIONS This paper presented the results of a study that investigated the link between supplier ratings and current industry practices, inspection hours, and nonconformances. EPC companies are missing opportunities to resolve problems as they appear on the shop floor, understanding the situation, and working to prevent new incidents. Data suggests that suppliers with low performance ratings and those that subcontract work likely require more inspection hours when they are awarded a PO due to the likelihood that
17 | Proceedings IGLC | July 2017 | Heraklion, Greece

Impact of Supplier Evaluation on Product Quality
more NCs are found at the shop. Instead of working with suppliers ahead of the PO execution to prevent these problems, organizations are just increasing their inspection effort, without necessarily addressing the root cause of problems. The number of POs assessed and the specific material considered limits this study’s conclusions. Future studies might consider using a larger dataset, impact to safety performance, and different materials to validate and expand the results presented. Additional analyses of the current dataset are underway and will be reported by the authors in future publications.
6 ACKNOWLEDGMENTS
The authors are thankful for the financial support provided by the Construction Industry Institute (CII) and the countless hours of work spent on this project by RT308’s team members. The paper reflects the opinions of the authors and not those of the CII.
7 REFERENCES Alves, T.C.L., Needy, K.L., and Desai, P. (2016a). Achieving Zero Rework through
Effective Supplier Quality Practices. The University of Texas at Austin. Research Report 308-1?.
Alves, T.C.L., Ravagui, K., Needy, K.L. (2016b). “Supplier Selection in EPC Projects: An Overview of the Process and its Main Activities.” ASCE, 2016 Construction Research Congress, University of Puerto Rico, Mayagüez, 10pp.
Caldas, C.H., Gibson Jr, G.E., Weerasooriya, R., and Yohe, A.M. (2009). “Identification of Effective Management Practices and Technologies for Lessons Learned Programs in the Construction Industry.” ASCE, J. of Const. Engrg. and Mgmt., 135(6), 531-539
Construction Industry Institute (1999). Procurement and Materials Management: A Guide to Effective Project Execution.
Field, A. (2012). Discovering Statistics Using SPSS, 3rd Ed., Sage Publications, London. Hegwood, A. (2016). Effective Supplier Quality Practices in the Construction Industry.
Undergraduate honors thesis. University of Arkansas, College of Engineering. 59pp. Kannan, V. R. and Tan, K.C. (2002). “Supplier Selection and Assessment: Their Impact
on Business Performance.” The Journal of Supply Chain Mgmt., Fall 2002, 11-21 Liker, J. (2003). The Toyota Way: 14 Management Principles from the World's Greatest
Manufacturer, McGraw-Hill, New York, 350pp. Neuman, Y., Alves, T.C.L., Walsh, K.D., and Needy, K.L. (2015) “Quantitative Analysis of
Supplier Quality Surveillance Practices in EPC Projects.” Journal of Construction Engineering and Management, 141(11).
Monczka, R. M. Handfield, R. B., Giunipero, L. C. and Patterson, J.L. (2016). Purchasing and Supply Chain Management. 6th ed. 858pp.
Prahinski, C. and Fan, Y. (2007). “Supplier Evaluations: The Role of Communication Quality.” The Journal of Supply Chain Management, Summer 2007, 16-28
Rother, M. (2010). Toyota Kata. McGraw-Hill, New York, NY, 306pp. Walsh, K.D., Needy, K.L., Alves, T.C.L., Neuman, Y., can, R.Y., Ahmad, S. (2015).
Achieving Zero Rework through Effective Supplier Quality Practices. Construction Industry Institute, The University of Texas at Austin. Resesearch Report 308-11.
18 | Proceedings IGLC | July 2017 | Heraklion, Greece
Eke, G., and Elgy, J. (2017). “Testing the value of Best Value.” In: LC3 2017 Volume II – Proceedings of the 25th Annual Conference of the International Group for Lean Construction (IGLC), Walsh, K., Sacks, R., Brilakis, I. (eds.), Heraklion, Greece, pp. 19–26. DOI: https://doi.org/10.24928/2017/0090
TESTING THE VALUE OF BEST VALUE: EVIDENCE FROM EDUCATIONAL FACILITIES PROJECTS
Gerald Eke 1and John Elgy 2
Abstract: Contractor selection is one of the most important step in ensuring the success of any construction project. Failing to adequately select the winning contractor may lead to problems in the project delivery phase such as bad quality and delay in the expected project duration; which ultimately results in cost overruns. This paper presents an approach by which a what-if scenario can be analysed in educational facilities projects in the UK; therefore if the client selected the best value contractor for a project whose submitted price is not the lowest price, a what-if scenario was conducted to show how the lowest priced contractor would have fared had he/she been awarded the contract instead. This was done by analysing historic data of projects that have selected the lowest priced contractor. Then correlations were derived between variables; which was then be inputted into a Monte Carlo Simulation to analyse 3 real educational facilities projects that used a best value selection method. Using Monte Carlo Simulation allowed us to see all the possible outcomes of cost, and duration. It was concluded that selecting the best value contractor in educational facilities projects may not be necessary in terms of cost.
Keywords: Educational facilities projects, Contractor selection, Best value contractor, lowest priced contractor, Monte Carlo simulation.
1 INTRODUCTION
Selecting the most appropriate contactor is significant to project success (El-Abassy et al., 2013). Bid price has long been the most dominant criterion for selecting contractors in the UK (Holt et al., 1994). However, due to the different level of complexity and dynamics involved with construction projects, bid price can no longer be the most dominant or the sole criterion for selecting contractors (El-Abassy et al., 2013). Therefore, there are two strategies involved with selecting contractors: one is the lowest priced, the other is called best value or the Most Economically Advantageous Tender (MEAT). If the client chooses to go for the latter strategy, this would involve scoring the contractors' bids on price and quality and ranking them. But what is quality? Which criteria defines quality? There is no set definition for this, each client would their own unique definition of what quality, thus, what best value is to them. Therefore selecting contractor on best value is not as straightforward as awarding the contract to the lowest bidder. This is one of the reasons why industry professionals are finding it difficult to embrace the concept; judging by how the traditional procurement method, which uses the lowest bid award criterion, is still the most used procurement method in the UK (NBS, 2015). There are various models developed in order to help with contractor selection such as simple weighting, Analytical 1 School of Engineering and Applied Sciences, Aston University, Aston Express Way, Birmingham B4 7ET.
Email: [email protected] 2 Senior Lecturer of School of Engineering and Applied Sciences, Aston University, Aston Express Way,
Birmingham B4 7ET. Email: [email protected]
19 | Proceedings IGLC | July 2017 | Heraklion, Greece

Testing the Value of Best Value: Evidence From Educational Facilities Projects
Hierarchy Process (AHP), Analytical Network Process (ANP), and multi-utility theory, however only a handful of these models have substantially investigated the link between contractor selection and cost overruns (or project result). For example, Abdelrahman et al. (2008) for one, introduced a concept of best value modelling that was specific to each project; combing two application method: the weighted average method and AHP method. Their tool ranked contractors on best value by using a methodology for quantifying the qualitative effect of subjective factors in the selection process. Cheng and Li (2004) used ANP as an extension for AHP in order to allow access to the interdependent influences specified in the developed model. Kwong et al. (2002) and Bevilacqua and Petroni (2002) used the combination of a scoring system and fuzzy theory for ranking the best value bids. Bendana et al. (2008) also developed a fuzzy logic assessment model both the qualitative and quantitative issues that influence whether or not a contractor is suitable to win the bid for the project. These decision support tools have aided in selecting the best value contractor, however we are still none the wiser as to whether they lead to successful outcomes. The research has conducted a what-if analysis on educational facilities projects in the UK, in order to know whether selecting the best value bid is worth it in educational facilities project. This study is not advocating choosing one strategy over another. Furthermore, this does not imply that a selection strategy is the only factor responsible for delivering a successful project, as there are other factors that leads to overruns (see Flyvbjerg, 2008; Cantarelli et al., 2010).
2 CASE STUDY
2.1 Initial Analysis
The Building Cost Information Service of RICS (BCIS) database was used to conduct this study. A total of 120 Educational facilities projects, all of which was awarded to the lowest bidder, were analysed. Each project showed:
• Details of the contract awarded (tender bids received from all the contractors that bided for the project; companies shall remain anonymous)
• Selection criteria; (lowest tender accepted)
• The wining contractor: the eventual tender accepted
• Project outcome cost: initial tender cost, final cost, the expected duration, and actual duration.
The BCIS database states the reasons for overruns, for example there was a project that overran by £20,000, and this was due to the client making design changes. These sort of projects were not used for this study; all 120 projects where cases whereby the contractor solely impacted the outcome of the project, at least form the reasons given. The study was to see whether awarding the project to the lowest tender will result in a higher outcome cost, and duration than awarding to the best value tender.
From this dataset (120 project cases), correlations were derived between three variables using Excel (see Table 1 for correlation):
• Bid price (BP, which in this case, is always the lowest tender)
• The difference between the final cost of the project and the tender accepted price (Diff)
• Delay
20 | Proceedings IGLC | July 2017 | Heraklion, Greece
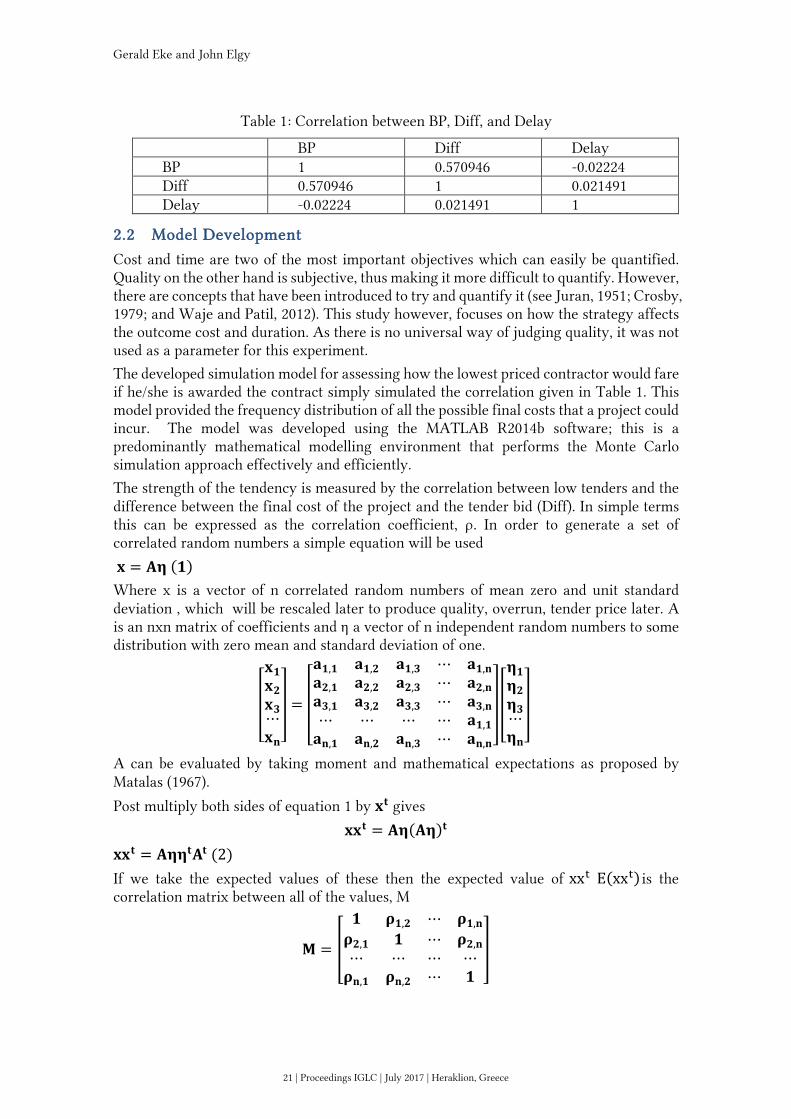
Gerald Eke and John Elgy
Table 1: Correlation between BP, Diff, and Delay
BP Diff Delay BP 1 0.570946 -0.02224 Diff 0.570946 1 0.021491 Delay -0.02224 0.021491 1
2.2 Model Development
Cost and time are two of the most important objectives which can easily be quantified. Quality on the other hand is subjective, thus making it more difficult to quantify. However, there are concepts that have been introduced to try and quantify it (see Juran, 1951; Crosby, 1979; and Waje and Patil, 2012). This study however, focuses on how the strategy affects the outcome cost and duration. As there is no universal way of judging quality, it was not used as a parameter for this experiment.
The developed simulation model for assessing how the lowest priced contractor would fare if he/she is awarded the contract simply simulated the correlation given in Table 1. This model provided the frequency distribution of all the possible final costs that a project could incur. The model was developed using the MATLAB R2014b software; this is a predominantly mathematical modelling environment that performs the Monte Carlo simulation approach effectively and efficiently.
The strength of the tendency is measured by the correlation between low tenders and the difference between the final cost of the project and the tender bid (Diff). In simple terms this can be expressed as the correlation coefficient, ρ. In order to generate a set of correlated random numbers a simple equation will be used
𝐱 = 𝐀𝛈 𝟏 Where x is a vector of n correlated random numbers of mean zero and unit standard deviation , which will be rescaled later to produce quality, overrun, tender price later. A is an nxn matrix of coefficients and η a vector of n independent random numbers to some distribution with zero mean and standard deviation of one.
𝐱𝟏𝐱𝟐𝐱𝟑⋯𝐱𝐧
=
𝐚𝟏,𝟏 𝐚𝟏,𝟐 𝐚𝟏,𝟑 ⋯ 𝐚𝟏,𝐧𝐚𝟐,𝟏 𝐚𝟐,𝟐 𝐚𝟐,𝟑 ⋯ 𝐚𝟐,𝐧𝐚𝟑,𝟏 𝐚𝟑,𝟐 𝐚𝟑,𝟑 ⋯ 𝐚𝟑,𝐧⋯ ⋯ ⋯ ⋯ 𝐚𝟏,𝟏𝐚𝐧,𝟏 𝐚𝐧,𝟐 𝐚𝐧,𝟑 ⋯ 𝐚𝐧,𝐧
𝛈𝟏𝛈𝟐𝛈𝟑⋯𝛈𝐧
A can be evaluated by taking moment and mathematical expectations as proposed by Matalas (1967).
Post multiply both sides of equation 1 by 𝐱𝐭 gives
𝐱𝐱𝐭 = 𝐀𝛈 𝐀𝛈 𝐭
𝐱𝐱𝐭 = 𝐀𝛈𝛈𝐭𝐀𝐭(2) If we take the expected values of these then the expected value of xx2 E xx2 is the correlation matrix between all of the values, M
𝐌 =
𝟏 𝛒𝟏,𝟐 ⋯ 𝛒𝟏,𝐧𝛒𝟐,𝟏 𝟏 ⋯ 𝛒𝟐,𝐧⋯ ⋯ ⋯ ⋯𝛒𝐧,𝟏 𝛒𝐧,𝟐 ⋯ 𝟏
21 | Proceedings IGLC | July 2017 | Heraklion, Greece
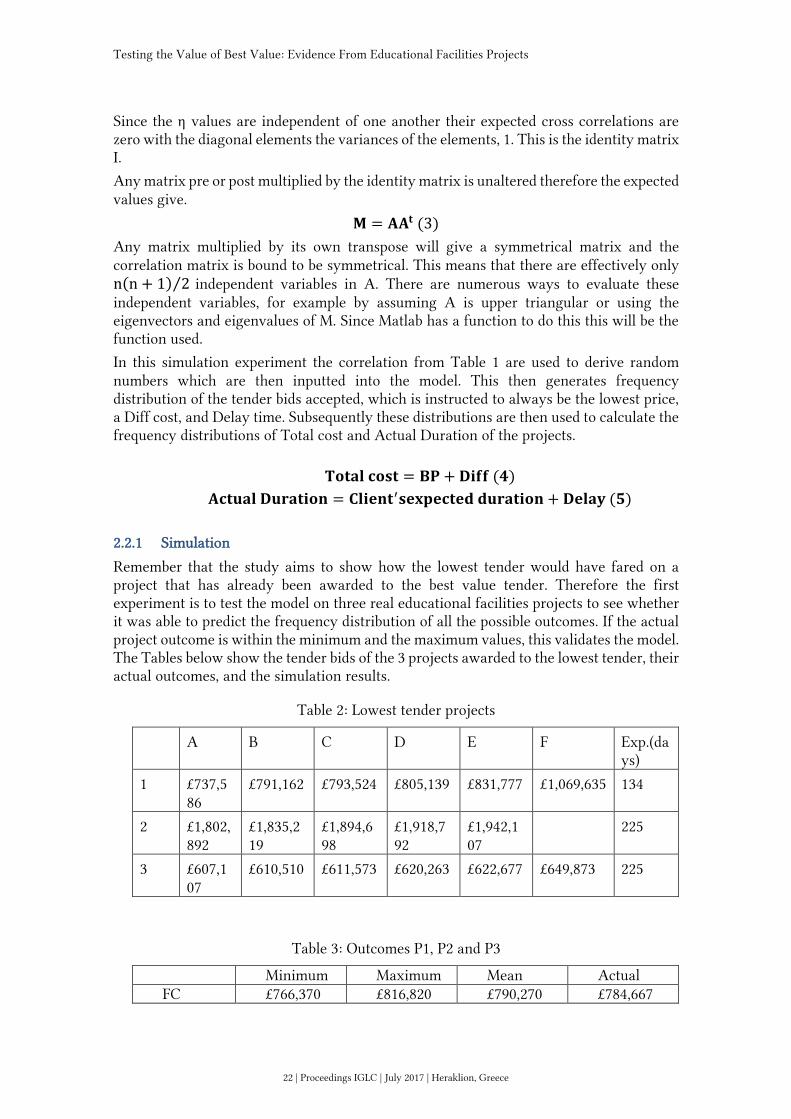
Testing the Value of Best Value: Evidence From Educational Facilities Projects
Since the η values are independent of one another their expected cross correlations are zero with the diagonal elements the variances of the elements, 1. This is the identity matrix I.
Any matrix pre or post multiplied by the identity matrix is unaltered therefore the expected values give.
𝐌 = 𝐀𝐀𝐭(3) Any matrix multiplied by its own transpose will give a symmetrical matrix and the correlation matrix is bound to be symmetrical. This means that there are effectively only n n + 1 2 independent variables in A. There are numerous ways to evaluate these independent variables, for example by assuming A is upper triangular or using the eigenvectors and eigenvalues of M. Since Matlab has a function to do this this will be the function used.
In this simulation experiment the correlation from Table 1 are used to derive random numbers which are then inputted into the model. This then generates frequency distribution of the tender bids accepted, which is instructed to always be the lowest price, a Diff cost, and Delay time. Subsequently these distributions are then used to calculate the frequency distributions of Total cost and Actual Duration of the projects.
𝐓𝐨𝐭𝐚𝐥𝐜𝐨𝐬𝐭 = 𝐁𝐏 + 𝐃𝐢𝐟𝐟(𝟒) 𝐀𝐜𝐭𝐮𝐚𝐥𝐃𝐮𝐫𝐚𝐭𝐢𝐨𝐧 = 𝐂𝐥𝐢𝐞𝐧𝐭I𝐬𝐞𝐱𝐩𝐞𝐜𝐭𝐞𝐝𝐝𝐮𝐫𝐚𝐭𝐢𝐨𝐧 + 𝐃𝐞𝐥𝐚𝐲(𝟓)
2.2.1 Simulation
Remember that the study aims to show how the lowest tender would have fared on a project that has already been awarded to the best value tender. Therefore the first experiment is to test the model on three real educational facilities projects to see whether it was able to predict the frequency distribution of all the possible outcomes. If the actual project outcome is within the minimum and the maximum values, this validates the model. The Tables below show the tender bids of the 3 projects awarded to the lowest tender, their actual outcomes, and the simulation results.
Table 2: Lowest tender projects
A B C D E F Exp.(days)
1 £737,586
£791,162 £793,524 £805,139 £831,777 £1,069,635 134
2 £1,802,892
£1,835,219
£1,894,698
£1,918,792
£1,942,107
225
3 £607,107
£610,510 £611,573 £620,263 £622,677 £649,873 225
Table 3: Outcomes P1, P2 and P3
Minimum Maximum Mean Actual FC £766,370 £816,820 £790,270 £784,667
22 | Proceedings IGLC | July 2017 | Heraklion, Greece

Gerald Eke and John Elgy
Time 97 206 139 157 Diff £28,784 £79,234 £52,684 £47,081 FC £1,797,600 £1,849,900 £1,824,700 £1,814,892 Time 167 291 230 225 Diff -£5,292 £47,008 £21,808 £12,000 FC £584,060 £640,740 £611,670 £638,271 Time 161 297 230 225 Diff -£23,047 £33,633 £4,563 £31,164
Therefore, as the actual outcomes were able to fall within the envelope of the predicted outcomes from the model. The model could now be tested in 3 real educational facilities projects that selected the best value tender. In this case, the actual outcomes would be that of the best value tender. In Figure 5, Contractor C was selected in Project 4 and 5, and Contractor B was selected in Project 6.
Table 4: Best value tender projects
A B C D E F Exp.(days)
4 £4,299,664
£4,343,931
£4,371,596
£4,447,081
£4,724,370
£5,017,168
292
5 £2,096,388
£2,108,776
£2,123,918
£2,206,340
£2,278,743
134
6 £261,778 £313,826
£328,959 £376,187 89
Table 5: Outcomes P4, P5, P6
Minimum Maximum Mean Actual Actual-Max
Actual-Mean
FC £4,291,400 £4,328,600 £4,309,000 £4,371,596 +£42,996 +£62,596
Time 225 364 297 292 +72 days +5 days
Diff -£8,254.40 -£28,947 £9,370 £0.00
FC £2,069,300 £2,120,100 £2,095,600 £2,123,918 +£3,818 +£28,318
Time 73 205 139 134 +71 days +5 days
Diff £2,511.70 £23,712 £28,839 £0.00
FC £288,980 £343,820 £317,660 £343,200 -£620 +£25,540
Time 51 155 94 89 +66 days +5 days
Diff £27,202 £82,043 £55,884 £29,374
2.2.2 Sensitivity Analysis
A sensitivity analysis was done to see how many times the lowest bid would still be the best overall bid if the correlations between the Bid Price (lowest tender) and the Diff in Table 1 changed using Project 1. Interestingly, it did not entirely affect the outcomes;
23 | Proceedings IGLC | July 2017 | Heraklion, Greece

Testing the Value of Best Value: Evidence From Educational Facilities Projects
the lowest bid still turned out to be the best bid majority of the time (see Figure 1). The sensitivity analysis was conducted on Project 1.
Figure 1: Correlation, Diff, and Count
• The X-axis is the correlations that ranges from -0.8 to 0.8 (removing the extremities of -+1 and 0.9), with a step of 0.1; this is then given a range from 0 to 17.
• The Y-axis is the standard deviation of Diff that ranges from £1000 to £30,000; this is then given a range from 0 to 30.
• The Z-axis counts the number of times that the lowest tender did turn out as the best overall bid; in other words if the amount of time that the lowest bidder’s outcome cost, turns out to still be lower than the next highest bid.
• The model was given 5000 realisations.
The result of this analysis showed that when the correlation is highly negative, given the range of Diff, there is still a high chance that the lowest tender is the best bid; at least 82% of the time. The more positive the correlation becomes, given the range of Diff, the higher the chance that the lowest tender is the best bid. This sort of result is impossible to analyse by only altering the correlation; which is why the standard deviation was also altered to show the surface of the curve. The result supports Project 1 model results, given the correlation used for the model, which had a high chance of the lowest bidder turning out to be the best bid in terms of outcome cost. The reason for this is possibly due to the fact that the standard deviation of the tender prices in Project A was over £100,000; the lowest bid for example was £737,586, while the highest bid was £1,069,635. This means that the overrun cost of going with the lowest bid should be over £300,000 for the lowest bid not to be the best bid, if we are just comparing the two. Therefore further analyses is required which involves reducing the standard deviation of the tender price and increasing the variance of Diff to see how this would affect the results.
24 | Proceedings IGLC | July 2017 | Heraklion, Greece

Gerald Eke and John Elgy
3 DISCUSSION
In Project 6, the best value tender overran by almost £30,000 but still manages to deliver the project in 89 working days, which was the client’s expected duration. Interestingly, the maximum cost the lowest tender would have achieved is just £620 over the actual cost of the project, though the risk of it happening was slight. This possibly suggests that a scope was added to the project, or an unforeseen situation developed that affected the cost. Apart from that, the result showed that there was a higher chance of the lowest tender completing the project at a lesser cost to the best value tender; despite the fact it incurs a cost overrun. This is also the case with Project 4 and 5.
However, the notion of selecting contractors on best value tenders does not only depend on cost. Though best value will have a different meaning to different people, a client’s best value expectation may be quicker duration time. In terms of that, the results show that despite the fact that there is a high chance that the lowest tender will complete the project at a lesser cost than the best value tender, it may come at the expense of it exceeding at the client’s expected duration. There is a risk that the project would take longer to complete if given to the lowest tender, therefore, it comes down to how risk averse the client is. Would the client be willing go with the lowest tender but risk a longer duration time? One can argue that these results are based on the fact that in educational facilities projects, requirements are usually familiar, and building parameters are not very complex. However, the strength of this study is that it is also able to show when projects may not turn out as planned.
4 CONCLUSIONS
This study looked at how the lowest tender would have fared in projects that awarded contracts to the best value tender had he/she been awarded the contract instead. Correlations were derived from 120 educational facilities projects in the UK, this was inputted into the model that was first tested on 3 real projects in the same sector that chose the lowest tender. This was in order to see whether the actual outcomes of these projects would fall within the envelope of all the possible outcomes that was predicted in the model. Then, the same model was then tested in 3 real educational facilities projects in the UK that picked the best value tender. All 120 projects were cases where the contractor was mainly responsible for the project outcomes, for example they were no design changes reported or any other reasons from the clients' side that affected outcomes. The results showed that though it is likely that the lowest tender would deliver at a lesser cost than the best value tender, it will likely overrun both in cost and duration. Therefore it boils down to how risk averse the client is in taking the chance, and what best value is to him/her. The sensitivity analyses conducted for this study involved changing the correlations, this had little effect to the outcomes. Further analyses that include changing the correlation and the standard deviation would have to be undertaken to see how it affects outcomes.
Furthermore, the results shown in this study is limited to educational facilities projects. Thus, the study should be done in other sectors, and even with individual clients, to see how the lowest and best value tender fare. Perhaps, the fact that educational facilities projects are less likely to change in terms of scope would mean that the lowest tender would generally fare well. Also, it is important to note that clients now utilise a preferred contractors’ list, therefore the assumption is that every contractor that makes the list is
25 | Proceedings IGLC | July 2017 | Heraklion, Greece

Testing the Value of Best Value: Evidence From Educational Facilities Projects
capable of delivering. This may be entirely different in other sectors in the construction industry, therefore further study is required. Finally, the use of the BCIS database may possibly bring in a certain level of bias. It is likely that companies are likely to report projects which went considerably well; thus results should be interpreted with a bit of caution. However, this dataset was validated on real life projects in which the outcomes was known.
5 REFERENCES
Abdelrahman, M., Zayed, T., and Elyamany, A. (2008). Best-value model based on project specific characteristics. Journal of Construction Engineering Management, 134 (3), 179–188.
Bendana, R., Cano, A., and Pilar de la Cruz. (2008). Contractor selection: Fuzzy-control approach. Canadian Journal of Civil Engineering, 35(5), 473-486.
Bevilacqua, M. and Petroni, A. (2002). From traditional purchasing to supplier management: a fuzzy logic-based approach to supplier selection. International Journal of Logistics, 5(3), 235-255.
Cantarelli, C. C., Flyvbjerg, B., Molin, E.J.E., and van Wee, B. (2010). Cost Overruns in Large-Scale Transportation Infrastructure Projects: Explanations and Their Theoretical Embeddedness, European Journal of Transport and Infrastructure Research, 10(1), 5-18.
Cheng, E.W. and Li, H. (2004). Contractor selection using the analytic network process. Construction Management and Economics, 22(10), 1021-1032.
Crosby, P. (1979) Quality is Free. McGraw-Hill: New York, NY. El-Abbasy, S.M., Zayed, T. M.ASCE., Ahmed, M., Alzraiee, H., and Abouhamad, M. (2013).
Contractor Selection Model for Highway Projects Using Integrated Simulation and Analytic Network Process. Journal of Construction Engineering and Management, 139(7), 755-767.
Flyvbjerg, B (2008) Curbing optimism bias and strategic misrepresentation in planning: Reference class forecasting in practice. European Planning Studies, 16(1), 3-21.
Holt, G. D., Olomolaiye. P. O., & Harris, F. C. (1994). Evaluating Prequalification Criteria in Contractor Selection. Building and Environment, 29(4), 437-448.
Juran, J. (1951). Quality Control Handbook. 1st ed., McGraw-Hill: New York, NY. Kwong, C.K., Ip, W.H., and Chan, J.W.K. (2002). Combining Scoring Method and Fuzzy
Expert Systems Approach to Supplier Assessment: A Case study. Integrated Manufacturing Systems, 13(7), 512-519.
NBS (2015). The National Construction Contracts and Law Survey 2015. [online] Available from: https://www.thenbs.com/knowledge/nbs-national-construction-contracts-and-law-survey-2015-finds-disputes-continue-to-blight-construction-industry [Accessed: 15th October 2016].
Waje, V. and Patil, V. (2012). Cost of poor Quality in Construction. IOSR Journal of Mechanical and Civil Engineering, 16-22.
26 | Proceedings IGLC | July 2017 | Heraklion, Greece

Gomez, Christy P. and Raji, Abdulazeez U. (2017). “Investigating Organizational Capability Vis-à-vis Human Action to Minimize Post-contract Transaction Costs in D&B Projects.” In: LC3 2017 Volume II – Proceedings of the 25th Annual Conference of the International Group for Lean Construction (IGLC), Walsh, K., Sacks, R., Brilakis, I. (eds.), Heraklion, Greece, pp. 27–34. DOI: https://doi.org/10.24928/2017/0283
INVESTIGATING ORGANIZATIONAL CAPABILITY VIS-À-VIS HUMAN ACTION TO MINIMIZE POST-
CONTRACT TRANSACTION COSTS IN D&B PROJECTS
Christy P. Gomez1 and Abdulazeez U. Raji2
Abstract: This paper examines the role of human action for benefits realization (BR) with respect to minimizing post-contract transactions costs (PTCs) in D&B construction projects. PTCs are commonly associated with monitoring and control, dispute resolution, and implementation activities during the construction phase of projects. This is also an attempt to reaffirm the innovative potentialities of the D&B procurement approach. Viewing BR as an emergent phenomenon, the relationship between the independent constructs of contractors’ team-competency and team-commitment with the dependent construct PTC in Malaysian D&B projects are examined by means of hypothesis testing. Questionnaire survey data from a sample of major D&B contractors in Malaysia was analysed using SmartPLS 3 to test the two main hypothesis. The questionnaire survey was designed based on collation of past literature findings and validated using a Delphi study undertaken with D&B experts. Results indicate that contractor team-commitment has an overall positive and significant influence on minimizing PTCs whilst team-competency has a strong positive and significant influence. The findings also confirm that affective commitment of D&B contractors' team to be the most significant factor. These findings establish the extent to which human agency within its interplay with structure can impact on construction project performance in D&B projects.
Keywords: Benefits realization, competency, post-contract transaction costs (PTCs), design & build projects.
1 INTRODUCTION This paper views benefits realization in construction projects as an emergent phenomenon that needs to be understood within the lens of complexity theory that accommodates the understanding of individual and social structure. In drawing attention to the capability of human action to generate value in a "structured but loose manner", we rely on structuration theory to situate this work on minimization of post-contract transaction costs (PTCs) arising within D&B projects. The unit of analysis is the construction project teams' capability, viewed as organizational capability. Management of construction projects is complex, primarily due to the level of uncertainty and the level of fragmentation. The traditional view of the project management 'team' that is taken-for-granted in terms of an Integrated Project Delivery (IPD) team needs to be
1 Associate Professor, Department of Construction Management, Universiti Tun Hussein Onn Malaysia,
Johor, [email protected] 2 Lecturer, Department of Architecture, Modibbo Adama University of Technology Yola, Adamawa
State, Nigeria, [email protected]
27 | Proceedings IGLC | July 2017 | Heraklion, Greece

Investigating Organizational Capability Vis-à-vis Human Action to Minimize Post-contract Transaction Costs in D&B Projects
dispelled at all levels. In recognizing this, the focus of this paper is on contractor team-competency and team-commitment in D&B projects, as latent variables affecting PTCs. The project team or contractor team is viewed as a community of legitimate individuals acting either as a tight-knit or loosely-linked group committed to value generation.
The actions aimed at minimizing PTCs are seen as being oriented towards Benefits Realization, wherein requirements capture is a key feature. PTCs have been variously described as being social waste (Koskela, 2010), a reflection of inefficient project management practice (Li et al., 2015) and a bane of the fragmented nature of construction. PTCs are commonly associated with monitoring and control, dispute resolution, and implementation activities during the construction phase of projects (see Appendix).
Although, higher levels of in-house expertise and structural efficiencies are deemed to be the cornerstone of D&B organizations, D&B as a solution to better serve client's needs seems not to have had a resounding success. It is affirmed by Jaafar & Radzi (2012) that contractors in Malaysia are often nominated based on low-bid criteria, with little emphasis on their competencies, therein often leading to the production of a failed product that does not meet the client`s needs. The practice of the D&B delivery system in the construction industry is characterized by the D&B contractor organization outsourcing consultants (expertise) to execute their projects (Gambo & Gomez, 2015; Masterman, 2002). This is referred to as the fragmented D&B, a contradiction of sorts. Hence, investigating minimization of PTCs as benefits realization (BR) within a much beleaguered but potentially rich context-specific D&B procurement environment can serve not only to address current D&B limiting practices but also to address the current over-reliance on purely functionalist notions of structural mechanisms, and allow space for the interplay between human agency and structure.
Although previous research points to an extended requirements capture process (Leite et al., 2005), however Gomez and Raji (2015) argue that the current practice is still entrenched in requirements capture mainly as a phase-static pre-construction output. They propose that the client’s requirements needs to be incorporated within the scope of a benefits maximization process based on a dynamic benefits realization model. Kagioglou and Tzortzopoulos (2016) share the view that the traditional practice of measuring benefits based on initial requirements is to be rejected, and emphasize on the notion of actors as being involved both in undertaking and enacting process based on Giddens structuration principle.
1.1 Transaction Costs for Project Delivery Systems
The TCs during the construction phase are known as post-contract TCs (PTCs). For an industry that is attempting to reduce its fragmentation, obviously one clear measure to gauge its performance is the reduction in transaction costs, more importantly that of PTCs. These PTCs could be high due to disputes and litigation. It is found that the PTCs for D&B range from 3.4% to 14.7% with an average of 9.5% of the overall project value (Rajeh, 2014; Li et al., 2015). Based on a study undertaken by the authors, it is noted that the situation is not very different for D&B projects in Malaysia, with an average of 9% ranging from 3.5% to 13.5% of the project value.
1.2 Team-Commitment and Competency & Theoretical Framework
Organizational team-commitment and team-competency are two critical aspects of organizational capability that significantly impact on organizational performance. The D&B contractor team-commitment and team-competency measures were developed
28 | Proceedings IGLC | July 2017 | Heraklion, Greece

Christy P. Gomez and Abdulazeez U. Raji
using the Delphi technique. These focused measures were initially collated from extant literature under the broad category of organizational commitment and competency, and formulated as a theoretical framework (see Figure 1). Through the Delphi refinement process a final set of focused measures were identified. The Delphi study respondents consisted of D&B practitioners and academia with expertise in the execution of D&B construction projects in Malaysia. A total of 30 experts were invited to participate in the Delphi survey which served as the first round of the survey. The experts were identified based on the initial five experts having participated in a previous Delphi study on D&B projects and then using the snowballing sampling technique to obtain the rest. However, only twelve experts participated in the second round of the survey and further only ten participated in the third round of the survey, which is considered to be acceptable in using the Delphi technique. The responses of the experts through the three rounds of Delphi were facilitated and the final consensus view of the D&B experts constituted the questionnaire measurement constructs (see Appendix).
The epistemological basis for this work is embedded within Lean Production Theory (Koskela, 2000), wherein knowledge or action in production is to be premised on principles related to minimizing waste and maximizing value. In this paper construction project performance is addressed in terms of minimizing PTCs in order to maximize benefits for D&B clients in the construction industry.
Figure 1: Theoretical framework
The fundamental presumption is that D&B clients rely on the attitude and behaviour of the team to act in the client's best interest. Hence, in the absence of such behaviour or commitment from the contractors’ team, the D&B clients’ benefits would be plagued by uncertainties, thus lowering the performance level and increasing transaction costs (TCs). The conceptualization of the theoretical framework (see Figure 1) is based on the Theory of Action and Job Performance (Boyatzis, 2008). According Boyatzis (2008) theory of performance is the basis for the concept of competency. As maximum performance is believed to occur when the person’s capability or talent is consistent with the needs of the job demands and the organizational environment. The framework was further developed using Williamson's (1981) analysis of the key contributors of TCs, namely: the economic actors' behavioral assumptions, the lack of competency resulting in bounded rationality and opportunism; and transaction characteristics such as asset specificity, uncertainty, frequency and complexity of the construction projects. Competency is operationalized by using three dimensions: knowledge, functional and social competencies (Delamare Le Deist & Winterton, 2005; Sarmawa et al., 2015). Whilst organizational commitment is taken to be an attitude which is characterized by favourable positive cognitive and affective components about the organization. Attitude
29 | Proceedings IGLC | July 2017 | Heraklion, Greece
Investigating Organizational Capability Vis-à-vis Human Action to Minimize Post-contract Transaction Costs in D&B Projects
and behavioural aspects of ‘commitment’ are considered as antecedents to performance (Mohyin, 2011).
Hence, it is hypothesized that D&B PTCs can be minimized by emphasising on the different dimensions of contractors’ team-competency and team-commitment as shown in Figure 1. The main and sub-hypothesis of the framework are: The main hypothesis: HA: D&B contractors’ Team-Commitment positively influences PTCs HB: D&B contractors’ Team-Competency positively influences PTCs Sub-hypothesis: H1: D&B contractors’ Affective team-commitment positively influences PTCs
H2: D&B contractors’ Continuance team-commitment positively influences PTCs H3: D&B contractors’ Normative team-commitment positively influences PTCs H4: D&B contractors’ Knowledge team-competency positively influences PTCs H5: D&B contractors’ Functional team-competency positively influences PTCs H6: D&B contractors’ Social team-competency positively influences PTCs
2 METHODOLOGY The population of study consisted of 4,625 G7 contractors (highest grade of registered contractors, eligible to bid for value of work above RM10million) registered with CIDB Malaysia based on the CIDB website directory as of December 2015. Based on Saunders et al. (2012) sampling table, 357 G7 contractors were selected with 3% margins of error and 95% confidence level. Structural Equation Modelling (SEM) using SmartPLS (3) was used for the data analysis. A total of 248 questionnaires were returned with 17 considered as invalid. The collated data was tested for missing data and Monotone Response Pattern. The data from the 231 questionnaires was analysed using SPSS version 21.
3 DATA ANALYSIS
3.1 Assessment of Outer Model
Analysis of the measurement model (or outer model), was carried out to determine the appropriateness of the theoretically defined constructs. The measurement model extracted from the theoretical framework was examined to ensure the reliability of the questionnaire. The three key aspects considered were factor loadings, composite reliability (CR) and average variance extracted (AVE).
CR is calculated from the factor loadings of the observed variable. The composite reliability values obtained lie in the range of 0.88 to 0.914, all of which exceeds the recommended value of 0.70. The complete amount of variance in the observed variable accounted by the latent variable relative to measurement error measured by the AVE was between 0.589-0.726 for all constructs, and all greater than 0.50.
Figure 2 is the measurement model analysis of D&B contractor team-commitment and team-competency on PTCs. D&B contractor team-commitment on the whole reported R2 0.758, a positive but not significant relationship with PTCs, with continuance commitment being not significant (β= 0.014, t-value (0.211) <1.96) as shown in Table 1. D&B contractor team-competency reported R2 0.849, with all constructs indicating a strong positive and significant relationship with PTCs as shown in Model B.
Table 1: Measurement model results
30 | Proceedings IGLC | July 2017 | Heraklion, Greece

Christy P. Gomez and Abdulazeez U. Raji
Figure 2: Measurement model
3.1.1 Construct Validity
The construct validity was confirmed by examining the respective cross loadings and factor loadings, wherein all the constructs attained values greater than 0.50. The 32 observed variables had factor loadings between 0.708 - 0.908 (cut-off value for factor loadings is 0.60) and all the values are positive and greater than the recommended value.
3.1.2 Discriminant Validity (DV)
The correlations between the measures of potential overlapping constructs was assessed for DV. The measurement model demonstrated adequate DV as all the square roots of AVE (values in bold, off-diagonal in Table 2) are greater than the correlations in the respective columns and rows.
Table 2: Discriminant Validity
3.1.3 Hypothesis Testing
Table 3 presents the path coefficient (β) and their significance values in testing the various hypothesis. Five of the six relationships were found to be significant except C_CMT -> PTCs. Figure 2 shows the graphical representation of the inner model R2 coefficients.
31 | Proceedings IGLC | July 2017 | Heraklion, Greece

Investigating Organizational Capability Vis-à-vis Human Action to Minimize Post-contract Transaction Costs in D&B Projects
Table 3: Hypothesis Testing
The findings indicate that D&B contractor team-commitment overall has a positive and significant relationship with PTCs (see Figure 3), path coefficient shows (β= 0.310, t-value (4.220)>1.96). Whilst D&B contractor team-competency indicates a strong positive and significant relationship with PTCs (β= 0.577, t-value (8.258) >1.96).
Figure 3: Final measurement model
4 CONCLUSION It is evident that the "innovative" D&B organizational structures have a tendency to "degenerate" into hybrid forms apparently to take advantage of markets and avoid hierarchies so as to minimize costs. However, this can compromise on process efficiencies and "trigger" additional TCs. Viewing the problem from an analytical socio-technical perspective and focusing on organizational capability vis-à-vis human action to minimize PTCs, two latent constructs were identified from literature as components of organizational capability namely: team-commitment and team-competency.
The findings indicate that D&B contractors' team-competency has a strong and positive significant impact on minimizing PTCs, whilst team-commitment has a significant but weaker impact. It is also evident that affective commitment is the most significant factor towards minimizing PTCs, wherein the observable sub-factors are viewed as indicators of project performance. Hence, it is proposed that in order to minimize PTCs, team-competency and team-commitment needs to be given greater emphasis in order for D&B projects to leverage on its full potential with respect to permitting a greater interplay of structure and agency. The results of this investigation also affirms the role of human agency in the benefits realization process.
5 REFERENCES
Boyatzis, R. E. (2008). Competencies in the 21st century. Journal of Management Development, 27(1), 5–12.
32 | Proceedings IGLC | July 2017 | Heraklion, Greece

Christy P. Gomez and Abdulazeez U. Raji
Delamare Le Deist, F., & Winterton, J. (2005). What is Competence? Human Resource Development International, 8(1), 27–46.
Gambo, M. M. & Gomez, C.P. (2015). Project Characteristics for Design and Build Procurement Approach in the Malaysian Construction Industry. Journal of Engineering and Technology (JET), 6(1), 144-154.
Gomez, C.P. and Raji, A.U. (2015). Dynamic benefits maximization model for renovation works of landed residential properties in Malaysia. In: Proceedings of 23rd Annual Conference of the International Group for Lean Construction, pp. 803-814
Jaafar, M., & Radzi, N. M. (2012). Building procurement in a developing country: a comparison study between public and private sectors. International Journal of Procurement Management, 5(5), 608-626.
Kagioglou, M., and Tzortzopoulos, P. (2016). Benefits Realisation: An Investigation of Structure and Agency. In: Proc. 24th Ann. Conf. of the Int’l. Group for Lean Construction, Boston, MA, USA, sect.4 pp. 183-192
Koskela, L. (2000). An exploration towards a production theory and its application to construction. VTT Technical Research Centre of Finland.
Li, H., Arditi, D., & Wang, Z. (2015). Determinants of transaction costs in construction projects. Journal of Civil Engineering and Management, 139(1), 60–68.
Leite, F.L., Miron, L.I.G. and Formoso, C.T. (2005). Opportunities for client requirements management in low-income house building projects in Brazil Proc. 13th Ann. Conf. of the Int’l. Group for Lean Construction. Sydney, Australia.
Masterman, J. W. E. (2002). An Introduction to Building Procurement Systems, 2nd ed., Spon Press, London.
Mohyin, N. A. (2011). Managing commitment in small construction professional services firms. Doctoral thesis, University of Loughborough. UK.
Rajeh, A. J. M. (2014). Comparative Analysis of Construction Procurement Systems Based on Transaction Costs. Doctoral thesis, Auckland University of Technology, Australia.
Sapountzis, S., Yates, K., Lima, J., and Kagioglou, M. (2010). Benefits realisation: Planning and evaluating healthcare infrastructures and services. In: Kagioglou, M. and Tzortzopoulos, P. (Eds.) Improving healthcare through built environment infrastructure. Wiley-Blackwell, Oxford, UK, 166-195
Sarmawa, I., Suryani, N., & Riana, I. G. (2015). Commitment and competency as an organizational citizenship behavior predictor and its effect on the performance. International Journal of Economics, Commerce and Management, 3(1), 1-13.
Tillmann, P., Tzortzopolous, P., Sapountzis, S., Formoso, C., & Kagioglou, M. (2012). A case study on benefits realization and its contributions for achieving project outcomes. Proceedings of the 20th International Group for Lean Construction (IGLC).
Whittington, J. (2008). The transaction cost economics of highway project delivery: Design-Build contracting in three states. University of California, Berkeley, CA.
Williamson, O. E. (1981). The Economics of Organization: The Transaction Cost Approach. American Journal of Sociology, 87(3), 548-577.
33 | Proceedings IGLC | July 2017 | Heraklion, Greece
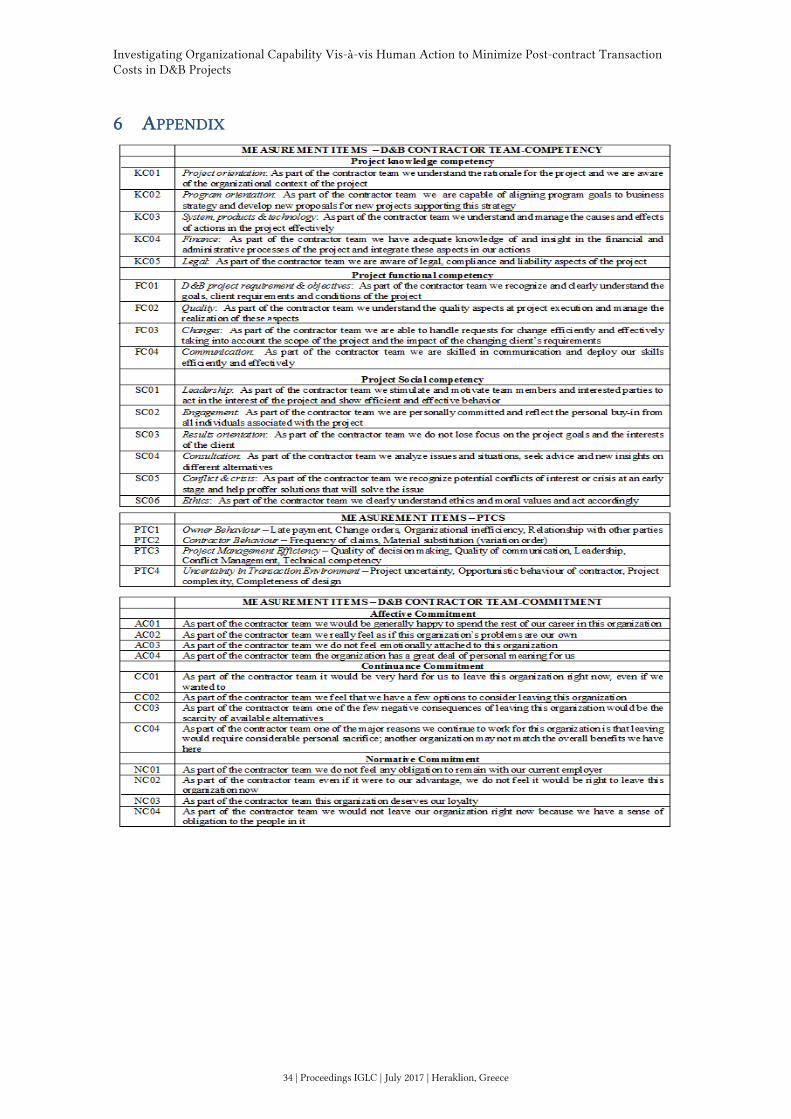
Investigating Organizational Capability Vis-à-vis Human Action to Minimize Post-contract Transaction Costs in D&B Projects
6 APPENDIX
34 | Proceedings IGLC | July 2017 | Heraklion, Greece

Plusquellec T., Lehoux N., and Cimon Y. (2017). “Design-Build in Construction: Performance and Impact on Stakeholders.” In: LC3 2017 Volume II – Proceedings of the 25th Annual Conference of the International Group for Lean Construction (IGLC), Heraklion, Greece, pp. 35-43. DOI: https://doi.org/10.24928/2017/0057
DESIGN-BUILD AND DESIGN-BID-BUILD IN CONSTRUCTION- A COMPARATIVE REVIEW
Titouan Plusquellec1, Nadia Lehoux2, and Yan Cimon3
Abstract: This paper aims at synthesizing relevant findings about the Design-Build (DB) construction delivery system from previous studies. It focuses especially on cost, schedule, quality, and various sustainability aspects associated with a construction project, as they are widely used as performance indicators in this industry. This work has been done through a literature review and a content analysis, focusing on papers comparing Design-Build to the classical Design-Bid-Build delivery system. The results of the literature review show that Design-Build outperforms Design-Bid-Build in terms of cost and schedule growth as well as in terms of delivery speed, all for a similar quality. Furthermore, it may suggest that Design-Build could help in reaching highly sustainable goals while being a key step in the implementation of lean construction. This study might allow owners to save time in their investigation about the performance of Design-Build, and even lead them to reconsider their project delivery system choice when planning for new project launches.
Keywords: Design-Build; Design-Bid-Build; Construction Delivery Systems; Comparative Review.
1 INTRODUCTION
The way construction projects are conducted and managed has evolved considerably over the years. Indeed, as technology progressed, the complexity of projects soon reached a point where it exceeded the grasp of a single expert. The increasing complexity led the stakeholders of a construction project to specialize, thereby sequencing the project’s organization (Sanvido et al., 1992). This evolution led to what is currently known as the classical delivery method, where the owner contracts a team of architects and engineers to design the building and then elects a contractor following the lowest bidder rule.
However, this classical Design-Bid-Build (DBB) delivery system is still far from perfect since most of the construction projects have to face some cost increases and schedule overruns, which can be really harmful for the owner. Moreover, in some parts of the world, as is the case in the Province of Quebec, Canada, the construction industry is currently facing a drop in activity (CCQ, 2015). The lack in efficiency shown by the classical method promotes the use of alternative delivery methods such as Design-Build (DB), characterized by a single contract with an entity dispensing both the design and the construction of the building. Similar conclusions led to the development of Lean Construction, which aims to optimize the performances at a project level (Forbes & Ahmed, 2011).
Since its first definition on the early 1990s, Design-Build has been gaining market share, reaching nearly 40% in the US in 2014 (RSMeans, 2015). It makes this delivery 1 Graduate Student, CIRCERB, Faculty of Science and Engineering, Université Laval, Québec, QC,
Canada; [email protected] 2 Associate Professor, Ph.D. CIRCERB; CIRRELT; Faculty of Science and Engineering, Université Laval,
Québec, QC, Canada; [email protected] 3 Professor, Ph.D. CIRRELT; Faculty of Business Administration, Université Laval, Québec, QC, Canada;
35 | Proceedings IGLC | July 2017 | Heraklion, Greece

Design-Build and Design-Bid-Build in Construction- a Comparative Review
system one of the most significant trends in design and construction (DBIA, 2016). As it becomes even more important, the Design-Build delivery system is the subject of numerous research efforts that try to determine whether this mode is more efficient than the classical method. To do so, each study focuses on specific aspects of a construction project such as cost and schedule performance, single or multiple owners, and the type of building erected. However, the literature lacks a study synthesizing all the observations and the findings found about Design-Build performance in comparison with Design-Bid-Build; which represents the goal of this study. Thus, this paper aims at synthesizing the knowledge gathered from previous studies about the performance of Design-Build compared to the classical Design-Bid-Build delivery system.
The paper is divided as follows: in Section 2, some preliminary concepts are defined. In Section 3, the research method followed is described while in Section 4, the results are presented. A discussion and a brief conclusion complete the paper.
2 PRELIMINARY CONCEPTS
As this study focuses on the comparison between Design-Build and Design-Bid-Build, these are the definitions used to characterize those project delivery methods based on the first comparative study proposed by Konchar and Sanvido (1998):
“Design-Build (DB) is a project delivery system where the owner contracts with a single entity to perform both design and construction under a single design-build contract. Contractually, design-build offers the owner a single point of responsibility for design and construction services. Portions or all of the design and construction may be performed by a single design-build entity or by a selection of specialized workers. In some cases, all of the activities may be subcontracted to other companies (Konchar et al., 1998: page IX).”
“Design-Bid-Build (DBB) is a project delivery system where the owner contracts separately with a designer and a constructor. The owner normally contracts with a design company to provide "complete" design documents. The owner or owner-agent then usually solicits fixed price bids from construction contractors to perform the work. One contractor is usually selected and enters into an agreement with the owner to construct a facility in accordance with the plans and specifications (Konchar et al., 1998: page IX).”
Even though the performance triangle time-cost-quality is not necessarily the best way to determine the success of a project (Atkinson, 1999), it is still the tool most used by the authors to compare the two construction delivery systems. Because these criteria remain the most representative way to synthesize results from different studies, this paper will mainly use the same indicators. Quality being a subjective measurement, there is hardly a unique indicator to measure it. Thus, past research generally used surveys to collect data and then emit global conclusions about the behaviour of each delivery system concerning quality performance. The quality of constructed facilities, the compliance with construction specifications or the conformity to user expectations are some of the indicators commonly used for quality measurement.
3 RESEARCH METHOD
3.1 Test
3.1.1 Test again
All of the information used to compare the two construction systems was gathered through a structured literature review (see Cooper (1998) for more details).
36 | Proceedings IGLC | July 2017 | Heraklion, Greece

Titouan Plusquellec, Nadia Lehoux and Yan Cimon
The first step was to identify key articles related to the subject using two online databases: Web of Science and Compendex. In particular, a combination of the keywords “Design-Build”; “Design-Bid-Build”; “Construction Delivery Systems”, “Comparative analysis” were exploited to find relevant papers for the research. Once those articles were found, the authors focused on their lists of references to identify other interesting articles related to the subject (i.e., backward snowballing, see Wohlin (2014)). The authors took great care to ensure that validity and reliability criteria were met (Carmines & Zeller, 1979). In terms of validity, they ensured their concepts met the agreed-upon definitions in both academic and practice-related literature. Furthermore, they ensured reliability by searching with consistent keywords in leading commercial databases that are well known for the quality of their contents, thus ensuring that researchers in the field could replicate this research. Most of the articles identified in that way dealt with empirical and statistical analysis, using data from construction projects already delivered. The findings of those studies were therefore classified and analyzed to better capture the performance of each type of construction delivery system, as presented in the next section, which details the content of those comparative studies.
4 RESULTS
The first search on Web of Science yielded a list of 83 articles. Among all the articles found, 16 relevant papers comparing Design-Build and Design-Bid-Build were retained. From those 16 studies, 11 focused on the cost-schedule-quality performance for the two project delivery systems. These 11 papers used data from a total of 1,609 construction projects, 636 projects concerning the DB method and 973 projects being related to the DBB approach. Moreover 98% of the project sample was located in the United States. The authors also observed that military construction projects represented 64% of the sample. The comparative study written by Konchar and Sanvido (1998) was the research most cited.
In 1998, Konchar and Sanvido published one of the main studies between different project delivery systems: Design-Bid-Build, Construction Management at Risk (CMR), and Design-Build. These systems were empirically compared through the results of numerous projects conducted in the United States, regarding their cost, schedule, and quality performances. Data concerning cost and schedule were directly extracted from project metrics while quality was evaluated based on a questionnaire sent to the project owners. In particular, the study gathered data from 351 projects, from which 44% were DB, 33% DBB, and 23% CMR. The projects concerned different building categories, namely: Light industrial, Multi-storey dwelling, Simple office, Complex office, Heavy industrial, and High-technology facilities. The researchers also compared the performance of each delivery system through three univariate statistical analyses respectively focusing on cost, schedule and quality. They ranked the delivery systems following the facility type and the owner type. They finally conducted a multivariate analysis to identify variables that accounted for the greatest proportion of variation concerning unit cost, construction speed, delivery speed, cost growth, and schedule growth. The authors concluded that projects administered using the Design-Build project delivery system can achieve significantly improved cost and schedule advantages while quality achieved using DB is equal or sometimes higher than the one obtained from the other delivery systems studied.
Another study, focusing on military construction, was conducted in 2009 by Rosner et al. with data from the Air Force military construction program. This study used a large sample of projects encompassing 278 DB projects and 557 DBB projects, for a total of 835 projects. These projects included various types of facilities, from storage to more complex
37 | Proceedings IGLC | July 2017 | Heraklion, Greece

Design-Build and Design-Bid-Build in Construction- a Comparative Review
operational facilities or even airfield pavement. The performance was evaluated based on cost and schedule indicators, but the number of modifications per million dollars was also taken into account. A statistical analysis showed significant results in favour of Design-Build in terms of cost growth and modification per million, but the DBB achieved the advantage in terms of total project time. This study concluded that DB was most suited for 7 out of the 9 facility types studied. For the 2 other types of facility, storage and maintenance units, the statistical analysis did not show a significant difference. Besides the statistical analysis, the large number of projects used enabled the authors to represent the evolution of the use of design-build over time, showing a notable increase around 1999/2000, when the use of DB jumped from 18% to 48%.
In 2016, a study was published by El Asmar et al., but unlike most of the other studies, it did not evaluate the delivery systems using only cost, schedule, and quality metrics. Indeed, the purpose of this study was to adapt the Quarterback Rating technique to project ranking in order to compare the performance of different construction systems, which led to the “Project Quarterback Rating”. The advantage of the method is that it ranks the different systems using only one output metric. The authors decided to compare 4 delivery systems: DBB, DB, CMR, and Integrated project delivery, through data from 35 projects. The project quarterback rating allowed the researchers to take a large number of indicators into account, which were divided into 7 categories: customer relations, safety, schedule, cost, quality, profit, and communication. Their method led them to emit a ranking of the four compared delivery systems: Integrated project delivery finished first, followed by Design-Build, then Construction Management at Risk, and finally Design-Bid-Build.
As described above, most of the studies used an empirical approach to compare the different delivery systems based on cost, schedule, and quality performances. Other studies that rather compared the delivery systems based on their ability to deliver sustainable projects were also found. The level of sustainability reached by a project was generally evaluated following the LEED ranking which is recognized as the international mark of excellence for green building in 132 countries (CaGBC, 2016).
In 2009, Molenaar et al. published a report aiming to determine whether project delivery methods influence an owner’s ability to achieve its sustainability goals. To do so, the authors gathered information about 230 projects: 53 DB, 54 DBB, and 123 CMR, using a questionnaire survey sent all over the United States. The project sample was also divided by contract type used in each delivery system. Based on the analysis of their survey responses, the researchers concluded that if the owner wants to maximize sustainability within an available budget, CMR and DB provide the greatest likelihood of success. The study also revealed that integration is necessary to seek a high level of LEED ranking.
Another element on which the different construction delivery systems were compared concerns the legal aspect. Indeed, a study written by Pishdad-Bozorgi et al. in 2012 compared DB and DBB from the standpoint of claims. Using a literature review and a series of interviews, the authors tried to determine the influence of DB over the number of claims between the owner and the contractor. Results showed that the number of claims emitted by the contractor decreased for DB systems, especially when it dealt with changes in contract documents. The owner’s claims also tended to decrease, especially the ones dealing with cost over-run and schedule delays. Nevertheless, claims about work quality might increase for DB systems depending on the level of commitment of the owner and the design-build team expertise.
38 | Proceedings IGLC | July 2017 | Heraklion, Greece

Titouan Plusquellec, Nadia Lehoux and Yan Cimon
5 DISCUSSION
Based on what was found in the literature, it becomes possible to highlight some aspects of the duality between Design-Build and Design-Bid-Build. First, we can see that, at least in the US, Design-Bid-Build is still the main delivery system used, with 58% in 2014 against 38% for DB (RSMeans, 2015). Moreover, it seems that military construction is one of the principal users of Design-Build as it reached 48% of the MILCON use in 2009 (Rosner, Thal, & West, 2009). This may justify that 4 of the 11 empirical studies listed focused on military constructions. This goes along with the ease of access to military project data.
It is also interesting to note that most of the papers compared the different construction delivery systems using cost, schedule, and quality performance indicators. A summary of the studies using this kind of evaluation can be found in Table 1. Only the indicators included in most of the papers are presented (i.e., cost growth, unit cost, schedule growth, and delivery speed). Due to the heterogeneity of the units used to describe the unit cost and the delivery speed, no mean could be calculated for these two indicators; this heterogeneity is a consequence of the different types of buildings studied in each research. As quality cannot be efficiently evaluated with quantitative values, only the general conclusions of the studies which tackled this issue are represented in the table.
When looking at this recapitulative table, it can be noted that the DB system seems more reliable concerning the estimated budget and schedule. In particular, a mean cost growth 2% lower and a mean schedule growth 8% lower than the ones obtained for the DBB system can be observed, even though some studies punctually showed results in disfavour of DB. It is also important to note that every study providing value for the mean delivery speed tends to agree on the fact that DB is faster than the classical delivery system. The only point where Design-Build does not outperform Design-Bid-Build is the unit cost, as most of the studies found almost no differences concerning this indicator.
When looking at quality, authors pointed out that DB quality performance was better or similar to the quality performance of DBB projects. There is however some uncertainty attributable to the subjective nature of quality, which makes it difficult to measure without perceptual influences. But a conservative interpretation could be that DB performs at least as well as DBB in terms of quality. The literature also highlighted the capability of DB to deliver sustainable projects. Every study written on that subject agreed with the fact that project integration facilitates the reach of higher sustainable goals. They also confirmed that DB can achieve a greater project team integration than DBB. However, they also mentioned that the best delivery system in terms of integration, and therefore in terms of sustainability, was the Integrated Project Delivery (IPD).
The Integrated Project Delivery also seams to be the system of choice to reach efficient lean construction methods (Forbes & Ahmed, 2011). However, DB and IPD are similar in many ways. We can consider DB as a first step to reach IPD because the selection of the Design-Builder is still mainly based on cost while IPD goes a little further by taking qualification consideration into account. Moreover, even though DB promotes integration when conduction the project, this integration mainly happens between the design team and the contractor. With IPD, the owner is also fully involved over the life of the project (Haskell, 2017). DB can therefore be seen as an intermediate step to reach the requirement of lean construction in terms of integration and internal communication.
39 | Proceedings IGLC | July 2017 | Heraklion, Greece
Design-Build and Design-Bid-Build in Construction- a Comparative Review
6 CONCLUSION
In this article, a synthesis of previous studies comparing Design-Build and Design-Bid-Build has been proposed. By combining and analyzing the different results of these studies, a clear advantage in favour of Design-Build was found, as it seems to outperform the classical delivery system in each criterion typically used for measuring a construction project performance, except for the unit cost. In other words, it seems that DB is a faster and more reliable construction delivery system, leading to a slightly lower claim rate.
And as even more construction projects try to achieve sustainable goals, its relative integration may represent an advantage. However, it appears that most of the studies used in this research were based on US projects, which may not represent the situation of DB elsewhere in the world. Future work could certainly involve more extensive research with more keywords and ideally more than one language to compare the findings with a larger international sample. This paper represents a synthesis of the knowledge gathered around Design-Build in comparison with Design-Bid-Build, which may help further researchers in their literature reviews. This study might also allow owners to save time in their investigation about the performance of DB, and even lead them to reconsider their project delivery system choice when planning for new project launches.
40 | Proceedings IGLC | July 2017 | Heraklion, Greece

Titouan Plusquellec, Nadia Lehoux and Yan Cimon
Table 1: Summary of the empirical studies.
Cou
ntry
US
US
US
US
US
US
US
US
US
US
Sout
h K
orea
Faci
lity
type
Mili
tary
Indu
stri
al
Indu
stri
al
Mili
tary
Tra
nspo
rt
Mili
tary
Mili
tary
Tra
nspo
rt
Tra
nspo
rt
Wat
er
Was
tew
ater
Res
iden
tial
Qua
lity
--
DB
≥ D
BB
DB
≥ D
BB
DB
≥ D
BB
DB
= D
BB
--
--
DB
≥ D
BB
--
DB
= D
BB
DB
≥ D
BB
Sche
dule
Gro
wth
(%)
41.2
48.4
0.0
4.4
1.5
11.2
-4.0
56.0
11.0
4.3
11.5
13.9
17.3
18.8
20.5
5.1
20.2
23.0
4.3
5.0
--
--
10.1
18.4
Del
iver
y sp
eed
--
--
636
(m²/
mon
th)
302
(m²/
mon
th)
10,3
10 (S
F/m
onth
)
7,63
4 (S
F/m
onth
)
--
--
11.4
(Day
s/M
ile)
28.5
(Day
s/M
ile)
2.6
(Day
s/be
d)
7.0
(Day
s/be
d)
--
--
0.3
(mon
th/k
m)
1.2
(mon
th/k
m)
--
--
--
--
37 (D
ays/
Floo
r)
50 (D
ays/
Floo
r)
Mea
n sc
hedu
le
grow
th:
Cos
t
Gro
wth
(%)
12.9
6.7
2.2
4.8
5.7
9.0
3.0
21.0
1.5
12.7
2.0
4.0
4.5
6.4
7.8
6.3
45.3
20.4
1.6
3.6
13.0
19.0
5.8
7.8
Uni
t Cos
t
--
--
861
($/m
²)
1,29
1 ($
/m²)
124
($/S
F)
141
($/S
F)
117.
23 ($
/SF)
134.
41 ($
/SF)
3.52
(M$/
mile
)
3.70
(M$/
mile
)
56 (K
$/be
d)
58 (K
$/be
d)
3.04
($/m
²)
2.70
($/m
²)
3.2
(M$/
km)
2.7
(M$/
km)
--
--
--
--
961.
6 ($
/m²)
960.
2 ($
/m²)
Mea
n co
st
grow
th:
Proj
ect s
ampl
e
5 7 154
116
40
48
36
74
4 4 38
39
278
557
6 16
30
30
31
69
14
13
636
973
DB
DB
B
DB
DB
B
DB
DB
B
DB
DB
B
DB
DB
B
DB
DB
B
DB
DB
B
DB
DB
B
DB
DB
B
DB
DB
B
DB
DB
B
DB
DB
B
Aut
hor
Jam
es B
. Poc
ock
(199
6)
Kon
char
(199
8)
Moo
re
(199
8)
Lind
a N
. Alle
n
(200
1)
Pram
en P
. Shr
esth
a
(200
7)
Dar
ren
R. H
ale
(200
9)
Jam
es W
. Ros
ner
(200
9)
Pram
en P
. Shr
esth
a
(201
2)
R. E
dwar
d M
inch
in J
r.
(201
3)
Jenn
ifer
S. S
hane
(201
3)
Hye
-Sun
g Pa
rk
(201
5)
Tot
al p
roje
ct n
umbe
r:
41 | Proceedings IGLC | July 2017 | Heraklion, Greece

Design-Build and Design-Bid-Build in Construction- a Comparative Review
7 REFERENCES Allen, L. N. (2001). Comparison Of Design-Build To Design-Bid-Build As A Project
Delivery Method.
Asmar, M. E., Hanna, A. S., & Loh, W.-Y. (2016). Evaluating Integrated Project Delivery Using the Project Quarterback Rating. Journal of Construction Engineering and Management, 142(1). doi:10.1061/(ASCE)CO.1943-7862.0001015
Atkinson, R. (1999). Project management: cost, time and quality, two best guesses and a phenomenon, its time to accept other success criteria. International Journal of Project Management, 17(6), pp. 337-342.
CaGBC. (2016). LEED - Leadership in Energy and Environmental Design. (Canada Green Building Council) Retrieved 2016, from Conseil du bâtiment durable du Canada - Québec: http://batimentdurable.ca/construction-developpement-durable/leed
Carmines, E. G., & Zeller, R. A. (1979). Reliability and validity assessment. Sage Publications.
CCQ. (2015). Revue de l’activité,4e trimestre 2014.
Cooper, H. M. (1998). Synthesizing Research: A Guide for Literature Reviews. SAGE.
DBIA. (2016). What is Design-Build? Retrieved 07 2016, from Design Build Institute Of America: http://www.dbia.org/about/Pages/What-is-Design-Build.aspx
Forbes, L. H., & Ahmed, S. M. (2011). Modern Construction Lean Project Delivery and Integrated Practices. Boca Raton, FL: CRC Press, Taylor & Francis Group.
Hale, D. R., Shrestha, P. P., Jr., G. E., & Migliaccio, G. C. (2009). Empirical Comparison of Design/Build and Design/Bid/Build Project Delivery Methods. Journal of construction engineering and management, 135(7), pp. 579-587.
Haskell. (2017). Integrated Project Delivery Vs. Pure Design-Build. Retrieved 03 10, 2017, from http://haskell.com/getattachment/803de0de-153d-4cc5-9ca3-e7e1a60e46fb/Integrated-Project-Delivery-vs-Pure-Design-Build
Konchar, M., & Sanvido, V. (1998). A Comparison of United States Project Delivery Systems.
Minchin, R. E., Li, X., Issa, R. R., & Vargas, G. G. (2013). Comparison of Cost and Time Performance of Design-Build and Design-Bid-Build Delivery Systems in Florida. Journal of Construction Engineering and Management, 139(10). doi:10.1061/(ASCE)CO.1943-7862.0000746.
Molenaar, K., Sobin, N., Gransberg, D., McCuen, T., Korkmaz, S., & Horman, M. (2009). Sustainable, High Performance Projects and Project Delivery Methods.
Moore, S. D. (1998). A Comparison Of Project Delivery Systems On United States Federal Construction Projects.
42 | Proceedings IGLC | July 2017 | Heraklion, Greece

Titouan Plusquellec, Nadia Lehoux and Yan Cimon
Park, H.-S., Lee, D., Kim, S., & Kim, J.-L. (2015). Comparing Project Performance of Design-Build and Design-Bid-Build Methods for Large-sized Public Apartment Housing Projects in Korea. Journal of Asian Architecture and Building Engineering, 330, pp. 323-330.
Pishdad-Bozorgi, P., & Garza, J. M. (2012). Comparative Analysis of Design-Bid-Build and Design-Build From the Standpoint of Claims.
Pocock, J. B., Hyun, C. T., Liu, L. Y., & Kim, M. K. (1996). Relationship Between Project Interaction and Performance Indicators. Journal of Construction Engineering and Management, 122(2), pp. 165-176.
Rosner, J. W., Thal, A. E., & West, C. J. (2009). Analysis of the Design-Build Delivery Method in Air Force Construction Projects. Journal of Construction Engineering and Management, 135(8), pp. 710-717.
RSMeans. (2015). Design-Build Project Delivery Market Share and Market Size Report Update for 2014 Non Residential and Multi-Family Activity.
Sanvido, V., Fenves, S., & Wilson, J. (1992). Aspects Of Virtual Master Builder. Journal of Professional Issues in Engineering Education and Practice, 118(3).
Shane, J. S., Bogus, S. M., & Molenaar, K. R. (2013). Municipal Water/Wastewater Project Delivery Performance Comparison. Journal of Management in Engineering, 29(3), pp. 251-258.
Shrestha, P. P. (2007). Performance Benchmarking of Large Highway Project.
Shrestha, P. P., O’Connor, J. T., & Jr., G. E. (2012). Performance Comparison of Large Design-Build and Design-Bid-Build Highway Projects. Journal of Construction Engineering and Management, 138(1), pp. 1-13.
Wohlin, C. (2014). Guidelines for Snowballing in Systematic Literature Studies and a Replication in Software Engineering. EASE '14 Proceedings of the 18th International Conference on Evaluation and Assessment in Software Engineering.
43 | Proceedings IGLC | July 2017 | Heraklion, Greece

44 | Proceedings IGLC | July 2017 | Heraklion, Greece

Schöttle A., Arroyo P., and Haas Georgiev C. (2017). “Applying Choosing by Advantages in the Tendering Procedure.” In: LC3 2017 Volume II – Proceedings of the 25th Annual Conference of the International Group for Lean Construction (IGLC), Walsh, K., Sacks, R., Brilakis, I. (eds.), Heraklion, Greece, pp. 45–52. DOI: https://doi.org/10.24928/2017/0303
APPLYING CHOOSING BY ADVANTAGES IN THE PUBLIC TENDERING PROCEDURE
Annett Schöttle1, Paz Arroyo2, and Christine Haas Georgiev3
Abstract: Schöttle and Arroyo (2017) and demonstrate that the implementation of choosing by advantages (CBA) in the tendering procedure is beneficial for i) achieving transparency; ii) clarifying what an owner truly values in a project, and iii) creating value, prior to requesting proposals and receiving responses. Furthermore, CBA allows decision-makers to separate the value of the technical proposal versus the cost of the proposal; thus, a bad technical proposal cannot be compensated by a low bid. This paper explains how CBA can be applied in the tendering procedure and also how to adjust the CBA tabular method for public procurement. The authors explain the process steps of the method and outline what the owner needs to define before requesting and evaluating proposals. Finally, based on the constructed case of Schöttle et al. (2015) the procedure is analyzed and discussed.
Keywords: Choosing by advantages, project team, selection, tendering procedure.
1 INTRODUCTION CBA is a multiple-criteria decision-making process developed by Suhr (1999), which is neither well-understood nor widely used in the AEC industry. Most research studies focus on the implementation of CBA in the design process (e.g., Grant and Jones 2008; Parrish and Tommelein 2009; Arroyo, et al. 2014a; Arroyo, et al. 2014b; Kpamma et al. 2015; Arroyo et al. 2016). Schöttle and Arroyo (2016) and Schöttle et al. (2015) did preliminary research for applying CBA in the tendering procedure. In their study, they compared CBA with weighting-rating-calculating (WRC) and best value selection (BVS) using sensitivity analysis. Their results demonstrate the benefits of applying CBA, such as avoiding the problem of combining value with cost. Furthermore, using a decision method, such as weighted average or cost per value, can result in speculative bidder behavior because it allows the potential of compensating a bad technical proposal that includes a favorably low price (Schöttle and Arroyo 2017).
This paper focuses on implementing CBA in the tendering procedure to select a project team, in consideration of the fact that most public owners are required to publish the factors under consideration, their weight and the scoring system to be used, before receiving proposals. Suhr (1999) describes the prior anchoring method for regulated systems, but didn't integrate it in the CBA tabular method. This paper fills that gap, and, additionally, adjusts the CBA tabular method with the prior anchoring process for application in the public tendering procedure. Further, based on the constructed case of 1 PhD Candidate. Karlsruhe Institute of Technology (KIT), Institute for Technology and Management in
Construction (TMB), [email protected], Advisor: Prof. Dr.-Ing. Fritz Gehbauer, M.S. 2 Assistant Professor. Pontificia Universidad Católica de Chile, Chile. Phone +56 22354-4244,
[email protected]. 3 Senior Counsel, Real Estate & Construction, University of California, San Francisco (UCSF), 654
Minnesota Street, San Francisco CA 94143, USA. +1 415.514-3553, [email protected].
45 | Proceedings IGLC | July 2017 | Heraklion, Greece
Applying Choosing by Advantages in the Public Tendering Procedure
Schöttle et al. (2015) this paper illustrates and analyzes the prior anchoring CBA tabular method.
2 RESEARCH METHOD
Based on the constructed case of Schöttle et al. (2015), this paper develops a further case to show how the CBA tabular method needs to be adjusted to provide for proper application in the public tendering procedure. In addition, a protocol for the procedure was developed. This paper focuses on answering the following research questions.
• Is the CBA method applicable in the tendering procedure?
• Does CBA require modification?
• How to apply CBA in the tendering procedure for public owners?
• What does the public owner need to take into account in order to successfully implement CBA?
To answer the research questions the researchers developed a concept that was shown and discussed it in a focus group (Gray 2009). The focus group consisted of two researchers and two individuals working for a public organization.
First, this paper explains the theory of the CBA tabular method and the theory of the prior anchoring process. The prior anchoring process is then integrated in the CBA tabular method, and therefor, the method was adjusted. Every process step for the implementation in the tendering procedure is described and its application exemplified. Finally, the paper discusses the implementation.
3 CBA BACKGROUND
3.1 Motivation for applying CBA
The authors see two major issues that easily occur while using the current methods WRC and BVS. (1) The combination of a technical proposal with the price proposal and vice versa. Because both methods mix value with cost, the bidders could, potentially, “game” the system. CBA does not mix cost and value, thus the bidder cannot speculate in this respect. (2) Members of the focus group observed the problem of unclear differentiation among the proposals during the evaluation process. Often, the group had problems in expressing the differentiating factors in the score, which, in the end resulted in less difference among the proposals. In case of the tendering of an office building at UCSF in 2012, the owner adopted a ranked scoring system so that the proposers could only achieve 3/3, 2/3, or 1/3 of each of the maximum achievable scores, to get a clear judgment and a clear bidder delineation of ranking (see Schöttle et al 2015). When CBA is in place, this would not be necessary because, if a proposal does not have an advantage, then it does not get any score (Schöttle and Arroyo 2017), so the spread of the scores occur naturally (see Arroyo et al. 2014b, Schöttle and Arroyo 2017).
3.2 Theory of the CBA Tabular Method
The CBA tabular method was developed by Suhr (1999). Therefore, the following section is based on Suhr (1999). CBA is a system designed to make sound decisions. Before the method is explained, the related glossary of terms must be understood. Table 1 presents the definitions of the key terms, factors, attributes, advantages, and criteria.
46 | Proceedings IGLC | July 2017 | Heraklion, Greece

Annett Schöttle, Paz Arroyo, and Christine Haas Georgiev
According to Suhr (1999), the method is based on four principles: (1) pivotal cornerstone principle; (2) fundamental rule of sound decision-making; (3) principle of anchoring, and (4) methods principle. The first principle stands for the learning process and the use of sound decision-making methods to make sound decisions. The second principle states that “decisions must be based on the importance of advantage” and not on factor weight (Suhr 1999). Moreover, Suhr (1999) specifies weighting of advantages and disadvantages, of pros and cons, of factors, goals, roles, categories, criteria, objectives, attributes, characteristics, or consequences as unsound decision making. The difference between advantages and disadvantages is simply the perspective. The third and primary principle of the method is anchored judgment, which allows making both reproducible and transparent decisions. The last principle emphasizes the fact that different decision types call for different sound methods (Suhr 1999).
Table 1: Definition of CBA key terms (based on Suhr 1999).
Term Explanation
Factor Element or component of a decision, a container for criteria, attributes, etc.
Attribute A quality, characteristic, or consequence of one alternative, a distinctive feature is neither a pro nor a con.
Advantage Difference between attributes of two alternatives in quality or quantity.
Attribute Decision rule or guideline.
The CBA tabular method can be summarized by the following eight steps (Suhr 1999): (1) Identify alternatives; (2) define factors; (3) define must/want have criteria for each factor; (4) summarize the attributes of each alternative; (5) decide the advantage of each alternative by underlining the least-preferred attribute in each factor and summarizing the difference, which will be the advantages; (6) deciding the importance of each advantage based on the selected paramount advantage (PA) and the established scale of importance; (7) calculating the total importance of advantages of each alternative, and (8) evaluating cost data. The PA is necessary to weight every alternative on the same scale of importance. The decision of importance itself is based on four major considerations: (1) the identified purpose, not on finding a solution for a problem; (2) the preference; (3) the magnitude of the advantages, and (4) their attributes (Suhr 1999). If the owner has problems in choosing the PA, a defender-challenger process can be used to select the PA. The advantages are weighted by comparing the difference of the attributes in each factor.
3.3 The Prior Anchoring Process
The public tendering procedure is usually restricted by regulations with the purpose of installing a fair and objective competition, thus, the CBA tabular method needs to be adjusted to fulfill the corresponding constraints. Suhr (1999, pp. 221-226) describes the prior anchoring process, the prior weighting of advantages, for decisions in a regulated system with four steps. (1) The expected range of attributes has to be estimated for each factor. (2) Determine the expected range of advantages by identifying the worst acceptable (WA) attribute, the worst expected (WE) attribute, and the best expected (BE) attribute in each factor; select the least-preferred attribute as anchor to identify
47 | Proceedings IGLC | July 2017 | Heraklion, Greece
Applying Choosing by Advantages in the Public Tendering Procedure
advantages, and describe the advantages between the least-preferred and BE attribute which indeed is the most important advantages, also named anchor-statement advantage. (3) Then, the importance of the expected advantages needs to be determined. Therefore, the PA, most important anchor-statement advantage, must be selected and the scale of importance established to weight the importance of each anchor-statement advantage based on the PA. (4) Choose the preferred alternative based on cost and total importance.
After the submission, the proposals are evaluated by scoring their advantages. In the event that proposal exceeds the BE attribute, the corresponding advantage would achieve an importance score greater than the importance of the anchor-statement advantage. This applies also to the PA. In case that an attribute does not exceed the least-preferred attribute but achieves the (WA) attribute, the scale can be extended to assign negative importance scores (Suhr 1999).
4 ADJUSTED CBA TABULAR METHOD FOR IMPLEMENTATION
4.1 Adjustment based on Legislation
The tendering procedure must be based on the legislation applicable to the particular public entity. Now, two options exist to implement CBA in the selection process based on the existing regulations. First option would be to state in the request for proposal (RFP) that CBA will be used to evaluate the proposals, and then simply evaluate the proposals using CBA. For example, this will be the case of University of California, as the California Public Contract Code (PCC), that gives instructions for the owner about how to proceed in public procurement, states that for best value selection procedure, owners needs to describe the criteria, the methodology and rating or weighting system, and the relative importance or weight assigned to the criteria on which the proposals will be evaluated in the RFP (see Cal. Pub. Contract Code section 10506.6, subd. (2)).
The second option is to integrate a prior anchoring process (Suhr 1999). The first option is easier, because the classic CBA tabular can be applied and no further effort is necessary. In relation to the first option, Suhr (1999) states that an objective judgment requires the non-identification of the contractor with their proposals. This is a conflict and needs to be considered because as soon as a pre-qualification and interview process is used to select the bidders for the competition phase; the owner knows who is going to bid. The second option is to integrate a prior anchoring process (Suhr 1999) as will be shown in the following two sections.
4.2 The prior anchoring CBA Tabular Method
Public owners who need to publish weights in the RFP, can use the CBA tabular method with the prior anchoring method. Because the authors questions the advantage and do not see the necessity of having a WA and WE attribute, the authors will implement the minimum requirement (MR) attribute. The MR attribute represents the attribute that needs to be fulfilled by the bidder. If a proposer does not meet the MR attribute, the bid must be rejected. This rule protects bidders against the speculative behavior of a competitor. For example, a bidder could speculate to not achieve the minimum requirement LPS as it does not provide a high score. A proposal, which exceeds the maximum value, may not be valuable for the owner. For example, one bidder proposes a building with an interior program space of 280,000 GSF. This exceeds the maximum value by 5.66%. This might be, but doesn’t have to be, a positive option for the owner as maybe higher life-cycle-cost surfaces. Nevertheless, the proposal that doesn’t provide an
48 | Proceedings IGLC | July 2017 | Heraklion, Greece

Annett Schöttle, Paz Arroyo, and Christine Haas Georgiev
advantage in the factor will still be scored zero. In case that none of the components of the proposal fulfills all minimum requirements, the process should be stopped and a root-cause analysis should be done to answer the question why no part of the proposal fulfills the minimum requisites. Table 2 provides an overview of the CBA process steps, including a modified prior anchor method.
Table 2: Process steps of the prior anchoring CBA tabular method.
Process step Explanation
Define factors All factors on which the proposals will be evaluated need to be documented.
Define MR and BE attribute MR and BE attribute represents two possible alternatives and are needed to determine the expected range of
attributes for each factor.
Describe anchor-statement advantage
This is the difference between the MR and the BE attribute.
Select the PA Search for the most important anchor-statement advantage.
Develop the scale of importance Choose a scale, such as 0-100, 0-10, or 0-1.
Weight the importance of each anchor-statement advantage
Weight the importance based on the PA.
Choose the preferred alternative This is the anchor for the final decision.
Identify alternatives Based on pre-qualification and interviews.
Request for proposals Publish the factors, the scale of importance, the anchor-statement advantage, and the weight of the anchor-
statement advantage in the RFP.
Open the technical proposal -
Summarize the attributes of each alternative
Document the attribute of each alternative for every factor in the CBA table.
Decide the advantages of each proposal
Evaluate the technical proposals based on anchored judgment.
Decide the total importance of each proposal
Calculate the total of advantages for each bidder.
Open the price proposal -
Evaluate the proposals based on the diagram
Insert every alternative into the diagram and analyze which proposal provides the preferred alternative for the
owner.
The methods contains three anchors: (1) anchor between MR and BE attribute; (2) anchor between weight of the anchor-statement advantage and PA, and (3) anchor between the importance weight of the anchor-statement advantage and the advantages of the new alternatives, which automatically result in an anchor between the advantages of the alternatives in each factor. Anchors (1) and (2) are established before the request for proposal is issued. Anchor (3) is used to evaluate the proposals.
49 | Proceedings IGLC | July 2017 | Heraklion, Greece

Applying Choosing by Advantages in the Public Tendering Procedure
4.3 Example for the prior anchoring CBA Tabular Method
Based on the constructed case of Schöttle et al. (2015), Table 3 exemplifies the integration of the prior anchoring process in the CBA tabular as described in section 4.2. To simplify the example, the number of factors was reduced to five from 18 in the constructed case. The bid prices in the proposals were also adopted from the constructed case. Hence, Bidder 1 submits a price proposal of USD 93.8M, Bidder 2 submits USD 92.5M, and Bidder 3 submits USD 93.7M (Schöttle et al. 2015). The descriptions of the attributes were taken from the real tendering. A 0 - 100 scale of importance is used to weight the anchor-statement advantage and evaluate the proposals. The factor 'Building interior program spaces' is identified as the PA, because it contains the highest anchor-statement advantage weight with 100. Then, in the RFP, the first part of the table can be published. After proposals submission, the evaluation commences. Because the anchor-statement advantage is defined, the proposals are easier to evaluate. Thus, the advantages of the attributes must be described based on the criterion; and the importance of every advantage must be scored based on the defined scale of importance and in relation to, the prior defined MR and BE attributes. The alternative that does not provide any advantage in a factor must be scored zero.
Table 3: Example of the prior anchoring CBA tabular method.
In our example, Bidder 1 achieved the highest score, followed by Bidder 2 (see table 3). The differentiation of Bidders 1 and 2 to Bidder 3 is significant. The difference between Bidder 1 and 2 is small, but Bidder 2 does not fulfill the minimum requirement of the recyclable material factor (circled in Table 3) and, thus, its bid must be rejected. We are now positing the case that Bidder 2 fulfills the minimum requirement of the recyclable material factor. Bidder 2 would still get a zero score as the proposal doesn't provide an
Factor BE attribute
(Criterion) ASA description
Building interior program spaces
255,000 GSF 265,000 GSF 100
(The more fit between program space and designated gross area, the better.)
10,000 GSF
Adv.: Significantly Better fit between program spaces and gross area.
Imp.: 95
Adv.: Slightly better fit between program spaces and gross area.
Imp.: 50 Adv.: Imp.:
Building interior Little interactive
Very interactive 60
(The more interactive, the better.)
Significantly more interaction Adv.: Imp.:
Adv.: Significantly more interactive concept.
Imp.: 60Adv.: More interactive concept. Imp.: 40
Vegetated Roof 80 sf 160 sf 40
(The more sf, the better.) 80 sf Adv.: 50 sf more. Imp.: 25 Adv.: 70 sf more. Imp.: 35 Adv.: Imp.:
Materials Slightly recyclable
Totally recyclable
50
(The more recyclable, the better.)
Much more recycable
Adv.: Slightly more recyclable. Imp.: 20 Adv.: Imp.:
Adv.: Slightly more recyclable. Imp.: 20
Last Planner® System PPC metrics Demonstrate full understanding.
20
(The greater the understanding, the better.)
Full understanding of the concept.
Adv.: Considerably more.
Imp.: 20 Adv.: Imp.: Adv.: Slightly more understanding
Imp.: 5
Tota l of As 2 5 0 16 0 14 5 6 5
Att.: Demonstrate full understanding.
Att.: PPC during construction only.
Att.: Proposal shows thorough understanding. Response is general and does not show how this will be applied.
Att.: 130 sf Att.: 150 sf Att.: 80 sf
Att.: Partially addressed. Att.: Choose not to pursue. Att.: Partially addressed.
Att.: 261,283 GSF. Att.: 264,197 GSF, but missing some classrooms.
Att.: 258,178 GSF.
Att.: Typical floor plans have one major point of intersection for groups to collide and interact. Ground floor is separated into disparate zones without much required interaction.
Att.: Communal space and ground floor are very strong from a collaborative /interactive perspective.
Att.: Interactive. Atrium centralized with c irculation and interactive spaces. Limited prefunction space.
MR attribute
Defined before request for proposals Evaluation of proposals
Weight of ASA
Alternative 1: Bidder 1 Alternative 2: Bidder 2 Alternative 3: Bidder 3
50 | Proceedings IGLC | July 2017 | Heraklion, Greece

Annett Schöttle, Paz Arroyo, and Christine Haas Georgiev
advantage in this factor compared to the other two bidders, but is not rejected. Based on the case, Figure 1 represents the related cost versus value diagram. Viewing the cost versus value diagram, the owner can readily explain why a certain bidder is selected. Bidder 3 would not be an alternative, because the proposal contains significantly less value for almost the same price as the proposal of Bidder 1. Between Bidders 1 and 2, the owner now has to make its selection. The proposal of Bidder 1 achieved 15 scores more than the proposal of Bidder 2, but is also USD 1.3M higher in price. The USD 1.3M differential seems high, but in comparison to the overall price, it is 1.39%.
Figure 1: CBA cost vs. value diagram with full scoring and cost scale (left) and in
detail (right)
5 CONCLUSIONS This paper illustrates that the CBA method can be used for bidder selection in the public sector in accordance with applicable law. The authors present an example of pre-anchoring CBA in the case it is needed. The authors argue that a sound and fair method does not provide a basis for a claim against the CBA process when correctly applied. The methods themselves require a facilitator to implement and training for the evaluation team. Usually, UCSF calculates one half of a day to evaluate the bids received and come to a conclusion. Also, the time to learn other methods is limited; therefore full implementation of CBA has barriers to overcome. However, we argue that the benefits of CBA implementation outweigh the time spent in training, in order to learn and implement a more transparent and collaborative decision-making method.
Future research is necessary to test the method in field and to develop optimal training for public owners. Furthermore, despite the import of life cycle to the owner, usually it is not a factor considered in the tendering procedure, and often it is contra affected by optimizing the bid price. Thus, life-cycle cost could be another area in the CBA diagram, so that the owner can study not only bid price versus value, but also bid price versus life-cycle cost and value versus life-cycle cost.
6 ACKNOWLEDGMENT The authors would like to thank Michael Bade, Associate Vice Chancellor - Capital Programs & Campus Architect at UCSF, for sharing information and knowledge regarding the challenges of proposal evaluation in a public tendering procedure.
51 | Proceedings IGLC | July 2017 | Heraklion, Greece

Applying Choosing by Advantages in the Public Tendering Procedure
7 REFERENCES
Arroyo, P., Tommelein, I. D., and Ballard, G. (2014a). Comparing AHP and CBA as decision methods to resolve the choosing problem in detailed design. ASCE J. Constr. Eng. Manage., 141(1), doi: 10.1061/(ASCE)CO.1943-7862.0000915.
Arroyo, P., Tommelein, I. D. and Ballard, G. (2014b). Comparing Weighting Rating and Calculating vs. Choosing by Advantages to Make Design Choices. Proc. 22nd Annual Conf. of the Int. Group for Lean Construction, Oslo, Norway, pp. 401-412.
Arroyo, P., Tommelein, I. D., Ballard, G., and Rumsey, P. (2016). Choosing by advantages: A case study for selecting an HVAC system for a net zero energy museum. Energy and Buildings, 111, pp. 26-36.
Gray, D. E. (2009). Doing research in the real world, 2nd Ed., SAGE, London. Grant, E. J., and Jones, J. R. (2008). A decision-making framework for vegetated roofing
system selection. Journal of Green and Building, 3(4), pp. 138-153, doi: 10.3992/jgb.3.4.138.
Kpamma, Z. E., Adinyira, E., Ayarkwa, J., and Adjei-Kumi, T. (2015). Application of the CBA Decision System to Manage User Preferences in the Design Process. Journal of Professional Issues in Engineering Education and Practice, 142(1), doi: 10.1061/(ASCE)EI.1943-5541.0000258.
Parrish, K. and Tommelein, I. D. (2009). Making design decisions using choosing by advantages. Proc. 21th Annual Conf. of the Int. Group for Lean Construction, Taipei, Taiwan, pp. 501-510.
Schöttle, A., Arroyo, P., and Bade, M. (2015). Comparing three methods in the tendering procedure to select the project team. Proc. 23rd Annual Conf. of the Int. Group for Lean Construction, Perth, Australia, pp. 267-276.
Schöttle, A., and Arroyo, P. (2016). The impact of the decision-making method in the tendering procedure to select the project team. Proc. 24th Annual Conf. of the Int. Group for Lean Construction, Boston, MA, USA, pp. 23-32.
Schöttle, A., and Arroyo, P. (2017). Comparison of Weighting-Rating-Calculating, Best Value, and Choosing by Advantages for Bidder Selection. ASCE J. Constr. Eng. Manage., in press.
Suhr, J. (1999). The choosing by advantages decisionmaking system. Quorum, Westport.
52 | Proceedings IGLC | July 2017 | Heraklion, Greece
Wondimu P.A., Lohne J., and Lædre O. (2017). “Motives for the Use of Competitive Dialogue.” In: LC3 2017 Volume II – Proceedings of the 25th Annual Conference of the International Group for Lean Construction (IGLC), Walsh, K., Sacks, R., Brilakis, I. (eds.), Heraklion, Greece, pp. 53–60. DOI: https://doi.org/10.24928/2017/0146
MOTIVES FOR THE USE OF COMPETITIVE DIALOGUE
Paulos Abebe Wondimu1, Jardar Lohne 2 and Ola Lædre 3
Abstract: Competitive dialogue (CD) is a seldom-practised procurement procedure in Norway. The Norwegian Public Roads Administration (NPRA) plans to use it in complex and mega infrastructure project in the future. This study investigates how CD has contributed to the implementation of lean in the public sector by answering the following two research questions: What are the motives for using CD?; and How was the CD carried out (timeline, main activities etc.)?
With a supporting literature study, four cases were studied by conducting a document study and semi-structured in-depth interviewees with eight key informants. Several motives why CD has been used in the target projects were identified. However, none the identified motives were to directly implement lean. Furthermore, eleven major activities of CD and two project implementation models that have used CD were identified in the case projects. The motives behind implementing CD are found to be comparable to the motives for implementing lean construction principles. In addition, the dialogue phase is found to be at the core of the process and could contribute to reducing significant waste. The findings provide a contribution of how CD can be used to implement lean in public procurement.
Keywords: Lean, Competitive dialogue, CD, Early contractor involvement, ECI public procurement, waste.
1 INTRODUCTION Based on the literature study leading to this paper, competitive dialogue (CD) seems to be little known outside the context of certain EU countries (Haugbølle et al. 2015). CD was introduced in 2004 by the European parliament for particularly complex contracts. This procurement procedure allows public clients to hold discussions with shortlisted contractors regarding the client’s requirements before the contractors submit their tenders (European Parliament 2014). The purpose of introducing CD is to give public owners a flexible procurement procedure that enables a dialogue concerning all aspects of the contract with several competitors (Telles and Butler 2014). CD is one of the approaches for early contractor involvement (ECI) and is a procurement procedure that is recognised by EU public procurement law (Wondimu et al. 2016).
Lean thinking is establishing a system that constantly explores ways to reduce waste. Furthermore, it is getting more attention as a way to reduce the costs associated with government procurement (Waterman and McCue 2012). When the Lean Project Delivery
1 PhD Candidate, Department of civil and environmental engineering (IBM), Norwegian University of
Science and Technology (NTNU), Trondheim, Norway/Senior Engineer, Norwegian Public Roads Administration (NPRA), Norway, +4790111814, [email protected]/ [email protected]
2 Researcher, Dr.Art., IBM, NTNU, [email protected] 3 Assoc. prof., Dr.Ing., IBM, NTNU, [email protected]
53 | Proceedings IGLC | July 2017 | Heraklion, Greece
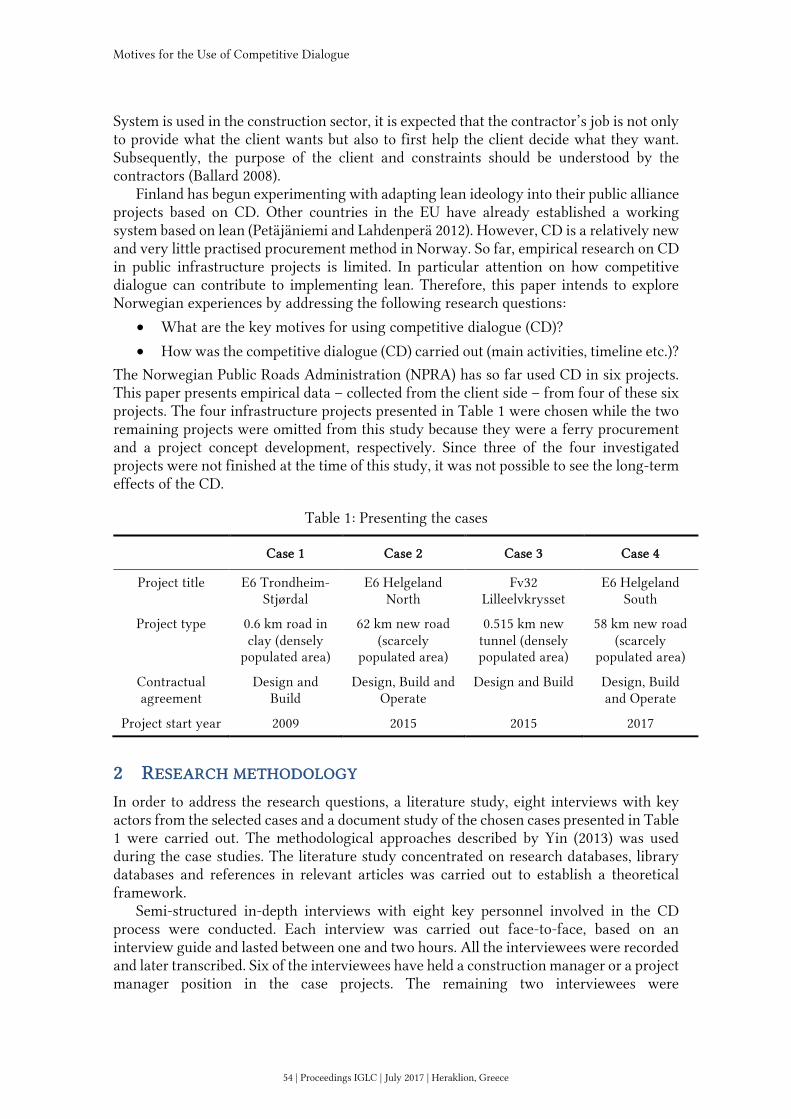
Motives for the Use of Competitive Dialogue
System is used in the construction sector, it is expected that the contractor’s job is not only to provide what the client wants but also to first help the client decide what they want. Subsequently, the purpose of the client and constraints should be understood by the contractors (Ballard 2008).
Finland has begun experimenting with adapting lean ideology into their public alliance projects based on CD. Other countries in the EU have already established a working system based on lean (Petäjäniemi and Lahdenperä 2012). However, CD is a relatively new and very little practised procurement method in Norway. So far, empirical research on CD in public infrastructure projects is limited. In particular attention on how competitive dialogue can contribute to implementing lean. Therefore, this paper intends to explore Norwegian experiences by addressing the following research questions:
• What are the key motives for using competitive dialogue (CD)?
• How was the competitive dialogue (CD) carried out (main activities, timeline etc.)?
The Norwegian Public Roads Administration (NPRA) has so far used CD in six projects. This paper presents empirical data – collected from the client side – from four of these six projects. The four infrastructure projects presented in Table 1 were chosen while the two remaining projects were omitted from this study because they were a ferry procurement and a project concept development, respectively. Since three of the four investigated projects were not finished at the time of this study, it was not possible to see the long-term effects of the CD.
Table 1: Presenting the cases
Case 1 Case 2 Case 3 Case 4
Project title E6 Trondheim-Stjørdal
E6 Helgeland North
Fv32 Lilleelvkrysset
E6 Helgeland South
Project type 0.6 km road in clay (densely
populated area)
62 km new road (scarcely
populated area)
0.515 km new tunnel (densely populated area)
58 km new road (scarcely
populated area)
Contractual agreement
Design and Build
Design, Build and Operate
Design and Build Design, Build and Operate
Project start year 2009 2015 2015 2017
2 RESEARCH METHODOLOGY
In order to address the research questions, a literature study, eight interviews with key actors from the selected cases and a document study of the chosen cases presented in Table 1 were carried out. The methodological approaches described by Yin (2013) was used during the case studies. The literature study concentrated on research databases, library databases and references in relevant articles was carried out to establish a theoretical framework.
Semi-structured in-depth interviews with eight key personnel involved in the CD process were conducted. Each interview was carried out face-to-face, based on an interview guide and lasted between one and two hours. All the interviewees were recorded and later transcribed. Six of the interviewees have held a construction manager or a project manager position in the case projects. The remaining two interviewees were
54 | Proceedings IGLC | July 2017 | Heraklion, Greece

Paulos Abebe Wondimu, Jardar Lohne and Ola Lædre
representatives from the NPRA head office (Vegdirektoratet) who participated in the dialogue phase. The document study consisted of documents received from interviewees, such as contract documents and dialogue invitation documents. The document study was carried out in order to find background information about the cases and how CD is carried out in NPRA. Data triangulation was achieved through different sources of data (interviews and document study).
3 THEORETICAL BACKGROUND
3.1 Lean and public procurement
Lean thinking is not simply adopting a lean tool (Waterman and McCue 2012). Instead, it involves implementing various measures in construction management to remove waste (Song and Liang 2011). Lean is a philosophy that constantly looks to reduce waste and increase customer satisfaction that can be ingrained in a system (Waterman and McCue 2012). Furthermore, it aims to achieve the intended time, cost and quality simultaneously (Tommelein 2015).
Public procurement involves the spending of public money and has impacts on innovation (Uyarra and Flanagan 2010). It is subjected to accountability and detailed procedures since it is exposed to a high risk of fraud and corruption (Erridge and Nondi 1994). The primary consideration of every government should be the efficiency of the procurement process as public resources have become scarce (Waterman and McCue 2012). According to this literature, there seems to be a potential for applying lean thinking to public procurement.
The separation between design and construction in public procurement is generally considered to be inefficient. Principally, the lean philosophy promotes an integration of design and construction (Jørgensen and Emmitt 2009) to reduce waste in construction (Song and Liang 2011). ECI is one of the basic principles of lean to achieve integration between the design team and the construction team (Gil et al. 2000).
When lean thinking is applied in public procurement, it is possible to analyse the current processes for value as well as to identify obvious waste in the process. Furthermore, based on lean thinking it is possible to develop a set of tools and documents to support a standardised process (Waterman and McCue 2012).
3.2 Competitive Dialogue (CD)
CD is explicitly aimed for complex projects which require the development of the best solution to address specific client needs. It is a flexible procedure that secures competition and dialogue (Albano and Sparro 2010). In this process, the client can discuss all aspects of the project with the shortlisted contractors (Uttam and Le Lann Roos 2014). It gives the contracting parties the opportunity to discuss, among other things, sustainability and renewable energy objectives, and the client can ensure its long-term commitments are taken into account (O'Brien and Hope 2010).
CD can be related to other public procurement procedures, as for example the negotiated procedure (Nagelkerke et al. 2008). In the negotiated procedure, direct discussions take place between the owner and one or more contractors of the owner's choice (Erridge and Nondi 1994). On the other hand, it is different from the negotiations procedure because in CD the negotiations are concentrated within a particular phase in the procurement process (European Commission 2006).
55 | Proceedings IGLC | July 2017 | Heraklion, Greece

Motives for the Use of Competitive Dialogue
CD's largest disadvantage is its relatively high transaction costs (Siemonsma et al. 2012). The process is time-consuming and labour-intensive for both the client and contractors. The client should conduct several dialogues to select the qualified contractor and should document the dialogues for the sake of transparency. The contractors should prepare detailed documentation after each dialogue, which costs a lot as well (Hoezen and Hillig 2008).
4 FINDINGS AND DISCUSSION
4.1 What are the key motives for using CD?
The key motives for using CD, which were raised by the interviewees, are presented in the following section. Case 1 is comparable with case 3, and case 2 is comparable with case 4. Therefore, the findings are presented according to the above in the following section.
Regarding case 1 and 3, project complexity (technical difficulty) was the major motive for using CD in these projects. These projects were defined as complex among other things due to sensitive ground conditions (quick clay) and the surrounding environment (since the project was in an urban area). For such a kind of complexity, the client lacked experience and reference projects from similar project challenges. This leads to difficulty in the design and execution of the projects. It was also difficult to estimate the projects’ costs. Besides the projects' complexity, case 1 was the first infrastructure project where the NPRA used CD. Hence, it was used as a pilot project to try the procedure.
Regarding case 2 and 4, the motives of using CD in this project were to identify and determine how the client’s requirements and needs could best be met. Furthermore, the other motives were to create a platform for the client and the individual suppliers to work together to find solutions that best meet client’s needs. The projects' complexity was also the motive to use CD in these two case projects. The projects were defined as complex by taking into consideration the length of the road project (approx. 60KM) and the contract complexity (the contract includes design, construction, operation and maintenance of the road project for 15 years). In addition, the wish to try a new type of contract that can decrease the current conflict level and the problems of the traditional project delivery methods was another motive. To reduce the project risk level during the dialogue phase was also another reason to use CD. The client's need for better solutions constituted the motive for ECI.
According to the findings, project complexity was not the only reason for the use of CD. Besides that, NPRA wanted to achieve other goals as well, such as innovation, low level of conflict, etc. However, the interviewees did not raise any direct motives that were related to lean. Therefore, the underlying motives of implementing CD in the case projects were not to implement lean. However, the key motives for using CD resemble, to a large degree, the motives of lean construction. Some of the CD motives that resemble the motives of lean construction are overcoming project complexity, creating a common platform, identifying how the client's needs can best be fulfilled, reducing the risk level, ECI and obtaining innovative solutions.
4.2 How was the CD carried out?
Eleven main activities used during CD were identified from the case projects. The main activities are showed in Table 2. The first three activities concern preparation phases of the client. The client uses the first two activities to prepare a draft tender document and to plan the dialogue. The third activity is used to evaluate if there is enough capacity in
56 | Proceedings IGLC | July 2017 | Heraklion, Greece
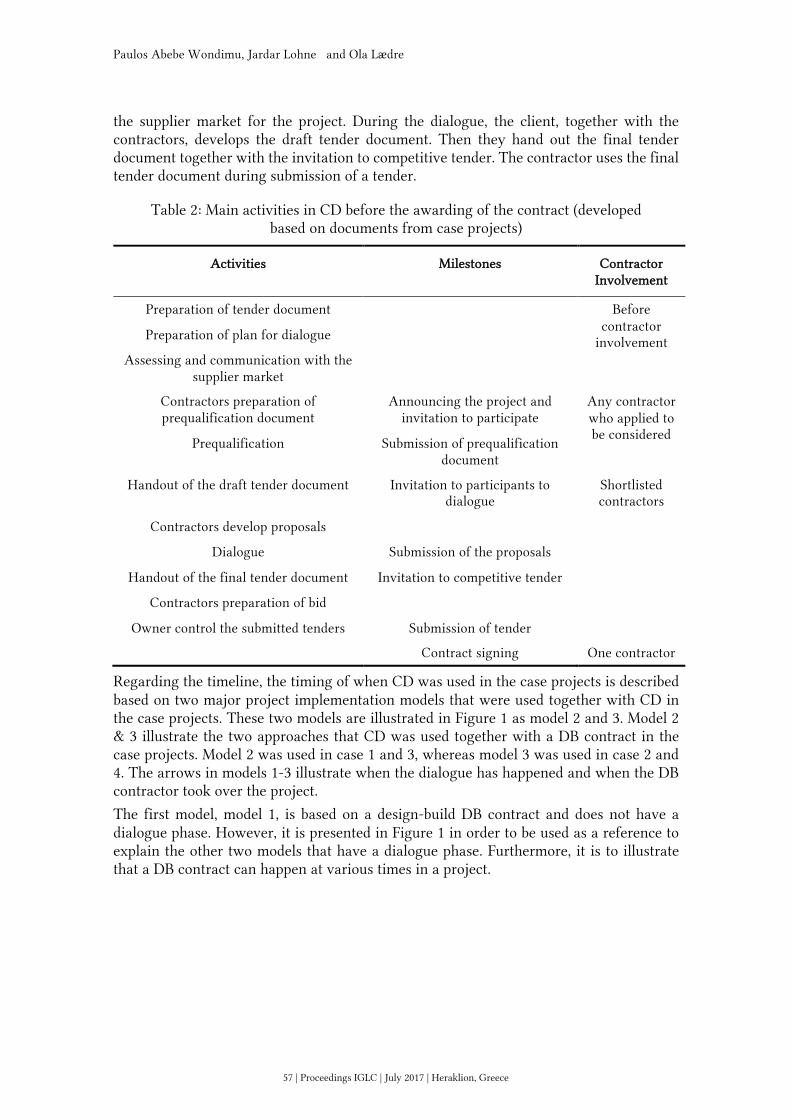
Paulos Abebe Wondimu, Jardar Lohne and Ola Lædre
the supplier market for the project. During the dialogue, the client, together with the contractors, develops the draft tender document. Then they hand out the final tender document together with the invitation to competitive tender. The contractor uses the final tender document during submission of a tender.
Table 2: Main activities in CD before the awarding of the contract (developed based on documents from case projects)
Activities Milestones Contractor Involvement
Preparation of tender document Before contractor
involvement Preparation of plan for dialogue
Assessing and communication with the supplier market
Contractors preparation of prequalification document
Announcing the project and invitation to participate
Any contractor who applied to be considered
Prequalification Submission of prequalification document
Handout of the draft tender document Invitation to participants to dialogue
Shortlisted contractors
Contractors develop proposals
Dialogue Submission of the proposals
Handout of the final tender document Invitation to competitive tender
Contractors preparation of bid
Owner control the submitted tenders Submission of tender
Contract signing One contractor
Regarding the timeline, the timing of when CD was used in the case projects is described based on two major project implementation models that were used together with CD in the case projects. These two models are illustrated in Figure 1 as model 2 and 3. Model 2 & 3 illustrate the two approaches that CD was used together with a DB contract in the case projects. Model 2 was used in case 1 and 3, whereas model 3 was used in case 2 and 4. The arrows in models 1-3 illustrate when the dialogue has happened and when the DB contractor took over the project.
The first model, model 1, is based on a design-build DB contract and does not have a dialogue phase. However, it is presented in Figure 1 in order to be used as a reference to explain the other two models that have a dialogue phase. Furthermore, it is to illustrate that a DB contract can happen at various times in a project.
57 | Proceedings IGLC | July 2017 | Heraklion, Greece

Motives for the Use of Competitive Dialogue
Figure 1: Project implementation models (developed based on documents from
Helgeland projects). DG denotes decision gates. DB denotes design-build contract.
Model 2 was used when the client had several technical alternatives to solve the project challenges but when they were not sure which of the alternatives would be the cheapest to fulfil all their requirements. In this model, the contractors have the possibility to influence how to execute the project. Thus, it is possible to conclude that model 3 was used for technically complex projects.
Model 3 was used for large and complex projects. The complexity of these projects was not limited to the technical level, how to execute it like in the case of model 2, but also in the options of what and where to build. One of the goals of model 3 was that design, construction and operation shall be considered together in order to provide savings and other advantages.
Model 2 and model 3 have a dissimilar length of dialogue phase. The length of the dialogue phase can vary depending on the project's need. Furthermore, the dialogue can take place at different phases of a project. In model 2, the dialogue phase takes place between the preliminary design and the detail design phases. In model 3, the dialogue starts in an earlier phase compared to model 2. It takes place during the preliminary design phase. In addition, in model 3, the contractor has responsibility for the operation and maintenance of the road for 15 years, which is not the case in model 2.
Of the above eleven main activities of CD, the dialogue phase is at the core of the process. It is an important stage to reduce significant waste. This can happen in several ways. The first way is as the contractor gets the possibility to develop the tender document together with the client. The second one is that both the client and the contractor are involved in the development of the project in this phase. The third way is that the client gets support from the contractors in deciding what to build. The fourth way is that individual goals can be aligned to the project goals during the dialogue stage. All this contributes to reducing waste in the project execution phase. Therefore, the dialogue phase in CD can contribute to implementing lean in public infrastructure projects.
58 | Proceedings IGLC | July 2017 | Heraklion, Greece

Paulos Abebe Wondimu, Jardar Lohne and Ola Lædre
5 CONCLUSIONS
This paper has addressed how competitive dialogue can contribute to implementing lean by studying four infrastructure projects in Norway. The key motives for using CD and how it was carried out was the focus of the study.
Project complexity is the requirement from the EU public procurement directive to justify the use of CD. The findings show that, in the studied cases, the owner has had several reasons beyond that to use CD. However, none of the reasons given by the interviewees shows that the direct motive of implementing CD in the studied cases was to implement lean or to remove waste. This might be due to the fact that personnel involved in the CD practising are not lean experts. Thus, it is possible to conclude that the NPRA's primary focus during the use of CD in the case projects was not to implement lean.
However, the key motives for using CD resemble, to a large degree, the motives of lean construction. Some of the CD motives that resemble the motives of lean construction are overcoming project complexity, creating a common platform, identifying how the client's needs can best be fulfilled, reducing the risk level, ECI and obtaining innovative solutions.
Regarding how CD was carried out, eleven main activities of CD and two project implementation models were identified from the case projects. The studied cases have used model 2 and model 3, which have different timings of implementing CD. This study has found that the dialogue phase is at the core of the CD process. Public owners could use it to reduce waste as it promotes integration between the client and the contractor in several ways. Furthermore, the dialogue phase could also be used to better align the motives of CD with the motives of lean.
In the future, the long-term effect of CD could be studied in order to explore how the procedure affects the operation and maintenance phase of projects. In addition, other types of projects than just infrastructure projects could also be studied to cross-reference the experience.
6 REFERENCES Albano, G. L., and Sparro, M. (2010). "Flexible strategies for centralized public
procurement." Review of Economics and Institutions, 1(2). Ballard, G. (2008). "The lean project delivery system: An update." Lean Construction
Journal, 1-19. Erridge, A., and Nondi, R. (1994). "Public procurement, competition and partnership."
European Journal of Purchasing & Supply Management, 1(3), 169-179. European Commission, P. P. P. (2006). "Explanatory Note-Competitive Dialogue-Classic
Directive." Directorate General Internal Market and Services. European Parliament, C. o. t. E. U. (2014). "Directive 2014/24/EU of the European
Parliament and of the Council of 26 February 2014 on public procurement and repealing Directive 2004/18/EC Text with EEA relevance." Official journal of the European Union.
Gil, N., Tommelein, D., Kirkendall, B., and Ballard, G. "Lean product-process development process to support contractor involvement during design." Proc., Computing in Civil and Building Engineering, ASCE, 1086-1093.
Haugbølle, K., Pihl, D., and Gottlieb, S. C. (2015). "Competitive Dialogue: Driving Innovation Through Procurement?" Procedia Economics and Finance, 21, 555-562.
59 | Proceedings IGLC | July 2017 | Heraklion, Greece

Motives for the Use of Competitive Dialogue
Hoezen, M., and Hillig, J.-B. "The Competitive Dialogue Procedure: Advantages, Disadvantages, and its Implementation into English and Dutch Law." Proc., Proceedings COBRA RICS Construction and Building Research Conference., 09.
Jørgensen, B., and Emmitt, S. (2009). "Investigating the integration of design and construction from a “lean” perspective." Construction Innovation, 9(2), 225-240.
Nagelkerke, M., Van Rijn, M., Huith, G., and Van Valkenburg, M. "Competitive Dialogue: Abyss or Opportunity?" Proc., 3rd International Public Procurement Conference Proceedings, 275-294.
O'Brien, G., and Hope, A. (2010). "Localism and energy: Negotiating approaches to embedding resilience in energy systems." Energy Policy, 38(12), 7550-7558.
Petäjäniemi, P., and Lahdenperä, P. "Alliance contracting–one for all and all for one (Finland)." Proc., European Infrastructure Procurement Symposium, Conflict between Institutional Frameworks and Managerial Project Practice. Copenhagen, Danimarca, 12-15.
Siemonsma, H., Van Nus, W., and Uyttendaele, P. (2012). "Awarding of Port PPP contracts: the added value of a competitive dialogue procedure." The flagship journal of international shipping and port research, 39(1), 63-78.
Song, L., and Liang, D. (2011). "Lean construction implementation and its implication on sustainability: a contractor's case study." Canadian Journal of Civil Engineering, 38(3), 350-359.
Telles, P., and Butler, L. (2014). "Public Procurement Award Procedures in Directive 2014/24/EU." Novelties in the 2014 Directive on Public Procurement, Djof Publishing.
Tommelein, I. D. (2015). "Journey toward lean construction: Pursuing a paradigm shift in the AEC Industry." Journal of Construction Engineering and Management, 141(6), 04015005.
Uttam, K., and Le Lann Roos, C. (2014). "Competitive dialogue procedure for sustainable public procurement." Journal of Cleaner Production.
Uyarra, E., and Flanagan, K. (2010). "Understanding the innovation impacts of public procurement." European Planning Studies, 18(1), 123-143.
Waterman, J., and McCue, C. (2012). "Lean thinking within public sector purchasing department: the case of the UK public service." Journal of Public Procurement, 12(4), 505.
Wondimu, P. A., Hosseini, A., Lohne, J., Hailemichael, E., and Lædre, O. "Early Contractor Involvement in Public Infrastructure Projects." Proc., Proc. 24th Ann. Conf. of the Int’l. Group for Lean Construction, sect.3 pp. 13–22.
Yin, R. K. (2013). Case study research: Design and methods, Sage publications.
60 | Proceedings IGLC | July 2017 | Heraklion, Greece

Young, B.K.., Hosseini, A., and Lædre, O. (2017). “A Comparison of Project Alliancing and Lean Construction” In: LC3 2017 Volume II – Proceedings of the 25th Annual Conference of the International Group for Lean Construction (IGLC), Walsh, K., Sacks, R., Brilakis, I. (eds.), Heraklion, Greece, pp. 61–68. DOI: https://doi.org/10.24928/2017/0196
A COMPARISON OF PROJECT ALLIANCING AND LEAN CONSTRUCTION
Brendan K. Young1, Ali Hosseini2, and Ola Lædre3
Abstract: As the adoption of both alliancing and lean in the construction industry has started becoming more prevalent, knowledge of the alignment of Lean Construction with alliancing could be valuable to practitioners looking at adopting lean project delivery. This paper contributes to addressing this issue by providing insight into the relationship between the alliancing project delivery method and Lean Construction project delivery through the review of a literature review, interviews and a document study. A major driver of alliancing is to deliver value for money to the client, so it comes as a surprise that, to this date, alliancing has yet to fully capitalize on the Lean Construction operating system to drive the pursuit of maximum value. The inclusion of a lean operating system would require only minor changes to the existing structure of a standard project alliancing agreement. Alliancing could essentially remain the same, both structurally and commercially, while incorporating Lean Construction methods and tools into its operating system. In the right circumstances, this combination could be used to deliver greater value to the client.
Keywords: Alliancing, Lean Construction, Operating System, Organisation, Commercial.
1 INTRODUCTION Alves and Tsao (2007), through their study of IGLC papers from 2000 – 2006, identified that there has been a lack of research among the IGLC community in the area of relational contracting. They suggested that researchers “strive to understand how to implement relational contracting, measure its outcomes, and explain project results to help provide guidance to owners that are interested in working towards lean project delivery.” (Alves and Tsao 2007, 57). Ten years later, there is still a gap in the literature comparing project alliancing (PA) and Lean Construction (LC). This paper contributes to addressing this issue by providing insight into the relationship between the PA and LC project delivery methods.
Previous work by the authors shows that alliancing does in fact inherently align with some key LC principles, particularly in four of the five LC principles identified by Diekmann et al. (2004), namely customer focus, culture and people, waste elimination, and
1 Graduate Research Assistant, NTNU - Norwegian University of Science and Technology, Trondheim,
Norway, +47 944 31 715, [email protected] 2 PhD Candidate, NTNU - Norwegian University of Science and Technology, Trondheim, Norway, +47
913 09 166, [email protected] 3 Associate Professor, NTNU - Norwegian University of Science and Technology, Trondheim, Norway,
+47 735 94 739, [email protected]
61 | Proceedings IGLC | July 2017 | Heraklion, Greece

A Comparison of Project Alliancing and Lean Construction
continuous improvement. The research at that time lacked sufficient findings to show an alignment in the fifth principle of workplace standardization. To give a visual representation of the alignment between PA and LC we refer to the Lean Construction triangle in Error! Reference source not found..
There is sufficient evidence for PA and LC alignment concerning the organization and commercial sides of the triangle. Alliancing is associated with the principle of customer focus, a key element of the commercial side of the triangle. On the organizational side, we have shown alignment in the areas of culture/people, waste elimination and continuous improvement. The research uncovered insufficient evidence to comment on the alignment between the operating system side of the triangle and is therefore the departure point for this paper.
There is a view that despite a lack of direct influence from alliancing, Integrated Project Delivery (IPD) can be seen as a combination of an alliance contract and governance system with a LC operating system (Raisbeck et al. 2010). Since IPD developed independently from alliancing yet resembles a combination of PA and LC, what would the potential outcomes be if PA and LC were combined intentionally? The fact that there is an inherent alignment between the organizational and commercial domains shows that such a combination is plausible, while the existence of IPD shows that it is possible.
The initial findings identified that a possible key difference between PA and LC appears in the operating system. Alliancing seems to lack the workplace standardization and the use of tools associated with LC. This paper will expand on this point by focusing in on the operating system side of the triangle. To provide a clear focus, the following research questions were identified:
• What are the similarities and differences between the two project delivery methods?
• Is there potential for the two systems to learn from each other?
Thomsen et al. (2009) uses the above triangle to represent the three domains of all project delivery systems. Domains must be in alignment and balanced to ensure that the delivery system is coherent and optimal. Using this model as a departure point, the paper begins by exploring the balance and alignment between these three domains for both PA and LC. Once a high-level understanding of each of these methods is established, a deeper exploration is made into their operating systems. This exploration forms the basis for a comparison between the PA and LC operating systems, noting any key differences and similarities between the two. Finally, conclusions are drawn and recommendations made for further research.
2 METHOD
A literature search was undertaken following the five steps prescribed by Blumberg et al. (2014). Step 1 was to define the questions to be answered after the literature search. Step 2 and 3 was to identify and apply key search terms in primary sources (for example
62 | Proceedings IGLC | July 2017 | Heraklion, Greece

Brendan K. Young, Ali Hosseini, and Ola Lædre
databases and search engines). In step 4, secondary sources were located and reviewed (for example by scanning references). Step 5 was to evaluate the sources and the content. After this search, a review of the literature formed the basis for the theoretical background. To gain insight into both the academic and practical aspects of the operating systems, findings from both journal articles and conference papers (mostly primary sources) are used in combination with findings from government and industry publications (mostly secondary sources).
After the literature review, two of the authors undertook a series of 27 semi-structured in-depth interviews – following the descriptions of (Yin 2013) – in Australia in early 2016. The interview questions were formulated after the literature review was almost finished, and each interviewee received a transcript afterwards to avoid misunderstandings.
A document study was carried out after the literature search and interviews, where the documents were what (Weber 1990) denotes as sampling population. The purpose of this document study was to supplement the secondary sources found during the literature search. The main source for identifying relevant documentation were the interviewees, who both recommended and provided documents.
3 THEORETICAL BACKGROUND
In order to draw conclusions on the similarities and differences between PA and LC, an exploration of the current theory on each topic was undertaken. As the adoption of both alliancing and lean in the construction industry has become more prevalent, an understanding of the lean principles inherent in alliancing could be valuable to practitioners looking at adopting lean project delivery. Many countries, particularly in Europe, have started adopting alliancing in recent years. In addition, Finland, who adopted alliancing in 2007, has begun experimenting with adopting lean ideology into their alliance projects (Petäjäniemi and Lahdenperä 2012). The authors will explore the practical findings based on the outcome of this combination of lean and alliancing in Finland in later publications once enough completed projects are available to provide significant findings. A clear understanding of the current similarities between PA and LC from a theoretical view could help improve this adoption and could potentially lead to the creation of improved project delivery models.
IPD is a method used mostly in the USA that has many similarities to alliancing, with the one major difference that IPD incorporates a number of LC elements (Lahdenperä 2012; Raisbeck et al. 2010). IPD’s use is mostly concentrated in America, yet the principles of lean are more prevalent worldwide. Alliancing is often considered at the top end of collaborative and relational contracting (Ross 2003) and is more widely distributed across the globe (Chen et al. 2012; Ingirige and Sexton 2006). In addition, IPD and Alliancing have often been used for different types of projects (Lahdenperä 2012). The authors believe that there is sufficient difference between alliancing and IPD to warrant such a study, and as such, a full exploration into the differences between IPD and alliancing will not be explored further in this paper but can be found in the studies by Lahdenperä (2012) and Raisbeck et al. (2010).
3.1 Project Alliancing
PA is a collaboration between a client, service providers and contractors where they share and manage the risks of the project together (Chen et al. 2010). All parties’ expectations and commercial arrangements are aligned with the project outcomes and the project is driven by a best-for-project mindset, where all parties either win together, or lose together
63 | Proceedings IGLC | July 2017 | Heraklion, Greece
A Comparison of Project Alliancing and Lean Construction
(Chen et al. 2012; Walker et al. 2013). The contract is designed around a non-adversarial legal and commercial framework with all disputes and conflicts resolved from within the alliance (Henneveld 2006). This type of project delivery can lead to improved project outcomes and value for money, in part due to the increased level of integration and cooperation between planners, design teams, contractors and operators (Love et al. 2010).
Alliancing as a model is well addressed in the literature and thus will not be discussed in great detail here. Previous research determined the most common characteristics of a project that may influence the decision to proceed with an alliance as the preferred PDM and provides an up-to-date look at the critical success factors and barriers to alliancing (Young et al. 2016a). Alliancing: A Participant’s Guide is a detailed industry publication that addresses alliancing from the perspectives of both the owner and non-owner participants (NOP) (Morwood et al. 2008), and Introduction to Project Alliancing is a valuable piece of the alliancing body of knowledge (Ross 2003).
Project alliances are suitable – and most often used – for projects that have tight timeframes, multiple or complex stakeholder issues, are uncertain, complex and/or high risk (Young et al. 2016a). The organization domain of PA focuses on the high level of team integration necessary to deal with such projects. Alliancing uses a fully integrated project team that is co-located (in most cases) for the entire duration of the project. A board made up of equal representation of senior leaders from each party, known as the alliance leadership team (ALT), governs the alliance. The ALT makes decisions unanimously and handles all disputes (that cannot be handled at the management level) in house (with the exception of willful default), reinforcing the high level of team integration. The level of integration experienced in alliancing is at such a level where an alliance essentially becomes a ‘virtual’ organization.
The commercial domain of alliancing is made up of, in large part, the three-limbed compensation model. In recent times, alliance contracts have been structured around the three-limbed approach: (Ross 2003; Walker et al. 2015):
• Limb 1: all the directly reimbursable costs including project-specific overheads.
• Limb 2: corporate overheads and profit for each NOP, determined by an independent auditor and is placed ‘at-risk’ according to the pain/gain arrangement.
• Limb 3: incentivized cost-reimbursement where all participants share in the pain/gain associated with how the alliance performs against pre-arranged targets in cost (e.g. the target outturn cost and non-cost key result areas).
This three-limbed model creates a contractual alignment between all parties and provides the financial mechanisms that align the client and NOPs’ interests and objectives.
The operating system of alliancing isn’t known to be associated with a specific set of tools in the way that LC is. In a general sense, alliancing can be seen to behave in a similar way that a design and construct (D&C) project would (Marosszeky and Ward 2010) by using common project management (PM) methods and tools. On a day-to-day level the alliance is run by an alliance management team (AMT), whose responsibility is to work with the alliance manager to drive the operational project delivery (Morwood et al. 2008). The authors are yet to see any prescriptions in the literature explicitly dictating how to operate an alliance. The literature often deals with what to achieve, i.e., the clients value for money statement, delivery of project objectives etc., but not how to achieve it. It seems that alliances do in fact rely on common PM methods and tools unspecific to any particular PDM. Given the extent to which common PM methods and tools are prevalent in the construction industry, they will not be covered in detail here.
64 | Proceedings IGLC | July 2017 | Heraklion, Greece

Brendan K. Young, Ali Hosseini, and Ola Lædre
3.2 Lean Construction
Lean Construction was born out of the success of the lean philosophy that developed in the manufacturing industry. Both lean and the development of LC are well described in literature [Lean: (Ballard et al. 2001; Diekmann et al. 2004; Krafcik 1988; Liker 2004) and LC: (Howell and Ballard 1998; Howell 1999; Koskela 1992; Picchi 2001)]. Therefore, this information will not be covered. This paper will instead focus on the way LC addresses and balances the three domains of the LC triangle.
LC addresses the domain of project organization through the promotion of an integrated organization, the creation of cross-functional teams and the alignment of participants’ interests. LC aims to break down the barriers between different organizations, and between the different functional silos that are present within most organizations. The organizations can reduce waste by avoiding the separation of design and construction and the sequential nature of processes often found in traditional project delivery. The alignment of interests is achieved by combining the promotion of collaboration with a major focus on the achievement of value as defined by the customers (both internal and external). This alignment extends not only to the alignment of different organizational objectives but also to the alignment of employees to each other and their own organizations (Azari-Najafabadi et al. 2011).
A key element of the LC operating system is characterized by the use of tools. While a tool in and of itself cannot be described as LC, the application and use of tools in a project embodies LC if it eliminates waste and/or maximizes value in the project. The same tools applied poorly could lead to the opposite effect by creating waste and not value (Thomsen et al. 2009). A number of tools have developed out of the lean community that have been employed in construction projects. These include, but are not limited to: Last Planner System™, Increased Visualization, 5S Process, First Run Studies, Daily Huddle Meetings, Fail Safe for Quality and Safety, Plan-Do-Check-Act, A3 Reports, Value Stream Mapping and Target Value Design (Salem et al. 2005; Thomsen et al. 2009).
Addressing the commercial domain is not so straight forward since LC itself is not considered to be a typical project delivery contract strategy. The commercial domain has do to with the “compensation method, contractual assignment of roles and responsibilities, and financial mechanisms which can result in alignment of interests within a project organization, if properly designed, etc.” (Azari-Najafabadi et al. 2011, 428). The research has uncovered many ways that LC can lead to alignment of interests within a project, but not in the specific commercial aspects of a compensation model or financial mechanism. This gap is often where, in the LC community, IPD steps in to handle the commercial contractual arrangements.
4 FINDINGS AND DISCUSSION
This discussion presents the authors’ interpretation of the findings that have resulted from this research. This discussion explores the three project delivery domains of both PA and LC in order to determine the similarities and differences between the two and to identify the potential for lessons learned to be passed from one to the other and vice versa.
Alliancing is structured in a way that creates full alignment of the three domains. The shared risk and pain/gain arrangements combined with the alignment of client and commercial participants’ objectives creates an entity that is adept at dealing with projects that are high risk or have high levels of uncertainty. When combined with unanimous decision-making, no dispute clause and open book, it helps to promote the win-win
65 | Proceedings IGLC | July 2017 | Heraklion, Greece

A Comparison of Project Alliancing and Lean Construction
principle of PA necessary to deal effectively with issues that arise. When problems arise, it is in the best interest of all parties to find the best-for-project outcome, and find it quickly. The full integration of the organizational domain combined the commercial aspects creates a situation where the emphasis of contract management in the typical sense is removed and full focus can be placed on the operation of the alliance.
It seems that, even with a good balance between the domains, alliancing hasn’t made any leaps forward in terms of revolutionizing its operating system when compared to traditional PDMs. The success of alliancing seems to be due to the innovations made in the organizational and commercial domains. Such a finding leads the authors to believe that alliancing could be greatly improved by focusing on its operating system.
LC as a method of management seems to operate mostly in the organizational and operating system domains. Despite deficiencies in what is commonly understood to be the commercial domain, LC maintains a high-level alignment between the other two domains. This alignment makes it particularly adaptable to being incorporated into a wide range of commercial models.
Considering both PA and LC from this perspective, we can see that they are highly compatible. They share many similarities in the organization domain in that they both strive to achieve full integration to the effect that value is maximized for the client. PA has a fully functioning commercial domain that is inherently aligned with the principles of LC (Young et al. 2016b), thus making PA and LC highly compatible in this area. In the operating system domain, PA relies on traditional approaches to project management and does not have a specific set of prescribed methods and tools of its own. This void creates a situation where a full LC operating system, i.e., tools and methods such as LPS, Increased Visualization, 5S etc., could be seamlessly introduced into an alliance without fundamentally changing the alliance itself.
The findings show that there is great potential for PA and LC to learn from each other. This possibility has been demonstrated practically via the adoption of alliance-like governance and commercial aspects into LC, creating the IPD model. On the other hand, the alliancing model could benefit from LC, particularly from its operating system, while still staying true to the structure and principles that make alliancing what it is today.
5 CONCLUSIONS A major driver of alliancing is to deliver value for money to the client, so it comes as a surprise that, to this date, alliancing it yet to fully capitalize on the LC operating system to drive the pursuit towards maximum value. Despite the presence of PDMs that resemble a combination of PA and LC, namely IPD, alliancing, in its own right, has solidified its place alongside such PDMs in the project delivery toolkit available to clients. The presence of IPD does not make alliancing obsolete and the inclusion of a LC operating system into standard PA would not necessarily become IPD either.
Regarding the similarities and differences between the two project delivery methods, the similarities are in the organizational domain while differences exist on the commercial and operating system domains. Despite the differences in the commercial domains, PA does inherently align with LC principles, making the two compatible in this area. The major difference in the operating system domain is that LC relies on a specific set of tools to handle daily operations while PA uses non-specific tools from the common PM toolkit.
There is potential for the two systems to learn from each other. Particularly, alliancing could learn from the LC operating system. The inclusion of a lean operating system would not require any major changes to the existing structure of a standard PA agreement.
66 | Proceedings IGLC | July 2017 | Heraklion, Greece

Brendan K. Young, Ali Hosseini, and Ola Lædre
Alliancing could essentially remain the same, structurally and commercially, while incorporating LC methods and tools into its operating system. This integration is made possible due to the inherent alignment between alliancing and the lean construction principles in the organizational and commercial domains.
The authors aim to study the practical implications of this concept by reviewing the outcomes of a number of Finnish alliances that are in the process of experimenting with the inclusion of the lean construction philosophy, tools and methods. Based on these theoretical findings, the expectation is that this implementation will deliver positive results and key lessons learned.
6 REFERENCES
Alves, T., and Tsao, C. (2007). "Lean construction–2000 to 2006." Lean Construction Journal, 46.
Azari-Najafabadi, R., Ballard, G., Cho, S., and Kim, Y.-W. (2011). "A dream of ideal project delivery system." Proc. of The Architectural Engineering Conference (AEI)–Building Integrated Solutions, 427-436.
Ballard, G., Koskela, L., Howell, G., and Zabelle, T. (2001). "Production system design: Work structuring revisited." White Paper, 11.
Blumberg, B. F., Cooper, D. R., and Schindler, P. S. (2014). Business research methods, McGraw-hill education.
Chen, G., Zhang, G., Xie, Y.-M., and Jin, X.-H. (2012). "Overview of alliancing research and practice in the construction industry." Architectural Engineering and Design Management, 8(2), 103-119.
Chen, G., Zhang, G., and Xie, Y. (2010). "Overview of the Australia-based studies on project alliancing." Proceeding of the Australiasian Universities Building Education Association (AUBEA), 35th Annual Conference, 1-15.
Diekmann, J. E., Krewedl, M., Balonick, J., Stewart, T., and Wonis, S. (2004). "Application of Lean Manufacturing Principles to Construction." The Construction Industry Institute, Austin, Texas.
Henneveld, M. (2006). "Alliance Contracting--Removing the Boundaries for Infrastructure Delivery." Annual Conference & Exhibition of the Transportation Association of Canada.
Howell, G., and Ballard, G. (1998). "Implementing lean construction: understanding and action." Proc. 6 th Ann. Conf. Intl. Group for Lean Constr.
Howell, G. A. (1999). "What is lean construction-1999." Proc. Ann. Conf. Intl. Group for Lean Constr, Citeseer, 1.
Ingirige, B., and Sexton, M. (2006). "Alliances in construction: investigating initiatives and barriers for long-term collaboration." Engineering, Construction and Architectural Management, 13(5), 521-535.
Koskela, L. (1992). Application of the new production philosophy to construction, Stanford University Stanford, CA.
Krafcik, J. F. (1988). "Triumph of the lean production system." MIT Sloan Management Review, 30(1), 41.
Lahdenperä, P. (2012). "Making sense of the multi-party contractual arrangements of project partnering, project alliancing and integrated project delivery." Construction Management and Economics, 30(1), 57-79.
Liker, J. K. (2004). The Toyota Way: 14 Management Principles from the World's Greatest Manufacturer, McGraw-Hill, New York.
67 | Proceedings IGLC | July 2017 | Heraklion, Greece

A Comparison of Project Alliancing and Lean Construction
Love, P. E., Mistry, D., and Davis, P. R. (2010). "Price competitive alliance projects: identification of success factors for public clients." Journal of Construction Engineering and Management.
Marosszeky, M., and Ward, M. (2010). "Public Sector Experience with the Use of KRA and KPI Frameworks onAlliances − to Incentivise Performance in Non-cost areas of Delivery." Evans and Peck.
Morwood, R., Scott, D., and Pitcher, I. (2008). "Alliancing: A Participant’s Guide." Published by Maunsell AECOM.
Petäjäniemi, P., and Lahdenperä, P. (2012). "Alliance contracting–one for all and all for one (Finland)." European Infrastructure Procurement Symposium, Conflict between Institutional Frameworks and Managerial Project Practice.
Picchi, F. A. (2001). "System view of lean construction application opportunities." Proc. Ann. Conf. Intl. Group for Lean Constr, 39-50.
Raisbeck, P., Millie, R., and Maher, A. (2010). "Assessing integrated project delivery: a comparative analysis of IPD and alliance contracting procurement routes." Management, 1019, 1028.
Ross, J. (2003). "Introduction to project alliancing." Alliance Contracting Conference. Salem, O., Solomon, J., Genaidy, A., and Luegring, M. (2005). "Site implementation and
assessment of lean construction techniques." Lean Construction Journal, 2(2), 1-21.
Thomsen, C., Darrington, J., Dunne, D., and Lichtig, W. (2009). "Managing integrated project delivery." Construction Management Association of America (CMAA), McLean, VA, 105.
Walker, D., Harley, J., and Mills, A. (2013). "Longitudinal Study of Performance in Large Australasian Public Sector Infrastructure Alliances." RMIT University, Melbourne, Victoria.
Walker, D. H. T., Harley, J., and Mills, A. (2015). "Performance of project alliancing in Australasia: a digest of infrastructure development from 2008 to 2013." Construction Economics and Building, 15(1), 1-18.
Weber, R. P. (1990). Basic content analysis, Sage. Yin, R. K. (2013). Case study research: Design and methods, Sage publications. Young, B. K., Hosseini, A., and Lædre, O. (2016a). "The Characteristics of Australian
Infrastructure Alliance Projects." Energy Procedia(96), 833-844. Young, B. K., Hosseini, A., and Lædre, O. (2016b). "Project Alliances and Lean
Construction Principles." 24th Annual Conference of the International Group for Lean Construction Boston, USA.
68 | Proceedings IGLC | July 2017 | Heraklion, Greece

ENABLING LEAN WITH INFORMATION TECHNOLOGY TRACK
Track Chair:
Claudio Morgues
Pontificia Universidad Catolica de Chile
69 | Proceedings IGLC | July 2017 | Heraklion, Greece

70 | Proceedings IGLC | July 2017 | Heraklion, Greece

Bataglin F. S., Viana D. D., Formoso C. T. and Bulhões I. R. (2017). “Application of BIM for Supporting Decision-making Related to Logistics in Prefabricated Building Systems.” In: LC3 2017 Volume II – Proceedings of the 25th Annual Conference of the International Group for Lean Construction (IGLC), Heraklion, Greece, pp.71–78 DOI: https://doi.org/10.24928/2017/0278
APPLICATION OF BIM FOR SUPPORTING DECISION-MAKING RELATED TO LOGISTICS IN PREFABRICATED BUILDING SYSTEMS
Fernanda S. Bataglin1, Daniela D. Viana2, Carlos T. Formoso3 and Iamara R. Bulhões4
Abstract: Managing industrialised construction requires an accurate synchronisation of design, manufacturing and assembly processes. Considering the high uncertainty and the interdependences between different processes on site, it is important to consider the status of the construction site in the planning and control process. Understanding the demands of site assembly in terms of components is a key step for integrating fabrication and site assembly. One possible approach is to use Building Information Modelling (BIM) for planning the logistics operations of prefabricated building systems.
The aim of this paper is to describe an application of BIM 4D modelling for supporting the planning and control process of logistics operations for Engineer-to-order (ETO) concrete prefabricated structures. Design Science Research was the methodological approach adopted in this investigation, which involved an empirical study carried out in partnership with a company that design, produces and assemble prefabrication concrete structures. The main contribution of this investigation is on how to increase the reliability of information exchanges by concentrating product and process information in a BIM model. Also, some guidelines on how to plan loading and unloading operations, and how to use BIM to assess changes in production plans, considering the logistics impacts.
Keywords: Industrialised construction, logistics process, 4D BIM simulation, planning loads, lean construction.
1 INTRODUCTION Building projects have become increasingly complex due to several factors: need to increase building performance, product flexibility, high uncertainty in some markets, and the large number of specialists involved. The growing complexity, associated with the need to reduce project duration, reduce costs and improve working conditions have encouraged the adoption of prefabricated building components and systems, which are often produced offsite. Differently from the idea of mass-producing off-the-shelf parts, this type of industrialisation requires customised design and fabrication, being similar to Engineer-to-order (ETO) production systems in manufacturing (Eastman et al., 2011). In this type of production system, design and production do not start until a customer order is confirmed (Powell et al., 2014).
1 M.Sc. Student, School of Engineering, Building Innovation Research Unit (NORIE), Federal University
of Rio Grande do Sul (UFRGS), Porto Alegre, Brazil, [email protected] 2 Assistant Professor, Interdisciplinary Department, CLN, UFRGS, Porto Alegre, Brazil,
[email protected] 3 Professor, School of Engineering NORIE, UFRGS, Porto Alegre, Brazil, [email protected] 4 Assistant Professor, Interdisciplinary Department, CLN-UFRGS, Porto Alegre, Brazil,
71 | Proceedings IGLC | July 2017 | Heraklion, Greece

Application of BIM for Supporting Decision-making Related to Logistics in Prefabricated Building Systems
Production planning and control in this type of production system plays the role of coordinating different types of flows (design information, fabrication, logistics operations, and site assembly), in an environment that usually has a high level of uncertainty (Viana, 2015). In fact, the scope of planning and control for prefabricated building systems tends to be different from traditional construction. A major challenge in the management of prefabricated building systems is to avoid stoppages and the increase in work-in-progress due to the lack of components available. However, this does not mean that all materials should be ordered as early as possible and stored on site, but rather that they should arrive just in time (Skjelbred et al., 2015).
The primary focus of logistics in construction is to improve coordination and communication between project participants during the design and construction phases, particularly in the materials flow control process (Agapiou et al., 1998). In prefabricated building systems, a higher level of coordination and frequent exchanges of information is necessary, due to the need to integrate different units of the same company, or sometimes to engage external suppliers of components (Čuš-Babič et al., 2014).
In order to reach a balance between on-site buffers of components and just-in-time deliveries. some conditions must be considered: uncertainty and variability in site conditions and upstream flows, distance to the supplier, lead time, the level of detail in the plans, and the amount of storage space on site (Skjelbred et al., 2015). The definition of the transportation batches is a key decision for controlling the flow of components and synchronising the production in both the prefabrication plant and assembly site. Those batches should be sized and designed according to the project, and are hard to be standardised in ETO production systems. In that case, a load plan needs to be produced for specific loads, describing what should go in the truck, and when it should arrive at the site.
Numerous research studies have pointed out the benefits of Building Information Modelling (BIM), especially by using 4D modelling to support production planning and control, such as testing alternative sequences of tasks (Chau et al., 2004), predicting logistics problems (Hartmann et al., 2008), detecting spatial conflicts between tasks (Akinci et al., 2002), monitoring progress discrepancies (Golparvar-Fard et al., 2009), improving site layouts (Ma et al., 2005) and analysing workspace congestion (Chavada et al., 2012). BIM enables a wide range of information to be stored and connected to a virtual building representation, which is produced by different project participants. This virtual model has the ability to store different types of information, including geometric, semantic and topological information (Schlueter and Thesseling, 2009).
However, none of those studies has addressed the process of planning and controlling logistics operations for prefabricated building systems such as loading and unloading components, movement of equipment, and control of site inventories. Moreover, little emphasis has been given to the interactions between traditional production planning and control systems with the management of site logistics in an organisational context. Indeed, most BIM tools are designed to handle permanent building objects, and temporary objects have received far less attention (Karan and Irizarry, 2015). Only a few and very specific aspects of logistics have been discussed so far, mostly related to the positional planning of inventories and workspaces. In fact, in most studies 4D models are simply a translation of the output of a CPM network (Jongeling and Olofsson, 2007) that contains only value-adding activities, a practice widely criticised by the Lean Construction Community.
The aim of this paper is to describe an application of BIM 4D modelling for supporting the process of planning and controlling logistics operations for prefabricated concrete structures. This application assumes that in ETO prefabricated building systems the
72 | Proceedings IGLC | July 2017 | Heraklion, Greece

Fernanda S. Bataglin, Daniela D. Viana, Carlos T. Formoso and Iamara R. Bulhões
manufacturing process must be pulled according to the assembly process status, similarly to what is prescribed in the Last Planner SystemTM. This application supports decision-making in the definition of the loading operations that need to be carried out, considering the priorities established in the long terms plans, the existing inventories in the plant yard, and site constraints. This was based on an empirical study carried out in collaboration with a large company that delivers concrete prefabricated structures in Brazil.
2 RESEARCH METHOD
Design Science Research (DSR) was the research approach adopted in this investigation. The aim of DSR is to develop innovative solutions that solve practical problems and at the same time allow a theoretical contribution (Kasanen et al., 1993). Problems from real world are investigated and one of the research outcomes is the development of artefacts such as models, diagrams, plans, organisation structures, and information system designs (Lukka, 2003). The research process was divided into the following phases: understanding the problem, development of the artefact, and analysis and reflection. It was conducted in close collaboration with the concrete prefabrication company (named Company A), similarly to an action research process. Several learning cycles were undertaken during the implementation process. This research study is part of a broader research project that aims to implement improvements in the production system and assembly process of concrete prefabricated structures.
Company A is a company that delivers complete solutions of prefabricated concrete structures for building projects in Brazil, often involving customised components. This can be described as an Engineer-to-order production system. This research study was focused on the delivery of prefabricated concrete structures for a university campus, located in Porto Alegre, which corresponds to 67% of the total constructed area of the building. The components for this project were all produced in a prefabrication plant located 740 km away. This company was chosen because they had an improvement program based on the Lean Production Philosophy, and was interested in the use of BIM for managing logistics operations.
The study lasted 11 months, covering the whole period of site assembly. Multiple sources of evidence were used in this investigation: (i) unstructured interviews were carried out with different stakeholders from the concrete prefabrication company and from the construction company, such as the site managers from each company, assistants and crew leaders from the prefabricated contractor; (ii) document analysis, including 2D designs and activity plans, spreadsheets of load plans and components status report; (iii) participant observations in short-term planning meetings, involving representatives of both companies, with an average duration of 1 hour, to discuss the construction progress; (iv) meetings with site manager, with 30 minutes length, were performed during 26 site visits, for short-term plan discussions and planning load discussions, using 4D simulation to understand assembly sequence. Besides, three workshops involving the research team and company’s representatives were carried out to create a discussion group, providing a common understanding of concepts and practices as well as diagnosis carried out on the construction site. In addition, two plant visits were performed at the company headquarters in Curitiba to understand the production process of components.
73 | Proceedings IGLC | July 2017 | Heraklion, Greece

Application of BIM for Supporting Decision-making Related to Logistics in Prefabricated Building Systems
3 EMPIRICAL STUDY
3.1 3D and 4D Modelling
The modelling process was divided into two stages. First, a 3D model was produced, using the 2D structural design as a starting point. Then, a 3D model of the construction site was devised, including, besides the prefabricated components, some temporary facilities, pathways and main equipment. The codes used for identifying each prefabricated component in the structural design were used in the 3D model, as this is an important identification throughout all company controls. Figure 1 provides an example of the code used for identifying a component in a 2D drawing (a), and the attributes assigned to that component in the 3D BIM model. In this case, families of the component were created, by creating a specific ID for each of them.
Figure 1 – Components Code in the 2D drawing (a) and in the BIM model (b)
The 4D model was generated in the Synchro Professional software, based on the schedule from the construction site The long-term plan provided by the company was used only as starting point for the creation of the activities schedule in the 4D simulation software. A coding system for the assembly activities was created, combining the position (axis) of the component, the type of component to be assembled (columns, beams or slabs) and the identification of the assembly stage. Figure 2 presents an example of the coding system.
Figure 2 – Example of the coding system for site assembly activities
3.2 Existing process for planning the load
A key activity in logistics operations is planning the loads, based on the definition of transportation batches. It is worth noting that concrete prefabricated components should
74 | Proceedings IGLC | July 2017 | Heraklion, Greece

Fernanda S. Bataglin, Daniela D. Viana, Carlos T. Formoso and Iamara R. Bulhões
not be stored on site, i.e. the delivery date and the sequence of transportation batches should match the assembly date and sequence. In that context, the task of planning the loads becomes more critical than when is possible to site inventories. Before the improvements were implemented, this process was carried by manually matching the components described on 2D drawings and the site assembly schedule, in order to generate a daily list of the required components. In parallel, the production planning and control department from the plant should provide the components status report, containing updated information about the status of each component (e.g. not produced, produced, ready to ship). After that, the site manager should check if the required components would be ready on time for shipping. Then, the loads were planned based on the availability of the components.
Figure 3 represents schematically this process. The load plans were produced every fifteen days, containing approximately forty-five loads - each load had eight components on average. The load plans were sent to the planning and control department 15 days before they were required on site, in order to confirm the production of components and 2 days in advance to the expedition department to confirm the site assembly demand.
Figure 3 - Schema of existing process of planning the load
3.3 Changes introduced in the process of planning the loads
A major change in the process of planning the loads was the introduction of a 4D BIM model containing all necessary information about prefabricated concrete components. By assigning objects of the 3D model to each scheduled activity, planners could easily visualise the progress of the site-assembly process, and the batch size assigned to each crew, reducing the possibility of errors while planning the loads. Figure 4 represents the interface of the 4D BIM software, which displays a bar chart containing the activities to
75 | Proceedings IGLC | July 2017 | Heraklion, Greece

Application of BIM for Supporting Decision-making Related to Logistics in Prefabricated Building Systems
be performed on a given day, and the model containing geometric, semantic and topological information of each object of the model.
Figure 4 - Interface of the 4D BIM simulation software
An activity list was exported from the model in Synchro software, containing useful information for making decisions about planning the loads. Each line of this Microsoft Excel spreadsheet (Figure 5) relates to all types of components (such as columns, beams, slabs), in a specific location, during a specific period.
Figure 5 - Spreadsheet with list of activities and the assigned resources
The information from the production status report was included in this spreadsheet to analyse if the required components were ready to be shipped. The spreadsheet was designed for automatically update this information from the status report, creating a new tool for the process of planning loads. Error! Reference source not found. shows the information arrangement of the spreadsheet, highlighting (dashed line) the required inputs in terms of location axes and level.
Figure 6 - Spreadsheet of planning the loads
76 | Proceedings IGLC | July 2017 | Heraklion, Greece

Fernanda S. Bataglin, Daniela D. Viana, Carlos T. Formoso and Iamara R. Bulhões
After using the tool, the site manager reported a 33% reduction in the time spent on this activity. This happened because several non-value-adding activities were eliminated (e.g. the manual generation of the component list and the cross-comparison of information from the component list and component status report). This also contributed to the organisation of the information by the site manager, so that all information needed for planning the loads was in the same file.
By using BIM integrated with production data, the exchange and update of information became more reliable. There is a change in the availability of status information in real time. The plant delivered 95% of the requested loads on time, and the productivity of the assembly team has increased due to the reduction in the waiting time by components of the plant. The effective communication between the construction site and the manufacturing plant, made short-term plans more accurate, which then led to a reduction in the duration of the operation, also reducing delays and a lower demand for material buffering, as highlighted by Čuš-Babič et al. (2014).
The benefits of this application could more perceptible if the Last Planner System was used in its full potential. The use of 4D simulations has made easier the control of the assembly process (Figure 7) and reduced the time spent for this activity. In addition, there were improvements in the visualisation of the project, by making available geometric and topological information of the components.
Figure 7 - Comparison between 4D simulation and real executed work
4 CONCLUSIONS This research work pointed out the importance of planning loads in the context of Engineer-to-order prefabricated building systems, as part of logistics management. Planning the loads is also important to confirm the need for production of prefabricated elements and to control material flows, providing a clear definition of batches and assembly sequence.
The use of 4D models, including semantic information of components and critical equipment, has contributed to improve the understanding of the production process. The practice of updating this model during short and medium-term planning and control processes facilitates decision-making about logistic process both for the plant and for the construction site. The ability to exchange and update information increases the reliability and transparency of the process, supporting collaboration between different departments of the company (production, expedition, and assembly). Furthermore, the improvements in the process of planning the loads contributed to reduce delays in the delivery of components to assembly sequence, to reduce site inventories and ensure that the prefabrication plant produce only the necessary to attend the site demand.
77 | Proceedings IGLC | July 2017 | Heraklion, Greece
Application of BIM for Supporting Decision-making Related to Logistics in Prefabricated Building Systems
5 ACKNOWLEDGMENTS
We would like to thank the CNPq for the financial support for this research project and the company for the opportunity to develop this investigation.
6 REFERENCES Agapiou, A., Clausen, L.E., Flanagan, R., Norman, G., Notman, D., 1998. The role of
logistics in the materials flow control process. Constr. Manag. Econ. 16, 131–137. Akinci, B., Fischer, M., Kunz, J., 2002. Automated generation of work spaces required by
construction activities. J. Constr. Eng. Manag. 128, 306–315. Chau, K.W., Anson, M., Zhang, J.P., 2004. Four-Dimensional Visualization of Construction
Scheduling and Site Utilization. J. Constr. Eng. Manag. 130, 598–606. Chavada, R., Dawood, N., Kassem, M., 2012. Construction workspace management : the
development and application of a novel nD planning approach and tool. J. Inf. Constr. 17, 213–236.
Čuš-Babič, N., Rebolj, D., Nekrep-Perc, M., Podbreznik, P., 2014. Supply-chain transparency within industrialized construction projects. Comput. Ind. 65, 345–353.
Eastman, C., Teicholz, P., Sacks, R., Liston, K., 2011. BIM Handbook - A Guide to Building Information Modeling for Owners, Managers, Designers, Engineers, and Constractors, 2nd ed, John Wilet & Sons, Inc. New Jersey.
Golparvar-Fard, M., Peña-Mora, F., Arboleda, C. a., Lee, S., 2009. Visualization of Construction Progress Monitoring with 4D Simulation Model Overlaid on Time-Lapsed Photographs. J. Comput. Civ. Eng. 23, 391–404.
Hartmann, T., Gao, J., Fischer, M., 2008. Areas of Application for 3D and 4D Models on Construction Projects. J. Constr. Eng. Manag. 134, 776–785.
Jongeling, R., Olofsson, T., 2007. A method for planning of work-flow by combined use of location-based scheduling and 4D CAD. Autom. Constr. 16, 189–198.
Karan, E.P., Irizarry, J., 2015. Extending BIM interoperability to preconstruction operations using geospatial analyses and semantic web services. Autom. Constr. 53, 1–12.
Kasanen, E., Lukka, K., Siitonen, A., 1993. The Constructive Approach in Management Accounting Research. J. Manag. Account. Res. 5, 243–264.
Lukka, K., 2003. The Constructive Research Approach. Case study Res. Logist. Series B, 83–101.
Ma, Z., Shen, Q., Zhang, J., 2005. Application of 4D for dynamic site layout and management of construction projects. Autom. Constr. 14, 369–381.
Powell, D., Strandhagen, J.O., Tommelein, I., Ballard, G., Rossi, M., 2014. A new set of principles for pursuing the lean ideal in engineer-To-order manufacturers. Procedia CIRP 17, 571–576.
Schlueter, A., Thesseling, F., 2009. Building information model based energy/exergy performance assessment in early design stages. Autom. Constr. 18, 153–163.
Skjelbred, S., Fossheim, M.E., Drevland, F., 2015. Comparing Different Approaches to Site Organization and Logistics: Multiple Case Studies, in: 23rd Annual Conference of the International Group for Lean Construction. pp. 13–22.
Viana, D.D., 2015. Integrated Production Planning and Control Model for Engineer-to-Order Prefabricated Building Systems. PhD thesis, Universidade Federal do Rio Grande do Sul, Porto Alegre/RS
78 | Proceedings IGLC | July 2017 | Heraklion, Greece
Bolpagni M., Burdi L., and Ciribini A. L. C. (2017). “Integration of Lean Construction and Building Information Modeling in a Large Client Organization in Massachusetts.” In: LC3 2017 Volume II – Proceedings of the 25th Annual Conference of the International Group for Lean Construction (IGLC), Walsh, K., Sacks, R., Brilakis, I. (eds.), Heraklion, Greece, pp. 79–86. DOI: https://doi.org/10.24928/2017/0311
INTEGRATION OF LEAN CONSTRUCTION AND BUILDING INFORMATION MODELING IN A LARGE
CLIENT ORGANIZATION IN MASSACHUSETTS
Marzia Bolpagni1, Luciana Burdi2, and Angelo Luigi Camillo Ciribini3
Abstract: Recently the construction industry has started to study and implement together Lean Construction (Lean) and Building Information Modeling (BIM) to better manage projects. Previous research findings suggest that several changes in the work practice and business processes are needed to fully take advantage of BIM and Lean. Even if the client's role is very important to drive the entire process, the literature lacks of comprehensive examples of client's implementation. The paper shows how a large client organization is integrating Lean and BIM in real projects and how it is possible to measure it thanks to a Maturity Matrix. The research is based on a case study involving both active participation and interviews. The main results indicate that a) internal change is needed in the client organization; b) clients need to drive the process in order to maximise benefits; c) BIM does not fit in the traditional procurement process; and d) existing contracts need to be modified to support BIM and Lean. Research findings are useful for large client organizations that would like to integrate BIM and Lean in their operational strategy as well as for researchers. Further studies could be done to compare the work of different client organizations.
Keywords: Lean Construction, Lean, Building Information Modeling, BIM, Large Client Organisation.
1 INTRODUCTION Building Information Modeling (BIM) and Lean Construction are considered two of the most relevant drivers in the construction industry (Sacks et al. 2010). However, the lack of a unique definition of BIM and Lean often generates confusion and misunderstanding in the industry as well as in academia (Succar 2009; Modig and Ahlstrom 2015).
As a term, BIM has grown tremendously over the years and is now the current expression of digital innovation across the construction industry (Succar 2017). BIM is a set of technology, processes or policies, enabling multiple stakeholders to collaboratively design, construct and operate a facility in virtual space (Succar 2017; Succar 2009).
Lean can be seen as an operational strategy that priorities flow efficiency over resource efficiency (Modig and Ahlstrom 2015). The car dealer Toyota was the first to adopt it using the so called "Toyota Production System" (TPS) (Koskela 1992; Modig and Ahlstrom 2015).
1 PhD Candidate, Department of Architecture, Built Environment and Construction Engineering,
Politecnico di Milano, Milano, Italy, [email protected] 2 Adjunct Assistant Professor, Department of Civil and Environmental Engineering, Worcester
Polytechnic Institute, Worcester, Massachusetts, USA, [email protected] 3 Full Professor, Department of Civil, Environmental, Architectural Engineering and Mathematics,
University of Brescia, Brescia, Italy, [email protected]
79 | Proceedings IGLC | July 2017 | Heraklion, Greece
Integration of Lean Construction and Building Information Modeling in a Large Client Organization in Massachusetts
Lean Construction is the application of this approach to the construction industry (Koskela 1992; Koskela 2000). In this research the term 'Lean' stands for 'Lean Construction'.
Initially, Building Information Modeling and Lean Construction have been separately developed (Sacks et al. 2010; Dave et al. 2013; Dave 2013). Recently, they have been analysed together and several constructive interactions have been identified (Sacks et al. 2010; Eastman et al. 2011; Dave et al. 2013; Dave 2013). Alarcón et al. (2013) have provided a literature review on this topic, even if the difference between BIM and Virtual Design and Construction (VDC) is not totally clear and the two terms are used as synonyms.
When implementing BIM and Lean, several changes in the work practice and business processes are needed (Succar 2009; Eastman et al. 2011; Dave et al. 2013; Dave 2013). While the client's role is very important to drive the entire process (Eastman et al. 2011; Ciribini et al. 2015), the literature lacks of comprehensive examples of client's integration of BIM and Lean and ways to measure and compare different organizations.
2 RESEARCH AIM AND METHODOLOGY
The research aims to identify the current maturity of BIM and Lean integration in a large client organization using the Maturity Matrix developed by Bilal Succar (2010). The study is a preliminary research for further and more depth research to compare the situation of different client organizations working on BIM and Lean.
The work is a case study on a large USA client organization, the Massachusetts Port Authority (Massport), an independent entity governed by a board of directors appointed by the State's governor. Massport owns and operates both horizontal and vertical assets such as Boston Logan International Airport, and Worcester Regional Airport.
The research project started in October 2015 and lasted for six months. During this period of time, it was possible to daily work with the Design Technologies Integration Group (DTIG) that is responsible for the BIM and Lean implementation within Massport. In order to complete the Maturity Matrix, it is essential to have sufficient insight into the organisation’ systems and culture and to conduct the assessment as a group activity involving individuals representing different roles, disciplines and seniority levels (BIMe Initiative 2016). For this reason, four different projects at different stages (conceptual, design, construction and operation and maintenance) have been analysed to better understand Massport's operational strategy. The work is supported by the study of client's documents, direct observation during internal and external meetings with consultants and semi-structured interviews with client's projects managers, cost estimator, assistant director and the DTIG manager.
One of the authors, Dr. Luciana Burdi, is adjunct assistant professor at Worcester Polytechnic Institute and Deputy Director of the Capital Programs and Environmental Affairs Department at Massport. The authors would like to state that, even if there could be a potential conflict of interest, the study has been conducted independently and it is an accurate representation of the trial results.
3 THE INTEGRATION OF BUILDING INFORMATION MODELING AND
LEAN CONSTRUCTION AT MASSPORT
3.1 BIM and Lean Integration: start with the end in mind
Several large client organizations, such as government departments (GSA 2015; U.S. Department of Veterans Affairs 2010; MoJ 2016), State owned companies (COBIM 2012;
80 | Proceedings IGLC | July 2017 | Heraklion, Greece

Marzia Bolpagni, Luciana Burdi, and Angelo Luigi Camillo Ciribini
Statsbygg 2013) and States (State of Wisconsin 2012) are implementing BIM-based strategies supported by BIM guides, protocols and mandates (Kassem et al. 2015). Recently, the NIBS (2017) published the National BIM Guide for Owners and also the European Commission is working on a BIM Handbook for client organizations. However, Massport is the only client that has implemented a multi-year strategy based on BIM and Lean.
Lean and BIM are equally essential enablers in Massport's strategy for innovate project delivery and maintain assets. The BIM and Lean integration is summarised in Figure 1. Every project starts with the identification of the Conditions of Satisfaction (CoS), explicit client's requirements to be satisfied by suppliers. CoS are similar to Employer Information Requirements (EIR) defined in PAS 1192:2 (BSI 2013). The CoS definition forces suppliers in providing the exact required information avoiding lack or overflow of data.
Later, the BIM Execution Plan (BIMxP) is developed together with stakeholders in order to define BIM Uses (such as clash avoidance) and Lean tools (such as Pull Planning and Last Planner System®) that support CoS execution. During client's needs definition, any constraint against CoS accomplishment is identified in the BIMxP and removed or mitigated thanks to BIM Uses (such as Laser Scanning or Modeling of Existing Conditions) and Lean tools. The main Lean tools and principles are described in the Guideline (Massport 2015a). Each CoS can be split in several actions with different levels of priority and responsibilities. It is important to remark that each CoS can be satisfied by several BIM Uses and there is not a 1:1 relation.
Figure 1: BIM and Lean Integration (Massport 2015a)
3.2 Introduction to BIM and Lean Maturity Matrix
In order to better evaluate Massport's BIM and Lean implementation, the BIM Maturity Matrix created by Succar (2010) has been used. Originally, the Matrix (Succar 2010) has not been developed to assess BIM and Lean together, but the research shows that is it a valid support because it takes into account three main BIM fields, Technology, Process and Policy and their sub categories (Succar 2009) where Lean can contribute.
Another Lean and BIM maturity model, based on NBIMS work (2007), has been created (Dave et al. 2013). Its limitations have been discussed by Succar (2010). Similar considerations can be done on the new version (Dave et al. 2013) because the 10 maturity levels are not well explained and the 11 areas of interest are not clear and they mix different aspects such as Lean tools (e.g. Target Value Design and co-location of teams),
81 | Proceedings IGLC | July 2017 | Heraklion, Greece

Integration of Lean Construction and Building Information Modeling in a Large Client Organization in Massachusetts
BIM Uses (e.g. BIM for production and Accurate as-built model) and policy aspects (e.g. relational contracting). Finally, the matrix is project-based and it does not allow organizational assessment.
3.3 Technology: Software, Hardware and Network
For Massport the technology improvement is essential to support BIM and Lean implementation. For this reason, investment in equipment is tightly integrated with financial plans, business strategies and performance objectives. The DTIG team constantly evaluate new versions and solutions available in the market to support defined BIM uses. Data usage, storage and exchanges are monitored and controlled using a specific platform where only authorized people can access. Due to technology limitations, full interoperability data exchange cannot be performed and BIM and Lean software are usually used to manage singular projects.
3.4 Process
3.4.1 Resources, Activities & Workflows and Products & Services
Based on the Lean principle of continuous improvement, Massport's staff is periodically asked to fill Plus and Delta template on events and overall working experience. Moreover, documents to support BIM and Lean knowledge are collected in a digital platform.
BIM roles such as the DITG Manager and competency targets are imbedded within the organization and traditional teams are replaced by BIM and Lean oriented ones thanks to specific training.
The BIMxP defines the Level of Development (LOD) during different project milestones in accordance with specific BIM Uses. This approach is innovative because it avoids information waste, promoting detailed specifications thanks to a Lean approach. However, in the Guideline (Massport 2015a), LOD is associated to both the entire Building Information Model and Model Elements, in contrast with the reference document, the LOD Specification (BIMForum 2015), where LOD is associated only to Model Elements.
3.4.2 Leadership & Management
Massport set a multi-year strategy (2014-2020) for implementing BIM and Lean (Massport 2015c) because organizational, processes and technological changes are needed and they require time to be fully integrated using a gradual approach. Lean Benefit Realization Management (LBRM) (Smith 2013) has been used to develop the strategy thanks to stakeholders engagement.
The roadmap (Massport 2015c) is divided in three sequential phases: 1) Normalise (2 years and half); 2) Optimize (2 years); and 3) Institutionalize (1 years half).
During the first phase the DTIG is established in order to coordinate the BIM and Lean implementation and the entire staff is trained. It is important to establish an internal team and not rely only on external consultants because the client needs to drive the entire process.
Different standards are defined, such as the BIM Guideline (Massport 2015a), an Appendix on BIM Uses (Massport 2015b) and the BIM Execution Plan (BIMxP) template, to clarify Massport's needs. Several pilot projects are carried out to gradually implement the new strategy and support the definition of requirements.
In the second phase, the BIM-based process is fully integrated with the Geographical Information System (GIS) and Facility Management systems and procedure. The last phase is based on integrated real-time information exchanges and monitoring. During the research project, Massport was completing the first phase.
82 | Proceedings IGLC | July 2017 | Heraklion, Greece

Marzia Bolpagni, Luciana Burdi, and Angelo Luigi Camillo Ciribini
3.5 Policy
3.5.1 Preparatory
Training on BIM and Lean is integrated into organisational strategies and performance targets as stated in the first part of Massport's strategy. All staff has a basic knowledge on BIM and Lean principles and specific training programs are set based on different roles and respective competency objectives. For example, project managers are trained to open, view and mark up BIM Models as well as to take part into Pull Planning sessions.
3.5.2 Regulatory
Massport realized that the manuals were based upon traditional processes in conflict with Lean and BIM. For this reason, after a deep analysis on intrenal strandards and Facility Management (FM) data requirements, the BIM Guidelines for Vertical and Horizontal Construction (Massport 2015a) has been published. A glossary of terms and acronyms has been included to avoid misunderstanding, improve team communication and allow stakeholders to better understand client's needs. The guideline contains a 'BIM decision Matrix' to define requirements based on project types and Estimated Construction Cost (ECC). A BIM-based approach is required for all projects with ECC over 1M $; for project below 1M$, instead, a traditional approach is accepted. A separate Annex (Massport 2015b) on BIM Uses is available with a list of well-defined 51 BIM Uses that has been used as a reference for the Modular Requirements Clarification Language on BIM Uses developed by Succar et al. (2016).
3.5.3 Contractual
In order to successfully use BIM and Lean, procurement methods and contracts must be analysed. For this reason, Massport reviewed existing contracts and laws. Massport delivers projects under the Commonwealth of Massachusetts General Law using several procurement methods (Chapter 30, 149 and 149A). The allowed procurement methods are Design-Bid-Build (DBB), Design-Build (DB) and Construction Manager at Risk (CM@Risk) (Commonwealth of Massachusetts; Massport 2015a). Collaborative procurement methods, such as Integrated Project Delivery (IPD) (AIA 2007), are more suitable for BIM-Based and Lean processes (Sacks et al. 2009; Eastman et al. 2011). However, IPD cannot be used because some principles, such us the use of multi-party contracts and profit sharing, are in contrast with the General Law (Massport 2015a).
Massport believes that the procurement method influences the success of the process and BIM does not fit in the traditional procurement method (DBB). For this reason, Massport favors DB and CM@Risk, where there is an early contractor involvement. Based on a Lean approach, the client organization promotes the early involvement of key players because they can bring better value to the project. In this way, it is possible to avoid possible issues and improve the decision-making process as demonstrate by literature (Eastman et al. 2011; Bolpagni 2013). The client organization noticed that existing contracts do not manage risk for BIM-based projects. Thus, Massport worked with a legal expert to re-write contract documents. Two BIM Exhibits, for CM@Risk and DBB, have been created. The BIM Exhibits state that Building Information Models are the primary contract documents and drawings must be produced from them. Other sections of the exhibits define the responsibility for model development, ownership and management.
83 | Proceedings IGLC | July 2017 | Heraklion, Greece

Integration of Lean Construction and Building Information Modeling in a Large Client Organization in Massachusetts
3.6 Results of Massport's BIM and Lean Maturity Matrix
Based on the previous discussion, Table 1 illustrates results of BIM and Lean integration at Massport using the last version of the Maturity Matrix (BIMe Initiative 2016).
Table 1: Results of Massport's Maturity Matrix on BIM and Lean integration
BIM Maturity Matrix - Assessment at Granularity Level 1 a b c d e
Technology Software x
Hardware x
Network x
Process Resources x
Activities & Workflow x
Products & Services x
Leadership & Management x
Policy Preparatory x
Regulatory x
Contractual x
Stage Modeling-Based Collaboration [2] x
Scale Organization [9] x
4 DISCUSSION The definition of clear client's needs (CoS) is a key part of the overall process and the
BIMxP should be structured to solve and manage CoS thanks to BIM Uses and Lean. Also in the UK, client's requirements (EIR) play a relevant role (BSI 2013), but they have not be fully integrated in the workflow. The NBS BIM Toolkit (NBS 2017) has tried to fill this gap, but it is quite rigid and EIR are not associated with BIM Uses and Lean.
Even if Lean is an operation strategy that could be a strategic choice for all organization to improve flow and resource efficiency, how it is realized depends on the context (Modig and Ahlstrom 2015). An optimal solution for an organization will not necessarily be applicable in another organization (Modig and Ahlstrom 2015). The environment influences the way a client organization procures projects and set requirements. For example, the Commonwealth of Massachusetts does not allow collaborative delivery methods, such as IPD (AIA 2007), that can improve the overall process (Eastman et al. 2011; Dave et al. 2013). In addition, Massport is allowed to include explicit references to commercial software in bids. This approach could not be applicable by other clients, especially in Europe. The European Directive on public procurement (European Parliament 2014), indeed, states that technical specifications shall not refer to a specific make, source or a particular process that favour or eliminate certain undertakings or certain products.
The BIM and Lean integration is part of a long-term strategy and results presented in this paper represent only the first part of a longer journey. For these reasons, results reflect the current situation and other assessments should be repeated in the future.
84 | Proceedings IGLC | July 2017 | Heraklion, Greece

Marzia Bolpagni, Luciana Burdi, and Angelo Luigi Camillo Ciribini
Each client organization should first analyse their own business strategy and understand what value they would like to create and how to complete it (Modig and Ahlstrom 2015).
5 CONCLUSIONS AND FUTURE WORK
By today, Massport is one of the few client organization working on a multi-year BIM and Lean integration strategy. In order to integrate BIM and Lean in real projects, Massport discovered that it is essential to start with the end in mind defining clear clients requirements (CoS/EIR). In addition, internal change is needed in the client organization and a multi-year strategy must be implemented. Owners need to drive the process in order to maximise benefits and an internal team is needed. In addition, BIM does not fit in the traditional procurement process and existing contracts must be modified.
The Maturity Matrix developed by BIMe Initiative (2016) has been found a valuable support to evaluate BIM and Lean implementation in a client organization.
Research findings can be used as a reference for large client organizations that would like to integrate BIM and Lean in their operational strategy as well as for researchers.
Further studies could be done during the second and third phases of the roadmap in order to follow the process evolution. Finally, it would be useful to further investigate the BIM and Lean Maturity Matrix using assessment at Granularity Level 2 (Succar 2010) and to compare the work of different client organizations.
6 ACKNOWLEDGMENTS The authors would like to acknowledge the Capital Programs and Environmental Affairs Department of Massport for sharing knowledge on BIM and Lean implementation.
7 REFERENCES AIA (2007). Integrated project delivery: A Guide. Version 1. Alarcón, L.F., Mandujano, M.G., and Mourgues, C. (2013). Analysis of the Implementation
of VDC from a Lean Perspective: Literature Review. 21th Annual Conference of the International Group for Lean Construction, pp. 781-790.
BIMe Initiative (2016). 301in BIM Maturity Matrix v1.22. Available at: http://bimexcellence.org/301in/. [Accessed 14 Jan. 2017].
BIMForum (2015). Level of Development Specification. Version 2015. Bolpagni, M. (2013). The implementation of BIM within the public procurement. A model-
based approach for the construction industry. VTT Technology. BSI (2013). PAS 1192-2:2013 Specification for information management for the
capital/delivery phase of construction projects using building information modelling. Ciribini, A., Bolpagni, M., and Oliveri, E. (2015). An Innovative Approach to e-public
Tendering Based on Model Checking. Procedia Economics and Finance., 21(2015), pp. 32-39, doi: 10.1016/S2212-5671(15)00147-1.
COBIM (2012). Finnish Common BIM Requirements. v 1.0. Commonwealth of Massachusetts (n.d.). General Laws. Chapters 30, 149 and 149A. Dave, B. A. (2013). Developing a Construction Management System Based on Lean
Construction and Building Information Modelling. PhD Diss., University of Salford. Dave, B., Koskela, L., Kiviniemi, A., Owen, R., and Tzortzopoulos, P. (2013). Implementing
Lean in construction. Lean construction and BIM. C725, CIRIA, London.
85 | Proceedings IGLC | July 2017 | Heraklion, Greece

Integration of Lean Construction and Building Information Modeling in a Large Client Organization in Massachusetts
Eastman, C. M., Teicholz, P., Sacks, R., and Liston, K. (2011). BIM Handbook: a guide to Building Information Modeling for Owners, Managers, Architects, Engineers and Contractors. 2nd ed. USA: John Wiley & Sons, Inc..
European Parliament (2014). Directive 2014/24/EU of the European Parliament and of the Council of 26 February 2014 on public procurement and repealing Directive 2004/18/EC. OJEU. 28 March 2014 doi: 10.3000/19770677.L_2014.094.eng.
GSA (2015). 3D-4D Building Information Modeling. Kassem, M., Succar, B., and Dawood, N. (2015). Building Information Modeling: Analyzing
Noteworthy Publications of Eight Countries Using a Knowledge Content Taxonomy. Building Information Modeling, American Society of Civil Engineers, pp. 329-371.
Koskela, L. (1992). Application of the new production philosophy to construction. CIFE Technical Report. # 72, Center for Integrated Facility Engineering, Stanford University.
Koskela, L. (2000). An exploration towards a production theory and its application to construction. VTT Publications 408, Espoo.
Massport (2014). Massport Building Information Modeling (BIM) Roadmap. Massport (2015a). BIM Guidelines for Vertical and Horizontal Construction. V 1.2. Massport (2015b). Appendix A MPA BIM USES.. Massport (2015c). Massport Building Information Modeling (BIM) Roadmap. Modig, N., and Ahlstrom, P. (2015). This is Lean. Resolving the Efficiency Paradox. Lean
Construction Institute. Rheologica Publishing. MoJ (2016). BIM2AIM Quick Start Guide. The Shared Estate Service (SES) Cluster: Project
Control Framework. STD/BIM/P001.1. NBIMS (2007). National Building Information Modeling Standard™. Version 1. NBS (2017). NBS BIM Toolkit. Available at: https://toolkit.thenbs.com/. [Accessed 14 Jan.
2017]. NIBS (2017). National BIM Guide for Owners. Washington, D.C. Sacks, R., Koskela, L., Dave, B. A., and Owen, R. L. (2010). Interaction of Lean and Building
Information Modeling in Construction. The Journal of Construction Engineering and Management., 136(9), pp. 968-980, doi: 10.1061/(ASCE)CO.1943-7862.0000203.
Smith, S. (2013). Implementing Lean in construction: Lean benefits realisation management. C727, CIRIA, London.
State of Wisconsin (2012). Building Information Modeling (BIM) Guidelines and Standards for Architects and Engineers.
Statsbygg (2013). Statsbygg Building Information Modelling Manual. Version 1.2.1 (SBM1.2.1). Oslo, Norway.
Succar, B. (2009). Building information modelling framework: a research and delivery foundation for industry stakeholders. Automation in Construction., 18(3), pp. 357-375, doi: 10.1016/j.autcon.2008.10.003.
Succar, B. (2010). Building Information Modelling Maturity Matrix. Handbook of research on Building Information Modelling and construction informatics: concepts and technologies, J. Underwood and U. Isikdag, eds., IGI Publishing, pp. 65-103.
Succar, B. (2017). Building Information Modelling (BIM). BIM Dictionary. BIMe. Available at: http://bimdictionary.com/building-information-modelling/ [Accessed 14 Jan. 2017].
Succar, B., Saleeb, N., and Sher, W. (2016). Model Uses: Foundations for a Modular Requirements Clarification Language. AUBEA2016. Caims, Australia, July 6-8, 2016.
U.S. Department of Veterans Affairs (2010). The VA BIM Guide. V 1.0.
86 | Proceedings IGLC | July 2017 | Heraklion, Greece

Lagos C.I., Herrera R.F., and Alarcón L.F. (2017). “Contribution of Information Technologies to Last Planner System Implementation.” In: LC3 2017 Volume II – Proceedings of the 25th Annual Conference of the International Group for Lean Construction (IGLC), Walsh, K., Sacks, R., Brilakis, I. (eds.), Heraklion, Greece, pp. 87–94. DOI: https://doi.org/10.24928/2017/0255
CONTRIBUTIONS OF INFORMATION TECHNOLOGIES TO LAST PLANNER SYSTEM IMPLEMENTATION
Camilo Ignacio Lagos1, Rodrigo Fernando Herrera2, and Luis Fernando Alarcón3
Abstract: The Last Planner System (LPS) has been in use for over 20 years; however, some of its components remain at a basic level of implementation. This paper seeks to identify improvements in the level of implementation of those components with the use of Information Technologies (IT). In addition, correlation analysis between those components and the Plan Percent Complete (PPC) was performed to determine which components aided by IT use are correlated to the PPC.
Results were obtained from a sample of 18 construction projects in which the level of implementation of 16 LPS components and their PPC were measured. Results showed that the group of 10 IT supported projects had a significant improvement in 6 of the components and in the overall level of implementation of the methodology. Also, correlative analysis between the level of implementation of each component and the PPC allowed to identify a positive correlation between 7 components and the PPC, and between the overall implementation level and the PPC. Finally, two components were found to be both correlated to the PPC and improved using IT. These components are the standardisation of the planning and control process, as well as the analysis and systematic removal of constraints.
Keywords: Last Planner System, Information Technologies, Implementation Level.
1 INTRODUCTION
1.1 Context
The Last Planner System (LPS) has been in use for over 20 years in multiple countries and projects with highly beneficial impacts on project performance (Ballard and Howell 2003). A recent study reveals that even though the level of implementation of the majority of its components has improved over the years, the adoption of some components remains at a basic level (Daniel et al. 2015). While components related to short term planning are reported to be widely and extensively adopted, the use of the Executable Work Inventory (EWI), Constraints Management, Root Cause Analysis and Corrective Actions Management are still the least implemented parts of the methodology (Daniel et al. 2015; Salvatierra et al. 2015; Lagos et al. 2016).
1.2 Problem
The insufficient degree of implementation of the aforementioned components prevents the complete use of the LPS potential (Lagos et al. 2016). Moreover, previous research carried
1 Msc student, Department of Construction Engineering and Management, Pontificia Universidad
Católica de Chile, Researcher - GEPUC, Santiago, Chile, [email protected] 2 PhD student, Department of Construction Engineering and Management, Pontificia Universidad
Católica de Chile, Professor School of Civil Engineering, Pontificia Universidad Católica de Valparaíso, Chile, Researcher - GEPUC, Santiago, Chile, [email protected]
3 Professor, Department of Construction Engineering and Management, Pontificia Universidad Católica de Chile, Santiago, Chile, [email protected]
87 | Proceedings IGLC | July 2017 | Heraklion, Greece

Contribution of Information Technologies to Last Planner System Implementation
out by the Production Management Centre of the Catholic University of Chile (GEPUC) found that the adoption of components such as Lookahead Planning, Constraints Management and use of the EWI was highly correlated to improvements in performance indicators like the PPC (Alarcón et al. 2005). Therefore, improving and standardizing the adoption of the remaining LPS components should be one of the main objectives of the continual improvement of the methodology and its implementation (Daniel et al. 2015).
1.3 Opportunity
Evidence also shows that the use of Information Technologies Systems (IT), based on LPS, to support its implementation resulted in a more comprehensive implementation of the methodology and better performance (Alarcón and Calderón 2003; Alarcón et al. 2005), even though the use of IT systems is not yet fully adopted by the industry. For example, previous research of the use of IMPERA, which is a support system developed by GEPUC that has been used in more than 100 projects for over 15 years (Alarcón and Calderón 2003; Alarcón et al. 2005; Cisterna 2013; Alarcón et al. 2014; Lagos et al. 2016), shows that the majority of the projects used only about 40% of the software capabilities (Cisterna 2013).
Nonetheless, GEPUC has continuously developed IMPERA, including reports and contributions related to the less used components of the methodology and software itself. These contributions have already been proven to benefit the collection and use of information regarding constraints, causes of non-compliances (CNCs) and corrective actions (Lagos et al. 2016). Since the management of information regarding the aforementioned components is improved by the use of the IT system, it could be inferred that their degree of implementation has also benefited. Therefore, the first aim of this paper is to analyse the effect of the use of IT Systems on the level of implementation of the methodology and its least adopted components.
In addition, since previous research has identified a correlation between LPS level of implementation and the PPC (Alarcón et al. 2005), the second aim of this paper is to identify which are the components positively correlated to the PPC. Finally, the third objective is to demonstrate that there are in fact components correlated to the PPC that have significant improvements with the use of IT systems, allowing to conclude that IT support can improve both implementation and performance in LPS.
1.4 Research questions
The first question addressed in this research is: Which LPS components have significant improvements in their level of implementation by the use of IT support? This will allow us to determine whether the use of IT systems can improve the level of implementation of LPS and what components are most benefited by its use. The second question is: What LPS components present a significant correlation between their level of implementation and the PPC? This will allow us to determine components of the methodology where improvements can beneficially impact project performance. Finally, the conjoint analysis of the answers to both questions can help conclude if the use of the IT System addressed allows an improvement in LPS components significantly correlated with project performance and the fulfilment of commitments.
2 METHODOLOGY The research methodology seeks to answer the research questions, as follows:
88 | Proceedings IGLC | July 2017 | Heraklion, Greece

Camilo Ignacio Lagos, Rodrigo Fernando Herrera and Luis Fernando Alarcón
1. Literature review regarding the Last Planner System (LPS) and its level of implementation.
2. Create and validate an instrument to assess the level of implementation of LPS in the construction stage.
3. Collect information about the level of implementation and traditional indicators of LPS in 18 construction projects.
4. Data analysis and discussion of results: frequencies analysis, correlations test and Mann-Whitney U test.
To create and validate the tool to evaluate the level of LPS implementation, the Planning Best Practices (PBP) (Bernades and Formoso 2002; Viana et al. 2010) tool and a deep literature review were used as a basis. In addition, user and expert criteria were considered to develop a metric that details the fundamental aspects of each proposed component by PBP, described in such a way as to facilitate self-evaluation by users. This metric was validated qualitatively by a panel of 6 experts.
The instrument consists of 16 criteria, with n sub criteria for each of them (Table 1). The degree of implementation of each sub-criterion on a Likert scale is evaluated with the following levels: non-existent (0), low (1), moderately (2) and complete (3).
Then, for each criterion, an average compliance percentage (Equation 1) is calculated; finally the level of LPS implementation is calculated with the average of the percentage of each criterion.
Criteriaaccomplishment =Scoresubcriteria4
numberofsubcriteria
6
478
The instrument was applied to 18 construction projects that were applying the Last Planner System (LPS). All projects assessed had completed a 4 month implementation by LPS consultants. To ensure the quality of data, each project was assessed by the consultant in charge of the implementation. An analysis of reliability of the instrument was performed by calculating Cronbach's alpha, which in this case gave a value of 0.924; this demonstrates a high reliability of the constructed instrument (Hernández et al. 2006).
During the execution of these eighteen projects, in addition to assessing the level of LPS implementation, the LPS indicator PPC was weekly measured. Ten of eighteen projects used the addressed software to support LPS and to carry out all phases of the planning and control process.
To answer the research question about the correlation between the level of implementation and the PPC, we used the Pearson correlation coefficient. Also, we correlated the PPC with each of the instrument criteria presented in Table 1.
To answer the research question about whether there are differences between the level of implementation of LPS in the project with IT support and the project without this software, the Mann-Whitney U test technique was used to verify globally and for each criterion; therefore, the following hypothesis formulation as made:
H0= There is no difference in the LPS level implementation between projects with IT support and projects with traditional support regarding the criteria i.
H1: There is a difference in the LPS level implementation between projects with IT support and projects with traditional support regarding the criteria i.
A significance level of 0.05 is defined and the p-value for each face of the criteria for whether we were with H0 or H1 hypothesis was obtained. If the p-value is greater than the significance level, we cannot reject the null hypothesis; and on the other hand if the
89 | Proceedings IGLC | July 2017 | Heraklion, Greece

Contribution of Information Technologies to Last Planner System Implementation
p-value is less than the significance level, we can reject the null hypothesis and we can stay with H1.
Table 1: Number of sub criteria for each criterion.
Criteria Number of sub criteria
Standardisation of the planning and control process 5
Standardisation of short-term planning meetings 6
Participation of the last planners in planning and decision-making meeting 5
Use of indicators to assess compliance with planning 6
Critical analysis of information 8
Visual information management 5
Correct definition of work packages 4
Using an easy-to-understand and transparent master plan 4
Phase Planning 4
Standardisation of intermediate planning 6
Systematic analysis and removal of constrains 5
Using an Executable Work Inventory (EWI) 2
Exclusive use of EWI in short-term planning 4
Planning and control of physical work flows 5
Corrective actions based on causes of non-compliance 6
Communication and teamwork 5
3 ANALYSIS AND RESULTS
3.1 Improvement of the level of implementation of LPS components with IT support
The hypothesis tests at the global level obtained a p-value of 0.02, which means that the null hypothesis can be rejected. Therefore, it is possible to conclude that there is a significant difference in the level of LPS implementation for projects that use the IT system to support the methodology, compared to projects with traditional support. In fact, a 22% increment in the general level of implementation of the methodology was detected in the IT aided group. Detailed results are presented in Table 2.
In addition, when reviewing the Mann Whitney U test at each criterion, significant differences were identified in 5 of the components. This means that even though the average by component for the IT aided group was at least 10% higher in 10 out of the 16 criterions, 5 components were found to be significantly aided by the use of IT. These components were on average improved by 40%. However, it is important to mention that even though the use of the EWI did not fulfil the p-value criteria for selection, it obtained an 85% measured increase in the IT aided group, which allows us to infer that the benefit
90 | Proceedings IGLC | July 2017 | Heraklion, Greece

Camilo Ignacio Lagos, Rodrigo Fernando Herrera and Luis Fernando Alarcón
of the use of IT systems for this component might also be validated with a more extensive study.
Table 2: Results of the Mann Whitney U test for independent samples.
Criteria Traditional Support
IT Support
Percentage difference
p-value
Standardisation of the planning and control process
1,45 2,16 49% 0,02
Standardisation of short-term planning meetings 2,44 2,40 -2% 0,82
Participation of the last planners in planning and decision-making meeting
1,70 1,74 2% 1,00
Use of indicators to assess compliance with planning 1,90 2,57 35% 0,02
Critical analysis of information 1,06 1,75 65% 0,00
Visual information management 1,90 2,12 12% 0,19
Correct definition of work packages 2,75 2,70 -2% 0,01
Using an easy-to-understand and transparent master plan
2,06 2,55 24% 0,01
Phase Planning 1,38 1,75 27% 0,30
Standardisation of intermediate planning 1,98 2,20 11% 0,16
Systematic analysis and removal of constrains 1,93 2,42 26% 0,02
Using an Executable Work Inventory (EWI) 0,81 1,50 85% 0,06
Exclusive use of EWI in short-term planning 1,53 1,78 16% 0,30
Planning and control of physical work flows 2,23 2,40 8% 0,36
Corrective actions based on causes of non-compliance
1,69 1,70 1% 0,89
Communication and teamwork 2,35 2,42 3% 0,86
Average 1,82 2,13 22% 0,02
Finally, components with a significant improvement were: standardisation of the planning and control process; use of indicators to assess compliance with planning; critical analysis of information; correct definition of work packages; using an easy-to-understand and transparent master plan; and systematic analysis and removal of constraints. All but the correct definition of work packages observed an improvement of at least 24%.
3.2 Correlation between LPS implementation and the PPC
The correlation analysis performed between the PPC and the level of implementation of the methodology allowed us to observe a positive relationship between the general degree of implementation and the fulfilment of commitments, represented by a Pearson Coefficient of 0.7. In addition, analysis by criterion allowed us to determine positive correlations between 7 components and the PPC. These components are the standardisation of the planning and control process; participation of the last planners in planning and decision-making meeting; standardisation of intermediate planning;
91 | Proceedings IGLC | July 2017 | Heraklion, Greece

Contribution of Information Technologies to Last Planner System Implementation
systematic analysis and removal of constraints; exclusive use of EWI in short-term planning; corrective actions based on causes of non-compliance; and communication and teamwork. Results of the correlation analyses are presented in Table 3.
Table 3: Correlation between LPS components and PPC.
Criteria Pearson Coefficient
Standardisation of the planning and control process 0,5
Standardisation of short-term planning meetings 0,4
Participation of the last planners in planning and decision-making meeting 0,6
Use of indicators to assess compliance with planning 0,1
Critical analysis of information 0,1
Visual information management 0,4
Correct definition of work packages 0,0
Using an easy-to-understand and transparent master plan 0,2
Phase Planning 0,1
Standardisation of intermediate planning 0,7
Systematic analysis and removal of constrains 0,5
Using an Executable Work Inventory (EWI) 0,4
Exclusive use of EWI in short-term planning 0,8
Planning and control of physical work flows 0,4
Corrective actions based on causes of non-compliance 0,7
Communication and teamwork 0,7
General level of implementation 0,7
Then the average level of implementation was calculated for each component and the projects were separated into a group composed only of projects below average for a specific criterion and a group of projects above average. Then the average PPC of each group was calculated for each of the 7 components that resulted correlated to the PPC and for the general level of implementation. Results, which are presented in Table 4, allow us to observe PPC differences between the projects below and above average in each component.
3.3 Conjoint analysis of results
First, it was possible to conclude that projects with IT support have a higher general level of implementation of LPS, which is also correlated to the PPC. This means that the use of IT can potentially help projects improve their weekly accomplishment of commitments. In addition, two of the components significantly correlated to the PPC were also significantly improved by the use of the IT software. These components are the Standardisation of the planning and control process as well as the analysis and systematic removal of constraints. Hence, it can be inferred that the use of IT support for LPS implementations implies the adoption of practices that result in better accomplishment of short-term plans.
92 | Proceedings IGLC | July 2017 | Heraklion, Greece

Camilo Ignacio Lagos, Rodrigo Fernando Herrera and Luis Fernando Alarcón
Table 4: PPC difference in projects above and below average level of implementation of significantly correlated components.
Criteria PPC of projects above average
level of implementation
PPC of projects below average
level of implementation
Percentage difference
Standardisation of the planning and control process
71% 66% 5%
Participation of the last planners in planning and decision-making
meeting 71% 65% 6%
Standardisation of intermediate planning
72% 65% 7%
Systematic analysis and removal of constrains 71% 64% 7%
Corrective actions based on causes of non-compliance
73% 65% 8%
Communication and teamwork 72% 63% 9%
Exclusive use of EWI in short-term planning
73% 60% 13%
Average 74% 64% 10%
4 CONCLUSIONS In first place, if IT systems are used to support LPS, greater implementation standards
are achieved globally, and specifically in the following elements: standardisation of the planning and control process; use of indicators to assess compliance with planning; critical analysis of information; using an easy-to-understand and transparent master plan; and analysis and systematic removal of constraints. Secondly, the degree of LPS implementation is positively correlated with the PPC, specifically for the following components: standardisation of the planning and control process; participation of the last planners in LPS meetings; standardisation of intermediate planning; systematic analysis and removal of constraints; exclusive use of EWI; corrective actions based on CNCs; as well as communication and teamwork.
When we link the results of the analyses performed, we can distinguish two critical components: standardisation of the planning and control process and the systematic analysis and removal of constraints. Standardization is only achieved by improving communication, analysis and knowledge management. Hence, IT systems must focus not only on operational matters but have a systemic approach to LPS implementation. Finally, work preparation can also be improved by the facilitation of communication and information management through continual development of IT tools.
93 | Proceedings IGLC | July 2017 | Heraklion, Greece

Contribution of Information Technologies to Last Planner System Implementation
5 ACKNOWLEDGMENTS
We want to thank to GEPUC and GEPRO that provided access to data collection for this study. Rodrigo F. Herrera acknowledges financial support for PhD studies from VRI of Pontifical Catholic University of Chile.
6 REFERENCES Alarcón, L. F. and Calderón, R. (2003) ‘A production planning support system for construction projects’, 11th Annual Conference of the International Group for Lean Construction. Virginia, USA.
Alarcón, L. F., Diethelm, S., Rojo, Ó. and Calderon, R. (2005) ‘Assessing the impacts of implementing lean construction’, 13th International Group for Lean Construction Conference, IGLC 13, July 19, 2005 - July 21, 2005, pp. 387–393.
Alarcón, L. F., Salvatierra, J. L. and Letelier, J. A. (2014) ‘Using Last Planner Indicators To Identify Early Signs Of Project Performance’, Proceedings for the 22th Annual Conference of the International Group for Lean Construction, pp. 547–558.
Ballard, G. and Howell, G. (2003) ‘An update on last planner’, 11th Annual Conference of the International Group for Lean Construction, pp. 1–10.
Bernardes, M. and Formoso, C. (2002) ‘Contributions To the Evaluation of Production Planning and Control Systems in Building Companies’, 10th Annual Conference of the International Group for Lean Construction. Gramado, Brazil, pp. 1–11.
Cisterna, D. (2013) Desarrollo y evaluación de indicadores de control para implementación en software de planificación y control de proyectos basado en metodología Last Planner. Universidad de Chile.
Daniel, E. I., Pasquire, C. and Dickens, G. (2015) ‘Exploring the Implementation of the Last Planner® System Through Iglc Community: Twenty One Years of Experience’, (February 2016), pp. 153–162.
Hernández, R., Fernández, C. and Baptista, P. (2006) Metodología de la investigación, McGraw-Hill Interamericana. México D.F.
Lagos, C., Alarcón, L. F. and Salvatierra, J. L. (2016) ‘Improving the Use of Information Management for Continuous Improvement With the Last Planner System’, Memorias del VII Elagec, Bogotá, Colombia, pp. 737–745.
Salvatierra, J. L., Alarcón, L. F., López, Á. and Velásquez, X. (2015) ‘Lean diagnosis for Chilean construction industry: Towards more sustainable Lean practices and tools’, Proceedings for the 23th Annual Conference of the International Group for Lean Construction, pp. 642–651.
Viana, D., Mota, B., Formoso, C., Echeveste, M., Peixoto, M. and Rodrigues, C. (2010) ‘A survey on the last planner system: Impacts and difficulties for implementation in Brazilian companies’, Proceedings for the 18th Annual Conference of the International Group for Lean Construction, pp. 497–507.
94 | Proceedings IGLC | July 2017 | Heraklion, Greece
Martinez, E., Tommelein, I.D., and Alvear, A. (2017). "Integration of Lean and Information Technology to Enable a Customization Strategy in Affordable Housing." In: LC3 2017 Volume II – Proceedings of the 25th Annual Conference of the International Group for Lean Construction (IGLC), Walsh, K., Sacks, R., Brilakis, I. (eds.), Heraklion, Greece, pp. 95–102. DOI: https://doi.org/10.24928/2017/0136
INTEGRATION OF LEAN AND INFORMATION TECHNOLOGY TO ENABLE A CUSTOMIZATION
STRATEGY IN AFFORDABLE HOUSING
Eder Martinez1, Iris D. Tommelein2, and Ariana Alvear3
Abstract: Affordable housing developers in Latin America would benefit from moving away from mass housing construction and expanding the variety of choice they offer to their customers in order to create greater customer satisfaction. Admittedly, offering variety poses operational challenges that may increase cost and extend construction time, so the challenge is for developers to find the means to deliver variety without significantly affecting housing affordability. Firms outside of the construction industry have made long-term investments to integrate Lean thinking and Information Technology (IT) into production systems aiming to deliver variety with efficiency. However, such investments may be hard to replicate in the construction industry, in which investment in process innovation and technology tends to be limited. This paper presents the experience of an Ecuadorian developer who integrated Lean and IT to support a customization strategy in affordable housing delivery. The developer faced several operational challenges as a result of allowing customers to select different features of housing units. The authors describe such challenges and present the development of a novel IT tool to enable Lean construction delivery. The evaluation demonstrates that Lean with IT integration improved internal communication enabling a faster response to meet customer choices.
Keywords: Lean construction, affordable housing, information technology, housing customization, Latin America.
1 INTRODUCTION Mass housing construction (MHC) is the prevailing approach to deliver affordable housing in Latin America (Rodríguez 2006). MHC allows developers to reduce construction costs and thus their sales price, thereby facilitating low-income households the purchase housing. Nevertheless, extreme standardization along with poor design and inadequate location of mass-developments result in socio-economic problems such as overcrowding and segregation (Rodríguez and Sugranyes 2005; Baena and Olaya 2013). In fact, a comprehensive study of the Inter-American Development Bank recommends developers in the Latin American region to deviate from extreme standardization and expand the choice offering in affordable housing delivery. Developers should therefore deepen their understanding of market needs and align their production processes accordingly (Bouillon 2012, p. 175). The implementation of customization strategies for affordable housing delivery may serve this purpose (Tillmann and Formoso 2008). However, as the level of
1 PhD, Global Process Manager, Hilti AG, Feldkircherstrasse 100, Schaan, Liechtenstein, email:
[email protected] 2 Professor, Civil and Envir. Engrg. Dept., Director, Project Production Systems Lab., Univ. of California,
Berkeley, CA 94720-1712, USA, email: [email protected] 3 MS Engineering and Project Management, Assistant Project Manager, Webcor Builders, San Francisco,
CA, email: [email protected]
95 | Proceedings IGLC | July 2017 | Heraklion, Greece
Integration of Lean and Information Technology to Enable a Customization Strategy in Affordable Housing
choice increases, developers face operational challenges that raise costs and extend construction time (Nahmens and Bindroo 2011). Expanding the level of choice while keeping housing prices affordable implies the use of production systems able to tackle operational challenges stemming from customization without significantly increasing production costs.
In order to address the operational challenges of delivering variety, several industries have leveraged the use of IT when implementing Lean processes in their production systems. According to Kotha (1996), firms succeeding with this approach have made long-term investments in manufacturing technologies, IT, and human resources. Such long-term thinking may be hard to replicate in the housing context, especially when considering that the construction industry invests little in process innovation and technology (Egan 1998, p. 7). In fact, Andújar-Montoya et al. (2015) identify the lack of investment in IT to support processes as the main barrier for housing customization. This issue is exacerbated in Latin America since most developers in the region use outdated construction techniques and technology (CEPAL 1996; Torres and Torres 2009).
This paper describes the experience of an Ecuadorian affordable housing developer implementing Lean to support a customization strategy. Allowing customers to select some features of housing units resulted in several operational challenges. At the planning stage, the Developer experienced difficulties in responding efficiently to customer-specific requirements. To address those challenges, the Developer invested in the creation of an IT tool. This paper describes the challenges faced by the Developer and the development and implementation of an IT tool intended to address them.
2 RESEARCH METHODOLOGY The authors used Action Research (AR) to conduct their study. AR is a social research methodology that combines theory generation with changing the social system through the researchers' intervention. AR has been identified as a proactive research method to address challenges in the Construction Engineering and Management field (Azhar et al. 2010) and when Lean Construction theory is the subject of study (Jang et al. 2011). The authors helped to diagnose challenges of the Developer's production system. They contributed to the creation of an IT tool, aimed to address those challenges, and then evaluated its implementation. The authors documented the development and implementation of the IT tool in order to identify the learnings of this experience.
3 LEAN AND IT FOR HOUSING CUSTOMIZATION From the perspective of an affordable housing developer, it is not economically feasible to design every house according to each individual customer' preferences. Numerous preferences increase the complexity of design and make the production process complex to manage. Correspondingly, developers favor traditional manufacturing techniques to keep cost at bay, exploiting repetition and economies of scale (Ofori 2012). From a customer perspective, customization provides higher value since the housing product fulfills personal preferences (Nahmens 2007). This results in a dilemma for developers. On the one hand, they do not want to sacrifice productivity by deviating from traditional models. On the other hand, they still want to deliver increased variety to expand their market reach and potentially satisfy a broader range of customers (Nahmens and Mullens 2009). Consequently, the operational challenge is to deliver customized housing without significantly sacrificing efficiency and profit.
96 | Proceedings IGLC | July 2017 | Heraklion, Greece

Eder Martinez, Iris Tommelein and Ariana Alvear
In customization strategies, the degree of customer involvement typically defines the complexity of the production system. In MHC, housing design is based on market research and units are built-to-stock with practically no customer involvement during design or construction. In contrast, developers offering customization should be able to manage customer input in the production system (Barlow et al. 2003). In practice, variant customer inputs related to housing configurations (e.g., the number of rooms or colors) must be captured at the sales point and communicated in a timely fashion to production units for construction (Ozaki 2003). The amount of information increases as the level of choice expands which increases complexity. The integration of Lean processes and IT in production systems may enable developers to handle such information, thus allowing faster reaction to changing customer requirements (Riezebos and Klingenberg 2009). It may also serve as a valuable source of shared information in the supply chain, thus allowing the organization to reduce lead times (Ward and Zhou 2006). Toyota is able to produce over a million vehicle variations, including different colors, trims, and body styles (Johnson and Bröms 2000, p. 80). The company integrates IT to support Lean processes, for example by using "e-Kanbans" to enhance communication with suppliers (Kotani 2007). Lean can be complemented by IT implementation to increase the overall efficiency of the production system.
4 PROJECT CONTEXT
The Developer is a private company, building over 10,000 affordable housing units in Duran, Ecuador. This paper focuses on the first phase of the project, corresponding to 700 housing units. Instead of building standard units, the Developer allows customers to select certain housing features. The Developer wants to allow (low-income and other) households to select the housing models which better fit their needs and budget. Nevertheless, such approach causes operational challenges. The Developer has to find the means to produce different housing configurations efficiently in order to maintain competitiveness in terms of cost and delivery time.
4.1 Housing Configuration
Table 1 depicts the level of customization offered to customers. Customers start their configuration selection based on nine pre-defined housing models and the number of bedrooms. Then they select the type of interior and exterior finishes, some add-ons (i.e., balconies), the phase of the project and the location of the housing unit within the block. To avoid inefficiencies in building housing units in a scattered fashion, the Developer subdivided the project site (around 180,000 m²) into phases linked to different delivery dates. Accordingly, selection of a location is restricted to sub-areas within the phase. The housing configuration mix results in 49 housing variations. The grey cells in Table 1 exemplify the selection of the "Hermosa" model with two bedrooms and basic finishes, located in one of the corners of block 1D.
97 | Proceedings IGLC | July 2017 | Heraklion, Greece

Integration of Lean and Information Technology to Enable a Customization Strategy in Affordable Housing
Table 1: Housing configuration
4.2 Practical Challenges
The Developer faced several challenges capturing and communicating housing configuration data (Table 1) to the construction team, and developed a process (Figure 1)to do manage them. The sales team consolidates housing configurations and communicates them to the planning team using an Excel report. The planning and construction teams analyze the data and define the most appropriate construction workflow given the housing configuration mix. The teams use a printed version of the latest site plan to map out the different housing configurations in order to have a visual representation of the workflow and to define the schedule accordingly. This information is then used in the field for construction.
Figure 1: Planning process
The process seems to be straightforward but it has several flaws. First, the fast-paced construction method used in the project allows for construction of 2 houses per day. Given the variety in housing configurations, it is very difficult to process daily changes required in the field without incurring any mistakes. Second, every time customers change their selection (e.g., order cancellation, or change in the model, type of finishes, or location), the planning and construction teams have to re-do the process to adjust the construction schedule. Third, the planning and construction teams do not have real-time access to housing configurations. In practice, they work with outdated information until the sales department releases an updated Excel report. Unquestionably, the planning process was complicated and time-consuming. Manual data processing of new orders and adjustment of existing ones took up to two days. The response time of the production system was
Housing Model Hermosa Esplendida Linda Bonita Divina Bella Grandiosa Preciosa Magnifica
Number of bedrooms 1
Interior and exterior finishesProject stage 1 2 3 4 5 6 7 8 9Block 1A 1B 1C 1D 2A 2B 2C 3A 3BLocation within block
Intermedium
2 3
Corner
PremiunMediumBasic
4
Planning process
Plan
ning
Sa
les
Con
stru
ctio
n
Housing configuration
Review Schedule
Consolidate information
MS Excel report
Print latest site plan
Site plan (printed paper)
Interpret data and plan workflow
Excel reportSchedule and drawings
Input for planning Construction
98 | Proceedings IGLC | July 2017 | Heraklion, Greece

Eder Martinez, Iris Tommelein and Ariana Alvear
extended due to the manual effort required to process and communicate housing configurations. Consequently, the Developer wanted to automate the steps shown in grey in the process (Figure 1) by implementing an IT tool called Interactive Plan (IP). The envisioned IP would help sales agents capture customer orders and plot them in a project plan allowing the construction team to access sales data in real time.
5 INTERACTIVE PLAN (IP)
5.1 IP Architecture
The IP system is built on IDempiere, an open source Enterprise Resource Planning (ERP) platform. IDempiere is based on JAVA and can be operated in a physical or virtual infrastructure making it accessible through the internet with no need of local software installation (BMLaurus 2015). In IP, housing configuration data is captured at the sales point and sent to the IDempiere database. The data is then translated into color/shape codes and plotted in a site plan which creates an interactive plan accessible in real time. Housing configuration data in the IDempiere database is mapped out on the site plan by overlapping two layers of information through JAVA code. Figure 2 outlines the system code. Layer 1 corresponds to a high definition picture of the site plan, where every lot location is assigned unique (X, Y) coordinates.
Figure 2: Schematic representation of JAVA code for Interactive Plan
Layer 2 is programmed to translate housing configurations into color/shape codes using the same (X, Y) locations defined in layer 1. In simple terms, layer 2 acts as a transparent slide containing color/shape codes according to housing models selected by customers. Since both layers have the same (X, Y) coordinates, the overlap of the two layers of information generates IP in the IDempiere environment showing the housing configurations anchored to locations in a visual way.
5.2 User Interface
IP can be consulted in real time over the internet. Every time the company receives a customer order, that order is promptly captured and depicted in the system. IP also captures changes in customer orders. Figure 3 shows the user interface. The right side depicts customer selections anchored to the housing unit's corresponding location on the site plan. The left side shows the color/shapes legend that allows users to filter the information. For instance, a user may want to analyze information for a specific delivery date or to verify the locations of specific housing configurations. In addition, IP can be zoomed in or out to a specific project area users want to see on the screen. Moreover, users can access further information (e.g., order date, customer name, transaction cost) by clicking the color/shape codes.
99 | Proceedings IGLC | July 2017 | Heraklion, Greece

Integration of Lean and Information Technology to Enable a Customization Strategy in Affordable Housing
Figure 3: Interactive Plan user interface
5.3 Results
Reduced lead time. IP allowed the developer to automate several steps in the process of capturing and communicating housing configuration data (grey steps in Figure 1). This automation improves the process by allowing the planning and construction teams to have instant access to the necessary information to start construction.
Improved communication. IP processes and depicts housing configuration data in a visual and interactive way which facilitates internal communication.
Shared information. IP offers shared information. In addition to housing configuration locations, IP contains other type of data (e.g., transaction dates and customer information) that serves other departments in the organization.
5.4 IP Limitations and Further Development
The feedback provided by users helped identify limitations of IP as well as aspects where it can be improved and further developed. First, the current version of the IP only allows exporting of information in a JPG file. The JPG file has several limitations in terms of compatibility with other software commonly used in the construction industry. This situation limits the use of IP for other purposes. For example, exporting IP in a DWG file could help the design team update the project design according to final housing configurations (e.g., as-built drawings). Second, the software is not able to receive inputs directly in the IP interface (Figure 3). IP allows data input only in IDempiere, limiting its use for other purposes. For example, the construction team may want to input information about construction progress to use in project control.
6 CONCLUSIONS
This paper presented the creation and implementation of Interactive Plan (IP), a novel IT tool that supports Lean process delivery of variety in affordable housing in on a project in Latin America.
100 | Proceedings IGLC | July 2017 | Heraklion, Greece

Eder Martinez, Iris Tommelein and Ariana Alvear
The implementation of IP improved the process of capturing and communicating housing configuration data in several ways. First, manual efforts are minimized by the automation of the transition reports from the sales team to the planning and construction teams. This automation reduces lead time and the likelihood of mistakes from processing information. Second, IP processes housing configuration data and depicts it in a visual way, which eases internal cross-department communication within the organization. Third, IP offers shared information not only for construction, but also for administrative purposes such as purchase dates, transactions, and cost. In alignment with Lean thinking, IP also serves as a tool for continuous improvement. The IP database allows the Developer to learn about customer preferences and improve their customization strategy for the following stages of the project. For instance, the Developer may consider discontinuing housing configurations ranked at the bottom of sales. Similarly, the IP database may provide the Developer with valuable information about the housing features that customers prefer. In future stages, the Developer can focus on such aspects in order to provide the customer with enhanced value in affordable housing provision.
7 REFERENCES
Andújar-Montoya, M. D., Gilart-Iglesias, V., Montoyo, A., and Marcos-Jorquera, D. (2015). "A construction management framework for mass customisation in traditional construction." Sustainability, 7(5), 5182-5210.
Azhar, S., Ahmad, I., and Sein, M. (2010). "Action Research as a proactive research method for construction engineering and management." J.Constr.Eng.Manage., 136(1), 87-98.
Baena, A., and Olaya, C. (2013). "Vivienda de interés social de calidad en Colombia: hacia una solución integral [High-quality affordable housing in Colombia: towards an integral solution]." Sistemas & Telemática, 11(24), 9-26.
Barlow, J., Childerhouse, P., Gann, D., Hong-Minh, S., Naim, M., and Ozaki, R. (2003). "Choice and delivery in housebuilding: lessons from Japan for UK housebuilders." Build.Res.Inf., 31(2), 134-145.
BMLaurus (2015). "Software ERP - IDempiere." <http://www.bmlaurus.com/#!idempiere/c1qvr> (Jun. 19, 2015).
Bouillon, C. P. (2012). Room for development: housing markets in Latin America and the Caribbean. Palgrave Macmillan, New York, NY, USA.
CEPAL. (1996). "La produccion de la vivienda en America Latina y el Caribe [Housing production in Latin America and the Caribbean]." CEPAL, Santiago, Chile.
Egan, J. (1998). "Rehtinking construction: The report of the construction task force." Department of Trade and Industry, UK, London, UK.
Jang, W., Choi, S., Han, S. H., Im, K., and Jung, D. (2011). "Integrated framework for productivity improvement: action research approach with Lean Construction theory." P. of the 28th Int’l. Symp.on Autom. and Robotics in Const. ISARC, IAARC, Seoul, Korea, 1134-1140.
Johnson, H. T., and Bröms, A. (2000). Profit beyond measure: extraordinary results through attention to work and people. Free Press, New York, NY, USA.
Kotani, S. (2007). "Optimal method for changing the number of kanbans in the e -Kanban system and its applications." Int’l. J. of Prod.Res., 45(24), 5789-5809.
Kotha, S. (1996). "From mass production to mass customization: the case of the national industrial bicycle." European Management Journal, (5), 442-450.
101 | Proceedings IGLC | July 2017 | Heraklion, Greece

Integration of Lean and Information Technology to Enable a Customization Strategy in Affordable Housing
Nahmens, I. (2007). "Mass customization strategies and their relationship to lean production in the homebuilding industry." Ph.D. Diss. Univ. of Central Florida, Orlando, FL, USA.
Nahmens, I., and Bindroo, V. (2011). "Is customization fruitful in industrialized homebuilding industry?" J.Constr.Eng.Manage., 137(12), 1027-1035.
Nahmens, I., and Mullens, M. (2009). "The impact of product choice on Lean homebuilding." Construction Innovation, 9(1), 84-100.
Ofori, G. (2012). Contemporary issues in construction in developing countries. Spon Press, New York, NY, USA.
Ozaki, R. (2003). "Customer‐focused approaches to innovation in housebuilding." Constr.Manage.Econ., 21(6), 557-564.
Riezebos, J., and Klingenberg, W. (2009). "Advancing lean manufacturing, the role of IT." Comput.Ind., 60(4), 235-236.
Rodríguez, A., and Sugranyes, A. (2005). Los con techo: un desafío para la política de vivienda social [People with a roof: a challenge for the affordable housing policy]. Ediciones Sur, Santiago, Chile,.
Rodríguez, I. (2006). "Vivienda social latinoamericana: la clonación del paisaje de la exclusión [Latin American affordable housing: cloning a landscape of exclusion]." ACE: Arquitectura, Ciudad Y Entorno, 1(2), 20-55.
Tillmann, P. A., and Formoso, C. T. (2008). "Opportunities to adopt mass customization: a case study in the Brazilian house building sector." P. of the 16th Annual Conference of the International Group for Lean Construction (IGLC), IGLC, Manchester, UK, 447-458.
Torres, J., and Torres, E. A. (2009). "El contexto económico, social y tecnológico de la producción de vivienda social en América Latina [Economic, social, and technological context for affordable housing production in Latin America]." Enc. Latinoam. de Gestión y Econo. de la Const. (ELAGEC), Bogotá, Colombia.
Ward, P., and Zhou, H. (2006). "Impact of Information Technology integration and Lean/Just-In-time practices on lead-time performance." Decision Sciences, 37(2), 177-203.
102 | Proceedings IGLC | July 2017 | Heraklion, Greece
Mirzaeifar S., Dave B., and Singh V. (2017). “Development of Systematic Construction Logistics Using Intelligent Products” In: LC3 2017 Volume II – Proceedings of the 25th Annual Conference of the International Group for Lean Construction (IGLC), Walsh, K., Sacks, R., Brilakis, I. (eds.), Heraklion, Greece, pp. 103–110. DOI: https://doi.org/10.24928/2017/0295
DEVELOPMENT OF SYSTEMATIC CONSTRUCTION LOGISTICS USING ‘INTELLIGENT PRODUCTS’
Saeed Mirzaeifar1, Bhargav Dave2, and Vishal Singh3
Abstract: A cost-effective transfer of materials and tools from supplier location to construction site along with efficient information flow is defined as systematic construction logistics. Development of appropriate IT mechanisms plays an essential role for simplified production planning and elimination of wastes from broken resource. The contribution of this study in construction supply chain is to design and develop an innovative logistics management framework using context-aware and autonomous product centric system. More specifically, the proposed framework is responsive to real-world circumstances by demonstration of autonomous behaviour, and support several lean principles to improve resource and information flows. This paper addresses (i) an innovative solution for overcoming the construction logistics information flow challenges based on the intelligent product concept, (ii) a requirement analysis phase using “Quality Function Deployment” to turn the product requirements into technical specifications and (iii) implementation of a logistics management framework prototype to develop a first proof-of-concept.
Keywords: Lean construction, computing, mixed reality, template, instructions.
1 INTRODUCTION
Construction logistics is a set of activities, including strategic management of procurement, delivery, storage of parts and materials as well as relevant information flows through different agents. Efficient construction logistics maximizes the current and future profit using effective fulfilment of the requirements (Wegelius-Lehtonen, 2001). On the other hand, several studies pointed out problems related to inefficient materials handling, inappropriate delivery schedule and shortcomings of interactions between suppliers and clients due to highly fragmented supply chain (Ying et al., Agapiou et al., 1998; Dave et al., 2015). In the same vein, another study pinpointed important reasons of on-site inefficiencies, which caused problems in decision making on buffers, off-site production and delivery planning (Azambuja and O`brian, 2009).
The literature on construction as an assembly operation emphasizes the vital role of efficient information sharing in the supply chain (Koskela, 1999; London and Kenley, 2001; Shakantuet al., 2003). One potential for resolving the significant problems of the construction supply chain is to introduce ‘intelligent products’ into the information management system (Dave et al., 2015). Utilizing intelligent products, the sequence and control logic of the production can be attached to individual construction assemblies and components from the design phase. The authors of this paper propose a technical and practical solution which enables the construction components to carry life cycle 1 PhD Candidate, Civil and Structural Engineering Dept., Aalto University; Finland. +358 44 9755377,
[email protected] 2 Senior Researcher, Computer Science Dept., Aalto University; Finland. +358 50 4364717;
[email protected] 3 Assistant Professor, Civil and Structural Engineering, Aalto University; Finland; [email protected]
103 | Proceedings IGLC | July 2017 | Heraklion, Greece

Development of Systematic Construction Logistics Using ‘Intelligent Products’
information from their inception to construction and maintenance. To this end, this paper is continued by a review of existing problems through current approaches of logistics management. The next section discusses the proposed solution and the major high level enabling technologies. In the fourth section, a requirement analysis using QFD is performed in order to translate system functional requirements into technical specifications for the implementation of a logistics management system. Finally, the method and materials for the prototype are then explained after which conclusions are drawn.
2 CURRENT APPROACHES IN CONSTRUCTION LOGISTICS
Logistics management essentially is recognized as the management of both information and materials flows through supply chain with a high level of customer satisfaction. A potential reason for ineffective logistics management is the fragmented nature of the construction industry logistics and challenges in data integration and compilation (Sargent, 1991). In traditional construction practice, there was an information gap between resource management and workflow (Arbulu et al., 2005). Subsequently, the planning team organized all schedules related to operations, workers and tools with the assumption that all facilities and materials for installation are available.
A study by Jang et al (2003) noted the importance of five main parameters on project managers` satisfaction of construction logistics such as contractor`s organization, material and information flow. Moreover, this study highlighted the necessity of construction logistics software and technical improvement. Last Planner System (LPS) developed by Ballard (2000) partially tackled the variability and “flow” aspects of construction problems by providing a detailed construction planning and control workflow. However, Dave et al, (2015) pointed out that such systems have relatively long “look-ahead” responsive planning to construction requirements where daily or even hourly control is needed.
Product tracking technologies such as radio frequency identification (RFID), global positioning system (GPS) and ultra-wideband have been applied in construction logistics. However, implementation of such technologies has been deployed in the limited levels (Young et al., 2011) and implementation of integrated technologies within construction supply networks is still needed. Present logistics management systems with localized information system are capable to serve a specific amount of requirements. Nevertheless, they are not adequate due to requested changes and updates in design and manufacturing which can result in incorrect specifications and receipt of wrong components on site (Cutting-Decelle et al., 2007). In the next section, a potential solution will be proposed which can help to overcome the aforementioned gaps in construction logistics management.
3 POTENTIAL SOLUTION – LOGISTICS BASED ON PRODUCT CENTRIC
CONTROL Nowadays, products with unique identification and integrated control instructions are being developed for simplification of seamless information flow, material handling and customization throughout the supply chain (Kärkkäinen & Holmström, 2002). Dave et al. (2015) noted that intelligent products have contextual operative logic linked within individual components already from design phase and they are able to support whole lifecycle from design to construction and maintenance. The derived advantages of
104 | Proceedings IGLC | July 2017 | Heraklion, Greece
Saeed Mirzaeifar, Bhargav Dave, and Vishal Singh
intelligent products such as autonomous behaviour and responsiveness to real-world circumstances can considerably reduce the need for planning and organization, improve inventory management and finally improve product quality and project performance (Musa et al., 2014).
The basic principle of product centric control is to embed the products and process related information, which is necessary for construction project actors’ communication across supply chain, within products themselves. Consequently, the individual component and assemblies within intelligent product are capable to carry the required sequence and instruction of construction project with themselves from design phase along the entire lifecycle. In other words, the intelligent construction components should be aware of the next operation schedules. Therefore, a construction product itself would request a delivery service from the supplier or manufacturer whenever it is ready to be delivered to the construction site. As the product is shipped to the site, it should provide the information about its location in inventory site and then inform the specific worker to install the product based on planned time schedule. From the logistics point of view, such scenario is completely implementable using the intelligent products capabilities in the information flow between different project agents. To this end, it should be investigated what technologies are required for implementation of intelligent products.
Internet of Things (IoT), Building Information Modelling (BIM) and Lean construction techniques are the main enabling technologies for implementation of intelligent products (Dave et al., 2015). Through IoT communication framework, an infrastructure where the product`s information can be exchanged between organizational agents and individual products is provided. BIM plays a vital role in the reduction of planning redundancy and raising engineering efficiency with capability of storing virtual and multidisciplinary information about products (Said & El-Rayes, 2014). Lean construction is considered as the alignment and holistic following of simultaneous and continuous improvement in all dimensions of construction stages (Abdelhamid & Salem, 2005). Systematic logistics system based on intelligent products operates on lean construction technique such as “pull” based production to maximize value across supply chain and reduce waste from lifecycle stages by providing materials in construction site when and only when it is needed.
4 MATERIALS AND METHODS FOR DEVELOPMENT PHASE The aim of this research is to develop a framework for a ‘logistics management system utilizing intelligent products’ to track individual materials and components from their inception, assembly and installation across construction stages. In the previous section, some of the main enabling technologies were discussed. In this section, the materials, tools and methodologies for such development are investigated to better understanding of the technological and scientific perspectives of the proposed solution.
4.1 QUALITY FUNCTION DEPLOYMENT
During an efficient product design, a designer or design team should identify the end-user expectations accurately. Quality Function Deployment (QFD) is a systematic approach to identify customer requirements for design a product or service considering all stakeholders involved in the production and supply chain process (Esan et al., 2013). The QFD approach taken in this research is adapted from (Kubler et al., 2010) and contains two levels of matrix evaluation namely “house of quality” in order to translate high-level requirements into scientific and technological specifications as indicated in Figure 1.
105 | Proceedings IGLC | July 2017 | Heraklion, Greece

Development of Systematic Construction Logistics Using ‘Intelligent Products’
Figure 1: Two level QFD matrices (House of Quality)
A functional analysis is performed to extract product requirements by investigating existing literature such as (Dave et al., 2015; Said & El-Rayes, 2013; Said & El-Rayes, 2014) and interviewing Aalto Bim Lab4 researchers. Subsequently, the extracted and prioritized requirements by AHP (Analytic Hierarchy Process) method are prepared for QFD input. Moreover, the QFD weights are assessed and consensed among the Aalto BIM Lab researchers especially the authors of this paper. However, it is intended to collect the real customer requirements from the industry partner`s key personnel in further studies.
In level one, the collected requirements (What) are listed in rows with their initial priorities using AHP method (from low priority 1 to high priority 5) and technical descriptors (How) are placed in the columns of this matrix. The relationship matrix is developed then between What-How, as shown in Figure 2. The column indicators of matrix present the information about the relative influence of a single technical descriptor on all requirements and row indicators shows the relative effects of technical descriptors on single requirements.
Figure 2: First level of QFD matrix
4 http://bim.aalto.fi/
How
What Periority
UploadBIMmodeldesignbased 4
Registertheagentsformaterialtracking 5
Provideusersprivacyandsecurityrequirement 3
providesecurityforexchangeofinformation 3
Recordtheproductiontrackinglocation 5
Enableuserstoview/manipulatesupplychainstages 2
ConnecttheproductmodeltophysicalproductURI 5
Provideautomatedmaterialdeliverybasedonprojectschedule 3
Provideinformationaboutthelocationofmaterialonsite 2
Security & Privacy Operation Management
0.810 0.600 0.660 0.690 0.600 0.960 1.020 1.320 0.390 0.420 1.200 1.020
6 6
66
543 3 3 9 36
3 6 9
3 3 6 9
9 3 96 6 3
3 66 9 3
99 6 3 6
6 6
9 9 6
IoT
data
stan
dard
s com
plia
nt
Prod
uct a
nd p
roce
ss D
ashb
oard
Decis
ion
mak
ing
supp
ort
Posit
ioni
ng sy
stem
cord
inat
es
Web
-bas
ed In
terfa
ce
Agen
ts`ab
ility t
o co
mm
unica
te
thro
ugh
Inte
rnet
Diffe
rent
IFC
sche
ma
com
plia
nt
supp
ort v
ario
us a
gent
s Te
chno
logi
esSi
mul
atio
n to
ols f
rom
bui
ldin
g de
sign
phas
e
Diffe
rent
leve
ls of
acc
essib
ility
encr
yptio
n an
d de
cryp
tion
of
info
rmat
ion
Data
hist
ory a
vailib
ility
lifecycle tools
96
99
90
165
72
135
195
63
9 6 3 6 6 3 6
3 6
106 | Proceedings IGLC | July 2017 | Heraklion, Greece

Saeed Mirzaeifar, Bhargav Dave, and Vishal Singh
Through second level of QFD, the previous approach should be reiterated between the technical descriptors (How) of first matrix and specifications of logistics management system placed in columns. In this manner, the quality is ensured by constraints spreading since the technical descriptors of the first level matrix become the What for level two matrix as illustrated in Figure 3. The aim of interrelationship half-matrix development is to identify areas which some specifications can conflict with others and some of them can enforce other processes. The second level matrix is highlighting the technical specifications for functional requirements fulfilment. The results out of column indicators of second level matrix show that the specifications “Open IoT messaging communication framework”, “3D Web technologies”, “Distributed Architecture” and “IFC standard compliant” are respectively the most important. Consequently, a logistics management system prototype is developed in order to validate the pertinence of the achieved results from requirement analysis.
Figure 3: Second level of QFD matrix
4.2 Implementation of prototype
To implement the prioritized technical specifications, agile software development is selected which can deliver the system prototype faster and more organized. A simple prototype scenario begins with assigning the IFC model URI to physical product through NFC writing from product inception. However NFC and RFID are different in term of communication technology and bandwidth, the identification can be performed because
How
What Valeurs
DifferentIFCschemacompliant 0.81
supportvariousagentsTechnologies 0.60
Simulationtoolsfromconstructiondesignphase 0.66
Differentlevelsofaccessibility 0.69
encryptionanddecryptionofinformation 0.60
Datahistoryavailibility 0.96
IoTdatastandardcompliant 1.02
Productandprocessdashboard 1.32
Decisionmakingsupport 0.39
Positioningsystemcordinates 0.42
Web-basedInterface 1.20
Agents`abilitytocommunicatethroughinternet 1.02
39.78
6 3 87.12
48.96
3 6 9 6 6 9
3 9
18
9 6 6 6 6 9 6 3
6 3
3 6 6
3 9 6
PoP3
and
STM
P pr
otoc
ols
GPS
Long
itude
and
Lat
itude
Scan
ning
tech
nolo
gy
Decis
ion
Supp
ort S
yste
m
User
-frie
ndly
Prod
uct d
ashb
oard
Open
IoT
mes
sagi
ng co
mm
unica
tion
fram
ewor
k
Pull b
ased
sequ
encin
g
Distr
ibut
ed A
rchi
tectu
re
NoSQ
L da
taba
se
Data
hist
ory m
anag
emen
t
3D W
eb te
chno
logi
es
9
IFC
stand
ard
com
plia
n
CObi
e sta
ndar
d co
mpl
iant
Inte
racti
ve E
nviro
nmen
t
open
stan
dard
Aut
horiz
atio
n
Cryp
togr
aphi
c key
man
agem
ent
Sepa
rate
d Au
then
ticat
ion
Data
base
14.589
183 6 9
6 6 9 3 6 3 3
6 6
3
3 3 3
43.563 66 6 6
6 28.98
3
6 9 14.04
6
3 6 3
6 6 6 3 9
36
6 3 9 3
12.696 6 9
75.63 63 6 3
36.723 6 99 6
0.115 0.267 0.447 0.148 0.383
3 9 9
0.329 0.264 0.282 0.206
6 6 9
3
0.188 0.2910.214 0.167 0.402 0.178 0.254 0.245
107 | Proceedings IGLC | July 2017 | Heraklion, Greece

Development of Systematic Construction Logistics Using ‘Intelligent Products’
of its ease of use and install at this stage of study. This action enables the products to carry the information about themselves through their lifecycle and a link is created between the IFC model and individual products.
The agents are responsible to provide traceability of products through their manufacturing, supply chain and installation. Moreover, the products are able themselves to activate actions such as “delivery requests” and “worker call” based on the BIM model design and communication protocols. A high-level architecture of overall system is then identified to facilitate better understanding of different modules of the system as depicted in Figure 4. Server consists of a web server, which is publicly accessible through the internet and communicates via HTTP protocol and messaging interfaces (O-MI and O-DF) with web client and agents. It also contains the “Authentication Interface” to control either the authentication of incoming requests and user permissions to access the services. Valid requests then can be handled by “Service Interface” to be provided with corresponding responses upon the type of request. The basic implementation of server is utilizing BIMServer (Beetz et al., 2010), which is an open source software, in order to facilitate Parsing and storing IFC files in database.
Figure 4. High level architecture of overall logistics management system
Web client is product and process dashboard developed for managers and end users to retrieve and manipulate all the information related to project plan and progress, product details and instructions for installation. The product dashboard within the web client contains all information about selected product in 3D model including product ID with all previously recorded and recent location information. In addition, all registered agents information such as ID and location are available in this part of the web client.
The objective of an agent is to transmit information i.e. location and ID between
product and server. In this study, the agent is developed on Android OS with access to NFC device in order to ease the portability and hardware development limitations. The basic workflow of an agent can be summarized in agent registration, authentication, assignment of URI to products NFC and retrieving product information. From the technical viewpoint, agent consists of APIs to communicate to the server for handling the requests and User Interfaces which are handled by fragments. Figure 5 illustrates a few sketches from developed logistics management system prototype.
108 | Proceedings IGLC | July 2017 | Heraklion, Greece

Saeed Mirzaeifar, Bhargav Dave, and Vishal Singh
Figure 5: Logistics management system prototype sketches
5 CONCLUSIONS The current approach of logistics management through construction supply chain has significant information flow problems which are rarely addressed in literature. Moreover, companies hesitate to invest in development of logistics management automation since they think that the added value cannot cover the budget for investment. There have been attempts to eliminate information gap across construction life cycle by providing heterogeneous solutions in individual areas of design management and production. However, the lack of integrated information system can be observed through entire construction projects. The developed solution based on intelligent product concept attempts to tackle the aforementioned problems by a detailed functional analysis to implement a system with a high level of acceptance. The system prototype was implemented according to the results of QFD method which prioritized the requirements and technical specifications of proposed solution. However, there is a need to implement all specifications of the system in further studies.
6 REFERENCES Abdelhamid, T., & Salem, O. (2005). Lean construction: A new paradigm for managing
construction projects. The International Workshop on Innovations in Materials and Design of Civil Infrastructure,
Agapiou, A., Clausen, L., Flanagan, R., Norman, G., & Notman, D. (1998). The role of logistics in the materials flow control process. Construction Management & Economics, 16(2), 131-137.
Arbulu, R., Koerckel, A., & Espana, F. (2005). Linking production-level workflow with materials supply. 13th International Group for Lean Construction Conference: Proceedings, 199.
Azambuja, M., & O'Brian, W. (2009). Construction Supply Chain Modelling: Issues and Perspectives. In W. O'Brian, C. Formoso, R. Vrijhoef, & K. London, Construction Supply Chain Management Handbook (pp. 2.1-2.31).
109 | Proceedings IGLC | July 2017 | Heraklion, Greece
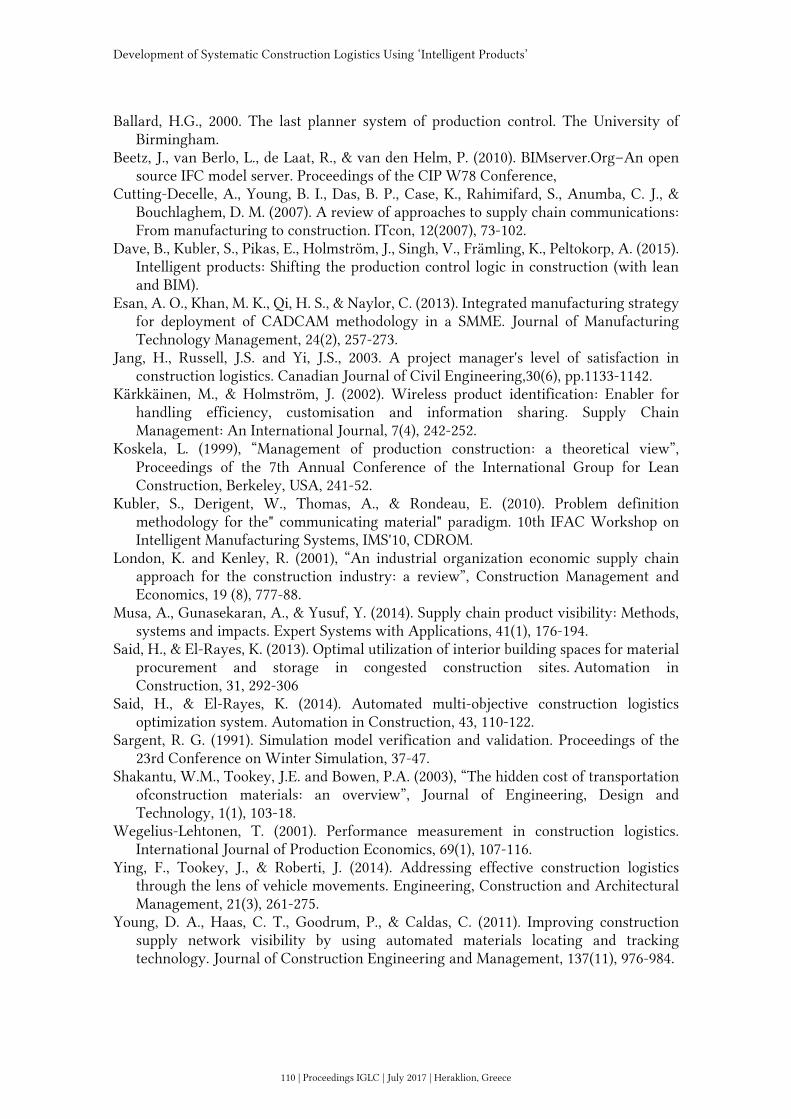
Development of Systematic Construction Logistics Using ‘Intelligent Products’
Ballard, H.G., 2000. The last planner system of production control. The University of Birmingham.
Beetz, J., van Berlo, L., de Laat, R., & van den Helm, P. (2010). BIMserver.Org–An open source IFC model server. Proceedings of the CIP W78 Conference,
Cutting-Decelle, A., Young, B. I., Das, B. P., Case, K., Rahimifard, S., Anumba, C. J., & Bouchlaghem, D. M. (2007). A review of approaches to supply chain communications: From manufacturing to construction. ITcon, 12(2007), 73-102.
Dave, B., Kubler, S., Pikas, E., Holmström, J., Singh, V., Främling, K., Peltokorp, A. (2015). Intelligent products: Shifting the production control logic in construction (with lean and BIM).
Esan, A. O., Khan, M. K., Qi, H. S., & Naylor, C. (2013). Integrated manufacturing strategy for deployment of CADCAM methodology in a SMME. Journal of Manufacturing Technology Management, 24(2), 257-273.
Jang, H., Russell, J.S. and Yi, J.S., 2003. A project manager's level of satisfaction in construction logistics. Canadian Journal of Civil Engineering,30(6), pp.1133-1142.
Kärkkäinen, M., & Holmström, J. (2002). Wireless product identification: Enabler for handling efficiency, customisation and information sharing. Supply Chain Management: An International Journal, 7(4), 242-252.
Koskela, L. (1999), “Management of production construction: a theoretical view”, Proceedings of the 7th Annual Conference of the International Group for Lean Construction, Berkeley, USA, 241-52.
Kubler, S., Derigent, W., Thomas, A., & Rondeau, E. (2010). Problem definition methodology for the" communicating material" paradigm. 10th IFAC Workshop on Intelligent Manufacturing Systems, IMS'10, CDROM.
London, K. and Kenley, R. (2001), “An industrial organization economic supply chain approach for the construction industry: a review”, Construction Management and Economics, 19 (8), 777-88.
Musa, A., Gunasekaran, A., & Yusuf, Y. (2014). Supply chain product visibility: Methods, systems and impacts. Expert Systems with Applications, 41(1), 176-194.
Said, H., & El-Rayes, K. (2013). Optimal utilization of interior building spaces for material procurement and storage in congested construction sites. Automation in Construction, 31, 292-306
Said, H., & El-Rayes, K. (2014). Automated multi-objective construction logistics optimization system. Automation in Construction, 43, 110-122.
Sargent, R. G. (1991). Simulation model verification and validation. Proceedings of the 23rd Conference on Winter Simulation, 37-47.
Shakantu, W.M., Tookey, J.E. and Bowen, P.A. (2003), “The hidden cost of transportation ofconstruction materials: an overview”, Journal of Engineering, Design and Technology, 1(1), 103-18.
Wegelius-Lehtonen, T. (2001). Performance measurement in construction logistics. International Journal of Production Economics, 69(1), 107-116.
Ying, F., Tookey, J., & Roberti, J. (2014). Addressing effective construction logistics through the lens of vehicle movements. Engineering, Construction and Architectural Management, 21(3), 261-275.
Young, D. A., Haas, C. T., Goodrum, P., & Caldas, C. (2011). Improving construction supply network visibility by using automated materials locating and tracking technology. Journal of Construction Engineering and Management, 137(11), 976-984.
110 | Proceedings IGLC | July 2017 | Heraklion, Greece

Rossini, F L, Novembri, G, and Fioravanti, A (2017). “BIM and Agent-based Model Integration for Construction Management Optimization” In: LC3 2017 Volume II – Proceedings of the 25th Annual Conference of the International Group for Lean Construction (IGLC), Walsh, K., Sacks, R., Brilakis, I. (eds.), Heraklion, Greece, pp. 111–118. DOI: https://doi.org/10.24928/2017/0267
BIM AND AGENT-BASED MODEL INTEGRATION FOR CONSTRUCTION MANAGEMENT OPTIMIZATION
Francesco Livio Rossini1, Gabriele Novembri2, and Antonio Fioravanti3
Abstract: The current necessity of manage complexity in the field of building process management push to provide process' figures of construction methodologies and tools capable to support them in a proficient way. With the scope to define in advance the places occupied by workers to accomplish a task, is defined a methodology and related tools to integrate Building Information Modeling (BIM) with an Agent-Based simulation of workers activities. The goal is to know at early project phases where it is possible to work in a more effective and safer way, how it is possible to be more efficient placing in the same working space different working phases and when it is possible to allow the continuity of building operations. The outcome of the system is predicting how much resources are involved in a project, identifying and minimizing wasted time.
Keywords: BIM, Project and Construction Management, Lean construction, Agent-Based Simulation.
1 INTRODUCTION
The industry of A/E/C is characterised by a huge complexity that has multifaceted aspects, due to the variety of new materials, design solutions and the need to respect pressing timetables and narrow budgets. This ever-growing complexity, furthermore, is less manageable when, i.e. during refurbishments, in the same building construction workers and building users are present, with the sake to ensure the continuity of building use.
Moreover, is difficult to manage users and workers by means of the usual Building Codes or 'rules of thumb', expressed in handbooks - even if digital - as we were in the XIX century. Nowadays, with the introduction and the progressive spreading of the engineering approach, it is time to deal with new and old complexities.
During the last decades, the development of Information and Communication Technologies (ICT) allowed the simplification of building process management thanks to the automation of reasoning tasks, for instance ‘clash detections’ and ‘rule checking’ (Solihin and Eastman, 2015).
Evidently, these improvements provided designers of useful tools able to predict the effects of their choices and, consequently, to avoid as possible mistakes and misunderstandings, which are important complementary causes of construction delay, unexpected costs and possible injuries during the working-phases. 1 PhD Candidate, in Engineering-based Architecture and Urban Planning - Sapienza University of Rome,
Rome, ITA, [email protected] 2 Aggregate Professor, Dept. of Civil, Constructional and Environmental Engineering, Sapienza -
University of Rome, Rome, ITA, [email protected] 3 Aggregate Professor, Dept. of Civil, Constructional and Environmental Engineering, Sapienza -
University of Rome, Rome, ITA, [email protected]
111 | Proceedings IGLC | July 2017 | Heraklion, Greece

BIM and Agent-based Model Integration for Construction Management Optimization
The paper’s aim is to describe a use of the Artificial Intelligence (AI) technique of Agents-based simulation with the sake to support choices in construction management, in order to prevent risks like the overlapping of activities, wasted time, under-used spaces and resources and, consequently, improve productivity of construction sites allowing, where required, the continuity of building use.
Nowadays Information Modeling methodologies shown great potential in A/E/C field, contributing designers in the management of the complexity of large quantity of information, allowing also the automatic identification of conflicts, mainly geometrical (Singh et al., 2011). At the same time, they have not shown clear capabilities in associating building entities and their assigned resources with their construction methods, required materials, execution time and generated interferences.
The support that these tools provide in architectural design, and the need to move toward the simplification of the overall project organization model construction from the initial stages of design, could suggest appropriate choices of production techniques, optimizing required construction time and mitigating risks.
However, Building Information Modeling (BIM) and integration of project management tool is difficult to realize by means of scheduling traditional techniques like Program Evaluation and Review Technique (PERT) and the quite-similar Critical Path Method (CPM) techniques; it requires, conversely, an explicit representation of management and assessment to:
• Working team behaviours on the construction site;
• Space required for the execution of the work to be carried out;
• Number and type of the resources involved. Thus, techniques based on Location-Based Structure (LBS) are more suitable to develop
such a different approach (Kenley and Seppanen, 2009). Location is very important in AEC as it is linked to main characteristic of a building
whether used space for construction-related activities. In this paper is described how automatically define a single 'location' called <Room> in a BIM environment via a specific application. Term ‘location’ means the space required by a working-team to reach its goal.
2 STATE OF THE ART
2.1 BIM (Building Information Modeling) and simulation in construction management field
There are different definitions of BIM, coined by the first generation involved in this field (Eastman et al., 2011) but, for the purpose of this paper, we consider the 'Building SMART' alliance definition (2012), that describes BIM as a ‘digital representation of physical and functional characteristics of a facility‘. As such, it serves as a shared knowledge resource for information about a facility forming a reliable basis for decisions during its lifecycle from inception onward.
A basic premise of BIM is collaboration of different stakeholders at different lifecycle phases of a facility to insert, extract, update or modify information in the BIM to support and reflect the roles of actors involved.
This defines how this methodology acquire essential information to manage a construction site. In fact, interventions on existing buildings have as first requirement knowing the starting-point situation.
112 | Proceedings IGLC | July 2017 | Heraklion, Greece

Francesco Livio Rossini, Gabriele Novembri, and Antonio Fioravanti
Thus, a BIM model can contain appropriate information for construction like the property of materials used in construction, potential risks or details that can improve the level of the working-area conditions awareness and, consequently, safety conditions.
However, uncertainty in existing building data cannot be avoided unless a complete field inspection is undertaken, and there is still a risk of human error. Three approaches may be used to manage the uncertainty of data in a BIM model: (1) verification, (2) acceptance or (3) avoidance.
These are determined individually – for example if a subset of equipment was field-located and 50% were found exactly as indicated on the available drawings, they would be 50% certain – and only elements with a minimum certainty are modelled. Third, data below this certainty level (which may be 99%+ for some organizations) is omitted from the model.
This final option is the least expensive but may severely limit the model functionality (McArthur, 2015).
Finally, BIM is a promising digital methodology to collect and represent information, but lacks of technique, methods and related tools capable to predict the feasibility, time and costs related to a construction process.
In the other hand, this promising methodology show lacks toward the construction management sector: as a matter of fact, the most widespread software for construction specialists (i.e. Navisworks, Trimble Vico, Synchro etc.) are very useful to set the timing of activities, to verify clashes in a BIM model or quantify - in an appropriate way - the related costs. However, a lack of these tools is in the domain of the prediction of choices result: indeed, the current software work on the base of data provided by the implicit knowledge of designer, and rely only on the expertise of specialists involved.
To overtake these limits, several researches introduced techniques of artificial intelligence on building construction field, like multi-agents. These technique indeed allow to link process management with stochastic approach (Taillandier et al, 2015), using discrete evaluation by means of simulation of each risk involved in a project. Furthermore, was also developed methodologies to plan automatically the construction site with genetic algorithm for optimization of the safer paths in the site, based on BIM models (S. S. Kumar and J. C. P. Cheng, 2015). In addition, was explored other fields of artificial intelligence like ontology (R.J. Scherer and S. E. Schapke, 2011) and semantic web technology (L. Y. Ding et al., 2016). Eventually, to increase the precision of simulation results, other studies focused on the hybrid simulation approach, proposed to facilitate integration of safety management consideration into construction activity simulation by means of System Dynamics (SD), Discrete Event Simulation (DES) and Agent Based Simulation (ABS). This system, evidently, seems to be the best approach to solve the problem of predicting the more appropriate choices to take into account during construction (Goh Y., M.,and Askar Ali, M., A., 2015) but, considering the overlapping of heavy dimension of computations needed by these methods, is viable only on limited cases.
To exceed this gap, in this research is proposed to link Agent-Based simulation to BIM environment, via an application that, in the BIM environment, specify the space needed to complete an activity. The aim is to analyse the risks related to specific phases in their specific context, predicting how many time an activity concretely requires.
2.2 ABM (Agent-Based Modeling) in architectural construction sites
Building is a complex activity. Nevertheless, this complexity is the sum of simple issues, which are often solved by small worker-teams or, in many cases, by single worker. For this reason, agent-based modeling is very near to the real phenomenon, and can model
113 | Proceedings IGLC | July 2017 | Heraklion, Greece

BIM and Agent-based Model Integration for Construction Management Optimization
accurately the interaction among them and between agents and the context given, in this case, by the related BIM model.
Furthermore, in ABM the ontological correspondence between the computer agents in the model and in the real world actors makes it easy and evident to represent actors and the environment and their relationship (Gilbert, 2008), working also on different levels of abstraction, starting from the lower ‘reactive’ level, to an higher ‘proactive’ level (Novembri et al., 2015).
The project construction management is a realm very near to the ABM method capabilities, because this field involves cross-disciplinary problems like social and human aspects, and both spatial and temporal interactions among different participating teams (Liang, 2012). On the other hand, current BIM and Construction Management tools provide embedded agents-inference engine: these tools are able to represent the working phase duration (4D) or costs (5D) only if the designer sets data following his implicit knowledge. Indeed, the method here described allows the solution of a part of the general problem. This application, in effect, provide managers to know how much space is needed to workers to reach their goals by automatic reasoning given by agents’ inference.
3 THE IMPACT OF BIM AND ABM IN A LEAN CONSTRUCTION
PROCESS: APPLICATIVE METHODOLOGY
3.1 Modelling agents to interact with building construction issues: brief program framework
To describe agent-based program operation and to give an actual example of it, a small Windows Presentation Foundation (WPF) in C# language with more updated pattern of parallelization with the aim of enhancing concurrency among agents. In this prototype the thread elimination is only a visual omission, because the thread continues computing operation in background.
More precisely, when a dimensional input given in a BIM environment is defined, the interaction among several agents begin, characterized by different rules, behavior and, substantially, goals (Castelfranchi and Falcone, 1998).
Thus, the aim is the optimization of spaces where the working-phases are located during the global operation of the building, avoiding inhibitions of its social function.
Agents are located in a workspace that have specific requirement and constraints: when all agents find a satisfying condition, the solution is given.
Specifically, every agent geometrically modifies this working-space and, when the modifications required by agents are not in collision among them, the final boundary is defined. During simulations, we demonstrated (fig. 1) that areas defined by simulation tool is considerably smaller than areas forecasted by the construction site planner.
Since these processes happen in parallel mode, the conclusion of a method stops other agents modifying the state of starting instance, until the next iterative cycle starts.
Every execution, therefore, produces similar but different results; it is not possible, effectively, to control the thread priority and execution speed because memory access is exclusively random: we conceptually can compare this selection process to the spermatozoa trip toward the ovum.
Thus, the agent that modifies the possible space occupied by the workers is the first that ends the entire optimization that satisfies all other agents' requirements. Note that this is not the only possible solution as it depends on agents' initial configuration.
114 | Proceedings IGLC | July 2017 | Heraklion, Greece

Francesco Livio Rossini, Gabriele Novembri, and Antonio Fioravanti
Fig. 1: Identification of an effective-working area.For an important but simple
activity in the building construction field e.g. painting, we have to model several agents such as scaffolding, painters, suppliers etc. After the interaction among
these intelligent entities, starting from a forecasted larger area (green), we could work in the red-bounded area in a more efficient way, allowing the use of other
spaces for different activities.
As a matter of fact, an agent intervening early in the first cycle, will not necessary arrive first in the second one, as the whole cycle is random; this randomness is addressed exclusively to the prior interest to solve the problem in the most effective way, without privileging any agent.
3.2 Modelling agents to interact with building construction issues: the first-programming phase
115 | Proceedings IGLC | July 2017 | Heraklion, Greece

BIM and Agent-based Model Integration for Construction Management Optimization
For the sake of allowing a coherent graphic representation of the algorithm, the application was encapsulated in a traditional Windows ™ visualization. The "base-class" is the one that describes the space vertex, or rather the "class descriptive element", allows the method to calculate the Euclidean parameters.
The "Room-constructor class", conversely, has the task to foresee the other two missing vertices necessary to represent the process (the other two vertices of the rectangle are assigned in the previous method). The <Draw> method, allows to design the instance in the Canvas previously defined. <SetAsLast()> high-lights the instance border, while <SetAsBase()> re-freshes the current state. The <Area> and <Form-Factor> properties define the surface dimensions and the related form-factor, set up as an important parameter to give working area reliable dimensions. To finish the first phase, we have to set up the WPF control, in which several application will be visualized. The proposed framework shows the principal graphical interface of the application. The pink surface, the Canvas, is the area where the <Room> is located.
3.3 Agent execution logic
To describe the base-structure of an agent we defined an interface that, when implemented, allows to agents to define a name, a block-function and a worker-function.
In our case, we have not implemented the block-functions, and the worker function requires access in a Room (the working-area) and the output of a new Room.
Finally, the program produce an object and requires the restitution of a new instance of the same object type. For these agents, the implementation required is <nullable> type. The <null> type, in effect, will be used in agreement of current norms to warn the agent about a completed work, or rather in a compatible state. In this way, we optimize the program interface.
3.4 Agents management and parallelization
To manage the parallelization process, then the sending and reception of data, we used Task Parallel Library (TPL) dataflow, which extends the namespace. <System.Thread> with several functions, turned toward data-oriented programming: a de-tailed documentation about this topic is provided by the Microsoft web-library, while the whole package is available on Nuget, because it is not included in the .NET framework (Microsoft, 2017).
The Scheduler class manage the access to four public functions that can be used by the User Interface (UI) with the aim to receive notices about the agents’ state. <SyncronizedAgent> will memorize information about agents, which has the synchronization priority because entered the process firstly.
<AgentLastReturnedStatus> contains information about the output of single agents, <WorkingRoom> is the currently synchronized <Room>.
<AgentsDictionary> contains the <TransformBlock> obtained by <Reflection> process. The definition of auxiliary class is shown at the top of the next page.
To allow an effective operation of the agents’ systems, initialization function is required and, essentially, upload the starting room – in this case the pre-defined working area – and, through the reflection mode, produces all the agents defined.
The agent broadcast has to run in a synchronous way, and includes a sort of logical re-verification of results, fundamental in this experiment. <PostAndReceive> is the key-function: its task is data checking.
116 | Proceedings IGLC | July 2017 | Heraklion, Greece
Francesco Livio Rossini, Gabriele Novembri, and Antonio Fioravanti
Finally, the enrolment of the WPF events is as follows: the graphic interface file is to
completed with the <CoreBehind> capable to connect itself with the agent-based system, in addition to the definition of areas. The code task is simply to enrol the several statistic events involved in the <Scheduler> and provide a graphical output to be visualized in the stock panel.
3.5 Linking ABM application and BIM
The application developed is conceived to link the geometrical result of the iteration among intelligent agents with the “BIM-world” via the API (Advanced Programming Interface).
The dataset provided by the BIM, in this case represented by the in-stances “surface”, define the agents’ interaction: they react to events generated every time the surface analyzed is modified. In summary, instances are classified through their <Unique_ID> and their geometrical data are imported into the Canvas (fig. 1); Here, the program identifies geometrical values and starts its computation, until the optimized working surface is obtained.
Furthermore, when an object is modified, the system updates data in order to avoid inconsistency within the BIM model. However, the interaction mode varies as a function of the type of interaction. Any request made via the BIM interface is immediately forwarded to the combined ABM application, and then the BIM awaits the completion of the task: in this case, a synchronous mode of interaction is established. Otherwise, when the ABM application needs to interact with the BIM world, a request will be show in the alert palette, waiting for the project manager validation.
4 CONCLUSIONS
The research started investigating the lacks of current construction management process and tools. The result is the identification of the wasted working areas and the lack of tools to predict the occupancy of area in construction site. After that, a leaner way to allocate resources in the construction site is individuated in the use of LBM (Location-Based Management).
Furthermore, a key-concept to optimization is collaboration, and the BIM methodology helps process actor in sharing information about material and drawings. Therefore, to increase the effectivity of process using reliable data, an Agent-Based simulation was linked to the BIM model, that represents the topology of these agents
Finally, the optimized area is defined by means of an Agent-Based Simulation, defining the area that a working-crew effectively need to accomplish the assigned task. The next step will be the lean management of these areas, with the scope to warrant the higher rate possible of occupancy in order to maximize the contractor's productivity.
117 | Proceedings IGLC | July 2017 | Heraklion, Greece

BIM and Agent-based Model Integration for Construction Management Optimization
5 REFERENCES
Building Smart, international home of BIM <http://www.buildingsmart.org/> last access 13/04/2016.
Castelfranchi, C., Falcone, R., 1998, Toward a theory of delegation for Agents-Based systems, Robotics and Autonomous systems, 24 (24), pp. 141-157.
Gilbert, N., 2008, Agent-Based Models. Sage Publications, Los Angeles, p. 14. Ding, L., Y., Zhong, B., T., Wu, S., Luo, H., B., Construction risk knowledge management
in BIM using ontology and semantic web technology in Safety Science, 87 (2016) pp. 202-213.
Eastman, C. Teicholz, P., Sacks, R., & Liston, K. (2011). BIM handbook: a guide to building information modelling for owners, managers, designers, engineers, and contractors. Wiley.
Goh, Y., M., Askar Ali, M. J., A hybrid simulation approach for integrating safety behaviour into construction planning: An earthmoving case study in Accident Analysis and prevention 93 (2016), pp 310-318.
Kenley, R., Seppänen, O., 2009, Location-based management of construction projects: part of a new typology for project scheduling methodologies in Proceedings of the 2009 Simulation Conference, Eds. Rossetti M., D., Hill, R., R., Johansson, A., Dunkin A. and Ingalls, R.G. Austin, TX, USA, December 13-16, pp 2563-2570.
Kumar, S., S., Cheng., J., C., P., A BIM-based automated site layout planning framework for congested construction sites in Automation in Construction, 59 (2015) pp. 24-37.
Liang, C., 2012, Agent-based modelling in urban and architectural research: A brief literature review. Frontiers of architectural Research vol. 1 (2012) pp. 166-177.
McArthur, J.J., 2015, A building information management (BIM) framework and supporting case study for existing building operations, maintenance and sustainability, in Procedia Engineering 118 (2015), pp. 1104-1111.
Novembri, A., Fioravanti, A., Rossini, F.L., 2015, Geometria qualitativa nel BIM-world: Generazione della Location Breakdown Structure (LBS) per un processo di costruzione sostenibile, in Environmental sustainability, circular economy and building production. Maggioli Editore, pp. 502-521.
Scherer, R.J., Schapke, S. E., a distributed multi-model-based Management Information System for simulation and decision-making on construction projects, in Advanced Engineering Informatics, 25 (2011) pp. 582-599.
Singh, V., Ning, G., Xiangyu, W., 2011, A theoretical framework of a BIM-based multi-disciplinary collaboration platform in Automation in construction 20 (2011) pp. 134-144.
Solihin, W., Eastman, C., 2015, Classification of rules for automated BIM rule checking development, in Automation in construction, Vol. 53 (2015), pp. 69-82.
Taillandier, F., Taillandier, P., Tepeli, E., Breysse, D., Mehdizadeh, R., Khartabil, f., a multi-agent model to manage risks in construction project (SMACC) in Automation in Construction, 58 (2015), pp. 1-18.
Websites: Laiserin J. in Laiserin Letter http://www.laiserin.com/ last access 15/02/2017. Microsoft Developer Network at <https://msdn.microsoft.com/en-
us/library/gg145045(v=vs.110).aspx>, last access 06/05/2017.
118 | Proceedings IGLC | July 2017 | Heraklion, Greece
Singh J., Mangal M., and Cheng J.C.P. (2017). “IT for Lean Construction-A Survey in India.” In: LC3 2017 Volume II – Proceedings of the 25th Annual Conference of the International Group for Lean Construction (IGLC), Walsh, K., Sacks, R., Brilakis, I. (eds.), Heraklion, Greece, pp. 119–126. DOI: https://doi.org/10.24928/2017/0321
IT FOR LEAN CONSTRUCTION - A SURVEY IN INDIA
Jyoti Singh1, Mohit Mangal2 and Jack C.P. Cheng3*
Abstract: Construction is a complex and challenging process consisting of various kinds of waste resulting in client dissatisfaction, cost and time overrun. Waste is defined as a non-value adding component which uses project resources and efforts without achieving any objective. Factors leading to waste in construction are termed as "causes of waste". Current construction practices are unable to eliminate these "causes of waste" due to limited use of technology. This paper presents an IT based methodology to eliminate various "causes of waste" to support lean construction and thereby making the construction process efficient. A questionnaire survey was carried out to investigate major "causes of waste" in the Indian construction industry. 30 major "causes of waste" were identified in the design process, construction planning and site management process, and mal-administration. Literature review helped us identify 13 available IT applications for lean construction. This study aims to link the identified IT applications with relevant "causes of waste" through the developed relationship matrix to mitigate waste causing activities. It was observed that 23 out of the 30 identified major "causes of waste" can be eliminated from 13 identified IT applications.
Keywords: Lean Construction, Information Technology, Survey
1 INTRODUCTION
The construction industry plays an important role in the development and economic growth of any country. It is a complex and challenging process consisting of various kinds of waste resulting in cost and time overrun, client dissatisfaction, etc.
Waste is defined as a non-value adding component which uses project resources and efforts but does not achieve any objective of the project. Factors leading to waste in construction projects can be termed as "causes of waste". Current construction practices are unable to eliminate these "causes of waste" efficiently due to limited use of information technology (IT) in the construction industry. Hence, there is a need to address and manage the "causes of waste" in an integrated manner to achieve project success in terms of cost, time and satisfaction to clients.
Lean is a philosophy that seeks to eliminate waste in all aspects of production activities in an organization (Womack et al., 1991). It has a very extensive collection of tools and concepts, such as value stream mapping which permits systematic view of value flow process (Pasqualini and Zawislak, 2005), integrated project delivery (IPD) which encourages communication and collaboration among participants (Suttie et al., 2013), last
1 Research Postgraduate Student, Dept. of Civil and Environment Engineering, The Hong Kong
University of Science and Technology, Hong Kong, China, +852 5106 4954, [email protected] 2 Research Postgraduate Student, Dept. of Civil and Environment Engineering, The Hong Kong
University of Science and Technology, Hong Kong, China, +852 5980 1108, [email protected] 3 Associate Professor (Corresponding Author), Dept. of Civil and Environment Engineering, The Hong
Kong University, of Science and Technology, Hong Kong, Chinamailto:[email protected], +852 2358 8186, [email protected], +852 2358 8186, [email protected]
119 | Proceedings IGLC | July 2017 | Heraklion, Greece
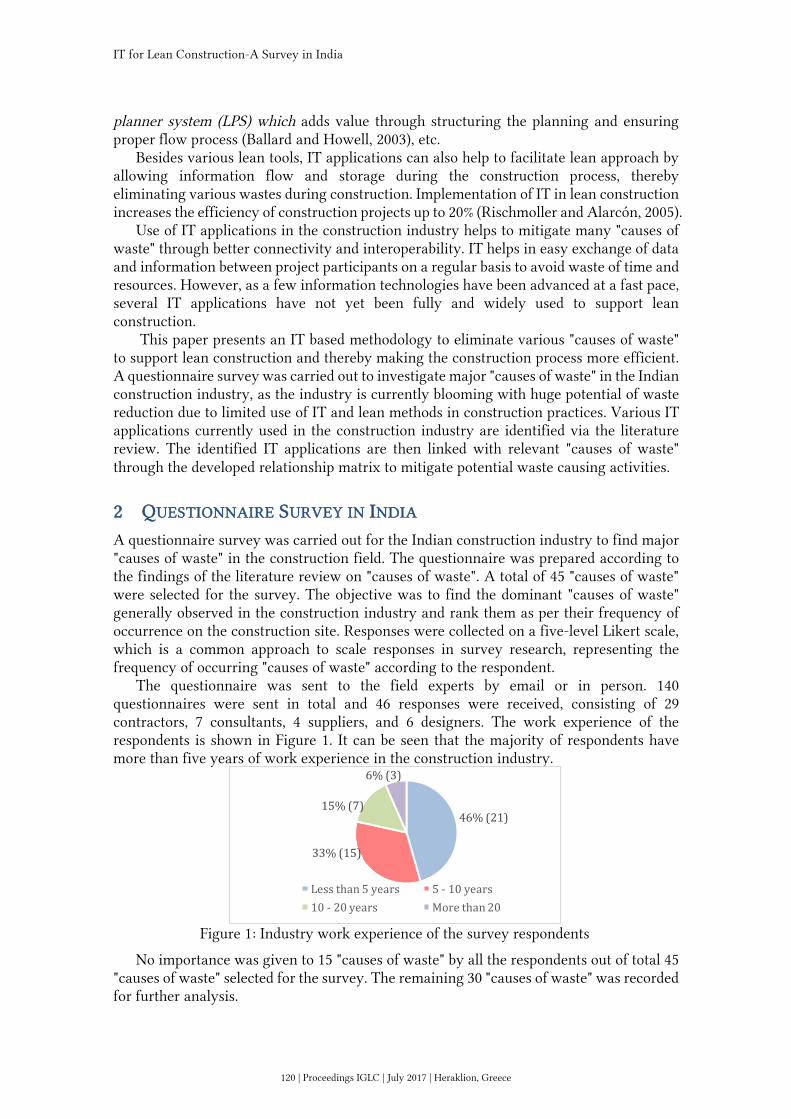
IT for Lean Construction-A Survey in India
planner system (LPS) which adds value through structuring the planning and ensuring proper flow process (Ballard and Howell, 2003), etc.
Besides various lean tools, IT applications can also help to facilitate lean approach by allowing information flow and storage during the construction process, thereby eliminating various wastes during construction. Implementation of IT in lean construction increases the efficiency of construction projects up to 20% (Rischmoller and Alarcón, 2005).
Use of IT applications in the construction industry helps to mitigate many "causes of waste" through better connectivity and interoperability. IT helps in easy exchange of data and information between project participants on a regular basis to avoid waste of time and resources. However, as a few information technologies have been advanced at a fast pace, several IT applications have not yet been fully and widely used to support lean construction.
This paper presents an IT based methodology to eliminate various "causes of waste" to support lean construction and thereby making the construction process more efficient. A questionnaire survey was carried out to investigate major "causes of waste" in the Indian construction industry, as the industry is currently blooming with huge potential of waste reduction due to limited use of IT and lean methods in construction practices. Various IT applications currently used in the construction industry are identified via the literature review. The identified IT applications are then linked with relevant "causes of waste" through the developed relationship matrix to mitigate potential waste causing activities.
2 QUESTIONNAIRE SURVEY IN INDIA A questionnaire survey was carried out for the Indian construction industry to find major "causes of waste" in the construction field. The questionnaire was prepared according to the findings of the literature review on "causes of waste". A total of 45 "causes of waste" were selected for the survey. The objective was to find the dominant "causes of waste" generally observed in the construction industry and rank them as per their frequency of occurrence on the construction site. Responses were collected on a five-level Likert scale, which is a common approach to scale responses in survey research, representing the frequency of occurring "causes of waste" according to the respondent.
The questionnaire was sent to the field experts by email or in person. 140 questionnaires were sent in total and 46 responses were received, consisting of 29 contractors, 7 consultants, 4 suppliers, and 6 designers. The work experience of the respondents is shown in Figure 1. It can be seen that the majority of respondents have more than five years of work experience in the construction industry.
Figure 1: Industry work experience of the survey respondents
No importance was given to 15 "causes of waste" by all the respondents out of total 45 "causes of waste" selected for the survey. The remaining 30 "causes of waste" was recorded for further analysis.
46%(21)
33%(15)
15%(7)
6%(3)
Lessthan5years 5- 10years10- 20years Morethan20
120 | Proceedings IGLC | July 2017 | Heraklion, Greece

Jyoti Singh, Mohit Mangal and Jack C.P. Cheng
The collected responses were analysed using Cronbach's alpha test and Relative Importance Index method (RII). The questionnaire survey comprised of different "causes of waste". Therefore, Cronbach’s alpha test was performed to check the internal consistency (reliability) of "causes of waste" before further analysis. A Cronbach’s alpha value of 0.911 is resulted, showing the strong correlation among the "causes of waste" and thus, "causes of waste" data were reliable for further analysis. RII was then used to rank the "causes of waste" by calculating the weighted average using the formula as given:
RII = ∑𝑊𝑛
(𝑁 ∗ 𝐴)
where, Wn = weights given by the respondent on the Likert scale of 1 to 5 N = number of respondents A = the highest weight assigned, (5 in the current case)
Table 1: RII and rank of the "causes of waste" identified in survey
Note: (I) = Design management waste, (II) = Construction planning & site management waste, and (III) = Mal-administration.
Ranking for the selected 30 major "causes of waste" was then carried out as per their RII response factor, as given in Table 1. The selected 30 "causes of waste" were also categorized using factor analysis. Three categories were identified to group all the selected
Rank/No. Attributes RII Identified Group 1 Unnecessary work 0.821 II 2 Rework 0.815 II 3 Poor planning and co-ordination of resources 0.785 II 4 Lack of proper supervision 0.769 II 5 Poor communication among team members 0.764 II 6 Waiting time 0.749 II 7 Lack of transparency 0.749 III 8 Inadequate time given for planning and design
stage 0.744 I
9 Design changes by clients 0.744 I 10 Lack of team work and co-ordination between
parties 0.718 III
11 Insufficient quality 0.718 II 12 Improper documentation of design data 0.692 I 13 Excessive inventory 0.692 II 14 Use of old techniques 0.687 II 15 Lack of experienced staff 0.687 III 16 Lack of training programs 0.687 III 17 Lack of past project review 0.682 I 18 Lack of skilled manpower 0.672 II 19 Choice of wrong construction methods 0.667 II 20 Lack of risk management plans 0.662 III 21 Poor safety 0.656 III 22 Human error 0.656 II 23 Bureaucracy & red tape 0.631 III 24 Delay in approval 0.626 I 25 Inferior working conditions 0.621 II 26 Inefficiency of equipment 0.621 II 27 Excessive processing 0.615 II 28 Changes made by regulatory authority 0.605 III 29 Unnecessary movement 0.590 II 30 Scrape waste 0.585 II
121 | Proceedings IGLC | July 2017 | Heraklion, Greece

IT for Lean Construction-A Survey in India
30 "causes of waste". Table 1 shows all selected 30 "causes of waste" categorised as (I) design management waste, (II) construction planning & site management waste, and (III) mal-administration. As shown in Table 1, the most common waste in the Indian construction as per the field experts mainly follow the category (II) construction planning & site management waste.
3 IT BASED APPROACHES
Based on literature review, some commonly used IT applications in the construction industry with their benefits are summarized as follows:
• (A) Building Information Modelling (BIM) /Virtual Design and Construction (VDC) - Both BIM and VDC share similar characteristics. BIM/VDC helps to improve the efficiency of the design phase, reduce the time taken and quantity take off and increase the percentage planned-complete by a considerable amount. It also increases reliability and visibility through 3D/4D virtual models (Knotten and Svalestuen, 2014).
• (B) Cloud Computing - Cloud computing enables rapid visualization of demand and supply data and helps in instant tracking of construction material status in the supply chain. It also helps in merging and synchronizing multiple sources of information for better communication among various stakeholders (Azambuja et al., 2013).
• (C) Common Data Environment (CDE) - CDE helps to collect, manage, share information and disseminate all relevant documents among various stakeholders (PAS 1192-2, 2013).
• (D) Data Mining - Data mining helps to extract repeated and useful patterns from a large data set to predict the outcome of future events (Danilevsky et al., 2014).
• (E) Geographical Information System (GIS) - GIS provides access to asset data within reasonable time for site feasibility analysis, and efficient use of equipment (Maisuria, 2013)
• (F) GPS Support System - GPS helps in tracking the whereabouts of fleet of assets in order to reduce lead-time at work sites with improved delivery and customer satisfaction (Simonsson and Carlsward, 2005).
• (G) On-Site Vision Tracking - Using closed circuit television (CCTV) effective positioning of personnel in construction sites, activity sequence analysis, enhancing pull flow mechanism, better localization of tools and material, detection of conflicts, visualization of waste and safety on site as well as adequate flow of information throughout the construction process can be supported (Brilakis et al., 2008).
• (H) Radio Frequency Identification (RFID) - RFID provides real-time information of assets, improves visibility and traceability, enhance safety and security of workers, and reduce resource wastage (Lu et al., 2011).
• (I) Robots - Robots provide better productivity under extreme conditions with a high degree of precision, speed of execution, safety, and security (Warszawski, 1986).
122 | Proceedings IGLC | July 2017 | Heraklion, Greece
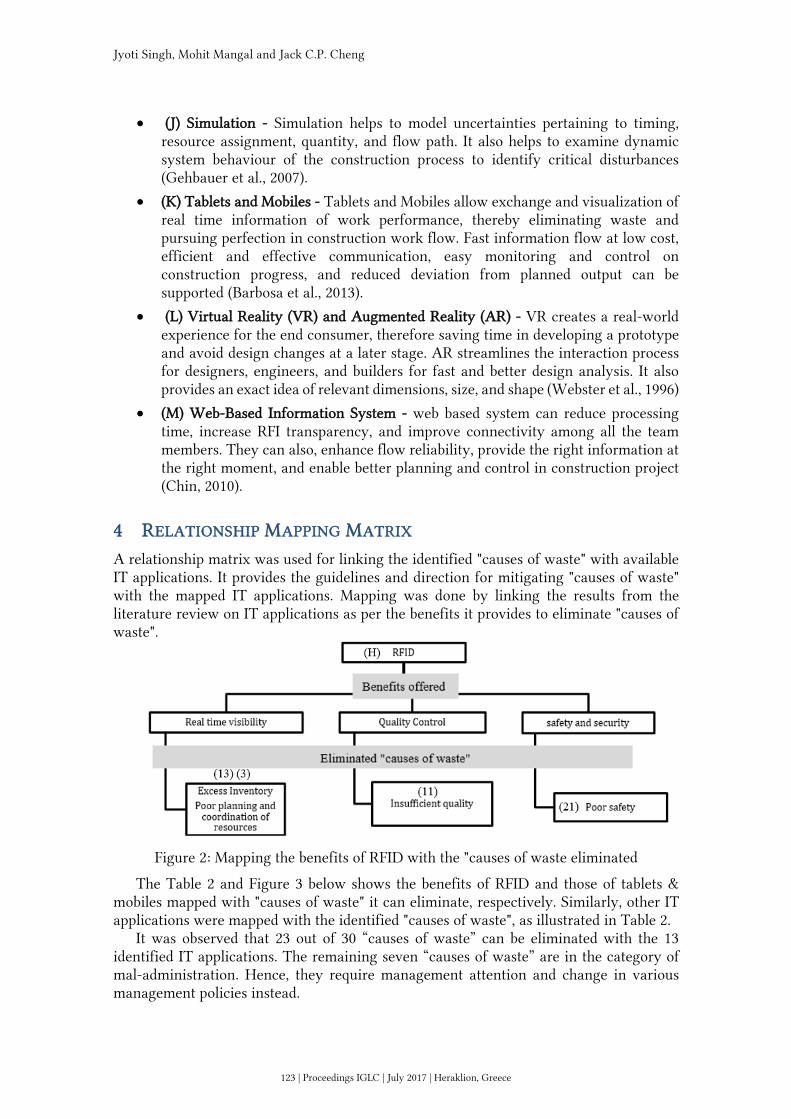
Jyoti Singh, Mohit Mangal and Jack C.P. Cheng
• (J) Simulation - Simulation helps to model uncertainties pertaining to timing, resource assignment, quantity, and flow path. It also helps to examine dynamic system behaviour of the construction process to identify critical disturbances (Gehbauer et al., 2007).
• (K) Tablets and Mobiles - Tablets and Mobiles allow exchange and visualization of real time information of work performance, thereby eliminating waste and pursuing perfection in construction work flow. Fast information flow at low cost, efficient and effective communication, easy monitoring and control on construction progress, and reduced deviation from planned output can be supported (Barbosa et al., 2013).
• (L) Virtual Reality (VR) and Augmented Reality (AR) - VR creates a real-world experience for the end consumer, therefore saving time in developing a prototype and avoid design changes at a later stage. AR streamlines the interaction process for designers, engineers, and builders for fast and better design analysis. It also provides an exact idea of relevant dimensions, size, and shape (Webster et al., 1996)
• (M) Web-Based Information System - web based system can reduce processing time, increase RFI transparency, and improve connectivity among all the team members. They can also, enhance flow reliability, provide the right information at the right moment, and enable better planning and control in construction project (Chin, 2010).
4 RELATIONSHIP MAPPING MATRIX
A relationship matrix was used for linking the identified "causes of waste" with available IT applications. It provides the guidelines and direction for mitigating "causes of waste" with the mapped IT applications. Mapping was done by linking the results from the literature review on IT applications as per the benefits it provides to eliminate "causes of waste".
Figure 2: Mapping the benefits of RFID with the "causes of waste eliminated
The Table 2 and Figure 3 below shows the benefits of RFID and those of tablets & mobiles mapped with "causes of waste" it can eliminate, respectively. Similarly, other IT applications were mapped with the identified "causes of waste", as illustrated in Table 2.
It was observed that 23 out of 30 “causes of waste” can be eliminated with the 13 identified IT applications. The remaining seven “causes of waste” are in the category of mal-administration. Hence, they require management attention and change in various management policies instead.
123 | Proceedings IGLC | July 2017 | Heraklion, Greece

IT for Lean Construction-A Survey in India
Rank/No. Attributes IT applications (I) Design Management Waste
8 Inadequate time given for planning and design stage
(A) BIM/VDC; (L) VR and AR; (M) Web-based information system
9 Design changes by client (A) BIM/VDC; (M) Web-based information system 12 Improper documentation of
design data (A) BIM/VDC; (C) CDE; (L) VR and AR; (M) Web-based information system
17 Lack of past project review (D) Data mining; (M) Web-based information system 24 Delay in drawing approval (A) BIM/VDC; (C) CDE; (M) Web-based information system (II) Construction Planning & Site Management Waste
1 Unnecessary work (A) BIM/VDC; (G) On-Site vision tracking; (I) Robots; (J) Simulation; (L) VR and AR
2 Rework (A) BIM/VDC; (L) VR and AR 3 Poor planning and co-
ordination of resources (A) BIM/VDC; (B) Cloud computing; (C) CDE; (E) GIS; (F) GPS; (G) On-Site vision tracking; (H) RFID; (J) Simulation; (K) Tablets and mobiles; (M) Web-based information system
4 Lack of proper supervision (A) BIM/VDC; (B) Cloud computing; (F) GPS; (G) On-Site vision tracking; (J) Simulation; (L) VR and AR; (M) Web-based information system
5 Poor communication among team members
(A) BIM/VDC; (B) Cloud computing; (C) CDE; (K) Tablets and mobiles; (L) VR and AR; (M) Web-based information system
6 Waiting time (A) BIM/VDC; (B) Cloud computing; (F) GPS; (G) On-Site vision tracking; (I) Robots; (J) Simulation; (K) Tablets and mobiles
11 Insufficient quality (H) RFID 13 Excessive inventory (B) Cloud computing; (F) GPS; (G) On-Site vision tracking; (H)
RFID 14 Use of old techniques 18 Lack of skilled manpower (I) Robots 19 Choice of wrong
construction methods (A) BIM/VDC; (L) VR and AR
22 Human error (B) Cloud computing; (G) On-Site vision tracking; (I) Robot 25 Inferior working conditions (G) On-Site vision tracking 26 Inefficiency of equipment (G) On-Site vision tracking 27 Excessive processing (I) Robots 29 Unnecessary movement 30 Scrap Waste (G) On-Site vision tracking; (J) Simulation
Table 2: Relationship matrix for IT applications and "causes of waste"
Rank/No. Attributes IT applications (III) Mal-administration
7 Lack of transparency (A) BIM/VDC; (B) Cloud computing; (C) CDE; (E) GIS; (F) GPS; (G) On-Site vision tracking; (J) Simulation; (L) VR and AR; (M) Web-based information system,
10 Lack of team work and Co-ordination between parties
(A) BIM/VDC; (B) Cloud computing; (C) CDE; (L) VR and AR; (M) Web-based information system
15 Lack of experienced staff 16 Lack of training programs 20 Lack of risk management
plans (A) BIM/ VDC; (D) Data Mining; (J) Simulation; (L) VR and AR
21 Poor safety (G) On-Site vision tracking; (H) RFID; (I) Robots, 23 Bureaucracy & red tape 28 Changes made by regulatory
authority
124 | Proceedings IGLC | July 2017 | Heraklion, Greece

Jyoti Singh, Mohit Mangal and Jack C.P. Cheng
Figure 3: Mapping the benefits of tablets & mobiles with the "causes of waste
eliminated
5 CONCLUSIONS AND FUTURE WORK
Past case studies and observations from various construction sites have identified 30 major "causes of waste" in the Indian construction industry. As per questionnaire survey, major "causes of waste" can be categorised into (I) design management related waste, (II) construction planning & site management related waste, and (III) mal-administration.
13 relevant IT applications satisfying lean perspective were identified through literature review. It was found that 23 out of the 30 major "causes of waste" can be effectively eliminated through the 13 identified IT applications. The remaining seven “cause of waste” require management intervention for their mitigation. Although the questionnaire survey was carried out in India, results are still valid globally due to similar nature of construction processes all over the world.
As per the developed relationship matrix, it was found that the use of IT such as BIM and web-based information systems in construction processes from cradle to gate can effectively share various important information system among the participants and can reduce most of the “causes of waste” with ease. The on-site vision tracking system also helps in reducing site management waste.
The developed relationship matrix is based on the inputs of many experts and provides a good solution to mitigate the common “causes of waste” on construction sites. However, a study is required in the future to develop in-depth knowledge about the interaction of identified “causes of waste” with each other.
6 REFERENCES Azambuja, M., Schnitzer, T., Sahin, M. & Lee, F. (2013) Enabling Lean Supply with a Cloud
Computing Platform - An Exploratory Case Study. The 21st Annual Conference of the International Group for Lean Construction. Fortaleza, Brazil.
Pasqualini, F. & Zawislak, P. (2005) Value Stream Mapping in Construction: A Case Study in a Brazilian Construction Company. The 13th International Group for Lean Construction Conference: Proceedings. Sydney, Australia.
125 | Proceedings IGLC | July 2017 | Heraklion, Greece

IT for Lean Construction-A Survey in India
Ballard, G. & Howell, G. (2003) An Update on Last Planner. The 11th Annual Conference of the International Group for Lean Construction. Virginia, USA.
Barbosa, G., Andrade, F., Biotto, C. & Mota, B. (2013) Heijunka System to Level Telescopic Forklift Activities Using Tablets in Construction Site. The 21st Annual Conference of the International Group for Lean Construction. Fortaleza, Brazil.
Brilakis, I., Cordova, F. & Clark, P. (2008) Automated 3D Vision Tracking for Project Control Support. The 15th EG-ICE International Workshop. Plymouth, UK.
Chin, C. (2010) RFI Responsiveness of Paper-Based vs. Web-Based Information Processing Systems. The 18th Annual Conference of the International Group for Lean Construction. Haifa, Israel.
Danilevsky, M., Wang, C., Desai, N., Ren, X., Guo, J. & Han, J. (2014) Automatic Construction and Ranking of Topical Key phrases on Collections of Short Documents.
Gehbauer, F., Zulch, G. & Ott, M. (2007) Simulation-Based Analysis of Disturbances in Construction Operations. The 15th Annual Conference of the International Group for Lean Construction. Michigan, USA.
Knotten, V. & Svalestuen, F. (2014) Implementing Virtual Design and Construction (VDC) in Veidekke – Using Simple Metrics to Improve the Design Management Process. The 22nd Annual Conference of the International Group for Lean Construction. Oslo, Norway.
Koskela, L., Howell, G., Ballard, G. & Tommelein, I. (2002). The Foundations of Lean Construction, Oxford, UK, Butterworth Heinemann.
Lu, W., Huang, G. Q. & Li, H. (2011) Scenarios for applying RFID technology in Construction Project Management. Automation in Construction, 20 (2).
Maisuria, A. & Rathod, H. (2013) GIS and its Application in Construction Industry. The International Journal of Advanced Research in Engineering, Science & management.
Rischmoller, L. & Alarcon, L. (2005) Using Lean Principles as a Framework to Study Information Technology in Construction. The 13th International Group for Lean Construction Conference: Proceedings. Sydney, Australia.
Simonsson, P. & Carlsward, J. (2005) Evaluation of a GPS Support System for Fleet Management Control. The 13th Annual Conference of the International Group for Lean Construction. Sydney, Australia.
Specification for information management for the capital/delivery phase of construction projects using building information modelling. PAS 1192-2:2013.
Suttie, J. (2013) The impacts and effects of Integrated Project Delivery on participating organization with a focus on organization culture. The 21st International Group of Lean Construction. Fortaleza, Brazil.
Webster, A., Feiner, S., Macintyre, B., Massie, W. & Krueger, T. (1996) Augmented Reality in Architectural Construction, Inspection, and Renovation.
Womack, J., Jones, D. & Roos, D. (1991) The Machine that changed the World: The Story of Lean Production, New York.
Warszawski, A. (1984) Application od Robotics to Building Construction. The 1st International Conference on Robotics in Construction.
126 | Proceedings IGLC | July 2017 | Heraklion, Greece

von Heyl, J. and Teizer, J. (2017). “Lean Production Controlling and Progress Tracking Using Digital Methods.” In: LC3 2017 Volume II – Proceedings of the 25th Annual Conference of the International Group for Lean Construction (IGLC), Walsh, K., Sacks, R., Brilakis, I. (eds.), Heraklion, Greece, pp. 127-134. DOI: https://doi.org/10.24928/2017/0238
LEAN PRODUCTION CONTROLLING AND TRACKING USING DIGITAL METHODS
Jakob von Heyl1 and Jochen Teizer2
Abstract: Lean construction projects are understood as temporary production systems that eliminate waste, allow collaboration and optimize structures of the value added chain. Remaining crucial challenges in construction are the coordination of the involved trades and the tracking of construction progress. Current research in Lean Construction Management (LCM) targets automated digital methods that support work package planning and make inferences about states of progress. The scope of the presented work focuses on closing the feedback loop of lean construction planning, progress tracking, and status control by using 4D information from Building Information Modeling (BIM) as well as Internet-of-Things (IoT) technology for reporting actual progress.
Keywords: Production Planning and Control, Last Planner System, Takt Planning and Takt Control, Information Management, Building Information Modeling, Information and Communication Technologies, Automated Progress Tracking.
1 INTRODUCTION Lean principles are based on several preceding economy of scale production approaches, originating from the ship building, aviation, and car manufacturing industries. Two prominent examples are Taylorism and Fordism. After the Second World War, Toyota adapted the ideas of Taylorism, Fordism and several other approaches, such as Total Quality Management (TQM), to a flexible production system with several products and variable batch sizes. A set of different principles, methods, and tools that reduce buffers, set-times and waste were consolidated in the Toyota Production System (TPS) (Womack et al. 1990). The term lean was coined by Krafcik in 1988, who described the advances in productivity of the Japanese automotive industry in comparison with western manufacturers (Krafcik 1988). His research was continued by Womack, Jones and Roos at the MIT in Boston, who identified a large productivity gap between Japanese and western car manufacturers and suppliers (Womack et al. 1990). Many attempts by western manufacturers to copy specific TPS-tools failed. Therefore the main ideas were abstracted and bundled in the Lean Management Theory (Drew et al. 2004). Specific solutions can be derived from that theory for any industry or company.
The adaption of Lean Management to the construction industry was first examined by Koskela in 1992. He developed the TVF-Theory, saying that construction can be described with the transformation of resources and the creation of Value and Flow of materials and people. (Koskela 1992). Ever since then, several lean production control methods have been developed for the construction sector.
1 Dipl.-Wirt.-Ing., Scientific Assistant, Institute of Construction Management, University of Stuttgart, Germany, [email protected]. 2 Ph.D., Dipl.-Ing., Chair of Computing in Civil Engineering, Ruhr-University Bochum, Germany,
127 | Proceedings IGLC | July 2017 | Heraklion, Greece

Lean Production Controlling and Progress Tracking Using Digital Methods
2 LEAN PRODUCTION PLANNING AND CONTROL METHODS
Two prominent Production Control Methods (LPS and TPTC) are explored:
2.1.1 Last Planner System (LPS)
The Last Planner is the project participant accountable for the execution and control of operative tasks. The Last Planner System (LPS) is a method to manage the tasks in the design or construction phase of a project. The main idea is to shield near-term work via a network of commitments in order to improve reliability and workflow, resulting in an improved adherence to schedules and productivity (Ballard and Howell 1994). LPS leads to a decentralization of management tasks and promotes cooperative work. Working areas, tasks, and schedules are planned by a team consisting of the affected project participants. This improves commitment and solution orientated teamwork. LPS consists of four phases aimed to develop more detailed plans as the project moves on (Koskela et al. 2010) (see Figure 1).
Figure 1: Phases of LPS
LPS is a method to successively identify, prepare and execute required working steps. After a general set-up, work is getting pulled and made ready for execution while becoming more precise and detailed. The supply chain is getting permanently adjusted. According to Ballard and Howell three categories of constraints have to be considered (Ballard and Howell 2003):
1. Directives: Information required for execution (e.g., design documents) 2. Prerequisite work: Work needed to be completed before the start of specific tasks. 3. Resources: Labour, equipment and space required for the execution. In comparison with traditional Methods, like the Critical Path Method (CPM), LPS
focuses on reduced variability. This indirectly leads to improved productivity rates, reduced durations, and resource consumption. A disadvantage of LPS is the missing reflection of the current status of the construction site on higher planning levels (Koskela et al. 2010).
Furthermore, LPS is a bottom-up management approach based on cooperative work packaging and commitments. Activities are constantly getting prepared for execution by the responsible project participants. In order to prepare work for execution, related constraints have to be identified and removed. Therefore LPS relies heavily on correct information to assess work progress and the use of resources.
2.1.2 Takt Planning and Takt Control (TPTC)
“Takt” is a German word that can be translated as pulse, cycle time or work cycle. It is also referred to rhythm or cadence, as it describes something is done regularly and on time. Takt-time is used to schedule production and supply times (Frandson et al. 2013). The first known use of Takt-times dates back to the 16th century, when merchant ships and warships were produced in Venice using a Takt. With the industrial revolution Takt was becoming a part of many production approaches, such as Fordism or Toyota Production System (TPS) (Haghsheno et al. 2016).
Reliability
Feedback (PPC)
Phase PlanningMaster Plan Look ahead Planning Weekly Work Planning
128 | Proceedings IGLC | July 2017 | Heraklion, Greece

Jakob von Heyl and Jochen Teizer
Takt is mostly used in repetitive construction processes. This criterion is particularly met by linear infrastructure projects, e.g. the construction of bridges, tunnels, roads or railways (Haghsheno et al. 2016). The structure and manufacturing processes determine the size of the working area, the required effort and working steps as well as the productivity rates. These are the input variables for the calculation of the Takt-time in order to achieve a consistent production speed. Prefabricated elements, which are often used in infrastructure projects (e.g., bridge elements or tunnel lining elements), facilitate the determination of suitable segments and the calculation of working times.
The use of Takt in the construction industry is nowadays strongly intertwined with the method Takt Planning and Takt Control (TPTC), which has been developed in Germany in the middle of the last decade. TPTC has been applied in numerous construction projects since then (Haghsheno et al. 2016). The preparation of a Takt-based production is done in two main steps, the process analysis and the Takt-planning. Each of the two steps can be further differentiated in three steps (Frandson et al. 2013). The outcome is a production plan including time and space. The compliance with the production plan is checked constantly during the next step, known as Takt Control (see Figure 2). The working packages are highly interdependent. Therefore a permanent control and update of the production plan is required in order to deal with potential changes and disruptions. To ensure production stability, current developments are monitored and necessary adjustments are made immediately in regular meetings (Haghsheno et al. 2016, Kenley and Seppänen 2010).
Figure 2: Procedure of Takt Planning and Takt Control
Takt-planning is top-down approach and requires reliable plans and a deep understanding of the structure, the construction process, as well as the supply chain. There is a high demand for correct and up-to-date information in order to constantly adjust the production plan. When these requirements are met Takt-planning becomes a powerful method to increase the stability and reliability of the production. Disadvantages arise in reacting to unexpected events as the method lacks flexibility. The higher the number of alternations or modifications, the less it is suitable.
2.1.3 Comparison
LPS and TPTC work differently but are both aiming to achieve a continuous flow and improve project understanding due to the visualization of the tasks, processes and dependencies. Both methodologies have in common that they require a continuous monitoring of the production and a functioning information and communication management system. The differences are that TPTC is a rather rigid top-down method requiring a stable supply chain and little variability. LPS is a more agile bottom-up approach focusing on mutual agreement between the project participants. Main differences of the two approaches are depicted in Table 1.
Process Analysis Takt Planning Takt ControlSubsteps:- Gather information- Define work stations- Understand the trade sequence
Substeps:- Balance the workflow- Understand the individual trade
durations- Plan production
Requirements:- Monitor production continuously- Plan adjustments near real-timeTool:- Use Takt control board
129 | Proceedings IGLC | July 2017 | Heraklion, Greece
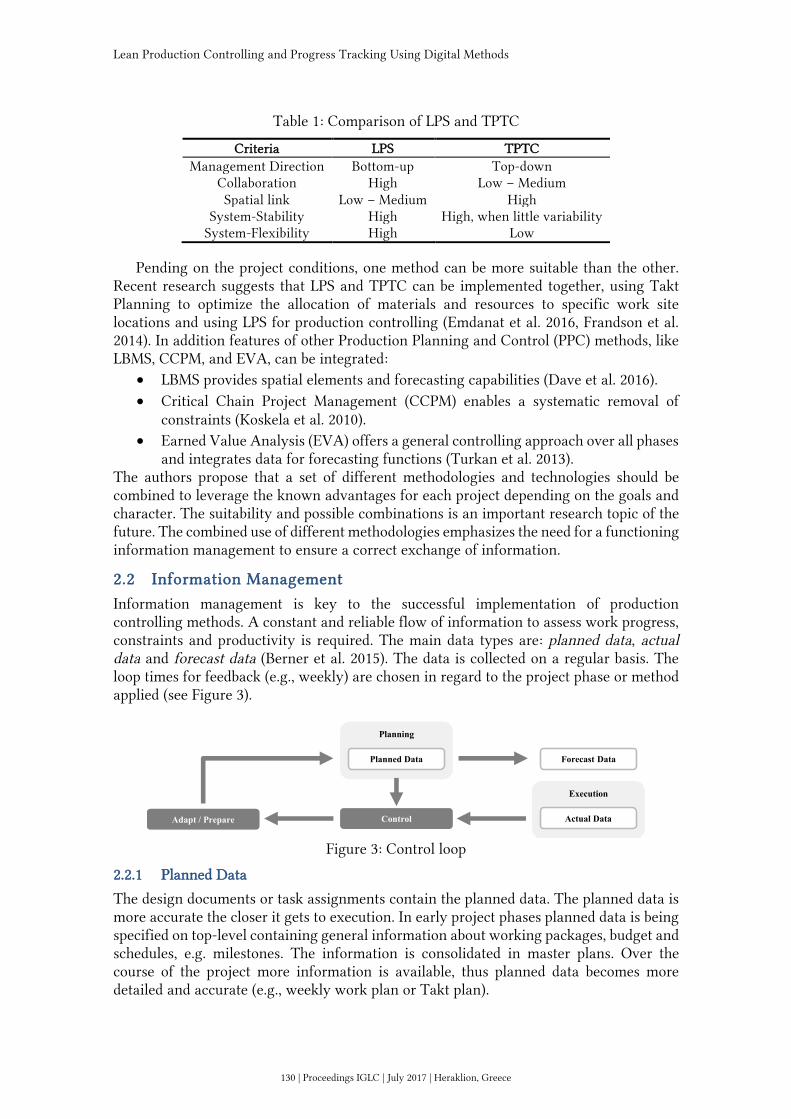
Lean Production Controlling and Progress Tracking Using Digital Methods
Table 1: Comparison of LPS and TPTC
Criteria LPS TPTC Management Direction Bottom-up Top-down
Collaboration High Low – Medium Spatial link Low – Medium High
System-Stability High High, when little variability System-Flexibility High Low
Pending on the project conditions, one method can be more suitable than the other.
Recent research suggests that LPS and TPTC can be implemented together, using Takt Planning to optimize the allocation of materials and resources to specific work site locations and using LPS for production controlling (Emdanat et al. 2016, Frandson et al. 2014). In addition features of other Production Planning and Control (PPC) methods, like LBMS, CCPM, and EVA, can be integrated:
• LBMS provides spatial elements and forecasting capabilities (Dave et al. 2016). • Critical Chain Project Management (CCPM) enables a systematic removal of
constraints (Koskela et al. 2010). • Earned Value Analysis (EVA) offers a general controlling approach over all phases
and integrates data for forecasting functions (Turkan et al. 2013). The authors propose that a set of different methodologies and technologies should be combined to leverage the known advantages for each project depending on the goals and character. The suitability and possible combinations is an important research topic of the future. The combined use of different methodologies emphasizes the need for a functioning information management to ensure a correct exchange of information.
2.2 Information Management
Information management is key to the successful implementation of production controlling methods. A constant and reliable flow of information to assess work progress, constraints and productivity is required. The main data types are: planned data, actual data and forecast data (Berner et al. 2015). The data is collected on a regular basis. The loop times for feedback (e.g., weekly) are chosen in regard to the project phase or method applied (see Figure 3).
Figure 3: Control loop
2.2.1 Planned Data
The design documents or task assignments contain the planned data. The planned data is more accurate the closer it gets to execution. In early project phases planned data is being specified on top-level containing general information about working packages, budget and schedules, e.g. milestones. The information is consolidated in master plans. Over the course of the project more information is available, thus planned data becomes more detailed and accurate (e.g., weekly work plan or Takt plan).
Execution
Actual Data
Planning
Planned Data Forecast Data
ControlAdapt / Prepare
130 | Proceedings IGLC | July 2017 | Heraklion, Greece

Jakob von Heyl and Jochen Teizer
2.2.2 Actual Data
Actual data is collected during execution. An improved production management with fast reaction times requires reduced cycle times for the collection of actual data (Emdanat et al. 2016). Actual data is needed to assess the performance and contains information about quantities, labour hours, costs or execution times. It provides feedback to identify necessary adaptations and improves the preparation of working order. Key Performance Indicators (KPIs) facilitate the identification of shortcomings. They are calculated using actual data. Each method is using individual KPIs (e.g., Percent of Scheduled Assignments (PAP) or Percent Planned Complete (PPC) as part of LPS). While the collection of actual data is a prerequisite for the calculation of the different KPIs, the initial emphasis of this research is on tracking the completion of tasks.
2.2.3 Forecast Data
The task of forecasting is usually assigned to the most experienced construction managers, who often go with their gut feeling instead of using systematic forecasting methodologies. This might be satisfying in small projects, but projects with higher complexity require a more profound approach. Plausible forecasts can be calculated using up-to-date planned data and actual data, e.g. Estimate at Completion (EAC) using EVA (Turkan et al. 2013) or forecasts generated with LBMS (Dave et al. 2016).
2.3 Limitations
Studies show that there is a limited reflection of the current status of the construction site in the master or phase planning if LPS or TPTC are not sufficiently integrating suitable controlling and tracking functions from other methodologies. There is a need to compile and integrate tracking and forecasting information as feedback and input for fruitful look-ahead or Takt planning sessions (Dave et al. 2016). This is prerequisite for a successful identification, preparation and execution of single working steps.
The collection of actual data is a crucial step towards informed management systems and serves as a prerequisite for further successful production planning and controlling. Current progress on projects is often compiled manually which is very time consuming and prone to human error. It leads to overall lower product quality and decreases the chances for successful risk mitigation.
3 DIGITAL PROGRESS TRACKING Construction research has been increasingly focusing on discovering synergies between the adoption of lean practices and information and sensing technologies (Navon 2007). The use of information and communication technologies (ICT) are in particular beneficial to lean practices when they improve the flow of construction processes by identifying non-value adding activities that can be eliminated. Other examples are cycle-times that can be shortened, rework, variation and errors that can be omitted (Sacks et al. 2010).
Lean management and the adaption of technology is not new to construction. Several practical field applications exist, for example, Radio Frequency Identification (RFID) for pipe spool tracking (Song et al. 2006), Global Navigation Satellite System (GNSS) for earth hauling operations (Pradhananga and Teizer 2013), and wireless Real-time Location Sensing (RTLS) for tracking repetitive travel patterns of workers (Cheng et al. 2013). As outlined by Sacks et al. (2010) and Cheng et al. (2010), much stronger ties between Lean, BIM, and tracking technology are needed. Formalization of work-in-progress based on
131 | Proceedings IGLC | July 2017 | Heraklion, Greece
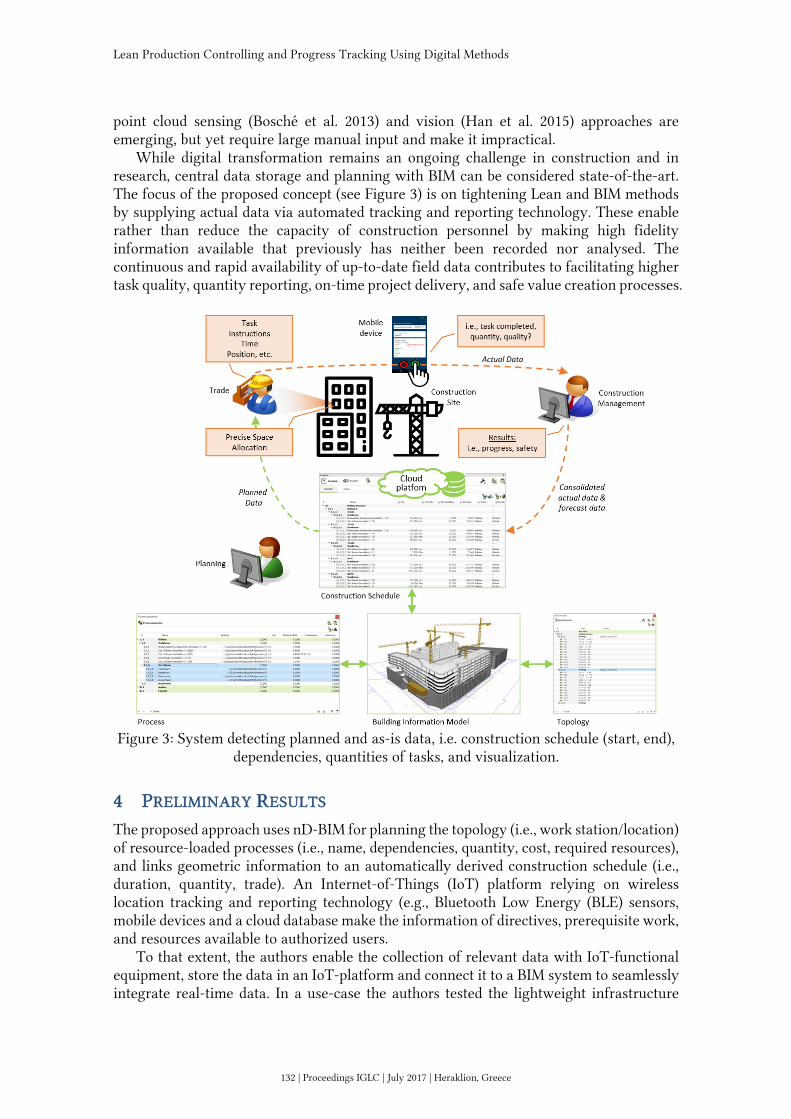
Lean Production Controlling and Progress Tracking Using Digital Methods
point cloud sensing (Bosché et al. 2013) and vision (Han et al. 2015) approaches are emerging, but yet require large manual input and make it impractical.
While digital transformation remains an ongoing challenge in construction and in research, central data storage and planning with BIM can be considered state-of-the-art. The focus of the proposed concept (see Figure 3) is on tightening Lean and BIM methods by supplying actual data via automated tracking and reporting technology. These enable rather than reduce the capacity of construction personnel by making high fidelity information available that previously has neither been recorded nor analysed. The continuous and rapid availability of up-to-date field data contributes to facilitating higher task quality, quantity reporting, on-time project delivery, and safe value creation processes.
Figure 3: System detecting planned and as-is data, i.e. construction schedule (start, end),
dependencies, quantities of tasks, and visualization.
4 PRELIMINARY RESULTS The proposed approach uses nD-BIM for planning the topology (i.e., work station/location) of resource-loaded processes (i.e., name, dependencies, quantity, cost, required resources), and links geometric information to an automatically derived construction schedule (i.e., duration, quantity, trade). An Internet-of-Things (IoT) platform relying on wireless location tracking and reporting technology (e.g., Bluetooth Low Energy (BLE) sensors, mobile devices and a cloud database make the information of directives, prerequisite work, and resources available to authorized users.
To that extent, the authors enable the collection of relevant data with IoT-functional equipment, store the data in an IoT-platform and connect it to a BIM system to seamlessly integrate real-time data. In a use-case the authors tested the lightweight infrastructure
132 | Proceedings IGLC | July 2017 | Heraklion, Greece

Jakob von Heyl and Jochen Teizer
solution for indoor tracking of personnel. A further test automated the process of time recording. Combining the traceability of the personnel’s location and timestamp enabled the IoT/BIM-platform to collect and visualize actual performance data (desktop screenshot in Figure 4). More tests in realistic construction settings are planned.
Figure 4: BLE-beacon positions in BIM (left) and real-time presence of workers (right)
5 CONCLUSION Methods including Lean Construction Management (LCM) and BIM alongside with progress detection and tracking technology have the potential to assist construction personal in some of their challenging work tasks: (a) planning with reliable high fidelity actual information, and (b) detecting and tracking progress based on the presence of trades or on activity completion. A needs statement led to the proposed concept that integrates the three categories of constraints (directives, prerequisite work, and resources). Although preliminary experiments utilizing an IoT-platform show early, but promising results, more extensive testing in field realistic work environments is required to validate the selected approach.
6 REFERENCES
Ballard, G. and Howell, G. (1994). Implementing Lean Construction: Stabilizing Work Flow. Proc. 2nd Ann. Conf. of the Int’l. Group for Lean Construction, Pontificia Universidad Catolica de Chile, Santiago, 101-110.
Ballard, G. and Howell, G. (2003). Lean project management. Building Research & Information, 31:2, 119-133.
Berner, F., Kochendörfer, B. and Schach, R. (2015), Grundlagen der Baubetriebslehre 3 – Baubetriebsprüfung, 2. Edition, Springer Vieweg, Wiesbaden, Germany.
Bosché, F, Guillemet, A., Turkan, Y., Haas, C.T., Haas, R. (2013). Tracking the built status of MEP works: Assessing the value of a Scan-vs-BIM system, Journal of Computing in Cvil Engineering, 05014004.
Cheng, T., Yang, J., Teizer, J, and Vela, P.A. (2010). Automated Construction Resource Location Tracking to Support the Analysis of Lean Principles, Proc. 18th Ann. Conf. of the Int’l. Group for Lean Construction, Haifa, Israel, 643-653.
Cheng, T., Teizer, J., Migliaccio, G.C., Gatti, U.C. (2013). Automated Task-level Activity Analysis through Fusion of Real Time Location Sensors and Worker's Thoracic Posture Data, Automation in Construction, 29, 24-39.
Dave, B., Seppänen, O., and Modrich, R (2016). Modeling Information Flows Between Last Planner and Location Based Management System. Proc. 24th Ann. Conf. of the Int’l. Group for Lean Construction, Boston, MA, USA, Section 6, 63–72.
133 | Proceedings IGLC | July 2017 | Heraklion, Greece

Lean Production Controlling and Progress Tracking Using Digital Methods
Drew, J., McCallum, B., and Roggenhofer, S. (2004). Journey to Lean: Making Operational Change Stick, Palgrave Macmillan, New York.
Emdanat, S., Meeli, L., and Christian D. (2016). A Framework for Integrating Takt Planning, Last Planner System and Labor Tracking. Proc. 24th Ann. Conf. of the Int’l. Group for Lean Construction, Boston, MA, USA, Section 2, 53–62.
Frandson, A., Berghede, K., and Tommelein, I. (2013). Takt-time planning for construction of exterior cladding. Proc. 21st Ann. Conf. of the Int’l. Group for Lean Construction, Fortaleza, Brazil.
Frandson, A., Berghede, K., and Tommelein, I. (2014). Takt-Time Planning and the Last Planner System. Proc. 22nd Ann. Conf. of the Int’l. Group for Lean Construction, Oslo, Norway, 571-580.
Haghsheno, S., Binninger, M., Dlouhy, J., and Sterlike, S. (2016). History and Theoretical Foundations of Takt Planning and Takt Control. Proc. 24th Ann. Conf. of the Int’l. Group for Lean Construction, Boston, MA, USA, Section 1, 53–62.
Han, K.K., Cline, D., Golparvar-Fard, M. (2015). Formalized knowledge of construction sequencing for visual monitoring of work-in-progress via incomplete point clouds and low-LoD 4D BIMs. Advanced Engineering Informatics, 29, 889–901.
Kenley, R. and Seppänen, O. (2010). Location-based Management for Construction. Planning, scheduling and control. Spon Press, London and New York.
Krafcik, J. (1988). Triumph of the Lean Production System. Sloan Mgmt. Review, 30:1 Koskela, L. (1992). Application of the new Production Philosophy to Construction, CIFE
Technical Report #72, Center for Integrated Facility Engineering, Stanford University. Koskela, L., Stratton, R., and Koskenvesa, A. (2010). Last Planner and Critical Chain in
Construction Management: Comparative Analysis. Proc. 18th Ann. Conf. of the Int’l. Group for Lean Construction, Haifa, Israel.
Navon, R. (2007). Research in Automated Measurement of Project Performance Indicators, Automation in Construction, 16:1, 176-188.
Pradhananga, N., Teizer, J. (2013). Automatic Spatio-Temporal Analysis of Construction Equipment Operations using GPS Data. Automation in Construction, 29, 107-122.
Sacks, R., Radosavljevic, M., and Barak, R. (2010). Requirements for building information modeling based lean production management systems for construction, Automation in Construction, 19(6), 641-655.
Song, J., Haas, C., Caldas, C., Ergen, E., and Akinci, B. (2006). Automating the Task of Tracking the Delivery and Receipt of Fabricated Pipe Spools in Industrial Projects. Automation in Construction, 15:2, 166-177.
Turkan, Y., Bosché, F., Haas, C.T., and Haas, R. (2013). Toward Automated Earned Value Tracking Using 3D Imaging Tools, J. Constr. Engr. Mgmt., 139:4, 423-433.
Womack, J.P., Jones, D., and Roos, D. (1990). The machine that changed the world. Rawson Associates, New York.
134 | Proceedings IGLC | July 2017 | Heraklion, Greece

LEAN THEORY TRACK
Track Chair:
Olli Seppannen
Aalto University
135 | Proceedings IGLC | July 2017 | Heraklion, Greece

136 | Proceedings IGLC | July 2017 | Heraklion, Greece

Baladrón C. and Alarcón L.F. (2017). “Assessing the Impact of Lean Methods in Mining Development Projects." In: LC3 2017 Volume II – Proceedings of the 25th Annual Conference of the International Group for Lean Construction (IGLC), Walsh, K., Sacks, R., Brilakis, I. (eds.), Heraklion, Greece, pp. 137–144. DOI: https://doi.org/10.24928/2017/0272
ASSESSING THE IMPACT OF LEAN METHODS IN MINING DEVELOPMENT PROJECTS
Cristóbal Baladrón1 and Luis F. Alarcón2
Abstract: One of the main challenges that developing countries face is the need to increase productivity. In Chile, the most important productivity gap in both mining and construction industries is the lack of operational efficiency, caused mainly by the low adoption of advance management methods. Hence, considering the need to increase productivity through operational efficiency, lean production emerges as a management system with the objective to create value while eliminating waste, and continuously seek operational excellence. This research evaluates the impacts of the implementation of lean methods in an underground mining development project in the execution phase, which will help to better understand to what extent these methodologies can affect the performance of this type of projects. This research indicates that the implementation of lean methods in an underground mining development project had a statistical significant improvement of the mean for all indicators studied. Likewise, the implementation produced a statistically significant reduction of the variability for some indicators; moreover, there is a considerable reduction in the coefficient of variation (CV), which indicates more stable processes. In addition, this research demonstrates that there is a statistically significant correlation between the percent of plan completed and its coefficient of variation.
Keywords: lean construction, lean mining, mining development project, percent of plan completed (PPC), variability.
1 INTRODUCTION
One of the main challenges that face developing countries is the need to increase productivity, since it is proven that productivity is the factor that better explains the difference of Gross Domestic Product per capita between countries. Out of all of the industries in Chile, mining has the highest relative productivity rate, reaching 68% of the productivity of Australian mining companies. Regarding construction in Chile, this productive sector has a relative productivity of 38% compared with the same industry in the United States (McKinsey and Company 2013).
Given this scenario, there are significant productivity gaps that need to be addressed in order to increase the country’s competitiveness. When identifying these gaps, operational efficiency is considered to have the most potential to improve in both the mining and construction industries: it could raise relative productivity in mining and construction by 27% and 32%, respectively. The main causes of low operational efficiency are low adoption of advance management methods, low level of standardization of
1 MSc Student, Department of Construction Engineering and Management, Pontificia Universidad
Católica de Chile, Av. Vicuña Mackenna 4860, Edificio San Agustín 3er Piso, Macul, Santiago, Chile, Phone +56 2 2354 4244, [email protected]
2 Professor, Department of Construction Engineering and Management, Pontificia Universidad Católica de Chile, Av. Vicuña Mackenna 4860, Edificio San Agustín 3er Piso, Macul, Santiago, Chile, Phone +56 2 2354 4244, [email protected]
137 | Proceedings IGLC | July 2017 | Heraklion, Greece

Assessing the Impact of Lean Methods in Mining Development Projects
planning processes, fragmentation of the phases of the projects, lack of training for workers and sub-optimal organization of work (McKinsey and Company 2013).
2 BACKGROUND
Considering the need to increase productivity through operational efficiency, different operational management methods that could be relevant must be explored. In this search emerges lean production, which is the management system used in the Toyota Production System that changed the concept of production defined in the craft and mass production systems. This philosophy seeks to deliver to the costumer what is needed, in the amount needed and when it is needed, based on a just-in-time delivery method (Shah & Ward 2007; Womack & Jones 1996; Womack et al. 1990).
The principles that sustain lean philosophy are: (1) reducing variability and (2) increasing value adding activities (Womack & Jones 1996). This philosophy has been applied mainly in manufacturing and health (Ballard 2005; Ballard & Howell 1994; Ballard 2000; Koskela 1992), however, there are other industries that have adopted it slowly and belatedly, among which are the construction and mining industries (Ballard 2005; Castillo et al. 2015; De Valence 2005).
On the implementation of lean in mining, there is literature on the theoretical applicability of the lean principles (Yingling et al. 2000; Wijaya et al. 2009; Hattingh & Keys 2010) and implementations in mining operations and projects (Ade & Deshpande 2012; Castillo et al. 2015; Dunstan et al. 2006; Klippel et al. 2008b; Klippel et al. 2008a). However, there are few reported cases of implementation in mining development projects (Dunstan et al. 2006; Castillo et al. 2015). Nevertheless this type of projects is identified as the area that presents the greatest potential for lean implementation in the mining industry (Loow 2015).
In lean construction, one widely used tool is the Last Planner System (LPS), which is a planning and control system that emerges from the lean principles applied in a construction environment. This system is sustained by commitments, which are given by the workers about the work they do (Ballard & Howell 1994; Ballard 2000). The study of the application of the LPS in industrial mining projects has been limited (Leal 2010), although it is noticed to be very applicable (Castillo et al. 2015; Leal 2010). In lean construction, specifically in commercial and residential project, there has been found a strong correlation between the percent of plan completed (PPC) and its coefficient of variation (CV) (Alarcón et al. 2008), but this has not yet been proven true in mining development projects.
3 RESEARCH METHODOLOGY To develop this research, a case study methodology was used. This methodology was chosen because it allows the authors: (1) to study the singularities of a particular case (Arzaluz 2005; Yin 2003; Simons 2011); (2) to utilize different techniques simultaneously, such as documents, reports, interviews, surveys, among others (Arzaluz 2005; Goode & Hatt 2008; Yin 2003); and (3) to conduct quantitative, qualitative or mixed research (Yin 2003). Additionally, the objective of the research is to study a phenomenon in depth, considering the particularities of a single case (Arzaluz 2005; Simons 2011; Yin 2003) and the research focus is contemporary, rather than historical (Schell 1992; Yin 2003).
138 | Proceedings IGLC | July 2017 | Heraklion, Greece
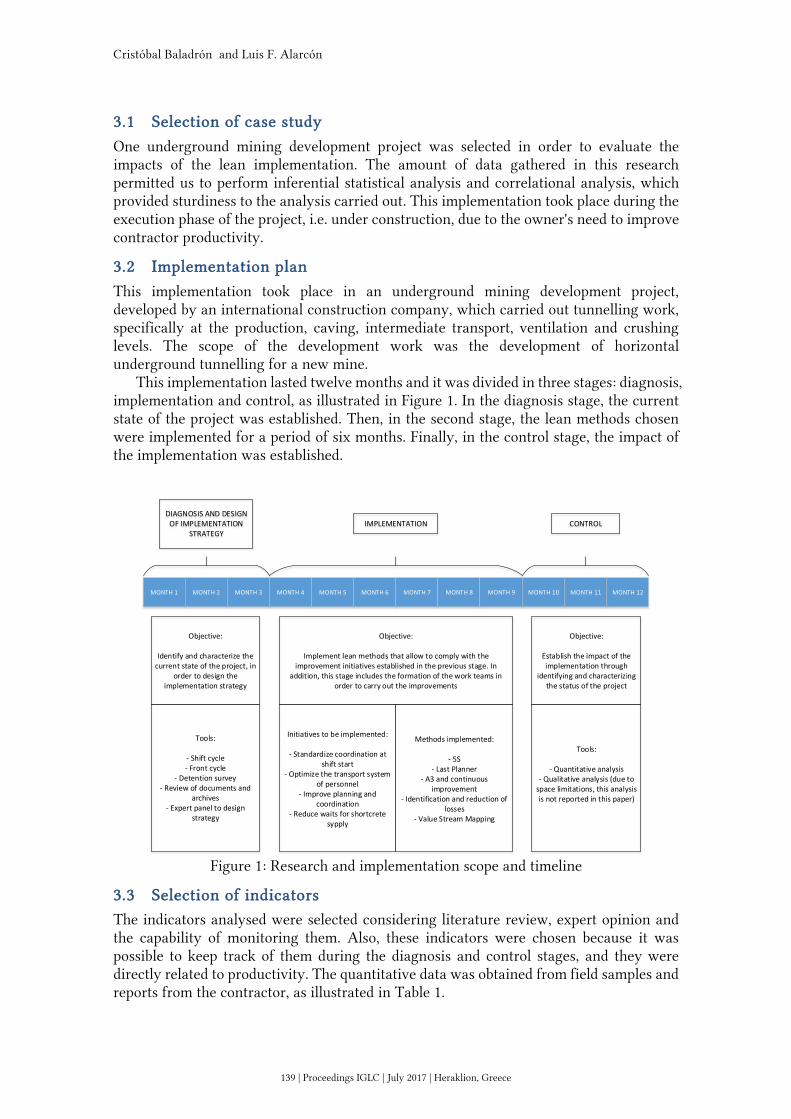
Cristóbal Baladrón and Luis F. Alarcón
3.1 Selection of case study
One underground mining development project was selected in order to evaluate the impacts of the lean implementation. The amount of data gathered in this research permitted us to perform inferential statistical analysis and correlational analysis, which provided sturdiness to the analysis carried out. This implementation took place during the execution phase of the project, i.e. under construction, due to the owner's need to improve contractor productivity.
3.2 Implementation plan
This implementation took place in an underground mining development project, developed by an international construction company, which carried out tunnelling work, specifically at the production, caving, intermediate transport, ventilation and crushing levels. The scope of the development work was the development of horizontal underground tunnelling for a new mine.
This implementation lasted twelve months and it was divided in three stages: diagnosis, implementation and control, as illustrated in Figure 1. In the diagnosis stage, the current state of the project was established. Then, in the second stage, the lean methods chosen were implemented for a period of six months. Finally, in the control stage, the impact of the implementation was established.
MONTH1 MONTH2 MONTH3 MONTH4 MONTH5 MONTH6 MONTH7 MONTH8 MONTH9 MONTH10 MONTH11 MONTH12
DIAGNOSISANDDESIGNOFIMPLEMENTATION
STRATEGYIMPLEMENTATION CONTROL
Tools:
-Shiftcycle-Frontcycle
-Detentionsurvey-Reviewofdocumentsand
archives-Expertpaneltodesign
strategy
Objective:
Identifyandcharacterizethecurrentstateoftheproject,in
ordertodesigntheimplementationstrategy
Initiativestobeimplemented:
-Standardizecoordinationatshiftstart
-Optimizethetransportsystemofpersonnel
-Improveplanningandcoordination
-Reducewaitsforshortcretesypply
Tools:
-Quantitativeanalysis-Qualitativeanalysis(duetospacelimitations,thisanalysisisnotreportedinthispaper)
Objective:
Establishtheimpactoftheimplementationthrough
identifyingandcharacterizingthestatusoftheproject
Objective:
Implementleanmethodsthatallowtocomplywiththeimprovementinitiativesestablishedinthepreviousstage.In
addition,thisstageincludestheformationoftheworkteamsinordertocarryouttheimprovements
Methodsimplemented:
-5S-LastPlanner
-A3andcontinuousimprovement
-Identificationandreductionoflosses
-ValueStreamMapping
Figure 1: Research and implementation scope and timeline
3.3 Selection of indicators
The indicators analysed were selected considering literature review, expert opinion and the capability of monitoring them. Also, these indicators were chosen because it was possible to keep track of them during the diagnosis and control stages, and they were directly related to productivity. The quantitative data was obtained from field samples and reports from the contractor, as illustrated in Table 1.
139 | Proceedings IGLC | July 2017 | Heraklion, Greece

Assessing the Impact of Lean Methods in Mining Development Projects
Table 1: Description of indicators
Theoretical proposition
Variable Definition Operational measurement
Source of evidence
1. Best results (mean
improvement)
2. More stable results (variability
reduction)
Workable time
Time of the day that the worker is in front
and that could potentially be used in
productive work
Time the worker is on the front,
considering a 12-hour day
On-field samples
Daily physical progress
Number of advanced linear meters daily
Number of advanced meters
per day
Contractor reports
Number of daily blasts
Number of daily blasts
Contractor reports
Program completion
Relationship between the executed and the
programmed
PPC
On-field samples
3. Strong relationship
between PPC and its CV
PPC Relationship between activities completed
and planned
PPC: Activities Completed /
Planned Activities
On-field samples
4 ANALYSIS OF RESULTS: QUANTITATIVE ANALYSIS Two methods of quantitative analysis were used: inferential statistics and correlation. In this investigation, inferential statistics is related to the hypothesis test (Pardo & San Martín 1998) and it was used two parametric tests: (1) test T for equality of means, which allows determining if two samples have equal mean, and (2) test of Levene of equality of variance, which allows determining if two samples have the same variance.
Statistical correlation is defined as the degree of association, similarity or joint variation between two or more variables of a population. In particular, in order to be able to quantify the degree of correlation between the variables, Pearson's correlation coefficient was used. The absolute value of the Pearson correlation coefficient indicates the strength of the correlation, while the sign indicates the direction of the correlation (Pardo & San Martín 1998).
5 IMPLEMENTATION RESULTS
5.1 Project performance
Table 2 illustrates a summary of the descriptive statistics in the diagnosis and control stages.
140 | Proceedings IGLC | July 2017 | Heraklion, Greece

Cristóbal Baladrón and Luis F. Alarcón
Table 2: Indicators in the diagnosis and after the implementation
Descriptive statistics
Workable time
Daily physical progress (meters)
Daily physical progress (blasts)
Program completion
Diagnosis Mean 5.75 hours 12.7 meters
4.8 blasts 60.9%
Standard deviation
1.43 hours 6.32 meters
1.84 blasts 4.9%
CV 25% 50% 38% 8.1%
Sample size 98 92 90 3
Implementation Mean 6.67 hours 20.5 meters
6.7 blasts 81.4%
Standard deviation
0.98 hours 5.49 meters
1.76 blasts 7.9%
CV 15% 27% 26% 9.7%
Sample size 41 88 88 3
Percent variation of mean (diagnosis
vs. implementation)
Mean +16% +61% +40% +34%
Standard deviation
-31% -13% -4% +61%
CV -40% -46% -32% +30%
Table 3 summarizes the inferential statistical tests performed, where "Yes" means that
there is a statistical significant difference of the value of the indicator when comparing the diagnosis and control, "No" means that there is not such statistical significant, and "N.A." means that it was not possible to perform the tests due to small sample sizes. Considering a level of significance of 0.05, there is an improvement of means for all the indicators and an improvement of variance in the indicator of workable time.
Table 3: Statistical results
Workable time Daily physical progress (meters)
Daily physical progress (blasts)
Program completion
Equality of means test Yes Yes Yes N.A.
Equality of variance test Yes No (0.172) No (0.909) N.A.
Moreover, the reduction in the CV shows that the indicators became more stable;
therefore, it can be infer that the processes became more stable. Figure 2 illustrates the histograms and boxplot for the indicators analysed. Due to the small sample size used in the analysis of the indicator "Program completion", histograms and box plot of this indicator are not displayed.
141 | Proceedings IGLC | July 2017 | Heraklion, Greece

Assessing the Impact of Lean Methods in Mining Development Projects
Indicator Histograms Box plot Workable time
N.A.
Daily physical progress (meters)
Daily physical progress (blasts)
Figure 2: Histograms and boxplot diagrams of indicators
5.2 Correlation between PPC and its coefficient of variation
The activities tracked correspond to all of those that conform the drill and blast cycle, i.e., surveying, drilling, charging explosives, blasting, loading, hauling, scaling and bolting. The PPC was calculated daily and then, an average weekly PPC was calculated. The evolution of the average of the weekly PPC and its CV is shown in Figure 3. For this analysis, 21 weeks of PPC measurements were considered.
Figure 3: Weekly tracking of PPC and its CV
0%
20%
40%
60%
80%
100%
1 2 3 4 5 6 7 8 9 10 11 12 13 14 15 16 17 18 19 20 21
WeeklytrackingofPPCandCVPPC
PPC CVPPC
142 | Proceedings IGLC | July 2017 | Heraklion, Greece
Cristóbal Baladrón and Luis F. Alarcón
From the correlation analysis performed it can be stated that there is a statistical significant relationship between these two variables, with a coefficient of determination (R²) of 0.4097. The Pearson coefficient is -0.629, with a significance level of 0.01. Considering a level of significance of 0.05, it can be stated that this relationship is statistically significant.
6 CONCLUSIONS
From the results of this research, we can indicate that the implementation of lean methods in underground mining development projects in execution positively impacts its performance. In particular, the results of this research indicate that the implementation of lean methodologies in this type of projects produces positive and statistically significant impacts with respect to the improvement of the mean. This stands for all the variables measured in this research and that were subjected to statistical analysis.
On the other hand, the results of this research indicate that the implementation of lean methods in this type of project produce a statistically significant reduction of the variability in project performance for certain indicators. Moreover, there was a considerable reduction in the CV, which indicates more stable processes. In addition, this research ratifies the results found in the literature: there is a statistically significant relationship between PPC and its CV.
Even though the results from this implementation were positive, there are some limitations. For instance, it was not guaranteed that the results were sustain in time after the implementation took place. As well, the use of a small sample size limits the results. For example, the correlation of the PPC and its CV might be robustly validated with greater sample data. Regarding future studies and researches, they might focus on extending and enhancing the analysis in this research. For example, the addition of other indicators, such as safety ones, might be considered.
7 ACKNOWLEDGMENTS The authors want to thank DICTUC of Pontificia Universidad Católica de Chile and CODELCO for providing the opportunity to carry out this research.
8 REFERENCES Ade, M. & Deshpande, V.S., 2012. Lean manufacturing and productivity improvement in
coal mining industry. International Journal of Engineering Research and Development, 2(10), pp.35–43.
Alarcón, L.F. et al., 2008. Assessing the impacts of implementing lean construction. Revista Ingenieria de Construccion, 23(January), pp.26–33.
Arzaluz, S., 2005. La utilización del estudio de caso en el análisis local. Revista Región y Sociedad, XVII(32), p.2005.
Ballard, G., 2005. Construction: One type of project production system. In Proceedings for the 13th Annual Conference of the International Group for Lean Construction, IGLC 13. SYdney, NSW, pp. 29–35.
Ballard, G., 2000. The last planner system of production control. Ph.D. dissertation, University of Birmingham, Birmingham, UK.
Ballard, G. & Howell, G., 1994. Implementing lean construction: Improving downstream performance. In Lean Construction. Rotterdam, Netherlands, pp. 111–125.
143 | Proceedings IGLC | July 2017 | Heraklion, Greece

Assessing the Impact of Lean Methods in Mining Development Projects
Castillo, G., Alarcón, L.F. & González, V., 2015. Implementing lean production in copper mining development projects: case study. Jorunal of Construction and Engineering Management, 141(1).
Dunstan, K., Lavin, B. & Sanford, R., 2006. The application of lean manufacturing in a mining environment. International Mine Management, October 16, pp.145–157.
Goode, W. & Hatt, P., 2008. Métodos de investigación social tercera ed., Mexico: Editorial F. Trilla.
Hattingh, T.S. & Keys, O.T., 2010. How applicable is industrial engineering in mining? In The 4th International Platinum Conference, Platinum in transition “Boom or Bust.” Sun City, South Africa: The Southern African Institute of Mining and Metallurgy, pp. 205–210.
Klippel, A., Petter, C. & Antunes, J., 2008a. Lean management implementation in mining industries. DYNA, 75(154), pp.81–89.
Klippel, A., Petter, C. & Antunes, J., 2008b. Management innovation, a way for mining companies to survive in a globalized world. Utilities Policy, 16(4), pp.332–333.
Koskela, L., 1992. Application of the new production philosophy to construction. Center for Integrated Facility Engineering. Department of Civil Engineering. Stanford University.
Leal, M., 2010. Impactos de la implementacion del sistema Last Planner en obras de montaje industrial en minería. Departamento de Ingeniería y Gestión de la Construcción. Pontificia Universidad Católica de Chile.
Loow, J., 2015. Lean production in mining: an overview. Department of Business Administration, Technology and Social Sciences. Lulea University of Technology.
McKinsey and Company, 2013. Productividad laboral en Chile ¿cómo estamos?, Santiago, Chile.
Pardo, A. & San Martín, R., 1998. Análisis de datos en psicología II (2° ed), Madrid: Pirámide.
Schell, C., 1992. Case study as a research method. ERS-RUPRI conference: Exploring Rural Entrepreneurship, 11(1), pp.370–388.
Shah, R. & Ward, P.T., 2007. Defining and developing measures of lean production. Journal of Operations Management, 25(4), pp.785–805.
Simons, H., 2011. El estudio de caso: Teoría y práctica. , p.2011. De Valence, G., 2005. Production theory and construction productivity. In Proceedings for
the 13th Annual Conference of the International Group for Lean Construction, IGLC 13. Sydney, NSW, Australia, pp. 135–141.
Wijaya, R., Kumar, R. & Kumar, U., 2009. Implementing Lean Principle into Mining Industry Issues and Challenges. , pp.1–9.
Womack, J. & Jones, D., 1996. Lean Thinking: Banish Waste and Create Wealth in Your Corporation, New York: Simon & Schuster.
Womack, J., Jones, D. & Roos, D., 1990. The Machine that Changed the World:, New York: Rawson Associates.
Yin, R.K., 2003. Case study research: Design and methods Thousand O., Sage Publications. Yingling, J.C., Detty, R.B. & Sottile, J., 2000. Lean manufacturing principles and their
applicability to the mining industry. Mineral Resources Engineering, 9(2), pp.215–238.
144 | Proceedings IGLC | July 2017 | Heraklion, Greece

Drevland F., Lohne J., and Klakegg O. J. (2017). “Ethical Dilemmas in Value Delivery: Theoretical Conditions” In: LC3 2017 Volume II – Proceedings of the 25th Annual Conference of the International Group for Lean Construction (IGLC), Walsh, K., Sacks, R., Brilakis, I. (eds.), Heraklion, Greece, pp. 145–152. DOI: https://doi.org/10.24928/2017/0276
ETHICAL DILEMMAS IN VALUE DELIVERY: THEORETICAL CONDITIONS
Frode Drevland1, Jardar Lohne2, and Ole Jonny Klakegg3
Abstract: Delivering value for the customer is one of the core tenets of lean construction. However, anyone who is affected by a project is considered a customer of the project. Often, different customers of a project will be at odds with each with regards to what constitutes value for them. This could potentially lead to ethical dilemmas for the project delivery team. This is a subject that has so far been given little attention in literature.
In this paper we set forth a theoretical framework for investigating ethical dilemmas in value delivery that will form the basis for future empirical research on ethical issues related to value delivery. More precisely we examine fundamental reasons for ethical dilemmas occurring in the context of value delivery. We theorize that ethical dilemmas in construction projects typically arises when there is misalignment of value between project stakeholders.
Keywords: Lean construction, ethics, value, value delivery.
1 INTRODUCTION One of the core prescripts of the lean philosophy is that we should focus on delivering value to our customers. On the surface this seems a relatively simple and straightforward concept. However, in reality it is actually infinitely complex. For one, value as a concept is ill-defined and ambiguous (Salvatierra-Garrido et al. 2012; Thyssen et al. 2010). This is, however, not the biggest challenge related to delivering customer value.
Although there exist no commonly agreed upon definition of value, it is generally agreed that value is subjective or particular (Drevland and Lohne 2015; Holbrook 1998; Salvatierra-Garrido and Pasquire 2011b), i.e. value is in the eye of the beholder. Herein lies the other challenge in delivering value for our customers. Not only is the term value fuzzy in-and-of-itself, within lean, the term customer refers not only to the paying client, but rather everyone downstream in the production chain and anybody who is affected by the built asset.
Given that value is particular and that we trying to serve widely different customer at the same time, we will inevitable find ourselves in the situation that the different customers have needs and desires that are at odds with each other. How do we prioritize one customer over another?
In the literature search leading up to this paper we found different who authors have offered different views on whose value we should be concerned with in construction projects. E.g. Bertelsen and Emmitt (2005) argues that we need to consider the client as a 1 Assistant Professor, Department of Civil and Environmental Engineering, NTNU - Norwegian
University of Science and Technology, Trondheim, Norway, [email protected] 2 Research Scientist, Department of Civil and Environmental Engineering, NTNU - Norwegian
University of Science and Technology, Trondheim, Norway, [email protected] 3 Professor, Department of Civil and Transport Environmental, NTNU - Norwegian University of Science
and Technology, Trondheim, Norway, [email protected]:[email protected]
145 | Proceedings IGLC | July 2017 | Heraklion, Greece

Ethical Dilemmas in Value Delivery: Theoretical Conditions
complex system, taking into the account the needs of all the different stakeholder in the client organization, Drevland and Svalestuen (2013) argue that only the value for the paying client is of consequence, while Salvatierra-Garrido et al. (2011a) argue that we must also consider the value for the wider society.
Although the literature does cover different views, we have not found any that contrasts these different views to one another, furthermore, none of the literature that we have seen contains any discussions of the ethical implications. E.g. is it ethical to prioritize the needs of the larger society above the needs of the paying client or vice versa?
In this paper we seek to start to shed a light on this, so far, neglected area of value. The purpose of this paper is to define ethical dilemmas in value delivery from a theoretical point of view. This is a preliminary work that will followed up by empirical studies at a later date to determine how people in the industry experience and handle ethical dilemmas of value delivery.
2 THEORETICAL FRAMEWORK
2.1 Ethical versus lawful
In the literature on ethical decision making in business, lawful and ethical decisions are often conflated. In his seminal work on ethical decision making by individuals in organizations, Jones (1991) define an ethical decision as “a decision that is both legal and morally acceptable to the larger community”. This is a definition that is somewhat at odds with the general ethics literature, where moral and ethical are generally considered synonymous terms. Though often concurrent with, ethics must be separated from the field of the law in order to be fully understood. What is perceived as unethical can – in certain circumstances – be lawful, whilst what is perceived as ethically laudable can be deemed unlawful. E.g. in the legend of Robin Hood, his stealing from the rich (unlawful) in order to give to the poor (ethically laudable) forms, is in fact, a clear example of this distinction.
2.2 Normative and descriptive ethics
We can separate ethics into normative and descriptive ethics. The first of these profess judgments concerning the manner of acting in the world. This is ethics as most have encountered it, the lessons propagated being from different traditions such as deontology (Kant 1828), consequentialism (Mill 2002 (1861) etc.), virtue ethics (typically in the tradition from (Aristotle 2009 (~350-322 BC)) or various contemporary approaches (Focault 1976 etc. Habermas 1992; Lévinas 2014; Sartre 1976). In fact, analyses of this sort seem – more or less consciously – to reveal how little that has been done of ethical analysis within the project management literature.
Descriptive ethics, on the other hand, typically analyses the judgments of behaviour in the world according to the vocabulary of ethics. Rather than developing a framework for judging the appropriateness of actions, such analyses typically investigate the reasons underlying such judgements in specific contexts.
While it is possible to investigate and discuss the ethics of value delivery using a normative approach, we would argue that in the context of construction projects and the construction industry this would result in pure theoretical exercise with little practical benefit. It is more interesting to see what industry practitioners themselves consider ethical and unethical and which issues they face.
Depending on which analytic level an analysis is situated, it is possible to distinguish individually oriented and social ethics (Ray et al. 1999). The first of these concerns the
146 | Proceedings IGLC | July 2017 | Heraklion, Greece

Frode Drevland, Jardar Lohne and Ole Jonny Klakegg
individual as moral actor, whilst the latter concerns the ethical qualities of social systems. The intention of this paper is not to carry out any sort of blame game on a personal level. What occupy us here are rather judgments of practitioners as representatives of a group, that is, as professionals within the AEC industry, analysing it as a social system. In Hood’ian terms, the question is not whether or not Robin judges his actions in a certain matter – neither, in fact, the manner by which the sheriff of Nottingham judges them – but rather how the social milieus these actors operate within judge them. It is more interesting to examine the differences between the perceptions of the simpletons who judge Robin and those of the elite that support the sheriff, than simply calling into attention the judgements of two single individuals.
2.3 Virtue-oriented descriptive ethics
One further distinction needs being made concerning the object of the analysis. As commented by Harris (2008), much of current practice within engineering ethics has 1) revolved around creating ethical codes for preventing unethical conduct by engineers, or 2) around the concern for preventing threats from technology to the health and safety of the public. Harris labels these approaches “preventive ethics”, having for salient factor a (negative) rule-based understanding of how to act as an engineer in the world. A consequence of this could be that the descriptive ethical analysis outlined focused on perceptions of such (negative) rule-based understandings of ethics.
As Emison (2006) points out, however, an “[u]navoidable complexity” is what faces engineers in their working life, creating “especially dynamic and unstable ethical conditions”. The logical consequence of such an insight is that, as Harris points out, not everything that is important in professional ethics can be expressed by rules in general. Rules cannot, Harris argues, adequately account for the place of discretion, judgment and background knowledge involved in professional judgement. Further, there is an internal and often idealistic component to professional practice that cannot adequately be accounted for by rules.
Within the field of ethics, virtue ethics is typically identified as the preponderant alternative to rule-based understandings of ethics. Virtue ethics differs from most other approaches by being more concerned with the character of the moral actor – that is, why the moral actor is doing what he/she is doing – than in outlining rules for conduct.
From a virtue-oriented descriptive ethics perspective, then, what is of interest to the analysis of professional actors is not the observation of their devotion to rules and regulations, but rather an analysis of their motivations for action when facing the complexity characteristic of their professional life. Questions concerning phenomena such as value delivery form archetypal examples of the challenges involved.
2.4 Definition of value
In the lean construction community there is a clear tendency to equate value with benefit, however, the most common definition of value is that is the relationship of what you Give and what you Get, or Costs and Benefits to use another terminology (Drevland and Lohne 2015). This is often shown expressed mathematically as Value=Benefit/Cost, however, it can also be expressed as Value=Benefit-Cost. Although mathematical expressions of value have been criticized (Rooke et al. 2010; Thyssen et al. 2010), we believe they can be beneficial if one is aware of their shortcomings. Specifically that value is not summative (Drevland and Lohne 2015). I.e. it is not possible to evaluate different costs and benefits separately and then sum them up, they have to be considered in one comprehensive value judgement.
147 | Proceedings IGLC | July 2017 | Heraklion, Greece

Ethical Dilemmas in Value Delivery: Theoretical Conditions
One of the reasons such a definition of value is useful, is that it opens up for the notion of negative value, i.e. the situation where someone gives more than they get. This concept is important when considering all the customers of a project. Some of these could possibly only be negatively affected, i.e. there is no Get or Benefit component for them.
A shift in value for some customer will typically occur from some decision being made. To be able to describe what happens in such as situation, we believe it beneficial to introduce the concepts of baseline value and marginal value. The former being the value of someone for the null or default alternative and the latter how much the value will be shifted if a decision is made.
𝑉",$ - Baseline value for some entity X given that the zero or default alternative is chosen.
∆𝑉" -Marginal shift in value for some entity Z after a decision is made.
Another couple of ancillary terms that we believe are needed when discussing values are true and perceived value. Value being particular entails that it cannot be objectively measured. This entails that value in reality dependent on perception. However, as given by Drevland and Lohne (2015), the concept of true value can be a beneficial theoretical concept. Perceived value being what someone perceives the value of something to be given the knowledge that they possess, whereas true value is what someone would perceive if they had perfect knowledge.
In addition to knowledge, someone’s perception of value will depend upon their values (Drevland and Lohne 2015). Value (singular) and values (plural) are two distinct theoretical concepts. Schwartz and Bilsky (1987) defines values as “ (a) concepts or beliefs (b) about desirable states or outcomes (c) that transcend specific situations, (d) guide selection or evaluation of behaviour and events and (e) are ordered by relative importance.” With regards to ethical dilemmas values are also important since they will influence what someone will consider an ethical dilemma and how to handle it.
2.5 Alignment of Value
Alignment of interest is term that is commonly used in the lean literature to describe how well the interests of different actors line up. However, the actors in question are typically limited to be those that have a formal role in the project, i.e. owner, designers and constructors (see e.g. Mesa et al. 2016). Therefore, we believe that this term is not completely suitable in the context of customer value. Furthermore alignment of interest is also tied to action (Colvin and Boswell 2007). I.e. how is the interest of differs actors to act. Value on the on the other does not necessarily have any connection to action. While it is true that some actors will take an active role in the project to maximise their value, this is not true for all stakeholder, or customers in the lean sense of the word, of the project. Some are just passive recipient of a positive or negative value of the project. We therefore choose to introduce the term value alignment and misalignment.
Value alignment - The situation where increasing the value for A will cause an increase in the Value for B and conversely decreasing the value for A will decrease the value for B. Value misalignment - The situation where Increasing the value for A will cause a decrease in the Value for B and conversely decreasing the value for A will increase the value for B.
148 | Proceedings IGLC | July 2017 | Heraklion, Greece

Frode Drevland, Jardar Lohne and Ole Jonny Klakegg
Table 1 Mathematical expressions for alignment and misalignment.
Value alignment 𝑉',$ + ∆𝑉' > 𝑉',$ → 𝑉+,$ + ∆𝑉+ > 𝑉+,$ or
𝑉',$ + ∆𝑉' < 𝑉',$ → 𝑉+,$ + ∆𝑉+ < 𝑉+,$
Value misalignment 𝑉',$ + ∆𝑉' > 𝑉',$ → 𝑉+,$ + ∆𝑉+ < 𝑉+,$ or
𝑉',$ + ∆𝑉' < 𝑉',$ → 𝑉+,$ + ∆𝑉+ > 𝑉+,$
The degree of value alignment can be varying. We therefore introduce the terms in Table 2 to describe the degree of alignment or misalignment.
Table 2 Actor B's degree of value alignment with A when changing the value for actor A
Negligible ∆𝑉+ ≈ 0
Weak |∆𝑉'| ≫ |∆𝑉+|
Proportional |∆𝑉'| ≈ |∆𝑉+|
Strong |∆𝑉'| ≪ |∆𝑉+|
3 ETHICAL DILEMMAS IN THE CONTEXT OF VALUE DELIVERY According to Perry (Perry 2014) an ethical or moral dilemma is a situation where "at least two mutually exclusive actions have a clear moral rational for them or there simply is no moral answer at al." Based on the theoretical framework that we have set forth, we hypothesize that ethical dilemmas, in construction projects, will arise for the project delivery organization and the people working in it whenever a non-negligible misalignment of value happens. In the following we will present different scenarios and some possible misalignments of value that could arise. Note that these are not based on formal research, but rather on the authors experience with the industry and impressions that we have gotten from practitioners over the years. We have included them to help the reader get a concrete grasp of the abstract framework that we have presented.
We have here chosen to focus on external customers of construction projects. While it is clear that there in todays practice also are ethical issues regarding value delivery to internal customers in project (see e.g. Lohne et.al, 2016, for issues arising in the design phase), we believe the move towards relational contracting forms like IPD and Alliancing will alleviate this issue. I.e. aligned of commercial goals entails alignment of value and thereby eliminating internal ethical conflicts.
3.1 The good of the few versus the good of the many
In many cases a project will have a negative impact for its immediate neighbours, yet be of great value for society at large. One example is critical infrastructure such as powerlines. Another issue of current interest is related to city densification that is happening in large cities around the world. In some cases, areas that have previously been purely composed
149 | Proceedings IGLC | July 2017 | Heraklion, Greece
Ethical Dilemmas in Value Delivery: Theoretical Conditions
of single homes only a couple of floors high are no seeing development of high-rise apartment buildings. This significantly the value for existing inhabitants in the area.
Although these issues will normally be politically decided on a municipal level, and not be something that the project delivery organization should be encumbered with, it could still weigh heavily on individuals in the organization if they see this as placing and undue burdens those directly affected by the project.
3.2 The good of the client versus the good of wider society
Another, more pertinent variant of the above, could be the good of the client versus the good of wider society. If the contract between the client and wider society, i.e. laws, regulations etc., does not ensure value alignment, ethical dilemmas could arise for the project delivery team. E.g., a client wanting a massive building that negatively affects a city environment, for example, by blocking sightlines or having a blocking effect on pedestrian traffic. The municipality might allow this to be built du to ignorance, i.e. not perceiving what the true effects on the city will be. On the other hand, the architect, being both knowledgeable on the issues from education as well as having been instilled the professional values of their profession, could likely perceive the true situation and experience it as problematic. I.e. should they be true to what their client wants or true to what is the best for the city and the values of their profession?
3.3 The good of the developer versus the good of the buyer
The former examples touch upon issues that might occur due to issues of value perception. An even clearer examples of the challenges of perception of value can be found in the context of housing development. In a housing project, increasing value for the developer will be a matter of reducing the cost of the project while maximizing the price each unit can be sold for. In many cases the cost of the project can be reduced without seemingly affecting the value for the customers buying the units, i.e. the perceived value stays the same. However, this could be due to the customers not being sufficiently knowledgeable to correctly asses the true value. E.g. a cost reduction for the developer could lead to a long increase in the maintenance cost that has to be borne by the buyer. In this case there is an alignment of perceived value, but a misalignment of true value.
The buyer, lacking sufficient domain knowledge to properly asses this, will perceive the value to be the same and therefore be willing to pay the same price. An architect or engineer on the other hand will have this knowledge and will able to accurately assess the buyers will be short changed on their value.
4 DISCUSSION AND CONCLUSION The previous scenarios describe situations where value misalignment can occur, and where we believe ethical dilemmas can arise for the project delivery team. However, as we have argued in the theoretical framework, we believe that a descriptive approach has to be taken in analysing ethical issues in construction projects. Therefore, while we hypothesize that such situations will give birth to ethical dilemmas, we cannot state for at fact that these scenarios will always lead to ethical dilemmas. It is not given that industry professionals will experience ethical issues if they find themselves in such situations. E.g. if someone’s values dictate that the paying client always comes first, then they might not experience any ethical dilemmas, even in the case where there is a strong misalignment of value between the paying client and the other customers of the project.
150 | Proceedings IGLC | July 2017 | Heraklion, Greece
Frode Drevland, Jardar Lohne and Ole Jonny Klakegg
Furthermore, it is not only interesting to understand what is considered ethical and unethical in the context of value delivery. If the goal is to address the issues in practical terms, we also need to know how often they occur and how people typically act when faced with these kinds of ethical dilemmas. When faced between a value misalignment between the client and other customer, an architect or engineer might, for example, choose to be blindly loyal to the client, or decide to go behind the clients back and optimize value for the different customers based on their own conception of what is the fairest situation overall.
If are to develop tools and methods for optimizing value delivery in projects we need to have a notion of how people are prone to act in this sense. E.g. a process that only considers the value for the paying client might be seen as inherently unethical by members of the project delivery team, and its use could be sabotaged. If so, it would probably be beneficial to bring in the value for other customers. This would make the process more transparent and less likely that team members will make value adjustments or rebalancing of their own accord. People will typically go along with decisions that they don't agree with a long as they have been able to voice their concerns (Lencioni 2002).
Much of this pure speculation, and we need more knowledge about practitioners' actual views on these issues. In this paper, we have presented a theoretical framework for analysing ethical dilemmas in construction projects. This lays the groundwork for a later empirical study of the phenomenon. Our aim for future research is to answer:
1. What value misalignments are experienced in practice and how frequently? 2. Do designers and constructors experience ethical dilemmas due to these
misalignments? 3. How are these situations handled by designers and constructors?
5 REFERENCES Aristotle. (2009). The Nicomachean Ethics. ARISTOTLE (2009). The Nicomachean Ethics. ,
Oxford, Oxford World’s Classics, Oxford. Bertelsen, S., and Emmitt, S. (2005). “The client as a complex system.” 13th Ann. Conf. of
the Int’l. Group for Lean Construction, 73–79. Colvin, A. J. S., and Boswell, W. R. (2007). “The problem of action and interest alignment:
Beyond job requirements and incentive compensation.” Human Resource Management Review, 17(1), 38–51.
Drevland, F., and Lohne, J. (2015). “Nine Tenets on the Nature of Value.” 23rd Annual Conference of the International Group for Lean Construction, Perth, Australia, 475–485.
Drevland, F., and Svalestuen, F. (2013). “Towards a framework for understanding and describing the product value delivered from construction projects.” 21th Ann. Conf. of the Int’l. Group for Lean Construction, Fortaleza, Brazil.
Emison, G. A. (2006). “The complex challenges of ethical choices by engineers in public service.” Science and Engineering Ethics, 12(2), 233–244.
Focault, M. (1976). Histoire de la sexualité: la volonté de savoir. Gallimard, Paris. Habermas, J. (1992). Moral Consciousness and Communicative Action. Polity Press,
Cambridge. Harris, C. E. (2008). “The Good Engineer: Giving Virtue its Due in Engineering Ethics.”
Science and Engineering Ethics, 14(2), 153.
151 | Proceedings IGLC | July 2017 | Heraklion, Greece
Ethical Dilemmas in Value Delivery: Theoretical Conditions
Holbrook, M. B. (1998). Consumer Value : A Framework for Analysis and Research. Routledge, London, GBR.
Jones, T. M. (1991). “Ethical Decision Making by Individuals in Organizations: An Issue-Contingent Model.” The Academy of Management Review, 16(2), 366–395.
Kant, I. (1828). Critik der reinen Vernuft. Leipzig. Lencioni, P. (2002). The Five Dysfunctions of a Team: A Leadership Fable. Jossey-Bass,
San Francisco. Lévinas, E. (2014). Le temps et l’autre. Collection Quadrige, PUF, Paris. Mesa, H. A., Molenaar, K. R., and Alarcón, L. F. (2016). “Exploring performance of the
integrated project delivery process on complex building projects.” International Journal of Project Management, 34(7), 1089–1101.
Mill, J. S. (2002). Utilitarianism. Hackett Publishing Company, Indianapolis/Cambridge. Perry, M. S. (2014). Moral Dilemmas, Identity, and Our Moral Condition: A Guide for the
Ethically Perplexed. Algora Publishing, New York. Ray, R. S., Hornibrook, J., Skitmore, M., and Zarkada-Fraser, A. (1999). “Ethics in
tendering. A survey of Australian opinion and practice.” Construction Management and Economics, (17), 139–153.
Rooke, J. A., Sapountzis, S., Koskela, L. J., Codinhoto, R., and Kagioglou, M. (2010). “Lean knowledge management: The problem of value.” 18th Ann. Conf. of the Int’l. Group for Lean Construction, Haifa, Israel, 12–21.
Salvatierra-Garrido, J., and Pasquire, C. (2011a). “The first and last value model: Sustainability as a first value delivery of lean construction practice.” 19th Annual Conference of the International Group for Lean Construction 2011, IGLC 2011, 1–10.
Salvatierra-Garrido, J., and Pasquire, C. (2011b). “Value theory in lean construction.” Journal of Financial Management of Property and Construction, 16(1), 8–18.
Salvatierra-Garrido, J., Pasquire, C., and Miron, L. (2012). “Exploring value concept through the iglc community: Nineteen years of experience.” 20th Ann. Conf. of the Int’l. Group for Lean Construction, San Diego, CA, USA.
Sartre, J.-P. (1976). L’être et le néant - Essai d’ontologie phénoménologique. Gallimard, Paris.
Schwartz, S. H., and Bilsky, W. (1987). “Toward a universal psychological structure of human values.” Journal of Personality and Social Psychology, 53(3), 550–562.
Thyssen, M. H., Emmitt, S., Bonke, S., and Kirk-Christoffersen, A. (2010). “Facilitating Client Value Creation in the Conceptual Design Phase of Construction Projects: A Workshop Approach.” Architectural Engineering and Design Management, 6(1), 18–30.
152 | Proceedings IGLC | July 2017 | Heraklion, Greece

Hatzigeorgiou A. and Manoliadis O. (2017). “Assessment of Performance Measurement Frameworks Supporting the Implementation of Lean Construction” In: LC3 2017 Volume II – Proceedings of the 25th Annual Conference of the International Group for Lean Construction (IGLC), Walsh, K., Sacks, R., Brilakis, I. (eds.), Heraklion, Greece, pp. 153–160. DOI: https://doi.org/10.24928/2017/0073
ASSESSMENT OF PERFORMANCE MEASUREMENT FRAMEWORKS SUPPORTING THE
IMPLEMENTATION OF LEAN CONSTRUCTION
Hatzigeorgiou Alexandros1 and Manoliadis Odysseas2
Abstract: Construction companies can perceive significant benefits of Lean Construction management, although cannot clearly identify the extent and origin of the obtained benefits. Frameworks, consisting structured tools suitable for business management, find wide application in the field of Performance Measurement, in most of the industries. The role of contemporary, process-oriented, Performance Measurement frameworks, like the European Foundation for Quality Management Excellence Model, the Balanced Scorecard and Key Performance Indicators, in supporting Lean Construction is examined in this study. The contribution of Performance Measurement Systems developed upon such frameworks, in the implementation of basic Lean Construction principles, like waste/variability reduction, operation simplification and benchmarking, is demonstrated by reviewing a number of related studies from the literature and identifying their basic characteristics regarding the adopted Performance Measurement frameworks and the involved Lean Construction principles. The presented studies indicate that the use of these frameworks, and especially Key Performance Indicators, can assist the application of specific Lean Construction principles, and most of all benchmarking.
Keywords: lean construction principles, performance measurement frameworks.
1 INTRODUCTION
Performance Measurement (PM) is an integral part of management, assisting organizations to establish challenging and feasible goals and objectives and to connect them with improvements. PM is a well explored subject in literature and has gained significant attention during the 1990s among academics and professionals in most of the economy's sectors, followed by a plethora of published articles, described by Neely (1999) as "revolution". It had a profound impact on the construction industry too, where more and more construction engineering organizations started adopting Performance Measurement Systems (PMSs), over the past two decades (Bassioni et al. 2004).
Traditional PMSs, depending solely on financial measures, has been strongly criticized as strictly results-oriented and backward focused (Lantelme and Formoso 2000), since they are based on lagging indicators describing the outcomes of managerial actions or decisions only after they occur. This widespread dissatisfaction, climaxing in the late 1970s and early 1980s, has driven the construction industry to shift to modern methods of PM, with the use of process-oriented, leading measures, aiming to give early warnings and identify barriers and potential problems in the implementation of strategy and the attainment of goals and objectives (Costa et al. 2006).
1Civil Engineer A.U.Th., M.B.A. U.O.M., MSc "Engineering Project Management", School of Science and Technology, Hellenic Open University, Patra, Greece, [email protected] 2 Associate Professor, Department of Civil Engineering, Democritus University of Thrace, Xanthi, Greece, [email protected]
153 | Proceedings IGLC | July 2017 | Heraklion, Greece

Assessment of Performance Measurement Frameworks Supporting the Implementation of Lean Construction
Lean Production (LP) emerged in the middle 1980s as a breakthrough production philosophy, aiming at the designing of a production system to deliver a custom product instantly on order, with the less possible intermediate inventories (Howell 1999). The seminal technical report of Koskela (1992), introducing the Transformation-Flow-Value generation model, was the first consideration of the application of concepts of LP in construction, giving birth to the term Lean Construction (LC). Koskela summarized a number of heuristic principles for the improvement of flow processes in production. On the top of the list, described as the core principle of LP, is the reduction of non value-adding activities from the production process, called waste, and the efficiency increase of value-adding ones. Reviewing the construction production as a combination of conversion and flow processes, waste reduction consists probably the central idea of LC. An associated principle with waste removal is variability reduction, expressed as unreliable workflow between processes, which can decrease the amount of non value-adding activities and increase customer satisfaction. In LC the issue of variability is usually addressed in terms of construction labour productivity (Thomas et al. 2002). Operations simplification is another critical LP principle, accomplished by minimizing the number of steps or parts involved in the production process, which can find application in construction too. Finally, the well-known benchmarking, a systematic process of comparing and measuring the organization's performance against other similar ones in key business activities can be considered as a general principal related both to LP and LC issues. In construction, benchmarking can be implemented with the use of indices of construction labour productivity (Manoliadis 2011).
The present paper is aiming to stress the contribution of the use of contemporary PMSs in construction in the successful implementation of business strategies like LC, by assisting the employment of the above principles. In doing so, the paper is first reviewing the most widely implemented PM frameworks applied in construction and is then presenting and commending on a number of characteristic studies of PMSs, developed for construction firms and projects, which support the use of such principles.
2 CONTEMPORARY PERFORMANCE MEASUREMENT FRAMEWORKS
APPLIED IN CONSTRUCTION After the gradual abundance of traditional PMSs since the 1980s, a number of models and frameworks have been evolved and developed for PM, trying to bridge the gap between financial and non-financial measures. Nevertheless, not all of them experienced wide implementation within the construction industry. According to a number of researchers (Bassioni et al. 2004; Yang et al. 2010), the most frequently used PM frameworks in construction are the European Foundation for Quality Management (EFQM) Excellence Model, the Balanced Scorecard (BSC) and the Key Performance Indicators (KPIs), presented briefly in the next sections.
2.1 The European Foundation for Quality Management (EFQM) Excellence Model
One of the most utilized quality-based management models is the EFQM Excellence Model, a non-prescriptive framework developed in 1989 in Europe by the EFQM, a membership based, non-profit organization. It has emerged as a major tool in the development of continuous business improvement, aiming to improve performance and to enable the assessment of excellence, by measuring and upgrading the overall quality of an
154 | Proceedings IGLC | July 2017 | Heraklion, Greece

Hatzigeorgiou Alexandros and Manoliadis Odysseas
organization, based on eight fundamental concepts of excellence (EFQM 1999): Results Orientation, People Development & Involvement, Customer Focus, Continuous Learning Innovation & Improvement, Leadership & Constancy of Purpose, Partnership Development, Management by Process & Facts and Public Responsibility.
The EFQM Excellence Model consists of nine criteria, intrinsically linked, requiring measurement of results, that can be used to identify dimensions of PM: i) five enabler’s criteria, dealing with how the various activities are undertaken and representing the management of the organization and ii) four sets of results criteria, focusing on what results an organization have achieved. The model starts on the left-hand side with Leadership, essential for any action or decision of an organization, which decides upon the organization's Policy & Strategies, utilizing the capabilities of its People and deploying its Partnerships & Resources. Next, the organization's Processes which will deliver the desired Customer Results are defined, affecting also the employees of the organization (People Results) and the society in general (Society Results). These results will in turn determine the organization's Key Performance Results. The model is further devised to be used as a self-assessment tool (Beatham et al. 2004). Despite its original mission as a business quality and excellence model, the EFQM Excellence Model has been used ever since as a PM framework (Bassioni et al. 2004) and, although developed generically, has been adopted by many construction companies in the last decade.
2.2 The Balanced Scorecard (BSC)
Kaplan and Norton (1992) introduced the BSC as a new PMS, characterizing it as a comprehensive framework that can translate a company’s vision and strategy into a coherent and linked series of measures and sub–measures. BSC allows an organization to measure and evaluate its performance through four distinct perspectives: i) Financial Perspective, monitoring the organization’s financial performance, with the use of typical financial and accounting ratios, such as Current Ratio, Net Profit, ROI, ROA, etc. ii) Customer Perspective, looking at the organization through the eyes of its customers, involving specific measures that reflect factors critical to customers such as delivery time, quality, service, and cost. iii) Internal Process Perspective, reporting on the efficiency of internal processes and procedures such as cycle time, inventory management, productivity control and logistics. iv) Learning and Growth Perspective, reflecting the commitment of the organization to grow and adapt to change by measuring its ability to innovate, improve and learn. A proper BSC should consist of both core outcome measures (lagging indicators) as objectives and performance drivers (leading indicators) as sub–measures of these outcomes (Kaplan and Norton 1996).
Although BSC was initially introduced to serve as the basis of a typical PMS, it was further promoted as a strategic management system (Kaplan and Norton 1996) with an important underlying principle, organized on a cause-and-effect relationship base between the four perspectives. Innovation and learning will be used for the development of new technologies and processes that can be implemented to decrease costs and increase efficiencies in the internal business perspective, providing higher value and satisfaction to the customer, which will in turn produce improved financial results. Yang et al. (2010) considered BSC as the most frequently used PM framework, in the organizational level, in construction industry.
2.3 Key Performance Indicators (KPIs)
During the 1990s two landmark reports, the first by Sir Michael Latham (1994) and the second by Sir John Egan (1998), were published, setting specific targets for performance
155 | Proceedings IGLC | July 2017 | Heraklion, Greece

Assessment of Performance Measurement Frameworks Supporting the Implementation of Lean Construction
level improvement in the construction industry. In response to these two reports, the Construction Best Practice Program (CBPP), a government funded organization, was established in the U.K., identifying Key Performance Indicators (KPIs) as the measures of the performance of the process critical to its success and launching the KPI Programme in 1998. CBPP developed in 2000 a first set of 10 headline KPIs, serving as a measure of the overall state of health of a company, roughly classified into three categories: economic, respect for people and environment, and divided into project and company level. These headline KPIs were further distinguished as operational and diagnostic KPIs. CBPP was soon acknowledged as the leading organization in the production of KPIs for the construction industry and its merging with the "Rethinking Construction" movement created in 2004 the Constructing Excellence (CE) Programme of the U.K (CE 2006).
In the case of the U.S, the importance of performance assessment in increasing competitiveness and growth was acknowledged in the early 1990s. The Benchmarking & Metrics Programme (B&MP) of the Construction Industry Institute (CII) is another widely known construction PM initiative, aiming to provide the construction industry with a common set of metric definitions and performance norms and to illuminate and quantify the use and value of best practices (Costa et al. 2006). B&MP reported a first performance data collection in 1996 and its current review includes a set of indicators classified in the categories of budgeted/actual costs, planned/actual schedule, facility capacity, project outcomes, accident data and project impact factors. Its goal is to set performance standards in the construction industry using a consistent PM algorithm and to develop assessment tools in order to promote construction performance (CII 2001).
KPI models have been widely applied in the construction industry, aiming to eliminate inefficiency and maximize cost effectiveness and productivity (Cha and Kim 2011), yet significantly criticised as lagging measures, inappropriate for decision making, performance improvement and change opportunities (Bassioni et al., 2004).
3 CONTRIBUTION AND APPLICATIONS OF PERFORMANCE
MEASUREMENT FRAMEWORKS IN LEAN CONSTRUCTION Lantelme and Formoso (2000) pointed out the important role PM plays in process control and LP systems in general, providing process transparency and assisting the conversion of usually invisible attributes to visible. Consequently, the use of appropriate and well-designed PMSs, for supporting the successful implementation of LC, has been emphasised by many researchers. According to Alarcón et al. (2001), traditional control systems focus their attention in conversion activities ignoring flow ones, therefore most of the non-value-adding activities become invisible. Sarhan and Fox (2013) argued that one of the critical factors for the poor application of lean principles in construction is the failure to use appropriate process oriented PMSs.
Despite the huge number of published articles in the field of PM in construction, few of them can be accounted for explicitly supporting the application of the four basic LC principles, discussed earlier. Some of the most significant and cited studies, published in major construction management journals, are briefly presented in the next section.
3.1 Related studies
Cox et al. (2003) acknowledged the necessity of identifying common indicators for construction executives and managers in measuring projects' performance and investigated management perceptions of quantitative and qualitative KPIs utilized in the
156 | Proceedings IGLC | July 2017 | Heraklion, Greece

Hatzigeorgiou Alexandros and Manoliadis Odysseas
construction industry. They generated an initial set of perceived KPIs, through literature research, and conducted a survey in order to administer them to the construction industry. Performing statistical analysis of the collected responses and trying to identify common KPIs by construction sector and management or experience level, they argued that the reported KPIs differ according to management's perspectives but identified six top rated indicators, including: quality control, on-time completion, cost, safety, cost/unit and units/man-hours, reported as the most useful by every construction sector.
Beatham et al. (2004) reviewed and appraised different kinds of construction KPIs, criticizing most of them as mainly lagging and post event indicators. Using the EFQM Excellence Model criteria as a framework, they distinguished between three different types of indicators: i) KPIs, indicative of associated future performance, ii) Key Performance Outcomes (KPOs), as measures of completed actions and events and iii) Perception Measures, as individuals' judgements of leading or lagging measures, arguing that the developed CBPP headline KPIs basically represent KPOs. Dividing the five enabling Excellence Model criteria into two groups, they placed Processes in the first and the other four in the second, applying KPOs of Key Business Processes and sub-processes in the first and KPIs/ Perception Measures on the second. They proposed KPIs incorporated into a two-cycle PMS, the first involving measures implementation and the second initiating Change Action driven by Results, both of them based on the RADAR (Results, Approach, Deployment, Assessment and Review) logic of the EFQM.
Chan and Chan (2004) developed a framework for measuring success of construction projects, developing a set of KPIs, measured both objectively and subjectively, through a comprehensive literature review. Nine KPI categories in total were selected and divided into two groups, representing the objective and subjective measures respectively: the first one included the categories of Time, Cost, Value & Profit, Health & Safety and Environmental Performance and the second one the categories of Quality, Functionality, User expectation/satisfaction and Participants’ satisfaction. In every category, they proposed a few, common used, representative KPIs.
Yu et al. (2007) established a PMS implementation model for construction companies, following a BSC approach and designing a set of benchmarking measures, serving as KPIs. Their model included a PM framework, consisting of the four BSC perspectives, performance criteria and representative KPIs. They first identified 12 performance criteria, three for each BSC perspective, and formulated a candidate list of 45 initial indicators through literature review. Conducting a questionnaire survey in listed Korean construction companies and interviews with performance management experts, they cut down the initial list of indicators to 16 final KPIs.
Yeung et al. (2007), arguing that KPIs can serve as a benchmark for PM in construction partnering projects, developed a performance evaluation model of partnering projects in Hong Kong. Utilizing a previously developed KPIs' conceptual framework, they applied the Delphi survey technique, with a large number of construction experts, to rank and address weighs to the initial list, resulting in seven top-weighted KPIs. In addition, a composite Partnering Performance Index was derived to provide an integrated assessment of partnering performance. In a consequent study, Yeung et al. (2009), following a similar approach, formulated a model to evaluate the success of relationship-based construction projects in Australia, selecting this time eight KPIs, and calculated an equivalent Performance Index to assess their performance. In both studies, the developed indices were composed of a set of lagging KPIs.
Cha and Kim (2011) developed a framework for an effective PMS for building construction projects in South Korea, focusing on the project PM in the construction stage,
157 | Proceedings IGLC | July 2017 | Heraklion, Greece

Assessment of Performance Measurement Frameworks Supporting the Implementation of Lean Construction
from the perspective of the construction company. Deploying related literature analysis and implementing PMSs' cases, they identified eight candidate performance areas, which corresponded to the project objectives, and formed an initial list of 27 indicators. Throughout a preliminary review 6 categories and 20 indicators were screened out as potential KPIs and after an in-depth survey, examining their measurability and representativeness, they resulted to a final set of 18 KPIs.
Yeung et al. (2013) attempted to incorporate both leading and lagging KPIs, applying the Reliability Interval Method (RIM), to formulate a benchmarking model in order to assess project performance, at different stages of the project Life Cycle in Hong Kong. A list of KPIs was compiled, based on a comprehensive literature review, which was used to develop a survey questionnaire and the RIM was subsequently applied to analyse the survey results and determine the relative importance and rankings of the various leading and lagging KPIs. From the results, the top 10 KPIs were selected for the success evaluation of Hong Kong construction projects and a Composite Performance Index was derived to provide a comprehensive assessment.
3.2 Summary characteristics of presented studies
Cox et al. (2003), Chan & Chan (2004), Yu et al. (2007) and Cha & Kim (2011) identified, theoretically or empirically, indicators which can be applied for utilizing waste reduction. The proposed measures in the studies of Chan & Chan and Yu et al. incorporated KPIs dealing with operations variability, while Chan & Chan, Cha & Kim and Yeung et al. (2013), adopting a pure KPIs framework, included a number of leading indicators examining functionality, equivalent to simplification of operations. Finally, all the presented PMSs contained a number of indices, grouped in various dimensions or categories, which can serve as benchmarking measures.
Table 1 summarizes the basic characteristics of the presented PMSs, reporting the corresponding LC principles to which each study has the most profound contribution.
Table 1: PMSs characteristics and LC principles contribution
Author(s) (Year) Approach followed PM framework adopted
LC principle contribution
Cox et al. (2003) Empirical KPI WR/BN
Beatham et al. (2004) Conceptual/Empirical EFQM/KPI BN
Chan & Chan (2004) Conceptual KPI WR/VR/OS/BN
Yu et al. (2007) Conceptual/Empirical BSC/KPI WR/VR/BN
Yeung et al. (2007/2009) Empirical KPI BN
Cha & Kim (2011) Empirical KPI WR/OS/BN
Yeung et al. (2013) Empirical KPI OS/BN WR: Waste Reduction, VR: Variability Reduction, OS: Operations Simplification, BN: Benchmarking
Table 1 reveals that a common PM framework adopted in all the presented studies is KPIs, suggesting clearly that the use of indices in a PM framework is essential for the effective application of LC principles. In addition, from the four presented LC principles, the only one addressed in every study is benchmarking, indicating that PMSs developed for construction, support LC implementation basically through benchmarking. The next,
158 | Proceedings IGLC | July 2017 | Heraklion, Greece

Hatzigeorgiou Alexandros and Manoliadis Odysseas
most commonly, supported LC principle by the presented PMSs is waste reduction, appearing in four out of the seven reviewed studies.
4 CONCLUSIONS
The general trend of the PMSs in construction, reported in the literature during the last two decades, indicate that they can prove very useful in the implementation of LC. Such frameworks act as an indirect measurement of indicators and can provide valuable information, derived as a by-product of PMSs, which can be utilized to specific aspects of LC management. In this paper, a number of published studies were reviewed to substantiate the suggestion that the selection of appropriate PM measures has a major influence on the implementation of LC strategies. The use of PMSs based on contemporary PM frameworks, like the EFQM Excellence Model, the BSC and the KPIs, can assist the application of basic LC principles, such as such as waste and variability reduction, operations simplification and especially benchmarking. More specifically, the KPIs framework, used individually or in combination with the other two, is indispensable in the development of PMSs for these principles.
The increasing interest from the construction industry in PM models and frameworks provides a sound foundation for their use in conjunction with lean practices. Findings of this paper are based on wide implemented PM frameworks and a relative small number of published studies. As a future work, a more extensive literature review could be conducted, in order to include other PM frameworks and a larger sample of related studies.
5 REFERENCES Alarcon, L.F., Grillo, A., Freire, J., and Diethelm, S. (2001). Learning From Collaborative
Benchmarking in the Construction Industry. In: Proc. 9th Ann. Conf. of the Int’l. Group for Lean Construction, 6-8 August, Singapore, Singapore.
Bassioni, H.A., Price, A.D.F., and Hassan, T. M. (2004). Performance measurement in construction. ASCE J. of Manage.in Eng., 20(2), pp. 42-50.
Beatham, S., Anumba, C., Thorpe, T., and Hedges, I. (2004). KPIs: a critical appraisal of their use in construction. Benchmarking: An Int'l. J., 11(1), pp. 93-117.
Cha, H.S., and Kim, C.K. (2011). Quantitative Approach for Project Performance Measurement on Building Construction in South Korea. KSCE J. of Civil Eng., 15(8), pp. 1319-1328.
Chan, A.P.C., and Chan, A.P.L. (2004). Key performance indicators for measuring construction success. Benchmarking: An Int'l. J., 11(2), pp. 203-221.
Constructing Excellence (2006). Industry performance report 2006, CE, London, U.K. Construction Industry Institute (2001). CII Benchmarking & Metrics Data Report 2001, CII,
Austin, Texas. Costa, D.B., Formoso, C.T., Kagioglou, M., Alarcón, L.F. and Caldas, C.H. (2006).
Benchmarking initiatives in the construction industry: Lessons learned and improvement opportunities. ASCE J. of Manage. in Eng., 22(4), pp. 158-167.
Cox, R.F., Issa, R.R.A., and Ahrens, D. (2003). Management’s perception of key performance indicators for construction. ASCE J. Constr. Eng. Manage., 129(2), pp. 142-151.
European Foundation for Quality Management (1999). The EFQM Excellence Model (Blue Book). EFQM, Brussels, Belgium. British Quality Foundation, London, UK.
Egan, Sir, J. (1998). Rethinking Construction. Construction Task Force, Norwich, UK.
159 | Proceedings IGLC | July 2017 | Heraklion, Greece

Assessment of Performance Measurement Frameworks Supporting the Implementation of Lean Construction
Howell, G.A. (1999). What Is Lean Construction - 1999. In: Proc. 7th Ann. Conf. of the Int’l. Group for Lean Construction, 26-28 July, Berkeley, USA, pp. 1-10.
Kaplan, R.S.,and Norton, D.P. (1992). The Balanced Scorecard – Measures that Drive Performance. Harvard Business Review, 70(1), pp. 71-79.
Kaplan, R.S.,and Norton, D.P. (1996). Using the Balanced Scorecard as a Strategic Management System. Harvard Business Review, 74(1), pp. 75-85.
Koskela, L. (1992). Application of the New Production Philosophy to Construction. Technical Report #72, Center for Integrated Facility Engineering, Department of Civil Engineering, Stanford University.
Lantelme, E., and Formoso, C.T. (2000). Improving Performance Though Measurement: The Application of Lean Production & Organisational Learning Principles. In: Proc. 8th Ann. Conf. of the Int’l. Group for Lean Construction, 17-18 July, Brighton, UK.
Latham, Sir, M. (1994). Constructing The Team. Joint Review of Procurement & Contractual Arrangements in the U.K. Construction Industry, London, UK: HMSO.
Manoliadis, O. (2011). Labour Productivity Benchmarking In Greek Projects. Organ., Tech. and Manage. in Constr. - An Int'l. J. 3(1), pp. 221-226.
Neely, A. (1999). The performance revolution: Why now and what next?. Int'l. J. of Operat. and Product. Manage., 19(2), pp. 205-228.
Sarhan, S, and Fox, A. (2013). Performance measurement in the UK construction industry and its role in supporting the application of lean construction concepts. Australasian J. of Constr. Econ. and Build., 13(1), pp. 23-35.
Thomas, H.R., Horman, M.J., de Souza, U.E.L., and Azvrski, I. (2002). Reducing variability to improve performance as a lean construction principle. ASCE J. of Constr. Eng. and Manage., 128(2), pp. 144-154.
Yang, H., Yeung, J.F.Y., Chan, A.P.C., Chiang, Y.H., and Chan, D.W.M. (2010). A critical review of performance measurement in construction. J. of Facil. Manage., 8(4), pp. 269-284.
Yeung, J.F.Y., Chan, A.P.C., and Chan, D.W.M. (2009). Developing a performance index for relationship-based construction projects in Australia: Delphi study. ASCE J. of Manage. in Eng., 25(2), pp. 59-68.
Yeung, J.F.Y., Chan, A.P.C., Chan, D.W.M., Chiang, Y.H., and Yang, H. (2013). Developing a Benchmarking Model for Construction Projects in Hong Kong. ASCE J. of Constr. Eng. and Manage., 139(6), pp. 705-716.
Yeung, J.F.Y., Chan, A.P.C., Chan, D.W.M., and Li, L.K. (2007). Development of a partnering performance index (PPI) for construction projects in Hong Kong: a Delphi study. Constr. Manage. and Econ., 25(12), pp. 1219-1237.
Yu, I., Kim, K., Jung, Y., and Chin S. (2007). Comparable Performance Measurement System for Construction Companies. ASCE J. of Manage. in Eng., 23(3), pp. 131-139.
160 | Proceedings IGLC | July 2017 | Heraklion, Greece
Korb S., Sacks R., and Alhava O. (2017). “A Portfolio/Process/Operations (PPO) Analysis of a Meta-project Production System in Renovation Projects” In: LC3 2017 Volume II – Proceedings of the 25th Annual Conference of the International Group for Lean Construction (IGLC), Walsh, K., Sacks, R., Brilakis, I. (eds.), Heraklion, Greece, pp. 161–168. DOI: https://doi.org/10.24928/2017/0322
A PORTFOLIO/PROCESS/OPERATIONS (PPO) ANALYSIS OF A META-PROJECT PRODUCTION
SYSTEM IN RENOVATION PROJECTS
Samuel Korb1, Rafael Sacks2, and Otto Alhava3
Abstract: The Portfolio/Process/Operations (PPO) model is a novel approach to understanding the elements that impact production systems in the world of construction. Building on prior work such as the "Transformation-Flow-Value" (TFV) theory, the PPO model adds a multi- and meta-project view through its consideration of the total "Portfolio" of projects and partners in which each company in the industry is engaged.
Fira Palvelut is a Finnish contractor specializing in the refurbishment of bathrooms in the aging Finnish mass housing market. This paper examines Fira's efforts to improve their operations and finds that by addressing each of the elements of the PPO model, they have managed to build a robust and successful production system that dramatically outpaces the industry standard for project lead time. In the renovation sphere, this means customers must be out of their houses for significantly less time while the work is performed.
In this paper, we give a background to the PPO model and Fira Palvelut's operations, and analyze their success through the lens of each element of the model.
Keywords: Lean construction, PPO model, case study, linked projects
1 INTRODUCTION The Portfolio/Process/Operations (PPO) model is a new approach to conceptualizing the intertwined factors that impact the work flow in construction production systems (Sacks, 2016). "Operations" are the individual value-adding tasks performed by trade crews, while "Process" reflects the flow of individual products (locations within a building project) through the tasks across different trades. "Portfolio" introduces a meta-project point of view, by examining how general contractors schedule the flow of their projects, considering building projects as product units. The portfolio and the operations levels are linked to close a loop, in that the trade crews (subcontractors and suppliers) balance the demands of the multiple projects in which they are involved across the local construction market.
Fira Oy is a Finnish construction contractor. Among other lines of business, Fira offers bathroom-renovation services to aging housing projects, in which the bathrooms in a multi-floor building are refurbished, including replacement of all of the plumbing systems and most of the electrical. After completing a number of projects in this domain using a traditional planning and control model – i.e. by subcontracting each of the demolition,
1 PhD Student, Faculty of Civil and Environmental Engineering, Technion - Israel Institute of Technology,
Haifa, Israel, [email protected] 2 Associate Professor, Faculty of Civil and Environmental Engineering, Technion - Israel Institute of
Technology, Haifa, Israel, [email protected] 3 Otto Alhava, M.Sc. (Tech.), Chief Technology Officer, Fira Group Oy, Vantaa, Finland,
161 | Proceedings IGLC | July 2017 | Heraklion, Greece
A Portfolio/Process/Operations (PPO) Analysis of a Meta-project Production System in Renovation Projects
plumbing systems, electrical systems, mechanical systems, concrete and block work, and tiling work to separate sub-contracted crews and managing them using a critical path method plan – Fira was able to identify and quantify much of the wastes in the system.
Fira then applied Lean thinking to the problem and has devised a new approach in which it views individual bathrooms as products in a production system which spans across buildings and projects. On the basis of this conceptual change, the system attempts to build a predictable work pace and flow which extends from project to project in a carefully planned portfolio. Similarly, the subcontractors are aligned using Alliancing agreements and other similar contract structures, which allow them to take a meta-project view of their work flow and avoid periods of under-utilization between projects. Though Fira did not explicitly set out to implement the PPO model (as it was only advanced recently), their practice and their success incorporate the principles of the PPO model of production flow in construction.
In the following sections, we review the PPO model in detail, describe Fira’s approach to bathroom renovation, and discuss the degree to which Fira’s construction production system can be considered an exemplar of the PPO model. The conclusions provide insight into the domains within construction and the ways in which the PPO model can be applied in practice.
2 THEORETICAL BACKGROUND
The PPO model is based on the 'Process-Operation' conceptual distinction made by Shingo (1988) between the work tasks done on successive products at the same work station (the operation axis) and the successive sequence of tasks that each product flows through as it moves through the company (the process axis). In the case of construction, the PPO model recognizes that the product is stationary and the work stations (trade crews) flow through the product (Sacks, 2016). The construction products are the locations (room, apartment, floor, or any other distinct zone that is handed over to a customer). The locations are built along the process axis, whereas the trade crews work on the operations axis.
This same conceptual framework underpins the Location-Based Management approach which uses a "Line of Balance" chart to manage (both planning and control) the progress of construction projects (Kenley and Seppänen, 2006). A Line of Balance (LOB) chart portrays the locations of the construction project on the Y axis and the progress of time on the X axis. The locations move through time and through the trades, on the Process axis. Each trade is portrayed as a line moving through the locations, along an Operations axis. This is shown graphically in Figure 1.
The contribution of Shingo's model was to broaden the scope of attention given by managers and industrial engineers beyond merely the work transpiring at each work station, where focus naturally gravitates, and instead to look at the work through the "eyes" of the product to identify the journey it took through the manufacture and supply process. This approach underlay much of the work done to improve processes at Toyota, where Shingo was one of the thought leaders behind the Toyota Production System, and is a key component of Lean thinking to this day. Koskela (2000) also highlighted this distinction in his "Transformation-Flow-Value" (TFV) theory (in which Transformation corresponds to Operations and Flow corresponds to Process). TFV added an additional element, Value, as a way of viewing the work activities through the eyes of the customer.
In construction, there is a third element - construction is a form of project production rather than factory or serial production (Ballard, 2005). The PPO model encompasses this aspect by adding a third dimension - the project Portfolio. Projects can be considered
162 | Proceedings IGLC | July 2017 | Heraklion, Greece

Samuel Korb, Rafael Sacks and Otto Alhava
products in and of themselves, and one can conceptualize the flow of a company’s construction projects using notions such as work in progress (the number of projects a company is engaged in simultaneously) and cycle time (the duration of each project). As such, theoretical constructs such as Little's law can be applied. Figure 2 illustrates the three dimensions.
Figure 1: Traditional "Line of Balance" (LOB) chart for managing a single project,
showing Process (location) flows and Operations (trade crew) flows.
Figure 2: Three-dimensional Portfolio, Process and Operations (PPO) model of
construction flows.
Furthermore, in the construction industry, it is common for the actual work to be carried out by subcontractors who can work at more than one project at a time for
more than one General Contractor. As Sacks and Harel (2006) have shown, the inter-project dynamic for a subcontractor who is juggling the demands of multiple projects can have a significant impact on the progress of a given project. Thus in the same way that the work must be viewed through the eyes of the product, it
must also be viewed through the eyes of the multi-site resources, if global optimization and favorable project outcomes are to be pursued. The cyclical nature
of the PPO model is shown in (a) (b)
Figure 3b.
Flow of locations
Locatio
ns
ProcessAxis(Time)
ProjectA
A1
A2
A3
TradeX
TradeY
Operations
Locations
Portfolio
Axis
ProcessAxis
ProjectA
ProjectB
A1
A2
B1
B2
TradeX
TradeY
163 | Proceedings IGLC | July 2017 | Heraklion, Greece
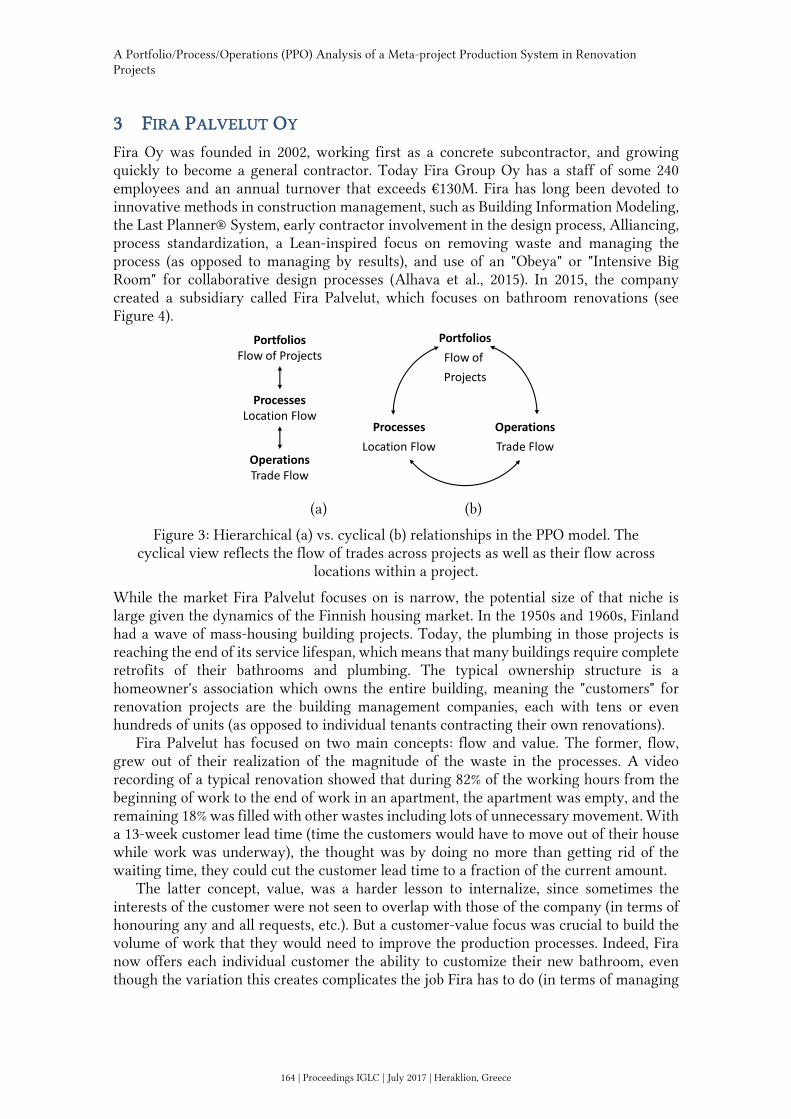
A Portfolio/Process/Operations (PPO) Analysis of a Meta-project Production System in Renovation Projects
3 FIRA PALVELUT OY
Fira Oy was founded in 2002, working first as a concrete subcontractor, and growing quickly to become a general contractor. Today Fira Group Oy has a staff of some 240 employees and an annual turnover that exceeds €130M. Fira has long been devoted to innovative methods in construction management, such as Building Information Modeling, the Last Planner® System, early contractor involvement in the design process, Alliancing, process standardization, a Lean-inspired focus on removing waste and managing the process (as opposed to managing by results), and use of an "Obeya" or "Intensive Big Room" for collaborative design processes (Alhava et al., 2015). In 2015, the company created a subsidiary called Fira Palvelut, which focuses on bathroom renovations (see Figure 4).
(a) (b)
Figure 3: Hierarchical (a) vs. cyclical (b) relationships in the PPO model. The cyclical view reflects the flow of trades across projects as well as their flow across
locations within a project.
While the market Fira Palvelut focuses on is narrow, the potential size of that niche is large given the dynamics of the Finnish housing market. In the 1950s and 1960s, Finland had a wave of mass-housing building projects. Today, the plumbing in those projects is reaching the end of its service lifespan, which means that many buildings require complete retrofits of their bathrooms and plumbing. The typical ownership structure is a homeowner's association which owns the entire building, meaning the "customers" for renovation projects are the building management companies, each with tens or even hundreds of units (as opposed to individual tenants contracting their own renovations).
Fira Palvelut has focused on two main concepts: flow and value. The former, flow, grew out of their realization of the magnitude of the waste in the processes. A video recording of a typical renovation showed that during 82% of the working hours from the beginning of work to the end of work in an apartment, the apartment was empty, and the remaining 18% was filled with other wastes including lots of unnecessary movement. With a 13-week customer lead time (time the customers would have to move out of their house while work was underway), the thought was by doing no more than getting rid of the waiting time, they could cut the customer lead time to a fraction of the current amount.
The latter concept, value, was a harder lesson to internalize, since sometimes the interests of the customer were not seen to overlap with those of the company (in terms of honouring any and all requests, etc.). But a customer-value focus was crucial to build the volume of work that they would need to improve the production processes. Indeed, Fira now offers each individual customer the ability to customize their new bathroom, even though the variation this creates complicates the job Fira has to do (in terms of managing
ProcessesLocationFlow
OperationsTradeFlow
PortfoliosFlowofProjects
ProcessesLocationFlow
OperationsTradeFlow
PortfoliosFlowofProjects
164 | Proceedings IGLC | July 2017 | Heraklion, Greece

Samuel Korb, Rafael Sacks and Otto Alhava
information and the supply chain). Furthermore, each project has a service engineer whose sole job is to serve the needs of the tenants. The short lead-time and customized product have given them a competitive edge in their market.
Figure 4: Typical bathroom, post-demolition, with tubing laid for in-floor heating
Fira's key innovation to improve flow has been to create stable groups of subcontractors called "trains" that move together from project to project. In each project, the "coaches" of the train proceed from apartment to apartment at designated intervals (a form of Takt planning). Capacity buffers (in the form of overtime or temporarily adding workers) are used to maintain consistency in the cycle times, so that the coaches do not become uncoupled and nor does the train derail. In this way, they were able to reduce customer move-out duration from thirteen weeks to a standard of five weeks, and consequently to grow the business almost six-fold in the course of five years. A pilot program has reduced the apartment cycle-time further, to two weeks, which garnered attention in the local press.
4 PPO AT FIRA
In building the unique production system that is Fira Palvelut, Fira has instinctively addressed all of the elements of the PPO model, and in so doing, they have harnessed the synergy that can be created when those elements are in harmony.
4.1 Portfolio
One of the key things that Fira has done is work to create a stable backlog of projects, so that when one project is finished, the next is immediately ready to start. In this way, they are able to provide the crews with a steady supply of jobs, and in return they ask that the subcontractors maintain the crew composition from project to project (as a comparison, in prior projects less than 10% of the crew members would continue from one project to the next). In essence, they are aware of the crucial importance of the "Portfolio" from the point of view of the subs and thus take active steps to make sure that it is addressed (by providing a dependable flow of projects).
For subcontractors, the continuity of projects is a boon, since it avoids gaps between projects, gaps that are problematic due to the fixed costs for the subcontractor and
165 | Proceedings IGLC | July 2017 | Heraklion, Greece

A Portfolio/Process/Operations (PPO) Analysis of a Meta-project Production System in Renovation Projects
questions about whether to hold onto or lay off their staff. The workers can also be affected by discontinuities in the work; if they know that there is no new project in the pipeline after the current one (which could mean no work for weeks or months), they may be subject to psychological pressures (knowingly or not) which could slow the pace of work.
As is apparent from the model and the example provided by Fira’s practical experience, understanding these meta-project dynamics at work is crucial to the efficient management of any given project and the many client-service provider relationships it contains, because it guides thinking toward establishment of streams of projects that provide for optimal trade-crew flows both within a project and from project to project. By addressing the portfolio-level interests of all agents and designing production systems accordingly, better outcomes can be achieved for all parties.
In turn, through Alliancing agreements and other similar contract structures, Fira gains high-quality work and some measure of control over which specific workers are involved in each project. This allows them to build on the learning curve of each individual project, accumulating learning from project to project instead of starting from scratch with each new project team (compare the ad-hoc approach in Figure 5 to the continuous flow of projects in Figure 6). This directly enables continuous improvement.
Figure 5: The "waste" of shared learning when projects are disconnected and teams
are ad-hoc
Figure 6: Linking projects and maintaining team continuity leads to long-term
learning and improvement
166 | Proceedings IGLC | July 2017 | Heraklion, Greece

Samuel Korb, Rafael Sacks and Otto Alhava
4.2 Process
The key enabler to building a stable flow of work both within and between projects has been a keen attention to Process. This meant identifying, quantifying, defining, and balancing the work packages so that each coach of the train has an equal duration of work. The continuity of personnel from project to project provided by the attention to Portfolio was crucial to the improvement of the processes, since there was a set team who could be engaged in the joint Value Stream Mapping (VSM)-type work required to examine the work flow and jointly coordinate their actions. Rather than arriving to each new site and having to renegotiate their working relationships (if they exist at all) with the other subs, the workers in the Fira Palvelut model are part of a quasi-organization that has intentional longevity. As Priven and Sacks (2016) have shown, growing the social interactions between the team members has positive impacts on project outcomes.
The stability that is gained in the work durations has been leveraged to compress project timelines, an effective competitive advantage in a market niche that requires residents to find alternate accommodations during the refurbishment. All of this comes from an awareness of the existence of a work process that involves all of the trades and a conscientious drive to identify and remove the wastes that impede the smooth flow.
One example was the acquisition of a diamond drill by the demolition team. Previously, the demolition subcontractor had hired another company to drill the holes in the concrete necessary to run the new plumbing. But the wait for an exterior party, coupled with the motivation on the part of the driller to wait until a batch of works had built up, was causing interruptions to the flow which were having negative impacts on the overall work. The demolition team eventually purchased their own drill so they could self-perform that part of the work, on time, as needed, in batches as arbitrarily small as the flow required. Fira systematically documents these innovations as they are implemented and standardizes them across projects, though developing standardized processes across the trains remains a challenge.
4.3 Operation
Connecting project to project with the same team has an additional benefit at the level of the individual Operations. The continuity it provides means that there is a degree of repetition not present in the typical one-off project organization. Continuous improvement is based upon being able to stabilize processes, which often means having a sufficient degree of repeatability of the operation under study. In a here-today, gone-tomorrow traditional project, the interest in investing in continuous improvement (to say nothing of the underlying repetition that is necessary) rapidly approaches zero. But in a scenario where the crews are doing roughly the same work from day to day, project to project, with the same suppliers and other crews they are interfacing with, the situation is completely different. Suddenly there is not only room for improvement but also desire, since the benefits will be paid out for as long as the trains keep moving from project to project. This happened with the electrical crew, who were able to drop their costs by 18% under their estimation by focusing on improving from project to project.
5 CONCLUSIONS The success of Fira is a good indication of how the elements of the PPO model are interconnected, as depicted in Figure 3b. Their attention to the "Portfolio" element allows improvements to both Process and Operation, which in turn have benefits to the overall
167 | Proceedings IGLC | July 2017 | Heraklion, Greece

A Portfolio/Process/Operations (PPO) Analysis of a Meta-project Production System in Renovation Projects
Portfolio of the parties concerned. And indeed, the meta-project element is a key innovation, both in the PPO model and in Fira's practice.
One critique of Fira's practice is that their Location Breakdown Structure (LBS) does not go down to the individual apartment level, thus stopping short of the Lean "One Piece Flow" ideal. This is due to the nature of the local construction market, where the ownership structure is as described above (leading to entire buildings hiring Fira), and where sub-floor components of each bathroom are actually located in the apartment below so that each 'entrance' (typically with some 10-20 apartments) is the smallest planning unit. In other markets, the logical implication of the PPO model is to reduce the product to the smallest indivisible unit (the apartment). But as the case of Fira shows, this ideal can be influenced by the prevailing cultural, technological, and legal context.
In conclusion, Fira's practice illustrates implementation of a production system that considers all three aspects of the PPO model. The designers of Fira's production system are implicitly aware of all elements: of the project portfolio, of the process undergone by each individual apartment, and of the operations performed by the trade crews. They have addressed each in an integrative fashion to improve performance. By building a continuity of projects, the portfolio of each of the partners is being given its due, instead of the typical one-off approach leaving each of the members of the ad-hoc construction organization to fend for themselves at project end. Furthermore, the continuity allows attention to be given to improving both the individual operations and the overall flow, creating balanced work sequences which are themselves crucial to scheduling each trade and each project.
6 REFERENCES Alhava, O., Laine, E., Kiviniemi, A., 2015. Intensive big room process for co-creating
value in legacy construction projects. J. Inf. Technol. Constr. ITcon 20, 146–158. Ballard, G., 2005. Construction: One Type of Project Production System, in: 13th Annual
Conference of the International Group for Lean Construction. University of New South Wales, Sydney, pp. 29–35.
Kenley, R., Seppänen, O., 2006. Location-Based Management for Construction: Planning, Scheduling and Control. Routledge.
Koskela, L., 2000. An Exploration towards a Production Theory and its Application to Construction. (Dissertation for the degree of Doctor of Technology). Helsinki University of Technology.
Priven, V., Sacks, R., 2016. Impacts of the Social Subcontract and Last Planner System Interventions on the Trade-Crew Workflows of Multistory Residential Construction Projects. J. Constr. Eng. Manag. 04016013. doi:10.1061/(ASCE)CO.1943-7862.0001102
Sacks, R., 2016. What constitutes good production flow in construction? Constr. Manag. Econ. 34, 641–656. doi:10.1080/01446193.2016.1200733
Sacks, R., Harel, M., 2006. An economic game theory model of subcontractor resource allocation behaviour. Constr. Manag. Econ. 24, 869–881. doi:10.1080/01446190600631856
Shingō, S., 1988. Non-stock production: the Shingo system for continuous improvement. Productivity Press, Cambridge, Mass.
168 | Proceedings IGLC | July 2017 | Heraklion, Greece

Koskela L., Pikas E., Niiranen J., Ferrantelli A. and Dave B. (2017). “On Epistemology of Construction Engineering and Management.” In: LC3 2017 Volume II – Proceedings of the 25th Annual Conference of the International Group for Lean Construction (IGLC), Walsh, K., Sacks, R., Brilakis, I. (eds.), Heraklion, Greece, pp. 169–176 DOI: https://doi.org/10.24928/2017/0336
ON EPISTEMOLOGY OF CONSTRUCTION ENGINEERING AND MANAGEMENT
Lauri Koskela1, Ergo Pikas2, Jarkko Niiranen3, Andrea Ferrantelli4 and Bhargav Dave5
Abstract: In philosophy of science, there have been two different starting points for epistemology: Platonism and Aristotelianism. These two alternative starting points have played a major role also in the formation of fundamental ideas of engineering and management generally as well as in relation to construction. It is contended that an overly Platonic influence on engineering and management has created a number of problems. For solving these problems, beyond mere patching, a more balanced take on Platonism and Aristotelianism is needed.
Keywords: Epistemology, Construction Engineering, Construction Management.
1 INTRODUCTION
The ubiquity of the problems in construction – both managerial and technical – is well known. For tackling these problems, it is necessary to know whether the root causes for them are abundant and scattered over many domains or whether there are some major root causes that could be remedied through a few concentrated efforts. In this presentation, we contend that there indeed exists one major root cause that has hardly attracted attention, namely unhelpful epistemological (i.e., how we acquire knowledge) choices in engineering and management.
The paper is structured as follows. First, the intellectual origins of engineering and management are examined. The findings made allude to the influence of the time-honoured epistemological contradiction between Plato and Aristotle; this is discussed next, along with the historical diffusion of their views into engineering and management. An analysis of the problems caused by inappropriate epistemological views follows. A brief discussion on conclusions completes the paper.
2 EPISTEMOLOGICAL ORIGINS OF ENGINEERING AND MANAGEMENT
2.1 Rankine – the father of scientific engineering
The Scot William Rankine consolidated the engineering field of structural mechanics in his books published in the 1850s and 1860s. The book “A manual of applied mechanics” (Rankine 1872) contains his inaugural lecture to the class of civil engineering and mechanics at the University of Glasgow in 1858, titled “Preliminary dissertation on the harmony of theory and practice in mechanics”. In many ways, this lecture is his programmatic declaration for a science of engineering.
1 University of Huddersfield, School of Art, Design and Architecture, [email protected] 2 Aalto University, Department of Civil Engineering and Tallinn University of Technology, Faculty of
Engineering 3 Aalto University, Department of Civil Engineering 4 Tallinn University of Technology, Faculty of Engineering 5 Aalto University, Department of Computing
169 | Proceedings IGLC | July 2017 | Heraklion, Greece

On Epistemology of Construction Engineering and Management
The novelty he propagated was to utilize natural science, especially physics, for practical purposes in engineering – earlier these two fields had been considered separate. Essentially the question was about engineering design: “to plan a structure or a machine for a given purpose”. The use of physical laws made it possible to accurately predict, through deduction, the behaviour of a structure or machine, and this in turn made it possible to pinpoint the best possible, optimal, solution. Thus, he defined the new style of engineering as a “scientifically practical skill which produces the greatest effect with the least possible expenditure of material and work”.
According to Rankine, this new engineering contrasts with purely practical knowledge, providing only approximate solutions, based on prompt and sound judgment or an established practical rule. This practical knowledge dominated especially in the realm of making and constructing: “to judge the quality of materials and workmanship, to direct the operations of workmen.” Rankine did not hide his value judgment regarding the relative worth of scientific engineering and practical knowledge: “…the engineer or mechanic, who plans and works with understanding of the natural laws that regulate the results of the operations, rises to the dignity of a Sage.”
Interestingly, all these hallmarks of scientific engineering exist still today in teaching and research of engineering: basing engineering on physical laws, definition of engineering predominantly as design, emphasis on optimal solutions, and use of deduction as the primary form of reasoning.
2.2 Shewhart – the father of quality
The American Walter Shewhart is considered as the seminal contributor to statistical quality control, which later evolved into total quality control. His work was stimulated in the 1920s by the rapidly evolving mass production, which needed methods for ensuring consistent quality of products.
Shewhart (1931) was not much interested in engineering design but he needed it as his starting point (he discusses human wants as the starting point of mass production):
The first step of the engineer in trying to satisfy these wants is therefore that of translating as nearly as possible these wants into the physical characteristics of the thing manufactured to satisfy these wants. In taking this step intuition and judgment play an important role as well as the broad knowledge of the human element involved in the wants of individuals.
Here, Shewhart fails to mention the use of physical laws in engineering. Indeed, he is more interested in production:
The second step of the engineer is to set up ways and means of obtaining a product which will differ from the arbitrarily set standards for these quality characteristics by no more than may be left to chance.
Shewhart’s concern was to reduce the gap between the intended and the achieved. How is this gap reduced? Through the method of science (Shewhart 1939):
Let us recall the three steps of control: specification, production, and judgement of quality. […] In fact these three steps must go in a circle instead of in a straight line […]. It may be helpful to think of the three steps in the mass production process as steps in the scientific method. In this sense, specification, production, and inspection correspond respectively to making a hypothesis, carrying out an experiment, and testing the hypothesis. These three steps constitute a dynamic scientific process of acquiring knowledge.
These ideas were later transformed into the PDCA cycle (Plan-Do-Check-Act), now widely known and applied in quality work and lean production.
Again, the basic ideas of Shewhart are today widely used in industrial engineering, especially in practices of quality and lean production: basing industrial engineering on the scientific method, focusing industrial engineering on production, emphasis on
170 | Proceedings IGLC | July 2017 | Heraklion, Greece
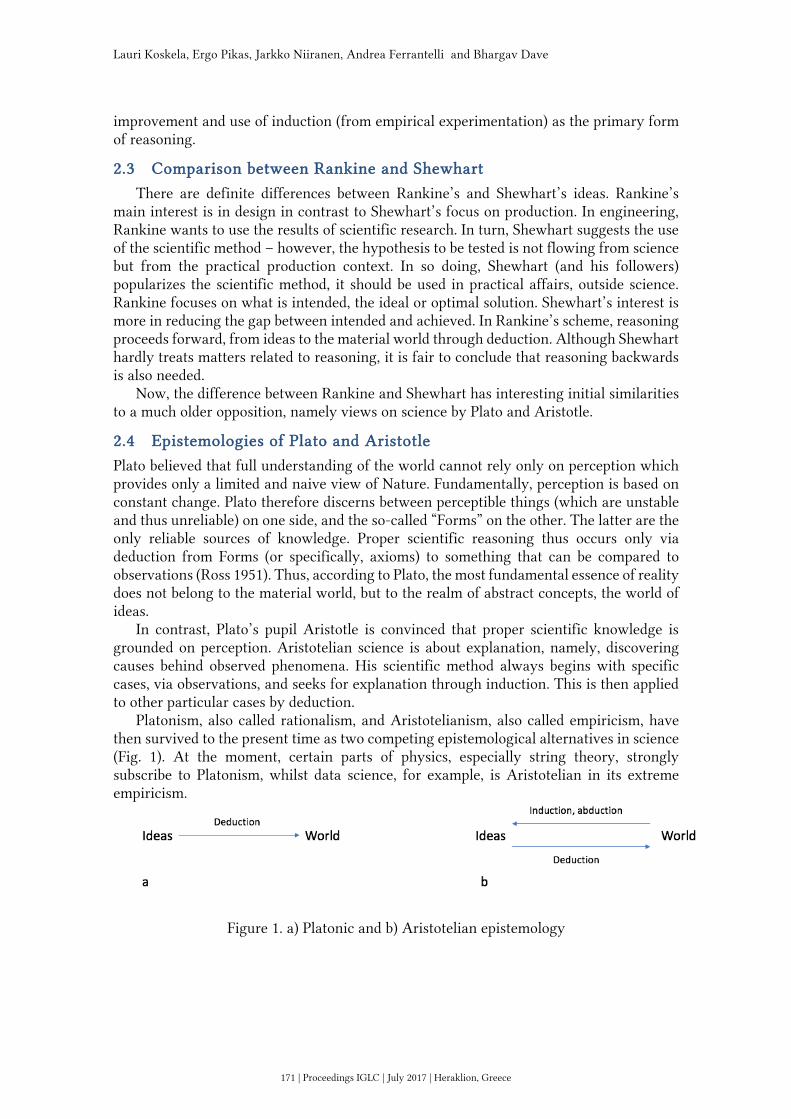
Lauri Koskela, Ergo Pikas, Jarkko Niiranen, Andrea Ferrantelli and Bhargav Dave
improvement and use of induction (from empirical experimentation) as the primary form of reasoning.
2.3 Comparison between Rankine and Shewhart
There are definite differences between Rankine’s and Shewhart’s ideas. Rankine’s main interest is in design in contrast to Shewhart’s focus on production. In engineering, Rankine wants to use the results of scientific research. In turn, Shewhart suggests the use of the scientific method – however, the hypothesis to be tested is not flowing from science but from the practical production context. In so doing, Shewhart (and his followers) popularizes the scientific method, it should be used in practical affairs, outside science. Rankine focuses on what is intended, the ideal or optimal solution. Shewhart’s interest is more in reducing the gap between intended and achieved. In Rankine’s scheme, reasoning proceeds forward, from ideas to the material world through deduction. Although Shewhart hardly treats matters related to reasoning, it is fair to conclude that reasoning backwards is also needed.
Now, the difference between Rankine and Shewhart has interesting initial similarities to a much older opposition, namely views on science by Plato and Aristotle.
2.4 Epistemologies of Plato and Aristotle
Plato believed that full understanding of the world cannot rely only on perception which provides only a limited and naive view of Nature. Fundamentally, perception is based on constant change. Plato therefore discerns between perceptible things (which are unstable and thus unreliable) on one side, and the so-called “Forms” on the other. The latter are the only reliable sources of knowledge. Proper scientific reasoning thus occurs only via deduction from Forms (or specifically, axioms) to something that can be compared to observations (Ross 1951). Thus, according to Plato, the most fundamental essence of reality does not belong to the material world, but to the realm of abstract concepts, the world of ideas.
In contrast, Plato’s pupil Aristotle is convinced that proper scientific knowledge is grounded on perception. Aristotelian science is about explanation, namely, discovering causes behind observed phenomena. His scientific method always begins with specific cases, via observations, and seeks for explanation through induction. This is then applied to other particular cases by deduction.
Platonism, also called rationalism, and Aristotelianism, also called empiricism, have then survived to the present time as two competing epistemological alternatives in science (Fig. 1). At the moment, certain parts of physics, especially string theory, strongly subscribe to Platonism, whilst data science, for example, is Aristotelian in its extreme empiricism.
Figure 1. a) Platonic and b) Aristotelian epistemology
171 | Proceedings IGLC | July 2017 | Heraklion, Greece

On Epistemology of Construction Engineering and Management
3 DIFFUSION OF EPISTEMOLOGICAL COMMITMENTS INTO
ENGINEERING AND MANAGEMENT The context considered here, namely engineering and management, is of course different to science. Nevertheless, the epistemological questions require to be responded if progress is to be made: from where can we have knowledge to base our design and planning activities, or any productive action? Those leaning to Platonism argue that reason or theoretical knowledge – broadly, the world of ideas – should provide the basis. In turn, those subscribing to Aristotle contend that it is the empirical observation that should be taken as a starting point.
As exemplified through Rankine, the very idea of engineering is to start from theoretical knowledge; also other hallmarks of Platonism are plain. Although more Aristotelian views have also existed, especially in the US the Platonic view of engineering gained a dominating position after the Second World War (Seely 1999).
The emergence of managerial disciplines is connected to the famous reports on the future management education in the US published in 1959 (Koskela 2017). They proposed three root stems for business research and education: behavioural science, economics and quantitative methods. Out of these, economics and quantitative methods were Platonic, whereas behavioural science was promoted as an empirical science. Out of these, especially economics, with strong Platonic undercurrents, has been influential. In economics, the current neoclassical paradigm gained foothold after 1870, with a tipping point in the 1930s. It adopted contemporaneous physics as its methodological model, and thus its axiomatic method. Optimal decision on allocation of scarce resources came to be the leading economic concept.
Certainly, there have been counter-currents. The quality movement that emerged from Shewhart’s seminal efforts can be seen as the flag-bearer of the Aristotelian approach. The related lean movement, foreshadowed by scientific management and essentially brought into completion as the Toyota Production System, is similarly Aristotelian. Especially, the concept of waste implies that one starts from the material world.
All in all, it can be said that in the realm of productive activities, engineering, production and management, Platonic approaches have provided the dominant worldview in the latter half of the 20th century, and still in the beginning of this century.
4 EPISTEMOLOGICAL PROBLEMS IN CONSTRUCTION ENGINEERING
AND MANAGEMENT
The general intellectual trends described above have trickled down to construction through education (especially at the university level), professional institutions and methods. They have been offered as modern and superior alternatives to craft-based, experiential methods in construction, but of course they have not completely substituted for them. Unfortunately, a number of problems, related especially to the overly Platonic orientation, have also been transmitted.
4.1 Construction Engineering
The genesis of scientific engineering, as a Platonic endeavour, has directly contributed to several problems or shortcomings, to be covered next.
172 | Proceedings IGLC | July 2017 | Heraklion, Greece

Lauri Koskela, Ergo Pikas, Jarkko Niiranen, Andrea Ferrantelli and Bhargav Dave
4.1.1 Preoccupation with design at the cost of other stages
As defined by Rankine, engineering is involved in design of machines and structures; the realization of these is left to men having practical knowledge (although not explicitly stated, it is obvious that the operation and maintenance is thought of in the same way by Rankine). This preoccupation is visible in the still widely known definition of engineering by the American Engineers' Council for Professional Development6 (ECPD):
The creative application of scientific principles to design or develop structures, machines, apparatus, or manufacturing processes, or works utilizing them singly or in combination; or to construct or operate the same with full cognizance of their design; or to forecast their behavior under specific operating conditions; all as respects an intended function, economics of operation or safety to life and property.
Thus, although construction and operation are now recognized as valid areas for engineering, they should be looked through the lens of design. However, construction and operation remain underdeveloped areas of engineering. In addition, the Platonic attitude implies that in design, subsequent stages are hardly taken into account. The following anecdote from an ethnographic study of an engineering office is revealing (Demian and Fruchter 2006):
Bart is very much old school in that a building is just an assembly of details, and that there’s nothing wrong with drawing one detail and completely ignoring the fact that there is another detail that must interface with it. He just draws all of these details independently and expects the contractor to figure out how they all fit together.
4.1.2 Preoccupation with optimality at the cost of gap between optimal solution and what is achieved
Already for Rankine, the optimality of the solution was one hallmark of scientific engineering. This idea of optimality has been further strengthened by the rise of modern economics from the 1930’s onwards as well as the evolution of quantitative methods somewhat later, leading to the approach of “optimal design” from 1960 onwards. However, there are two problems confronting this idea. As already Shewhart identified, the use environment of products wildly varies, making the determination of one single optimum difficult if not impossible. The methods of robust design (Taguchi & Clausing 1990) have been developed to counter this difficulty.
The other difficulty is that an optimum exists only in the world of ideas; when it is implemented in the material world, the achievement will more or less deviate from the optimum. There is a settled term for this deviation in quality and production engineering: waste. This phenomenon of waste is troublesome for those subscribing to the Platonic view, and it is turned down in different ways. An argument flowing from the Platonic approach itself is that waste belongs to the natural, varying imperfections of the material world and is of low interest in comparison to the pursuit of eternal truths in the ideal world. Another argument is that optimum as such eliminates waste (OECD 1972): “It is also clear that optimum production, which by definition means no wastage and the best use of available resources...”. A third popular argument is that if there is a gap between ideal and material world, it is a fault of your own or of somebody else. Indeed, so incompatible are the concepts of optimum and waste that along with the diffusion of the idea of optimal
6 ECPD changed its name to Accreditation Board for Engineering and Technology (ABET) in 1980. For
comparison, the current definition of engineering by ABET is as follows: The profession in which a knowledge of the mathematical and natural sciences gained by study, experience, and practice is applied with judgment to develop ways to utilize economically the materials and forces of nature for the benefit of mankind.
173 | Proceedings IGLC | July 2017 | Heraklion, Greece

On Epistemology of Construction Engineering and Management
allocation of resources from the (then new) economics after the Second World War, a stark reduction in the use of the term waste occurred (Koskela, Sacks & Rooke 2012).
4.1.3 Preoccupation with pre-existing knowledge at the cost of contextually captured knowledge
For Rankine, engineering was utilization of physical laws for the design of machines and structures. This view of engineering has persisted. Unfortunately, this overshadows the possibility and need for acquiring knowledge related to the task context, or through scientific experimentation. Recently, there have been calls to add problem analysis into the engineering curriculum (Downey 2005). The benefits of acquiring knowledge through experimentation, trials and tests in engineering (and product development) has in the last decades been emphasized by many authors (Thomke 1998) and in approaches such as design thinking (Brown 2008). In construction, these developments have, for their part, been reflected in the shift of focus from physical models to computer models. The advance of Building Information Modelling has been instrumental in this respect.
4.1.4 Preoccupation with the viewpoint of one discipline
Clausing (1994) sees that the traditional design process has not moved far enough beyond partial design, i.e., design from the point of view of one engineering discipline. Thus, according to Clausing, the traditional approach suffers from failure of co-operation (missing unity within the team) and failure of process (missing clarity with regard to the activities). This situation has often been called silo mentality; designers prepare designs from the point of view of their own discipline (without much taking needs of other disciplines or stages into account) and just send them to the other designers or next stages. The weakness of this approach is now widely recognized.
4.1.5 Preoccupation with deduction at the cost of other types of reasoning
According to Rankine, the type of reasoning associated with engineering is reasoning forward (from ideas to the world), deduction. Deduction is especially evident in the task often called analysis; given a structure, determine its behaviour. In engineering, the creative design activity has been called synthesis but this term hardly carries any widely agreed theoretical understanding.
Reasoning proceeding in the reverse order, backwards, is needed when we start from observation on the material world and want to create knowledge into the world of ideas. Reasoning backwards takes many forms, such as regressive reasoning (reverse of deduction), induction (generalization from a sample) and abduction (creative leap to something new). All these are needed in design and problem-solving, and also when analysing waste for the sake of improvement. The problem has been that systematic teaching and training on these types of backwards reasoning is more or less absent from the curricula of engineering schools. In this way, education reinforces the Platonic tendencies of engineering. Indeed, one of the difficulties related to the concept of waste is that investigation of waste requires less known reasoning approaches, rather than the familiar approach of deduction.
4.2 Construction Management
4.2.1 Production planning and management
The two well-known approaches to production management, push and pull, have their epistemological interpretation. As it is well-known, push is based on a plan, and pull on the state of the production system. The former is related to the world of ideas, the latter to
174 | Proceedings IGLC | July 2017 | Heraklion, Greece

Lauri Koskela, Ergo Pikas, Jarkko Niiranen, Andrea Ferrantelli and Bhargav Dave
the material world. The wide experience shows that using (Aristotelian) pushing and pulling is widely superior to (Platonic) pushing only.
In construction, push-based production management emerged with the invention of Critical Path Method (CPM) in 1959. CPM was developed in the framework of operations research, under strong Platonic influence (Koskela & al. 2014). Thus, the question is about an optimal plan that pushes tasks into execution. In case of a deviation from the plan, the primary goal is to do adjustments for reaching back to the original plan. Beyond that, there is no place for learning from observations on execution. Interestingly, verification and validation are not only missing in a CPM plan, but they have been absent also in relation to the CPM as a method. Jaafari (1984), after reviewing six themes of critique against the CPM, states: “…there is nothing inherently wrong in either CPM concept or the subsequent schedules resulted from its analysis, the fault lies in the way it is applied in practice.” Of course, this attitude is part and parcel in the Platonic tradition: the starting point in the world of ideas must be correct, it is the execution in the messy material world that is the cause of any problems.
In the beginning of the 1990’s, Ballard (2000) realized that invariantly only half of the tasks in a weekly plan, resulting from the application of the CPM, get realized as planned. This observation, which made the claim of an optimal plan to collapse, led then to development of the Last Planner method, an Aristotelian counterpart to the CPM.
4.2.2 Construction economics
The mainstream economic doctrine includes the axiomatic assumption of optimal productive efficiency of firms. This is accepted in the discipline of construction economics. For example, in his book on construction economics, Myers (2004) states, in stark contradiction to the wide evidence on waste in construction:
In any free market economy businesses will never waste inputs. A business will not use 10 units of capital, 10 units of labour, and 10 units of land when it could produce the same amount of output with only 8 units of capital, 7 units of labour, and 9 units of land.
Another example on the deceptive power of an axiomatic starting point is provided by Public Private Partnerships (PPP). They are based on the idea that in creating a single point of responsibility and a long temporal involvement, the PPP model provides an effective economic incentive to implement through life management. However, a recent study could not find substantial evidence on through life management benefits, in spite of wide application of this model over decades in different countries (Koskela & al. 2016).
5 CONCLUSION
The analyses presented show that the Platonic epistemology has dominated in construction engineering and management, leading to various problems and triggering several correctives. However, the common cause for the problems and correctives, namely inappropriate epistemological choices in the form of overuse and misuse of Platonism, has not been explicitly discussed and identified.
It is opportune to remind that Platonism has its lasting value as an approach starting from concepts and ideas; it is thus a better balance between the Platonic and Aristotelian tendencies in construction engineering and management that is needed. For realizing that, a wide discussion in the relevant disciplines and professions is requisite. For enabling future generations of engineers to avoid related problems, it is also suggested that the foundations of epistemology and philosophy of science should be introduced into university teaching.
175 | Proceedings IGLC | July 2017 | Heraklion, Greece

On Epistemology of Construction Engineering and Management
6 REFERENCES
Ballard, H. G. (2000). The last planner system of production control. Doctoral dissertation, The University of Birmingham.
Brown, T. (2008). Design thinking. Harvard Business Review 86(6): 84. Clausing, D. (1994). Total quality development: a step-by-step guide to world class
concurrent engineering. ASME Press, New York. Demian, P. & Fruchter, R. (2006). An ethnographic study of design knowledge reuse in the
architecture, engineering, and construction industry. Research in Engineering Design, 16(4), 184-195.
Downey, G. (2005). Are engineers losing control of technology?: From ‘problem solving’ to ‘problem definition and solution in engineering education. Chemical Engineering Research and Design 83(6): 583-595.
Jaafari, A. (1984). Criticism of CPM for project planning analysis. Journal of Construction Engineering and Management 110(2): 222-233.
Koskela, L. (2017) Why is management research irrelevant? Construction Management and Economics, 35 (1-2), 4-23.
Koskela, L., Rooke, J., Siriwardena, M. (2016) Evaluation of the Promotion of Through-Life Management in Public Private Partnerships for Infrastructure. Sustainability, 8, 552.
Koskela, L., Howell, G., Pikas E. and Dave, B. (2014). If CPM is so bad, why have we been using it so long? 22nd Annual Conference of the International Group for Lean Construction, Oslo. Norway, 25 - 27 July 2014, Akademika forlag. Pp. 27 - 37.
Koskela, L., Sacks, R. and Rooke, J. (2012). A brief history of the concept of waste in production. IGCL 20, 18 - 20 July 2012, San Diego, California, USA.
Losee, J. (2001). A Historical Introduction to the Philosophy of Science. Oxford University Press, New York.
Myers, D. (2004). Construction economics: A new approach. Spon Press, London. OECD. (1972). Eighteenth Annual Report and Resolutions of the Council of Ministers,
European Conference of Ministers of Transport. OECD Publishing, 289 p. Rankine, W. J. M. (1872). A manual of applied mechanics. Sixth ed., revised. Charles
Griffin, London. Ross, S. D. (1951). Plato's Theory of Ideas. Oxford University Press, Oxford. Seely, B. E. (1999). The Other Re-engineering of Engineering Education, 1900–1965.
Journal of Engineering Education, 88, 285-294. Shewhart, W. and Deming, W. (1939). Statistical Method from the Viewpoint of Quality
Control. The Graduate School, the Department of Agriculture, Washington. Shewhart, W. A. (1931). Economic control of quality of manufactured product. D. Van
Nostrand Company, New York. Taguchi, G. & Clausing, D. (1990). Robust quality. Harvard Business Review, 68(1), 65-75. Thomke, S. H. (1998). Managing experimentation in the design of new products.
Management Science, 44(6), 743-762.
176 | Proceedings IGLC | July 2017 | Heraklion, Greece

Laine E., Alhava O., Peltokorpi A., and Seppänen O. (2017). “Platform Ecosystems: Unlocking the Subcontractors’ Business Model Opportunities” In: LC3 2017 Volume II – Proceedings of the 25th Annual Conference of the International Group for Lean Construction (IGLC), Walsh, K., Sacks, R., Brilakis, I. (eds.), Heraklion, Greece, pp.177–184. DOI: https://doi.org/10.24928/2017/0325
PLATFORM ECOSYSTEMS: UNLOCKING THE SUBCONTRACTORS’ BUSINESS MODEL
OPPORTUNITIES
Enni Laine 1, Otto Alhava2, Antti Peltokorpi3, and Olli Seppänen4
Abstract: Platform ecosystems facilitated by the internet are changing the way market mechanisms work. The platform ecosystem business model, using data and network effects, creates new rules for how value is created and delivered. The viral growth characteristic to platform ecosystems has already caused disruption in several industries. The purpose of the research is to explore business opportunities facilitated by the platform ecosystem business model in the construction sector through an example case of a residential building construction. The key concepts and underpinning logics of the platform ecosystem business model are defined. Interactions between the five lean principles and the platform ecosystem concept are reviewed. Finally, an example case of implementation is represented with the help of the platform business model canvas.
Keywords: Lean, platform ecosystem, business model design, network effect, construction industry
1 INTRODUCTION
While several legacy businesses such as transportation, healthcare, energy, and heavy industry have faced fierce competition after the emergence of platforms and lost remarkable market shares to start-ups, the management research over platforms has proliferated (Parker et al 2016, Thomas et al 2014; Porch et al 2015). The way in which platforms change the competition by transforming industries is now identifiable (Parker et al 2016). So far, the construction sector has not been taken over by a platform-based operator, although there is room for competition since all companies use similar business models (Pekuri et al 2013). Moreover, despite nearly a quarter century existence of the International Group for Lean Construction promoting lean principles, the construction sector’s productivity has not improved (Teicholz 2013).
This research maps and analyses platform ecosystem-based business opportunities utilised by Über, Airbnb, Google, and other similar companies from the management research perspective in the context of the construction sector and Lean. The view of a General Contractor is adopted because they have the role of traditional matchmakers called gatekeepers (Parker et al 2016) and are thus most exposed to platform-based competitors often entering the market from outside the traditional industry boundaries (Evans and Schmalensee 2016, Alstyne et al 2016).
1 Doctoral Candidate, Department of Civil Engineering, Aalto University, Finland, [email protected] 2 Chief Technology Officer, Fira Oy [email protected] 3 Assistant Professor, Department of Civil Engineering, Aalto University, Finland,
[email protected] 4 Professor of Practice, Department of Civil Engineering, Aalto University, Finland,
177 | Proceedings IGLC | July 2017 | Heraklion, Greece

Platform Ecosystems: Unlocking the Subcontractors’ Business Model Opportunities
The emergence of platform business models is a result of their overwhelming capacity to remove friction and waste (Evans and Schmalensee 2016), scale without investments (Moazed and Johnson 2016), and increase customer value by utilising network effects (Parker et al 2016, Choudary 2015) and excess capacity (Chase 2015). The theoretical foundations and central concepts of the platform business logics are used to define key aspects of a platform-based business model. The interaction of the key aspects with the Lean principles is further analysed. A residential building project case is analysed to exemplify the use of a platform ecosystem approach as a lean business model to add value for customers and suppliers in the construction sector.
2 PLATFORM BUSINESS MODEL
2.1 Key concepts
Thomas et al. (2014) have defined four platform streams based on the leverage method and architectural openness of the platform structure. They are: 1) organisational platforms, 2) product family platforms, 3) market intermediary platforms, and 4) platform ecosystems. This research focuses on understanding the underlying logic of the platform ecosystem, which is combining the logics from both the product family and the market intermediary streams. The platform ecosystem is architecturally open, orchestrating external resources as providers, producers, and customers. It uses all three different types of leverage methods to allow greater outputs from the available inputs. This is done by recombining shared assets, designs and standards (production leverage), facilitating the creation of new goods and services (innovation leverage), and by manipulating market pricing mechanism and access to reduce friction such as transaction and search costs (transaction leverage). (Thomas et al 2014)
Chase (2015) states that the platforms mobilise value which is hidden to excess capacity by engaging community and their assets, time, expertise, and creativity to collaborate through a participative infrastructure. The control of the overall product or service system is relinquished to a community of users in the roles of producers and consumers. The scaling of the community happens through a positive network effect which is a cycle where an increase of well managed value-creating actions increase the value of the platform which in turn attracts more users, increasing again the value-creating actions (Parker et al 2016, Choudary 2015). As the business logic is based on interaction and open access, coordination is needed for both maximising the value and the ease of use equally for providers and consumers. Control is mandatory for separating the best users from the rest and expelling the poorly behaving ones from the platform (Choudary 2015). Bi-directional rating and reputation mechanisms as well as personalisation of the service are examples of curation for users (Choudary 2015). A governance system is needed for orchestrating the platform in terms of participation management, value division, and resolving conflicts between producers and consumers (Parker et al 2016).
To gain positive network effects and viral growth, it is important to 1) reach critical mass to facilitate value creation (Evans and Schmalensee 2016), 2) take care of real-time customisation, curation and governance to manage the community (Choudary 2015), and 3) ensure that the selected value proposition of the platform is relevant and of high value for the users (Alstyne et al 2016). Choudary (2015) claims that two key components of the platform often neglected by traditional pipe-based businesses, which try to implement a platform concept, are 1) agile response to changing usage patterns and 2) continuous management of the platform health. These and the other underlying key mechanisms of
178 | Proceedings IGLC | July 2017 | Heraklion, Greece
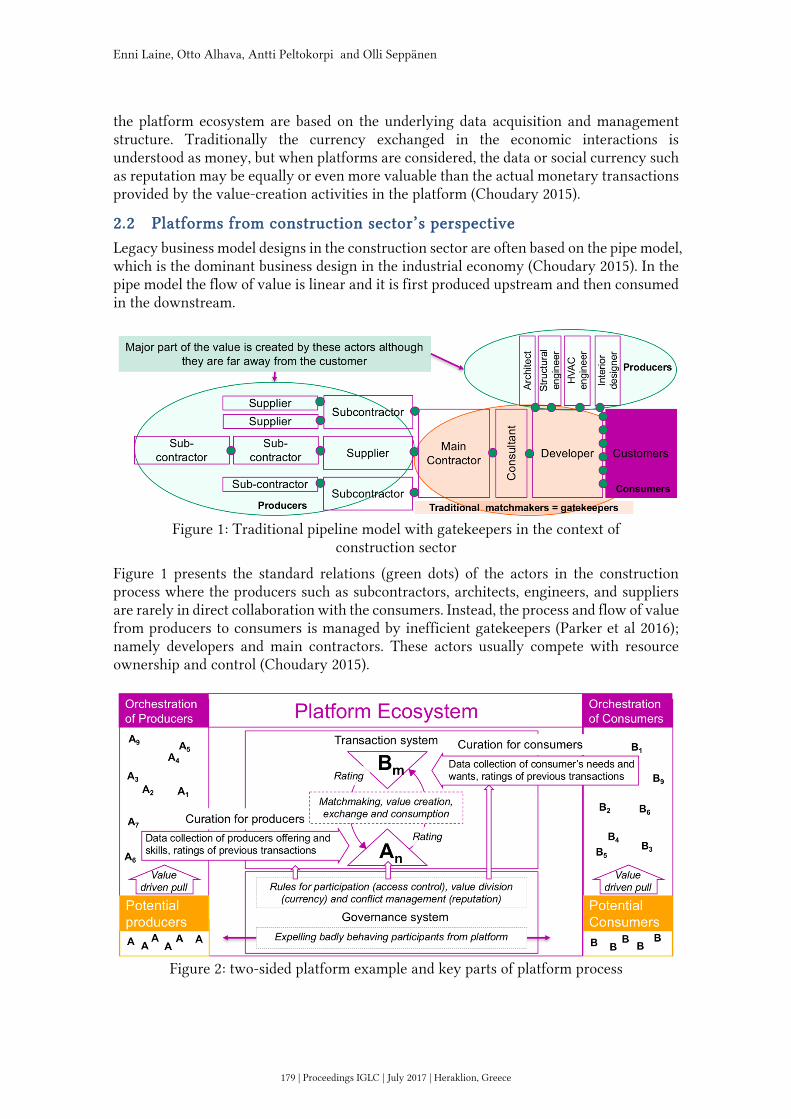
Enni Laine, Otto Alhava, Antti Peltokorpi and Olli Seppänen
the platform ecosystem are based on the underlying data acquisition and management structure. Traditionally the currency exchanged in the economic interactions is understood as money, but when platforms are considered, the data or social currency such as reputation may be equally or even more valuable than the actual monetary transactions provided by the value-creation activities in the platform (Choudary 2015).
2.2 Platforms from construction sector’s perspective
Legacy business model designs in the construction sector are often based on the pipe model, which is the dominant business design in the industrial economy (Choudary 2015). In the pipe model the flow of value is linear and it is first produced upstream and then consumed in the downstream.
Figure 1: Traditional pipeline model with gatekeepers in the context of
construction sector
Figure 1 presents the standard relations (green dots) of the actors in the construction process where the producers such as subcontractors, architects, engineers, and suppliers are rarely in direct collaboration with the consumers. Instead, the process and flow of value from producers to consumers is managed by inefficient gatekeepers (Parker et al 2016); namely developers and main contractors. These actors usually compete with resource ownership and control (Choudary 2015).
Figure 2: two-sided platform example and key parts of platform process
179 | Proceedings IGLC | July 2017 | Heraklion, Greece

Platform Ecosystems: Unlocking the Subcontractors’ Business Model Opportunities
Evans and Schmalensee (2016) argue that many of the formulas of the economics of the traditional business models are not valid when considering platforms. Unlike the pipe model, the platform business model represented in Figure 2 orchestrates value-exchanging interactions between various ecosystem partners (A’s and B’s) simultaneously, while the platform infrastructure utilising data collected through platform is replacing the gatekeepers (Choudary 2015).
Value creation is maximised by matching the most relevant resources from producers (A’s) in the ecosystem with the need of those resources (B’s). An easy plug-and-play connectivity reduces transaction cost by replacing existing expensive lock-in procedures such as the standard tendering process, which according to Hughes et al (2005) accounts for up to 9% of the subcontractors’ annual turnover.
Moazed and Johnson (2016) summarise the delta between the pipeline business model and the platform business model in terms of cost efficiency and scalability: in the pipeline business model, a new user adds a single relationship (sub-contractor in Figure 1) whereas in a platform a new user (“A” in Figure 2) adds on a potential relationship with all the other users (B1, B2, etc.). Therefore, the platform business model replaces the linear pipelines due to a higher cost efficiency and exponential growth potential.
3 PLATFORMS AND LEAN
To understand if and how the platform principles interact with Lean theory, the five principles of Lean introduced by Womack and Jones (1996) are used to review the key concepts of the platform business model. The principles are Value, The Value Stream, Flow, Pull, and Perfection.
Value of goods and/or a service can only be defined by the customer. The concept of value also embeds a principle to improve the performance and delivered quality while the fundamental costs of deliverables are steadily pushed down (Womack and Jones 1996). According to Moazed and Johnson (2016), platforms capture data from each transaction and record bi-directionally the transaction satisfaction of both producers and consumers. This information is further used in the algorithms of the platform to match the most valuable producers with the individual needs of consumers. Also, these platforms reduce costs by removing unnecessary gatekeepers, i.e. pipeline companies. The very essence of platform ecosystem orchestration is in line with value definition.
Value Stream stands for three critical steps: problem solving, information management, and a physical transformation task (Womack and Jones 1996). The Value Stream is an approach in the pipeline system whereas the platform, although aiming to solve customer problems in a desired way, does not work as the Value Stream but rather as a value network. The platforms only flourish if they succeed in matching the right producer for the consumer and delivering maximised value for them both (Parker et al 2016). Therefore, they are in line with the lean principle.
The third lean principle is Flow. Lean organisations focus on a steady flow from one activity to another without interruptions. The platform ecosystem replaces entire companies, i.e., gatekeepers, from the value chain when they introduce a new business model, which removes end-to-end friction from a market of pipeline companies (Parker et al 2016). Platform ecosystems extend the concept of flow from the individual company and the individual project to the ecosystem level.
The fourth principle, Pull, is embedded in the platform logic. A successful platform creates a network effect, which increases the value of the platform for each participant of the platform every time a new producer or a new consumer plugs-in to the platform and
180 | Proceedings IGLC | July 2017 | Heraklion, Greece

Enni Laine, Otto Alhava, Antti Peltokorpi and Olli Seppänen
increases the double-sided pull. A platform owner balances the demand and supply by adjusting the pricing. (Evans and Schmalensee 2016)
The platform business model is a powerful tool for Perfection. Platform ecosystems compete not only with pipelines but other platforms. In the future, it will be more common for consumers or producers to be engaged in more than one similar platforms (Parker et al 2016). These multi-homing participants will foster Perfection. The real-time feedback cycle with the big data management enforces the community to act against waste, while the governance system prevents bad behaviour (Choudary 2015). The continuous strive towards Perfection is built-in to the curation processes and governance systems of platforms.
All five Lean principles are naturally embedded in the success factors of the platform ecosystem. Especially Flow, while it is a key factor for a successful construction project, needs to be further addressed as it has not been sufficiently addressed by the current gatekeepers. Overall, platforms highlight the importance of understanding and embracing of customer value, which according to Pekuri et al. (2013) has been long overlooked by the construction sector.
Moreover, while it has many useful aspects to support the Lean implementation, the platform ecosystem is a new concept for the Lean Construction community. When searching the IGLC conference paper database with the term “platform ecosystem”, no results appear. However, the search "platform" returns 13 results. In two cases the platform is used in the context of the production family platform (Jensen et al 2013, Kalsaas 2013). In three other cases a software platform facilitating real time information sharing was discussed (Azambuja et al 2013, Dave et al 2010, Faloughi et al 2014) but these software platforms, although considered an essential part of a well-functioning platform ecosystem, do not alone comply with the platform ecosystem framework. The rest of the papers utilised the term “platform” in a different context than the one used in this research.
4 CASE STUDY: RED VELVET ROSE WALLPAPER
4.1 Case description
A restriction of the conventional value creation mechanism utilised in the legacy pipeline based construction process is demonstrated by a customer change example. A buyer of an apartment (customer) finds a developer’s wallpaper selection unsatisfactory. The developer’s assortment, although designed to provide alternatives to the customer, is limited due to standardisation. The rationale for the standardisation from the developer's perspective is to reduce additional transaction costs and variation in the process caused by the customers’ change requests.
Instead of selecting from the standard assortment, the customer requests for red velvet rose wallpaper from a specific producer, which is not available through regular purchasing channels. A negotiation on how to proceed with a non-standard change request is conducted within the production pipeline. It is agreed that if the customer will purchase and deliver the material, a sub-contractor can install it.
Figure 3 presents the communication flow of the change request through the pipeline process. When the change request is analysed from the gatekeeper's perspective, it is often only considered waste or variation that should be minimised to ensure the flow in the process. However, when observed from the consumer’s perspective, the completion of the request is of high value.
181 | Proceedings IGLC | July 2017 | Heraklion, Greece
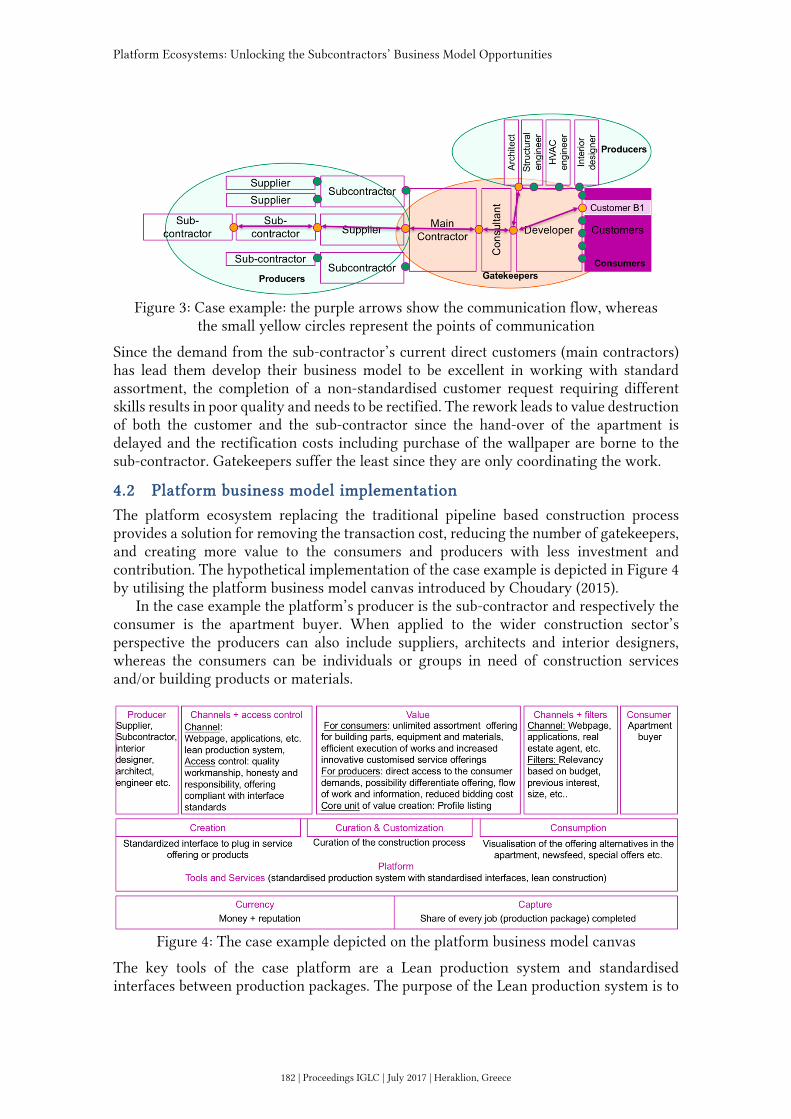
Platform Ecosystems: Unlocking the Subcontractors’ Business Model Opportunities
Figure 3: Case example: the purple arrows show the communication flow, whereas
the small yellow circles represent the points of communication
Since the demand from the sub-contractor’s current direct customers (main contractors) has lead them develop their business model to be excellent in working with standard assortment, the completion of a non-standardised customer request requiring different skills results in poor quality and needs to be rectified. The rework leads to value destruction of both the customer and the sub-contractor since the hand-over of the apartment is delayed and the rectification costs including purchase of the wallpaper are borne to the sub-contractor. Gatekeepers suffer the least since they are only coordinating the work.
4.2 Platform business model implementation
The platform ecosystem replacing the traditional pipeline based construction process provides a solution for removing the transaction cost, reducing the number of gatekeepers, and creating more value to the consumers and producers with less investment and contribution. The hypothetical implementation of the case example is depicted in Figure 4 by utilising the platform business model canvas introduced by Choudary (2015).
In the case example the platform’s producer is the sub-contractor and respectively the consumer is the apartment buyer. When applied to the wider construction sector’s perspective the producers can also include suppliers, architects and interior designers, whereas the consumers can be individuals or groups in need of construction services and/or building products or materials.
Figure 4: The case example depicted on the platform business model canvas
The key tools of the case platform are a Lean production system and standardised interfaces between production packages. The purpose of the Lean production system is to
182 | Proceedings IGLC | July 2017 | Heraklion, Greece

Enni Laine, Otto Alhava, Antti Peltokorpi and Olli Seppänen
facilitate flow of the process. The production packages and interfaces divide the works into pieces small enough to manage which further enables providers to create diversified offerings. All basic platform principles including the real-time customisation, curation and governance as well as controlled standard access channels through webpages and mobile applications need to be in place. The access of the producers is controlled by construction professionals to ensure the quality and relevancy for the consumers whereas the services and products offered to the consumers are filtered based on their interests and prior behaviour on the platform.
The value of the platform for the producers includes 1) efficient resource allocation matching the consumer needs, 2) continuous flow of activities and standardised interfaces, 3) just-in-time delivery of consistent information facilitated by advanced data management, and 4) minimised tender costs with plug-and-play access to the platform. Moreover, the direct interaction between consumers and producers unlocks the unmet demand for customised offering enabling producers to diversify both their offering and business model design. The value proposition for the customer is thus composed of a personalised, high quality, low price apartment combined with a shorter throughput time of the work and diversified offering from the various producers. Additionally, the platform has potential to open new business opportunities to innovative producers that are unable to provide any services for the consumers in the existing market environment dominated by legacy pipeline process.
The main currencies that are exchanged as a result of value-creating actions are money and the reputation of the users. The capture, i.e. the return of investment, for the platform owner is composed of two main components: the data collected on the platform and money. The operator takes a cut of each transaction whenever money is exchanged through the platform. The underlying collection and orchestration of the data necessary for governance, curation, and filtering purposes facilitates the further potential advantages of the platform business model. The real time social feedback cycle works as a powerful distributed quality control quickly revealing mechanisms resulting in poor quality construction work. Moreover, the monetisation opportunities of the data gathered by the platform are unthinkable for the legacy construction process actors.
5 RESEARCH LIMITATIONS This research is based on a literature study and an exemplary case. The target of the case is first to demonstrate a failure of the value creation mechanism utilised by the prevailing pipeline-based business model in the Finnish construction sector. Secondly, it hypothesises a few aspects of platform ecosystem’s value creation potential in the construction sector. To test and implement a platform ecosystem based business model in the construction sector, further research is needed.
6 CONCLUSIONS This paper demonstrates through an example that there is space for improvement in value creation in the construction process. The platform ecosystem has the potential to work as a tool to develop leaner practices in the sector. However, it was also noted that although the key platform principles are in line with Lean principles, the platform concept as such does not sufficiently address all of them. It is crucial to develop a platform architecture that enables and supports the flow of concurrent and sequential value-creating activities needed in construction projects. To conclude, acknowledging the limited scope of this
183 | Proceedings IGLC | July 2017 | Heraklion, Greece

Platform Ecosystems: Unlocking the Subcontractors’ Business Model Opportunities
research it is recommended that platform ecosystems are studied further within the construction community.
7 REFERENCES
Alstyne, M.W., Parker, G.G., and Choudary, S.P. (2016) Pipelines, Platforms, and the New Rules of Strategy. Harward Business Review, 94(4), pp.54-62
Azambuja, M., Schnitzer, T., Sahin, M., and Lee, F. (2013) Enabling Lean Supply with a Could Computing Platform - An Exploratory Case Study. In: Formoso, C.T. & Tzortzopoulos, P., 21th Annual Conference of the International Group for Lean Construction. Fortaleza, Brazil, 31-2 Aug 2013, pp. 205-214
Chase, R. (2015) Peers Inc: How People and Platforms Are Inventing the Collaborative Economy and Reinventing Capitalism. Public Affairs, New York.
Choudary, S.P. (2015) Platform Scale: How a new breed of startups is building large empires with mimimum investment. Singapur. Platform thinking labs.
Dave, B. , Boddy, S. & Koskela, L. (2010). Improving Information Flow Within the Production Management System With Web Services In:, Walsh, K. & Alves, T., 18th Annual Conference of the International Group for Lean Construction. Haifa, Israel, 14-16 Jul 2010. pp 445-455
Evans, D.S, and Schmalensee, R. (2016/1). Matchmakers: The New Economics of Multisided Platforms. Harward Business Review Press.
Faloughi, M., Bechara, W., Chamoun, J., and Hamzeh, F. (2014) Simplean: An Effective Tool for Optimizing Construction Workflow. In:, Kalsaas, B.T., Koskela, L. & Saurin, T.A., 22nd Annual Conference of the International Group for Lean Construction. Oslo, Norway, 25-27 Jun 2014. pp 281-292
Hughes, W., Greenwood, D., and Hillebrandt P. (2005). Impact of Procurement Method on Costs of Procurement in Globak Perspectives in Kähkönen, K. & Porkka J. Management and Economics in the AEC Sector. VTT Technical Research Center of Finland, pp.214-226.
Jensen, P., Larsson, J., Simonsson, P., and Olofsson, T. (2013) Improving Buildability with Platforms and Configurators
Kalsaas, B.T. (2013) Improving Buildability with Platforms and Configurators Moazed, A. and Johnson, N.L. (2016). Modern Monopolies: What It takes to Dominate the
21st Century Exonomy. St. Martin’s Press. Parker, G., Van Alstyne, M.W., Choudary S.P. (2016). Platform Revolution: How
networked markets are transforming the economy – and how to make them work for you. WW Norton & Company.
Pekuri, A., Pekuri, L., and Haapasalo, H. (2013). The Role of Business Models in Finnish Construction Companies. Construction Economics and Building, 13(3), pp.13-23
Porch, C.,Timbrell, G., and Rosemann, M. (2015) Platforms: A Systematic Review of The Literature Using Algorithmic Historiography, IN ECIS 2015 Proceedings. Paper 143. Available at: http://aisel.aisnet.org/ecis2015_cr/143 , [Accessed 16th Jan. 2017]
Teicholz P. (2013) “Labor-Productivity Declines in the Construction Industry: Causes and Remedies (Another Look)” AECbytes Viewpoint #67, March 14, 2013.
Thomas, L.D., Autio, E., and Gann, D.M. (2014). Architectural leverage: putting platforms in context. The Academy of Management Perspectives, 28(2), pp. 198-219, doi:10.5465/amp.2011.0105.
Womack, J.P., and Jones, D.T. (1996). Lean Thinking: Banish waste and create wealth in your corporation. Simons & Schuster, Inc.
184 | Proceedings IGLC | July 2017 | Heraklion, Greece

Murata K., Tezel A., Koskela L., and Tzortzopoulos P. (2017). “An Application of Control Theory to Visual Management for Organizational Communication in Construction” In: LC3 2017 Volume II – Proceedings of the 25th Annual Conference of the International Group for Lean Construction (IGLC), Walsh, K., Sacks, R., Brilakis, I. (eds.), Heraklion, Greece, pp.185–191. DOI: https://doi.org/10.24928/2017/0346
AN APPLICATION OF CONTROL THEORY TO VISUAL MANAGEMENT FOR ORGANIZATIONAL COMMUNICATION IN CONSTRUCTION
Koichi Murata1, Algan Tezel2, Lauri Koskela3, and Patricia Tzortzopoulos4
Abstract: Insufficient process transparency is one of the main reasons for process waste, quality deviations and safety non-conformances in construction. Lean Production frequently resorts to a range of visual communication strategies called Visual Management (VM) to increase the level of process transparency and to support continuous improvement at the workplace. Although VM is a fundamental part of the Lean toolbox, theoretical or empirical studies on the role of VM in team activities are scarce. This study explores VM in construction through a block diagram used in control theory. Two VM tools for construction teams from construction companies in the UK and Japan are analysed in detail. The initial findings suggest that VM can and must cover various communication levels in construction organizations in order to break the barriers for information flows and to share valuable and newest knowledge.
Keywords: Lean construction, Visual management, Communication, Control theory.
1 INTRODUCTION
Despite the rapid advent of digital visualization technologies in construction, conventional visual tools, an information board or an idea generation post-it, have also been utilized to cover the functions which the IT-based visualization cannot effectively present. This type of conventional visual tools are often utilized to improve process transparency. There are many studies on the role of conventional VM in factory management in the manufacturing industry (Greif 1991, Mestre 2000). Although similar research for the construction industry (Murata 2015, Tezel 2015 and Tjell 2015) has recently increased in the context of lean construction, there is a need for further understanding of VM in construction to help constitute a VM theory and to guide construction practitioners who design and install VM tools in their work environments. Based on this recognition, this paper aims at the introduction of a generic theoretical approach to VM as well as at the demonstration of its application to construction.
The paper is structured as follows. The following section presents the adopted theoretical and methodological approach to VM. Next, the characteristics of communication in the construction industry are analyzed, and based on this analysis and
1 Associate Professor, College of Industrial Technology, Nihon University, Chiba, JAPAN,
[email protected] 2 Researcher, School of Art, Design and Architecture, University of Huddersfield, Huddersfield, UK,
[email protected] 3 Professor of Construction and Project Management, University of Huddersfield, Huddersfield, UK,
[email protected] 4 Professor, School of Art, Design and Architecture, University of Huddersfield, Huddersfield, UK,
185 | Proceedings IGLC | July 2017 | Heraklion, Greece
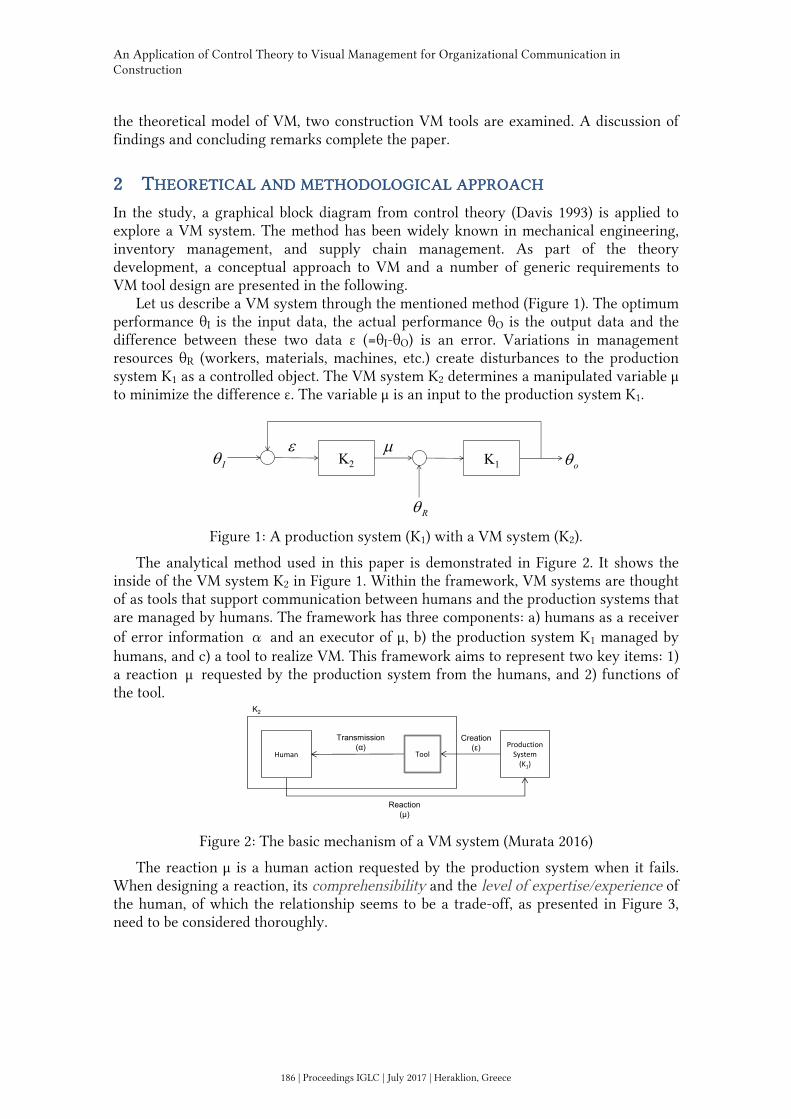
An Application of Control Theory to Visual Management for Organizational Communication in Construction
the theoretical model of VM, two construction VM tools are examined. A discussion of findings and concluding remarks complete the paper.
2 THEORETICAL AND METHODOLOGICAL APPROACH
In the study, a graphical block diagram from control theory (Davis 1993) is applied to explore a VM system. The method has been widely known in mechanical engineering, inventory management, and supply chain management. As part of the theory development, a conceptual approach to VM and a number of generic requirements to VM tool design are presented in the following.
Let us describe a VM system through the mentioned method (Figure 1). The optimum performance θI is the input data, the actual performance θO is the output data and the difference between these two data ε (=θI-θO) is an error. Variations in management resources θR (workers, materials, machines, etc.) create disturbances to the production system K1 as a controlled object. The VM system K2 determines a manipulated variable µ to minimize the difference ε. The variable µ is an input to the production system K1.
Figure 1: A production system (K1) with a VM system (K2).
The analytical method used in this paper is demonstrated in Figure 2. It shows the inside of the VM system K2 in Figure 1. Within the framework, VM systems are thought of as tools that support communication between humans and the production systems that are managed by humans. The framework has three components: a) humans as a receiver of error information α and an executor of µ, b) the production system K1 managed by humans, and c) a tool to realize VM. This framework aims to represent two key items: 1) a reactionµrequested by the production system from the humans, and 2) functions of the tool.
Figure 2: The basic mechanism of a VM system (Murata 2016)
The reaction µ is a human action requested by the production system when it fails. When designing a reaction, its comprehensibility and the level of expertise/experience of the human, of which the relationship seems to be a trade-off, as presented in Figure 3, need to be considered thoroughly.
Iq oq
Rq
K2 K1µe
Tool
Transmission(α)
Reaction(μ)
Creation(ε)
K2
HumanProductionSystem(K1)
186 | Proceedings IGLC | July 2017 | Heraklion, Greece

Koichi Murata, Algan Tezel, Lauri Koskela and Patricia Tzortzopoulos
Figure 3: Relationship between expertise/ experience level and indicated
information level
For the second item, two tool functions, namely creation of information ε and transmission of information α, need to be designed. In the first function, a visualized item created by the production system is designed and sent from the system to a tool. When designing this function, the non-ordinariness and continuity of the created information need to be considered. The non-ordinariness needs to be designed to notice when a visualized item needs to be created. When the production system is in the ordinary condition, the tool is not required to work. This tool’s important role is to handle a special situation within a production system. With regard to continuity, the tool must have a structure to monitor the typical conditions of the production system in order to grasp special situations at any time as they arise. In the second function, the visualized and created items are provided from the tool to a manager or an operator. When designing this function, the inducibility and immediacy of the delivered visualized item need to be considered. With regard to the former, the tool needs to have appeal for operators because their physical and mental condition may not always be stable. In order to improve the capability of inducibility in the tool, it is necessary to build a device that attracts the operator's attention to the tool. With regard to the latter, the timing of delivery of the created visualized item has to be when an immediate reaction is required to the prevailing condition of the production system.
Two VM systems, from the UK and Japan, are analysed using the following three research questions related to the model shown in Figure 2.
1. What are the three components? 2. What do the managed system require of you when it fails? 3. How do you visualize?
- What do you visualize? - How do you design a device to attract attention?
3 ANALYSIS OF VM SYSTEMS
3.1 Nested Communications in Construction Industry
Construction projects are executed at the same time and in different locations. Many different specialists join one project according to the plan progressing by turns. While the former causes a geographical boundary, the latter draws out a temporal boundary for communication. This two-boundary structure has other structures nesting inside it. Each
Low
Warning to informoccurrence of problem
HighC
ompr
ehen
sibi
lity
of
a re
actio
nLevel of expertise/
experience of the human
Answer to solveproblem
187 | Proceedings IGLC | July 2017 | Heraklion, Greece

An Application of Control Theory to Visual Management for Organizational Communication in Construction
structure involves each worksite of each project at present. The characteristics of communication in the construction industry is shown in Figure 4.
Figure 4: Nested structure model of communications in the construction industry
Two analysed VM tools shown in Figure 5 are 1) a daily communication tool among project members and 2) a report method at one company for the worksite, local office and the head office. The first investigated object, which is used to break a temporal boundary for communication, is from a major improvement project in England’s strategic highways network. The second object, which is used to break a geographical boundary for communication, is from an information sharing system used in a construction company located in Japan.
Figure 5: Schematic illustration of the two VM systems
3.2 The first VM System
A progress chart is used as an important tool for daily communication, in order to draw the plan of a project, to ascertain whether it has progressed as scheduled or not, and to re-schedule it, if it is late. The UK company have been using some progress charts, and it was found by observation that their design procedure consists of three selection steps explained as follows.
The first selection is how to make a progress chart as the base to comprehensively manage a project on a worksite. One option is an object drawn directly on a whiteboard. The other option is an object printed from a scheduling software. The initial design of the former and its continuous customization are definitely laxer than the latter, of which the format is fixed but which is easy to print.
The second selection is a time schedule like a Gantt chart or with the diagram of a structure plan. Regarding both alternatives, the length of a term of a project indicated in a time chart needs to be decided, for instance, one day, one week or two weeks and so on. In some cases, time charts are also used with strings in the case company. The length and the slope of each string express the length of one process and the degree of its progress. Colourful magnets are also put to represent construction machines and
You
Yourworksite
Tomorrow's You
Head office
Yourproject
・ ・ ・
Otherproject
Temporal boundaryAt present Next term
Geographical boundary
Other specialist
System 1
Report for preset condition of a project
1. Progress2. Cost3. Quality4. Safety5. Environmental
Judge Comment
Work-site
Localoffice headoffice
A manager at work-site
System 2 System 3
Present a project result
Associated companies’ members
Time schedule To-do list
188 | Proceedings IGLC | July 2017 | Heraklion, Greece

Koichi Murata, Algan Tezel, Lauri Koskela and Patricia Tzortzopoulos
materials on the board. The latter will be better in a case that a finished product is difficult to imagine because of the phased progress of processes in a long-term project.
A whiteboard for a To-do list is added next to a progress chart in the third selection. The discussion of prompt action with the direct-writing onto the To-do list is considered as efficient management with a process chart. The addition of an application rule of the whiteboard is necessary to continuously prevent the emasculation of it. Coloured post-it notes and/or colourful marker pens are also useful to promote problem-solving.
3.3 The second VM System
Construction projects in the case company in Japan are managed by three actors; managers at the work-site, local offices, and head office. The managers at the work-sites actually execute the construction projects. They must report the project progress to the local offices, to which each of them belongs, every month.
In this report, they describe the present condition of their projects from six viewpoints: plan progress, cost, quality, safety, environment, and others. They also evaluate each item with three colours: green, yellow, and red, similarly to the andon, the Japanese word for a stack light with several colours to support just-in-time operation. Green means that the project performance is on track. Yellow means that the project is susceptible to problems (problems are expected). Red means that the project has problems in the corresponding measurement parameter. The local offices evaluate the present condition of a project coming in through the report and send it to the head office. The head office performs a final evaluation and decides on a support level, which consists of three levels. The first level (green) designates keeping watch on a project. The second level (yellow) requires support from an expert on a problem that needs to be solved. The third level (red) requires support from a team of experts on a problem that needs to be solved. The execution of the performance reporting is similar to the andon system.
4 DISCUSSION
The comparison of the analysed results of the two tools are summarized in Figures 6 and 7.
As for the analysis of the first tool, the type of the production system is a worksite (K1). The human attribute is project members. The VM system is a progress chart used as a daily communication tool (K2). The reaction (µ) from the project members to the worksite is designed to deliver quick and adequate actions for the project at the worksite level. The design of the two functions to create information (ε) and transit of the created information (α) performs in the three selections described in Section 3.2. The items visualized in the former function are the progress of a project, the length of the term of a project, the diagram of a structure plan, machines, materials, and a To-do list. The base to transit the visualised items in the latter function is an object drawn directly on the whiteboard or an object printed from a scheduling software. There are many visual artefacts such as a time chart, the diagram, a drawing, a picture, a photograph, a string, colourful magnets, colourful post-it notes, colourful marker pens, and a direct-writing on the base.
189 | Proceedings IGLC | July 2017 | Heraklion, Greece
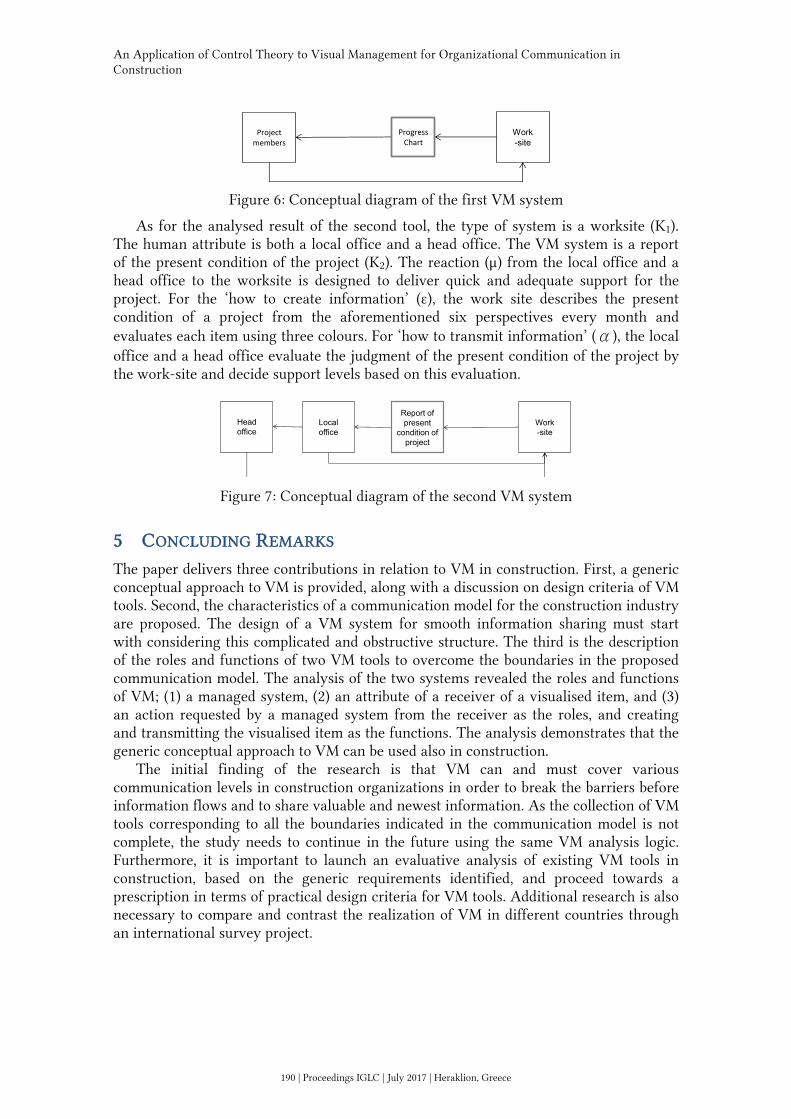
An Application of Control Theory to Visual Management for Organizational Communication in Construction
Figure 6: Conceptual diagram of the first VM system
As for the analysed result of the second tool, the type of system is a worksite (K1). The human attribute is both a local office and a head office. The VM system is a report of the present condition of the project (K2). The reaction (µ) from the local office and a head office to the worksite is designed to deliver quick and adequate support for the project. For the ‘how to create information’ (ε), the work site describes the present condition of a project from the aforementioned six perspectives every month and evaluates each item using three colours. For ‘how to transmit information’ (α), the local office and a head office evaluate the judgment of the present condition of the project by the work-site and decide support levels based on this evaluation.
Figure 7: Conceptual diagram of the second VM system
5 CONCLUDING REMARKS The paper delivers three contributions in relation to VM in construction. First, a generic conceptual approach to VM is provided, along with a discussion on design criteria of VM tools. Second, the characteristics of a communication model for the construction industry are proposed. The design of a VM system for smooth information sharing must start with considering this complicated and obstructive structure. The third is the description of the roles and functions of two VM tools to overcome the boundaries in the proposed communication model. The analysis of the two systems revealed the roles and functions of VM; (1) a managed system, (2) an attribute of a receiver of a visualised item, and (3) an action requested by a managed system from the receiver as the roles, and creating and transmitting the visualised item as the functions. The analysis demonstrates that the generic conceptual approach to VM can be used also in construction.
The initial finding of the research is that VM can and must cover various communication levels in construction organizations in order to break the barriers before information flows and to share valuable and newest information. As the collection of VM tools corresponding to all the boundaries indicated in the communication model is not complete, the study needs to continue in the future using the same VM analysis logic. Furthermore, it is important to launch an evaluative analysis of existing VM tools in construction, based on the generic requirements identified, and proceed towards a prescription in terms of practical design criteria for VM tools. Additional research is also necessary to compare and contrast the realization of VM in different countries through an international survey project.
ProgressChart
Projectmembers
Work-site
Report of present
condition of project
Work-site
Localoffice
Headoffice
190 | Proceedings IGLC | July 2017 | Heraklion, Greece
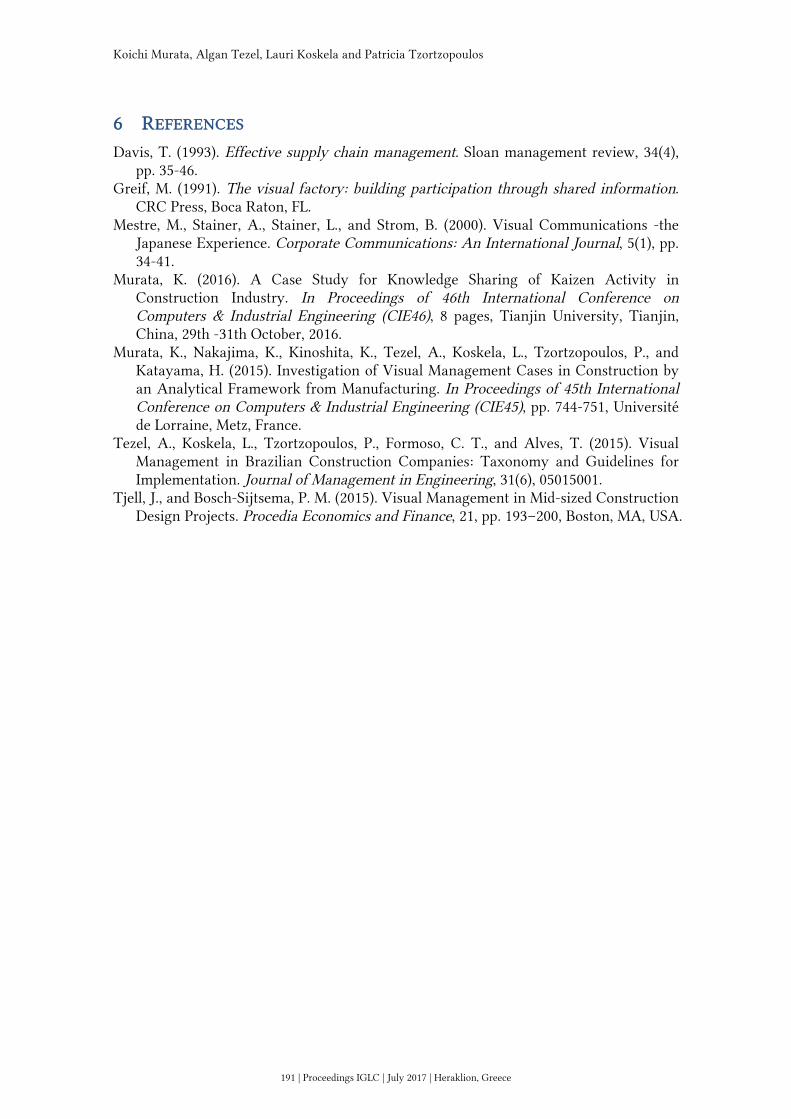
Koichi Murata, Algan Tezel, Lauri Koskela and Patricia Tzortzopoulos
6 REFERENCES
Davis, T. (1993). Effective supply chain management. Sloan management review, 34(4), pp. 35-46.
Greif, M. (1991). The visual factory: building participation through shared information. CRC Press, Boca Raton, FL.
Mestre, M., Stainer, A., Stainer, L., and Strom, B. (2000). Visual Communications -the Japanese Experience. Corporate Communications: An International Journal, 5(1), pp. 34-41.
Murata, K. (2016). A Case Study for Knowledge Sharing of Kaizen Activity in Construction Industry. In Proceedings of 46th International Conference on Computers & Industrial Engineering (CIE46), 8 pages, Tianjin University, Tianjin, China, 29th -31th October, 2016.
Murata, K., Nakajima, K., Kinoshita, K., Tezel, A., Koskela, L., Tzortzopoulos, P., and Katayama, H. (2015). Investigation of Visual Management Cases in Construction by an Analytical Framework from Manufacturing. In Proceedings of 45th International Conference on Computers & Industrial Engineering (CIE45), pp. 744-751, Université de Lorraine, Metz, France.
Tezel, A., Koskela, L., Tzortzopoulos, P., Formoso, C. T., and Alves, T. (2015). Visual Management in Brazilian Construction Companies: Taxonomy and Guidelines for Implementation. Journal of Management in Engineering, 31(6), 05015001.
Tjell, J., and Bosch-Sijtsema, P. M. (2015). Visual Management in Mid-sized Construction Design Projects. Procedia Economics and Finance, 21, pp. 193–200, Boston, MA, USA.
191 | Proceedings IGLC | July 2017 | Heraklion, Greece

192 | Proceedings IGLC | July 2017 | Heraklion, Greece
Nascimento Da Silva, M., and Miron, L. (2017). “Hierarchy of Value Perceived by Groups of Users About Their Neighbourhood” In: LC3 2017 Volume II – Proceedings of the 25th Annual Conference of the International Group for Lean Construction (IGLC), Walsh, K., Sacks, R., Brilakis, I. (eds.), Heraklion, Greece, pp. 193–200. DOI: https://doi.org/10.24928/2017/0186
HIERARCHY OF VALUE PERCEIVED BY GROUPS OF USERS ABOUT THEIR NEIGHBOURHOOD
Michelle Nascimento da Silva 1 and Luciana Inês Gomes Miron 2
Abstract: The value perceived by the client is a concept that has attracted a growing interest among Lean Construction researchers. The perceived value, associated with the Means-End Chain Model and the laddering technique, has allowed for the understanding of the personal values influence on the users’ perception of value. The application of this concept regarding the built environment on the neighbourhood, scale has the potential for contributing to the concept of value consolidation. The aim of this paper is to identify and compare the perception of value of two user groups of a neighbourhood. The research strategy adopted was case study. The main study contributions refer to the contribution of the perception of value knowledge in the complex relationship between users and the built environment.
Keywords: perceived value, personal values, means-end chain, laddering, neighbourhood.
1 INTRODUCTION
The application of the perceived value concept has attracted the interest of a number of Lean Construction researchers (Santos et al. 2004; Lima et al. 2009; Miron and Formoso 2010; Bonatto et al. 2011; Brito and Formoso 2014; Peltokorpi et al. 2016) due to its potential for contributing to the consolidation of the concept of value. Woodruff and Gardial (1996) state that the value perceived by the client is “the consumer perception on what they want to happen in a specific situation of use, with the help of a product or a service offer, in the sense of reaching a proposal or goal.”
In a wider context, built environment researchers have identified the value perceived by their clients as a relevant concept, backed up by extensive research related to definition, understanding and the attempt at measuring the perception of value by the clients and users (Coolen and Hoekstra 2001; Coolen 2006; Miron and Formoso 2010; Zinas and Jusan 2010; Bonatto et al. 2011; Kowaltowski and Granja 2011; Zinas 2013; Brito and Formoso 2014; Hentschke et al. 2014). Most of these investigations have adopted approaches of the marketing field as a reference. In these investigations, the perceived value has been associated with the concept of personal values, which results from social psychology (Rokeach 1973).
Despite the potential of this approach for value perception analysis of users and clients, there is still a lack of research focusing on the built environment on the neighbourhood scale. Most of the existing studies on the built environment has focused on the scale of buildings. The neighborhood scale has a greater complexity because of the number of different typologies of buildings, infrastructure and large number of users (residents,
1 PhD Student, Programa de pós-graduação em Planejamento Urbano e Regional (PROPUR) Federal
University of Rio Grande do Sul, Brazil, [email protected] 2 PhD, Associate Professor, School of Architecture, Department of Architecture, Federal University of
Rio Grande do Sul, Brazil, [email protected]
193 | Proceedings IGLC | July 2017 | Heraklion, Greece

Hierarchy of Value Perceived by Groups of Users About Their Neighbourhood
traders and frequenters. Besides this, the personal values dimension (Rokeach 1973; 1981) has not been properly explored in the investigations related to the built environment.
The built environment ‘neighbourhood’ can be understood by its plurality of usages, users, and stakeholders, as well as by the coexistent negotiations and conflicts resulting from this overlapping of interests. Thus, the neighborhood has been presenting itself as a problem of use management of great complexity. Considering this, the investigations on the perception of value in neighbourhoods has the potential for contributing to the knowledge of value generation in the complex relationship between users and the built environment.
This paper reports part of a master's degree research in which one of the research questions was: what are the relationships between personal values and the perception of value of user groups (residents and traders) of a neighbourhood? Because of the absence of identified knowledge, taking the Means-end Chain Model as a theoretical base, this paper aims at identifying and comparing the perception value of two user groups of a neighbourhood. Identification is understood as the deployment of the relations between the personal values and the perception of value by the user groups.
2 PERCEPTION OF VALUE AND PERSONAL VALUES
2.1 Means-End Chains and the Hierarchy of Perceived Value for the User
The examples of the marketing field research that contribute to the understanding of the perceived value by the clients and users are the Means-End Chain Models (Gutman 1982; Reynolds and Gutman 1988) and the hierarchy of perceived value (Woodruff and Gardial 1996; Woodruff 1997). Strongly based on the Means-end Chain Model proposed by Gutman (1982), Wooddruff and Gardial (1996) organized the hierarchy of value model, which proposes that the clients' perception can be presented through a value hierarchical model with three levels of interconnected abstraction: the product attributes, the consequences of the use of a particular product and its user's personal values.
According to Gutman, a widely applied method to build Means-End Chains is the laddering technique. In this technique, beginning with in-depth interviews, clients (consumers, users) translate the products' attributes into their resulting consequences, and the consequences are, in turn, translated into personal values orientation (Gutman 1982). Through the laddering technique, it is possible to identify the client's (user's) web of meaning. The constructs are directly connected and form a hierarchy: attributes, consequences and values (A-C-V). This hierarchy can be represented by ladders, which facilitate the understanding of the connection between the more concrete levels (attributes) to the more abstract ones (consequences and values). The ladders assist in the subject’s (user's) mapping of the hierarchy of value (HVM).
2.2 Personal Values
The concept of personal values was presented in investigations of the sociology field (Thomas and Znaniecki 2004), and also those of anthropology (Kluckhohn 1968). In the domain of social psychology, Rokeach (1973) and Schwartz (1992) are the most cited authors in the organization of theories on personal values. The studies coming from these different knowledge areas have affected marketing research on the perception of value. In this regard, Woodruff (1997) states that the client's (user's) perception of value is associated with personal values. Woodruff (1997) defines the personal values as being lasting, relatively stable, intrinsic beliefs that consist of mental representations of need,
194 | Proceedings IGLC | July 2017 | Heraklion, Greece

Michelle Nascimento da Silva and Luciana Inês Gomes Miron
and which are used by subjects as a base for equating decision and conflict processes. Moreover, these 'needs' help to explain why consumers make decisions (purchase and consumption) differently (Woodruff 1997).
Rokeach (1973) distinguishes personal values into instrumental (means) and terminal (ends) values. According to the author, this difference between personal values makes it possible to consider the existence of a functional relationship between the terminal and instrumental values. For Rokeach (1981), the terminal values are the favourite final states of existence; on the other hand, the instrumental values are the favourite social conduct and behaviour modes to achieve personal goals. The difference between personal values is relevant because it is employed in the stratification of the hierarchy of value. In the marketing field, personal values have been studied because they affect the perception of value in product use and purchase. In the built environment, personal values could help to understand the client´s perceived value, as well as the attributes that can generate value in a project. In the environment built on a neighbourhood scale, the influences of personal values on the users' perception of value can help in the negotiation of conflicts related to neighbourhood management.
3 RESEARCH METHOD
The research strategy adopted was case study because a contemporary phenomenon within its real-life context was investigated; where the boundaries between phenomenon and context are not clearly evident; and in which multiple sources of evidence were used (Yin 1994). The research was made in the Cidade Baixa neighbourhood in the city of Porto Alegre, southern Brazil. In this neighbourhood, the Town Hall formed a Work Group (WG) with the aim of equating the conflicts of interest between two user groups: residents and traders. Nightlife noise was the main conflict negotiated between the user groups. The WG, through a municipal decree, readjusted the working hours of the night trading places (bars, restaurants, coffeehouses, and diners). The nocturnal activities (gastronomy and entertainment) are important and profitable for traders, but they generate noise and disturb the rest time of the residents. The selection of these two user groups was based on the engagement of both in the negotiation of the conflict regarding neighbourhood management. All users involved in the negotiations were part of associations (residents or traders).
Table 1: User Groups, Population and Sample Collected.
User Groups Number and Type Population (N) Collected Sample (n)
Residents
Traders
90 residential units 90 7
67 trade facilities 67 6
To define the sample collected, the population, the response saturation and the time required for the research development were considered. The population was considered as: the number of all engaged residents (members of residents' associations) and the number of all engaged traders (members of traders' associations). The respondent selection was made based on a simple random sample. Saturation was considered according to Coolen and Hoekstra (2001): "when the interviews do not produce any new information one stops
195 | Proceedings IGLC | July 2017 | Heraklion, Greece

Hierarchy of Value Perceived by Groups of Users About Their Neighbourhood
the interviewing because the exploration process is saturated". Table 1 presents the user groups, population, and sample collected.
The perception of value of both groups was presented through the application of the laddering technique and HVM. The laddering technique was applied in two crucial steps: 1) data collection and b) analysis and interpretation results.
The data collection was made between October and November 2013. A semi-structured in-depth interviewing script was organized in which the following constructs were addressed: Coexistence, Accessibility, Image, Environmental Comfort and Safety (previously identified in the exploratory phase of the research). Interview script pilot trials had been made in the Cidade Baixa neighbourhood with representatives from both engaged user groups (which are not part of the final collected sample).
3.1 Results Analyses and Interpretation
To perform the generated results analysis through the laddering technique, four steps were followed: a) Content Analysis; b) Generating the Implication Matrix; c) Constructing the Hierarchical Value Map – HVM; and d) Determining Dominant Perceptual Pathways (cut-off).
Table 2: Example of summary-codes generated in the research.
A-C-V Sequence
Terminal Values
HAPPINESS - well-being, feeling well, personal satisfaction, better life, living well, optimizing life.
Instrumental Values
ORGANIZATION - neat, clean.
Psychosocial Consequences
TRANQUILITY - silence, rest, relaxation, ease, quiet, concentration, privacy, sleeping
Functional Consequences
ENVIRONMENTAL COMFORT - appropriate furniture, appropriate environment for specific use, clean, dimensions, security, thermal comfort.
Abstract Attributes
MAINTENANCE - well maintained, preserved, clean, quality of the place, well preserved, good pavement.
Concrete Attributes
INFRASTRUCTURE - transport, lighting, urban cleaning, rubbish collection, green areas, trees, parks, vegetation, pavements/streets and roads, large pavements, bikeways, traffic lights, parking areas, underground parking, traffic signs, entry sign, sanitation.
Considering the contributions of Zinas and Jusan (2010), the categorizations of each element were sub-divided into: (F) Abstract or Concrete Attribute; (C) Psychosocial or Functional Consequence; (V) Terminal or Instrumental Value, thereby creating a chain (sequence A-C-V). Based upon this, the summary table was created with the codes of the elements. For example: for Concrete Attributes, one possible code is “INFRASTRUCTURE”, which represents a range of words mentioned by the interviewees. Ultimately, starting with the attributes, the interconnected elements were identified, driven by the A-C-V sequence. The ladders were formulated to represent in summary the respondent's way of thinking. Table 2 presents an example of the summary-codes generated in the research.
196 | Proceedings IGLC | July 2017 | Heraklion, Greece

Michelle Nascimento da Silva and Luciana Inês Gomes Miron
All data were inserted and processed in the LadderUX3 tool. This resource was only applied in the results analysis and interpretation results step. The A-C-V sequence elements were decoded and separated, thereby generating the ladders. The subjects' ladders were inserted in an implication matrix, showing all existing relations between the items. Subsequently, predominant associations between the said items were graphically represented in the HVM.
4 RESULTS AND DISCUSSION
The HVM and laddering technique allow for the clarification of a wide range of connections between the main attributes of the neighbourhood and the main personal values. Substantial input was required regarding theoretical basis, constructs definition, and the main neighbourhood attributes identification, as perceived by both user groups.
The laddering technique demanded specific attention regarding the definitions of each summary-code and construct used in this work. More in-depth research was required for the summary-codes definition in the base theory of environment-behaviour, for example, infrastructure, mix of uses, maintenance, accessibility, image, environmental comfort, sense of security; social science, for example, counter-uses, bohemian neighbourhood, sociability and coexistence; social psychology, for example. instrumental and terminal values; and marketing, for example, perception of value and means-end chains A-C-V) areas. Table 3 shows the main results obtained through the laddering technique in the research.
Table 3: Main results obtained through the application of the laddering technique.
Hierarchical Value Map (HVM): more frequently mentioned elements that have a more evident relation than other items from the A-C-V chain.
Residents —“ infrastructure – maintenance – environmental comfort – tranquility– happiness” —“ infrastructure – maintenance – sense of security – happiness”
—“mix of uses – users diversity – sociability – coexistence – respect – happiness”
—“night entertainment – bohemian neighbourhood – sociability – coexistence – respect – happiness” —“ infrastructure – maintenance – image – good impression”
Traders —“ infrastructure – maintenance – image – successful – prosperity”
—“ infrastructure – maintenance – image – successful – accomplishment” —“ infrastructure – accessibility/centrality – successful – prosperity”
—“policing/surveillance– availability– sense of security – safety”
—“night entertainment – bohemian neighbourhood – appeal – coexistence – respect”
Through the laddering, the relations between personal values and perceptions were more clearly displayed in the Implication Matrix and the Hierarchical Value Map, as exemplified in Figures 1 and 2.
3 http://ladderux.org/
197 | Proceedings IGLC | July 2017 | Heraklion, Greece

Hierarchy of Value Perceived by Groups of Users About Their Neighbourhood
Figure 1: Residents HVM.
Figure 2: Traders HVM.
Regarding the concrete attribute ‘night entertainment’, both groups consider that this attribute makes the neighbourhood bohemian (abstract attribute). Sociability (psychosocial consequence) benefits from the neighbourhood’s appeal due to its many nightlife-driven establishments. Whereas residents link these attributes to the terminal value, happiness, traders connect them to the terminal values of prosperity and accomplishment.
The infrastructure (concrete attribute) and maintenance (abstract attribute) were considered by both user groups as a crucial attribute to a positive assessment of the aspects of the neighbourhood. Maintenance of the public spaces assists in a given space being appointed prestige and appropriation. The prestige aspect can be observed in the research results in both groups from the personal values that arise due to maintenance, such as social recognition and self-esteem.
198 | Proceedings IGLC | July 2017 | Heraklion, Greece

Michelle Nascimento da Silva and Luciana Inês Gomes Miron
It can therefore be concluded that the laddering technique has made it possible to identify that the maintenance of public equipment and service infrastructure (transport, lighting, urban cleaning, rubbish collection, green areas, trees, parks, vegetation, pavements/streets and roads, large pavements, bikeways, car parking, traffic lights, traffic signs, entry signs and sanitation) creates positive perceptions because it makes it possible to reach the consequences of use as a good image. Maintenance of public spaces helps a given space to be surrounded by prestige and appropriation. The extent of this consequence seeks to attain different final states of existence (terminal values) for both studied user groups. For the residents, a good image is more related to social recognition and self-esteem values, and prosperity and accomplishment for the traders.
5 CONCLUSIONS
The detailed analysis in the perception of value of the different user groups, using the theoretical basis Means-End Chain, the laddering technique application and HVM, has assisted in improving the concept of attributes and consequences in the value hierarchical perception in the built environment on the neighbourhood scale. The HVMs as a visual display shows more clearly the relationships between personal values and the perception of value regarding the neighbourhood for each user group. Thus, they have facilitated the perception comparison between both user groups, making the variations clear between the hierarchical values.
The influence of personal values on users' perception of value can lead to an important contribution to the perceived value concept because it has allowed for a wider understanding of the value generation to be used in the built environment. Personal values are implicit motivational goals (Schwartz 1992) that have not been analysed by the lean construction community. As shown in the case study, different personal values result in similarities and differences in users’ perceived value. Therefore, the methods and constructs identified here could be applied for research and practices of the IGLC community as a whole.
Considering the multi-disciplinary aspect related to the research regarding the built environment and the user's interaction with this environment, the use of techniques from different knowledge areas is important. Such studies could aid in the negotiation process of conflicts between different client groups and stakeholders of the built environment. Besides this, given the complexity of neighbourhood use management, such studies present a potential for contributing to the development management of complex projects.
6 REFERENCES Bonatto, F.S., Miron, L.I. and Formoso, C.T. (2011). 'Evaluation of Social Housing Projects
Based on User Perceived Value Hierarchy' In: 19th Annual Conference of the International Group for Lean Construction. Lima, Peru, 13-15 jul.
Brito, J.N.D.S. and Formoso, C.T. (2014). 'Using the Means-End Approach to Understand Perceived Value by Users of Social Housing Projects' In: 22nd Annual Conference of the International Group for Lean Construction. Oslo, Norway, 25-27 Jun 2014.
Coolen, H. and Hoekstra, J. (2001). Values as Determinants of Preferences for Housing Attributes. Journal of Housing and Built Environment. v. 16, n. 3/4, p. 285-306.
Coolen, H. (2006). The meaning of dwellings: An ecological perspective. Housing, Theory and Society, v. 23, n. 4, p.185-201.
199 | Proceedings IGLC | July 2017 | Heraklion, Greece

Hierarchy of Value Perceived by Groups of Users About Their Neighbourhood
Gutman, J. (1982). A means-end chain model based on consumer categorizations processes. Journal of Marketing. V. 48: 60-72, spring.
Kluckhohn, C.K.M. (1968). Values and value orientation in the theory of action. In: PARSONS, T.; SHLDS, E. (eds). Toward a general theory of action. Cambridge, MA, Harvard University Press.
Kowaltowski, D. C. C. K. and Granja, A. D. (2011). The concept of desired value as a stimulus for change in social housing in Brazil. Habitat International, v. 35, n. 3, p. 435-446, jul.
Lima, L.P., Miron, L.I., Leite, F. and Formoso, C.T. (2009). 'Perceived Value in Social Housing Projects' In: 17th Annual Conference of the International Group for Lean Construction. Taipei, Taiwan, 15-17 Jul 2009.
Miron, L.I. and Formoso, C.T. (2010). 'Value Generation in Social Housing Projects: A Case Study on the City Entrance Integrated Program in Porto Alegre, Brazil' In 18th Annual Conference of the International Group for Lean Construction. Haifa, Israel, 14-16 Jul 2010.
Peltokorpi, A., Seppänen, O. and Noorizadeh, A. (2016). 'Project Lifecycle Approach to the Perceived Value of Suppliers: A Study of a Finnish Contractor' In:, 24th Annual Conference of the International Group for Lean Construction. Boston, USA, 20-22 Jul.
Reynolds, T. J. and Gutman, J. (1988). Laddering theory, method, analysis, and interpretation. Journal of Advertising Research.
Rokeach, M. (1973). Beliefs, attitudes and values. New York: The Free Press. Rokeach, M. (1981). Understanding Human Values: individual and societal. New York:
The Free Press. Santos, A.D., Kristmann, V.B. and Fischer, S. (2004). 'Assessing Total Value Requirements
on Low Income Houses in Brazil' In: 12th Annual Conference of the International Group for Lean Construction. Helsingør, Denmark, 3-5 Aug.
Schwartz, S. H. (1992). Universals in the content and structure of values: Theory and empirical tests in 20 countries. In M. Zanna (Ed.), Advances in experimental social psychology (Vol. 25, pp. 1-65). New York: Academic Press.
Thomas, W. I. and Znaniecki, F. (2004). El campesino polaco en Europa y en América. Madrid: CIS.
Woodruff, R. B. (1997). Customer Value: the next source for competitive advantage. Journal of the Academy of Marketing Science, v. 25, n. 2: 139-153.
Woodruff, R. B. and Gardial, S. (1996). Know Your Customer: new approaches to understanding customer value and satisfaction. S.l.]: Blackwell Publishing.
Yin, Robert K. Case Study Research: design and methods. 2. Ed. California: Sage Publications, 1994.
Zinas, B. Z. and Jusan M. M. (2010). Theoretical Framework of Means-End Chain Model for Measuring Housing Environment Choice and Preference. 4th International Conference on Built Environment in Developing Countries, USM Penang-Malaysia, 1st- 2nd December.
Zinas, B. Z. (2013). Laddering as a Research Technique for Measuring Housing Choice and Preference. Journal of Environmental Sciences and Resources Management, v. 5, n. 2.
200 | Proceedings IGLC | July 2017 | Heraklion, Greece

Reed D., Ashcraft H., Khanzode, A., Fischer M., Rischmoller, L., and Berg, P. (2017). “Integrating Delivery of a Large Hospital Complex” In: LC3 2017 Volume II – Proceedings of the 25th Annual Conference of the International Group for Lean Construction (IGLC), Walsh, K., Sacks, R., Brilakis, I. (eds.), Heraklion, Greece, pp. 201–208. DOI: https://doi.org/10.24928/2017/0348
INTEGRATING DELIVERY OF A LARGE HOSPITAL COMPLEX
Dean Reed1, Howard Ashcraft2, Atul Khanzode3, Martin Fischer4, Leonardo Rischmoller5, and Peter Berg6
Abstract: Building a high performing building requires project teams to integrate their knowledge, their organization and their information, leveraging metrics, models (energy, BIM, cost and schedule), co-location and collaboration, and production management. This model, the “Simple Framework for Integrating Project Delivery” was validated in action on the UCSF Mission Bay Hospitals project. The senior project leaders created an integrated community that employed Lean and Virtual Design and Construction methods to create solutions in the best interest of the project.
Keywords: Simple Framework, integration, leadership, collaboration, capabilities.
1 INTRODUCTION This paper describes the integration of a large Healthcare project relative to a theoretical model for integrating project delivery explained in a previous IGLC paper (Fischer et al., 2014) and a recently published academic text (Fischer et al., 2017) by four of this paper’s authors. The emphasis is on how leaders and team members, without explicit knowledge of the Simple Framework, developed a working system that closely approximated the Simple Framework. The paper reports reflections by senior leaders on the work they did to integrate their project. It also describes Lean and Virtual Design and Construction as essential capabilities for effective integration. Figure 1 shows elements and enabler of the Simple Framework.
Figure 1: The Simple Framework for Integrating Project Delivery.
1 Organizer for Lean and Integrated Project Delivery, DPR Construction, Redwood City, CA. [email protected]
2 Partner, Hanson Bridgett, San Francisco, CA, [email protected]
3 Director for Technology and Innovation, DPR Construction, Redwood City, CA, [email protected] 4 Professor of Civil and Environmental Engineering and (by Courtesy) Computer Science and Director, Center for Integrated Facility Engineering
(CIFE), Stanford University, Stanford, CA, [email protected] 5 Business Process Analyst, DPR Construction, Redwood City, CA, [email protected]
6 Project Executive, DPR Construction, Phoenix, AZ, [email protected]
201 | Proceedings IGLC | July 2017 | Heraklion, Greece
Integrating Delivery of a Large Hospital Complex
2 THE IMPERATIVE OF INTEGRATION The authors of Integrating Project Delivery define the “high-performing building” as one that is usable, operable, sustainable and buildable. This means that it should be useful for the people who engage with and rely upon the building. This certainly includes function, form and aesthetics. The building should be economical to operate, and, if our planet is to remain habitable, the building should be constructed and run without depleting or harming the environment. The building most also contribute to the success of its sponsors, using the metrics the sponsoring organization uses to define success. The process of creating the building must be similarly high performing. Project cost and duration must stay within constraints. Workers should not be exposed to avoidable risks. Project quality must meet the sponsor’s needs. Unless the project process can be efficient and effective, the building will not be successful and may not even be built. Seeing the goal of delivering a high performing building allows stakeholders and deliver team members to understand their challenge.
A high-performing building can only be achieved through a building with integrated building systems, which can only be produced through an integrated process, which depends on an integrated team with the right people, which needs integrated information, i.e., BIM+ to function effectively and efficiently. Simulation and visualization are the primary ways in which BIM+ informs the integrated team. Collaboration and co-location are the primary ways that allow the integrated team to integrate processes. Production management methods enable the productive design, fabrication, and construction of the integrated building system. Outcome metrics define the performance of the building and validate the integrated building system. All of this is supported by the appropriate agreement or framework.
3 UCSF MISSION BAY HOSPITALS The University of California San Francisco Mission Bay Hospitals opened in 2014 after a 45-months of design and construction. It currently serves pediatric specialties, the adult surgical oncology program, and a women’s birthing program. There are 16 imaging rooms, 20 operating rooms, and 289 patient rooms. Heating, cooling, and power for the hospital and connected outpatient clinic are supplied by an energy center. Altogether, the facility is 878,000 gross square feet and has 60,000 square feet of roof gardens. The total construction budget was $765 million, pared down from an original $965 million cost estimate; the project budget was $1.52 billion. It earned LEED Gold and was opened eight days early. (Fischer et al., 2017, pp.176-177)
4 LEADERSHIP While the Simple Framework model was not available during the project, senior leaders and many Mission Bay Hospitals team members knew more than most about collaboration and integration, Lean, and BIM. Stuart Eckblad, came to UCSF Medical Center as director of Design and Construction in 2006 as a long-time advocate and practitioner of collaboration. Long before IPD came into being, Stuart joined with other industry leaders to cofound and serve as president of the Collaborative Process Institute (CPI) in the mid 1990s. CPI’s mission was to educate owners and industry leaders about building collaborative cultures to enable project teams to deliver extraordinary results. In
202 | Proceedings IGLC | July 2017 | Heraklion, Greece

Dean Reed, Howard Ashcraft, Atul Khanzode, Martin Fischer, Leonardo Rischmoller and Peter Berg
2007, he chaired the AIA California Council committee, which drafted and published the “Working Definition of Integrated Project Delivery.” Laurel Harrison, a highly-regarded Healthcare planner and design architect and Principal at Stantec Architecture was a key leader of the architectural team. Ray Trebino, with years of experience building advanced technology facilities, was at the center of a team managing the project for the General Contractor, DPR Construction.
In conversation reflecting on their experience leading the project, Eckblad, Harrison and Trebino described countless conversations amongst themselves and with other leaders to design and redesign the project organization, information flows, and decision-making through the course of the project. (Fischer et al., 2017, pp.183-184) The three leaders described sharing leadership and how important it was for them to go into the project convinced that it could only succeed if they could create a “best-for-project” culture and community of people building for Healthcare. They spoke of the need to be confident that most people would respond positively. They spoke of creating and inventing delivery rather than applying methods and processes. (Eckblad, Harrison and Trebino, personal communication, December 19, 2016)
5 PERFORMANCE PREREQUISITES 5.1 Removing Obstacles to Collaboration Stuart Eckblad convinced university officials that he could produce better results by engaging the general contractor and key trades early and adopting major IPD concepts. The University had little prior experience with any of these concepts and was reluctant to deviate from their traditional standards. Eckblad was convinced, however, that real change required real change and he challenged university and outside counsel to transform traditional contractual and business models into a reasonable approximation of IPD principles. Although the resulting documents were complex, they did improve integration by interlocking the parties through shared incentives and collaborative management.
DPR Construction was selected in a competitive process as the GC and joined the project in August of 2008, followed in December of 2008 by eight design-assist MEP, concrete, steel, drywall, and doors-frames-hardware subcontractors chosen via a competitive process. All were contracted to work under Cost-Plus Guaranteed Maximum Price (CPGMP) contracts with target costs and target incentives to reduce overall construction cost by $200 Million and to meet schedule and other constraints. (Fischer et al., 2017, p.177)
5.2 Trust for Collaboration Larry Prusak, founder and Executive Director of the Institute for Knowledge Management (IKM) has stated, “Without trust, it's spectacularly difficult for collaboration to flourish, even between peers and within practices.” (Prusak, 2011)
In anticipation of construction contract awards, Stuart Eckblad invested in establishing a co-location center on the building site, the “Integrated Center for Design and Construction” (ICDC). Then he insisted that the design team move-in with the general contractor’s staff. The architects did relocate which greatly increased knowledge among the project team and significantly reduced time required to have questions answered (Fischer et al., 2017, p.178). Trust increased as people came through with the useful information as they had promised. “Basic Action Workflow,” developed by Fernando
203 | Proceedings IGLC | July 2017 | Heraklion, Greece

Integrating Delivery of a Large Hospital Complex
Flores, shown in Figure 2, illustrates how people working in the ICDC built trust. (Flores, 2012)
Figure 2: The Basic Action Worflow of Fernando Flores.
5.3 Feedback for Continuous Improvement W. Edwards Deming taught Japanese industrialists and engineers the Shewhart Learning Cycle, which Toyota and other Japanese companies made famous as the Plan-Do-Study-Act cycle. The idea was to predict results, check on whether they were achieved, and find ways to improve and then implement them in a continuous learning / improvement cycle. (Latzko, 1995)
UCSF Mission Bay Hospitals senior leaders followed this approach. They worked with the sub-teams responsible for different aspects of work to set targets for cost reduction, responding to contractor’s questions about design, approving materials submittals, and completing work as promised. Leaders met 4-days each week with their teams and then with other teams leaders and a “Captain” for the design or construction of one of the buildings who would then meet with the top leaders. Results, problems and solutions were always on the meeting agendas. Figure 3 illustrates the practice of daily tiered meetings described by David Mann (2014) in his book, Creating a Lean Culture: Tools to Sustain Lean Conversations.
Figure 3: Daily Tiered Meetings.
204 | Proceedings IGLC | July 2017 | Heraklion, Greece
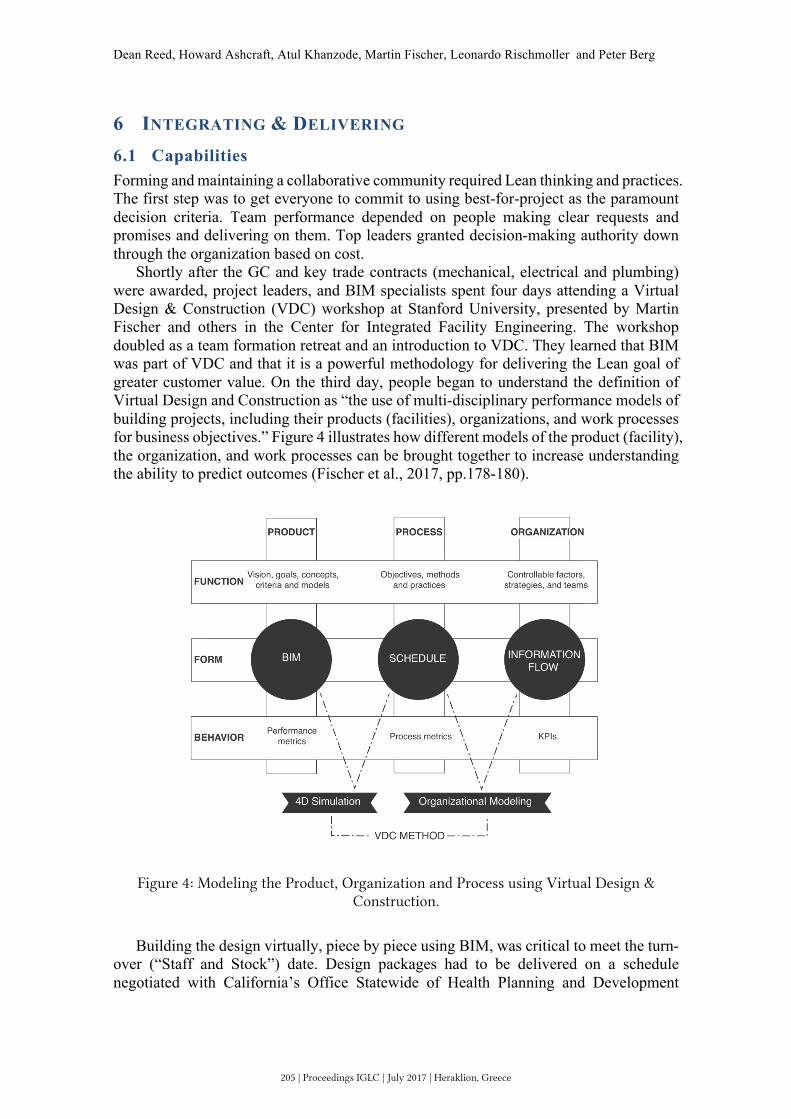
Dean Reed, Howard Ashcraft, Atul Khanzode, Martin Fischer, Leonardo Rischmoller and Peter Berg
6 INTEGRATING & DELIVERING 6.1 Capabilities Forming and maintaining a collaborative community required Lean thinking and practices. The first step was to get everyone to commit to using best-for-project as the paramount decision criteria. Team performance depended on people making clear requests and promises and delivering on them. Top leaders granted decision-making authority down through the organization based on cost.
Shortly after the GC and key trade contracts (mechanical, electrical and plumbing) were awarded, project leaders, and BIM specialists spent four days attending a Virtual Design & Construction (VDC) workshop at Stanford University, presented by Martin Fischer and others in the Center for Integrated Facility Engineering. The workshop doubled as a team formation retreat and an introduction to VDC. They learned that BIM was part of VDC and that it is a powerful methodology for delivering the Lean goal of greater customer value. On the third day, people began to understand the definition of Virtual Design and Construction as “the use of multi-disciplinary performance models of building projects, including their products (facilities), organizations, and work processes for business objectives.” Figure 4 illustrates how different models of the product (facility), the organization, and work processes can be brought together to increase understanding the ability to predict outcomes (Fischer et al., 2017, pp.178-180).
Figure 4: Modeling the Product, Organization and Process using Virtual Design & Construction.
Building the design virtually, piece by piece using BIM, was critical to meet the turn-over (“Staff and Stock”) date. Design packages had to be delivered on a schedule negotiated with California’s Office Statewide of Health Planning and Development
205 | Proceedings IGLC | July 2017 | Heraklion, Greece

Integrating Delivery of a Large Hospital Complex
(OSHPD). This work coincided with an intense Target Value Design effort mostly focused on true Value Engineering to lower cost while maintaining functionality and durability. Teams and sub-teams for the three major buildings pull-planned their work from target dates they believed were achievable. They coordinated daily with project managers, architects and engineers working on the buildings to stay in sync.
6.2 Integrating Knowledge, Organization and Information Leaders developed and drove the adoption of the process for documenting, analysing
and deciding on value engineering proposals. Larger decisions, which impacted cost, schedule, or sustainability goals, were passed up to the cluster and senior leadership levels for approval using a process and template developed by UCSF Mission Bay Hospitals project leaders called Project Modifications and Innovations© (PMI).
First, the building team would discuss and vet the idea, gathering as much input as possible from all clusters that could be impacted, along with the facility operators, architects, and so forth. If a building or cluster lead signed on as a “Sponsor, “the PMI would then be passed up to the senior leadership level, where the change would be accepted or rejected. Figure x shows an overview of the PMI process.
One successful PMI centered on the tray system, which carries cables throughout the hospital. Standard cable trays were expensive, but one common alternative, J-hooks, seemed too unattractive and potentially disorganized to the UCSF Mission Bay Hospitals facilities representatives. A low-voltage designer working on the team suggested using common brackets, which would reduce cost and be easier to install, yet keep the cables and wiring organized. After requesting samples from the manufacturer, vetting the system with the facilities staff, and successfully completing the PMI©, the team determined that the cable tray substitute would be a perfect solution. The cable tray solution was implemented using an information-rich analysis created in an Integrated Concurrent Engineering (“ICE”) session that included the responsible team members and representatives of affected stakeholders. Integrated Concurrent Engineering (ICE) is an element of VDC and these sessions were used on several other items to bring rapid closure to issues and opportunities. Figure 5 illustrates the accordion model of ICE depicting integrated sessions followed by breakout meetings over some period.
Figure 5: ICE Accordion Model.
ICE sessions were held to deal with other problems, such as inadequate ceiling space above caesarean section operating rooms and intensive care units. Three 4-hour sessions were held with leaders from every entity involved with the design and construction of the hospitals buildings. They found a solution, which as the roof garden would stay and the
206 | Proceedings IGLC | July 2017 | Heraklion, Greece

Dean Reed, Howard Ashcraft, Atul Khanzode, Martin Fischer, Leonardo Rischmoller and Peter Berg
ceiling height would be maintained by resizing steel beams, rerouting above-ceiling HVAC and power, and shifting the location of the operating rooms (ORs) to a different area without sacrificing the clinical program. Every participant realized that they had saved months and significant dollars through their intense collaboration within the span of three weeks.
Team members reported each week on how they were performing relative to their latency metric: 80 percent of issues resolved in 30 minutes or less within teams, and 80 percent of all others resolved in four hours or less in the Big Room. Design cluster teams consistently tracked and reported progress towards reducing costs. These teams also tracked numbers of requests for information (RFIs), material submittals, and change requests and compared these against key performance indicators (KPIs) they had set. Performance relative to metrics was reported each week in the project executive meeting and charts posted on the Big Room wall for everyone to see, including the many visitors to the project.
A third-party estimator forecast a $200 million USD cost overrun. But using a Lean, integrated methodology, the team achieved the cost reductions required to proceed with building and achieved the full program without scope reductions. Fully modelled and coordinated design packages were submitted and permitted on schedule. And, the team met all but one of its performance targets for incentive compensation.
There were thousands of issues and questions on a project this large. Most of those were resolved by the parties working collaboratively in the Big Room and documented in a confirming RFI. However, if an issue had a schedule, cost, or design impact, or required additional outside consulting, the team would bring the issue into the Project Solutions Group© (PSG), an organizational mechanism developed by Stuart Eckblad together with UCSF Mission Bay Hospitals team leaders. Project leaders for the UCSF Medical Center, the construction manager, and the design and construction firms met daily except for Fridays in the PSG to address issues as quickly as possible. The goal was always to solve the problem.
Leaders wore several hats throughout the project. The GC and design team project managers led clusters and the three buildings’ teams. Some of these people participated with others in the project captains and senior leadership team. Each building team leader stayed on during construction to manage that subproject and surface issues for the PSG. Construction teams, organized by floor, took over from the area BIM teams for each building.
During construction, the ICDC open office space doubled in size to accommodate the general contractor’s staff, the architectural team for construction and Inspectors of Record. Slides showing quantities of work installed were added to the weekly progress update to the project owner, architect, contractor (OAC) meeting, printed as posters and displayed along a wall in the new area of the ICDC.
Senior leaders worked with the UCSF Medical Center counsel to redraft the UC standard contract, including general and special conditions and the scheduling specification, to incorporate Lean construction planning and scheduling practices. The new specification allowed for a high-level contract schedule supported by the Last Planner™ System methodology of phase schedules, short interval work plans, pull scheduling, and weekly commitments updated daily. This extended the integrated organization to work crews through daily huddles to coordinate work. (Fischer et al., 2017, pp.181-184)
207 | Proceedings IGLC | July 2017 | Heraklion, Greece

Integrating Delivery of a Large Hospital Complex
7 CONCLUSIONS The experience, work and outcomes of the UCSF Mission Bay Hospitals provide useful insights integrating project delivery, as follows.
1. Senior leaders face an imperative to integrate the building components and systems to achieve high performance.
2. In the face of this imperative, senior leaders of the project committed themselves to building a community and committed to create integration, as opposed to implement a set of methods and process.
3. Project leaders and team members learned and applied Virtual Design and Construction to produce deliverables using Lean methods.
4. Independent of the Simple Framework model, team members used all the enabler described in the model to create the essential building blocks required to deliver what they had promised.
8 REFERENCES Fischer, M., Reed, D., Khanzode, A., and Ashcraft, H. (2014), “A Simple Framework for
Integrated Project Delivery.” 22nd Annual Conf. of the Intntl. Group for Lean Construction. Oslo, Norway. 1319 - 1330.
Fischer, M., Ashcraft, H., Reed, D. and Khanzode, A. (2017). Integrating Project Delivery. Hoboken: John Wiley & Sons, Inc., pp.176–185.
Flores, F. (2012), Conversations for Action and Other Essays Instilling A Culture of Commitment in Our Working Relationships. North Charleston: CreateSpace Publishing Platform, ch.3.
Latsko, W. and Saunders, D. (1995). Four Days with Dr. Deming A Strategy for Modern Methods of Management. Reading: Addison-Wesley Publishing Company, pp.594-595.
Mann, D. (2014). Creating a Lean Culture: Tools to Sustain Lean Conversions. Florence: CRC Press.
Prusak, L., (2012). The One Thing That Makes Collaboration Work. Available at: https://hbr.org/2011/07/one-thing-that-makes-collaboration [30 Mar. 2017].
208 | Proceedings IGLC | July 2017 | Heraklion, Greece

Saurin, T.A. (2017). “Removing Waste While Preserving Slack: The Lean and Complexity Perspectives” In: LC3 2017 Volume II – Proceedings of the 25th Annual Conference of the International Group for Lean Construction (IGLC),Walsh, K., Sacks, R., Brilakis, I. (eds.), Heraklion, Greece, pp. 209-216. DOI: https://doi.org/10.24928/2017/0099
REMOVING WASTE WHILE PRESERVING SLACK: THE LEAN AND COMPLEXITY PERSPECTIVES
Tarcisio A. Saurin1
Abstract: In complex socio-technical systems such as construction projects, the lean emphasis on waste reduction can contribute to the depletion of necessary slack for managing unexpected variability. This risk is amplified by the absence of a solid lean theory on slack and on how to manage the trade-off between slack and efficiency. Furthermore, lean focuses on managing slack in terms of time and inventories. Thus, a broader approach that accounts for a wide variety of slack resources is necessary. In this paper, the complexity science´s and lean´s views of slack are laid down and compared based on eleven criteria. Commonalities and conflicts between both approaches are identified, and proposals for future research related to slack management in lean complex systems are presented. Keywords: Slack, buffers, complexity, waste, lean.
1 INTRODUCTION As lean production (LP) has spread to several sectors, it has more and more been applied in the so-called complex socio-technical systems (CSSs), which are known for characteristics such as variability and a large number of elements in dynamic interactions (Perrow, 1984). The construction industry is one of these CSSs in which LP has been used, involving a similar set of principles and a set of practices tailored to the sector, known as lean construction (LC). Nevertheless, drawbacks of using lean in CSSs have been pointed out by several studies. For instance, the decision of what counts as value and waste is not straightforward in CSSs, given the multitude of clients and conflicting requirements (Browning and Heath, 2009).
In fact, regardless of positive results, there are many accounts of LP in CSSs which fall short of expectations, sometimes not paying back, worsening working conditions, simply moving waste from one location to another, and creating other undesired side-effects – e.g. public hospitals in Canada (Moraros et al., 2016), public service in the UK (Radnor and Osborne, 2013), and the production of the F-22 fighter (Browning and Heath, 2009). While reports of unexpected or undesired results of LC are not so common, this does not mean they have not occurred. It is possible that undesired side-effects are less likely in construction due to the loosely-coupled nature of most processes, which offers intrinsic slack that cannot be easily removed through lean.
Slack is useful for absorbing variability from different sources, and it is focused on this paper. In LC, the use of the term ‘‘buffer’’ is more common than slack, and it has been
1Associate Professor, Industrial Engineering and Transportation Department. Federal University of Rio Grande do Sul (UFRGS), Porto Alegre, RS, Brazil, [email protected]
209 | Proceedings IGLC | July 2017 | Heraklion, Greece

Removing Waste While Preserving Slack: The Lean and Complexity Perspectives
addressed by many studies. Alves and Tommelein (2004) define buffers as resource cushions (e.g. money, time, materials, space), used to protect processes against variation and resource starvation. Russel et al. (2012) acknowledge four main types of buffers in construction: inventory, time, capacity, and plans. In the present paper, the term slack is preferred over the term buffer, as the discussion has implications for other sectors, it is not focused on any specific type of resource, and there is a fairly long research tradition on the management of slack, especially in organizational science (e.g. Sharfman et al., 1988). Also, when ‘‘lean’’ is used in isolation in this paper, it makes reference to both LC and LP.
At a cursory view, lean and complexity science (CS) appear to be in conflict regarding their approach on slack. On the one hand, the lean emphasis on eliminating waste can lead to the removal of slack, which cannot always be easily distinguished from waste. This makes systems tightly-coupled, increasing interactive complexity. On the other hand, CS stresses the need for providing slack so as the system can adjust its performance to both expected and unexpected variability (Perrow, 1984).
This paper presents and compares the lean and CS perspectives on slack, shedding light on research and practical gaps. It is assumed that both views need and can be reconciled, from a theoretical viewpoint. The need assumption is grounded on the previously mentioned increasing use of lean in CSSs. The can assumption is based on the empirical fact that many companies from construction and other complex sectors successfully use lean, which suggests they effectively balance the trade-off between slack and efficiency (Marley et al., 2014). This is a sub-class of the more generic efficiency-thoroughness trade-off, which is ubiquitous in CSSs and usually managed by means of approximate adjustments by front-line staff (Hollnagel, 2012).
2 WHAT IS SLACK? Slack means available spare resources, of any sort, which can be called on in times of need (Fryer, 2004). Such spare resources do not necessarily imply extra or idle resources, as they may account for existing and strictly necessary resources that may be relocated and used in different ways as needed. Underlying that definition is the notion that virtually any resource can become slack in a certain context: if not by design or opportunistic intentional use, chance can play a role for transforming a resource into slack.
3 LEAN VIEW OF SLACK LP theory and practice usually refers explicitly to slack only in terms of time and inventory of materials. As to time, slack is normally embedded in the calculation of process efficiency, which is always lower than 100% due to inevitable wastes and mandatory work stoppages, such as time for meals. As to inventories, the practice of designing safety stocks and work-in-process is the usual means of accounting for slack (Smalley, 2004). However, excessive stock is seen by LP as detrimental since the effects of disruptions will not be immediately visible, and thus there will be no pressure to control their underlying causes (Liker, 2004). In other words, excessive stock implies a high threshold for detecting variability. As to LC, concerns with slack of work-in-process and time seem to be prominent (Gonzalez et al., 2006). This can be due to the project nature of construction, in which a large number of design and production
210 | Proceedings IGLC | July 2017 | Heraklion, Greece

Tarcisio A. Saurin
tasks need to be synchronized in space-time, while demand for raw materials is not as uncertain and variable as in manufacturing.
Another lean assumption is that slack can be gradually reduced as the system becomes more stable and wastes are eliminated. This is one of the reasons why Spear and Bowen (1999) refer to (perhaps large) inventories as ‘‘countermeasures’’ in lean systems. Furthermore, if a process easily and consistently produces the desired outputs, lean experts may interpret this as a warning that there are excessive slack resources, which probably could be reduced in the quest for efficiency. In order to empirically test whether the slack size is excessive, localized experiments of slack reduction can be made, in order to force the emergence of wastes and stimulate ‘‘creative tension’’ (Womack and Jones, 1998).
Of course, lean also deals less explicitly with slack in many other dimensions, such as: (i) the use of multifunctional workers and cross-training, which helps to deal with variations in demand and absenteeism (Liker, 2004); (ii) the use of cognitive slack (e.g. due to teamwork) and the consideration of several alternatives for solving complex-problems, delaying the final decision to the last possible moment (Shook, 2008); and (c) the “help chain” concept (Spear and Bowen, 1999), which is a standardized routine for the identification and solution of abnormalities. The help chain is triggered by a visual device (andon, in lean jargon) to request help from support areas, which in turn should go to the requested location, discuss a solution jointly with workers and produce organizational learning.
Regardless of the aforementioned concerns with slack, production pressures and the lean stress on waste control are likely to encourage practitioners to favor efficiency over slack when trading-off both. Moreover, such balance of the trade-off may occur as a result of myopic yet very common applications of lean for cost-cutting in the short-term. While this approach is not recommended by lean theorists, the practical appeal of lean as a source of improved productivity makes it a potentially dangerous tool in terms of depleting necessary slack.
4 COMPLEXITY SCIENCE VIEW OF SLACK
CS recognizes unpredictability as a key property of CSSs, and thus it tends to view slack as an asset. Slack makes systems loosely-coupled (Perrow, 1984), offering time and other resources to support performance adjustment. Moreover, due to slack, agents in a CSS may realize they are consuming safety margins and recover control before the occurrence of irreversible losses (Rasmussen, 1997). Thus, visibility of the status of slack resources (e.g. availability and amount) is essential in order to support its management.
However, CS also recognizes the role of dynamic interactions between system elements. As a result, slack itself may introduce vulnerabilities due to the creation of new possibilities for undesired and unexpected interactions (Perrow, 1984). For instance, slack can increase systems´ opaqueness, disguising small changes and latent hazards which may have non-linear effects. Furthermore, CS recognizes that scarcity of resources is a natural tendency in CSSs, due to continuous performance adjustments (i.e. resilience) by multiple agents, in search of better performance (Dekker, 2011).
It is also worth noting that tight-couplings, either in linear or complex systems, do not necessarily imply absence of slack and impossibility of adaptation. Assembly lines in lean manufacturing plants illustrate this point: although there may be no work-in-process in-between workstations (i.e. they are tightly-coupled and there is continuous flow),
211 | Proceedings IGLC | July 2017 | Heraklion, Greece

Removing Waste While Preserving Slack: The Lean and Complexity Perspectives
abnormalities can be managed through off-line slack, such as safety stocks and the use of a help chain (Liker, 2004).
Complexity science also offers the insight that slack cannot be completely eliminated from a CSS. This applies to slack that equates to waste that cannot be reduced below a certain threshold, at least given known and available technologies. In these cases, all that designers can do is to move waste to a place where it can be less harmful. This type of waste is associated with interactions which are vital for system survival: if the interactions are eliminated the system ceases to produce its outputs. In a construction project, an example of waste and interaction of this type may be a project manager who, himself, orders materials from suppliers. While this activity is waste and cannot be eliminated, it could be in principle less serious if carried out by an administrative worker rather than by the project manager. By contrast, other interactions can be eliminated through design. Thus, waste and slack that cannot be completely designed out account for interactions essential for system survival and that cannot be eliminated given existing resources.
5 TIGHT AND LOOSE-COUPLINGS: RELATIONSHIPS WITH SLACK
CSSs are known for tightly-coupled processes, which means that failures may propagate quickly and in unexpected ways (Perrow, 1984). By contrast, loosely-coupled systems can afford for failures, as there is substantial slack, which is often intrinsic to the system´s nature (Perrow, 1984). Regardless of the widespread academic use of the tight-loose coupling analogy, and its relationship with slack, this concept is hardly operationalized and graphically represented. In this section, the Functional Resonance Analysis Method – FRAM (Hollnagel, 2012) is tentatively used in order to make sense of this concept. The FRAM is a method for the modelling of CSSs, which involves: (i) the identification and description of the functions performed by the system, according to the six aspects of each function (input, output, precondition, resource, control, and time); (ii) the analysis of the variability of the outputs of each function, and (iii) the analysis of how the functions interact between themselves; the assumption is that outputs of functions are used by other functions, thus establishing couplings between them (Hollnagel, 2012). These characteristics of the FRAM allow a functional description of CSSs, focusing on work-as-done by front-line workers rather than on work-as-imagined by others.
A generic FRAM model of a portion of a construction project is presented in Figure 1, showing how work packages are interrelated with planning functions and functions that deploy slack. Figure 1 can support a risk assessment, envisioning possible scenarios based on existing planning. According to this Figure, the variability of the outputs of three managerial functions <plan work packages look-ahead>, <plan work packages short-term> and <provide resources> may propagate to the operational functions <work package A> and <work package B>. Variability of the planning functions could involve, for instance, the short-term scheduling of work packages which did not have all constraints removed at the look-ahead level. In turn, variability of the work package functions triggers two other functions that deploy slack resources – these could be, for example, the planning of overtime work, and the assignment of additional workers. The outputs of the planning functions could also provide slack in terms of time to the work packages. In this case, there would be a coupling linking the output of the planning function to the time aspect of the work package function. As such, in Figure 1, work
212 | Proceedings IGLC | July 2017 | Heraklion, Greece

Tarcisio A. Saurin
packages A and B are loosely coupled with work package C, which is a downstream function. In turn, work package C is tightly coupled with work package D, due to the absence of a slack function related to C. For future studies, it is proposed that, for any given instantiation like Figure 1, an overall score of the variability and slack associated with functions be estimated and compared. The greater the difference between the slack and the variability score (i.e. slack – variability), the more loosely-coupled the system will be.
Figure 1: Example of a generic FRAM model in construction. Notes: (i) hexagons represent
functions (blue = planning functions, red = function that deploy slack resources, green = work packages); (ii) waves inside hexagons indicate the output of the function has
substantial variability; (iii) lines in-between functions represent couplings; (iv) (tight) couplings of work package C are highlighted
6 COMPARING THE LEAN AND COMPLEXITY VIEWS OF SLACK Table 1 summarizes the comparison between the lean and complexity views of slack, based on criteria for classifying slack resources proposed by Saurin (2015).
Table 1: Comparison of the lean and complexity views of slack
Criteria Lean perspective Complexity perspective
213 | Proceedings IGLC | July 2017 | Heraklion, Greece

Removing Waste While Preserving Slack: The Lean and Complexity Perspectives
(1) Belief regarding the role of slack
Slack is costly and the need for it arises from waste and variability: the aim is to streamline processes so as slack can be gradually reduced.
Substantial and unpredictable variability are inevitable in CSSs, and slack offers protection against these. Safety is a more important value than efficiency.
(2) Belief regarding the nature of variability
Variability is essentially a hindrance, since it contributes to waste. Some lean practices can reduce variability (e.g. housekeeping), while others require low variability in order to be effective (e.g. pull production)
Variability, especially by front-line workers when making decisions under uncertainty and scarcity of resources, can be an asset. CSSs have a high minimum variability threshold, which cannot be reduced through design and management (Hollangel, 2012).
(3) Origin: how slack arises It must be designed into the system, and can be created through waste reduction (e.g. by reducing excessive inventories, slack of space and money can be created)
Slack must be designed into the system, and it can also arise from self-organization
(4) How slack evolves over time
The continuous improvement cycle (i.e. PDCA) should be used to adjust the size and location of slack resources over time
The behavior of CSSs is based on their past history and the corresponding feedback (Dekker, 2011). Thus, CSSs may learn over time how to manage slack
(5) Interactions: what triggers the deployment of slack resources and how these interact with other processes
Abnormalities of any sort may trigger the deployment of slack resources. The help chain is a tool that illustrates how lean deals with this criteria
Variability of the outputs of functions triggers the use of slack resources. The FRAM can be used for modelling how functions that deploy slack resources interact with other functions
(6) Typical slack resources stressed by theory
Time and inventories of parts (e.g. finished products, raw materials, semi-processed products).
No clear stress on any specific resource. Literature mentions time, redundant equipment, and cognitive diversity, among others.
(7) Concerns with side-effects of slack
Slack hides waste Slack interacts with other elements of the system, and this can trigger undesired emergent phenomena.
(8) Concerns with quantification: how much is enough?
A number of industrial engineering methods can be used to calculate process efficiency and the size of inventories, explicitly stipulating an amount of slack
There are no widely accepted and available tools for quantifying slack. Also, from a constructivist perspective that permeates some CS research (e.g. Dekker, 2011), what counts as sufficient slack is a social construction, instead of an objective fact.
(9) Concerns with giving visibility to slack
It should be possible to identify at a glance the status of resources in general. Visibility of slack viewed as waste (e.g. idle workers due to unbalanced cycle times) is also stressed, in order to create pressure for its elimination.
While the need for visibility is emphasized by literature, it does not offer practical tools and principles such as those promoted by lean
(10) Concerns with consumption of slack
Consuming slack, even if unexpectedly, is not necessarily a major issue. If the system halts because of this, it creates pressure for improvement.
There is concern with consumption of slack, especially from efficiency pressures that create ‘‘normalized deviances’’ (Dekker, 2011). As such, less and less slack may become the normal state of the system.
(11) Typical variability sources that slack should withstand
Demand and supply, inefficiencies in general (e.g. defects, delays, etc.)
Variability that impacts on safety and threaten the system´s existence is stressed by CS literature
Table 1 suggests that: (i) these two views are potentially in conflict regarding criteria 1 and 2 (beliefs on the nature of slack and variability), which indicates the need for explicitly managing the trade-off between slack as waste and slack as protection – instead of being a problem, the joint use of both views can be useful since it encourages explicit and balanced decision-making; (ii) lean offers practical tools for dealing with criteria 4 (evolution), 5 (interactions), 8 (quantification), and 9 (visibility); the use of these tools provide data that can be interpreted from a complexity perspective; (iii) CS offers a practical tool (i.e. the FRAM) to address criteria 4; and (iv) CS takes a broader view of the slack concept, not emphasizing specific types of resources and sources of variability. Overall, CS seems to offer a stronger theoretical background, while lean offers a more practical approach, regardless of being fairly limited to certain resources and variability types.
214 | Proceedings IGLC | July 2017 | Heraklion, Greece

Tarcisio A. Saurin
7 CONCLUSIONS
While slack is a key concept for both LP and LC, it has been underexplored by researchers from both disciplines. The management of slack may be interpreted as a dimension of project risk management, since it involves a ubiquitous trade-off in construction projects, namely the extent to which variability should be protected without compromising efficiency. This paper offered insights into the said management, by comparing the lean and CS perspectives of slack. Lean assumes that a portion of slack is unnecessary, arising from clear-cut waste that can be eliminated without relevant negative side-effects. Lean also recognizes that not all wastes can be removed given existing conditions, and therefore it provides countermeasures to deal with abnormalities. This ‘‘countermeasure’’ view conveys that slack is fundamentally a drawback, and it may be eventually eliminated as a result of the lean quest for perfection. Conversely, CS asserts that in truly CSSs the emphasis should be on coping with variability and thus slack tends to be seen as protection. CS also warns against side-effects arising from the introduction of slack itself. Moreover, a complexity inspired tool, the FRAM, stands out as a tool for modelling interactions between slack and processes in construction projects and elsewhere.
As to future research, it is proposed: (i) the development of tools for supporting the design and evaluation of a broad range of slack resources over all phases of construction projects, since the design phase; (ii) the development of explicit and operational guidelines for supporting decision-making regarding the trade-off between slack as protection and as waste; and (iii) the investigation of how existing LC practices, such as the Last Planner and BIM, address or could address the management of slack.
8 ACKNOWLEDGMENTS This research work was funded by Financiadora de Estudos e Projetos (FINEP), and it is part of a research project entitled “Technologies for Sustainable Construction Sites for Social Housing” (CANTEC-HIS).
9 REFERENCES Alves, T., and Tommelein, I.D. (2004). Simulation of Buffering and Batching Practices in the
Interface Detailing-Fabrication-Installation of HVAC Ductwork. Proc. 12nd Ann. Conf. of the Int’l. Group for Lean Construction, Elsinore, Denmark.
Browning, T., and Heath, R. (2009). Reconceptualizing the effects of lean on production costs with evidence from the F-22 program. Journal of Operations Management, 27, pp. 23-44.
Dekker, S. (2011). Drift into Failure: From Hunting Broken Components to Understanding Complex Systems. CRC Press, Boca Raton.
Fryer, P. (2004). Running an organization along complexity lines. In: Kernick, D. (Ed.) Complexity and Healthcare Organization: a view from the street. Radcliffe Medical Press, Abingdon, pp. 289-298.
Gonzalez, V., Alarcon, L.F., and Gazmuri, P. (2006). Design of Work in Process Buffers in Repetitive Building Projects: A Case Study. Proc. 14th Ann. Conf. Int'l.Group for Lean Construction, Santiago, Chile, pp. 10-20.
215 | Proceedings IGLC | July 2017 | Heraklion, Greece
Removing Waste While Preserving Slack: The Lean and Complexity Perspectives
Hollnagel, E. (2012). FRAM: the Functional Resonance Analysis Method: Modeling complex socio-technical systems. Ashgate, Burlington.
Liker, J. (2004). The Toyota Way: 14 management principles from the world’s greatest manufacturer. McGraw-Hill, New York.
Marley, K., Ward, P., and Hill, J. (2014). Mitigating supply chain disruptions – a normal accident perspective. Supply Chain Management: an international journal, 19(2), pp. 142-152.
Moraros, J., Lemstra, M., and Nwankwo, C. (2016). Lean interventions in healthcare—do they actually work? A systematic literature review. International Journal for Quality in Health Care, 28(2), pp. 150-165.
Perrow, C. (1984). Normal Accidents: living with high-risk technologies. Princeton University Press, Princeton.
Radnor, Z., and Osborne, S. (2013). Lean: a failed theory for public service? Public Management Review, 15(2), pp. 265-287.
Rasmussen, J. (1997). Risk management in a dynamic society: a modeling problem. Safety Science, 27(2/3), pp.183-213.
Russell, M., Howell, G., Hsiang, S., and Liu, M. (2012). Causes of time buffer in construction project task durations. Proc. 20th Ann. Conf. Int'l. Group for Lean Construction, San Diego, USA.
Saurin, T.A. (2015). Classification and assessment of slack: implications for resilience. In: Proc. 6th Resilience Engineering Symposium, Lisbon. Available at <www.resilience-engineering-association.org>.
Sharfman, M., Wolf, G., Chase, R., and Tansik, D. (1988). Antecedents of organizational slack. The Academy of Management Review, 13(4), pp. 601-614.
Shook, J. (2008). Managing to Learn: using the A3 management process to solve problems, gain agreement, mentor and lead. Lean Enterprise Institute, Cambridge.
Smalley, A. (2004). Creating Level Pull. Lean Enterprise Institute, Cambridge. Spear, S., and Bowen, H. (1999). Decoding the DNA of the Toyota Production System. Harvard
Business Review, pp. 97–106. Womack, J., and Jones, D. (1998). Lean Thinking: Banish Waste and Create Wealth in your Corporation. Simon and Schuster, New York.
216 | Proceedings IGLC | July 2017 | Heraklion, Greece

Shou W., Wang J., Wu P., Wang X. and Song Y. (2017). “Application of Lean Production With VSM to the Blasting and Coating Industry.” In: LC3 2017 Volume II – Proceedings of the 25th Annual Conference of the International Group for Lean Construction (IGLC), Walsh, K., Sacks, R., Brilakis, I. (eds.), Heraklion, Greece, pp. 217-224. DOI: https://doi.org/10.24928/2017/0308
APPLICATION OF LEAN PRODUCTION WITH VALUE STREAM MAPPING TO THE BLASTING AND
COATING INDUSTRY
Wenchi Shou1, Jun Wang2, Peng Wu 3, Xiangyu Wang4 and Yongze Song5
Abstract: Lean production involves a variety of principles and techniques, all of which aim to eliminate waste and non-value-added activities at every production or service process. To stay competitive, many Australian owners in the blasting and coating industry have sought to improve their production process productivity and human performance. The purpose of this study is to evaluate the feasibility of existing lean principles by using Value Stream Mapping (VSM) in the blasting and coating industry. A real case is selected as a model, both current and future states of shop-floor production scenarios are discussed using value stream concepts. This is analysed along with calculations of cycle time, work-in-process inventory, and waiting time. A framework of lean improvement is proposed which includes: (1) waste elimination by using techniques of standardisation, supermarket, and pull scheduling system; (2) workforce involvement; and (3) client integration. The results showed that the product delivery rates could be significantly increased through lean implementation.
Keywords: lean production, value stream mapping (VSM), blasting and coating industry, production management, pull scheduling
1 INTRODUCTION Lean production has been applied to many businesses that wish to remain their competitiveness in an increasingly global market. Lean production is designed to eliminate all activities that do not add value throughout the production process (Womack and Jones 2010). Originally, it was developed from car manufacturing in Japan, but the main lean techniques have been applied to a wide variety of other processes in manufacturing, healthcare, construction and service.
Despite the diversity of applications in different production sectors throughout the world, the lean production principles lag within the blasting and coating industry, partly because of particular difficulties of implementation in these types of processes. One of the characteristics of these operations is that product mix grows as the material moves through the process, creating a wide variety of in-process production schedules, making it difficult to apply some traditional lean concepts. Moreover, despite the simple production steps, production planning and control is decided based on manager’s experience. No formal 1 Ph.D. student, Australasian Joint Research Center for BIM, Curtin Univ., Perth, Australia,
[email protected] 2 Ph.D. student, Australasian Joint Research Center for BIM, Curtin Univ., Perth, Australia,
[email protected] 3 Senior Lecture, Australasian Joint Research Center for BIM, Curtin Univ., Perth, Australia,
[email protected] 4 Professor, Australasian Joint Research Center for BIM, Curtin Univ., Perth, Australia,
[email protected] 5 Ph.D. student, Australasian Joint Research Center for BIM, Curtin Univ., Perth, Australia,
217 | Proceedings IGLC | July 2017 | Heraklion, Greece

Application of Lean Production With VSM to the Blasting and Coating Industry
documents are available to track the production progress. Due to the unique features faced in this kind of industry environment, lean production application is a challenge to be adapted.
The purpose of this piece of research is to evaluate the feasibility of existing lean principles by using Value Stream Mapping (VSM) in the blasting and coating industry. VSM is the most efficient tool of lean thinking and has proved its value of increasing process visibility (transparency) (Klotz et al. 2008) and reducing lead time (Tyagi et al. 2015) in many sectors (Shou et al. 2017). VSM is used as the primary tool to identify waste in the process, developing a current map; subsequently, a future map with the proposed improvements is generated, as well as the working plans, used to monitor the implementation project (Rother and Shook 2003).
2 RESEARCH METHODS
To analyze the applicability of lean methodologies in blasting and coating workshop, this research employed the case study method (Yin, 2013). The case study can suitably be used for theory testing and refinement, which allows the study of production management and organizational phenomena in their actual context. In this research, the information for case analysis was collected from semi-structured interviews and direct observation in three days. One complete work order was selected to study the applicability.
3 CASE STUDY The case study was conducted in a steel blasting and coating workshop. The coating company communicates with their clients and upfront steel fabrication companies by telephone and email for orders, and buys painting materials used in the processes according to the blasting and coating requirement provided by the clients. Once the fabricated steel has been loaded on the site, the production in the workshop is responsible for the quality of customized blasting and coating work. The production is daily planned but, relying on the production manager’s experience by referring to deadlines and urgencies required by clients. The production has no planning for the progress for clients.
There are three main parts of the production processes in the workshop: blasting, coating, and delivery. All the blasting is conducted in the one blasting chamber. The client orders are divided into several batches because of the chamber space limitation. Batches are lifted from the storage area and loaded on the trolleys before they are pushed into the blasting chamber and be blasted sequentially. Then the blasted steels are placed at the coating area by crane drivers. However, the coating work doesn’t follow the same batch size as in the blasting process. The painters start the coating work once all the batches have the same coating requirement have been placed on the site. Moreover, the delivery work can only start once all the batches in one order have been completed. Therefore, the work batches have a huge deviation in the processes.
3.1 CURRENT STATE MAP
After carefully collecting the production information, the map of the current process was developed. Figure 1 shows the current state map. The value stream for a typical blasting and coating was mapped in detail, which includes flows of information and material.
1. Information flow:
218 | Proceedings IGLC | July 2017 | Heraklion, Greece

Wenchi Shou, Jun Wang, Peng Wu, Xiangyu Wang and Yongze Song
• The straight arrows represent oral information between processes. The production manager and the supervisor are responsible for every process; so they have a role to inform and approve each production process.
• The broken arrows represent electronic information. Clients make the orders and check the production quality and progress by telephone.
2. Material flow:
• The squares represent each operation with data such as the number of workers, the cycle time (CT), processing time (PT), work in process (WIP), batch size, and waiting time (WT) in each process.
• The crane represents the steel transportation, turnover or loading carried by crane drivers.
• The thick dark arrows represent the in-process material that is pushed to a production process to the next one.
0-2days1batch
3
Abrasiveblasting
2
Primercoatingsideone
1
Primercoatingsidetwo
1-2
Deliver
1
Pullontrolley(driver1)
CT=8minsPT=8minsManpower=1Batchsize=8
CT=8minsPT=8minsManpower=1Batchsize=8
CT=20minsPT=20minsManpower=3WT=0minBatchsize=8
CT=20minsPT=20minsManpower=3WT=0minBatchsize=8
1
Transfer(driver2)
CT=(5,10)minsPT=(5,10)minsManpower=1WT=0minBatchsize=8
CT=(5,10)minsPT=(5,10)minsManpower=1WT=0minBatchsize=8
1
Transfer(driver3)
CT=(26,105)minsPT=(12,25)minsManpower=1WT=80minsBatchsize=8
CT=(26,105)minsPT=(12,25)minsManpower=1WT=80minsBatchsize=8
CT=65minsPT=60minsManpower=2WT=5minsBatchsize=48
CT=65minsPT=60minsManpower=2WT=5minsBatchsize=48
1
Turnover(driver3)
CT=80minsPT=70minsManpower=1WT=10minsBatchsize=64
CT=80minsPT=70minsManpower=1WT=10minsBatchsize=64
Cranedriver2
Cranedriver1 Crane
driver3 Cranedriver3
CT=130minsPT=70minsManpower=1WT=50minsBatchsize=72
CT=130minsPT=70minsManpower=1WT=50minsBatchsize=72
2
Packing(driver4+5)
CT=280minsPT=220minsManpower=2WT=60minsBatchsize=72
CT=280minsPT=220minsManpower=2WT=60minsBatchsize=72
Client
8
Dailyschedule
1
ProductionManager
DailyscheduleDailyscheduleDailyscheduleDailyschedule
Supplier
+1d
1batch 3batches 6batches 8batches 9batches 9batches
20 5-10 12-25 60 70 70 220
Figure 1 Current state map
In the current process map, the need for waiting resulted from the changes of batch size is shown explicitly in Figure 1. Another important waste shown in the process is the accumulation of WIP. This waste is derived from the fact that the overall production is planned and pursued without consideration of the impact of the labour availability and schedule coordination.
As shown in Table 1, it is noted that the total duration of the selected case is 949 minutes, but the total VAT only account for 290 minutes (30.56%). The non-value adding time (NVAT) but necessary work is 471 minutes (49.63%), while the waste is 19.81%.
Table 1: performance analysis
Metrics Percentage Amount of time (mins)
VAT 30.56% 290
NVAT but necessary
49.63% 471
Waste 19.81% 188
Besides, the waste was analysed from the perspective of production line as well. There
are 8 primer coating orders and 6 three coating orders have been processed in the three
219 | Proceedings IGLC | July 2017 | Heraklion, Greece

Application of Lean Production With VSM to the Blasting and Coating Industry
days. However, the number of orders have been delivered is 4 and 1, respectively. Table 2 lists the delivery rate for the orders produced in the three days' observation (delivery rate= the number of material have been delivered / the number of material have been processed). If the quantity of WIP required would be reduced, the delivery rate could also be improved.
Table 2: delivery rate in the data collection period
Types of production
Delivery rate
Primer 50%
Third coating 16.67%
Table 3: Reasons analysis
Reasons of waste Percentage Amount of time (mins)
Lack of planning 37.77% 71
Push schedule 36.57% 65
Worker's low productivity
27.66% 52
As shown in Table 3, one apparent cause of high WIP is that lack of planning. In the
daily work plan, crane drivers and painters are assigned to orders with high priority. However, they reported that the work assignment tends to randomly direct their efforts to those steels in which have been blasted and placed on site. They get another oral work assignment once they have done the current work. It is hard to recognize the priorities without any formal progress record of the work in the workshop.
Push scheduling is another cause of high WIP. Waiting time in production process increased because of the push production progress. Orders with work left (for example, waiting for being coated, turned over, or packed for delivery) are simply not completed due to the push work carried out by limited workforce, thus, remaining as WIP.
Another important reason of high WIP has been observed is the low productivity of the crane driver. The transfer and placement work conducted by crane driver 3 didn't follow the same batch size. The increased transfer time because of the reduced batch size (the reduced number of steels that have been transferred at one time) raised the WIP.
In summary, the existing process exhibited various forms of waste, different batch sizes, low success delivery rate and high levels of WIP.
3.2 FUTURE STATE MAP
Looking at the current state map for blasting and coating work several things stand out: (a) significant waiting time, (b) the low success delivery rate, and (c) each process producing to its own schedule, large WIP caused by in-process workforce and schedule constraints. WIP and low delivery rate may be viewed as two related issues since the more the WIP, the longer any processed order must wait for its turn of next process and thus, the lower the delivery rate. In creating the ideal future state map, this research tries to identify solutions to drive both of these down while looking at the schedule across the
220 | Proceedings IGLC | July 2017 | Heraklion, Greece

Wenchi Shou, Jun Wang, Peng Wu, Xiangyu Wang and Yongze Song
entire value stream. There are eight guidelines to introduce lean thinking into a value stream, according to Rother and Shook (2003). Applying them to this case study, we proposed the following improvement framework to the production processes (as shown in Figure 2). The wastes have been identified are listed in the framework. Lean practices have been proposed from three perspectives: waste elimination, workforce involvement, and client integration. Due to the limited space, the improvement strategies of workforce involvement and client integration will not be addressed further in this paper. The three lean measures were discussed in detail in the following sections.
LeangoalsIncreaseproductivityandimprovequalitytoincreasecustomervalue&profit
Wasteidentified
DelaycausedbythesuccessorpaintworkDelaycausedbythesitepreparationDelaycausedbypaintpreparationDelaycausedbypaintdrytimeDelaycausedbyqualitycheckwork
Leansolutions
Eliminationofwaste IntegrationofclientCreativeinvolvementoftheworkforce
Leanpractices
• Supermarket• Standardoperations• Pullschedulingsystem
• JITdeliveries• Client
rationalisation
• Team-basedproblemsolving• Worker-drivenkaizen• Training
Pushscheduling
Lackofplanning
Workers’lowproductivity
Delaycausedbypainterunavailable(workforceconstraints)Delaycausedbycranedriverunavailable(workforceconstraints)
Delaycausedbydriver’slowproductivity
Figure 2: Framework of lean improvement
1. Supermarket
Before the coating process, the production in the workflow can be continuous since the materials move in the same batch size. At the coating, however, the blasted steel can merge and move through one of many possible routines based on the required coating standard and workers’ experience. Different cycle time and batch size of the coating work, make it difficult to introduce continuous flow in this process. Meanwhile, the subsequent processes of turnover, second side of coating and delivery are restricted to different schedules depending on product shape, workforce availability and orders coordination. Therefore, it is unrealistic to join these processes to obtain a continuous flow. The focus at the end of
221 | Proceedings IGLC | July 2017 | Heraklion, Greece

Application of Lean Production With VSM to the Blasting and Coating Industry
transfer process should be on developing a system to enable pull by the customer, rather than continuous flow.
A “supermarket” is a buffer located at the process where continuous flow is not available. The recommendation is that steel produced to a supermarket (store at the coating area) and whenever the supermarket inventory is higher than a certain level this would trigger the coating process.
The introduction of supermarkets that are controlled by a Kanban system forces the entire coating to pace every process to the speed of the bottleneck (to match the coating pace with blasting time), which as the current state map indicated that it is located between the blasting and coating. Thus the coating begins to take on the characteristics of a production line where batches start to flow rather than stop and start.
The second supermarket is recommended to stabilize the second side of coating process for the turned over material. The inventory after turned over and before second side of coating is large. This is because the painters start the second side of coating after all the batches in one order have been turned over. It is necessary to set up a supermarket to accommodate progress coordination (that is coordinate the work of turnover and second side coating). Again, a Kanban pull system can be used to regulate second side of coating start time.
The Kanban at the supermarkets follow the standard rules of a pull system. For example, the painter is allowed to process the other work in the workshop as long as there is an empty spot in the supermarket for the transferred steel. By definition, if the supermarket is less than its capacity then this means that the steel batches does not need painting.
2. Standard operation
Standard operation procedures are designed to reduce waste in scheduling activities. Work standards show what, where, when, who and how tasks should be carried out to ensure customer satisfaction.
Currently, the steel being processed in workshop displaying a unique functionality, configuration, and size. The production processes of coating, turnover, etc. are operated based on the operators’ skills and experience accordingly. Therefore, the purpose of this method is to use rigorous process standardization of difference coating system to reduce variation, thereby creating both flexibility and predictable outcomes.
Standard operation routine sheets could be used to show the time relationship between the workers and the production system. The information required to create the routine sheet are the time it takes a painter to finish one side painting, the paint dry time of the different paint standards, etc. The processing data can summarize from (1) statistic data analysis: manual data record and summary; (2) feedback from worker based on their experience.
The standard processing procedure and time framework of primer, second, and third coating system is formatted by reducing the interval time between two sides painting, the interval time from a finished round of coating to next round of coating, and the waiting time before delivery.
3. Pull scheduling system
A pull system is one in which the control of information flows in the opposite direction to the material flow. To eliminate the waste caused by the conflict of workforce in the production process and increase the transparency of the production schedule, future state improvement develops a pull scheduling system to replace the dictated schedule plan created by the production manager. The push-driven sequence of work is replaced with a
222 | Proceedings IGLC | July 2017 | Heraklion, Greece

Wenchi Shou, Jun Wang, Peng Wu, Xiangyu Wang and Yongze Song
sequence designed by the availability of stable production information. The production manager works with estimator assessing the maturity of the order, and releases work order to the schedule according to a continuously updated list of information. Ideally, the work order is not introduced into the production process unless all the conditions for its completion have been completely fulfilled (e.g. the material arrival and delivery time is confirmed respectively, the procurement of paint has done, and the paint is stored on site). A daily and weekly production schedule will be created based on the information provided. Pull scheduling with the input of customer orders plus ongoing work in the workshop, which creates a set of prioritized orders.
Pull priority (human resource assignment and start time) setting:
• Level 1: Delivery at the same day
• Level 2: Delivery at the next day
• Level 3: Delivery at the third day
The pull scheduling system has two significant potential benefits:
• The waste of waiting caused by human resource conflict is essentially eliminated. Production work in process are not executed according to the daily work job assigned from production manager or randomly assigned in the workshop, but are instead always performed according to the priority setting.
• WIP is controlled. The desired level can be determined roughly by multiplying (1-the required delivery rate (on the overall production schedule)) by the number of the daily order be processed.
In practice, each batch/order requires a unique sequence of production, each with varying durations and often with different procedures. The rate of introduction of “mature” order into the system depends on the arrival time and the clients’ decision making and may therefore also be irregular. These sources of variation can be coped with in some ways: (1) by planning buffers of stable work; (2) with flexible labor resource strategies. The sequence of production can be prioritized for release not only regarding delivery time but also regarding the probability of coating work are likely to be reached considering other factors (e.g. weather and the dry time required for different paint thickness). In this way, orders with less than 100% production information can be released when necessary. Time buffer between procedures should be monitored and reduced to a minimum necessary to avoid unacceptable extension of lead time.
4 RESULTS OF LEAN PRODUCTION
The implementation of the future state is ongoing in the case study company. A three months kaizen plan was formulated to break the application into steps and to provide a time frame for improvements. The objectives of each phase were outlined as follows:
• Standardize work process with the assistant of standard operation routine sheets and educate the site workers to eliminate handover problems;
• Implement Kanban to raise the schedule control;
• Reduce waiting time between processes to the level shown on the future state map;
• Establish supermarket-based pull flow in the whole process with the consideration of standardized production processes;
• Involve client in the process to have the just in time levels of both input and output
223 | Proceedings IGLC | July 2017 | Heraklion, Greece
Application of Lean Production With VSM to the Blasting and Coating Industry
The expected results for the industry after this piece of research and analysis of the
application of lean production techniques to produce blasting and coating can be deduced. The analysis of production data from the workshop that adopted the pull schedule showed that the duration of production had a slight reduction, but that the delivery rates have increased dramatically. The delivery rate during the same measurement period has increased to 76.5%, 54% of the primer and third coating system respectively.
5 CONCLUSION
The applicability of lean production techniques in the blasting and coating industry has been presented, with the aim of improving the production process efficiency. First, VSM has been used as the primary tool to identify process wastes, and the present and future maps have been developed, as well as an analysis of the estimated results of the application in the workshop. Second, as an example of the application of the methodology, a plan has been developed to implement it in three months, structured in several steps.
The key issues derived from the proposed methodology, those that can be considerably improved by its application, are the inventory reduction, the appropriate schedule management, and elimination of the waiting time. These problems, which were presented in this case study can be considered as the key for the extrapolation of the proposed methodology and the expected results to other process industries.
It should be noted that due to the rising recognition of offsite construction and prefabrication in the construction industry, this study provides useful insights into the use of VSM in determining the scheduling of offsite construction and prefabrication due to its repetitive nature. It is recommended that future studies should focus on generalizing the use of VSM in the construction industry by also considering non-repetitive and non-typical activities.
6 REFERENCE Klotz, L., Horman, M., Bi, H. H. & Bechtel, J. (2008) The impact of process mapping on
transparency. International Journal of Productivity and Performance Management, 57(8), 623-636.
Rother, M. & Shook, J. (2003) Learning to see: value stream mapping to add value and eliminate muda, Lean Enterprise Institute.
Tyagi, S., Choudhary, A., Cai, X. & Yang, K. (2015) Value stream mapping to reduce the lead-time of a product development process. International Journal of Production Economics, 160, 202-212.
Wenchi, S., Wang, J., Wang, X. & Chong, H.-Y. (2015) An application of value stream mapping for turnaround maintenance in oil and gas industry: Case study and lessions learned, Procs 31st Annual ARCOM Conference. Lincoln, UK, 7-9 September, 2015. Association of Researchers in Construction Management.
Wenchi, S., Wang, J., Wu, P., Wang, X. & Chong, H.-Y. (2017) A cross-sector review on the use of Value Stream Mapping. International Journal of Production Research
Womack, J. P. & Jones, D. T. (2010) Lean thinking: banish waste and create wealth in your corporation, Simon and Schuster.
Yin, R. K. (2013) Case study research: Design and methods, Sage publications.
224 | Proceedings IGLC | July 2017 | Heraklion, Greece

PEOPLE, CULTURE, AND CHANGE TRACK
Track Chair:
Zofia Rybkowski
Texas A&M University
225 | Proceedings IGLC | July 2017 | Heraklion, Greece

226 | Proceedings IGLC | July 2017 | Heraklion, Greece

Binninger M., Dlouhy J., Oprach S., and Haghsheno S. (2017). “Learning Simulation Game for Takt Planning and Takt Control” In: LC3 2017 Volume II – Proceedings of the 25th Annual Conference of the International Group for Lean Construction (IGLC), Walsh, K., Sacks, R., Brilakis, I. (eds.), Heraklion, Greece, pp. 227–233. DOI: https://doi.org/10.24928/2017/0088
LEARNING SIMULATION GAME FOR TAKT PLANNING AND TAKT CONTROL
Marco Binninger1, Janosch Dlouhy 2, Svenja Oprach 3, and Shervin Haghsheno4
Abstract: The methods of Takt Planning and Control are applied in many companies. When conducting trainings with employees, subcontractors and clients the topic of Lean Construction is often imparted. The difficulty often lies in teaching abstract concepts to participants in a way that is clear and that reflects reality. A simulation game supports teaching, by its simplified description of real processes and helps transfer the method into practice. A good example is the Villego™ simulation game for the use of the Last Planner System. At Karlsruhe Institute of Technology (KIT) a learning simulation game comprising three rounds was developed. Presenting Takt Planning and Control in a production facility, it includes a scale model of a real project. In addition to tasks for the construction manager and various trades, roles for the client, health and safety manager and quality manager were integrated. This article describes the development, the game instructions and the empirical evaluation of the benefits in using Lean in the simulation game. It has been successfully tested multiple times and implemented for training by a number of companies. It offers the potential to make the method of Takt Planning and Takt Control more accessible and easier to understand.
Keywords: Learning Simulation Game, Lean Game, Takt Planning, Takt Control.
1 INTRODUCTION Trainings based on pure theory assume the approach that "knowledge is a result of learning facts and routines" (Mandl et al. 2015, p.65). Modern approaches toward learning focus on reflective skills and needs-based learning through a combination of theory and practice (Pellicer and Ponz-Tienda, 2014). The knowledge learned in simulation games can be used to actively test the theory in a simplified form. Examples of well-known simulation games for the construction industry include the Villego™ simulation game developed for the Last-Planner System (Villego). Other examples include the game Parade of Trades (Tommelein et al. 1998), which shows variance between parameters together with system effectiveness and the game for Location-Based Management System from Seppänen (2012). These games have been documented and analysed in academia.
Some games and trainings in the field of Takt Planning and Takt Control have been developed by consultancies or by companies internally. According to the research of the authors there has been little scholarly documentation or analysis of trainings of this
1 Research Fellow, Karlsruher Institute of Technology, Germany, [email protected] 2 Research Fellow, Karlsruher Institute of Technology, Germany, [email protected] 3 Team Lean Construction, BMW AG, Germany, [email protected] 4 Professor, Karlsruher Institute of Technology, Germany, [email protected]
227 | Proceedings IGLC | July 2017 | Heraklion, Greece

Learning Simulation Game for Takt Planning and Takt Control
nature. Also according to Hirota and Formoso (1998) it is not trivial to incorporate Lean Construction principles and approaches in trainings in an understanding way and so that old thinking patterns, even of professionals, can be abandoned.
Within the framework of research at the Karlsruhe Institute for Technology (KIT) a training concept for the topic area of Takt Planning and Takt Control was developed. A simulation game based on a real project in the industrial sector supports the development of learning content.
2 GOAL OF THE TRAINING
In the modern (working) world, it is generally no longer sufficient to rely upon a single set of knowledge and skills learnt in the past (Kriz 2006). There is a demand for the ability to self-organise and make decisions to solve open problems (Erpenbeck und Rosenstiel 2003). For this reason, there is a need to develop understanding and a basis for being able to respond according to any given situation at a later date.
The primary goals of the training are providing a foundation in the methods of Takt Planning and Takt Control and an application based on the ‘Three Level Model’ (Dlouhy et al. 2016). The secondary goal is to develop an understanding of Lean principles. The Lean values should be known and participants should have a basic feeling for value creation and waste. A simulation game plays a important role and can be beneficial to implementing these Lean principles (Heyl 2015, Choomlucksana 2013). Soft factors such as team building, commitment, value to the client, communication and collaboration are also taught.
The implementation of the simulation game helps to reduce skepticism regarding transferability of Lean principles to construction projects. If a participant does not begin with this openness, the effectiveness of learning and absorption of knowledge remain low.
3 DEVELOPMENT OF THE SIMULATION GAME The development of the simulation game was oriented toward the five levels of reality according to Kriz (2003). Based on the real world, these are applicable from the design of the simulation game to its execution, debriefing, meta-debriefing and evaluation.
• Real World: The first level of reality reflects the real world, a relevant piece of which has been selected for the simulation game.
• Design phase: During the design phase this real world is transferred to a model. Here through conscious or subconscious reduction of complexity, reality may be distorted. This results in a second level of reality. The design phase ends with a construction of a prototype, which should be tested to be reviewed and modified.
• Execution of the simulation game results in a simulated reality - the third level of reality. The participants operate within the second level of reality provided by the simulation model, but are influenced by their knowledge and experience from the real world - the first level of reality - which they recognise during the simulation game.
• The debriefing allows for the transfer of the resultant simulation game reality back to the real world. The fourth level of reality is derived by comparing the first and third level of reality.
228 | Proceedings IGLC | July 2017 | Heraklion, Greece
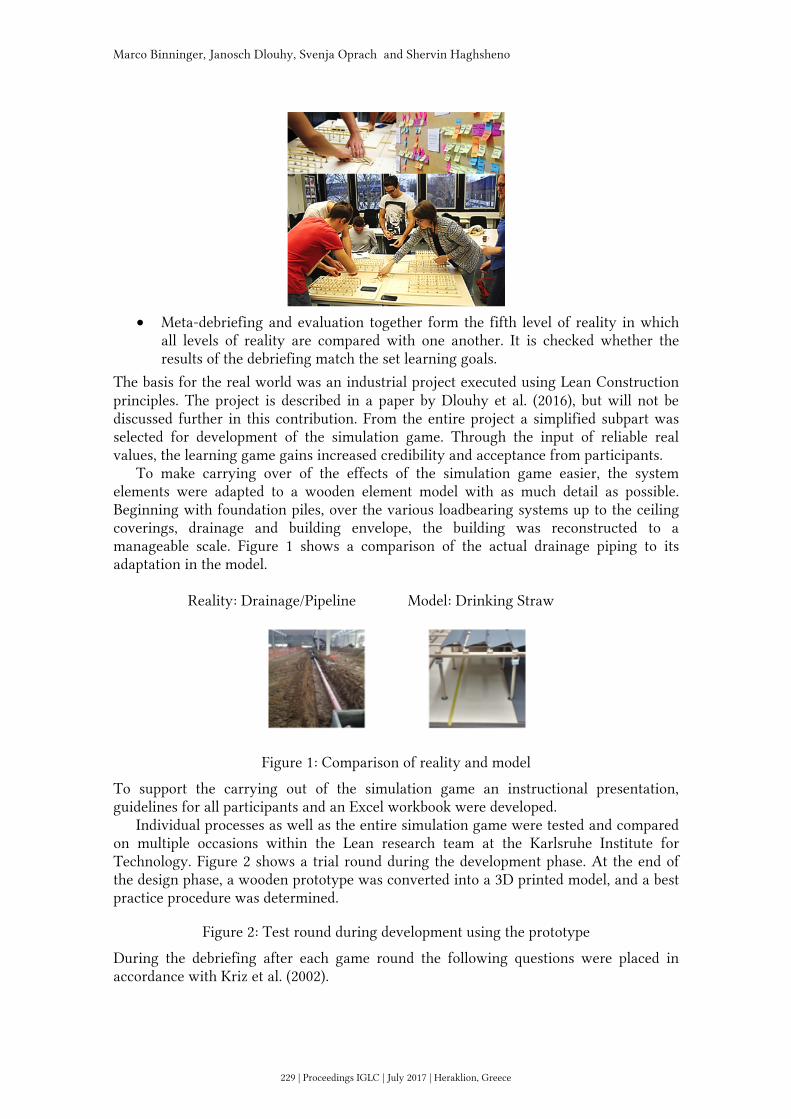
Marco Binninger, Janosch Dlouhy, Svenja Oprach and Shervin Haghsheno
• Meta-debriefing and evaluation together form the fifth level of reality in which all levels of reality are compared with one another. It is checked whether the results of the debriefing match the set learning goals.
The basis for the real world was an industrial project executed using Lean Construction principles. The project is described in a paper by Dlouhy et al. (2016), but will not be discussed further in this contribution. From the entire project a simplified subpart was selected for development of the simulation game. Through the input of reliable real values, the learning game gains increased credibility and acceptance from participants.
To make carrying over of the effects of the simulation game easier, the system elements were adapted to a wooden element model with as much detail as possible. Beginning with foundation piles, over the various loadbearing systems up to the ceiling coverings, drainage and building envelope, the building was reconstructed to a manageable scale. Figure 1 shows a comparison of the actual drainage piping to its adaptation in the model.
Reality: Drainage/Pipeline Model: Drinking Straw
Figure 1: Comparison of reality and model
To support the carrying out of the simulation game an instructional presentation, guidelines for all participants and an Excel workbook were developed.
Individual processes as well as the entire simulation game were tested and compared on multiple occasions within the Lean research team at the Karlsruhe Institute for Technology. Figure 2 shows a trial round during the development phase. At the end of the design phase, a wooden prototype was converted into a 3D printed model, and a best practice procedure was determined.
Figure 2: Test round during development using the prototype
During the debriefing after each game round the following questions were placed in accordance with Kriz et al. (2002).
229 | Proceedings IGLC | July 2017 | Heraklion, Greece
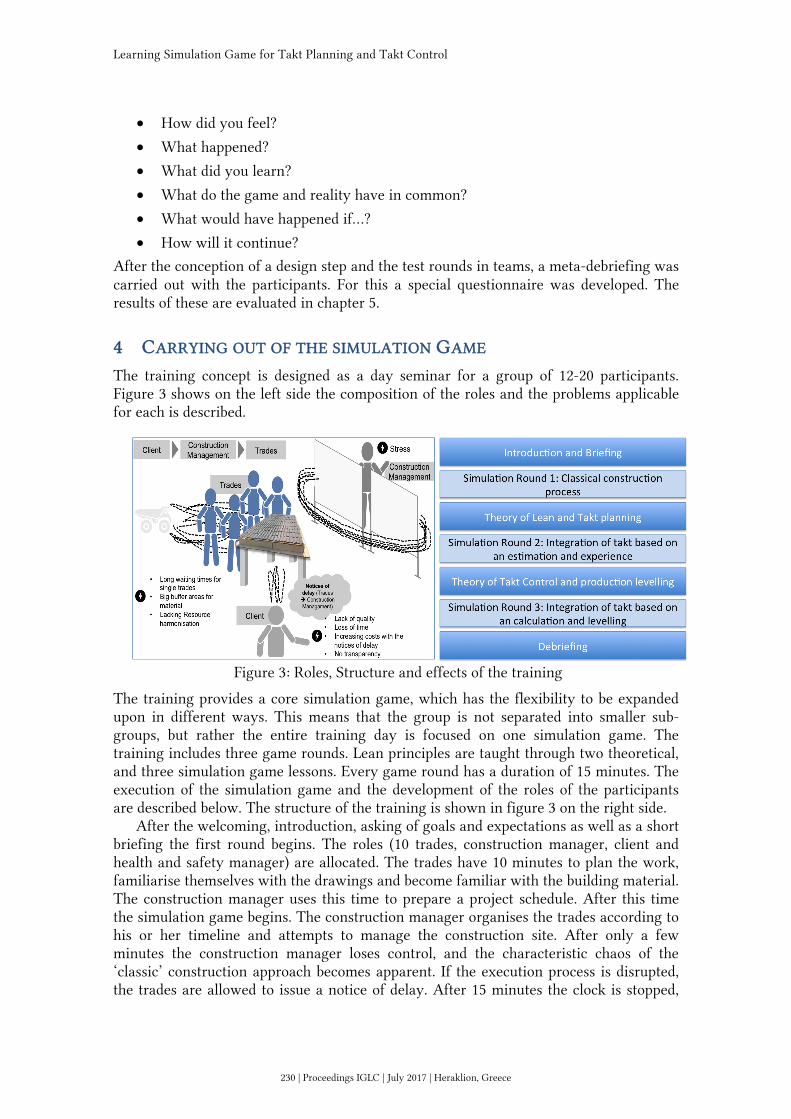
Learning Simulation Game for Takt Planning and Takt Control
• How did you feel?
• What happened?
• What did you learn?
• What do the game and reality have in common?
• What would have happened if…?
• How will it continue?
After the conception of a design step and the test rounds in teams, a meta-debriefing was carried out with the participants. For this a special questionnaire was developed. The results of these are evaluated in chapter 5.
4 CARRYING OUT OF THE SIMULATION GAME The training concept is designed as a day seminar for a group of 12-20 participants. Figure 3 shows on the left side the composition of the roles and the problems applicable for each is described.
Figure 3: Roles, Structure and effects of the training
The training provides a core simulation game, which has the flexibility to be expanded upon in different ways. This means that the group is not separated into smaller sub-groups, but rather the entire training day is focused on one simulation game. The training includes three game rounds. Lean principles are taught through two theoretical, and three simulation game lessons. Every game round has a duration of 15 minutes. The execution of the simulation game and the development of the roles of the participants are described below. The structure of the training is shown in figure 3 on the right side.
After the welcoming, introduction, asking of goals and expectations as well as a short briefing the first round begins. The roles (10 trades, construction manager, client and health and safety manager) are allocated. The trades have 10 minutes to plan the work, familiarise themselves with the drawings and become familiar with the building material. The construction manager uses this time to prepare a project schedule. After this time the simulation game begins. The construction manager organises the trades according to his or her timeline and attempts to manage the construction site. After only a few minutes the construction manager loses control, and the characteristic chaos of the ‘classic’ construction approach becomes apparent. If the execution process is disrupted, the trades are allowed to issue a notice of delay. After 15 minutes the clock is stopped,
230 | Proceedings IGLC | July 2017 | Heraklion, Greece

Marco Binninger, Janosch Dlouhy, Svenja Oprach and Shervin Haghsheno
and the status of completion is recorded. Only isolated parts of the building are finished. Additionally, the participants are asked for their impressions and knowledge gained.
In connection to round 1 of the game a lesson is given on the content of Lean Construction. It is attempted to incorporate the Lean principles of flow and pull by determining the sequence of works (process analysis). In addition, a Takt time is estimated, and an attempt is made to introduce the zero defects principle in the form of short-cycled inspections.
Building on the theory, the information learned in the first part are integrated within the second round. The construction manager again has some minutes to develop a construction strategy. The build-up and execution of the simulation game is the same, but the trades move through the building systematically according to the execution plan developed, and attempt to keep to the predetermined Takt. However, after some minutes the contractors no longer keep to the Takt, and from the perspective of the construction manager the level of control is as chaotic as in the first round. There is no time for short-cycled inspections as the construction manager is occupied with solving problems. In this round, large parts of the building are completed, which still often do not fulfil the prioritisation of the client.
In the second theory session, which follows, the topic of improved control is explored in greater detail and instruments such as a Takt Control board or a Takted production plan are introduced. The duration of individual trades is analysed and the level of effort determined. With the help of these tools the works are Takted (Haghsheno et al., 2016). The bottlenecks in production are eliminated to allow for an optimised flow.
Round 3 is carried out in the same way, but the site is managed with the help of a regular, short-cycle Takt Control board. After some minutes the focus of the construction manager shifts from reactive coordination to a proactive and anticipative approach. This also allows space to develop improvements in quality. In this round the building is usually fully completed ahead of schedule.
5 EMPIRICAL AND QUALITATIVE ASSESSMENT More than 100 participants over 15 trainings were surveyed for feedback. The participants included both German and foreign project managers, architects, general contractors, subcontractors, technical specialists, designers and project controllers. The questionnaire was divided into two parts with 15-20 closed questions in each. The first and second parts of the questionnaire were filled out at the start and beginning of the training respectively.
The majority of the participants in the simulation game had long-term experience in the construction industry (56% with more than 10 years, 26% with 5-10 years and 18% with less than five years). Furthermore 77% had not yet gained any experience with Lean projects. Before completing the training only half (54%) were convinced of the need to implement Lean Construction in their projects. 100% found physical simulation game helpful for delivering learning content.
The first part of the questionnaire asked participants for compare the importance of time, cost and quality. 80% believed that time had the highest priority in industrial projects. Cost was named as the next most significant factor, and quality the least important.
However, participants only gave a low to medium rating to their own knowledge of Takt Planning. Many were also often dissatisfied with the results of time planning, but were aware that their influence on time planning is significant.
231 | Proceedings IGLC | July 2017 | Heraklion, Greece

Learning Simulation Game for Takt Planning and Takt Control
The relevance of keeping to a schedule shows that the focus of the game should be time planning. In particular, the evaluation of soft factors supports the use of Takt Planning and Takt Control in the simulation game: Area prioritisation, transparency, trust and process flexibility were rated as very important in comparison to product flexibility. Takt Planning and Takt Control support prioritisation of areas through defining Takt areas according to the client's priorities. Takt Planning enables a high level of transparency for all project stakeholders. The visualisation of the Takt Plan allows possible alternative processes to be quickly visible, which allow Takt Control a high degree of process flexibility. The trust of all project stakeholders is strengthened by the means of representation, collaboration and transparency.
In the second part of the questionnaire achieved learning outcomes were surveyed. The complexity of the simulation game was rated as appropriate by 67% of the participants surveyed. The 15-minute duration of the rounds was considered appropriate by 83%. The balance between theory and practice was rated appropriate by 100%. All participants also agreed the simulation game clearly or to some extent provide a real building project in simplified form. Surveying of client priorities was rated as clearly apparent by 83%. On average there is a clear improvement in time planning between the three rounds. A comparison of rounds 1 and 2 show that in round 1 only 4-20% of simulations were fully completed, whereas in round 2 the percentage was 80-100%. Further on from round 2 to round 3 the time of completion improve from about 15:00 to 12:00 minutes. Through an analytic and mathematical approach of the third round, the size of Takt areas and Takt time were reduced by two thirds. Through implementation of Takt Control the areas could reach close to 100% of the calculated potential. In every round completed there was a clearly measurable trend toward a reduction in time. In the debriefings after each round, soft Lean factors such as trust, stability, transparency and collaboration were recognised.
Table 1 shows the improvements by the pre-defined KPIs from round to round.
Table 1: Average key performance indicators (KPI) during the three simulation game rounds
KPI 1st round 2nd round 3rd round
Deviation notices 30 10 0
Accidents 4 1 0
Level of completion 4-20% 80-100% 100%
Completion time >15 min. 15 min. 12:00 min
Fulfilment of the clients value
0% 50% 100%
6 CONCLUSION AND OUTLOOK The training and simulation game are a fixed part of a large property development organisation, which has implemented this system. This system has also been implemented as part of teaching at the Karlsruhe Institute of Technology. Preliminary enquiries have been made by further interested companies. Presently the training is focused on a small sub-process - construction of the shell for a production facility.
232 | Proceedings IGLC | July 2017 | Heraklion, Greece

Marco Binninger, Janosch Dlouhy, Svenja Oprach and Shervin Haghsheno
Broadening of the simulation game to preceding process steps such as design, approvals or logistics as well as succeeding process steps such as fit-out is possible. Of the participants surveyed, 67% agree for the need to broaden the simulation game for fit-out and installation works. Additionally, 22% would like to see incorporation of the equipment installation process in production facilities, and 11% would also like to incorporate the deconstruction processes.
At present a continuation of the simulation game to include fit-out and installation works is being developed.
7 REFERENCES
Choomlucksana, J. (2013): A study of the impact of collaborative and simulation sessions on learning Lean principles and methods. PhD. Oregon State University USA.
Dlouhy, J. , Binninger, M. , Oprach, S. & Haghsheno, S. 2016, 'Three-Level Method of Takt Planning and Takt Control – a New Approach for Designing Production Systems in Construction' In:, 24th Annual Conference of the International Group for Lean Construction. Boston, USA, 20-22 Jul 2016.
Erpenbeck, John; Rosenstiel, Lutz von (Hg.) (2003): Handbuch Kompetenzmessung. Erkennen, verstehen und bewerten von Kompetenzen in der betrieblichen, pädagogischen und psychologischen Praxis. Stuttgart: Schäffer-Poeschel. (Manual measuring skills. Recognise, understand and evaluate skills in occupational, educational and psychological practice)
Haghsheno, S. , Binninger, M. , Dlouhy, J. & Sterlike, S. 2016, 'History and Theoretical Foundations of Takt Planning and Takt Control' In:, 24th Annual Conference of the International Group for Lean Construction. Boston, USA, 20-22 Jul 2016.
Heyl, J.V. 2015, 'Lean Simulation in Road Construction: Teaching of Basic Lean Principles' In:, Seppänen, O., González, V.A. & Arroyo, P., 23rd Annual Conference of the International Group for Lean Construction. Perth, Australia, 29-31 Jul 2015. pp 403-412.
Hirota, E.H. & Formoso, C.T. 1998, 'Some Directions for Developing Construction Management Training Programmes on Lean Construction' In:, 6th Annual Conference of the International Group for Lean Construction. Guarujá, Brazil, 13-15 Aug 1998.
Kriz, Willy C. (2003): Creating Effective Interactive Learning Environments through Gaming Simulation Design. In: Journal of Simulation & Gaming 34 (4), p. 117–134.
Kriz, Willy C. (2006): Systemkompetenz als Zieldimensionkomplexer Simulationen. (System competence as target dimension of complex simulations) In: bwp@ Berufs- und Wirtschaftspädagogik - online (10). Online available at http://www.bwpat.de/ausgabe10/land_siemon_bwpat10.pdf.
Kriz, Willy C.; Nöbauer, Brigitta (2002): Teamkompetenz. Konzepte, Trainingsmethoden, Praxis (Team competence. concepts, training methods, practice). Göttingen: Vandenhoeck & Ruprecht. Online available at http://www.socialnet.de/rezensionen/isbn.php?isbn=978-3-525-46162-4.
Mandl, Heinz; Geier, Boris; Hense, Jan (2015): Planspiele und Serious Games -Basis einer neuen Lernkultur. Aufl. Bonn, Bielefeld: Bundesinst. für Berufsbildung; Bertelsmann, p. 65–70. (Simulations and Serious Games as basis of a new learning culture.)
Pellicer, E. & Ponz-Tienda, J.L. 2014, 'Teaching and Learning Lean Construction in Spain: A Pioneer Experience' In:, Kalsaas, B.T., Koskela, L. & Saurin, T.A., 22nd Annual
233 | Proceedings IGLC | July 2017 | Heraklion, Greece

Learning Simulation Game for Takt Planning and Takt Control
Conference of the International Group for Lean Construction. Oslo, Norway, 25-27 Jun 2014. pp 1245-1256
Seppänen, O. 2012, 'A Production Control Game for Teaching of Location-Based Management System's Controlling Methods' In:, Tommelein, I.D. & Pasquire, C.L., 20th Annual Conference of the International Group for Lean Construction. San Diego, USA, 18-20 Jul 2012
Tommelein, I.D. , Riley, D. & Howell, G.A. 1998, 'Parade Game: Impact of Work Flow Variability on Succeeding Trade Performance' In:, 6th Annual Conference of the International Group for Lean Construction. Guarujá, Brazil, 13-15 Aug 1998.
Villego (n.d.). Villego – Last Planner Simulation. www.villego.com Available at: [Accessed 06 Mar. 2017].
234 | Proceedings IGLC | July 2017 | Heraklion, Greece

Bolpagni M., Burdi L., and Ciribini A. L. C. (2017). “The Implementation of Building Information Modelling and Lean Construction in Design Firms in Massachusetts and its Correlation with Client's Requirements.” In: LC3 2017 Volume II – Proceedings of the 25th Annual Conference of the International Group for Lean Construction (IGLC), Walsh, K., Sacks, R., Brilakis, I. (eds.), Heraklion, Greece, pp. 235–242. DOI: https://doi.org/10.24928/2017/0310
THE IMPLEMENTATION OF BUILDING INFORMATION MODELLING AND LEAN CONSTRUCTION IN DESIGN FIRMS IN
MASSACHUSETTS
Marzia Bolpagni1, Luciana Burdi2, and Angelo Luigi Camillo Ciribini3
Abstract: It is not easy to evaluate Building Information Modelling (BIM) and Lean Construction (Lean) capabilities of design firms. The paper investigates the level of BIM and Lean implementation at representative design firms in Massachusetts. A survey was given to the principal design firms working for a large public client. First, answers were analysed and discussed. Second, results from the same design firm were compared to detect possible inconsistencies. Main results show that there is still not a clear definition of BIM and Lean; BIM training is not done consistently within design firms; and there is not a common understanding of BIM and Lean within each design firm, even though most designers affirmed that they have internal standards. Results of the survey could be useful for designers to develop internal standards and establish training courses for the design firm and clients to better understand designers’ approach to BIM and Lean.
Keywords: Building Information Modelling, Lean Construction, Design Firm.
1 INTRODUCTION Building Information Modelling (BIM) can be defined as a set of technologies, processes and policies enabling multiple stakeholders to collaboratively design, construct and operate a facility in virtual space (Succar 2017). BIM deals with the entire life cycle of a facility and all parties involved have to collaboratively work together (Eastman et al. 2011).
In order to maximise profit by maximising efficiency and removing waste of resources, the construction sector has started to adopt the Lean thinking originated in Japanese manufacturing (Asri and Nawi 2015). Lean Construction (also called Lean) refers to the adaptation and application of principles coming from the Toyota Production System to the design and construction process (Sacks et al. 2009). Lean Construction can be defined as a set of new processes that increases the efficiency of construction by providing better value to the client and decreasing waste from the process (Dave 2013). Building Information Modelling and Lean Construction have been separately developed (Sacks et al. 2010). However, they have been recently analysed together (Ahuja et al. 2014; Alarcon et al. 2013; Arayici et al. 2011; Bhatla and Leite 2012; Clemente and Cachadinha 2013; Dave 2013; Dave et al. 2013a; Dave et al. 2013b; Hamdi and Leite 2012; Khan and Tzortzopoulos 2014; Oskouie et al. 2012; Sacks et al. 2010; Sands and Abdelhamid 2012), but there can be a 1 PhD Candidate, Department of Architecture, Built Environment and Construction Engineering,
Politecnico di Milano, Milano, Italy, [email protected] 2 Adjunct Assistant Professor, Department of Civil and Environmental Engineering, Worcester
Polytechnic Institute, Worcester, Massachusetts, USA, [email protected] 3 Full Professor, Department of Civil, Environmental, Architectural Engineering and Mathematics,
University of Brescia, Brescia, Italy, [email protected]
235 | Proceedings IGLC | July 2017 | Heraklion, Greece

The Implementation of Building Information Modelling and Lean Construction in Design Firms in Massachusetts
strong synergy between Lean and BIM during the whole life cycle of a project (Dave et al. 2013b).
Designers play an important role in the entire design and construction process, however, it is not always easy to evaluate BIM capabilities of design firms. Succar et al. (2013) developed an assessment framework for BIM competency evaluations of individuals and organisations, and several surveys have been carried out in the past (such as the NBS in the UK (2015) and the McGraw-Hill Construction in USA (2012)). However, it is still not easy to determine whether employees of the same design firm have a common understanding of BIM and Lean.
For this reason, the paper investigates the level of BIM and Lean implementation at design firms working for a large client in Massachusetts.
2 METHODOLOGY
In order to gather empirical data on the current use of BIM and Lean in design firms in Massachusetts, a deductive approach based on an online survey was used. The survey was given to the principal design firms working for a large public client that requires the use of BIM and Lean. Design firms were selected based on their ability to manage a BIM-based process on previous projects. The survey was open to several BIM experts working in the same company (e.g., BIM Directors, BIM Managers, and BIM Specialists). In this way, it was possible to analyse whether employees have a common understanding of BIM and Lean. Survey respondents were contacted via email and a link to the online survey was provided. All questions were closed-ended and SurveyMonkey© was selected to manage the online survey. Separate collectors were created for each design firm to compare anonymous answers. The online questionnaire was accessible for three months starting in November 2015.
A total of seven design firms took part to the survey. Nineteen professionals filled out the survey, but only seventeen completed the entire survey. For this reason, only the seventeen completed surveys were analysed.
The survey contained 20 questions covering the following main topics:
• General information
• BIM-based tools
• BIM training sessions
• BIM standards
• BIM and Lean integration
• Model Checking
• Client’s requirements on BIM
3 THE IMPLEMENTATION OF BIM AND LEAN IN DESIGN FIRMS
This section presents results of the survey. First, all answers are analysed and discussed. Second, results of the same design firm are compared to detect possible inconsistencies.
3.1 Current use of BIM
3.1.1 General Information
This section included the following questions:
236 | Proceedings IGLC | July 2017 | Heraklion, Greece
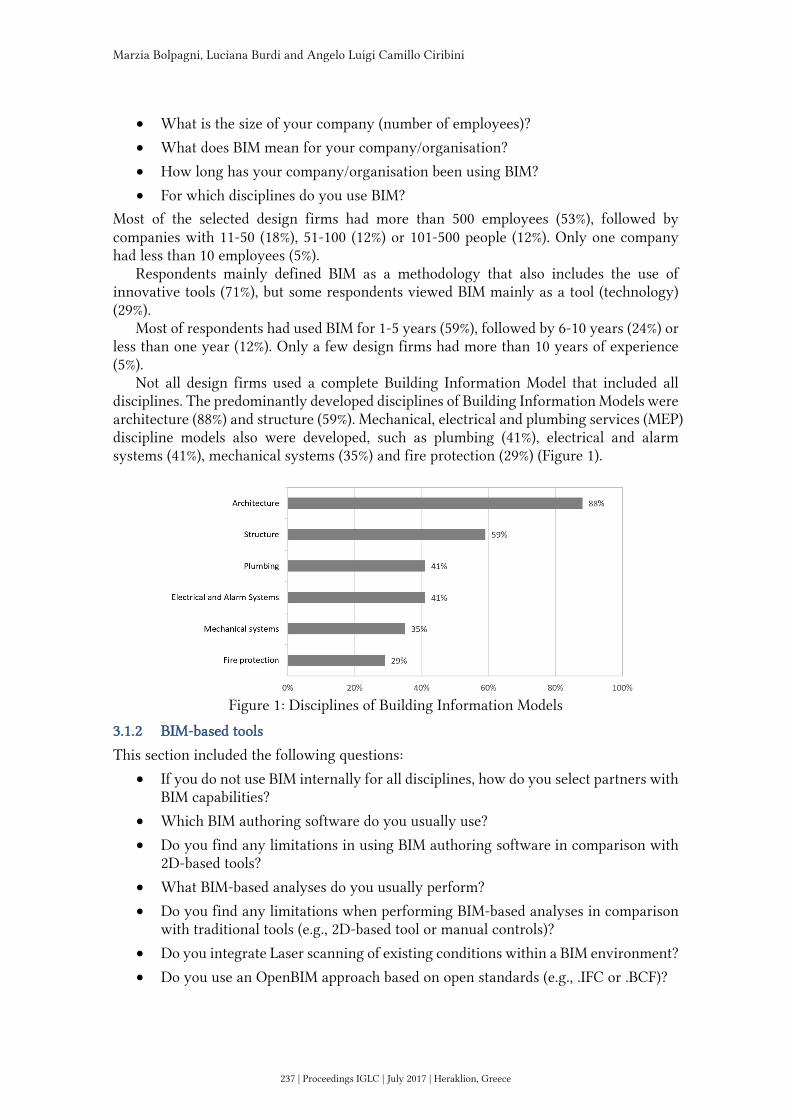
Marzia Bolpagni, Luciana Burdi and Angelo Luigi Camillo Ciribini
• What is the size of your company (number of employees)?
• What does BIM mean for your company/organisation?
• How long has your company/organisation been using BIM?
• For which disciplines do you use BIM?
Most of the selected design firms had more than 500 employees (53%), followed by companies with 11-50 (18%), 51-100 (12%) or 101-500 people (12%). Only one company had less than 10 employees (5%).
Respondents mainly defined BIM as a methodology that also includes the use of innovative tools (71%), but some respondents viewed BIM mainly as a tool (technology) (29%).
Most of respondents had used BIM for 1-5 years (59%), followed by 6-10 years (24%) or less than one year (12%). Only a few design firms had more than 10 years of experience (5%).
Not all design firms used a complete Building Information Model that included all disciplines. The predominantly developed disciplines of Building Information Models were architecture (88%) and structure (59%). Mechanical, electrical and plumbing services (MEP) discipline models also were developed, such as plumbing (41%), electrical and alarm systems (41%), mechanical systems (35%) and fire protection (29%) (Figure 1).
Figure 1: Disciplines of Building Information Models
3.1.2 BIM-based tools
This section included the following questions:
• If you do not use BIM internally for all disciplines, how do you select partners with BIM capabilities?
• Which BIM authoring software do you usually use?
• Do you find any limitations in using BIM authoring software in comparison with 2D-based tools?
• What BIM-based analyses do you usually perform?
• Do you find any limitations when performing BIM-based analyses in comparison with traditional tools (e.g., 2D-based tool or manual controls)?
• Do you integrate Laser scanning of existing conditions within a BIM environment?
• Do you use an OpenBIM approach based on open standards (e.g., .IFC or .BCF)?
237 | Proceedings IGLC | July 2017 | Heraklion, Greece

The Implementation of Building Information Modelling and Lean Construction in Design Firms in Massachusetts
Some respondents answered that they internally used Building Information Modelling to create and manage all disciplines (35%). In situations where the design firm used partners, , the selection of partners was based on both no-BIM requirements such as previous collaboration on other projects (47%), as well as the presence of BIM experts in the team (47%). Other selection criteria included previous collaboration on other BIM-based projects (35%); the relevance (24%) and the number (12%) of BIM-based projects completed by the company; and the relevance of BIM-based projects performed by BIM-experts within the firm.
There was a unanimous agreement among all respondents on the use of Autodesk Revit© as BIM authoring software. However, more than a half of them (53%) believed that there are limitations in using such a tool in comparison with 2D-based software.
A list of most common BIM-based analyses was provided to understand their adoption within different design firms. Building Information Models were used to perform several analyses such as clash detection (53%), daylight and sun studies (47%), energy analysis (35%), structural analysis (29%), lighting analysis (18%), LEED credit certification reporting (11%) and mechanical analysis (5%). Most of respondents (76%) did not perceive any limitations in using BIM software in comparison with traditional tools or manual controls.
In addition, respondents advised that laser scanning is used by a large number of design firms (76%) and is integrated in a BIM environment. On the other hand, an OpenBIM approach based on open standards (e.g., Industry Foundation Classes IFC and BIM Collaboration Format BCF) is not common and only a few (24%) adopt it.
3.1.3 BIM training
This section included the following question:
• How often do you offer BIM training sessions for your staff? Most of the respondents (35%) answered that their company offers BIM training to
staff once a year. Some respondents answered that their company does not provide any kind of internal training (18%). Other respondents advised that their firms organise training sessions twice a year (5%), every three months (5%), every month (25%) or more than once a month (12%).
3.1.4 BIM standards
This section included the following question:
• Do you have internal BIM standards? All respondents answered that their design firms have internal BIM standards and most
of those standards address both Building Information Models and BIM-based processes (71%). A smaller number of design firms had standards to manage only Building Information Models (24%) or a BIM-based process (5%).
3.1.5 Lean implementation
This section included the following questions:
• How long have you been using Lean Construction?
• Which Lean Construction tools and processes are you using?
The majority of respondents have been using Lean for 1-5 years (65%); some have used Lean for less than one year (18%); some do not use Lean at all (12%). Only a few design
238 | Proceedings IGLC | July 2017 | Heraklion, Greece

Marzia Bolpagni, Luciana Burdi and Angelo Luigi Camillo Ciribini
firms have a longer experience of 6-10 years (5%). The most common Lean tool used are: Pull Planning (59%), Choosing by Advantages, (47%) and A3 Process for Decision Making (41%). The Lean process of Target Value Design (29%) is seldom used.
3.1.6 Model Checking
Model Checking plays an important part within BIM processes, because it allows quality control of information (geometrical and alphanumeric) within Building Information Models (Ciribini et al. 2015). It can be done visually or using specific tools. In some tools, it is possible to set specific rules (rule-sets) to check Building Information Models against (e.g., to check if the dimension of a particular space is correct). The Model Checking phase is also essential in the Plan-Do-Check-Act process to promote continuous improvement.
The questions included in this section were:
• Which software do you use to perform Model Checking for quality assurance?
• Do you have standard rule-sets to control models (e.g., automatic rules to control dimension of spaces, presence of BIM objects, classification systems)?
• Who performs quality control of models?
Model Checking was mainly performed using Autodesk Navisworks© (59%) or the BIM authoring software (35%). Only one respondent used BIM Assure©, that supports rule-sets for Model Checking. Some respondents advised that they do not perform Model Checking at all (18%).
In addition, 53% of respondents did not use rule-sets to control models. Only a few had standard rule-sets to control models (29%) or they created rule-sets for each project (18%). It is possible that respondents did not understand this question, because answers were not consistent with previous statements, since even if only one person used a rule-based software (BIM Assure©), more than one respondent has rule-sets to control models.
Often, both designers and an internal BIM manager performed quality controls of models (82%); only in few cases were they separately carried out by designers (12%) or BIM Managers (6%).
3.1.7 Client’s requirements on BIM
This section included the following questions:
• For how many projects did the owner ask the use of BIM in the last five years?
• For which purposes has BIM been required? The majority of respondents advised that in the last five years BIM had been required
by clients for 1-5 projects (53%), followed by 6-15 (23%), 16-30 (18%), and 51-100 (6%) projects. The principal required BIM uses were the creation of models for all (65%) or some disciplines (59%) and quantity take off (47%). Other uses included conceptual design studies (e.g., space programming and massing) (29%), BIM-based analyses (e.g., structural, mechanical, energy, lighting) (23%), and budgetary costing model (6%).
3.2 Understanding of BIM and Lean within the same design firm
Seven design firms took part to the survey, but only six of them provided more than one answer. For this reason, a comparison was conducted on six companies. Results of the same design firm were compared to find possible dissimilarities and calculate the
239 | Proceedings IGLC | July 2017 | Heraklion, Greece

The Implementation of Building Information Modelling and Lean Construction in Design Firms in Massachusetts
percentage of inconsistency. In this way, it was possible to verify whether there is a common understanding on BIM and Lean among experts within the same firm.
Table 1: Percentage of inconsistency of answers for each design firm.
Design Firm % of
Inconsistency
B 89%
C 72%
E 72%
G 50%
F 44%
D 28%
Results are included in Table 1. The values of the percentage of inconsistency varied
from 89% (design firm B) to 28% (design firm D). The average value was 59% (Figure 2).
Figure 2: Average value of the percentage of inconsistency
4 DISCUSSION AND CONCLUSIONS Main results show that there is not a clear definition of BIM within design firms, even if BIM standards are established. Not all design firms create Building Information Models for all disciplines; this could be related to firms' scope of services limitations (e.g., some organisations are specialised only on architecture and do not provide structural or MEP models).
BIM and Lean adoption are relatively new and only a limited number of design firms has more than 10 years' experience. Moreover, BIM training is usually provided only once a year and this could lead to heterogeneous views and gaps in understanding of BIM policies. For this reason, training sessions should be scheduled more often to avoid misunderstanding and to promote continuous improvement.
240 | Proceedings IGLC | July 2017 | Heraklion, Greece

Marzia Bolpagni, Luciana Burdi and Angelo Luigi Camillo Ciribini
The use of rule-sets that allow semi-automatic Model Checking is still limited. For this reason, design firms should invest more in the control of their work in order to support a more effective BIM and Lean approach.
It is interesting to note that, when design firms select partners to develop BIM-processes, often selection criteria do not include BIM capabilities. There is a possibility that this practice is affected by the small number of BIM-based projects previously done by design firms in Massachusetts.
BIM is becoming a mandatory requirement in public works, and clients play an important role as ‘data-drivers’ (Bolpagni et al. 2016). In Massachusetts, public clients can ask for specific software, in contrast with other areas, such as Europe, where open standards (e.g., Industry Foundation Classes) are preferred requirements. For this reason, in Massachusetts, as well as in other American states, usually proprietary software is specified and open BIM standards are not included in public procurements.
Although the survey results indicate that there is not a univocal understanding of BIM and Lean within the same design firm, inconsistencies in responses show the limitation of surveys. Workshops with more than one BIM/Lean expert from the same organisation could be a valid alternative to surveys in order to get more reliable data.
Results of the study can be useful for designers to develop internal standards and establish internal training programs, as well as for clients to better understand designers’ approach to and use of BIM and Lean. Due to the low response rate from the design firms, results cannot be generalised to the entire construction industry. However, the study results can be used by researchers in order to improve data collection methods and to better understand the current status of BIM and Lean implementation in Massachusetts.
In the future, the same questions could be sent to different design firms working with other public clients to compare results and better evaluate the impact of clients' requirements on design firms' behaviours. Finally, other maturity matrices, such as the one developed by Bilal Succar (2010), could be used to evaluate BIM and Lean implementation across design firms.
5 REFERENCES Ahuja, R., Sawhney, A. and Arif, M. (2014). Bim Based Conceptual Framework for Lean
and Green Integration. In: Kalsaas, B.T., Koskela, L. and Saurin, T.A., 22nd Annual Conference of the International Group for Lean Construction. Oslo, Norway, 25-27 June 2014, pp. 123-132.
Alarcon, L.F., Mandujano, M.G. and Mourgues, C. (2013). Analysis of the Implementation of VDC from a Lean Perspective: Literature Review. In: Formoso, C.T. and Tzortzopoulos, P., 21th Annual Conference of the International Group for Lean Construction. Fortaleza, Brazil, 31-2 August 2013, pp. 781-790.
Arayici, Y., Coates, P., Koskela, L., Kagioglou, M., Usher, C. and O'Reilly, K. (2011). Technology adoption in the BIM implementation for lean architectural practice. Automation in Construction. 20(2), pp. 189-195.
Asri, M. A. N. M., and Nawi, M. N. M. (2015). Actualizing Lean Construction: Barriers Toward the Implementation. Adv. Environ. Biol., 9(5), pp. 172-174.
Bhatla, A. and Leite, F. (2012). Integration Framework of BIM with the Last Planner System. In: Tommelein, I.D. and Pasquire, C.L., 20th Annual Conference of the International Group for Lean Construction. San Diego, USA, 18-20 July 2012.
241 | Proceedings IGLC | July 2017 | Heraklion, Greece

The Implementation of Building Information Modelling and Lean Construction in Design Firms in Massachusetts
Bolpagni, M., Ciribini, A. and Philp, D. (2016). The European Client’s Attitude Towards the Quasi-Automation of the Procurement Processes within a Digital Environment. Proceedings of the CIB World Building Congress 2016. Volume III, pp. 429-439.
Ciribini, A., Mastrolembo Ventura, S. and Bolpagni, M. (2015). Informative content validation is the key to success in a BIM-based project. Territorio Italia, n. 2/2015, pp. 9-30.
Clemente, J., and Cachadinha, N. (2013). BIM-Lean Synergies in the Management on MEP Works in Public Facilities of Intensive Use - a Case Study. In: Formoso, C.T. and Tzortzopoulos, P., 21th Annual Conference of the International Group for Lean Construction. Fortaleza, Brazil, 31-2 August 2013, pp. 751-759.
Dave, B. (2013). Developing a construction management system based on lean construction and Building information modelling. PhD thesis, University of Salford.
Dave, B., Koskela, L., Kiviniemi, A., Owen, R., Tzortzopoulos, P. (2013). Implementing Lean in construction. Lean construction and BIM. CIRIA.
Eastman, C., Teicholz, P., Sacks, R., and Liston, K. (2011). BIM Handbook: A guide to Building Information Modeling for Owners, Managers, Designers, Engineers and Contractors. 2nd ed. USA: John Wiley & Sons, Inc.
European Parliament (2014). Directive 2014/24/EU of the European Parliament and of the Council of 26 February 2014 on public procurement and repealing Directive 2004/18/EC.
GSA (2007). BIM Guide 01 – 3D-4D-BIM Overview. McGraw-Hill Construction, 2012. The Business value of BIM in North America: Multi-
Year Trend Analysis and User Ratings (2007-2012), Bedford, U.S. NBS (2015). Building Information Modelling (BIM): Reports from NBS, National Buildings
Specification. Raisbeck, P., Millie, R. and Maher, A. (2010). Assessing integrated project delivery: a
comparative analysis of IPD and alliance contracting procurement routes. In: Egbu, C. (Ed), Proceedings 26th Annual ARCOM Conference, 6-8 September 2010, Leeds, UK, Association of Researchers in Construction Management. Vol. 2, pp. 1019-1028.
Sacks, R., Koskela, L., Dave, B. A., and Owen, R. L. (2010). Interaction of Lean and Building Information Modeling in Construction. The Journal of Construction Engineering and Management, 136(9), pp. 968-980, doi: 10.1061/(ASCE)CO.1943-7862.0000203.
Sands, M. and Abdelhamid, T.S. (2012). Whole-Building Measurement and Computing Science BIM for Lean Programming and Performance. In: Tommelein, I.D. and Pasquire, C.L., 20th Annual Conference of the International Group for Lean Construction. San Diego, USA, 18-20 July 2012.
Succar, B. (2010). Building Information Modelling Maturity Matrix. Handbook of research on Building Information Modelling and construction informatics: concepts and technologies, J. Underwood and U. Isikdag, eds., IGI Publishing, pp. 65-103.
Succar, B. (2017). Building Information Modelling (BIM). BIM Dictionary. BIMe. Available at: http://bimdictionary.com/building-information-modelling/ [Accessed 14 Jan. 2017].
Succar, B., Sher, W. and Williams, A. (2013). An integrated approach to BIM competency assessment, acquisition and application. Automation in Construction, 35 (2013), pp. 174-189.
242 | Proceedings IGLC | July 2017 | Heraklion, Greece

Cândido, L. F., Barros Neto, J. P. (2017). “Features, Roles and Processes of Performance Measurement in Lean Construction.” In: LC3 2017 Volume II – Proceedings of the 25th Annual Conference of the International Group for Lean Construction (IGLC), Walsh, K., Sacks, R., Brilakis, I. (eds.), Heraklion, Greece, pp. 243–250. DOI: https://doi.org/10.24928/2017/0290
FEATURES, ROLES AND PROCESSES OF PERFORMANCE MEASUREMENT IN LEAN
CONSTRUCTION
Luis Felipe Cândido1 and José de Paula Barros Neto2
Abstract: The development of an adequate performance measurement system represents a challenge for all modern companies, including those applying Lean Construction (LC) principles. LC companies adopt a broader scope that focuses not only on traditional financial performance but also on process improvement and value creation. Thus, management should evolve to embrace different performance criteria and related indicators.
However, in spite of advances in other industries, in the construction sector, as well as LC, it is slow. Thus, this paper aims to analyse the performance measurement process in lean construction context through a multiple case study. This paper is expected to contribute to efforts undertaken by practitioners and academics because the framework and the gaps identified provide guidelines to what works and to what does not work when implementing performance measurement systems especially in LC projects.
Keywords: Lean construction, Performance Measurement, Performance Indicators, Metrics, Strategy.
1 INTRODUCTION Since the spread of Toyota production principles, researchers have been trying to justify the change in production paradigm (from mass production to lean production). This occurs due of the apparent decrease of productivity in the early stages of lean implementation, from the point of view of traditional measurement systems, which are based on financial accounting (Åhlström 1998).
This has been increasing the interest of academics and professionals to the use of performance indicators in lean production (Chavez et al. 2013; Fullerton & Wempe 2009). The main change in production paradigm shifted by Toyota principles was the focus on value creation for the customers, a fact which led the companies to change their strategies based on cost-leadership to strategies based on differentiation/customization. This change led a revolution in the field of Performance Measurement (Neely 1999).
Thus, the companies perceived the inappropriateness of its Performance Measurement Systems (PMS) that were based exclusively on financial accounts (Franco-Santos et al. 2012). In addition, qualitative aspects, such as customer satisfaction and quality assurance, have become fundamental in the evaluation of organizational performance (Kennerley & Neely 2002). Such changes also occurred in the construction industry (Jin et al. 2013).
In the construction industry, the main initiatives to improve performance measurement are represented by benchmarking initiatives such as KPI and CII BM&M (Costa et al. 2006). However, it is still not possible to check the contributions of those
1 Professor, Christus University Center (UNICHRISTU), Brazil, [email protected] 2 Professor, Federal University of Ceará (UFC), Brazil, [email protected]
243 | Proceedings IGLC | July 2017 | Heraklion, Greece

Features, Roles and Processes of Performance Measurement in Lean Construction
initiatives in well-established management practices in the construction sector (Nudurupati et al. 2007; Deng et al. 2012; Korde et al. 2005). The PMS evolution is happening slowly, mainly when it is compared to other industries (Deng et al. 2012), demanding more studies in this research matter (Nudurupati et al. 2007; Deng et al. 2012; Korde et al. 2005).
It is necessary to come up with more comprehensive and applicable measurement systems (Yang et al. 2010; Kueng et al. 2001). Is also necessary to create conditions to enable the correct use of PMS already deployed in the companies (Taticchi et al. 2010). In the lean construction context, studies suggest that this question remains open (Li et al. 2015; España et al. 2012; Alarcón et al. 2014).
Thus, this paper aims to analyse the performance measurement process in the lean construction context. Unlike most research in this matter that is focused only on performance indicators, this study is focused on the main characteristics, roles, processes to carry out an appropriate performance measurement. To accomplish this, a multiple case study was carried out with three construction companies from Fortaleza, a city northeast of Brazil, that applies lean construction.
2 PERFORMANCE MEASUREMENT SYSTEM AND LEAN
CONSTRUCTION Several structures to design and implement a performance measurement system are found in the literature. These models were created in different economic sectors and encompass a range of disciplines such as accounting, strategy, human resources, operations and production management, marketing, organizational behavior and strategic management (Neely 1999; Franco-Santos et al. 2012).
Thus, performance measurement is a multidisciplinary topic and there is still not a coherent structure for performance measurement (Choong 2013a), i.e, a PMS suitable for different environments. It is difficult to understand the meaning of 'performance' (Micheli & Mari 2013), its attributes (Choong 2013b) and its structure to cover the role of performance measurement as a System (Toni & Tonchia 2001). The process of measuring the performance is not clearly defined (Kueng et al. 2001).
Frequently, this lack of understanding leads to PMS to work as a simple control tool (Sink & Tuttle 1993), instead of a cyclical and holistic management process (Lebas 1995). It seems clear that performance measurement plays a control role in the construction industry and does not drive continuous improvement due to emphasis on financial outcomes. A well-stablished criticism to this narrow approach has been mentioned by a number of authors (Bassioni et al. 2004; Nudurupati et al. 2011; Horstman & Witteveen 2013).
This occurs due of the difficulty defining what successful project is in such a complex sector as construction, characterized by: the fragmented processes in the project (Horstman & Witteveen 2013), the one-of-a-kind nature of a project with temporary location and temporary construction (Koskela 1992) and the existence of many stakeholders that follow different business practices with different objectives (Wegelius-Lehtonen 2001).
The status quo of PM becomes critical in lean construction. The performance of lean projects cannot be assessed through traditional measures (Horman & Kenley 1996). Projects under lean construction principles aim to maximize value, minimize waste, reduce cycle times (Ballard et al. 2001), provide production stability and improve construction
244 | Proceedings IGLC | July 2017 | Heraklion, Greece

Luis Felipe Cândido and José de Paula Barros Neto
flow (Sacks et al. 2017), achieve continuous improvement and show respect for people (Korb 2016), among others things.
The performance measurement in lean construction projects should be grounded on physical and qualitative aspects of production progress and not only on financial outcomes (Cândido et al. 2014) which demonstrates the complexity of the performance measurement in lean construction (España et al. 2012).
To improve on understanding on performance measurement, Franco-Santos et al. (2007) suggested the following components as essential for an adequate PMS:
• Features: (i) to have a performance measurement; (ii) to support infrastructure;
• Roles: (i) to measure performance; (ii) strategy management; (iii) communication; (iv) to influence behaviour; (v) learning and improvement;
• Processes: (i) selection and design measures; (ii) data collection and manipulation; (iii) information management; (iv) performance evaluation and rewards; (v) system review;
Thus, to contribute to lean, a Performance Measurement System should provide continuous improvement. It should increase transparency and manage accountability (España et al. 2012). It should be a driving factor to the team's growth, to ensure respect for people, encompassing motivation and self-determination for both the individual and the collective staff.
Table 1 summarizes the PMS Roles and its driving factor for lean.
Table 1: PMS - Roles and its driving factor for lean
Roles of PMS Definition (Franco-Santos et al. 2007) Driving factor for lean Measure performance
This category encompasses the role of monitor progress and measurement performance/evaluate performance
It allows value generation, minimize waste, reduce cycle times
Strategy management
This category comprises the roles of planning, strategy, formulation, strategy implementation/execution, and focus attention/provide alignment
Allows a maintenance strategy and focus on lean construction principles over time
Communication Comprises the roles of internal and external communication, benchmarking and compliance with regulations
Information flow is a critical issue to lean construction. These roles should allow for increased transparency and accountability management
Influence behavior
It encompasses the roles of rewarding or compensation behavior, managing relationships and control
It allows the respect for people, motivation and self-determination
Learning and improvement
It comprises the roles of feedback, double-loop learning and performance improvement
It allows the continuous improvement, standardization
Thus, in this paper, the main features, roles and processes of PMS are analysed to check its capacity to facilitate a lean behaviour and to check its ability to promote lean construction.
3 METHOD
This study represents a multiple case study (Yin 2010) of three building companies. These companies have been operating for more than 25 years, working in the real estate market and applying lean construction for more than 10 years.
245 | Proceedings IGLC | July 2017 | Heraklion, Greece

Features, Roles and Processes of Performance Measurement in Lean Construction
Seven interviews were carried out, with 6 participants: 3 technical directors, 1 technical manager, 1 technical coordinator and 1 quality coordinator. Besides the interviews, documents were collected to support interviews claims.
The case study was structured to analyse the main features, roles and process according to Cândido et al. (2016) (Table 2).
Table 2: Example of audit criteria protocol3
Processes Criteria
Information management
Does the model present a procedure or provide guidelines to management and information interpretation, connecting them to the decision-making process through the operation of information transference mechanisms (discussion, debates, publications, selective diffusion of information, others, or using ICTs)? 0 – It does not provide any guideline. 1 – It provides guidelines to assure information reaches the interested ones and is available to make decisions. 2 – It provides guidelines to assure the integrity and consistency of measurement results, as well as the way they should be used (which information transference mechanisms are supposed to be used?).
Thus, three points are attributed: (1) importance degree and (2) use degree - both in manager's point of view; (3) audit degree - in the researchers' point of view.
4 RESULTS Table 3 shows the PMS evaluation results.
Table 2: Companies’ self-assessment and audit for features, roles and processes
Features, Roles and Processes to Performance Measurement
Alpha Company Beta Company S Company
(1) (2) (3) (1) (2) (3) (1) (2) (3)
A. Features 100% 85% 75% 93% 73% 75% 90% 60% 75%
a. Performance measures 100% 100% 100% 100% 80% 100% 100% 60% 100% b. Supporting infrastructure 100% 70% 50% 87% 67% 50% 80% 60% 50% B. Roles 100% 86% 70% 93% 69% 60% 76% 68% 60%
a. Measure Performance 100% 100% 50% 100% 87% 50% 80% 80% 50%
b. Strategy Management 100% 80% 100% 93% 73% 100% 80% 80% 100%
c. Communication 100% 80% 50% 87% 73% 50% 100% 80% 100%
d. Influence Behavior 100% 80% 100% 87% 53% 50% 60% 40% 0%
e. Learning and Improvement 100% 90% 50% 100% 60% 50% 60% 60% 50%
C. Processes 98% 90% 40% 92% 73% 70% 84% 60% 50%
g. Selection and design measures 100% 100% 50% 100% 93% 100% 100% 80% 100%
h. Data collection and manipulation 100% 90% 0% 100% 80% 100% 100% 80% 50%
i. Information management 100% 80% 50% 80% 60% 50% 100% 80% 50%
j. Performance evaluation and rewards 90% 90% 50% 93% 80% 50% 60% 40% 0%
k. System review 100% 90% 50% 87% 53% 0% 60% 20% 50% Legend: (1) importance degree; (2) use degree; (3) audit scored
3 see complete table at https://goo.gl/fu2Myt
246 | Proceedings IGLC | July 2017 | Heraklion, Greece
Luis Felipe Cândido and José de Paula Barros Neto
4.1 Analysis of the Companies’ PMS characteristics
Regarding characteristics, a Measurement System must have performance indicators aligned with the companies' strategies, a fact which was not observed explicitly. For improvements, there are models that allow quick visualization of those pieces of information, for example, the matrix proposed by Kagioglou, Cooper and Aquad (2001), Kaplan and Norton (1992, 1996).
The infrastructure reached a low degree at the evaluation on the company manager’s view and on the auditing perspective as well. This is also verified at the literature (Cândido et al. 2016; Kennerley & Neely 2002).
Regarding the indicators used by the companies, Alpha Company has a Lean Audit, which was presented by Valente et al. (2012). The other performance indicators are traditional and widely spread as PPC, PCR, Cost Variance, ROI, among others. But in general they are focused on cost control and financial outcomes.
4.2 Analysis of the Companies’ PMS roles
Regarding roles, Alpha PMS Company measures and evaluates performance. Beta Company’s primary goal is to measure performance and to provide learning and improvements. Finally, for the S Company, the most important goal is to communicate results, even though they showed not to have expertise in its use.
All companies’ PMS do not have well-established processes to follow the decisions progress made from the performance evaluation, which is an opportunity for improvement.
For the companies, the worst role was to influence behaviour (average of 58% for the companies). This result corroborates with the literature (Cândido et al. 2016).This is critical, since the implementation of a culture of improvement arising from PMS is of extreme importance (Kennerley & Neely 2002; Sink & Tuttle 1993). Like PMS, one of the basic PMS elements is the people (Kueng et al. 2001). Without this role, the focus on indicator (means to check the performance) becomes greater than the value generation (the goal) (Sink & Tuttle 1993). This is also true in Lean Construction context.
4.3 Process Analysis
Regarding selection and definition of indicators, only Beta and S companies own indicator handbooks. The formalization of data collection and processing is the recommended to improving the Alpha Company's PMS. Process formalization is an important characteristic of a measurement system (Toni & Tonchia 2001). Training about indicators may minimize misunderstandings and formalize knowledge about the company (Flapper et al. 2006).
Regarding data collection and processing, Alpha Company PMS neither offers guidelines about the data source to be used, no information about which tool will be used for the procedure. This item can be enhanced by using the proposed indicator handbook and training the ones responsible for collection. When it is not well established, data collection may make PMS unproductive and expensive for the company.
For information management it was possible to see good practices found in lean construction. Beta Company uses visual devices to spread information about the construction site. Alpha Company measures partners' performance (suppliers) and involves them in the discussions at meetings.
Towards the process of performance evaluation and rewards, Alpha Company self-assessed with 90%. It does not have a formalized process for evaluation and awarding, although there is an award for each work phase. This award goes according to the financial performance of each finished stage.
247 | Proceedings IGLC | July 2017 | Heraklion, Greece

Features, Roles and Processes of Performance Measurement in Lean Construction
In Beta Company, at the organization level, every three months there is a meeting named “Accountability Meeting”. Each area manager exhibits the results for their respective director. These results are consolidated into a single annual indicator for each area. Having meetings to discuss indicators is a positive point, because the need to use indicator should not only offer a communication of results to the superior hierarchic levels. As Sink and Tuttle (1993) and Kennerley and Neely (2002) point out, the creation of a measurement culture is an important step to implement any performance measurement system.
An improvement opportunity for Alpha and Beta Companies is to formalize the awarding process by matching the rewards to goals. Whereas, for the S Company, a rewarding culture must be created to encourage improvements, obviously this process must be well formalized and based on goals.
Regarding continuous improvement of the system there is no established process of revising its indicators neither revising the system consistency. The revision, in general, is only focused on goals evaluation. This practice is below expectations, since the whole system utility, efficiency and consistency must be revised so that the system does not become obsolete and unproductive.
5 CONCLUSIONS
This paper aims to analyse the performance measurement process in a lean construction context focused on the main characteristics, roles and processes to carry out an adequate performance measurement.
Despite of the limitations of a case study, it is possible that the PMS (performance measurement system) is too fragile to promote Lean. It is worth noticing that the design and selection of measures were not derived from Lean Construction principles. LC companies should adopt a broader scope that focuses not only on traditional financial performance but also on process improvement and value creation. Thus, management should evolve to embrace different performance criteria and related indicators.
6 REFERENCES Åhlström, P., 1998. Sequences in the implementation of lean production. European
Management Journal, 16(3), pp.327–334. Alarcón, L.F., Salvatierra, J.L. & Letelier, J.A. 2014, 'Using Last Planner Indicators to
Identify Early Signs of Project Performance' In: Kalsaas, B.T., Koskela, L. & Saurin, T.A., 22nd Annual Conference of the International Group for Lean Construction. Oslo, Norway, 25-27 Jun 2014. pp 547-558
Ballard, G. et al., 2001. Production System Design in Construction. Annual Conference of the International Group for Lean Construction, 9, pp.1–15.
Bassioni, H.A., Price, A.D.F. & Hassan, T.M., 2004. Performance Measurement in Construction. Journal of Management in Engineering, 20(2), pp.42–50.
Cândido, L.F., Heineck, L.F.M. & Neto, J.D.P.B. 2014, 'Critical Analysis on Earned Value Management (EVM) Technique in Building Construction ' In: Kalsaas, B.T., Koskela, L. & Saurin, T.A., 22nd Annual Conference of the International Group for Lean Construction. Oslo, Norway, 25-27 Jun 2014. pp. 159-170
Cândido, L.F., Lima, S.H. de O. & Barros Neto, J. de P., 2016. Análise de Sistemas de Medição de Desempenho na Indústria da Construção. Ambiente Construído, 16(2), pp.189–208.
248 | Proceedings IGLC | July 2017 | Heraklion, Greece

Luis Felipe Cândido and José de Paula Barros Neto
Chavez, R. et al., 2013. Internal lean practices and operational performance: The contingency perspective of industry clockspeed. International Journal of Operations & Production Management, 33(5), pp.562–588.
Choong, K.K., 2013a. Has this large number of performance measurement publications contributed to its better understanding? A systematic review for research and applications. International Journal of Production Research, 52(14), pp.4174–4197.
Choong, K.K., 2013b. Understanding the features of performance measurement system: a literature review. Measuring Business Excellence, 17(4), pp.102–121.
Costa, D.B. et al., 2006. Benchmarking Initiatives in the Construction Industry: Lessons Learned and Improvement Opportunities. Journal of Management in Engineering, 22(4), pp.158–167.
Deng, F., Smyth, H. & Anvuur, A., 2012. A critical review of PMS in construction: Towards a research agenda. In: Annual ARCOM Conference, 28(September), pp.807–816.
España, F., Tsao, C.C. & Hauser, M. 2012, 'Driving Continuous Improvement by Developing and Leveraging Lean Key Performance Indicators' In: Tommelein, I.D. & Pasquire, C.L., 20th Annual Conference of the International Group for Lean Construction. San Diego, USA, 18-20 Jul 2012.
Flapper, S.D.F., Fortuin, L. & Stoop, P.P.M., 2006. Towards consistent perfromance management system. International Journal of Operations & Production Management, 16(7), pp.27–37.
Franco-Santos, M. et al., 2007. Towards a definition of a business performance measurement system. International Journal of Operations & Production Management, 27(8), pp.784–801.
Franco-Santos, M., Lucianetti, L. & Bourne, M., 2012. Contemporary performance measurement systems: A review of their consequences and a framework for research. Management Accounting Research, 23(2), pp.79–119.
Fullerton, R.R. & Wempe, W.F., 2009. Lean manufacturing, non-financial performance measures, and financial performance. International Journal of Operations & Production Management, 29(3), pp.214–240.
Horman, M. & Kenley, R. 1996, 'The Application of Lean Production to Project Management ' In: 4th Annual Conference of the International Group for Lean Construction. Birmingham, UK, 1-8.
Horstman, A. & Witteveen, W., 2013. Performance Indicators in the Best Value Approach. Advanced of Performance Information & Value, 5(2), pp.59–78.
Jin, Z. et al., 2013. Practical Framework for Measuring Performance of International Construction Firms. Journal of Construction Engineering and Management, 139(9), pp.1154–1167.
Kagioglou, M., Cooper, R. & Aquad, G., 2001. Performance management in construction: a conceptual framework. Construction Management and Economics, 19, pp.85–95.
Kaplan, R.S. & Norton, D.P., 1992. The Balanced Scorecard – Measures that Drive Performance. Havard Business Review, 70(1), pp.70–79.
Kaplan, R.S. & Norton, D.P., 1996. Using the Balanced Scorecard as a Strategic Management System. Harvard Business Review, 74(1), pp.75–85.
Kennerley, M. & Neely, A., 2002. A framework of the factors affecting the evolution of performance measurement systems. International Journal of Operations & Production Management, 22(11), pp.1222–1245.
Korb, S. 2016, '“Respect for People” and Lean Construction: Has the Boat Been Missed?' In: 24th Annual Conference of the International Group for Lean Construction. Boston, USA, 20-22 Jul 2016.
249 | Proceedings IGLC | July 2017 | Heraklion, Greece

Features, Roles and Processes of Performance Measurement in Lean Construction
Korde, T., Li, M. & Russell, A.D., 2005. State-of-the-Art review of Construction Performance Models and Factors. In: Construction Research Congress 2005. San Diego, E. U. A: ASCE, pp. 1–14.
Koskela, L., 1992. Application of the new production philosophy to construction. Stanford: Techniccal Repport 72. Center for Integrated Facility Engineering. Department of Civil Engineering. Stanford Univeristy.
Kueng, P., Andreas, M. & Wttstein, T., 2001. Performance Measurement Systems Must Be Engineered. Communications of the Association for Information Systems, 7(3), pp.1–27.
Lebas, M.J., 1995. Performance measurement and performance management. International Journal of Production Economics, 41(1), pp.23–35.
Li, S., Wu, X., Hu, S. & Hu, B. 2015, 'Performance Evaluation of Lean Construction Projects Based on Balanced Scorecard' In: Seppänen, O., González, V.A. & Arroyo, P., 23rd Annual Conference of the International Group for Lean Construction. Perth, Australia, 29-31 Jul 2015. pp 753-762
Micheli, P. & Mari, L., 2013. The theory and practice of performance measurement. Management Accounting Research, 25(2), pp.147–156.
Neely, A., 1999. The performance measurement revolution: why now and what next? International Journal of Operations & Production Management, 19(2), pp.205–228.
Nudurupati, S., Arshad, T. & Turner, T., 2007. Performance measurement in the construction industry: An action case investigating manufacturing methodologies. Computers in Industry, 58(7), pp.667–676.
Nudurupati, S.S. et al., 2011. State of the art literature review on performance measurement. Computers & Industrial Engineering, 60(2), pp.279–290.
Sacks, R. et al., 2017. Construction flow index: a metric of production flow quality in construction. Construction Management and Economics, 6193(February), pp.1–19.
Sink, D.S. & Tuttle, T.C., 1993. Planejamento e medição para performance, Rio de Janeiro, RJ: Qualitymark.
Taticchi, P., Tonelli, F. & Cagnazzo, L., 2010. Performance measurement and management: a literature review and a research agenda. Measuring Business Excellence, 14(1), pp.4–18.
Toni, A. de & Tonchia, S., 2001. Performance Measurement Systems: models, characteristics and measures. International Jounal of Operations & Production Management, 21(1/2), pp.46–70.
Wegelius-Lehtonen, T., 2001. Performance measurement in construction logistics. International Journal of Production Economics, 69(1), pp.107–116.
Yang, H. et al., 2010. A critical review of performance measurement in construction. Journal of Facilities Management, 8(4), pp.269–284.
Yin, R.K., 2010. Estudo de caso: planejamento e métodos 4th ed., Porto Alegre: Bookman.
250 | Proceedings IGLC | July 2017 | Heraklion, Greece

Collinge W.H. and Connaughton, J. (2017). “Mobilizing BIM in a Collaborative Project Environment.” In: LC3 2017 Volume II – Proceedings of the 25th Annual Conference of the International Group for Lean Construction (IGLC), Walsh, K., Sacks, R., Brilakis, I. (eds.), Heraklion, Greece, pp. 251–258. DOI: https://doi.org/10.24928/2017/0008
MOBILIZING BIM IN A COLLABORATIVE PROJECT ENVIRONMENT
Bill Collinge1 and John Connaughton2
Abstract: This paper reports on the application of BIM methods an innovative project in the UK that is pioneering a new form of project insurance (Integrated Project Insurance) that joins project partners together as a virtual company. The paper examines the processes put in place to optimize BIM usage whilst reviewing the problems and issues encountered; the observations of a researcher being combined with the reflections of the BIM Information Manager.
It is noted that mobilizing a comprehensive BIM-centric system is a complex and difficult undertaking, with new roles and responsibilities needing to be created, that put extra pressures on project partners. The positive results of using BIM in a collaborative environment are noted as the findings suggest inclusive contractual arrangements facilitate enhanced BIM use. The insights inform understanding of mobilizing BIM in a collaborative project environment as it is argued that only a fully collaborative project environment can realise the full benefits of BIM.
Keywords: BIM, collaboration, Integrated Project Insurance, organization.
1 INTRODUCTION It has been argued that to realize the full potential of BIM, project partners must be free to share and exchange information without fear or hesitation of litigation (Hui, 2013). However, such an approach requires project partners to be bound together contractually, and such arrangements remain rare (in the UK construction industry at least). Whilst there is a trend for more relational type contracting methods, such as project alliancing (Young et al. 2016), such arrangements do not join the whole project team together to achieve mutually beneficial outcomes for every partner. Therefore, whilst commentators such as Demian & Walters (2014) and Eastman et al. (2008) argue that BIM improves information management processes, the contractual realities enabling such co-operation to happen are often absent from projects. As noted by Gardiner (2016), when quoting Greenwood,
“The last 50 years have shown you`re not going to get collaboration or partnership
without full-process integration, because people have to protect their legal position. You can`t expect some whizz-bang system will force people to integrate.” (p.25)
1 Researcher, Construction Management & Engineering, Whiteknights, University of Reading, Reading,
UK, [email protected] 2 Professor of Sustainable Systems in the Built Environment, Construction Management & Engineering,
Whiteknights, University of Reading, Reading, UK, [email protected] The project reported here is part of the Innovate UK’s (formerly the Technology Strategy Board) Rethinking
the Build Process and acknowledgement is made of the financial support provided by that programme. Specific results and their interpretation remain the responsibility of the project team.
251 | Proceedings IGLC | July 2017 | Heraklion, Greece

Mobilizing BIM in a Collaborative Project Environment
This paper engages with this issue through an exploration of BIM use on a project in the UK that is pioneering a new form of insurance that joins principal partners together under a single, all-embracing insurance product: Integrated Project Insurance (IPI). IPI offers a new way of working on construction projects as it binds together parties (i.e. client; architect; structural engineer; designer; constructor and specialist(s) in a relationship that is mutually beneficial, giving parties a gain/pain share depending on project performance. IPI arguably engenders greater collaboration and establishes an important framework for better BIM achievements. The extent to which IPI facilitates enhanced BIM use is explored through the paper as the realities of mobilizing BIM on a low-medium sized project in the UK is examined.
The paper begins by reviewing the literature relating to BIM and the contractual realities prevalent in the UK industry today. A research method section describes the methodology employed and describes the project and IPI in greater detail. The processes put in place to mobilize BIM in the collaborative project environment are then described; the narrative being supplemented by comments from a BIM Information Manager on the project. A discussion reflects on the issues arising and identifies some lessons learned. A closing conclusion draws the findings of the paper together.
2 BIM & CONTRACTUAL REALITIES
The advent of BIM has been heralded as the key development that will bring improvements to construction project information management (Eastman et al., 2008), enhancing design, delivery and maintenance of facilities and bringing greater stakeholder involvement (e.g. Hendrickson & Au, 2003; Howell, 1999). As noted by Demian & Walters (2014),
“BIM has a core potential to foster significantly greater collaboration between project participants” (p.1163)
Increased organizational collaboration necessarily means an increased entwining of
fortunes, although the contractual realities and new ways of working required to make BIM collaboration a reality are often overlooked. Current contractual terms predominating in the UK do not allow for this collective responsibility, but the UK government Cabinet Office has been instrumental in exploring new ways of improving the perceived inefficiencies of the UK construction industry through a number of construction trial projects (Cabinet Office, 2014). The Advance II project (a pseudonym) is one such trial project pioneering a new method of project delivery (IPI) that potentially facilitates enhanced BIM use. Young et al. (2016) state that alliancing is often considered at the top end of collaborative and relational contracting, but the Advance II project takes one step further by employing a single insurance policy that joins all principal parties together to achieve a mutual "best for project" outcome.
A significant amount of work has addressed BIM implementation on projects, its` setup and management. Miettinen and Paavola (2014) highlight the significance of the organizational change process resulting from BIM whilst Murphy (2014) considers BIM implementation as an innovative process. Arayici et al. (2011) point out that BIM implementation is complex where it involves competence training and new business models whilst Neto (2016) notes the extensive preparation, required, commenting,
252 | Proceedings IGLC | July 2017 | Heraklion, Greece

Bill Collinge and John Connaughton
"BIM must be considered as a strategic process that involves organizational change and innovation, beyond technical aspects." (p.149) This paper takes forward such views to examine their applicability and validity in a collaborative project context.
3 RESEARCH METHOD
The University of Reading was tasked by Innovate UK (IUK - a primary funder of innovative industry-led research) to examine the performance of the IPI model on a live construction project. A researcher was appointed to examine project performance over time, becoming embedded into project activities as much as possible (i.e. attending meetings; receiving team emails; accessing the Common Data Environment (CDE). The evidence presented in this paper was gathered by the researcher through the course of his work. Additionally, an interview with one of the two project Information Managers clarified the issues of significance relating to BIM mobilization on the project. The interview was conducted in the early construction phase as numerous suppliers were about to commence construction work. At the time of the interview, the BIM system had become operational.
3.1 The Advance II project & IPI
Dudley College, a further education institute located in the UK West Midlands were actively seeking to procure a new facility to develop their vocational training programmes in construction skills. IPI offered Dudley College a fundamentally different way of procuring a new facility; IPI potentially facilitating greater collaboration and better results by bringing parties together as a virtual company working under a single insurance policy (Cabinet Office, 2013). The IPI model applies an integrated collaborative working approach to the design, delivery and fit-out phases of a construction project, including the adoption of a Project Bank Account, BIM and lean implementation practices. Under IPI, a project team is appointed at project inception, working under an Alliance Contract and working together under a shared single insurance policy. On Advance II, the project Alliance consisted of the client, the architect, civil & structural engineers, constructor, engineering services specialist contractor and project co-ordinator. A single (third party assured) insurance policy covers risks associated with the delivery of the project; each Alliance member agreeing a gain-share benefit and capped pain-share risk depending on overall project outcome. Partners work together collaboratively under a shared "no blame/no claim" cultural ethos to enhance best for project outcomes. For further information about the IPI procurement model see Cabinet Office (2013; 2014). The paper now proceeds to describe what work was done on Advance II regarding BIM.
4 BIM MOBILIZATION ON ADVANCE II
4.1 Initial Work
Use of BIM was important for the project from the start: the client making BIM level 2 a requirement and the project team wanting the BIM model to be the single system through which all information would flow. Initial BIM roles and responsibilities were defined in the early design phase period as a comprehensive BIM strategy was agreed. The most experienced BIM Alliance partner undertook BIM management work as a sub-group was
253 | Proceedings IGLC | July 2017 | Heraklion, Greece

Mobilizing BIM in a Collaborative Project Environment
formed to specifically address BIM issues; each Alliance partner nominating a BIM champion to sit on the sub-group and coordinate issues from that partner`s perspective. The BIM group reported directly to the Alliance Board, composed of senior representatives of each Alliance partner. The Information Manager reflected in interview that the initial Alliance selection process should have been more robust in BIM terms,
"Really, we should have had an EIR (Employer Information Requirement) when the Alliance was selected. That would have set the requirements for capability around BIM and information delivery. All members should have done a pre-contract BIM Execution Plan (BEP) to say “this is how we will respond to the Employer Information Requirements (EIR)”.
However, part of the project strategic brief was a stated need for advanced BIM use on Advance II, for both teaching and curriculum development, with the selected partners advising on what was considered leading practice, although this did not translate into a specific stated EIR requirement at the selection stage. BIM learning and education became a significant issue on the project; pre-contract BEPs would have indicated where BIM capability shortfalls within the team occurred. A BEP was formulated alongside an evolving EIR as the client clarified their needs through Plain Language Questions (PLQ)s, ‘Soft Landings’ performance criteria, an Education Information Model (EIM) and operations/maintenance requirements to be delivered within the Asset Information Model (AIM). Further meetings clarified needs in terms of design and information: a 3D model with a link to Operations & Maintenance documentation being a stated requirement. It was also agreed that a specific Soft Landings delivery plan would be developed so that building information could be tailored to the College`s preferred maintenance strategy. Throughout this phase, the Alliance worked intensively on multiple issues, including planning application; refinement of the cost plan; design development; thermal modelling and evolution of a procurement strategy. All these activities were challenging, as project partners were working collaboratively together for the first time. Although not in the forefront of activities, the importance of BIM remained an ever-present theme at meetings.
At this time, the BIM group realised that a new plan of work was needed to be devised for the project (the commonly referenced RIBA (2013) work stages being inappropriate for an IPI project. The Information Manager later commented,
"As a virtual business, things like roles, responsibilities, hierarchy and processes for
authorization should have been defined first and BIM then built around it. But we had to define BIM implementation from a theoretical point of view in terms of how it should be done. We had to deconstruct the logic first and make sense of that because that tells you where the information exchanges need to be."
It was clear that the scale of mobilizing BIM on the IPI project had not been appreciated
enough at a strategic level at project commencement; the BIM sub-group consequently needing to work very hard to optimize BIM as the project gathered momentum.
254 | Proceedings IGLC | July 2017 | Heraklion, Greece
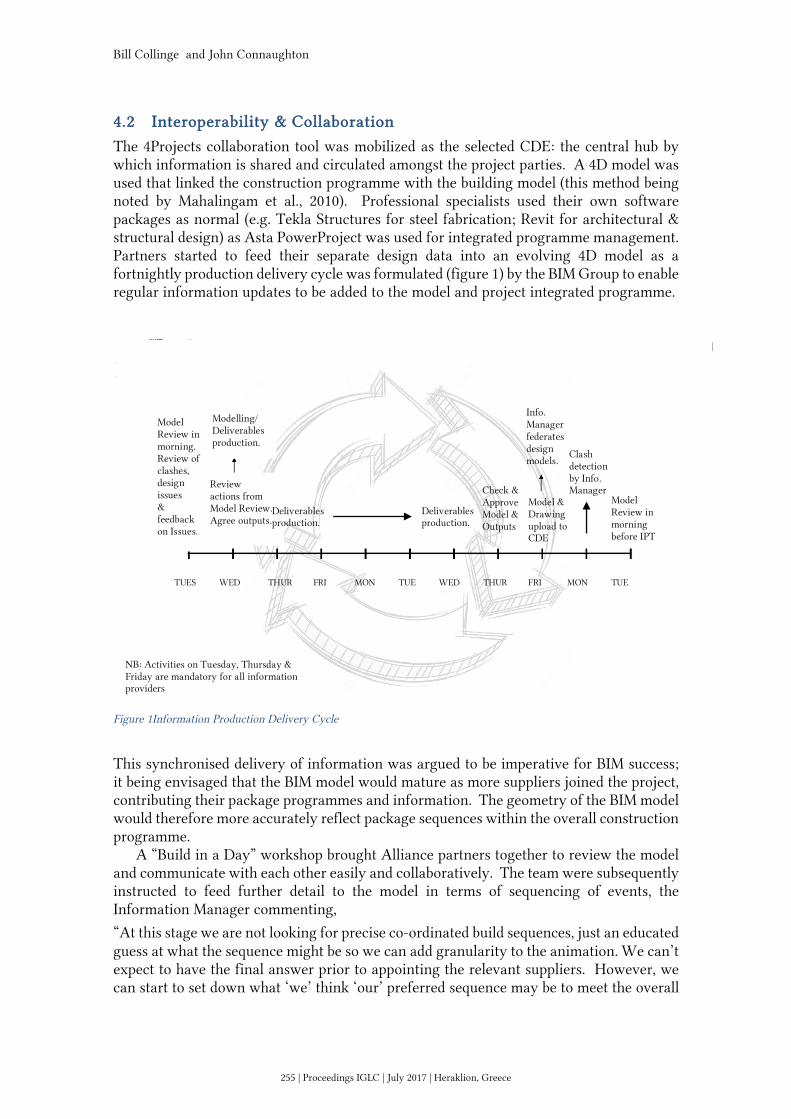
Bill Collinge and John Connaughton
4.2 Interoperability & Collaboration
The 4Projects collaboration tool was mobilized as the selected CDE: the central hub by which information is shared and circulated amongst the project parties. A 4D model was used that linked the construction programme with the building model (this method being noted by Mahalingam et al., 2010). Professional specialists used their own software packages as normal (e.g. Tekla Structures for steel fabrication; Revit for architectural & structural design) as Asta PowerProject was used for integrated programme management. Partners started to feed their separate design data into an evolving 4D model as a fortnightly production delivery cycle was formulated (figure 1) by the BIM Group to enable regular information updates to be added to the model and project integrated programme.
Figure 1Information Production Delivery Cycle
This synchronised delivery of information was argued to be imperative for BIM success; it being envisaged that the BIM model would mature as more suppliers joined the project, contributing their package programmes and information. The geometry of the BIM model would therefore more accurately reflect package sequences within the overall construction programme.
A “Build in a Day” workshop brought Alliance partners together to review the model and communicate with each other easily and collaboratively. The team were subsequently instructed to feed further detail to the model in terms of sequencing of events, the Information Manager commenting,
“At this stage we are not looking for precise co-ordinated build sequences, just an educated guess at what the sequence might be so we can add granularity to the animation. We can’t expect to have the final answer prior to appointing the relevant suppliers. However, we can start to set down what ‘we’ think ‘our’ preferred sequence may be to meet the overall
Model Review in morning. Review of clashes, design issues & feedback on Issues. TUES WED THUR FRI MON TUE WED THUR FRI MON TUE
Review actions from Model Review. Agree outputs.
Modelling/ Deliverables production.
Deliverables production.
Deliverables production.
Check & Approve Model & Outputs
Model & Drawing upload to CDE
Info. Manager federates design models.
Clash detection by Info. Manager
Model Review in morning before IPT
NB: Activities on Tuesday, Thursday & Friday are mandatory for all information providers
255 | Proceedings IGLC | July 2017 | Heraklion, Greece

Mobilizing BIM in a Collaborative Project Environment
programme. This way, when we sit down with the relevant suppliers, we can show them the animation to show what our intent is."
Through the bi-weekly information delivery cycle, the Alliance endeavoured to evolve
the design model in line with the project programme as more work focused upon the potential use of BIM on the project; it being argued that benefits would become evident over time, with information transfer, storage, accessibility and information redundancy all potentially benefitting. The IPI model enabled this close collaboration to occur around the evolving BIM model, and whilst collaboration can occur under "traditional" models of procurement, with IPI, collaboration is continuous, extends to a wider team and is more transparent.
4.3 Scope of Work
The amount of work required to make BIM effective became increasingly clear as the project progressed. For example, to take advantage of innovative procurement methods (and to deliver information in the most efficient way possible), an ongoing review of information requirements for separate work packages was required; the information requirements of each separate work packages being unique. With IPI Policy inception, the Information Manager reminded personnel of the need for collective coordinated information sharing/production activities: the correct timing/cycling of information being critical for effective model based information delivery. The Information Manager also informed the team that his role was to manage the CDE and not to upload items to it, advising the team to read the 4Projects guidance document and the project BEP. Evidently, the new work processes were particularly challenging for Alliance members as each partner was also engaged in other projects operating under more traditional procurement and delivery routes. The Information Manager later commented,
"Trying to get the team to do proper information delivery & management has been
difficult. This is because careful thought is required to establish what the minimum information required is and this is harder than normal for them. The industry is so resistant to change to all embracing new methods of working." As noted, training of Alliance partners with low BIM knowledge was an issue of significance, with literature (i.e. a 4Project guide; a BEP) being produced to tell people what to do in a way that provided education so they understood the difference between a Revit 3D model and a Project Information Model (with consistent language used throughout). Commenting retrospectively, the Information Manager said,
"I think core capability around BIM tools has cost the project. Inefficiency of the information production and then facilitating people`s learning and training to try and get them up to speed. There has been a lot of time resource spent and that wasn`t predicted accurately enough in the initial people resource costs." By late October 2016, the project had entered the early construction phase, with the structural frame being erected on-site. When interviewed, the Information Manager commented about the BIM state-of-play, but also the impact of working under an IPI procurement model,
"Collaboration has been good. We have one set of information and all files are named in accordance with the standard which is greatly assisting operations downstream. But
256 | Proceedings IGLC | July 2017 | Heraklion, Greece

Bill Collinge and John Connaughton
people`s understanding is not there yet. But without IPI, we would not be where we are. Without IPI, we will never realise the full potential of BIM because you have a contractual line halfway through the process then you get a fragmented information exchange."
5 DISCUSSION
Several issues emerge from the paper. The amount of work required to plan, set-up and manage a BIM system in a collaborative project context is considerable. On Advance II, this was underestimated; only the dedicated input of the partner with advanced BIM knowledge enabling a federated BIM model, an information input cycle, a BEP and clear plan of action to be devised. There were consequential impacts on labour, time and training for the project. Strategically, although the importance of BIM had been recognized early, the organizational impact and effects of process integration had not been appreciated enough. These insights lead the paper to echo the findings of scholars such as Neto (2016), Arayici et al. (2011) and Merschbrock and Munkvold (2012) that the organizational aspects of BIM are a fertile area upon which to direct the lens of academic enquiry.
The importance of alliancing contracting (such as IPI) for BIM optimization also emerges from the paper. BIM requires free movement of information between parties and this is only achievable if contractual barriers are removed. However, even in a fully collaborative project setting, the "burden of BIM" will fall more heavily upon certain project partners. On Advance II, although positive use of BIM enabled the project to overcome some of those professional and organizational barriers identified by Kahler et al. (2016) to the delivery of a digitally enabled project, the challenge of ensuring suppliers also embrace BIM was noted as significant. Resistance to change behaviours from suppliers is likely to remain an obstacle to BIM evolution unless they are positively embraced by projects. On Advance II, the Alliance are currently discussing new and innovative methods of engaging suppliers to ensure they utilise the BIM system.
6 CONCLUSION The paper explored work done on the Advance II project with regards to BIM mobilization. The findings indicate that fundamental to BIM achievements is the IPI model that enables enhanced collaboration and communication to occur. However, the work and organizational time required to set it up was underestimated, as were associated training and labour costs. Strategically, a holistic BIM system requires full process integration from Alliance partners rather than a tweak to information management processes. Such an organizational change process is challenging when other projects are being managed under more traditional ways of working. As the first trial of IPI in the UK, Advance II is generating new knowledge and learning in multiple spheres of construction project activity, including cost and risk management, procurement, leadership and design development. It is envisaged that further insights regarding BIM use on Advance II will become apparent as the project evolves, to be duly reported by the UoR and Innovate IUK.
7 REFERENCES Arayici, Y., Coates, P., Koskela, L., Kagioglou, M., Usher, C. & O`Reilly, K. (2011).
Technology adoption in the BIM implementation for lean architectural practice. Automation Construction, 20(2), pp. 189-195.
Cabinet Office (2014). New models of construction procurement. Cabinet Office, London.
257 | Proceedings IGLC | July 2017 | Heraklion, Greece

Mobilizing BIM in a Collaborative Project Environment
Cabinet Office (2013). The Integrated Project Insurance (IPI) Model. Project Procurement and Delivery Guidance. Government Construction Strategy 2011. Demian, P & Walters, D (2014). The advantages of information management through
building information modelling, Construction Management and Economics, 32(12), pp. 1153-1165.
Eastman, C M, Teicholz, P, Sacks, R and Liston, K (2008). BIM Handbook: a guide to building information modelling for owners, managers, designers, engineers and contractors, models of construction procurement. Wiley, Hoboken, NJ.
Hendrickson, C and Au, T (2003). Project management for construction: fundamental concepts for owners, engineers, architects and builders, 2nd ed., Prentice Hall, Pittsburgh, PA. Howell, G A (1999). What is lean construction: 1999. Paper presented at the 7th Annual
conference of the International group for lean construction, 26-28 July, Berkeley, CA. Hui, S (2013). Research on construction contract under BIM conditions, Journal of Applied Sciences, 13(9), pp.3926-3930. Gardiner, J (2016). Have you seen the BIM deadline? Building Magazine (Agenda: BIM special), 22-25. Kahler, D., Brown, D, Watson, J. (2016). "Delivering projects in a digital world" In: Proc. 24th Ann. Conf. of the Int`l Group for Lean Construction, Boston, MA, USA, sect.1 pp. 33-42. Mahalingam, A, Kashyap, R and Mahajan, C (2010). An evaluation of the applicability of 4D CAD on construction projects, Automation in Construction Management, 19(2), pp. 148-159. Miettinen, R. and Paavola, S. (2014). Beyond the BIM utopia: approaches to the development and implementation of building information modelling, Automation in Construction, 43, pp. 84-91. Merschbrock, C. and Munkvold, B.E. (2012). A research review on building information modelling in construction - an area ripe for IS research, Communications for the Associations of Information Systems, 31(1), p.10. Murphy, M.E. (2014). Implementing innovation: a stakeholder competency-based approach for BIM, Construction Innovation, 14(4), pp.433-452. Neto, J.P. (2016). "Approach for BIM implementation: a vision for the building industry.". In: Proc. 24th Ann. Conf. of the Int`l Group for Lean Construction, Boston, MA, USA, sect.1 pp. 143-152. RIBA (2013). RIBA job book. RIBA Publishing, London. Young, B.K., Hosseini, A. and Laedre, O. (2016). "Project alliances and lean construction principles". In: Proc. 24th Ann. Conf. of the Int`l Group for Lean Construction, Boston, MA, USA, sect.3 pp. 33-42.
258 | Proceedings IGLC | July 2017 | Heraklion, Greece

Correa M.G., Arroyo P., Mourgues C., and Flager F. (2017). “Comparing Choosing by Advantages and Weighting, Rating and Calculating Results in Large Design Spaces.” In: LC3 2017 Volume II – Proceedings of the 25th Annual Conference of the International Group for Lean Construction (IGLC), Walsh, K., Sacks, R., Brilakis, I. (eds.), Heraklion, Greece, pp. 259–266. DOI:https://doi.org/10.24928/2017/0248
COMPARING CHOOSING BY ADVANTAGES AND WEIGHTING, RATING AND CALCULATING RESULTS
IN LARGE DESIGN SPACES
María Gabriela Correa1, Paz Arroyo2, Claudio Mourgues3, and Forest Flager4
Abstract: Architecture, Engineering and Construction (AEC) projects are complex systems that are evaluated based on many factors. Multi-Criteria Decision Making (MCDM) methods are used to support AEC project teams in this process. Traditionally, these decisions are made using the Weighting, Rating and Calculating (WRC) method. Recent literature shows benefits of the Choosing By Advantages (CBA) method compared to WRC. However, these studies have been made in the context of comparing and ranking a small number of design alternatives (2-10). This research presents a case study in which CBA and WRC are applied to a large design space. The results show that CBA allowed for a more complete comparison of design alternatives. In addition, CBA enabled decision makers to explicitly evaluate performance versus cost, which led to more transparent and Pareto optimal decisions considering all alternatives in the design space.
Keywords: Choosing By Advantages, CBA, WRC, Large Design Spaces, Multi-Disciplinary Optimization.
1 INTRODUCTION
Contemporary buildings are complex systems that are evaluated based on multiple
performance criteria including energy consumption, acoustical performance, thermal occupant comfort, indoor air quality, cost and many other issues (Hopfe et al. 2013). Building design involve the collaboration of many specialists. Typically these specialists are organized by discipline, with each discipline being responsible for the design of a component (subsystem) of the overall system (Balling and Rawlings 2000).
Specialists strive to meet design goals and constraints that are particular to the specific subsystem they are designing. The goals of the individual subsystems can conflict, i.e. an optimal design from the perspective of one subsystem may not be optimal or even feasible from the perspective of other subsystems (Tappeta and Renaud 2001). In addition, subsystems are often coupled, which means that design decisions in one subsystem may influence or even control design decisions in the coupled subsystem.
Multi-Criteria Decision Making (MCDM) methods are used to help project teams to choose the best alternative for the decision maker considering multiple factors. Weighting, Rating and Calculating (WRC), a MCDM method, is widely used in the industry (Arroyo
1 Master Student, Construction Engineering and Management Dept., School of Engineering, Pontificia
Universidad Católica de Chile, Santiago, Chile, +569 56189350, [email protected] 2 Assistant Professor, Pontificia Universidad Católica de Chile, Santiago, Chile, +56 22354-4244,
[email protected] 3 Assistant Professor, Pontificia Universidad Católica de Chile, Santiago, Chile, +56 22354-4244,
[email protected] 4 Research Associate and Lecturer, Department of Civil and Environmental Engineering, Stanford University, Califoria, United States, +1.415.728.7197, [email protected]
259 | Proceedings IGLC | July 2017 | Heraklion, Greece

Comparing Choosing by Advantages and Weighting, Rating and Calculating Results in Large Design Spaces
et al. 2016). However, several authors have proved that Choosing by Advantages (CBA) presents several benefits over WRC (Arroyo et al. 2016; Arroyo et al. 2014) in terms of transparency and its capacity to reach consensus. CBA presents many benefits in the decision-making process but these benefits have been proven only in scenarios that consider a relatively small number of alternatives (2-10).
Multidisciplinary Design Optimization (MDO) methods formalize problem decomposition and coordination among groups working on the design of complex systems (AIAA 1991). These systematic procedures leverage computer processing power to enable design team to explore orders of magnitude more alternatives than possible using conventional methods (Vandenbrande, Grandine, et al. 2006). Potential benefits include compressing design cycle time, evaluating many more potential design alternatives and yielding substantial product quality and performance gains.
The comparisons that a decision maker should make to assess thousands of alternatives using CBA in a design process that uses MDO methods to generate alternatives would be overwhelming. Therefore, we developed a protocol to use CBA in this context. This study compares the results of using of using CBA and WRC in a large design space.
2 BACKGROUND
2.1 Multi-Criteria Decision Making Methods
During the design process, decision makers must decide between a set of design alternatives, which could involve multiple criteria. In those cases, MCDM methods, are tools to collaborate in the decision making process. Many MCDM methods exist. However value-based methods, such as WRC, are widely used in the AEC industry (Arroyo et al. 2016; Arroyo et al. 2015).
WRC is a method that weights factors, that are elements or components of a decision (e.g., energy usage, acoustic performance, and air quality), to decide which is the best alternative. This method uses three principal steps: (1) decision makers weights factors considered in the decision; (2) they rate the alternatives for each factor in function of the attributes (or characteristic) that each alternative has; and (3) the weight of each factor multiplies each alternative as a function of the rate. The weighted sum for each alternative gives the final score for that alternative. The alternative that has highest final score is the alternative that offers more benefits for the decision maker.
CBA is a method developed by Suhr (1999), that is based on the advantages of each alternatives and not on the weight of factors considered in the decision.
CBA method has eight steps: (1) identify alternatives; (2) identify factors; (3) define the criteria to assess each factor; (4) determinate the attributes that characterize each alternative; (5) decide the advantages of each alternative; (6) decide the Importance of Advantage (IoA) for each alternative; (7) Sum the IoA for each alternative; (8) decide the best alternative in function of the IoA and cost of each alternative.
Previous research has demonstrated some benefits of CBA compared to WRC. For example, CBA reduces the time for decision making, reduces the frustration of the team in a collaborative design process (Arroyo et al. 2016), and is more transparent and closer to the context of the decision (Arroyo et al. 2014).
2.2 Multidisciplinary Design Optimization Methods
260 | Proceedings IGLC | July 2017 | Heraklion, Greece

María Gabriela Correa, Paz Arroyo, Claudio Mourgues and Forest Flager
Multidisciplinary Design Optimization (MDO) methods formalize problem decomposition and coordination among groups working on the design of complex systems (AIAA 1991). Beginning in the 1980’s building engineering teams began to couple building performance simulation with numerical methods to achieve optimal design solutions in less time than required for manual design iteration. A pioneering study to optimize building engineering systems was presented by Wright in 1986 when he applied the direct search method in optimizing HVAC systems (Wright 1986). Subsequently, the number of international MDO studies in the field of building science has increased exponentially (Nguyen et al. 2014). Application of these methods has been demonstrated to achieve significant improvements in building life-cycle performance compared to conventional methods (Riccardi 2011).
3 RESEARCH METHODOLOGY
This study is based on a charrette experiment where a group of practitioners were required to make a decision using the WRC and CBA methods in the context of a large design space generated by MDO methods. Figure 1 depicts the main steps of this experiment.
Figure 1: Main steps of the research experiment.
The case study was prepared based on an existing MDO project from where the researchers selected three decision factors plus the capital cost. The project is a hotel in Orlando, Florida, USA. The Center for Integrated Facility Engineering (CIFE) at Stanford University applied MDO methods to generate the design space based on the following design variables: building’s shape factor (from 1.5 to 1.8), percentage of glazed surface per facade (from 60% to 80%), 12 different types of glasses, 12 different types of glass insulation, and 6 options for indoor finishes. The decision factors that this research used for the CBA-WRC comparison were the following:
• VOC emissions: measures the volatile organic compounds in the air, and it is a measure for the indoor air quality.
• Acoustic Reverb: measures the persistence of a sound once it is emitted by the source issuer.
• Energy: corresponds to the energy used to operate the building.
• Cost: corresponds to the capital cost of the hotel.
261 | Proceedings IGLC | July 2017 | Heraklion, Greece

Comparing Choosing by Advantages and Weighting, Rating and Calculating Results in Large Design Spaces
The results of the MDO project allowed the researchers to determine the range for each decision factor as shown in Table 1.
Table 1: Factor's range
Factors
[units]
Range
VOC emissions [µg/m3]
38 - 126
Energy [KWh/year]
1687 - 7675
Acoustic Reverb [ms (T60)]
75 - 169
Cost [US Dollars]
6,781 - 75,597
One thousand design alternatives were generated for the purpose of the experiment. The case study preparation also included the application of a CBA protocol for clustering the large number of design alternatives into 10 representative design options that were used during the decision-making charrette.
The CBA method was implemented in a design charrette environment (controlled experiment with a group of people) where 11 practitioners from the AEC industry participated in the CBA decision-making process. These practitioners used CBA to individually assess the representative design solutions and then the researchers extrapolated this assessment to evaluate the IoA (importance of alternatives) for the entire design space (1000 design options). It is important to note that the cost is not used as a decision factor within the CBA method but it is used to assess the willingness to pay for the IoA of the design alternatives. Therefore, at the end of the decision-making charrette, the practitioners made a final decision based on the trade-off between the IoA of each alternative and the capital cost of that alternative.
Before the charrette, the same practitioners were asked to weigh the factors involved in the decision (including the cost) based on their perception of the relevance of each factor. These weights allowed the researchers to calculate the chosen alternative from the WRC process. This calculation consisted in assigning a relative importance for each factors on a one to ten scale with ten being the most important and one being the least important. A linear regression between these two values yielded the rating of the intermediate alternatives. Finally, the weight of each factor is multiplied by the value of the alternative, generating the final score of all the alternatives. The alternative with the highest score was the best alternative for the WRC method.
At the end of the decision-making charrette, the practitioners decided which of the two alternatives, the one chosen with WRC or the one chosen with CBA, was the alternative that provides them more benefits.
4 RESULTS
One of the analyses performed with the experiment data was the contrast of the WRC solution against the whole design space regarding its IoA (calculated with the
262 | Proceedings IGLC | July 2017 | Heraklion, Greece

María Gabriela Correa, Paz Arroyo, Claudio Mourgues and Forest Flager
extrapolation of the CBA results) and its capital cost. The IoA vs. Cost graphs showed two possible outcomes: the first, where the alternative selected by WRC was in the Pareto’s optimal frontier; and the second case, where the WRC alternative wasn’t at this curve (see Figures 2 and 3). The Pareto´s optimal curve means that a decision maker can not get an alternative with a better IoA without having a higher cost. For example, in figure 3, alternative P1 is in the Pareto's optimal curve because it does not exist any alternative that has a better IoA, i.e. higher score in y axes, with an equal or lower cost, i.e. located at the left side of alternative P1 in the graph. If a decision maker wants to have an alternative with more IoA could chose alternative P2, which is also in the Pareto's optimal curve and it has more IoA than alternative P1, but has a higher cost over alternative P1.
Figure 2: WRC alternative outside Pareto's optimal curve.
Figure 3: WRC alternative in Pareto's optimal curve.
The experiment resulted in seven practitioners selecting a Pareto optimal solution using the WRC method, and four practitioners selecting an non-Pareto optimal solution. Using the CBA method, all of the practitioners that obtained a WRC alternative that wasn’t Pareto optimal selected a superior alternative. That is to say that the alternative had more IoA with the same cost than the WRC alternative or had less cost with the same IoA. Out of the seven cases where the WRC solution was Pareto optimal, five practitioners selected an alternative different from the WRC solution.
263 | Proceedings IGLC | July 2017 | Heraklion, Greece

Comparing Choosing by Advantages and Weighting, Rating and Calculating Results in Large Design Spaces
After the CBA application, practitioners were asked to make the final decision about what of the two chosen alternatives (WRC or CBA result) would they choose. In two cases, the WRC and CBA alternatives were the same. For the nine remaining cases, the CBA alternative was preferred to the WRC alternative in all but one case. Table 2 shows the details of the decisions.
Table 2: Experiment's results
Practitioners WRC alternative ubicated in Pareto's optimal curve
WRC decision is different from CBA
decision
Final decision
P1 Yes* Yes Not Answer
P2 Yes* Yes CBA
P3 Yes* Yes CBA
P4 No Yes CBA
P5 Yes No Same alternative
P6 Yes Yes CBA
P7 Yes* Yes WRC
P8 No Yes CBA
P9 Yes No Same alternative
P10 No Yes CBA
P11 No Yes CBA
*In those cases, WRC alternative is in Pareto's optimal curve. However, an alternative with less cost and a little difference in IoA exist (see Figure 4).
After the experiment, practitioners were asked to complete a survey about WRC and
CBA methods. From that survey, all the practitioners indicated that CBA was a more transparent method than WRC. Some of the reasons were: (1) “CBA is more comprehensive. I was able to take a more informed decision”; (2) “Justifying in terms of differences between alternatives is better than a global ranking”; and, (3) “because it actually describes the advantage in an analytical way”.
All practitioners indicated that in the case that they have to make a decision from a set of alternatives in the future, they will use CBA method instead of WRC. A few excerpts of their rationale included: (1) “because for decision is important analyzing the advantage in order to demonstrate to the stakeholders the benefits. It provides a clearer rationale for decision making”; and (2) "It shows more consistency to explain the importance of that particular decision you have to take in that moment”.
5 DISCUSSION There are cases where WRC alternative is in Pareto's optimal curve, but exist an
alternative that has a better trade off between the IoA and cost, which makes it be a better alternative for some decision makers. For example, in Figure 4 exist the alternative P3, which has slightly less IoA than WRC alternative, but has a huge reduction in cost.
264 | Proceedings IGLC | July 2017 | Heraklion, Greece

María Gabriela Correa, Paz Arroyo, Claudio Mourgues and Forest Flager
This better alternative could not be assessed in WRC method, because this method incorporate cost in the weight of factors and doesn’t made an analysis of factors that are not cost versus cost, as CBA does. This final step of CBA, where the IoA and cost are evaluated for final decision, is a benefit of the method, because as practitioners indicates, this method allow to contrast the differences between alternatives and also allow to contrast more information.
Figure 4: WRC alterative in Pareto's optimal curve, but exist better alternatives.
Most of the practitioners chose a CBA alternative different from WRC’s one, even if WRC was in Pareto’s optimal curve. Also, the CBA alternatives were generally higher performing and/or more economical than alternatives selected by WRC. These results demonstrate that that CBA method enabled decision makes to explicitly evaluate performance versus cost which lead to more transparent and Pareto optimal decisions considering all alternatives in the design space.
6 CONCLUSIONS This study shows that it is possible to obtain better alternatives when CBA is applied
to large design spaces compared to the WRC method. The benefits of the CBA method over the WRC method are obtained from the analysis of the IoA versus cost, because it is possible to comprehensively assess all the alternatives in the design space. Also, CBA makes it possible to compare the benefits of all the alternatives instead of obtaining just one alternative as the best one, as the WRC method does.
7 REFERENCES AIAA (1991). Current state of the art in multidisciplinary design optimization. American
Institute for Aeronautics and Astronautics Inc. MDO Technical Committee. Arroyo, P., Fuenzalida, C., Albert, A., and Hallowell, M. (2016). Collaborating in decision
making of sustainable building design: an experimental study comparing CBA and WRC methods. Energy and Buildings. doi: 10.1016/j.enbuild.2016.05.079.
Arroyo, P., Tommelein, I.D., and Ballard, G. (2015). Comparing AHP and CBA as Decision Methods to Resolve the Choosing Problem in Detailed Design. Energy Construction Engineering and Management., 141(1), p.4014063.
265 | Proceedings IGLC | July 2017 | Heraklion, Greece
Comparing Choosing by Advantages and Weighting, Rating and Calculating Results in Large Design Spaces
Arroyo, P., Tommelein, I.D., and Ballard, G. (2014). Comparing Weighting Rating and Calculating vs Choosing By Advantages to make design choices, 1(510), pp.401–412.
Balling, R., and Rawlings, M.R. (2000). Collaborative optimization with disciplinary conceptual design. Structural and Multidisciplinary Optimization., 20(3), pp. 232-241.
Díaz, H., Alarcón, L.F., Mourgues, C., and García, S. (2017). Multidisciplinary Design Optimization through process integration in the AEC industry: Strategies and challenges. Automation in Construction.
Flager, F., Welle, B., Bansal, P., Soremekun, G., and Haymaker, J. (2009). Multidisciplinary process integration and design optimization of a classroom building. Information Technology in Construction., 14.
Flager, F., Adya, A., and Haymaker, J. (2009). AEC multidisciplinary design optimization: Impact of high performance computing. Center for Integrated Facility.
Hopfe, C.J., Augenbroe, G.L., and Hensen, J.L. (2013). Multi-criteria decision making under uncertainty in building performance assessment. Building and environment., 69, pp. 81-90.
Nguyen, A.T., Reiter, S., and Rigo, P. (2014). A review on simulation-based optimization methods applied to building performance analysis. Applied Energy., 113, 1043-1058.
Riccardi, A. 2011. Multidisciplinary design optimization for space applications. PhD Diss., University of Bremen, Bremen.
Sobieszczanski-Sobieski, J. (1987). The case for aerodynamics sensitivity analysis. NASA CP-2457, pp. 77–96.
Suhr, J. (1999). The Choosing by Advantages Decisionmaking System. Westport: Quorum Books.
Tappeta, R.V., and Renaud, J.E. (2001). Interactive multiobjective optimization design strategy for decision based design. Journal of Mechanical Design., 123(2), pp. 205-215.
Vandenbrande, J., Grandine, T., and Hogan, T. (2006). The search for the perfect body: Shape control for multidisciplinary design optimization. 44th AIAA Aerospace Science Meeting and Exhibit. Reno, NV, American Institute of Aeronautics and Astronautics, INC. AIAA 2006-928, pp. 1-16.
Wright, J.A. (1986). The optimised design of HVAC systems. PhD Diss., Loughborough University, Loughborough.
266 | Proceedings IGLC | July 2017 | Heraklion, Greece

Delhi Venkata S. K., N Raghavan, Mahalingam A. and Varghese K., (2017). “Initial Euphoria to Sustained Change – Mainstreaming Lean Culture” In: LC3 2017 Volume II – Proceedings of the 25th Annual Conference of the International Group for Lean Construction (IGLC), Walsh, K., Sacks, R., Brilakis, I. (eds.), Heraklion, Greece, pp. 267–274. DOI: https://doi.org/10.24928/2017/0288
INITIAL EUPHORIA TO SUSTAINED CHANGE – MAINSTREAMING LEAN CULTURE
Venkata S. K. Delhi1, Raghavan N2, Ashwin Mahalingam3, Koshy Varghese4
Abstract: In line with the trend of spread of Lean Construction concepts in the recent past, Lean construction philosophy was introduced in a large industrial project of a leading organisation about two years back. The drive by the top management, augmented by efforts of the Lean champions in the project team, helped the project team to transition from the conventional project delivery method to the Lean Construction method. The present study looks at the developments in Lean implementation in the Project over time, based on observations on such dynamics and understanding the strategies which might help to mainstream Lean philosophy introduction in other similar organisations and construction projects.
A detailed case study based approach was adopted to this end. The mentoring coach closely observed the behavioural developments of the Project team over time. Data for analysis included primary observations by the mentoring coach, minutes of the various meetings of the project team under study and one- on- one interactions with various team members. The analysis gave some significant insights on how to continue the initial momentum gained towards sustained Lean implementation on construction projects and in organisations.
Keywords: Sustained Lean Practice, Lean Culture, Transformation, Behaviour change, Human resources.
1 INTRODUCTION Lean construction has gained some momentum in India over the last decade. . The formation of bodies like ILCE (Institute for Lean Construction Excellence) and research initiatives from leading educational institutions such as Indian Institute of Technology Madras (IITM) helped in securing institutional support for the organisations willing to transform and adopt Lean philosophy. To this end, many such construction organisations are testing Lean construction concepts on pilot basis on some of their construction projects. The initial gains witnessed from such projects include reduction in wastage, time and cost benefits, improvement in the morale of the teams involved among many other benefits (Kaiser, 2012; Raghavan, 2015). Such witnessed benefits encouraged these organisations to attempt to institutionalise Lean practices in their organisational processes. One such commendable attempt by a leading corporate is reported in this paper.
1 Assistant Professor, Civil Engineering Dept., Indian Institute of Technology Bombay, Mumbai, India,
[email protected] 2 Professor of Practice, Dept. of Civil Engineering, Indian Institute of Technology Madras, Chennai,
India [email protected] 3 Associate Professor, Dept. of Civil Engineering, Indian Institute of Technology Madras, Chennai,
India, [email protected] 4 Professor, Dept. of Civil Engineering, Indian Institute of Technology Madras, Chennai, India
267 | Proceedings IGLC | July 2017 | Heraklion, Greece
Initial Euphoria to Sustained Change – Mainstreaming Lean Culture
In this context, this large conglomerate with a distinguished long history had initiated the introduction of Lean philosophy in some of its construction activities. , After a couple of successful trial implementations conducted in a training mode, the organisation decided to introduce Lean construction in a large industrial project on a pilot basis. The initial part of how Lean construction philosophy was introduced and the learning from the initial exercise were reported in an earlier paper (Raghavan et. al. 2016). An external mentoring coach team which was hired to give guidance on Lean implementation decided to use this unique opportunity to study the various barriers and facilitators to mainstream Lean on a long term basis in a Project, and then further on in the overall organisation.
2 OBJECTIVES OF THE STUDY
Further to the earlier study which looked at the initial learning curve, the present study is aimed at understanding the organisational dynamics and other factors which help in sustaining the initial momentum towards comprehensive implementation of Lean construction in a project and in the organisation.
3 RESEARCH METHOD To address these objectives, a detailed case- based research approach was adopted in this study. After the initial take-off the mentoring coach observed the sustained practice of Lean concepts in the project as well as in the organisation. The mentoring coach also observed the development of Lean culture in the various construction teams over time. Data for analysis included primary observations by the research team, minutes of meetings of the project team under study, a survey questionnaire addressed to the team members and one- on- one interactions with various team members. .The various observations made from time to time were analysed by the mentoring coach and corrective courses were communicated to the project teams for steady progress on the Lean road. Decisions were made on the basis of data collected from different methods/ sources and not from any subjective view points.
4 CASE STUDY – INDUSTRIAL PROJECT The new industrial project included Engineering, Procurement and Construction phases. The parent organisation was basically a diversified, highly reputed manufacturing company and it also had a construction division. The construction division had the responsibility to construct and deliver this crucial project to its parent organisation. The top management of the construction division sensed this as a good opportunity to introduce Lean construction on the project. The division had tried out Lean construction earlier on pilot projects and had tasted some success. Hence the division wanted to try this philosophy on a project with larger scope. The top management hoped that the new construction philosophy would help them save time and make construction more efficient across all their construction projects by and by.
As the project was being conceptualized and designed, Lean construction philosophy was introduced progressively in all the phases of the project. Various techniques such as 5S, Big Room, Last Planner SystemTM, PPC (Plan Percent Completed) monitoring, etc. were introduced progressively in the project. The team started using these tools and also started progressively adopting Lean as a work philosophy as well.
268 | Proceedings IGLC | July 2017 | Heraklion, Greece

Venkata S. K. Delhi, Raghavan N, Ashwin Mahalingam and Koshy Varghese
As time progressed, the project emphasis shifted from design to construction stage. In the various stages the project encountered a number of challenges. Initially the project faced some challenges due to permits, approvals and land acquisitions which impacted the sequence and timing of development significantly. Later there were other challenges arising from various scope changes from end users, design changes, variations in soil strata, inclement weather conditions, etc. As the challenges began to unfold, the mentoring coach observed how the project team responded to these challenges and tried to understand whether the adoption of Lean philosophy helped or deterred the team from achieving their objectives.
5 OBSERVATIONS ON SUSTAINING LEAN PHILOSOPHY
The main observations relating to sustaining the Lean philosophy on the project and mainstreaming it in the organisation are covered in three different categories in this section - (i) Organizational structure, (ii) Procedural aspects and (iii). Organizational behaviour and culture.
5.1 Organizational structure
The first set of observations relates to the unique aspects pertaining to the organisational structure and how they contributed/challenged in sustaining the Lean philosophy.
5.1.1 Sustaining the changes in organizational structure
The traditional time-honoured (matrix) structure of this organization had multiple reporting streams for many people. For example, the manager responsible for installing MEP components of the project reported to the project manager as well as the division head of the MEP division of the company. Similarly, many team members were working on various other projects and had multiple heads to report to. The introduction of Lean exposed these complexities in the organizational structure. The regular practice of the Big Room concept and the Collaborative Planning System adopted, as well as better understanding of the inter-dependencies of the various teams, helped overcome such difficulties related to the structure. Basically people started to reach out to the concerned people directly and collaborate along lateral lines rather than along vertical lines of communications. Teams started accepting the complexities and learned to function effectively despite the challenges. Realisation of this initial benefit helped the team members appreciate the benefits of Lean and sustain Lean in the project.
Another challenge overcome by Lean practices related to compartmentalisation and lack of sharing. The prevailing planning structure before Lean was highly centralized. The project planning was done by a central team and the scopes and deadlines were determined by this team and "pushed" on to the other teams. The introduction of Lean transformed this relationship to that of a "pull" environment where the micro planning and scheduling for activities were now done by the respective team members and the central planning team aggregated these plans and checked for conformance to the broader milestones. The initial transition was quick. However, as the project progressed, there was always a tendency to swing back to the age-old planning mechanism. The benefits of initial Lean implementation weighed against the resistance to switch from a known process and this was a key dynamic which assisted long term adoption of Lean philosophy on the project.
269 | Proceedings IGLC | July 2017 | Heraklion, Greece

Initial Euphoria to Sustained Change – Mainstreaming Lean Culture
5.1.2 Involvement of the top management
During the initial phases the top management of the construction division was closely following the team’s transition to Lean construction and provided considerable motivation. The management was regularly involved in the Big Room meetings during the initial phase. As the management saw that Lean was being successfully adopted on the project, its focus shifted to other pressing matters. As the top management’s frequency of participation in the Lean meetings decreased, the initial enthusiasm towards Lean started waning. The behaviour of the various teams changed to some extent once they realised that they were no longer under the direct watch of the top management. This could relate somewhat to the concept of the Hawthorne effect (Landsberger, 1958), wherein the behaviour of people changed once they realised that they were being observed. This highlighted the need for the involvement of the top management to continue for a considerable period to sustain the transition to Lean construction.
5.1.3 The changes in Lean championship team
The initial transition to Lean methods was championed by a Lean championship team which was familiar with Lean methods from association with earlier Lean trials and which had also fully subscribed to the Lean philosophy. However, as the project progressed, some of the members of this championship team were shifted to other assignments. The dilution in the driving force provided by the champions started cooling off the interest in Lean and commitment to Lean started wavering to some extent. The learning was that the core championship team should stay with the Project for sustained momentum.
5.2 Procedural Aspects
The introduction of Lean philosophy involved some significant changes to the traditional processes adopted in the project. This section discusses some aspects of the processes which the Lean implementation challenged.
5.2.1 The transparency required in organisational processes
An interesting change in the organisational processes came about due to increased transparency in the interaction processes associated with Lean culture. Lean introduced the need to accept the project performance as paramount as against the performances of individual divisions/ teams. The use of the Big Room concept encouraged the various teams to start having conversations directly with the other teams to seek clarifications instead of going through time and energy-consuming traditional hierarchical routes. Such dynamics observed on this project point to the fact that for successful Lean implementation, the organisation should enable processes which are adequately transparent and inclusive and encourage the various players to share information among all team members including subcontractors.
5.2.2 Proactive determination of challenges
The use of Big Room meetings and Look Ahead schedules encouraged the team members to look at the potential constraints more proactively and seek timely and coordinated action plans. This meant introduction of new processes in the organisation which would facilitate such proactive working. Also, a new software tool was deployed to keep track of the promises and new protocols were drafted with regard to the communication and escalation mechanisms. As the project progressed, the teams were initially viewing these
270 | Proceedings IGLC | July 2017 | Heraklion, Greece

Venkata S. K. Delhi, Raghavan N, Ashwin Mahalingam and Koshy Varghese
as constraining them from their usual way of doing business. However, as the project started facing various challenges (described in Section 4 above) these new processes helped the teams to navigate the challenges better. The formation of a multi-disciplinary, multi-divisional Steering Committee helped considerably in sorting out inter-departmental coordination issues, etc. The team was able to anticipate some of these challenges and the new Lean processes gave them flexibility to micro plan around these challenges. As one of the team members put it in one of the meetings – “I should tell you, as we look at whether Lean helped us on the project or not, that we have made this progress despite various challenges only because of Lean. I do not know what it would have been like if Lean was not implemented”
5.2.3 Challenges in implementing Lean in Design and Procurement phases
Lean construction principles have been applied to the construction processes in various projects in this country. However, introduction of Lean philosophy in the design and procurement phases of the project posed significant challenges. The Design work in this project was outsourced and complex workflow processes involving several end-user groups, the internal coordination team and the multi-location design agency resulted in several iterations. The weekly look ahead plans and constraints identification were not easy for the design and procurement teams. The Big Room meetings mandated these team members to give commitments on certain aspects of the design. The weekly look-ahead plans did help them to micro plan certain activities but as the week progressed, the team members realized that the promises given might not be fulfilled due to unanticipated iterations and design changes. Similar problems were encountered with the procurement phase, where standard operating procedures for procurement as per Lean concepts were not set before the project commenced. Unanticipated activities such as extended negotiations with vendors, etc. made it difficult for the procurement teams to keep up their promises. Such procedural aspects challenged the appropriateness of Lean implementation in the Design and Procurement phases of Lean implementation. At present methods for improving the processes of introduction and mainstreaming Lean in design and procurement are still being debated by the teams.
5.2.4 Challenges in the Involvement of different Divisions with their own individual Processes
The other divisions of the organisation apart from the construction division had their own project management systems, such as the Theory of Constraints and initially found it difficult to accept and adopt the Lean philosophy. This resulted in many debates and disengagement to some extent. However, on observing the Lean processes involved over time, they understood the many similarities in the approaches and came around to accepting the Lean concepts as being more comprehensive and started practicing Lean quite effectively.
5.3 Organizational behaviour and culture
The behavioural and cultural aspects turned out to be the most challenging in terms of sustaining the transformation to Lean over a longer period. The initial momentum of the novel philosophy started slowing down after some time. The age-old habits of the team members began to resurface. The prevalent organisational culture was a friendly one where team members were more concerned about avoiding conflicts. While this culture maintained a pleasant working environment in the organisation and the project, it impeded the team members from discussing the feasibility, etc frankly and effectively.
271 | Proceedings IGLC | July 2017 | Heraklion, Greece

Initial Euphoria to Sustained Change – Mainstreaming Lean Culture
As the project progressed, Lean implementation forced the members to come out of this comfort zone and discuss the issues more frankly and point out the constraints posed by other team members. Sustaining this open culture became a challenge in the long term on the project and prompted organisation-wide initiatives to change this culture.
6 STRATEGIES THAT FACILITATE MAINSTREAMING OF LEAN
CULTURE IN THE ORGANISATION As the mentoring coach observed the organisation while it was trying to sustain the Lean culture developed, some key findings which can be applied to other projects were noted. These findings are discussed below.
6.1 The role of Lean steering team
The role of a Lean steering or champion team is very important in mainstreaming Lean philosophy. This team should be in a position to gauge the morale of the working team players and persist with the changes till the working teams realized the benefits of Lean implementation. The role of this team is also crucial in realizing how various tools related to Lean construction can be implemented in the organisation in an effective manner. The team could decide on which tools to implement and also on the timing of such implementations to maximise the gains achieved by the implementation of Lean on projects. An important point in this aspect is the continuity of personnel who are part of this team. The organisation could, as far as possible, ensure that certain key persons continue on this team to improve the consistency of Lean implementation over time.
6.2 The role of demonstrable initial successes
It helps to have some demonstrable initial successes to sustain Lean over time. The use of the simpler tools such as 5S, Work Sampling, First Run Studies, etc help people understand Lean processes on a hands-on basis and can be useful to demonstrate early gains. The initial successes help the team members build confidence on subscribing to the change and help mainstreaming the new philosophy.
6.3 The role of HR training
A crucial role is played by Human Resources training in mainstreaming Lean construction. The HR teams can help facilitate the behavioural change which is required by the project teams as the organisation transitions to the new culture. The HR trainings could also aim at addressing gaps in trust and encourage an open and honest culture. In this process, they could re-emphasize the vision and goals of the organisation and how transforming to the new paradigm helps in achieving those goals. The trainings should be structured in such a way that these principles are instilled in all the employees early in their career in the organisation. Reinforcing trainings which build on the older trainings play a crucial role in the internalization of Lean culture among employees and mainstreaming the Lean culture in the organisation. The mentoring coach observed that such HR trainings might also be required for the vendors and contractors who are part of the projects.
6.4 The role of technology
The organisation could substantially invest in technologies which would help in mainstreaming Lean. This might involve software tools that facilitate coordination and
272 | Proceedings IGLC | July 2017 | Heraklion, Greece

Venkata S. K. Delhi, Raghavan N, Ashwin Mahalingam and Koshy Varghese
construction such as comprehensive modelling tools like Digital workflow models, Visualization and BIM enabled-Lean. The mentoring coach had observed significant improvement in the effectiveness of the PPC measures when the organisation introduced special software to automate the processes of reporting. Such simple technology tools might help Lean implementation in a big way.
6.5 The role of top management buy-in
The role played by top management is extremely critical in the mainstreaming. The top management could make it amply clear that Lean would be the main or only way of delivering projects in the organisation and should take visible actions to this effect. Such actions by the top management will facilitate the shifting to the new philosophy and aid in changing the organisational culture. Further, sustained involvement and motivation by the top management is invaluable in sustained Lean implementation.
6.6 The role of a Lean Mentor/ Coach
The availability of an experienced Lean mentor or coach can help in maintaining sustained practice of Lean concepts and help in charting mid-course corrections to ensure sustained Lean implementation. The various problems encountered in the project as mentioned earlier sometimes had a negative impact on the overall PPC trend in the Last Planner process used. (Fig. 1). However, with the guidance of the Lean coach and ever-growing permeation of Lean culture in the various teams, the negative trends were rectified.
Fig.1 Variation of overall PPC over time
7 IMPLICATIONS AND CONCLUSIONS The study illustrates some key aspects related to organisational structure, processes and culture which can pose significant challenges or enable mainstreaming while implementing Lean construction in a project or in an organisation. It was noted that changing the organisational structure or introducing tools did not pose significant challenges if the top management was fully subscribed. However, a change in processes is relatively difficult to achieve in an organisation. Finally, the organisational culture is a significant factor in the transformation to the new paradigm. Though the team members adopt the new philosophy in the short term, the deep seated beliefs would resurface over time and if not re-aligned to the new philosophy continuously, would pose significant challenges in transforming to Lean culture. Strategic planning by the top management is required to surmount these challenges. Such strategies might include demonstrating the
0%
50%
100%
Weeks
273 | Proceedings IGLC | July 2017 | Heraklion, Greece

Initial Euphoria to Sustained Change – Mainstreaming Lean Culture
initial successes achieved with Lean philosophy to reinforced trainings to transform the organisational culture. The use of technology and tools such as Digital workflows, automated reporting and alerting tools, etc. might help in improving the effectiveness of Lean and also help transform the team. Top managements should strategically plan such interventions to effectively mainstream Lean culture in an organisation.
8 REFERENCES
Raghavan, N. (2015). “Implementing Lean Concepts in Indian Construction Sites- A Trial and its Outcome.” Indian Lean Construction Conference, Mumbai, 39–52.
Raghavan, N., Kalidindi, S., Mahalingam, A., Varghese, K., and Ayesha, A. (2014). “Implementing Lean Concepts on Indian Construction Sites: Organisational Aspects and Lessons Learned.” Proceedings of the 22nd annual conference of the International Group for Lean Construction, Oslo, 1181–1190.
Ballard, G. (2015). “Bringing Lean into Indian Construction Industry.” Proceedings of the Indian Lean Construction Conference, Mumbai, 1–13.
Raghavan, N., Venkata S.K.D., Mahalingam, A., Varghese, K. (2016). "Introducing Lean Construction Philosophy in E-P-C Phases of a Large Industrial Project", Proceedings of the 24th annual conference of the International Group for Lean Construction, Boston
Keiser, J. A. (2012) "Leadership and Cultural Change: Necessary Components of a Lean Transformation". Proceedings of the 20th annual conference of the International Group for Lean Construction, San Diego
Landsberger, H. A. (1958). "Hawthorne Revisited: Management and the Worker, Its Critics, and Developments in Human Relations in Industry". Cornell University Press
274 | Proceedings IGLC | July 2017 | Heraklion, Greece
Dlouhy J., Binninger M., Weichner L. and Haghsheno S. (2017). “Implementation of Lean Construction in Client Organizations- an Analysis of the Status Quo in Germany.” In: LC3 2017 Volume II – Proceedings of the 25th Annual Conference of the International Group for Lean Construction (IGLC), Walsh, K., Sacks, R., Brilakis, I. (eds.), Heraklion, Greece, pp. 275–282. DOI: https://doi.org/10.24928/2017/0089
IMPLEMENTATION OF LEAN CONSTRUCTION IN CLIENT ORGANIZATIONS – AN ANALYSIS OF THE
STATUS QUO IN GERMANY
Janosch Dlouhy1, Marco Binninger2, Lisa Weichner3, and Shervin Haghsheno4
Abstract: Lean Construction is a management approach that is not only relevant for construction companies but also for their clients. The goal of this paper is to present the current status of strategies for implementation of Lean Construction within client-side organizations in Germany. A significant foundation principle in Lean Construction is the definition of value from the perspective of the client. Value is predominantly defined through the design and functional quality of a building as well as keeping to the defined time and cost objectives. In construction, the developer as a client has several tasks to fulfil which have a significant impact on the success of a project. Some developers seek to actively contribute to defining and managing meeting of their own client wishes. This requires using the approach and tools of Lean Construction, and these efforts have resulted in implementation strategies. Analysis of the status of implementation within client-side organizations was completed through interviews with eight companies in Germany. This paper will explain the method of data collection, the structure of the organizations surveyed. The implementation strategies will be described for each organization and classified according to the applicable framework conditions. The results determined that the companies use various approaches which are at different stages of implementation. This paper thereby provides a preliminary empirical overview of the situation regarding implementation of Lean Construction by development companies in Germany, and can be used by other developers as a basis for their first steps in implementing Lean Construction.
Keywords: Lean construction, computing, mixed reality, template, instructions.
1 INTRODUCTION Womack begins his book 'Lean Thinking' by stating "The critical starting point for lean thinking is value. Value can only be defined by the ultimate customer" (Womack and Jones 2003). When applying this to lean in the construction industry, two questions are posed: Who is the end client in this construction process, and how does this client define the value of a construction project? This paper will not offer a definite answer to these questions, but rather practical observations and analysis as a basis for further research into value to the ultimate costumer. The client of a building project is not always the end client, but these roles could be combined that could be confusing. To clarify understanding of
1 Research Fellow, Karlsruhe Institute of Technology, Germany, +49-721-608-42168,
[email protected] 2 Research Fellow, Karlsruhe Institute of Technology, Germany, +49-721-608-44124,
[email protected] 3 M.Sc. Student, Karlsruhe Institute of Technology, Germany, +49-721-608-43650,
[email protected] 4 Professor, Karlsruhe Institute of Technology, Germany, +49-721-608-42646,
275 | Proceedings IGLC | July 2017 | Heraklion, Greece
Implementation of Lean Construction in Client Organizations- an Analysis of the Status Quo in Germany
these roles, a client who is both the end client and user will be described in this paper as the "ultimate client" according to Womack and Jones (2003). The ultimate client presents a clear difference to the role of "ultimate customer". The ultimate customer generally has no influence over the production process for creating value. The production company has sole responsibility for the conditions of production. Conversely the ultimate client in the construction process has final responsibility and sets the framework conditions for the production company. According to German architect Otto Bartning (Gautier 2014), 50% of all services are to be provided by the client. Therefore, clients are responsible for important tasks and functional areas during execution of construction projects. To better understand the ultimate client and his or her perception of value, this research analyzed the lean activates of known ultimate clients in Germany. The authors have limited the sample to industrial clients as in contrast to public-sector or private clients, these fill the role of client as well as the user and operator (Bertelsen and Emmitt 2005). Selection of industrial clients means that the company is building to satisfy its own demand and selects the location as well as volume of investment according to the goals of their main area of business (Glatte 2012). These goals include short design and build times for production buildings, as well as to guarantee sufficient production and secure their market segment (Girmscheid 2010). The resultant requirements have led to various approaches for lean construction implementation being developed within German client-side organizations.
The goal of this paper is to document efforts toward lean construction from the perspective of the ultimate client. Additionally, the different forms of this are identified and assessed according to lean construction principles. This allows the current status of lean construction implementation by industrial concerns acting as construction clients in Germany to be determined.
2 RESEARCH METHOD Due to a lack of literature on the topic of clients and how they carry out projects, it is
not possible to gather sufficient written factual data on this topic. In order to gain a perspective on client implementation concepts which is as realistic as possible, data was gathered qualitatively in the form of expert interviews. This was arranged as a partially standardized questionnaire to allow simplified access to complex knowledge from interviewees (Hohl 2000).
The interviews were carried out using open questions with the help of additional knowledge gathering strategies. These strategies are characterized by the use of varying types of questions (Scheele and Groeben 1988). The questionnaire encompassed open, closed and hybrid questions (Kruse 2014). The combination of these types of questions created the possibility of gaining an overview of the lean methods used, and at the same time offered the potential for discovering new methods. Lean terminology was not used in order to prevent potential confusion that maybe caused by jargon. In total there were 23 questions of which eight were open questions and 15 were closed questions. Of the 15 closed questions, four were hybrid questions. The goal was to gain additional background information on how projects are executed. In addition to questions on the use of lean methods, the questionnaire also included general questions regarding the types of buildings, volume of construction and the organizational structure of the building department of the applicable company. Additionally, there were questions on project organization, project execution, project control and measures applied in cases where there were deviations from the project goals. The recorded data was anonymized to protect the identity of the participants. The selection of interviewees was completed through a
276 | Proceedings IGLC | July 2017 | Heraklion, Greece

Janosch Dlouhy, Marco Binninger, Lisa Weichner and Shervin Haghsheno
combination of gatekeepers and internet research to simplify access to interviewees (Kruse 2014). The organizations invited should be active in the industrial sector and have an in-house construction department. Ideally they should have knowledge of, or even have implemented lean construction methods. The interviewees held a management position in the construction department, or were directly involved with the lean implementation process. As the questionnaire included open and hybrid questions, data was assessed through coding of the questions. Thereby similar answers could be categorized. After categorization was completed, the hybrid questions could be assessed in the same way as the closed questions. It is important to include a category such as "no answer". The approach of interpreting the answers was completed using Flick's method of thematic coding which comprises three steps (Flick 1995).
1. Case by case analysis: This includes a short description of each case and results
with respect to the question asked and the central themes of this research (Reuber and Pfaffenbach 2005).
2. In-depth analysis: A specific account related to the topic of this research is presented. Relevant connections between individual answers are sought. The goal is to develop a system of categorizations for each individual case which can be applied to the interviews that follow, and be modified as needed. (Flick 1995)
3. Typification: The final step includes the finding similarities and differences between different cases and categories. Types can be developed to subsume the specific cases. The construction of types occurs through summarizing the specific cases according to specific characteristics. The specific cases of one type only have small differences (internal homogeneity). The characterization of individual types is thereby as strong as possible (external homogeneity). (Flick 1995)
3 STATUS QUO IN GERMANY Evaluation of the gathered data shows that as a result of client demands, more efficient supply systems, simplified standards, quality improvements, cost optimizations and transparency of various lean management concepts have been developed. There are similarities with regard to the influencing factors for project execution and types of buildings.
3.1.1 Company 1
An Industrial company with more than 150 million € annual construction volume.
277 | Proceedings IGLC | July 2017 | Heraklion, Greece
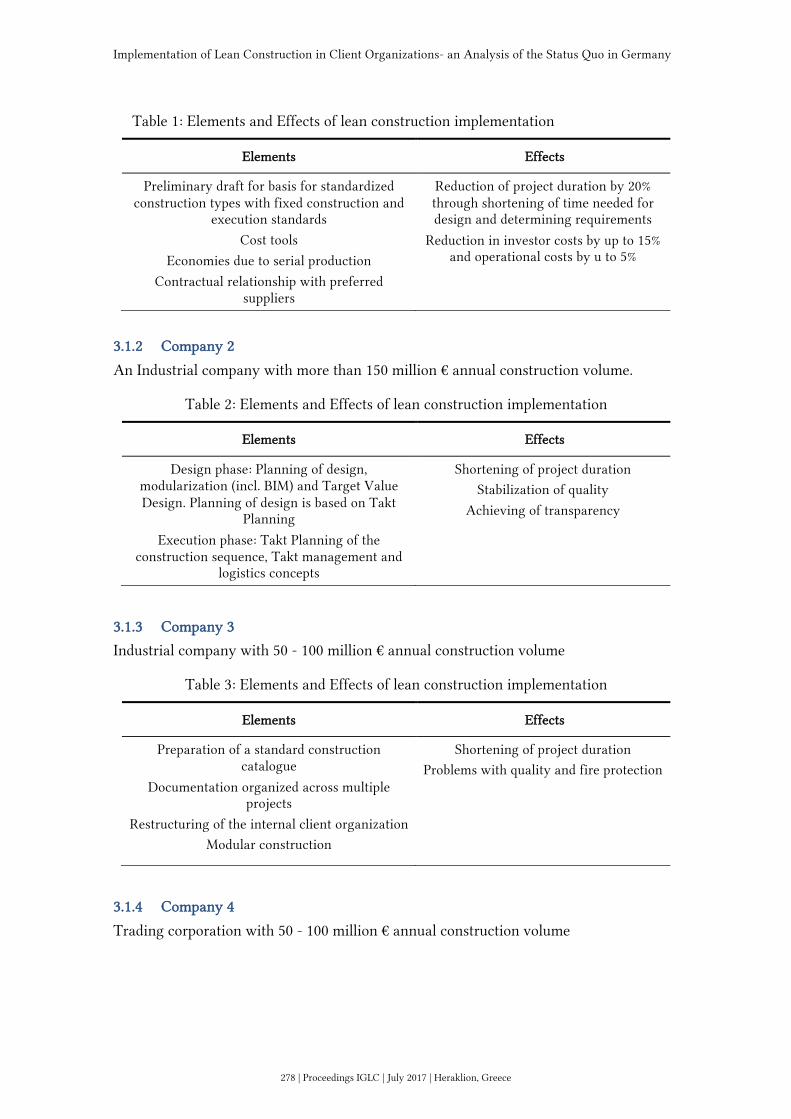
Implementation of Lean Construction in Client Organizations- an Analysis of the Status Quo in Germany
Table 1: Elements and Effects of lean construction implementation
Elements Effects
Preliminary draft for basis for standardized construction types with fixed construction and
execution standards
Cost tools
Economies due to serial production
Contractual relationship with preferred suppliers
Reduction of project duration by 20% through shortening of time needed for design and determining requirements
Reduction in investor costs by up to 15% and operational costs by u to 5%
3.1.2 Company 2
An Industrial company with more than 150 million € annual construction volume.
Table 2: Elements and Effects of lean construction implementation
Elements Effects
Design phase: Planning of design, modularization (incl. BIM) and Target Value Design. Planning of design is based on Takt
Planning
Execution phase: Takt Planning of the construction sequence, Takt management and
logistics concepts
Shortening of project duration Stabilization of quality
Achieving of transparency
3.1.3 Company 3
Industrial company with 50 - 100 million € annual construction volume
Table 3: Elements and Effects of lean construction implementation
Elements Effects
Preparation of a standard construction catalogue
Documentation organized across multiple projects
Restructuring of the internal client organization Modular construction
Shortening of project duration Problems with quality and fire protection
3.1.4 Company 4
Trading corporation with 50 - 100 million € annual construction volume
278 | Proceedings IGLC | July 2017 | Heraklion, Greece

Janosch Dlouhy, Marco Binninger, Lisa Weichner and Shervin Haghsheno
Table 4: Elements and Effects of lean construction implementation
Elements Effects
Fixed definition of construction and execution standards
Lean awarding of contracts through long-term framework contracts based on a specification of
services which describes all necessary works and materials to be used
Cooperative project execution processes achieved through long-term business
relationships Increased efficiency through repetition
Shortening of project duration
3.1.5 Company 5
Industrial company with less than 50 million € annual construction volume
Table 5: Elements and Effects of lean construction implementation
Elements Effects
Consistent process systems to increase efficiency in the construction sequence made
up of an overall process analysis, process planning and steering of the performance
Embedding a Bonus/Malus system into contracts with design consultants
Project organizations with integrated user management
Development of a professional and structured execution of construction that
keeps within cost and timeline constraints
Transparency for clients and all parties involved with the project
Intensive involvement of users leading to minimization of variations
Partnerships and trusting collaboration instilled in all project participants
3.1.6 Company 6
Industrial company with less than 50 million € annual construction volume
279 | Proceedings IGLC | July 2017 | Heraklion, Greece
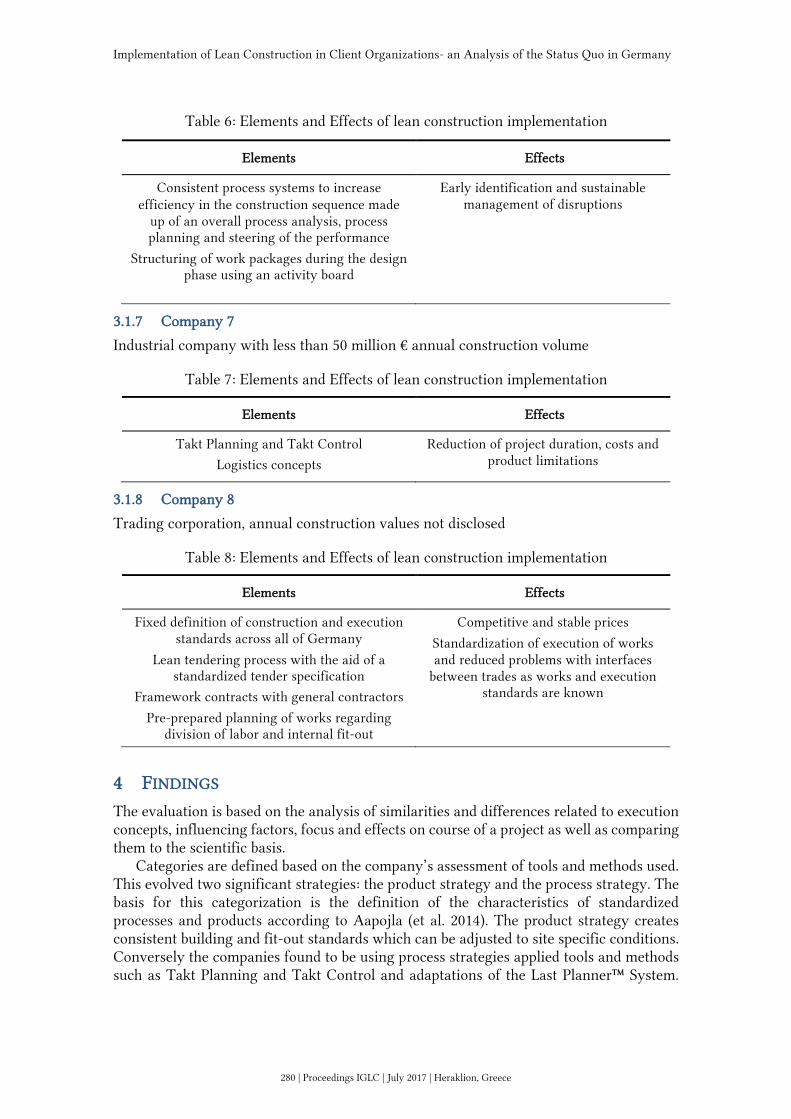
Implementation of Lean Construction in Client Organizations- an Analysis of the Status Quo in Germany
Table 6: Elements and Effects of lean construction implementation
Elements Effects
Consistent process systems to increase efficiency in the construction sequence made
up of an overall process analysis, process planning and steering of the performance
Structuring of work packages during the design phase using an activity board
Early identification and sustainable management of disruptions
3.1.7 Company 7
Industrial company with less than 50 million € annual construction volume
Table 7: Elements and Effects of lean construction implementation
Elements Effects
Takt Planning and Takt Control
Logistics concepts
Reduction of project duration, costs and product limitations
3.1.8 Company 8
Trading corporation, annual construction values not disclosed
Table 8: Elements and Effects of lean construction implementation
Elements Effects
Fixed definition of construction and execution standards across all of Germany
Lean tendering process with the aid of a standardized tender specification
Framework contracts with general contractors
Pre-prepared planning of works regarding division of labor and internal fit-out
Competitive and stable prices
Standardization of execution of works and reduced problems with interfaces
between trades as works and execution standards are known
4 FINDINGS The evaluation is based on the analysis of similarities and differences related to execution concepts, influencing factors, focus and effects on course of a project as well as comparing them to the scientific basis.
Categories are defined based on the company’s assessment of tools and methods used. This evolved two significant strategies: the product strategy and the process strategy. The basis for this categorization is the definition of the characteristics of standardized processes and products according to Aapojla (et al. 2014). The product strategy creates consistent building and fit-out standards which can be adjusted to site specific conditions. Conversely the companies found to be using process strategies applied tools and methods such as Takt Planning and Takt Control and adaptations of the Last Planner™ System.
280 | Proceedings IGLC | July 2017 | Heraklion, Greece

Janosch Dlouhy, Marco Binninger, Lisa Weichner and Shervin Haghsheno
These should generate transparency, predictability and stability to the construction process.
Furthermore, effects can be seen in the execution strategy for project organization, project sequence, project control and for managing changing project expectations. Comparison with the available literature, Glatte (2014) confirms that corporate strategies have significant effects on the real estate strategy and thereby influence the selection of project execution strategy.
Figure 1 shows how the real estate strategy influences the execution strategy of ultimate clients. For the product strategy, the ultimate client is characterized by corporate design, which determines the structure and equipment used. The process strategy fulfils the requirements of ultimate clients who have various kinds of buildings with a unique character. It must be ensured that both strategies remain focused on completion of the building within the given timeline to keep to the required opening date or start of production, and to best fulfil the applicable corporate strategy.
Moreover, it is shown that currently only a small proportion of the available tools have been used. In particular, during the design phase lean methods are rarely used, as is shown in Table 9.
Table 9 Overview of the lean tools used
Elements Company
1 2 3 4 5 6 7 8
Last Planner System Integrated Project Delivery
Takt Planning/ Takt Management Target Value Design
Agile Methods
Set Based Design
Modularization
Quality Function Development Lean Construction Site logistics
X
X X
X
X
X
X
X
X
Figure 1: Influences on implementation strategies
281 | Proceedings IGLC | July 2017 | Heraklion, Greece

Implementation of Lean Construction in Client Organizations- an Analysis of the Status Quo in Germany
The current status of lean implementation for ultimate customers in Germany is shown in Figure 2 according to Schuh's Lean Maturity Model (Schuh 2013). "This maturity model describes how the effectiveness of lean innovation principles can be continually increased by changing structures and relationships. Working with ideal situations and the target outcomes derived thereof to serve in orienting all employees is especially important for continuous improvement." (Schuh 2013)
Only one company achieves maturity level of 'Lean Organised'. The others are categorized in the levels 'Ad Hoc' to 'Lean Initiated'.
Figure 1: Lean Maturity of the companies interviewed
5 CONCLUSIONS This paper shows that the ultimate client develops various strategies to define value for the client, and how to achieve it. Thereby there is a clear internal definition of their own client value in this work. Achieving value to the client is not achieved just by selecting a method, but rather by choosing a product and process-driven strategy and aligning the regarding tools to them. The type of implementation is bound by strategic parameters, which is also linked to the client's area of business.
A recommendation to ultimate clients is that both strategies are taken into account for lean implementation across all project stages and across different projects using multi-project management. The current best practice is used by Company 2 which attempts to integrate the product into its process strategy.
6 DISCUSSION
The results of this paper have no general validity, but rather provide a sample investigation, as only a small number of interviewees were selected on a subjective basis. If other gatekeepers would have selected the companies, it is possible that the results would have been different.
It has been shown that ultimate clients exist, and this offers a basis for further research.
282 | Proceedings IGLC | July 2017 | Heraklion, Greece

Janosch Dlouhy, Marco Binninger, Lisa Weichner and Shervin Haghsheno
7 REFERENCES
Aapaoja, Aki; Haapasalo, Harri (2014): The Challenges of Standardization of Products and Processes in Construction. Oslo (22nd Annual Conference of the International Group of Lean Construction).
Bertelsen, Sven; Emmitt, Stephen (2005): The Client as a Complex System. Sydney, Australia (13th Annual Conference of the International Group for Lean Construction;)
Flick, Uwe (1995): Handbuch qualitative Sozialforschung. Grundlagen, Konzepte, Methoden und Anwendungen. 2. Aufl. Weinheim: Beltz.
Gautier, Peter; Osebold, Rainard (2014): Die Wiederentdeckung des Bauherrn- Bedarfsplanung als Grundlage für den weiteren Planungsprozess. Berlin: Deutsches Ingenieurblatt
Girmscheid, Gerhard (2010): Projektabwicklung in der Bauwirtschaft. Wege zur Win-Win-Situation für Auftraggeber und Auftragnehmer. Berlin, Heidelberg: Springer-Verlag Berlin Heidelberg.
Glatte, Thomas (2014): Entwicklung betrieblicher Immobilien. Beschaffung und Verwertung von Immobilien im Corporate Real Estate Management. Wiesbaden: Springer Vieweg
Hohl, Joechim (2000): Das qualitative Interview. In: Journal of Public Health 8 (2), S. 142–148. DOI: 10.1007/BF02962637.
J.Womack/D. Jones – Lean Thinking First Free Press Edition 2003 ISBN 0-7432-4927-5) S. 16.
Kruse, Jan (2014): Qualitative Interviewforschung. Ein integrativer Ansatz. Weinheim: Beltz Juventa (Grundlagentexte Methoden)
Reuber, Paul; Pfaffenbach, Carmella (2005): Methoden der empirischen Humangeographie. Beobachtung und Befragung. 1. Aufl. Braunschweig: Westermann (Das geographische Seminar).
Scheele, Brigitte; Groeben, Norbert (1988): Dialog-Konsens-Methoden zur Rekonstruktion subjektiver Theorien. Die Heidelberger Struktur-Lege-Technik <SLT>, konsensuale Ziel-Mittel- Argumentation u. kommunikative Flußdiagramm-Beschreibung von Handlungen. Tübingen: Francke.
Schuh, Günther (2013): Lean Innovation. Berlin, Heidelberg: Imprint: Springer Vieweg.
283 | Proceedings IGLC | July 2017 | Heraklion, Greece

284 | Proceedings IGLC | July 2017 | Heraklion, Greece

Engebø, A., Drevland, F., Lohne, J., Shkmot, N., and Lædre O. (2017). “Geographical Distribution of Interest and Publications on Lean Construction” In: LC3 2017 Volume II – Proceedings of the 25th Annual Conference of the International Group for Lean Construction (IGLC), Walsh, K., Sacks, R., Brilakis, I. (eds.), Heraklion, Greece, pp. 285-292. DOI: https://doi.org/10.24928/2017/0121
GEOGRAPHICAL DISTRIBUTION OF INTEREST AND PUBLICATIONS ON LEAN CONSTRUCTION
Atle Engebø1, Frode Drevland2, Jardar Lohne3, Nawras Shkmot4 and Ola Lædre5
Abstract: It is a common view that certain countries show more interest in Lean Construction Principles than others. Some researchers within the Lean Construction community publish more and are more cited than others. The paper address the following research questions: 1) Where do those who show interest in Lean Construction come from? And 2) Is there any connection between geographical distribution of academic publications and where those who show interest in Lean Construction come from?
The research is based on empirical data collected from analysis of data traffic from the IGLC web page and the Lean Construction Blog. It also consists of a registration of what countries the authors at IGLC’s annual conference and in the Lean Construction Journal come from. The analysis of the data collected validates that specific countries show more interest in lean construction than other. When publications and web-traffic were corrected for number of inhabitant's country-by-country, the findings shows that there was a strong positive connection between the two parameters. This study could serve as a good basis for further studies on why some countries are more open to new ideas regarding construction and construction management.
Keywords: People, Culture and Change; lean expansion; mapping; web traffic.
1 INTRODUCTION Established theories for analysing the life-cycle of concepts emphasise the importance for concepts reach and engage, to both the early- and late majority of their intended audience (Rogers (2002); Gartner (2007)). A concept that fails at this would suffer the consequence of disappearing into oblivion. It is therefore vital for the “concepts well-being” to reach the majority of their intended audience. Thus, a mapping of the prevalence of Lean Construction (hereafter LC) could be used to assess the concept’s success in reaching the intended audience.
Pasquire and Connor (2011) evaluated whether the sources upon which the LC-theory has been based were originated from within the lean community or from outside. First, they found that the top five IGLC authors dominated and had 49% of the total citations.
1 Scientific assistant, Department of Civil and Environmental Engineering, Norwegian University of
Science and Technology, Trondheim, Norway, +47 905 71 902, [email protected] 2 Assistant Professor, Department of Civil and Environmental Engineering, NTNU - Norwegian
University of Science and Technology, Trondheim, Norway, +47 920 64 262, [email protected] 3 Research scientist, dr. art., Department of Civil and Environmental Engineering, Norwegian University
of Science and Technology, Trondheim, Norway, +47 934 44 930, [email protected] 4 Co-Founder & CFO, Paramount Decisions, San Francisco, USA, +47 41409992,
[email protected] 5 Associate Professor, dr. ing., Department of Civil and Environmental Engineering, Norwegian
University of Science and Technology, Trondheim, Norway, +47 911 89 938, [email protected]
285 | Proceedings IGLC | July 2017 | Heraklion, Greece
Geographical Distribution of Interest and Publications on Lean Construction
Second, their statistical analysis showed that only 21% of the sampled papers referred were by authors who were IGLC members (sources published at IGLC conferences). They argued that the lack of internal citing within IGLC was a challenge and suggested that IGLC authors should publish more in other significant research channels with the purpose of developing the theoretical base of LC. Pasquire and Connor (2011) also examined the citation distribution of past IGLC-papers where they identified the leading figures in the development of LC theory. Since the late nineties, where the spread of LC was dependent on a few key actors, and up until today, where the field consist of academics and industry actors from many different countries, LC-principles have experienced an increased interest within both academia and the AEC-industry.
According to Sun et al. (2016), mapping the evolution of scientific fields is crucial for positive science policy and societal impact planning. Academic publishing within the field of LC is in an historical perspective a relatively new phenomenon. A mapping of the geographical distribution of LC related publications does not seem to have been carried out. An assessment of the geographical distribution of academic publication could therefore give some indicators on the prevalence of the concepts as well as research productivity of individual countries. Thus, the correlation between the general interest of LC and academic publication within national borders can indicate whether academic publishing affects public interest. The paper address the following research questions:
1. Where do those who show interest in Lean Construction come from? 2. Is there any connection between geographical distribution of academic
publications and where those who show interest in Lean Construction come from?
This study examines scientific contribution by different countries with the use of data related to academic publication and general interest in LC by different countries represented with the use of web-traffic data.
2 THEORETICAL FRAMEWORK
2.1 Evolution and life cycle of a scientific field
With regards to assessing the prevalence and evolution of a scientific field, several approaches could be used. In the following paragraphs, two different approaches will be described: citation- and geographical distribution. Sun et al. (2016) explain three types of scientific maps based on citation: the first is the paper-level maps focusing on citations, co-citations etc. to create an overview of the scientific literature. The second type is journal-level maps that build maps based upon aggregated journal-journal citation relations. The third type is category-level maps based on data concerning publication category. The other approach is to examine the geographical distribution of publications based on the national belonging of either the author(s) or the institution. There are several studies conducted across different field with the purpose of uncover the geographical distribution of publications. Tutarel (2002), for example, investigated the geographical distribution of academic publications within the field of medical education. The purpose was to uncover which countries were most influential.
2.2 Roger‘s theory of diffusion and Gartner’s Hype Cycle
Rogers’ model describes the process of implementation of new concepts and innovations (Rogers, 2002). According to Rogers, the process of implementation might be evaluated
286 | Proceedings IGLC | July 2017 | Heraklion, Greece

Atle Engebø, Frode Drevland, Jardar Lohne, Nawras Shkmot and Ola Lædre
through the extent of adoption. Further, he categorizes adopters as innovators, early adopters, early majority and laggards.
Another prevalent model is the Gartner’s Hype Cycle, shown in Figure 2, which outlines the typical progression of an emerging technology (Gartner, 2007). The curve illustrates different stages in what referred to as the technology’s maturity. The “hype” is the establishment of expectations and often overenthusiasm of the potential of the emerging technology. As the technology matures, it will encounter negative “hype” when facing critique and the technology fails to meet the overenthusiastic expectations.
Figure 1: Diffusion of innovations
(Everett, 2016) Figure 2: Gartner Hype Cycle
(Gartner, 2007)
The critical part is the next phase where the technology gets refined, adopted and either slides into what is characterized as the “slope of enlightenment” or eventually disappear into oblivion (Linden and Fenn, 2003).
2.3 The Context of Lean Construction
According to Howell (1999), LC is a form of production management for the construction industry. Howell concludes that LC needs to emphasis on further research in order to complete the translation to construction as adopted from lean thinking. Bertelsen (2004) investigated factors differentiating construction from manufacturing. The purpose was to identify future research areas of importance for LC. He concluded that one of the great challenges in the years to come was not to turn construction into a manufacturing process, but to keep focus on the construction process.
Naney et al. (2012) examined where LC philosophy placed on Gartner’s Hype Cycle. They state that LC is an important innovation for the industry. Further, they emphasise that the benefits and potential of the innovation itself is not enough to push innovation to adoption. The LC community needs to understand what barriers exist and further develop strategies to remove them. The paper concludes that innovations need key influencers and a contextual environment that promotes the necessary changes. LC has to address the barriers in order to move from the phase of early adoption to reach the early majority.
Nesensohn et al. (2014) offers a framework for assessing LC maturity and describes how to assess the current level of LC maturity in organizations. The purpose is to provide guidance for organisations that want to implement LC. They state that the industry increasingly implements lean construction principles. Their proposed framework contributes in the process of improving the LC capability in organisations.
Wandahl (2014) examined the implementation of LC in Denmark, addressing how widespread LC actually was. The findings indicated that 3 out of 4 in the Danish
287 | Proceedings IGLC | July 2017 | Heraklion, Greece
Geographical Distribution of Interest and Publications on Lean Construction
construction industry did not know of LC. Secondly, it was addressed how Lean Construction was implemented. The findings confirmed that more than 25% applied LC elements partly or contrary to what was identified as best practice. The author concludes that different barriers exist to overcome when implementing LC and that an understanding of such barriers is highly relevant for the future success and development of LC.
Simonsen et al. (2014) analysed LC as a management concept in order to identify whether it was a fad or an enduring concept. In the context of concept life-cycle, LC has experienced both rise and fall in interest. The paper examined the case of Denmark and the authors suggested that it would be interesting to see whether LC will follow the same path in other national arenas.
3 METHODOLOGY
To address the research questions, a suitable sampling method and size had to be chosen. To measure interest, we chose to accredit academic contributions by country as a quantitative measure of interest. Academic contribution was supplemented with data about the general interest related to the field of LC. Web-traffic in form of number of viewing-session was chosen as an indicator of public interest. The data spans from four primary sources; 1) IGLC proceedings, 2) Lean Construction Journal, 3) viewer-traffic of the IGLC web-page and 4) viewer-traffic of the Lean Construction blog.
First, each abstract of papers in the IGLC proceedings were reviewed with the aim of extracting authors’ name and institutional belonging. Regarding the analysis of data, the following approach was used; each author contributes with one count in favour of the nationality of their institutional belonging. The practice of crediting nationality based on institutional belonging instead of authors primary nationality was chosen on basis of academia being characterized by a high degree of internationalization. The following counting system was applied: each author in the list of authors contributes with one "publication-count" to their respective institutions. For example; Pasquire and Connor (2011) contributed with one count for each, so then United Kingdom got two counts. The same approach was adopted when data from the Lean Construction Journal was collected. The data collection included the proceedings from IGLC 4 (1996) to IGLC 24 (2016), primarily since these were available online. From the journal, the data collection includes every publication from Volume 1 issue 1 (2004) to the Volume 13 issue 1 (2016).
All papers from the proceedings and the journal database were registered and ranked in two categories based on country of origin: Publications and authors per 106 inhabitants. The use of quantitative data in form of data traffic are categorized as webometrics, which is an emerging research field emphasising the use of various types of data to study the Web (Vaughan and Yang, 2013). The data from the IGLC web page and the Lean Construction Blog was gathered with the use of Google Analytics. The final dataset was tested for potential correlations by determine the Pearson r correlation coefficient. In order to linearize the relationship between the variables we applied a logarithmic transformation. This was considered convenient in order to eliminate skewness created by large values in the dataset. Countries with either zero publications or sessions are excluded from the graphical presentation of the findings as well as for the Pearson r calculation. Therefore, the representation only consist of countries with both academic publishing and web traffic.
The study is limited to the use of four different sources relevant to LC. This was considered a convenient sampling-size, but the authors acknowledge they are not the only LC-related channels. Another limitation is that the data in the IGLC proceedings only include institutional affiliation of the authors/ contributors. The result is therefore that
288 | Proceedings IGLC | July 2017 | Heraklion, Greece

Atle Engebø, Frode Drevland, Jardar Lohne, Nawras Shkmot and Ola Lædre
authors do not necessarily represent their country of birth, but the country of their institutional belonging.
A potential source of error is the process of categorizing authors and publications, particularly for publications with several contributors from different institutional belonging. Another source of error related to the measurement of general interest, is that of language. While academic channels are mostly standardized on using English, the same cannot be said for practice. Web-traffic are measured as total web-traffic to the examined web sites, therefore it does not take in to account phenomena’s such as bounce-rate (single-page visit) and unique visitors. Unique visitors are for example difficult to measure, if the web-user have deleted web-cookies between two sessions, Google will count it as two unique visitors.
4 RESULTS
The publications spans from IGLC 4 (1996) to IGLC 24 (2016), including 1310 IGLC-proceedings papers and 72 journal articles. The data-traffic includes 101793 unique internet-sessions on the web-sites of IGLC.net and the Lean Construction Blog. Table 1 shows the top 20 countries, by number of papers ("publication-counts", not number of unique papers, ref. methodology p.3). Table 1 compares the data on the number of authors, papers- and sessions as well as the data on number of papers, authors and web-sessions per 10 million inhabitants' country-by-country.
Table 1: top 20 countries, by no. of papers
Country No. of authors
No. of papers
No. of Sessions
Papers / 10 millions
Authors/ 10 millions
Sessions/ 10 million
1. United States 1038 453 24239 14,1 32,3 754 2. Brazil 619 224 8585 11,0 30,3 420 3. UK 527 223 8566 34,8 82,2 1337 4. Lebanon 69 222 1162 355,9 110,6 1863 5. Finland 161 84 1696 153,4 294,0 3097 6. Norway 207 80 6281 153,6 397,5 12061 7. Chile 179 72 2040 41,1 102,2 1165 8. Sweden 122 57 1429 58,2 124,5 1458 9. Denmark 94 54 1337 96,7 168,4 2395 10. Germany 105 44 5926 5,4 13,0 733 11. Australia 94 41 2332 18,0 41,3 1025 12. Israel 74 32 593 39,1 90,5 725 13. New Zealand 48 26 1372 58,1 107,3 3066 14. Peru 35 19 4011 6,2 11,4 1305 15. Netherlands 24 17 1504 10,0 14,1 884 16. Taiwan 25 16 0 6,8 10,7 0 17. South Korea 47 16 347 3,1 9,2 68 18. Singapore 33 15 1160 25,9 57,1 2006 19. Portugal 27 13 446 12,0 24,9 412 20. Colombia 34 10 1158 2,1 7,2 245
Figure 3 show the geographical distribution of publications per 10,000,000 inhabitants. 48 different countries had published academic content on the subject of LC, but in figure 3 all countries with a publishing factor below 0.09 are – for space reasons – excluded. Figure 3 uses a temperature diverging colour-scale to differentiate countries by publications.
289 | Proceedings IGLC | July 2017 | Heraklion, Greece

Geographical Distribution of Interest and Publications on Lean Construction
Figure 3: Geographical distribution of publications (temperature diverging colour
scale)
Figure 4: Log-10 representation of countries, by publications and sessions per 10
million inhabitants
Figure 4 show the distribution of all 48 countries with publications per 10,000,000 inhabitants on the x-axis and sessions per 10,000,000 inhabitants on y-axis. In order to present the data, we used a log-10 scale for both the Y-and the X-axis. This was necessary because of the large range of values.
The correlation between the parameters is significant, as the Pearson r correlation coefficient between the variables Log (publications) and Log (sessions) was calculated to
Norway
LuxembourgEstonia
Finland
NewZealand
Ireland
Denmark
Singapore
LebanonSweden
UnitedKingdom
Peru
UnitedArabEmirates
Chile
AustraliaNetherlands
UnitedStates
Germany
Israel
Canada
Spain
Brazil
Portugal
Switzerland
MalaysiaColombia
France
SouthAfrica
SaudiArabia
Italy
GhanaMexicoEcuadorTurkey
SouthKorea
Egypt
Iran
Thailand
JapanIndonesia
India
ChinaNigeria
0.01
0.10
1.00
10.00
100.00
1000.00
1.00 10.00 100.00 1000.00 10000.00 100000.00
Sessionsper10million
Publicationsper10million
290 | Proceedings IGLC | July 2017 | Heraklion, Greece

Atle Engebø, Frode Drevland, Jardar Lohne, Nawras Shkmot and Ola Lædre
be 0.87. As publications per 10 million increase, sessions per 10 million tend to increase, so it is a positive association.
5 DISCUSSION
The paper has addressed the following research questions: "Where do those who show interest in Lean Construction come from?" and "Is there any connection between geographical distribution of academic publications and where those who show interest in Lean Construction come from?". Our investigation spans from 1996-2016 with the total of 1382 examined publications and above 101793 unique web sessions.
Both in total numbers of publications and total number of authors the United States, United Kingdom and Brazil excels with 64.91 percent of the total publications. When we adjust the numbers with regards to for national populations, the tables turn. After the adjustment, the Nordic countries of Finland, Sweden, Denmark and Norway as well as the Middle East countries Israel and Lebanon excel. Interestingly, more than 48 different countries have showed interest in LC in form of academic publishing.
When publications and sessions were adjusted for number of inhabitant's country-by-country, some interesting results emerged (see figure 4). There is a cluster of 11 countries that are scoring high on both sessions- and publications and a cluster of seven countries right below. Six countries are found on both the top ten lists of sessions- and publications per 10 million inhabitants: Sweden, Norway, New Zealand, Lebanon, Finland and Denmark. The four countries only represented on one top list for publications were United Kingdom, Liechtenstein, Israel and Chile. Singapore, Luxembourg, Ireland and Estonia are only represented on one top list for web-sessions. The results shows that there was a strong positive correlation (r=0.87) between academic publishing and sessions, but the data likewise presented cases where no such connection was observable. For example, on web-sessions Russia place seventh, still no Russian publications were registered. This was as well the case with the following countries: Qatar, Hong Kong, Costa Rica, Panama, Russia, Austria, Kazakhstan, Argentina, Belgium, Poland, Philippines and Kenya.The research also reveals that countries such as Japan and France, which are perceived to have traditions within Lean production failed to make the list of influential contributors to LC.
6 CONCLUSION Geographical distribution of publications and web-traffic in some of the leading Lean Construction contribution channels (IGLC, LCI and LCB) show that 48 different countries have showed interest in LC- principles. Publishing of scientific results from a variety of academic institution should be seen as an indicator that the LC concept has grasped a broader audience. The positive association between web sessions and academic publishing does not prove causality, but indicate a general relationship between the two variables. Countries scoring high on academic contribution tended to score high on web searches. On a general basis, the combination of a relatively small population and academic institutions emphasising on LC-related research seems to provide some sort of viral effect on the countries interest in LC. Thus, for the LC as an own field to survive, the need to both document experiences and develop theories, and disseminate them. The correlation between the general interest of LC and academic publication within national borders is significant. Thus, if we lay emphasis on the Roger’s model (Rogers, 2002), more educational institutions need to show interest in LC to sustain the process of spreading LC principles.
291 | Proceedings IGLC | July 2017 | Heraklion, Greece

Geographical Distribution of Interest and Publications on Lean Construction
6.1 Further work
This study could serve as a foundation for further research aimed at uncovering why some countries are showing greater interest in LC than other. Lean Construction has a relatively brief history of research and publishing. The Lean Construction Journal and the IGLC-proceedings are important research channels, but LC related publications are also published through other channels. A suggestion is to include other relevant channels.
7 REFERENCES Bertelsen, S. 2004. Lean Construction: Where are we and how to proceed. Lean
Construction Journal, 1, 46-69. Everett, R. 2016. Diffusion of innovations. In: INNOVATIONS, D. O. (ed.).
https://en.wikipedia.org: Based on Rogers, E. (1962) Diffusion of innovations. Free Press, London, NY, USA.
Gartner, I. 2007. Gartner Research's Hype Cycle diagram. In: DIAGRAM, G. R. S. H. C. (ed.). https://commons.wikimedia.org.
Howell, G. A. What is lean construction-1999. Proceedings IGLC, 1999. Citeseer, 1. Linden, A. & Fenn, J. 2003. Understanding Gartner’s hype cycles. Strategic Analysis
Report Nº R-20-1971. Gartner, Inc. Naney, D., Goser, C. & Azambuja, M. Accelerating the Adoption of Lean Thinking in the
Construction Industry. In: TOMMELEIN, I. D. & PASQUIRE, C. L., eds. 20th Annual Conference of the International Group for Lean Construction, 2012/07/18 2012 San Diego, USA.
Nesensohn, C., Bryde, D., Ochieng, E., Fearon, D. & Hackett, V. Assessing Lean Construction Maturity. In: KALSAAS, B. T., KOSKELA, L. & SAURIN, T. A., eds. 22nd Annual Conference of the International Group for Lean Construction, 2014/06/25 2014 Oslo, Norway. 1157-1168.
Pasquire, C. & Connor, P. Where does the Theory Informing the International Group for Lean Construction Come From? In: ROOKE, J. & DAVE, B., eds. 19th Annual Conference of the International Group for Lean Construction, 2011/07/13 2011 Lima, Peru.
Rogers, E. M. 2002. Diffusion of preventive innovations. Addictive behaviors, 27, 989-993. Simonsen, R., Thyssen, M. H. & Sander, D. Is Lean Construction Another Fading
Management Concept? In: KALSAAS, B. T., KOSKELA, L. & SAURIN, T. A., eds. 22nd Annual Conference of the International Group for Lean Construction, 2014/06/25 2014 Oslo, Norway. 85-96.
Sun, X., Ding, K. & Lin, Y. 2016. Mapping the evolution of scientific fields based on cross-field authors. Journal of Informetrics, 10, 750-761.
Tutarel, O. 2002. Geographical distribution of publications in the field of medical education. BMC Medical Education, 2, 3.
Vaughan, L. & Yang, R. 2013. Web traffic and organization performance measures: Relationships and data sources examined. Journal of Informetrics, 7, 699-711.
Wandahl, S. Lean Construction with or without Lean – Challenges of Implementing Lean Construction. In: KALSAAS, B. T., KOSKELA, L. & SAURIN, T. A., eds. 22nd Annual Conference of the International Group for Lean Construction, 2014/06/25 2014 Oslo, Norway. 97-108.
292 | Proceedings IGLC | July 2017 | Heraklion, Greece

Gehbauer, F., Ballard, G. and Leonova, M. (2017). “How Research Can Help Transform the Construction Industry”. In: LC3 2017 Volume II – Proceedings of the 25th Annual Conference of the International Group for Lean Construction (IGLC), Walsh, K., Sacks, R., Brilakis, I. (eds.), Heraklion, Greece, p. 293-300. DOI: https://doi.org/10.24928/2017/0240
HOW RESEARCH CAN HELP TRANSFORM THE CONSTRUCTION INDUSTRY
Fritz Gehbauer1, Glenn Ballard 2 and Margarita Leonova3
Abstract: According to its website, the International Group for Lean Construction is dedicated to the radical renewal of AEC practice, education and research. As is the way with academic researchers, that objective has been pursued with little explicit coordination. Without expecting everyone to become part of a big machine, this paper presents the benefits expected from collaboration on a high level research program aimed at removing the obstacles to radical renewal. Obstacles to that transformation are proposed, culminating in an appeal for collabration to remove those obstacles.
Keywords: Lean construction, industry transformation, obstacles, paradigms, research.
1 INTRODUCTION Construction is a project business, contracts have to be defined at a stage when the product is only projected. Handling of that complicated situation goes back as far as the famous “Stele of Law” by the Babylonian King Hammurabi. Whereas death was the penalty for a failed master builder, in the modern world we have more civilized contract models and public procurement rules. But they are no less belligerent. Each side is striving for its own advantage. Gaps in the description of the described works are used to create construction claims. Since those gaps are inevitable war is pre-programmed, resulting in disputes, delays and waste of time and resources. Profit maximizing of the contractor stands against budget discipline of the client. The Lean and collaborative approach is different. The selection process of contractors is based on quality and reliability. The contract is concluded at an early stage of the project bundling the experience and knowledge of the partners. Reasonable profit margins of the contractor are accepted by the client. Incentives are built into the contract with the aim to optimize the project as it develops.
Lean and collaborative contracting have generated their own power. To increase benefits to society, we want to encourage the Lean community to improve its methods of practicing, its ability to spread the results to society and reach the “next level” of performance. It is high time that this community openly and more publicly, in the face of
1 Professor Emeritus, Institute for Technology and Management in Construction, Karlsruhe Institute of
Technology, Am Fasanengarten Geb. 50.31, 76128 Karlsruhe, Germany, Phone +49-721 9554631, [email protected]
2 Research Director, Project Production Systems Laboratory, Civil and Environmental Engineering Dept., Univ. of California, Berkeley, 407 McLaughlin Hall, CA94720-1712, USA. [email protected]
3 Ph.D. Student, Tallinn University of Technology, Faculty of Civil Engineering, Ehitajate tee 5, 419086 Tallinn, Estonia., +372 5845 4946, [email protected]
293 | Proceedings IGLC | July 2017 | Heraklion, Greece

How Research Can Help Transform the Construction Industry
the whole world, publish its views, aims and potentials. Lean research must play a major role.
Traditional regulations are not more than a sort of “Geneva Convention” regarding warfare. The absolute power of a king like Hammurabi has been replaced by the power of the administrator. Keeping files clean, adhering to rules, and lack of courage for better guide his behavior. Who can harm him when choosing the cheapest route? Who will reward him when choosing the best? Proof of the former is a simple table, the proof of the latter requires explanations, judgements and courage, rare commodities in the construction environment.
The “next level” for the Lean practitioners is, therefore, not only to spread success stories but also to develop help for the administrators in both public and private clients, to support them in developing judgement and courage, in making distinctions between the numbers in an offer, often not worth the paper they are written on, and true value. Researchers in the Lean Construction community can help to reveal potential for change and its underlying rationale. Specialization comes with the territory for academics, and as a result, there is a natural resistance to collaboration beyond their specialties. But that collaboration is what is needed for lean professors and practitioners to create and spread the knowledge of making a difference, of creating a construction world that encompasses progress for the better, to convince administrators and politicians of the potential of Lean.
2 LEAN RESEARCH AND NEXT LEVELS OF LEARNING An earlier call for action in support of lean transformation was made by Koskela et al. (2003), where the authors noted, citing Papert (2000): “A systemic approach requires one to step back from the immediate problems and develop an understanding of how the whole thing works.” The “next level” of research must address prevailing paradigms and obstacles more intensively. To do so requires understanding the construction industry as a system. Numerous success stories and intelligent white papers have not generated a worldwide acceptance. We must do more to change the construction world for the better.
Some of the setbacks in Lean happen in different countries. National regulations and habits are hindering. We encourage the study of those factors. We want to bring forward the common interests of all countries. We solicit all researchers and practitioners to collaborate, to understand national particularities and to create models independent of all nationalities without neglecting their benefits. The “next level” should encompass all virtues of difference.
Lean is not only a personal power with regard to success in projects. It is a social power. Little has been done by the Lean family to make social power transparent and spread it to the construction stakeholders. The alignment of different interests is the great secret. It has not yet been made transparent to all, especially to the “traditionalist” opposition. The “next level” endeavours do not only have to reveal its advantages but also to show that it can be done.
It is widely understood that fundamental transformation of an industry takes a generation. Educating the next generation in research-generated Lean Construction theory and practice is a necessity. The “next level” practice has to form part of education and research. Whereas research is often a reactive science dedicated to explaining what has already happened, it also has power to shape the future. All participants are encouraged to foster collaborative practice through research results and to form the next generation. One of its many tasks will be to help generate sustainability
294 | Proceedings IGLC | July 2017 | Heraklion, Greece

Fritz Gehbauer, Glenn Ballard and Margarita Leonova
of progress achieved while it is constantly hindered by the human habit to fall into “inherited” habits.
The IGLC world is characterized by trying to add a scientific component to the practical Lean world. That is good. But we have to distinguish between what the world needs and papers that are presented in a context of giving the authors academic credit. While the latter should continue we need more research into removing obstacles and disclosing wrong paradigms and developing strategies for radical renewal. Corresponding papers should develop Lead Values, values that create new value. The present depth of the IGLC research can reach “next levels” along the following lines.
Sustainability -in the sense of maintaining the Lean journey- is one of them. Numerous are the cases where success in projects is not transferred to the next project or does not lead to a Lean transformation of the organization. More investigation and research is needed here. Lean Construction has developed its principles and methods by adopting, adapting and inventing. Some Lean production principles and methods have been adopted with little or no change; e.g., the principle to Use Pull Systems to Avoid Over Production (Liker, 2004). Others have been adapted to fit with the nature of construction as an industry; e.g., Target Value Delivery (Tommelein and Ballard 2016), which was adapted from lean manufacturing’s target costing. Yet others have been invented; e.g., the Last Planner System (Ballard and Tommelein 2016). The Toyota Production System has been the principal source and inspiration, and may yet inspire other adoptions and adaptations. But there are other sources as well that should be mined; e.g., current innovations (e.g. mass customization) that bring manufacturing closer to project-based industries, and further exploration of potential knowledge transfers across the boundaries of project production systems: construction, new product development, software engineering, shipbuilding (air and sea), and performing arts productions.
Is waste always a waste? Is there something good to be discovered in waste? Einstein said that God does not throw dice. If we look at evolution it rather looks like the opposite. Constantly dice are thrown into various directions. The right numbers are not defined by a certain face value but through their relation to a changing environment. Can we do more research into the value of waste? The Set Based Design method is going into that direction. Possibly more could be discovered.
The Last Planner System offers great opportunities for learning. Failures and mistakes are collaboratively made transparent. Root causes are unveiled with the aim to eliminate those and to create a learning platform. But learning does not only happen through failures. It is established that children learn through negative experience; they won´t touch a hot stove a second time. The Lead Value, however, is created by learning through positive experience: from their own behavior with feedback, from the encouragement of the parents, from positive role models, from everything they did and regard it as a success. Spitzer (2007) has given evidence of that. The hot stove is just a singular thing. Positive learning creates new values and shapes the future. The Lean learning from success can be systemized. Another field of research.
Lean has formed a successful marriage with BIM. Other technologies could be added like hand-held devices as I-Pads or augmented reality in head screens on site. What are the next levels of using IT and internet? The future design team might gather necessary input from the net. Is the Big Room outdated already? Imagine architects working for the net. An “app” makes the results available. The feeders could be rewarded like an UBER driver. What does a Lean app look like? Can we create a Lean internet university? The Lean construction future might be in the internet. Today, you have an idea and it can be
295 | Proceedings IGLC | July 2017 | Heraklion, Greece

How Research Can Help Transform the Construction Industry
developed through the net, at low cost. In this context, are the five big ideas really big? Here is another huge research field that could be assigned to a Lean think tank for structuring and devising research topics.
3 OBSTACLES TO LEAN TRANSFORMATION
There are many obstacles to any kind of transformation. The first obstacle is unwillingness to change until forced. Fortunately for the human race, that characteristic is not uniformly distributed through the species. Some people and organizations tend to be early adopters of new ideas and tools. When that adoption leads to improvements, especially improvements that impact competitiveness in markets, it can compel others to change.
A related obstacle is what has been called paradigms: fundamental assumptions about the nature of reality (Kuhn, 1970). Paradigms in the construction industry that are obstacles to lean transformation include (Ballard, et al., 2011):
• Trust is for suckers;
• If you don’t bid it, you pay more;
• Win-win is hogwash. All that matters is if I win;
• The best risk management strategy is shifting risk to someone else; and
• Project management does not include management of production.
Experience has shown that some people are unable to give up their paradigms—they just can’t ‘get their head around’ new ways of thinking and behaving. However, a few do make the change, and new assumptions and operating principles can be embedded in younger generations. Old rules and regulations can be replaced by new rules that align with the new way of thinking and acting.
The existing way of doing and thinking about construction is well rooted in a multitude of practices and institutions. For a transformation such as lean to replace what appears to be an immovable object will require cutting every one of its roots. Among the strongest such roots is the education system, in which curriculum is controlled by successful practitioners through service on program assessment committees and on standards setting bodies. At the university level, it is the rare assistant professor who will carry the fight into the camp of the enemy when threatened with failure to be granted tenure. Change is coming, but slowly, in the teaching of architects, engineers and constructors.
Another fundamental obstacle to lean transformation is those who live off the waste in the current system. That waste ranges from claims consultants to unnecessary inventories to criminal practices. This obstacle cannot be overcome by persuasion and education. It must be overcome by force. How can research help with this problem?
4 THE NUMBER ONE OBSTACLE TO LEAN: CORRUPTION The number one waste in construction is corruption. Little has been published or done to fight this in Lean research or practical Lean papers. Corruption is the main obstacle to progress especially in developing countries that need progress most. The Lean principles of transparency, honesty, openness, customer value, aligning of justified interests, etc. are bound to fail in an environment where special interests prevail. Special interests are those that will not contribute either to the project or to customer value. They are
296 | Proceedings IGLC | July 2017 | Heraklion, Greece

Fritz Gehbauer, Glenn Ballard and Margarita Leonova
designed to serve the interests of individuals who render their paid services for influencing the awards of contracts or for providing information.
It is beyond the scope of this paper to investigate all the reasons for corruption and its mechanisms. Numerous papers exist in the non-Lean context. One may be mentioned here: Zhang et al., “Causes of Business-to-Government Corruption in the Tendering Process in China”, an ASCE Case Study, 2016. Further references are included there. The reasons for corruption are given there in a one country context. Recommendations to overcome them are presented. As in many other countries the remedies proposed are concentrated around improving the existing system: To revise the flawed tendering system, establish a new code of conduct, introduce new laws to better an existing system, and establish more stringent penalties and supervision. Nothing of that nature has really helped yet. The truth is that the corruption environment usually has “better” rules and codes of conduct always being ahead of the tender regulations and that new regulations will open new possibilities to bribe its enforcer.
It is quite clear in this context that Lean principles must fail. To really operate an open Last Planner System (LPS) is close to impossible. Attempts of admirable young Lean researchers to investigate the possibilities of applying LPS or other methodologies like TVD or even IPD must remain futile in those environments because they are not connected to reality. Lean research should focus on how “special interests” createobstacles. But that is only one side of the coin. It should offer to the world that Lean principles do represent a possibility to overcome the special interests by showing that no new regulations within the old system will help. Only cultural changes will help.
Culture has mostly a positive denomination. But habitual negative behaviours are often derived from it. Bad habits become culture. Our brain functions like that. Repetitive actions are stored and become habitual, even if detrimental. So, if the Lean family wants to offer a better solution than increasing supervision and ever more stringent rules that would be corrupted anyway, it has to offer something else--its own philosophy. Bring people together to jointly develop the project. The remaining problem is how to develop a win-win situation with corruption-prone people who would see their gain drift away, a research question of highest importance. How can we lead them into a world where jointly developing a project and sharing of knowledge is better than making information a trade item to be paid through corruption?
Another item in the context of special interests is vanity. Rulers in developing countries are rather pleased to open a new road with golden scissors and under TV coverage. Nothing spectacular is connected with spending money to maintain public assets. The result is that, according to the World Bank’s (1989) Road Maintenance Initiative, for every Dollar spent in new road construction in Africa withdrawing it from maintenance, three Dollars are lost in the value of existing roads lacking maintenance. What is the answer of Lean to that? A research question.
Useful agents to influence the supreme decision-maker are deeply rooted in our culture (e.g. ask a Saint for help). Corruption emerges from the very inside of our cultures and behaviour. Therefore, it can only be fought from the inside through cooperative models. If the Lean family is convinced of its mission to change the construction world it has to be aware of cultural facts. Instead of accepting the demanding of ever stricter rules for a failing system it should offer and make more transparent its powers to change habits, at least in the construction world. In the context of this chapter, the transformation of the construction world, more research is needed. More action is required to show society that lean principles have the potential to reduce the negative effects of special interests. The action part should be to convince political
297 | Proceedings IGLC | July 2017 | Heraklion, Greece

How Research Can Help Transform the Construction Industry
decision makers to give Lean/IPD a chance to prove that better projects will be the result and corruption could be fought more efficiently through open books, aligning of interests and collaborative contracting than through introducing more stringent rules within a failing system. The group dynamics of LPS and IPD have the power to work against corruption, automatically and inherently. One of the predominant research questions in this context is: How can we create win-win?
5 RESEARCH AREAS
A list of possible next level research areas is presented below. These are not meant to be comprehensive. They can be subdivided into a number of individual dissertations and/or actions. International coordination is recommended.
• How can IPD be made understood and accepted in various environments –worldwide?
• How can it be shown that IPD and correct administration are not in contradiction?
• How can public authorities be helped to develop new regulations and new behavior?
• How can a FAQ-list for newcomers and ´traditionalists´ be elaborated and answers compiled?
• How can wrong or misleading paradigms be made more transparent and better understood?
• How can it be proven that the most economic project is one that creates the best value?
• How can it be shown that different interests can be aligned for the benefit of all?
• How can Lean country teams develop procedures incorporating national singularities?
• How can it be shown that Lean is much more than a mere collection of tools?
• How can Lean be expanded in the field through the use of augmented reality?
• How can Lean research be led to a next level by offering Lead Value?
• How can Lean learn from production systems other than the TPS?
• How can Lean be spread through education? Can a standard curriculum be developed?
• How can the experience from successful Lean projects be transferred into sustainability?
• How can the effort be intensified to lead young researchers into practical next level topics?
• How can it be shown that Lean offers the best way available to react to a changing world?
• How can Lean learning from success be systemized?
• How can obstacles against transformation be systematically identified and eliminated?
298 | Proceedings IGLC | July 2017 | Heraklion, Greece

Fritz Gehbauer, Glenn Ballard and Margarita Leonova
• How can wrong paradigms be addressed? Which role has education in this context?
• How can Lean contribute to convincing corruption infested societies that jointly developing a project and sharing knowledge is better than making information a trade item to be purchased through corruption?
• How can Lean be applied and transparency and win-win situations be created against the resistance of those who live off waste?
• How can Lean be extended to improve the maintenance field?
• How can Lean develop its potential for changing habits deeply rooted in culture?
• How can it be shown that Lean principles offer a better potential for the fight against corruption than ever more stringent regulations within a failing system?
• How can Lean contribute to overcome resistance to and fear of change?
• How can Lean become the norm in construction worldwide?
• How can the methods to disseminate the knowledge of Lean be improved?
• How can Lean make new-comers ´feel´ something: excitement, curiosity, inspiration?
• How can Lean change the suspicion many people carry about Lean?
• Can the PDCA cycle be used by Lean on its next level to Plan (strategize) the transformation, to Do certain steps, to Check (create evidence and evaluation), and Act (create standards)?
• How can Lean be developed from offering new concepts into a force that drives change in industry and society? How can drivers for change be identified?
• Should gradual change be maintained or a revolution started?
• How can small and medium enterprises be addressed and included more intensively?
• What are the potentials for Lean on the internet?
6 SUMMARY AND CONCLUSIONS This paper constitutes an appeal to IGLC researchers and practitioners to work together in applying research to advance the transformation of the global construction industry. Although Lean Construction enclaves are growing, traditional thinking and practice still dominate the construction industry. Lean transformation remains something that must be fought for--it will not happen by itself.
To cut the roots of the traditional culture of industry, many things need to be done, and research is only one of them, but a very important one. Education is a mighty weapon because it helps shape the framework within which future construction industry professionals think and act within the construction industry—and research provides the stream of knowledge, both know-that and know-how, that informs educational curricula. Further development and implementation of technology can be helpful; e.g., in supporting Lean Construction objectives to engage the minds and emotions of industry workers in continuous improvement.
299 | Proceedings IGLC | July 2017 | Heraklion, Greece

How Research Can Help Transform the Construction Industry
Specific to their role as researchers, Lean Construction advocates can help by targeting the paradigms that are obstacles to lean transformation. To give just one example: what evidence is there to believe that ‘If you don’t bid it, you pay more’? A recent review of the literature by one of this paper’s authors found that most academic researchers believe this to be true, and counterpose this drive for ‘efficiency’ to the need for innovation in the industry. This is confused thinking, which targeted research can reveal as such. What evidence has been produced thus far against the claim that bidding reduces cost? One example is the recent publication of a report on Integrated Project Delivery projects entitled Motivation and Means: How and Why IPD and Lean Lead to Success (Cheng, 2016). This set of case studies is certainly a contribution to knowledge, but statistical confirmation of the correlation between awarding contracts on qualifications (not price) and lean management of projects, on the one hand, and on the other hand, project outcomes, including cost, remains to be done.
6 REFERENCES
Ballard, G., Kim, Y.W., Azari, R. and Cho, S. (2011) ”Starting from Scratch: A New Project Delivery Paradigm” Research Report 271, Construction Industry Institute, University of Texas, Austin.
Ballard, G. and Tommelein, I.D. (2016). Current Process Benchmark for the Last Planner System. Lean Construction Journal, 2016. Also available at p2sl.berkeley.edu
Cheng, R. (2016). Motivation and Means: How and Why IPD and Lean Lead to Success. Lean Construction Institute (www.leanconstruction.org)
Koskela, L., Ballard, G. and Howell, G. (2003) “Achieving Change in Construction.” Proceedings of the 11th International Group for Lean Construction Conference.
Kuhn, T.S., (1970) The structure of scientific revolutions. International Encyclopedia of Unified Science, vol. 2, no. 2.
Liker, J.K. (2004). The Toyota Way: 14 Management Principles from the World’s Greatest Manufacturer. McGraw-Hill
Papert, S. (2000). What's the big idea? Toward a pedagogy of idea power. IBM Systems Journal, Vol. 39, No’s 3 & 4, pp. 720 - 729.
Spitzer, M. (2007) Learning: The Human Brain and the school of Life. Elsevier Science Tommelein, I.D. and Ballard, G. (2016). Target Value Design: Introduction, Framework
and Current Benchmark. Lean Construction Institute, March 2016. Worldbank (1989). Road Maintenance Initiative. Internal documentation made available
to governments in developing countries. Zhang, B., Le, Y., Xia, B. and Skitmore, M. (2016). Causes of Business-to- Government Corruption in the Tendering Process in China. American Society of Civil Engineers, also published in Journal of Management in Engineering,
05016022, Queensland University of Technology.
300 | Proceedings IGLC | July 2017 | Heraklion, Greece
Gomes D., Tzortzopoulos P., and Kagioglou M. (2017). “Socio-constructivist Account of Collaboration in Concept Design.” In: LC3 2017 Volume II – Proceedings of the 25th Annual Conference of the International Group for Lean Construction (IGLC), Walsh, K., Sacks, R., Brilakis, I. (eds.), Heraklion, Greece, pp. 301–308. DOI: https://doi.org/10.24928/2017/0300
SOCIO-CONSTRUCTIVIST ACCOUNT OF COLLABORATION IN CONCEPT DESIGN
Danilo Gomes1, Patrícia Tzortzopoulos2, and Mike Kagioglou3
Abstract: In a collective design situation, participants usually have limited understanding of how other designers operate in the project and how their work has interdependencies with other design tasks. Most commonly, misunderstandings between team members will emerge around vague design representations and undocumented decisions, creating negative iterations in design. Collaboration at concept design includes actions to build shared understanding of product and process concepts amongst the design team. In this paper, it is suggested that the wicked nature of concept design requires collaboration to be conceptualised in terms of collective creative actions within team interactions. Through a synthesis of the literature, a model to study collaboration in concept design is suggested. The model proposes that collaboration is determined by the group’s ability to perform collective-reflective actions. Further development on the proposed model will provide ways of measuring and improving collaboration within multidisciplinary design teams.
Keywords: Collaboration, Multidisciplinary Team, Concept Design, Shared Understanding, Socio-constructive interactions
1 INTRODUCTION The concept design stage, referred to as Project Definition in the Lean Project Delivery (Ballard, 2008), consists of determining a concept design based on the identification and translation of project requirements into performance criteria for both product and process, developed by a multidisciplinary team. However, during concept design, designers usually have limited understanding of how other designers operate in the project and how their work has interdependencies with others (Cross and Cross, 1995; Arias et al., 2000). In some cases, in order to eliminate ambiguity in the informal exchange, the project team is co-located (Paranandi, 2014). However, to work co-located is generally not sufficient to solve the issue, and the lack of integration on decision-making can still happen as misunderstandings between team members around vague design representations and undocumented decisions (Maher et al., 1996). These misunderstandings occur due to different languages, standards, and wrong assumptions between design disciplines (Parrish et al., 2008). Consequently, team members cannot realise the consequences of incompatible decisions at the time, which can hamper later activities, creating negative design interactions and causing unnecessary iterative loops (Valkenburg, 1998).
1 PhD candidate in Architecture, University of Huddersfield, UK [email protected] 2 Professor, Head of Department for Architecture and 3D Design, University of Huddersfield, UK,
[email protected] 3 Professor, Dean of the School of Art, Design and Architecture, University of Huddersfield, UK,
301 | Proceedings IGLC | July 2017 | Heraklion, Greece

Socio-constructivist Account of Collaboration in Concept Design
From a theoretical point of view, there seems to be tension between the idea of the team and individual within design (Coyne and Snodgrass, 1993; Dorst, 2006). According to these authors, collaboration in design is usually seen as an activity in which individuals come together to share their skills and insights, in way that benefits are derived from the collection of the private skills and insights of individuals. Alternatively, it can be argued that human activity is ‘collaborative’ by nature, whether we are aware of it or not, involving a collective shared experience that is much more than the collection of individuals knowledge (Coyne and Snodgrass, 1993).
Researchers have argued that traditional models of design activity fail to realise the social constructive nature of collaborative design (Coyne and Snodgraas, 1993; Dorst, 2006). The social construction theory suggest that reality is not objectively given, but rather, constructed through social interactions generating interpretations, as collective meanings, that emerging from conversations among individuals in the social space (Gergen, 1985). In this context, professional expertise, technical competence, and skills should not be seen as a commodity for individuals, but rather existing within a community (Schön, 1983; Coyne and Snodgrass, 1993, Dorst, 2006).
The aim of this paper is to present a collaborative concept design model, seen as a socio-constructive action. This model offers a conceptual framework to investigate and measure collaborative concept design in practical situations. Further steps in this research requires the application of the model on multiple cases studies.
2 COLLABORATIVE DESIGN AS SOCIAL CONSTRUCTION Traditional design process models have been proposed as derivation from theories belonging to the logical-empirical sciences (i.e. Science of Artificial from Herbert Simon, 1969), and are deeply rooted in the Cartesian ontology, aligning them to a mathematical problem to be solved by way of prescribed logical steps (Snodgrass and Coyne, 1992; Dorst, 2006). The main assumption embedded in such design process models is that they offer logically coherent and consistent structures, which consequently, could be logically deducible, and logically expressible (Snodgrass and Coyne, 1992). However, the methodological description of design activities as “design problem” is very problematic or even meaningless to say if we cannot define it or crystalise it in empirical descriptions (Dorst, 2006).
According to Snodgrass and Coyne (1992), Dorst and Dijkhuis (1995), Lloyd and Busby (2001) and Dorst (2006), a more appropriate model of design activity was proposed by Schön (1983) conceptualising design as reflective activity, and replacing the logic-based models that have driven traditional design research. In this model (figure 1), designing is experimentation, and design moves can be seen as actions to test hypothesis and explore a phenomena, either affirming or negating that move (Schön, 1983). The evaluation of the performance of the hypothesis will be based on the way the designer framed the situation setting a particular perspective of the problem to be solved. When designers evaluate how design moves affects the framed situation, they establish a conversational process in which the situation ‘talks back’, allowing them to see it differently and constantly constructing new meanings and intentions (Schon, 1984).
More importantly, in a collective design situation, each participant sees the object of design differently, based on their position of responsibility and, more importantly, on the paradigmatic nature of their discipline (Bucciarelli, 2003). This means that nobody will have a total understanding of the object and process of design. Therefore, the design task cannot be fully disaggregated or reduced to subtasks that can be independently pursued,
302 | Proceedings IGLC | July 2017 | Heraklion, Greece

Danilo Gomes, Patrícia Tzortzopoulos and Mike Kagioglou
and demands actions for reconciling and harmonising claims, requirements and proposals of different participants, in a process that evolves through discussion and negotiation across object worlds (Bucciarelli, 2003).
Figure 1: Dynamics of Design Situation as suggested by Schön (1983)
In this context, shared understanding is a social phenomenon, towards the suppression of differences in interpretation and conformity in the collective act (Coyne and Snodgrass, 1993). All understanding and action is based on a background of experiences that exist in a context of shared cultural practices (Coyne and Snodgrass, 1993). The matter of interpretation and the validity of the assessment over design actions will be influenced by skills of judgment and the experience in understanding the unique situation, and not about knowledge of rules or algorithmic formulae (Snodgrass and Coyne, 1992). Therefore, agreement on the assessment of the validity of a model will be reached through argumentation and persuasion between team members (Snodgrass and Coyne, 1992).
More precisely, shared understanding would be deeply rooted in a collective process of reflection upon design moves within the shared context of the design activity supporting the integration of various perspectives (Arias et al., 2000). Consequently, collaborative design would be a situation in which stakeholders and experts could reason directly about emergent conflicts and collectively work towards new perspectives to mitigate it (Craig and Zimring, 2002). According to these authors, the effects of a collaborative approach in design is to allow collective reflection-in-action (Schön, 1983), in which collaborators help each other to discover the unintended consequences of design moves.
Therefore, collaborative design can be defined as a situation of shared creation, in which the collection of agents with complementary skills interact to create a shared understanding about a process, a product or an event that does not pre-exist that collective situation (Schrage, 1995), which fits to the Project Definition phase in Lean Project Delivery. Following this conceptualization, and expanding on Schön's initial model of design activity, it is suggested that collaborative design exists in terms of skilful team interactions for social construction of meaning involving three complementary efforts: collective appreciation, collective representation and reflective dialogue. These are described as follows.
303 | Proceedings IGLC | July 2017 | Heraklion, Greece

Socio-constructivist Account of Collaboration in Concept Design
3 COLLABORATIVE DESIGN AS CREATIVE INTERACTION
3.1 Collective Appreciation
Designers will differ from one another in respect to design judgments and ways of framing problems, coming to interact with different perspectives and systems of appreciation (Schon, 1984). It seems that, to be aware of and eventually overcome a conflict of appreciation, require from designers to carry a specific sort of collective inquiry, which eventually can reveal both the intractability of their dilemma and an alternative approach to the design solution (Schon, 1984). These design experimentations can only reach objectivity within the framework of an appreciative system, which considers the designers preferences, values, likings, meanings and norms (Schön, 1984).
According to Vickers' Theory of Appreciative Systems, appreciation is occasioned by an ability to perceive and make judgments that contributes to the ideas stream leading to actions that also become part of the events stream (Vickers, 1965 apud Checkland, 1994). Moreover, in collaborative design, this appreciative ability can be related to the concept of team situational awareness proposed by Endsley (1995). According to this author, situation awareness is the capacity to perceive and comprehend the characteristics of an environment in a specific set of time and space supporting the realisation of predicted futures aligned with a task or project. As an ability this would be intrinsically related to what each worker knows about the understanding and workload of the co-worker, and how this is supported by intercommunication between them (Endsley and Jones, 2001).
3.2 Collective Representation
Collaborative actions deal with the process of searching for common representations of proposed course of actions (Qu and Hansen, 2008), and graphical or physical artefacts are the usual means to embody such reasoning in design (Fischer, 2004). It is more than a simple aggregation of individuals and involves discussing and negotiating representations’ structure to achieve a level of consensus. Since the coupling of representations and understanding cannot be assumed, a collective effort is necessary to support change in each collaborator’s internal representation and meaning, to come to a collectively constructed representation comprising shared understanding (Qu and Hansen, 2008).
The process of building shared understanding forces the collision of ideas, and external representations are the means of negotiation, in which the objective must be to reach consensus on the meaning of the representations (Qu & Hansen, 2008). The purpose of these shared artefacts should be to provide concrete means of representing different functional interest (Carlile, 2004). The need to synthesise different perspectives of a problem in the evolving nature of a designed artefact is key for designers to collectively understand the consequences of design decisions (Arias et al., 2000).
More importantly, this suggest that what is usually considered relevant design knowledge as a synthesis of expertise from different contributors, cannot be considered existent previously and cannot simply be transferred by those who have it to those who need it (Arias et al., 2000). As described earlier, design involves a collective construction of meaning, in which the concept of shared understanding replaces the idea of knowledge sharing in organisations as suggested by Nonaka (1994).
More recently, based on the work of Ludwig Wittgenstein (1967, apud Smart, 2011), Smart (2011) suggest that understanding is an ability to provide predictive and explanatory grasp on the phenomena that is to be understood, enabling the agent to
304 | Proceedings IGLC | July 2017 | Heraklion, Greece
Danilo Gomes, Patrícia Tzortzopoulos and Mike Kagioglou
express thoughts and actions that fit the realisation of goals. Accordingly, this is related to an ability that is highly flexible, adaptive and context-sensitive, and often referred as ‘knowledge in use’ or tacit knowledge. Furthermore, the author suggest that, in a collective effort, shared understanding would imply similarity of understanding in relation to a particular phenomenon (i.e. goals, task, situation), involving the emergence of group abilities to form common expectations and predictions regarding future states, actions, events.
This ability to form expectations and predictions of future states and actions is intrinsically embedded in the nature of design representation. Consequently, to recognise this nature of shared artefacts in design, as collective actions of modelling shared understanding, essentially challenges the Kantian epistemology in which knowledge is perceived as a thing (Snowden, 2002). This assumption aligns with the heuristic approach to knowledge, suggested by Snowden (2002), in which knowledge should be considered simultaneously as: only volunteered and not conscripted; reflective in a way that it arguably dissociated from our capacity to externalise it; and contextual, as it is triggered by circumstance.
3.3 Reflective Dialogue
In design teams, practitioners need to recognise that individual technical expertise only exist embedded in a context of meanings, in which meaningful interactions would be generally related to the surfacing of negative information, the public negotiation of dilemmas and the resolution or dissolution of conflicting views (Schön, 1983). Accordingly, this reciprocal reflection-in-action emerges as a reflective conversation, establishing a “learning system” that is conditioned by the organisational structure and behavioural culture (Schön, 1983).
Conversations take place over a bedrock of common assumptions and experiences, allowing participants to interact without extensive explanations (Lloyd and Busby, 2001). Common assumptions usually refer to technical properties of a design solution, and common experiences relates to past events or facts that contextualise the current situation (Lloyd and Busby, 2001). Both can be seen as discursive objects (i.e. mediating artefacts), serving as objective reference for interpreting the situation.
Lloyd and Busby (2001) identified that conflicts often happen over the consequences of certain “facts” in an evolving situation. In these occasions, the designers put their technical skills second and displayed a set of skills to make a convincing interpretation of the situation. Designers show skills to construct an effective argument to get their version of the consequences on a situation accepted in a meeting (Lloyd and Busby, 2001). Using language mechanisms of engagement, exaggeration and imagery, designers try to create situations of implied objectivity over common assumptions and/or past experiences, as a rhetorical ability to build argumentation (Lloyd and Busby, 2001).
More recently, Koskela (2015) explored the relation between lean principles and the discipline of rhetoric. Accordingly, rhetoric works as means for human productive interaction, in which persuasion acts towards compliance (i.e. collective design decisions). Conversations are developed based on the existence of a common ground, as a set of common values, mutually known facts, and commonly held presumptions between agents from different backgrounds (Koskela, 2015). Therefore, as well as graphic representations assume a modelling role in design discussions, words can also provide a kind of collective sketching function that remains ambiguous while suggesting possibilities, providing a first level of prototyping in the collective action of design (Lloyd and Busby, 2001).
305 | Proceedings IGLC | July 2017 | Heraklion, Greece

Socio-constructivist Account of Collaboration in Concept Design
4 COLLABORATIVE CONCEPT DESIGN MODEL
Our definition of collaborative concept design considers Schrage’s (1995) definition of collaboration presented earlier, and the socio-constructivist account of collaborative design presented in terms of specific skilful team collective actions presented in the last section. Hence, collaborative concept design can be defined as a collective creative situation, in which a multidisciplinary team collectively contribute in the representation activity to compromise on design decisions while being collectively aware of the consequences of those decisions.
However, this socio-constructivist account of collaborative concept design suggest the expansion of the metaphor proposed by Schon (1983) to a new one that includes three modes of action that emerge from the interaction of the collection of individuals (i.e. the team) as: collective appreciation, collective representation and reflective dialogue (Figure 2).
Figure 2: Model of Collaborative Concept Design Dynamics
In this model, the three modes of action (framing, moving, reflection), suggested by Schön (1983) remain as the motion trigger of the design situation, while the new three “lateral” actions function to converge the diverse reasoning processes of the team, work as a “gravitational force” generated by the collective engagement on design actions. A deeper exploration on the nature of those actions and their respective functions is still needed in order to understand how they relate to abilities to effectively perform collaborative design.
5 CONCLUSIONS Focusing on the negative iterations in concept design caused by misunderstandings between team members, this study offers a new conceptualisation of collaborative concept design. This suggests that collaboration, as design collective creative action, is dependent on the team ability to develop shared understanding among the participants, through a dynamic process of social construction of meaning.
The model proposed indicates that the dynamics of this process involve three modes collective of actions: collective appreciation, collective representation and reflective dialogue. Each of them is based on a specific set of skills that usually are considered as
306 | Proceedings IGLC | July 2017 | Heraklion, Greece

Danilo Gomes, Patrícia Tzortzopoulos and Mike Kagioglou
"tacit knowledge". However, we argued that the concept of shared understanding is more appropriate to define the socio-constructive nature of design actions. More specifically, we suggest that the key element on this dynamic model is how the design team collectively articulate interdependencies during concept design, while they collectively move around different modes of action. Deepening our understanding of the nature and the circumstances of those collective actions would help to establish measures for collaborative design interactions and to suggest improvement strategies for collaborative practices in design.
The measures of collaborative design performance start by questioning how the three modes of action suggested in the model operate, focusing on how team members collectively articulate interdependencies: how much of the design decisions, graphically or verbally represented, have the involvement of the “key players” in the situation (Collective Representation); how design decisions take into consideration the appreciative systems of the team members (Collective Appreciation); and how designers are able to engage in reflective conversations, to expand or negotiate the collection of interpretations and representations supporting decision-making (Reflective Dialogue).
Further investigation on the usability of those measures and of the proposed model will be developed through case studies in different collaborative concept design practices.
6 REFERENCES
Arias, E., Eden, H., Fischer, G., Gorman, A., and Scharff, E. (2000). "Transcending the individual human mind—creating shared understanding through collaborative design". ACM Transactions on Computer-Human Interaction (TOCHI), 7(1), 84-113.
Ballard, G. (2008). "The lean project delivery system: An update". Lean Construction Journal, 2008, 1-19.
Bertelsen, S. (2003). “Construction as a complex system.” In Proc. 11rd Ann. Conf. of the Int’l. Group for Lean Construction. Blacksburg, VA, 1-.
Bucciarelli, L. L. (2003). "Designing and learning: a disjunction in contexts". Design Studies, 24(3), 295-311.
Carlile, P. R., (2004). “Transferring, Translating, and Transforming: An Integrative Framework for Managing Knowledge Across Boundaries.” Organization Science. Vol. 15, No. 5, September-October, 555-568.
Checkland, P. (1994). "Systems theory and management thinking". American Behavioral Scientist, 38(1), 75-91.
Coyne, R., and Snodgrass, A. (1993). "Cooperation and individualism in design". Environment and Planning B: Planning and Design, 20(2), 163-174.
Craig, D. L., and Zimring, C. (2002). "Support for collaborative design reasoning in shared virtual spaces". Automation in construction, 11(2), 249-259.
Cross, N., and Cross, A. C. (1995). “Observations of teamwork and social processes in design.” In: Design studies, 16(2), 143-170.
Dorst, K., and Dijkhuis, J. (1995). "Comparing paradigms for describing design activity". Design Studies, 16(2), 261-274.
Dorst, K. (2006). "Design problems and design paradoxes". Design issues,22(3), 4-17. Endsley, M. R. (1995). “Toward a theory of situation awareness in dynamic systems.”
In: The Journal of the Human Factors and Ergonomics Society, 37(1), 32-64. Endsley, M. R., and Jones, W. M. (2001). “A model of inter-and intrateam situation
awareness: Implications for design, training and measurement.” In: New trends in
307 | Proceedings IGLC | July 2017 | Heraklion, Greece

Socio-constructivist Account of Collaboration in Concept Design
cooperative activities: Understanding system dynamics in complex environments,7 ,46-67.
Fischer, G. (2004). Social creativity: turning barriers into opportunities for collaborative design. In Proceedings of the eighth conference on Participatory design: Artful integration: interweaving media, materials and practices. Vol. 1 (pp. 152-161). ACM.
Gergen, K. J. (1985). "The social constructionist movement in modern psychology". American psychologist, 40(3), 266-275.
Koskela, L., (2015). “Where rhetoric and lean meet.” In: Proc. 23rd Ann. Conf. of the Int’l. Group for Lean Construction, Perth, Australia. 527-535.
Lloyd, P., & Busby, J. (2001). "Softening up the facts: engineers in design meetings". Design issues, 17(3), 67-82.
Maher, M. L., Cicognani, A., and Simoff, S. (1996). “An experimental study of computer mediated collaborative design.” In: Enabling Technologies: Infrastructure for Collaborative Enterprises. Proceedings of the 5th Workshop. 268-273.
Nonaka, I. (1994). "A dynamic theory of organizational knowledge creation". Organization science, 5(1), 14-37.
Paranandi, M. (2014). "BIM as a Catalyst to Foster Creativity through Collaboration". Building Information Modeling: BIM in Current and Future Practice, 237-249.
Parrish, K., Wong, J. M., Tommelein, I. D., and Stojadinovic, B. (2008). “Set-based design: case study on innovative hospital design.” In: Proc. 16th Ann. Conf. of the Int`l Group for Lean Construction, Manchester, UK, 413-424.
Qu, Y., and Hansen, D. L. (2008). “Building shared understanding in collaborative sensemaking”. In: Proceedings of CHI 2008 Sensemaking Workshop, Florence, Italy.
Rittel, H. W. (1987). "The reasoning of designers". Montreal: IGP. Schön, D. A. (1983). "The reflective practitioner: How professionals think in action" (Vol.
5126). Basic books. Schön, D. A. (1984). "Problems, frames and perspectives on designing". Design
Studies, 5(3), 132-136. Schrage, M. (1995). "No more teams! Mastering the dynamics of creative collaboration". Simon, H. A. (1969). "The sciences of the artificial". Cambridge, MA. Smart, P.R. (2011). "Understanding and shared understanding in military coalitions".
Technical report available at http://eprints.soton.ac.uk/267735/1/suwcv2.pdf Snodgrass, A., and Coyne, R. (1992). "Models, metaphors and the hermeneutics of
designing". Design Issues, 9(1), 56-74. Snowden, D. (2002). "Complex acts of knowing: paradox and descriptive self-
awareness". Journal of knowledge management, 6(2), 100-111. Valkenburg, R. C. (1998). “Shared understanding as a condition for team design.” In:
Automation in construction, 7(2), 111-121.
308 | Proceedings IGLC | July 2017 | Heraklion, Greece

Hacker C., Byse E., Reed D., and Alves, T.C.L. (2017). “Building a Lean Culture” In: LC3 2017 Volume II – Proceedings of the 25th Annual Conference of the International Group for Lean Construction (IGLC), Walsh, K., Sacks, R., Brilakis, I. (eds.), Heraklion, Greece, pp. 309-316. DOI: https://doi.org/10.24928/2017/0301
BUILDING A LEAN CULTURE
Cory Hackler1, Erika Byse2, Dean Reed3, and Thais da C.L. Alves4
Abstract: To accelerate understanding and implementation of Lean throughout a large general contracting company, the Lean leadership group, with the support of management at all levels, shifted from training employees on tools and solutions, to educating them about Lean principles as an overarching way to run their projects. This industry paper describes the work that the company has and is currently doing to train professionals in all its business units. It explains why and how the effort started, the feedback received from participants who have attended a new course in Lean leadership, and the plans to expand this program to increase and sustain Lean implementation. The paper provides a contribution to the literature on Lean implementation and change management and underscores the importance of creating a culture based on solid understanding of the Lean vocabulary, principles, and goals to create a critical mass across projects.
Keywords: Lean leadership, Lean education, Lean culture.
1 INTRODUCTION This industry paper describes a General Contractor’s effort to establish a Lean culture, which enables their project teams to deliver greater value to customers. The goal is to share what was learned from this experience and benefit from the feedback that will result from discussing what is being presented within the IGLC community and beyond.
2 LEAN IMPLEMENTATION IN CONSTRUCTION COMPANIES In their roadmap for Lean implementation Ballard et al. (2007, p. xi-xii) suggest several actions for organizations to implement Lean in capital projects: select partners who can adopt lean project delivery, structure project organization to engage downstream partners in upstream processes and vice-versa; encourage thoughtful experimentation and celebrate breakdowns; build quality and safety through the work of those designing and making; amongst others. Along these lines, another example found in the literature includes Izquierdo et al. (2011)’s work, which proposed the development and implementation of a ‘Basic Management Functions Workshop’ with the goal of training a company’s employees and aligning them towards a way of doing business using Lean principles.
A common thread in the literature about Lean implementation is the idea of aligning those working for a company, and its extended network of partners, toward common goals and purposes that matter for their clients (value), as well as creating a critical mass of stakeholders who understand Lean principles. Alves et al. (2012) suggested that
1 DPR Construction, 1450 Veterans Boulevard, Redwood City, CA. [email protected] 2 DPR Construction, 222 N. 44th Street, Phoenix, Arizona 85034, [email protected] 3 DPR Construction, 1450 Veterans Boulevard, Redwood City, CA. [email protected] 4 Associate Professor, J.R. Filanc Construction Engineering and Management Program, Dept. of Civil,
Constr., and Env. Engineering, San Diego State University, USA, [email protected]
309 | Proceedings IGLC | July 2017 | Heraklion, Greece

Building a Lean Culture
developing professional curriculums that teach Lean and its related vocabulary is an important step to creating a platform that to consistently communicate overarching Lean goals and principles. Similarly, the use of examples grounded in practice, metaphors (e.g., lower the river to reveal the rocks), and simulations are also important ways to help practitioners understand how they can think and apply Lean practices in their daily work. The case presented here reflects many of these recommendations and builds on previous experiences and lessons learned about implementing Lean. More importantly, it recognizes the need to explain Lean within the context of company’s business environment and culture so that people can plan and act to make value flow on their projects.
3 CHANGING DIRECTION This company’s project teams have used Lean principles well on specific large and complex projects over the years. One such example was the case described in Britt et al. (2014) when the company’s project leaders led the creation of a high-performance team based on collaboration and alignment, shifted focus from tools to outcomes, and enabled rapid problem solving.
The company’s philosophy embraces the inverted pyramid for leadership to manage complexity and the risk that it spawns by enabling people executing projects closest to problems to solve them. Attention is focused on developing people above processes and procedures, which has made many leaders suspicious of the heavy emphasis Lean Construction places on processes and tools, and the discipline required to apply them consistently. The company culture is one of openness and accessibility versus authority and hierarchy. The company works without a CEO, and relies on a Management Committee, which helps business leaders in different offices to make decisions (Feintzeig, 2016), exemplifying shared governance and collaboration. It was in this environment that the informal Lean leadership group started a new training program aiming at shifting the focus of previous efforts from tools to Lean thinking, leadership and problem-solving.
3.1 Phase 1 – Testing a Different Approach Initially, the Lean champions recognized that their focus on processes and tools was not sufficient. They decided to shift attention to teaching the fundamental ideas of Lean, i.e., focusing on respect for people and continuous improvement, value stream thinking, flow, problem-solving, and Lean leadership and management. Two of the Lean leaders, enrolled in 8-week facilitated online course on Lean Leadership offered by a Lean logistics company (https://leancor.com) and reported that they found it quite rewarding. They saw that being able to study each week’s material online over the 8-week course gave participants the opportunity to think about the concepts, put them into practice, and share stories during the weekly conference call.
The course did and continues to blend weekly online training sessions with mentoring/coaching sessions, and requires participants to read the book, People: A leader’s day-to-day guide to building, managing, and sustaining lean organizations (“People book”) by Gran et al. (2012). Learning comes through coaching by the class facilitator in applying Lean concepts during the weekly conference call.
The Lean group decided to sponsor a private course for themselves and other like-minded company managers as an experiment. They launched it with an in-person workshop with people from two other business units attending remotely. Business unit
310 | Proceedings IGLC | July 2017 | Heraklion, Greece

Cory Hackler, Erika Byse, Dean Reed and Thais da C.L. Alves
leaders were also invited to participate. It became clear during workshop, led by an experienced facilitator from the company that had developed the material, that if the 8-week course was to succeed, people who understood how to apply Lean concepts to managing construction projects would need to facilitate the 1-hour weekly conference calls. This also meant that they needed to teach people using ideas and examples that individuals could relate to and build on.
3.2 Phase 2 – Deploying the Lean Training Course The 8-week course was and is offered to employees, from offices across the company. The course covers a range of topics covered in the People book such as: "Characteristics of a Lean Leader", "Leading with Purpose and Principles", "Focus and Alignment", "Value Stream Thinking", "Effective Measurement Systems", "Reflection", and "Building Teams". Every week, participants work through assigned reading and questions at their own pace whenever they find time, Every Friday they join a 1-hour conference call with their facilitator to discuss what they learned and how they might apply it on their current or a future project.
The People book is continuously referenced within the course content, which allows participants to review the material before and after meetings. For example, one project team has been passing the People book around to help disseminate these concepts. An observation of this team’s planning meetings revealed that concepts discussed in the People book are being applied to their project. The team has defined a baseline to keep improving upon, as they work to employ better management systems. They have continued to educate all team members in the topics covered by the course content and the book.
From the outset, the two facilitators used the Plan-Do-Study-Act (PDSA) method to improve the way they taught the course. A key early improvement was to have students send in their "apply your learning" homework, for others to see. The facilitators also worked on a teachers’ guide and decided to use their own questions to provoke discussion of how students could use each chapter’s concepts to improve delivery of their projects. Each student answered five to ten questions on the chapter, then the instructors posted everyone’s answers in a shared location. Later, participants and teachers would have a designated call once a week to discuss the answers. Each student was given five to seven minutes during the weekly call to discuss one answer that they felt passionate about, and to go deeper into the way it impacted them or how they are now doing something different based on the coursework. This shifted responsibility for learning to the students, and allowed the facilitators to help each student become a teacher. Highlights from each chapter were also taken and improved and posted as examples for other classmates and future students to see.
The facilitators created the illustration in Figure 1 to help students understand how they can use the information during and after they completed the course. It shows a constant PDSA cycle of learning through the entire lifecycle of their project. The graphic also communicates that the company leaders want them to continue learning and mastering Lean thinking and leadership.
311 | Proceedings IGLC | July 2017 | Heraklion, Greece

Building a Lean Culture
Figure 1: Road map of the Lean Leadership training
3.3 Phase 3 – Learning and Creating New Opportunities A major challenge of this course was to educate people across the country and in different roles. The course material and its related examples had to be relevant to a wide audience, yet be consistent. As the course unfolded, and participants engaged with the instructors and coaches on learning and applying the material, the facilitators started collecting feedback and compiling a list of lessons learned to improve future offerings. They started working on examples of the principles in practice and how Lean leaders could approach problems.
A sign-up list for future offerings was opened after Phase 1 and employees from across the United States signed up for three additional course offerings. In the meantime, as the word spread and the waiting list grew, the facilitators were busy compiling feedback from participants and adjusting the technology platform hosting it to improve course delivery. This encompassed new ways to teach and support the needs of the field supervisors, project managers and project office staff taking the course. Participants willingly provided feedback. Some excerpts of the feedback received (verbatim) are transcribed below:
• “Many of the tools we have been learning are straightforward concepts. I think the biggest challenge is taking the time and putting forth the effort to apply these tools to our daily work habits. But we also need to promote them to our other team members. One person cannot make a project lean. But one person can promote lean philosophies to a project team and foster a collaborative environment where these principles take root and are applied.”
• “I feel that this was a great course to encouraging and fostering being a lean leader. I think that the instructors did a great job of coaching and teaching. I do not know if this is a game changer - business system. Time will tell on this.”
• “Five things learned in the lean core academy: 1. Expect difficulties when implementing change. It is just part of the process; 2. Using inquiry to gain perspective; 3. Exposing rocks by not throwing resources at problems when they arise; 4. Plan, Do, Check, Act – just creating a lean workflow doesn’t mean your job is done. Implementing is the difficult part. It requires follow-up and re-
312 | Proceedings IGLC | July 2017 | Heraklion, Greece

Cory Hackler, Erika Byse, Dean Reed and Thais da C.L. Alves
follow-up; 5. Measure performance of the process, not performance of the people. In the end, it is always a PROCESS that caused the failure by allowing someone who was able to fail to be in that position.”
• “Five things learned in the lean core academy: 1. Lean Concepts that work in a manufacturing setting can apply to construction; 2. Focus on being lean to better meet the client expectations rather than DPR’s; 3. Exceeding goals and expectation is not lean. (overproduction); 4. It is important to understand “purpose” (i.e. what the customers wants, not what we perceived they want); 5. Do not do things for the sake of being what you think is “lean” if it does provide value at the end.”
• “I’m looking forward to learning how to be a more efficient and effective leader”, I really feel like this class and the information and tools I’ve gained form the course have and will continue to help me improve upon my leadership skills. I also feel like the course has helped me see things from a very different perspective, to ask more questions and involve more of the team before developing an opinion.”
In addition to providing feedback about the course, participants conducted a self-evaluation of their performance. Participants evaluated their own capabilities compared to the understanding they gained of the qualities of a Lean leader, and the facilitators produced a radar chart, shown in Figure 2, for each student and combined for all students in each course, and overall for the year. This evaluation helped participants identify the areas in which they needed to improve.
Figure 2: Lean Leadership categories average scores for Round 1 – Radar chart
During the weekly calls, especially in the second and third courses, participants began relating how they had applied one or more concepts. For example, a project engineer explained how he gathered his team together and convinced them that they had to rethink how they had been working and develop a different process for distributing RFI's to the field. The solution included needing paper copies in the field and a discussion of what changes were made to the drawings, so the field and the office were aligned prior to completion of the work. The team made the necessary changes and continued to use the PDSA cycle on their job for the remaining work.
The course content resulted in “a-ha” moments and students started seeing the value of the coursework. For example, one student realized that they were more of a traditional
313 | Proceedings IGLC | July 2017 | Heraklion, Greece

Building a Lean Culture
leader after completing the Chapter 2 module on Traditional Leadership versus Lean Leadership; the student then realized that they should work on new Lean habits. Additionally, the self-paced online content made it easy for students to attend, while the weekly check-ins keep it personal and hold people accountable for delivering their assignments and attending the meetings.
Momentum built as participants from multiple business units and backgrounds signed up to attend the course. Currently, the facilitators and students believe that silos are breaking down as people from different functional groups go through the course together and share their knowledge with others. As the courses are not offered to any single group or managerial level, participants are part of a diverse group of backgrounds and ideas, which serves to spread knowledge throughout the company.
3.4 Phase 4 – Expanding the Offerings Corporate leaders committed to the team’s idea to license and deploy the online Lean Leadership course (Lean Leadership Certificate, http://academy.leancor.com) company-wide after seeing metrics collected throughout the first two offerings of the course. The marketing efforts for the course were improved to consistently reach out to employees interested in attending the course. This helped make it easier for the students to sign up because the message was clear, and a sign-up link was embedded in the email notices. Students could read a "what's in it for me" message, recognize the value of the offerings, and sign up for the courses all in one document. Currently, the students sign up directly through the company’s internal learning center, which is a system they are already know how to use.
At the close of 2016, over seventy people had been through the course, and another 230 were signed up for the next three offerings. The number of individuals interested in taking the course increased rapidly due to very positive reviews from the graduates. The survey feedback from students, along with the radar charts, was shared across the company’s business units, whose leaders also promoted the course. As demand grew, so did the need to train more instructors, which has produced a bottleneck because of the scarcity of experienced Lean practitioners with both the time and facilitation skills.
Early in 2017, the two facilitators arranged for another course called “Lean Fundamentals” to be uploaded to the learning management system to serve as a starter for those who are either waiting, undecided, or unable to commit to the 8-week long course.
Focusing on Lean thinking and leadership has increased interest in learning and applying Lean practices and tools. In the past six months, the Lean Leadership facilitators and other members of a formal group focused on planning and scheduling, have trained 80+ operations people to apply Lean principles and practices, particularly pull planning to plan and manage production. 150 people signed up for the three 30-minute Lean Fundamentals modules within the first week after it was announced in January 2017 and 30 completed the course in the following 2-months.
3.5 Looking Forward Currently, the goals for 2017 are: to leverage the on-line content now available. This will allow 150 people to go through Lean Leadership and another 100 to complete the Lean Fundamentals by the end of the year. The facilitators anticipate 200 will complete Lean Leadership and 200 will work through Lean Fundamentals in 2018.
314 | Proceedings IGLC | July 2017 | Heraklion, Greece

Cory Hackler, Erika Byse, Dean Reed and Thais da C.L. Alves
Other goals the team expects to achieve include: creating a scorecard to reach out to graduates and measure their improvements; helping the graduates define Lean goals and check-in monthly to review their progress towards meeting these goals; improving communication and promoting the use of an internal Wiki to disseminate what teams are doing and what they have learned; identifying Lean champions in each region who lead by example, educate, coach and mentor others; requiring the Lean Fundamentals course for all new hires as they join the company; and educating the group on Lean tools. The team is also looking for new and innovative ways to share stories.
4 CONCLUSIONS As demand for construction grows across the country, and the company’s offices continue experiencing high growth rates in the number of projects, the company is working to build a Lean culture to promote consistency across its offices. More importantly, the team is focused on how the company’s employees interact, learn, and teach each other Lean across the country. The course facilitators together with the Lean group have drawn several lessons from their experience so far, as follows.
• Employees from all functional groups and levels are interested in learning about Lean.
• Training on Lean tools is necessary but training on overarching Lean concepts, principles, and goals is essential.
• Make training interactive and allowing people to be heard reflects respect for people, and are great ways to accelerate learning.
• Consistency and support are required to expose many people to Lean ideas. • People need a common vocabulary to share knowledge and gain enough
confidence to put them into action. • Offering courses at different levels to engage participants improves understanding.
Not every person has the time to engage in multi-week training sessions. Creating short courses with practical examples breaks the inertia and potentially the fear of changing or having to learn something new. Opening the class to employees at all levels and responsibilities increases understanding of the problems others face, and relatedness between people.
• The PDSA cycle can and should be used to continuously improve Lean education and training.
• Educating employees about Lean principles and leadership may be the most effective means, acting as a bridge, for incorporating Lean thinking into the company’s culture of collaboration, individual initiative and accountability.
This is an ongoing change process that will be evaluated along the way, and new findings will be reported in the future.
5 ACKNOWLEDGMENTS The authors acknowledge the efforts of those who have participated in the courses and helped improve outcomes along the way. The views, comments, and opinions expressed are those of the authors.
315 | Proceedings IGLC | July 2017 | Heraklion, Greece

Building a Lean Culture
6 REFERENCES Alves, T.C.L., Milberg, C., Walsh, K. (2012). "Exploring Lean Construction Practice,
Research, and Education." Engrg., Constr. and Arch. Mgmt., 19(5), 512-525 Ballard, G., Liu, M., Kim, Y.W., Jang, J.W. (2007). The University of Texas at Austin,
Construction Industry Institute, Research Report 234-11. Britt, K., Alves, T.C.L., Reed, D., and Gracz, B. (2014). “Lessons Learned from the Make
Ready Process in a Hospital Project.” Proc. 22nd Annual Conference of the International Group for Lean Construction (IGLC-22). Oslo, Norway, 257-268.
Gran, S., Martichenko, R., Miller, and Pearce, R. (2012). People: A leader’s day-to-day guide to building, managing, and sustaining lean organizations. LeanCor.
Howell, G.A. , Macomber, H. , Koskela, L., and Draper, J. (2004), “Leadership and Project Management: Time for a Shift from Fayol to Flores.” 12th Annual Conf. of the Intntl. Group for Lean Construction. Helsingør, Denmark. 8pp.
Izquierdo, J.L. , Cerf, M. & Gomez, S.A. 2011, 'Lean Construction Education: Basic Management Functions Workshop' 19th Annual Conference of the International Group for Lean Construction. Lima, Peru, 13-15.
Feintzeig, R. (2016). Companies Manage with no CEO. The Wall Street Journal. Available at http://tinyurl.com/gvsk6pp
Rother, M. (2010). Toyota Kata. McGraw-Hill, New York, NY, 306pp.
316 | Proceedings IGLC | July 2017 | Heraklion, Greece
Jean E. Laurent and Robert M. Leicht (2017) “Cross Functional Project Teams in Construction: A Longitudinal Case Study.” In: LC3 2017 Volume II – Proceedings of the 25th Annual Conference of the International Group for Lean Construction (IGLC), Walsh, K., Sacks, R., Brilakis, I. (eds.), Heraklion, Greece. Pp. 317-324. https://doi.org/10.24928/2017/0063
CROSS-FUNCTIONAL PROJECT TEAMS IN CONSTRUCTION: A LONGITUDINAL CASE STUDY
Jean E. Laurent1 and Robert M. Leicht2
Abstract: For many years traditional project delivery methods have been utilized in the construction industry, but new delivery systems such as IPD are being developed to answer the need for more integrated approaches. Studies have been conducted to assess the impact of project delivery method on project performance, but few focus on the effect of team composition and organization. However, many factors influence the need for evolving cross-functional project teams (CFPTs) as project needs change and there are additions of new participants to the project. This research presents a case study of an IPD project delivered at the Pennsylvania State University for a mixed-use laboratory, office and classroom building. The objective is to demonstrate the composition and evolution of the CFPTs organization, from the beginning of the design through early construction. This study shows that three main causes impacted the organization of CFPTs. First, the on-boarding of new project participants necessitated new CFPT organization to better fit members into specific groups. Second, certain CFPTs were created in order to achieve a specific task, leading to the dissolution of the team once the task is achieved. Third, CFPTs can show low performance related to their original goals requiring the project team to adjust the CFPT organization. The IPD structure showed unique organizational flexibility as CFPTs, leaders and members were replaced or exchanged to better fit the project needs when new members are added to the team, or if a member was not effective in meeting changing project needs.
Keywords: Cross-Functional Project Teams, Lean, IPD, Integrated Projects.
1 INTRODUCTION
Typically, construction projects follow the organizational structure driven by the type of delivery method selected. Konchar and Sanvido (1998) refer to Design-Bid-Build (DBB) as the most commonly utilized delivery method, where the owner holds separate agreements with the architect and the general contractor, that is engaged at the construction stage. On the other hand, with the Construction Management at Risk (CM-at-Risk) method, the owner contracts a construction manager responsible for the management and the construction of the facility earlier in design to work with the design team. More recently Ling et al. (2004) refer to Design-Build (DB) as a delivery method where the owner hires a single entity responsible for the design and the construction of the project. These three delivery methods have distinct impacts on project performance, with a significant difference in the contractors’ ability to influence the design for integration with construction processes. The concept of Integrated Project Delivery (IPD)
1 Graduate Student, Department of Architectural Engineering, The Pennsylvania State University,
University Park, PA, USA, [email protected] 2 Assistant Professor, Department of Architectural Engineering, Director of Partnership for Achieving
Construction Excellence (PACE), The Pennsylvania State University, University Park, PA, USA, [email protected]
317 | Proceedings IGLC | July 2017 | Heraklion, Greece

Cross Functional Project Teams in Construction: A Longitudinal Case Study
leverages principles from the Toyota Production System (TPS) and Lean Construction, using technologies and organizational methods to create value for the owner and improve project outcomes (Seed 2015). Contrary to other types of project delivery methods, in an IPD project the owner, the designers and the primary contractors share a single contract, enabling much earlier involvement of the key participants (El-Asmar et al. 2013). The increasing demand for IPD has led to the creation of standardized contractual documents for industry organizations, such as American Institute of Architects (AIA) and the Associated General Contractors (AGC). Thus, as industry representative and leader the AGC (2009) and the AIA (2007) published Consensus Documents 300 and the C195 standard forms of agreement. The use of IPD presents notable advantages, as Mossman (2008) notes a compact definition of IPD as a way to “collaboratively align people, systems, business processes and practices to optimize value for the client.” He specifies that the benefits vary depending on the role taken by the team members, but similarities are identifiable due to the nature of IPD contracts. For clients it becomes easier to link improved value and higher quality design with business objectives. Furthermore, Thomsen (2010) refers to the early involvement of prime contract members and describes this engagement as the means to achieve defect-free buildings. Therefore, a project becomes easier to design with shorter documentation times and better-integrated design benefits all the members.
Leicht et al. (2015) relate the different delivery methods and stipulate that the method itself is not the determining factor for success. The use of highly integrated teams and development of cohesive groups were found to be the key enablers for increased project performance. Integrated projects strongly depend on team organization, more specifically on the use and management of cross-functional teams (CFT). CFTs originated from the manufacturing industry in the late 1970s to improve product development, and have been used increasingly since then. According to Krajewsky and Ritsman (2005), a CFT re-groups people from within the same company, but brings together different areas such as finance, marketing, management and other departments to work toward a common objective. Henke et al. (1993) relates specific considerations concerning team structure and composition:
1. CFTs usually gather between eight to 10 members 2. Each CFT is responsible for self-management. 3. When different CFTs are established to work on the same project, they often
integrate support groups to assist the main CFTs, with all groups under the control of the Product Management Team (PMT).
UHS (2014) and Cheng (2015) emphasize the need for cross-discipline collaboration via the use of CFTs that include necessary members to respond to a specific scope, such as an estimator or specialty trade contractor. Qiu et al. (2009) highlight the need for interactional fairness on the performance of CFTs, but they do not provide specific ways to achieve it. Additionally Hickethier et al. (2013) focus on the social network analysis of information between members in IPD projects and highlight the need for utilizing the CFT approach without giving specific organizational consideration.
The difference between a Cross-functional project team (CFPT) and simply a Cross-functional team (CFT) is that in a CFPT participants are brought together to work on a single project for a limited amount of time. However, project management methods seeking the organization of cross-functional project teams (CFPTs) in construction projects are not well defined in current literature. Gaps in literature concerning CFTs organization in IPD projects lead to the following question: how do cross-functional teams
318 | Proceedings IGLC | July 2017 | Heraklion, Greece

Jean E. Laurent and Robert M. Leicht
organize and evolve in project-based organizations in the building design and construction industry?
2 CASE STUDY
2.1 Background
The Pennsylvania State University delivered its first project using an Integrated Project Delivery contract. This project was selected to allow easier communication and collaboration with the project team. The project consisted of the demolition and reconstruction of the Agricultural and Biological Engineering (ABE) building of about 77,000ft2 (7,000m2) of new construction, and, a 16,000f2 (1,500m2) renovation of the existing structure. The project incorporated new graduate education labs, research labs, offices, classrooms, a fermentation facility, and a maintenance shop. The team pursued LEED certification for a total estimated construction cost of $30 million (€27 million), with a construction start in early September 2016 and completion in winter 2017. The IPD contract gathered five signatory partners: owner, designer (architect and engineer), general contractor, mechanical contractor and electrical contractor. Penn State first selected the designer and general contractor as a team, followed by the selection of specialty contractors. Finalizing the original selection process, the IPD team presented a list of five goals that they wish to achieve:
1. Enhance student and faculty experience (support excellence in research and teaching),
2. Respect, reinforce and improve PSU-ABE brand and image, 3. Building design quality (design and materials should set a high standard for
architectural aesthetics and quality), 4. Improve building neighborhood (building should communicate with the
neighboring project and landscape), and, 5. Life cycle and sustainability (the project should minimize life costs, and remain
relevant for a 50 to 100 years lifecycle). In order to regroup members from different companies on specific project scopes and
objectives, the participants self-organized by cross-functional project teams. The Project Management Team (PMT), gathering members of all five signatory firms, is responsible for decision-making in instances when the CFPTs cannot come to a common agreement. The other members are divided into several scope-specific CFPTs, focusing on achieving project goals in conjunction with the Target Value Design process (TVD). TVD is a management technique that has been utilized in the manufacturing industry to achieve cost predictability during new product development (Zimina et al. 2012). According to Pishdad-Bozorgi et al. (2013) designers need the assistance of builders to determine design alternatives, estimate costs, and provide value engineering services during the design phase. Therefore, TVD involves both current and continuous processes of designing to set a target value and assessing the team performance toward achieving the design targets. This method creates possibilities for the project team to achieve the greatest value for the owner. Furthermore, during design, other members were selected and added to the team, as needed, to bring expertise by system. The non-signatory design-assist partners have different contracts payment terms, depending on their degree of influence on the project. Some of the design-assist contracts are incentivized through shared savings, while others are under traditional lump sum terms. Figure 1 shows an example of the contractual
319 | Proceedings IGLC | July 2017 | Heraklion, Greece

Cross Functional Project Teams in Construction: A Longitudinal Case Study
relationships among project participants. The signatory members are linked to the IPD contract; each of the signatory members has subcontractors, some of which are incentivized while others are not.
2.2 Methodology
To develop this case study across the entire design phase, the project was tracked from the beginning of the design process to the early stages of construction. The project team held general meetings once a month at the university, allowing mapping of the evolution of the team organization throughout the project. Through working sessions with the general contractor’s project manager a draft of the overall CFPT evolution was created. Furthermore, in order to develop an accurate CFPTs map evolution; interviews with a project manager from the five signatory members were held. The five interviews focused on validating the CFPTs evolution, including all organizational modifications, additions, or removals of members. This approach allowed the case study to reflect a broad, longitudinal picture of the evolution of the CFPT throughout the design phase, as well as making sure that all elements accurately reflect reality. Eventually, the information obtained during the interviews completed the original CFPT map evolution to provide a final version; presented in Figure 2, that was validated by the project team members in a follow-up meeting.
IPD
GC
Elec.
DesignerOwner
Mech.
Design
Architectural
Landscape Design
Piping
MEP
Self Perform
rest
Concrete
Roofing
Fire AlarmControls
Cold Rooms
3rd
Party Insp.
Civil Eng.
Signatory Members
Figure 1: Project team contractual relationships - Example
320 | Proceedings IGLC | July 2017 | Heraklion, Greece

Jean E. Laurent and Robert M. Leicht
3 CROSS-FUNCTIONAL PROJECT TEAM COMPOSITION AND
EVOLUTION Figure 2 represents the evolution of the three CFPTs throughout the design phase of
the project. The first CFPT relates to the Program Validation, required to be completed in order to enable other CFPTs to begin working. Once this task was complete, the project team created a set of CFPTs using personnel from the first two members (designer and general contractor) of the team that were selected in January 2015. The CFPTs were created to focus on the main building systems of the project, such as: Environmental system (MEP), Shell and Envelope, Site and Fit-out. Participants of each CFPT were chosen based on their capabilities to help the CFPT reach its goals and objectives. A leader was chosen, by common agreement, among CFPT participants to govern each. Then, each CFPT evolved differently based on various elements impacting the need for group and member modifications. Hence, Figure 2 shows the three main organizational changes experienced by the project team, represented by the different highlighted areas accompanied by numbers on Figure 2.
Type “1” in red refers to a change experienced due to the expansion of the CFPTs through the on-boarding of new project participants, in this case the Mechanical and
Figure 2: Cross-Functional Project Teams evolution through design phase – Types of changes
321 | Proceedings IGLC | July 2017 | Heraklion, Greece

Cross Functional Project Teams in Construction: A Longitudinal Case Study
Electrical contractors. The new CFPT combined the MEP CFPT and Electrical CFPT, as well as engaging the new Electrical and Mechanical contractor partners. The original logic for the two CFPTs was that they both needed to hold separate meetings focusing on specific system topics. However, as the systems work closely together, it is important to create the cross-functional communication as a single team to assure an appropriate flow of information. Eventually, the on-boarding of new project participants impacted the organization and the need for a more capable leader, bringing the builder’s input and more scope specific expertise, which Figure 2 highlights.
Type “2” in blue relates to a change brought about by the project team when they realized a lack of interaction related to the Envelope and the Site. Originally, Shell and Envelope were gathered under one CFPT. However, Site was a separate CFPT with its own meetings and agenda. The project team realized that the Site CFPT due to the relatively small site area, required extensive collaboration with the building's Envelope design. Thus, the project team decided to gather the CFPTs under one main CFPT led by “designer 1.” In this case, the team described this individual as more capable of leading such large CFPT, by showing extensive leadership skills and technical expertise. From then on the CFPT held meetings with all of the members in order to collaboratively develop the design and exchange information. In summer 2016, to prepare for construction, the leadership transferred to “project manager 1” from the GC because it is believed he is more able to bring field input and coordinate with subcontractors at this stage of the project.
Type “3” in green is the last type of change experienced during this case study. The Program Validation is a task CFPT that focused on area repartition and definition in order to allow the rest of the project team to begin design. This CFPT took place at the very earliest stage of the design phase, once completed, the specific team was dissolved and re-emerged into the Fit-out CFPT with a revised make-up and principal activities that are based on the elements developed during the program validation. It appears that “designer 2” was brought on the project to focus on this specific program validation task; this explains why this person left the group after the completion of the task. When Program Validation merged into Fit-out, the senior “architect 1” from the Designer took over the leadership of the CFPT.
4 DISCUSSION The ABE project team organized participants into different scope specific, TVD-
oriented, CFPTs that gathered individuals from different companies. The case study showed that the CFPTs focus on elements related to the main building systems of the project and their intersections. Additionally, each CFPT is expected to collaborate in order to reach the project goals and target cost set at the project outset. The three types of CFPT modifications observed were identified in different ways. Sometimes the team realized that their organization was not sufficient for a task or for coordination, which led to a reorganization or a transition of leadership. Other times, the team simply reviewed their organization in order to accommodate new firms joining the project team. Finally, one CFPT stopped when the objective was reached. These changes suggest that the team organization is organic and is based on the principles of flexible capacity and continuous improvement. However, these observations and specific changes might not occur on every IPD project. Variables, such as project type, size and goals, have a significant impact on team size, composition and evolution. This case study is limited to a medium-sized IPD project of $30 million gathering five signatory members and approximately twenty fully
322 | Proceedings IGLC | July 2017 | Heraklion, Greece

Jean E. Laurent and Robert M. Leicht
involved participants during the design phase. Furthermore, this case study highlights the importance of the IPD contract related to how a specific role can be fulfilled by different people in order to best suit the project team needs at a given time. Members can be added to a specific CFPT instead of adding members from a different company without having to revisit the contract values of the companies involved. Additionally, the CFPT organization combined with the IPD contract allows the full potential of individuals to be realized to support CFPT needs. As seen in the case study, some members are removed or switched from one CFPT to another if they do not add value to the process in their original placement. The structure is flexible and allows the team to continuously evolve the CFPTs in parallel with the changing design processes to better use team member skills. These characteristics enhance the cross-functional organization of the team and allow for greater opportunity for collaboration and innovation.
5 CONCLUSIONS The elements arising from this case study are beneficial to the lean community and
more specifically the project team members that are unfamiliar with the concepts of IPD and CFPTs. In IPD, participants are divided in CFPTs to focus on a TVD approach. Each CFPT focuses on a specific scope depending on the project and building systems. The CFPTs are composed of participants from the different project firms that have the capacity to bring value to the design process. Using CFPTs establishes a specific group of people to work on a scope with a set of practices, TVD goal, information share and communication. On top of this, the CFPTs also need to apply the concept of cross-functional communication from one CFPT to another. IPD, being a relatively new contract form, is sometimes difficult to properly engage participants into the process. However, the flexibility of CFPTs in conjunction with an IPD contract allows evolution and flexibility in the team organization, providing greater opportunity for integration and development of cohesive groups to deliver project performance. The CFPTs evolve either by changing organization or by rotating members to better suit the project needs. Some participants interviewed during the case study highlighted their difficulties to see the need for IPD and the benefits of using early in the process. Those same participants later specified that by experiencing it and having all members working towards achieving a common goal the design process was more collaborative, allowing for better performance related to project goals. The use of CFPT seems more appropriate to IPD projects, but could be utilized on other type of project deliveries. The challenge implementing CFPTs in non-IPD contracts would lie in easily transition member roles between companies to fill a gap when there is a need because it would require a renegotiation of several contracts.
To expand this case study and obtain a broader picture of CFPTs organization in integrated construction projects a qualitative research will be pursued. Consisting of interviewing a set of IPD experts would allow for a confirmation of practices used during this case study and obtaining additional information concerning the type and evolutions of CFPTs on others projects experienced by the experts. Ideally, the most effective way to provide a full representation of organizational changes related to CFPTs would be to compare several case studies with regard to the overall projects performance. Each project would show a specific set of CFPTs organization at each project stage and evolution analysed against the final project performance to assess whether CFPT organization impacted performance and the recurring elements across case studies.
323 | Proceedings IGLC | July 2017 | Heraklion, Greece

Cross Functional Project Teams in Construction: A Longitudinal Case Study
6 REFERENCES AGC (2009). "Consensus Documents." Associated General Contractors of America. AIA (2007). "Consensus Documents 300." American Institute of Architects. Aime, F., Humphrey, S., Derue, D. S., and Paul, J. B. (2011). "The Riddle of Heterarchy:
Power Transitions in Cross-Functional Teams." Academy of Management Journal, 57.
Cheng, R. (2015). "Integration at its Finest: Sucess in High-Performance Building Design and Project Delivery in the Federal Sector."
El-Asmar, M., Hanna, A. S., and Loh, W.-Y. (2013). "Quantifying Performance for the Integrated Project Delivery System as Compared to Established Delivery Systems." Journal of Construciton Engineering and Management, 139.
Henke, J. W., Krachenberg, A. R., and Lyons, T. F. (1993). "Perspective: Cross-Functional Teams: Good Concept, Poor Implementation!" Journal of Product Innovation Management, 10.
Hickethier, G. & Tommelein, I.D. 2013, 'Social Network Analysis of Information Flow in an IPD-Project' In:, Formoso, C.T. & Tzortzopoulos, P., 21th Annual Conference of the International Group for Lean Construction. Fortaleza, Brazil, 31-2 Aug 2013. pp 319-328
Konchar, M., and Sanvido, V. (1998). "Comparison of U.S Project Delivery Systems." Journal of Construciton Engineering and Management.
Krajewsky, L. J., and Ritsman, L. P. (2005). Operations Management: Processes and Value Chains., Upper Saddle River.
Leicht, R. M., Molenaar, K. R., Messner, J. I., Franz, B. W., and Esmaelli, B. (2015). "Maximizing Success in Integrated Projects: An Owner's Guide." Construction Industry Institute.
Ling, F. Y. Y., Chan, S. L., Chong, E., and Ee, L. P. (2004). "Predicting Performance of Design-Build and Design-Bid Build Projects." Journal of Construciton Engineering and Management.
Mossman, A. (2008). "What is Integrated Lean Project Delivery?". Pishdad-Bozorgi, P., Moghaddam, E. H., and Karasulu, Y. "Advancing Target Price nd
Target Value Design Process in IPD using BIM and Rish-Sharing Approaches." Proc., 49th Associated Schools of Construction Annual International Conference.
Qiu, T., Qualls, W., Bohlmann, J., and Rupp, D. E. (2009). "The Effect of Interactionnal Fairness on the Performance of Cross-Functional Product Development Teams: A Multilevel Mediated Model." Journal of Product Innovation Management, 26.
Seed, W. R. (2015). Transforming Design and Construction: A Framework for Change. Sive, T., and Hays, M. (2009). "Integrated Project Delivery: Reality and Promise. A
Strategist's Guide to Understanding and Marketing IPD." Society for Marketing Professional Services Foundation.
Thomsen, C. (2010). "Managing Integrated Project Delivery: Concepts and Contracts Strategies." CMAA.
UHS (2014). "Lean Project: Delivery Guide." Zimina, D., Ballard, G., and Pasquire, C. (2012). "Target value design: using collaboration
and a lead approach to reduce construction cost." Construction Management and Economics, 20(5).
324 | Proceedings IGLC | July 2017 | Heraklion, Greece
Zanotti N.L. Maranhão F.L. and Aly, V.L.C. (2017). “Bottom-up Strategy for Lean Construction on Site Implementation.” In: LC3 2017 Volume II – Proceedings of the 25th Annual Conference of the International Group for Lean Construction (IGLC), Walsh, K., Sacks, R., Brilakis, I. (eds.), Heraklion, Greece, pp. 325-331. DOI: https://doi.org/10.24928/2017/0304
BOTTOM-UP STRATEGY FOR LEAN CONSTRUCTION ON SITE IMPLEMENTATION
Nero Lenotti Zanotti1, Flávio Leal Maranhão2, Vitor Levy Castex Aly3
Abstract: This paper shows a Lean Construction method being implemented with a bottom-up strategy, using spontaneous improvement as a tool for the implementation. To introduce the changes, all workers were trained on how to manage and identify the 8 types of waste, and presented to a simplified A3 thinking approach as a problem-solving technique.
The implementation occurred on a large infrastructure project with a total extension of 83 km, using the construction of a water pipeline as an example, studying it for six months. To measure the results, the labor productivity rate and the average production-per-day rate were introduced as performance indicators, to analyse whether the implementation was successful or not.
By the end of the study, it was possible to observe a correlation between the number of improvements made, the labor productivity rate, and the average production-per-day rate, which implied a successful implementation of the lean philosophy.
Keywords: Lean construction, site implementation, kaizen, spontaneous improvement.
1 INTRODUCTION There are many ways and different strategies to implement Lean Construction on construction companies. The most common ways of doing so are the top-down and the bottom-up strategies. Arbulu and Zabelle (2012) considered that the top-down method often pushed organizations to adopt a shallow and wide implementation approach, typically conceived and mandated by the leadership and without proper stakeholder engagement. Therefore, many difficulties for a successful implementation of the Lean Construction philosophy have been reported, as Berroir et al (2015) questions the sustainability of most actions done by company leaders for implementation, and as Jorgensen et al (2004) has observed, the cultural interpretations constituted a considerable impediment to process-oriented cooperation.
The main barrier to Lean Construction implementation is resistance by the middle management, supervisors and employees. Team resistance comprises more than 86% of the barriers to implementation, as shown in the Lean Enterprise Institute (2007) chart (Figure 1). This is the major problem that must be overcome for a successful lean transformation to occur.
1 Civil Engineer and M.Sc. Candidate, Escola Politecnica, Universidade de São Paulo, São Paulo, Brazil,
[email protected] 2 Professor, Escola Politécnica, Department of Construction Engineering, Universidade de São Paulo;
Professor, Universidade São Judas Tadeu, São Paulo, Brazil, [email protected] 3 Professor, Escola Politécnica, Department of Construction Engineering, Universidade de São Paulo;,
São Paulo, Brazil, [email protected]
325 | Proceedings IGLC | July 2017 | Heraklion, Greece

Bottom-up Strategy for Lean Construction on Site Implementation
Figure 1: obstacles to lean implementation (Lean Enterprise Institute, 2007).
Reprinted with permission of Lean Enterprise Institute.
Meanwhile, Sarhan, S. and Fox, A. (2013) identified the top 3 barriers for Lean Construction implementation, in the following order:
• Lack of adequate lean awareness and understanding
• Lack of top management commitment
• Culture and human attitudinal issues To address the implementation problems listed above, an alternative implementation
method is the bottom-up strategy. According to Hook and Stehn (2008), this strategy implies that workers, by doing specific working routines, can implement a work culture, where the lean tools can improve how things are done traditionally. There are few published research studies that evaluate the on-site implementation of lean construction for workers, as Pichi and Granja (2014) did with lean principles; and Berroir et al (2015) did with added value analysis and 5S. However, no research was identified that focused on the training of employees such that they might be empowered to reduce or eliminate wastes in their own processes.
Motivated by the discussion above, this paper aims to evaluate an on-site implementation of lean construction using a bottom-up strategy, where the workers themselves improved their own processes. All data were collected by studying a large water pipeline construction site in Brazil.
2 DESCRIBING THE PROJECT The project that was studied for this paper is a large water production system, with a flow rate of up to 6.4 cubic meters per second, made to supply a population of 500,000. The system is consisted of:
326 | Proceedings IGLC | July 2017 | Heraklion, Greece

Nero Lenotti Zanotti, Flávio Leal Maranhão and Vitor Levy Castex Aly
• A water intake facility
• A water treatment facility
• 83 km of water pipeline
• Another structures as water reservoirs and pumping stations
2.1 Studied activity
As previously stated, the scope of this paper is the construction of the pipeline, which has a diameter of 2.1m and the trenches have 4 meters of depth. The initial estimated building cycle time is of one and a half day for every 7 meters of pipeline completed. The construction cycle is composed by the following activities:
• Soil Excavation
• Pipeline installation
• Welding
• Soil Backfill The project had several crews doing the same job in different places in order to build
it faster. The composition of the teams involved on the construction process for each of the activities is shown in Figure 2.
Figure 2: team composition for different activities of the water pipeline
construction.
In this study, the water pipeline is considered as only one construction activity, that has the construction cycle mentioned above, and the product is always finished with the trench completely backfilled.
3 STRUCTURING THE STRATEGY
3.1 Fundamentals and methodology
As Womack and Jones (2013) describe, kaizen means continuous incremental improvement. They also say that a combination of both radical improvement (kaikaku) and continuous improvement (kaizen) can produce endless improvements.
This research focused on only continuous incremental improvements, or kaizen events. It began with a training phase in which all workers were trained. Then the
18%
32%27%
23% SoilExcavation
Pipelineinstallation
Welding
SoilBackfill
327 | Proceedings IGLC | July 2017 | Heraklion, Greece

Bottom-up Strategy for Lean Construction on Site Implementation
improvements were captured using a kaizen form (Figure 3). Finally, all data collected were analyzed comparing the improvements and the labor productivity rate during the same period.
3.2 Training phase
The training provided to the workforce consisted in two specific topics of lean: waste reduction and problem solving.
As Liker (2004) mentioned, there are 8 types of wastes: overproduction, waiting, transportation, extra processing, inventory, excessive motion, defects and underutilized personnel. For each type of waste, it was showed to the workforce a contextualized example, for better understanding.
The other topic consisted of problem solving. To simplify the lesson, a reduced A3 thinking model for training was adopted so that the foremen and their crew could easily understand the concept.
The objective was to merge the two LC topics into one. Each time the workers found a waste, they were instructed to instinctively solve the problem as they had been trained, assisted by the engineers responsible for the task.
3.3 Capturing the improvement
As mentioned before, a simplified A3 thinking method was implemented, so that the foreman and his crew could identify different kinds of waste, and make improvements to overcome them. To register the actions taken on field, a proprietary form called "kaizen" (Figure 3) was developed. The kaizen form is divided in four different areas: waste or problem identification; waste or problem cause; solution or improvement implemented; and results obtained. It also has a checkbox, where the type of waste found can be marked.
All the data collect was compiled into a data base of improvement information so it could be analyzed.
Figure 3: kaizen form.
328 | Proceedings IGLC | July 2017 | Heraklion, Greece

Nero Lenotti Zanotti, Flávio Leal Maranhão and Vitor Levy Castex Aly
After the data was analyzed, the engineer responsible for the implementation of LC would visit the crew, to verify the improvements that were made, and to encourage the team to produce more kaizens forms by pointing out the results that were already obtained to promote continuous improvement.
4 IMPROVEMENTS REFLECTING ON PRODUCTIVITY
To measure the impact of the improvements, labor productivity rate and the average production-per-day rate were chosen as performance indicators, and assessed over a period of six months. Figure 4 shows the monthly productivity and the number of kaizen forms accumulated and analyzed for the water pipeline construction activity.
Figure 4: comparison of number of kaizen forms accumulated and labor
productivity rate over time.
Figure 5 shows average production-per-day rate and the number of kaizens forms
accumulated during the period.
1121
44
97150
318
141180
185
39 3346
0
50
100
150
200
250
300
350
1month 2months 3months 4months 5months 6months
NumberofKaizensforms(accumulated) Productivity(laborhour/meter)
329 | Proceedings IGLC | July 2017 | Heraklion, Greece

Bottom-up Strategy for Lean Construction on Site Implementation
Figure 5: comparison of number of kaizens forms accumulated and average
production-per-day rate.
Both figures 4 and 5 showed a correlation of the performance indicator and the
number of kaizen forms accumulated during the period. The correlation on figure 4 means that over the increase of kaizens forms, less labor hours were necessary to do the task. So, the activity was becoming more productive. And the correlation on figure 5 means that more product was made in a single day over the increase of kaizen forms. Hence, these two facts were a result of a systematically waste reduction over time.
5 CONCLUSIONS The bottom-up strategy for Lean Construction implementation on construction sites described on this paper is effective because it stimulates the engagement of the workers to make improvements on their own processes. This is made possible through training to enable them to find and eliminate wastes in their daily work.
Even though the labor productivity rate and the average production rate were chosen as the performance indicators for measuring the success of Lean Construction implementation on this case, it is expected that other performance indicators could also show a positive outcome, reflecting the improvements made by the kaizen forms, as shown on this paper. Systematically speaking, a reduction of waste on the construction process can also lead to an increase of quality and worker safety.
It was also observed that, as the number of kaizen grew, the effect it had on increasing the productivity and production rate would grow less, reaching a superior limit. This happened because the first improvements made had big impacts on performance, but as time went on, there was a tendency that the improvements would have a significantly smaller impact on performance, which meant that the work processes were close to their limit of improvement. Therefore, this study advocates radical change (kaikaku) followed by collective kaizen to promote a systematically continuous improvement.
To avoid that all the spontaneous improvement made could be somehow lost within time, it is suggested that a standardized manner of cataloguing what was made is created,
1121
44
97150
318
8.0
9.4
7.6
9.7
9.8 9.8
0.0
2.0
4.0
6.0
8.0
10.0
12.0
0
50
100
150
200
250
300
350
1month 2months 3months 4months 5months 6months
NumberofKaizensforms(accumulated) Production(meter/day/crew)
330 | Proceedings IGLC | July 2017 | Heraklion, Greece

Nero Lenotti Zanotti, Flávio Leal Maranhão and Vitor Levy Castex Aly
to add the improvements made by the application of the kaizen forms into the working culture of the company. And to really achieve continuous improvement, further actions, taken from a top-down perspective, must be added to the bottom-up spontaneous improvement methods, so that the company can reach its peak efficiency on working routines on a faster way.
6 REFERENCES
Arbulu, R. and Zabelle, T. (2006). Implementing Lean in Construction: How to Succeed. Proceedings of IGLC, Santiago, Chile, pp.553-565.
Berroir, F., Harbouche, L. and Boton, C., 2015. Top down vs. Bottom up approaches regarding the implementation of lean construction through a French case study. In: Proc. 23rd Ann. Conf. of the Int’l. Group for Lean Construction. Perth, Australia, July 29-31, pp. 73-82, available at www.iglc.net
Lean Enterprise Institute, (2007). New Survey: Middle Managers Are Biggest Obstacle to Lean Enterprise. State of Lean Survey. p.4.
Jorgensen, B., Emmitt, S. and Bonke, S. (2004). Revealing Cultures and Sub-Cultures During the Implementation of Lean Construction. Proceedings IGLC, Helsingør, Denmark, p.13.
Höök, M. and Stehn, L., 2008. Lean principles in industrialized housing production: the need for a cultural change. Lean Construction Journal, 2, pp.20-33.
Picchi, F. and Granja, A. (2004). Construction Sites: Using Lean Principles to Seek Broader Implementations. Proceedings IGLC, Helsingør, Denmark, p.12.
Womack, J. and Jones, D. (2003). Lean thinking. 1st ed. New York: Free Press. Liker, J. (2004). The Toyota way. 1st ed. New York: McGraw-Hill. Sarhan, S. and Fox, A. (2013). Barriers to Implementing Lean Construction in the UK
Construction Industry. The Built & Human Environment Review, Volume 6, p.17.
331 | Proceedings IGLC | July 2017 | Heraklion, Greece

332 | Proceedings IGLC | July 2017 | Heraklion, Greece

Leonova, M., Ballard, G. and Gehbauer, F. (2017). “Strategies that Can Help Transform the Construction Industry” In: LC3 2017 Volume II – Proceedings of the 25th Annual Conference of the International Group for Lean Construction (IGLC), Walsh, K., Sacks, R., Brilakis, I. (eds.), Heraklion, Greece pp. 333-340. DOI: https://doi.org/10.24928/2017/0241
STRATEGIES THAT CAN HELP TRANSFORM THE CONSTRUCTION INDUSTRY
Margarita Leonova1, Glenn Ballard2, and Fritz Gehbauer3
Abstract: This paper is an appeal to the various stakeholders committed to lean transformation of global construction to coordinate their efforts, and to recruit others not yet committed. Both opponents and advocates of industry transformation are identified; those who live off the waste are in one corner and those who suffer from unsafe, defective, late and costly construction are in the other. A case is made for an alliance of advocates to develop and coordinate the manifold initiatives that together constitute a strategy for transformation.
Keywords: Lean construction, industry transformation, research strategies, research areas
1 INTRODUCTION Thee International Group for Lean Construction (IGLC) was formed in 1993 as a platform for academic exchange and lean research. Fifteen papers were presented at the annual conference in 1996. Ten years later, that number had grown to 123. Many of the IGLC papers have been influential in both the academy and practice.
Nevertheless, despite evidence of increasing impact in some parts of the world, it is apparent that the objective of transforming the construction industry is far from being attained. That is even true in countries where Lean has made considerable progress. Moreover, there are major and huge blank areas in the Lean world map, as can be easily deduced from the number of countries not represented in the IGLC conferences. The question has to be discussed whether the IGLC papers in their majority are really supporting the overall objective. There might be even allowed the question whether many of the papers would even frighten away a person from practical life if these papers were their first contact with Lean. In any case, if the success of Lean transformation is sub-optimal, then we need a discussion about improved strategies. IGLC researchers could direct some of their research directly to the task of industry transformation; for example, by testing and refuting the paradigms on which traditional, non-Lean practice is based. But research is only one, though a critical one, of the levers for that transformation. In this paper, which does not pretend to be itself a research paper, we provide a larger, more comprehensive view of strategies and stakeholders involved in that initiative.
1 Ph.D. Student, Tallinn University of Technology, Faculty of Civil Engineering, Ehitajate tee 5, 19086
Tallinn, Estonia., +372 5845 4946, [email protected] 2 Research Director, Project Production Systems Laboratory, Civil and Environmental Engineering Dept.,
Univ. of California, Berkeley, 407 McLaughlin Hall, CA94720-1712, USA. [email protected] 3 Professor Emeritus, Institute for Technology and Management in Construction, Karlsruhe Institute of
Technology, Am Fasanengarten Geb. 50.31, 76128 Karlsruhe, Germany, Phone +49-721 9554631, [email protected]
333 | Proceedings IGLC | July 2017 | Heraklion, Greece

Strategies that Can Help Transform the Construction Industry
Others in the IGLC community have addressed issues, challenges and obstacles to Lean Construction adoption, dissemination, research and education and have made recommendations (to mention a few: Alves et al. 2012, Sarhan and Fox 2012, Common et al. 2000, Wandahl 2014). Building on their work, we propose to bring the discussion to a new level.
This paper starts with a summary of observations from a practical view followed by the presentation of strategies for the transformation of the construction industry worldwide. Finally, questions of organizing and developing action pans are discussed.
2 OBSERVATIONS FROM A PRACTICAL VIEW
Transforming the construction industry is hindered by existing paradigms and other obstacles. More research is needed to reveal and reduce these obstacles. Many a practitioner having received an introduction to Lean has mentioned that “miracles” like aligning of interests or real and open co-operation are considered impossible. Even companies that have embraced Lean in one or several projects find it hard to maintain the momentum or to develop into a Lean organization. Lean research does not seem to produce answers to those problems. It is mostly concentrated around hypothetical research questions, often far away from practical needs. The traditional administrator usually suspects the idea of Integrated Project Delivery (IPD). The public sector has to be won over and supported in the development of new regulations. The difference between value and low price is not sufficiently understood.
In most countries, Lean education is either totally missing or incomplete. The possibilities of the internet are not explored in that context. If we observe an insufficient Lean education throughout, we have to consider creating a Lean online university.
It is widely accepted that the adoption of lean requires changes in attitudes, thinking, and behaviour. At the same time, it is clear that these changes are hard to achieve and that there are a lot of obstacles. However, too little research action is seen addressing the problems and facilitating the change, especially when different national peculiarities increase the human resistance to change. Too little is done to develop concepts that can drive the change and to identify the drivers.
Often lean is perceived as merely a collection of tools. Sometimes the roles of Lean and BIM are reversed or confused, with BIM even regarded by some as synonymous with Lean. Lean Construction and VDC (Virtual Design and Construction) are often misunderstood to be competing solutions. Why do not VDC and lean always go hand in hand? Newcomers usually have lot of questions and doubts. Lean research does not seem to produce answers to those. Lean needs to join forces with other progressive initiatives in the industry to overcome traditional thinking and mindsets.
The learning culture of the Last Planner System is to a great extent based on learning from failures. The real drive in nature and in humanity is, however, learning from success (Spitzer 2007). This can be systemized and incorporated into Lean.
The majority of all AEC companies belong to the small and medium-sized enterprises (SME) category. Whereas IPD and Alliancing are considered to be of special value in complicated projects, normally not the field of the SME, Lean should make clear what it has to offer to them. Basically, if we promote change within the industry, we have to deal with a huge number of companies with less than 10 employees. Lean construction implementation needs to be evaluated both for its successes and for its omissions.
Stifi (2017) has presented two world maps, one of Transparency International (Corruption Perceptions Index), the other from the World Bank (Control of Corruption).
334 | Proceedings IGLC | July 2017 | Heraklion, Greece
Margarita Leonova, Glenn Ballard and Fritz Gehbauer
A closer look reveals that these countries, with a few exceptions, are the ones with the least adoption of Lean. That is not a surprise. Transparency, open collaboration and reliability have no place in a corrupted system. Endeavours to reduce corruption apply ever more stringent codes and regulations - with no effect. Lean has something else to offer: a gradual entry into a new world with win-win situations.
Stifi (2017) also discusses the fact that corruption and Lean efforts in the same project are hindering each other. Can that be used to reduce corruption? Looking at the corruption world map another interesting observation can be made. Some countries with the lowest corruption factor are very reluctant to embrace full IPD. Possibly, it is feared that corruption could no longer be controlled with these new procurement methods. Any initiative trying to promote Lean has to take such matters into consideration.
Corruption is possibly the number one waste in the industry, but there are more groups that live off waste. In addition, there are the timid ones and persons and organizations resisting change. They all belong to the group of opponents and form obstacles against transformation. On the other hand, there are advocates who have shown considerable success in projects and organizational improvements. They are too few and often regionally confined. A concerted action is needed to spread the success stories and to teach the conditions for success, on a worldwide scale.
3 STRATEGIES FOR RESEARCH AND EDUCATION
Even though the construction industry is believed to be slow to adopt innovations and embrace changes, there is a lot going on. The industry is influenced by developments in chemical and materials engineering, construction machinery and equipment, and increasing penetration of ICT (Information and Computer Technology) into daily operations. The Lean Construction community brings management innovations in culture and ways of working. Changing culture and habits is inevitably a slow process and needs a clear strategy and dedication.
Along with other industries, the question for the construction industry is not one of whether or not to innovate but rather of how to do so successfully. The Lean community’s goal is for Lean Construction principles and methods to become standard in the industry. The question is how the Lean research community should influence and direct research to achieve the goal.
3.1 Strategies for research
During 25 years of extensive research, case studies and conferences the community has produced a Lean Construction body of knowledge. Participants of the 24th IGLC conference discussed where the world is in terms of Lean Construction adoption. Broadly speaking, there has been relatively good progress in terms of lean implementation at the project level; not much evidence of successful lean enterprises; the industry overall has not transformed into a lean one. In other words, it could be said that we have achieved “pockets of excellence”; however, this is not good enough. Using Rogers’ Diffusion of Innovations curve to analyse the situation (Rogers 1962), it could be stated that we are still in the “early adopters” phase and in order to reach the “early majority” category we have to “cross the chasm” (Moore 1991). Choosing the right research direction should bring us nearer to achieving the goal.
After about ten years of LC research and implementation, a survey (Common et al. 2000) revealed “a distinct lack of understanding and application of the fundamental techniques required for a lean culture to exist”. Nevertheless, more than ten years later
335 | Proceedings IGLC | July 2017 | Heraklion, Greece

Strategies that Can Help Transform the Construction Industry
Alves et al. (2012) discussed the evidence found in the literature and collected from industry actors the variety of ways Lean is understood when applied to construction. A study by Sarhan and Fox (2012) identified three barriers to the successful implementation of LC: [1] Lack of adequate lean awareness and understanding; [2] Lack of top management commitment; and [3] Cultural & human attitudinal issues. Another research on barriers and obstacles in Lean implementation shows that “the awareness of Lean Construction is considerably low” (Wandahl 2014).
As we all know, there is nothing more practical than a good theory. Apparently, the current best knowledge has not delivered the desirable results. A broader and more fundamental approach in Lean Theory is needed in order to establish a common understanding of key principles and definitions, including lean, value, transformation.
Koskela et al. (2003) argued that while theory explains the reasons and possible preventions of problems, experimentation converts theory into practical methods and tools. Feedback from industry actors along with the appropriate research approach should establish “an appropriate link between theory and practice, strengthening the relevance of academic research” (Rocha et al 2012).
Ultimately, success of lean adoption is seen in the establishment of standard work in AEC companies. IGLC research should definitely consider the environment we are living and working in and have a focus on solving real world problems. At the same time, the proposed solutions should be more universal to avoid unnecessary repetition of the same applications on different companies, regions, countries.
The challenge of promoting partnering between industry and academia has been previously discussed in the work of Alves et al. (2012). Practitioners have the data but do not have the resources to process and analyze it. Researchers, on the other hand, do not have direct access to data but have the capacity to analyze and draw conclusions. Within this win-win collaboration, a transfer of the conclusions and solutions back to the industry in required. For that, publications of academic papers is not sufficient.
During the 24th IGLC conference panel discussions, it was stated that we should find new ways to bring academia and practitioners to work together. Along with a fundamental theory, a simple and clear core concept of Lean should be developed. There should be clarity what the new theory proposes to be done differently and how the proposed solutions are incorporated into the real world and meet the needs of the majority in the field. Examples of successful research-industry partnerships should be taken into consideration. The gap between industry and research is well illustrated in a recent survey (Alves et al. 2016) that highlighted a lack of “pull” from the industry regarding specifying lean skills in job offers, even from members of the Lean Construction Institute.
3.2 Strategies for education
Teaching lean concepts is a challenge by itself; however, it pushes lean educators to find creatively different approaches to teaching the subject. Seven different perspectives on teaching LC in a university setting were presented in papers of Tsao et al. (2012) and Tsao et al. (2013). Multiple teaching approaches, e.g. team projects, reading assignments, guest speakers, field trips, mixed with learning methods such as simulations and discussions resulted in higher student engagement and satisfaction in courses. As the leader of the Lean Construction Institute’s Academic Forum, Tariq Abdelhamid has collected Lean Construction curricula and materials, which were made available to member companies4. Unfortunately, not that many academics followed the encouragement of the authors to
4 The Lean Construction Lighthouse webpage http://www.leanconstruction.msu.edu/
336 | Proceedings IGLC | July 2017 | Heraklion, Greece

Margarita Leonova, Glenn Ballard and Fritz Gehbauer
share their teaching approaches, experiences, and lessons learned which leaves some blank spots in the body of knowledge for Lean Construction education.
According to the IGLC statement, in order to respond to the global challenges ahead, the practice, education, and research of the AEC industry have to be radically renewed. Kuhn (1970), writing about paradigmatic change in the sciences, noted that some people are unable to accept and embrace new ways of thinking and behaving. According to Rogers (1962), many of those who did embrace new ways were influenced by innovators and enthusiasts in the field5. There is still a lot of work to do in convincing experienced practitioners to go with Lean. However, there are those who do not have to unlearn practices, rather they are ready to think in Lean terms from the beginning. Students and young researchers are going to shape the future of the construction industry in their role as architects, engineers, contractors and owners. In order to compete for the fresh blood and best young brains on the market, the construction industry should think about how to make construction more appealing for students.
The network of research from practice and academia should become more internationalized and its work should be more coordinated. There are still countries and regions that have not heard about lean or are at the very beginning of their journey; however, sometimes more fundamental problems – corruption – must first be addressed. Students and young researchers from those countries should be reached by the representatives of the network of Lean professionals. External advisors should provide guidance and help direct the research to achieve better and faster results, help to avoid beginning from scratch and reproducing research already done.
The authors of this paper discussed several reasons why a new approach to Lean research is needed. Some of the points are reflected in the corresponding IGLC literature. We are hoping to draw additional attention to existing issues and believe that in true collaboration the radical renewal of AEC practice, education and research can be achieved.
Today we have different sources for information about Lean Construction, some of which is outdated. As a community, we have to think about the impression we are making on, for example, newcomers who are searching the web for trusted sources of information. To mention some: the IGLC webpage provides a yearly-replenished collection of conference papers; the Lean Construction Lighthouse was a pioneer effort on making Lean resources available online on a variety of topics; the Lean Construction Institute's website is a good example of a truly helpful get-started source. However, there is no unity for international audience or prospective students and researchers or potential industry actors who would like to partner with academia.
An integrated platform is needed to unite interested parties and enable access to updated information about the lean world. The opportunities and issues that it could address include:
• information about universities that incorporate lean education in their curricula;
• active academia members, their research interests and willingness to serve as external advisors for students;
• students’ information (CV, resume, research interests);
• companies’ requests for research support: research questions, data analysis, problems to be solved etc.;
• companies could share achievements and barriers to lean implementation;
5 According to Rogers (1962), (1962) “innovators” initiate the diffusion.
337 | Proceedings IGLC | July 2017 | Heraklion, Greece

Strategies that Can Help Transform the Construction Industry
• opportunities for doing case studies, organizing field trips and company tours for students.
The goal is to create a strong network with information collected in one place, easily reachable and accessible for anyone interested in Lean Construction. The platform could address the missing link between research and practice, internationalization, direction and monitoring of quality of the research.
4 NEED TO CREATE AN ORGANIZATION TO LEAD THIS INITIATIVE: PLAN OF ACTION
The construction sector is characterized by fragmentation and construction projects by siloed structure. As a result, an age-old question “who must initiate the change?” or “who must demand better construction processes?” has not yet been answered. It seems that the lean movement also lacks a shared view of the direction and general steps towards lean at the industry-level.
Lean Construction is said to need a greater sense of mission, focus, and industry support (Forbes and Ahmed 2011). We invite interested parties to participate in creating a plan of action. We list some elements that need to be considered:
• Producing a fundamental Lean Theory with clearly defined terminology and agreed definitions (what is lean, value, change etc.) and key principles.
• Research revealing how Lean can help attack fundamental obstacles like corruption.
• Opportunities for several relevant research focuses can be distinguished: research on obstacles to lean transformation; observation and description of real-world problems and paradigms; observation and description of what is working and why it is working during the lean journey.
• Exploring other industries for useful input to the lean transformation of construction. Interesting parallels were drawn in the recent paper about filmmaking and construction (Ballard et al. 2016).
• A new direction should be set in order to boost interest and trust of traditional academia and increase number of proceedings in other non-lean conferences and journals, and stimulate externally generated citations of IGLC papers. (More statistics on citations can be found in the work of Pasquire and Connor (2011).
• A plan for attracting young people to the construction industry as practitioners and researchers.
• Collaborate really collaborate to make Lean Construction a global movement: o Establish a strong integrated network (a platform) of representatives of
research, education, practice and potential members of the Lean Community.
o Create internet-based Lean Construction courses, the nucleus of a later internet Lean University.
The construction industry strongly impacts the economies of almost every country, through spending in both the public and private sector, and fundamentally through changing the built environment. We need an improved next level of performance. The term “next level” refers to ideas that could improve the impact of construction on society
338 | Proceedings IGLC | July 2017 | Heraklion, Greece

Margarita Leonova, Glenn Ballard and Fritz Gehbauer
and the environment. Advocates for Lean Construction will start from different places. What’s critical is for them to reach their next level of understanding and application from whatever base they start. That includes politicians, public clients, the industry and universities. Groups already practicing Lean and collaborative contracting are invited to join the discussion with the aim to reach a “next level” of performance: The International Group of Lean Construction (IGLC), the Lean Construction Institutes worldwide, the Alliancing community of Australia, the Integrated Project Delivery (IPD) projects in the US, the Lean in the Public Sector (LIPS) conferences worldwide, and organizations that develop and promote BIM and other information technologies, such as BuildSmart and BIM Forum.
The IGLC community cannot alone develop an action plan and create the organizational base for the actions needed. However, IGLC can take a leadership role in bringing advocates for Lean Construction together, and solicit research that facilitate construction industry transformation. The following action plan includes the important contributions IGLC can make. But it is not limited to those. This paper is addressing the IGLC community because many of the key players in the action plan should come from that community. Many of its members and contributors belong to influential organizations both in the academic and industry world. We invite them to join in an effort to initiate actions and create organizational structures that are necessary for transforming the construction industry. Nevertheless, we also need working groups and organizational structures. These cannot be created in one stroke. But a beginning has to be made.
The beginning could be a working group consisting of influential stakeholders of IGLC. Its first task could be to bring in more stakeholders and to form an alliance of advocates to develop and coordinate the manifold initiatives that together constitute a strategy for transformation.
5 SUMMARY AND CONCLUSIONS This paper has outlined an approach to lean transformation of the construction industry. Needs and opportunities for change have been identified and first steps proposed, including creation of a leadership group drawn from multiple stakeholders. The role envisioned for IGLC as an organization is to be part of the industry transformation leadership, focused on issues of research and education.
6 REFERENCES Alves, T.D.C.L., Azambuja, M.M. and Arnous, B. (2016). Teaching Lean Construction: A
Survey of Lean Skills and Qualifications Expected by Contractors and Specialty Contractors in 2016. Proceedings of the 24th Annual Conference of the International Group for Lean Construction.
Alves, T.D.C.L., Milberg C., Walsh, K.D. (2012). Exploring lean construction practice, research, and education. Engineering, Construction and Architectural Management. Vol. 19 No. 5, pp. 512 - 525
Ballard, G., Egebjerg, C., Bølviken, T., Endresen, S. and Ballard, B. (2016). Filmmaking and Construction: Two Project Production Systems. Proceedings of the 24th Annual Conference of the International Group for Lean Construction.
Common, G., Johansen, E. and Greenwood, D. (2000). A Survey of the Take-Up of Lean Concepts Among UK Construction Companies. Proceedings of the 8th Annual Conference of the International Group for Lean Construction.
339 | Proceedings IGLC | July 2017 | Heraklion, Greece

Strategies that Can Help Transform the Construction Industry
Forbes, L.H. and Ahmed, S.M. (2010). Modern Construction Lean Project Delivery and Integrated Practices. Boca Raton, FL, CRC Press Taylor & Francis.
Koskela, L., Ballard, G. and Howell, G. (2003). Achieving Change in Construction. Proceedings of the 11th International Group for Lean Construction Conference.
Kuhn, T.S., (1970) The structure of scientific revolutions. International Encyclopedia of Unified Science, vol. 2, no. 2.
Moore, G.A. (1991). Crossing the Chasm. Harper Perennial. Pasquire, C. and Connor, P. (2011). Where does the Theory Informing the International
Group for Lean Construction Come From? Proceedings of the 19th Annual Conference of the International Group for Lean Construction.
Rocha, C.G.D., Formoso, C.T., Tzortzopoulos-Fazenda, P., Koskela, L. and Tezel, A. (2012). Design Science Research in Lean Construction: Process and Outcomes. Proceedings of the 20th Annual Conference of the International Group for Lean Construction.
Rogers, E.M. (1962). Diffusion of Innovations. The Free Press, New York. Sarhan, S. and Fox, A. (2012). Trends and Challenges to the Development of a Lean Culture
Among UK Construction Organisations. Proceedings of the 20th Annual Conference of the International Group for Lean Construction.
Stifi, A. (2017). Development of an Anti-Corruption Toolkit with Components of Lean Construction. Doctoral Dissertation submitted to the Institute for Technology and Management in Construction, KIT.
Spitzer, M (2007) Learning: The Human Brain and the School of Life. Elsevier Science The IGLC webpage http://www.iglc.net/ The Lean Construction Lighthouse webpage http://www.leanconstruction.msu.edu/ The Lean Construction Institute's website https://www.leanconstruction.org/ Tsao, C.C., Alves, T.D.C.L. & Mitropoulos, P. (2012). Different Perspectives on Teaching
Lean Construction. Proceedings of the 20th Annual Conference of the International Group for Lean Construction.
Tsao, C.C., Azambuja, M., Hamzeh, F.R., Menches, C. & Rybkowski, Z.K. (2013). Teaching Lean Construction Perspectives on Theory and Practice. P. Proceedings of the 21th Annual Conference of the International Group for Lean Construction.
Wandahl, S. (2014). Lean Construction with or without Lean – Challenges of Implementing Lean Construction. Proceedings of the 22nd Annual Conference of the International Group for Lean Construction.
340 | Proceedings IGLC | July 2017 | Heraklion, Greece

Li, S. and Ma, Q. (2017). “Barriers and Challenges to Implement Integrated Project Delivery in China.” In: IGLC 2017 - 25th Annual Conference of the International Group for Lean Construction, Heraklion, Greece. Pp. 341-348. DOI: https://doi.org/10.24928/2017/0119
BARRIERS AND CHALLENGES TO IMPLEMENT INTEGRATED PROJECT DELIVERY IN CHINA
Shan Li1, and Qiuwen Ma2
Abstract: Integrated Project Delivery (IPD) improves construction project performance. In China, though IPD is known due to its theoretical advantages and benefits, effective implementation of IPD in construction projects is rare. This may be caused by some existing barriers and problems. The purpose of this study was to explore the barriers to adopt IPD in Chinese construction. Critical factors of IPD implementation were reviewed, and face-to-face interviews with experts were carried out to collect industry views. Nanjing, China was selected as the location to carry out the research. The results revealed that the confidence of using IPD is not strong. In particular, adversarial relationships, legal issues, and lack of owner willingness may block the implementation of IPD in China. It is suggested to adopt positive mechanisms to push for the early involvement of diverse participants. In terms of the contract mechanisms, future studies should involve a standard framework, gradual project procurement process, collaboration-oriented risk and rewards system, and necessary techniques to improve integrative operations.
Keywords: Integrated project delivery, barriers, Nanjing-China.
1 INTRODUCTION
In 2015, the development of the construction industry in China fell to a historical low. Due to inborn fragmented problems, the Chinese construction industry suffered from low productivity, inefficiency, and ineffectiveness. To develop and survive in the context where integrated scientific management develops, participants in Chinese construction need to review their practices and refine their strategies to improve their operations.
The concept of “lean” refers to reducing waste, meeting the requirements of customers, and focusing on value generation (Koskela 1997). IPD is a lean project delivery method that is characterized by bonding the key participants together and incentivizing them to achieve real collaboration for the interest of the project (American Institute of Architecture (AIA) 2007; Forbes and Ahmed 2010), thereby reducing waste and adding value. Previous research on IPD can be briefly classified into two groups: IPD definition and IPD application. Knowledge in the first group is helpful to identify the concepts, advantages, and measurements of IPD (Lahdenperä 2012; El Asmar et al., 2013). The second group of knowledge is useful for knowing the barriers and problems, critical successful factors, and effective mechanisms to address technique issues, contractor issues, and organizational issues in implementing IPD (Ballard 2011; Korb et al. 2016; Lostuvali et al. 2014). Despite the success of IPD projects in foreign countries, the challenges to adopt IPD in China are unknown. Rowlinson (2017) highlighted that business willingness and policies are the main barriers of IPD implementation. In addition, cultural, financial, legal, and
1 Assistant Professor, Department of Architecture and Civil Engineering, City University of Hong Kong,
Hong Kong SAR, China, [email protected]. 2 Ph.D. student, Department of Architecture and Civil Engineering, City University of Hong Kong, Hong
Kong SAR, China, [email protected].
341 | Proceedings IGLC | July 2017 | Heraklion, Greece
Barriers and Challenges to Implement Integrated Project Delivery in China
technological problems are prevalent barriers (Ghassemi and Becerik-Gerber 2011, Korb et al. 2016). In the context of China, less research has been performed on IPD implementation. This paper aims to solve these research problems.
2 IPD
The American Institute of Architects (AIA) and the American Institute of Architects California Council (AIACC) (2010) defined IPD as a method of project delivery distinguished by a contractual arrangement among a minimum of the owner, the constructor, and design professionals that aligns the business interests of all parties.
Since Sutter Health successfully combined lean project delivery with multiparty contracts, IPD has shown its advantages in risk management and cost predictability (Lichtig 2005). IPD was first adopted in healthcare projects and gradually has been implemented in a variety of projects, including office buildings, residential buildings, transportation infrastructure, educational buildings, civic projects, and others.
The most well-recognized characteristics of IPD are: early involvement of key participants, shared risk and rewards, multiparty agreement, collaborative decision making and control, liability waivers among key participants, jointly developed and validated goals, and use of Building Information Modelling (BIM) (AIA and AIACC 2010; Azhar et al. 2015).
Multiparty agreement (MA): In IPD implementation, a multiparty agreement should be established. Such a contract refers to a single contract among multiple parties, including at least the owners, architects, and contractors (AIA 2007; National Association of State Facilities Administrators (NASFA) et al. 2010). Some important subcontractors and suppliers may also be included in the multiparty contract. In this contract, all elements are clearly stated and normally include incentives and risk sharing, payment method, dispute resolutions, and the responsibilities of all involved parties. However, the usage of IPD may deviate from the standard. For example, in Sutter Health’s construction of its new Cathedral Hill Hospital in San Francisco, the integrated form of agreement (IFOA) was used, and the owner, architect, design consultant, general contractor, and primary trade contractors were included in the IFOA; while in a project of Lawrence & Schiller Remodel, a new, limited liability company (LLC) was established, formed, and solely owned by the owner, who contracted with the integrated team partners, which included interior designers, the architect, general contractor, electrical contractor, and mechanical contractor (Cheng et al. 2012).
Early involvement of key participants (EIKP): One of the most fundamental advantages of IPD is that all key parties should be present and involved in a project from the earliest design phase (AIA 2007). Early contractor involvement (ECI) is not a new strategy, which was first adopted in 2000 in the project of Blyth Community College for cost review and selection of materials (Mosey 2009). Many researchers have investigated ECI and its use of different procurement forms, including partnering and alliancing (Mosey 2009; Rahman 2012). Since the new millennium, ECI has been adopted widely in different construction environments (Walker and Lloyd-Walker 2012; Whitehead 2009).
Shared risk and rewards (SRR): Incentive compensation layer (ICL) is incorporated in IPD projects, where a percentage or all of the profit of designers and contractors is put at risk. The project goals are set at an early project stage, and the project participants will receive their profit jointly in terms of the measurement of project performance against project goals (Cohen 2010). The ways to define and calculate risk and rewards are diverse. Badenfelt (2008) suggested that the sharing ratio should be chosen based on past working
342 | Proceedings IGLC | July 2017 | Heraklion, Greece

Shan Li and Qiuwen Ma
relationship and perceived risks, while Zhang and Li (2014) proposed a sharing mechanism in terms of the Nash Bargaining Solution based on target cost.
Collaborative decision making and control (CDMC): In IPD projects, the decisions are made based on mutual agreements among all project teams, instead of solely by the owner. The IPD management team and implementation team, comprising representatives from at least the owner, architect, and contractor, should be built to make decisions collaboratively (Thomsen et al. 2009). Core decisions are mainly made by the project executive team, while the detailed implementation is conducted by the project management team (AIA 2009a).
Liability waiver (LW): The contractual agreements of IPD require a liability waiver among the key participants, except for willful misconduct which occurs if the project participants cannot prove that the misconduct is unintentional (AIA 2009b). Liability waivers have been strictly implemented in alliancing projects in Australia. Despite the fact that LW is a metric to measure the level of integration, the relevant adoption in the IPD context is not as high as alliancing (Lahdenperä 2012).
Jointly developed and validated goals (JDVG): In the IPD context, project participants develop project goals jointly. Project performance criteria are defined based on the input and support of all key participants (NASFA et al. 2010). Given an initial planning budget provided by the owner, project participants develop target cost. In addition to cost target, the design criteria also include quality, schedule, diversity, sustainability, and implementation (Cheng et al. 2012).
Use of BIM: Open and interoperable information exchanges based on BIM can facilitate integration and collaboration between different participants (AIA 2007). In IPD projects, BIM serves as a platform where the information is shared among project participants.
Despite the fact that IPD as a project delivery method emerged 10 years ago, the philosophy of IPD actually has been embraced in the AEC industry even before the first term of IPD emerged (NASFA et al. 2010; Matthews and Howell 2005). NASFA et al. (2010) defined “IPD-ish” as using IPD as a philosophy, a phenomenon that is also called “IPD lite” or “non-multiparty IPD.” In IPD-ish projects, not all of the IPD characteristics are achieved, nor is multiparty agreement adopted. In addition, the collaboration level is lower than IPD as a delivery method but higher than traditional procurement methods. Other procurement methods, such as DB, CMR, and DBB can also adopt IPD-ish characteristics.
3 RESEARCH METHOD The study investigated barriers to implement IPD in China. By face-to-face interviews during December 2016, the perceptions of industry practitioners and academics towards IPD were examined. Through personal networking of research team members, two academics and six industry practitioners representing owners, general contractors and designers in the private and public sectors agreed to have face-to-face interviews in Nanjing, China. Nanjing was selected in that it is representative of Chinese cities experiencing rapid urban development. The questions were divided into three parts: 1) background information on the interviewees; 2) discussion of the extent to which IPD has been implemented in China; and 3) investigation of the barriers and challenges to the adoption of IPD.
343 | Proceedings IGLC | July 2017 | Heraklion, Greece

Barriers and Challenges to Implement Integrated Project Delivery in China
4 RESULTS AND DISCUSSION
Two academics and six industry professionals were interviewed through face-to-face meetings. Of eight respondents, four are interested in project management, three interviewees focus on construction and one is a design consultant. Detailed backgrounds for all respondents are shown in Table 1.
Table 1: Profile
Description Frequency %
Industry participants 6 75
Academics in university 2 25
Business/interests areas
Project management 4 50
Construction 3 37.5
Design 1 12.5
Years of experience
<5 years 4 50
5-10 years 0 0
10-30 years 2 25
>30 years 2 25
Practice adopted
Early involvement of key participants (EIKP) 3 37.5
Multi-party agreement (MA) 0 0
Shared risk and rewards (SRR) 1 12.5
Collaborative decision making and control (CDMC) 0 0
Jointly developed and validated goals (JDVG) 2 25
Liability waiver (LW) 0 0
Use of BIM 3 37.5
4.1 PRACTICE ADOPTED IN CHINA
Regarding IPD adoption in China, MA, CDMC, and LW have not been implemented despite the fact that some respondents agreed with the importance of these strategies. The other component parts, such as EIKP, SRR, and JDVG, have been adopted to some extent. Use of BIM is the most common element of IPD used in construction projects in China. Results from responses are shown in Table 1. Regarding “Practice adopted,” "Frequency" means the number of interviewees who had participated in projects that implemented the relevant IPD elements.
Respondents reported that EIKP is rarely implemented in China. Though several respondents highlighted the benefits of ECI and contractors’ strong willingness to get
344 | Proceedings IGLC | July 2017 | Heraklion, Greece

Shan Li and Qiuwen Ma
involved in the design stage, two owners insisted that the majority of design problems can be handled by designers. Three respondents highlighted that the early involvement of relevant specified experts is generally observed. However, they also mentioned that these experts were contractors who did not get involved in the construction stage. Interviewees stated that MA has not been implemented. The lump sum contract is the most commonly used mechanism in China. In addition, the unit price contract is adopted with complex ground conditions. SRR is rarely adopted, though one owner mentioned that technology sharing by the architect was adopted in one project in which he had participated. From the owner's perspective, the mechanism is risky and adverse to their benefits. This is consistent with the contractors' viewpoint that the mechanism will push owners to take more risk. CDMC is rarely happening. Owner and contractor respondents specified that the owner has total power to make decisions in the early stage, in which contractors are not involved. During the construction stage, change orders still need the approval of the owner or owner’s representatives. JDVG is less observed, since project goals are developed by owners. Only two respondents claimed that consultants also got involved in project goal development. The typical responses were that the owners would not agree to LW, while the contractors are neutral to it. Almost all respondents expressed the view that LW is too risky. The use of BIM is highly adopted. However, BIM is mainly used for technical problem-solving, primarily for clash detection. In addition, respondents noted that BIM models are not shared between project participants.
4.2 BARRIERS TO IMPLEMENT IPD IN CHINA
There are several challenges that impede IPD implementation and explain its low level of adoption, including legal barriers, lack of owner willingness, lack of government support, adversarial relations, lack of IPD experts, and technical problems in the industry and among academics.
Legal barriers: Some respondents stated that IPD implementation is hindered by current construction laws and regulations. First, laws do not allow an owner to enter into a multiparty agreement with the architect and contractor as signatory parties in public projects. Second, early contractor involvement is impeded by the competitive bidding law. Regarding legal barriers, the response from one owner was as follows: “To put it simply, IPD is not easy to be adopted. It is difficult to get contractors and
trade contractors involved in the design stage because it is against the law on public bidding. Regarding multiparty contract, it is also not encouraged. The majority of contractual agreements used in China are modified FIDIC contracts, based on which two-party relationship is built rather than multiparty.”
Lack of owner’s willingness: Without the owner’s willingness, risk will never be shared among all project participants. In the IPD context, the engaged owner is one of the key factors for project success.
In regard to owner willingness, one site manager (contractor) stated: “We do not mind early involvement and multiparty contract, since our knowledge in
design can help us to solve the problems normally occurring in construction. I don’t think the architects have problems with this, either. But the owner is not willing to adopt these strategies. They are the ones who decide which business models to be used, make payment and select the parties to work for them. If they do not want to implement IPD, what can we do?”
Lack of support of government: Lack of governmental will is one of the most important barriers, especially in China. One senior project manager stated:
345 | Proceedings IGLC | July 2017 | Heraklion, Greece

Barriers and Challenges to Implement Integrated Project Delivery in China
“For example, in recent years PPP has become very popular in China, most probably due to the support of government. The central and local government all introduced new policies to encourage the business leaders to choose PPP. If we can’t have the support of government, I am sure there is still a very long way to go [for IPD adoption].”
Mistrust among project participants and adversarial relations among project participants impede communication and sharing. Good communication is built on a basis of trust. One contractor explained why mistrust blocked IPD implementation: “The current industry atmosphere is not mature enough for IPD adoption. The status
of owners and contractors are not equal. It is hard to have mutual respect and trust between them. In this situation, even though the contractors come up with some good ideas to add value, or save money for the owner, I do not think the owner can accept them.”
Lack of professional bodies to enhance IPD awareness, thus the understanding of IPD in industry, is rare. In industry, on one side, lack of understanding of IPD for industry participants, especially the construction professionals in the top management level, may result in the slow change of attitudes towards IPD and increase the concern that IPD may not be helpful to improve project performance; thus IPD is not selected as the procurement method. On the other side, even though some flexible managers want to try new business models like IPD, it is rare for industry professionals to help them achieve real integration in projects.
Little academic research relevant to IPD has been conducted. In addition, little education relevant to IPD has been conducted in China. This has led to a lack of IPD awareness among the graduates who would become the key managers and engineers in the construction industry. Although studies might have been undertaken on the policy level, studies on implementation are urgently required.
Technical barrier: Even though the use of BIM is recommended in industry, the BIM-enabled culture and platform are not well established. Without addressing the problem of interoperability among diverse software applications and the interdependencies among participants, the benefits of BIM will not be realized. One structural engineer expressed his view: “I think the core idea of IPD is integration, is sharing. If the problems related to
interoperability cannot be solved, how to achieve integration?”
5 CONCLUSIONS The findings indicate that in general the level of adoption of IPD in construction projects being executed in China is still low. Some IPD strategies, such as EIKP, SRR and JDVG, have been adopted to some degree, while other IPD components, especially the contractual requirements including MA, CDMG, and LW, have been rarely implemented. In spite of the fact that the use of BIM is commonly recommended in construction projects in China, it is mainly used to solve technical problems rather than achieving integration. It can be concluded that true IPD has not been implemented, but “IPD-ish” practices are emerging. The low level of IPD implementation may be related to poor project performance in China. The results revealed that legal issues, mistrust among key parties, and lack of owner willingness are major barriers to the use of IPD in China. To overcome the legal barriers, the support of government and attention from researchers are necessary. The research also highlights the need to improve the level of awareness of the potential benefits of IPD adoption, thereby enhancing owners’ willingness. This can be achieved through
346 | Proceedings IGLC | July 2017 | Heraklion, Greece

Shan Li and Qiuwen Ma
continuous professional development programs done by professional bodies in the built environment.
6 ACKNOWLEDGMENTS
The research is made possible by the Hong Kong General Research Fund [Grant number 9041988].
7 REFERENCES American Institute of Architecture (2009a). Experiences in Collaboration: On the Path to
IPD, AIA National and AIA California Council, Sacramento, CA. American Institute of Architecture (2007). Integrated Project Delivery: A Guide, AIA
National and AIA California Council, Sacramento, CA. American Institute of Architecture (2009b). Standard Form Multi-party Agreement for
Integrated Project Delivery. C191-2009, The American Institute of Architects (AIA), Washington, DC, Sacramento, CA.
Badenfelt, U. (2008). The selection of sharing ratios in target cost contracts. Engineering, Construction and Architectural Management, 15(1), pp.54–65.
Ballard, G. (2011). The growing case for lean construction. Construction Research and Innovation, 2(4), pp.30–34.
Cheng, R. et al. (2012). IPD Case Studies. Minnesota: AIA Minnesota and School of Architecture University.
Cohen, J. (2010) Integrated Project Delivery: Case Studies, AIA National, AIA California Council, AGC California and McGraw-Hill.
Darrington, J.W. and Lichtig, W.A. (2010). Rethinking the “G ” in GMP: Why Estimated Maximum Price Contracts Make Sense on Collaborative Projects. The Construction Lawyer, 30(2), pp.1–12.
El Asmar, M., Hanna, A.S. and Loh, W.Y. (2013). Quantifying Performance for the Integrated Project Delivery System as Compared to Established Delivery Systems. Journal of Construction Engineering and Management, 139(11), pp.1–14.
Forbes, L. H., and Ahmed, S. M. (2011). Modern construction. CRC Press,. Ghassemi, R. and Becerik-Gerber, B. (2011). Transitioning to integrated project delivery:
Potential barriers and lessons learned. Lean construction journal, 2011, pp.32–52. Garcia, A.J., Mollaoglu-Korkmaz, S. and Miller, V.D. (2014). Progress loops in
interorganizational project teams: An IPD case. In Construction Research Congress 2014: Construction in a Global Network, pp. 2011–2020.
Korb, S. et al. (2016). Overcoming “but we’re different”: An ipd implementation in the middle east. IGLC 2016 - 24th Annual Conference of the International Group for Lean Construction, pp.3–12.
Koskela, L.(1997). Lean production in construction. Lean construction, pp.1-9. Lahdenperä, P. (2012). Making sense of the multi-party contractual arrangements of
project partnering, project alliancing and integrated project delivery. Construction Management and Economics, 30(1), pp.57–79.
Lichtig, W.A. (2005). Sutter health: Developing a contracting model to support lean project delivery. Lean Construction Journal, 2(1), pp.105-112.
Lostuvali, B., Alves, T.D.C. and Modrich, R.U. (2014). Learning from the Cathedral Hill Hospital Project during the Design and Preconstruction Phases. International Journal of Construction Education and Research, 10(3), pp.160–180.
347 | Proceedings IGLC | July 2017 | Heraklion, Greece
Barriers and Challenges to Implement Integrated Project Delivery in China
Matthews, O. and Howell, G.A. (2005). Integrated project delivery an example of relational contracting. Lean construction journal, 2(1), pp.46-61.
Mosey, D. (2009). Early contractor involvement in building procurement: contracts, partnering and project management. Wiley-Blackwell, Chichester.
National Association of State Facilities (2010). Integrated Project Delivery for Public and Private Owners, National Association of State Facilities Administrators (NASFA), Construction Owners Association of America (COAA), The Association of Higher Education Facilities Officers (APPA), Associated General Contractors of America (AGC) and American Institute of Architects (AIA).
Pishdad-Bozorgi, P. and Beliveau, Y.J. (2016). A Schema of Trust Building Attributes and Their Corresponding Integrated Project Delivery Traits. International Journal of Construction Education and Research, 12(2), pp.142-160.
Rahman, M. (2012). A contractor’s perception on early contractor involvement. Built Environment Project and Asset Management, 2(2), pp.217–233.
Rowlinson, S. (2017). Building information modelling, integrated project delivery and all that. Construction Innovation, 17(1), pp.45–49.
Thomsen, C., Darrington, J., Dunne, D. and Lichtig, W. (2009). Managing integrated project delivery. Construction Management Association of America (CMAA), McLean, VA.
Walker, D.H. and Lloyd-Walker, B. (2012). Understanding early contractor involvement (ECI) procurement forms. In Twenty-Eighth ARCOM Annual Conference, Edinburgh, pp.5-7.
Whitehead, J. (2009). Early contractor involvement – the Australian experience, Construction Law International, 4(1), pp.20–26.
348 | Proceedings IGLC | July 2017 | Heraklion, Greece

Maxwell D.W., and Aitchison M. (2017). “Design-value in the Platform Approach.” In: LC3 2017 Volume II – Proceedings of the 25th Annual Conference of the International Group for Lean Construction (IGLC), Walsh, K., Sacks, R., Brilakis, I. (eds.), Heraklion, Greece, pp. 349-356. DOI: https://doi.org/10.24928/2017/0033
DESIGN-VALUE IN THE PLATFORM APPROACH
Duncan W. Maxwell1 and Mathew Aitchison2
Abstract: Lean production has responded to low-level customisation, but for residential construction, earlier customer input is required. The development of the ‘platform approach’ to industrialised house building has enabled high-level mass-customisation. Focus has been applied to ‘hard’ improvements regarding production efficiency, with less emphasis on ‘soft’ values associated with the intangible nature of design. Platform-thinking has demonstrated that new possibilities are emerging which may enable producers of industrialised housing to effectively deliver design-value to end-users.
This paper contributes to the developing platform approach, by investigating design-value for industrialised house building from an architectural perspective. Through an understanding of the product platform approach developed within the Swedish context, selected case-studies from outside construction demonstrate the possibilities that the platform-thinking concept holds, to address the research question; how can design-value be achieved in industrialised house building?
Much design-value originates from interaction between designer and user, which has been overlooked in the development of the platform approach, yet by considering its conceptual basis of platform-thinking, new possibilities emerge for the delivery of design-value in product and process. The findings will enhance the development of platforms for industrialised house building.
Keywords: Lean design, platforms, platform-thinking, design-value, architecture.
1 INTRODUCTION Architectural engagement with prefabrication has had a chequered history, resulting in a late-twentieth century division of engagements with industrialised construction: that of architecture, and that of the broader housing industry (Davies 2005). Prior to this division, in establishing a motto for the Bauhaus School of Design, Walter Gropius viewed architecture’s engagement with industry as a fundamental aspect of modern design: ‘Art and Technology – a New Unity’. In this unity, Gropius saw architecture as a profession primarily of integration, positing that ‘technology did not need art, but that art needed technology’, and consequently modern designers should seek links between art, science, technology and society (Mindrup 2014).
Seeking these links and integration, Le Corbusier’s book, Le Modulor, established a series of measurements to enhance standardisation and minimise “obstacles, sweeping them away before the majesty of the rule” (Le Corbusier 1954, p.112). Le Corbusier envisioned the architect mediating the relationship between humans and their environment, and hoped that these rules would allow domestic design to be elevated such that “a house fulfilling all its practical functions can go beyond strict utilitarianism and attain the dignity of a palace…” (Le Corbusier 1954, p.113). Le Corbusier’s thinking sets
1 PhD Candidate, Innovation in Applied Design Lab, Faculty of Architecture, Design and Planning, The University
of Sydney, Sydney, Australia, [email protected] 2 Associate Professor, Innovation in Applied Design Lab, Faculty of Architecture, Design and Planning, The
University of Sydney, Sydney, Australia, [email protected]
349 | Proceedings IGLC | July 2017 | Heraklion, Greece
Design-value in the Platform Approach
an important benchmark in considering the design-value of industrialised architecture beyond functionalism, to benefit society and provide improved living conditions for occupants. For most of the modernist architects concerned with industrialised construction, efficiency of production and design-flexibility were the primary markers of design-value, rather than this integration and mediation of contextual factors. Today, this legacy extends beyond the profession of architecture, to inform industrialised house builders’ methods, inhibiting the realisation of design-value. As Anne Beim (2004) states, this “pragmatic interpretation of industrialization seems to be the predominant feature of contemporary construction, despite the industry’s inherent potentials.” To bridge this division, and ensure improved client and producer outcomes, greater focus must be placed on design-value in industrialised house building.
2 LEAN AND VALUE
‘Lean’ has long associated value with waste (Womack et al. 2007) . Lean production’s value focus seeks to minimise waste in processes and the resulting product’s material usage, with the dominant lean construction value perspective being that of Koskela’s (2000) transformation-flow-value theory. Where value of the product is concerned, there has been an emphasis on materiality and buildability, achieving value in design through modularisation (Björnfot & Stehn 2004). Beyond modularisation and buildability, Stephen Emmitt (2011) reflects on a significant knowledge gap in lean production with regards the management of design to create value, during the early phases of projects, when significant design input is required to achieve maximum value for the customer. Integrated Project Delivery methods are helping to fill this void, together with Target Value Design (TVD), yet the basis of TVD sees value and the result of collaboration from an economic perspective (Zimina et al. 2012), while Integrated Project Delivery research has had a strong focus on the contractor’s perspective rather than the role of the designer (Volker & Klein 2010). Salvatierra Garrido and Pasquire (2011) surveyed the range of value perspectives that exist in lean construction. Their assertion is that a more holistic understanding of value is required due to its objective, subjective, relative, context dependant and dynamic nature. Into this broad understanding of value is inserted consideration of design-value to contribute a more holistic perspective of value for lean construction.
Acknowledging the variety of value perspectives that exist within Lean, this paper limits its discussion to focus on design-value, distinct from these pre-established value perspectives. Gann (2010) notes that there has been little effort to establish design quality metrics in construction, and research into this area has revealed inherent difficulties as design in its nature reveals subjective, intangible qualities. This places consideration of design-value, as a soft factor counter to lean’s often hard, technical, cost and efficiency value perspective. Steiner and Harmon (2009) determined that an holistic approach to customer value is determined by a ‘value platform’, with value increasing from a hierarchy that is based on a product layer (physical product), has a service layer added on top, and which is topped off by an intangibles layer which interacts with both product and service and which comprises: knowledge, emotion and experience. It is the author’s assertion that lean theory has investigated both the product and service layers of the value platform, yet little research has been conducted into the intangible layer, and this is the realm of design-value.
350 | Proceedings IGLC | July 2017 | Heraklion, Greece
Duncan W. Maxwell and Mathew Aitchison
3 DESIGN-VALUE
Academics and practitioners alike have often struggled to pin down a definition for the value that design brings to projects, because it deals with these sensual intangibles, is highly subjective, and subject to the changeability of taste and fashion. Dewulf and Van Meel (2004) summarise how mid-twentieth century understanding of design-value was brought about by a ‘soft’ user-focus, yet these factors proved difficult to communicate outside of academia. This failure to communicate led the quality debate to harder, more quantifiable ground by the 1980s where design-value was to be entwined with the field of architectural science, notably indoor environmental quality (IEQ). By the early 2000s, a research project was commissioned by the Construction Industry Council, to establish a Design Quality Indicator Tool (Markus 2010). This project sought to balance design research endeavours of the time that were considering productivity and efficiency in construction, by seeking the definition of design-value which would incorporate softer values and assess the impact and quality of design solutions (Gann et al. 2010). The debate remains open as to the effectiveness and validity of results (Dewulf & van Meel 2004), though this project remains one of the few design quality assessment tools to be used in the construction market and embraces design’s qualitative nature seeking a balance between subjective and objective views (Markus 2010).
Henry Plummer has described the affect that architecture can have on the human existence. Plummer considers contemporary architecture in the built form to suffer from two threats, both of which are familiar to the consideration of design-value in industrialised construction; utilitarianism and spectatorism (Plummer 2016). The former reduces design to an economic commodity based on ease of production and which standardises human engagement, while the latter strives to make design entertaining and novel, ultimately overpowering the audience. The design-value of projects utilising industrialised construction must seek to finely balance these viewpoints, and seek to impact on the human senses in the way that traditional construction can.
Continuing to consider design-value from a sensual point of view, Lisa Heschong’s book ‘Thermal Delight in Architecture’ (1979) laid out four fundamental qualities that good design must possess: necessity, delight, affection and sacredness. It is perhaps no co-incidence that Heschong’s research has been highly influential in architectural science circles which, has been a field which has not shied away from seeking to define architectural quality. Heschong’s thesis was that thermal qualities play an essential role in our understanding of space, and can be used to think about design’s impact on all senses: the necessity of our fundamental physiology, surprise causing delightful sensory stimulation, social rhythms reinforcing an affectionate emotional engagement, and the transmission of cultural knowledge described by sacredness.
Robert Woods Kennedy, an architect and critic divided residential design-value into two dominant aspects in his book of 1953, The House and the Art of its Design (Kennedy 1953). Kennedy considered residential design-value as either physical or process-based and as reliant on people and context. Seeking to balance of product and process design-value, Andrea Campioli (2011) found that a hard, traditional, and technological view of innovation in construction had isolated design from construction. This divide, as with the split pursuit of architecture and industrialised construction, has led architects to design novel and innovative solutions that are very specific to the design problem posed rather than being transferrable (a pre-requisite for design of industrialised house building). Developing a combined product and process view of design-value, led Campioli to establish that there are two opportunities for improvement of architectural quality when
351 | Proceedings IGLC | July 2017 | Heraklion, Greece

Design-value in the Platform Approach
applied to industrialised construction. One based on horizontal integration and focused on product improvement (familiar to many integrated house production companies), while the other seeks to establish networks of relationships across the supply chain to enhance the process and product. This paper contests that this networked vision for design-value fits with the concept of platform-thinking.
4 PLATFORMS AND INDUSTRIALISED HOUSE BUILDING
4.1 The Platform Approach to Industrialised House Building
In Sweden, following the lessons of mass production, enhanced by the Lean manufacturing philosophy, companies are building industrially built housing projects effectively and efficiently. Through collaboration with academia, Swedish builders have been developing a ‘platform approach’ for industrialised house building. With its origins in product-design and manufacture, the platform approach constitutes shared product assets consisting of components, processes, knowledge and relationships, which can be configured to deliver a range of product outcomes (Robertson & Ulrich 1998; Lehnerd & Meyer 1997)
These industrialised house building platforms are enabling more efficient design and delivery processes to be realised (Jansson & Viklund 2015), knowledge management practices to be refined (Jansson et al. 2016), as well as seeking opportunities for modularisation of the physical components to achieve effective mass-customisation (Johnsson et al. 2013). The platforms range from those which are highly constrained, or closed, to those which are flexible and open. Closed platforms in Sweden see customisation practiced through the arrangement of combinations of pre-designed apartment layouts, or the arrangement of pre-engineered modules to create a diversity of apartment sizes (Jansson & Viklund 2015). Open platforms see design tasks broken down and supported by visual planning techniques, where the pre-engineering occurs in wall build-ups which are configured to custom apartment designs (Lidelöw et al. 2015).
Platform approaches are reliant upon a range of contextual (place) factors and actors’ (people) experience, this variability means that it is not enough to transplant one mode of thinking directly from one culture to another. A broad, open and global perspective is required to tackle these differences and leads to the concept of platform-thinking.
4.2 Platform-thinking for Industrialised House Building
Lean-thinking has driven its value focus from the perspective of the customer, to which the producer must then deliver. ‘Platform-thinking’ extends and complements this value focus to include both the consumer and producer’s perspective, connected through a ‘platform’.
Platform-thinking, as a concept, links producers and consumers more directly than traditional businesses, altering how an offering and market are perceived and managed. A platform-based business model contrasts with traditional business models which were typically based on ‘pipes’ (Choudary et al. 2016). Pipe businesses add value sequentially through a chain of interactions; by contrast the emerging platform business model creates an ecosystem of interactions between producers and consumers which add value in an integrated manner. Today, the platform-thinking approach to value creation has a clear and profound impact on the consideration of design-value for industrialised construction, due to its ability to connect production and end-users through a design-focused platform.
Businesses that utilise platform-thinking are being increasingly understood from a virtual, information-technology perspective, for example AirBnb and Uber. When we
352 | Proceedings IGLC | July 2017 | Heraklion, Greece
Duncan W. Maxwell and Mathew Aitchison
consider the physical realm of production, the implications of platform-thinking are less widely discussed. Yet, the platform approach to industrialised construction has a number of similarities with the emerging concept of platform-thinking. Despite their contrasting physical-virtual environments. Choudary (2015) determined that platforms operate at three levels: a networked community where interactions take place, infrastructure which allows and supports interactions and data generated by and supporting future interactions. These three levels of platform-based business operations can be compared against Robertson and Ulrich’s (1998) definition of platform assets. ‘Infrastructure’ may be seen as the components and processes, the ‘data’ as knowledge, while the ‘network-community-marketplace’ is an expanded definition of the people and relationships.
The platform-thinking concept is also based on three logics: connecting, sharing and integrating (Eloranta & Turunen 2016), enabling a community of users to create value through new external interactions rather than existing internal business processes (Choudary et al. 2016). This community of users becomes the definition of a platform business, when compared to traditional business models which were defined by assets which were either resource or knowledge-based. With regards design-value, it is therefore less important that a platform business have a design (resource) ‘ready-to-go’, but rather have a network of users who can define and create design-value through interaction (utilising knowledge).
4.3 Platform-thinking and Design-value
As it is not yet clear the impact that platform-thinking may have on the design-value outcomes of industrialised house building, it is relevant to examine how platform-thinking is impacting on design and production organisations that are outside of construction, yet still deal with production, creativity and innovation.
4.3.1 Manufacturing: Quirky
‘Quirky’ is a self-described invention platform, which specialises in the design and ultimately facilitates the manufacture of products. The platform acts to facilitate interactions between people with product ideas (generating the conceptual idea), contributors (giving product feedback) and skilled experts (documenting or rendering the idea and feedback). This can happen openly on the platform, or collaborators can agree to meet within closed groups. Collaborators agree to share portions of ‘influence’, being a cut of the final product revenue. Product ideas that are worked on between collaborators, are then chosen by community members to be pitched to brand partners for product development and manufacture.
Despite its chequered history (Quirky’s start up team filed for bankruptcy during 2015, but was bought and relaunched by investors), Quirky demonstrates that a design-led, manufacturing platform is possible, drawing together diverse expertise in the form of a community of designers and manufacturers to add design-value through open collaboration in new and innovative means compared to traditional product design processes, connecting producers and designers with consumers.
4.3.2 Music: Splice
The music industry has embraced platform-thinking through a consumer-focus, as a means of tackling the growth of piracy brought about by an historic industry-focus, finally finding a degree of stability with the likes of Spotify and Apple Music. Yet there is argument that this newfound stability and consumer-focus has been at the expense of the industry, leaving a void for a balanced approach to emerge.
353 | Proceedings IGLC | July 2017 | Heraklion, Greece

Design-value in the Platform Approach
‘Splice’ has emerged to fill this void. A collaborative music creation network designed to allow musicians to showcase, distribute and collaborate on projects. Producers can share music projects in source format suitable for remixing and collaboration on popular music editing software, or simply to gather feedback from the broad global community. Operating on a subscription basis, Splice has enabled travelling musicians to gain access to a studio in the cloud, or for collaboration to occur across continents. Music collaboration platforms are by no means unique, Splice competes with a range of other platforms which focus on producers. By allowing producers to showcase their projects directly to consumers, there is potential that these collaborative platforms may end up disrupting the purely consumer-focused ‘listening’ platforms. Splice demonstrates the importance of balance in platform design to create value for both producer and consumer. The shifts in focus which created these listening, and now distribution music platforms, demonstrates the parallels that exist through construction’s historic supplier focus (Saxon 2010), which presents a similar possibility for disruption. For construction, this is especially important, as “A value-centred industry, which works for all its stakeholders, will transcend the limits of construction as currently defined” (Saxon 2010, p.335).
4.3.3 Innovation: Nosco
Increasingly, dedicated platforms for innovation are being utilised by business to generate and receive feedback on design ideas, and encourage greater collaboration. ‘Nosco’ is a social platform, which has been used by the likes of Allianz, Reebok and Volkswagen for product development, improvement, and knowledge management. The platform operates at four levels: social, workflow, measure and manage. At the social level, the Nosco platform encourages collaboration, communication and knowledge-sharing through the posting of design ideas, comments and voting for what users consider worthy or useful innovation. Workflow allows the platform participants to manage design ideas through processes which are easily repeated and refined. Analytical data is increasingly important to companies, and the Measurement aspect of the platform allows companies to understand where in their organisation ideas are being generated and how they are being received. Through the management component of the platform, ideas and knowledge can be effectively controlled and communicated around the organisation utilising the platform.
Social media has at times been maligned, yet this social view of value generation which focuses on the management of flows of information between platform users has provided clear benefit. No longer need the design review be a rare occurrence or overly time consuming, instead through the utilisation of platform-thinking, design ideas can be continually tested and refined, not just during early stages but also receiving feedback from all levels of the construction supply chain.
5 CONCLUSION Koskela and Vrijhoef (Koskela & Vrijhoef 2001) discussed the importance of
developing a new theory for construction that would promote innovation to tackle construction’s cost issues, variability and unstable supply chains, along with ingrained methods of working and knowledge management practices which hold the industry back. There is potential that platform-thinking may enable a response to some of these issues, especially with a greater design-value focus.
A focus on process design-value, has shown that greater clarity in the communication of the value of design can be achieved through an integrated, holistic perspective, resulting in design ideas which are transferrable. Product design-value must also be accommodated
354 | Proceedings IGLC | July 2017 | Heraklion, Greece
Duncan W. Maxwell and Mathew Aitchison
by the incorporation of softer, more sensual values, transporting design-value beyond efficiency and production of process and product.
While the platform approach being utilised by industrialised house builders has enabled greater design flexibility and mass customisation opportunities to be realised, the design-value outcomes of industrialised house building remains an open question. Many Swedish companies have achieved outstanding results in terms of lean, efficient production systems delivered through a platform approach, yet through this paper design-value has been shown to be a key consideration in the definition of a more holistic industrialised house building industry. Investigating the concept of platform-thinking has shown the possibilities that exist when design-value is considered with greater connectivity, sharing, and integration of producers and consumers. Potentially part of a new theory for lean construction, platform-thinking case studies have shown the concept to enable collaboration, open pathways of communication, balance perspectives, create free flows of information, as well as instituting effective knowledge management procedures. Platform-thinking businesses create an ecosystem of producers and customers, to effectively create design-value, and demonstrate the potential of a more holistic industrialised house building industry to bridge the divide that exists between architecture and production.
6 REFERENCES
Beim, A., (2004). Tectonic Visions in Architecture, Copenhagen, Denmark: Kunstakademiets Arkitektskole Forlag.
Björnfot, A. & Stehn, L., (2004). Industrialization of Construction - A Lean Modular Approach. 12th Annual Conference of the International Group for Lean Construction. Helsingør, Denmark.
Campioli, A., (2011). "Architectural quality: innovation, technological research and design". TECHNE, 1(1): 62-69
Choudary, S.P., Parker, G.G. & Van Alystne, M., (2015). Platform Scale, Platform Thinking Labs.
Choudary, S.P., Van Alystne, M. & Parker, G.G., (2016). "Pipelines, Platforms, and the New Rules of Strategy". Harvard Business Review: 54–62.
Davies, C., (2005). The Prefabricated Home, London: Reaktion Books. Dewulf, G. & van Meel, J., (2004). "Sense and nonsense of measuring design quality".
Building Research & Information, 32(3): 247–250. Eloranta, V. & Turunen, T., (2016). "Platforms in service-driven manufacturing:
Leveraging complexity by connecting, sharing, and integrating". Industrial Marketing Management, 55(C): 178–186.
Emmitt, S., (2011). "Lean Design Management". Architectural Engineering and Design Management, 7(2): 67–69.
Gann, D., Salter, A. & Whyte, J., (2010). "Design Quality Indicator as a tool for thinking". Building Research & Information, 31(5): 318–333.
Heschong, L., (1979). Thermal Delight in Architecture, Cambridge, Massachusetts, USA: The MIT Press.
Jansson, G. & Viklund, E., (2015). "Advancement of Platform Development in Industrialised Building". Procedia Economics and Finance, 21: 461–468.
Jansson, G., Viklund, E. & Lidelöw, H., (2016). "Design management using knowledge innovation and visual planning". Automation in construction, 72(3):.330–337.
355 | Proceedings IGLC | July 2017 | Heraklion, Greece

Design-value in the Platform Approach
Johnsson, H., Jansson, G. & Jensen, P., (2013). "Modularization in a housing platform for mass customization" 29th Annual ARCOM Conference, Reading, UK: 91-100
Kennedy, R.W., (1953). The House and The Art of its Design, Huntington, New York: Robert E. Krieger Publishing Co.
Koskela, L., (2000). An exploration towards a production theory and its application to construction. Helsinki, Finland: VTT Publications.
Koskela, L. & Vrijhoef, R., (2001). "Is the current theory of construction a hindrance to innovation?" Building Research & Information, 29(3): 197–207.
Le Corbusier, (1954). Le Modulor 2nd ed., London: Faber and Faber Ltd. Lehnerd, A.P. & Meyer, M.H., (1997). The Power of Product Platforms, New York, NY:
Simon and Schuster. Lidelöw, H., Jansson, G. & Viklund, E., (2015). Design Breakdown in Industrialized
Construction: Supporting Lean Manufacturing. 1st MOC Summit, Edmonton, Canada: 255-262.
Markus, T.A., (2010). "Lessons from the Design Quality Indicator". Building Research & Information, 31(5): 399–405.
Mindrup, M., (2014). "Translations of Material to Technology in Bauhaus Architecture". Wolkenkuckucksheim, Internationale Zeitschrift zur Theorie der Architektur, 19(33): 161–172.
Plummer, H., (2016). The Experience of Architecture, London: Thames & Hudson. Robertson, D. & Ulrich, K., (1998). "Planning for Product Platforms". Sloan Management
Review, 39(4): 19–31. Salvatierra Garrido, J. & Pasquire, C., (2011). "Value theory in lean construction" Journal
of Financial Management of Property and Construction. 16 (1): 8–18. Saxon, R., (2010). "The industry “formerly known as construction”: an industry view of
the Fairclough Review". Building Research & Information, 30(5): 334–337. Steiner, F. & Harmon, R., (2009). "The impact of intangible value on the design and
marketing of new products and services: An exploratory approach". Portland International Conference on Management of Engineering & Technology: 2066–2079.
Volker, L. & Klein, R., (2010). "Architect Participation in Integrated Project Delivery: the Future Mainspring of Architectural Design Firms?" Gestão & Tecnologia de Projetos, 5(3): 39–58.
Womack, J.P., Jones, D.T. & Roos, D., (2007). The Machine That Changed the World, New York, NY: Simon and Schuster.
Zimina, D., Ballard, G. & Pasquire, C., (2012). "Target value design: using collaboration and a lean approach to reduce construction cost". Construction Management and Economics, 30(5): 383–398.
356 | Proceedings IGLC | July 2017 | Heraklion, Greece

Nesensohn, C. (2017). “A Lean Construction Maturity Model for Organization”. In: LC3 2017 Volume II – Proceedings of the 25th Annual Conference of the International Group for Lean Construction (IGLC), Walsh, K., Sacks, R., Brilakis, I. (eds.), Heraklion, Greece, pp. 357–363. DOI: https://doi.org/10.24928/2017/0293
A LEAN CONSTRUCTION MATURITY MODEL FOR ORGANIZATIONS
Claus Nesensohn1
Abstract: At IGLC 2014 a Lean Construction Maturity Model (LCMM) was introduced and at IGLC 2015 its validation was presented. The LCMM offers organizations in the AEC Industry to obtain a systemic and holistic overview of their current state of LC maturity and provides them with support in their maturation. This paper intends to motivate its implementation in practice in order to test and demonstrate the whole range of benefits and implications of the LCMM. Therefore, this paper proposes a self-assessment template of the LCMM with a two-step procedure to obtain the current maturity level of any organization with regards to Lean Construction (LC). It will enable practitioners to measure the gap between where they currently are as well as develop an improvement plan to improve their LC maturity.
Keywords: Process improvement, Lean Construction Maturity, LCMM, Maturity model, Organizational assessment
1 INTRODUCTION
The construction industry faces the central challenge of improving its productivity and innovation (Larsson et al. 2013). In consequence, many organisations are seeking to achieve the required improvement through consequently applying the management philosophy of LC as one of the most prominent improvement approaches within the construction industry (Sage et al. 2012).
To embed LC it is necessary to measure the gap between the current state in the organisations and where they want to be in terms of Lean (Meiling et al. 2012). In this context, maturity models (MM) represents a very useful tool. It has been widely acknowledged that these models provide organisations with such an assessment of the current state and serve as guidance and support when implementing a change or improvement strategy (Pennypacker 2005; Perkins et al. 2010a; Perkins et al 2010b).
In previous works (Nesensohn 2014a, Nesensohn 2014b, Nesensohn 2015) presented the development and validation of a LC maturity assessment framework labelled Lean Construction Maturity Model (LCMM). The LCMM defines 5 levels of maturity in terms of LC, these are: uncertain, awaking, systematic, integrating, and challenging. Figure 1 illustrates the definition of each maturity level.
Focus groups are considered as an appropriate method, through the production of a consensus of a group that experienced the phenomena (Morgan and Krueger 1993). The data collection through the focus groups involved five and six LC key informants respectively and semi-structured interviews with 11 informants.
Semi-structured interviews were adopted to strengthen the validity of the data from the focus groups (Smithson 2008).
1 CEO and founder, Refine Projects AG, Schelmenwasenstraße 34, 70567 Stuttgart Germany, +49 179 9789624, [email protected]
357 | Proceedings IGLC | July 2017 | Heraklion, Greece
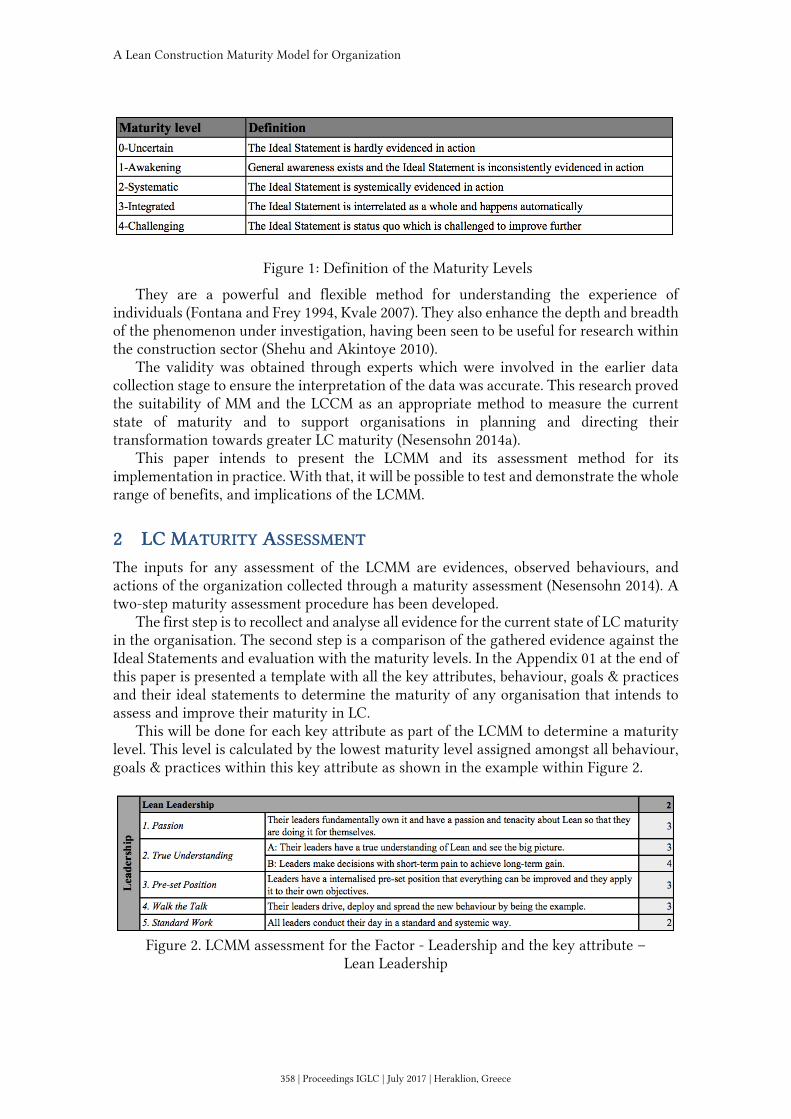
A Lean Construction Maturity Model for Organization
Figure 1: Definition of the Maturity Levels
They are a powerful and flexible method for understanding the experience of individuals (Fontana and Frey 1994, Kvale 2007). They also enhance the depth and breadth of the phenomenon under investigation, having been seen to be useful for research within the construction sector (Shehu and Akintoye 2010).
The validity was obtained through experts which were involved in the earlier data collection stage to ensure the interpretation of the data was accurate. This research proved the suitability of MM and the LCCM as an appropriate method to measure the current state of maturity and to support organisations in planning and directing their transformation towards greater LC maturity (Nesensohn 2014a).
This paper intends to present the LCMM and its assessment method for its implementation in practice. With that, it will be possible to test and demonstrate the whole range of benefits, and implications of the LCMM.
2 LC MATURITY ASSESSMENT The inputs for any assessment of the LCMM are evidences, observed behaviours, and actions of the organization collected through a maturity assessment (Nesensohn 2014). A two-step maturity assessment procedure has been developed.
The first step is to recollect and analyse all evidence for the current state of LC maturity in the organisation. The second step is a comparison of the gathered evidence against the Ideal Statements and evaluation with the maturity levels. In the Appendix 01 at the end of this paper is presented a template with all the key attributes, behaviour, goals & practices and their ideal statements to determine the maturity of any organisation that intends to assess and improve their maturity in LC.
This will be done for each key attribute as part of the LCMM to determine a maturity level. This level is calculated by the lowest maturity level assigned amongst all behaviour, goals & practices within this key attribute as shown in the example within Figure 2.
Figure 2. LCMM assessment for the Factor - Leadership and the key attribute –
Lean Leadership
358 | Proceedings IGLC | July 2017 | Heraklion, Greece

Claus Nesensohn
After that, the overall maturity level can be calculated through the multiplication of the maturity level of each Key Attribute with a weighting factor whose total sum is divided by the total sum of the weighting factors. Each Organisation must weigh the key attributes, which they find most important to them. Nevertheless, there can be no weighting factor with “0” or higher than “4”. This will generate a single score from 0-4 for the organisation’s total maturity in LC as shown in Figure 3.
Figure 3. LCMM assessment for Lean Leadership Key Factor
Since the framework identifies strengths and weaknesses in terms of LC maturity within organisations. The assessment above shown in table above illustrates gaps and areas with high and low maturity within the current state of LC maturity. AS the example shows, the assessed organization is mature in terms of Change (initial level 4) but lacks in terms of Improvement Enablers.
To obtain the greatest benefit of the maturity assessment, it is suggested to use the LCMM to guide the transformation efforts, and support decisions towards prioritising planned improvement actions with regards to the key attributes which have been rated lowest within the assessment. The information about a gap within can be used for instance to develop targeted interventions and workshops aimed at improving the maturity of a behaviour, goals and practices in the framework.
After the implementation of the improvement actions a re-assessment with the same model, will enable the organisation to monitor changes and improvements actions to identify achieved maturing and learning.
3 CONCLUSIONS Whilst in many organisational disciplines MM have been tried and tested to measure the current state of maturity in order to enable businesses to direct and plan their move towards greater maturity; there is an absence in AEC companies of such a framework for improvement processes focused on LC.
This paper meets that gap by presenting such a MM together with a developed self-assessment. The MM is labelled the LCMM. The LCMM provides a holistic view of the current state of LC maturity within respect to: lean leadership, customer focus, way of thinking, culture & behaviour, competencies, improvement enablers, processes & tools, change, work environment, business results, and learning and competency development.
359 | Proceedings IGLC | July 2017 | Heraklion, Greece

A Lean Construction Maturity Model for Organization
In so doing, this LCMM contributes to the body of knowledge in LC in two ways. Firstly, the development of a validated MM provides a verified method to measure the current state of LC maturity in organisations. Secondly, the data collected to inform the development of the LCMM reveals four main phenomena as the essence of maturity in LC. These are: 1) the crucial role of leadership in driving LC maturity, 2) the need to focus on culture and behaviour, 3) the requisite knowledge about Lean, and 4) the low resistance to change.
From a practical perspective, the research provides construction organisations with a method to identify specific strength and weaknesses of LC approaches which can support the planning and directing of transformative LC-based programmes.
Hence, the LCMM highlights gaps in capability, as well as evidence-based support to decision-making in terms of the prioritising of planned improvement actions towards greater LC maturity.
Therefore, the outputs from an assessment using the LCMM can be used to develop targeted interventions. To support such interventions workshops can be held with the aim of improving the maturity of behaviours, goals and practices associated with, specifically, a key attribute and, generally, overall LC maturity.
Finally, it is expected that the LCMM will further 'mature' through its utilisation in practice. This should be considered within a case study-driven research. The author invites organisations within the AEC Industry to test the LCMM and their current maturity and share their experience. Additionally, the generalisation of the emerged explanation of LC maturity as well as the 11 key attributes of LC can be further confirmed or disconfirmed through further empirical evidence.
4 REFERENCES Fontana, A. and J. H. Frey (1994). The art of science. "Handbook of Qualitative Research."
N. Denzin and Y. Lincoln. Sage, London, 361-377. Kvale, S. (2007). "Doing interviews." Sage, London. Larsson, J., Eriksson, P. E., Olofsson, T. and Simonsson, P. (2013). Industrialized
construction in the Swedish infrastructure sector: Core elements and barriers. Construction Management and Economics pp.1-14.
Morse, J. M. (2003). Principles of mixed methods and multimethod research design. Handbook of mixed methods in social & behavioural research. A. Tashakkori and C. Teddlie. Sage, London, 189-208.
Meiling, J., F. Backlund and H. Johnsson (2012). "Managing for continuous improvement in off-site construction: Evaluation of lean management principles." Engineering, Construction and Architectural Management, 19(2), 141-158.
Nesensohn, C. 2014a. An Innovative Framework For Assessing Lean Construction Maturity. Ph.D., Liverpool John Moores University, (available at http://ethos.bl.uk.
Nesensohn, C., D. Bryde, E. Ochieng, D. Fearon and V. Hackett 2014b. Assessing Lean Construction maturity. In: Proc. 22nd Ann. Conf. of the Int’l. Group for Lean Construction. Oslo, Norway, Aug. 25-27.
Nesensohn, C., Bryde, D., and Pasquire, C., 2015. A measurement model for lean construction maturity. In: Proc. 23rd Ann. Conf. of the Int’l. Group for Lean Construction. Perth, Australia, July 29- 31, pp. 652-660.
Pennypacker, J. S. 2005. Project portfolio management maturity model. Pennsylvania: Center for Business Practices.
360 | Proceedings IGLC | July 2017 | Heraklion, Greece
Claus Nesensohn
Perkins, L. N., L. Abdimomunova, R. Valerdi, T. Shields and D. Nightingale (2010a). "Insights from enterprise assessment: How to analyze LESAT results for enterprise transformation." Information Knowledge Systems Management, 9(3/4), 153-174.
Perkins, L. N., L. A. Initiative, R. Valerdi, D. Nightingale and S. Rifkin (2010b). Organizational assessment models for enterprise transformation. Proceedings of INCOSE International Symposium. Chicago, USA.
Sage, D., A. Dainty and N. Brookes (2012). "A ‘strategy-as-practice’ exploration of Lean construction strategizing." Building Research & Information, 40(2), 221-230.
Shehu, Z. and A. Akintoye (2010). "Major challenges to the successful implementation and practice of programme management in the construction environment: A critical analysis." International Journal of Project Management, 28(1), 26-39.
Smithson, J. (2008). Focus Groups. "The Sage Handbook of Social Research Methods." P. Alasuutari, L. Bickman and J. Brannen. Sage, London, 356-371.
361 | Proceedings IGLC | July 2017 | Heraklion, Greece

A Lean Construction Maturity Model for Organization
5 APPENDIX - – ASSESSMENT GRID OF THE LCMM
362 | Proceedings IGLC | July 2017 | Heraklion, Greece

Claus Nesensohn
363 | Proceedings IGLC | July 2017 | Heraklion, Greece

364 | Proceedings IGLC | July 2017 | Heraklion, Greece

Christine Pasquire and Paul Ebbs (2017). “Shared Understanding: the Machine Code of the Social in a Socio-Technical System" In: LC3 2017 Volume II – Proceedings of the 25th Annual Conference of the International Group for Lean Construction (IGLC), Walsh, K., Sacks, R., Brilakis, I. (eds.), Heraklion, Greece, pp. 365-372. DOI: https://doi.org/10.24928/2017/0342
SHARED UNDERSTANDING: THE MACHINE CODE OF THE SOCIAL IN A SOCIO-TECHNICAL SYSTEM
Christine Pasquire1 and Paul Ebbs2
Abstract: The emergence of the explicit need for shared understanding as an underpinning flow in lean construction has generated some debate and exposed a need to provide a better explanation. Following an investigation comprising of a total of 27 interviews and several workshops, the data identifies and connects the relationship between inappropriate understanding and constraints to flow - represented through a conceptual model. The research further identified that introducing lean construction concepts associated with the Last Planner® System caused the participants to realise the importance of a shared understanding when previously they had not raised it as a source of constraint or problem. The research concludes that a shared understanding is critical to the social aspects of a socio-technical system and needs to be precise and project specific to achieve the desired outcomes. In this way, a shared understanding can be considered to be the equivalent of a machine code in an operating system - if the understanding breaks down then so does the project delivery system.
Keywords: 8th flow; common understanding; shared understanding; lean construction
1 INTRODUCTION It was proposed by Pasquire (2013) based on a reivew of lean construction practice and theory, that a common understanding formed the eighth flow of lean construction, adding to the seven flows identified in construction physics (Bertelsen et al. 2007). Flow has long been established as a lean principle with Just in Time forming one of the pillars of the Toyota Production System (TPS) (Liker 2004). Similarly, the importance of creating a common understanding is apparent within many aspects of TPS (Pasquire 2013). Furthermore, the occurrence of actions to generate understanding is observed within the implementation of a lean construction system when examined retrospectively (Pasquire & Court 2014). However, although Pasquire & Court (2014) identify that knowledge is an important part of a common understanding, more work is needed to create a better explanation of the phenomenon and provide evidence of its existence and form. In his theoretical discussion on the eighth flow, Andersen (2016) relates understanding and Communities of Knowledge (CoK) to the semantic dimension of language, which he claims fails to determine the outer reality. He proposes that a unified, outer experience or model to enable "real external production" is needed and he continues to describe the form this might take. This description includes proposals regarding the alignment of human action through a material order approach within an organisational system in an attempt to widen the lean construction debate (Andersen 2016). The integration of human action and the
1 Professor of Lean Project Management; Centre for Lean Projects, School of Architecture, Design and
Built Environment, Nottingham Trent University, UK. [email protected] 2 Research Fellow; Centre for Lean Projects, School of Architecture, Design and Built Environment,
Nottingham Trent University, UK [email protected]
365 | Proceedings IGLC | July 2017 | Heraklion, Greece
Shared Understanding: the Machine Code of the Social in a Socio-Technical System
systematic material order approach can be described as socio-technical and aligns with the idea of lean construction as socio-technical system. Seymour (1996) introduced socio-technical systems to the IGLC body of knowledge and recognised the importance of describing how human actors bring themselves to bear upon the technical production: "… look more carefully at the theories that are actually there, in use; to find out how they are used in particular settings and for what particular purposes. That is, not to construct theories about people but to find out the theories of people (their theories) and to establish how they are used."(Seymour 1996 p3.)
Seymour's (1996) early contribution has resonated within much of the later practical and theoretical development of lean construction. His particular reference to the "ghost in the machine" (Ryle 1963 cited in Seymour 1996 p.2) is a good description of how people may appear within systems - ethereal and potentially disruptive to organisational, economic and technical engineering being directed without bottom up consideration. Clearly, the social aspect of socio-technical systems are important and the language used in conversations is critical to sharing knowledge and communicating ideas, and to how these ideas are understood and more importantly acted upon. The language becomes the means of operation for the project in much the same way that a machine code exists to turn switches on or off and facilitate interoperatibility through standardisation. A principal difference however is that machine code mostly operates through a binary on/off language whereas human language stimulates many billions of chemical reactions in the brain albeit still finally in a binary on/off mechnism. The combination of these reactions affect mood, memory and action in a very pesonal way making a homogeonized reaction across a number of individuals not only impossible but also undesirable not least for the reasons stated by Abderson (2016). The difficulty is encountered as the future of a project is invented through the language used in conversations specifically by:
• what is or what is not said
• what is or what is not heard
• what is or what is not understood, and
• what action is or what action is not taken In the simplest terms, action is what gets work done; knowledge and ideas are what
drive the design of the work to be done (from project inception to last planner). To illustrate the importance of understanding taking into consideration Seymour's suggestion that the people are consulted, research is being undertaken within an organisation seeking to transform itself into lean project delivery enterprise. Referred to as Organisation X in this paper. Part of this research has tested aspects of the relationship between all eight flows of lean construction and constraint management as part of make ready under the Last Planner® System (LPS). It is reported by Daniel (2017) that a number of path clearing activities are required at organisational level prior to implementing LPS and these informed the research. Organisation X has 150 employees and provides project management services to a UK Government Agency in a highly regulated engineering sector. The projects are generally closer to simple and straightforward than complex and difficult, but the stringency of the operating regulations adds a significant layer of complication particularly at the front end. They have several departments in addition to project management. These include Safety, Health, Environment and Quality (SHEQ); Procurement; Legal; and Human Resources (HR). These departments operate in traditional silos separated physically and operationally within a hierarchical organisational structure. The only inter-departmental team is the Management Lead Team of departmental heads, who meet weekly with Directors to review performance.
366 | Proceedings IGLC | July 2017 | Heraklion, Greece

Christine Pasquire and Paul Ebbs
2 RESEARCH METHOD
The research reported here is part of an action research project funded directly by Organisation X for a duration of 24 months. The principal purpose of the action research is the development of a bespoke lean project delivery system that makes project delivery more reliable. An early part of the project required the investigation of the current operational process of the organisation and constraints to this. There were four steps in the research process with each step supporting subsequent steps: Step 1 - Exploratory interviews; Step 2 - a set of workshops; Step 3 - Interviews specific to planning & control practices and procedures; Step 4 – Development of a conceptual model illustrating the importance of understanding to flow in project delivery.
Step 1 - the first research activity was a series of 14 exploratory interviews. The interview sample included members of each department (excluding HR) at various management levels. The interviews were conducted in private with assured confidentiality and anonymity in order to increase the degree of honesty in the responses. A semi-structured survey instrument was used to enable the exploration of issues within a common framework of topics. The interviews were audio recorded, transcribed and analysed using Thematic Analysis.
Step 2 – two mini preparatory workshops were held in advance of a one-day workshop. The purpose was to flush out the initial constraint categories in each of the 8 Flows: prior work; materials; information; equipment; people; space; external conditions; understanding. Subsequently, a one-day workshop where a refreshed sample of 15 staff members participated (including 8 people that were not included in the interview sample). The workshop began by creating a “current state” flow chart of Organisation X (non-lean) project delivery process followed by an introduction to the theory of flow in lean project delivery. This was followed by a number of breakout sessions facilitated by the research team in which each group considered how each of the 8 Flows identified by Pasquire (2013) were constrained during the delivery of projects by answering the question "What are the constraints (relating to the named flow) that disrupt project delivery here? i.e. what stops you from working?". This resulted in 12 new constraints being added and four being removed from those identified in Steps 1 & 2. A total of 142 constraints were assigned across the eight flows. These 142 constraints were then prioritised (n = 22) and the level of impact assessed by a simple voting system (n =266 total votes cast).
Step 3 – additional semi-structured interviews (n=13) took place. This included staff from business/project planning (n=4); project engineers (n=2); procurement including QS (n=3); project managers (n=2); SHEQ (n=2). Current and future planning & control practices and procedures were investigated under themes such as: what's working well/what's not working (traditionally & LPS); people's role in planning; how plans & project status get communicated; how commitments are made & the consequence of missed commitments; control mechanisms used; the accuracy of plans vs actual work underway; LPS metrics; constraints to personal work; and planning & control improvement suggestions.
Step 4 – the combination of interviews and workshops provided a significant body of rich, qualitative, primary data with many uses. For the purposes of the research reported here, this data was analysed using a lens of "Understanding" to try to provide a conceptual model of how understanding impacts upon the eight flows of a project process (Figure 2).
367 | Proceedings IGLC | July 2017 | Heraklion, Greece

Shared Understanding: the Machine Code of the Social in a Socio-Technical System
3 RESULTS
3.1 Data analysis
Table 1 illustrates a sample of the 22 constraints identified through Step 2 including their perceived Level Of Impact (LOI), the number of votes assigned and which flows were affected.
Table 1: Sample of constraints (n=22) identified from the flow walks
LOI Constraint Votes Affected Flows
1a Scope 33 Information, Ext. Conditions, Materials
1b Sign-off Process 33 Information, Material, Prior Activity
2 Resource/Priority Planning 24 Understanding, Ext. Conditions, Space
3 Commitments 23 Understanding, Ext. Conditions
13 Office Environment 6 People, Space
14 Centralised Decisions 5 People
15
Lack of Standard Work 4 Understanding
Bottleneck of Key Resources 4 People
16
Overuse of Modification Doc 3 Understanding
Security Clearance 3 Prior Activity
17 Unknown Risks 2 Understanding Each of the steps within the current state project delivery process of Organisation X were screened against each of the 22 constraints to identify specific areas of future focus.The constraints “Resource/Priority Planning” (LOI #2) and “Commitments” (LOI #3) were identified as the constraints with the biggest LOI on Organisation X’s “current state” project delivery - impacting over 50% of the 31 stages identified in the current process..
Of the total number of 22 constraints identified by the participants during Step 2, only 10 constraints (45%) were linked to the 8th Flow: Shared Understanding. However, the more the data is interrogated, the clearer the impact of “Understanding” becomes on each constraint. For example, if we unpack LOI #1a Scope, 25% of its votes were attached to "Ambiguous/Unclear Scope" and "Assumptions in Work Package". One suspects that if anything is deemed “ambiguous” or is “assumed” a shared understanding is unlikely. Similarly, if we look at LOI #1b “Sign-off Process”, the are three references to "unnecessary purchase requisitions". If unnecessary work is being carried out, a shared understanding of “next” customer requirements cannot exist because the work would not proceed if it was unnecessary.
The breakdown shown in Figure 1 is the distribution of over 1000 statements across 21 themes identified. Additional sub-codes were created within these themes. The interview content describes the way the particpants view their operational processes relative to the sub-set of questions outlined in Step 3 of the methodology. These processes largely revolve around the preparation of project documentation to facilitate designing (engineering), procuring and constructing a variety of projects. The interview transcripts were themed and coded deductively and then analysed through a lens of understanding.
Figure 1: Thematic analysis results from Step 3
368 | Proceedings IGLC | July 2017 | Heraklion, Greece
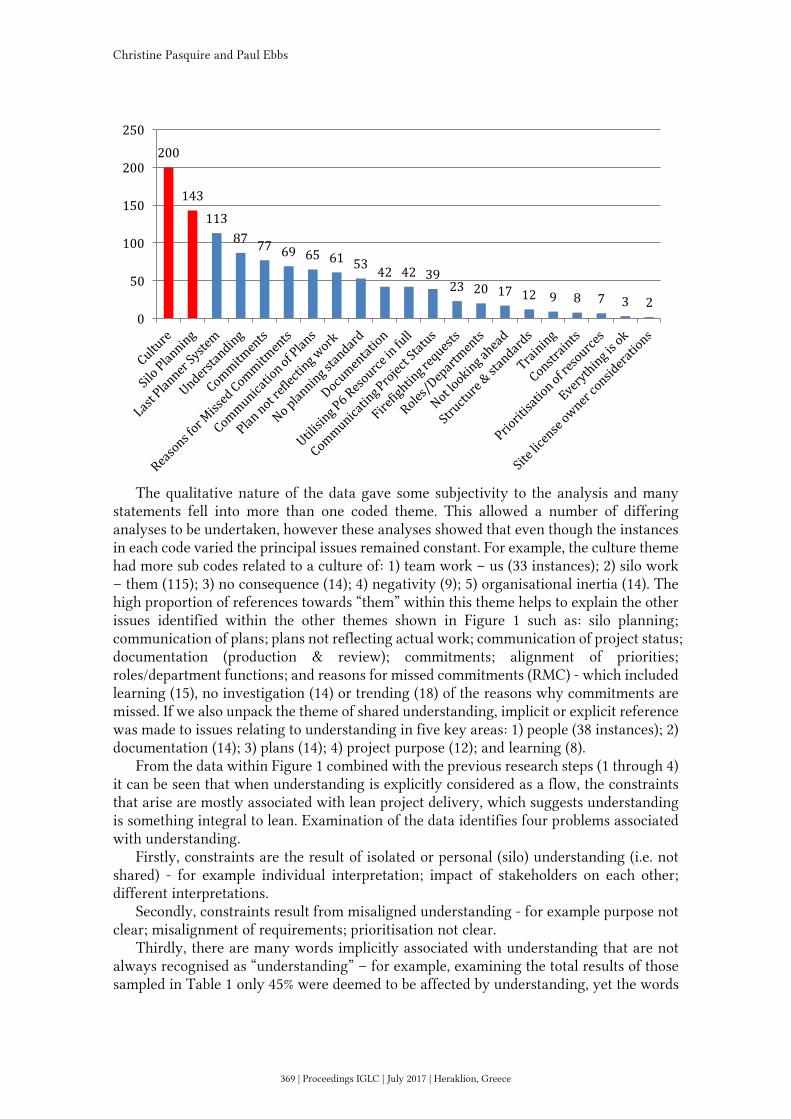
Christine Pasquire and Paul Ebbs
The qualitative nature of the data gave some subjectivity to the analysis and many
statements fell into more than one coded theme. This allowed a number of differing analyses to be undertaken, however these analyses showed that even though the instances in each code varied the principal issues remained constant. For example, the culture theme had more sub codes related to a culture of: 1) team work – us (33 instances); 2) silo work – them (115); 3) no consequence (14); 4) negativity (9); 5) organisational inertia (14). The high proportion of references towards “them” within this theme helps to explain the other issues identified within the other themes shown in Figure 1 such as: silo planning; communication of plans; plans not reflecting actual work; communication of project status; documentation (production & review); commitments; alignment of priorities; roles/department functions; and reasons for missed commitments (RMC) - which included learning (15), no investigation (14) or trending (18) of the reasons why commitments are missed. If we also unpack the theme of shared understanding, implicit or explicit reference was made to issues relating to understanding in five key areas: 1) people (38 instances); 2) documentation (14); 3) plans (14); 4) project purpose (12); and learning (8).
From the data within Figure 1 combined with the previous research steps (1 through 4) it can be seen that when understanding is explicitly considered as a flow, the constraints that arise are mostly associated with lean project delivery, which suggests understanding is something integral to lean. Examination of the data identifies four problems associated with understanding.
Firstly, constraints are the result of isolated or personal (silo) understanding (i.e. not shared) - for example individual interpretation; impact of stakeholders on each other; different interpretations.
Secondly, constraints result from misaligned understanding - for example purpose not clear; misalignment of requirements; prioritisation not clear.
Thirdly, there are many words implicitly associated with understanding that are not always recognised as “understanding” – for example, examining the total results of those sampled in Table 1 only 45% were deemed to be affected by understanding, yet the words
200
143
11387 77 69 65 61 53 42 42 39
23 20 17 12 9 8 7 3 20
50
100
150
200
250
369 | Proceedings IGLC | July 2017 | Heraklion, Greece

Shared Understanding: the Machine Code of the Social in a Socio-Technical System
ambiguous, unclear, assumptions etc. are used in the description of the “Scope” constraint (LOI #1a) and unnecessary purchase requisitions to the “Sign-off Process” (LOI #1b). These two constraints were perceived to have the biggest LOI (level of impact) on Organisation X project delivery but not implicitly recognised as relating to the flow of “Understanding.”
Finally, and perhaps most damagingly, constraints result from understanding based on assumptions - for example commitments made on behalf of others; incorrect information used; dates moved without consultation; plans made by 3rd parties without consultation.
Having codified and revealed the main constraints to the general company operations through interviews and workshops, the related constraints to project delivery at Organisation X specific to the 8 Flows of lean construction were identified. A conceptual model of how the flows interacted with the delivery process is illustrated in Figure 2. The 8th Flow: Shared Understanding – solid purple block - is shown at the heart of the seven flows identified by Bertelsen et al (2007). The tip of the arrow at each of issues relates to where the shared understanding must be pulled from - i.e. shared understanding must be pulled from each of the other 7 Flows. The 7 Flows are shown in a separate solid coloured block with purple outline with their related constraining issues arranged as a network. Shared understanding must be then also be pulled from each of the elements within the network of each of the 7 Hard Flows.
The model provides examples that show that a shared understanding not only underpins the knowledge and consenquent action associated with each of the 7 Hard Flows but that it permeates the project processes in this study.
4 DISCUSSION AND CONCLUSIONS The title of this paper refers to machine code. This phrase is used to provide a context for the importance of understanding by equating the impact of poor understanding to that of poor machine coding. Information technologies such as Computer Aided Manufacturing use machine code to direct machines. These codes require significant attention and design to ensure the machine output is the desired one and the effort to ensure interoperability between machine codes becomes increasingly complex as the number of machines to be co-ordinated increases. This requires a need for the sharing and integration of machine codes to be explicitly considered if interfaces are to be successful. We tried to illustrate through the this paper how understanding acts like a machine code by collecting examples of where the absence of a an appropriate level of understanding constraints work flow in a project organisation.
Figure 2: Conceptual model of flow and understanding
370 | Proceedings IGLC | July 2017 | Heraklion, Greece
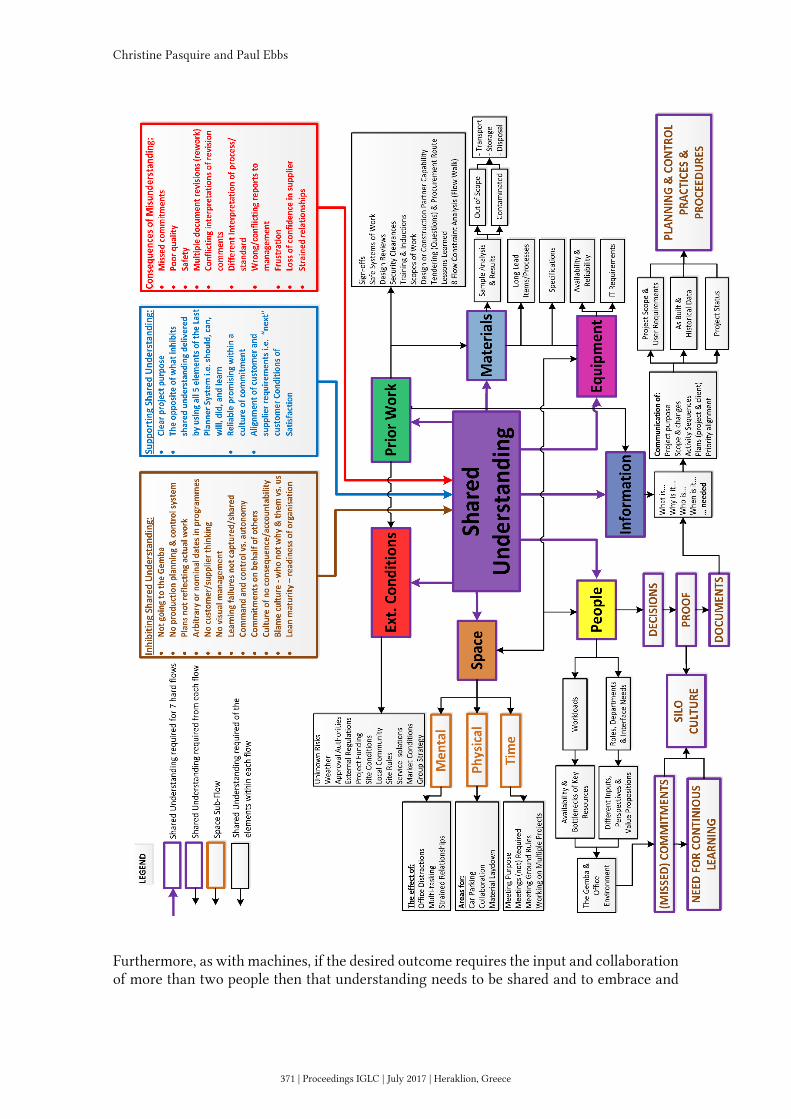
Christine Pasquire and Paul Ebbs
Furthermore, as with machines, if the desired outcome requires the input and collaboration of more than two people then that understanding needs to be shared and to embrace and
371 | Proceedings IGLC | July 2017 | Heraklion, Greece

Shared Understanding: the Machine Code of the Social in a Socio-Technical System
engage the distributed knowledge in a way that optimises those outcomes. As the findings listed here show, even in a small and simple context there are many opportunities for this to fail. Whilst the attempt to match flow with specific constraints within a single case study does not provide a generalised solution, we believe it does provide some evidence of the disruption caused by inappropriate understanding and that these inappropriate understandings include misalignment, personal (non-shared or siloed), implicit recognition of words related to understanding, and assumption. It seems that people within a traditional organisation like the case study company, are not aware that inappropriate understanding causes many of the problems they face. It also seems that once people become aware of lean practices they also become aware of the need to create a shared understanding because they try to identify root causes of difficulty and disruption. These lean practices seem to provide a system which actively and continually removes barriers and problems through a structured approach to work and learning. The shape and nature of the shared understanding not only needs to be created for each project but must be nurtured and refreshed along the project timeline especially as things change frequently and team members come and go, sometimes unexpectedly, for example as a result of illness and temporary cover. For this latter reason it equates to a flow or moving phenomenon.
We conclude that the social and technical parts of the lean construction system must operate together. We propose however, that a shared understanding is not the entirety of the social part of the system. Leadership and motivation are also significant but that these need to be engaged to foster and preserve shared understanding.
5 REFERENCES Andersen, L., (2016). “Design and Engineering – Material Order” Proc. 24rd Ann. Conf.
of the Int’l. Group for Lean Construction, 21-23 July, Boston, MA, sect.1 pp. 83-92, Bertelsen. S, Henreich. G, Koskela. L, and Rooke, J. (2007) Construction Physics. Proc 15th
Ann Conf. of the Int’l. Group for Lean Construction,, July 2007, Michigan, USA pp 13-26
Liker, J. K. (2004). The Toyota Way: 14 management principles from the world's greatest manufacturer. New York: McGraw Hill
Pasquire, C.L. (2012), The 8th Flow - A Common Understanding; Proc 20th Ann Conf. Of the Int'l Group for Lean Construction, July 2012, San Diego, USA
Pasquire C.L. & Court, P.F (2013) An Exploration of Knowledge and Understanding - the Eighth Flow. Proc 21st Ann Conf. Of the Int'l Group for Lean Construction, July 2013, Forteleza, Brazil
Ryle, G. (1963). The Concept of Mind, Penguin, Harmondsworth. Seymour. D. (1996). Developing Theory in Lean Construction. Proc 4th Ann Conf. of the
Int’l. Group for Lean Construction, Birmingham, UK pp 1- 25.
372 | Proceedings IGLC | July 2017 | Heraklion, Greece

Pollesch, P., Rovinsky, A., Alvarado III, R., and Alves, T.C.L. (2017). “House of Cards – a Simulation of Lean Construction Principles” In: LC3 2017 Volume II – Proceedings of the 25th Annual Conference of the International Group for Lean Construction (IGLC), Walsh, K., Sacks, R., Brilakis, I. (eds.), Heraklion, Greece, pp. 373–380. DOI: https://doi.org/10.24928/2017/0212
HOUSE OF CARDS – A SIMULATION OF LEAN CONSTRUCTION PRINCIPLES
Paul Pollesch1, Alexander Rovinsky2, Raul Alvarado III3, and Thais da C. L. Alves4
Abstract: The "House of Cards" simulation was developed to stimulate discussion and improve the application of lean production concepts (5S, flow, waste, kaizen, transparency, and collaboration) to construction engineering and management. It is a simple, scalable, hands-on exercise that enables a facilitator to lead teams to intuitively grasp lean concepts and their benefits to construction processes. The simulation requires minimal resources for each team: 3-4 players, a deck of playing cards, a timer, and a playing surface. “House of Cards” presents six phases of gameplay, and progresses from a worst-case scenario to an optimized ideal. The objective is to play the cards as quickly as possible to construct a 13-story building. As in construction, there is a logical sequence of work required. Lower floors must be built before upper floors, structural work must precede mechanical, and mechanical must precede finish work. This simulation was developed with a construction project context, but can easily be adapted to other industries. The analogies can be tailored to meet other industrial processes, and the floors can be changed to different parts of assembly or production lines.
Keywords: Lean construction, simulation, continuous improvement, 5S, flow improvement.
1 INTRODUCTION This paper presents a simulation to introduce students or workers in the architectural, engineering, and construction (AEC) industry to lean principles, as applied to construction engineering and management. The goal was to develop a simple, scalable, repeatable, hands-on group exercise that would enable a facilitator to lead groups to intuitively understand the benefits of lean concepts applied to construction processes. Basic lean concept definitions are included so that participants unfamiliar with lean production, and without the guidance of a facilitator, can still benefit from the simulation whether as an observer or watching the video developed by the authors.
Simulations have become one of the most important ways to teach lean concepts over the years. Academics, practitioners, and consultants use simulations to engage people and enhance the learning experience in an applied setting. Tsao et al. (2012) identified the use of simulations across academic curricula in three different universities. Simulations help bridge the gap in conceptual understanding when paired with readings and cases that provide additional background to the implementation of lean in real
1 Civil Engineer Corps, United States Navy. Currently enrolled as a graduate student at San Diego
State University. [email protected] 2 Civil Engineer Corps, United States Navy. Currently enrolled as a graduate student at San Diego
State University. [email protected] 3 Graduate Student, San Diego State University, [email protected] 4 Associate Professor, J.R. Filanc Construction Engineering and Management Program, Dept. of Civil,
Constr., and Env. Engineering, San Diego State University, USA, [email protected]

House of Cards – a Simulation of Lean Construction Principles
construction projects. Simulations are constantly being created and re-invented to support lean education. Mitropoulos et al. (2014) developed a simulation to automate the 'Parade of Trades', which was originally developed by Tommelein et al. (1999) to evaluate the effects of variability on a sequence of interdependent construction activities. Rybkoswki et al. (2016) have upgraded the “marshmallow simulation” to teach concepts related to target value design. Similarly, teams of practitioners have developed the Villego simulation to mimic the implementation of the Last Planner System in the construction of houses (Villego 2016).
The 'House of Cards' simulation was developed at San Diego State University, where students were challenged to develop new forms of teaching lean principles. This paper describes basic aspects considered by the first three authors while developing the simulation, how it was implemented, and how they collected feedback and identified areas for improvement along the way.
2 LEAN PRINCIPLES USED IN THE SIMULATION
The “House of Cards” simulation exposes participants to the following lean concepts: waste reduction, flow improvement, continuous improvement (kaizen), and 5S. Additionally, collaborative teamwork, which is also related to the lean principle ‘improving transparency’, is used in phases 3-6 to improve performance. After starting the game in Phase 1 with the worst-case scenario, phases 2-6 introduce one improvement at a time to demonstrate how that one change can improve team performance. Players will observe that cycle times are reduced as a result of the continuous improvement made from phase to phase.
The simulation was developed to demonstrate performance gains realized by improving flow and reducing waste. Continuously improving flow and reducing wastes are important principles of lean thinking (Womack and Jones 2003), and have been applied to construction (Koskela 1992). The first of Koskela's eleven lean construction principles applied to production system design is the 'reduction of non-value-adding activities'. This principle is tightly related to the other principles due to their symbiotic relationships. For example, 'simplify by reducing the number of steps, parts, and linkages' contributes to 'reducing waste', ‘reducing variability’, and ‘increasing process transparency’.
There are many ways to eliminate waste in production processes. Improving process transparency is a key principle that improves understanding of the production system, the ability to identify and mitigate wastes, and the ability of team members to effectively collaborate. Visual representation and management of transparent processes allow system wastes to be more readily exposed and eliminated (Galsworth 2005). The 'House of Cards' simulation uses multiple steps to gradually improve process organization and improve flow. This effort is very much related to the 5S process (Sort, Set in order, Shine, Standardize, and Sustain), in which the goal is to promote an uncluttered and disciplined environment (Galsworth 2005). The use of 5S in this simulation improves transparency through process simplification and by reduction of waste. Monitoring and recording team cycle times for each of the six phases leads participants to predict, evaluate, and discuss the improvements realized through application of lean principles.
Collaborative teamwork is another principle used in the simulation. In the AEC industry, short-term teams are assigned to individual projects, and seldom have the advantage of long-term relationships to foster alignment, trust, and collaboration. Each project team must make efforts to quickly align the various stakeholders and build the

Paul Pollesch, Alexander Rovinsky, Raul Alvarado III and Thais da C. L. Alves
trust needed for true collaboration. Design-build (DB) contracts and integrated project delivery (IPD) projects have contributed to improving collaboration among project stakeholders. IPD projects provide an operational system to enhance collaboration, such as physical collocation in 'big rooms', pain- and gain-sharing, pull planning sessions, etc. (Lichtig 2005). Integrated forms of agreement (IFOA) replace the traditional construction contract on IPD projects and make participants accountable to each other for the success of the project. Successful collaboration supports achieving target goals, boosting profits, and improving flows.
3 THE HOUSE OF CARDS SIMULATION
“House of Cards” presents six phases of gameplay, and progresses from a worst-case scenario to an optimized quick process. The objective is to play the cards as quickly as possible to construct a 13-story building. The three players represent three trade contractors, each responsible for different construction activities: structural, mechanical, and finish work. As in construction, there is a logical sequence of work required. Lower floors must be built before upper floors, structural work must precede mechanical, and mechanical must precede finish work. The game is complete when the finish contractor plays the last card (King of Hearts) representing completion of the finish work on the 13th floor. Each floor of the building, visualized by a row of cards, is represented by face value of the card, e.g., ace = first floor, 2 = second floor, and so on, with the king = 13th floor (Figure 1). If desired, the analogies can be tailored to represent processes and context of other industries, such as an assembly line.
The simulation can be used for a small team of 3 people, or multiple teams of 3-4 members each. The set-up for each team includes: 3-4 players, one table or playing surface, a standard deck of 52 playing cards, 30-60 minutes to complete all six phases, and a timer or stopwatch. The timer is used to monitor cycle time for each phase of play. Cycle time is the main indicator in this simulation, and is the basis for evaluating performance improvements. The simulation is easily scalable, from a small group of 3 players, to large groups of 50, 100, or more. Large groups need only additional decks of cards and playing surfaces. The simulation uses the standard 52-card deck of playing cards, separated as follows: Player 1 structural contractor (clubs); Player 2 mechanical contractor (diamonds); Player 3 finishes contractor (hearts); spades are considered as waste or non-value-adding activities.
Phase 1 is a worst-case scenario that demonstrates a complete lack of organization and order on a construction site. Cards are shuffled in a loose pile, face up, on the table. The material laydown area is a complete mess, unsorted, and contains 25% waste represented by the spades cards, which are not needed but are mixed with the other cards in the deck (Figure 1). Players select their cards from the loose pile, and then place the cards from lowest (ace) to highest (king) within their assigned construction area. The game is complete when the king of hearts is placed as the last card. Screenshots of the videotaped simulation are shown in Figure 2.

House of Cards – a Simulation of Lean Construction Principles
a) b)
Figure 1: a) Phase 1 set up; b) Order of Play
In phase 1, players are not allowed to gather or sort the cards. Rather, they are restricted to finding and using only the one card that they can play from the pile. Additionally, the players may not talk, or work together in any way. This phase should easily prove to be the slowest, and is designed to frustrate the players so that they consider how to improve performance time. Players play phase 1 twice, once to practice and get familiar with the simulation and the second time to go for the best time possible, which will become the baseline cycle time.
After Phase 1, the post-play discussion includes the following questions:
• How long did your team take to complete Phase 1? o Did you do better the second time? | Is this faster/slower than expected?
• Where there any QC problems?
• What are some suggestions to improve performance (time)? During Phase 2 (improved site laydown) all the cards are facing up in a loose, mixed
pile. Now players may gather all of their cards and sort their cards during play. No talking, collaboration, or teamwork is allowed in this phase. After Phase 2 (and all remaining phases) the following post-play discussion questions are asked alongside those used in Phase 1:
• Was your team performance faster or slower?
• Which lean concepts were used to improve performance?
• What might you change to further improve performance? In Phase 3 (collaboration) all cards are facing up in a loose, mixed pile. As in phase 2,
players may gather and sort their cards during play. Now, they may also talk and collaborate with each other. The same post-play questions are used to analyse Phase 3.
During Phase 4 (reducing waste), all spades are set aside to the edge of the playing area. The remaining cards are set face-up in a loose, mixed pile. As before, players may gather and sort their cards and collaborate to help each other. The same post-play questions are used to analyse Phase 4.
Phase 5 (improved material management) involves setting aside the spades as in Phase 4. This time though, play starts with three separate piles (sorted by suit, but not rank). Players may gather and sort their cards and collaborate to help each other. The post-play questions are used to analyse Phase 5.
Finally, in Phase 6 (optimized resource management), all the rules of Phase 5 apply with the additional organization of the three same-suit piles in order of face value, that is, they are pre-ordered in the sequence in which they will be used. The post-play questions
Loose pile of 52 cards, mixed up, face-up
BUILDING CONSTRUCTION
Timer
♦M
echa
nica
l Car
ds ♦
♥Fi
nish
Car
ds ♥
♣St
ruct
ural
Car
ds ♣
- Cards are placed from lowest (Ace) to highest (King) according to their suit.
- Each floor of the building is represented by face value of the card (ace = first floor, 2 = second floor, and so on)
- ♣ Structural cards may be placed independently of other suits, but must be placed in sequence from Ace (low) through King (high)
- ♦ Mechanical cards must also be placed in a Ace-King sequence, and are only placed AFTER the structural card on any given floor.
- ♥ Finish Cards are also placed in a Ace-King sequence, and can only be placed AFTER both the structural and mechanical cards are placed for a given floor.
ORDER OF PLAY:
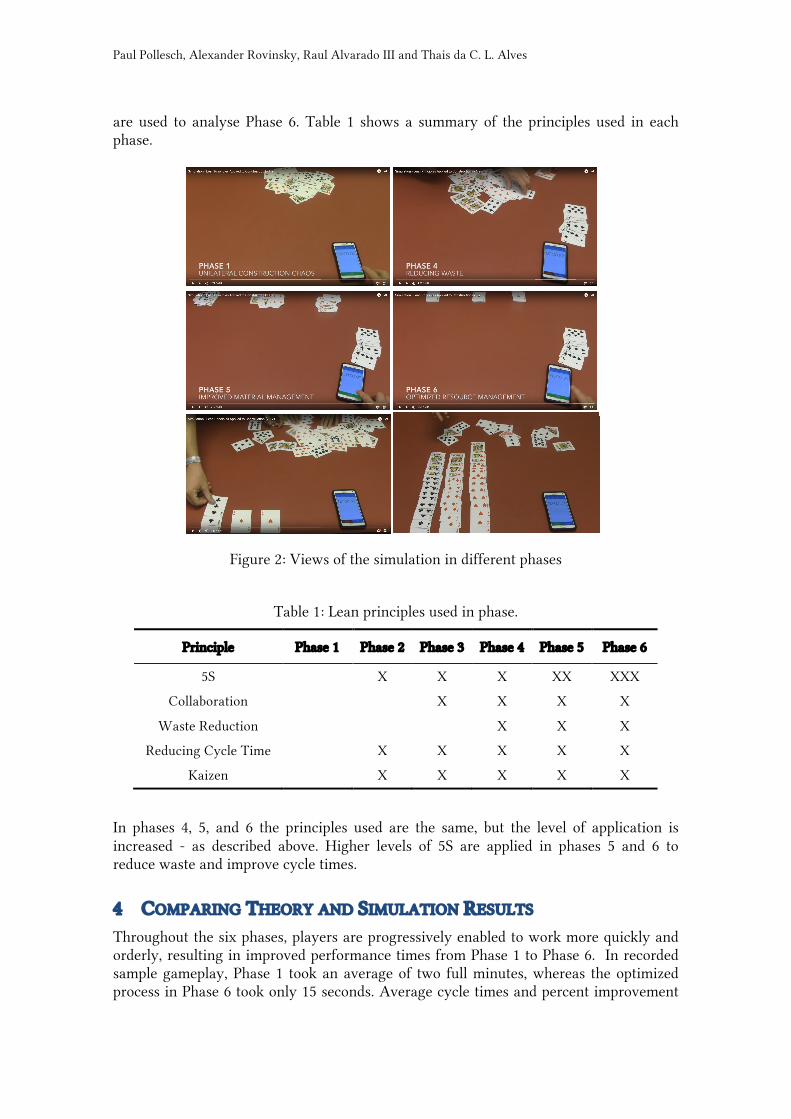
Paul Pollesch, Alexander Rovinsky, Raul Alvarado III and Thais da C. L. Alves
are used to analyse Phase 6. Table 1 shows a summary of the principles used in each phase.
Figure 2: Views of the simulation in different phases
Table 1: Lean principles used in phase.
Principle Phase 1 Phase 2 Phase 3 Phase 4 Phase 5 Phase 6
5S X X X XX XXX
Collaboration X X X X
Waste Reduction X X X
Reducing Cycle Time X X X X X
Kaizen X X X X X
In phases 4, 5, and 6 the principles used are the same, but the level of application is increased - as described above. Higher levels of 5S are applied in phases 5 and 6 to reduce waste and improve cycle times.
4 COMPARING THEORY AND SIMULATION RESULTS Throughout the six phases, players are progressively enabled to work more quickly and orderly, resulting in improved performance times from Phase 1 to Phase 6. In recorded sample gameplay, Phase 1 took an average of two full minutes, whereas the optimized process in Phase 6 took only 15 seconds. Average cycle times and percent improvement

House of Cards – a Simulation of Lean Construction Principles
from the baseline are based on a small sample size of 3 iterations per phase, as played by the authors and recorded in Table 2.
Table 2: Simulation results (data based on 3 iterations)
Iteration Average Cycle Time (seconds)
Improvement from previous phase
Improvement from baseline
1 120 N/A N/A
2 74 38% 38%
3 58 22% 52%
4 52 10% 57%
5 31 40% 74%
6 15 52% 88%
The above data (Table 2) supports the hypothesis that the application of lean principles (Table 1) will improve performance (cycle time) between phases of play. Some of the changes between phases are quite noticeable, and the overall improvement of each phase over the baseline (phase 1) is significant. In phase 6, players start with all suits and cards in order, which may be equated to near-perfect execution of a perfect plan (e.g., schedule, logistics, prefabrication) with perfect resource management (labor, resources, equipment). Arguably, this is unlikely to be achieved in the real-world, but is the goal and objective of kaizen.
The authors had expected improvements in collaboration to result in a larger performance gains than was observed. In phases 1-2, players act primarily in self-interest and fight to find and employ their own resources, without regard to success of the overall project team (local vs. global optimization). This lack of collaboration could result in hindering the work of other players struggling with mixed resources in a tight workspace. However, increasing collaboration resulted in less performance gain than application of 5S.
Site preparation, organization, and optimized resource management were the biggest factors for improvement in this lean simulation. 5S reduced waste and contributed to improved performance in each phase. The significant amount of disorder and chaos (mixed resource pile) with which players start in phases 1-4, causes the players to waste time on non-value-adding activities to sort and order the resources prior to placing them. However, even this 'wasted time' of gathering and sorting the cards (instead of finding them individually) improves the production flow. This same principle (5S applied to resource management) is important to management of construction sites - starting with something as basic as daily housekeeping.
The best workflows are realized when tasks and resources are organized and ordered before work begins. Unnecessary resource waste (spades) is present in the first three phases of play, and slows production due to players needing to filter it out of the construction process. In phases 4-6, the non-value-added, unnecessary materials (spades) are eliminated from the simulation. The remaining wastes in phases 4 and 5 are of the “non-value-added, but necessary type”, such as sorting (double-handling) and transportation of the value-adding resources. Only in phase 6 are wastes completely eliminated due to starting with an optimized system (optimized supply system).

Paul Pollesch, Alexander Rovinsky, Raul Alvarado III and Thais da C. L. Alves
5 SIMULATION TESTING AND FEEDBACK
Social media provided the primary means to share the simulation and solicit feedback. The “House of Cards” simulation video was uploaded to YouTube (https://www.youtube.com/watch?v=cL60KAm0K-I) and then shared with peers and professional social networks to solicit feedback. Specific attempts were made to engage professionals in the lean and construction industries, such as members of the Lean Construction Institute, ASCE: Construction Engineering, and the US Navy’s Civil Engineer Corps. Feedback to date has been promising, and several suggestions have already been implemented in the current version of the simulation.
One commenter familiar with teaching lean construction approved of the simulation’s structure, and recommended several modifications for larger groups. He noted that each team could have a fourth member to serve as observer, recorder, and timekeeper, and that another volunteer could consolidate teams’ performance times for comparison. This will help keep each team competitively engaged in the simulation for larger groups (e.g. 30, 50, 100 people).
When presented to people unfamiliar with lean concepts in a small group setting, players commented on needing clarification of the rules, and a basic definition of the lean concepts. They noted that it was easier to play through the phases after watching the video simulation. Review of gameplay also indicated the need for a poka-yoke in the game to prevent players from building ahead of where they were allowed to build (such as completing finish work before structural work on a given floor). A potential idea for a poka-yoke is to use a “grid system” in place on the table to maintain an higher level of organization, and prevent one suit from “getting ahead” of another suit.
5.1 Feedback Analysis and Recommendations for Future Use
This simulation is intended for use by a facilitator, experienced in lean construction principles, who will guide group discussions and explore concepts between phases of play. The original concept was for teams of 3 players. For larger, or more competitive settings, the team size may be increased to 4 players (as recommended), with the 4th member being the official observer, timer, and recorder. In addition to the group facilitator, an assistant or designated volunteer may consolidate group performance times using a computer and spreadsheet application. This will facilitate quick compilation of times to keep groups competitively engaged, enable comparison of fastest, slowest, and average times, and serve to document the ‘pursuit of perfection’ as the game progresses.
Finally, simple lean principle definitions were added to the video to help those who do not have any lean experience. If the simulation proves popular, a customized ‘lean construction’ card deck and playing mat could be designed. Based on the feedback received, this simulation can be applied in facilitated group environment, with minimal investment costs (a deck of cards for each team).
6 CONCLUSIONS This paper presented a new simulation to teach lean construction principles. The simulation is simple, yet easily able to convey the application of lean principles to the AEC community. Organization, collaboration, and the implementation of small changes (kaizen) lead to waste reduction and promote continuous improvement.

House of Cards – a Simulation of Lean Construction Principles
The entire simulation takes between 30 to 60 minutes to play, depending on how much discussion is held between rounds. It may be used as an ice-breaker in meetings or classes to educate participants about the power of lean principles. Readers are invited to visualize the simulation on YouTube as a complement to this paper, put it in practice, and improve it as they see fit. The authors welcome constructive feedback for future improvements.
7 ACKNOWLEDGMENTS
Special thanks are rendered to everyone who has reviewed the various versions of this simulation and provided feedback to the authors to support its continuous improvement.
8 REFERENCES Galsworth, G. D. (2005). Visual Workplace: Visual Thinking. Visual-Lean Enterprise
Press, Portland, USA. Koskela, L. (1992). Application of the New Production Philosophy to Construction. CIFE:
Center for Integrated Facility Learning,Technical, Stanford University, Palo Alto, 81. Lichtig, W.A. (2005). “Sutter Health: Developing a contracting model to support Lean
Project Delivery.” Lean Construction Journal. 2(1), 30-45, Mitropoulos, P., Alves, T., and Walsh, K.D. (2014). "Parade Plus: A Simulation Game for
Investigating and Teaching Strategies for Managing Production Variability and Dependence." Construction Research Congress 2014, ASCE, GeorgiaTech, May 19-21 2014, 409-417.
Tommelein, I. D., Riley, D. R., Howell, G. A. (1999). “Parade game: Impact of work flow variability on trade performance.” Journal of Construction Engineering and Management 125(5): 304-310.
Tsao, C.C.Y., Alves, T.C.L., and Mitropoulos, P. (2012). "Different perspectives on Teaching Lean Construction." 20th Annual Conference of the International Group for Lean Construction (IGLC-20). San Diego State University, San Diego, CA, July-18-20, 2012, pp. 621-630
Villego (2016). Last Planner Simulation. Available at www.villego.com (12/14/16) Womack, J.P., and Jones, D.T. (2003). Lean Thinking: Banish Waste and Create Wealth
in Your Corporation, Simon and Schuster, New York, 396 pp. Yamagar, A. C., and Ravanan, P. M. (2010). “Material Management by using Lean
Manufacturing Principles a Case Study.” Advanced Manufacturing Engineering, Quality, and Production Systems, 17.

Rendek, Adam (2017). “Re(de)fining Project Delivery with Life Cycle BIM” In: LC3 2017 Volume II – Proceedings of the 25th Annual Conference of the International Group for Lean Construction (IGLC), Walsh, K., Sacks, R., Brilakis, I. (eds.), Heraklion, Greece, pp. 381–388. DOI: https://doi.org/10.24928/2017/0307
RE(DE)FINING PROJECT DELIVERY WITH LIFE CYCLE BIM
Adam Rendek1
Abstract: This paper explores a shift in the Architecture, Engineering, Construction (AEC), and Capital Facilities Industries in which all stakeholders of the building life cycle unite around forming common goals. We are witnessing changes in these industries due to recent economic, cultural, and technical development, and these changes provide an opportunity to re-think and re-define project delivery more efficiently.
We will review influencing stakeholder groups and their relationships or the lack of. The paper will also offer specific examples where BIM (Building Information Modeling) can directly support greater collaboration and promote the complete building information life cycle. The assumptions are based on the experiences of working on large capital projects in California, although the references to literature from the past few years highlight international trends as well.
Assumptions and conclusions in this paper are based on action research and interviews with stakeholders of large public organizations during the implementation of building owner side BIM programs.
Keywords: Project delivery, collaboration, BIM, communication, complete building information life cycle.
1 INTRODUCTION
1.1 Changes in project delivery
Changes in popular project delivery methods have been promoting collaboration for decades, however significant misalignments continue to exist between stakeholder groups, resulting in inefficiencies. In parallel, today's technology can effectively support communication and coordination, but technology alone cannot solve these issues unless we also address stakeholder organization.
In this paper, we will look at current project delivery types, the connection between stakeholders and trends in technology adoption, which will provide a better understanding of project organization. Building on that, we will use practical examples where BIM can directly support collaboration.
There are many types of project delivery. Let us explore three in use in the USA to illustrate the evolution of project delivery from the perspective of collaboration.
• Design-Bid-Build (D/B/B) project delivery has separate phases with limited overlap and collaboration between them.
• Design-Build (D/B) has been established to allow early constructability input. Designers and construction professionals work together in this project delivery to achieve a coordinated result.
1 BIM/ Engagement Manager, DPR Construction, San Francisco, CA, USA, [email protected]
381 | Proceedings IGLC | July 2017 | Heraklion, Greece
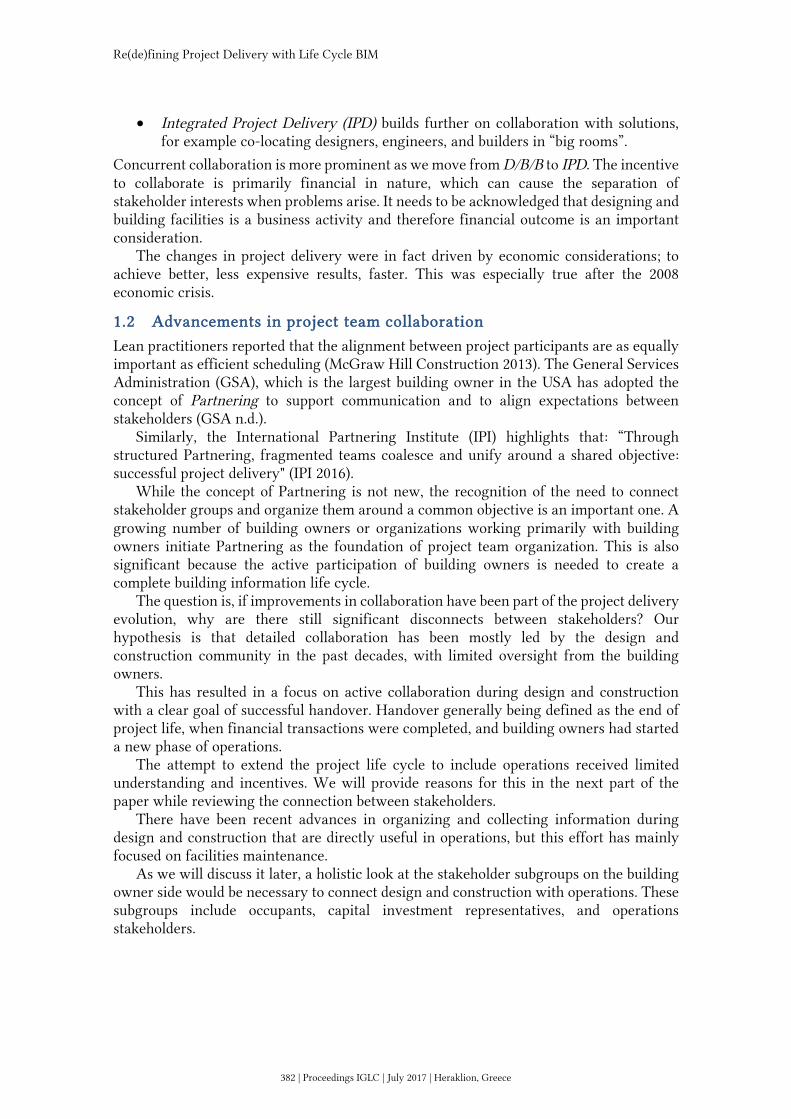
Re(de)fining Project Delivery with Life Cycle BIM
• Integrated Project Delivery (IPD) builds further on collaboration with solutions, for example co-locating designers, engineers, and builders in “big rooms”.
Concurrent collaboration is more prominent as we move from D/B/B to IPD. The incentive to collaborate is primarily financial in nature, which can cause the separation of stakeholder interests when problems arise. It needs to be acknowledged that designing and building facilities is a business activity and therefore financial outcome is an important consideration.
The changes in project delivery were in fact driven by economic considerations; to achieve better, less expensive results, faster. This was especially true after the 2008 economic crisis.
1.2 Advancements in project team collaboration
Lean practitioners reported that the alignment between project participants are as equally important as efficient scheduling (McGraw Hill Construction 2013). The General Services Administration (GSA), which is the largest building owner in the USA has adopted the concept of Partnering to support communication and to align expectations between stakeholders (GSA n.d.).
Similarly, the International Partnering Institute (IPI) highlights that: “Through structured Partnering, fragmented teams coalesce and unify around a shared objective: successful project delivery" (IPI 2016).
While the concept of Partnering is not new, the recognition of the need to connect stakeholder groups and organize them around a common objective is an important one. A growing number of building owners or organizations working primarily with building owners initiate Partnering as the foundation of project team organization. This is also significant because the active participation of building owners is needed to create a complete building information life cycle.
The question is, if improvements in collaboration have been part of the project delivery evolution, why are there still significant disconnects between stakeholders? Our hypothesis is that detailed collaboration has been mostly led by the design and construction community in the past decades, with limited oversight from the building owners.
This has resulted in a focus on active collaboration during design and construction with a clear goal of successful handover. Handover generally being defined as the end of project life, when financial transactions were completed, and building owners had started a new phase of operations.
The attempt to extend the project life cycle to include operations received limited understanding and incentives. We will provide reasons for this in the next part of the paper while reviewing the connection between stakeholders.
There have been recent advances in organizing and collecting information during design and construction that are directly useful in operations, but this effort has mainly focused on facilities maintenance.
As we will discuss it later, a holistic look at the stakeholder subgroups on the building owner side would be necessary to connect design and construction with operations. These subgroups include occupants, capital investment representatives, and operations stakeholders.
382 | Proceedings IGLC | July 2017 | Heraklion, Greece

Adam Rendek
2 STAKEHOLDERS
2.1 Perceived issues
The boundaries between disciplines and divisions between project phases exist for good reasons. For example, the Design-Bid-Build delivery method is not simply inefficient, it was established to serve specific purposes (e.g. fair, public competition). "Lean thinking views the entire project in production system terms, that is, as if the project were one large operation" (Howell and Ballard 1998). However, adopting new technologies or collaboration methods that cross these boundaries and divisions can present difficulties without considering the original reasons behind the boundaries and divisions.
One of the cornerstones of partnering is commitment by all participants. Committing to something is only possible if the subject is well-understood. Lack of willing collaboration between stakeholders can stem from concerns about professional liability or code issues which need to be observed. Vaguely defined requirements from owners can also contribute to sub-optimal results. Team-work can break down when problems arise and the initial commitment was not based on a known effort.
For these and other reasons, one stakeholder group can refrain from committing time and effort to the process.
2.2 Stakeholder groups
There are many disciplines and stakeholder groups involved in developing and executing a building project. The different disciplines often represent different work cultures, and can associate different meanings to concepts that appear to be the same on the surface.
For example, we explored the communication between architects and energy modelers during the development of high-efficiency buildings. "As they leave the meeting table, architects and engineers have a different expectation about what the other side is going to deliver to the next meeting or how much effort the identified next exercise will take" (Grinberg and Rendek 2013).
To further complicate matters, stakeholders often have subgroups with their own cultures and differences. They are tasked to represent their own subject matters and coordinate with other disciplines and stakeholders. Table 1 lists the different focus areas of the various participants of a hypothetical Design-Build project to illustrate the diversity of special interests during any building project.
383 | Proceedings IGLC | July 2017 | Heraklion, Greece
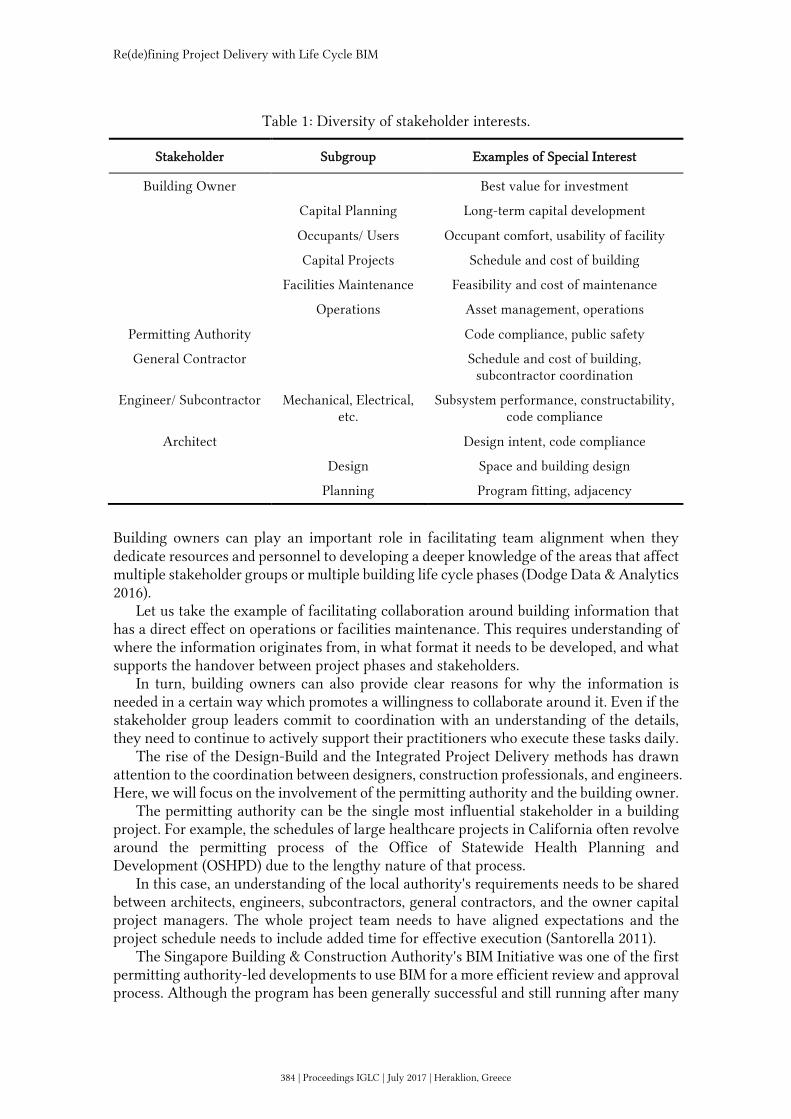
Re(de)fining Project Delivery with Life Cycle BIM
Table 1: Diversity of stakeholder interests.
Stakeholder Subgroup Examples of Special Interest
Building Owner Best value for investment
Capital Planning Long-term capital development
Occupants/ Users Occupant comfort, usability of facility
Capital Projects Schedule and cost of building
Facilities Maintenance Feasibility and cost of maintenance
Operations Asset management, operations
Permitting Authority Code compliance, public safety
General Contractor Schedule and cost of building, subcontractor coordination
Engineer/ Subcontractor Mechanical, Electrical, etc.
Subsystem performance, constructability, code compliance
Architect Design intent, code compliance
Design Space and building design
Planning Program fitting, adjacency
Building owners can play an important role in facilitating team alignment when they dedicate resources and personnel to developing a deeper knowledge of the areas that affect multiple stakeholder groups or multiple building life cycle phases (Dodge Data & Analytics 2016).
Let us take the example of facilitating collaboration around building information that has a direct effect on operations or facilities maintenance. This requires understanding of where the information originates from, in what format it needs to be developed, and what supports the handover between project phases and stakeholders.
In turn, building owners can also provide clear reasons for why the information is needed in a certain way which promotes a willingness to collaborate around it. Even if the stakeholder group leaders commit to coordination with an understanding of the details, they need to continue to actively support their practitioners who execute these tasks daily.
The rise of the Design-Build and the Integrated Project Delivery methods has drawn attention to the coordination between designers, construction professionals, and engineers. Here, we will focus on the involvement of the permitting authority and the building owner.
The permitting authority can be the single most influential stakeholder in a building project. For example, the schedules of large healthcare projects in California often revolve around the permitting process of the Office of Statewide Health Planning and Development (OSHPD) due to the lengthy nature of that process.
In this case, an understanding of the local authority's requirements needs to be shared between architects, engineers, subcontractors, general contractors, and the owner capital project managers. The whole project team needs to have aligned expectations and the project schedule needs to include added time for effective execution (Santorella 2011).
The Singapore Building & Construction Authority's BIM Initiative was one of the first permitting authority-led developments to use BIM for a more efficient review and approval process. Although the program has been generally successful and still running after many
384 | Proceedings IGLC | July 2017 | Heraklion, Greece

Adam Rendek
years, the disconnect between stakeholders happens to be on the design and construction side. The designers and construction professionals in Singapore are adopting BIM slower than was expected. Therefore, they cannot feed the authority's system at the rate and efficiency that was originally envisioned.
The Taiwanese government is also considering BIM-based e-submission for building permits. In their case "more than half of the firms were willing to use BIM-based tools to streamline the building permit review process" (Juan et al. 2016).
The permitting process can create a bottleneck in the schedule of building projects and, for the same reason, it can provide an opportunity for time savings after careful alignment of all stakeholders and clear understanding of local requirements and culture. Time savings leading to early operations, in turn, can have significant positive financial results for the owner capital project managers. We will discuss practical BIM uses that can support the permitting authority's work and coordination with other stakeholders in the next part of this paper.
While organized data from design and construction to support facilities maintenance has documented benefits (McGraw Hill Construction 2014), the results are difficult to illustrate. Large building owners typically have separate stakeholder groups representing capital project investment and facilities maintenance. These internal groups are often funded separately and siloed in ways that slows the implementation of a complete building information life cycle. The capital project manager's focus is finishing the project on time and within budget.
While most of them consider long term maintenance to achieve best value for the investment, they are not directly incentivized to adopt BIM to support it, especially if it is at the cost of an extended schedule or inflated budget. The few organizations at the forefront of developing a complete building information life cycle recognize this issue and actively work on connecting their internal stakeholders (Dodge Data & Analytics 2016b).
Occupants and users on the owner side can also benefit from better coordination and the adoption of technology that supports it. Taking the healthcare sector as an example once more, large projects may need hundreds of user meetings in early design phases. These meetings require not just time, but a significant amount of personnel and financial resources, making them ideal environments for improvement through better coordination.
3 EFFECTIVE SUPPORT BY TECHNOLOGY Once collaboration and the alignment of expectations are addressed between stakeholders, it is possible to choose the right technology to support the right tasks. BIM is no exception from this and its use needs to be evaluated accordingly.
3.1 Partnering with Virtual Design and Construction (VDC)
As we explored above, the adoption of Partnering as a method of structured collaboration is increasing. Thoughtful commitment to collaboration and leaders supporting practitioners on the ground ensures better results in difficult circumstances. While financial performance is important, making the effort to understand different stakeholders' special interests will result in better execution, increase the willingness for collaboration, and can therefore positively impact financial results as well.
Virtual Design and Construction (VDC) addresses processes and organization in design and construction and it integrates BIM as key technology in a measurable way through multidisciplinary collaboration (Kunz and Fisher 2012).
385 | Proceedings IGLC | July 2017 | Heraklion, Greece

Re(de)fining Project Delivery with Life Cycle BIM
VDC has been developed at Stanford University's Center for Integrated Facility Engineering (CIFE) since 2001, and adopted by several design and construction firms with documented results (Kam et al. 2013).
Partnering and VDC are naturally aligned because of the complementing nature of their key components. Jointly, they provide a good reference point for building owners who want to adopt BIM for operations and plan to actively collaborate with their project teams.
3.2 Practical examples of BIM use
Stakeholders on the building owner side may not be familiar with the benefits of BIM or how it can support their work because primarily designers and construction professionals have used it in the past decades. For this reason, clearly defining project specific BIM uses and their potential impact can help to align expectations between building owners, occupants, and project team members. If this alignment happens early in the project, BIM can be a tool to support scope and requirement clarification through handover.
Visualization is an example of BIM application that can be tailored to support the needs of multiple project stakeholders. Whether the subject is 3D utility coordination, building security concerns, or the esthetic review of design, BIM based visualization can help to align the expectations of building owners and occupants, and design and construction professionals.
The following are a few additional practical examples where BIM can directly support collaboration and the appropriate alignment of needs and expectations.
3.2.1 Accessing Building Information during Operations
The building owners of large organizations with multiple buildings and campuses can benefit from standards addressing coordinate system alignment. BIM is designed to assist the design and documentation of individual buildings.
The location of buildings can be recorded in BIM, but due to limited need, it is not current standard practice. Building owners need to develop a process to achieve that, which in turn can be followed by various project teams creating virtual models.
Geospatial Information Systems (GIS) are often deployed by building campus owners. When GIS is connected to BIM, they provide a platform for accessing building information from multiple buildings at once without having to open individual BIM files.
3.2.2 BIM supporting permitting
Permitting authorities can benefit from viewing BIM as a database with graphic representation. Standardized attributes of wall types can be filtered to highlight fire rated walls and the related components. This can expedite the review of code compliance and fire life safety strategies.
Compliance with the American Disability Act (ADA) can also be facilitated in a similar fashion. Designers can benefit from using intelligent BIM elements that automatically display clearance issues without manual calculations.
Visualization based on BIM can generally support the permit review process, especially 3D views, which can lead to faster understanding of the designer intent.
3.2.3 Connecting the virtual and the real
QR codes and passive RFID chips are inexpensive today and can be easily attached to equipment and elements of the building. Every BIM element is coded with a unique identifier by default which can be linked to the QR codes or RFID chips of their physical
386 | Proceedings IGLC | July 2017 | Heraklion, Greece

Adam Rendek
equivalent during commissioning. This connection allows for automated equipment tracking or identification during operations and maintenance saving the time of manually searching for the element in drawings and documents.
4 CONCLUSIONS
4.1 Balance and clarity
The adoption of BIM has been unfolding in phases in the past decades. As the design and construction community has demonstrated its benefits, building owners and permitting authorities became interested in its use as well.
Five years ago, it was usual for building owners to request BIM without really understanding it. Today, we are approaching a tipping point when building owners and permitting authorities will ask for BIM and know how to use it as well.
This is signalled by several large building owners and permitting authorities developing specific requirements and establishing data standards where they don't currently exist. Complete building information life cycle is possible when building owners actively participate in team organization, provide detailed data standards and requirements, and effectively use the organized information through operations. This way, collaboration through Partnering can be balanced with choosing the right technologies for the right tasks. Permitting authorities can also support and benefit from this process which can affect a capital project's bottom line.
4.2 Proposed next steps
A pilot project designed around thoughtful collaboration, including all stakeholders and aimed at complete building information life cycle, could enhance our understanding of the challenges and benefits of the process, data development, and data use. While further research supporting facilities maintenance with standardized data is needed, we are proposing a focused effort to explore the benefits of using BIM by capital project managers, building users, and permitting authorities.
5 REFERENCES
Dodge Data & Analytics (2016). Optimizing the Owner Organization, The Impact of Policies and Practices on Performance SmartMarket Brief, s.l.: Dodge Data & Analytics. McGraw Hill Construction (2013). Lean Construction, Leveraging Collaboration and Advanced Practices to Increase Project Efficiency SmartMarket Report, s.l.: McGraw Hill Construction. McGraw Hill Construction (2014). The Business Value of BIM for Owners SmartMarket Report, s.l.: McGraw Hill Construction. Grinberg, M. and Rendek, A. (2013). Architecture & Energy in Practice: Implementing an Information Sharing Workflow. Chambery/ France, 13th Conference of International Building Performance Simulation Association. GSA (n.d.) Partnering. [Online] Available at: https://www.gsa.gov/portal/content/100822 [Accessed 27 March 2017]. Howell, G. and Ballard, G. (1998). Implementing Lean Construction: Understanding and Action. Guaruja, Brazil, The International Group for Lean Construction.
387 | Proceedings IGLC | July 2017 | Heraklion, Greece

Re(de)fining Project Delivery with Life Cycle BIM
IPI (2016). What is Construction Partnering?. [Online] Available at: https://partneringinstitute.org/what-is-collaborative-partnering/ [Accessed 27 March 2017]. Juan, Y.-K., Lai, W.-Y. and Shih, S.-G. (2016). Building information modeling acceptance and readiness assessment in Taiwanese architectural firms. Journal of Civil Engineering and Management, 2016(June), pp. 1-12. Kam, C., Senaratna, D., Xiao, Y. and McKinney, B. (2013). The VDC Scorecard: Evaluation of AEC Projects and Industry Trends, s.l.: Stanford University CIFE. Kunz, J. and Fisher, M. (2012). Virtual Design and Construction: Themes, Case Studies and Implementation Suggestions, s.l.: Stanford University CIFE. Santorella, G. (2011). Lean Culture for the Construction Industry: Building Responsible and Committed Project Teams. New York: Taylor and Francis Group, LLC.
388 | Proceedings IGLC | July 2017 | Heraklion, Greece

Rischmoller L., Dong N., Fischer M., and Khanzode A. (2017). “Automation of the Building Information Model Breakdown Structure” In: LC3 2017 Volume II – Proceedings of the 25th Annual Conference of the International Group for Lean Construction (IGLC), Walsh, K., Sacks, R., Brilakis, I. (eds.), Heraklion, Greece, pp. 389–396. DOI: https://doi.org/10.24928/2017/0216
AUTOMATION OF THE BUILDING INFORMATION MODEL BREAKDOWN STRUCTURE
Leonardo Rischmoller1, Ning (Tony) Dong2, Martin Fischer3 and Atul Khanzode4
Abstract: Breaking down project information via different breakdown structures has been a successful way of managing and controlling construction projects with levels of efficiency and effectiveness otherwise unimaginable to achieve over the past decades. However, the current practice of grouping and organizing building information models from multiple project participants does not reflect such breakdown structures well. This gap renders it a challenge to introducing Building Information Modelling (BIM) to on-site meetings in the construction phase, such as daily subcontractor huddle and pull planning meetings, in which on-the-spot-requests to query federated models are prevalent. This paper introduces the underlying concepts of a method that allows automatic grouping of models so that the model breakdown structure (MBS) matches a certain breakdown structure within a project. An automation tool has been developed accordingly and tested in two case studies, which prove that the proposed method enables project participants without extensive trainings of BIM the rapid identification of the desired model contents.
Keywords: Building Information Modelling (BIM), breakdown structure, model breakdown structure (MBS)
1 INTRODUCTION It is an intuitive idea to breaking a project description into a series of small parts that could facilitate (1) the preparation of bill of materials, budgets, and schedules; (2) the allocation of resources and responsibilities; and (3) the execution and control of the project. The formalization of this idea dates back to the 1950’s and 60’s when the United States Department of Defense (DOD) and NASA adopted PERT/COST, the system that first described the work breakdown structure (WBS) as “a family tree subdivision of a program, beginning with the end objectives and then subdividing these objectives into successively smaller end item subdivisions” (DOD and NASA 1962).
By 1983 the WBS had been emphasized and successfully implemented as a program planning tool for more than a decade, and the DOD had been utilizing the WBS as a primary mechanism for the definition of contract work and the foundation for a management planning and control system (Lanford and McCann 1983). Currently it is generally recognized by project management professionals that the WBS is the foundation of planning, estimating, scheduling, and monitoring activities (Rad 1999). In the last 30 years a number research has been conducted on the WBS rationale, rules, as well as related methods (Hameri and Nitter, 2002, Mansuy 1991; Mueller 2000; Gloany and Shtub 2011; Kunz and Fischer 2012; PMI 2013).
1 DPR BIM Manager, DPR Construction [email protected] 2 DPR R&D Manager [email protected] 3 Center for Integrated Facility Engineer, Stanford University, Director [email protected] 4 DPR Technology Group Director [email protected]
389 | Proceedings IGLC | July 2017 | Heraklion, Greece

Automation of the Building Information Model Breakdown Structure
Variations of the original WBS concept have led to the development of different types of breakdown structures subject to certain breakdown criteria, e.g. product breakdown structure (PBS), organizational breakdown structure (OBS), resource breakdown structure, cost breakdown structure, value breakdown structure, etc. Common to these breakdown structures is the same family tree subdivision originally conceived as part of the WBS concept.
Breakdown structures are very effective in managing a large amount of data and structuring the information to aid comprehension (Hameri and Nitter, 2001; Langford 1983; Globerson 1994; Deckro et al 1992). OBS indicates the organizational relationships and are used as the framework for assigning work responsibilities. PBS breaks up a project into a series of small “physical” parts. WBS breaks up a process into a series of small tasks. Together they provide a framework for a detailed cost estimating and control, along with guidance for schedule development and control. Every type of breakdown structure provides a legitimate way to view a project. Depending on circumstances, one approach may be preferred over the others.
Since different breakdown structures call for different structures or management practices during the implementation of the project, some degree of controversy exists as to which breakdown structure is better (Mansuy 1991). On the other hand, efforts in identifying the points of intersection and integration of different breakdown structures (e.g., using the PM software’s capability to report with multiple breakdown structures) have been carried out in the last decades (Lanford 1983; Rad 1999; Cam 2005; Kunz and Fischer 2012).
Creating a breakdown structure forces the project designers to choose one approach and adhere to it throughout the project life cycle (Golany and Shtub 2001). This leads to improved efficiencies gained by the specialization, but also to increased efforts in managing information integration, which is often rendered difficult when complex tasks from multiple disciplines (or functions) are created using different breakdown criteria. Building Information Models practices and tools, widely considered as the means to facilitate data integration for construction projects (Gao and Fischer 2008; Hartmann et al 2008) do not offer, however, Model Breakdown Structures that matches breakdown structures within a project with the level of flexibility for BIM coordinators and, more importantly, on-site personnel to navigate and query model contents in a timely fashion.
2 MBS CURRENT PROBLEMS
2.1 Limitations of current BIM practices regarding MBS
The existing BIM tools emphasize more on the information (e.g., properties, attributes, parameters, etc.) attached to each piece (e.g., the part, element, component) of the model and on the level of detail or level of development (LOD) of the BIM pieces. They are less concerned with how the pieces are arranged into a MBS. Some BIM tools offer limited functions of grouping different model pieces by location, elevation, discipline, or other criteria. These attempts however provide a number of "fixed" ways to organize a federated model (also known as integrated model), which either has no relationship with a project's WBS, PBS, or OBS; or makes it too difficult to obtain a MBS that matches any project breakdown structure.
From a general contractor's perspective, a federated model of a project can consist of digital model files from different sources (i.e., different project stakeholders using a variety of model authoring tools) and different project phases (i.e., design models, fabrication
390 | Proceedings IGLC | July 2017 | Heraklion, Greece

Leonardo Rischmoller, Ning (Tony) Dong, Martin Fischer and Atul Khanzode
models, as-built models, etc.). Sometimes a BIM coordinator needs to combine several hundreds or even thousands of digital model files using some of the available BIM tools (e.g., Autodesk Navisworks®, Solibri®, Bentley Navigator®, Intergraph SmartPlant Review®, etc.). The MBS becomes, in this situation, a long list of digital model files, which do not provide an expedited way (i.e., a few seconds) to identify a certain piece or group of pieces within the federated model. Even if certain BIM tools can help group individual models files into one federated model with a certain MBS (e.g., area à level à discipline à system, etc.) it is very difficult and time consuming, if not impossible, to convert to another model with a different MBS.
2.2 MBS and on-site meetings
It has become a common practice for a general contractor to provide standardized model naming conventions, which facilitate the use of filter features that allow isolating and visualizing pieces or groups of pieces of the federated model. BIM coordinators normally save these visualization scenes as viewpoints (or snapshots) so they can be retrieved rapidly during a coordination meeting. There have been attempts of expanding the use of the federated model to on-site meetings, such as the daily subcontractor huddle, pull planning meetings, and owner-architect-contractor (OAC) meetings. Since on this type of meetings on-the-spot-requests to query the federated model are very common, without the saved viewpoints it could take a model operator minutes to find the right model contents relevant to a topic. In this process it is observed that meeting participants lose interest in models quickly, thus making the introduction of BIM unsuccessful. Without the model visualization, issues that could have been addressed and decisions that could be made within a meeting can be delayed significantly. In other words, the benefits of BIM are not realized in these meetings. This applies in particular to projects with meetings of over 20 participants. Dealing with topics or issues for which the model is not prepared in advance exposes the limitations of the current approaches of applying MBS to the federated model. In most of the on-site meetings the participants may have different ideas and understanding of how they want to breakdown a project. Accordingly, if a federated model matches these different breakdown structures the desired model contents can be rapidly retrieved.
3 THE CIFE MBS AUTOMATION TOOL The Center for Integrated Facility Engineering (CIFE) at Stanford University has developed a method that allows to group digital model files reflecting different breakdown structures. The CIFE MBS automation tool was developed accordingly. The tool can convert model files created using almost all of the most commonly used BIM authoring tools (including Autodesk Revit®, Tekla®, Microstation®, AutoCAD, etc.) into Autodesk Navisworks® NWD-format files. These NWD files are then automatically nested into a family tree of NWD files using some project breakdown structure (e.g., area, sector, level, discipline, system, etc.). The project breakdown structure categories and the hierarchical order in which these categories will be displayed in every MBS created using the CIFE MBS automation tool, are arranged in a table within a Microsoft Excel® file. From this file the CIFE MBS automation tool pulls the relevant information to create a single Autodesk Navisworks® NWD model, which shows on the 'Selection Tree' window the MBSs corresponding to each arrangement of the breakdown categories. The CIFE MBS automation tool can create as many different NWD files with different MBS just by varying the hierarchical categories grouping criteria included in the Excel file.
391 | Proceedings IGLC | July 2017 | Heraklion, Greece
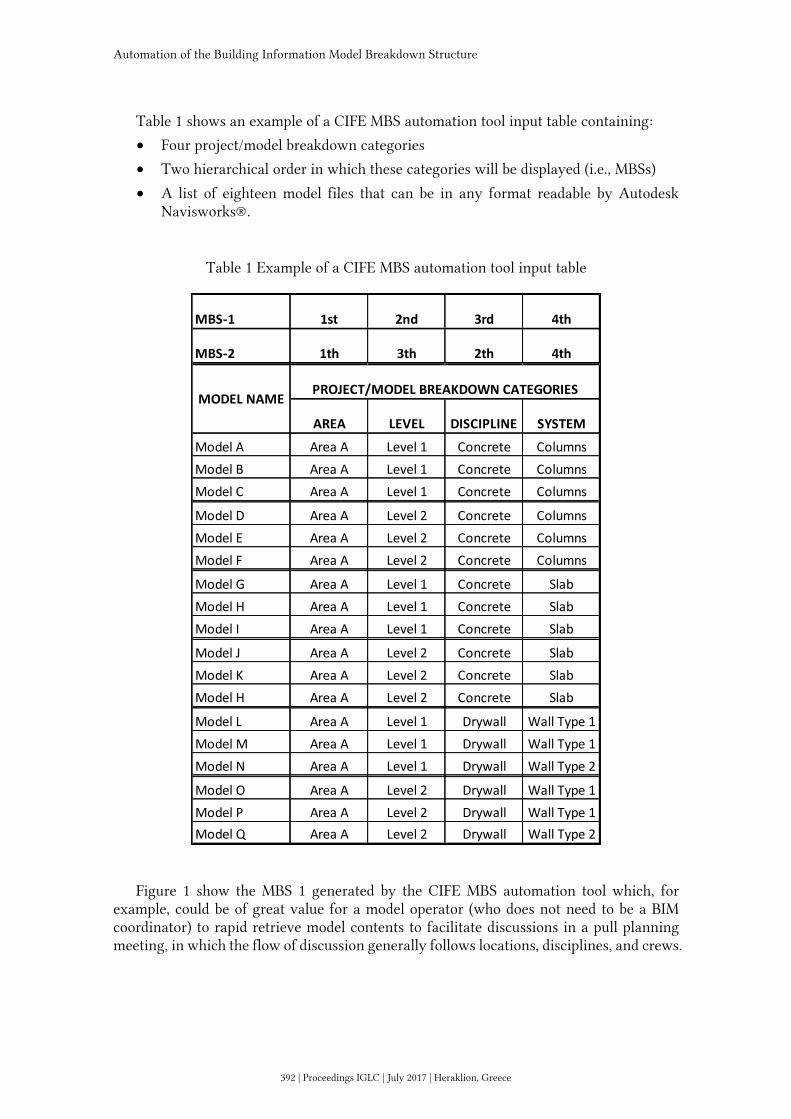
Automation of the Building Information Model Breakdown Structure
Table 1 shows an example of a CIFE MBS automation tool input table containing:
• Four project/model breakdown categories
• Two hierarchical order in which these categories will be displayed (i.e., MBSs)
• A list of eighteen model files that can be in any format readable by Autodesk Navisworks®.
Table 1 Example of a CIFE MBS automation tool input table
Figure 1 show the MBS 1 generated by the CIFE MBS automation tool which, for example, could be of great value for a model operator (who does not need to be a BIM coordinator) to rapid retrieve model contents to facilitate discussions in a pull planning meeting, in which the flow of discussion generally follows locations, disciplines, and crews.
MBS-1 1st 2nd 3rd 4th
MBS-2 1th 3th 2th 4th
AREA LEVEL DISCIPLINE SYSTEMModelA AreaA Level1 Concrete ColumnsModelB AreaA Level1 Concrete ColumnsModelC AreaA Level1 Concrete Columns
ModelD AreaA Level2 Concrete ColumnsModelE AreaA Level2 Concrete ColumnsModelF AreaA Level2 Concrete Columns
ModelG AreaA Level1 Concrete SlabModelH AreaA Level1 Concrete SlabModelI AreaA Level1 Concrete Slab
ModelJ AreaA Level2 Concrete SlabModelK AreaA Level2 Concrete SlabModelH AreaA Level2 Concrete Slab
ModelL AreaA Level1 Drywall WallType1ModelM AreaA Level1 Drywall WallType1ModelN AreaA Level1 Drywall WallType2
ModelO AreaA Level2 Drywall WallType1ModelP AreaA Level2 Drywall WallType1ModelQ AreaA Level2 Drywall WallType2
PROJECT/MODELBREAKDOWNCATEGORIESMODELNAME
392 | Proceedings IGLC | July 2017 | Heraklion, Greece
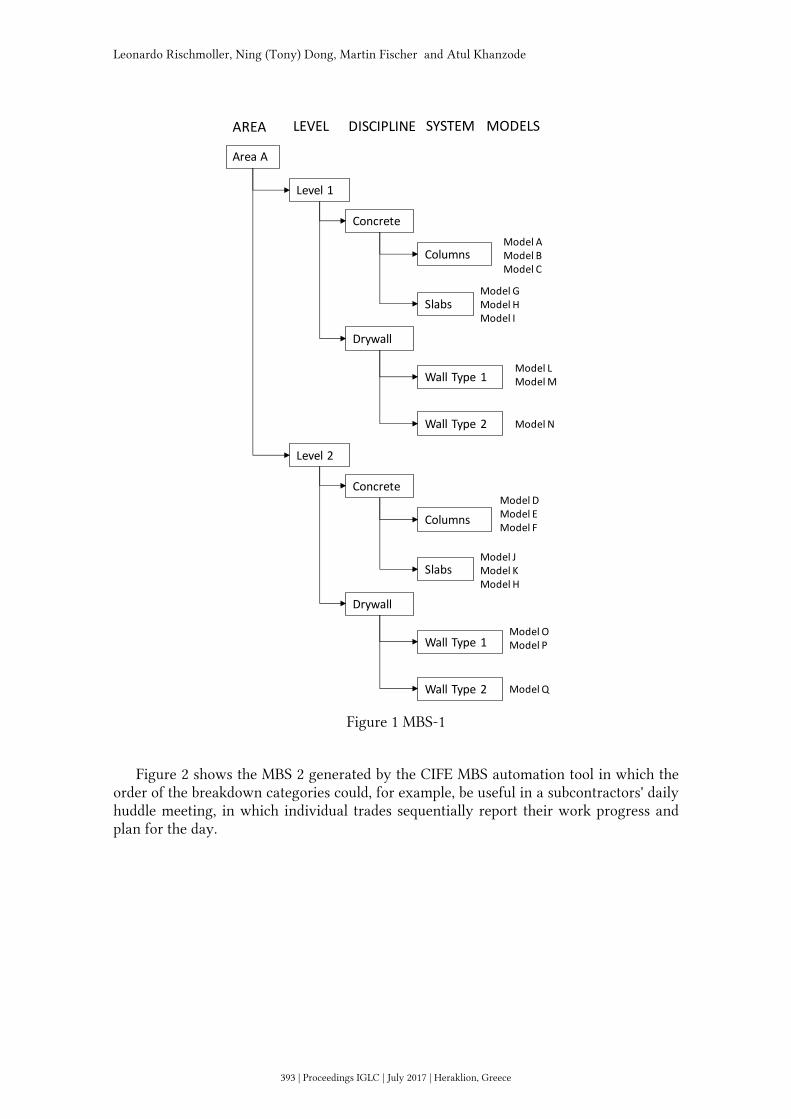
Leonardo Rischmoller, Ning (Tony) Dong, Martin Fischer and Atul Khanzode
Figure 1 MBS-1
Figure 2 shows the MBS 2 generated by the CIFE MBS automation tool in which the order of the breakdown categories could, for example, be useful in a subcontractors' daily huddle meeting, in which individual trades sequentially report their work progress and plan for the day.
Level1
AreaA
Concrete
Columns
Slabs
ModelAModelBModelC
ModelGModelHModelI
Drywall
WallType1
WallType2
Level2
Concrete
Columns
Slabs
ModelDModelEModelF
ModelJModelKModelH
Drywall
WallType1
WallType2
AREA LEVEL DISCIPLINE SYSTEM MODELS
ModelLModelM
ModelN
ModelOModelP
ModelQ
393 | Proceedings IGLC | July 2017 | Heraklion, Greece
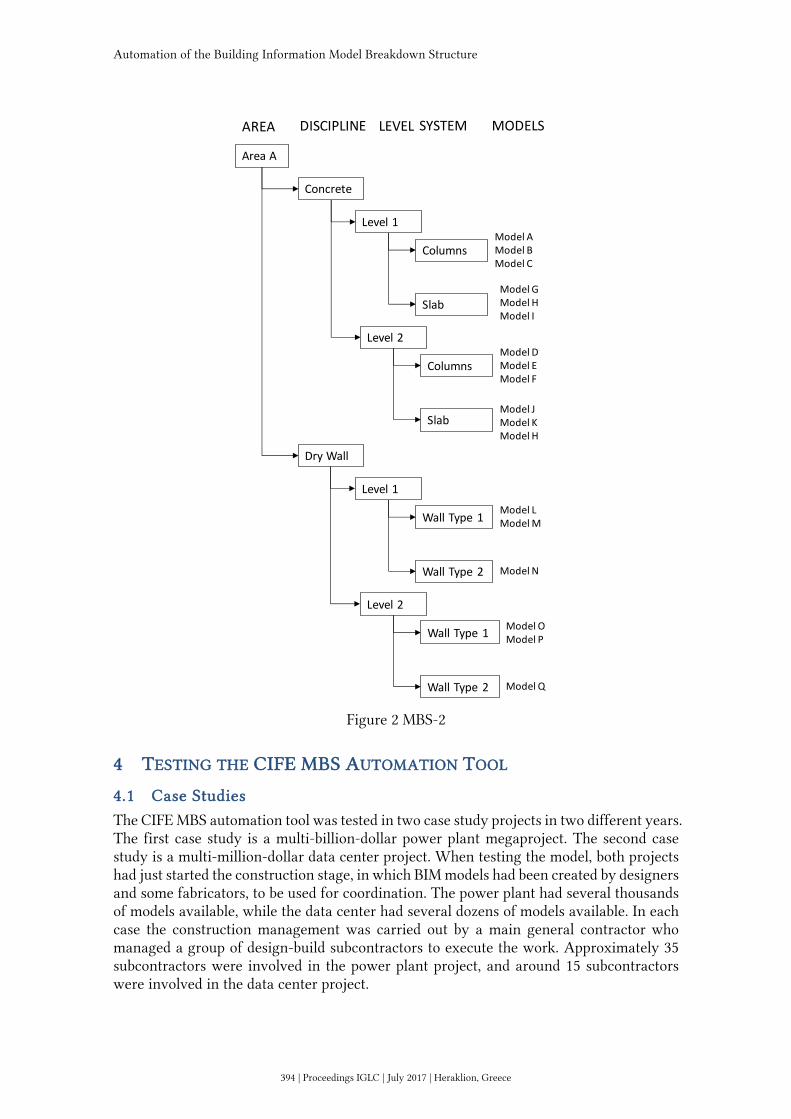
Automation of the Building Information Model Breakdown Structure
Figure 2 MBS-2
4 TESTING THE CIFE MBS AUTOMATION TOOL
4.1 Case Studies
The CIFE MBS automation tool was tested in two case study projects in two different years. The first case study is a multi-billion-dollar power plant megaproject. The second case study is a multi-million-dollar data center project. When testing the model, both projects had just started the construction stage, in which BIM models had been created by designers and some fabricators, to be used for coordination. The power plant had several thousands of models available, while the data center had several dozens of models available. In each case the construction management was carried out by a main general contractor who managed a group of design-build subcontractors to execute the work. Approximately 35 subcontractors were involved in the power plant project, and around 15 subcontractors were involved in the data center project.
Concrete
AreaA
Level1
ColumnsModelAModelBModelC
ModelGModelHModelI
Slab
ModelDModelEModelF
ModelJModelKModelH
Level2
Columns
Slab
DryWall
Level1
WallType1
WallType2
Level2
WallType1
WallType2
AREA DISCIPLINE LEVEL SYSTEM MODELS
ModelLModelM
ModelN
ModelOModelP
ModelQ
394 | Proceedings IGLC | July 2017 | Heraklion, Greece

Leonardo Rischmoller, Ning (Tony) Dong, Martin Fischer and Atul Khanzode
Using different combinations of the project breakdown structures (e.g., area, level, discipline, contractor, system, etc.) the CIFE MBS automation tool was used to create Integrated (or Federated) Project Models (IPMs) that combined the existing design and fabrication models of different formats into Autodesk Navisworks® NWD format models. Each IPM contains a different MBS displayed on the Navisworks® 'Selection Tree' window.
4.2 Results
In the first test case finding the right model contents on-the-spot in a meeting was almost impossible due to the many models included in the federated model. After introducing the CIFE MBS tool a BIM coordinator was able to identify the model contents relevant to the topic of discussion in 15 seconds or less. After one-hour training sessions 18 project members (project engineers, project managers, planners and schedulers) eventually became the main model navigator leading their respective meetings. Before introducing the CIFE MBS tool these project members had little to no experience with the models. In the second test case, project engineers hosting different types of meetings were able to navigate and query the model to find the right contents in 15 seconds or less when used the MBSs created with the CIFE tool. Finding the right content had taken several minutes when the MBS were not available. The latencies in resolving issues during the on-site meetings were reported to be significantly reduced (Rischmoller et al, 2017).
Within two weeks of the introduction of models with MBS created using the CIFE MBS tool other meeting participants (e.g., subcontractor's superintendents and managers, owner representatives, planners, safety and quality managers, etc.) started to realize the "presence" of the IPMs and how the models "followed" the ongoing discussions. The participants started shifting their focus of attention from the screen displaying 2D documents to the screen displaying the IPM. After another two weeks, the meeting participants realized that they could not only expect the model to "follow" the discussions but that they could actually "require" the right model contents to lead the ongoing discussions with the confidence that they were going to get an answer, not in the next meeting several days or weeks later, but in the same meeting in most cases.
The simplicity to navigate and query the IPMs led several meetings' participants to believe that this was the "normal" way of working using BIM, which they had not been aware of previously. Furthermore, it was not difficult to find in each case study a tech-savvy field engineer ready to take charge of navigating the model during meetings rather than relying on the "model operator".
5 CONCLUSIONS
This paper introduces the underlying concepts of a method that allows flexible MBS configuration reflecting different project breakdown structures. Based on this method the CIFE MBS automation tool is developed which enables quick query in an IPM without saved viewpoints. Without the introduction of this tool the advantages and benefits of BIM could have stayed in the world of modellers and BIM coordinators in the construction phase. According to the case projects team members, the tool allowed on-site personnel to easily overcome their fear of technology and take the lead in using BIM to improve the efficiency of their meetings. Detailed discussions of the results as well as surveys to case studies meeting participants are provided in the paper titled "Improving on-site meeting efficiency by using an automated model breakdown tool" for the same conference.
395 | Proceedings IGLC | July 2017 | Heraklion, Greece
Automation of the Building Information Model Breakdown Structure
6 REFERENCES
Chachere, J., Kunz, J., and Levitt, R., Integrated Concurrent Engineering: Grounded Theoretical Factors that Enable Radical Project Acceleration, CIFE Working Paper #WP087, Aug, 2004.
Chachere, J., Kunz, J., and Levitt, R., The Role of Reduced Latency in Integrated Concurrent Engineering, CIFE Working Paper #WP087, Aug, 2004.
Coffe, T., The Future of Integrated Concurrent Engineering in Spacecraft Design, The Lean Aerospace Initiative Working Paper Series, MIT, 2006
Deckro, RF; Herbert, JE; and Verdini, WA, Project Scheduling with Work Packages, OMEGA International Journal of Management Science, Vol. 20, No 2, pp. 169-182, 1992
DOD and NASA Guide, PERT/COST System Design, June 1962 Gao, J.; and Fischer, M. (2008). Framework & Case Studies Comparing Implementations
& Impacts of 3D/4D Modeling Across Projects. CIFE Technical Report 172. Gloany and Shtub 2011???? Globerson, S. Impact of various work-breakdown structures on project conceptualization.
International Journal of Project Management 1994 12 (3) 165-171 Hameri, A., and Nitter, P. Engineering data management through different breakdown
structures in large-scale project. International Journal of Project Management 20 (2002) 375-384
Hartmann, T.; Gao, J.; and Fischer, M. (2008). Areas of Application for 3D and 4D Models on Construction Projects. Journal of Construction Engineering and Management, 134(10), pp. 776-785, doi: 10.1061/(ASCE)0733-9364(2008)134:10(776)
Kam, C. Dynamic Decision Breakdown Structure: Ontology, Methodology, and Framework for Information Management in Support of Decision-Enabling Tasks in the Building Industry. Doctor of Philosophy Thesis. Department of Civil and Environmental Engineering, Stanford University, 2005.
Kunz, J. and Fischer, M., Virtual Design and Construction; Themes, Case Studies and Implementation Suggestions, CIFE Working Paper #097, Version 14, Jan, 2012
Lanford, H.; and McCann, T. (1983). Effective planning and control of large projects using work breakdown structure. Long Range Planning, 16(2) pp. 38-50, doi:10.1016/0024-6301(83)90054-7.
Mansuy, J. Work Breakdown Structure: A Simple Tool for Complex Jobs. Cost Engineering Magazine, American Association of Cost Engineers, Vol 33, No 12, December 1991
Mueller, S. Resolving Work Breakdown Structure Problems. AACE International Transactions, 2000
Park, B., and Meier, R., Reality-Based Construction Project Management: A Constraint-Based 4D Simulation Environment. Journal of Industrial Technology, Vol. 23, Number 1, pp. 1-11. 2007
PERT Coordinating Group (1962) DOD and NASA Guide, PERT Cost Systems Design. Rad, P.F. “Deliverable-Oriented Work Breakdown Structure,” 1999 AACF International
Transactions, CSC 02. Worker Cost (1999). Yassine, A., and Braha, D., Concurrent Engineering: Research and Applications, Four
Complex concurrent engineering and the design structure matrix method. Sage Publications, Vol. 11, No. 3, pp. 165-176. 2003
396 | Proceedings IGLC | July 2017 | Heraklion, Greece

Rischmoller L., Dong N., Fischer M., and Khanzode A. (2017). “Improving On-site Meeting Efficiency by Using and Automated Model Breakdown Tool” In: LC3 2017 Volume II – Proceedings of the 25th Annual Conference of the International Group for Lean Construction (IGLC), Walsh, K., Sacks, R., Brilakis, I. (eds.), Heraklion, Greece, pp. 397–404. DOI: https://doi.org/10.24928/2017/0217
IMPROVING ON-SITE MEETING EFFICIENCY BY USING AN AUTOMATED MODEL BREAKDOWN TOOL
Leonardo Rischmoller1, Ning (Tony) Dong2, Martin Fischer3, and Atul Khanzode4
Abstract: Integrating Building Information Modelling (BIM) to on-site meetings in the construction phase has been a challenge to general contractors mainly due to the inflexibility of the current practice in grouping and organizing models to facilitate rapid, on-the-spot model queries. We have developed an automation tool that supports the automatic grouping of models according to a certain model breakdown structure (MBS), which reflects a breakdown structure of a project. This enables a model navigator to identify the relevant model contents on the fly in a meeting thus drastically reducing the coordination latency in resolving an issue. This paper introduces two case studies to explain a non-intrusive process of introducing federated models produced by the automation tool to the meetings. The results of surveys to the meeting participants prove that the non-intrusive process as well as the models reflecting multiple MBS's changed the meeting participants' behaviour and enhanced their coordination, communication, and collaboration, thus improving the overall outcomes of the meetings.
Keywords: Building Information Model (BIM), Model Breakdown Structure (MBS), Coordination Latency
1 INTRODUCTION Chachere et al. (2004) defines the term “coordination latency” as the time that elapses between a request for information or action and the compliance to that request. Coordination latency is offered as a unifying, intuitive, descriptive performance metric, intended to reach a near-zero value as a project design goal (Chachere et al., 2009). Coordination latency is especially important in the interdependent and iterative design because it involves a large number of information exchanges and exception handling requests (Cachere et al., 2004).
Reduction of coordination latency can lead to shorter design development times, timely availability of critical information, ability to share and communicate useful information on a timely basis, and hence to a transformed near real-time decision-making process in which a number of issues are solved on the spot rather than going through more traditional prolonged processes, such as the request for information process and the change order process.
The introduction of BIM to the design and coordination processes in the AEC industry has transformed design meetings to integrated concurrent engineering (ICE) sessions (Coffee, 2006), in which the coordination latency has been drastically reduced, resulting in extraordinarily rapid design with a quality similar to or surpassing traditional methods at a lower cost (Smith 1998; Smith and Koenig 1998; Wall 1999, Wall 2000; Wall et al., 1999; Kunz and Fischer, 2012). However, bringing BIM to on-site meetings, such as the
1 DPR BIM Manager, DPR Construction [email protected] 2 DPR R&D Manager [email protected] 3 Center for Integrated Facility Engineering, Stanford University, Director [email protected] 4 DPR Technology Group Director [email protected]
397 | Proceedings IGLC | July 2017 | Heraklion, Greece

Improving On-Site Meeting Efficiency by Using and Automated Model Breakdown Tool
daily subcontractor huddle, pull planning meetings (Tommelein, 1998), and owner-architect-contractor (OAC) meetings has been very challenging. One of the main reasons is that the current practice of issue discussion and resolution using federated models heavily relies on saved viewpoints or snapshots prepared in advance to support these meetings, in which participants usually have many on-the-spot model queries. If a model navigator is not fast enough to identify the right model contents, the field personnel (e.g., superintendents, subcontractors, field engineers, foremen, etc.) will lose interest and stop trusting the use of BIM in these meetings. Current BIM models/processes have too much coordination latency to support real-time dynamic of the meetings and the current BIM practice does not provide adequate support to the reduction of coordination latency in the on-site meetings. Therefore, the full benefits of BIM are not fully reaped in the construction phase. In the paper titled "automation of the building information model breakdown structure" Rischmoller et al. (2017) introduced the CIFE5 Model Breakdown Structure (MBS) automation tool and method that enable project participants without extensive BIM trainings the rapid identification of the desired model contents. In this paper, we use a case study approach to demonstrate how the utilization of this tool and method improves the field personnel's involvements with BIM thus improving the efficiencies of the on-site meetings.
2 BENEFITS OF USING BIM IN THE ON-SITE MEETINGS The following are the expected benefits of applying the CIFE MBS automation tool and method to the case studies:
• Improvement (among the meeting participants) of: o Coordination o Communication o Collaboration
• Reduction of latency.
• Rapid understanding of the topics discussed.
• Duration to go through each topic reduced.
• Outcomes of the meeting sessions improved.
We took a qualitative approach to evaluate the achievement of these goals by surveys, which were handed out after models, created using the CIFE MBS automation tool were integrated and fully used in the on-site meetings.
3 THE CASE STUDIES
3.1 Case Studies
We tested the CIFE MBS automation tool (Rischmoller et al., 2017) in two case study projects. In both case studies the main researcher was hired as the project BIM coordination consultant, who produced Integrated (or Federated) Project Models (IPMs) aggregating individual models from different sources (i.e., different project stakeholders using a variety of model authoring tools). The project personnel were not aware of the
5 Center for Integrated Facility Engineering
398 | Proceedings IGLC | July 2017 | Heraklion, Greece

Leonardo Rischmoller, Ning (Tony) Dong, Martin Fischer and Atul Khanzode
BIM coordinator acting also as a researcher aiming at testing the benefits of utilizing the tool.
The first case study is a multi-billion-dollar power plant megaproject. The second case study is a multi-million-dollar data center project. The main researcher joined both projects during the construction phase, in which individual BIM models had already been created by designers and some fabricators for design and trade coordination. These models were not used at the on-site meetings before the introduction of the IPMs produced by the CIFE MBS automation tool.
Using different combinations of the construction management project breakdown categories (e.g., area, level, discipline, contractor, system, etc.), the CIFE MBS automation tool was used to create IPMs that combined the existing design and fabrication models. Each IPM contains a unique MBS, displayed on the Navisworks ® Selection Tree window, reflecting a certain breakdown structure.
3.2 IPMs implementation on the case study projects
Using the CIFE MBS automation tool, different MBSs (reflecting different project breakdown structures) were created and displayed by the BIM coordinator (i.e., main researcher) at the existing daily and weekly coordination and planning meetings (e.g., pull planning meetings and daily subcontractor planning meetings). The BIM coordinator followed the ongoing issue or conversation by displaying on the model the relevant parts of the projects under discussion. The IPMs were displayed on one screen whereas the meeting agendas and/or other type of documents (e.g., graphics and 2D drawings) were shown on another. The main researcher did not provide any notification about the utilization of the IPMs in these meetings, in which most participants had never utilized any 3D models. This is a lesson learned from previous projects in which attempts of forcing the use of 3D models in these meetings failed when the participants were very conscious of the models and paid less attention to the issues at hand. In these attempts the participants lost interest and patience quickly when a model navigator did not prepare the right viewpoints for an issue and spent time to find the right model contents on the spot.
The variety of modelling capabilities of the designers, fabricators and subcontractors involved in each case study project led to the situation in which not all the digital model files used to assemble the IPMs matched the 2D drawings used for the construction execution. Some models were outdated in comparison to most recent 2D drawings, while some of the 2D drawings where outdated in comparison to the most current design model files. These however did not prevent the utilization of the IPMs for planning and coordination purposes. Sometimes even 3D placeholders were good enough to improve the quality of the discussion and accelerate issue resolutions in the meetings.
4 RESULTS 4.1.1 IPMs awareness
After the introduction of the IPMs in different type of on-site meetings in the case study projects, the meeting participants (usually subcontractor's superintendents and managers, but also owner representatives, planners, safety and quality managers, etc.) soon started to realize the "presence" of the IPMs and how the models "followed" the ongoing discussions. This lead the meetings' participants to start shifting their focus to the screen displaying the IPM. After two weeks, the meeting participants realized that they could not only expect the model to "follow" the discussions but that they could actually "require" the model to show parts of the project to support their ongoing discussions. Within another
399 | Proceedings IGLC | July 2017 | Heraklion, Greece

Improving On-Site Meeting Efficiency by Using and Automated Model Breakdown Tool
two weeks the meeting participants began to request more advanced features of the IPMs such as color-coding certain systems or model elements, color-coding the pieces by plan vs. actual, and overlaying IPMs with other design/construction documents.
Within two months of the use of IPMs the main researcher received request from project engineers, project managers from both the general contractor and the subcontractors, as well as tech-savvy superintendents to learn the use of the IPMs and some basic navigation functions. Quite a few participants also asked for the availability of the IPMs on mobile devices so they could use them in the field. Eventually these participants became the model navigators in the meetings, assisting and facilitating meetings by themselves instead of depending of a BIM coordinator. It was clear that this less intrusive approach of introducing the IPMs to the field personnel paid off.
4.1.2 Survey
To further understand the benefits of the use of the IPMs created by the CIFE MBS automation tool, a survey was carried out among the project participants that had attended meetings in which the IPMs were used, in each case study project. Figure 1 and 2 show the composition of the population sampled, and the number of meetings attended by the people surveyed on both cases studies. Figure 3 shows the survey results. The results of the surveys indicate that the experience was overwhelmingly perceived as positive by the project team members of each case study.
Figure 1: Case study 1 survey demographics
Disciplines:
Numberofmeetingsattended:
400 | Proceedings IGLC | July 2017 | Heraklion, Greece

Leonardo Rischmoller, Ning (Tony) Dong, Martin Fischer and Atul Khanzode
Figure 2: Case study 2 survey demographics
4.1.3 Reduction of latency and ICE sessions
We discovered that most of the times a model navigator could answer to a model query in less than fifteen seconds. This strengthened the interaction between the IPMs and the meeting participants, resulting in a reduction of latency during the meetings. With the aid of the IPMs the participants were consistently on the same page when discussing a topic and the time of searching through emails and documents for information was also drastically reduced. Furthermore, the IPMs enabled the participants to ask many more questions earlier (i.e., questions that they wouldn't have thought of until very late during the project execution) because they realized that through the MBS they could rapidly access model, and hence project visualization and information to support discussions during ongoing meetings (Sack et al., 2009), that otherwise would have demanded extra time (and/or another meeting) to gather documents and drawings which in addition do not provide the visualization and rapid access to project information that can be obtained by using the model. As indicated in the survey results the meeting participants perceived that the use of IPMs greatly improved the understanding of the meeting topics as well as the communication, coordination, collaboration, and integration among the participants.
In the first case study the CIFE ICE session (Kunz and Fischer, 2012) principles and ideas were applied in order to support the diverse project stakeholder community to achieve their project objectives through the use of the IPMs in meetings carried out at the Computer Advanced Visualization Environment (CAVE) facility, dedicated for BIM-enhanced design and construction coordination.
After the embracement of the IPMs as central part of their meetings by the project team members, the CIFE ICE session methodology was introduced, gradually transforming most of the project meetings into ICE sessions in which the IPMs became just another piece of a more holistic approach to collaboration and integration. The transformation
401 | Proceedings IGLC | July 2017 | Heraklion, Greece
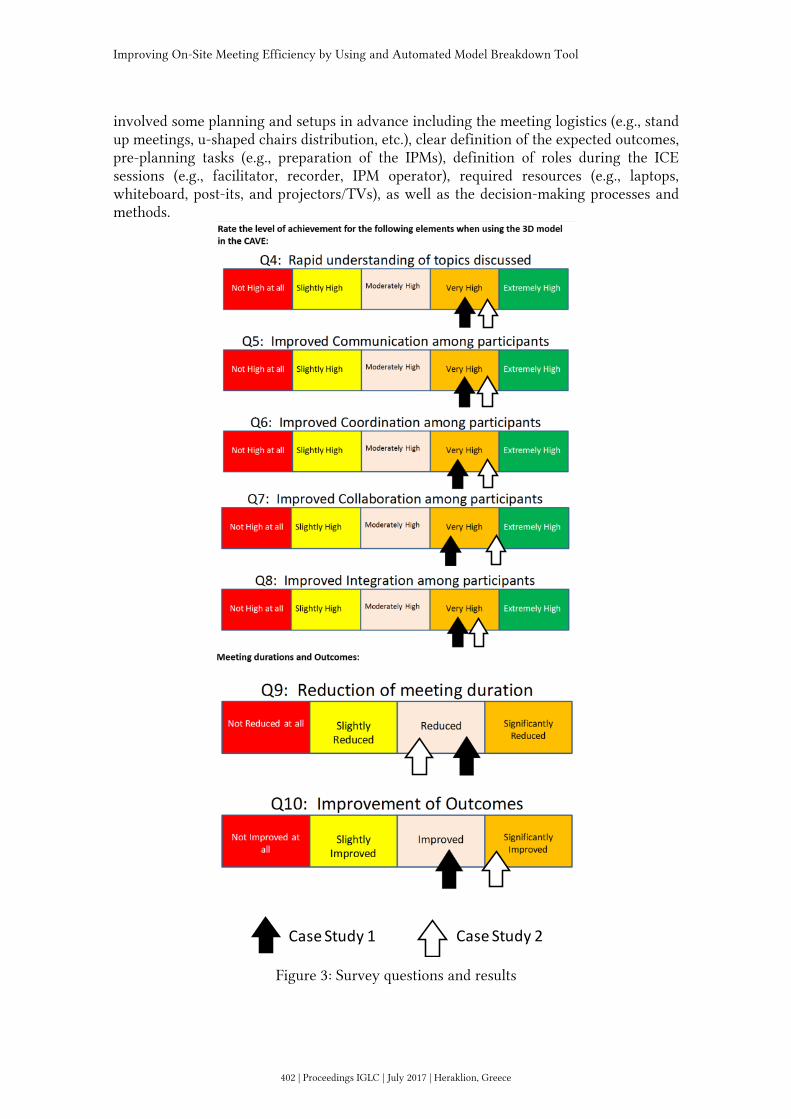
Improving On-Site Meeting Efficiency by Using and Automated Model Breakdown Tool
involved some planning and setups in advance including the meeting logistics (e.g., stand up meetings, u-shaped chairs distribution, etc.), clear definition of the expected outcomes, pre-planning tasks (e.g., preparation of the IPMs), definition of roles during the ICE sessions (e.g., facilitator, recorder, IPM operator), required resources (e.g., laptops, whiteboard, post-its, and projectors/TVs), as well as the decision-making processes and methods.
Figure 3: Survey questions and results
CaseStudy1 CaseStudy2
402 | Proceedings IGLC | July 2017 | Heraklion, Greece
Leonardo Rischmoller, Ning (Tony) Dong, Martin Fischer and Atul Khanzode
4.1.4 Design Push versus Pull
On-site meetings focusing on planning, scheduling and tracking of the work sequence, constructability, and coordination; did not necessarily require a high level of geometrical precision from the IPMs, sometimes even placeholders in the complete project 3D environment were good enough to support discussions about construction sequences. However, even a "perfect" model was not always needed for coordination purposes, the lack of quality and completeness in parts of the IPMs was identified by the construction teams and communicated to the design teams. The designers in both case studies were not used to hearing comments about their models from superintendents, project managers, and foremen. However, they embraced the feedback and updated (or completed) their models rapidly without asking for extra payment (under design-build contracts). In some cases, they updated models that they would not have been either persuaded or forced to update during the design stage. The IPM exposed good and bad things about the models to a new audience and exerted peer pressures among the meeting participants, including the designers, who became more willingness to "collaborate" with the people in charge of converting the design information into a physical reality. This is different from the previous efforts carried out during the design and preconstruction stages in which designers and subcontractors were pushed (either convinced or forced) to model in a certain way, using certain criteria and processes (e.g., following a naming convention, signing-off model to freeze the design, etc.), and in a timely manner so that the 2D drawings will always be extracted from the fabrication models. Upstream awareness about IPMs that will be scrutinized downstream by construction professionals and last planners pulled not only higher diligence on the Building Information Modelling efforts, but in the design itself represented now not only in 2D drawings but also in the IPMs.
5 DISCUSSION Instead of windows within model visualization software tools showing data attached to each model component or element in the form of properties, attributes or parameters; the MBS provides access to a different type of model information through "a family tree subdivision of a project beginning with the end objectives and then subdividing these objectives into successively smaller subdivisions" (the same original description of the WBS). Furthermore, the CIFE MBS automation tool provides the ability and flexibility to create rapidly as many different MBSs as needed, eliminating the need to discuss which breakdown structure is better. The idea of "allowing improved project visibility" originally proposed by the WBS concept for the control phase can be expanded to all the project development phases in which IPMs are reviewed using appropriate MBSs. The research presented on this paper is limited to testing the benefits of using IPMs including MBSs created with the CIFE MBS automation tools, used by multidisciplinary audiences of 10-30 persons working on complex tasks concurrently in the same room during the project construction stage. In this sense, the benefits of timely availability of information to all development participants, and the reduction of the traditional cycle of working periods and meeting periods, proposed by Concurrent Engineering is fulfilled by using IPMs with appropriate MBSs. On this paper we have explored these benefits specifically during meetings that were subsequently transformed into ICE sessions, in which latency was reduced, and communication, coordination, collaboration, and integration among participants was improved.
403 | Proceedings IGLC | July 2017 | Heraklion, Greece
Improving On-Site Meeting Efficiency by Using and Automated Model Breakdown Tool
6 CONCLUSIONS Finding out the best way to managing the implementation of BIM is a task that can still be considered under exploration. And considering the complexity associated to the multidisciplinary and multi-phase nature of our projects, as well as new tools, technologies and associated processes appearing every time at a faster pace, it can be stated that managing the implementation of BIM is a task that will probably be under permanent exploration and adjustment. As part of the current BIM management approaches, trying to push BIM into the construction process, if milestone goals of a BIM execution plan are not achieved timely, the project will not wait and the BIM implementation will give up to, either explicitly or implicitly, avoid the unmanageable associated to unfulfilled achieved milestones. When this happens, it is not only the modelling effort which is affected, but the design itself leads the construction management approach to struggle on focusing with managing the unavoidable issues "common" to most of the projects and reflected in documents like RFIs and Change Orders.
The IPMs and MBSs approaches presented in this paper introduce a novel mechanism that can be added to any BIM implementation effort providing a feedback loop from downstream project execution that shall contribute to pull innovative, more simple and effective BIM management approaches.
7 REFERENCES Chachere, J., Kunz, J., and Levitt, R. (2004). Observation, Theory, and Simulation of Integrated
Concurrent Engineering: Grounded Theoretical Factors that Enable Radical Project Acceleration, CIFE Working Paper #WP087, Aug, 2004.
Chachere, J., Kunz, J., and Levitt, R. (2009). The Role of Reduced Latency in Integrated Concurrent Engineering, CIFE Working Paper #WP116, Aug, 2009.
Coffe, T. (2006). The Future of Integrated Concurrent Enginnering in Spacecraft Design, The Lean Aerospace Initiative Working Paper Series, MIT, 2006
Kunz, J. and Fischer, M. (2012). Virtual Design and Construction; Themes, Case Studies and Implementation Suggestions, CIFE Working Paper #097, Version 14, Jan, 2012
Rischmoller L., Dong N., Fischer M., and Khanzode A. (2017). Automation of the Building Information Model Breakdown Structure” In: Proc. Lean & Computing in Construction Congress (LC3), Vol. 3 (IGLC), Heraklion, Greece
Sacks, R., Treckmann, M., and Rozenfeld, O. (2009). Visualization of Workflow to Support Lean Construction. Journal of construction engineering and management, Vol. 135, Issue 12
Smith, J. (1998). “Concurrent Engineering in the Jet Propulsion Laboratory Project Design Center”, Society of Automotive Engineers, Long Beach, CA, U.S.A., June 4.
Smith, D., and L. Koenig (1998). “Modeling and Project Development”, European Space & Research Centre, Noordwijk, The Netherlands, November 3.
Tommelein, I. (1998). "Pull-driven scheduling for pipe-spool installation: simulation of a lean construction technique." Journal of construction engineering and management., 124 ( 4) 279-288.
Wall, S. (1999). Reinventing the Design Process: Teams and Models, IAF, Specialist Symposium: Novel Concepts for Smaller, Faster & Better Space Missions, Redondo Beach, California, USA, April 19-21.
Wall, S. (2000). Design Process Enhancements for Planetary Missions. 4th International Conference on Low Cost Planetary Missions, Maryland, USA, May 2
Wall, S., D. Smith, L. Koenig, and J. Baker (1999). “Team Structures and Processes in the Design of Space Missions”, MTG: 1999 IEEE Aerospace Conference, Snowmass at Aspen, CO, U.S.A., March 6-13.
404 | Proceedings IGLC | July 2017 | Heraklion, Greece
Salazar, R., Rybkowski, Z., and Ballard, G. (2017). “An Exploration of Compatibility of U.S. Army Culture and Lean Construction” In: LC3 2017 Volume II – Proceedings of the 25th Annual Conference of the International Group for Lean Construction (IGLC), Walsh, K., Sacks, R., Brilakis, I. (eds.), Heraklion, Greece, pp. 405–412. DOI: https:// doi.org/10.24928/2017/0199.
AN EXPLORATION OF COMPATIBILITY OF U.S. ARMY CULTURE AND LEAN CONSTRUCTION
Ralph T. Salazar,1 Zofia K. Rybkowski2 and Glenn Ballard3
Abstract: The culture of the United States Army has evolved significantly over the course of the service of the present generation of Soldiers. Through the implementation of Lean Management practices, and Six Sigma measurement and analysis tools, Army leaders are more able to competently perform a mission or accomplish a business goal. Through careful case study of previous missions, effort spent building learning organizations, and cultivating a culture of respect, leaders have discovered a formula to optimize unit performance. The keys to unlocking the benefits of Lean’s historically proven efficiency methods lie in changing the attitude and mindset of the Army’s workforce to effectively apply lean methods to the myriad projects and tasks that the citizens of the United States ask its Soldiers to perform every day. Cultural transformation must occur, however, in an unforgiving environment that poses significant threats to our national security, leaving very little margin for error in applying the new managerial methodology to both state-side and war-side operations. Using as its framework Jeffrey Liker’s Principles of Management described in The Toyota Way, this paper will explore the ways in which the U.S. Army is already equipped to implement lean, and those areas where more cultural evolution must take place to take full advantage of the philosophy. Viewing the Army culture as a whole, and then discussing more specifically Health Facility Development and Military Hospital Construction, the authors’ contention is that the U.S. Army and Lean Construction are more compatible than may appear at first glance.
Keywords: Lean Construction, Military Culture, Military Decision Making
1 INTRODUCTION The United States armed forces have been engaged in a protracted conflict for over 15 years. This state of high operational tempo has eroded the readiness, capability, and, in some cases, the productivity of the force over the last decade. The negative effects on a war-weary workforce may be evident, due in part to a pernicious cycle of executing a wartime mission followed by stateside reset and recovery. It was on the home-front that this degradation became most apparent. In response to the decline in the efficiency of the Department of Defense, strategists at the Pentagon’s Office of the Deputy Chief of Staff Business Transformation Division began searching for solutions to the dwindling productivity. On May 15, 2008 the Department of Defense (DoD) issued Directive number 5010.42. This directive served as a mandate to all DoD branches to establish a Continuous Process Improvement (CPI) and Lean Six Sigma (LSS) program which was to be the primary means to assess and continually improve the effectiveness and efficiency of DoD processes. The program’s 1 Graduate Student, Department of Construction Science, College of Architecture, Texas A&M University, College Station, Texas, 77843-3137 USA, [email protected] (corresponding author) 2 Associate Professor, Department of Construction Science, College of Architecture, Texas A&M University, College Station, Texas, USA, 77843-3137, Ph :+1-979-845-4354, [email protected] 3 Research Director, Project Production Systems Laboratory, Civil and Environmental Engineering Dept., University of California, Berkeley, 407 McLaughlin Hall, CA94720-1712, USA, [email protected]
405 | Proceedings IGLC | July 2017 | Heraklion, Greece

An Exploration of Compatibility of U.S. Army Culture and Lean Construction
initiative was to strengthen the military’s capabilities and improve the following lines of effort: Productivity, Performance, Safety, Flexibility and Energy Efficiency (DoD Directive 2008). This mandate would, of course, come with funding to support the educational and implementation requirements of such a program. The rationale was that it sometimes costs money to save money, and ultimately improve the way we do business. In accordance with Jeffrey Liker’s (2004) first principle of basing “management decisions on a long-term philosophy, even at the expense of short-term financial goals,” the DoD invested in lean programs (p. 37). CPI/LSS was the vehicle to achieve transformation, in spite of a few inconsistencies in lean philosophy when compared to the military hierarchical structure of making decisions and executing work.
In fulfillment of the requirement, the U.S. Army Medical Command (MEDCOM) began a concerted effort to train and equip its workforce with the knowledge required to implement a CPI/LSS program. Dr. Donna Whittaker, the MEDCOM Lean Six Sigma deployment director, and her colleagues, developed an academic pipeline to produce certified Lean Six Sigma leaders who could apply the waste mitigating and performance measurement techniques learned in the classroom to their respective organizations. Lean operations became the gold standard in U.S. Army Medicine and while many systems were streamlined, and billions of dollars saved, there were still some aspects of the lean philosophy that were incompatible with Army culture (Lopez 2016). As the organization begins to apply lean to more widespread facets of Army Medicine, specifically Health Facility Development and Military Medical Treatment Facility Construction, it will become even more important that we understand the dissimilarities between traditional lean philosophy and current Army culture.
The purpose of this paper is to explore ways in which the military and lean are compatible while striving to understand what cultural adaptations could be made to more effectively implement lean. The idea that parallels can be drawn between lean and military strategy is not new. Low and Teo (2005) suggest that lean production principles may have been influenced by Sun Tzu's Art of War. They did not analyze, however, how U.S. military culture may change the way lean is implemented and enacted. While the United States Army has begun to implement lean operations in the healthcare environment, it has yet to fully implement many of the tools at the disposal of a Lean Construction practitioner while undertaking military health facility development. Several peer-reviewed articles in The Military Engineer, the official professional journal of the Society of American Military Engineers, call for an overhaul of military construction delivery methodology. Specifically, Peter Cholakis, in his article “Rethinking Construction Delivery” (2015), contends that “leaner” construction practices and tools such as BIM may be precisely what military constructors need to implement to ensure project success. Lean tools notwithstanding, in order to take full advantage of the methodology, an organization must adapt its culture, as necessary, to embrace a more lean-centric way of thinking. This paper will examine U.S. Army Medicine and, using The Toyota Way (Liker 2004) and Liker’s Management Principles, determine which of those principles are already being successfully implemented, while highlighting those that present a greater challenge. Table 1 lists the Toyota Way principles that the U.S. Army has already implemented, or that already existed.
406 | Proceedings IGLC | July 2017 | Heraklion, Greece

Ralph T. Salazar, Zofia K. Rybkowski and Glenn Ballard
Table 1: Excerpt from Liker’s 14 Management Principles (Liker 2004)
Principle Number
Content Military Applicability Compatibility
(War-side / State-side)
1 Long-Term Philosophy Decision to invest in Lean Six Sigma
Low / High
13 Make decisions slowly by consensus, execute rapidly
Army post-war leadership transformation initiative
Medium / Medium
9 Grow Leaders with thorough understanding of the
philosophy
Formal pipeline to train lean practitioners
Low / Medium
10
Develop exceptional people and teams
Professional Military Education focuses on
developing people
High / High
14
Become a learning organization
Assess current state and evolve to world class
(healthcare)
Medium / High
5
Stop to Fix Problems
High Reliability Organization
High / High
6 Standardize Tasks / Continuous Improvement
Standard Operating Procedures
High / Medium
In this exploration, only the principles that focus on the collaborative aspects of lean will be addressed (i.e. those shown in Table 1). Those principles that are more operationally oriented (i.e. process flow) and do not deal with building consensus or making decisions are outside the scope of this paper and represent areas for further exploration.
2 THE EVOLUTION OF LEAN IN THE U.S. ARMY
2.1 Managing Change
The dichotomy of grooming leaders to give orders in a deployed or wartime environment compared to the way that same leader is asked to build consensus and make decisions in a state-side or peacetime environment is striking. There is a time and place for consensus building, but the middle of a kinetic and tactical environment, where the stakes are life or death, is not necessarily one of them. An entire generation of warfighters has been baptized in the crucible of combat, in some cases leading to a rigid and inflexible hierarchy resistant to soliciting ideas or innovation from its subordinates. This is sometimes necessary in a combat environment, but it can be detrimental to an organization in a stateside business environment. In 2006, when General David Petraeus penned the U.S. Army Counterinsurgency Field Manual 3-24, he recognized then that even in tactical situations, soliciting bottom-up refinement can be a healthy, team building event (FM 3-24 2006). He wrote:
Open channels of discussion and debate are needed to encourage growth of a learning environment in which experience is rapidly shared and lessons adapted for new challenges. The speed with which leaders adapt the organization must outpace
407 | Proceedings IGLC | July 2017 | Heraklion, Greece
An Exploration of Compatibility of U.S. Army Culture and Lean Construction
insurgents’ efforts to identify and exploit weaknesses or develop countermeasures. (p. 7-9)
This concept is in line with Liker’s 13th Principle of “making decisions slowly by consensus, thoroughly considering all options, and implementing decisions rapidly” (Liker 2004). “Speed” is a relative thing in a warzone, but the premise is that if appropriate time is taken to discuss decisions with the team, trust is built. With buy-in and trust built through consensus, a leader will more aptly be able to manage his or her team. The same is true of decisions in Health Facility Development while conducting peacetime operations. Rather than decisions being made solely “at the top,” design and construction professionals should develop a network of decision- makers to collectively agree on design interventions in military hospitals. One of the organizational challenges that the U.S. Army has to overcome is that units (hospital organizations) experience fairly rapid turnover. On average, Commanders4 change command every two years, which often results in a changing of the guard in the middle of enduring 4-5 year megaprojects. Health Facility Developers who build a network of decision makers may preclude some of the issues that arise when a new Hospital Facility Commander takes command shortly before the commissioning of a new hospital. There are occasions when the new commander decides to make sweeping changes to the design resulting in significant delays and cost over-runs due to change-orders and rework. When a design decision rests with “the team,” it is much harder for the “new Boss” to overturn it. With the implementation of Lean Six Sigma, organizations are having to address the impact of combat on leadership development—and assess with a critical eye—how decisions are made. This is a healthy exercise for an organization that is transforming to a more lean and agile institution.
2.2 Building the Bench
The U.S. Army Training and Doctrine Command (TRADOC) has a large role to play in the lean transformation as well. This major command is responsible for “training the force,” and manages all of the professional military education courses in the U.S. Army. In these courses, student Soldiers learn through experiential case study, and evolve as men and women who understand servant leadership. Hard conversations are engaged in about the types of leaders whom they have served, and the leader that they have become, or wish to become. Understanding culture is the foundation of the advanced courses, and white papers are studied relative to what it means to be in the Profession of Arms (TRADOC 2010).
In these environments, rank is metaphorically removed, and honest assessments about the state of the organization are given. This is a crucial step in evolving as a lean organization. Leaders must be willing to accept—and even celebrate—failure in an effort to truly understand why a specific mission or business initiative did not go as planned. For more than a decade, the U.S. Army has embarked on this journey, only to battle a silent resistance to flattening the hierarchy. Brilliant men and women who spent entire careers watching this evolution also acknowledge the need for change. General Peter Chiarelli, the 32nd Vice Chief of Staff of the U.S. Army who served in that capacity from August, 2008 to January, 2012, made the following inference in his article on Modern Wars, implying inherent issues with current Army culture:
The military must continually look at ways to flatten their organizational structures… increase opportunities—and rewards—for leaders to serve in assignments outside the traditional military structure…and then retain only those
4 It is standard practice in Army prose to capitalize rank titles even when used as common nouns (e.g. Commander, Soldier) as a sign of respect.
408 | Proceedings IGLC | July 2017 | Heraklion, Greece

Ralph T. Salazar, Zofia K. Rybkowski and Glenn Ballard
Americans who have the potential to succeed in tomorrow’s complex operating environments… they must ensure all views are welcomed to the debate and that junior leaders have no fear of career retribution for freely stating their opinions. (Chiarelli and Smith 2007, p. 41)
The U.S. Army Field Manual 101-5 Chapter 5: “The Military Decision Making Process” (MDMP), which is taught extensively at TRADOC schools, describes in detail, the art and the science of decision making (MDMP 1997). It delineates between those things that can be operationally measured (the science), while acknowledging that there are other complex and intangible aspects of decision making that are simply more subjective (the art), and rely on the decision-maker having the experience, institutional knowledge, and leadership capability to execute the task. The challenge for many army leaders is taking a system (MDMP) designed to function in a tactical, or combat, environment, and adapting it to a stateside mission. It is in this construct that CPI/LSS excels at bridging the gap, and enables teams to do the analysis necessary to build multiple courses of action to accomplish both business goals and combat missions. Lean, and its philosophy of Continuous Improvement, champions the notion of measuring the state of where you are today, so that you can assess where you want to be tomorrow, and have the tools to implement the plan to get there. Moreover, it does so by advocating a culture of cooperation and shared reward without sub-optimization between the various components of the organization. This is one aspect of lean at which the U.S. Army excels. The Army mantra of “One Team, One Fight” is the phrase that best describes the willingness to selflessly operate in concert with sister units to accomplish a common goal, regardless of who is ultimately left paying the bill. In this regard, the U.S. Army is already well on its way to achieving Liker’s 9th and 10th principles of “growing leaders who thoroughly understand the work, and live the philosophy,” while “developing exceptional people and teams who follow your company's philosophy” (Liker 2004).
2.3 Climbing the Kaizen Stairway
Another aspect of U.S. Army culture that is congruent with Liker’s 14th Principle of “becoming a learning organization through relentless reflection (hansei) and continuous improvement (kaizen)” is the Army’s steadfast adherence to the practice of conducting After Action Reviews (AAR). The tenets of conducting an AAR are simple. There are four questions asked in every discussion (TC 25-20 1993):
1. What did we set out to accomplish? (Identify the objectives of the mission) 2. What actually happened? (Assess each phase of the mission) 3. Why did it happen? (Without placing blame, assess what went well, and what
failed during the mission) 4. What are we going to do next time? (Identify what will change/remain the same
in the planning phases and process execution for the next mission) The AAR is conducted per the guidance in U.S. Army Training Circular 25-20: “A Leader’s
Guide to After Action Reviews,” by an objective third party, not one of the first-line leaders who lead the mission (TC 25-20 1993). Additionally, feedback from the group begins with the lower ranking members first to prevent their opinions and observations from being overshadowed by more senior ranking Soldiers. A comprehensive list of “sustains” and “improves” for each phase are generated, and subsequently drafted into an executive summary for each mission conducted. In rare cases (if mission execution was particularly poor), the facilitator may conduct separate sensing sessions with the different rank structures independently of one another. This autonomy to critically examine the successes and failures of a mission is key to developing a cohesive unit where
409 | Proceedings IGLC | July 2017 | Heraklion, Greece

An Exploration of Compatibility of U.S. Army Culture and Lean Construction
everyone, from the lowest ranking to the highest, feels like his or her vote matters. This empowerment to shape operations is also important in establishing a sense of “ownership” in the organization through team endorsed, command level decisions. The role of the Executive Director (Commander) is to then ensure that the next mission adheres to the best practices of the AARs that were generated by the team. Reading previous executive summaries of similar missions should be the first step a commander and his staff take when planning the current mission. In this way, army units continue to climb the Kaizen Stairway (Rybkowski and Kahler 2014; Seed 2015) and solidify themselves as a “learning organization.”
2.4 Becoming a High Reliability Organization
Simply cataloging successes and failures through the AAR process is not enough to become great. An organization must go further if it hopes to establish a climate where all employees truly feel empowered to make “on-the-spot” corrections of deficiencies, and in some cases halt the mission altogether. This initiative has recently been implemented in the operation of military hospitals under the command of Lieutenant General Patricia Horoho, the 43rd Surgeon General of the U.S. Army and previous Commander of MEDCOM. In an effort to achieve High Reliability Organization (HRO) status, LTG Horoho began breaking down the barriers of rank structure and military hierarchy to reduce errors, and emphasized placing the customer (patient) first. An HRO is defined as an organizational “environment of collective mindfulness in which all workers look for, and report, small problems or unsafe conditions before they pose a substantial risk to the organization, when they are easy to fix” (Weick and Sutcliffe 2007, p. 38).
The Army suggests there are three components to high reliability: continuous improvement, leadership development, and establishing a culture of safety that empowers every member of the organization to make safety decisions (HRO 2014). While testifying to the Senate Committee for Defense Appropriations on the state of Army Medicine in March, 2015, General Horoho said: “A High Reliability Organization is committed to achieving zero preventable harm by successfully limiting the number of errors in an environment where normal accidents can occur due to the risk factors and complexity of the practice” (Horoho 2015, p. 17). Part of the preventable harm solution is also designing military hospitals in such a manner as to assist practitioners and clinicians in this HRO commitment. By “slowing down to get quality right the first time” and designing the ability to “detect problems” into the built environment (jidoka and Liker’s 5th Principle), Army Medicine can achieve its HRO and world class healthcare goals (Liker 2004).
2.5 Standardization is Key
The final principle that this paper will discuss is Liker’s 6th principle that states that “standardized tasks and processes are the foundation for continuous improvement and employee empowerment” (Liker 2004). This is another strong suit for the military. The natural inclination for a military person is to execute tasks within a set framework of codified conditions and standards. In fact, the U.S. Army has a Standard Operating Procedure (SOP) for virtually everything it does. However, given the relative infancy of some of its lean implementations, those SOPs, in some cases, are still in the process of being written. There is precedent for developing SOPs to capture lean mechanisms within the army culture and its operations. The “Army Standardization Policy” prescribes responsibilities for implementing standardized programs with respect to procedure, organizational operations, and training. The proponent for this policy is the Deputy Chief of Staff for Operations and Plans headquartered at The Pentagon. The Army defines standardization as, “the management principle which fosters the development and sustainment of a high state of proficiency and readiness among Soldiers and units throughout an organization” (AR 34-4 1984). The objectives of
410 | Proceedings IGLC | July 2017 | Heraklion, Greece

Ralph T. Salazar, Zofia K. Rybkowski and Glenn Ballard
the policy are to improve the productivity and development of both the individual Soldier, and the team (unit) as a whole. Due to reassignment of individual Soldiers throughout the Army every 2-3 years, it is also imperative that the Army standardize practices to reduce the adverse effects of personnel turbulence. To that end, the Army refines its practices, and ensures that only those methods of practice that are fully vetted for efficacy endure from generation to generation. These “best practices” are captured in both Army policy (Army Regulation or “AR” manuals) and unit SOP manuals. The challenge is to ensure that while standardization serves as an integral part of the way the Army operates, that it does not stifle initiative or innovation. Careful evaluation of the mechanisms for enforcement and current applicability of the standard is routinely scrutinized for relevancy as the mission, and the culture, changes. This is analogous to the concept of climbing the Kaizen Stairway where Rybkowski and Kahler (2014) suggest, “Effective use of collective kaizen and standardization capitalizes on the ability of individuals to innovate, to learn from one another, and to improve their effectiveness, thus helping managers improve time, cost, quality, safety and morale by engaging the employees they already have” (p. 1).
3 CONCLUSION The duality of the stateside institutional army, versus the wartime operational army is a challenging aspect of the business to overcome. As if caught in a Dr. Jekyll and Mr. Hyde scenario, it is as though military organizations have to reinvent themselves each time they deploy to a theatre of combat, and then return to a stateside mission. The application of lean thinking and lean managerial methodology is not necessarily possible in some tactical environments. Furthermore, without a wholesale cultural transformation, it may be challenging for the U.S. Army to ever be a truly lean organization philosophically, rather than merely an organization which happens to implement a few lean techniques. That said, there are many cultural norms in the Army that lend themselves quite well to fitting into the lean organizational framework. In this paper, seven of the fourteen lean principles were addressed, and deemed by the authors and military colleagues to be precisely in line with the attributes Liker says a lean organization should exhibit. A strong argument can be made that the other seven principles are at least partially fulfilled by certain facets of U.S. Army business. Perhaps the current climate promoting budget reduction is conducive to the Army’s willingness to implement more lean cost saving measures. As Womack and Jones (1996) wrote, “lean provides a way to do more and more with less and less—less human effort, less equipment, less time, and less space—while coming closer and closer to providing customers with exactly what they want.” (p.36) Unfortunately, in the same way that the construction industry has sometimes struggled to develop analogous systems to Toyota’s manufacturing processes, so too is the Army challenged with applying all of Liker’s lean principles to its varied and diverse mission portfolio. In the end, however, it is well worth the effort to try.
4 REFERENCES
Chassin, M.R. and Loeb, J.M. (2013). “High-Reliability Health Care: Getting There from Here,” The Milbank Quarterly, 91 (3), 459–490. Chiarelli, P.W. and Smith, S.M. (2007). “Learning from Our Modern Wars: The Imperatives of Preparing for a Dangerous Future,” Military Review, September. Cholakis, P. (2015). “Rethinking Construction Delivery,” The Military Engineer, July <http://themilitaryengineer.com/index.php/item/492-rethinking-construction-delivery> November
15, 2016.
411 | Proceedings IGLC | July 2017 | Heraklion, Greece

An Exploration of Compatibility of U.S. Army Culture and Lean Construction
Department of Defense Directive. (2008). DoD-Wide Continuous Process Improvement (CPI)/Lean Six Sigma (LSS) Program, DoD Directive No. 5010.42, Washington, DC: U.S. Gov. Printing Office. Department of the Army. (1984). Army Standardization Policy (AR 34-4), Washington, DC: Headquarters, Department of the Army. Department of the Army. (1993). A Leaders Guide to After-Action Reviews (TC 25-20), Washington, DC: Headquarters, Department of the Army. Department of the Army. (1997). The Military Decision Making Process (FM 101-5), Washington, DC: Headquarters, Department of the Army. Department of the Army. (2006). Counterinsurgency (FM 3-24), Washington, DC: Author,
General David Petraeus. Department of the Army. (2010). The Profession of Arms (Whitepaper), Released in Review: Army Profession in an Era of Persistent Conflict. Washington, DC: Headquarters,
TRADOC. High Reliability Organization (2014). <http://armymedicine.mil/Documents/Panel-A-HRO-
Placemat-AUSA-Medical-Hot-Topics.pdf>16 November, 2016. Liker, J. (2004). “The 14 Principles of The Toyota Way: An Executive Summary of the Culture Behind TPS,” <http://www.si.umich.edu/ICOS/Liker04.pdf> Nov. 14, 2016. Liker, J. (2004). The Toyota Way: 14 Management Principles from the World's Greatest Manufacturer. New York: McGraw-Hill. Lopez, C.T. (2016). “Army's Lean, Six Sigma practitioners free up $1.1 billion in 2015” <https://www.army.mil/article/175162/armys_lean_six_sigma_practitioners_free_up_11_
billion_in_2015> November 15, 2016. Low S. P., and Teo H. F., (2005) "Modern‐day lean construction principles: Some questions on their origin and similarities with Sun Tzu's Art of War." Management Decision,
43(4), 523 – 541. Rybkowski, Z. K., and Kahler, D. L. (2014). “Collective kaizen and standardization: the development and testing of a new lean simulation,” Proceedings of 22nd Annual Conference of
the International Group for Lean Construction. Oslo, Norway, 25-27. Seed, W. R., ed. (2015). “Ch. 31: Continuous Improvement (Kaizen Stairway),” Transforming
Design and Construction: A Framework for Change, Lean Construction Institute, Arlington, VA, 179-185.
Sequestration’s effect on Army Medicine: Defense Health Program: Testimony before the Senate Committee on Appropriations: Subcommittee on Defense, 114th Cong., 1 (2015) (testimony of
Lieutenant General Patricia D. Horoho, The Surgeon General, US Army). Weick, K.E. and Sutcliffe, K.M. (2007). Managing the Unexpected, 2nd ed. San Francisco, CA:
Jossey-Bass. Womack, J.P. and Jones, D.T. (1996). Lean Thinking. New York, NY: Simon and Schuster.
412 | Proceedings IGLC | July 2017 | Heraklion, Greece
Segarra Ll., Herrera R. F., Alarcón L. F. and Pellicer E. (2017). “Knowledge Management and Information Flow Through Social Networks Analysis in Chilean Architecture Firms.” In: LC3 2017 Volume II – Proceedings of the 25th Annual Conference of the International Group for Lean Construction (IGLC), Walsh, K., Sacks, R., Brilakis, I. (eds.), Heraklion, Greece, pp. 413–420. DOI: https://doi.org/10.24928/2017/0244
KNOWLEDGE MANAGEMENT AND INFORMATION FLOW THROUGH SOCIAL NETWORKS ANALYSIS IN
CHILEAN ARCHITECTURE FIRMS
Lluís Segarra1, Rodrigo F. Herrera2, Luis F. Alarcón3 and Eugenio Pellicer4
Abstract: In the Architecture, Engineering and Construction (AEC) sector, information flow and knowledge management influence how companies organize, work and produce, which can be represented in a social network analysis (SNA). Information flows are a critical activity for the work done in architecture firms. The objective of this study is to analyse the social structure of architecture firms to determine how to address information flow and knowledge management. The study is part of benchmarking research related to SNA, management practices and Key Performance Indicators (KPI) in architectural offices. After an extensive literature review, a survey was implemented to develop the SNA. Findings show network type shown by the office depends on its organizational infrastructure. There are also behavioural patterns; it is possible to observe that as the firm’s size increases, the density of the work-related connections in the network decreases and the average length of the path between the nodes within the network increases. Therefore, we can conclude that when offices have more human resources, as well as a pyramid structure and defined hierarchy, information flow is concentrated in small groups.
Keywords: Social network analysis, architecture firms, survey, organizational structure, knowledge management and information flow.
1 INTRODUCTION
Currently, in the Architecture, Engineering and Construction (AEC) industry, information flow and knowledge management influence how companies organize, operate and produce. A social network analysis (SNA) can be used as an effective diagnostic tool so as to highlight a hidden flow of another type of important information (Alarcón et al. 2013)
According to Castillo et al. (2016), there is a relationship between key performance indicators (KPIs) and the metrics obtained by SNA in construction projects where the Last Planner System lean tools are applied. Therefore, it would be interesting to corroborate if these correlations are present in architecture firms, since the design phase is where the greatest impact can be made on an overall construction project.
Leadership development professionals are interested in social networks (SNs) as a way to strengthen relationships between leaders in these fields, communities and organizations
1 Master student, Department of Civil Engineering, Universitat Politécnica de Valéncia, Valencia, España,
[email protected] 2 PhD student, Department of Construction Engineering and Management, Pontificia Universidad
Católica de Chile, Professor of School of Civil Engineering, Pontificia Universidad Católica de Valparaíso, Chile, Researcher - GEPUC, Santiago, Chile, [email protected]
3 Professor, Ph.D., Department of Construction Engineering and Management, Pontificia Universidad Católica de Chile, Santiago, Chile, [email protected]
4 Professor, Ph.D., Department of Civil Engineering, Universitat Politécnica de Valéncia, Valencia, España, [email protected]
413 | Proceedings IGLC | July 2017 | Heraklion, Greece
Knowledge Management and Information Flow Through Social Networks Analysis in Chilean Architecture Firms
(Hoppe and Reinelt 2010), given that the person and their connectivity play a fundamental role in the success or failure of projects, and they should be managed and continuously improved (Flores et al. 2014). Likewise, the forecasted performance of a construction organization helps to identify weak spots, as well as to find solutions to improve performance and increase benefits (Zayed et al. 2012).
The ownership and administration of an architecture firm have been noted as critical organizational variables in the determination of the results of a professional service company. It is known that company size is a relevant factor which influences the organizational structures that are adopted by architecture firms (Oluwatayo and Amole 2014).
Information flow is a critical activity in architecture firms due to the type of work they do; hence, that is why it is necessary to study how the flow of information and knowledge management occurs, since it is often not visible at first glance (Alarcón et al. 2013).
This study is part of benchmarking research for architecture firms which is being done by Pontificia Universidad Católica de Chile (PUC) and Universidad Técnica Federico Santa María (UTFSM) as well as the Asociación de Oficinas de Arquitectura de Chile (AOA), under the umbrella of project CORFO INGENIERÍA 2030.
The overall objective is to create benchmarking among architecture firms, correlating the organizations’ management practices, SNAs and KPIs. The goal of this article is to evaluate and analyse the social structure of architecture firms to determine how information is handled and knowledge management occurs in each of these offices, and then to compare them and to detect patterns.
This article is based on quantitative research with a clearly defined structure. It begins with a review of the literature to understand the initial state. Then the methodology used for the data gathering is described. This is then followed by the results and discussion, and finally the conclusions and a few guidelines for action.
2 BACKGROUND
2.1 Architecture Firms
According to Oluwatayo and Amole (2013), in the case of most architecture firms, the level of information that flows within their structures is moderate – to – high, whereas the level of centralization is generally low. This is due to the fact that the owners are managers; their roles as partners and in actual management roles influence the structure of the office. The results of a study of 92 architecture firms revealed a significant direct relationship between the type and the size of the formal legal structure. Also, even though these companies have specialized knowledge, the study indicated that there is not a significant relationship between the leadership characteristics and the performance of the architecture firms.
Research by Oluwatayo and Amole (2014) confirmed that only one of the internal factors of the study, specifically the size of the firm, influenced a company’s organizational structure. They arrived at the conclusion that organizational structures work better when some external influences are high, resulting in an increased benefit; this drove the conclusion that the Directors of the architecture firms should consider external factors when choosing an organizational structure for their offices, objectively determining the external factors that will exert influence on their companies.
414 | Proceedings IGLC | July 2017 | Heraklion, Greece
Lluís Segarra, Rodrigo F. Herrera, Luis F. Alarcón and Eugenio Pellicer
2.2 Organizational Structures
Research by Greenwood R and Empson (2003) strived to clarify what types of organizations could be effective in the administration of professional organizational services, concluding that the most effective was when the professional organization was constituted as a private corporation where the principal asset is specialized labour. Given that conclusion, Zhou and Wit (2009) described the overall structure of an organization in terms of specialization, centralization and formalization; the structural organization of a company is the way it is organized and coordinates the work. In addition, according to Oluwatayo and Amole (2013) there are not many descriptions of the structure of architecture firms in these terms, and generally a low level of specialization is observed in them. They also envision a level of decentralization in most of companies.
2.3 Social Network Analysis
According to Anklam (2003), the development of an organization to fulfil its objectives and to reach its stated goals is based on relationships between the individuals that make up the company. The SNA is a technique that has been applied as a Lean Tool to study the impact of Lean Management on continuous improvement, and it can be used to analyse and discern behavioural patterns within an organization, which provides value to areas of interest within an organization (Priven and Sacks 2013; Castillo et al. 2015; Castillo et al. 2016). The SNA is also useful to discover the importance of informal structures that co-exist with formal structures within the organization. It serves as a way to adapt the structure of the organization, within a short period of time, as well as to organize solid, strong teams with respect to knowledge transfer (information flow). Finally, it can also be used to develop a relationship of close teamwork (Flores et al. 2014).
SNA can be used to detect patterns such as bottlenecks between teams, areas, groups and information sources, as well as identify disconnected areas or teams. We can better understand the organizational networks, observing connections between nodes and their collaborations, as well visualizing the characteristic patterns of networks such as groupings, and people’s proximity or distance (Alarcón et al. 2013).
3 METHODOLOGY For this study, we worked with the employees of nine architecture firms belonging to the AOA. Information was gathered regarding SNA, management practices and KPIs for these organizations. To develop the measurement instruments, multiple workshops of collaborative work were held in some of the offices with the researchers from PUC and UTFSM.
3.1: DEFINE MODEL SETTINGS
The questions were developed and validated by experts; the questions were adapted to the organizational model being studied. The participants of all the architecture firms responded to a survey to identify each of the networks. Networks were modeled for work interaction, exchange of work information as well as exchange of information regarding new ideas. Three networks were chosen which explained how work information and new ideas flowed within the organizations.
415 | Proceedings IGLC | July 2017 | Heraklion, Greece

Knowledge Management and Information Flow Through Social Networks Analysis in Chilean Architecture Firms
3.2: COLLECTING DATA WITH A SURVEY
Interviews were done with each office, using a virtual platform. The questions included: (1) Indicate the following individuals with which you have had a work interaction during the past 6 months; (2) of the individuals indicated by you, what is the frequency that you deal with relevant information regarding your work, (3) indicate how often you develop innovative work ideas with these people. The first question is a discriminatory question. The other two are based on a four point Likert scale. The four points are: “Less than once per month”, “One to three times per month”, “One to four times per week” and “Once or more times per day".
The required sample from each company was calculated to obtain a 95% confidence level. Questions 2 and 3 were done with a reliability analysis, receiving a Chronbach’s Alpha of 0.755, which indicates that the test is reliable.
3.3: PROCESS DATA
Data in Excel was exported to the free Gephi software, version 0.9.1. The choice to use this software, rather than other software, was the weight that experts give to it, as well as the open license agreement and the fact that it was free. Finally, the information was processed with the Force Atlas algorithm, which is designed to capture SN (Bastian et al. 2009)
3.4: EXAMINE DATA
The results were examined to determine connections or bottlenecks between teams and areas, organizational groups, as well as disconnected areas or groups and/or those that are too connected and act as a reference for organizational information. Alarcón et al. (2013) also state that it is important to take into account that the results of the analysis do not provide answers, but rather they indicate where and how we should ask questions. To examine data networks, we used network edges, medium degree, network diameter, network density and medium length of the path. And for the nodes was node in-degree, isolated nodes, referential nodes, intermediary nodes and node closeness, in the manner of Flores et al. (2014).
3.5: DISCOVER THE CONTEXT
Individual interviews were conducted with each office to understand the context of the data obtained. Through these interviews, we were able to understand the graphs, the network diagrams and the metrics obtained in the analysis.
Through these interviews, we were able to understand the office’s type of organizational structure, as well as the level of hierarchy and the model of information flow that exemplifies each office. We also asked them about the number of groups they were divided into and the size of projects they were implementing at the time the network information was gathered. To understand the networks, we asked questions developed by experts: Are there projects in their final phase that require a larger concentration of human resources? Are there communication channels available for isolated groups? Is it necessary to have teams that are isolated by their work capacity? Have new human resources been incorporated lately? Do you know if any human resources want to leave the organization or are going to leave? Should these work areas be connected?
416 | Proceedings IGLC | July 2017 | Heraklion, Greece

Lluís Segarra, Rodrigo F. Herrera, Luis F. Alarcón and Eugenio Pellicer
3.6: DEFINE AN ACTION PLAN
Anklam (2003) suggested three types of interventions to change the behavior patterns of organizations, which are: structural/organizational, the development of the knowledge network and individual/leadership. These interventions are used to read the networks and to adapt the organization. They can also be used to visualize patterns that are intuitively known to exist. These interventions also review the positions of the nodes. The idea is to create a structure that can adapt in real time to the organization’s demands.
4 RESULTS AND DISCUSSION The interviews resulted in the identification of networks, and their metrics, for nine architectural companies to understand the information flow and knowledge management in architectural firms. The intent of the research was to identify the relationship between the size of the networks and the metrics obtained.
The first network created was the network of overall interactions for a period of six months. This network did not discriminate by the amount or type of information that was transmitted. In fact, the networks of frequent work information and new idea information are sub-networks of the first, since they determine types of interactions with the individuals cited in the first question (Alarcón et al. 2013).
Consistent with the research done by Alarcón et al. (2013) and Flores et al. (2014), the higher density network -connections obtained among possible connections in the network- was the overall interaction network, reaching 90.5% for office A and 34.9% of office I; whereas in the case of the frequent information network, the metrics dropped to 54.8% for office A and 11.7% for office I. We were observed that the density diminished as the number of nodes increased. Also, density was directly related to the size of the offices–nodes; the larger the office, the less interconnected it was. In other words, the office with the fewest number of nodes had more resources to share relevant information (Flores et al. 2014). We could also observe that when there were more nodes, the median length of the path–average steps necessary to connect all the nodes in the network to each other–was longer (Figure 1).
Figure 1: Relationship between the number of nodes, density and the median
length of the path.
When we completed step 5 of the methodology –identifying the context of the offices– we found relationships between many variables. The interacting variables included: a) the work structures, b) the disposition of the human resources, c) the productive groups
0.548
0.372 0.350
0.5040.242
0.2140.207
0.167 0.117
1.5241.688 1.747
1.48
2.036
1.837
2.333
2.287
2.763
R²=0.93599
R²=0.86956
0.000
0.500
1.000
1.500
2.000
2.500
3.000
5 10 15 20 25 30 35 40 45 50Architecturalfirmsnodesnumber
Density
LengthofPath
417 | Proceedings IGLC | July 2017 | Heraklion, Greece

Knowledge Management and Information Flow Through Social Networks Analysis in Chilean Architecture Firms
separated by size when the data was collected, d) densities, e) median length of path, and f) shape of the networks. We found that there is a direct relationship between the resulting networks and the formal structure that the companies adopted as organizations. There is a clear difference between the two visual forms of the network; Office D network had a circular shape and Office I had a star shape (Figure 2). The one with the circular shape is related to greater integration of the information flow (Flores et al. 2014). Also, the difference in the nodes indicated that when the nodes increased in size, these were named by a greater number of other nodes of the organization, represented by the connectivity lines between them. Office D, which was the smallest, had a basic functional structure that currently is migrating toward a matrix organization. We observed that the floor layout and the office distribution do not have architectural barriers. The form obtained was practically round. On the other hand, Office I has a very hierarchical pyramid structure and is divided into three stories in one building. In this case –and with other two offices–, we observed that the resulting network was in the shape of a star.
Figure 2: Frequent work information networks from office D and Office I.
Finally, we observed that the density percentage of the frequent work information network is directly related to the number of work groups that the offices indicated that they had at the time the snapshot was taken (Figure 3). For example, the higher density of work information flow network was 54.80% that corresponded a firm with two teams and the lower density of work information flow network was 11.70% that corresponded a firm with nine teams.
Figure 3: Relationship between the density of the frequent information network
and the number of work teams in each office.
54.80%
37.20%
35.00%
50.40%
24.20%
21.40%
20.70%
16.70%
11.70%
R²=0.74217
0.00%
10.00%
20.00%
30.00%
40.00%
50.00%
60.00%
2 3 4 5 6 7 8 9
Densityofworkinformationflow
Numberofteams
418 | Proceedings IGLC | July 2017 | Heraklion, Greece

Lluís Segarra, Rodrigo F. Herrera, Luis F. Alarcón and Eugenio Pellicer
5 CONCLUSIONS
The results presented indicate the following conclusions: Similar to the analysis of AEC industries, the analysis of the architecture firms also
generated opportunities for improvement. Offices with a highly hierarchical structure tended to have a network structure in the shape of a star (e.g. Figure 2 Office I), whereas offices with basic functional or matrix structures tended to have a round network structure (e.g. Figure 2 Office D). At the same time, we could see that organizations with basic functional or matrix structures were the smallest firms (few nodes) and the biggest were hierarchically structured companies (many nodes). This allowed us to confirm that when there are fewer nodes, there are more resources to share relevant information; because relationships and communication within small groups is easier. Therefore, information flow and knowledge management were direct because they travelled a shorter distance.
As indicated by Flores et al. (2014), in the first feedback meeting it became clear that it would be difficult to interpret the results, and then later translate them and incorporate them into actions. They recommended the development of a methodology that integrates SNA with relevant concepts of organizational psychology to provide specific suggestions and to envision opportunities for change.
Finally, the research was limited to the initial survey of networks in architecture firms; there were similarities with AEC industries, but it is important to note that it was a snapshot in a moment of the life of the companies. The results obtained represent the temporary limited reality for the research period (Castillo et al. 2015). To add value and to know if there is improvement, it would be necessary to undertake a second study. That would make it possible to see if specific actions resulted in improvements or not. Also, it is important to study the correlation that exists between the SNA metrics, the KPIs and the management practices that are evidenced in the benchmarking study.
6 ACKNOWLEDGMENTS We thank our colleagues in GEPUC and GEPRO. We also thank our universities - UPV and PUC – for considering us for this research. Also, we thank the companies in AOA for providing us with their organizational structures and sharing how they work. Finally, we acknowledge financial support for PhD studies from VRI of PUC.
7 REFERENCES Alarcón, D. M., Alarcón, I. M. and Alarcón, L. F. (2013). Social network analysis: A
diagnostic tool for information flow in the AEC industry. In: The International Group for Lean Construction, pp. 196–205.
Anklam, P. (2003)- KM and the social network. , Analysis, 6(May), pp. 24–28. Available at: http://www.jedbrubaker.com/wp-content/uploads/2010/02/brubaker-vertesi-death-sns.pdf.
Bastian, M., Heymann, S. and Jacomy, M. (2009). Gephi: An Open Source Software for Exploring and Manipulating Networks. In: Third International AAAI Conference on Weblogs and Social Media, pp. 361–362. doi: 10.1136/qshc.2004.010033.
Castillo, T., Alarcón, L. F. and Salvatierra, J. L. (2016). Last Planner System, social networks and performance of construction projects. In: IGLC 2016 - 24th Annual Conference of the International Group for Lean Construction, pp. 1–10.
419 | Proceedings IGLC | July 2017 | Heraklion, Greece

Knowledge Management and Information Flow Through Social Networks Analysis in Chilean Architecture Firms
Castillo, T., Alarcón, L. F., Salvatierra, J. L. and Alarcón, D. (2015). Analyzing the Interrelation Between Management Practices, Organizational Characteristics and Performance Analyzing the Interrelation Between Management Practices, Organizational Characteristics and Performance Indicators for. In: IGLC 2015 - 23rd annual conference of the International Group for Lean Construction, Perth, Australia, pp. 691–700.
Flores, J., Ruiz, J. C., Alarcón, D., Alarcón, L. F., Salvatierra, J. L. and Alarcón, I. (2014). Improving Connectivity and Information Flow in Lean Organizations - Towards an Evidence-Based Methodology. In: IGLC 2014 - 22nd Annual Conference of the International Group for Lean Construction, pp. 1109–1120.
Greenwood R, Empson, L. (2003). The professional partnership: Relic or exemplary form of governance?, Organization Studies, 24(6), pp. 909–933.
Hoppe, B. and Reinelt, C. (2010). Social network analysis and the evaluation of leadership networks, Leadership Quarterly, 21(4), pp. 600–619. doi: 10.1016/j.leaqua.2010.06.004.
Oluwatayo, A. A. and Amole, D. (2013). Ownership, structure, and performance of architectural firms, Frontiers of Architectural Research. Elsevier, 2(1), pp. 94–106. doi: 10.1016/j.foar.2012.12.001.
Oluwatayo, A. A. and Amole, D. (2014). Organizational Structure of Architectural Firms and Their Performances, International Journal of Construction Engineering and Management, 3(1), pp. 1–12. doi: 10.5923/j.ijcem.20140301.01.
Priven, V. and Sacks, R. (2013). Social network development in Last Planner System implementations. In: IGLC 2013 - 21st Annual Conference of the International Group for Lean Construction 2013, IGLC 2013, pp. 474–485. Available at: https://www.engineeringvillage.com/share/document.url?mid=cpx_772ff42f147219c4589M39cd10178163125&database=cpx.
Zayed, T., Elwakil, E. and Ammar, M. (2012). A Framework for Performance Assessment of Organizations in the Construction Industry, International Journal of Architecture, Engineering and Construction, 1(4), pp. 199–212. doi: 10.7492/IJAEC.2012.022.
Zhou, H. and de Wit, G. (2009). Determinants and dimensions of firm growth. , SCALES - Scientific AnaLysis of Entrepreneurship and SMEs, (February). Available at: http://www.entrepreneurship-sme.eu/pdf-ez/H200903.pdf.
420 | Proceedings IGLC | July 2017 | Heraklion, Greece

Smith, J. P., and Ngo, K. (2017). “Implementation of Lean Practices Among Finish Contractors in The Us.” In: LC3 2017 Volume II – Proceedings of the 25th Annual Conference of the International Group for Lean Construction (IGLC), Walsh, K., Sacks, R., Brilakis, I. (eds.), Heraklion, Greece, pp. 421-428. DOI https://doi.org/10.24928/2017/0182
IMPLEMENTATION OF LEAN PRACTICES AMONG FINISHING CONTRACTORS IN THE US
James P. Smith1 and Khoi Ngo2
Abstract: Many parties to the construction process have implemented lean construction practices to improve efficiency within their respective scopes of work. Academics have researched a wide range of these applications in an effort to assess barriers, benefits, and other associated impacts. One area of construction that is currently under-represented in lean literature is finishing contractors. The purpose of this paper was to assess lean implementation by finishing contractors in the US. 33% of the sample of contractors specializing in the finishing methods reported implementation of some level of lean practices. For those attempting lean, the most common tool being utilized was Last Planner System. The same group reported that implementation was driven by a desire to improve efficiency by cutting costs and reducing schedules. Non-practicing respondents indicated that the primary barrier to implementation was a lack of knowledge in the area.
Keywords: Lean construction, finishing contractors, subcontractors, lean implementation
1 INTRODUCTION Lean principles have been successfully implemented by contractors over recent years. Various studies have shown improved efficiency in terms of cost and time as well as other criteria (McGraw Hill 2013). In a relatively comprehensive report, McGraw Hill (2013) stated that 84% of lean practitioners reported that adopting lean led to higher quality projects, 74% reported reduced project schedule, and 80% reported greater customer satisfaction.
In the niche of building finishing, contractors are often smaller and may have limited knowledge and training with lean practices. According to the North American Industry Classification System Association (NAICS) code #2383, "Building Finishing" contractors includes the following specific trades: drywall, insulation, painting and wall covering, flooring, and finish carpentry. The portion of a construction job that is related to building finishing, especially in the commercial and residential industry, can be relatively time consuming and costly. In the average single family house, the interior finishes cost nearly 30% of the total construction (Taylor 2014). In the average apartment complex, building finishes average around 12% of the total project cost (RSMeans 2015).
The application of lean principles in various areas of the construction process has been well-documented in the literature. However, research regarding the implementation of lean practices among building finishing contractors is lacking. The purpose of this research project was to analyze the current level of lean implementation among building
1 Assistant Professor, School of Technology, Department of Construction and Facilities Management,
Brigham Young University, Provo, UT, USA, [email protected] 2 Masters Degree Student, Department of Construction Science and Management, Clemson University,
Clemson, SC, USA, [email protected]
421 | Proceedings IGLC | July 2017 | Heraklion, Greece

Implementation of Lean Practices Among Finish Contractors in The Us
finishing contractors in the US. More specifically, the following research questions related to building finishing contractors were addressed:
• How common is lean implementation?
• What are the drivers, challenges, benefits and barriers to implementation of lean practices?
This research provides a starting place for analysis of lean implementation in building finishing. It provides a sense of the current state for interested researchers and industry practitioners alike and provides a benchmark of understanding for future work in the area.
2 LITERATURE REVIEW
2.1 Lean Implementation
Lean construction is a "way to design production systems to minimize waste of materials, time, and effort in order to generate the maximum possible amount of value," (Koskela et al. 2002). The lean philosophy and principles originated in the manufacturing industry but are now commonly used by a variety of industries and trades.
In order to populate the survey with appropriate possible answers, literature describing lean implementation drivers, potential impact areas, common practices, benefits, and barriers and challenges was reviewed. It was determined that the data collected and presented in the report by McGraw Hill (2013) was an appropriate representation of general industry practice and opinion (see also Alarcon et al. 2005; Sarhan and Fox 2012). As such, the majority of potential answers were selected from that report. However, the McGraw Hill report only provided data regarding general contractors and specialty trade contractors (concrete, curtain wall, electrical, glazing/panels, MEP, masonry, roofing, steel erection and fabrication, thermal and moisture control, and vertical transportation. Building finishing contractors were missing from this study.
2.1.1 Drivers
McGraw Hill (2013) identified the top drivers for lean construction implementation. This list included 1) client influence, 2) need to increase profitability/cut costs, 3) leadership interest in this area, 4) need to keep up with/ahead of competition, 5) concerns about worker safety, 6) need to decrease project schedule, 7) improved sustainability, and 8) workforce concerns.
2.1.2 Potential Impact Areas
Kim (2002) assessed the impact of lean implementation for general contractors and sub-contractors along the following criteria: 1) managerial time & attention, 2) job satisfaction, 3) turnover & absenteeism, 4) competitiveness, 5) planning & coordination, 6) involvement & commitment, 7) fire-fighting, 8) productivity, 9) unplanned overtime, 10) rework, 11) resources availability, 12) working conditions, 13) wasted time, and 14) work assignments. These criteria will be used to assess the effectiveness of lean according to lean practitioners.
2.1.3 Lean Practices
There are a wide variety and continually increasing amount of practices and tools that a contractor can implement in their attempt to become more "lean". Based on the literature review and definitions provided by the Lean Construction Institute, twelve common lean practices were identified and defined in the survey.
422 | Proceedings IGLC | July 2017 | Heraklion, Greece

James P. Smith and Khoi Ngo
2.1.4 Benefits
Reported benefits of lean in extant literature relate to quality, human factors, and productivity improvements (e.g., Kung et al. 2008). These projects suggest that lean principles are effective not only in complicated processes, but also in simple processes. Yu et al. (2013) reported a case study of a U.S. modular building producer, which witnessed a 10% improvement in labor efficiency, and a production improvement of 50% within six months of implementation. Additional benefits discussed in the literature include positive environmental impacts (Ghosh et al. 2014), and potential safety improvements (Saurin et al. 2002) among others.
2.1.5 Barriers and Challenges
Although lean implementation has shown a number of benefits, adoption in the construction industry is still slow. McGraw Hill (2013) provided thirteen challenges to lean implementation facing contractors. These challenges include both internal and external barriers that companies have faced. The challenges identified were 1) lack of knowledge, 2) lack of industry support, 3) lack of standards, 4) lack of sufficient support from project team, 5) employee resistance, 6) inadequate commitment from top management, 7) concern regarding time required for implementation and application, 8) profitability concern, 9) union resistance, 10) lean complexity concern, 11) lack of understanding customers’ needs, 12) lack of progress measurement, and finally, an 13) overall lack of supporting lean culture.
3 METHODOLOGY
3.1 Survey
Data was collected using an online survey. Survey respondents were randomly selected from the publicly available member directory of the Finishing Contractors Association (FCA). Respondents had various specialties (e.g., painting, drywall finishing, etc.) but were all involved in the finishing stage of a construction project as previously defined. The sample also represented different regions and different company sizes providing a broad view of finishing contractors in the US. The survey was sent to 300 possible respondents, from which 24 valid responses were received. Applicable questions on the survey included an "other" category to allow respondents to give additional answers.
The survey was designed to collect information from two different groups within the sample. Depending on whether or not respondents claimed to have experience with lean implementation determined which set of questions they were given. One version of the survey focused on finishing contractors currently practicing any level of lean implementation. The other had questions tailored to finishing contractors that have not implemented any specific lean practices. The self-proclaimed lean practitioners were asked:
• Background questions
• Which lean practices they had implemented
• The drivers for implementing lean
• The challenges they experienced
• The differences experienced between lean projects and traditional projects Non-practitioner respondents were asked:
423 | Proceedings IGLC | July 2017 | Heraklion, Greece

Implementation of Lean Practices Among Finish Contractors in The Us
• Background questions
• What barriers prevented them from implementing lean practices
3.2 Limitations
This research is limited by the relatively low response rate and the low total number of respondents. As such, it is not possible to generalize results to the industry. Additionally, since the survey was a self-report mechanism, it is possible that there may be respondents practicing lean principles that don't realize it, and conversely, respondents thinking they are practicing lean principles without actually doing it. It is also possible that respondents may have differing interpretations of the lean terms included in the survey.
4 RESULTS AND ANALYSIS
4.1 Respondent Backgrounds
In keeping with the wider population, the majority of respondents were small contractors. 62% had less than 50 employees and almost 50% had an annual volume of less than $10 million. Regional involvement of the respondents was heavier in the Southeast (12), but each region was represented with the Western region having the smallest representation (4). The majority of companies that self-reported as "non-practitioners" have an annual volume <$10M, while nearly 65% of those practicing some level of lean have an annual volume >$50M. This suggests a relationship between the scale of the contractor and awareness and implementation of lean. This is not necessarily surprising as process efficiency improvements have a greater impact over higher volumes of work.
Despite an apparent awareness of room for improvement within the finishing processes (over 90% perceived building finishing as less than efficient), only 33.3% of the survey respondents reported having implemented any of the provided lean practices. This could suggest a lack of awareness of the potential benefits of lean.
4.2 Currently Implemented Lean Practices
Respondents that were currently implementing some form of lean were asked to identify specific practices they had implemented. Each practice included a brief description on the survey to normalize responses. Figure 1 shows the percentage of practicing respondents that utilize each of the lean practices.
Figure 1: Lean practices currently implemented by practicing finishing contractors
0.0% 10.0% 20.0% 30.0% 40.0% 50.0% 60.0% 70.0% 80.0%
ChoosingbyAdvantagesMulti-PartyContracts
First-runStudiesIncreasedVisualization
OtherBigRoom
Just-In-TimeValueStreamMappingTargetValueDesign
FiveS'sFailSafeforQualityHuddleMeetings
LastPlannerSystem
424 | Proceedings IGLC | July 2017 | Heraklion, Greece
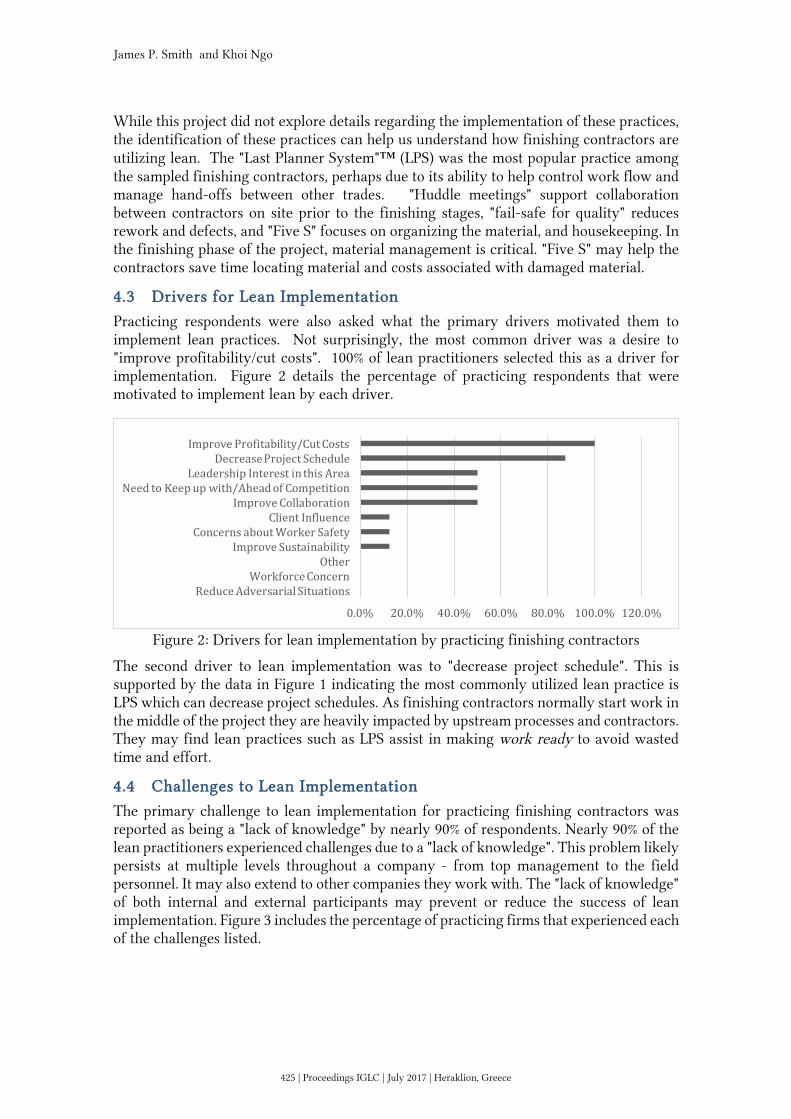
James P. Smith and Khoi Ngo
While this project did not explore details regarding the implementation of these practices, the identification of these practices can help us understand how finishing contractors are utilizing lean. The "Last Planner System"™ (LPS) was the most popular practice among the sampled finishing contractors, perhaps due to its ability to help control work flow and manage hand-offs between other trades. "Huddle meetings" support collaboration between contractors on site prior to the finishing stages, "fail-safe for quality" reduces rework and defects, and "Five S" focuses on organizing the material, and housekeeping. In the finishing phase of the project, material management is critical. "Five S" may help the contractors save time locating material and costs associated with damaged material.
4.3 Drivers for Lean Implementation
Practicing respondents were also asked what the primary drivers motivated them to implement lean practices. Not surprisingly, the most common driver was a desire to "improve profitability/cut costs". 100% of lean practitioners selected this as a driver for implementation. Figure 2 details the percentage of practicing respondents that were motivated to implement lean by each driver.
Figure 2: Drivers for lean implementation by practicing finishing contractors
The second driver to lean implementation was to "decrease project schedule". This is supported by the data in Figure 1 indicating the most commonly utilized lean practice is LPS which can decrease project schedules. As finishing contractors normally start work in the middle of the project they are heavily impacted by upstream processes and contractors. They may find lean practices such as LPS assist in making work ready to avoid wasted time and effort.
4.4 Challenges to Lean Implementation
The primary challenge to lean implementation for practicing finishing contractors was reported as being a "lack of knowledge" by nearly 90% of respondents. Nearly 90% of the lean practitioners experienced challenges due to a "lack of knowledge". This problem likely persists at multiple levels throughout a company - from top management to the field personnel. It may also extend to other companies they work with. The "lack of knowledge" of both internal and external participants may prevent or reduce the success of lean implementation. Figure 3 includes the percentage of practicing firms that experienced each of the challenges listed.
0.0% 20.0% 40.0% 60.0% 80.0% 100.0% 120.0%
ReduceAdversarialSituationsWorkforceConcern
OtherImproveSustainability
ConcernsaboutWorkerSafetyClientInfluence
ImproveCollaborationNeedtoKeepupwith/AheadofCompetition
LeadershipInterestinthisAreaDecreaseProjectSchedule
ImproveProfitability/CutCosts
425 | Proceedings IGLC | July 2017 | Heraklion, Greece

Implementation of Lean Practices Among Finish Contractors in The Us
Figure 3: Lean implementation challenges for practicing finishing contractors
4.5 Benefits of Lean Implementation
Practicing respondents were asked to compare their experience with lean projects versus traditional projects along a number of criteria. Table 2 includes the descriptive statistics from the responses. Respondents were given a 5-point scale where 5 indicated that the lean project was "much better" and 1 indicated that the lean project was "much worse".
Table 2: Lean implementation benefits for practicing finishing contractors
Description Mean SD
Planning and coordination 4.50 0.53
Client job satisfaction 4.00 0.00
Involvement and commitment of the contractors 3.75 0.71
Productivity 3.63 0.52
Managerial time and attention consumed 3.50 0.53
Working conditions (overcrowded work area, crew interference and stacking of trades)
3.50 0.93
Resources availability (materials, tools, equipment and information) 3.38 0.52
Turnover and absenteeism 3.13 0.35
Number of unexpected and urgent problems experienced 2.75 0.70
Rework due to common problems (design changes, priority order and prerequisite work)
2.75 0.71
Unplanned over time 2.50 0.76
Wasted time (waiting and idle time) 2.50 1.07
Perhaps the most noticeable difference claimed by practitioners is in the improved "planning and coordination" experienced on lean projects (avg = 4.5). Client job satisfaction, contractor involvement and commitment and productivity also showed
0.0% 20.0% 40.0% 60.0% 80.0% 100.0%
OtherLackofUnderstandingCustomers'Needs
LeanComplexityConcernUnionResistance
ProfitabilityConcernLackofProgressMeasurement
LackofSupportfromProjectTeamLackofLeanCulture
TimeConsumingConcernEmployeeResistance
TopManagementCommitmentLackofIndustrySupport
LackofStandardsLackofKnowledge
426 | Proceedings IGLC | July 2017 | Heraklion, Greece
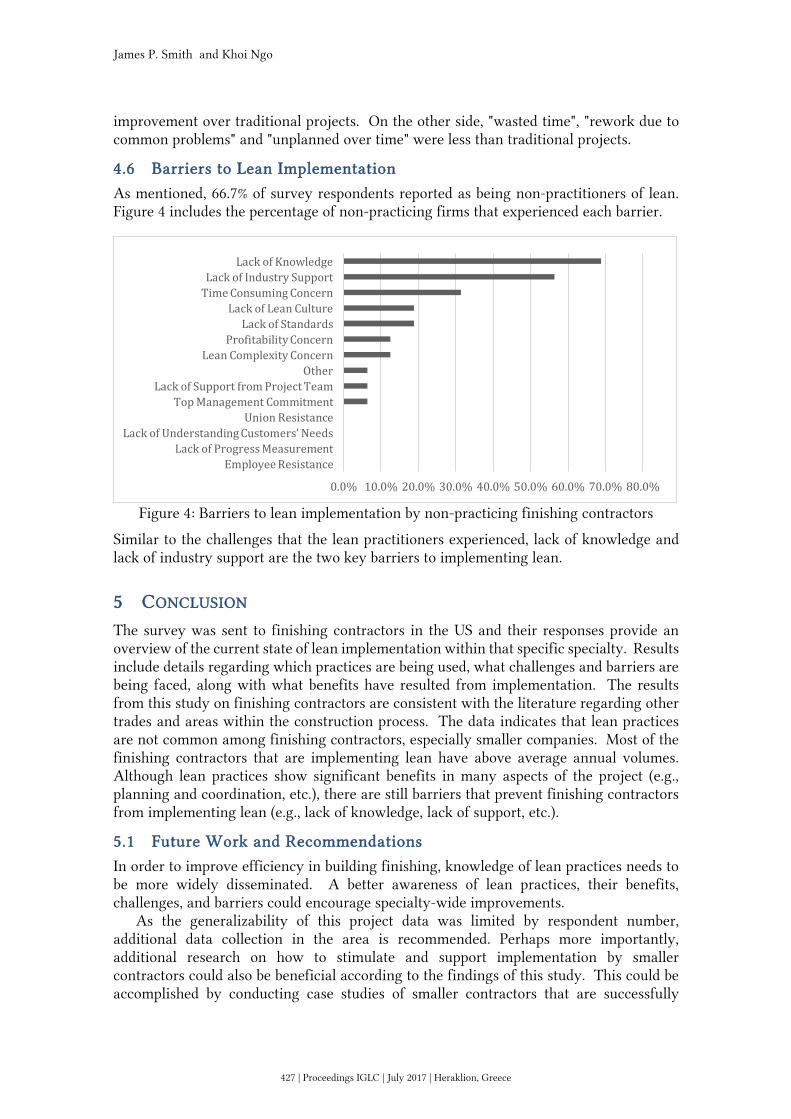
James P. Smith and Khoi Ngo
improvement over traditional projects. On the other side, "wasted time", "rework due to common problems" and "unplanned over time" were less than traditional projects.
4.6 Barriers to Lean Implementation
As mentioned, 66.7% of survey respondents reported as being non-practitioners of lean. Figure 4 includes the percentage of non-practicing firms that experienced each barrier.
Figure 4: Barriers to lean implementation by non-practicing finishing contractors
Similar to the challenges that the lean practitioners experienced, lack of knowledge and lack of industry support are the two key barriers to implementing lean.
5 CONCLUSION The survey was sent to finishing contractors in the US and their responses provide an overview of the current state of lean implementation within that specific specialty. Results include details regarding which practices are being used, what challenges and barriers are being faced, along with what benefits have resulted from implementation. The results from this study on finishing contractors are consistent with the literature regarding other trades and areas within the construction process. The data indicates that lean practices are not common among finishing contractors, especially smaller companies. Most of the finishing contractors that are implementing lean have above average annual volumes. Although lean practices show significant benefits in many aspects of the project (e.g., planning and coordination, etc.), there are still barriers that prevent finishing contractors from implementing lean (e.g., lack of knowledge, lack of support, etc.).
5.1 Future Work and Recommendations
In order to improve efficiency in building finishing, knowledge of lean practices needs to be more widely disseminated. A better awareness of lean practices, their benefits, challenges, and barriers could encourage specialty-wide improvements.
As the generalizability of this project data was limited by respondent number, additional data collection in the area is recommended. Perhaps more importantly, additional research on how to stimulate and support implementation by smaller contractors could also be beneficial according to the findings of this study. This could be accomplished by conducting case studies of smaller contractors that are successfully
0.0% 10.0% 20.0% 30.0% 40.0% 50.0% 60.0% 70.0% 80.0%
EmployeeResistanceLackofProgressMeasurement
LackofUnderstandingCustomers'NeedsUnionResistance
TopManagementCommitmentLackofSupportfromProjectTeam
OtherLeanComplexityConcern
ProfitabilityConcernLackofStandards
LackofLeanCultureTimeConsumingConcernLackofIndustrySupport
LackofKnowledge
427 | Proceedings IGLC | July 2017 | Heraklion, Greece

Implementation of Lean Practices Among Finish Contractors in The Us
implementing lean practices. Improvements in this area would help a large portion of the building finishing industry take advantage of the benefits associated with lean practices.
6 REFERENCES
Alarcón, L.F., Diethelm, S., Rojo, O. & Calderon, R. (2005). Assessing the Impacts of Implementing Lean Construction. In: 13th Annual Conf. of the IGLC. [online] Sydney, Australia: IGLC, pp. 387-393. Available at: http://www.iglc.net/Papers [accessed 13 Dec. 2016].
Ghosh, S., Bhattacharjee, S., Pishdad-Bozorgi, P. & Ganapathy, R. (2014). A Case Study to Examine Environmental Benefits of Lean Construction. In: 22nd Annual Conf. of the IGLC. [online] Oslo, Norway: IGLC, pp. 133-144. Available at: http://www.iglc.net/Papers [accessed 13 Dec. 2016].
Kim, D. (2002). Exploratory study of lean construction: Assessment of lean implementation. Ph.D. University of Texas at Austin.
Koskela, L., Howell, G., Ballard, G. and Tommelein, I. (2002). The foundations of lean construction. In: Design and Construction: Building in Value. Oxford, UK: Butterworth-Heinemann, pp. 211-226.
Kung, D., Alex, D. P., Al-Hussein, M., & Fernando, S. (2008). Application of lean thinking to improve the productivity of water and sewer service installations. Canadian J. Civ. Eng., [online] 35(4), pp. 418–430. Available at: http://www.nrcresearchpress.com/doi/pdf/10.1139/L07-136 [accessed 14 Dec. 2016]
McGraw Hill Construction (2013). Lean Construction: Leveraging Collaboration and Advanced Practices to Increase Project Efficiency. Bedford, MA. Available at: http://www.leanconstruction.org/media/docs/Lean_Construction_SMR_2013.pdf [accessed 14 Dec. 2016].
RS Means (2015). Building Construction Cost Data. RS Means Company. Sarhan, S. & Fox, A. (2012). Trends and Challenges to the Development of a Lean Culture
Among UK Construction Organisations. In: 20th Annual Conf. of the IGLC. [online] San Diego, US: IGLC, pp. 1151-1160. Available at: http://www.iglc.net/Papers [accessed 13 Dec. 2016].
Saurin, T. A., Formoso, C. T., & Cambraia, F. B. (2006). Towards a common language between Lean production and safety management. In: 14th Annual Conf. of the IGLC. [online] Santiago, Chile: IGLC. Available at: http://www.iglc.net/Papers [accessed 13 Dec. 2016].
Taylor, H. (2014). Cost of Constructing a Home. Special Studies, Economics and Housing Policy. Washington DC: National Association of Home Builders.
Yu, H., Al-Hussein, M., Al-Jibouri, S., & Telyas, A. (2013). Lean transformation in a modular building company: A case for implementation. Journal of Management in Engineering, [online] 29(1), pp. 103-111. Available at: http://ascelibrary.org/doi/pdf/10.1061/(ASCE)ME.1943-5479.0000115 [accessed 14 Dec. 2016]
428 | Proceedings IGLC | July 2017 | Heraklion, Greece

Carvalho B. and Scheer S. (2017). “Analysis and Assessment for Lean Construction Adoption: The DOLC Tool.” In: LC3 2017 Volume II – Proceedings of the 25th Annual Conference of the International Group for Lean Construction (IGLC), Walsh, K., Sacks, R., Brilakis, I. (eds.), Heraklion, Greece, pp. 429–435. DOI: https://doi.org/10.24928/2017/0117
ANALYSIS AND ASSESSMENT FOR LEAN CONSTRUCTION ADOPTION: THE DOLC TOOL
Bruno Soares de Carvalho1 and Sergio Scheer2
Abstract: Construction companies have difficulties to measure the performance of their efforts regarding the use and application of the Lean Construction philosophy. To serve as support for this development, a tool called DOLC was created to analyze and assess the degree of Lean Construction of a construction company. Based on the 11 principles of Koskela (1992), the DOLC performs the analysis involving 5 (five) different stakeholders: directors, engineers, construction workers, suppliers and designers of a construction company. This tool generates an index for the establishment of improvement by the analyzed constructors. In this paper, 35 case studies are presented between 2008 and 2016, in which the tool was used in Brazil, applied by different researchers and presented in published papers. Based on this research, an overview on the conditions of use of Lean Construction in Brazil is presented..
Keywords: Lean construction, DOLC, Degree of Lean Construction.
1 INTRODUCTION Lean Construction (LC) is a theory-based methodology for construction (Koskela et al 2002). Projects are temporary production systems (Ballard and Howell 2003) and Lean Construction is a way of designing systems to minimize waste and generate maximum value (Ballard and Howell 2003; Koskela et al 2002). The concept emphasizes waste elimination throughout activities and operations without compromising the client’s value (Liker 2005). By implementing LC in projects, clients may improve their project delivery regarding cost, quality and time.
Analyses to evaluate the quality and application status of high abstract principles of LC in construction projects or companies are mostly restricted to qualitative measures (Hofaker at al. 2008). Initiatives, such as the one of Hofaker et al (2008), have collaborated so that the concept of the assessment of the degree of Lean Construction could be better understood. Hofaker’s measurement instrument is called LCR (Rapid Lean Construction – Quality Rating Model) and seeks to quickly assess the Lean status of a construction company.
This paper presents the conclusions of a survey of Lean Construction use, which was applied in Brazil. The survey was developed by gathering a compilation of 10 (ten) papers that have all used analysis and assessment tools of Lean Construction application in 35 (thirty-five) construction companies in Brazil, using in a tool called DOLC (Degree of Lean Construction). According to the CBIC (Brazilian Chamber of Construction Industry), from 2008 to 2015, the civil construction market represented between 4.4% and 6.6% of the Brazilian GDP. In 2015, there was a decline of 7.6% of this market compared to 2014, due to a severe economic crisis experienced in the country.
1 PhD Student, PPGECC - Post Graduation Program in Construction Engineering. Universidade Federal
do Parana, Brazil. [email protected] 2 Professor, Civil Engineering Research Center. Universidade Federal do Parana, Brazil. [email protected]
429 | Proceedings IGLC | July 2017 | Heraklion, Greece

Analysis and Assessment for Lean Construction Adoption: The DOLC Tool
This represents a scenario of challenges and opportunities that can be envisioned by agents in this market. Lean Construction collaborates in this context as it provides the developer with greater efficiency, flexibility and ability to generate higher value for the products and services offered compared to traditional methods of construction management.
2 DOLC - DEGREE OF LEAN CONSTRUCTION
Since Koskela (1992) presented Lean Construction to the world as the new production philosophy for the civil construction sector, it has not been established as a widespread philosophy among Brazilian construction companies. There is lack of knowledge by the vast majority of the contractors on the competitive advantages to be obtained with the application of this technique (Alarcon et al 2005).
The proposed model of analysis and assessment, here called DOLC, diagnoses the current state of a construction company in relation to the level of implementation of concepts of lean construction that this company has established (Carvalho 2008).
The DOLC indicates that the construction companies may have Lean Construction applied in a partial way and adapt its use according to several variables, such as: opportunity, competitiveness, time and resources available, employee abstraction abilities, among others (Carvalho 2008).
The DOLC will indicate which of the key points of the lean philosophy that the construction company has applied more prominently and which key points the constructor has a less expressive performance. This way, opportunities are created to identify, classify and improve lean performance in construction companies (Carvalho 2008).
The DOLC tool was based on the 11 principles elaborated by Koskela (1992), which are listed below:
1. Reduce the share of non-value-adding activities. 2. Increase output value through systematic consideration of customer requirements. 3. Reduce variability. 4. Reduce the cycle time. 5. Simplify by minimizing the number of steps, parts and linkages. 6. Increase output flexibility. 7. Increase process transparency. 8. Focus control on the complete process. 9. Build continuous improvement into the process. 10. Balance flow improvement with conversion improvement. 11. Benchmark. The goal of the DOLC tool is to point out difficulties found by researchers and
contractors in establishing a methodology for the implementation of the Lean Construction philosophy, for those contractors who desire to engage in this production philosophy.
When a contractor needs to decide on whether to deploy the philosophy of Lean Construction in their business, doubts arise, especially when they ask themselves this question: "How can I start the deployment of Lean Construction?".
It was observed that the contractors generally do not have comprehensive knowledge about the current state of their own management status in relation to the basic concepts of Lean Construction. The DOLC intends to fill this gap, providing the user with a tool that allows them to investigate the use of Lean Construction among the main agents
430 | Proceedings IGLC | July 2017 | Heraklion, Greece

Bruno Soares de Carvalho and Sergio Scheer
involved in the value chain of their construction company. Contractors don't need any kind of Lean Construction knowledge before to starting the assessment.
Therefore, the contractor who applies this questionnaire in his business can map out their strengths and weaknesses, resulting in a clear understanding of their current situation. Consequently, they could be ready to establish their own plan for improvement, based on the assessment provided by the areas analyzed, in the search for developing their business and customer satisfaction.
Contractor’s knowledge about the current state of their business is critical to setting goals and action plans for their future state. Without this understanding, there is a risk of making efforts in the opposite direction to what their real business needs are. As a result, this could lead up to the disbelief in the competitive advantages of this management philosophy as well as unsatisfactory results for the contractor.
It is assumed that all contractors have in their organizations characteristics of Lean Construction, which are applied with greater or lesser efficiency.
Among other advantages already discussed in literature, the deployment of Lean Construction, when performed with an appropriate methodology, tends to leverage the gains in productivity, improve profitability, and reduce waste inherent to the construction process.
The DOLC is divided into five (5) questionnaires and they must all be answered by at least one person representing each of the categories of stakeholders: directors, engineers, construction workers, suppliers and designers. The tool can be applied to any contractor, regardless of whether they apply the Lean Construction philosophy or not.
The application of the questionnaire among these five different stakeholders aims to establish information for each department in different areas, as well as a general evaluation of the value chain where the company is involved.
The questionnaire has 204 multiple choice questions and the rating scale ranges from 0 to 3, as figure 1.
Figure 1 - Degree of Lean Construction.
The questionnaire weighs all principles and all questions equally, to ensure that all principles have the same importance in the DOLC tool.
The result is obtained through the arithmetic averages of the partial results identified among the stakeholders in each of the principles analyzed.
3 RESULTS, METHODOLOGY AND ANALYSIS From 2008 to 2016, 10 (ten) papers that describe the use of the DOLC tool were published. These works are presented in table 1.
431 | Proceedings IGLC | July 2017 | Heraklion, Greece
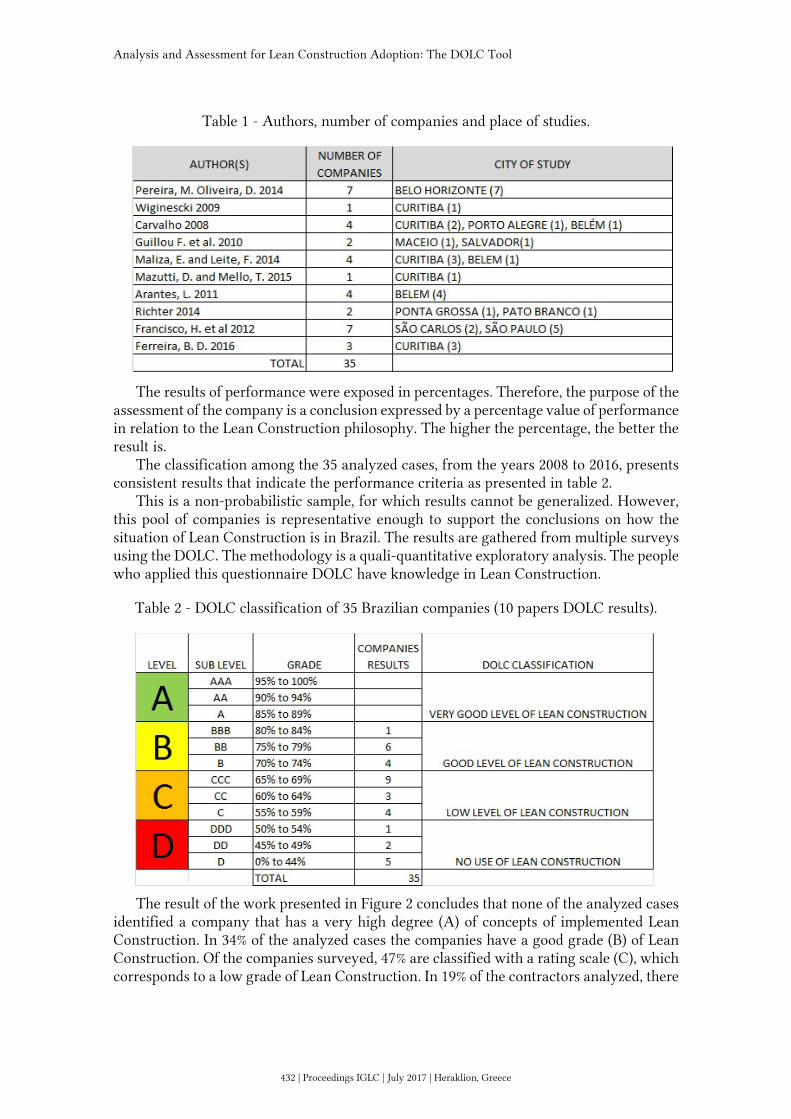
Analysis and Assessment for Lean Construction Adoption: The DOLC Tool
Table 1 - Authors, number of companies and place of studies.
The results of performance were exposed in percentages. Therefore, the purpose of the
assessment of the company is a conclusion expressed by a percentage value of performance in relation to the Lean Construction philosophy. The higher the percentage, the better the result is.
The classification among the 35 analyzed cases, from the years 2008 to 2016, presents consistent results that indicate the performance criteria as presented in table 2.
This is a non-probabilistic sample, for which results cannot be generalized. However, this pool of companies is representative enough to support the conclusions on how the situation of Lean Construction is in Brazil. The results are gathered from multiple surveys using the DOLC. The methodology is a quali-quantitative exploratory analysis. The people who applied this questionnaire DOLC have knowledge in Lean Construction.
Table 2 - DOLC classification of 35 Brazilian companies (10 papers DOLC results).
The result of the work presented in Figure 2 concludes that none of the analyzed cases
identified a company that has a very high degree (A) of concepts of implemented Lean Construction. In 34% of the analyzed cases the companies have a good grade (B) of Lean Construction. Of the companies surveyed, 47% are classified with a rating scale (C), which corresponds to a low grade of Lean Construction. In 19% of the contractors analyzed, there
432 | Proceedings IGLC | July 2017 | Heraklion, Greece

Bruno Soares de Carvalho and Sergio Scheer
is lack of knowledge about the philosophy of Lean Construction or the non-use of the philosophy by its management, resulting in a degree (D).
Figure 2 – Classification breakdown of the 35 studied companies in Brazil.
The 35 case studies were compiled in figure 3 to demonstrate the situation of the 11 principles proposed by Koskela (1992). It is possible to identify the need and a way for the Brazilian construction industry to develop proposals and actions in favor of Lean Construction, therefore, valuing this important sector of the Brazilian economy and, with that, collaborating with aspects of economic and environmental development.
Figure 3 – Classification breakdown of the 35 Brazilian companies, around the 11
Principles of Lean Construction.
It valid to note that item 04, which relates to “reducing the cycle time”, among the 11 fundamental principles of Lean Construction, is the least developed with performance of
433 | Proceedings IGLC | July 2017 | Heraklion, Greece

Analysis and Assessment for Lean Construction Adoption: The DOLC Tool
only 48% of the average among the companies analyzed. With that, it was classified with sub level (DD). The best result among all 11 principles analyzed was item 11, which relates to “benchmarking”, with 67% of performance and sub level (CCC).
4 CONCLUSIONS
This study shows that Brazilian companies are poorly aware of Lean Construction and are using few lean construction practices. The actions that promote Lean Construction among Brazilian contractors are not being efficient enough to leverage the country as a benchmark in Lean Construction. These results corroborate the low productivity indexes of the Brazilian construction industry.
To change this scenario, a joint action is proposed among class entities, the civil construction companies, and academic circles. Actions directed to the market are key to raising the understanding of Lean Construction and its benefits, in order to obtain better performance of the construction companies in the future.
The current economic condition of Brazil brings the implementation of innovations due to the reduction of turnover in the construction sector. In this hostile environment of the market, the attitudes that promote the improvement of productive performance are welcome, as they result in cost reduction and promote business, fomenting the sector of the Brazilian civil construction industry.
Actions of Lean Construction deepen the studies in planning and accomplishing the qualification of the workmanship, mainly in the operational level.
It is recommended that this study be performed again at a future opportunity to compare the results obtained with the current results demonstrated in this paper, to assess whether actions of continuous improvement have been present in the Brazilian market.
5 REFERENCES Arantes, L. (2011). Master's thesis. Diagnóstico da aplicação dos principios da construção
enxuta em construtoras do setor de edificações que atuam em Belem-PA. (in Portuguese). Universidade Federal do Para, Belem-PA, Brazil.
Alarcón, L.F. , Diethelm, S. , Rojo, O. & Calderon, R. (2005) Assessing the Impacts of Implementing Lean Construction In:, 13th Annual Conference of the International Group for Lean Construction. Sydney, Australia, 19-21 Jul 2005. pp 387-393
Ballard, G., and Howell, G. (2003). "Lean project management." Building Research & Information, 31(2), 119-133
Cavalho, B. (2008). Master's thesis. Proposta de uma ferramenta de análise e avaliação das construtoras em relação ao uso da construção enxuta (in Portuguese). PPGECC - Universidade Federal do Parana, Curitiba-PR, Brazil.
CBIC (2016). Camara Brasileira da Industria da Construção. Brazilian Chamber of Construction Industry.
Ferreira, B. D. (2016) Estudo sobre a contribuição da construção enxuta comparada com a ISO 14001: estudo de casos em construtoras de Curitiba (in Portuguese). Trabalho de conclusão de curso Universidade Federal do Parana, Curitiba - PR, Brazil.
Guillou, F., Santos, A. Serra, S. (2010). Avaliação da utilização dos principios da construção enxuta: Caso de duas construtoras de médio porte. (in Portuguese) XIII ENTAC, Canela - RS, Brazil.
434 | Proceedings IGLC | July 2017 | Heraklion, Greece

Bruno Soares de Carvalho and Sergio Scheer
Hofaker, A. Oliveira, B., Gehbauer F., Freitas M., Mendes Jr, R. Santos, A. and Kirsch, J. Rapid Lean Construction - Quality Rating Model (LCR). 16th IGLC. Manchester, UK, 2008.
Koskela, L. (1992). Application of the new production philosophy to construction. Technical Report#72, CIFE, Stanford University.
Koskela, L., Howell, G., Ballard, G., and Tommelein, I. (2002). "The Foundations of Lean Construction." Design and Construction: Building in Value. Oxford, UK: Butterworth-Heinemann
Liker, J. K. (2005). The toyota way: Esensi. Mazutti, D. and Mello, T. (2015). Comparação de duas ferramentas de avaliação dos
princípios da construção enxuta: RLC e DOLC. (in Portuguese), Departamento de Construção Civil, Universidade Federal do Paraná, Curitiba-PR, Brazil
Pereira, M. Oliveira, D. (2014). Analysis of application of philosophy in Lean Construction companies in the construction sector of the metropolitan region of Belo Horizonte. Construindo Belo Horizonte, V.6, n.2, jul/Dez 2014, Brazil.
Richter, V. (2014). Diagnóstico da aplicação dos princípios da construção enxuta em construtoras. (in Portuguese). Universidade Tecnológica Federal do Parana, Pato Branco-PR, Brazil.
Valente, C, Novaes, M., Mourão, C.and Neto, J. (2012) Lean Monitoring and Evaluation in a Construction Site: A Proposal of Lean Audits. In:, Tommelein, I.D. & Pasquire, C.L., 20th Annual Conference of the International Group for Lean Construction. San Diego, USA, 18-20 Jul 2012.
Vieira, L., Souza, L. and Amaral, M. (2012). Application of the Rapid Lean Construction-Quality Rating Model to Engineering Companies. In:, Tommelein, I.D. & Pasquire, C.L., 20th Annual Conference of the International Group for Lean Construction. San Diego, USA, 18-20 Jul 2012.
Wiginescki, B. Master's thesis. Aplicação dos principios da construção enxuta em obras pequenas e de curto prazo: Um estudo de caso. (in Portuguese). PPGECC - Universidade Federal do Parana, Curitiba-PR, Brazil.
Francisco, H. Serra, S. and Lorenzon, I. (2012). Diagnóstico da Aplicação da Lean Construction em Construtoras das cidades de São Carlos e São Paulo-SP. (in Portuguese). XIV ENTAC - Encontro Nacional de Tecnologia do Ambiente Construído, Juiz de For a-MG, Brazil.
435 | Proceedings IGLC | July 2017 | Heraklion, Greece

436 | Proceedings IGLC | July 2017 | Heraklion, Greece

Spitler, L. (2017). “Design Thinking as a Method of Improving Communication Efficacy” In: LC3 2017 Volume II – Proceedings of the 25th Annual Conference of the International Group for Lean Construction (IGLC), Walsh, K., Sacks, R., Brilakis, I. (eds.), Heraklion, Greece, pp.437-444 DOI: https://doi.org/10.24928/2017/0270
DESIGN THINKING AS A METHOD OF IMPROVING COMMUNICATION EFFICACY
Laurie Spitler1 and Laura Talbot2
Abstract: Construction projects can be framed as a network commitments as defined by Linguistic Action Theory. With each project, varied requirements, designs, stakeholders, personalities, and countless other factors create new, indeterminate sets of issues whose resolution will be unique and determined by the linguistic actions of stakeholders. Because of this complexity, project definition and execution can be classified as “wicked problems”, or problems that are undefined in nature and defy a rational solution. “Design Thinking” is a method of creative problem solving that is useful in addressing wicked problems through its use of divergent brainstorming followed by convergent solution development. This paper first uses a case study to demonstrate how one team used Design Thinking to analyze and improve communication between stakeholders, and then proposes how Design Thinking can be added to the lean tool kit as a method of driving continuous improvement.
Keywords: Lean construction, computing, mixed reality, template, instructions.
1 INTRODUCTION In the fall of 2016, ten Autodesk volunteers spent two weeks in Kigali, Rwanda, as part of a partnership with a local design firm, MASS Design Group, and the fellows of the African Design Centre. Based in Kigali, the ADC works as a complement to existing architecture and design schools to further students’ education through an intensive two-year fellowship program. Autodesk volunteers worked with MASS and ADC to provide software training, make connections with local non-profits, and study communication between MASS Design and local Rwandan builders. The communication study was initially framed as a very simple question: “How can we educate our builders to understand drawings so that less time is spent on construction administration?”
The subsequent exploration of that question led to a realization of the complexity of the problem, and the application of Design Thinking to develop a solution.
By designing solutions with people rather than for them, MASS has demonstrated the value of thoughtful, inclusive design and has recognized that a creative and human-centered approach can improve the lives of the poor. Design programs in sub-Saharan Africa are scarce, and the continent needs a greater force of trained professionals who can help plan, design, and build the future. Training local designers has been central to MASS’s architectural work since its launch, and the African Design Centre is a progression of this initiative. MASS Design believes that socially-minded designers, bolstered by entrepreneurial thinking, can multiply access to dignified solutions.
1 Customer Engagement Specialist, Autodesk, San Francisco, CA 94107, USA, +1 415 342-1073,
[email protected] 2 Customer Engagement Specialist, Autodesk, San Francisco, CA 94107, USA, +1 415 342-1073,
437 | Proceedings IGLC | July 2017 | Heraklion, Greece
Design Thinking as a Method of Improving Communication Efficacy
MASS Design’s intensively focused human-centered and sustainable approach to project delivery includes the use of local material and labor. The local labor, referred to as “builders” throughout this paper, typically does not have the training or specialization common in more developed building cultures. Additionally, most builders speak only the local dialect, Kinyarwandan. This unfamiliarity with drawing conventions and language has led to amusingly literal interpretations of the drawings. In one instance, a MASS designer witnessed a builder carefully etching a cloud outline into a recently-poured slab of concrete so that it would look like the drawings. In another instance, the builders installed larger stones to mimic the exact scale of a hatch pattern in the drawings, instead of the gravel the hatching was meant to represent. Because of these communication gaps, MASS Design found that they were taking on a degree of site supervision and Construction Administration way beyond what is budgeted for a design firm.
The Autodesk team explored the surface question of educating the builders by applying the Lean technique of the “5 whys”. Among the questions posed were “What about the drawings are hard for the builders to understand?”, “What methods have you found that are effective for communication of design intent?”, and “What guidance is given during Construction Administration?”. The exercise revealed the following:
• MASS Design’s drawing standards derive from American Institute of Architects (AIA) guidelines. AIA standards for navigation, detail call outs, clouded changes, symbols and language are problematic for Rwandan builders.
• MASS Design is an innovative architect, using complex design components unfamiliar to local builders, such as trusses with complicated, non-orthogonal connections, new local materials that require experimentation before full detailing, and atypical design details such as trapezoid-shaped windows
From the application of the 5 whys, the team realized that the root issue was a complex issue of communication with many contributing factors. In short, a wicked problem.
2 BACKGROUND With its concern of communication between stakeholders, this paper focuses primarily on the human factors in construction. Flores (1982) captures the importance of the human factor with the statement, “Management is that process of openness, listening, and eliciting commitments, which includes concern for the articulation and activation of the network of commitments, primarily produced through promises and requests, allowing for the autonomy of the productive unit.”
Linguistic action theory explores the interactions between individuals on a project and “describes the very human processes, the purposeful ways people communicate, by which projects are conceived and delivered.” (Macomber and Howell, 2003) Macomber explores how the Last Planner, commonly understood as a production control system, is supported by linguistic actions, which draw attention to the “conversational nature of design, planning, and coordination.”(Macomber et al, 2005) Howell et al (2004) propose a new management model based on a network of commitments, stating “The new role of every project leader ...is to shape circumstances for team members to deepen their relatedness by developing a shared understanding, cultivating commitment-making, and producing coherence of intentions.” This paper uses Linguistic Action Theory’s understanding of a project as a network of commitments, rather than a project based production system as a conceptual starting point for the case study.
438 | Proceedings IGLC | July 2017 | Heraklion, Greece

Laurie Spitler and Laura Talbot
On a macro scale, Whelton and Ballard (2002) apply the concept of “wicked problems”, a term introduced by Horst Rittel, to construction project definition. In one of the first published reports on Rittel’s work, wicked problems are described as a "class of social system problems which are ill-formulated, where the information is confusing, where there are many clients and decision makers with conflicting values, and where the ramifications in the whole system are thoroughly confusing” (Buchanan, 1992) Whelton and Ballard present case studies to demonstrate how project definition can be treated as wicked problems, with research that suggests that “greater and timely understanding of stakeholder interests is necessary in order to better manage wicked problems”
The origin of the concept of “wicked problems” lies in design theory. Buchanan (1992), outlines the history and evolution of Design Thinking in the twentieth century as a liberal arts discipline well suited to the nature of wicked problems. Design Thinking is the result of “a concern to connect and integrate useful knowledge from the arts and sciences alike, but in ways that are suited to the problems and purposes of the present.” Employing Design Thinking, designers move past concrete categorization of problem definition and use different “placements3” or contexts to “position and reposition the problems and issues at hand.”
Specific Design Thinking methodologies follow a divergent-convergent model. First, all possible ideas are collected though exercises that systematically solicit stakeholder input, then solutions are developed through rapid iteration and testing. Several organizations have provided tools to supplement the theory of Design Thinking, or human-centered design.4 IDEO has developed a design kit to support their three phases of Inspiration, Ideation, and Implementation. (“IDEO Design kit,” n.d.) The LUMA Institute has developed a set of 36 methods divided into three phases: looking, understanding, and making. The looking tools are intended to “foster curiosity, empathy, and objectivity.” The understanding tools “help to identify patterns, determine priorities, and translate research into actionable insights.” The making tools “enable visual expression and iterative improvement.” (“Luma Workplace,” n.d.)
3 CASE STUDY Both Autodesk and MASS Design apply Design Thinking methodology as part of their corporate identity. Therefore, they chose this technique as a method of setting aside prior biases in information gathering, and developing empathy in the solution finding. Over two weeks, the teams did exercises to (1) observe, (2) understand, (3) prototype, and (4) test. The participants in this study included Autodesk volunteers, MASS Design staff, fellows from the African Design Center (ADC), and builders. The objective of the study was to create and test methods to increase the effectiveness of communication.
3.1 Observe
Exercise - Site Visit: The team traveled to Butaro Hospital in the Northern Province to visit several projects completed by MASS Design. As design professionals, MASS architects and the ADC fellows were accustomed to observing and speaking to building 3 “Placements are the tools by which a designer intuitively or deliberately shapes a design situation, identifying the views of all participants, the issues which concern them, and the invention that will serve as a working hypothesis for exploration and development. (Buchanan 1992) 4 For the purposes of this paper the terms “Design Thinking” and “human centered design” will be used interchangeably. There are fine theoretical distinctions between the two terms that will not be addressed.
439 | Proceedings IGLC | July 2017 | Heraklion, Greece
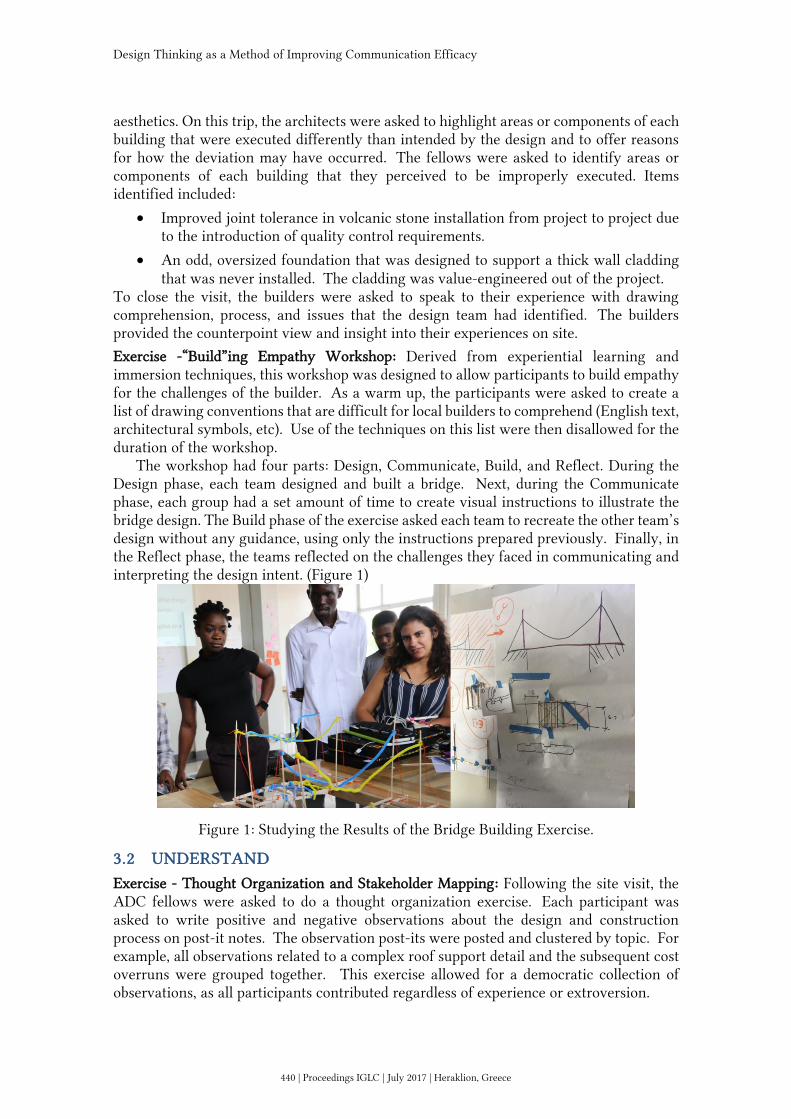
Design Thinking as a Method of Improving Communication Efficacy
aesthetics. On this trip, the architects were asked to highlight areas or components of each building that were executed differently than intended by the design and to offer reasons for how the deviation may have occurred. The fellows were asked to identify areas or components of each building that they perceived to be improperly executed. Items identified included:
• Improved joint tolerance in volcanic stone installation from project to project due to the introduction of quality control requirements.
• An odd, oversized foundation that was designed to support a thick wall cladding that was never installed. The cladding was value-engineered out of the project.
To close the visit, the builders were asked to speak to their experience with drawing comprehension, process, and issues that the design team had identified. The builders provided the counterpoint view and insight into their experiences on site.
Exercise -“Build”ing Empathy Workshop: Derived from experiential learning and immersion techniques, this workshop was designed to allow participants to build empathy for the challenges of the builder. As a warm up, the participants were asked to create a list of drawing conventions that are difficult for local builders to comprehend (English text, architectural symbols, etc). Use of the techniques on this list were then disallowed for the duration of the workshop.
The workshop had four parts: Design, Communicate, Build, and Reflect. During the Design phase, each team designed and built a bridge. Next, during the Communicate phase, each group had a set amount of time to create visual instructions to illustrate the bridge design. The Build phase of the exercise asked each team to recreate the other team’s design without any guidance, using only the instructions prepared previously. Finally, in the Reflect phase, the teams reflected on the challenges they faced in communicating and interpreting the design intent. (Figure 1)
Figure 1: Studying the Results of the Bridge Building Exercise.
3.2 UNDERSTAND
Exercise - Thought Organization and Stakeholder Mapping: Following the site visit, the ADC fellows were asked to do a thought organization exercise. Each participant was asked to write positive and negative observations about the design and construction process on post-it notes. The observation post-its were posted and clustered by topic. For example, all observations related to a complex roof support detail and the subsequent cost overruns were grouped together. This exercise allowed for a democratic collection of observations, as all participants contributed regardless of experience or extroversion.
440 | Proceedings IGLC | July 2017 | Heraklion, Greece

Laurie Spitler and Laura Talbot
Next, the fellows were asked to create a project delivery map, spanning from initial idea and community requirements through post occupancy analysis. With each phase of the project identified, stakeholders were added to the map to highlight when each party was (or was not) present, and then add the observed process issues to the map at the point where they manifested, as well as when they might have been mitigated. Invariably, the results revealed that process issues manifested late in the project timeline, with stakeholders different from those involved when the issue might have been mitigated. The exercise identified that more communication was needed between stakeholders throughout the project timeline to mitigate issues related to informational hand-offs and to incorporate lessons learned into the design. (Figure 2)
Figure 2: Applying the Thought Organization Exercise to the Stakeholder Maps
3.3 PROTOTYPE
After studying the issue of communication between stakeholders through observing and understanding, potential solutions were explored that would target both major stakeholders - in this case, local builders and MASS designers.
Prototype 1 - Design a Training Plan for Builders: One of MASS Design’s core missions is to empower the local community. As such, reusable and scalable educational resources for builders should be developed to build experience and create opportunities for future employment. Based on the discovery process, the ADC fellows were asked to prototype a training plan and develop a method of testing the program with the builders.
Prototype 2 - Propose Revised Standards for MASS Design: MASS Design’s drawing conventions are based on American standards and were found not to be an effective means of communication for Rwandan builders. Based on the discovery process, the ADC fellows were asked to prototype a set of revised standards and develop a method of testing the program with the builders.
3.4 TEST
The teams held a workshop for all participants where the plans were presented:
Prototype 1 - Designing a Training Plan for the Builders: Considering the lessons learning in the prior exercises, the team decided that a simpler set of drawings should be used to illustrate core concepts. The ADC fellows designed a training kit to be distributed on the jobsites. The kit contained a physical model of the building and corresponding drawing set. The model, while simple, could be split in half to show a section and lifted off the foundation to show a plan. The drawing set included plans, sections and details. The intent of this kit was to supplement a lesson in architectural convention for foremen. The lesson would then be relayed by foremen to the builders to perpetuate the learning.
To test this program, the fellows provided the lesson to the builders. Using the model, they demonstrated the concept of plans, sections and details. Following this instruction,
441 | Proceedings IGLC | July 2017 | Heraklion, Greece

Design Thinking as a Method of Improving Communication Efficacy
they asked the builders to draw plans and sections. For many of the builders, this was the first time they had ever produced an architectural drawing. This active learning exercise challenged the builders to think like architects - How are windows detailed? How are door swings visually represented? In short, they demonstrated the importance of symbology in architectural drawing by challenging the builders to produce the representation.
After the drawing exercise, the builders were asked to provide feedback on how the lesson could be improved. The builders felt that they learned from the exercise, and that they would appreciate the opportunity to draw and compare more architectural symbols, such as columns, walls, and doors, in the future. (Figure 3)
Figure 3: Teaching Builders how to Draw
Prototype 2 - Revised Drawing Standards for MASS Design: It was clear from the site visit and workshop exercises that the complex symbology and organization of the MASS Design drawing sets were not optimal for conveying design intent to the builders.
The ADC fellows developed a framework for drawing standards for building. To test which drawings were most useful to the builders, they produced different types of drawings for wall construction, including a model, a 3D render, an exploded axonometric, a dimensioned plan, a color-coded plan denoting wall types, a section, and details.
Figure 5: Designers and Builders having a Conversation about Communication
The builders were asked to vote on the drawings, using green stickers for drawings
that were clear and orange stickers for drawings that were overly complicated or confusing. Stickers were labeled with the level of the builder (superintendent, foreman, laborer) who had placed the vote. The builders then explained their votes. Some conclusions were
442 | Proceedings IGLC | July 2017 | Heraklion, Greece

Laurie Spitler and Laura Talbot
expected, such as the positive votes on the 3D rendering, and that the more educated builders found details useful. Other feedback surprised the design team. The builders were confused by an exploded axon, drawn to show the sequence of wall construction, because they “did not understand what was supposed to be put in the gaps” of the drawing. (Figure 5)
4 DISCUSSION
The workshop created a space for stakeholders to come together to discuss how to increase communication efficacy. The use of Design Thinking techniques allowed for (1) democratic contribution of information and (2) empathy building between stakeholders.
The democratic contribution of information was facilitated through exercises such as thought organizing. By asking all members of the team to submit ideas though notes on post-its and vote with stickers, the team mitigates the possibility of submissions being ranked on seniority, extroversion, or other persona-based criteria. By including team members with a variety of roles and perspectives, a diversity of contributions is guaranteed. Hence, these techniques allow for the widest base of knowledge and ideas to be included in the problem definition and solution phase.
Empathy was built for other stakeholders through the series of exercises that asked the team to experience the project though other’s perspectives. At the site visit, both the designers and the builders were given uninterrupted time to speak to their experiences. In the bridge building exercise, designers were asked to work with the restrictions of the builder. The builders were asked to draw architectural drawings as a method of learning. Through these exercises, the stakeholders experienced the constraints and motivations of the other party. Because of the study, the designers realized that in addition to educating the builders, they could also learn from the builders’ experience to improve design communication efficacy. Additionally, through the repeated non-hierarchical interactions, a sense of community and collective purpose was fostered.
The techniques outlined in this paper are applicable beyond the somewhat extreme example of design and building in Rwanda. Design Thinking exercises bear striking similarities to Lean techniques - most notably, pull planning. In both exercises, input is solicited in a democratic manner and stakeholders are asked to work together to build a collective plan to execute and evaluate. Design Thinking provides methods to apply this type of collective and creative problem solving to other aspects of project delivery.
As Whelton and Ballard (2002) have stated, project definition is a wicked problem: ill-defined and non-repeatable. Design Thinking is a discipline that explicitly address the indeterminate nature of wicked problems by drawing on multiple contexts to frame the problem and optimize solutions. No project or process is repeatable as stakeholders, project type, and contractual relationships change. Design Thinking can be applied in broad and focused ways as a systematic method of process analysis and continuous improvement. To identify project level improvements:
• Trade partners could collectively identify and cluster risk areas based on past experiences. The team could collectively agree on controls such as focused BIM coordination, design modifications, or others to mitigate identified risk.
• The team can map out a process that involves multiple stakeholders, do immersion exercises to understand motivations, and then propose process improvements.
As the case study demonstrated, beyond specific process improvements, the nature of the exercises will allow stakeholders to become more knowledgeable of the holistic project
443 | Proceedings IGLC | July 2017 | Heraklion, Greece

Design Thinking as a Method of Improving Communication Efficacy
and more empathetic with other stakeholders. Design Thinking can also be applied as a targeted to solution, such as:
• If a root cause of task failure is occurring with undue frequency, the stakeholders can complete a thought organization exercise to generate resolution
• To identify communication issues within a team and then process map a solution.
5 CONCLUSION Given the understanding of a project as a “network of commitments” (Howell et al, 2014), projects need to develop corresponding tools to address and manage the human process. This paper has demonstrated how Design Thinking can be applied to the wicked problems that occur in project delivery. The case study demonstrates how the use of Design Thinking allowed a team to (1) democratically generate ideas to increase the efficacy of communication between stakeholders and (2) develop an empathetic solution suited to the motivations of each stakeholder. The paper also proposes other areas in project delivery to apply Design Thinking methodology. As such, Design Thinking should be added to a project’s Lean toolkit as a method of driving continuous improvement.
6 REFERENCES Buchanan, R. (1992). Wicked problems in Design Thinking. Design Issues, 8(2), 5.
doi:10.2307/1511637 Flores, F., (1982). Management and Communication in the Office of the Future, PhD
Dissertation, University of California at Berkeley, p.42. Howell, G. A., Macomber, H., Koskela, L., and Draper, J. (2004). “Leadership and Project
Management -- Time for a Shift from Fayol to Flores.” Proc. 12th Annual Conference of the International Group for Lean Construction Elsinore, Denmark, 8 pp.
IDEO Design kit. (n.d.). Retrieved from http://www.designkit.org/ Luma Workplace. (n.d.). Retrieved from https://www.lumaworkplace.com/ Macomber, H. & Howell, G.A. 2003, 'Linguistic Action: Contributing to the Theory of Lean
Construction' In:, 11th Annual Conference of the International Group for Lean Construction. Virginia, USA, 1-.
Macomber, H. , Howell, G.A. & Reed, D. 2005, 'Managing Promises With the Last Planner System: Closing in on Uninterrupted Flow' In:, 13th Annual Conference of the International Group for Lean Construction. Sydney, Australia, 19-21 Jul 2005. pp 13-18
Whelton, M. & Ballard, G. 2002, 'Project Definition and Wicked Problems' In:, Formoso, C.T. & Ballard, G., 10th Annual Conference of the International Group for Lean Construction. Gramado, Brazil, 6-8 Aug 2002. pp 375-387
444 | Proceedings IGLC | July 2017 | Heraklion, Greece

Stifi A., Gehbauer F., and Gentes S. (2017). “Lean Anti-Corruption Toolkit.” In: LC3 2017 Volume II – Proceedings of the 25th Annual Conference of the International Group for Lean Construction (IGLC), Walsh, K., Sacks, R., Brilakis, I. (eds.), Heraklion, Greece, pp. 445-452. DOI: https://doi.org/10.24928/2017/0154
LEAN ANTI-CORRUPTION TOOLKIT
Ahmed Stifi1, Fritz Gehbauer2, and Sascha Gentes3
Abstract: When the Lean Construction revolution started about 25 years ago, it may have not have considered the issue of corruption.
The paper argues that corruption in construction forms a barrier in the implementation of Lean Construction. On the other hand, Lean Construction has the potential to combat corruption. Based on this contradiction, this paper shows how Lean Construction can be protected from corruption using something similar to a human immune system which includes Lean stem cells: transparency, accountability and integrity. Then paper shows how Lean Construction can play a vital role in combating corruption in construction via a Lean Anti-Corruption Toolkit.
Keywords: Lean Construction, Corruption, Integrity, Transparency, Accountability.
1 INTRODUCTION Literature reviews and interviews with experts deliver many facts about corruption in construction. The first fact is that corruption is widely spread in the construction industry (Kenny, 2007; and TI, 2011). The second fact is that the construction industry contains most known forms of corruption such as bribery, embezzlement, fraud, extortion, collusion (including bid rigging, cover pricing, losers’ fees and price fixing), facilitation payments, conflict of interest, nepotism, abuse of power and even money laundering (GIACC, 2008). The third fact is that efforts within the construction industry to combat corruption are less effective than in other industries and research conducted in this industry about corruption are not up to the level of importance and danger of this phenomenon.
The paper introduces integrity, transparency and accountability as fundamental core principles which act as body stem cells for Lean Construction. However, the intent of this paper is to invite the IGLC Committee into an open discussion about corruption and its position as waste in construction which must be eliminated by transplanting stem cells into Lean tools (in general into the body of Lean Construction).
2 SOLVING THE PROBLEM OF CORRUPTION WITH A LEAN
APPROACH One of the difficulties in combating corruption in different industries and especially in construction is seeing it as a complex problem and trying to ignore it intentionally or
1 Research Fellow, Institute for Technology and Management in Construction, Karlsruhe Institute of Technology (KIT), Karlsruhe, Germany, [email protected] 2 Professor, Institute for Technology and Management in Construction, Karlsruhe Institute of
Technology (KIT), Karlsruhe, Germany, [email protected] 3 Professor, Institute for Technology and Management in Construction, Karlsruhe Institute of
Technology (KIT), Karlsruhe, Germany, [email protected]
445 | Proceedings IGLC | July 2017 | Heraklion, Greece
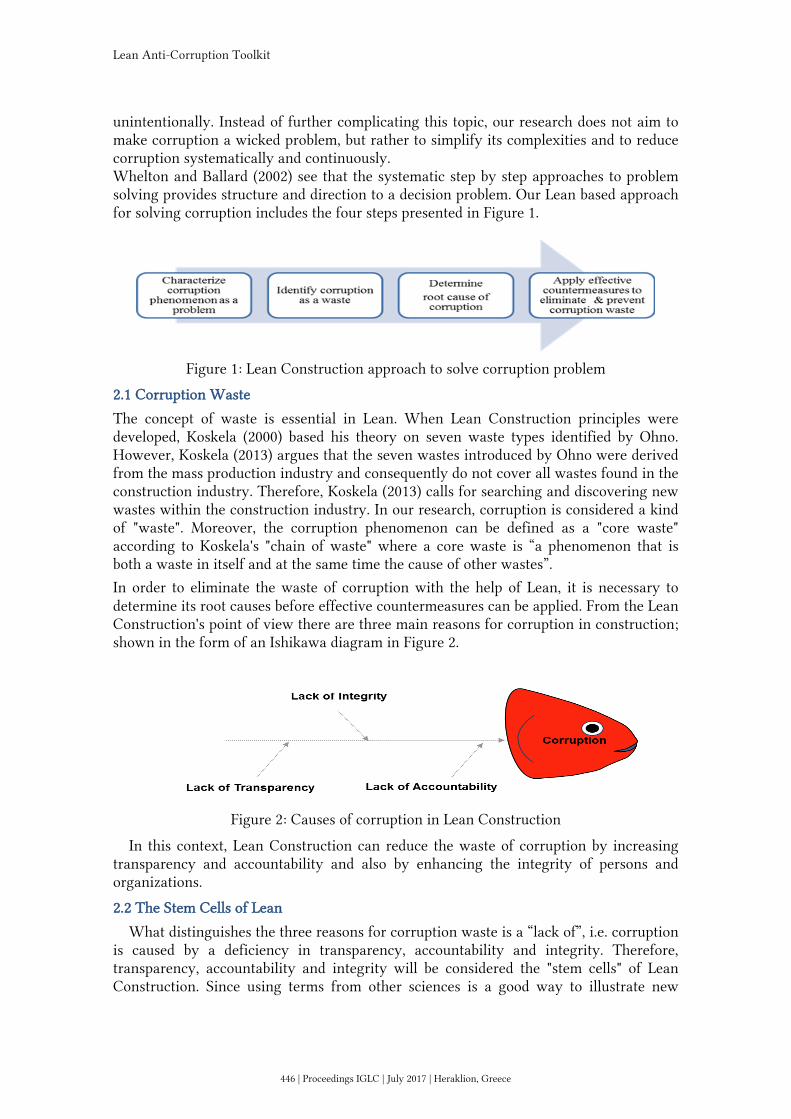
Lean Anti-Corruption Toolkit
unintentionally. Instead of further complicating this topic, our research does not aim to make corruption a wicked problem, but rather to simplify its complexities and to reduce corruption systematically and continuously. Whelton and Ballard (2002) see that the systematic step by step approaches to problem solving provides structure and direction to a decision problem. Our Lean based approach for solving corruption includes the four steps presented in Figure 1.
Figure 1: Lean Construction approach to solve corruption problem
2.1 Corruption Waste
The concept of waste is essential in Lean. When Lean Construction principles were developed, Koskela (2000) based his theory on seven waste types identified by Ohno. However, Koskela (2013) argues that the seven wastes introduced by Ohno were derived from the mass production industry and consequently do not cover all wastes found in the construction industry. Therefore, Koskela (2013) calls for searching and discovering new wastes within the construction industry. In our research, corruption is considered a kind of "waste". Moreover, the corruption phenomenon can be defined as a "core waste" according to Koskela's "chain of waste" where a core waste is “a phenomenon that is both a waste in itself and at the same time the cause of other wastes”.
In order to eliminate the waste of corruption with the help of Lean, it is necessary to determine its root causes before effective countermeasures can be applied. From the Lean Construction's point of view there are three main reasons for corruption in construction; shown in the form of an Ishikawa diagram in Figure 2.
Figure 2: Causes of corruption in Lean Construction
In this context, Lean Construction can reduce the waste of corruption by increasing transparency and accountability and also by enhancing the integrity of persons and organizations.
2.2 The Stem Cells of Lean
What distinguishes the three reasons for corruption waste is a “lack of”, i.e. corruption is caused by a deficiency in transparency, accountability and integrity. Therefore, transparency, accountability and integrity will be considered the "stem cells" of Lean Construction. Since using terms from other sciences is a good way to illustrate new
446 | Proceedings IGLC | July 2017 | Heraklion, Greece

Ahmed Stifi , Fritz Gehbauer , and Sascha Gentes
concepts, as the medical term DNA has been used by Steven Spear and H. Kent Bowen in their article in the Harvard Business Review entitled “Decoding the DNA of the Toyota Production System”, this research applies the concept of transplanting stem cells into the tools and concepts of Lean Construction to strengthen its immune system against corruption.
1. Stem Cell Transparency:
Undoubtedly, the term transparency is related to anti-corruption. "The greater the transparency, the more difficult it will be to conceal corruption" (TI, 2005). Several scholars also have shown that increasing transparency is a very important factor in reducing corruption (Sohail and Cavill, 2006; and Kolstad and Wiig, 2008). On the other hand, Lean considers transparency highly important. Womack (1996) says “transparency is the key principle in everything”. Koskela (2000) considers the principle of transparency an important one. However, will transparency suffice to protect Lean from corruption and, consequently, to combat corruption?
Lambsdorff (2010) presents one answer when he discusses the problem of what he calls “increased transparency”. He stated that "there are, however, also some problems with transparency" and he introduced many cases in which transparency was used to facilitate corruption. Kolstad and Wiig (2008) see that transparency is necessary, but not a sufficient condition to reduce corruption.
Gehbauer expresses his concern that some parties involved in the construction process might use the mutually proffered transparency to serve their special interests. This would pose a conflict of interest. In the Last Planner System (LPS), conflicts of interest (CoI) can be corrupt actions in disguise. Our research defines CoI in Lean as “the state or quality that can be attributed to a person, group or organization involved in a Lean project in which transparency provided by Lean to this person, group or organization is used without working on the same principle of transparency”. In other words, it is the misuse of the transparency principle which poses a genuine threat to the successful implementation of Lean construction.
Based on the deconstruction of the transparency concept provided by Kolstad and Wiig (2008) and the many observations conducted during this research in various construction projects, the misuse of transparency can be defined as; (1) secrecy and withholding of information, (2) offering wrong information, (3) spin, (4) incomplete information, (5) inaccessible information, (6) unequal access to information, and (7) irrelevant information. This finding shows that transparency is necessary but not enough to reduce corruption. However, transparency is an important and essential principle in Lean Construction. The solution lies in supporting Lean with other principles that work to limit the misuse of transparency. These principles are accountability and integrity.
2. Stem Cell Accountability:
Accountability is the second element of the so-called "immune system" to protect Lean from corruption. Scholars often argue that the simultaneous lack of transparency and accountability is a reason for corruption. However, neither accountability nor corruption in the construction industry is often subject to studies (Nordin et.al, 2011). In fact, transparency is far more mentioned and applied in Lean than accountability. Also, Lean Construction mostly refers to responsibility than to accountability. Cavill and Sohail (2007) studied the difference between these two; they found blame to be the distinction between accountability and responsibility. Responsibility is having a job to do and taking the blame when things go wrong, while accountability is having the duty to explain and make amends without accepting blame.
447 | Proceedings IGLC | July 2017 | Heraklion, Greece
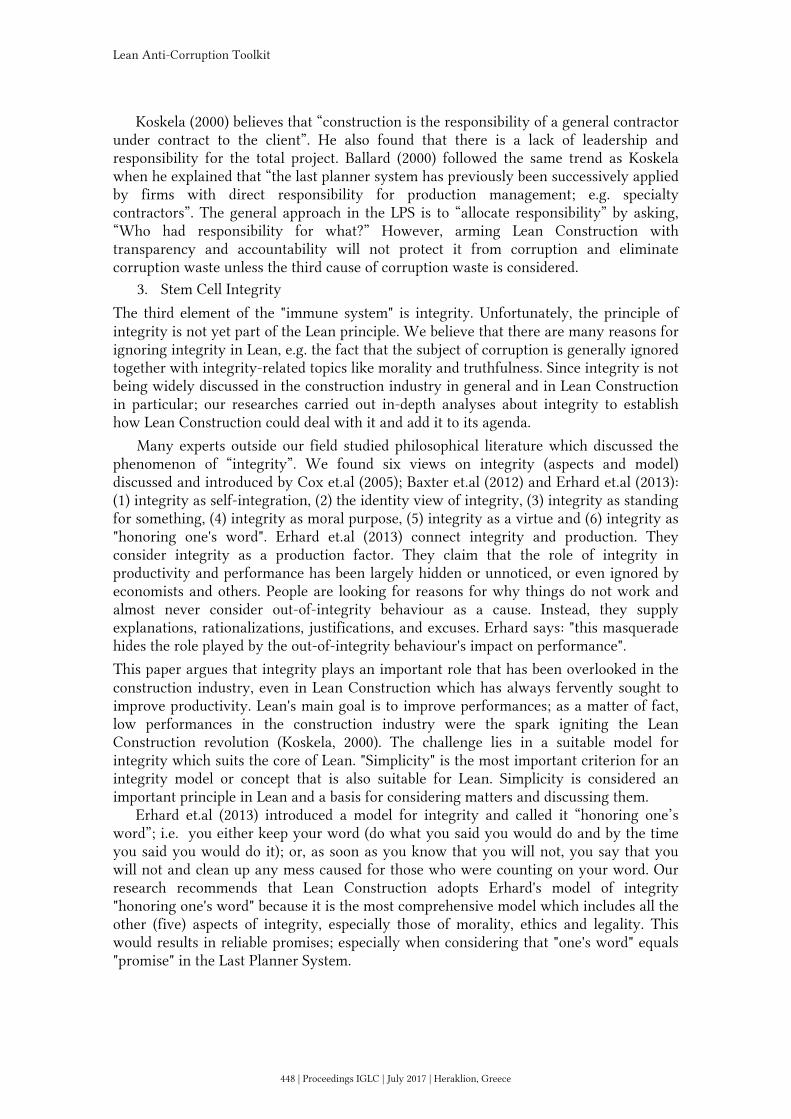
Lean Anti-Corruption Toolkit
Koskela (2000) believes that “construction is the responsibility of a general contractor under contract to the client”. He also found that there is a lack of leadership and responsibility for the total project. Ballard (2000) followed the same trend as Koskela when he explained that “the last planner system has previously been successively applied by firms with direct responsibility for production management; e.g. specialty contractors”. The general approach in the LPS is to “allocate responsibility” by asking, “Who had responsibility for what?” However, arming Lean Construction with transparency and accountability will not protect it from corruption and eliminate corruption waste unless the third cause of corruption waste is considered.
3. Stem Cell Integrity
The third element of the "immune system" is integrity. Unfortunately, the principle of integrity is not yet part of the Lean principle. We believe that there are many reasons for ignoring integrity in Lean, e.g. the fact that the subject of corruption is generally ignored together with integrity-related topics like morality and truthfulness. Since integrity is not being widely discussed in the construction industry in general and in Lean Construction in particular; our researches carried out in-depth analyses about integrity to establish how Lean Construction could deal with it and add it to its agenda.
Many experts outside our field studied philosophical literature which discussed the phenomenon of “integrity”. We found six views on integrity (aspects and model) discussed and introduced by Cox et.al (2005); Baxter et.al (2012) and Erhard et.al (2013): (1) integrity as self-integration, (2) the identity view of integrity, (3) integrity as standing for something, (4) integrity as moral purpose, (5) integrity as a virtue and (6) integrity as "honoring one's word". Erhard et.al (2013) connect integrity and production. They consider integrity as a production factor. They claim that the role of integrity in productivity and performance has been largely hidden or unnoticed, or even ignored by economists and others. People are looking for reasons for why things do not work and almost never consider out-of-integrity behaviour as a cause. Instead, they supply explanations, rationalizations, justifications, and excuses. Erhard says: "this masquerade hides the role played by the out-of-integrity behaviour's impact on performance".
This paper argues that integrity plays an important role that has been overlooked in the construction industry, even in Lean Construction which has always fervently sought to improve productivity. Lean's main goal is to improve performances; as a matter of fact, low performances in the construction industry were the spark igniting the Lean Construction revolution (Koskela, 2000). The challenge lies in a suitable model for integrity which suits the core of Lean. "Simplicity" is the most important criterion for an integrity model or concept that is also suitable for Lean. Simplicity is considered an important principle in Lean and a basis for considering matters and discussing them.
Erhard et.al (2013) introduced a model for integrity and called it “honoring one’s word”; i.e. you either keep your word (do what you said you would do and by the time you said you would do it); or, as soon as you know that you will not, you say that you will not and clean up any mess caused for those who were counting on your word. Our research recommends that Lean Construction adopts Erhard's model of integrity "honoring one's word" because it is the most comprehensive model which includes all the other (five) aspects of integrity, especially those of morality, ethics and legality. This would results in reliable promises; especially when considering that "one's word" equals "promise" in the Last Planner System.
448 | Proceedings IGLC | July 2017 | Heraklion, Greece

Ahmed Stifi , Fritz Gehbauer , and Sascha Gentes
3 INTEGRITY STEM CELL TRANSPLANTATION INTO LPS
Within the scope of this research, a case study was designed, using action research to transplant the concept of integrity as “honoring one’s word” into the LPS. We propose to adopt this concept in Lean Construction. Our strategy depends on the LPS as a platform to promote transparency, accountability, and integrity. The application of these concepts should consequently reduce corruption since their lack is the main reason for corruption as defined in this paper. The LPS already promotes transparency and accountability, however, the missing principle is integrity.
The case study revealed that the participants did not respect their respective commitments due to different conflicts of interest. For example, we recorded a corrupt case in which location and assembly flow of one subcontractor was negatively impacted by an area manager who would not give approval to commence work unless he was paid a certain sum, otherwise the manager would not let the subcontractor start work as promised. Another example was about obtaining permission to enter the site; its refusal preventing the proper flow of machines and labour. Here, the possibility of bribing the person giving entrance permission was recorded. Moreover, and in general, it was observed that most of the people in the project easily made promises without the intention of honouring them.
We used the LPS as a training platform to enhance integrity and to inform the participants about the importance of integrity "honoring one’s word" as a factor to the successful execution of the project, workshops and simulations of many cases were carried out within LPS sessions. Figure 3 (right side) shows the average PPC values of both phases of the case study, in Phase I (before transplantation of integrity) PPC= 71.58%, and in Phase II (after transplantation of integrity) PPC= 82.32%, i.e. in our case study the PPC valued increased by 11 percentage points. The figure shows also that all subcontractors have improved their PPC values in different ratios (left side).
Figure 3: PPC values of Phase I and Phase II
The improvement of the PPC value in the case study cannot be attributed to the introduction of the integrity model alone. Here, the increase in the PPC value is also a result of the continuous LPS implementation because the work team, by time, got used to the concepts of the LPS. Therefore, other improvement factors also applied. Several past studies about the LPS proved this point. Supposedly, if we had not introduced the integrity concept there could still have been some improvement in the PPC. Therefore, the improvement cannot be attributed entirely to the integrity concept alone.
449 | Proceedings IGLC | July 2017 | Heraklion, Greece

Lean Anti-Corruption Toolkit
However, a last planner person with integrity working to honour his promise (honouring one’s word) will adapt a positive "can do" attitude and carefully consider all constraints to ensure that he will keep his promises .In this case, the last planner (and everybody in this production chain working with integrity) tries to avoid any conflict of interest and simultaneously becomes an internal observer and monitor looking for all obstacles in the way of honouring the promise. Of course, corruption and corrupt people are main obstacles, like the above mentioned "corrupt area manager".
The case study shows how integrity can play a vital role in changing a corruptive "culture" through striving for reliable promises. However, eliminating corruption requires Lean to transplant the integrity principle into other Lean tools and to benchmark other tools and ideas as best practices to combat corruption. This lead us to develop a Lean Anti-Corruption Toolkit consisting of the elements listed in the next paragraph.
4 LEAN ANTI-CORRUPTION TOOLKIT The remaining step of our problem-solving approach is to apply effective countermeasures to reduce corruption waste. Here, we carried out a benchmarking process, looking for the best practices in the field of anti-corruption. The most important principles, concepts and tools used by other organizations to combat corruption in addition to our new integrity model in Lean Construction were assembled in a toolkit called “Lean Anti-Corruption Toolkit”. It consists of the following:
Integrity Management System (IMS): IMS guides a Lean organization on how to apply the integrity concept (including standards of moral and ethics) to every aspect of its business. This helps create the right procedure to prevent and eliminate corruption waste. (FIDIC, 2015)
ISO 37001: This can be one of the Lean organization tools for reducing corruption waste, especially bribery. It is preferable for a Lean organization to connect it to its quality management system ISO 9001(ISO 37001, 2016)
Due Diligence (DD): The Lean organization can use Due Diligence as an effective tool to talk with its parties about corruption waste directly, and to determine the issues from which corruption waste can result during running the construction process. (GIACC, 2008; and ISO 37001, 2016)
Anti-Corruption Contract Terms: Lean contracts, IPD, IFoA, and Alliance Contracts or any form of innovated contracts introduced by Lean should contain anti-corruption terms which can be considered anti-corruption commitments included in the contract. The design of anti-corruption clauses may range from simple requirements to more sophisticated regulations. (GIACC, 2008; and FIDIC, 2015)
Integrity Pact (IP): The IP is a tool introduced by Transparency International, it can be used as it is and could be further developed in Lean as a criterion for suppliers partners in the production process (Sohail and Cavill, 2006).
Project Code of Conduct (P-CoC): The Lean organization should develop a code of conduct applicable at project level. P-CoC could be a formal declaration of the project values and its working rules.
Integrity into LPS: It is important to modify the current LPS by integrating the integrity principle into it and training the last planners in "honoring one’s word" which will result in spreading the integrity culture among business partners; making them the base for spreading it in their organisation.
450 | Proceedings IGLC | July 2017 | Heraklion, Greece
Ahmed Stifi , Fritz Gehbauer , and Sascha Gentes
Reward and Discipline Policy: Rewarding and discipline behaviour with or without integrity can be linked to the incentive system of the organization. At the same time, the repeated plan failure should be discussed with last planners from an integrity point of view and failure reasons should be analysed without neglecting corruption causes.
Declaration of Conflict of Interest: Lean construction should use a "conflict of interest declaration" as a tool for persons in leading positions to declare whether they have relatives in the project or with the suppliers, to avoid that these relations lead to a kind of conflict of interest affecting the aims and values of the project.
Green-Box (GB): We suggest a so-called “Green-box” to be set in the hall of a project management's office, so that anybody can report any corrupt incidents that may occur, may have known about or may have been asked to participate in. This tool will help reporting without referring to the person directly (whistleblowing protection policy).
Training: Training remains the essential and effective tool to achieve the goal of reducing corruption waste. It is necessary to update the current training platforms within Lean construction to take corruption waste into consideration. In this context, LPS remains the best training platform to achieve this purpose.
Capacity Building (CB): Adopting the anti-corruption movement requires continuous capacity building in this field, so that the Lean organization develops the know-how for eliminating corruption. Capacity building in Lean Construction also involves the important principle “train the trainer”. Members of Lean organizations who received advanced training and knowledge on how to reduce corruption should be required to train other staff members in projects (on-site) on how to spread the culture of integrity and eliminate corruption waste in their projects.
5 CONCLUSION This paper introduces an important type of waste in construction by defining corruption as a core waste creating other wastes. It also introduces a new important principle in Lean: "integrity" which complements the already existing principles of transparency and accountability. The paper proposes to use the LPS as a practical platform for combating corruption in construction projects, in combination with the introduced Lean Anti-Corruption Toolkit.
It is highly recommended to integrate the components of the toolkit into Lean and to combine them for maximum effect.
Since this research is considered one of the first studying the corruption phenomenon in depth within Lean Construction, it can be generally assumed that there are still many opportunities for researches on this topic within Lean Construction.
6 REFERENCES Ballard, G. (2000). “The Last Planner System of Production Control.” Thesis submitted to
the Faculty of Engineering of The University of Birmingham Baxter, J.; Dempsey, J.; Megone, C. and Lee, J. (2012) “Real Integrity: Practical solutions
for organisations seeking to promote and encourage integrity” University of Leeds - Chartered Accountants’ Trustees Limited, London, UK
Cavill, S. and Sohail, M. (2007). “Accountability Arrangements to Combact Corruption – Literature Review.” Water, Engineering and Development Center (WEDC)
451 | Proceedings IGLC | July 2017 | Heraklion, Greece

Lean Anti-Corruption Toolkit
Cox, D.; La Caze, M. and Levin, M. (2005). “Integrity" The Stanford Encyclopedia of Philosophy, Fall-2013, Stanford Encyclopedia of Philosophy
Erhard, W.; Jensen, C. and Zaffron, S. (2013). “Integrity: A Positive Model that incorporates the Normative Phenomena of Morality, Ethics, and Legality.”
Fauchier, D. and Alves, T. C. L. (2013). “Last Planner System is the Gateway to Lean Behaviors.” IGLC 21., Fortaleza, Brazil.
FIDIC (2015). “Guidelines For Integrity Management in The Consulting Industry – Part II: FIMS Procedure” Federation of Consulting Engineering (FIDIC), Geneva, Switzerland
GIACC (2008). “Anti-Corruption Training Manual: Infrastructure, Construction and Engineering Sectors.” Global Infrastructure Anti-Corruption Centre, London, UK
Kenny, C. (2007). “Construction, Corruption, and Developing Countries” World Bank Policy Research Working Paper 4271, World Bank (WB), USA
Kolstad, I. and Wiig, A. (2008). “Is Transparency the Key to Reducing Corruption in Resource-Rich Countries?” Elsevier, World Development Vol. 37, No. 3.
Koskela, L. (2000). "An Exploration Towards a Production Theory and its Application to Construction" PhD thesis, Espo, Helsinki University of Technology, Finland
Koskela, L.; Bølviken, T. and Rooke, J. (2013). “Which are the Wastes of Construction?” IGLC 21., Fortaleza, Brazil.
Lambsdorff, J. G. (2010). “The Organization of Anticorruption – Getting Incentives Right!” Diskussionsbeitrag Nr. V-57-08, University of Passau, Germany
Nordin, R. M.; Takim, R. and Nawawi A. H. (2011). “Critical Factors Contributing to Corruption in Construction Industry.” IEEE Symposium on Business, Engineering and Industrial Applications (ISBEA), Langkawi, Malaysia
Sohail, M. and Cavill, S. (2006). “Corruption in construction projects.” Proceedings of the CIB W107 Construction in Developing Countries Symposium, Santiago, Chile
Transparency International (2005) “Corruption in Construction - Recommendation Report” Transparency International (TI), Berlin, Germany
Transparency International (2011) “Bribe Payers Index 2011 - Report” Transparency International (TI), Berlin, Germany
Whelton, M. and Ballard, G. (2002). “Wicked Problems in Project Definition.” IGLC 10., Brazil
Womack, J. and Jones, D. (1996) “Lean Thinking: Banish Waste and Create Wealth in your Corporation” Free Press, Simon & Schuster Inc., ISBN 0-7432-4927-5, USA
452 | Proceedings IGLC | July 2017 | Heraklion, Greece

Thameem, M., Rybkowski, Z. K., and Smith, J. P. (2017). “Delivery Methods and Social Network Analysis of Unethical Behavior in the Construction Industry.” In: LC3 2017 Volume II – Proceedings of the 25th Annual Conference of the International Group for Lean Construction (IGLC), Walsh, K., Sacks, R., Brilakis, I. (eds.), Heraklion, Greece, pp. 453-461. DOI: https://doi.org/10.24928/2017/0213
DELIVERY METHODS AND SOCIAL NETWORK ANALYSIS OF UNETHICAL BEHAVIOR IN THE CONSTRUCTION
INDUSTRY
Muzafar Thameem1, Zofia K. Rybkowski2, and James P. Smith3
Abstract: The construction industry accounts for about one-third of gross capital formation and is ranked as one of the most corrupt. It is a multifaceted industry with unregulated transactions in which illicit behavior can be difficult to detect. The effects of corruption go beyond demoralization associated with bribery, it can lead to substandard quality of infrastructure and insufficient funds available for project maintenance. There are a multitude of reasons identified as possible causes for unethical conduct. A few researchers cited corruption as a result of an unethical decision. Prior research concerning corruption in construction has called for several main strategies: enhanced transparency, ethical codes, project governance, and audit and information technology. However, strategies to combat corruption may not be sufficient. This research first presents an overview of unethical conduct in the industry. Then it examines the ethics in the industry followed by types of relationships and their structure which may be conducive to unethical conduct within the framework of different delivery methods. Finally, an argument is made regarding the importance of strength of relationships in curbing unethical conduct.
Keywords: Unethical behavior, Relational Contracting, Lean Construction
1 INTRODUCTION
1.1 Corruption in Construction
Corruption in construction is associated with economic growth and stages of development (Ehrlich and Lui 1999). It is considered a major hurdle to economic and social development. It is estimated that the annual loss from corruption in the global construction market accounts for 10% of global construction market value (Sohail and Cavill 2008).
Unethical decisions may occur at any phase during a project: initiation, planning and design, bidding and construction, and operation and maintenance (Tabish and Jha 2011). Ahmad et al. (1995) and Kenny (2009) suggest that construction observes widespread unethical behavior mainly due to the fragmented nature of the industry.
Le et al. (2014) identified twelve forms of corruption in the industry: bribery, fraud, bid rigging, embezzlement, kickback, conflict of interest, dishonesty, unfair conduct, extortion, negligence, front companies, and nepotism (Table 1).
1 Graduate Student, Department of Construction Science, College of Architecture, Texas A&M University, College Station, Texas, USA, [email protected] 2 Associate Professor, Department of Construction Science, College of Architecture, Texas A&M University, College Station, Texas, USA, Ph :+1-979-845-4354, [email protected] 3 Assistant Professor, School of Technology, Department of Construction and Facilities Management, Brigham Young University, Provo, UT, USA, [email protected]
453 | Proceedings IGLC | July 2017 | Heraklion, Greece

Delivery Methods and Social Network Analysis of Unethical Behavior in the Construction Industry
Corruption can hinder the social and economic development of societies worldwide (Snaith and
Khan 2008). So far anti-corruption strategies involve recommendations for enhanced transparency, ethical codes, project governance, auditing, and information technology (Le et al. 2014). But despite these, the severity of corruption has not been alleviated, and construction remains corrupt (Transparency International 2002, 2006, 2008, 2011). The primary causes identified are: excessive competition in the tendering process, insufficient transparency in selection criteria during tendering, inappropriate political interference in cost decisions, the complexity of institutional roles
Tab
le 1
. Typ
es o
f cor
rupt
ion
and
thei
r m
anif
esta
tions
in th
e co
nstr
uctio
n in
dust
ry. A
dapt
ed fr
om L
e et
al.
(201
4).
454 | Proceedings IGLC | July 2017 | Heraklion, Greece

Muzafar Thameem, Zofia K. Rybkowski, and James P. Smith
and functions, and asymmetrical information among parties (Le et al. 2014). Several researchers have argued that unethical behavior is one of the causes of corruption in the industry (Zarkada-Fraser and Skitmore 2000; Moodley et al. 2008). In this paper, we focus on unethical behavior as other issues such as asymmetric information and transparency have been studied extensively.
1.2 Ethics in the Construction Industry
Although employers may not force their employees to initiate or participate in unethical conduct, stakeholders in the construction industry witness or experience unethical conduct to some degree in the form of unfair conduct, negligence, conflict of interest, collusive tendering, fraud, confidentiality and propriety breach, bribery and violation of environmental ethics (Vee and Skitmore 2003). Workers do enjoy a fundamental right of professional conscience (Martin and Schinzinger 1996). However, it has been observed that in general, professionals tend to believe their obligations to the client are more important than to others, such as the public (Johnson 1991).
In the US construction industry, architects possess high ethical standards (Abramowitz 1998; Pressman 1997) which can be traced back to the American Institute of Architect’s code of ethics which prescribes “the common good is right” for issues not governed by laws (Pressman 1997). Similarly, the Project Management Institute (PMI: Code of Ethics and Professional Conduct, n.d.) lays down a code of ethics for project managers and the American Institute of Constructors (AIC: Bylaws and Code of Ethics, n.d.). However, contractors have developed a sour reputation for unethical behavior; this may be attributed to the high level of disputes between parties during a project (Pilvang and Sutherland 1998). Another major contributor to this may be the influx of new construction companies that lack necessary skills combined with greed (Ritchey 1990).
Several organizations have access to ethical conduct guidelines to assist with the decision-making process, but the construction industry still suffers from unethical conduct (Vee and Skitmore 2003). Advancement in ethics in the construction industry depends on the implementation of ethical guidelines-- policies of companies combined with leadership in public-sector procurement agencies (Vee and Skitmore 2003). All participants in the industry, irrespective of guidelines, require an understanding of the meaning of “common good.” Without guidelines, even ethically sound individuals have a difficult time maintaining moral standards (Vee and Skitmore 2003).
1.3 Professional Ethics
Professionals are defined as a group of individuals organized to serve specialized knowledge in the interest of society (Appelbaum and Lawton 1990). Johnson (1991) states that professionals are not exempt from ethical behavior, duties, and responsibilities that are binding for the common man. He adds that professionals are usually bound by principles and attitudes that control the way a profession is carried out. Johnson also argues that fairness should be extended not only for the benefit of clients but also for the greater good of society.
2 RELATIONSHIPS AND UNETHICAL BEHAVIOR Previous research into unethical conduct in the construction industry has called for increasing transparency and introducing a code of ethics among other strategies. However, there is little to no research on the nature and type of relationships which may be conducive to unethical conduct. Since construction relies heavily on the dynamics of human relationships, one should consider how these relationships offer the potential to reduce unethical behavior in the industry (Hollingsworth 2016). Unethical behavior is a social phenomenon; it involves relationships between people and a
455 | Proceedings IGLC | July 2017 | Heraklion, Greece

Delivery Methods and Social Network Analysis of Unethical Behavior in the Construction Industry
general consideration for the “other.” In the following sections, the basic types of relationships found on typical construction projects are examined.
2.1 Types of Relationships The strength of a relationship is defined by the frequency, reciprocity and emotional intensity of the relationship (Granovetter 1973). A weak relationship has a low barrier to unethical conduct while in a strong relationship, the associated costs are high for unethical conduct.
The degree to which two individuals are connected in more than one way is known as multiplexity of the relationship. Multiplexity adds an additional constraint for acting unethically (Brass et al. 1998).
Unethical behavior is most likely to occur in asymmetrical relationships when the trust and emotional involvement of one individual are not reciprocated by the other (Carley and Krackhardt 1990). Asymmetrical ties place one party at an advantage and increase the opportunity and payoffs for that party.
Status is defined as the relative power difference between actors. Asymmetric power in a relationship places the party of lower status at risk of being treated unethically. The lower status party is less likely to engage in unethical conduct as the party with the upper hand can retaliate with more severe consequences. In this situation, the probability of the party with higher status engaging in unethical conduct depends almost entirely on its moral character (Brass et al. 1998).
2.2 Structure of Relationships The presence of individuals in a strict hierarchal structure found in traditional delivery methods (Figure 1) increases the opportunity for unethical behavior (Zey-Ferrell and Ferrell 1982). A hierarchically flat organization increases surveillance and the reputation of the individual is put at risk. McCabe and Trevino (1993) found that ethical behavior is influenced by the individual’s perception of being caught. The presence of peers, their perceptions, and frequency of contact influences ethical behavior (Izraeli 1988; McCabe and Trevino 1993; Zey-Ferrell & Ferrell 1982; Zey-Ferrell et al. 1979). Of greater importance is the structure of the relationship. The following examines the basics of structure in a relationship.
Owner
Designer General Contractor
Sub Sub
Owner
Design-General Contractor
Sub Sub
Owner
Designer General Contractor
Sub Sub
(a) Design Bid Build (b) Design Build (c) Integrated Project Delivery
Figure 1. Structure of contractual relationships in different delivery methods. Adapted from El Asmar et al. 2013)
Structural holes represent the absence of a link between two individuals or parties (Burt 1992).
It is the absence of a relationship and is a hindrance to information sharing. In Design Bid Build
456 | Proceedings IGLC | July 2017 | Heraklion, Greece

Muzafar Thameem, Zofia K. Rybkowski, and James P. Smith
(Figure 1(a)), the owner, architect, and contractor may form a structure similar to Figure 2(a). There is a clear gap in communication; such relations in the industry, for example, can lead to an increase in the number of requests for information (RFIs) (El Asmar et al. 2013). The number of RFIs can be considered as a communication performance metric; they contribute to considerable waste on a project. In such situations, surveillance between parties is low and the probability of unethical conduct is high.
When participants are connected in mixed structures such as in figure 2(b), it is less likely that actors A and B will act unethically toward one another because surveillance is higher. This relationship structure is, arguably, found in Design Build projects (Figure 2(b)). An empirical study by Hale et al. (2009) found Design Build to be superior to Design Bid Build because it facilitates greater levels of collaboration. Fewer contingencies were observed and relationships between participants were stronger.
However, in 2(b) although there is a reduced risk of unethical behavior between parties A & B--because of increased surveillance and risk of damaged reputation--A and B can still form a coalition and act unethically toward C (Murnighan & Brass 1991). Such coalitions have been observed in Design Bid Build and Design Build projects. Moreover, C might perceive unethical behavior even though A and B do not have any such intention. In this case, the fear of being taken advantage of--or in other words, the mere fear of unethical conduct--may become a motivating factor for C to engage in unethical conduct.
(a) Structural Hole (b) Mixed (c) Simmelian Tie
A
B
C
A
B
C
A
B
C
Figure 2. Relationships and unethical behavior. Adapted from Brass et al. (1998).
By contrast, Lean-Integrated Project Delivery aims to form structures between participants similar to figure 2(c). This arrangement is called a simmelian triad4 (Krackhardt 1999). In this instance, any noted unethical behavior is transmitted quickly to a third party as surveillance is high and there is a risk of loss of reputation.
The extent to which an individual can reach to others in the least number of links within the network is defined as centrality (Freeman et al. 1979). Direct connections increase surveillance and determine the extent to which news of unethical conduct spreads to others. Hence, actors having high centrality have more to lose from unethical conduct than those who are isolated in the network (Brass et al. 1998). Density refers to the extent of network ties as opposed to the total number of possible connections (Scott 1991). High-density networks have higher surveillance and high loss of reputation. Conversely, loosely connected ties have the potential to facilitate unethical conduct (Brass et al. 1998).
4Two people are “Simmelian tied” to each other if they are reciprocally and strongly tied to each other and if they are reciprocally and strongly tied to at least one third party in common (Krackhardt 1999).
457 | Proceedings IGLC | July 2017 | Heraklion, Greece

Delivery Methods and Social Network Analysis of Unethical Behavior in the Construction Industry
Comparing the structure of delivery methods and structure of unethical behavior from a social network analysis perspective, the similarity is striking. While it is hard to quantify the amount of unethical conduct in different delivery methods, a more collaborative approach would lead arguably lead to more ethical behavior as suggested by social network analysis of unethical behavior (Figure 3).
(a) Design Bid Build (b) Design-Bid (c) Integrated Project Delivery(Simmelian Tie)
A
B
C
A
B
C
A
B
C
Figure 3. Comparison of structure of delivery methods and structure of unethical behavior from social network analysis perspective. Adapted from El Asmar et al. (2013) and Brass et al. (1998).
3 LEAN CONSTRUCTION AND RELATIONAL CONTRACTING
There are two fundamentally different types of contracting: transactional and relational (Williamson 1979; Macneil 1973). Lean construction champions the latter, as it is consistent with flow and value generation. Murdoch and Hughes (2002) state the risks associated with executing a project and to which participants are subject are considered separate while risks associated with processes are ignored in traditional delivery methods. The dispute record of the construction industry suggests it is impossible to draft traditional contracts for projects that include all contingencies and risks, limit opportunistic behavior, and still maintain efficiency (Matthews and Howell 2005). A relational contract provides a basis for long-term complex contracts with flexibility so that the participants can express their concerns in new environments (Joskow 1987, 1990; Leffler and Ruker 1991, Gundlach and Achrol 1993, Swierczek 1994).
The main characteristics of relational contracts are (Cheung et al. 2006): • personal interactions are crucial; • the transaction is usually of long duration; • the future cooperation opportunity is large; • there is flexibility to cope with unforeseen circumstances; and • it is anti-discrete. Relational contracts can be effective in attaining mutual benefits, developing long-term
relationships and avoiding adversarial tendencies. Relational contracting enhances the project performance by sustaining long-term relationships, acting as a buffer to unethical conduct. The idea is to create value beyond the project for participants and society. Trust and partnership are held in high regard among the project participants rather than the terms of the contract. This results in greater commercial value to participants and effective collaboration through knowledge-sharing.
458 | Proceedings IGLC | July 2017 | Heraklion, Greece

Muzafar Thameem, Zofia K. Rybkowski, and James P. Smith
4 CONCLUSION In lean construction, each representative of a party is present in the Big Room. Lean construction champions a decentralized decision-making process that helps avoid the perception of being used unethically by another party. It operates on the principle of reliable workflow and metrics describing inputs to these flows are made transparent (Howell et al. 2010). By creating this kind of network, the entire team begins to think alike which sets in motion a snowball effect. This alignment resides at the crux of lean thinking. This model creates a “virtual company” with representatives from each organization who possess strong ties within their company and who share proximity with other representatives (Thomsen et al. 2010). Individuals identify and adopt similar attitudes and behavior with others who occupy similar positions in and across groups. This develops empathy toward others, acting as a barrier to unethical conduct. In this way, behavior on a Lean construction jobsite can exceed the ethical codes prescribed. This can represent a necessary step in the right direction to reduce unethical conduct in the construction industry. The structure of delivery methods shares a structure of relationship similar to that of unethical conduct from a social network analysis perspective. Construction directly reflects the economic development of a country. Implementation of Lean-IPD in construction may be an effective grass roots weapon for combatting corruption. Further research needs to be conducted through the lens of psychology to better understand the interplay of relationships and their impact on decision-making behavior within various construction delivery methods.
5 REFERENCES
Abramowitz, A.J. (1998). “Speak out: a lawyer finds that architects, in their intense pursuit often ethics, often deny themselves a pragmatic practice,” Architectural Record, Nov, 24–7.
Ahmad, I. U., Russell, J. S., & Abou-Zeid, A. (1995). “Information technology (IT) and integration in the construction industry,” Construction Management and Economics, 13(2), 163-171.
Appelbaum, D., Lawton, S.V. (1990). Ethics and the professions, Prentice-Hall, USA Brass, D. J., Butterfield, K. D., & Skaggs, B. C. (1998). “Relationships and unethical behavior: A
social network perspective,” Academy of Management Review, 23(1), 14-31. Burt, R. S. 1992. Structural holes: The social structure of competition, Cambridge, MA: Harvard
University Press. Bylaws and Code of Ethics (n.d.). Retrieved from
http://www.professionalconstructor.org/?page=Bylaws Carley, K., & Krackhardt, D. (1990). ”Emergent asymmetries in organizations,” Paper presented at
the Social Network Conference, San Diego, CA. Cheung, S. O., Yiu, K. T., & Chim, P. S. (2006). How relational are construction
contracts?. Journal of Professional Issues in Engineering Education and Practice, 132(1), 48-56.
Code of Ethics and Professional Conduct. (n.d.). Retrieved from http://www.pmi.org/-/media/pmi/documents/public/pdf/ethics/pmi-code-of-ethics.pdf?sc_lang_temp=en
Ehrlich, I., & Lui, F. T. (1999). “Bureaucratic corruption and endogenous economic growth,” Journal of Political Economy, 107(S6), S270-S293.
El Asmar, M., Hanna, A. S., & Loh, W. Y. (2013). Quantifying performance for the integrated project delivery system as compared to established delivery systems. Journal of Construction Engineering and Management, 139(11), 04013012.
Freeman, L. C., Roeder, D., & Mulholland, R. R. (1979). Centrality in social networks: II. Experimental results. Social networks, 2(2), 119-141.
Granovetter, M. (1973). “The strength of weak ties,” American Journal of Sociology, 78: 1360-1380.
459 | Proceedings IGLC | July 2017 | Heraklion, Greece

Delivery Methods and Social Network Analysis of Unethical Behavior in the Construction Industry
Gundlach, G. T., & Achrol, R. S. (1993). “Governance in exchange: contract law and its alternatives,” Journal of Public Policy & Marketing, 141-155.
Hollingsworth, J. (2016, November 23). It’s not just bricks and mortar – construction is a people’s business, says Gammon chief. Retrieved from http://www.scmp.com/business/article/2048625/its-not-just-bricks-and-mortar-construction-peoples-business-says-gammon.
Howell, G. A., Ballard, G., & Tommelein, I. (2010). Construction engineering—Reinvigorating the discipline. Journal of construction engineering and management, 137(10), 740-744.
Izraeli, D. (1988). “Ethical beliefs and behavior among managers: A cross-cultural perspective,” Journal of Business Ethics, 7: 263-271.
Johnson, D.G. (1991). Ethical issues in engineering, Prentice Hall, New Jersey: USA Joskow, P. L. (1987). “Contract duration and relationship-specific investments: Empirical evidence
from coal markets,” The American Economic Review, 168-185. Joskow, P. L. (1990). “The performance of long-term contracts: further evidence from coal
markets,” The Rand Journal of Economics, 251-274. Kenny, C. (2009). “Transport construction, corruption and developing countries,” Transport
Reviews, 29(1), 21-41. Leffler, K. B., & Rucker, R. R. (1991). “Transactions Costs and the Efficient Organization of
Production: A Study of Timber-Harvesting Contracts,” Journal of Political Economy, 1060-1087.
Le, Y., Shan, M., Chan, A. P., & Hu, Y. (2014). “Overview of corruption research in construction,” Journal of Management in Engineering, 30(4), 02514001.
Macneil, I. R. (1973). The many futures of contracts. S. Cal. l. Rev., 47, 691. Martin, M., & Schinzinger, R. (1996). “Ethics in Engineering”, McGraw-Hill, New York. Matthews, O., & Howell, G. A. (2005). Integrated project delivery an example of relational
contracting. Lean construction journal, 2(1), 46-61. McCabe, D. L., & Trevino, L. K. (1993). “Academic dishonesty: Honor codes and other contextual
influences,” Journal of Higher Education, 64(5): 522-538. Moodley, K., Smith, N., & Preece, C. N. (2008). “Stakeholder matrix for ethical relationships in the
construction industry,” Construction Management and Economics, 26(6), 625-632. Murdoch, J., & Hughes, W. (2002). Construction contracts: law and management. Routledge. Murnighan, J. K., & Brass, D. J. (1991). Intra-organizational coalitions. In M. H. Bazerman, R. J.
Lewicki, & B. H. Sheppard (eds.) Research on negotiation in organizations: 283-306. Greenwich, CT: JAI Press.
Pilvang, C., Sutherland, I. (1998). “Research Information: Environmental Management in Project Design,” Building Research & Information, The International Journal of Research, Development, Demonstration and Innovation, 26(2), Mar–Apr, 113
Pressman, A. (1997). Professional Practice 101, A Compendium of Business and Management Strategies in Architecture, John Wiley and Sons, USA
Ritchey, D. (1990). “Bonded by trust: a new construction ethics committee is formed,” Arkansas Business and Economic Review, 7(7), 26 Mar, 50.
Scott, J. (1991). Social network analysis: A handbook, London: Sage. Swierczek, F. W. (1994). “Culture and conflict in joint ventures in Asia,” International Journal of
Project Management, 12(1), 39-47. Snaith, M. S., and M. U. Khan.(2008) "Deleterious effects of corruption in the roads
sector." Proceedings of the Institution of Civil Engineers-Transport. Vol. 161. No. 4. Thomas Telford Ltd.
460 | Proceedings IGLC | July 2017 | Heraklion, Greece
Muzafar Thameem, Zofia K. Rybkowski, and James P. Smith
Sohail, M., & Cavill, S. (2008). “Accountability to prevent corruption in construction projects,” Journal of Construction Engineering and Management, 134(9), 729-738.
Tabish, S. Z. S., & Jha, K. N. (2011). “Analyses and evaluation of irregularities in public procurement in India,” Construction Management and Economics, 29(3), 261-274.
Thomsen, C., Darrington, J., Dunne, D., and Lichtig, W.(2010). “Managing integrated project delivery.” White paper of the Construction Management Association of America. McLean, VA, USA 52pp.
Transparency International. (2002). “Bribe payers index 2002.” ⟨http://archive.transparency.org/policy_research/surveys_indices/bpi/bpi_2002⟩ (Nov. 12, 2017).
Transparency International. (2006). “Bribe payers index 2006.” ⟨http://archive.transparency.org/policy_research/surveys_indices/bpi/bpi_2006⟩ (Nov. 12, 2017).
Transparency International. (2008). “Bribe payers index 2008.” ⟨http://archive.transparency.org/policy_research/surveys_indices/bpi/bpi_2008⟩ (Nov. 12, 2017).
Transparency International. (2011). “Bribe payers index 2011.” ⟨http://bpi.transparency.org/bpi2011/⟩ (Nov. 12, 2017)
Vee, C., & Skitmore, C. (2003). “Professional ethics in the construction industry,” Engineering, Construction and Architectural Management, 10(2), 117-127.
Williamson, O. E. (1979). Transaction-cost economics: the governance of contractual relations. The journal of Law and Economics, 22(2), 233-261.
Zarkada-Fraser, A., & Skitmore, M. (2000). Decisions with moral content: collusion. Construction Management & Economics, 18(1), 101-111.
Zey-Ferrell, M., & Ferrell, 0. C. (1982). “Role set configuration and opportunity as predictors of unethical behavior in organizations,” Human Relations, 35: 587-604.
Zey-Ferrell, M., Weaver, K. M., & Ferrell, O. C. (1979). Predicting unethical behavior among marketing practitioners. Human Relations, 32: 557-569.
461 | Proceedings IGLC | July 2017 | Heraklion, Greece

462 | Proceedings IGLC | July 2017 | Heraklion, Greece