2016-Reference-Document.pdf - Kering Brand Portal
402
Reference document 2016
-
Upload
khangminh22 -
Category
Documents
-
view
2 -
download
0
Transcript of 2016-Reference-Document.pdf - Kering Brand Portal
Reference document2016


12016 Reference Document ~ Kering
TABLE OF CONTENTS
CHAPTER 1Kering in 2016 3
CHAPTER 2Our activities 17
CHAPTER 3Sustainability 57
CHAPTER 4Corporate governance 141
CHAPTER 5Financial information 221
CHAPTER 6Share capital and ownership structure 367
CHAPTER 7Additional information 379
This is a free translation into English of the 2016 Reference Document issued in French and is provided solely for theconvenience of the English speaking users.
1_VA_V4 04/04/2017 13:21 Page1

2 Kering ~ 2016 Reference Document
1_VA_V4 04/04/2017 13:21 Page2

32016 Reference Document ~ Kering
CHAPter 1
Kering in 2016
1. History 4
2. Key consolidated figures 6
3. Group strategy 8
4. Kering Group simplified organisational chart as of December 31, 2016 15
1_VA_V4 04/04/2017 13:21 Page3

The Kering group was founded by François Pinault in 1963,as a timber and building materials business. In the mid-1990s, the Group repositioned itself on the retail marketand soon became one of the leading players in the sector.
The acquisition of a controlling stake in Gucci Group in 1999and the establishment of a multi-brand Luxury Goodsgroup marked a new stage in the Group’s development.
In 2007, the Group seized a new growth opportunity withthe purchase of a controlling stake in PUMA, a worldleader and benchmark in Sport & Lifestyle.
Having fully aligned the Group around its Luxury andSport & Lifestyle activities, since 2014 Kering has continuedits growth story aimed at unlocking the potential of itsbrands.
1963• François Pinault establishes the Pinault group, specialising
in timber trading.
1988• Flotation on the Paris Stock Market’s Second Market of
Pinault SA, a company specialising in timber trading,distribution and processing.
1990• Acquisition of Cfao, a group specialising in electrical
equipment distribution (through CDME, which becameRexel in 1993) and in trading with Africa.
1991• The Group acquires Conforama and enters the retail
market.
1992• The Pinault-Printemps Group is born with the takeover
of Au Printemps SA, which held 54% of La Redoute andFinaref.
1994• La Redoute is merged into Pinault-Printemps, and the
Group is subsequently renamed Pinault-Printemps-Redoute.
• Takeover of Fnac.
1995• Launch of the Group’s first website, laredoute.fr.
1996• Creation of Orcanta, a women’s lingerie chain.
1997• Takeover by Redcats (Kering’s home shopping business)
of Ellos, the leader on the Scandinavian mail order market.• Creation of Fnac Junior, a concept store for children
under 12.
1998• Takeover of Guilbert, the European leader in office
supplies and furnishings.• Acquisition by Redcats of 49.9% of Brylane, the fourth-
largest home shopping company in the US.• Creation of Made in Sport, a chain of stores dedicated
to sports enthusiasts.
1999• Purchase of the remaining stake in Brylane.• The Group enters the Luxury Goods sector with the
acquisition of 42% of Gucci Group NV.• First steps towards the creation of a multi-brand Luxury
Goods group, with the acquisition by Gucci Group ofYves Saint Laurent, YSL Beauté and Sergio Rossi.
• Launch of Fnac.com, the Fnac website.
2000• Acquisition of Surcouf, a specialised PC retailer.• Acquisition by Gucci Group of Boucheron.• Launch of Citadium, the new Printemps sports store.
2001• Gucci Group acquires Bottega Veneta and Balenciaga
and signs partnership agreements with Stella McCartneyand Alexander McQueen.
• Pinault-Printemps-Redoute raises its stake in GucciGroup to 53.2%.
2002• The Group raises its stake in Gucci Group to 54.4%.• Sale of the Guilbert home shopping business to Staples Inc.• Partial disposal of the Credit and Financial Services
division in France and Scandinavia to Crédit Agricole SA(61% of Finaref) and BNP Paribas (90% of Facet).
2003• The Group raises its stake in Gucci Group to 67.6%.• Sale of Pinault Bois & Matériaux to the Wolseley group
in the UK.• Sale of an additional 14.5% stake in Finaref.
1. HISTORy
1 KERING IN 2016 ~ HISTORY
4 Kering ~ 2016 Reference Document
1_VA_V4 04/04/2017 13:21 Page4

2004• The Group raises its stake in Gucci Group to 99.4%
further to a tender offer.• Sale of Rexel.• Sale of the residual 24.5% stake in Finaref.
2005• Change of corporate name: Pinault-Printemps-Redoute
becomes PPR.• Sale of the residual 10% stake in Facet.
2006• Sale of 51% of France Printemps to RREEF and the
Borletti group.• Sale of Orcanta to the Chantelle group.• Sale of the Bernay industrial site (YSL Beauté Recherche
et Industrie).• Discontinuation of Fnac Service’s activities.• Acquisition by Conforama of a majority stake in Sodice
Expansion.• Acquisition by Redcats group of The Sportsman’s
Guide, Inc.
2007• Sale of the residual 49% stake in France Printemps to
RREEF and the Borletti group.• Sale of Kadéos to the Accor group.• Acquisition of a 27.1% controlling stake in PUMA. This
stake was increased to 62.1% further to a tender offer.
2008• Sale of YSL Beauté to L’Oréal.• Sale of Conforama Poland.• Sale by Redcats UK of Empire Stores and by Redcats
USA of the Missy division.• Acquisition of a 23% stake in Girard-Perregaux.
2009• Acquisition by PUMA of Dobotex International BV.• Acquisition by PUMA of Brandon AB.• Sale of Bédat & Co.• Sale of Surcouf.• Flotation of 58% of Cfao.
2010• Acquisition by PUMA of a 20% stake in Wilderness
Holdings Ltd.• Acquisition by PUMA of COBRA.• Sale of Fnac éveil & jeux.• Sale of the controlling stake in Conforama to Steinhoff.
2011• Closing of the sale of Conforama to Steinhoff.• Acquisition of Volcom.• Increased stake (50.1%) in Sowind Group (Girard-
Perregaux and JEANRICHARD).• Announced acquisition of Brioni.
2012• Closing of the acquisition of Brioni.• Sale of the remaining 42% stake in Cfao to TTC.• Creation of a joint venture with Yoox S.p.A. dedicated to
e-commerce for several Luxury brands of the Group.• Announced project to demerge and list Fnac.• Sale of Fnac Italy.• Sale of Redcats USA business (The Sportsman’s Guide and
The Golf Warehouse, announced sale of OneStopPlus).• Announced acquisition of a majority stake in Chinese
fine jewelry brand Qeelin.
2013• Closing of the acquisition of a majority stake in Chinese
fine jewelry brand Qeelin.• Acquisition of a majority stake in the luxury designer
brand Christopher Kane.• Closing of the sale of OneStopPlus.• Sale of the Children and Family division of Redcats, Cyrillus
and Vertbaudet.• Acquisition of a majority stake in tannery France Croco.• Sale of the Nordic brands of Redcats, Ellos and Jotex.• Listing of Groupe Fnac.• Change of corporate name: PPR becomes Kering.• Acquisition of a majority stake in Italian jewelry group
Pomellato.• Kering enters into exclusive negotiations for the disposal
of La Redoute and Relais Colis.
2014• Closing of the sale of La Redoute and Relais Colis.• Announced project of internalisation of the Eyewear
business value chain.• Acquisition of the Haute horlogerie brand Ulysse Nardin.
2015• Sale of the industrial property rights of the Tretorn group
(which include trademark rights, patents and designs)by PUMA.
• Launch of Kering Eyewear.• Sale of the Italian luxury shoemaker Sergio Rossi.
2016• Creation of a new division called Kering Luxury Logistics
and Industrial Operations (KLLIO) which combinesKering Supply Chain, Logistics and Industrial Operations.
• Sale of Electric by Volcom.
1HISTORY ~ KERING IN 2016
52016 Reference Document ~ Kering
1_VA_V4 04/04/2017 13:21 Page5

1
6 Kering ~ 2016 Reference Document
dividend per share (in €)
Equity and debt-to-equity ratio* (in € millions and in %)
Free cash flow from operations (2)
(in € millions)
Net income attributable to ownersof the parent(in € millions)
(in € millions) 2016 2015 Change
Revenue 12,385 11,584 +6.9%
EBITDA 2,318 2,056 +12.7%EBITDA margin (as a % of revenue) 18.7% 17.8% +0.9pt
Recurring operating income 1,886 1,647 +14.5%Recurring operating margin (as a % of revenue) 15.2% 14.2% +1.0pt
Net income attributable to owners of the parent 814 696 +16.9%o/w continuing operations excluding non-recurring items 1,282 1,017 +26.0%
Gross operating investments (1) 611 672 -9.1%
Free cash flow from operations (2) 1,189 660 +80.2%
Net debt (3) 4,371 4,679 -6.6%
Average number of employees (full time equivalent) 35,877 34,697 +3.4%
Per share data (in €) 2016 2015 Change
Earnings per share attributable to owners of the parent 6.46 5.52 +17.0%o/w continuing operations excluding non-recurring items 10.17 8.07 +26.0%
Dividend per share (4) 4.60 4.00 +15.0%
2. Key consolidated figures
KERING IN 2016 ~ KEY CONSOLIDATED FIGURES
40.3 %
36.5 %2015
* Net debt (3) / equity.
11,623
2016 11,964
2015 660
2016 1,189
Net debt(3)
(in € millions)
2015 4,679
2016 4,371
Solvency ratio(Net debt(3)/EBITDA)
2015 2.28
2016 1.89
2015 696
2016 814
2015 4.00
2016(4) 4.60
2014 4.00
(1) Purchases of property, plant and equipment and intangible assets.(2) Net cash flow from operating activities less net acquisitions of property, plant and equipment and intangible assets.(3) Net debt is defined on page 222.(4) Subject to the approval of the Annual General Meeting to be held on April 27, 2017.
1_VA_V4 04/04/2017 13:21 Page6

Luxury 94%
Sport & Lifestyle 6%
€2.1 bn
1KEY CONSOLIDATED FIGURES ~ KERING IN 2016
revenue breakdown by activity
Recurring operating incomeBreakdown by activity(2)
Recurring operating income change and margin
Recurring Reported Recurring operating change operating(in € millions) income (in %) margin (in %)
Luxury 1,936 +13.3% 22.9%Sport & Lifestyle 123 +30.0% 3.2%Corporate and other (173) -10.8% -
Group 1,886 +14.5% 15.2%
Revenue breakdown and comparable (1) change by region
Group revenue2016 vs 2015 comparable (1) change, in %
Luxury 69%
Sport & Lifestyle 31%
€12.4 bn
31% of revenuechange: +11%
Western EuropeNorth AmericaJapan
Asia Pacific Other countries
11% of revenuechange: +10%
10% of revenuechange: 0%
22% of revenuechange: +4%
26% of revenuechange: +11%
Luxuryactivities +7.8%
Sport &Lifestyleactivities
+9.0%
Group +8.1%
72016 Reference Document ~ Kering
(1) Comparable revenue is defined on page 222.(2) Excluding corporate and others.
1_VA_V4 04/04/2017 13:21 Page7

The Group began extensively transforming its portfolio in2005 with the aim of gradually phasing out its mass-retailbusinesses located mainly in France and Europe, in orderto become a Luxury Group boasting top global Luxury brandsalong with iconic brands in the Sport & Lifestyle segment.
This transformation chimed with the Group’s intention tofocus its development on new growth drivers by capitalisingon changes in the global economy and harnessing themaximum potential of each of its markets. These growthdrivers include:
• a global economy, which will continue to be led bymature markets but will also be shaped by the growinginfluence of emerging markets;
• emerging market growth, underpinned by demographictrends and rapid urbanisation, gradually creating newpopulation segments with access to consumerdiscretionary goods;
• a gradual convergence in consumer patterns, propelledby growing aspirational demand in new markets for globalbrands, and supported by the development of internationaltourism and the digital economy;
• robust demand in both mature and emerging marketsfor branded Sport & Lifestyle and Luxury products, a segmentin which the Group has been well positioned since its1999 acquisition of Gucci Group.
From 2005 onwards, the Group began refocusing itsactivities, gradually withdrawing from mass-marketretailing activities with the sale of Printemps, Cfao,Conforama, Surcouf, certain international businesses andthe children’s division of Redcats, listing of Fnac on thestock market and sale of La Redoute.
At the same time, the Group embarked upon an ambitiousexpansion programme to grow its portfolio of Luxury andSport & Lifestyle brands. The first phase of the Group’stransformation, through 2015, involved expanding andstrengthening Kering’s brand portfolio, both throughorganic growth and targeted acquisitions, with the aim ofbuilding a complementary ensemble of powerful brands.
From PPR to Kering: Building a group on a global scale
Since its inception in 1963, Kering (then PPR) hascontinuously transformed itself, constantly seekinggrowth and creating value with an entrepreneurial spirit.
Between 2005 and 2014, Kering undertook an in-depthstrategic transformation, from a diverse conglomerateinto a cohesive international group entirely dedicated toa complementary ensemble of apparel and accessoriesbrands.
The change in the name of the Group from PPR to Keringin 2013 reflects this new identity. Pronounced “caring”,the new corporate identity symbolises the way in whichthe Group nurtures its brands, employees and customers,as well as the environment.
3. Group strategy: Empowering imagination
1 KERING IN 2016 ~ GROUP STRATEGY
8 Kering ~ 2016 Reference Document
1_VA_V4 04/04/2017 13:21 Page8

Adopting a multi-brand strategy is virtuous in manyregards. Taken individually, each brand has its owndistinctive identity, know how, positioning and growthpotential enabling it to reach critical mass at a globallevel. Together, they form a coherent and complementaryensemble, particularly in terms of market segments,stages of maturity and geographic base. There is nocompetition across the brands but rather a focus onidentifying and harnessing synergies.
From a financial and operational standpoint, Kering’sbalanced and diversified business model helps the Group
weather changes in the economic environment affectinga given activity or region. It combines growth andprofitability, as the Group allocates operating investmentson the basis of each brand’s business cycle, enablingthem to preserve exclusivity while maximising growth.
Kering has strengthened its portfolio in recent yearsthrough the acquisition of brands set to play a key role inthe Group’s development and value creation. As part ofthis strategy, Brioni, Pomellato group, Qeelin, ChristopherKane and Ulysse Nardin have joined the Group.
A multi-brand model: a complementary ensemble of powerful brands
Four key pillars underscore the Group’s strategy
1GROUP STRATEGY ~ KERING IN 2016
92016 Reference Document ~ Kering
● Balanced portfolio: - of complementary brands; - built through acquisitions and developed through organic growth.
● Business model and management aimed at leveraging: - differentiated cycles and degrees of maturity; - growth dynamics specific to each brand.
Multi-brandmodel1
● Foundation: secular growth of markets.● Capital: attractiveness of the brands.● Growth lever: same-store performance.● Accelerator: online presence.
Organicgrowth2
● Integrated specialised group. ● Optimisation of processes.● Strong generation of free cash flow, from operations.● Improving return on capital employed.
Value creationby brandsand Group
3
● Social and societal responsability.● Environmental responsability.● Creativity and leadership.
Sustainability4
1_VA_V4 04/04/2017 13:21 Page9
The worldwide standing, desirability and huge consumerappeal of Kering’s brands are key assets, which drive theirorganic growth potential.
The growth of these brands is underpinned by a series ofclearly identified drivers:
(i) Launching new product categories and refining existing lines
The Group’s brands work continuously to produce creative,attractive and innovative products for existing ranges andto introduce new product categories with untappedpotential. They are careful to constantly adapt and improvethe structure and performance of their collections tomeet the specific needs of their clientele in terms offunctionality, trends and pricing, and to draw in newgenerations of customers.
(ii) Improving performance in existing sales networks
In their network of directly operated stores, the brandsdeploy initiatives to boost sales performance, capitalising onincreasingly effective merchandising, in-store operationalexcellence, an in-depth knowledge of their customers,customer loyalty and development programmes, andtargeted communications.
(iii) Strengthening distribution channels through the selective expansion of directly operated store networks, close relationships with third-partyretailers, and the implementation of a dynamic e-commerce strategy
The Group is permanently fine-tuning its network ofdirectly operated stores to optimise the distribution of itsbrands and seize growth opportunities around the globe.Taking into account the characteristics and maturity ofeach brand, this strategy translates into targeted storeopenings to broaden penetration in certain markets, orstore relocations to occupy the very best locationsavailable. Adapting the Group’s retail network also entailsstore renovation and expansion projects, as well asoccasional store closures when brand criteria are nolonger met. In addition, the Group’s brands are constantlyseeking to enhance the quality of their third-partydistribution, a channel that has strategic significance forSport & Lifestyle activities. Kering also invests in e-commerceplatforms alongside traditional channels in response tonew consumer and purchasing practices. Lastly, thegrowth potential in the Travel Retail channel is graduallybeing tapped.
Priority focus on organic growth
These acquisitions were driven by the following strategicgoals and financial criteria:
• Potential targets must enjoy exceptional brand identity,strong values and a sought-after heritage; a uniquescope of expression through lasting codes and languagethat represents the brands’ DNA; and an ability tobroaden their geographic footprint and to graduallyexpand their market coverage.
• Targets must have genuine potential for significantimprovements in financial performance that Kering isable to identify and deploy in the long term, above andbeyond the potential specific to each. As well as seekingrevenue synergies derived from the increased capacity
of newly acquired brands to expand their geographicpresence or product categories once they join theGroup, Kering also looks for synergies arising frombrand expertise in terms of technical, commercial andinnovation know-how. Finally, the Group evaluates thepotential for savings at operational (purchasing, supplychain, real estate, etc.) and financial levels. These synergiesare analysed and appraised during the acquisition process,giving rise to a financial and operational roadmap tovalue creation drawn up at the outset of the integrationprocess.
Kering has built up a harmonious ensemble of brands andits priority today is to invest in order to develop these brands.
1 KERING IN 2016 ~ GROUP STRATEGY
10 Kering ~ 2016 Reference Document
1_VA_V4 04/04/2017 13:21 Page10

Kering sets the strategic and financial framework withinwhich the brands operate, and provides the structures,organisations and means to protect and support thesustainable growth of its brands.
Kering initially deployed a number of horizontal functionsand services for its Luxury brands, including real estate, e-commerce, indirect purchasing, intellectual property,strategic marketing and media buying, to allow them tofocus on their individual business objectives and supporttheir growth, especially internationally.
Shared services platforms have been set up in the Group’sthree biggest regions – Europe, America, and Asia Pacific.These centres employ experts in communications, audit,human resources, tax, property, legal affairs, IT systems,accounting and cash management, providing brandswith appropriate support for the local context.
More recently, important additional steps have been takenin order to transform Kering into a more tightly integratedGroup. The finalisation of the Group’s transformation,combined with recent changes in its markets, consumertrends and the competitive environment, have led to newmilestones.
(i) Kering has adapted its organisation to better reflectthe areas of activity of the Group’s Luxury brands andstrengthen the operational oversight of its businesses.Two new divisions were set up:
• Luxury – Couture & Leather Goods, comprising Gucci,Bottega Veneta, Saint Laurent, Balenciaga, as well asemerging brands Alexander McQueen, Brioni, ChristopherKane, McQ and Stella McCartney;
• Luxury – Watches & Jewelry, encompassing Boucheron,Girard-Perregaux, Pomellato, Dodo, Qeelin and Ulysse Nardin.
(ii) From 2013, the Group strengthened its upstreampositioning in the Luxury value chain, with the targetedacquisition of leather tanneries to secure raw materialssourcing. Logistics activities for its Couture & LeatherGoods brands have long been centralised, much like ready-to-wear prototyping, which is pooled in a shared unit inItaly. To ensure that this vertical integration is as relevant,effective and efficient as possible in terms of services,synergies and scale at all times, all of these operationshave been placed under the direct governance andoversight of Kering.
(iii) In 2014, Kering launched a key strategic initiative aimedat growing in-house expertise in Eyewear for its Luxuryand Sport & Lifestyle brands. The worldwide market forframes and sunglasses is vast and its premium segment
is enjoying substantial growth. To maximise the developmentof its portfolio of brands in this important category,Kering has decided to internalise the value chain for itsEyewear activities, from product creation and developmentto supply chain management, brand strategy, sales andmarketing. This innovative management model will give riseto significant value creation opportunities and help thebrands step up the pace of growth in the Eyewear category.
(iv) The digital challenge: Digital is a strategic priority forKering, not only for the business the Group’s brandsconduct online but also because it influences demandacross all sales channels. Gucci is a pioneer in Luxury e-commerce. Launched in 2002 and completely revampedin 2015, its website sets the standard in this field and thebrand’s digital know-how is widely recognised. Since theOther Luxury brands did not enjoy internal capabilitiescomparable to Gucci’s, in 2012 the Group set up a Keringe-commerce platform to provide the Couture & LeatherGoods division brands with the necessary technicalcompetence to develop their online business and digitalstrategy. All the brand sites now feature mobile- and tablet-optimised browsing, shared performance-measurementtools and a dedicated team of specialists to help continuouslyimprove site performance, conversion rates and customersatisfaction.
Our customers are increasingly connected, geographicallymobile and sensitive to the fluidity of their shoppingexperience spanning bricks-and-mortar stores and onlineboutiques. In this context, the Group’s e-commerceteams set out cross-channel service strategies adapted tothe characteristics of each brand. These include allowingcustomers to check in-store availability online, makeonline purchases, collect online product purchases instores, and reserve goods online, etc. A host of additionalfeatures are in the pipeline. Kering is also encouraging itsbrands to try out new solutions, with pilot projects tohelp brands test new technologies. The results are thenshared with the other brands within the division as aprelude to Group-wide rollout.
With the aim of ultimately offering a seamless omni-channel approach covering both physical stores andonline boutiques, Kering is currently assessing a large-scale project to establish a single shared customerdatabase across distribution channels and to modernise,harmonise and optimise its information systems andoperational processes.
The Sport & Lifestyle brands are also working on optimisingand revitalising e-commerce, against the backdrop ofextremely rapid online growth in the sector.
An integrated Group, structured to tap into the potential for growth and value creation
1GROUP STRATEGY ~ KERING IN 2016
112016 Reference Document ~ Kering
1_VA_V4 04/04/2017 13:21 Page11

Kering believes that sustainable business is smartbusiness. Sustainability is both a business and leadershipopportunity for Kering, allowing the Group to create value. Itstimulates growth, innovation and competitive advantagein the medium to long term, whilst simultaneouslyreducing costs. It also constitutes a motivational factorfor employees, enabling the Group to attract and retainthe best talents.
Sustainability is a key component of the Group brands’strategy. Kering empowers all its brands to developproducts that meet the utmost standards of innovation,quality and sustainability.
Kering’s Sustainability Department supports each of theGroup’s brands with the development and operationalrollout of their brand-specific action plans. Comprisingaround 15 experts, the team’s expertise encompasseseverything from environmental footprint analysis,responsible raw material sourcing, ecosystem conservation,energy efficiency and social compliance. The departmentdrives change within the Group by providing the brandswith the necessary know-how, guidance, collaborationand economies of scale needed to develop moresustainable business models. The Chief SustainabilityOfficer sits on Kering’s Executive Committee and ensuresa cohesive and integrated approach to sustainabilityacross the Group.
2016 was a turning point for Kering in terms of sustainabledevelopment. Delivering on its commitment to transparencyand following the 2014 publication of a mid-termprogress report, in 2016 Kering unveiled its definitivesustainability report detailing the progress made and theresults of the targets it had set for 2012-2016. Thesetargets had driven and structured Kering’s strategy, withthe Group choosing to go beyond a traditional approachand extend its goals and action to all of its supply chains.This is reflected in its Environmental Profit and Lossaccount (E P&L), the cornerstone of its initiative.
At the same time, under the aegis of the Group’sChairman and Chief Executive Officer, Kering’s teamsworked on a new chapter of the sustainable developmentstrategy through 2025. François-Henri Pinault wishedthat the Group’s Luxury brands be involved in writing thisnew chapter and met with all management teams andcreative staff during a period of over a year. The goal wasto define a strategy that met the specific needs of eachbrand, to ensure that targets were duly implemented froman operational standpoint and to embed sustainabilityconcerns more deeply at all levels of the Group. Theseefforts culminated in a ten-year strategy based aroundthe three pillars of environment, social responsibility andinnovation. The strategy sets concrete targets for the periodup to 2025 on which the Group is to report its progressevery three years.
Kering also continued to work on its ambitious socialresponsibility goals. It set up a single, centralised integratedorganisation to manage its suppliers and oversee theLuxury brands’ compliance with social imperatives;published the results of its 2015 E P&L; set an ambitioustarget to reduce greenhouse gas emissions which wasapproved by the Science Based Targets Initiative – a firstin the Luxury sector and for a French company; and put inplace a proactive parental policy for Group employeesworldwide.
Convinced that sustainability will play an ever moreprominent role in fashion going forward, Kering is alsocommitted to nurturing close ties with young talent andupcoming designers. This is the aim behind the variouspartnerships entered into across the globe, including inthe UK with the Centre for Sustainable Fashion (part ofthe London College of Fashion), in China with TsinghuaUniversity, and in the US with Parsons and the FashionInstitute of Technology. To raise the awareness ofsustainability issues among future generations ofdesigners, Kering has developed a mobile app based on
Sustainability at the heart of Kering’S Group and brand strategy
(v) In late 2016, the Group created a new Chief Client andMarketing Officer role to help brands better anticipateand meet customer needs and fulfil their desires in anincreasingly competitive Luxury market. The brands’success going forward will depend on their ability toprovide customers with a rewarding and consistentexperience across all channels, and on enhancingrelationships with customers to optimise customersatisfaction and loyalty. Kering’s Chief Client and MarketingOfficer is responsible for monitoring the value and imageof each of the Group’s brands over the long term, forbuilding a comprehensive, measurable and profitable
customer culture for each brand as well as for the Groupand for accelerating omni-channel distribution acrossthe Group.
(vi) Recognising that its teams are the driving forcebehind its future success, Kering has developed anambitious, integrated, worldwide human resourcesframework, based on ever-greater mobility across thebrands. Kering’s HR strategy is aimed at helping its brandsflourish through access to a shared talent pool, expertise,standards, information systems and best practices.
1 KERING IN 2016 ~ GROUP STRATEGY
12 Kering ~ 2016 Reference Document
1_VA_V4 04/04/2017 13:21 Page12
Global economic growth remained subdued in 2016, atan estimated 3.1%, amid a moderate slowdown ineconomic growth in certain key emerging markets suchas China and the lack of any convincing recovery in theeurozone, notwithstanding the fairly robust performanceof the US economy.
In a persistently uncertain environment shaped bygeopolitical tensions and their ramifications, Kering hasdemonstrated the relevance of its multi-brand model.The Group’s strategy is consistent: to nurture eachbrand’s long-term potential, with priority given to organicgrowth and operating cash flow generation.
True to its entrepreneurial and responsible vision, Keringwill continue to promote long-term value-creation,combining boldness and imagination, creativity andmeasured risk-taking, adaptability and agility.
Leveraging these values and its many other strengths tounlock the value and profitability potential of each of itsbrands, Kering faces a market in which:
• growth is normalising in the global Luxury segment;
• consumer habits and locations (tourism, Internet) aremore changeable and less predictable than previously;
• all players had significantly increased their investmentsand operating costs until recently, in a drive to developdirectly operated distribution networks.
Structured and organised to bring more expertise, valueand operational support to its brands, Kering’s priorities willbe to increase return on capital employed, by improvingprofit margins and optimising capital allocation forinvestments and working capital.
Concrete action plans have already been implemented atbrand level.
Gucci undertook a major transformation programme inearly 2015 to overhaul its creative drive, organisation andcollections. The results of its initiative in 2016 are proof ofthe ability of the soon-to-be 100-year-old brand to reinventitself and rapidly return to the forefront of the Luxuryindustry. PUMA, under the direction of a new managementteam since 2013, continues to deploy its strategic plan,aimed at renewing and streamlining its product line-upand refocusing its positioning around Sport Performance.For the past two years, the results of these initiatives havebeen apparent in PUMA’s robust top-line growth, nowcombined with profitability gains.
Across all Group brands, a range of cross-business initiativeshas been drawn up and dedicated teams to optimisecomparable-store sales performance. The emphasis is onstrengthening store productivity through a series ofupstream and downstream initiatives, including: improvingsupply chain capacity and the efficiency of productallocation criteria by region and type; redefining ranges
In an economic environment both uncertain and fragile,Kering is confident in its outlook
its E P&L methodology. Through the app, known as MyEP&L,Kering provides concrete examples of the environmentalimpact of product design. MyEP&L has already beenunveiled to students at several fashion schools.
Through the Kering Foundation, launched in 2009 byFrançois-Henri Pinault, Kering is also firmly committed tocombatting violence against women. To enhance itsimpact across the globe, the Kering Foundation is activein three core regions, each of which provides a specificfocus for its action: combating sexual violence in theAmericas, harmful traditional practices in WesternEurope, and domestic violence in Asia.
The Foundation supports local and international NGOs,awards grants to social entrepreneurs and seeks to raiseawareness of various issues with the help of itsemployees. Its initiatives include the “White Ribbon forWomen” campaign launched in 2012 on 25 November,the International Day for the Elimination of Violence
Against Women. The 2016 campaign run in partnershipwith Condé Nast International attracted unprecedentedinterest and reached a potential global audience of over1.1 billion people. Between 18 and 27 November 2016,50,000 badges and 180,000 stickers designed by StellaMcCartney, a member of the Kering Foundation’s Board ofDirectors, were given away in more than 800 stores in 51 countries. At the same time, the Kering Foundationalso ran a digital campaign with the hashtag #BeHerVoiceand involving several well-known male figures in order toencourage everyone to play a part in ending violenceagainst women.
In recognition of the Group’s continued sustainabilityefforts, Kering is referenced as a leader by several bodiesincluding the prestigious Dow Jones Sustainability Index,on which Kering has been listed for the past three years,and the Global 100 ranking of the world’s mostsustainable corporations.
1GROUP STRATEGY ~ KERING IN 2016
132016 Reference Document ~ Kering
1_VA_V4 04/04/2017 13:21 Page13

and their depth and breadth; training sales staff in bestpractices for customer service, loyalty and experience;and developing CRM and clienteling tools, etc. Theseinitiatives will generate cost reductions, improveprofitability and optimise capital employed. Complementingthis effort, and depending on the brand, directly operatedstore networks will be reviewed and consolidated asnecessary, as part of a broader alignment of the allocationof investments to strict return guidelines. These initiativeswill also be rounded out by the realisation of additionalrevenue and cost synergies, especially in terms of sourcing,production and logistics. Lastly, Kering continues to
promote its brands’ digital strategies by coordinating e-commerce projects, encouraging knowledge sharingand driving new ambitious developments with the aim ofincreasing the share of Internet sales in the brands’revenue and leveraging e-commerce to drive growth.
In economic environment that remains fragile, shaped bythe disruptive impact of geopolitical tensions, the Groupis looking ahead with confidence and determination.Kering remains fully committed to environmental andsocial sustainability and diversity, which are crucial to itsgoals and to its long-term performance.
1 KERING IN 2016 ~ GROUP STRATEGY
14 Kering ~ 2016 Reference Document
1_VA_V4 04/04/2017 13:21 Page14

4. Kering Group simplifiedOrganisational Chart as of December 31, 2016
1KERING GROUP SIMPLIFIED ORGANISATIONAL CHART AS OF DECEMBER 31, 2016 ~ KERING IN 2016
152016 Reference Document ~ Kering
Gucci100%
Kering Americas Kering Asia Pacific
Bottega Veneta100%
PUMA 86%
Volcom 100%
Yves Saint Laurent100%
Alexander McQueen100%
Balenciaga100%
Boucheron100%
Brioni100%
51% (2) Christopher Kane
Pomellato
Qeelin
81%
78% (2)
100%
(1) Corporate is defined page 241.(2) Excluding put options.(3) The Sowind group owns the Girard-Perregaux and JEANRICHARD brands.
Ulysse Nardin
50%
100%
Sowind (3)
Stella McCartney
Kering Corporate (1)
Kering
Luxury activities Sport & Lifestyle activities
1_VA_V4 04/04/2017 13:21 Page15

16 Kering ~ 2016 Reference Document
1_VA_V4 04/04/2017 13:21 Page16
172016 Reference Document ~ Kering
CHAPter 2
our activities
1. Worldwide personal Luxury Goods market overview 18
2. Luxury activities 24Gucci 26Bottega Veneta 29Saint Laurent 32Other brands 35
3. Worldwide Sport & Lifestyle market overview 46
4. Sport & Lifestyle activities 50PUMA 52Other brands 56
2_VA_V4 04/04/2017 13:21 Page17

Market overview: size, trends and main growth drivers
The global personal Luxury Goods market has enjoyedsignificant growth over the past few years (double-digitreported growth in 2010, 2011 and 2012). Since 2013,the market has gradually decelerated to enter into 2015 amore “normalised” growth phase. In 2016, it generatedrevenue of €249 billion, down 1% as reported and flat atcomparable exchange rates.
Worldwide personal Luxury Goods market trend(2009-2016e, in € billions)
2016 has been characterised by:
• less currency volatility compared to 2015, with yet someselective movements affecting local and touristconsumption patterns (British pound’s depreciationdriving growth in the United Kingdom, Chinese yuan’sslow but steady slide and Japanese yen’s appreciation)
and some currencies staying at an absolute low levelafter the depreciation experienced in 2015 (Russianrouble and Brazilian real);
• geopolitical tensions, political events and uncertaintiesaffecting consumer confidence, tourism flows andconsumption trends (terrorism in Europe, US electionyear, Brexit);
• trend of repatriation of consumer spending in their homecountry / region, with a meaningful impact in Mainland Chinaafter 3 years of stagnation, even though the recovery ofspending in Mainland China did not fully offset the declineof Chinese consumption overseas, resulting in a declineof Chinese spending globally (Chinese consumersaccounted for 30% of total market, -1pt vs 2015).
2016e Luxury market by nationality
This section contains information derived from studies conducted by organisations, such as Altagamma andBain & Company. Unless otherwise indicated, all historical and forecast information, including trends, sales, market shares,sizes and growth, comes from the Bain Luxury Study – Altagamma Worldwide Market Monitor, published in October 2016,completed by data from the full report published in December 2016. Luxury Goods industry segments and productcategories correspond to the definitions used in the Bain Luxury Study – Altagamma Worldwide Market Monitor.
In this document the global personal Luxury Goods market includes the “soft luxury” segment (Leather Goods, Appareland Accessories), the “hard luxury” segment (watches and jewelry) and the “perfumes and cosmetics” segment.
Worldwide personalLuxury Goods marketoverview
2 OUR ACTIVITIES ~ WORLDWIDE PERSONAL LUXURY GOODS MARKET OVERVIEW
Annual change at reported or comparable exchange rates
15
253
14
224
13
218
12
212
11
192
10
173
09
153
16e
249
+13% +11% +10% +3% +3% +13% -1%
+8% +13% +5% +7% +3% +1-2% 0%
reported
comparable
18 Kering ~ 2016 Reference Document
/pts: Market share change (2016e vs 2015) .
Chinese30% / -1pt
Other Asiancountries 10% / 0pt
Japanese11% / +1pt
American23% / -1pt
Other7% / 0pt
European19% / +1pt
2_VA_V4 04/04/2017 13:21 Page18

In addition to these cyclical factors, the market is currentlyfacing some more structural changes, among which:
• the Chinese consumption, that drove market growthover the last years, will likely not feed future growth tothe same extent;
• true core luxury consumers are enlarging their spendingfrom personal Luxury Goods to experiences (hotels, cruises,restaurants, etc.); while some new luxury consumersare entering the market rather by the “accessible”segment, looking for entry price items and brands;
• luxury consumption and patterns are getting more valuesensitive, digital-oriented and eager in more innovationand newness;
• most of the key players & biggest brands have completedtheir international store footprint expansion.
In this new environment, luxury groups and brands needto adapt their strategy to current and future markettrends that will shape the industry in the years to come:
• Chinese consumers will still drive growth, with theincrease mostly coming from the boost of the risingmiddle class;
• recovery of mature market consumer spending can beexpected thanks to tailored and customer-orientedstrategies implemented by luxury brands;
• rebalancing of local / tourists spending throughmanagement of international pricing strategy and thereduction of price differentials across regions;
• management of the generational shift of consumers.
Some structural factors will clearly be still supportingdemand and growth on the personal Luxury Goods market,including:
• positive demographic trends, especially in emergingmarkets;
• the emerging middle-class in these countries, wherethe average disposable income and purchasing powerof consumers has continued to grow;
• the rising number of super-rich consumers and High-net-worth individuals (HNWI);
• increasing international mobility generating highertravel flows and spending.
Nevertheless, the Luxury Goods market is exposed tosome short-term disruptions that could include:
• macroeconomic uncertainties and currency volatility;
• geopolitical tensions, security threats, epidemic / disease outbreak;
• any other factor impacting tourism flows (such as visapolicies, travel regulations, etc.) or luxury consumption(restrictions, tax and import duties, etc.);
• exogenous events such as political turmoil, unfavourableweather conditions, etc.
COMPEtitiVE ENVIRONMENT
The global personal Luxury Goods market is fragmentedand is characterised by the presence of a few large globalplayers, often part of so-called “multi-brand groups”, anda large number of smaller independent players. Theseplayers compete in different segments in terms of bothproduct category and geographic location. Keringoperates within the global personal Luxury Goods marketalongside some of the most global groups, prominentamong which are LVMH, Hermès, Prada, Burberry, Chaneland Richemont. A number of brands with more accessibleprices could also compete with established Luxury brands.
2WORLDWIDE PERSONAL LUXURY GOODS MARKET OVERVIEW ~ OUR ACTIVITIES
192016 Reference Document ~ Kering
2_VA_V4 04/04/2017 13:21 Page19

In 2016, the Americas region was the co-largest marketalongside Europe, with the United States accounting forthe vast majority of revenue (c. 89%). The region wasdown -2% at comparable exchange rates. As in 2015, themomentum in the US was mainly held back by the strongdollar, which had a negative effect on tourism flows,triggering a significant drop in tourist spending, insufficientlycounterbalanced by local consumption. In the othercountries (Canada, Mexico, Brazil), the trends were clearlymore positive with some repatriation of local spending.
Europe represented 33% of the total worldwide market,with revenue up +1% vs. 2015 at comparable exchange rates.In 2016, the region registered a modest performance with adecline of tourist consumption due to terrorist attacks andmore constraining visa rules for Chinese visitors. Inside theEurozone, France was hit the most while Italy and Spainperformed well. Outside the Eurozone, the United Kingdombenefited from the depreciation of the pound sterlingpost Brexit, prompting a surge of tourist spending.
Japan represented 9% of the global personal LuxuryGoods market in 2016. Japan is the second largest singlecountry in terms of personal Luxury Goods consumptionafter the United States, and posted a mixed performance,up 10% reported but down -1% at comparable exchangerates. Japan has become a key destination for Chinesetourists, but in 2016 the strong yen impacted tourismspending while local consumption was uneven.
China was up 4% at comparable exchange rates, andrepresented 7% of the global personal Luxury Goodsmarket. Mainland China is recovering after 3 years ofstagnation, with a clear trend of repatriation of spendinglocally driven by a decrease in price differentials,government measures, tourist spending hindered by theweakening of Chinese yuan throughout 2016 and touristflows decreasing in Europe as an aftermath of terroristattacks. Spending by locals in their domestic market nowrepresents 22% of total spending by Chinese nationals, up2pts compared to last year. Hong Kong and Macau remainedunder pressure, down 16% at comparable exchange rates,suffering from decreasing popularity among Chinese tourists,but the rate of decline has eased vs. 2015. South Koreahas been more dynamic thanks to Chinese tourist flowsrebounding after the MERS outbreak in 2015.
The rest of the world – including the Middle East, Africanmarkets and Australia- represented 5% of the personalLuxury Goods market, with €13 billion in revenue in 2016.In the Middle East, the most oil-dependent economiesregistered the worst performance after the fall in oilprices, while the United Arab Emirates outperformed.Australia was up 8% at comparable exchange rates,maintaining a positive trend thanks to Chinese touristspending.
REGIONAL OVERVIEW
Worldwide personal Luxury Goods market: breakdown by region (2016e)
Size Reported YoY change at comparable % of total(in € billions) YoY change exchange rates market
Europe 82 -1% +1% 33%Americas 82 -3% -2% 33%Japan 22 +10% -1% 9%China 18 -2% +4% 7%Rest of Asia 32 -3% 0% 13%Rest of the world 13 -1% 0% 5%
Total 249 -1% 0% 100%
The ten largest countries in terms of global personal Luxury Goods in 2016 are as follows (revenues by geography andnot by nationality):
Size Reported YoY change at 2016 Rank Country (in € billions) YoY change comparable exchange rates
1 United States 73 -3% -3%2 Japan 22 +10% -1%3 Italy 18 +4% +4%4 Mainland China 17 -2% +4%5 United Kingdom 15 0% +11%6 France 15 -8% -8%7 South Korea 11 +9% +13%8 Germany 11 -2% -2%9 Hong Kong 7 -17% -16%10 Switzerland 5 -3% -1%
2 OUR ACTIVITIES ~ WORLDWIDE PERSONAL LUXURY GOODS MARKET OVERVIEW
20 Kering ~ 2016 Reference Document
2_VA_V4 04/04/2017 13:21 Page20

Accessories
This category includes shoes, leather goods (includinghandbags and wallets, and other leather products),eyewear and textile accessories.
In 2016, this category represented 30% of the totalpersonal Luxury Goods market with total sales of €75billion.
The two main sub-categories were:
a) Leather goods, with estimated revenue of €44 billionin 2016. This sub-category grew at a rate of 2%between 2015 and 2016 (on a reported basis), drivenby the outperformance of entry-price offering andvolumes growth. Kering operates in leather goodsmainly through the Gucci and Bottega Veneta brands,as well as the Saint Laurent, Balenciaga, AlexanderMcQueen and Stella McCartney brands;
b) Shoes, with estimated 2016 revenue of €16 billion,with 2% growth year-on-year as reported. Growth is inline with leather goods, the current trend of themarket is the “ sneaker ” phenomenon and the gooddynamic in women’s category. Kering operates in thisproduct category with most of the larger brands,including Gucci, Bottega Veneta, Saint Laurent,Balenciaga, Alexander McQueen and Stella McCartneywhich offer shoes as part of their product assortment.
Eyewear
The eyewear category represented 4% of the totalpersonal Luxury Goods market in 2016 and was worth anestimated €11 billion, up 1% in reported terms. Almost allgroup brands propose some eyewear in their productassortment, under a license model. At the end of 2014,Kering decided to internalise this category, setting upKering Eyewear, which is in charge of designing, developingand distributing the brands’ eyewear collections.
Apparel
This category includes ready-to-wear for both womenand men, and is equally spread between the two. Itrepresented 23% of the total personal Luxury Goodsmarket in 2016, totalling an estimated €58 billion, aslight decline vs. 2015 (-4%). Men’s ready-to-wear wasdriven by fashion daywear and casualwear (i.e., outerwear,denim and cashmere) while formalwear growthdecelerated. In women’s ready-to-wear, brands haveresponded to the athleisure trend with more active-wearalternatives as well as resurgence of sport lines.
All Kering “soft luxury” brands operate in this productcategory, especially Gucci, Saint Laurent, Balenciaga,Stella McCartney, Alexander McQueen, and ChristopherKane, in addition to Brioni for menswear.
PRODUCT CATEGORIES
The global personal Luxury Goods market is analysed in five main product categories as shown below:
Worldwide personal Luxury Goods market: breakdown by category (2016e)
Market value 2016e Reported % of total(in € billions) YoY change market
Accessories 75 +1% 30%Apparel 58 -4% 23%Hard luxury 54 -5% 22%Perfume and cosmetics 52 +4% 21%Other 10 -2% 4%
Total 249 -1% 100%
2WORLDWIDE PERSONAL LUXURY GOODS MARKET OVERVIEW ~ OUR ACTIVITIES
212016 Reference Document ~ Kering
2_VA_V4 04/04/2017 13:21 Page21

Hard luxury
The hard luxury category generated revenue of €54 billionin 2016, representing 22% of the total personal LuxuryGoods market, and decreased by 5% between 2015 and2016 as reported. This category mainly includes watches,weighting €36 billion in 2016 and jewelry, weighting €16billion in 2016. In 2016, there was a significant polarizedperformance across the two main sub-categories withwatches down 8% and jewelry up 2% year-on-year asreported. High-end watches were hit by a negative Asianperformance, especially in Hong Kong, while jewelry wasdriven by mid-prices and the entry offer, with high jewelryslowing down, resulting in a dispersed performance.
Kering operates in this category across different pricepoints with Gucci Timepieces, Girard-Perregaux, andUlysse Nardin for watches, and Boucheron, Pomellato,Dodo and Qeelin for jewelry.
Perfume and cosmetics
The perfume and cosmetics category represented 21% ofthe total personal Luxury Goods market in 2016 and wasworth an estimated €52 billion.
Kering operates in this product category through royaltylicencing agreements between its main brands and leadingindustry players such as L’Oréal, Coty and Interparfums todevelop and sell fragrances and cosmetics.
DIStrIBUtiON CHANNELS
Worldwide personal Luxury Goods market: breakdown by distribution channel (2014-2016e)
Retail channel
A strong directly operated store network is important forthe success of a luxury brand as it allows greater controlover the consumer shopping experience and over theproduct assortment, merchandising and customerservice. In 2016 the retail channel accounted for salesamounting to 35% of the total global personal LuxuryGoods market.
In the case of Kering Luxury brands, the share of retail salesis far higher (72%), reflecting both the maturity of someof the brands and the Group’s strategic commitment togrow its directly operated network. This also reflects theKering brands’ product mix, as the higher share of leathergoods and accessories typically translates into a moreprominent share of retail sales in the channel mix.
2 OUR ACTIVITIES ~ WORLDWIDE PERSONAL LUXURY GOODS MARKET OVERVIEW
22 Kering ~ 2016 Reference Document
RetailWholesale
2014 32%68%
2015 34%66%
2016e 35%65%
€224 bn
€253 bn
€253 bn
2_VA_V4 04/04/2017 13:21 Page22

Wholesale channel
The wholesale channel typically includes departmentstores, independent high-end multi-brand stores andfranchise stores, and accounted for approximately 65% ofthe total global personal Luxury Goods market in 2016.The wholesale channel can thus be multi-brand ormono-brand. The share of wholesale sales is typicallyhigher in ready-to-wear and hard luxury, and is also moreimportant than retail in the channel mix for brands thatstand at an earlier stage of maturity.
These two distribution channels can also be split into sixsales formats. Some of these formats could be operatedthrough retail or wholesale.
E-commerceOnline sales of Luxury Goods reached a new record of around€19 billion in 2016 (up 12% at comparable exchangerates), representing about 8% of total global personalLuxury Goods sales. This includes sales done throughbrand websites, e-tailers and retailers.com. Online is thefastest growing channel globally, thanks to the growingshare of mobile, driving over half of e-commerce sales oftop performing brands and off-price segment (e-tailersand retailers.com).
Kering brands are present online and propose e-commerce,either operated internally, as is the case for Gucci, orthrough a joint venture.
Kering brands are also distributed online by selectedpartners.
MARKET OUTLOOK
For 2017, Bain and Altagamma forecast overall growth of1% to 2% excluding currency effects for the personalLuxury Goods markets.
Key trends for 2017 include:
• recovering consumption in the US, leaving behind theuncertainty of the election year;
• the rebound of Chinese global spending, with localsales in Mainland China expected to capture lost salesin international markets;
• consistent positive trajectory of Europe driven by localconsumption and a weak euro expected to bring backtourists.
By 2020, the market is expected to reach €280-285 billion,at a compound annual growth rate (CAGR) of 3-4% from2017, driven by:
• emerging countries: in addition to South East Asiancountries (Indonesia, Thailand, etc.), Brazil, Australia,Africa and India are expected to be increasingly key tothe growth of the global personal Luxury Goods market;
• emerging consumers: a booming upper-middle classespecially benefiting the “ accessible ” luxury segment,particularly in China. In fact, according to McKinsey, by2022, the Chinese upper-middle class should accountfor 54% of urban households and 56% of urban privateconsumption (up from 14% and 20% in 2012 respectively);
• the development of distribution channels such as outlets,travel retail or e-commerce. The latter is expected togrow at an annual average rate of 15% over the 2016-2020 period;
• an increase in high-spending consumer classes such ashigh-net-worth individuals (HNWIs);
• the development of new high-end products and services;
• the potential of the American market due to the under-penetration of European luxury brands in the region.
2WORLDWIDE PERSONAL LUXURY GOODS MARKET OVERVIEW ~ OUR ACTIVITIES
232016 Reference Document ~ Kering
/ pts: Market share change (2016e vs 2015).
Mono-brand stores29% / 0pt
Online8% / +1pt
Outlets12% / +1pt
Airportstores6% / 0pt
Department stores23% / -2pts
Specialtystores22% / -1pt
2_VA_V4 04/04/2017 13:21 Page23

Luxury activities
2 OUR ACTIVITIES ~ LUXURY ACTIVITIES
24 Kering ~ 2016 Reference Document
2016 key figures
€8,469millionin revenue
Revenue (in € millions)
Leather goods 52%
Ready-to-wear 16%
Shoes 14%
Watches 4%
Other 9%
Jewelry 5%
Gucci 52%
Saint Laurent 14%
Bottega Veneta 14%
Other brands 20%
33%
30%
19%
11%
7%Western EuropeAsia PacificNorth AmericaJapanOther countries
2015 7,865
2016 8,469
Breakdown by region
Breakdown by brand Breakdown by product category
2_VA_V4 04/04/2017 13:21 Page24

2LUXURY ACTIVITIES ~ OUR ACTIVITIES
€1,936 millionin recurring operating income
252016 Reference Document ~ Kering
Saint Laurent 14%
Bottega Veneta 15%
Other brands 6%
Gucci 65%
Total 2015: 1,264Total 2016: 1,305
WesternEurope
NorthAmerica
Japan
Emergingcountries
326338
210213
237248
491506
2015 1,708
2016 1,936
Breakdown by brand
21,559average number of employees (full time equivalent)
1,305directly operated stores
Recurring operating income(in € millions)
2_VA_V4 04/04/2017 13:21 Page25

2016 key figures
€4,378 millionin revenue
€1,256 millionin recurring operating income
10,253average number of employees (full time equivalent)
520directly operated stores
Breakdown of 2016 revenueby product category
Breakdown of 2016 revenue by region
Business concept
Founded in Florence in 1921, Gucci is one of the world’sleading luxury fashion brands.
From its origins in the 1920s through to the late 1970s,the brand stayed loyal to its values of superior Italiancraftsmanship and innovation, and as a result Gucci soonbecame the expression of Italian-made luxury.
Throughout the 1950s, 1960s and 1970s, Gucci’sreputation began to grow around the world thanks inlarge part to the «jet set», socialites and celebrities,particularly from Hollywood, who wore the brandinternationally. It was in the 1990s, under the creativedirection of Tom Ford, that Gucci became synonymouswith fashion and acquired the reputation of being a truefashion authority and leader.
Early in the new Millennium, against the backdrop of theworld economic crisis, consumers once again began to turnto traditional luxury values. It was at this time that Gucciintroduced its «Forever Now» philosophy, emphasisingboth its fashion authority and its Florentine heritage andcraftsmanship.
At the beginning of 2015, Gucci embarked on the next chapterin its history, under the direction of a new managementteam led by President and CEO Marco Bizzarri and CreativeDirector Alessandro Michele. Their new contemporaryvision for the brand quickly re-established its reputationas one of the world’s most influential luxury fashion brands.Eclectic, romantic, and above all contemporary, Gucci iscurrently inventing a wholly modern approach to fashionand thereby redefining luxury for the 21st century.
Gucci products continue to represent the pinnacle of Italiancraftsmanship and are unsurpassed in terms of their qualityand attention to detail. They are sold exclusively througha network of 520 directly operated boutiques, a directlyoperated online store (in 28 markets), a limited numberof franchises and selected department and specialty stores.
At the end of the year, Gucci retail sales representedapproximately 83% of the brand’s total revenue (up fromapproximately 70% in 2009).
2 OUR ACTIVITIES ~ LUXURY ACTIVITIES ~ GUCCI
26 Kering ~ 2016 Reference Document
Leather goods 55%
Ready-to-wear 13%
Shoes 17%
Jewelry 2%
Watches 4%
Other 9%
Western Europe 28%Other countries 7%
Japan 10%
North America 21%
AsiaPacific 34%
2_VA_V4 04/04/2017 13:21 Page26

COMPEtitiVE ENVIRONMENT
Gucci is one of the few luxury brands with truly worldwideoperations, alongside Hermès, Dior, Chanel, Louis Vuittonand Prada. Gucci confirms its leadership position as oneof the world’s leading luxury fashion brands both in termsof revenue and profitability.
StrATEGY
Gucci has once again established its position as a pivotalItalian luxury fashion brand leading the industry bysetting the tone with innovative runway collections andground-breaking creativity. The strategic vision conceivedby CEO Marco Bizzarri identified a new image for Gucci,more in line with today’s world and more relevant andappealing for new, younger luxury consumers. This vision isunderpinned by clear business goals designed to ensureabove average growth in revenues and improved profits ina market that is more competitive than it has ever been.
In terms of products, the offer has been fully transitionedin all main categories to the new brand aesthetic byreinterpreting the key iconic signs of the brand andcombining them with new distinctive signs of the newcreative direction.
The Dionysus bag, which combines the iconic GG logo withfloral (blooms) or animal details (bee) and a buckle comingfrom the archives, and the Princetown shoe, a reinterpretationof the Gucci loafer, are among the most successfulproduct launches both in terms of sales and image.
The product offering has been repositioned by graduallysubstituting all the units not consistent with the newcreative vision, reducing the number of product models andvariations in each store, while balancing the price clustersby rationalising entry prices and exploiting opportunitiesin the high price range.
In terms of distribution, the company has focused onoptimising its existing network, driving organic growthand profitability. This is being achieved by aligning thestore network with the new brand aesthetic, through theimplementation of a comprehensive retail excellenceprogramme aimed at improving customer experienceand by increasing sales density across the network.Online sales continue to grow exponentially as the newGucci.com has been progressively rolled out around theworld, with its unique approach to combining e-commercewith brand narrative.
2016 highlights and outlook for 2017
Following a year of reinvention for Gucci in 2015, the increasedinterest in the brand and the conversation around it beganto translate into growing market share in 2016, fuelled byboth a re-engaged existing customer base and a newly-engaged clientele, especially among Millennials. Theprogressive roll out of Creative Director Alessandro Michele’snew store concept, together with the introduction of newvisual tools in certain stores as an alternative to fullrenovation, continued on a worldwide basis, helping tocreate further visibility for the new brand positioning andcollections, thereby driving traffic and revenues in store.
The resulting impressive acceleration of full-price salesregistered since March 2016 across all product categoriesand distribution channels is now demonstrating theimpact of the new vision. Alessandro Michele’s collectionsin the last quarter of 2016 represented over 85% of Guccifourth quarter 2016 total revenue compared to slightlyover 30% in the last quarter of 2015.
In terms of products, the leather goods and shoes offerhas been strategically structured by establishing newiconic pillars while introducing new seasonal products toensure a well balanced mix between carry over andnewness. The strong performance of handbags is in factmostly driven by the new iconic pillars – Dionysus (GGSupreme logo), Gucci Signature (leather GG logo), Marmont(Soft leather bags) and Sylvie (structured leather bags) –which are «animated» each season with the introductionof new functions and new colours.
The ready-to-wear collections have been developed tofurther establish and sustain Gucci’s new positioning as«fashion influencer» while ensuring consistency andcontinuity season after season to sustain the businessand retain and gain clientele.
The omni-channel structure, implemented in early 2015,is helping to promote synergies across the differentdistribution channels, enhancing a customer centricapproach and the pivotal role of the digital strategy. As afurther testament to its digital leadership, Gucci has beenrecognised as the first brand in the Fashion Digital IQIndex, thanks to its revamped website, superior customerservice, unrivaled visibility on category search terms, andbest-in-class visibility on retailer sites and social platforms.
2GUCCI ~ LUXURY ACTIVITIES ~ OUR ACTIVITIES
272016 Reference Document ~ Kering
2_VA_V4 04/04/2017 13:21 Page27

Number of directly operatedstores by region
Revenue and recurringoperating income
Maintaining the brand’s digital leadership throughinnovation remains one of the pillars of the brand’sambition. Prioritizing incremental investment in digitalactivities, exploiting newsworthy collaborations togenerate native content stories, and continuous socialmedia innovation are the key drivers to keep and furtherreinforce this leadership position.
The highly original vision of Creative Director AlessandroMichele, which combines a unique understanding andappreciation of the historical codes of the brand, with auniquely contemporary sensibility, received a series ofaccolades throughout the year, including the 2016International Award from the Council of Fashion Designersof America, the British GQ 2016 Designer of the Year Awardand the British Fashion Council’s 2016 InternationalAccessories Designer of the Year Award for the secondyear in a row. Marco Bizzarri’s achievements were alsorecognised by the British Fashion Council with the 2016International Business Leader Award.
In 2017, Gucci will build on 2016 successful resultscompleting the product transition for all categories andseeking to capture all growth opportunities across productcategories and channels of distribution. Increased salesdensity and the progressive roll-out of Gucci.com acrossregions will be among the key drivers of sustainablegrowth for next year and the years to come.
Despite the low rate of growth expected for the industry,the brand’s ambition is to grow at more than twice therate of the sector, setting an ambition to reach 6 billioneuro revenues in the long term.
2 OUR ACTIVITIES ~ LUXURY ACTIVITIES ~ GUCCI
28 Kering ~ 2016 Reference Document
Revenue (in € millions)Recurring operating income (in € millions)
2015
2016
3,8981,032
4,3781,256
Total 2015: 525Total 2016: 520
WesternEurope
NorthAmerica
Japan
Emergingcountries
119113
122120
6671
218216
2_VA_V4 04/04/2017 13:21 Page28

2016 key figures
€1,173 millionin revenue
€297 millionin recurring operating income
3,417average number of employees (full time equivalent)
255directly operated stores
Breakdown of 2016 revenueby product category
Breakdown of 2016 revenue by region
Business concept
Founded in 1966 in the Veneto Region of Italy, BottegaVeneta began as a leather goods House and was madefamous through its signature intrecciato, a distinctive,crosshatched design developed by Bottega Veneta’sartisans with luxury and understated elegance in mind.Intrecciato is eminently adaptable, reinterpreted eachseason in different colours and materials. The brand ledthe way in introducing soft, deconstructed handbags – asopposed to the usual rigid structure that originated withthe French school – and quickly became well recognisedand appreciated in the market. Bottega Veneta hasevolved over the years from a leather goods House intoan absolute luxury Lifestyle brand by expanding itsproduct range, while respecting both the desires of thecustomer and the aesthetic sensibility of the brand. Thebrand’s famous motto, «When your own initials areenough», is now applied to a range of products forwomen and men, including leather goods (bags, smallleather goods and a full luggage collection), ready-to-wear, shoes, jewelry, furniture and more.
Over the years, the brand has also engaged in collaborationswith partners who have brought their know-how andcommitment to quality and craftsmanship to some of itsproduct categories, namely Kering Eyewear for framesand sunglasses and as part of both license agreements(Coty Prestige for fragrances) and supply partnerships(Poltrona Frau for seating, KPM for porcelain).
Bottega Veneta’s products are sold through a distributionnetwork of directly operated stores, complemented byexclusive franchise stores and strictly-selected departmentand specialty stores worldwide. In addition, BottegaVeneta’s products are now available through the brand’sonline store in 50 countries.
2BOTTEGA VENETA ~ LUXURY ACTIVITIES ~ OUR ACTIVITIES
292016 Reference Document ~ Kering
Leather goods 86%
Ready-to-wear 4%Shoes 7%
Other 3%
Western Europe 27%
Other countries 6%
Japan 15%
North America 12%AsiaPacific 40%
2_VA_V4 04/04/2017 13:21 Page29

COMPEtitiVE ENVIRONMENT
Bottega Veneta is one of the only Italian brands to offer trulyhandcrafted products made with the expert know-how ofits master Italian artisans. It is a rare example of an absoluteluxury lifestyle brand that never compromises on the qualityof its products while always providing an unsurpassedlevel of service to customers. This places the brand at thetop of the luxury pyramid in terms of positioning, incompetition with a limited number of brands.
StrATEGY
On October 4, 2016, Claus-Dietrich Lahrs was appointedBottega Veneta Chief Executive Officer. Under hisleadership and the creative direction of Tomas Maier,Bottega Veneta’s strategy aims to reinforce its position asa high-end and exclusive luxury lifestyle brand, for whichconsistency and continuity are the key elements tomaintaining differentiation in the industry. Business andcreativity will continue to work together as an essential partof Bottega Veneta’s success, as they always did in the past.
Historically, the brand’s core business was leather goods(86% of sales), characterised by attention to detail andthe use of the highest quality materials. A wider range ofproducts appealing to an international clientele of menand women was gradually integrated, with the emphasison contemporary functionality and timeless yetinnovative design.
The brand’s predominant trait of exclusivity has beentransferred to the distribution network. Through itsworldwide expansion, Bottega Veneta has consolidatedits presence in emerging markets, without compromisingits investments in mature markets, particularly the UnitedStates, but also Europe, where Bottega Veneta’s story andcraftsmanship began.
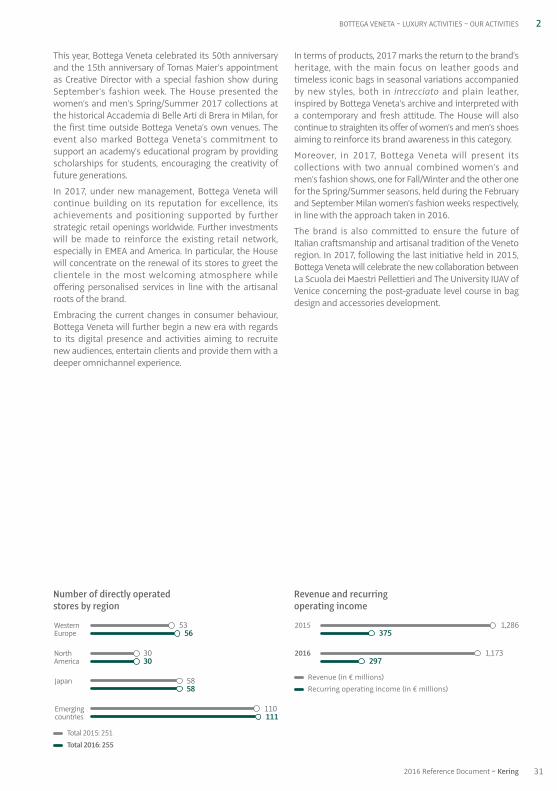
2016 highlights and outlook for 2017
2016 was a challenging year for Bottega Veneta, with ageneral macro and political environment that specificallyimpacted the performance of the brand across keymarkets.
In this context, leather goods, key category for the brand,has been revived thanks to a renewed offer in terms ofshapes and functions of full intrecciato products, as wellas an accurate search and development of new seasonalitems that further enrich the intrecciato offer withseasonal variations and craftsmanship, also within theprecious skin segment.
Shoes, for both men’s and women’s, performed particularlywell during the year while the brand is strongly investingto broaden the range of this product category and to rollout new display tools and dedicated shoe areas inselected stores.
Throughout 2016, Bottega Veneta focused on consolidatingits existing retail network, continuing its efforts toenhance its boutiques through both refurbishments andexpansions to ensure the best possible experience. It alsopursued selective store openings, bringing its totalnetwork up to 255 at the end of the year. The new storesopenings were quite evenly balanced between emergingand mature markets.
During the year, Bottega Veneta opened its second Maisonin Beverly Hills designed by Creative Director Tomas Maierto center upon the idea of lightness, spaciousness andintimacy in perfect balance, with the aim to reflect theHouse’s universe in a location that both honours andrepresents the beauty and discretion of the localarchitecture. Bottega Veneta also inaugurated its newlyexpanded boutique at Plaza 66 in Shanghai, becomingthe city’s new flagship and introducing an evolution of itsstore concept. Finally in October, the first Bottega Venetastore in the Netherlands opened in Amsterdam.
In terms of events, in April, during the Salone del Mobile2016 in Milan, Bottega Veneta presented its new HomeCollection pieces against the quietly elegant backdrop ofits Home boutique in via Borgospesso in Milan. During thesame month, the House also launched Parco Palladiano,the collection of six fragrances for women and meninspired by the Palladian gardens of the Veneto region.
2 OUR ACTIVITIES ~ LUXURY ACTIVITIES ~ BOTTEGA VENETA
30 Kering ~ 2016 Reference Document
2_VA_V4 04/04/2017 13:21 Page30
Number of directly operatedstores by region
Revenue and recurringoperating income
This year, Bottega Veneta celebrated its 50th anniversaryand the 15th anniversary of Tomas Maier’s appointmentas Creative Director with a special fashion show duringSeptember’s fashion week. The House presented thewomen’s and men’s Spring / Summer 2017 collections atthe historical Accademia di Belle Arti di Brera in Milan, forthe first time outside Bottega Veneta’s own venues. Theevent also marked Bottega Veneta’s commitment tosupport an academy’s educational program by providingscholarships for students, encouraging the creativity offuture generations.
In 2017, under new management, Bottega Veneta willcontinue building on its reputation for excellence, itsachievements and positioning supported by furtherstrategic retail openings worldwide. Further investmentswill be made to reinforce the existing retail network,especially in EMEA and America. In particular, the Housewill concentrate on the renewal of its stores to greet theclientele in the most welcoming atmosphere whileoffering personalised services in line with the artisanalroots of the brand.
Embracing the current changes in consumer behaviour,Bottega Veneta will further begin a new era with regardsto its digital presence and activities aiming to recruitenew audiences, entertain clients and provide them with adeeper omnichannel experience.
In terms of products, 2017 marks the return to the brand’sheritage, with the main focus on leather goods andtimeless iconic bags in seasonal variations accompaniedby new styles, both in intrecciato and plain leather,inspired by Bottega Veneta’s archive and interpreted witha contemporary and fresh attitude. The House will alsocontinue to straighten its offer of women’s and men’s shoesaiming to reinforce its brand awareness in this category.
Moreover, in 2017, Bottega Veneta will present itscollections with two annual combined women’s andmen’s fashion shows, one for Fall / Winter and the other onefor the Spring / Summer seasons, held during the Februaryand September Milan women’s fashion weeks respectively,in line with the approach taken in 2016.
The brand is also committed to ensure the future ofItalian craftsmanship and artisanal tradition of the Venetoregion. In 2017, following the last initiative held in 2015,Bottega Veneta will celebrate the new collaboration betweenLa Scuola dei Maestri Pellettieri and The University IUAV ofVenice concerning the post-graduate level course in bagdesign and accessories development.
2BOTTEGA VENETA ~ LUXURY ACTIVITIES ~ OUR ACTIVITIES
Total 2015: 251Total 2016: 255
WesternEurope
NorthAmerica
Japan
Emergingcountries
5356
3030
5858
110111
Revenue (in € millions)Recurring operating income (in € millions)
2015
2016
1,286375
1,173297
312016 Reference Document ~ Kering
2_VA_V4 04/04/2017 13:21 Page31

2016 key figures
€1,220 millionin revenue
€269 millionin recurring operating income
2,204average number of employees (full time equivalent)
159directly operated stores
Breakdown of 2016 revenueby product category
Breakdown of 2016 revenue by region
Business concept
Founded in 1961, Yves Saint Laurent is one of the mostprominent fashion houses of the 20th century. Originallyan haute couture House, Yves Saint Laurent revolutionisedmodern fashion in 1966 with the introduction of luxuryready-to-wear under the name Saint Laurent Rive Gauche.
Saint Laurent designs and markets a broad range of men’sand women’s ready-to-wear, handbags, shoes, smallleather goods, jewelry, scarves, ties and eyewear. Productionis mainly divided between Italy and France, where anhistoric workshop manufactures ready-to-wear garments.Under worldwide licence agreements, the House alsoproduces and distributes eyewear, fragrances andcosmetics.
In April 2016, the House of Yves Saint Laurent announcedthe appointment of Anthony Vaccarello as CreativeDirector. His modern, pure aesthetic, that impeccablybalances elements of provocative femininity and sharpmasculinity in his silhouettes is the perfect fit for theHouse.
As of December 31, 2016, the Saint Laurent retail networkconsists of 159 directly operated boutiques, whichtogether generated 68% of total revenue for the year andincludes flagship stores in Paris, London, New York, HongKong, Shanghai, Beijing, Tokyo, Miami and Los Angeles.The House is also present in select multi-brandboutiques and department stores around the world.
At the end of 2016, the Saint Laurent business was verywell balanced in terms of both geographic markets andproduct categories, with leather goods and shoesaccounting for 68% of business and ready-to-wearrepresenting 23% of total revenue.
2 OUR ACTIVITIES ~ LUXURY ACTIVITIES ~ SAINT LAURENT
32 Kering ~ 2016 Reference Document
Leather goods 53%
Ready-to-wear 23%
Shoes 15%
Other 9%
Western Europe 38%
Other countries 7%
Japan 9%
North America 23%AsiaPacific 23%
2_VA_V4 04/04/2017 13:21 Page32

COMPEtitiVE ENVIRONMENT
Since its inception, Yves Saint Laurent has held enormousinfluence both inside and outside the fashion industry.Over the years, its founder, the couturier Yves SaintLaurent secured a reputation as one of the 20th century’sforemost designers and personalities.
Saint Laurent now competes globally with other Frenchhigh-end exclusive luxury brands and occupies a leadingposition in ready-to-wear, fashion and leather goodssectors. Saint Laurent status as a leading fashion House isfully established and recognised, with a very distinctiveidentity and strong codes that are perfectly identified andmade relevant to our time.
StrATEGY
Saint Laurent’s primary objective is to create and markethighly desirable products, that embody the core values ofthe brand through innovation and unparalleled qualityand design.
Thanks to the implementation of a highly consistent strategyin terms of products, distribution and communication,the brand has built solid foundations for its present andfuture development. The execution of the strategy willcontinue to be focused on a well-balanced growth betweenproduct categories and distribution channels, a best-in-class retail and customer experience and a uniquedesirability of both iconic lines and newness.
2016 highlights andoutlook for 2017
Under the leadership of Francesca Bellettini, the company’sCEO, 2016 was another year of expansion for Saint Laurent.
In April 2016, Yves Saint Laurent announced theappointment of Anthony Vaccarello as Creative Director,whose mastery of tailoring techniques and influences areremarkably in line with the House style.
On September 27, 2016, during Paris Fashion Week,Anthony Vaccarello presented his first women’s ready-to-wear collection (Summer 2017) at rue de Bellechasse inthe 17th-century former abbey that will be SaintLaurent’s future headquarters. A collection characterisedby free femininity and a boyish attitude, incorporatingreferences to the House’s heritage. From this thread,Anthony Vaccarello has drawn a contemporary look, asensitive and personal collage, revising the classic form ofthe tuxedo and transposing the desirability of eightiesdresses inspired by the archives into the present.
Since his appointment, Anthony Vaccarello launched, in 2016, four new advertising campaigns for the House,clearly affirming his sharp, 360 degrees vision for Saint Laurent.
During the year, the brand’s sales were fuelled by extremelystrong growth across the main product categories. Overallgrowth was driven by the success of both permanent andnew successful introductions across all channels andcategories.
Saint Laurent also made 2016 another year of investment,enhancing its retail network with selective store openingsworldwide, in both emerging and mature markets, and key refurbishments and relocations. Throughout the year the brand opened 17 (net) directly operatedstores worldwide, including the entry into new countries,Canada and Malaysia.
2SAINT LAURENT ~ LUXURY ACTIVITIES ~ OUR ACTIVITIES
332016 Reference Document ~ Kering
2_VA_V4 04/04/2017 13:21 Page33

Number of directly operatedstores by region
Revenue and recurringoperating income
Yves Saint Laurent e-commerce business, as part of theoverall cross channel strategy, was particularly dynamicduring the year. As of December 2016 Saint Laurent ispresent on line in approximately 60 countries worldwideincluding the USA, all major countries in Europe, SouthKorea and Hong Kong.
Social media initiatives were met with extraordinarysuccess as social platforms were fully integrated intoglobal communications practices and strategies. Asof December 2016, Yves Saint Laurent had more than
2.6 million fans on Facebook and was one of the mostpopular luxury brands on Twitter with over 3.8 millionfollowers. Since June 2016, moreover, the Houseimplemented a new Instagram strategy, fastly over-reaching its first 1 million followers mark.
In line with its current strategy, in 2017 the brand will continueto expand its retail distribution network, opening storesin Europe, the Middle East, Latin America and the UnitedStates, as well as across the Asia Pacific region.
2 OUR ACTIVITIES ~ LUXURY ACTIVITIES ~ SAINT LAURENT
34 Kering ~ 2016 Reference Document
Revenue (in € millions)Recurring operating income (in € millions)
2015
2016
974169
1,220269
Total 2015: 142Total 2016: 159
WesternEurope
NorthAmerica
Japan
Emergingcountries
3537
2125
2527
6170
2_VA_V4 04/04/2017 13:21 Page34
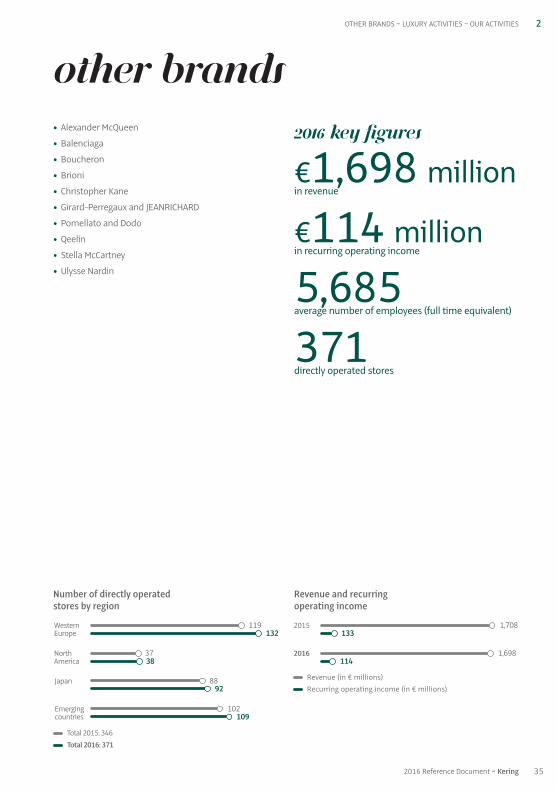
Number of directly operatedstores by region
Revenue and recurringoperating income
• Alexander McQueen
• Balenciaga
• Boucheron
• Brioni
• Christopher Kane
• Girard-Perregaux and JEANRICHARD
• Pomellato and Dodo
• Qeelin
• Stella McCartney
• Ulysse Nardin
2016 key figures
€1,698 millionin revenue
€114 millionin recurring operating income
5,685average number of employees (full time equivalent)
371directly operated stores
Other brands
2OTHER BRANDS ~ LUXURY ACTIVITIES ~ OUR ACTIVITIES
352016 Reference Document ~ Kering
Revenue (in € millions)Recurring operating income (in € millions)
2015
2016
1,708133
1,698114
Total 2015: 346Total 2016: 371
WesternEurope
NorthAmerica
Japan
Emergingcountries
119132
3738
8892
102109
2_VA_V4 04/04/2017 13:21 Page35

Founded in 1992 by Lee Alexander McQueen, theAlexander McQueen brand quickly gained a reputation forconceptual design and forged a strong brand identitywhich led to a partnership with Kering in 2001. Since2010, the brand has been fully owned by Kering.
Alexander McQueen is renowned for its unbridled creativityand the brand today has become synonymous withmodern British couture. In December 2016, the AlexanderMcQueen brand has been awarded the British brand ofthe year by the British Fashion Council for having madean impact on the international stage.
Since her appointment in 2010 as Creative Director, SarahBurton has produced critically acclaimed collections witha focus on handcraft and artisanal techniques. Her abilityto marry the design codes of the House with lightnessand her own feminine touch has brought a new andpersonal aesthetic that is being established as theblueprint for the future.
While the main product categories are women’s ready-to-wear and leather goods, the brand’s strength lies in itspresence across all categories. Silks, menswear and shoeshave enjoyed growth in recent years. 2016 saw the launchof the inaugural fragrance from Alexander McQueen. Inpartnership with Coty, McQueen Parfum and Eau de Parfum,a scent for women, were introduced with great success.
Having expanded internationally through both wholesaleand retail channels in the past few years, the AlexanderMcQueen brand has strengthened its presence andposition in the luxury sector. Its retail network is made upof 45 directly operated Alexander McQueen storesworldwide, including two net openings in 2016.
The brand has also reinforced its wholesale channel andits franchise business, with significant franchise openingsin Dubai, Jeddah and Jakarta. The Alexander McQueenbrand is sold in over 50 countries in more than 450 doors,working with key partners including Saks and NeimanMarcus in the US, Harrods and Selfridges in the UK and LaneCrawford in Asia. The brand continues to open shop-in-shops to strengthen its brand image and business.
The company has also successfully developed McQ, whichwas re-launched as an in-house brand in 2011 and hasquickly established itself in the popular contemporarymarket. The McQ brand is distributed in many countries,primarily as a wholesale business internationally with atotal of more than 500 doors. Franchises represent animportant part of the business. At the end of 2016, McQ had19 franchise stores located in Asia and in the Middle East,as well as four directly operated stores in Europe.
Alexander McQueen and McQ collections are sold onlinein most countries, with e-commerce becoming an importantvehicle for both brands to engage clients and to developbusiness.
2017 will see some new selective store openings in Asia forthe Alexander McQueen brand. During the year the companywill move to its new headquarters in the centre ofLondon’s Clerkenwell district, merging both brands underone roof and establishing a new era for the brands’ futuresuccess.
2 OUR ACTIVITIES ~ LUXURY ACTIVITIES ~ OTHER BRANDS
36 Kering ~ 2016 Reference Document
2_VA_V4 04/04/2017 13:21 Page36

Started in 1917 and founded in 1919 by Cristóbal Balenciaga,the Balenciaga brand was established in Paris in 1936,where it defined many of the greatest movements infashion from the 1930s to the 1960s. Balenciaga’sexquisite technique, masterful cut and constant fabricinnovation has helped it to carve out a special place inthe hearts and minds of its customers and followers.
In the 1990s and early 2000s, the brand experienced a re-birth, which saw an extension of its product universeto a broader range of products, focusing particularly oniconic handbag launches, together with increased focus onfashion shoes as well as accessories, without compromisingthe core ready-to-wear segment. The brand significantlyexpanded its retail network, helping to bolster brandawareness around the globe.
While the brand’s identity is firmly anchored in highlysymbolic ready-to-wear collections, its bag and shoelines have also enjoyed phenomenal worldwide success.The women’s and men’s ready-to-wear collections span awide price range, from the most emblematic items tomore universal products that open up Balenciaga’s styleto a wider public.
In fragrances, the brand has established a solid licencepartnership with Coty Prestige and has released somesuccessful perfumes: Balenciaga Paris, L’Essence andFlorabotanica. And, since the end of 2013, a similarpartnership with Marcolin has been developed in eyewear.
Demna Gvasalia was appointed Artistic Director ofBalenciaga in October 2015. His mastery of techniques,expertise and fashion knowledge, combined with hisinnovative approach, make him a powerful force intoday’s creative world. As Artistic Director, Demna Gvasaliais writing a new chapter in Balenciaga’s history andconsolidating the House’s status as a ready-to-wearauthority. Demna Gvasalia has embraced Balenciaga’score values and is developing them in harmony withtoday’s global changes.
On December 5, 2016, in London, Demna Gvasalia receivedthe prestigious award from the British Fashion Council asthe International Ready-to-Wear Designer of the year.
Over the past years Balenciaga has been consolidating itsdirectly operated store network worldwide. Today Balenciagahas a well-developed retail network of 114 stores in bothmature markets (Western Europe, US and Japan) and Asia(Greater China and South Korea). Balenciaga is also distributedthrough franchisees and leading multi-brand stores.
In 2016, Balenciaga pursued its retail expansion strategywith the opening of its retail operations in Germany, thetake-over of a franchisee in Hong Kong and the relocationof its Los Angeles store in Rodeo Drive. Several stores wererenovated in line with its concept during the year. Additionally,the brand extended its retail presence in upscale departmentstores with the opening of new shop-in-shops.
The further establishment of the balenciaga.com websitealso played a key role in 2016. The online store is now partof the top performing directly operated stores and trafficis increasing strongly, reflecting the increased interest inthe brand. Today there are nine localised versions ofbalenciaga.com, in languages including Chinese, Koreanand Russian. The website is e-commerce enabled in over95 countries, including South Korea, China and HongKong. Further openings are planned for the Middle Eastnext year.
On social media, as of December 2016, Balenciaga had morethan 1.2 million fans on Facebook and is increasinglypopular on Instagram with over 2.9 million followers.
In 2017 the brand will benefit from the momentumprovided by the new creative vision and the new productlaunches. While franchises and selective distributionremain important contributors to the brand’s activity,retail and e-commerce development will continue to bethe priority for the brand. In particular, new store openingsare planned for the year in strategic locations in maturemarkets and in Asia. In addition, a complete redesign ofthe website is planned for 2017 in the concept of the newArtistic Designer. Also in the roadmap for next year is anenlargement of the online product offer and furtherservices which will be part of the overall cross channelretail strategy.
2OTHER BRANDS ~ LUXURY ACTIVITIES ~ OUR ACTIVITIES
372016 Reference Document ~ Kering
2_VA_V4 04/04/2017 13:21 Page37

Founded in Paris in 1858 by Frédéric Boucheron, theeponymous Maison was built up by four generations ofthe founder’s direct descendants and soon acquiredfame for its expertise in precious stones and its savoir-faire in creating innovative jewelry and watches. Thejeweler moved to Place Vendôme in 1893, becoming thefirst of the jewelry and watch brands to open a boutiquein this iconic location. For nearly 160 years, Boucheronhas been synonymous with excellence in high jewelry,jewelry, and watchmaking.
Today, Boucheron creates and markets high jewelry, jewelryand watches through 39 directly operated stores acrossthe world, including its flagship Place Vendôme store,franchise boutiques, and department stores. It also has aselective network of additional points of sale in exclusivemulti-brand stores.
The brand is focusing its expansion through its retail andfranchise network in key locations worldwide. During theyear, the Maison opened its first boutiques (franchisees)in Kuwait City (The Avenues), in Riyad and in Istanbul, whilethe existing Doha and Dubai boutiques (franchisees)underwent a complete refurbishment. In Asia, Boucheronopened one new directly operated store in Tokyo(Omotesando).
The House new high jewelry collection, 26 Vendôme, waslaunched in 2016 as a contemporary expression ofBoucheron’s legacy. Designed by Creative Director ClaireChoisne, the collection reflects three important stylisticthemes in Boucheron’s archives: couture, nature andarchitecture. The collection of around 60 pieces wasrevealed in Paris in July during a one-of-a-kind livepresentation mise-en-scene by Olivier Saillard, Curator ofthe Palais Galliera, the Paris’ Fashion Museum. On thisoccasion, Boucheron’s unveiled its new salons inside itshistorical building in Place Vendôme. The collection wasthen presented in Cannes, Tokyo, Hong Kong and Dubai.
During the year, Boucheron’s iconic line, Quatre, wasextended with the worldwide launch of new references,using two signature motifs, Grosgrain and Clou de Paris.The Serpent Bohème jewelry collection and Animaux deCollection continued to perform very well as iconic pillars ofthe brand in terms of both image and sales contribution.
A new feminine round watchcase was launched duringBaselworld 2016 along with new Reflet variations thatenlarged Boucheron’s existing watch offering.
In 2017, Boucheron plans to further reinforce its distributionnetwork in key areas such as Asia and Europe while, interms of products, extend its iconic jewelry lines andlaunch a new very broad high jewelry collection.
2 OUR ACTIVITIES ~ LUXURY ACTIVITIES ~ OTHER BRANDS
38 Kering ~ 2016 Reference Document
2_VA_V4 04/04/2017 13:21 Page38

Brioni was founded in Rome in 1945 by Italian tailorNazareno Fonticoli and entrepreneur Gaetano Savini.Revolutionary since the beginning, Brioni was in 1952 thefirst men’s couture House to stage a fashion show and tointroduce bright colours and new fabrics to its tailoringcollections, moving the boundaries and interpretations oftraditional menswear.
Over the years, Brioni strengthened its global reputation,obtaining recognition in America, where it was namedthe most prestigious men’s luxury fashion brand by theLuxury Institute of New York in 2007 and 2011.
Part of Kering since 2012, Brioni develops and manufacturessartorial ready-to-wear, leather goods, shoes, eyewearand fragrances, in addition to the bespoke – made-to-measure – service.
Timeless sophistication, sartorial excellence and innovationare Brioni’s guiding values. The brand’s ambition is tofurther manifest and sustain its position as a world leaderof masculine elegance, addressing a self-confident,internationally minded and charismatic man in the agerange of 35 and 65, who is looking for excellence and adistinctive style.
All of the brand’s products are manufactured in Italy andmeticulously handcrafted by expert artisans. Most of theproduction is made in-house at Brioni’s ateliers in Penne, a
small town in the Abruzzo region, with a rich, longstandingtailoring tradition. The art of Brioni products comes fromthe genuine workmanship of Brioni’s tailors. These menand women, with many years of experience, shape eachgarment with the rigorous observance of the Brionimethod. The brand’s tailoring tradition is preserved at theScuola di Alta Sartoria tailoring school, founded by thecompany in 1985 to perpetuate its sartorial expertise andtrain new generations of tailors.
While wholesale still represents an important distributionchannel, Brioni is continuously expanding its retailnetwork by opening new strategic stores.
At the end of 2016, Brioni had 49 directly operated stores,mainly located in Western Europe, North America and Japan.
2016 marked an important year in Brioni’s retail strategywith the debut of its new store concept. Developed byDavid Chipperfield Architects, the concept was introducedwith the opening of the Paris and New York flagship stores.
Moving forward, Brioni’s ambitions for 2017 includeconsolidating business in the United States and Asia aswell as strengthening brand awareness and visibilityworldwide. During the year, the company will reinforce itsretail ambitions by continuing the roll out of its new storeconcept in order to reaffirm Brioni’s leading position inthe sartorial luxury menswear industry.
2OTHER BRANDS ~ LUXURY ACTIVITIES ~ OUR ACTIVITIES
392016 Reference Document ~ Kering
2_VA_V4 04/04/2017 13:21 Page39

Founded in 2006, Christopher Kane is a brand which iswidely acknowledged to have spearheaded a revival ofBritish high fashion, through the launch of innovativeready-to-wear styles and accessories. After havingcompleting his Master of Arts (MA) in Fashion Design atCentral Saint Martins College, Christopher Kane startedhis own label, in partnership with his older sister, TammyKane. In 2013, Kering acquired 51% of the company.
Christopher Kane has received several industry recognitionsin recent years, including the highly acclaimed WomenswearDesigner of the Year from the British Fashion Council(BFC) in 2013. In 2016, Christopher Kane was nominatedagain by the BFC for two prestigious awards: WomenswearDesigner of the Year and the Red Carpet Award. Inaddition, for the 5th year running, Christopher Kane hasbeen awarded the «Designer of the Year» at the11th annual Scottish Fashion Awards.
On the distribution side, Christopher Kane’s collectionsare currently distributed in over 30 countries across morethan 120 wholesale points of sale. The brand’s primaryproduct category is women’s ready-to-wear, with expansioninto menswear, accessories and shoes.
Christopher Kane’s first retail store, on Mount Street inMayfair, London which opened two years ago, representsa strong statement of the brand’s image and identity andhelps to increase brand awareness. In addition, the storeprovides significant leverage for strategic partnershipswith third parties.
In June 2016 the brand launched its own e-commercesite with the goal to have a truly global reach and exploitthe potential of its direct online business.
In 2017, the brand will aim at further strengthening itswholesale presence.
2 OUR ACTIVITIES ~ LUXURY ACTIVITIES ~ OTHER BRANDS
40 Kering ~ 2016 Reference Document
2_VA_V4 04/04/2017 13:21 Page40

Girard-Perregaux is one of the oldest high-end watchmanufacturers. Founded in 1791, the company isheadquartered in La-Chaux-de-Fonds, Switzerland.
The history of the brand is marked by watches that combinesharp design with innovative technology, such as therenowned Tourbillon with Three Gold Bridges presented byConstant Girard-Perregaux in 1889 at the Paris UniversalExhibition, where he was awarded a gold medal.
Combining a passion for state-of-the-art Haute Horlogerieand a relentless quest for precision, Girard-Perregaux isone of the few Swiss watchmakers that designs andmanufactures its own movements and cases in-house.
Girard-Perregaux has been part of the Kering group since 2011.
In 2016 the company celebrated its 225th anniversary andseized this opportunity to revamp and relaunch severalsignature collections that embody the brand’s heritage,craftsmanship and watchmaking culture. The Girard-Perregaux 1966 collection is now offered in a steeledition, while Girard Perregaux’s iconic complication, ThreeGold Bridges has been elevated from a complication to acomplete product collection, inspired by classic orcontemporary design. In addition, during the year Girard-Perregaux introduced limited editions of the Laureatoand the 1957 iconic models.
Haute Horlogerie continues to be the brand’s emblematicsegment. In 2016, the brand capitalised on the success ofthe products that had been honoured at the Grand Prix
d’Horlogerie de Genève (GPHG), introducing a full titaniumversion of the Minute Repeater Tourbillon and re-engineeredthe Constant Escapement into a 46mm version. The keyhighlight was the introduction of the Three Gold BridgesEsmeralda Tourbillon, inspired by the iconic historicalpieces that won the Paris Exhibition in 1889, but re-interpreted as a wristwatch.
Lastly, Girard-Perregaux ended the year very successfullywith two awards, at the 2016 Grand Prix d’Horlogerie deGenève: the Ladies’ High Mech Watch prize, with the Cat’sEye Tourbillon with Gold Bridge, and the Tourbillon Watchprize with La Esmeralda Tourbillon.
Girard-Perregaux is present in over 60 countries throughindependent points of sale, prestigious departmentstores and specialist boutiques.
The watches are also sold through a franchise network of13 mono-brand franchise stores located primarily in Asiaand Europe.
In 2017, the brand will mainly capitalise on the re-organisationof its distribution network. In terms of products, in 2017Girard-Perregaux plans to introduce a unique sport-chiccollection in respect of its codes and DNA.
Also based in La-Chaux-de-Fonds, JEANRICHARD sells itscollections through independent points of sale andspecialist multi-brand boutiques. Its main markets areMainland China, Japan, France and the United Kingdom.
2OTHER BRANDS ~ LUXURY ACTIVITIES ~ OUR ACTIVITIES
412016 Reference Document ~ Kering
2_VA_V4 04/04/2017 13:21 Page41

Synonymous with creativity and character in theinternational jewelry scene, Pomellato was established inMilan in 1967, and was the first to introduce the prêt-à-porter philosophy to the world of jewelry.
Pomellato’s creations – unique in their blend of colourfulstones, stone cutting techniques and setting know-how – are immediately recognisable and have built aconsistent, iconic style over the years. Jewels are craftedby the expert hands of goldsmiths, who transform thespirit of the brand into outstanding creations.
The Nudo, Capri, Tango, Sabbia, Victoria and M’ama nonm’ama collections represent Pomellato’s pillars andembody the message of the brand that is «the first globalluxury Italian fashion fine jeweler, unconventional,colourful».
In 2016, Pomellato launched the new Nudo pendant andNudo earrings, that add new functionalities to the collectionin the 15th anniversary year of this iconic line. In addition,during the year Pomellato enriched the Tango, Capri andSabbia collections with a mix of new materials andcolours that incentive spreading the character and thestorytelling of the Maison.
In 2016, Pomellato completed a 360° digital strategyincluding its website, social media and a newsletter. Aspart of this process, the new Pomellato website with anintegrated e-commerce platform was launched at theend of 2015.
Following its strategic international expansion, the Pomellatobrand currently has a distribution network that includes39 directly operated stores, 22 franchise boutiques and
approximately 500 wholesale points of sale.
Dodo is an Italian brand with international appeal, createdin 1995 as the first jewelry line to combine a decorativefunction with a message, precious and easy to wear.
In 2016, Dodo launched its new website combined with anew social media strategy and a cross media project, andin this context the launch of the new Rings collection hasbeen supported by many videos posted on the mainsocial media platforms.
For the Christmas collection, Dodo reinvented its most iconiccharms through new silhouettes and styles that expressthe perfect blend of valued artisan workmanship andcreative Italian design.
The Dodo distribution network currently includes 20 directly operated stores, 14 franchise boutiques andover 400 wholesale partners, most of which are sharedwith the Pomellato brand.
In 2017, the brands’ strategies will focus on consolidatingand protecting their distinctive positioning, as well asboosting their brand awareness, product strategy andcommunication. In addition, they plan new selectiveopenings to increase their retail presence in internationalmarkets, particularly in Japan and Mexico, while thewholesale expansions will focus on the main Americanand European markets.
2 OUR ACTIVITIES ~ LUXURY ACTIVITIES ~ OTHER BRANDS
42 Kering ~ 2016 Reference Document
2_VA_V4 04/04/2017 13:21 Page42

Created in 2004 by designer Dennis Chan, Qeelin hasembraced the evocative myths of the East, creating lavishfine jewelry that is rich in symbolism. In each collection,iconic designs, carefully selected materials andexceptional craftsmanship deliver a combination ofplayfulness and enchanting oriental beauty.
The brand’s identity is reflected in its name, a referenceto the «Qilin», a Chinese mythical animal and rootedsymbol of love, understanding and protection. Thebrand’s iconic Wulu collection is inspired by the legendaryChinese gourd filled with auspicious associations. Qeelinis also well-known for its Bo Bo collection, featuring anarticulated and playful representation of a diamondpanda bear, China’s treasured national hero.
Since Qeelin’s acquisition by Kering in December 2012,the brand has accelerated its growth, through both retailand wholesale channels.
Its boutique network expansion continued in 2016 primarilyin Mainland China with Qeelin now counting 25 stores
(16 directly operated boutiques and nine franchisestores). To reinforce its international expansion, the brandhas recently taken its first steps in the US market, wherebusiness development is driven by a selective network ofindependent retailers and department stores.
2016 was an important milestone for Qeelin as it marked the10th anniversary of Bo Bo, one of the brand’s most successfuland iconic collections. To celebrate this anniversary,Qeelin collaborated with acclaimed Chinese photographerand visual artist Chen Man to design the limited editionMonkey King Bo Bo, featuring the Chinese mythologicalfigure Sun Wukong in a contemporary design.
In 2017, Qeelin will continue to invest in its expansion,primarily focusing on the Chinese market. The productoffering aims to maximise the icons through furtherextensions of the existing lines. During the Fall 2017, anew collection will be introduced to express the brand’sDNA with a focus on playfulness and Chinese emotions.
2OTHER BRANDS ~ LUXURY ACTIVITIES ~ OUR ACTIVITIES
432016 Reference Document ~ Kering
2_VA_V4 04/04/2017 13:21 Page43

Stella McCartney is a luxury lifestyle brand that waslaunched under the designer’s name in partnership withKering in 2001. Since then, the brand has experiencedstrong and sustained development, building a verydistinctive positioning and a strong identity in the luxuryworld.
Since the brand’s foundation, ready-to-wear representsStella McCartney’s core business, although throughout itswhole life, the company has been successfully developingand extending its portfolio to include other product categoriessuch as bags, shoes and kids. Product diversification hasalso been guaranteed by successful collaborations suchas the design of sport apparel with Adidas and lingeriewith Bendon. The brand has also developed eyewear andperfume lines through licence agreements.
2016 also saw a further product portfolio expansion withthe launch of Stella McCartney’s first men’s collection.
Committed to reflecting the designer’s ethical values, thebrand is continuously looking for new ways to operate abusiness that reduces its environmental impact, andtakes very seriously its responsibility to be a sustainablecompany, from the design phase to store openings andproduct manufacturing. In this regard, in 2016, for thefirst time, Stella McCartney officially presented itsEnvironmental Profit and Loss (EP&L) account.
Since its establishment, the brand has been primarilyrepresented through its wholesale channel, which todayincludes approximately 700 doors. The brand willcontinue to optimise wholesale distribution by nurturingand fine-tuning it while engaging with key online players.
Most recently and for several years, the brand hasfocused its strategy on the expansion of its retail channelworldwide. Over the last few years though, the brand has
mostly concentrated on consolidating the organic growthof its existing retail network with only a very few selectiveopenings. For example in 2016, the brand took over thebusiness in Hong Kong from its long-time wholesalepartner, Lane Crawford, with the buyback of three directlyoperated stores, reinforcing its direct presence in Asia, astrategic market for the brand. At the end of 2016 thebrand owned a retail network of 41 directly operated stores,with six net openings in the year taking place in Japanand in Hong Kong.
In recent years, a very important role has been played bye-commerce, which helped to enhance and reinforcemarket penetration in terms of both image and revenue.Stella McCartney’s online presence today is very welldeveloped worldwide and represents a significant part ofits total revenue.
Social and media activities were particularly dynamic in2016 and Stella McCartney had over 3.6 million followerson Instagram, nearly 1 million on Twitter and approximately0.9 million fans on Facebook, which all contributed to keepclients, particularly Millennials, engaged and connectedwith Stella’s world.
In 2017, the brand will continue with its main strategicpriority to increase retail productivity and organic growth.Stella McCartney will open for the first time three flagshipsin top cities (New York, Paris and London) in very hightraffic prime locations. This will enable the brand toshowcase the entire product portfolio and to reinforcesynergies with the online business while aiming for one«universal» client experience. In addition, the brand plansto further expand its accessory lines and to keep increasingbrand awareness, particularly in China and in Japan.
2 OUR ACTIVITIES ~ LUXURY ACTIVITIES ~ OTHER BRANDS
44 Kering ~ 2016 Reference Document
2_VA_V4 04/04/2017 13:21 Page44

Founded by Ulysse Nardin in 1846, the watchmakingHouse, with strong legacy from the nautical world, joinedKering in November 2014.
Building on its strong identity and expertise in the high-end segment of marine chronometers and complicationtimepieces, Ulysse Nardin continues to introduce cutting-edge technologies and state-of-the-art materials,including silicon and other innovative materials. UlysseNardin is one of the few Swiss watchmakers to have in-house production capacity for high-precision movementcomponents, particularly the regulating organs.
Ulysse Nardin’s product offer has been consolidatedaround four key pillars: the Marine, the Diver, the Classicand the Freak.
Product launches in the year included the acclaimedGrand Deck Marine Tourbillon timepiece, which won thepublic prize «Premio del Público» during the 2016 SalonInternational of Haute Horlogerie in Madrid, and wasnominated «Watch of the Year» by a panel of specialisedjournalists and watch collectors in the Middle-Eastregion. The introduction of the top-selling ExecutiveTourbillon Skeleton also contributed to the brand’sinnovative image.
Alongside its audacious inventions, Ulysse Nardinnurtured its historical marine heritage by reviving theartistic Classico Schooner America, and the ClassicoManufacture both with a unique dial handcrafted in-house at Donzé Cadrans, a manufacturing subsidiary ofUlysse Nardin and a unique specialist in the delicate artof Grand Feu enamelled watch dials.
Within the Women’s collection, in 2016 Ulysse Nardinintroduced the Lady Marine Chronometer, and the LadyDiver. Additional releases in 2016 were the Diver ChronographMonaco and the Diver Chronograph Hammerhead Shark.
To reinforce its image and positioning in the Haute Horlogerieworld, the brand launched a new advertising campaignfeaturing the picture of a breaking wave underlined by its«Eternal Movement» motto. Marketing investment wasprimarily focused on digital media and on the launch ofUlysse Nardin’s new official website. Ulysse Nardincontinued to reaffirm its roots in the marine world thanksto the sponsorship of the Artemis Racing team, challengersin the 35th America’s Cup races.
Ulysse Nardin’s current distribution network includes 20 mono-brand boutiques (including one directlyoperated store) and over 500 selected points of salearound the world. Since January 2016, Ulysse Nardindirectly manages its distribution network in Japan.
In 2017, Ulysse Nardin aims to further streamline itsproduct portfolio, while expanding functionalities in eachof its four product pillars, in preparation of its firstattendance, in January, to the Geneva Salon Internationalde la Haute Horlogerie in Geneva. In addition, the brandwill extend the length of its warranty programme for theentire product portfolio to five years (previously it was 2-3 years) to offer an additional and highly valuable serviceto its clientele. Finally, Ulysse Nardin plans to pursue theconsolidation and upgrading of its worldwide distributionnetwork.
2OTHER BRANDS ~ LUXURY ACTIVITIES ~ OUR ACTIVITIES
452016 Reference Document ~ Kering
2_VA_V4 04/04/2017 13:21 Page45

MARKET OVERVIEW: SIZE, trENDS and MAINGROWTH DRIVERS
According to NPD, the global Sport & Lifestyle marketgenerated revenue of €356 billion in 2015, representing a 5%increase at comparable exchange rates compared to 2014.
As a region, Asia has become the second market behindthe Americas, while Europe is now only the thirdworldwide market.
Worldwide Sport & Lifestyle growth rate at comparable exchange rates (2007-2015)
Demand in the Sport & Lifestyle market is driven by fourmain factors:
• demographic trends and an increase in world GDP;
• increase in sports participation and growing awarenessamong the population of the positive effect of sport onhealth;
• globalisation and convergence of consumer habits assport promotes universal values;
• increase in purchasing power and urbanisation inemerging countries.
Meanwhile, sector players have developed their productoffering and extended their global reach through:
• innovation: sector players are quick to adopt newtechnologies and materials that help them stay aheadof the competition and to segment their offering;
• geographical expansion: sporting goods companies arefocusing on consolidating or growing their marketshares in mature markets, while investing in high-growth markets where they have more potential toincrease market penetration and brand awareness;
• retail expansion: while wholesale distribution remainsthe most important distribution channel for sportinggoods, industry players are also developing theirnetwork of directly operated stores.
WORLDWIDE Sport & Lifestyle MARKET OVERVIEWThis section contains information which is derived from the «2015 Global Sport Market Report» conducted by NPD, anindependent market research firm, and published in June 2016.
This study’s estimates of the size of the global sport market are based on NPD’s consumer panel tracking data, in 16countries (in 2015), representing approximately 80% of the global sport market sales. For the remaining 20%, NPDestimates are based on assumptions related to gross domestic product development.
Note that year after year some countries are surveyed using panels instead of being estimated. As a result, historicaldata (typically from 2007 to 2015) are subject to update by NPD each year.
Also note that i) all growth rates are expressed in reported terms (unless stated otherwise); ii) the designation«Sport & Lifestyle» (SLS) refers to all types of sports from running and hiking to snowboarding; iii) the global sport market,as reported by NPD, includes four major segments: apparel, footwear, equipment, and bicycles for all types of sport usage.
2 OUR ACTIVITIES ~ WORLDWIDE SPORT & LIFESTYLE MARKET OVERVIEW
46 Kering ~ 2016 Reference Document
14
+5%
13
+6%
12
+6%
11
+5%
10
+4%
09
-2%
08
0%
07
+4%
15
+5%
2_VA_V4 04/04/2017 13:21 Page46

In 2015, the United States and China remained the twolargest markets, accounting for 32% and 10% of theglobal market respectively.
In 2015, in the United States, the Sport & Lifestyle marketwas driven by sport apparel, up 16%, confirming the trendinitiated four years ago (i.e. consumers favoured sport productsfor casual and daily use). Footwear remained dynamic,with a 7% increase.
China shows a pretty linear growth rate by category, withthe noteworthy outperformance of footwear, up 9%.
Western Europe growth is also driven by footwear, whichgrows twice faster than the global market in this region.France, Italy and the United Kingdom also benefit from astrong apparel market (+8-10%), while Germany’s tractionrelies on bicycle (+6%).
India, which entered the top ten countries in 2015, saw asolid organic growth (+ 7%), driven by the footwearcategory (+10%).
The ten largest countries in terms of global revenue in 2015 are as follows (revenues by geography and not by nationality):
Year-on-year Size change % of total2015 rank Country (in € billions) 2015/2014 market
1 United States 114.9 +8% 32%2 China 33.9 +6% 10%3 Germany 14.3 +5% 4%4 Japan 14 +1% 4%5 Canada 13.4 +7% 4%6 France 12 +5% 3%7 United Kingdom 11.9 +4% 3%8 South Korea 11.2 0% 3%9 India 9.1 +7% 3%10 Italy 8.6 +5% 2%
COMPEtitiVE ENVIRONMENT
The Sport & Lifestyle market is a mass, global market.PUMA is currently one of the leading sporting goodsbrands after Nike and Adidas. In addition to these threemajor companies, there are several players specialisedeither in one specific category, or initially targeting aspecific region, such as Under Armour, New Balance andLululemon Athletica.
In Kering’s Sport & Lifestyle activities, Volcom addresses amore niche market, i.e. action sports and outdoor, competingwith brands such as Quiksilver, Vans and Billabong.
REGIONAL OVERVIEW
Worldwide Sport & Lifestyle market: breakdown by region (2015)
2WORLDWIDE SPORT & LIFESTYLE MARKET OVERVIEW ~ OUR ACTIVITIES
472016 Reference Document ~ Kering
Americas 42%
Europe 25%
Middle Eastand Africa 5%
Asia 28%
2_VA_V4 04/04/2017 13:21 Page47

PRODUCT CATEGORIES
According to NPD, the global sport market can be divided into three main product categories – footwear, apparel andequipment (excluding the market for bicycles and accessories) – which correspond to the key product areas in whichKering Sport & Lifestyle brands operate.
In 2015, all categories grew, with apparel, up 7.3%, confirming the trend initiated in 2014 as the prime contributor toglobal sport market growth, being at the same time the biggest and fastest growing category alongside footwear.
Worldwide Sport & Lifestyle market: breakdown by category (in 2015)
Market value Reported year-on-year % of total (in € billions) change 2015/2014 market
Footwear 97 +6.7% 27%Apparel 118 +7.3% 33%Equipment 99 +2.1% 28%Bicycle and accessories 42 +2% 12%
Total 356 +5% 100%
In 2015, fitness, swimming and basketball were the sports that enjoyed the highest growth rates.
2015 value Reported year-on-yearSport (in € billions) change 2015/2014
Cycling 45.2 +2%Fitness 37 +8%Walking / Hiking 29.5 +2%Running 24.1 +5%Football / Soccer 12.1 +1%Swimming 12.8 +7%Basketball 9.4 +8%
NB: as mentioned in the introduction to this section, NPD updates historical data each year (2014 data have been updated).
2 OUR ACTIVITIES ~ WORLDWIDE SPORT & LIFESTYLE MARKET OVERVIEW
48 Kering ~ 2016 Reference Document
2_VA_V4 04/04/2017 13:21 Page48

DIStrIBUtiON CHANNELS
The Sport & Lifestyle industry predominantly operatesthrough the wholesale channel. Key distributors ofsporting goods brands include retailers such as FootLocker and Finish Line in the United States, andIntersport and Decathlon in Europe. In the United States,action sports and outdoor brands are primarily distributedat Zumiez and Tilly’s, along with other independentmulti-brand accounts.
Sporting Goods brands are also looking to upgrade theshopping experience through dedicated partnershipswith the key retailers, notably by creating shop-in-shopsand joint-venture agreements with the largest retailers.
Along with wholesale distribution, most sporting goodsbrands, including PUMA, have selectively developeddirectly operated store operations (which representapproximately 20% to 30% of the sales mix across mostbrands) and are consistently looking to enhance overtime the retail experience within their own stores.
E-commerce is also gaining momentum, yet still accountsfor a fraction of total sales. Euromonitor estimated thatin 2014, global online sales accounted for 7% of totalsporting goods market sales. However, in the UnitedStates, e-commerce penetration is relatively higher andthus presents positive prospects for industry players.
MARKET OUTLOOK
In the long term, NPD forecasts a CAGR (compoundannual growth rate) of 4% from 2015 to 2020. TheSport & Lifestyle market is therefore expected to reach salesin excess of €428 billion by 2020, assuming continuedpositive global GDP growth. Therefore, the longer-termgrowth rate in the Sport & Lifestyle market is expected toremain closely tied to the more general trend indiscretionary consumer spending across the world.
According to NPD, two trends will contribute equally tolong-term growth:
• Consumer trends: the casual-use market will expandthrough increased penetration of branded sport-styledapparel and athletic footwear in daily life. The marketfor sport use will grow through increased concern forhealth considerations.
• Sports trends: within major sports, urbanisation willspecifically foster running, basketball and all fitnessactivities. Paradoxically, urbanisation should also nurturea return in demand for outdoor activities and brands.
2WORLDWIDE SPORT & LIFESTYLE MARKET OVERVIEW ~ OUR ACTIVITIES
492016 Reference Document ~ Kering
2_VA_V4 04/04/2017 13:21 Page49

sport & lifestyle activities
2 OUR ACTIVITIES ~ SPORT & LIFESTYLE ACTIVITIES
50 Kering ~ 2016 Reference Document
2016 key figures
€3,884 millionin revenue
28%
16%
28%
9%
19%Western EuropeAsia PacificNorth AmericaJapanOther countries
Breakdown by region
2015 3,683
2016 3,884
Revenue (in € millions)
2_VA_V4 04/04/2017 13:21 Page50

2SPORT & LIFESTYLE ACTIVITIES ~ OUR ACTIVITIES
512016 Reference Document ~ Kering
Footwear 42%
Apparel 18%Accessories40%
PUMA 94%
Other brands 6%
€123 millionin recurring operating income
Breakdown of 2016 revenue by brand
Breakdown of 2016 revenue by product category
2015 95
2016 123
Recurring operating income(in € millions)
Total 2015: 701Total 2016: 734
89103
147142
3435
431454
WesternEurope
NorthAmerica
Japan
Emergingcountries
734directly operated stores
2_VA_V4 04/04/2017 13:21 Page51

2016 key figures
€3,642 millionin revenue
€127 millionin recurring operating income
11,128average number of employees (full time equivalent)
Breakdown of 2016 revenueby product category
Breakdown of 2016 revenue by region
Business concept
As one of the world’s leading sports brands, PUMAdesigns, develops, and markets footwear, apparel andaccessories. For over 65 years, the brand has establisheda reputation for fast and innovative product designs in itsPerformance categories such as Teamsport, Running andTraining, Golf and Motorsport. In addition, PUMA offersinnovative and commercial Sportstyle ranges that areinspired by the rich heritage of PUMA’s roots in sports andengages in exciting collaborations with renowned designbrands to bring compelling designs to the sports world.
The PUMA group owns the PUMA and COBRA Golf brandsas well as the Dobotex subsidiary. The group distributesits products in more than 120 countries, employs morethan 11,000 people worldwide, and is headquartered inHerzogenaurach, Germany. Since 2013, PUMA’s mission isto be the fastest sports brand in the world, which isreflected in its brand positioning of being «ForeverFaster». This mantra serves as the company’s guidingprinciple, which is expressed through all of its actions anddecisions. PUMA’s objective is to be fast in reacting to newtrends, fast in bringing new innovations to market, fast indecision-making and fast in solving problems for itspartners and retailers.
2 OUR ACTIVITIES ~ SPORT & LIFESTYLE ACTIVITIES ~ PUMA
52 Kering ~ 2016 Reference Document
Footwear 45%
Apparel 37%Accessories18%
Western Europe 29%Japan 9%
North America 26%
Asia Pacific 16%
Othercountries 20%
2_VA_V4 04/04/2017 13:21 Page52

Competitive environment
The global sporting goods industry grew solidly in 2016.The main growth drivers were the increase in consumerspending based on rising wages as well as a higher sportsparticipation around the world, including more womentaking up sports. In addition, 2016 saw a continuation ofthe global athleisure trend.
From a distribution channel perspective, the e-commercebusiness continued to show rapid growth.
However, volatile currencies and a strong US dollar inparticular continued to weigh on the profitability of somecompanies within the sporting goods industry.
Strategy
PUMA’s strategy consists of five priorities: repositioningPUMA as the world’s fastest sports brand along with thecreation of brand heat, improving the product enginewith a pipeline full of exciting and commercial products,optimising PUMA’s revenue and distribution quality,enhancing organisational speed and business processesas well as further strengthening PUMA’s women’sbusiness. In 2016, PUMA has made further progress in allof these key strategic priorities.
In terms of further strengthening its position as a sportsbrand and creating more brand heat, PUMA capitalisedon its partnerships with some of the most eliteambassadors. The world’s fastest man Usain Bolt, starstriker Sergio Agüero, golf star Rickie Fowler, ArsenalFootball Club, Borussia Dortmund, the Jamaican andCuban Olympic Federations, multi-platinum recordingartist, designer and entrepreneur Rihanna as well asinfluencers Cara Delevingne, Kylie Jenner and many morehave played major roles in increasing sell-through forPUMA in 2016. Furthermore, the year’s great sportingevents such as the Copa América, UEFA Euro 2016, andthe Olympics in Rio all proved to be perfect stages toshowcase PUMA as an innovative and design drivensports brand.
The strong demand for PUMA’s Performance andSportstyle product offering proved that the brand hassuccessfully managed to increase the commercial appealof its products. This success stems from the IGNITEfranchise as well as Fierce and Fenty products within theRunning, Training and Sportstyle categories. In PUMA’swomen’s business, a series of styles for female consumershas been launched successfully. Key footwear styles soldout within weeks or days, which was accompanied bypositive feedback from retailers around the world.
In terms of improving distribution quality, PUMA continuedto consolidate its relationships with key strategicaccounts and built new partnerships with strong retailersin both established and emerging markets. Furthermore,PUMA’s retail sales developed quite strongly throughoutthe year thanks to healthy like-for- like sales growth, ahigher number of own retail stores in operation as well assignificant momentum in the e-commerce business. Theroll-out of the «Forever Faster» store concept alsocontinued worldwide for PUMA’s owned-and-operatedstores and contributed to this positive development.
Regarding the improvement of the group’s organisationalspeed, PUMA continued to make progress in key areas,including the further standardisation of ERP systems,improvements to the overall IT infrastructure and theexpansion in scope of the group’s International Sourcing &Trading Organisation, which manages all global order andinvoice flows centrally. Building enhanced capabilitiesand tools across product development, planning andreporting were also priorities, for example, in order todrive transparency and efficiency in managing productcomponents such as materials and graphics.
In support of the brand’s growing women’s business,PUMA launched its «DO YOU» campaign, which aims toinspire confidence in women around the world. Thecampaign is spearheaded by international model, actress,and activist Cara Delevingne who has joined PUMA’sgrowing list of influential female ambassadors. It featuresa cross -category product range from PUMA’s Running andTraining and Sportstyle collections. The «FENTY PUMA byRihanna» fashion shows in New York and Paris also led tocontinued strong visibility for PUMA’s women’s categoryworldwide.
2PUMA ~ SPORT & LIFESTYLE ACTIVITIESE ~ OUR ACTIVITIES
532016 Reference Document ~ Kering
2_VA_V4 04/04/2017 13:21 Page53
Social, economic and environmental sustainability remainsa core value for PUMA. In January 2016, PUMA joined theBetter Cotton Initiative (BCI), which is committed todeveloping better cotton as a sustainable mainstreamcommodity. Cotton has a significant environmentalfootprint because cotton farming requires enormoususage of land and water. As it is one of the most usedmaterials in PUMA’s apparel products, it is important forPUMA to integrate a commercially viable and moresustainable cotton solution into its production process,such as cotton from BCI.
In April 2016, PUMA and the International FinanceCorporation (IFC), a member of the World Bank Group,entered into a partnership to provide financing to PUMA’ssuppliers in emerging markets. This innovative programme,which is the first a European brand has signed with theIFC, offers financial incentives for suppliers to improveenvironmental, health, safety and social standards. In itsfirst phase, the program will be rolled out in Bangladesh,Cambodia, China, Indonesia, Pakistan and Vietnam.
2016 highlights and outlook for 2017
In January 2016, PUMA won the ISPO AWARD 2016 in thecategory Apparel Performance Products Outer Layer. As aconstant driver of innovation in sports, PUMA invented ajacket with dynamic thermoregulation. The evoTRG VentJacket has ergonomically-placed inserts that adapt tofootball players’ movements: they open to keep playerscool when in motion and close to keep them warm whenthe movement stops.
During the summer, the UEFA Euro 2016 in France provedto be a great stage to showcase PUMA as an innovativeand design-driven sports brand. With an on-fieldpresence of almost 40% across all matches, PUMA’s fiveparticipating teams secured the brand strong visibilitywith their kits featuring the ACTV Thermo-R appareltechnology. While Switzerland and Slovakia reached theround of last sixteen following passionate and decisiveappearances, Italy made it to the quarter-finals beatingformer European champion Spain. A clear highlight wasFrance’s Antoine Griezmann, who was voted Player of theTournament by UEFA after being the top scorer. Stars likePUMA player Olivier Giroud, who was ranked third in thescoring table of the tournament, while Portugal’s Europeanchampion Rui Patrício emerged as the Goalkeeper of theTournament, sporting PUMA’s yellow-pink boots or gloveson pitch.
In the Running category, PUMA continued to expand itssuccessful IGNITE franchise with the all new IGNITE Dualfor Autumn-Winter 2016 season. It provides ultimateflexibility and cushioning for mid-and long-distancerunners, thanks to the special sole with IGNITE FOAM. Amajor highlight for the brand was the Summer Olympicsin Rio, where PUMA sprint star Usain Bolt accomplishedhis «Triple Triple» by winning an Olympic Gold medal ineach of the three sprinting events. In total, ten gold, fivesilver and nine bronze medals were the yield of the PUMAequipped Olympic national teams.
2 OUR ACTIVITIES ~ SPORT & LIFESTYLE ACTIVITIES ~ PUMA
54 Kering ~ 2016 Reference Document
2_VA_V4 04/04/2017 13:21 Page54
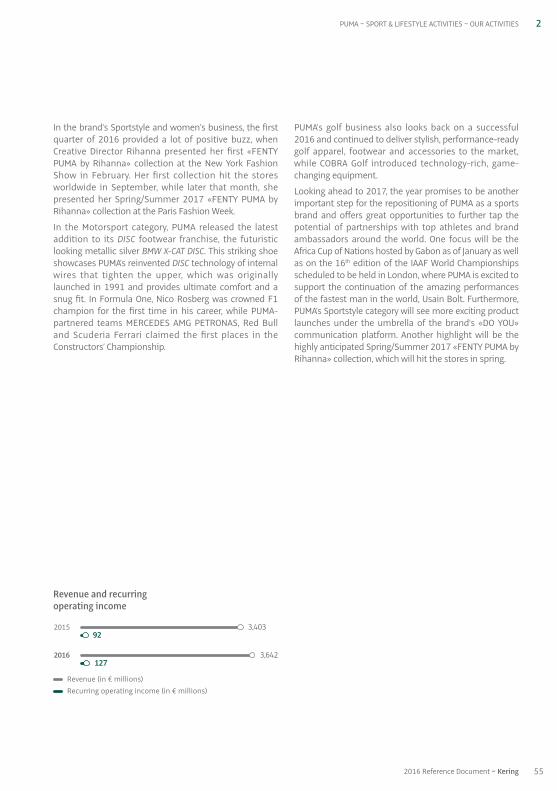
Revenue and recurringoperating income
In the brand’s Sportstyle and women’s business, the firstquarter of 2016 provided a lot of positive buzz, whenCreative Director Rihanna presented her first «FENTYPUMA by Rihanna» collection at the New York FashionShow in February. Her first collection hit the storesworldwide in September, while later that month, shepresented her Spring / Summer 2017 «FENTY PUMA byRihanna» collection at the Paris Fashion Week.
In the Motorsport category, PUMA released the latestaddition to its DISC footwear franchise, the futuristiclooking metallic silver BMW X-CAT DISC. This striking shoeshowcases PUMA’s reinvented DISC technology of internalwires that tighten the upper, which was originallylaunched in 1991 and provides ultimate comfort and asnug fit. In Formula One, Nico Rosberg was crowned F1champion for the first time in his career, while PUMA-partnered teams MERCEDES AMG PETRONAS, Red Bulland Scuderia Ferrari claimed the first places in theConstructors’ Championship.
PUMA’s golf business also looks back on a successful2016 and continued to deliver stylish, performance-readygolf apparel, footwear and accessories to the market,while COBRA Golf introduced technology-rich, game-changing equipment.
Looking ahead to 2017, the year promises to be anotherimportant step for the repositioning of PUMA as a sportsbrand and offers great opportunities to further tap thepotential of partnerships with top athletes and brandambassadors around the world. One focus will be theAfrica Cup of Nations hosted by Gabon as of January as wellas on the 16th edition of the IAAF World Championshipsscheduled to be held in London, where PUMA is excited tosupport the continuation of the amazing performancesof the fastest man in the world, Usain Bolt. Furthermore,PUMA’s Sportstyle category will see more exciting productlaunches under the umbrella of the brand’s «DO YOU»communication platform. Another highlight will be thehighly anticipated Spring / Summer 2017 «FENTY PUMA byRihanna» collection, which will hit the stores in spring.
2PUMA ~ SPORT & LIFESTYLE ACTIVITIES ~ OUR ACTIVITIES
552016 Reference Document ~ Kering
Revenue (in € millions)Recurring operating income (in € millions)
2015
2016
3,40392
3,642127
2_VA_V4 04/04/2017 13:21 Page55

2016 key figures
€242 millionin revenue
745average number of employees (full time equivalent)
Revenue(in € millions)
Celebrating its 25-year anniversary in 2016, Volcom wasfounded on the belief that we were all born to chase whatwe are true to. Built on liberation, innovation andexperimentation, the brand is rooted in the surf, skate,snow, art, and music cultures with style that reaches farbeyond. Volcom provides lifestyle-enhancing apparel,outwear, accessories and footwear to people who sharetheir passion, and supports anyone that relentlesslypursues their passion and lives for those intoxicatingmoments when they feel more than alive.
In a difficult retail environment in North America,negatively impacting Volcom’s wholesale channel, thebrand seized the opportunity to strengthen its positionwith key partners but also its product and marketing, witha heavy emphasis on understanding its consumer and howto effectively market to Millennial and Gen Z consumers.Volcom continues to challenge itself operationallyincluding globalisation of its organisation wherenecessary and driving efficiencies in its supply chain.
For its retail channels, Volcom has experienced tremendousgrowth in e-commerce and will continue to leverage thisunder penetrated business in future years. Volcom hasstrengthened its retail store portfolio in key markets inthe US, Europe and Asia Pacific: the brand opened a storeat Disney Orlando in 2016 with other key openings inSwitzerland, Australia and coastal Japan. For 2017, Volcomhas secured a store location in the Bastille neighbourhoodof Paris.
Volcom is continuously reinforcing its brand imagethrough sponsorship of world-class athletes, targetedgrassroots marketing events, key city marketing, distinctiveadvertising and the production of board sport and youthlifestyle-related films, art and music under the «True ToThis» brand mantra. In 2016, the brand signed key newathletes and brand ambassadors including the Australiansurfer, Noa Deane and fashion icon, Georgia May Jagger. In2016, Volcom launched its full length skate movie, «HolyStokes.» During the year, Volcom also refocused on itscore operations and sold its Electric brand.
Other brands
2 OUR ACTIVITIES ~ SPORT & LIFESTYLE ACTIVITIES ~ OTHER BRANDS
56 Kering ~ 2016 Reference Document
2015 279
2016 242
2_VA_V4 04/04/2017 13:21 Page56

572016 Reference Document ~ Kering
CHAPTer 3
Sustainability
1. Sustainability at Kering 581.1. A long-standing commitment 581.2. 2016 highlights 591.3. Vision and strategic challenges 621.4. Recognition and inclusion in SRI indices 671.5. Key figures 67
2. Supporting our employees 682.1. The Group’s human resources profile 682.2. Remuneration and employee benefits 712.3. Promotion and respect of ethics within the Group 722.4. Enhancement of talent and skills 732.5. Promotion of diversity 782.6. Quality of life at work 802.7. Social dialogue 83
3. Reducing our environmental impact 853.1. Environmental management 853.2. Environmental Profit & Loss account (EP&L) 893.3. Measurement and reduction of our carbon footprint 953.4. Circular economy 1043.5. Protection of biodiversity 114
4. Supporting community development 1164.1. Community impact 1164.2. Stakeholder dialogue 1184.3. Relationships with subcontractors and suppliers 1204.4. From risk management to development of responsible products 1274.5. Initiatives carried out by the Kering Foundation and sponsorship programmes 130
5. Cross-reference tablepursuant to Articles R. 225-104 and R. 225-105 of the French Commercial Code (Code de commerce) / Global Compact / GRI G4 134
6. Report by one of the Statutory Auditors 137
Appendix 140

For 20 years, Kering has pursued and expanded itsSustainability strategy, with the following key milestones:
1996• Group’s first Ethics Charter.
2001• Creation of the SolidarCité association, promoting
education and integration initiatives among employees.
• First employee opinion survey.
2003• Creation of a Group Sustainability Department.
• Establishment of an environmental reporting platform.
2004• Signature of the Diversity Charter by PPR’s Chairman
and creation of the Diversity Committee and theMission Handicap project.
2005• Signature of a partnership agreement with Agefiph, a
French association promoting job placement andvocational training for the disabled.
• Deployment of the Code of Business Practices andcreation of the Ethics and Corporate Social ResponsibilityCommittee (ECSRC).
2006• Definition of the Group’s CSR commitments.
2007• Creation of a Group Corporate Social Responsibility
Department, represented on the Executive Committeeand reporting directly to the Chairman.
• Definition of seven strategic priorities for the Groupwith respect to CSR for 2008-2010.
2008• Membership of the UN Global Compact.
• Creation of the PPR Corporate Foundation for Women’sDignity and Rights.
2009• Worldwide release of Yann Arthus-Bertrand’s documentary
Home, co-produced by EuropaCorp and Elzévir Films,and financed primarily by PPR.
2010• Launch of PPR’s Innovation and Sustainability Awards.
• Sustainability criteria included in performance evaluationsof PPR group leaders.
• Adoption of the Charter of Commitments on the qualityof life at work and the prevention of work-related stressfor employees of the PPR group in Europe.
2011• Launch of PPR HOME, a new initiative and organisation
dedicated to sustainability.
• Publication of the very first Environmental Profit & LossAccount (EP&L) by PUMA.
• Formalisation of the strategic “Gender Equality inLeadership” programme.
2012• Formalisation and publication of ambitious sustainability
targets to be achieved by the Group’s brands by 2016.
• Creation of a Sustainability Committee within the Boardof Directors.
2013• Kering was listed on the Dow Jones Sustainability World
and Europe Indices (DJSI World and Europe) and qualifiedfor the Climate Disclosure Leadership Index (CDLI) inFrance.
• Creation of the Materials Innovation Lab (MIL).
• PPR Corporate Foundation for Women’s Dignity andRights becomes the Kering Corporate Foundation, withthe slogan “Stop violence. Improve women’s lives”.
• Kering joins BTeam.
1. Sustainability at Kering
1.1. A long-standing commitment
3 SUSTAINABILITY ~ SUSTAINABILITY AT KERING
58 Kering ~ 2016 Reference Document

EP&LRollout of the Environmental Profit & Lossaccount (EP&L) across all Luxury andSport & Lifestyle brands.
• EP&L results and methodology were made public in 2015 to engage morecompanies in natural capital accountingwith the ambition of creating a collectiveapproach to support a more sustainableglobal economy.
• Significant contribution to the Natural Capital Protocol.
2012-2016 targets Achievement of target Comments
Kering releases the final report on its 2012-2016 sustainability targets
True to its commitment to transparency, and followingthe publication of a mid-term progress report in 2014, inMay of 2016 Kering published the final report setting outthe progress made and the outcomes stemming from itsambitious 2012-2016 objectives. These targets haddriven and structured Kering’s entire strategy, with the
Group consciously choosing to go beyond a traditionalapproach and extending its goals and actions to all of itssupply chains. This is reflected in the EP&L, the cornerstoneof its initiative. The Group made progress in reducing itsenvironmental footprint, even though some of theoutcomes were short of the targets set in 2012. A numberof challenges remain, such as the traceability of preciousmaterials.
1.2. 2016 highlights
2014• Extension of the EP&L process to cover the entire
Group.
• Signature by Kering of a five-year strategic partnershipwith the London College of Fashion’s Centre forSustainable Fashion to promote more sustainable andinnovative design practices in the fashion industry andamong its future practitioners.
• Kering named industry leader of the DJSI (Dow JonesSustainability Indices) within the Textile, Apparel &Luxury goods sector.
2015• Kering for the first time publishes the results of its
Environmental Profit & Loss account (EP&L) and sharesits methodology.
• Over 300 million Internet users potentially informed by theKering Foundation’s annual campaign to raise awarenessabout the fight to end violence against women.
2016 was a turning point in terms of sustainability: followingthe firm commitment made between 2012 and 2016 andthe publication of the Group’s results on those objectives,the year was in large part devoted to developing the newchapter in the Group’s 2025 Sustainability strategy andits objectives. At the same time, 2016 was also anopportunity to continue to deliver on Kering’s deep-rooted social, environmental and societal commitments,as evidenced by the publication of the 2015 EP&L results,the ambitious greenhouse gas reduction target approvedby the Science-Based Targets initiative and the proactiveparenthood policy implemented for all Group employeesworldwide.
3SUSTAINABILITY AT KERING ~ SUSTAINABILITY
100%
Leather100% of leather from domestic livestockwithin our brands’ products will be fromresponsible and verified sources that donot result in converting sensitive ecosystemsinto grazing lands or agricultural lands forfood production for livestock.
• Implementation by the brands traceabilitysystems to trace leather back to thecountry of origin, and increase in the shareof leather from countries aligned withKering standards. The objective of fulltraceability has yet to be fully achieved.
91%Bovine leather
69%Leather (Luxury)
64%Leather (Group)
PVCAll of our brands’ collections will be PVC-free.
• Replacement of PVC with other types of plastics or other materials.
99%
2016 Reference Document ~ Kering 59
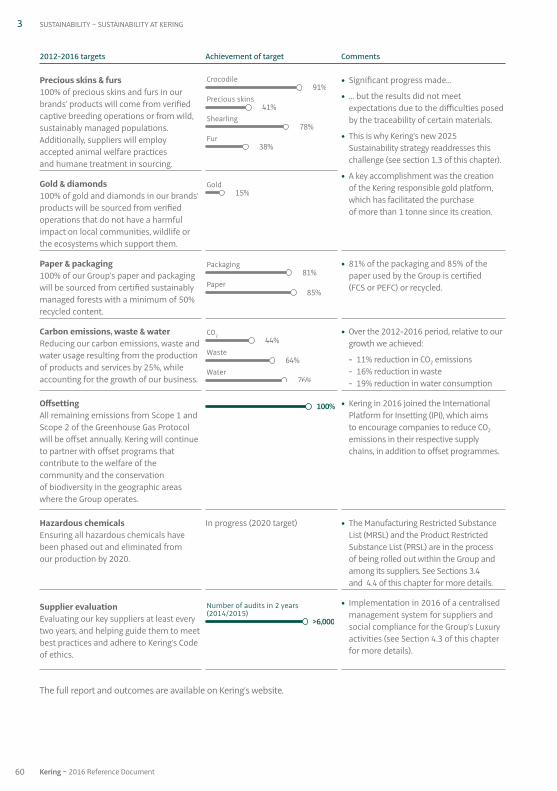
The full report and outcomes are available on Kering’s website.
3 SUSTAINABILITY ~ SUSTAINABILITY AT KERING
60 Kering ~ 2016 Reference Document
Precious skins & furs100% of precious skins and furs in ourbrands’ products will come from verifiedcaptive breeding operations or from wild,sustainably managed populations.Additionally, suppliers will employaccepted animal welfare practices and humane treatment in sourcing.
• Significant progress made…
• … but the results did not meetexpectations due to the difficulties posedby the traceability of certain materials.
• This is why Kering’s new 2025Sustainability strategy readdresses thischallenge (see section 1.3 of this chapter).
• A key accomplishment was the creation of the Kering responsible gold platform,which has facilitated the purchase of more than 1 tonne since its creation.
2012-2016 targets Achievement of target Comments
91%Crocodile
41%Precious skins
78%Shearling
38%Fur
Gold & diamonds100% of gold and diamonds in our brands’products will be sourced from verifiedoperations that do not have a harmfulimpact on local communities, wildlife orthe ecosystems which support them.
15%Gold
Paper & packaging100% of our Group’s paper and packagingwill be sourced from certified sustainablymanaged forests with a minimum of 50%recycled content.
• 81% of the packaging and 85% of thepaper used by the Group is certified (FCS or PEFC) or recycled.
81%Packaging
85%Paper
Carbon emissions, waste & waterReducing our carbon emissions, waste andwater usage resulting from the productionof products and services by 25%, whileaccounting for the growth of our business.
• Over the 2012-2016 period, relative to ourgrowth we achieved:
- 11% reduction in CO2 emissions- 16% reduction in waste- 19% reduction in water consumption
44%CO2
64%Waste
76%Water
OffsettingAll remaining emissions from Scope 1 andScope 2 of the Greenhouse Gas Protocolwill be offset annually. Kering will continueto partner with offset programs thatcontribute to the welfare of thecommunity and the conservation of biodiversity in the geographic areaswhere the Group operates.
• Kering in 2016 joined the InternationalPlatform for Insetting (IPI), which aims to encourage companies to reduce CO2
emissions in their respective supplychains, in addition to offset programmes.
100%
Supplier evaluationEvaluating our key suppliers at least everytwo years, and helping guide them to meetbest practices and adhere to Kering’s Codeof ethics.
• Implementation in 2016 of a centralisedmanagement system for suppliers andsocial compliance for the Group’s Luxuryactivities (see Section 4.3 of this chapter for more details).
>6,000
Number of audits in 2 years(2014/2015)
Hazardous chemicalsEnsuring all hazardous chemicals havebeen phased out and eliminated from our production by 2020.
In progress (2020 target) • The Manufacturing Restricted SubstanceList (MRSL) and the Product RestrictedSubstance List (PRSL) are in the process of being rolled out within the Group andamong its suppliers. See Sections 3.4 and 4.4 of this chapter for more details.

Kering is crafting tomorrow’s luxury and publishes its Sustainability strategy for the next 10 years
2016 was largely devoted to laying down the futureSustainability strategy for the coming 10 years, togetherwith a review of the 2012-2016 outcomes and theachievement of the objectives set out for that period (seeabove). This 2025 strategy rests on three pillars:
1. An environmental pillar (Care): continue to develop thebusiness while respecting planetary boundaries (1)
based on two major drivers: the EP&L approach andKering’s standards for responsible sourcing andsustainable production processes.
2. A social pillar (Collaborate): promote well-being at workand the protection of employees inside and outsidethe Group, develop talents and preserve craftmanshipskills while supporting communities that perpetuate them.
3. An innovation pillar (Create): create new opportunitiesand new business models through innovation at allstages of our value chain: design, product development,production, customer relations, service offerings, usingsustainability to create value.
There was a wide-ranging consultation and involvementof all stakeholders internally and the unprecedentedcommitment of teams from all the Group’s luxury maisons.In particular, the creative teams and management teamsfrom all of our luxury maisons were engaged under theleadership of Kering’s Chairman and Chief Executive Officer,who personally chaired the meetings and discussions withinthe various maisons. This illustrates the central position ofsustainability within the Group. The engagement processwas as significant as the creation of the strategy itself.
Kering is the first luxury Group whose carbonobjectives have been validated by the Science-Based Targets initiative
Kering is the first luxury group and the first French companyto have seen its goals of reducing its carbon footprintapproved by the Science-Based Targets (SBT) initiative. TheSBT initiative was launched jointly by the CDP (CarbonDisclosure Project), the United Nations Global Compact, theWorld Resources Institute and WWF. Its purpose is to helpcompanies set science-based greenhouse gas emissionreduction targets to ensure that the private sector takesinto account the need to limit global warming to lessthan 2°C by 2050.
Kering has accordingly made the following commitmentsfor 2025:
• reduce greenhouse gas emissions from its operationsby 50% (across all of Scopes 1 and 2 of the GreenhouseGas Protocol, as well as emissions from the shipmentand distribution of goods, the production of energy,and fuel and commercial flights);
• reduce greenhouse gas emissions from its supply chainby 40% (supply of goods and services from Scope 3 ofthe Greenhouse Gas Protocol), in line with its EP&Lobjectives.
Kering published in 2016 the results of itsEnvironmental Profit & Loss account (EP&L) for 2015 and reviews its progress since the launch of the initiative in 2012
After first releasing results for 2013 and 2014 in 2015,Kering stepped up its efforts to accelerate the cycle-timeof its EP&L, thereby making the results available to thebrands within a shorter timeframe and to be more intune with decision-making. Moreover, while the lessonsdrawn from the first two EP&L reports remain valid (mostof the impact attributable to supply chains and moreparticularly the production of raw materials and theirinitial processing), the 2015 results show a reduction ofapproximately 10% in the intensity of the Group’senvironmental impacts since 2012 (see Section 3.2 ofthis chapter for more details). Lastly, 2016 was also theopportunity to take part in the development of theNatural Capital Protocol under the auspices of theNatural Capital Coalition, and to put together and releasean educational mobile app on the concept of naturalcapital. The new app, MyEP&L, was presented to studentsfrom Parsons in the United States, Tsinghua University inChina and the London College of Fashion in the UnitedKingdom as part of educational partnerships establishedwith Kering.
Kering establishes a global parental policy for all its employees and introduces a minimumduration for maternity, adoption and paternity leave
Kering’s parenting policy provides for a minimum of 14 weeks’maternity or adoption leave on full pay for all Group employees,whatever their personal circumstances or geographicallocation, and a minimum of 5 days’ paternity or partnerleave on full pay, which in many countries represents a majorstep forward. In countries where local legislation providesfor more favourable parental leave standards, these willnaturally be applied. This measure demonstrates Kering’senduring commitment to professional equality and thebalance between personal and professional life.
Kering received the GEEIS label in 2016 for its actions in favour of gender equality
In recognition of its actions in favour of gender equality,the Group was awarded the GEEIS (Gender EqualityEuropean & International Standard) label by the Arborusendowment fund, the leading support fund for genderequality at work in Europe and worldwide, and BureauVeritas, a global leader in certification. The aim of this
3SUSTAINABILITY AT KERING ~ SUSTAINABILITY
612016 Reference Document ~ Kering
(1) The concept of planetary boundaries defines the environmental limits within which humanity can safely operate, thus avoiding abrupt and unpredictableenvironmental change.
Vision
Kering firmly believes that sustainable business is smart business. It is this commitment to the social andenvironmental dimensions that informs the Group’sSustainability strategy. Sustainability creates value andcompetitive advantage, for it enables Kering to lead withnew business models and innovative practices, whilstoften reducing costs. It is also a motivating factor for theGroup’s employees, helping to attract and retain the besttalent. Sustainability plays a key role in the strategy of theGroup’s brands. Kering serves as a catalyst, encouragingthem to develop increasingly innovative, appealing andsustainable products. Through the Kering Foundation,Kering is also firmly committed to combating violenceagainst women. With the help of its employees, thefoundation supports local NGOs, distributes grants tosocial entrepreneurs and organises awareness campaigns.
Materiality: target priority challenges
The materiality principle, which is at the heart of the Keringsustainability approach, like the EP&L, allows Kering tofocus on activities with the most impacts. This approachallows Kering to identify the key challenges matching itsvision (based on their economic, environmental and socialimpacts), and also to grasp the related governance issuesand the assessment made by the Company’s keystakeholders.
Developed in 2013 and fine-tuned in 2014 throughconsultation with a wide range of internal and externalstakeholders, the approach highlights six strategicchallenges that were central to discussions on thedevelopment of Kering’s 2025 strategy: responsiblesourcing, product quality, transparency and traceability,respect for human rights, working conditions and qualityof professional life and climate change strategy.
1.3. Vision and strategic challenges
label is to establish a joint standard allowing companies toachieve real professional equality in terms of remuneration,promotion, skills development and equal opportunity inthe various professions. It should also be noted thatwomen now make up 64% of Kering’s Board of Directors,making it one of the CAC 40 companies with the highestproportion of women Directors.
The Kering Foundation’s 2016 White Ribbon forWomen campaign to raise awareness of violenceagainst women has unprecedented impact
More than 1.1 billion people were potentially reached bythe White Ribbon Campaign For Women, renewed in 2016to mark White Ribbon Day on November 25, in partnershipwith Condé Nast International. Between November 18and 27, 2016, 50,000 badges and 180,000 stickersdesigned by Stella McCartney, a member of the Kering
Foundation’s Board of Directors, were given away in morethan 800 stores in 51 countries belonging to 10 of theGroup’s Luxury maisons. At the same time, the KeringFoundation ran a digital campaign with the hashtag#BeHerVoice to encourage everyone to play a part inending violence against women. This year, the Foundationfocused its campaign on the role of men in the fight, askingthree male personalities to present the testimonies ofwomen victims of violence supported by the Foundation.Lastly, a crowdfunding campaign was organised to encouragethe public to make donations to partner organisations forthe benefit of women victims of violence: HER Fund in HongKong, It’s On Us in the United States, Rosa UK and Women’sAid in the United Kingdom, and Maison des Femmes andFédération Nationale Solidarité Femmes in France.
3 SUSTAINABILITY ~ SUSTAINABILITY AT KERING
62 Kering ~ 2016 Reference Document

Strategy and objectives
To nurture this vision and address its priority challenges,Kering relied on a set of ambitious and quantified targetsfor the 2012-2016 period, the results of which weremade public in May 2016.
Other than the publication of these results, 2016 wasdevoted in large part to defining the future of Sustainabilityat Kering and putting together a strategy to guide itsaction in this area to 2025.
The process of developing and defining the new 2025strategy was in itself an important achievement. It was anopportunity lasting 11 months to achieve the broad andsustained involvement of all the Luxury maisons, whichwas naturally beneficial well beyond the formalisation ofthe new strategy:
• more than 100 people in-house were directly involvedin the redesign of the strategy;
• 13 Executive Committee meetings attended byFrançois-Henri Pinault, the Group’s Chairman and ChiefExecutive Officer, devoted exclusively to the Sustainabilitystrategy;
• 11 meetings between François-Henri Pinault and theartistic Directors of the Luxury maisons devotedexclusively to Sustainability issues, allowing them toshare their visions of the sustainable future of designand the collections;
• 13 workshops and roundtables organised within thebrands, bringing together operational staff fromdifferent departments;
• 4 plenary meetings of the Group Steering Committee.To build the 2025 Sustainability strategy, the Group’sExecutive Committee became the project’s steeringcommittee, with each Executive Committee membertaking up a specific topic and sponsoring thinking on itthroughout the process;
• 1 meeting of the Sustainability Committee at the Boardof Directors dedicated to the new strategy.
MATERIALITY MATRIX
3SUSTAINABILITY AT KERING ~ SUSTAINABILITY
Less important
Less
importan
t
SIGN
IFICAN
CE F
OR S
TAKE
HOL
DERS
SIGNIFICANCE FOR KERINGMore important
Mor
e importan
t
Environmental Social Economic Governance
Responsible sourcingof raw materials
Supply chaintraceability and
transparency
Climatechange
strategy
Watermanagement
WasteNatural capitalaccounting
Responsible productsand packaging
Land useand biodiversity
Human rights,workingconditions andsupplier relations
Living wagesin supply chains
Diversity andempowermentof women
Socialdialogue
Stakeholdersdialogue
Remuneration& employee benefits
Philanthropy andemployee volunteering
Product quality
Customersatisfaction
Preservationof craftsmanshipFinancial
objectives
Economic benefitsfor local communities
Ethics andcompliance
Public policies
Corporategovernance
Responsible communicationand marketing
Promoting sustainableconsumption Quality of life
at work, healthand safety
Talent attraction,development & retention
632016 Reference Document ~ Kering

CREATE new business models
√ Invest in disruptive innovations that can transform conventional processes in luxury, andinfluence the industry.
√ Develop new and sustainable solutions for sourcing raw materials, including exploringbiotech and promoting a circular economy through turning recycled textiles into newclothing.
√ Scale up an internal purchasing platform to provide access to high-quality, sustainableraw materials.
√ Stimulate and enable innovation to translate vision into action through internal governance.
√ Establish a Young Leaders Advisory Group for inspired ideas.
3 SUSTAINABILITY ~ SUSTAINABILITY AT KERING
64 Kering ~ 2016 Reference Document
COLLABORATEwith people
√ Support the continuation of craftsmanship traditions and the communities that supportthem.
√ Extend focus across the supply chain and improve community livelihoods where rawmaterials are sourced.
√ Develop an industry-leading performance metric system that will measure achievement ofthe UN Sustainable Development Goals.
√ Leverage current partnerships with leading universities and continue to developcollaborations to identify sustainability solutions.
√ Amplify forward-thinking employment practices, including the global parental policylaunched on January 1, 2017, a well-being at work policy by 2018, and an employee benefitspolicy by 2020.
√ Achieve gender parity at all levels.
√ Establish sponsorship and mentoring programmes, and develop innovative career pathsfor all employees.
√ Aim to be the preferred employer in the luxury sector.
CARE for the planet √ Use resources within the “planetary boundaries”, with a science-based approach in orderto reduce carbon emissions from Kering’s business activities by 50% in Scope 1, 2 and 3(1)
of the GHG Protocol by 2025.
√ Further address all supply chain environmental impacts with the goal to reduce Kering’sEnvironmental Profit and Loss (EP&L) account by at least 40%, including the remainingcarbon emissions(2), and going beyond to also include water use, water and air pollution,waste production and land use.
√ Create a “Supplier Index of Sustainability” and ensure Kering’s high standards for rawmaterials and processes are implemented by suppliers at 100% by 2025, which alsoraises the bar on traceability, animal welfare, chemical use and social welfare.
√ Promote sustainable design and minimise the environmental impact of a product atevery stage, from sourcing and manufacturing to transportation and consumer use, andcreate an open-sourced tool to assess products based on Kering’s standards.
√ Establish a Materials Innovation Lab (MIL) focused on watches and jewelry, following on thesuccess of Kering’s MIL for fabrics and textiles in offering access to sustainable alternatives.
√ Expand offsetting commitments to include a new “insetting” approach in order to ensurethat actions across the supply chain deliver climate benefits as well as social value.
(1) Emissions from upstream transport and distribution, business air travel and fuel and energy related emissions in Scope 3.(2) All Scope 3 emissions from purchased goods and services all the way back to raw materials at Tier 4.

The means for managing and monitoring progress onthis strategy have been set out:
• the Kering corporate structure is in charge of themanagement and follow-up of the 2025 strategy. Aprogress review will be conducted by the ExecutiveCommittee, whose members retain their individualroles as sponsor of a key challenge. One ExecutiveCommittee meeting is to be devoted exclusively to thesubject every year;
• twice yearly, a workshop dedicated to the 2025 strategyrollout will be organised with the Young Leaders AdvisoryGroup;
• within the Luxury brands, two management or ExecutiveCommittee meetings will review outcomes and theachievement of the objectives, making it possible toadjust action plans as needed. The system is completed byan annual workshop in each maison and a formal pointof contact between the brand Chairman and CEO andKering’s Chief Sustainability Officer.
The achievement of these targets is factored into thecalculation of the remuneration of the Group’s leaders,accounting for up to 10% of their variable portion.
This strategy allows the Group to be aligned with the UnitedNations’ new framework as defined in the 17 SustainableDevelopment Goals (SDG), which are now a commonreference in the structuring of sustainability approaches,for the private sector as well as for governments, civil societyand citizens, thereby recognising the indispensableinvolvement of stakeholders throughout society in theservice of the common good. More specifically, while webelieve that Kering can contribute directly or indirectly invariable proportions to each of the 17 SDGs, both nearand far (in other words close to its operations orupstream – and sometimes very far upstream – in itsvalue chain), one can nevertheless identify seven SDGs forwhich Kering can make a stronger mark than elsewhere:
SDG #3: Good health and well-beingProduct quality and consumer health, phase-out ofchemicals of concern, anthropo-centred approach to theEP&L taking into account the impacts of environmentaldegradation on local populations, in particular theirhealth and quality of life, well-being at work.
SDG #5: Gender equalityAmbition in terms of gender equality, parenthood policy,action by the Kering Foundation to fight violence againstwomen.
SDG #6: Clean water and sanitationUse of the EP&L approach taking into account local levelsof water stress, tanning without chromium and withoutheavy metals, participation in the ZDHC and LWG groups,development of the use of vegetable dyes.
SDG #8: Decent work and economic growthCode of ethics and fundamental commitments to respect
human rights, organisation devoted to social compliance,programme of collaboration with suppliers and subcontractors,preservation of know-how.
SDG #12: Responsible consumption and productionProduct design and choice of materials and their provenanceat the heart of the Group’s sustainability ambition(responsible sourcing and Kering standards), developmentof production methods with reduced environmentalfootprints and positive social impacts, goal of developingmore programmes in the circular economy.
SDG #13: Climate actionEnvironmental accounting and active participation indiscussions around natural capital, ambitious carbonfootprint reduction and science-based targets, measurementof the environmental footprint well beyond the company’s“borders”, participation in the promotion of insetting.
SDG #15: Life on land Animal welfare and responsible husbandry practices,responsible sourcing, traceability of materials, protectionof biodiversity, control of greenhouse gas emissions andair pollution.
Governance and organisation
Kering’s Sustainability Department defines the Group’sSustainability strategy and policies, and supports the Group’sbrands by operating as a resource platform, acting as asounding board, setting out and building on the initiativestaken individually by each brand. More than 15 specialists,who report to the Group’s Chief Sustainability Officer, amember of the Executive Committee, assist the brands withthe implementation of the Group’s Sustainability strategyby systematically looking for potential synergies andcontinuous improvement. In addition, each brand has atleast one Sustainability Lead and for the larger brands, entiresustainability teams. As a result, Kering has close to 60 peoplededicated to sustainability.
The degree of integration of sustainability at the core ofthe Group’s business is evident. Since 2015, sustainabilityhas been on the agenda of one of the four quarterlyBusiness Reviews during which each brand presents itsroadmap to Kering executives, along with an overview ofthe resources it has dedicated to sustainability and theprogress made by their brand.
As concerns governance, a Sustainability Committee,established in 2012 at Board level, provides advice onand guides the Group’s Sustainability strategy. Comprisedof four Directors (François-Henri Pinault, Jean-FrançoisPalus, Daniela Riccardi and Sapna Sood), the Committeemet twice in 2016 to review the results and outcomes ofthe objectives for the 2012-2016 period and to promotethinking on the Advance 2025 strategy.
In addition, a committee to be known as the YoungLeaders Advisory Group will be set up in 2017 to craft aninnovative and creative approach in the development of
3SUSTAINABILITY AT KERING ~ SUSTAINABILITY
652016 Reference Document ~ Kering
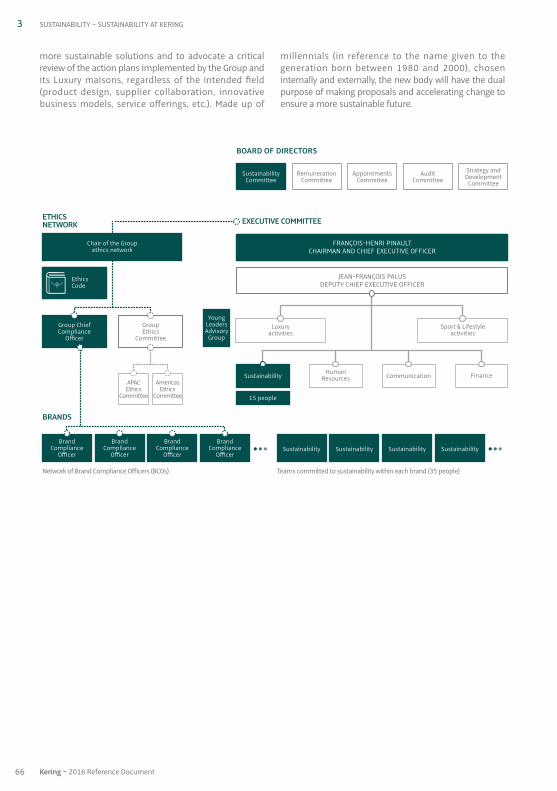
more sustainable solutions and to advocate a criticalreview of the action plans implemented by the Group andits Luxury maisons, regardless of the intended field(product design, supplier collaboration, innovativebusiness models, service offerings, etc.). Made up of
millennials (in reference to the name given to thegeneration born between 1980 and 2000), choseninternally and externally, the new body will have the dualpurpose of making proposals and accelerating change toensure a more sustainable future.
3 SUSTAINABILITY ~ SUSTAINABILITY AT KERING
66 Kering ~ 2016 Reference Document
ETHICSNETWORK
FRANÇOIS-HENRI PINAULTCHAIRMAN AND CHIEF EXECUTIVE OFFICER
JEAN-FRANÇOIS PALUSDEPUTY CHIEF EXECUTIVE OFFICER
Sustainability
15 people
Finance
Luxuryactivities
Sport & Lifestyleactivities
Strategy andDevelopmentCommittee
AuditCommittee
AppointmentsCommittee
RemunerationCommittee
SustainabilityCommittee
BOARD OF DIRECTORS
Sustainability Sustainability Sustainability Sustainability
BRANDS
EXECUTIVE COMMITTEE
Teams committed to sustainability within each brand (35 people)
YoungLeadersAdvisory
Group
HumanResources Communication
Chair of the Groupethics network
Group ChiefCompliance
Officer
EthicsCode
GroupEthics
Committee
AmericasEthics
Committee
APACEthics
Committee
BrandCompliance
Officer
BrandCompliance
Officer
BrandCompliance
Officer
BrandCompliance
Officer
Network of Brand Compliance Officers (BCOs)

• 40,052 employees as of December 31, 2016, 58.07% of whom are women;
• 90.9% of employees on permanent contracts;
• 50.9% of Group managers are women;
• 11.5% of permanent employees work part time;
• 35.3 years is the average age of permanent employees;
• 5.5 years is the average length of service of permanentemployees;
• 413 workers with disabilities;
• 423,194 hours of training, or 23,468 employees trained;
• 11,561 permanent employees hired;
• 361,465 tonnes of CO2 attributable to energy consumption(42.6%) and transport (57.4%);
• 27.7% of electricity consumed is generated usingrenewable resources;
• Kering published its 2015 EP&L and has developed amobile application to raise awareness among as manypeople as possible (MyEP&L);
• more than 10% reduction in the Group’s environmentalimpacts (€ EP&L / € revenue) between 2012 and 2015;
• 2,768 social audits carried out among the Group’ssuppliers;
• over 1.1 billion people potentially reached by the KeringFoundation’s annual White Ribbon For Women campaignto raise awareness about violence against women.
Index 2014 score 2015 score 2016 score
DJSI 78 / 100 83 / 100 83 / 100
CDP Carbon 95 A 99 B A-
CDP Water NS B B
CDP Forest NS NS A- (Leather) B (Wood)
NS: Not scored.
1.5. Key figures
In recognition of its Sustainability strategy and its keyachievements, Kering reaffirmed its position among theleaders in its sector in terms of the evaluation of non-financial rating agencies in 2016.
• DJSI (Dow Jones Sustainability Indices): for the thirdconsecutive year, Kering was featured in the prestigiousDJSI World and Europe indices. Created in 1999 by S&PDow Jones Indices in conjunction with RobecoSAM, theseindices distinguish, out of a panel of 2,500 companiesrepresenting the largest market capitalisations, 10% ofcompanies in each industry with the best performancein terms of sustainability. In 2016, Kering rankedsecond in the textile, clothing and Luxury goods sector.
• CDP: with nearly 2,000 companies responding eachyear, CDP is now the world reference in terms of carbonstrategy ratings. In 2016, Kering reached Leadershiplevel in the new CDP rating with a score of A-, thereby
maintaining its lead within its sector. Moreover, Keringreached the Leadership A- level in recognition of itswork to limit deforestation risk associated with the use of leather, and Management B level for its waterstewardship and its management of wood derivativessuch as viscose.
• Global 100: for the second consecutive year, Keringfeatured in the Global 100 ranking of the 100 mostsustainable companies worldwide. This ranking, createdby Corporate Knights magazine in 2005, is unveiled atthe World Economic Forum in Davos each year. Kering wasthe only luxury group in the Global 100 ranking, and rankedsecond in the Textile, Apparel & Luxury goods sector.
• Other SRI indices: Kering has been included in themain benchmark indices: FTSE4Good, Euronext VigeoEurozone 120 Ethibel Sustainability Index Excellence,MSCI Global Sustainability Indexes, Oekom Prime, etc.
1.4. Recognition and inclusion in SRI (1) indices
3SUSTAINABILITY AT KERING ~ SUSTAINABILITY
672016 Reference Document ~ Kering
(1) Socially Responsible Investing.

2.1. The Group’s human resources profile(1)
2.1.1. Breakdown of the workforce
The total workforce at December 31, 2016 was 40,052 employees, an increase of 3.2% or 1,251 employees.
Changes stemmed primarily from business development, particularly the establishment of growing brands in newmarkets and the opening of new stores.
Breakdown of the workforce as of December 31, 2016 (Men / Women managers, Men / Women non-managers)by region (2)
Managers Non-ManagersWomen Men Women Men
2016 2015 2016 2015 2016 2015 2016 20 15
Africa 30 28 41 49 159 132 142 114Asia / Middle East 1,129 1,071 1,004 941 6,971 6,755 3,625 3,400Eastern Europe 105 109 70 72 629 627 583 572France 633 611 382 358 986 962 560 550North America 660 623 554 554 2,442 2,547 2,086 2,270Oceania 55 44 39 36 332 269 212 227South America 131 128 204 202 725 725 1,353 1,327Western Europe 953 868 1,267 1,192 7,319 6,954 4,671 4,484
TOTAL 3,696 3,482 3,561 3,404 19,563 18,971 13,232 12,944
Kering helps its employees reach their potential andexpress their creativity by developing their skills andperformance in the most imaginative way possible. TheGroup provides its brands with the support necessary fortheir growth, promoting the sharing of and access to bestpractices, and encouraging the development of talentsfor the benefit of all brands. Kering encourages the poolingof expertise and the creation of synergies. In today’s worldof fast-changing markets, competition and customerneeds, finding and retaining the best talent is a strategicchallenge. Kering’s human resources policy continues tocultivate human and cultural diversity so as to give theGroup an economic and competitive advantage. It isdesigned to offer each employee development opportunitiespermitting them to contribute to achieving the Group’sstrategic priorities.
In 2016, Kering rethought its Sustainability strategy forthe years to 2025, and established its human resourcespriorities: develop talent, preserve craftsmanship, andpromote well-being at work and employee commitment. Theyear was also more specifically devoted to implementingways to better develop talent and give each employee avision of the Group through comprehensive, innovativeand inclusive policies, resources and tools. On top ofconcrete initiatives designed to promote the developmentof talents, programmes in favour of diversity, gender equalityand well-being at work are also encouraged. Launched onJanuary 1, 2017, the global parental policy means thatparents, regardless of their brand or the country in whichthey work, enjoy the same conditions.
2. Supporting our employees
3 SUSTAINABILITY ~ SUPPORTING OUR EMPLOYEES
(1) For each social indicator presented, 2016 data have been restated to take into account the change in the Group’s Scope of consolidation in 2016. Furthermore,the rate of coverage calculated as a percentage of the Group’s workforce as of December 31, 2016 is 100% for all indicators, with the exception of the number ofworkers with disabilities, which is 83.3% (excluding the United Kingdom and the United States).
(2) The table showing the breakdown by region includes the following countries and territories: Africa: South Africa; Asia / Middle East: United Arab Emirates, China,Guam, Hong Kong, India, Japan, South Korea, Israel, Kuwait, Macau, Malaysia, Qatar, Singapore, Turkey, Taiwan, Vietnam; Eastern Europe: Czech Republic,Estonia, Hungary, Lithuania, Poland, Romania, Russia, Serbia, Slovakia, Ukraine; France; North America: Canada, United States; Oceania: Australia, New Zealand;South America: Aruba, Argentina, Brazil, Chile, Mexico, Peru, Uruguay; Western Europe: Austria, Belgium, Switzerland, Germany, Cyprus, Denmark, Spain, Finland,United Kingdom, Greece, Ireland, Italy, Monaco, Malta, Netherlands, Norway, Portugal, Sweden.
68 Kering ~ 2016 Reference Document

2.1.2. Establishing a long-term hiringpolicy through internationalpartnerships
Recruiting the best talent by encouraging diversity,training young people in craft skills, and integrating anddeveloping talent are central to Kering’s human resourcesstrategy.
Forging strategic partnerships
To this end, Kering continues its policy of internationalpartnerships with prestigious schools worldwide.
In 2016, Kering continued its partnership with the Centrefor Sustainable Fashion at the London College of Fashion.The aim of this strategic partnership is to support theplace of sustainability in tomorrow’s fashion. A specificcurriculum has been developed. Open to students from arange of disciplines, it is geared towards enabling them toacquire both sound knowledge and practical experiencespanning every stage of the creative process. The Groupalso gives a chance to young talents through partnership
with organisations such as Vogue Italia and Parsons TheNew School for Design for internships, or the RoyalCollege of Art, through Brioni, for contests in the field ofsuit making and an internship programme. Lastly, theGroup and its brands work to develop ties with numerousinstitutions, building on the close relationships developedby Kering’s entire HR community worldwide, including theInstitut Français de la Mode, Istituto Marangoni, Politecnicodi Milano, Bocconi University, Tsinghua University, HongKong Polytechnic University and Columbia University.
In 2016, Kering strengthened the partnership, started in2010, with HEC Paris School of Management’s Luxury Chair.The Luxury certificate is a unique programme that aims to helpfuture leaders learn how best to handle luxury managementbrand challenges. It was built on five pillars in 2016: basiccourses, more in-depth theme-based teaching, a businessgame, a series of practical seminars facilitated by leadersor members of the executive Committees of Kering and itsbrands, as well as store visits and workshops, and a teamconsulting project on a topic set by Kering, the findings ofwhich were presented before a panel consisting of the
Change in the regional breakdown of the workforce between December 31, 2015 and December 31, 2016 (non-proforma data)
Age structure of the permanent workforce in 2016: managers & non-managers
3SUPPORTING OUR EMPLOYEES ~ SUSTAINABILITY
2016 Asia/Middle East 31.8%Eastern Europe 3.5%
North America 14.3%Oceania 1.6%
South America 6.0%
WesternEurope35.5%
France 6.4%Africa0.9%
2015 Asia/Middle East 31.4%Eastern Europe 3.6%
North America 15.4%Oceania 1.5%
South America 6.1%
WesternEurope34.8%
France 6.4%Africa0.8%
50% 40 30 20 10 00 10 20 30 40 50 %
< 25 0.19%
2.41%
9.02%
5.94%
1.35%
0.57%
0.20%
10.88%
23.43%
27.34%
12.43%
3.52%
2.00%
0.72%
25-30
31-40
41-50
56-60
51-55
> 60
< 25
25-30
31-40
41-50
56-60
51-55
> 60
Age
Non-ManagersManagers
692016 Reference Document ~ Kering

Hires
BREAKDOWN OF FIXED-TERM AND PERMANENT CONTRACTS AMONG NEW HIRES
Of the 11,561 employees hired in 2016, 57.9% were women and 89.5% were non-managers. The Kering group also hada monthly average of 1,389 temporary employees across all of its brands in 2016.
BREAKDOWN OF PERMANENT EMPLOYEE DEPARTURES BY CATEGORY
Departures of permanent employees, on all grounds, totalled 10,319 in 2016, of which 8,210 at the employee’sinitiative (79.56% of departures) and 1,230 dismissals (11.92% of departures).
certificate’s academic co-directors and Kering managers.This partnership allows Kering to play a role in thetraining of future high-level talents from diversebackgrounds, and to identify any talents among themthat have the potential to join the Group and its brands.In 2016, 40 students from 14 different nationalities tookthis programme.
Recruiting the best professionals
In addition to partnerships with schools, the Group alsomakes its resources available to brands to promote theirbusiness and opportunities. Kering UK organised a RetailTalent Day in London in October 2016. Approximately 20 representatives of various brands were present at theevent, and potential candidates took part in thematicworkshops designed for store managers and salesconsultants. Eleven brands took part in the event, whichput them in contact with 150 professionals.
3 SUSTAINABILITY ~ SUPPORTING OUR EMPLOYEES
2016 Permanent contracts 71.50%
Fixed-termcontracts 28.50%
2015 Permanent contracts 72.33%
Fixed-termcontracts 27.67%
2016 2015
Other0.21%
Redundancy3.48%
Termination at theemployer’s initiative11.92%
Retire-ment
0.59%
Terminationby mutualagreement4.24%
Terminationby mutualagreement4.29%
Termination atthe employee’s
initiative79.56%
Termination atthe employee’s
initiative81.23%
Redundancy3.95%
Other0.14%
Termination at theemployer’s initiative9.61%
Retire-ment
0.78%
70 Kering ~ 2016 Reference Document

• Total Group payroll in 2016: €1.67 billion.
• €76.136 million in employer contributions from thebrands in Metropolitan France in 2016.
Kering’s remuneration policy
Remuneration is a key component that managers can useto reward the commitment and the individual and collectiveperformance of their teams. The pay structure and itsmanagement are based on guidelines set by the Group.Accordingly, all employees belonging to a sales team orexercising a certain level of responsibility receive avariable component on top of their fixed wage. As aresult, almost 90% of the Group’s employees receivevariable remuneration subject to the achievement ofindividual and / or collective objectives. Efforts are madeto ensure that the amount of fixed wages of eachemployee is both fair internally and competitive withinthe market. It is reviewed annually on the proposal of linemanagers. Pay rises are granted in accordance with thelevel of the wage already achieved in comparison withpeers and / or the external market, factoring in performanceover a long enough period of time and the potential fordevelopment. They are determined independently of anyconsideration whatsoever of gender or age. The individualshare of variable pay is determined and managed withinthe system of annual performance appraisals. Goals are setand discussed with the line manager, as is the assessmentof their level of achievement.
Executive pay
The remuneration of the Leadership Group comprisingthe Group’s 300 senior executives is monitored by the Group’sHuman Resources Department, with the aim of ensuringconsistency and competitiveness in light of industrypractice. The structure of remuneration for senior executives(base pay, short-term variable remuneration, long-termprofit-sharing) is set out by the Group based on their levelof responsibility. The policy for short-term variableremuneration (annual bonus) aims to reward seniorexecutives for meeting objectives – in part financial andin part individual – set in line with the strategy of the
Group and the brands. Financial performance is assessedon the basis of two indicators, one dedicated tomeasuring profitability (EBIT) and the other assessing thequality of the free cash flow of the Group and the brands.Moreover, some individual objectives set for seniorexecutives are also related to the achievement of theGroup’s Sustainability objectives. Long-term profit-sharing granted to the Group’s senior executives in 2016draws on the system set up in 2013. The goal is twofold:to compensate executive teams for their performanceover time, and reward them for their loyalty. The amountsgranted and the means used (Kering Monetary Units andCash Plans) are directly linked to the position held by thebeneficiary and the level of his or her responsibility withinthe Group. At the end of a three-year vesting period, KeringMonetary Units received by executives can be exchangedon two occasions over each of the subsequent two years.Executives benefiting from a Cash Plan receive all or part ofthe corresponding payment, subject to the achievementof the three-year EBIT and free cash flow objectivesdetailed in the award. As regards the remuneration ofDirectors and executive corporate officers, the Board ofDirectors complied with the say-on-pay requirements setout in the revised AFEP-MEDEF Code in its proposals tothe Annual General Meeting of April 29, 2016.
Employee benefits within the Group
In addition to monetary remuneration, the Kering group hasalways valued the social benefits offered to its employeesthrough healthcare, disability / life and pension benefits.Therefore, virtually all employees have supplementaryinsurance coverage in addition to coverage provided by lawthrough the various schemes put in place by the Group’sbrands.
Some brands (Gucci, Bottega Veneta and Pomellato inItaly, as well as PUMA) have for several years offered morecomprehensive benefit schemes allowing employees tobalance their work and personal lives. Such schemesoften take the form of an offer of education, recreation,transport or family support. Very popular, they are constantlychanging to better meet employees’ expectations.
2.2. Remuneration and employee benefits
2.1.3. Supporting responsible changewithin the organisation
In 2016, Kering pursued its policy of supporting andredeploying employees, striving to help employees findother positions within the Group. In France, this policyinvolves support from the Social Development Coordination,a body of brand HR representatives led by Kering’s HumanResources Department, for individual redeployment
solutions. It aims to assist employees when an organisationalchange (such as a store transfer or closure) is liable tohave an impact on jobs.
In all countries and for all brands, when departures arebeing considered following reorganisations, the effortsmade to find employees another position go beyondwhat is required by law, and priority is given to voluntarymeasures where possible.
3SUPPORTING OUR EMPLOYEES ~ SUSTAINABILITY
712016 Reference Document ~ Kering

Kering’s Code of ethics, the foundation for ethics within the Group and for all employees
Set out since 1996 in the Group’s first Ethics Charter,Kering’s ethical principles apply to everyone within theGroup and reflect the Group’s strong convictions aboutbusiness practices. Kering’s Code of ethics, which wasestablished in 2005 and first updated in 2009, wasoverhauled again in 2013. It fits in firmly with the majorinternational reference texts (United Nations UniversalDeclaration of Human Rights, European Convention onHuman Rights, the main conventions of the InternationalLabour Organization, OECD Guidelines for MultinationalEnterprises, United Nations Convention on the Rights ofthe Child, United Nations Global Compact) and demonstrateshow the Group continually strengthens its commitmentsand the systems in place to ensure compliance.Sustainability for Kering is not attainable without theCode of ethics, which is used as the sole set of standardsimplemented by all throughout the Group, regardless oftheir level of responsibility, position held or location. TheCode of ethics is available in the 12 most widely spokenlanguages in the Group on the Group’s intranet, and onKering’s website for readers outside the Group.
An ethics structure reinforced in late 2013 and again in 2015
Initially based on a single body (ECSRC – Ethics andCorporate Social Responsibility Committee, set up in2005), the ethics organisation has since late 2013 drawn onthe work of three Ethics Committees, a Group committeeand two regional Committees (Asia-Pacific and theAmericas), thereby dovetailing with the Group’s policy ofdelegating responsibility to ensure the existence ofbodies that can act effectively in the light of actual operatingconditions, within a shared reference framework appliedthroughout the Group.
Each of the three Committees is made up of representativesfrom Kering and representatives from the Group’s brandsto ensure greater diversity. Employees are able to call onthese Committees to request clarification or ask aquestion regarding the interpretation of the Code, if theyare unsure how to behave in a specific situation or if theywish to submit a complaint to the Committee for allegednon-compliance with one of the principles of the Codefor examination.
An ethics hotline was also set up for all Group employeesin their country or area of operation. The hotline assiststhe Ethics Committees in reporting information,questions and complaints from employees and can becalled by anyone in the Group who prefers this systemover contacting one of the three Committees directly.
The Compliance structure, established in 2015 and led bya Group Chief Compliance Officer (CCO) backed up by aninternational network of Brand Compliance Officers (BCO)appointed by the CEOs of each brand, assists and guidesemployees at all levels of the Group to ensure compliancewith prevailing legal requirements, including thoserelating to the fight against corruption and those relatingto competition law. The full range of the complianceprogramme’s procedures was developed in 2016:
• approval of the anti-corruption policy and associatedprocedures: gifts, hospitality, entertainment and travelprocedure, gifts and sponsorship procedure, procedurefor participation in professional associations, conflict ofinterest procedure, third-party audit procedure;
• approval of competition law policies in force andrelated procedures: competition law policy for Europe,competition law policy for the APAC region, competitionlaw policy for the Americas region, procedure forparticipation in professional bodies.
2.3. Promotion and respect of ethics within the Group
On January 1, 2017, Kering established a comprehensivepolicy for parenting that guarantees all parents in the Group,regardless of their personal circumstances, 14 weeks’maternity or adoption leave and 5 days’ paternity leave.
Profit-sharing, incentive and employee savingsagreements
In accordance with national legislation, almost all of theGroup’s employees in France benefit from profit-sharingand incentive schemes governed by agreements specificto their legal entity. Tax and payroll deductions may applyto the amounts derived from these schemes in accordancewith the applicable regulations.
3 SUSTAINABILITY ~ SUPPORTING OUR EMPLOYEES
72 Kering ~ 2016 Reference Document
Developing talent and skills is at the heart of Kering’shuman resources policy. The policy focuses on two mainareas:
• setting up talent Committees at Group level with all thebrands to share the knowledge of our talents andenhance mobility;
• establishing Group programmes and tools for thebrands, especially in terms of training, with the launchof My Kering hub in 2016.
2.4.1. Manage and support talent, andfoster mobility and professionaldevelopment within the Group
Kering has set itself the priority of better identifying anddeveloping talent, and has for this purpose establishedprocesses and tools geared towards better identifyingtalent, and helping employees constantly expand theircareer prospects and strengthen their skills throughmobility and career opportunities.
2.4. Enhancement of talent and skills
Training employees on ethics and asking theright questions when dealing with situationsand dilemmas they may face at work
A training programme on ethics and the related Code wasestablished for all Group employees worldwide andimplemented throughout Kering in 2014.
Available in nine languages, it sets out the ethical groundrules in place at Kering, and presents case studies andethical dilemmas that help employees ask themselvesthe right questions. It is updated annually, and covers allthe principles of ethics upheld by the Group’s Code ofethics, with a module dedicated to the fight againstcorruption. The topics covered in 2014 includedcorruption, fraud, conflicts of interest and theconfidentiality of information on social media. In 2015,the programme covered topics related to diversity,corruption, respect for human rights and protection ofthe environment. In 2016, the programme’s third year,the agenda covered the themes of corruption, conduct inthe workplace, responsible sourcing and traceability ofraw materials, and lastly compliance with businessconfidentiality, in a campaign limited to six weeks so asto increase its impact and improve monitoring. It wasbacked up by a broad multi-language communicationcampaign on the Group’s intranet. Over 80% of Groupemployees worldwide were trained.
In September 2016, the Group began working on the2017 edition. The aim was to bring in content that was
relevant to all, addressing the key messages on ethicswithin the Group, while at the same time differentiating itso as to match the various situations and dilemmasencountered depending on the profiles of the employeesinvited to attend the training, with a view to giving it themost tangible foundations possible for everyone. Thetopics cover the fight against corruption, conduct in theworkplace and respect for the environment.
49 requests in 2016
Over the course of the various meetings held in 2016,Kering’s three Ethics Committees handled 49 requests(26 complaints and 23 questions / requests from employeeswho wanted to make sure that they had properlyunderstood the Code’s provisions on a specific topic orwho wished to report a potential conflict of interest or thereceipt of a gift). These issues were brought to theattention of the Committees either directly or through theethics hotline.
For each complaint, an enquiry involving both sides wasconducted under the responsibility of the Committeecontacted. Three violations of the Code have been identifiedto date, bearing in mind that five cases were still underinvestigation at the end of 2016. The other enquiries didnot show a failure to comply with the Code of ethics; rather,they generally revealed management issues.
3SUPPORTING OUR EMPLOYEES ~ SUSTAINABILITY
732016 Reference Document ~ Kering

Identifying and developing the talent of all,supporting future leaders and organisingsuccession plans
Talents are identified through the performance appraisalprocess and through talent reviews.
For all Group Leaders and corporate teams, the digitaland global People Performance and Developmentprocess initiated in 2015 was designed not only for theannual performance appraisal, but also to foster managerialdialogue throughout the year.
To complement this Group approach, the brands have setup their own systems for their employees. These systemsfollow the very same logic and serve the same objectives.
Once talents have been identified, the aim is to gain aclearer picture of talent and to draw up succession plans andsupport initiatives needed in terms of the organisationand its development. Group Talent Committees bringingtogether all the Directors of Human Resources of thebrands were set up in 2016. They meet at regular intervals.They provide a venue for sharing, with a commonvocabulary, the pool of talent existing within the Groupand the brands. They serve to lay down developmentplans and to build succession plans across the Group toensure the effectiveness of the organisation.
Promoting mobility and careers within the Group and its brands
Professional mobility is a pivotal means to help developskills, offer career prospects and give everyone theopportunity to grow within the Group.
Since its launch in July 2013, the internal mobility platformon the 360° Group intranet has been central to themobility system. Its aim is to allow employees to view jobopportunities, published by each brand within the Group.
In 2016, over 2,500 job vacancies were posted on theplatform, and approximately 100 employees took advantageof internal mobility opportunities made possible directlythrough it. All the brands are present on the platform andpost job offers to provide greater visibility for theirorganisation and possibilities for career development.
Brands have also developed specific programmes forRetail talent. Saint Laurent has developed successionplans offering positions with trial status to help identifythe best talent and assist people as they take up theirnew jobs.
2.4.2. Developing a structured trainingpolicy for all employees
In 2016, the Kering group devoted a budget of €17.83 millionto employee training, corresponding to 1% of the totalGroup payroll. On this basis, 423,194 hours of training(excluding safety training) were provided across the Keringgroup brands in 2016, and 23,468 employees took atleast one training course. One in two employees receivedtraining in 2016.
Women accounted for 56.3% of the workforce trained in 2016(excluding safety training). Furthermore, 79.2% of employeestrained in 2016 were non-managers.
In light of the brands’ new operations and Kering’s newprojects, the significant increase in the number of peopletrained and the number of training hours illustrates theGroup’s desire to give employees the means to developand to assist new staff members.
3 SUSTAINABILITY ~ SUPPORTING OUR EMPLOYEES
74 Kering ~ 2016 Reference Document

The Kering Learning Community, the Group’s steering body for training
Group programmes each year bring together numeroustalents from all brands, regions and functions. Each brandalso develops an offer tailored to its specific challenges.Within this process, the Kering Learning Communitycombines various Directors and Learning & Developmentmanagers of the brands, the regions and Kering corporate.
It is a community that develops and shares a commonframework for the inter-brand co-development of trainingoffers that is both decentralised and coherent. The regionscontribute to adapting the offer to the local needs ofeach geographical area.
Within this common framework, three key priorities havebeen developed for the Group:
1. The Empowering Imagination course, a developmentprogramme that aims to share the values and ambitionsof the brands and the Kering group for talentoccupying key functions or called upon to take addedresponsibility.
2. The managerial training offer, a multi-brand trainingoffering designed to support the development ofemployees taking up managerial responsibilities.
3. An Open Learning culture, to encourage more peopleto be actors in their own development.
TRAINING (EXCLUDING HEALTH AND SAFETY), PERMANENT CONTRACTS, FIXED-TERM CONTRACTS
3SUPPORTING OUR EMPLOYEES ~ SUSTAINABILITY
752016 Reference Document ~ Kering
2016
23,468 people received training, 58.59% of the workforce
20,628 people received training, 53.16% of the workforce
Non-managers 79.18%
Women 56.28%
Managers 20.82%
Men 43.72%
2015 Non-managers 79.17%
Managers 20.83%
Women 57.23%
Men 42.77%

At the same time, dissemination and transmission of“business” expertise and functional know-how areorganised by entities specialised in each area, such as theRetail Academy in the field of training designed for store-based employees.
1. Empowering Imagination course
The objective of this course is to support the developmentof the Group’s talents. It offers opportunities for sharingthe culture and strategy of the brands and the Keringgroup as a whole. It also allows participants to developtheir professional network between brands, functionsand regions, forging a sense of belonging to the Group.
The Talent Reviews conducted annually by the brandsand the Group serve to identify future participants inmajor international programmes (Kering Leadership andKering Influence). Close attention is paid to the diversityof the Groups formed (cultural, functional, geographic,gender, brand, etc.).
Kering Leadership
Composed of three four-day modules held over 12 months,the Kering Leadership programme each year bringstogether approximately 25 leaders in a multiculturalcontext. The class of 2016 consisted of 10 differentnationalities from 14 brands and Group entities.
The first module, We are Kering, which gets the programmerolling, is an important moment of understanding andexchange about the Group’s vision, challenges andtransformation projects through dialogue sessions withmembers of Kering’s Executive Committee and the headsof the various brands.
The second module is organised in partnership with theColumbia Business School in New York. It seeks to fosterimproved leadership practice through teaching byrenowned professors, talks by entrepreneurs from thedigital economy and the organisation of co-development
workshops drawing on each participant’s experience. Thisleadership development also features a significant individualdimension with the completion of a 360° feedbackprogramme by each participant upstream of the course.
Kering Leadership ends with a third module in the formof complete immersion in a business project with strongties to the Group’s social and environmental commitments.For its ninth year, which ended in 2016, the course wascompleted by a true to life social entrepreneurship projectin China, backed by the Kering Foundation.
Kering Influence
Starting in 2015, the Group has developed a new internationalprogramme known as Kering Influence, targeting youngleaders in the Group. This training, which comes upstreamof Kering Leadership, is a first step for the development ofleadership. Each participant takes away a personalunderstanding of his or her own style of leadership. Peercoaching and role play are used to foster communicationand leadership influence practice.
360° feedback “on demand”
This system is designed above all for executives facing anew professional challenge such as taking up a newstrategic function.
Using information on the perception of a person’s skillsobtained from several sources (supervisors, colleagues,employees, customers, etc.), the approach serves to enhancedevelopment potential. Each leader has a one-on-onecoaching session to analyse the results and define anaction plan for personal and professional development.
This type of individual development mechanism is oftenalso backed up by collective development programmes suchas Kering Leadership. The objective is both to customiseas far as possible what each participant takes away fromthe course, but also to foster a culture of development
3 SUSTAINABILITY ~ SUPPORTING OUR EMPLOYEES
76 Kering ~ 2016 Reference Document
KERING BRANDS
For managers
For everyone
For leaders(Empowering Imagination)
Team Management trainingPeople Management Essentials trainingRecruiting Skills for Managers training
People Performance and DevelopmentCode of Ethics e-learning programme
Open Learning Culture – My Kering Hub
Annual Imagine seminarKering LeadershipKering Influence
360° feedback on demand programme
Retail managementProfessional development
and expertise
Induction programmeSales assistant training
CRMOther business- and
craft-specific training
Top management seminarLeadership & youngtalent programmes

feedback between experienced participants. A further 30 employees benefited from the programme this year.
2. The multi-brand managerial training offer
The Learning Community was started in 2016 with theaim of strengthening the management training offeringin the regions (Asia Pacific, the Americas, Europe and theMiddle East) so as to offer a training course marking thevarious stages in each manager’s individual development.The first step was to identify the key common managementrequirements and test the pooling of some regionalcourses meeting those needs.
3. Open Learning culture: My Kering hub
Together with the main development courses, Keringwishes to encourage each employee to be an actor in hisor her own development, and to enable as many peopleas possible to receive training. Various initiatives taken bythe brands and the Group have resulted in the provisionof a range of diverse development resources: open accessdigital training modules, access to MOOCs in the field offashion business and a learning forum in the form of themedworkshops, practice communities and co-development.
Several pilots were launched with the brands in 2016 totest and identify best practices and prepare for thedeployment of these new digital learning approaches. AllKering corporate employees worldwide in this way benefitedfrom accessible and educational modules ahead of theannual performance and development appraisals.
2.4.3. Training by the brands
Integrate new employees and develop the managerialskills of teams and store managers
The brands also put a focus on Retail training in 2016, inconjunction with the Retail Academy Group. Support anddevelopment of sales consultants is central to the brands’human resources policies, with the recruitment of fivetrainers for Balenciaga, exchange and twinning programmesbetween stores in China and Italy at Bottega Veneta, andthe revised and strengthened training programmeestablished at Gucci.
At the same time, PUMA set up the Speed up / Speed up2programme to promote the retention of talent through adedicated programme and via networking. This programmetargeting employees and first-level team leaders combinesclassroom learning with webinars and one-on-one coaching.
Lastly, with the Group’s support, all of the brands set upmore developed integration programmes for corporateand retail teams alike.
Craft skills
In their desire to make a sustainable investment intomorrow’s professionals, the brands go to great lengths topreserve and pass on their expertise. Many of them havecontributed to the establishment of schools dedicated tothe training of highly qualified young craftspeople. Theyinclude Brioni, with the Scuola di Sartoria; Bottega Veneta,with the Scuola dei Maestri Pellettieri; and the Alta Scuoladi Pelletteria in Tuscany, which enjoys the active supportof Gucci, as well as a continuous learning policy at Ulysse Nardin.
3SUPPORTING OUR EMPLOYEES ~ SUSTAINABILITY
772016 Reference Document ~ Kering

Kering has long been committed to diversity, and wasamong the first signatories of the French CorporateDiversity Charter in 2004. In 2010, equivalent charterswere also signed by PUMA in Germany in 2010, and byGucci in Italy in 2011. In early 2015, the ExecutiveManagement of Kering and the European Works Councilsigned their first Empowering Talent agreement. Itprovides a forceful and comprehensive reassertion ofKering’s commitment to equal opportunities.
It is a commitment that goes beyond social responsibilityand compliance, rooted in the Group’s belief that diversityis a source of creativity and innovation, and as such ofeconomic performance. The Code of ethics, implementedin 2005 and whose third version was made available toall employees at the end of 2013, demonstrates theGroup’s commitment to ethics.
This long-standing commitment has been acknowledgedby the Thomson Reuters Diversity & Inclusion Index, whichranked the Group 22nd out of more than 4,000 internationallisted companies in 2016. This index assesses theperformance of listed companies on 24 environmental, socialand governance indicators, among which diversity, inclusionand talent development occupy a prominent place.
2.5.1. Establishing a culture of genderequality within the Group
While Kering addresses the issue of diversity in all itsaspects, particular emphasis is placed on equal opportunities.In 2010, the Group was one of the first companies in Franceto sign the Women’s Empowerment Principles, drafted byUN Women and the United Nations Global Compact.These principles offer guidance on how to promote thepresence and progression of women in business and,more generally, in society.
The same year, Kering launched the Gender Equality inLeadership programme, the aim of which is to stem theloss of female talent at all levels of authority, and moregenerally to establish a culture of equality within theGroup. This strategic programme focuses on three keypriorities:
• ensuring transparency and equal opportunity throughoutmen’s and women’s careers, thanks to human resourcespolicies and processes that treat all employees fairly;
• promoting the advancement of talented women in theorganisation through special development programmes;
• having managers take an active role in this commitmentto gender equality during their day-to-day teammanagement, particularly regarding the issue ofwork / life balance.
In 2016, with 51% women among its managers, 29%among Executive Committee members and 64% among itsDirectors, Kering was one of the CAC 40 companies withthe highest proportion of women in senior managementpositions.
The Group thus rose to 10th place in the 2016 Feminisationdes Instances Dirigeantes des Grandes Enterprises rankingconducted annually in France by Ethics & Boards amongSBF 120 companies, under the patronage of the FrenchMinistry for Families, Children and Women’s Rights. TheGroup also ranked second in the LedBetter Gender EqualityIndex, which highlights the gender ratio of businessleaders in over 2,000 brands.
• Ensuring transparency and equal opportunitythroughout men’s and women’s careers
A culture of equality cannot be built without regularlyraising awareness among employees and managers.
This is why Kering sponsors the United Nations HeForShecampaign, as part of a three-year partnership with the UNWomen Committee in France to support the developmentof its initiatives and increase its impact.
To mark International Women’s Day, Kering rolled out theHeForShe campaign on a global scale, advocating genderequality by getting men involved and encouraging themto take action against gender stereotypes. To accompanythe campaign, Kering created a dedicated community onits internal digital platform, accessible to all Groupemployees. Its objectives are to publicise the foundationsof the UN campaign, to encourage employees to sign theonline petition, to take part in thematic forums and toupload selfies in which they display the HeForShe sign. Inall, more than a hundred photos from the various Groupbrands worldwide were posted.
The Group and its brands organised a number of actionsto round out the digital campaign. They includedbreakfasts with Group executives, the projection of thefilm Miss Representation at PUMA’s headquarters inGermany, a conference-debate at the Kering Americasheadquarters with the Executive Director of UN Women,and a roundtable in France with the Executive Director ofthe UN Women Committee for France and the head ofthe Good Lad Initiative.
2.5. Promotion of diversity
3 SUSTAINABILITY ~ SUPPORTING OUR EMPLOYEES
78 Kering ~ 2016 Reference Document

• Promoting the advancement of talented womenin the organisation through special developmentprogrammes
In 2013, Kering launched a pilot session of inter-brandand inter-business mentoring in France for talentedwomen. The idea is based on a structured process lastinga year, building on an interpersonal relationship in whichan experienced manager (mentor) shares his or herexpertise with a more junior manager (mentee) in order tofoster his or her professional and personal development.
Mentees and mentors alike have acclaimed this programme,which is now part of the Group’s full catalogue of talentdevelopment offerings and has been rolled outinternationally. Supported by the Women’s Foundation, anon-profit organisation dedicated to improving the livesof women and girls in Hong Kong, Kering Asia Pacificearlier this year launched the first edition of Mentoring.Ten talented women from the Group’s various brandsbased in Hong Kong, China and Korea were able to enjoya year’s individual support from Group leaders.
The programme was launched in the United Kingdom atyear-end, with an external coach working with nine pairsfrom Stella McCartney, Alexander McQueen, BottegaVeneta, Christopher Kane, PUMA and Kering Corporate UK.
For the first year, Kering also partnered with the EVEprogramme, sending 17 employees from various Groupbrands and countries to seminars in Europe and Asia.Founded in 2010 by Danone, this unique managementprogramme, aimed at those who aspire to “enlightened”leadership, works on two levers: the individual and theorganisation. It aims to build strong and inspiringindividuals in sufficient numbers to enable them to bringabout change in the company.
• Promoting a better work / life balance
The Group and its brands are implementing actions infavour of a better organisation of professional andpersonal lives, benefiting both men and women. Throughthe Telework agreement signed this year, KeringCorporate France has taken up the challenge of making iteasier to reconcile work and personal life. The agreementallows eligible employees who so wish, in agreementwith their manager, to work from home two days permonth. At the same time, to facilitate the return to workof new parents, Kering corporate France allows them totake part-time work at 80% of standard working hourswithout any loss of pay during the month following theirreturn from maternity, paternity or adoption leave.
At Bottega Veneta, the MAAM U pilot was launched at itsItalian headquarters. MAAM stands for Motherhood asMASTER; its aim is to recognise the value of motherhood ina professional context, through a dedicated digital platform.
Kering’s new global parental policy is the finest testimonyto its commitment in favour of work / life balance.Effective from January 1, 2017, Kering’s parenting policyprovides for a minimum of 14 weeks’ maternity or adoptionleave on full pay for all Group employees, whatever theirpersonal circumstances or geographical location, and aminimum of 5 days’ paternity or partner leave on full pay.The new policy aims to promote a better balancebetween employees’ professional and personal lives and topromote equality between female and male employees,regardless of their personal circumstances, guaranteeingall Group employees worldwide the same minimumbenefits on the arrival of a child. Kering managers andhuman resources teams take an active part in theimplementation of the new policy by giving parents specificsupport before and after their leave, to ensure that theyreturn to work in the best possible conditions, and thatthey benefit from harmonious career development overthe long term.
• Assessing the impact of our policy
To assess the effectiveness of its action in favour of genderequality over recent years, as well as to identify newavenues of thinking for the future, the Group has chosento engage in the GEEIS (Gender Equality European &International Standard) certification process. This label,created by Arborus, the leading support fund for genderequality at work in Europe and worldwide, is based onrigorous evaluation methodology audited by BureauVeritas, the world leader in certification.
The Kering corporate structures in France, Italy and theUnited Kingdom, as well as the Group’s overall diversity policy,have been studied in the light of this global standard,which audits management tools, HR and managerialpractices and the overall impact of gender equality policies.When receiving this label in September 2016, Keringreaffirmed its commitment to advocating a shared visionof workplace equality within the Group.
With the same aim, the Stella McCartney brand has begunthe EDGE (Economic Dividends for Gender Equality)certification process, the purpose of which is to encourageproactive equal opportunity policies in large global groups.Certification was received for three of the countries inwhich the brand operates, after analysis of their humanresources processes (remuneration, recruitment andpromotion, training, reconciling professional and personallives, corporate culture), namely the United Kingdom, theUnited States and Italy. The certification process will beexpanded for the brands in the coming years.
3SUPPORTING OUR EMPLOYEES ~ SUSTAINABILITY
792016 Reference Document ~ Kering
Providing its employees with a quality of life ensuring thehealth and safety of all is a fundamental duty performedby all of Kering’s brands. In 2010, the European WorksCouncil and Kering group’s management signed a“Charter framework on commitments on quality of life atwork and prevention of work-related stress”. In 2015,health, safety and the quality of working life were the keythrusts of Kering’s commitments under the Europeanagreement signed with the European Works Council onFebruary 19, 2015.
Within its framework, the brands are adopting proceduresand taking action to identify, assess, reduce and preventthe key risks associated with their activities. Of particularnote is the OHSAS 18001 certification processes deployedon a number of industrial sites including Gucci shoefactories, three of the Group’s four tanneries and the
global logistics platform of the Group’s Luxury activities,aimed at aligning the occupational health and safetymanagement system with best standards. The brands arealso taking initiatives designed to achieve continuousimprovements in the quality of working life. Kering has inturn undertaken to develop a working environment andworking relationships that ensure well-being at work inorder to promote the development of all employees andcontribute to the Group’s performance.
The in-house social climate survey carried out every twoyears, “What’s the weather like where you are?”, is a criticaltool for defining priorities as regards the quality of worklife. Following the new edition targeting all Groupemployees launched in October 2015, actions weredrawn up at Group and brand level.
2.6. Quality of life at work
2.5.2. Promoting the integration of people with disabilities
As of December 31, 2016, the Kering group employed 413 workers with disabilities (rate of coverage:83.3% – excluding the United Kingdom and the UnitedStates).
For over 10 years, Kering has promoted the integration ofpeople with disabilities through Mission Handicap,reaffirming its commitment in the European EmpoweringTalent agreement signed in February 2015. In 2016,Mission Handicap launched an awareness campaign onthe Group’s 360° intranet under the heading “All different,all competent” to mark the International Day of Personswith Disabilities. Targeting all employees, this dedicatedspace serves to remind users of the importance ofdiversity, including disability, as a source of creativity andinnovation. The Handiscover game casts participants inthe role of a reporter discovering innovations revolutionisingthe lives of people with disabilities around the world.
The headquarters and the brands implemented actionsto mark European Disability Employment Week.Headquarters participated in the National Programme onAwareness of the Integration of People with Disabilities toencourage employees or their relatives to makethemselves known and assist them in their administrativeprocedures. At Balenciaga, a summary of activities waspresented to all employees, and fun participatory projectswere set up, with prizes in the form of Handiboxes craftedby a company employing people with disabilities.
The Group’s brands in France and Italy also continue tooutsource to the sheltered sector to promote theemployment of people with disabilities. Special serviceproviders employing workers with disabilities are calledon for such services as printing, data entry, archiving,replying to unsolicited applications, catering, preparingmailshots and gift packaging during the holiday season.
2.5.3. Supporting young people fromdisadvantaged backgrounds and those struggling at school
In France, the Group is a founding partner of TélémaqueInstitute (created in 2005), which, through a dual programmeof academic and business tutoring, helps talented andmotivated young people from underprivileged backgroundscomplete their secondary schooling. In 2016, 10 of theGroup’s French employees tutored Télémaque middle- orhigh-school students under this programme. Their role isto help their tutees – through feedback, meetings, events,etc. – to expand their sociocultural horizons and feelconfident and ambitious about their studies.
The brands are also actively involved in social responsibilityinitiatives. Boucheron has developed relationships withassociations that help young people, providing financialsupport and also involving employees who participatedin a sporting competition, as part of the Sport in the Cityinitiative, for example.
3 SUSTAINABILITY ~ SUPPORTING OUR EMPLOYEES
80 Kering ~ 2016 Reference Document

The brands are attached to the principle of risk preventionand the preservation of occupational health and safetyinvolving multiple stakeholders: Health, Safety andWorking Conditions Committee, ergonomists, occupationalphysicians and external specialists in the field of prevention.
In terms of risk prevention, 33,847 hours of safety trainingwere provided to 9,468 Group employees in 2016.
2016 was also marked by several initiatives and projects:
• the relocation of the Kering corporate and BalenciagaParis left bank teams to the Laennec site. The Laennecbuilding is classified as a historical monument, and isconsidered a masterpiece of seventeenth centuryarchitecture. Particular attention was paid to fitting outworkspaces in terms of ergonomics, lighting, and heatingand air conditioning, with the overriding objective ofbringing the site back to life. Employee safety, for thissite in the heart of Paris, was the subject of specificactions, shared with staff representatives. The Laennecsite is also one of the first historical monuments toreceive the HQE renovation environmental label. Theproject also boasts BREEAM classification, the Britishequivalent of HQE. This exceptional site also offers aset of courtyards and gardens open to employees;
• the opening of Gucci’s new headquarters in Milan on thehistoric Caproni site, a 35,000 sq.m former aircraft factorydating back to 1915. This rare site, whose renovationtook three years, will house the Milan offices, showrooms
photo studios, fashion shows and other events organisedby the brand. Designed as a campus, the site offersnumerous indoor and outdoor shared spaces to promoteexchanges between the different functions of theCompany. The site meets the most stringent environmentalstandards (LEED Gold certification targeted for 2017) toallow greater comfort and well-being;
• the evaluation and redesign of workspaces (ergonomicchairs, lighting, etc.) has been taken into account bycountry and by brand (full safety audit for all UK stores,remodelling of back store spaces at Saint Laurent,workshop audit at Balenciaga, office space redesign atBoucheron, etc.);
• prevention also involves raising awareness amongmanagers with a top-level commitment (66 managersof all brands trained in the United Kingdom) as well asamong employees with dedicated e-learning training(five e-learning modules offered by PUMA);
• a counselling system has been set up at Group level todeal with post-traumatic risks (e.g. terrorist attacks, aswell as prevention of psychosocial risks more broadly);
• outside its own borders, Kering received the ISO 28000certification in 2016, a reminder that ensuring thesecurity of goods plays a significant role in ensuring thesecurity of people. Deployed internationally, thiscertification covers logistics activities, relying on theidentification of risk levels across supply chain operations.
Frequency and severity rate of work-related accidents in 2016 and 2015
2016 2015
Frequency of work-related accidents(Number of accidents per million hours worked) 5.64% 5.85%
Severity rate of work-related accidents(Number of days lost per thousand hours worked) 0.11% 0.19%
Across all of the Group’s brands, 11 employees were recognised as suffering from a work-related illness in 2016.
2.6.1. Health and safety in the workplace, a Group priority
In 2016, 391 lost-time accidents were recorded across allGroup brands, compared with 387 in 2015.
The frequency and severity rates of work accidents aredecreasing.
The types of risks match the Group’s areas of activity:
• sales: risks related to handling, falls, etc.;
• production: cuts, pin / needle pricks, etc.;
• other areas (corporate, logistics, etc.): handling, falls,etc.
WORKFORCE PROFILES AS OF DECEMBER 31, 2016 BY AREA OF ACTIVITY (1)
3SUPPORTING OUR EMPLOYEES ~ SUSTAINABILITY
Employees working in sales 56.3%
Employees workingin other areas 26.8%
Employees workingin production 16.9%
(1) Sales: employees working in wholesale, stores and e-commerce; production: employees working in the areas of production (workshops, tanneries, etc.); other areas: employees working in support or logistics functions.
812016 Reference Document ~ Kering

The Group has in turn identified three priority areas foraction based on the results observed:
• foster leaders’ commitment to and alignment with thestrategy;
• encourage managers to better develop their employeesand build agile and efficient organisations;
• strengthen loyalty and sense of belonging to thebrand / the Group.
Training and development Organisation and operational efficiency Internal communication
#1: Creation of an e-learning content #1: iPad in each store worldwide #1: Implementationplatform open to all employees of networking breakfasts / lunches
#2: New induction programme including #2: New offices or renovation #2: Launch of a regular Newslettermandatory experience in a store to optimise space and working from the Chairman and CEO
conditions
#3: Exchange programmes between sales #3: Implementation of a #3: Introduction of an Innovationconsultants / store twinning between management culture at management committee with a Asia and Europe production sites representative from each
department
The absenteeism rate was stable in 2016. The total figurefor absenteeism due to illness includes sick-leave, work-related illness, work related accidents and commute-related accidents. The overall absenteeism rate includesabsenteeism due to illness and every other kind ofabsence (maternity leave, paternity leave, unjustifiedabsences, etc.), calculated from the first day of absence.
2.6.2. Organisation of work
Kering strives to implement an organised and collectivestructure, as well as methods and know-how that allowemployees to work together in the interest of theorganisation and based on set objectives.
The average working time of the Group’s full-time employeesis 39.8 hours per week. In 2016, 40,834 overtime hourswere recorded in France, up compared with 2015following the introduction of Sunday trading.
In 2016, 4,187 employees had contractual weekly workinghours below the standard number in effect within theircompany. Staff working part time accounted for 11.5% ofpermanent employees, and were located mainly in theUnited States and Western Europe. Contractual workinghours are spread out on the basis of the specific businessand organisation of each brand, either over certain daysof the week, or over small slots on all working days.
The organisation of working time in the Group’s brandsvaries according to the countries, sites and employeesconcerned. In France, work is most commonly organisedon the basis of a fixed number of hours or days, withannualised working time and the possibility of flexitime.
Beyond these legal aspects, the brands try to find andoffer more flexible ways to organise working time so as tomeet the needs of the organisation and those of bothhead office and production employees, as part of theirpolicy on the quality of life at work (flexitime in severalbrands, telework at Kering corporate France, remote workat PUMA Germany, leave to care for sick children atBoucheron, part-time work at Pomellato).
2.6.3. In-house social climate survey:“What’s the weather like where you are?”
Every two years since 2001, Kering has conducted aworldwide in-house social climate survey, “What’s theweather like where you are?”, to measure the perceptionsof employees of all brands across the Group on topicsrelated to their work and their working environment.
In 2016, more than 400 post-survey initiatives wereidentified with brands, focusing on three key themes,namely training and development, organisation andoperational efficiency, and internal communication. Eachbrand has set out and prioritised initiatives adapted to itsown context. Some examples are described below:
Overall lost time and sick leave (%)
2016 2015
Overall absenteeism rate 4.33% 4.30%Rate of absenteeism due to illness 2.10% 2.05%
3 SUSTAINABILITY ~ SUPPORTING OUR EMPLOYEES
82 Kering ~ 2016 Reference Document
The Kering group strives to ensure ongoing socialdialogue specific to each of its bodies. 2014 marked thefirst full year for the new members appointed in 2013 toKering’s social dialogue bodies, working under theGroup’s new Luxury and Sport & Lifestyle Scope.
2.7.1. Listening to and engaging withemployees: Kering’s first Europeanagreement signed on February 19, 2015
By promoting free expression within the Group andongoing social dialogue with employee representatives,Kering has long made clear its determination to forgesustainable and constructive relationships with all of itsemployees and their representatives.
In late 2014, the Human Resources Department and theSelect Committee of the European Works Council (EWC)decided to negotiate a new European agreement tofurther the commitments already undertaken to promotediversity and quality of life at work by including them in abroader framework. Management and representativesfrom the EWC met for four two-day sessions betweenSeptember and December 2014 to discuss and signKering’s European agreement on behalf of the EuropeanWorks Council.
The goal of this agreement, Empowering Talent, signedon February 19, 2015, is to underscore the priorities ofKering’s human resources policy for all employees. Theagreement sets out the Group’s commitments in threekey areas, namely to develop a working environment andworking relationships that improve quality of life at work, topromote diversity and foster the emergence of a cultureof diversity and inclusion, and, lastly, to expand opportunitiesfor all employees to boost their professional development.
Terms for monitoring the agreement have been establishedin an annual framework, and the review of initiatives takenunder the agreement was conducted at the EWC meetingof December 13, 2016 in Milan.
The commitment has also been adopted within each Groupbrand. As such, in 2016, 107 collective agreements wereconcluded within the Group, chiefly in Western Europe andAsia. They mainly covered pay and benefits (wages, variableremuneration, profit-sharing and incentives, etc.), workinghours and the organisation of working time (telework,flexitime, generational agreements, donating leave, etc.).
In 2016, the brands in France negotiated with unions theterms governing the implementation of work on Sundayswith a view to ensuring that procedures allow a balancebetween allowing more shops to open without neglectingthe wishes of employees and their capacity to organisetheir time.
2.7. Social dialogue
2.6.4. Initiatives promoting quality of life at work
Quality of life at work is a major theme of the EmpoweringTalent agreement in Europe. Kering uses this agreementto promote the continuous improvement of the qualityof life at work. It is rolling out a concrete action plan forwell-being at work in the French headquarters.
Brands have developed schemes based on three mainpillars:
• prevention of psychosocial risks and stress management:stress training for managers (jointly with Pomellato andKering Italy), health professionals: physiotherapists,osteopaths, sophrologists, yoga / meditation instructors(Balenciaga, Kering headquarters, Saint Laurentheadquarters, Stella McCartney, etc.);
• time management: telework, flexible work schedules,extension of welfare programmes (Rewards Studio inthe United Kingdom, welfare programme at Gucci Italy,Kering and Pomellato, Wellbeing@PUMA, etc.);
• social ties through moments of conviviality: in bici in ufficiochallenge and a ping-pong tournament (Italy Pomellato),Kering Chouette family time (Kering headquarters),Stella collectives, etc.
In the same vein, Kering corporate teams have a “ProfessionalLife / Personal Life” portal to facilitate their daily lives.Thus, in addition to the information available online,employees at headquarters benefit from personalisedservices accessible via the 360° intranet platform, througha network of experts who can be contacted via a toll-freenumber for practical questions regarding their every day life.
At Group level, the parenting policy contributes in acomprehensive and inclusive way for all the men andwomen of the Group to promoting a well-being policy bysetting a standard duration and payment for maternity,paternity and adoption leave.
3SUPPORTING OUR EMPLOYEES ~ SUSTAINABILITY
832016 Reference Document ~ Kering
The number of working hours of industrial action totalled16,223 in 2016, compared with 331 in 2015, resultingfrom unrest in the specific context of change in one ofthe Group’s brands.
2.7.2. The Group’s forums for dialogue
The Kering European Works Council
Created pursuant to the agreement of September 27, 2000,the Kering European Works Council (EWC) provides aEurope-wide forum for information, consultation, theexchange of views and dialogue.
The EWC is a cross-border institution and operates alongsideexisting national employee representative bodies inaccordance with specific prerogatives. The membershipof Kering’s EWC was renewed in November 2013. Upontaking office in 2014, all members received three days oftraining on economic fundamentals provided by ÉcoleSupérieure de Commerce in Paris. In 2015, members ofthe Select Committee received a day of training on socialdialogue in Europe. This training offered members anopportunity to better grasp legal and cultural differencesexisting in Europe, but also to see Kering’s EWC agreementin the light of legal requirements.
The EWC holds two three-day plenary sessions per year,at which it is informed of and, where applicable, consultedon cross-border issues affecting the Group’s employeesin a manner detailed in precise terms in the implementationagreement signed on September 3, 2008 and revisedpursuant to the agreement dated June 26, 2013.
The EWC’s ordinary plenary meetings took place in Parison June 30, 2016 and in Milan on December 13, 2016.The main information provided to its members includedthe Group’s economic and financial situation, its outlookand strategy, and its cross-business projects. Meetingsalso looked at social issues and provided an overview ofthe initiatives undertaken within the scope of Kering’sEuropean agreement. EWC members also benefited froma visit to Kering’s ready-to-wear site in Novara.
The EWC also has a Select Committee composed of fivemembers, elected by their peers, who meet at least threetimes a year to prepare and analyse the two annual plenarysessions and to discuss various issues with Groupmanagement.
The Kering group Works Council
Created in 1993 and renewed most recently in 2015, theKering group Works Council represents workers in Franceand operates under French law. Its members, who meetin plenary sessions once a year, are kept informed of andexchange views on the Group’s strategies, economic andfinancial imperatives, and human resources managementpolicy. The plenary session is preceded by a preparatorymeeting of members, held the day before.
The plenary session of the Group Works Council was heldon May 11, 2016.
3 SUSTAINABILITY ~ SUPPORTING OUR EMPLOYEES
84 Kering ~ 2016 Reference Document

Strategy and objectives
Kering has examined the results obtained over the period2012-2016 to identify the main challenges outstanding,achievements such as the rollout of the EnvironmentalProfit & Loss Account (EP&L), and the major opportunitiesopening over the years to come.
The environment pillar in the new strategy thereforebuilds on input from the period 2012-2016 to set thefollowing targets:
• overall reduction of 40% in the EP&L by 2025;
• reductions in greenhouse gas emissions (determinedby a science-based approach) across the Kering groupand its supply chain:- 50% reduction by 2025 in Greenhouse Gas Protocol
Scope 1 and Scope 2 emissions, and in Scope 3emissions from upstream transportation anddistribution of goods, business air travel and fuel andenergy consumption,
- 40% reduction in Scope 3 emissions correspondingto bought-in products and services, consistent withthe EP&L target.
These goals extend beyond Kering’s activities in the legalsense, because they apply across the whole value chain,consistent with the findings of the EP&L, which show thatmost (93%) of the environmental impact generated byKering operations arises from its supply chains.
Because traceability is a key factor in the endeavour tomeet these objectives, Kering undertakes that by 2025 allthe key materials it uses will be traceable back to the countryor region of production, or back to the livestock farm, inaccordance with the standards applicable to each type ofmaterial. This is a staged objective, with an intermediate95% target to be reached by 2018.
For the key raw materials it uses, Kering is following throughon the work conducted during the 2012-2016 period onsetting responsible standards for each material, andundertakes that 100% will comply with these standardsby 2025.
The above objectives were determined by joint work acrossKering and its brands. Over 100 people were involved in thisprocess including all the brand Executive Committeesand artistic Directors, and workshops were run withFrançois-Henri Pinault.
Through this cooperative process, each brand drew up aroadmap that would include specific commitmentsgoing beyond the objectives outlined above. For the firsttime, these roadmaps were shared across all the brandswith a view to stimulating synergy and cooperation onreaching the Group goals.
PUMA rewrote its sustainability strategy in 2015, in thelight of differences between Sport & Lifestyle brandactivities and Luxury brand activities. The new strategy,named 10for20, lists ten main objectives for 2020. Theseobjectives, consistent with the Kering group visionthrough to 2025, cover issues including governance, climate,responsible sourcing and human rights throughout thesupply chain. In 2016, Volcom reviewed its roadmap throughto 2020, focusing on the three key components of itsbrand genetics: protecting oceans, countering climatechange and contributing to a more sustainable society.
Internal organisation for environmental management
The Kering Sustainability Department comprises around15 specialists tasked with planning operational rollout ofthe Group environmental strategy and helping the brandsimplement action plans for achieving its objectives. Withthis purpose, Kering develops systems such as environmental
3.1. Environmental management
The Kering group’s environmental strategy is based onfour key goals:
• maximize environmental strategy;
• make environmental concerns central to the activity ofthe brands by involving all stakeholders along theentire value chain;
• go beyond mere compliance with legal environmentalobligations, through a macro-environment approachsuch as that of the EP&L;
• drive the Group’s sustainability leadership, through acollaborative approach that favours the sharing of bestpractices, progress and results with competitors andstakeholders.
3. Reducing our environmental impact
3REDUCING OUR ENVIRONMENTAL IMPACT ~ SUSTAINABILITY
852016 Reference Document ~ Kering

reporting or EP&L, along with standards to help brandsmanage their environmental impact (energy consumption,water consumption, waste treatment and raw materialssupplies).
Group-brand coordination is ensured through a networkof managers dedicated to sustainability issues, and eachbrand has at least one Sustainability Lead to spearheadthe drive towards sustainability. In all, close to 60 peoplework on implementing sustainability policy at Group andbrand levels.
In addition to these dedicated positions, working groupsare formed regularly to bring in other key businessfunctions to engage in the rollout of sustainability projects.With these cross-functional teams, which usuallyencompass functions including finance, merchandising,design, production and HR, more than a hundred peoplemeet regularly at Gucci, Balenciaga, Bottega Veneta,Boucheron, Girard-Perregaux, Pomellato, Ulysse Nardinand Saint Laurent. To similar principles, PUMA has definedBoard-level responsibility on oversight and implementationof its sustainability strategy.
Environmental reporting is also backed up by a substantialglobal network of nearly 400 contributors working in theGroup’s brands. It guarantees optimum data precisionand enables the Group to monitor its environmentalimpact and performance very closely.
Managing the network
The Sustainability Leads and the Kering SustainabilityDepartment meet monthly to coordinate deployment ofthe sustainability strategy and to share best practicesdeveloped at brand level. In addition to sharing experiences,these meetings enable participants to draw up actionplans to deal with cross-company issues within theGroup, as well as more specific issues affecting individualbrands. Kering’s sustainability network, which bringstogether Corporate and brand teams, meets physicallyonce a year for two days of work sessions. The 2016Sustainability Network Meeting familiarised all brandswith Group strategy through to 2025, and in exchangingnotes on their respective roadmaps, the brands developedcloser cooperation and enhanced synergy in the commonendeavour of meeting Group objectives. Kering DeputyChief Executive Officer outlined the Group’s businessstrategy and growth outlook to participants, while theKering Human Resources Department presented new HRprograms, on issues including talent management andparenthood policy.
In 2016, Kering continued with its Idea Labs, which areworking groups bringing together experts and operationalstaff from several brands with a view to sharing knowledge,nurturing and structuring new ideas, and implementingpractical solutions, notably in terms of improving the
environmental and social footprints of raw materialsupplies and controlling the use of harmful chemicals. In2016, eight Idea Labs involving a total of 50 employeesmet regularly around the following themes:
• leather;• fur;• gold;• precious skins;• chemicals;• viscose;• cotton;• energy.
The Group also offers its brands tools to help them adoptthe best environmental management practices. TheSmart Sustainable Store, aimed at stores, provides aguide to best management practices in respect of energy,waste, paper, water and other resource consumption,packaging and shipping, as well as maintenance andservicing. It is available in six languages: English, French,Italian, Japanese, simplified Chinese and traditionalChinese. A more detailed version is also available, focusedon the life cycles of stores and their fittings. A similar bestpractices guide, entitled Smart Sustainable Office, wasprepared in 2015. Designed by Kering and the Group’sbrands, this guide provides office workers with solutionsand recommendations, encouraging them to implementenvironmentally friendly practices in their daily tasks. Achecklist is also provided to help them monitor theirprogress. The guide is available in English, French and Italian.
Informing and raising awareness among employees
The 360° intranet platform keeps all Kering group employeesworldwide up to date on the Group’s sustainability news.In addition, there are internal newsletters on sustainability,such as Sustainability Monitoring, a review of nationaland international press coverage of the sustainability-related achievements of Kering and its brands, andRegulatory Watch, which outlines the latest news onregulations relevant to sustainability.
Store sales consultants are a prime audience for trainingand awareness-raising on Kering’s sustainability strategy,which helps them act as effective spokespeople withcustomers. The Sustainability in Retail guide was draftedfor Kering and brand teams tasked with training staff incustomer relations. It is composed of modules coveringthe key raw materials used by the Group, and aims to helpemployees (and ultimately customers) understand whereand how products are made, the challenges facing thesupply chain, their key impacts and the strategy implementedby Kering and the brands to meet these challenges. Thisguide is being translated and adapted to meet thespecific needs of each individual brand. A version forretailers and department stores will be coming in 2017.
3 SUSTAINABILITY ~ REDUCING OUR ENVIRONMENTAL IMPACT
86 Kering ~ 2016 Reference Document

Key dates such as World Environment Day on June 5, bringideal opportunities for reaching a broader public. ForCaring Day 2016, the Paris, Hong Kong, Shanghai and NewYork offices put on a number of sustainability-themedevents (conference, breakfast meetings, exhibition, etc.),addressing a large audience with information on theenvironmental issues facing the luxury sector and thesolutions adopted by Kering and its brands.
Kering group brands also develop their own individualtraining and awareness-raising operations on environmentalmatters, starting at the personnel induction stage. Formost brands, training for all new employees includesmodules on its sustainability commitments and initiatives.This is the case, for example, with Gucci, Bottega Veneta,Brioni and Saint Laurent. Other brands focus morespecifically on key business functions, addressing, forexample, design, retail and merchandising teams todeliver key information on products and sustainabilityinitiatives and best practices, especially as regards efficientshop management. For example, Balenciaga ran its Greenyour Back Office competition across its network of storesto encourage the take-up of environment-friendlypractices. Stella McCartney ran a series of what it calledStella Collective training sessions to help shop teamsunderstand the brand’s sustainable sourcing operationsand use of ecologically sound materials in productdesign. Along similar lines, at its Milan head office, Gucciran an event with partner NGO Rete Clima to familiarisepersonnel on environmental and social issues, and onissues related to deforestation in particular.
PUMA ran a wide-reaching communications programmeon the objectives of its new sustainability strategy in2016. In all, over 3,000 PUMA personnel were reached,though the Catch-up internal magazine and its mobileapplication, as well as the various seminars addressingthe sourcing, design and store management functions.
Other brands develop their own newsletters or dedicatedweb platforms, in addition to the communications materialsprovided by the Group. Saint Laurent, for example, includesa sustainability section in its internal newsletter. Also,Volcom developed its internal video channel dedicated tosustainability and its initiatives in this area, addressing itsNew Future community, which includes friends andcustomers as well as brand employees.
Certification procedures
The number of the Group’s sites for which ISO 14001certification is relevant is limited due to the nature of theGroup’s activities. Thus, certifications related to theimplementation of environmental management systemsare sought primarily for the sites with the greatestenvironmental impact, such as large logistics centres andtanneries.
In 2016, three out of four tanneries run by Kering wereISO 14001 certified. (The fourth was relocating to newpremises.)
Some brands are upgrading their environmental certificationto include ISO 14064, which is specific to the quantificationand reduction of greenhouse gas (GHG) emissions.
3REDUCING OUR ENVIRONMENTAL IMPACT ~ SUSTAINABILITY
872016 Reference Document ~ Kering

Reporting process and indicators
To accurately measure the environmental footprint of itsactivities, Kering has undertaken environmental reportingbased on around a hundred indicators every year since 2004.Representative of the environmental impacts of the Group’sbrands, these indicators fall into eight categories: wasteproduction, energy consumption, water consumption,water pollution, management of environmental risks,goods transport, business travel and use of raw materials.
Since 2014, energy consumption at stores has beenmonitored more closely using the NUS energy invoicetracking system, which inputs month-by-monthconsumption figures directly into the environmentalreporting system, thus avoiding data entry errors, cuttingout the need for possibly inaccurate estimates, andenabling rapid reaction to shortfall from consumptiontargets. By the end of 2016, a total of 638 stores had beenhooked up to the NUS tracking system, an increase of29% on the end-2015 figure. Most of the sites for which theGroup has an energy supply contract are now covered.Working from the NUS data input, Kering set up a store
energy performance ranking in 2016, enabling brands topinpoint the lower-performing sites in order to help themprioritise energy efficiency solutions.
To track its actual environmental performance as closelyas possible, Kering’s environmental reporting system isdesigned to cover all the Group’s business units, with theaim of gathering actual data from the 1,769 sites locatedaround the globe. The methodology set out in thereporting protocol, however, allows the Group to estimatesome data. To track changes reliably from one year to thenext, several consolidated indicators are presented on aproforma basis in this report. This method eliminateschanges in scope by only taking into account sites presentover two consecutive years, and changes in emission factors.
A methodological note provides all necessary informationregarding the environmental reporting protocol, emissionfactors and rules for using estimated or extrapolateddata. It is available on Kering’s website, under Sustainability.
Brand Site name Activity Certifications
Kering Bioggio platform Distribution ISO 14001 Stabio platform Distribution ISO 14001 Sant’Antonino platform Distribution ISO 14001 Cadempino Offices ISO 14001 Caravel Tanning ISO 14001 Luxury Tannery Tanning ISO 14001
Blutonic Tanning ISO 14001
Gucci Casellina warehouse Distribution ISO 14001 Casellina head office Offices ISO 14001 Tigerflex Production ISO 14001
Gucci Museo Offices ISO 14064
Bottega Veneta Altavilla Vicentina Distribution ISO 14001 Montebello Vicentino Atelier Production ISO 14001 ISO 14064 Vicenza Atelier Production ISO 14001
Milan head office Offices ISO 14064
Volcom Japan warehouse Distribution ISO 14001
3 SUSTAINABILITY ~ REDUCING OUR ENVIRONMENTAL IMPACT
88 Kering ~ 2016 Reference Document

Kering began work on the development and rollout of itsEnvironmental Profit & Loss Account, or EP&L, in 2012.Following a pilot stage covering one brand in 2011, thesystem was rolled out to cover 73% of the Group in 2012.The system has now covered all Kering operations, as seenin the 2015 publication of results for 2013 and 2014. In 2016,Kering’s work on its EP&L system addressed three mainpoints: wide-scale release of the EP&L findings; methodologyimprovements covering basics and specific internalmethods; and promotion of natural-capital accountingapproaches, with participation in setting up the NaturalCapital Protocol.
3.2.1. 2016 major achievements
• Findings
Kering published its 2015 EP&L results in 2016. Thispublication included details on how Kering uses the EP&Lfor decision-making. Specifically, EP&L data can be usedto simulate a product’s impact, and thereby providevaluable design-stage input on producing products witha lower environmental impact, by using different rawmaterials or a different sourcing location, as set out inthe detailed report available in the Sustainability sectionof the Group website.
Group-wide coverage for EP&L came with the 2013 data.Since 2013, EP&L has covered the whole of the Groupevery year, making it an efficient gauge of progress inenvironmental performance.
Kering incorporated the findings of its 2014 EP&L into itssustainability strategy, particularly in its raw materialsourcing. Though this is a long-term approach, some efforts
paid off as early as 2015. In 2015, Kering’s EP&L impactsrose by 1% against a 4.6% rise in revenue on a like-for-likebasis, indicating an improved environmental performancerelative to growth. Improvement is also seen over theperiod 2012-2015, with a drop of more than 10% in theintensity of environmental impacts (€ EP&L / € revenue)
Strong organic growth led to an increase in theenvironmental impacts of stores and productionprocesses. On the other hand, in focusing efforts on rawmaterials, to carry through responsible sourcing projectsand improve design and sourcing choices, Keringeffectively reduced environmental impact here. Throughdesign decisions on sport footwear, using more syntheticmaterials and less leather, and reduced use of cashmerein luxury maisons, Kering achieved a sharp reduction inthe environmental impacts of raw materials production.
3.2. Environmental Profit & Loss account (EP&L)
3REDUCING OUR ENVIRONMENTAL IMPACT ~ SUSTAINABILITY
892016 Reference Document ~ Kering
2014(proforma)
2015
€10,500 m (1)
€10,038 m
Revenue+4.6%
€811 m
€803 m
EP&L+1%
(1) The 2015 revenue figure of €11,584m is adjusted here to allow for exchange-rate variations.

The production of raw materials (T4) and their processing(T3) generated the biggest impacts in Kering’s 2015 EP&L,together representing more than 72% of total impacts.Land use, greenhouse gas (GHG) emissions and waterpollution account for 73% of the Group’s impacts. Thismapping, virtually unchanged compared with 2014,
shows the typical profile of the impact of Kering’sactivities.
The details of the environmental impacts of rawmaterials shed particular light on the Group’s activitiesgenerating the biggest Tier 3 and Tier 4 impacts.
The EP&L allows us to map the following impacts:
3 SUSTAINABILITY ~ REDUCING OUR ENVIRONMENTAL IMPACT
90 Kering ~ 2016 Reference Document
TIER 4Production
of raw materials44.7%
TIER 3Processing
of raw materials27.6%
TIER 2Preparation of
sub-components4.9%
TIER 1Final
assembly15.3%
TIER 0Operationsand stores
7.5%
GHGs37.4%
Airemissions10.0%
Waste5.4%
Landuse23.6%
Waterpollution12.1%
Waterconsumption11.5%
Leather
EP&L
impa
ct (€
)Quan
tity
ofra
w materia
ls (kg)
Syntheticfibres
Plantfibres
Metal Animalfibres
Naturalstones
Syntheticstones
Rubber Plastic Preciousskins
Paper Fur Cellulosebasedfibres
Wood
0 M
200 M
150 M
100 M
50 M
30 M
0 M
10 M
20 M
40 M
50 M
Land use Waste Waterpollution
Airemissions
GHGs Waterconsumption

Leather products have a high impact on GHG emissionsand change in land use, while textile fibres consumeenergy and water, which explains their air pollution, GHGemission and water impacts. Moreover, the use of metals,especially precious metals, has a significant impact onwater pollution because of the chemicals used in extractionand in the refining process. Impact analysis by materialenables Kering to prioritise and focus efforts on the rawmaterials and supply chains that generate the greatestimpact, even when the volumes of these materials appearon the low side.
Kering conducted wide-scale communications andexplanation on its EP&L findings in 2016. The EP&L was amajor item in discussions on the environmental pillar ofKering’s new sustainability strategy; members of Keringcorporate and brand executive committees studied theirEP&L results in detail to set impact reduction targets.
• Continuous improvement in methodology and steering systems
The EP&L serves primarily as a decision-making toolproviding input to the Group’s sustainability projects andguiding the day-to-day choices of decision-makers, with theultimate goal of reducing and limiting the environmentalimpact of both Kering and its supply chains.
Wide-scale rollout of the calculation process in 2015 broughtgood buy-in from operational teams, enabling them tocompare the impact of their decisions much more quickly.Kering boosted EP&L buy-in by brand teams in 2016 bydeveloping a scenario and prospecting tool that includesdynamic viewing of EP&L results. This scenario tool, availableto all brands from early 2017, performs direct comparisonbetween alternative scenarios, giving an immediateindication of the impact of a decision or project underconsideration. For example, a production team couldobtain an instant indication of the EP&L gains afforded byan energy saving project run jointly with suppliers. Or asourcing team could get an instant reading of the EP&Lgains achievable by switching a product line over toorganic cotton. The scenario tool thus brings greater precisionin managing the brands’ EP&L impacts, a crucial factor inthe Group’s sustainability strategy through to 2025.
Because the design stage, especially as regards the choice,sourcing and amount of materials, has a very major influenceon a product’s environmental impact, in 2016 Keringbegan development of an EP&L product module that wouldprovide designers with an intuitive tool offering guidancetoward more environmentally virtuous choices, in asimilar way to the MyEP&L application but with muchmore comprehensive choices and options.
As well as developing these new tools, Kering continuedwork on improving the EP&L methodology in 2016. This workwould bring more accurate allowance for biodiversity andmore precise evaluation of land use change. Kering haspartnered with Stanford University and the Natural CapitalProject of Cambridge University’s Institute for Sustainability
Leadership to improve the understanding and measurementof the impact of business activities on biodiversity andecosystem services. This initiative seeks to develop a referenceframework for measuring biodiversity impacts, for theKering EP&L and for the other companies involved in theprogramme. In 2016 Kering also continued with work onquantifying the environmental impacts of certain keymaterials, drawing up more than ten lifecycle inventoriesfor materials such as sustainable wool, synthetic glassand precious stones. For some materials Kering was thefirst to examine quantification of environmental impacts.Because of the lack of prior information here, it wouldconduct pioneering field studies to lay down thefoundations for further studies in what were previouslyuncharted areas.
• Promotion of natural-capital accounting
In line with its commitment on wide-scale communicationand education on natural capital issues, Kering releasedthe MyEP&L smartphone application, which gives keyinformation on product environmental impacts, primarilyfor the use of designers, students and customers. For fourproduct lines (footwear, overcoats, rings and handbags),the user selects key materials, countries of origin forthese materials, and product manufacture region. Theapplication then shows an environmental impact chartfor the selected product, by production stage and type ofimpact. In enabling users to line up their selectedconfigurations against the best available option, theapplication develops a better understanding of thedecisions that underlie design choices aimed at lesseninga product’s environmental impact. The application,available in English and Chinese, will be upgraded in 2017to offer a wider choice of products and materials. WithMyEP&L, Kering achieves a wide reach for the main messagesafforded by its EP&L, specifically as regards the extent towhich environmental impact is dependent on the choiceand sourcing of raw materials. The audience includes studentsat the Parsons School of Fashion in New York, the LondonCollege of Fashion in the United Kingdom, Poly U and City Uin Hong Kong, and Tsinghua in Beijing. In all, more than14,000 students have been reached on the importance ofdesign choices in determining environmental impact.
Through participation in a deep-dive pilot programme andmembership of the Technical Group of the Natural CapitalCoalition, Kering contributed to drafting the NaturalCapital Protocol, published in July 2016 to stand as aworldwide reference on the development of systems formeasuring impacts and dependences between businessesand natural capital. Kering also shared its experience withmany partner organizations in 2016, presenting its EP&Lapproach at international conferences and workshops, andtaking part in workshops on natural-capital accounting.Specific events here included the Biodiversity and EconomicsForum, the International Platform for Insetting (IPI), theCopenhagen Global Green Growth 3GF Summit, the ImpactValuation working group (comprising major multinational
3REDUCING OUR ENVIRONMENTAL IMPACT ~ SUSTAINABILITY
912016 Reference Document ~ Kering

corporations involved in social and natural-capital accountingprogrammes), the Copenhagen Fashion Summit, BSR(Business for Social Responsibility), the RobeccoSAM forum,IUCN, CITES, the Sustainable Apparel Coalition, PlanetTextiles, Better Brand, the UN Global Leaders Summit,Corporate Knights, the Luxury Futures Forum, TextileExchange, Web Summit, 2016 Condenast South Summitand the Future Luxury Summit.
3.2.2. EP&L methodology
• What is an EP&L?
The Environmental Profit & Loss Account enables acompany to evaluate its impacts on natural capital, byattributing a monetary value to the consequences onpopulation groups of the Company’s environmentalimpacts throughout its supply chain.
Kering uses the EP&L results, expressed in monetaryterms, to:
• translate its environmental impacts into businesslanguage;
• compare different environmental impacts;
• compare, for any given environmental indicator, themagnitude of an impact for different locations (particularlyuseful for drinking water availability, an important localissue);
• facilitate comparisons between its brands and businessunits.
The results should not be seen as a liability or a cost forKering. Rather, they represent a way of assessing the costto society of environmental changes stemming from theactivities of the Group and its suppliers.
• Why develop an EP&L?
For Kering and its brands, the EP&L represents a new wayof looking at its activities. It reveals areas for improvementwhere the Group can deploy solutions, using innovativenew technologies and materials that significantly reducethe environmental impact caused by the way in whichraw materials are processed and goods manufactured. Ithelps to show:
• where the main environmental impacts are: quantifyingand valuing all environmental impacts in financial termscan help shape decisions between different types ofimpacts and their location, and ultimately the choice ofmaterials and technologies;
• the variety and complexity in the operations of theGroup and its supply chains;
• the impact of Group decisions: sharing the results andlessons learned with the Group’s various departmentshas fostered awareness of the potential consequencesa single decision can have on the other side of the planet.
3 SUSTAINABILITY ~ REDUCING OUR ENVIRONMENTAL IMPACT
92 Kering ~ 2016 Reference Document

• Summary of the methodology
Comprehensive methodology details have been published on the Kering website since 2015. The EP&L approach goesbeyond standard environmental reporting, producing a much fuller picture of the impacts of Kering’s activities.
SCOPE COVERED BY THE EP&L APPROACH
Environmental change resulting from the relevant emissions or use of resources is translated into economic terms,taking into account local contexts and the effects on the welfare of local populations.
3REDUCING OUR ENVIRONMENTAL IMPACT ~ SUSTAINABILITY
+ ECONOMIC IMPLICATIONS OF THESE IMPACTSON LOCAL POPULATIONS (€)
TIER 2Preparation
of sub-components
TIER 4Production
of rawmaterials
TIER 3Processing
of rawmaterials
TIER 1Final
assembly
TIER 0Operationsand stores
GHGs
LEGALENVIRONMENTAL
REPORTING(GRENELLE 2
LAW)
Waterconsumption
Waste
Waterpollution
Airemissions
Land use
ADDITIONALENVIRONMENTAL
IMPACTS
UPSTREAM INTHE SUPPLY CHAIN
Environmentalchanges
Increase inpollutant
concentrationsClimate change Ecosystem
services reduction
Climate change,pollution and
contamination Water
shortages
Effect onwell-being
(costs to society)
Respiratoryillnesses,agricultural
losses,reduced visibility
Health impacts,economic losses,changes to the
natural environment
Health impacts,economic losses,
changes to thenatural
environment
Malnutritionand illness
Enjoyment of localenvironmentimpaired,
decontaminationcosts
PM2.5, PM10,Nox, Sox, VOCs,
NH3
CO2, N2O,CH4, CFCs,
etc.
Hectares of tropical,temperate,
wetlands andother forests,
etc.
Hazardous andnon-hazardous
wastem3
Emissionsand use
of resources
GHGs WasteAiremissions
Landuse
Waterconsumption
Health impacts,eutrophication,
economic losses
Specific heavymetals, nutrients,toxic compounds
Water qualitydeterioration
Waterpollution
932016 Reference Document ~ Kering

A summary of key projects carried out in response to Kering’s EP&L is provided below:
3.2.3. Kering’s response
These findings corroborate the efficacy of the Group’ssustainability strategy, which relies heavily on a responsiblesourcing policy and a quest to improve the environmentalefficiency of its industrial processes while seeking optimummanagement of sites and activities:
• Development of more robust internal procedures:through a finer understanding of risks and opportunities,Kering has been able to adapt and optimise internalprocedures, especially as regards the sourcing of rawmaterials such as leather and precious skins, furs, cotton,viscose, gold and diamonds (see Section 3.4 in particular);
• Implementation of targeted projects: the Group hasprioritised its sustainability actions in response to thefindings of the EP&L, in particular around:
- the choice of materials, as regards both the actualmaterials and the way they are used (location,manufacturing processes),
- production processes such as chrome-free tanningtechnology and improvements in suppliers’environmental performance,
- cooperation between brands and across branddepartments, through cross-functional and inter-brand work. By pooling the wealth of knowledge andexpertise available across the Group, Kering generatessynergies and provides a response to major issuessuch as traceability of materials, development ofcertifications and standards to reduce EP&L impact,and support for positive-impact initiatives in thevalue chain. This is done without compromising theconfidentiality or image of individual brands.
3 SUSTAINABILITY ~ REDUCING OUR ENVIRONMENTAL IMPACT
94 Kering ~ 2016 Reference Document
Smart Sourcing
Materials Innovation Lab (MIL)Encouraging brands to integrate more
sustainable raw materials into their collections(see Chapter 3.4).
Idea LabsInter-brand working group meetings to
consider specific issues (see Chapter 3.1).
Identifying and securingsustainable sourcing
LeatherPrecious skins
FurOrganic cotton
Wool and cashmereSynthetic fibres
Cellulose based fibresGold
Diamonds and precious stones(see Chapters 3.4, 3.5 and 4.4).
Animal well-being Developing comprehensive standards
regarding the species that the Group sources.
R&D investmentTo set up polyester and cellulosebased fibre recycling loops.
Clean by DesignProgramme to work with suppliers to reduce
their environmental footprint(see Chapter 4.3).
Production process innovationsTanning without heavy metals,
recycling of leather offcuts, productionmethods without chemical inputs, etc.
(see Chapters 3.4 and 4.4).
Financing suppliers’ ecological solutionsFinancing programmefor virtuous suppliers
(see Chapter 4.3).
Guidelines and best practicesGuides for shops, offices and sales teams
(see Chapter 3.1).
Pooled purchasing of electricityfrom renewable energy sourcesA renewable electricity monitoringand purchasing programme available
to the brands(see Chapter 3.3).
Certification of sites and efficient facilitiesRecommendations regarding certifications
(LEED, HQE, BREEAM).Renovation and maintenanceto improve energy efficiency.
Consideration of sustainability issuesin new store concepts.
Smart Suppliers Smart Operations
TIER 4
Idea LabsInter-brand working group meetings to consider specific issues (see Chapter 3.1).
TIER 3 TIER 2 TIER 1 TIER 0

The Kering group helps address the impacts of climatechange in two ways: by directly reducing the carbonfootprint associated with its energy consumption and thetransport of people and goods, but also, from a longer-term perspective, by evaluating and reducing emissionsof greenhouse gases in its supply chain, especially byusing the EP&L analysis implemented by the Group for allits brands. This approach is also a key tool in Kering’sstrategy for adapting to climate change, as demonstratedin the report analysing the consequences of climatechange for the luxury industry, published jointly with BSRin 2015. The report, entitled Climate Change: Implicationsand Strategies for the Luxury Fashion Sector, aims to helpindustry players see where their specific vulnerabilities lie,and makes recommendations promoting the developmentof more resilient business models.
Evaluation of climate risk is today an integral part of Grouprisk management (see Chapters 4 and 5 in the ReferenceDocument).
Key issues regarding greenhouse gas emissionsarising from the Company’s activities and from use of the goods and services it produces
When Kering decided to launch its EP&L program in 2012,the question naturally arose as to the scope it shouldcover, as regards the Group’s activities and their upstreamand downstream impacts. A global analysis clearly indicateda very strong predominance of upstream impacts,especially when it came to greenhouse gas emissions:
• unlike many consumer goods, Kering brand products (leathergoods, ready-to-wear, watches & jewelry, footwear andsportswear) generate little or no greenhouse gases in use;
• because of their quality, Luxury goods have a lifespanmuch longer than consumer goods on average;
• lifecycle analyses available for the textile sector show asplit of around 80%-20% between upstream phases(production of raw materials, transformation, assembly)and downstream phases (usage and end-of-life);
• there is as yet no reliable database characterising theproduct usage and disposal practices of Luxury goodscustomers (frequency and type of washing, maintenance,second-hand market, etc.).
Kering did, however, carry out an initial exploratory pilotsurvey with one of the Group’s brands to assess downstreamemissions, using a customer questionnaire covering sevenemblematic brand products representative of its different
categories (ready-to-wear, footwear, bags, etc.) to probecustomer practices on use and disposal of the productsthey buy. The survey results indicated a maximum 11%proportion of downstream with respect to upstreammissions for a single product category – apparel – withthis proportion being negligible for all the other productcategories. The survey also revealed that it would beextremely difficult to extrapolate this kind of result acrossall the Group’s brands and markets, given the hugediversity in customer practices.
Kering is nevertheless tackling the matter afresh since theGroup sustainability strategy drawn up in 2016 for thenext ten years includes a clear statement on full coverage,which means downstream emissions are to be includedby 2025.
The decision on cradle-to-gate scope for the Kering EP&Ldates back to 2012. So as well as measuring the greenhousegas emissions arising from its actual operations, as setout hereafter, Kering also calculates upstream emissionsand expresses them in monetary terms, as outlined inSection 3.2. Significant points here include the following:
• Greenhouse gas (GHG) emissions from supply chains(Tiers 1 to 4) greatly outweigh those from Keringoperations (Tier 0): 88.6% vs. 11.4%;
• within the supply chains, GHG emissions are mostpronounced at the raw material production and initialtransformation stages (Tiers 4 and 3), and mostespecially with leather and textile fibres, of vegetable,animal or synthetic origin;
• to set a relevant carbon footprint reduction target coveringits main GHG emission sources, Kering opted to take upthe framework set by the Science Based TargetsInitiative. Specific 2025 goals here include:- 50% reduction in greenhouse gas emissions arising
from Kering operations (whole of Greenhouse GasProtocol Scopes 1 and 2, plus emissions arising fromtransport and distribution of goods, energy and fuelproduction, and business air travel),
- 40% reduction in supply-chain greenhouse gas emissions(bought-in products and services under GreenhouseGas Protocol Scope 3), consistent with the EP&L objectives.
The transport and energy emission factors taken forcarbon reporting on Kering’s operations (as set outhereafter) include Scope 3 items for upstream phases(extraction, refining, transport, electricity line losses, etc.).
3.3. Measurement and reduction of our carbon footprint
3REDUCING OUR ENVIRONMENTAL IMPACT ~ SUSTAINABILITY
952016 Reference Document ~ Kering

Carbon footprint of Group operations
Energy consumption and the transport of goods and peopleare the two main sources of the Group’s CO2 emissions(excluding emissions related to the supply chain). Totalemissions for 2016 came in at 361,465 tonnes of CO2.
After three years of no change in the CO2 emission factorstaken for reporting purposes, consistent with theobjectives Kering had set for 2016, the factors taken up in2016 for calculating CO2 emissions arising from energyconsumption and transport were reviewed and updatedin line with input from the latest available databases. Thenew emission factors include allowance for the territoriesin which the Group operates, and for the energy mixes indifferent countries.
Proforma adjustment of the CO2 emission figures for 2015includes allowance for changes in scope and methodology:proforma comparisons only include Group sites presentin both 2015 and 2016, and the 2015 CO2 emission figuresare recalculated on the basis of the new 2016 updatedemission factors.
The Scope 2 emission figures relating to electricity areobtained using market-based methodology, givingspecific attention to the proportion of electricity fromrenewable sources.
Details of the emission factors used are set out in themethodological note to Kering’s 2016 environmentalreporting on the Group’s website.
BREAKDOWN OF TOTAL TRANSPORT- AND ENERGY-RELATED CO2 EMISSIONS IN 2016
Total: 361,465 tonnes of CO2
The proportion of energy-related as opposed to transport-related CO2 emissions fell from 51.4% in 2015 to 42.6% in2016. This is explained chiefly by the increase in goodstransport, consistent with increased business for severalbrands, and by the decrease in energy consumption andmassive switch from conventional to green electricity.
Energy consumption and related CO2 emissions
The Group uses the energy-consumption indicators listedbelow to assess its energy use and related greenhousegas emissions, both direct (Scope 1 of the GHG Protocol:burning of natural gas, heating oil and LPG) and indirect(Scopes 2 and 3 of the GHG Protocol: electricity and steamproduction, line losses, upstream production phase ofenergy fuels and treatment of waste generated byelectricity production).
3 SUSTAINABILITY ~ REDUCING OUR ENVIRONMENTAL IMPACT
96 Kering ~ 2016 Reference Document
Transport 57.4%
Energy 42.6%

On a proforma basis, the Group’s energy consumption fellby close to 6%, from 328 GWh in 2015 to 308 GWh in 2016.This is explained by a decrease in electricity consumptionarising from systematic implementation of LED lighting,which consumes less energy, and lower consumption(down by 5%) of fossil energies such as natural gas andheating oil. Throughout 2016, the C. Mendès ready-to-
wear atelier in Angers, which belongs to Saint Laurent,used biomass rather than gas for heating, under anarrangement first introduced in September 2014.
CO2 emissions from energy consumption fell by 10.5% asa result of falling energy consumption and significanttransfer (+12.5%) from conventionally generated electricityto electricity from renewable sources.
Proforma year-on-year change in energy consumption (MWh) and related CO2 emissions (tonnes)
2016-2015 proforma scope Year-on-year2016 2015 change
Electricity (MWh) 243,270 260,374 -6.6%of which electricity from renewable sources 67,402 59,760 +12.8%
Natural gas (MWh) 54,298 56,879 -4.5%Heating oil (MWh) 1,939 2,317 -16.3%Steam (MWh) 7,517 6,700 +12.2%LPG (MWh) 72 64 +12.5%Fuel for transport and on-site handling (MWh) 495 677 -26.9%Biomass (MWh) 739 813 -9.0%
Total energy (MWh) 308,330 327,824 -5.9%of which energy from renewable sources 68,142 60,573 +12.5%
Direct emissions (Scope 1) (tonnes of CO2) 11,786 12,460 -5.4%Indirect emissions (Scopes 2 and 3) (tonnes of CO2) 131,211 147,352 -11.0%
TOTAL ENERGY-RELATED EMISSIONS (TONNES OF CO2) 142,997 159,812 -10.5%
BREAKDOWN OF ENERGY-RELATED CO2 EMISSIONS IN 2016
Total: 154,126 tonnes of CO2
The Kering group’s energy consumption relates mainly tothe heating, lighting and air conditioning of stores, warehousesand offices. In 2016, it amounted to just over 334 GWh.Electricity is the Group’s main source of power, representing79% of total energy consumption, against 82% in 2015.
CO2 emissions related to the Group’s energy consumptionin 2016 totalled 154,126 tonnes. More than 89% stemmedfrom the generation of electricity, and were thereforeindirect emissions relating to the amount of electricityconsumed, but also to its mode of generation (coal,hydrocarbon, nuclear, renewable, etc.).
Energy consumption and related CO2 emissions in 2016
Energy Related consumption CO2 emissions (MWh) (tonnes of CO2)
Electricity 265,092 137,463Natural gas 57,968 14,134Heating oil 1,953 632Steam 7,978 1,718LPG 73 20Fuel for transport and on-site handling 495 159Biomass 739 -
TOTAL ENERGY 334,298 154,126
3REDUCING OUR ENVIRONMENTAL IMPACT ~ SUSTAINABILITY
972016 Reference Document ~ Kering
Electricity 89.2%Natural gas 9.2%
Steam 1.1%Heating oil 0.4%
LPG+Biomass+
On-site fuel0.1%

Measures to improve the energy efficiency of stores and infrastructures
In 2011, the Sustainability Department and the IndirectPurchasing Department – in partnership with NUSConsulting – launched a major energy managementproject intended for all Group brands. In 2012, it resulted inthe establishment of a more accurate energy-consumptionmonitoring system. By 2016 a total of 638 Group siteswere covered in Europe, the United States and Asia, up by29% on the 2015 figure of 496, bringing a coverage rateof 61% sites potentially covered by NUS (excluding cornersand shops in shopping centres). The project focuses onstreamlining the energy procurement process by poolingand consolidating energy consumption, increasing the useof renewable energy and centralising energy procurementmanagement. The project has generated tangible energysavings and cost reductions for the Group. As well asbeing extended to more than 140 new sites in 2016, theNUS system interface was upgraded to include controlpanel capabilities for comparing site energy performances,which encourages broader take-up of best practices.
Compliant with the European directive on energy efficiency,Kering commissioned 59 energy audits in France, Germany,the United Kingdom, Italy and Holland. The resultsrevealed openings for improvement in lighting (switch toLED) and energy (ventilation, temperature settings).
As well as meeting its regulatory obligations, Keringopened a new Idea Lab in 2016, dedicated to energy, andmore specifically, to LED lighting and site monitoring andcertification. Kering also drew up building certificationguidelines (covering the HQE, BREEAM, LEED certificationsalong with labels such as BEPOS, Passiv’Haus, Minergie Aand NZEB) to help Group brands make the best certificationchoices for their offices and stores.
This year, the Kering and Balenciaga head offices relocatedto new premises, the former Laennec Hospital in Paris,which are certified to BREEAM (Very Good rating) and HQE.Renovation of the new head office focused on the four mainHQE certification points: the building in its immediateenvironment, long-term upkeep of environmental performance,water quality, and worksite environmental impact.
A good example of work on reducing energy consumptioncomes with LEED certification (Leadership in Energy andEnvironmental Design) under way at new luxury brandstores and offices. The certification programme is basedon six evaluation criteria, of which energy is the mostimportant (optimising energy performance, using renewableenergies, etc.). Gucci had seven stores and two office sitesLEED-certified by the end of 2016, and Bottega Venetaobtained Platinum (the highest level) LEED certificationfor its Montebello Vicentino site in 2014. To bolster itsprogramme on reducing the environmental impactsgenerated by its retail network, Saint Laurent, which hasalready rolled out LEED certification at four stores,identified 20 good environmental practices based onLEED certification requirements. These good design
practices, named Architecture Golden Rules, coveringlighting, heating, air conditioning, etc., are to be applied atthe brand’s new stores and on its renovation projects.Details on the environmental requirements set out inthese Architecture Golden Rules are included in all thebrand’s call-to-tender documentation. Stella McCartneyalso holds LEED certification for two stores in the UnitedStates and one in China. Furthermore, Kering Sant’ Antoninowarehouse has also held the LEED platinium since 2014.
On top of certification, the Group’s brands are striving toimprove the environmental performance of their facilities.The Stella McCartney Green Guide, initially released in2012 and updated annually, helps stores manage theirenergy consumption sustainably. This publication wasissued to all the brand’s offices and stores in 2016.
Along similar lines, Gucci put out a document outliningtechnical guidelines on sustainable store management,to help the brand’s regional facility managers set upsustainable practices in everyday store management.Gucci also developed a document outlining sustainabilityrules for issue to store personnel.
Saint Laurent continued rollout of environmental goodpractices, set out in its Golden Rules Operations publication,across all regions, achieving an implementation rate of96% by the end of 2016 (excluding shopping centres anddepartment stores). With this store design and operationinitiative, Saint Laurent improved the energy efficiency of itsstores by 42% over the period 2012 to 2016. Saint Laurentalso assists all its main stores in the management of theirenergy consumption, sending them a personaliseddashboard each quarter. Invoice data is used to monitorstore consumption, calculate energy efficiency, and producea regional performance ranking. A total of 46 benefitedfrom this support by the end of 2016.
Girard-Perregaux continued rollout of the energy conservationprogramme with the Swiss Energy Agency and set up aten-year energy efficiency improvement programme.Various measures were introduced In 2016: training forall personnel on energy conservation at the workplace,installation of a compressor programming system to limitoperation to production hours, optimum setting ofheating and cooling systems, removal of old ventilationducts to minimise energy loss, and installation of LEDlighting in the reception area, passageways and rest areasat a production site.
Ulysse Nardin has also signed up to the Swiss Energy Agency’senergy conservation programme, and met its energyconsumption reduction targets several years ahead ofschedule at the Locle and Chaux de Fonds sites.
Lastly, the deployment of LED technology for lighting, asource of significant energy savings (up to 90% on lighting),continues in the stores of various brands. Bottega Veneta’sproject on LED lighting began in 2014. In 2016, 26 additionalstores were fitted out with all-LED lighting, bringing thenumber of LED-technology stores up to 50. In 2016,Bottega Veneta also switched the whole of the lighting
3 SUSTAINABILITY ~ REDUCING OUR ENVIRONMENTAL IMPACT
98 Kering ~ 2016 Reference Document

systems (production area, and some parts of the officeand common areas) at its two industrial sites, MVP Altavillaand MVP Malo. Pomellato and Dodo fitted out four storeswith LED lighting systems. LED lighting is fitted at all newstores and sites under renovation of the Stella McCartney,Alexander McQueen, Saint Laurent, Boucheron andBalenciaga brands. By the end of 2016, 58% of AlexanderMcQueen directly operated stores were 100% LED-lit. In2016, Gucci followed through with its investmentprogramme on replacing store lighting with LED fixtures.
In the Sport & Lifestyle business, Volcom continued workon replacing conventional lighting with LED systems at itsstores, offices and warehouses. All new and renovated PUMAstores make exclusive use of LED technology for lighting.
Gradual shift towards renewable energy
The proportion of renewable electricity used within theGroup is growing thanks to numerous green energy contractsimplemented by the brands with the Group’s support. Itamounted to 27.7% in 2016, compared with 23% in 2015on a proforma basis.
In 2016, Kering renewed its master energy agreementsfor all brands in Italy and France, as it had already done inthe United Kingdom, to ensure that electricity consumed inboth countries is fully renewable in origin. Electricity fromrenewable sources thus accounted for 89.4% of the mixin Italy (up 6 points proforma on 2015), 71% in the UnitedKingdom (up 9.9 points proforma) and 57.8% in France(up 28.4 points proforma). Then green electricity accountsfor 90% of consumption at the Group’s German sites, upfrom 85.2% in 2015 on a proforma basis. Gucci uses greenelectricity in Italy, France, the United Kingdom, Switzerland,Germany and Austria. In 2016, Girard-Perregaux optedexclusively for green electricity for its Swiss sites, whichrepresent over 93% of its total consumption. UlysseNardin uses close to 100% of locally generated greenhydroelectricity at its Locle and La Chaux de Fondsproduction sites, and close to 84% across its overallelectricity consumption. With Stella McCartney, 58% of thetotal electricity supply is renewable. The figure is 64% withPomellato, 62% with Brioni, 42% with Boucheron and 40%with Balenciaga. Bottega Veneta, which is also taking partin the project, extended the initiative to all its Austrian,Swiss and Spanish flagship stores in 2016. More than85% of the electricity consumed by the brand’s Europeansites is renewable. By the end of 2016, 60% of Saint Laurentsites and stores worldwide had green electricity contracts,and all Alexander McQueen directly operated stores in Europewere powered by green electricity. In 2016, the share ofelectricity derived from renewable sources rose to 19% ofPUMA’s total electricity consumption, thanks notably tothe significant increase since 2012 in the use of this typeof energy in Germany and Italy, where nearly 100% of
electricity consumed is renewable, and in Austria (72%),the United Kingdom (65.5%) and Holland (30%).
On top of external purchases, the brands have been boostingtheir reliance on renewable energies, for instance byinstalling photovoltaic panels. Some brands have alreadyinstalled panels on the roofs of their buildings, such asPUMA’s head office in Germany, a warehouse operated bythe Luxury business in the United States and threeBottega Veneta buildings in Italy. In 2016, Volcom finalisedinstallation of two photovoltaic panels on the roof of itsbuildings on the north coast of Hawaii, in an operation thatcontributes to raising public awareness on environmentalissues because of the regular visits the site receives fromthe brand’s athletes. Saint Laurent also fitted solar panelson the roof of its Beverly Hills store, generating electricitythat is consumed directly by the store.
Since September 2014, the C. Mendès ready-to-wearworkshop in Angers, which belongs to Saint Laurent, has usedbiomass rather than gas to meet its heating requirements,and renewable electricity has covered all of the site’sconsumption since November 2015. Using green energyhas reduced by more than 70% the site’s carbon footprint.In Paris, three Saint Laurent flagship stores fitted theClimespace air conditioning system, an urban coolingsystem using water from the River Seine to cool buildings.Compared to conventional air-conditioning systems, thisbrings a 35% reduction in electricity consumption and a50% reduction in CO2 emissions across the three sites.
Transport-related impacts and emissions
Methodology
Data on transport are divided into three main categories:
• B2B transport: this includes all transport of goods paidfor by the brands between suppliers and logisticsplatforms or industrial sites, and between logisticscentres and points of sale. The transport of goodsbetween logistics centres also falls into this category.B2B transport includes road freight, rail freight,shipping and air freight. Express transport includesgoods that are delivered by express transport serviceproviders via road and air freight;
• B2C transport: this covers all deliveries of finishedproducts between logistics platforms or points of saleand customers. These deliveries can be carried outeither by the brands’ own fleets or by subcontractors’vehicles. As with B2B, only transport that is paid for bythe brands is taken into account. B2C transportincludes road freight;
• business travel: this covers business air travel and theuse of company cars.
3REDUCING OUR ENVIRONMENTAL IMPACT ~ SUSTAINABILITY
992016 Reference Document ~ Kering
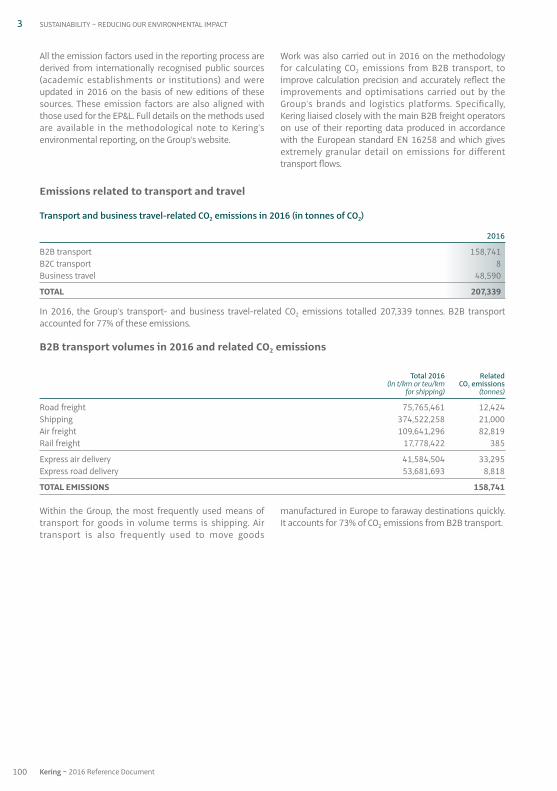
Within the Group, the most frequently used means oftransport for goods in volume terms is shipping. Airtransport is also frequently used to move goods
manufactured in Europe to faraway destinations quickly.It accounts for 73% of CO2 emissions from B2B transport.
Emissions related to transport and travel
Transport and business travel-related CO2 emissions in 2016 (in tonnes of CO2)
2016
B2B transport 158,741B2C transport 8Business travel 48,590
TOTAL 207,339
In 2016, the Group’s transport- and business travel-related CO2 emissions totalled 207,339 tonnes. B2B transportaccounted for 77% of these emissions.
B2B transport volumes in 2016 and related CO2 emissions
Total 2016 Related (In t / km or teu / km CO2 emissions
for shipping) (tonnes)
Road freight 75,765,461 12,424Shipping 374,522,258 21,000Air freight 109,641,296 82,819Rail freight 17,778,422 385
Express air delivery 41,584,504 33,295Express road delivery 53,681,693 8,818
TOTAL EMISSIONS 158,741
All the emission factors used in the reporting process arederived from internationally recognised public sources(academic establishments or institutions) and wereupdated in 2016 on the basis of new editions of thesesources. These emission factors are also aligned withthose used for the EP&L. Full details on the methods usedare available in the methodological note to Kering’senvironmental reporting, on the Group’s website.
Work was also carried out in 2016 on the methodologyfor calculating CO2 emissions from B2B transport, toimprove calculation precision and accurately reflect theimprovements and optimisations carried out by theGroup’s brands and logistics platforms. Specifically,Kering liaised closely with the main B2B freight operatorson use of their reporting data produced in accordancewith the European standard EN 16258 and which givesextremely granular detail on emissions for differenttransport flows.
3 SUSTAINABILITY ~ REDUCING OUR ENVIRONMENTAL IMPACT
100 Kering ~ 2016 Reference Document

CO2 emissions from B2C transport totalled 8 tonnes in 2016.On a proforma basis, B2C transport emissions increasedby 37.3%, but across a very limited scope.
Optimising logistics flows and switching toalternative means of transport
Goods transport has a significant impact on the Group’s CO2
emissions, and the brands have been working to reducethe distances covered during the supply and delivery ofgoods, to improve truck load factors and the performanceof truck fleets, and to develop alternative means oftransport.
In 2016, further efforts were made to optimise freightload factors on the multi-brand logistics platform inSwitzerland. After careful evaluation of rounds and theoptimal load factor, cardboard was formatted in threenew types. Several initiatives were performed on theplatform in 2016:
• work continued on truck loading levels, with the use ofdual-bridge trucks for example;
• aircraft from transport service providers were selectedon the basis of fuel efficiency and flight plan optimisation;
• all transport contracts were reviewed to ensure theyrequired the provider to leave the smallest possiblefootprint in performing the service. For example, in roadtransport, contracts include the obligation to perform
the transport with euro 6 trucks. Since 2015, the systemhas been extended to air transport, with a provision cappingair emissions added to the contract.
Kering logistics platform is working on reducing packaging,which can result in an improvement in the load factor oftrucks, and ultimately a reduction in the number of truckson the roads.
Delivery schedule optimisation is another importantfocus of work on reducing emissions. In the United States,to consolidate loads and ensure only full containers aredispatched, Volcom negotiates delivery dates with freightcompanies and minimises the number of departure ports.This also ensures that trucks carrying goods to warehousesfrom the port of arrival are loaded at maximum capacity.By grouping loads into a single weekly delivery, VolcomCanada reduced the number of dispatches by 21% in2016 compared with 2015. Volcom also works on cuttingout unnecessary transport stages; for example, productsmade in Asia and intended for Asian or South Americanmarkets will be dispatched directly to these regionsinstead of transiting via the United States. In 2016, thismeasure bypassed unnecessary transport via the UnitedStates for a total of 366,000 products, considerably reducingthe carbon footprint of dispatches to Latin America andAsia. We also note that Volcom France shares transportationwith other brands in its sector for up to 12% of its imports.
B2C transport-related CO2 emissions in 2016 and proforma year-on-year change (in tonnes)
Related CO2 emissions 2016-2015 proforma scope Year-on-year(tonnes of CO2) 2016 2015 change
B2C – own vehicle fleets 1.3 1.3 1.8 -29.2%
B2C – subcontractors’ vehicles 6.7 6.7 4.0 +66.9%
TOTAL 8.0 8.0 5.8 +37.3%
The Group’s proforma B2B transport emissions increasedby 41.3% in 2016. The year-on-year increase in this itemmainly reflects significant growth in the Group’s businessin 2016 as well as greater use of air transport for standardand express delivery against the backdrop of strongdemand for in-store availability of goods.
The significant increase in express delivery resulted inpart from improved reporting of domestic channels incertain countries in Asia.
Proforma year-on-year change in CO2 emissions from B2B transport (in tonnes of CO2)
2016-2015 proforma scope Year-on-year2016 2015 change
Road freight 12,424 12,539 -1.0%Shipping 21,000 19,385 +8.3%Air freight 82,819 63,024 +31.4%Rail freight 385 550 -29.9%
Express air delivery 33,295 12,839 +159.3%Express road delivery 8,818 3,974 +121.9%
TOTAL EMISSIONS 158,741 112,311 +41.3%
3REDUCING OUR ENVIRONMENTAL IMPACT ~ SUSTAINABILITY
1012016 Reference Document ~ Kering

CO2 emissions associated with employee business travelamounted to 48,590 tonnes in 2016. On a proformabasis, emissions increased by 17%. The increase is partlyattributable to Kering’s transformation to an integratedgroup and the ensuing team-building work conducted byKering corporate teams across the world. Expansion ofthe scope of coverage is another factor. In 2016, it coversbusiness air travel for 30 additional brands / countries.
Some brands took the Group’s policy even further byfactoring environmental criteria into the selection ofcompany vehicles: Bottega Veneta, for instance, continuedthe renewal of its fleet with the inclusion of new hybrid
vehicles, which accounted for 55% of its fleet in 2016, upfrom 43% in 2015. We see the same trend with Gucci, whosehead-office fleet included 32 hybrid vehicles in 2016, upfrom 19 in 2015, plus 3 electric vehicles. Emissions acrossthe PUMA fleet fell from an average 122 g / km per vehicleto 118 g / km. For taxi journeys in the United Kingdom,Stella McCartney only uses companies offering hybridvehicles. Brands also encourage the use of publictransport to reduce CO2 emissions arising from personneltravel. Bottega Veneta and the Kering logistics platform, forexample, provide employees with a free shuttle service inItaly and Switzerland.
Business travel
CO2 emissions from business travel in 2016 and proforma year-on-year change (in tonnes of CO2)
Related CO22016-2015 proforma scope Year-on-year
emissions (tonnes) 2016 2015 change
Business air travel 40,393 37,059 29,288 +27%Company cars 8,197 8,197 9,387 -13%
TOTAL 48,590 45,256 38,675 +17%
Another source of improvement is to change the mode oftransport wherever possible. PUMA is accordingly redirectingsome deliveries to shipping rather than air transport. Theswitch to shipping (highly advantageous, especially fornon-urgent deliveries as with point-of-sale materials,packaging, merchandising items, etc.) was stepped up in2016, as we can see from the shipping-related emissionlevels reported. The Luxury business’ stores in the MiddleEast already apply this policy by routing all packaging bysea. When air freight is required, the Group’s brandsfavour direct connections.
The Kering logistics platform continued its “High StreetFashion” partnership with TNT and ND Logistics to deploysustainable delivery strategies in major European shoppingdistricts using electric cars. Launched in 2012, the projectcovers the entire distribution chain in Switzerland, andthe following cities: Amsterdam, Milan, Florence, Paris,Munich, Barcelona and Berlin. Stella McCartney is involvedin the Last Mile Green programme in Italy.
In Paris, all daily shuttles between Saint Laurent storesare by electric vehicle only. Charging stations have beeninstalled at the brand’s headquarters in the Frenchcapital. The use of clean vehicles enabled Saint Laurent tosave 800 litres of fuel in 2016.
3 SUSTAINABILITY ~ REDUCING OUR ENVIRONMENTAL IMPACT
102 Kering ~ 2016 Reference Document

On a proforma basis, overall emissions across the Keringgroup rose by 11.6% due to increases in B2B transportand business travel (Scope 3). Scope 1 and 2 emissions
fell by close to 11% due to reductions in energy consumptionand increased use of electricity from renewable sources.
PROFORMA YEAR-ON-YEAR CHANGE IN CO2 EMISSIONS (IN TONNES)
2016-2015 proforma scope Year-on-year2016 2015 change
Scope 1 18,474 20,092 -8.1%Scope 2 108,445 122,370 -11.4%Scope 3 220,083 168,343 +30.7%
TOTAL 347,002 310,805 +11.6%
In 2016, 94.7% of the Kering group’s CO2 emissions were notunder its direct control as noted in the EP&L. Reducingelectricity consumption, switching to renewable energysources, optimising transport and opting for alternative
forms of transport that emit less CO2 neverthelessconstitute effective ways of reducing the Group’s carbonfootprint.
BREAKDOWN OF CO2 EMISSIONS IN 2016
Total: 361,465 tonnes of CO2
The GHG Protocol defines three operational Scopes inrespect to greenhouse gas emissions. To facilitate clarity,Kering publishes its emissions as follows:
• Scope 1 refers to direct emissions attributable to on-site fuel usage and the fuel burnt by the Kering group’sdirectly owned B2C vehicle and company car fleets;
• Scope 2 refers to indirect emissions resulting fromelectricity and steam production;
• Scope 3 refers to emissions resulting from goodstransported by subcontractors (all B2B deliveries andnearly all B2C deliveries) and from most employee airtravel, the production of energy fuels (upstream energyand petrol) and line losses. Emissions attributable tothe production of raw materials by suppliers or toemployee business travel other than by air (by car, train,etc.) are not taken into account.
Emissions testing in accordance with Scopes 1, 2 and 3
CO2 emissions by Scope as per the GHG protocol in 2016 (in tonnes of CO2)
2016
Scope 1 19,229Scope 2 117,003Scope 3 225,233
TOTAL 361,465
3REDUCING OUR ENVIRONMENTAL IMPACT ~ SUSTAINABILITY
1032016 Reference Document ~ Kering
Scope 2 32.4%
Business air travel 11.2%
Upstream energyand petrol 7.2%
Subcontracted B2C transport0.002%
B2B transport43.9%
Electicity andsteam production 32.4%
Directly-owned B2C vehicleand company car fleets 1.8%
Scope 15.3% Scope 3 62.3%
On-sitefuel usage 3.5%

3.4.1. Sustainable use of resources
The Group’s EP&L clearly shows that most environmentalimpacts (75%) are caused upstream of the supply chainby the extraction and production of raw materials andthe initial transformation stage (Tiers 3 and 4). For Kering,critical impacts are generated by the raw materials usedin large quantities whose production can have a significantimpact on the environment (leather, cotton, syntheticfibres, etc.), or by raw materials used in small quantitiesbut whose extraction or production can have a highimpact. This is the case for animal fibres such as wool,cashmere and silk, and for metals and precious stones(gold and diamonds).
Kering has committed to reducing its environmental footprintin the pre-operations phase, starting with the productionof its raw materials. To this end, the Smart Sourcingprogramme, launched in 2013, provides recommendationsand guidance for brands, allowing them to use raw materialsproduced sustainably and responsibly. This projectinvolves the Material Innovation Lab and supply chainmanagement, R&D and sustainability teams workingclosely with the Group and its brands to come up withresponsible sourcing solutions tailored to the specificneeds of each brand.
With the publication of its sustainability objectives in2012, Kering set out basic principles and guidelines onresponsible procurement, consistent with its generalsustainability policy, targets, and existing good practices. Theseguidelines cover responsible procurement, environmentalmanagement and management of chemicals.
As the Group’s sustainability strategy entered a new phase,in 2016 the guidelines were restructured into the KeringStandards, which give fuller details on material and processrequirements. The new Kering Standards specify criteria tobe met by the Group and its suppliers on five main points:traceability, chemicals, social impact, environmentalimpact and animal welfare. They cover leather, preciousskins, fur, cotton, paper, wood, plastic, gold, diamonds,cellulose based fibres, feathers and down. And in 2017coverage will be widened to include wool, silk, syntheticfibres and other metals (silver and brass). Kering Standardshave also been drawn up for the Group’s main productionprocesses, namely tanning, textile manufacture stages andleather work. In 2017 coverage will be extended to includemetal refining and precious stone cutting processes. In2016 Kering also developed a series of species-specificguidelines on animal welfare, working with Group brandsand outside experts. In 2017, these guidelines will beincluded in the new animal welfare programme to berolled out across all Kering’s supply chains.
Some of the Group’s brands apply even tighter measures.Stella McCartney, for example, has always excluded theuse of raw materials of animal origin, such as fur, leather,
3.4. Circular economy
The carbon-offset programme
As defined in 2012 as part of its sustainability targets, Keringcontinues to offset its residual Scope 1 and 2 greenhousegas emissions. In 2016, Kering offset 135,636 tonnes ofthe CO2 emissions that it generated in 2015. Carbon creditshave been purchased with the support of several REDD+(Reducing Emissions from Deforestation and ForestDegradation) programmes, and subject to VCS (VerifiedCarbon Standard) and CCBA (Certification of Competency inBusiness Analysis) certification and audit. This guaranteesnot only the generation of carbon credits, but also theirbenefits for biodiversity and local populations. 63% of thecarbon credits were purchased from Wildlife Works Carbon,of which Kering has been a shareholder since 2012,mainly for the protection and restoration of the KasigauCorridor in Kenya, but also for other REDD+ projects inBrazil and Indonesia. The remaining carbon credits werepurchased from Wildlife Conservation Society, for theMakira forest in Madagascar. These projects contribute tothe protection of more than 750,000 hectares of particularlybiodiversity-rich ecosystems, which represent a resourcefor more than 400,000 people.
The brands also develop their own carbon-offset initiatives.As in 2015, Volcom’s most widely publicised event in Hawaii,the Volcom Pipe Pro, was once again a certified Deep BlueSurf EventTM in 2016. This label, verified by SustainableSurf, an NGO, is awarded on the basis of respect for theenvironment and the ocean. The greenhouse gas emissionsgenerated by the event are fully offset.
In 2016, Bottega Veneta once again offset all the 2015 GHGemissions of its Milan head office, i.e., 385 tonnes of CO2,of which 145 tonnes were offset by Kering. Similarly, 979 tonnes corresponding to the emissions of the newMontebello workshop were offset through Wildlife Worksin 2016, including 357 tonnes of CO2 offset by Kering.
Pursuing further progress, in 2016 Kering joined theInternational Platform for Insetting (IPI). Insetting refers tothe initiatives undertaken by a company, within its ownvalue chain, to combat climate change while at the same timegenerating various social and environmental benefits for boththe Company and its stakeholders. Made up of companies,NGOs and climate change specialists, the IPI platformaims to institutionalise the approach, creating a standardand a block chain register in the initiatives and outcomes.
3 SUSTAINABILITY ~ REDUCING OUR ENVIRONMENTAL IMPACT
104 Kering ~ 2016 Reference Document

precious skins and feathers. And Bottega Veneta productsdo not use fur or stingrays. PUMA took up a tough policyon the use of leather, skins, fur, feathers and wool in2012. PUMA has also banned the use of certain speciessuch as crocodiles and snakes, and certain practices suchas mulesing in merino sheep.
Leather
Leather is one of the key raw materials used by Keringbrands. Cattle and sheep farming and leather processingoperations (including tanning) together represent one ofthe most significant environmental impacts across theGroup’s supply chains (24% of the total impact). A specificworking group (Idea Lab) on leather, involving most ofKering’s brands, has met regularly over the last threeyears, and specifically three times in 2016, to identifysolutions for reducing the environmental impact of theproduction of leather and share best practices (husbandry,traceability, tanning without heavy metals, recycling ofoffcuts, etc.).
In 2016, Kering continued its collaboration with Origem, aconsulting firm specialising in responsible sourcing, tofurther explore the environmental and social challengesfacing the leather (cattle, sheep and goat) industry. Thisstudy will allow the Group and its brands to assess therisks and opportunities stemming from leather suppliesin each of its sourcing countries, and minimise itsenvironmental impacts.
As well as working on its own value chains, Kering is alsocommitted to encouraging the adoption of moresustainable practices industry-wide. In 2016 Kering ranan international workshop to highlight challenges andsolutions in the development of traceable and sustainablecattle leather supply chains. It was attended by 50 peoplefrom the scientific community, civil society, UN organisations,and companies in the household goods, luxury andclothing sectors. The workshop publication addressedthe development of sector-specific initiatives to improvetraceability, certification and consideration of animalwelfare into textile brands’ value chains.
Kering also maintained its commitment with partnerorganisation the Nicolas Hulot Foundation and variousmeat industry stakeholders to ensure its brandspurchased skins through specific supply chains. The aimis to help the leather industry improve traceability andimplement best practices in animal welfare.
As an example of the positive results achieved here, thetracking systems set up by Gucci and Saint Laurent withtheir tanneries in 2016 ensure traceability of 90% and80% of leather used to produce their leather goodsranges respectively. Other brands implement approachesspecific to specific product lines: for example, the high-volume iconic products in Bottega Veneta’s Cabat rangemade entirely from nappa leather are traceable andcertified by ICEC (Institute of Quality Certification for theLeather Sector).
Many brands also have projects to reduce the environmentalimpact of leather tanning. In 2016, Gucci extended theuse of a metal-free tanning process to leather goods in itscruise collection and some of its footwear products, inaddition to the iconic bag and wallet models covered bythis process since 2015. Bottega Veneta also madeprogress on this issue: leather made using a process freefrom chrome and heavy metals topped 140,000 sq.m in2016. The new process reduces water consumptionduring the tanning process by about 30%, and energyrequirements by about 20%.
Stella McCartney does not use leather or fur in itsproducts, in keeping with the commitments of the brandand its Creative Director. Stella McCartney has selected analternative bioplastic leather with a coating created from50% non-edible vegetable oil to produce shoes, bags andaccessories.
PUMA is also striving to reduce the environmental footprintof its leather production by encouraging its footwearsuppliers to work with tanneries that belong to the LeatherWorking Group, which brings together a wide range ofstakeholders committed to improving environmentalstewardship in the leather goods industry. The LeatherWorking Group has developed a dual rating system formember tanneries: Gold, Silver or Bronze to describeenvironmental performance; and A, B or C for the qualityof the traceability of skins. In 2016, 94% of the leather usedby PUMA came from LWG-certified tanneries. And 18% ofPUMA supplies from LWG-certified tanneries in 2016 wererated A or B for traceability. Under its 10for20 sustainabilitystrategy, PUMA is committed to improving traceability.
Volcom sources all the leather for its footwear divisionthrough LWG members’ tanneries.
Textile fibres
Kering set up the Materials Innovation Lab (MIL) to assistbrands under its Smart Sourcing programme in 2013.Based in Italy, the MIL provides technical support to theGroup’s brands in order to identify sustainable rawmaterials for their collections. In addition to their closecollaboration with Kering Sustainability Department, theMIL’s team of experts work with individual brands andtheir respective suppliers in order to integrate these newmore sustainable textiles into the brand’s supply chain.The MIL now boasts a library of over 2,000 certifiedfabrics and an in-house evaluation tool, which is basedon EP&L learning and assesses fabrics’ environmentalimpacts. The MIL primarily focuses on supporting theGroup’s Luxury ready-to-wear brands, and as of 2016 hasextended its services to now also cater to the Group’sSport & Lifestyle brands on a case-by-case basis.
In 2016, special attention was given to organic cotton. Akey material for the Group, cotton causes a significantenvironmental impact, as shown in the EP&L. Conventionalcotton is grown using pesticides and fertilisers, and organiccotton can reduce the resulting environmental impact by
3REDUCING OUR ENVIRONMENTAL IMPACT ~ SUSTAINABILITY
1052016 Reference Document ~ Kering
up to 80%. Kering therefore encourages its brands to stepup the use of organic cotton in their collections. It doesthis in two ways, through the Kering Standards andthrough its new Group-wide purchasing platform.
• Kering Standards on cotton specify full traceability (toavoid sourcing from high-risk countries, as regardsenvironmental and social impacts), and restricted useof chemicals and pesticides. To ensure these standardsare met, Kering encourages the use of organic cotton,with a preference for GOTS (Global Organic TextileStandard) or OCS (Organic Content Standard) certification.Kering’s commitment on 100% compliance with itsstandards by 2025 means that all the cotton usedacross the Group must be of organic origin by this date.
• To support work on reaching this ambitious target, Keringlaunched its Organic Cotton Platform (OCP) in 2016,offering brands technical and financial support to helpthem overcome the initial difficulties in switchingsourcing to organic cotton. Five of the brands thatsubmitted sourcing projects to the OCP platform duringthe year obtained finance and technical support onpoints such as price difference absorption, costs entailedby developing new samples, design of marketingcampaigns on organic cotton, and auditing of newsuppliers with organic produce certifications. Throughthis platform more than 185 tonnes of GOTS-certifiedorganic cotton were purchased in 2016, increasing theshare of organic cotton to 21% of purchases for luxurybrands. These achievements form a sound foundationon which Kering can now build in order to developsimilar mechanisms in other textile supply chains.
With the Cotton Connect Organisation, Kering continuedwith the Heritage Cotton Project in India in 2016, workingdirectly with around a hundred organic cotton farmers toimprove cotton yield and quality through training andagricultural advice. The programme also includes a socialmodule involving community education to addresshealth and safety issues, counter child labour andimprove access to education.
In addition, as co-founder alongside Textile Exchange ofthe Organic Cotton Accelerator (OCA), Kering continuedin 2016 its support for the expansion of organic cottonfarming and the market for such cotton. Companiesjoining the OCA undertake to comply with a number ofguiding principles, such as promoting organic cottonand improving the environmental, social and economicaspects of production conditions. Main OCA operationsin 2016 included a pilot agricultural programme, a surveyon organic seed integrity, and support for work by the TextileExchange and GOTS on setting up a traceability database.
Kering also contributed to the work of the Textile Exchange’sOrganic Cotton Roundtable on a people-centred businessmodel based on organic farming practices. Specifically,Kering backed work on evaluating the positive impactmade by organic cotton procurement on UN SustainableDevelopment Goals for farmers, especially as regards
parity and working conditions.
These initiatives primarily support the policies of Kering’sLuxury brands, whose use of organic cotton rose significantlyin 2016. Alexander McQueen used more than 18,000 kgof organic cotton for its men’s ready-to-wear collectionsin 2016. Bottega Veneta worked towards switching all itsflannel bags, which account for 80% of its cottonconsumption in all, to organic cotton in 2016. These bagswill be available in stores from 2017. Stella McCartneycontinues to use organic cotton (in its jeans, for example,which account for more than 80% of the brand’s overallcotton procurement), focusing on GOTS (Global OrganicTextile Standard) and OCS (Organic Cotton Standard)certifications to ensure the highest standards in terms oftraceability and environmental impact along the entiretextile production chain. Stella McCartney also supportsthe Cottonforlife project in Egypt, a five-year programmeon developing Egyptian cotton plantation that includes astrong emphasis on social issues. This programme hasalready produced an extra-fine NILO fibre that is provinghighly successful with many luxury brands.
In 2016, PUMA joined the Better Cotton Initiative (BCI),which connects stakeholders across the cotton sector,from farm to store, to promote measurable and continuousimprovements for the environment, farming communitiesand the economies of cotton-producing regions. Consistentwith the targets set under its 10for20 strategy PUMA usedclose to 3,000 tonnes of BCI cotton in 2016, which accountsfor nearly 20% of the overall cotton procurement for itstextile product lines.
For wool, Kering and the MIL continued to identify newsources of high-quality fibres that meet the Group’ssustainability standards, especially as regards farmingpractices and animal welfare. For example, Kering and itsbrands visited wool supplier farms and began workdirectly with farmers to verify their practices. In addition,new, sustainable, sources of mohair and camelid (cameland guanaco) wool are been examined with a view tooffering brands sustainable luxury materials.
Research and experimentation work has been carried outwith a view to alleviating the significant environmentalimpact (as revealed in the Kering EP&L) involved in theproduction of cashmere, an archetypal luxury material. In2015, inspired by a Wildlife Conservation Society study,Kering launched a programme in the Gobi Desert topromote responsible production of high-quality cashmerein partnership with several cooperatives of nomadicshepherds, represent 270 households and 160,000 goats.As well as developing farmer cooperatives to improve woolquality, this initiative puts a strong emphasis on grazingpractices, protection of biodiversity and improvements inanimal welfare. Kering placed its first order for cashmereunder this project in 2016, bringing in 2.8 tonnes of virgincashmere through its supply chains. This project shouldbe producing larger quantities of quality wool in the yearsto come. To step up promotion and development ofresponsible cashmere provision in Mongolia, the Group is
3 SUSTAINABILITY ~ REDUCING OUR ENVIRONMENTAL IMPACT
106 Kering ~ 2016 Reference Document

also a founding member of the Sustainable Fibre Alliance(SFA), which focuses primarily on training for livestockfarmers and promotion on sustainable cashmere.
Alongside these initiatives on changing the cashmereindustry, some of the Group’s Luxury brands, like Gucciand Stella McCartney, also make massive use of cashmerefibres from production offcuts, a practice that greatlyimproves industry efficiency and lightens the pressure onnatural habitats.
Precious skins and furs
Because precious skins such as crocodile skin and snakeskin are important raw materials, Kering places a strongemphasis on sustainable sourcing that is also respectfulof the strictest standards of animal welfare. Over the pastfive years, the Group and its brands have supported arange of initiatives on sustainable supply chains forcrocodiles and pythons. On these initiatives, the brands’sustainability departments and the Group industrialdivision (which manages its own tanneries and incomingsupplies) liaise with various outside experts.
The Group and its brands comply with national andinternational legislation and regulations on the trade ofprecious skins: all skins of species catalogued asendangered or vulnerable by CITES (Convention onInternational Trade in Endangered Species) are obtainedwith certificates attesting to their legal origin, issued byCITES and the export authority, to ensure that trade doesnot threaten the species in question.
In 2016, Kering continued its commitment to theMadagascar Crocodile Conservation and Sustainable UseProgram (MCCSUP). Under a two-year partnership begunin 2014 with the IUCN Crocodile Specialist Group withKering support, this programme seeks to improve practicesconcerning the trade in Madagascar crocodiles. Theprogramme develops a structure for measuring crocodilepopulations and collection of wild eggs by farmers. It hasalso begun field studies in partnership with AntananarivoUniversity on developing captive populations and onconflicts between humans and wild crocodiles, todevelop a thorough understanding of the industry.
In 2016 Kering also continued close cooperation with expertsfrom CITES, the IUCN Boa & Python Specialist Group andthe International Trade Center (ITC) within the PythonConservation Partnership (PCP), a joint research andadvisory programme on sustainable and humane pythontrade in South-East Asia. PCP focuses on evaluating thesustainability of python hunting and issues recommen -dations on traceability and verification for farms. It issuesgood-practice guides on animal welfare and measuresthe impact of the python trade on local natural habitatsand socio-economic fibre. PCP is recognised by CITES asan example of excellence in public-private cooperation,and its publications have been reviewed by outside
experts. PCP surveys indicate that it is possible to developsustainable python hunting, in Indonesia in particular;and that this activity is capable of improving naturalhabitats in South-East Asia. Kering is now working ondirect application of these recommendations across itssupply chains, through, for example, training courses forsuppliers. Encouraged by the progress achieved here,Kering is also working with IUCN with a view to industry-wide take-up of the PCP principles.
Sustainability assessment is still pending for some preciousskin supply chains. With this in mind, Bottega Venetaworked with the TRAFFIC NGO (a WWF-IUCN partnership)on a survey to develop a better understanding of the impactsof farming species such as water serpents, cobras andrays. Partial findings from this survey were published in2016, and set milestones for the future development ofsustainable farming processes for these species.
Though Kering brands make limited use of furs, Keringworks closely with Business for Social Responsibility (BSR)on developing a programme to guarantee traceabilityand setting up best practices in animal welfare acrossthese supply chains.
In 2016 the audit protocol for rabbits set up by the Groupin 2015 was finalised, in part by a review by animalwelfare experts from NGOs and other luxury brands. Thefinalised protocol was tested with two suppliers in Francein 2016 then extended to other species including foxes,skunks, mink, coypu and chinchillas. It will be tested atFinnish farms in 2017.
Kering and its brands, including Gucci, Alexander McQueen,Balenciaga and Saint Laurent, take an active part in workon improving traceability and practices here, as activemembers of the BSR working group, which includes theInternational Fur Federation, Fur Europe and NorthAmerican Fur Auctions. In 2017 we should be seeing pilotprojects on traceability and objective evaluation of thevarious existing fur certifications.
Metals and precious stones
Illegal or unregulated mining can give rise to major socialand environmental damage. Whereas small-scale extractionwork can endanger communities by causing serious healthand environmental damage if unregulated, properlymanaged mining can generate responsible developmentfor millions of people. Kering is therefore committed toonly buying metals and precious stones obtained throughactivities that have no harmful impact on the environmentand that generate opportunities for local communities.Since 2012, this Kering group commitment has appliedmost significantly to diamonds and gold. In 2016 it wasextended to silver and precious stones.
The first key stage came in 2014 with the purchase of 55 kgof Fairmined-certified artisanal gold (the largest purchase
3REDUCING OUR ENVIRONMENTAL IMPACT ~ SUSTAINABILITY
1072016 Reference Document ~ Kering

of Fairmined gold to that date). Fairmined artisanal goldis extracted applying the strict standards of the Alliancefor Responsible Mining (ARM), whose criteria cover socialresponsibility, economic development of local communities,working conditions and proper management of chemicals.
Following its initial purchases of responsibly mined gold,Kering developed a dedicated platform enabling Groupbrands to purchase gold certified to RJC Chain of Custody(CoC) standards from selected gold refinery partners. Thispilot platform also manages purchasing of Fairtrade- andFairmined-certified artisanal gold, thus supporting theseinitiatives and participating in their growth. Kering hasissued a Gold Standard document detailing this approachto all its suppliers who use gold on behalf of the Group’sbrands, to involve them in this responsible sourcingprogramme. Purchases handled through the platformtotal more than a tonne of responsibly-mined gold so far,including more than 700 kg in 2016, which gives someidea of the extent to which the system is taking off. Theplatform has a dual objective: as well as committing tobuying gold certified to RJC CoC standards from selectedrefineries, the brands also make contributions to the KeringEthical Gold development fund, which help artisanal miningcommunities run environmental and social projects andobtain certifications. Following this successful experiencewith gold, Kering is considering going ahead with similarprogrammes for silver.
Kering works with its suppliers to ensure that all the diamondsused in its products are certified under the Kimberleyprocess, which aims to guarantee that transactions onthe international market are not used to finance armedconflict. Kering has also worked with its brands to roll outguidelines and good practices on traceability andsustainable sourcing of diamonds. The Group’s mainjewelry brands have taken a step further by joining RJC(Responsible Jewellery Council), an organisation thatpromotes responsible and transparent social andenvironmental practices throughout the jewelry sector,from the mine to the point of sale. These brands includeBoucheron, Gucci, Bottega Veneta and Girard-Perregaux.In 2012, Bottega Veneta and Girard-Perregaux alsoobtained RJC certification for their gold and diamondactivities, following Gucci and Boucheron in 2011. In 2016Pomellato joined RJC and began preliminary work(including the initial audit) with a view to certification in 2017.
In 2016, Kering also took part in a multi-party working
group seeking to develop standards and good practicesin artisanal extraction of precious stones. Guidelines willbe tested in 2017. Kering also launched a survey into theenvironmental impact of artisanal precious stone extractionin 2016, with a view to inclusion in an EP&L upgrade.
Plastics
Consistent with their objective of eliminating PVC fromtheir collections, the Group brands have worked onfinding alternatives to this material. At 99% completion,this programme now focuses on the last few itemsconcerned, and on getting the zero-PVC commitmentacross to suppliers, in contractual terms where appropriate.Some brands have built on this experience to progressfurther still in replacing usual plastics such as TPU byalternatives, such as bioplastics, that have a lesserenvironmental impact. Because of the very manyalternatives available, and the complexity of comparingenvironmental performances, Kering has worked with theFraunhofer Institute to develop an innovative tool thatbuyers can use for rating environmental performance. Thisis based on a simplified lifecycle analysis of environmentalimpacts (CO2 emissions, discharges into water, waterconsumption and waste production) consistent with themethodology applied in the EP&L and backed up byqualitative analysis (average fossil fuel content, foodcompetition, essential ingredients, etc.).
In 2016, MIL also developed a range of plastic materialscompliant with Kering standards on sustainable plastics.
Paper
Paper consumed by the Kering group and its subsidiariescomes from two main sources:
• indirect purchases of paper ordered by service providersoutside the Group (printers and agencies) for printingcommunication media such as reports, posters, mailshotsand point-of-sale advertising;
• office paper.
In 2016, Kering’s overall paper consumption totalled1,869 tonnes. A breakdown by category is presented below.
3 SUSTAINABILITY ~ REDUCING OUR ENVIRONMENTAL IMPACT
108 Kering ~ 2016 Reference Document

Between 2015 and 2016, the Group’s paper consumptiondecreased by close to 23%. This reduction is explainedchiefly by smaller print runs for catalogues and externalcommunication materials. Office paper consumption fellby 6.7%, reflecting the Group’s ongoing efforts to reducepaper consumption and promote paperless alternatives.
In 2016, the proportion of certified (FSC or PEFC) orrecycled paper was 85% across the Group, breaking downas 78% certified paper and 6% recycled paper. Theproportion exceeds 95% in several Kering brands,including Bottega Veneta, Saint Laurent, Stella McCartney,Brioni, Boucheron, Ulysse Nardin and Girard-Perregaux.
Furthermore, various initiatives were continued in 2016,rounding out the extensive list of measures already inplace at the Group’s brands. By way of example, allcatalogues and publications for the Pomellato and Dodojewelry brands are printed on FSC paper. Boucheron’soffice paper is also FSC-certified, and access to printers atthe brand’s head office is by nominative badge, which
helps avoid unnecessary printing. A print-on-demandprinciple is also operative at the Kering head office. UlysseNardin uses FSC-certified office paper, and this is also thecase for the majority of Brioni office paper.
TYPE OF PAPER USED IN 2016 (%)
Paper consumption in 2016 and proforma year-on-year change (tonnes)
Consumption 2016-2015 proforma scope Year-on-yearin 2016 2016 2015 change
Paper – indirect purchases 1,070 1,051 1,520 -30.9%Office paper 799 693 742 -6.7%
TOTAL PAPER 1,869 1,744 2,262 -22.9%
3REDUCING OUR ENVIRONMENTAL IMPACT ~ SUSTAINABILITY
1092016 Reference Document ~ Kering
Certified paper 78.2%
Other paper 15.3%
Recycled paper 6.5%
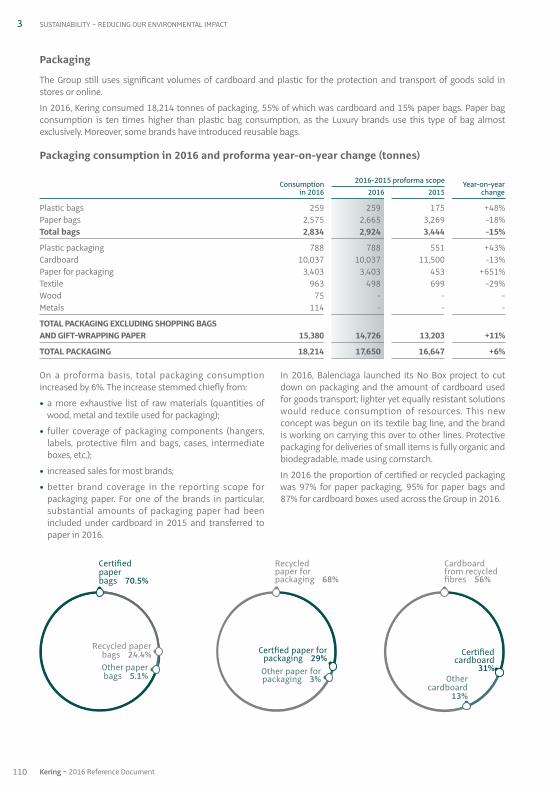
On a proforma basis, total packaging consumptionincreased by 6%. The increase stemmed chiefly from:
• a more exhaustive list of raw materials (quantities ofwood, metal and textile used for packaging);
• fuller coverage of packaging components (hangers,labels, protective film and bags, cases, intermediateboxes, etc.);
• increased sales for most brands;
• better brand coverage in the reporting scope forpackaging paper. For one of the brands in particular,substantial amounts of packaging paper had beenincluded under cardboard in 2015 and transferred topaper in 2016.
In 2016, Balenciaga launched its No Box project to cutdown on packaging and the amount of cardboard usedfor goods transport; lighter yet equally resistant solutionswould reduce consumption of resources. This newconcept was begun on its textile bag line, and the brandis working on carrying this over to other lines. Protectivepackaging for deliveries of small items is fully organic andbiodegradable, made using cornstarch.
In 2016 the proportion of certified or recycled packagingwas 97% for paper packaging, 95% for paper bags and87% for cardboard boxes used across the Group in 2016.
Packaging
The Group still uses significant volumes of cardboard and plastic for the protection and transport of goods sold instores or online.
In 2016, Kering consumed 18,214 tonnes of packaging, 55% of which was cardboard and 15% paper bags. Paper bagconsumption is ten times higher than plastic bag consumption, as the Luxury brands use this type of bag almostexclusively. Moreover, some brands have introduced reusable bags.
Packaging consumption in 2016 and proforma year-on-year change (tonnes)
Consumption 2016-2015 proforma scope Year-on-yearin 2016 2016 2015 change
Plastic bags 259 259 175 +48%Paper bags 2,575 2,665 3,269 -18%Total bags 2,834 2,924 3,444 -15%
Plastic packaging 788 788 551 +43%Cardboard 10,037 10,037 11,500 -13%Paper for packaging 3,403 3,403 453 +651%Textile 963 498 699 -29%Wood 75 - - -Metals 114 - - -
TOTAL PACKAGING EXCLUDING SHOPPING BAGS AND GIFT-WRAPPING PAPER 15,380 14,726 13,203 +11%
TOTAL PACKAGING 18,214 17,650 16,647 +6%
3 SUSTAINABILITY ~ REDUCING OUR ENVIRONMENTAL IMPACT
Recycledpaper forpackaging 68%
Certfied paper forpackaging 29%Other paper forpackaging 3%
Certifiedpaperbags 70.5%
Recycled paperbags 24.4%Other paperbags 5.1%
Cardboardfrom recycledfibres 56%
Certifiedcardboard
31%Other
cardboard13%
110 Kering ~ 2016 Reference Document

In 2016, Kering’s water consumption amounted toapproximately 831,647 cu.m. On a proforma basis, totalwater consumption was steady. The 2% drop in non-industrial water consumption is explained by improvedconsumption control and ongoing replacement of water-wasteful air conditioning systems. Industrial waterconsumption rose by 4.6%, as a result of brands’ increasedbusiness and resumption of normal business at a Grouptannery that had been closed for part of 2015.
3.4.2. Waste prevention and management
Hazardous and non-hazardous waste
As is the case for consumption of packaging, the productionof waste in Kering’s operations stems mainly from theextent of its retail activities. The repackaging of goods andthe use of pallets for transport mostly generate non-hazardous waste. Kering mainly generates packagingwaste and also small quantities of hazardous waste,corresponding to specific items of waste on productionsites and other waste produced mainly in stores andoffices (lighting, ink cartridges, etc.).
Water consumption in 2016 and proforma year-on-year change (cu.m)
Consumption 2016-2015 proforma scope Year-on-yearin 2016 2016 2015 change
Industrial water 218,000 218,000 208,481 +4.6%Non-industrial water 613,647 555,490 567,025 -2.0%
TOTAL WATER 831,647 773,490 775,506 -0.3%
Many brands also promote the use of certified or recycledmaterials for packaging. All Stella McCartney packaging ismade from FSC-certified cardboard and paper. FSCcertification also applies to Boucheron check-out bags andto all paper and cardboard customer packaging at AlexanderMcQueen and Dodo. A new type of customer packaging,fully FSC-certified and containing 50% recycled materials,was developed by Bottega Veneta in 2014. It was widelyused in 2015 and 2016. Saint Laurent developed a newenvironment-friendly shoebox packaging, which avoidedthe use of 5 tonnes of plastic in 2016. All the brand’scustomer packaging made of paper and cardboard isFSC-certified. The Brioni, Gucci, Pomellato and Balenciagabrands also all use substantial quantities of FSC-certifiedmaterials in their packaging.
PUMA shoeboxes, which account for more than 80% of itsshoes division packaging materials, are also FSC-certified,as are the paper bags used in the brand’s flagship stores.
Brands’ efforts to reduce the environmental impact of theirpackaging materials do not stop at customer packaging.Brioni, for example, uses EcoPure® biodegradable plasticfor internal transport packaging.
Water
Given the nature of the Group’s operations, the bulk of itsindustrial water consumption is attributable to tanneries.
While none are located in water-stressed zones, thebrands are still working tirelessly to come up with innovativetanning processes that eliminate heavy metals and useless water.
Across the Group, 74% of water consumed is used for domesticpurposes (store cleaning, lavatories, air conditioning, etc.).Consequently, the direct environmental impact of theGroup’s water consumption is low.
Kering brands nevertheless run a number of initiatives onreducing water consumption. Gucci, for example, informsits stores on good practices in water management, withthe publication Gucci Technical Guidelines for theSustainable Management of Stores. Bottega Venetacollects rain water for garden watering and waterfountains at its Montebello site.
Kering is applying its EP&L approach to conduct an innovativereview of responsible water management across itsentire production chain. Indirect water consumptionlinked to the use of agricultural raw materials like cottonconstitutes an environmental issue that Kering is strivingto quantify and address.
PUMA’s SAVE programme, for example, seeks to reducethe use of water resources across its supply chain. The 35 suppliers involved in this programme save a totalexceeding 600,000 cu.m of water per year.
3REDUCING OUR ENVIRONMENTAL IMPACT ~ SUSTAINABILITY
1112016 Reference Document ~ Kering

The Kering group recycled or reused as a source of energy53.1% of its hazardous waste and 69.3% of its non-hazardous waste, resulting in an overall recycling andwaste-for-power rate of approximately 69%.
In 2016, Volcom continued to promote styrofoam recyclingthrough its Waste to Wave programme. In partnershipwith the Sustainable Surf NGO, polystyrene is sent to alocal recycling company to be reused in the manufactureof new products, including surfboards. Taking a stepfurther, Volcom also recycles worn skateboard ramps tomake store shelving and uses worn store display units tomake skateboard ramps. Event banners are reconditionedto make surfboard and snowboard bags. At events run byVolcom, wastebins are provided to the public through apartnership with Repreve, suppliers of recycled PE fibre,under an awareness-raising operation on technology forrecycling plastic bottles to make clothing fibres.
In 2011, Balenciaga adopted waste sorting at its main sitesin Paris. The brand works with Greenwishes, an externalcompany specialising in the recovery and recycling ofconventional office waste (paper, envelopes, flyers, etc.),as well as cardboard, plastic, cans and above all fabric. Sincethe operation began, 68 tonnes of paper and cardboard,3.5 tonnes of plastic and 3.4 tonnes of fabric have beenrecycled. In 2016, for the third year running, Balenciagacontinued its Second Life Fabrics programme to find newuses for its unused fabrics. Since the project started,nearly 4,000 shopping bags and scarves have beenproduced by workshops employing people in workreintegration programmes and sold within the Group,resulting in the reuse of almost 2,300 metres of fabric.
Along similar lines, Brioni uses leather and fabric offcutsto make bags for shoes and leather goods.
Since April 2013, Bottega Veneta has been working with twocompanies specialising in production waste treatment totransform leather offcuts into organic fertiliser. ILSAcollects waste leather from the brand’s workshops andapplies a specific process that transforms it into fertiliser.The four Bottega Veneta sites taking part in this projectrecycled 141 tonnes of leather offcuts in 2016. Gucci setup a similar programme in 2012 to turn leather and fabricoffcuts into organic fertiliser. The waste material iscollected, shredded and turned into fertiliser by aspecialised company. In 2016, 276 tonnes of Guccioffcuts were used to produce fertiliser. Wool offcuts areused to make regenerated cashmere.
Saint Laurent also continued its efforts to recycle waste andunused materials in 2016. Partnerships were establishedwith two French vocational rehabilitation organisations togive a second life to fabrics used in old collections. Somefabrics are transformed into insulation for buildings or carsby the non-profit clothes recycling organisation, RelaisEmmaüs. Others are reused by the Tissons la Solidaritéassociation to create new clothes. Saint Laurent hasdeveloped an alternative to waste disposal for 95% of itsleather offcuts used for leather goods, through aninnovative recycling and reuse programme that covers allcutting centres in Italy, including its own, which alonerecycled 20 tonnes of leather in 2016. Saint Laurent’sRègles d’Or – its ten golden rules for good environmentalpractice throughout its stores – also have a wastemanagement focus: managers must ensure that all waste
Waste recycling
Rate of recycling and reuse of waste as energy in 2016 (%) % reused in 2016
Non-hazardous waste 69.3%Hazardous waste 53.1%
TOTAL WASTE 69.0%
In 2016, the Kering group’s total waste production amountedto 14,680 tonnes, 98% of which was non-hazardous.
On a proforma basis, hazardous waste decreased by 31.7%.The high 2015 figure was a result of two exceptionalevents, so the 2016 figure marks a “ return to normal ”.
Non-hazardous waste increased by 5.5% proforma. Thisincrease is in line with business growth and improvedtracking of the quantities of waste produced.
Total waste produced in 2016 and proforma year-on-year change (tonnes)
Production 2016-2015 proforma scope Year-on-yearin 2016 2016 2015 change
Non-hazardous waste 14,417 13,887 13,159 +5.5%Hazardous waste (1) 263 262 384 -31.7%
TOTAL WASTE 14,680 14,149 13,543 +4.5%
3 SUSTAINABILITY ~ REDUCING OUR ENVIRONMENTAL IMPACT
112 Kering ~ 2016 Reference Document
(1) Hazardous waste includes batteries, neon lights, waste electrical and electronic equipment, used oil, paint, aerosols, soiled packaging and ink cartridges.

paper, cardboard packaging, glass, plastic bottles, tins andink cartridges are sorted and then recycled. Lastly, throughpooling arrangements with Bottega Veneta, Gucci, StellaMcCartney and Balenciaga, Saint Laurent recycles all wastecardboard from its Parisian stores.
Lastly, Kering sought to allow fashion and design schoolsto benefit from the unused fabrics of its ready-to-wearbrands. Close to 13,000 metres of fabric were given tonine different schools in the United Kingdom, Italy, Franceand Belgium thanks to the participation of Gucci,Alexander McQueen, Balenciaga and Stella McCartney.
3.4.3. Countering food wastage
Though work on countering food wastage does not concernKering activities directly, Kering brands do developprogrammes addressing this issue, especially in Italy,where most sites with personnel canteens are located.Gucci and Bottega Veneta support programmes, onredistributing meals not served in canteens to persons indifficulty. Through this programme, Gucci and Bottega Venetadistributed a total approaching 13,000 meals in 2016.
3.4.4. Management of chemicals
As well as complying with fundamental national andinternational regulations such as REACH (Registration,Evaluation and Authorisation of Chemicals, EuropeanUnion), GB (Guo Bio, China), CPSIA (Consumer Product SafetyImprovement Act, United States), KC Mark (Korea CertificationMark, Korea), Kering has set itself the target of eliminatingall hazardous chemicals from all its brands’ products andproduction processes by 2020. To do so, the Group hasestablished two types of lists of substances subject torestrictions: one for production processes, the ManufacturingRestricted Substance List (MRSL), and one for products,the Product Restricted Substance List (PRSL). There is a singleMRSL covering the entire Group, and several PRSLs, one forthe Luxury business and one for each Sport & Lifestyle brand.
The MRSL is focused on discontinuing the use of dangerouschemicals in the manufacturing process, first to ensurethat workers in the supply chain of the Group’s brands arenot exposed to hazardous substances, and second toreduce toxic discharges into water. Implementation of theMRSL began in 2014 with a pilot phase at 13 key tanneries,including the four Kering tanneries, involving analysis ofmore than 3,500 chemicals, plus in-depth chemical testson samples of leather, water discharge and chemical inputs.In 2015, this pilot scheme was extended to textile suppliers.
In 2016, MRSL implementation continued across bothleather and textile product supply chains.
• Leather: building on the experience acquired during thepilot phase, guidelines, tools and methodologies weredeveloped to step up MRSL implementation. In April 2016,Kering began wide-scale rollout of the MRSL, whichtoday covers 38 key tanneries (36 for leather goods and
two for footwear) accounting for 80% of leather purchasingfor Luxury brand leather goods. The methodology includesidentifying the substances to be replaced and developingphase-out plans for each supplier. Kering has coordinatedthe whole project, steered technical discussions ondata collection with chemicals suppliers, and carriedout additional tests on chemical formulations.
• Textiles: the MRSL rollout pilot phase continued in 2016,involving eleven suppliers (four direct suppliers andseven subcontractors): five dyeing, three printing andthree wool spinning sites, covering the whole productioncycle. The suppliers evaluated the presence of MRSL-listed substances in the chemical formulations used intheir production processes (a total of 2,000 chemicals).Tests were also carried out on 65 substances and 12 wastewater samples.
In April 2016, Kering officially joined the Zero Discharge ofHazardous Chemicals group (ZDHC) as signatory member,after being an observer member since 2015. ZDHC comprisestwenty or so major international brands working to eliminatethe most dangerous chemicals from textile and footwearindustry supply chains by encouraging sector-wide take-up of best practices and sustainable chemicals use. Keringtakes an active part in ZDHC, primarily in research, guidelinesfor MRSL compliance, and the cross-functional subject ofdata and publications, as well as co-leading work on MRSL2.0. PUMA, an active founder member of ZDHC since 2012,sits on its board. It is also a member of AFIRM (Appareland Footwear International Restricted Substances ListManagement Group).
3.4.5. Water discharge and odour pollution
Though the water discharge impact from Kering operationsis not significant by itself, discharge from textile andleather industry production facilities can have a moresignificant environmental impact, especially as regardschemical pollutants. For this reason, water pollution isone of the six environmental impacts covered by theKering EP&L. Because of the large amounts of water usedby tanneries, special wastewater treatment measures arecalled for. Each tannery has its own on-site wastewatertreatment plant. The Group’s two Italian tanneries pre-treat their wastewater at their on-site plants, and sendthe output, which contains chrome, to a special treatmentplant used by several other tanneries, which purifies thewater and recovers the chrome. The Group’s other twotanneries have treatment plants that use sedimentationand chemical-physical and biological treatment techniques.
Through its involvement in ZDHC, PUMA co-led work ondrafting ZDHC guidelines on wastewater, the aim being tointroduce a new standard on wastewater quality across theclothing sector. Following publication in November 2016,these guidelines will be giving rise to pilot projects byseveral ZDHC members, including PUMA, in 2017.
3REDUCING OUR ENVIRONMENTAL IMPACT ~ SUSTAINABILITY
1132016 Reference Document ~ Kering

Preservation of biodiversity is a key component ofKering’s environmental policy. Kering endeavours to seethat its supply chains make a positive direct and indirectimpact on biodiversity, as regards soil and animal andplant life. Work on protection of biodiversity takes threemain focuses: improved measurement of ecosystemservices and biodiversity; help for conservation initiatives;raising awareness in the private sector about the importanceof biodiversity.
Improved measurement of ecosystem services and biodiversity
Kering is committed to improving the assessment ofbiodiversity and ecosystem services in its EP&L, and toimproving the databases that underlie these evaluations.Kering was involved in a number of initiatives here in 2016:
• the results of work conducted under a partnership withthe Stanford University Natural Capital Project and
Cambridge University’s Institute for SustainabilityLeadership will help Kering improve its EP&L and form areference base useful to any company wishing tomeasure its impacts on biodiversity. In May 2016, Keringran a workshop engaging dozens of stakeholders on theneed for improved indicators for tracking biodiversityand ecosystem services when accounting for companies’impacts on the natural capital. Discussions were followedby the publishing of a university study in October 2016;
• in 2016 Kering also joined the steering committee ofthe Product biodiversity footprint initiative on developinga lifecycle analysis methodology on biodiversity impacts.This project, coordinated by ICARE, includes three pilotcompanies, including Kering, and scientific bodies suchas ADEME, MNHN (Museum National d’Histoire Naturelle),Agro ParisTech and UNEP-SETAC.
3.5. Protection of biodiversity
In 2016, PUMA analysed a total of 61 water samples at 44 supplier sites in China, Indonesia, Thailand, Turkey,Taiwan, Vietnam and Bangladesh. These tests are carriedout at sites such as dyeing plants and tanneries, whichhave water-intensive production processes. They coverthe groups of substances listed in the ZHDC MRSL, inincoming water, wastewater before and after treatment,and sludge samples. Compliance rates at the sites testedranged from 84% to 98% in 2016. PUMA also continuedto work with the Institute of Public and EnvironmentalAffairs (IPE), a Chinese NGO, to communicate transparently
with all local stakeholders on the chemicals used andreleased into the environment by the brand’s suppliersand subcontractors.
Tanning processes can also give rise to odour nuisances,because they emit hydrogen sulphide, especially at thestripping stage. Unpleasant odours are managed by an airevacuation system at the stripping tubs, which channelspolluted air through a filter that traps sulphur-bearingparticles and outputs clean air.
3 SUSTAINABILITY ~ REDUCING OUR ENVIRONMENTAL IMPACT
114 Kering ~ 2016 Reference Document

Support for conservation initiatives
Stemming from its strong commitment to biodiversityconservation, Kering and its brands develop variousnatural heritage protection initiatives. In 2016, theGroup’s main projects were on crocodiles, protectionpractices and forest conservation through REDD+.
• Kering continued its support for the programme begunin 2015 on conservation and reintroduction of Siamesecrocodiles in Cambodia. This project, run by the WildlifeConservation Society (WCS), was prompted by the factthat the wild population of this species is very low, incontrast to the many breeding farms. It promotes speciesconservation by reintroducing specimens into the wildand helping farmers raise non-hybrid Siamese crocodiles.This programme was initially concentrated on the Sre-Ambel River and then extended nationwide in Cambodia.As part of this effort, WCS has set up a multi-partyworking group that includes local communities to defineand apply a national strategic plan for the Siamesecrocodile. It trains local communities on monitoring wildpopulations and finances a farm that specialises inraising Siamese crocodiles with a view to reintroductioninto the natural habitat.
Kering also supports a two-year project on setting up asustainable fishing operation on Lake Tonle Sap. Thefish and water serpents in this lake feed the Siamesecrocodiles being bred. Kering wishes to ensure thatsustainability aspect of operations here are part of theresponsible economic development in the region.
• The Group is continuing its cooperation with the WildlifeFriendly Enterprise Network (WFEN) on development ofgood-practice guides that ensure proper allowance forbiodiversity in the farming practices applied for producingraw materials. In 2016, WFEN issued practical recom -mendations on ensuring positive cohabitation betweenendangered local species and sheep farms in SouthAfrica, Australia and Patagonia.
• Kering continues to offset its Scope 1 and 2 residualgreenhouse gas emissions through certificates issuedby REDD+ (Reducing Emissions from Deforestation andForest Degradation) projects. In 2016, 135,636 tonnesof CO2, representing these emissions for 2015, were offsetby protection of 750,000 hectares of biodiversity-richregions in Kenya, Indonesia, Brazil and Madagascar.
Raising awareness in the private sector about the importance of biodiversity
In September 2016, Kering played an active role at theIUCN World Conservation Congress, held every three or fouryears, by organising a workshop on new ways of measuringbiodiversity within companies. Kering also took part in thevarious round tables on the matter. In November 2016, atthe Biodiversity and Business Forum organised in Paris bythe French Minister of the Environment, Kering presentedits various projects. The Forum, organised for the first timeto recognise the creation of the French Biodiversity Agency(Agence française de la Biodiversité), brought togetherover 380 specialists, researchers and CEOs from theprivate and public sector.
3REDUCING OUR ENVIRONMENTAL IMPACT ~ SUSTAINABILITY
1152016 Reference Document ~ Kering

Kering and its brands play a major role in the economicand social fabric of the regions where their sites arelocated. Community involvement is especially importantin the Luxury business: other than their directly operatedworkshops, the Luxury maisons draw their expertise andknow-how from a network of thousands of suppliers,more than 90% of which are based in Italy. Work by theGroup’s brands in that way contributes actively to thepreservation of traditional expertise and excellence incraftsmanship in leatherwork in Italy, as well as watchmakingin the Jura Valley and artistic creation in London, Parisand Milan. Of particular note in 2016 was the developmentof Saint Laurent’s leather workshop in Florence, whichbrought together skilled craftsmen with more than 20years’ experience and young talent in order to maintainthis rare and critical know-how for the brand. In the samevein, Stella McCartney launched the Made in the UnitedKingdom project, which helped revive factories for theproduction of men’s coats in Scotland.
The sustainability of the Group’s brands, particularly inthe Luxury business, relies on the key know-how thatmust be preserved either through specific training orlocal partnerships:
• Gucci continued its partnership with the Made in ItalyTuscany Academy and the Alta Scuola di PelletteriaItaliana to contribute to the preservation of know-howspecific to leather; Saint Laurent has also partneredwith the Alta Scuola di Pelletteria Italiana to develop aspecific programme with a view to building a pool oftalent for the brand;
• Bottega Veneta has supported the Giovanni Fontanavocational training centre since 2012. The brand isinvolved in drawing up three-year educational programmesto train leather craftspeople, and provides tutors forclasses and apprenticeships for students. It also tookpart in the renovation of the school’s leather lab tosupport the growing demand for training and contributeto the excellence of future generations of leathercraftspeople. Similarly, Bottega Veneta develops contentfor the leatherwork design and product developmentcourse at University IUAV of Venice. It also organisestraining sessions on its own premises as part of theScuola dei Maestri Pellettieri workshop to spread andtransmit traditional leatherworking techniques that areso specific and essential to the brand. In 2016, 214 people, both inside and outside the company, were
able to refine their leatherworking techniques (tanning,cutting, sewing, finishing, etc.). Bottega Veneta alsocontinued to offer funding and support to three communitycraft and social cooperatives as part of the ComunitàMontane Femminili project launched in early 2011 in AltoAstico e Posina, located in an Italian valley with highunemployment among women. Trained in intreccioinfilato, a traditional weaving technique used in theproduction of Bottega Veneta’s products, more than 80 women now run their workshops independently, andhave accordingly become direct suppliers to the brand;
• Boucheron is heavily involved in the Paris-based École dela Joaillerie jewelry school through its active participationas a member of the school’s Board of Directors. It offersinternships within its workshops, has established anapprenticeship contract and is sponsoring the class of2016;
• Stella McCartney continued to offer a scholarship to theCentral Saint Martins College of Art and Design, providedthat the chosen student commits to an ethical policy ofnot using fur or leather. Presentations were also given tostudents to share the brand’s vision of sustainable fashion;
• Ulysse Nardin supports the Watch Museum of Le Locleand two training institutes in the field of watchmaking,CIFOM and WOSTEP. This support involves welcomingapprentices, developing the training programme andoffering evening courses for Ulysse Nardin employeesto complete or complement their skills.
In addition to these partnerships, some brands have setup their own schools to help preserve both rare know-how and local employment. Brioni, for instance, offerstraining to 16 young people every year in a three-yeartailoring course at its Scuola di Alta Sartoria, and thenemploys them in its own workshops.
The Group and its brands also sometimes take action inthe form of partnerships with local schools or universitiesin more broadly based programmes, with the aim ofintegrating a sustainability component into the variouscourses.
Gucci has partnered with MAFED (Master in Fashion,Experience & Design Management) at the University ofBocconi in Milan to support a research project onresponsible innovation in luxury.
4. Supporting communitydevelopment
4.1. Community impact
3 SUSTAINABILITY ~ SUPPORTING COMMUNITY DEVELOPMENT
116 Kering ~ 2016 Reference Document

In 2016, Brioni continued its A Scuola di Sostenibilitàprogramme, which aims to welcome students from thePenne region, home to most of its production sites, toraise awareness on sustainability challenges and to showhow these issues are taken into account in the brand’sactivities. Brioni continued a similar programme at theScuola di Alta Sartoria in 2016 to raise awareness onsustainability challenges among future tailors andcraftspeople.
On the Group’s side, Kering has since 2014 been part of astrategic five-year partnership with the Centre forSustainable Fashion (CSF) at the London College of Fashion(LCF) to promote sustainable practices and innovation inthe fashion industry. This partnership focuses on threemain areas:
• the Kering Talks: each year, visionaries and businessleaders from the fashion industry speak on the latestdevelopments in the area of sustainable fashion, sharingtheir vision of the sector and its most innovativeadvances. After the inaugural talk in 2014 by François-Henri Pinault, Chairman and Chief Executive Officer ofKering, and the 2015 talk by Kelly Slater, world surfingchampion and founder of responsible fashion brandOuterknown, Stella McCartney this year laid out hervision of sustainable and ethical fashion;
• the joint development of teaching modules for theSustainable Design programme: Kering and the CSF, incollaboration with a community of experts, researchersand professors, have pooled their skills to create anddeliver a course module taught at the LCF on the supplychain and the environmental impact of sourcingstrategies;
• the Kering Award for Sustainable Fashion: each year,Kering brands and the CSF run a competition open tothird-year BA and MA students. The 2016 winners wereeach awarded a grant of €10,000 for their project andgiven internships at Stella McCartney and Brioni, wherethey benefited from the brands’ expertise as theycontinued to develop their projects.
Kering has also partnered with two schools, Parsons inNew York and Tsinghua in Beijing, through the organisationof conferences, competitions, scholarship programmesand knowledge sharing involving Kering executives.
Furthermore, community impact is at the heart of Kering’ssustainability strategy, of which responsible sourcing ofraw materials is a key element. Practically, responsiblesourcing takes into account both environmental andsocial issues, in particular those related to the productionof raw materials (extraction or crop and animal husbandry).This means that the Group seeks to go beyond simplyreducing any negative impacts to having a truly positiveimpact that directly benefits producers. For example:
• Kering purchases certified artisanal gold from both theinternational NGO Solidaridad and the Peruvian NGORed Social. These organisations support the Group inimplementing the best mining practices while alsocontributing to developing the standard of living oflocal communities;
• the Heritage Cotton project in India enjoys close tieswith a training programme that develops entrepreneurshipamong women so they can improve their standard ofliving through farming practices that help them diversifytheir sources of income;
• the Gobi Desert Cashmere programme works directlywith nomadic shepherds to train and support themwith a view to developing farmer cooperatives and themeans to improve the wool quality while having adirect positive impact on their standard of living.
3SUPPORTING COMMUNITY DEVELOPMENT ~ SUSTAINABILITY
1172016 Reference Document ~ Kering

In an increasingly interconnected world, players in theprivate sector need to pay attention to and maintainrelationships with their partners and stakeholders. Keringtherefore aims to establish quality relationships built ontrust with all its partners, regardless of location, with aview to gaining a full appreciation of their concerns andexpectations, and, as far as possible, incorporating theseaspects into its strategy. For Kering, this means:
• defining a policy for consultation and analysis ofstakeholder expectations at the Group level;
• encouraging brands to develop their own stakeholderdialogue platforms at a more operational level.
Group approach
Materiality
In 2014, Kering called on the expertise of Business forSocial Responsibility (BSR), a consultancy specialised inthe field of stakeholder dialogue, to update its materialityanalysis. To this end, 12 interviews were carried outinternally with senior executives of Kering and its brands.Kering also sent a questionnaire to over 100 externalstakeholders (universities, NGOs, consumer groups, tradeunions, investors and rating agencies, suppliers andbusiness federations). This work was a defining part ofthe development of Kering’s 2025 Sustainability strategy.Dialogue with stakeholders occupies a prominent placein this strategic vision, by virtue of its constructionprocess, since more than 100 people throughout theGroup contributed, but also because it provides for theformalisation of relationships with stakeholders througha Group-wide policy.
Platforms of dialogue and exchange
In order to remain constantly attentive to the key issuesaffecting its stakeholders, Kering participates in a numberof international initiatives:
• SAC: in 2012, Kering became a member of the SustainableApparel Coalition, which brings together major players(brands, retailers, suppliers, NGOs, etc.) from the textile,footwear and accessories sector, who work together toreduce the negative environmental and social impactscaused by the industry worldwide. The Group and itsbrands made a substantial contribution to the creationand implementation of the HIGG Index, a tool thattracks the environmental and social impacts of thetextile, footwear and accessories sector, notably at thesupply chain level. PUMA, Volcom and Stella McCartneyare also stakeholders in the SAC’s work. Of particularnote is the Convergence project, partnered by Kering,which aims to lay down a framework of harmonisedand global social audit procedures;
• WBCSD: in 2011, Kering joined the World BusinessCouncil for Sustainable Development, a multi-sectorplatform of 200 global companies that aims to promotethe role of the business community in achievingsustainability based on economic growth, ecologicalequilibrium and social progress. Kering worked activelywith the WBCSD in 2016, notably by sharing its EP&Lmethodology as part of the development of the NaturalCapital Protocol. Kering is also a member of Entreprisespour l’Environnement, which brings together some 40 French and international companies and which isthe WBCSD French partner;
• NCC: the Natural Capital Coalition is a group of playerswhich in 2016 committed to creating a Natural CapitalProtocol, a document setting out a common frameworkfor measuring and accounting for natural capital. Keringactively contributed to drafting the protocol, notably bysharing its EP&L methodology and by extending theprotocol to the textile and apparel sector;
• LWG: the Leather Working Group unites players in theleather industry in the aim of improving the environmentalperformance and traceability of its member tanneries.Following PUMA’s commitment to the LWG, Kering choseto join the organisation in 2014 in order to speed up thework related to leather traceability and improve theenvironmental footprint of its tanneries. Kering alsoshared PUMA’s progress in terms of the traceability ofleather at the LWG’s 2016 annual conference in Shanghai;
• Textile Exchange: Kering is a member of TextileExchange Europe, and sits on the Board of Directors ofthis body committed to promoting the production anduse of more sustainable textiles throughout theclothing industry;
• European Commission: Kering is taking part in twoinitiatives launched by the European Commission. Thefirst is the Product Environmental Footprint Pilot aimedat setting joint standards for the display of theenvironmental impact of certain product categories.Stella McCartney is leading Kering’s participation in thisinitiative, focusing on shoes. The brand is also currentlytesting the project’s communication phase withcustomers through the use of specific displays in stores.The second initiative is a European working groupaimed at promoting the measurement and recognitionof natural capital by companies and administrations;
• IUCN: the International Union for Conservation of Naturedevelops and maintains cutting-edge conservationscience, particularly with respect to species, ecosystemsand biodiversity, and their impact on human livelihoods.Kering initiated a strong partnership with the IUCN in2013, together with the International Trade Centre (ITC),on python breeding and trading in South-East Asia.
4.2. Stakeholder dialogue
3 SUSTAINABILITY ~ SUPPORTING COMMUNITY DEVELOPMENT
118 Kering ~ 2016 Reference Document

Kering works closely with the IUCN Crocodile SpecialistGroup to guide its initiatives in terms of speciesconservation and sustainable trade. Kering is a memberof the Board of IUCN USA;
• Wildlife Friendly Enterprise Network: Kering is amember of the Board of Directors, and supports movesto include the biodiversity criterion in the production ofkey raw materials (wool, cashmere, etc.);
• ITC: in 2014, Kering and the International Trade Centreinitiated a multi-year programme to support themonitoring and sustainable management of trade inNile crocodiles from Madagascar. IUCN crocodile specialistshave also contributed to this project by laying down itstechnical criteria. The formation of the Madagascar CrocodileConservation and Sustainable Use Programme followsthe recommendation by the Standing Committee of theConvention on International Trade in Endangered Speciesof Wild Fauna and Flora (CITES) to re-open trade in Nilecrocodiles from Madagascar. The programme’s goal isto support sustainable trade that contributes toeconomic opportunities, local livelihoods and the long-term conservation of crocodiles and their habitats. In 2016,work enabled the creation of guidelines for the collectionof eggs in nature, at the same time establishing a systemdesigned to monitor and control practices in the crocodiletrade in Madagascar;
• BSR: Kering is a member of the Responsible Luxury Initiativeworking group of Business for Social Responsibility, whichunites more than 300 companies to promote transparencyand cooperation between Luxury goods companies,particularly with regard to supply chains. The Group isparticularly active in the development of traceabilitystandards for fur and husbandry conditions on farms;
• IPI: in 2016, Kering joined the board of InternationalPlatform for Insetting, a multi-stakeholder initiativeinvolving companies, NGOs and climate experts. Theprinciple of insetting is to offset the carbon footprint byacting directly in the supply chain using blockchaintechnology to promote trust in the system and ensureits transparency.
Brands’ sector approach
In the same way as Kering, the brands are active membersof bodies representing their specific sectors. The Luxurybrands specialised in leather goods, such as Gucci andBottega Veneta, are very active in the work of Italy’s UnioneNazionale Industria Conciaria (UNIC) to improve theenvironmental footprint of tanning processes, as well ashealth and safety conditions in tanneries. The associationof Italian tanners is in turn a member of Cotance, the bodyrepresenting the leather industry in Europe, whichcontributes to the European Commission initiative aimedat defining a standard for measuring the environmentalfootprint of leather goods. The watchmaking industry is alsorepresented through various federations in Switzerland,in particular the Federation of the Swiss Watch Industry,
the Fondation de la Haute Horlogerie and the AssociationSuisse pour la Recherche Horlogère, to which Girard-Perregaux and Ulysse Nardin belong.
Also at the European level, the Group’s brands take part intalks held by the European Cultural and Creative IndustriesAlliance (ECCIA), which brings together Europe’s fiveLuxury goods and creative industry federations, includingComité Colbert in France, Fondazione Altagamma in Italyand Walpole in the United Kingdom.
Some brands go further by creating their own dialogueand exchange mechanisms with their stakeholders. Forexample, in 2016, PUMA organised the thirteenth annualTalks at Banz, an event attended by some 40 participants(suppliers, industry and government representatives,NGOs, sustainability experts, etc.) to address the theme ofdriving change and creating positive impacts. This annualevent enabled PUMA to share its new 10for20 strategy aswell as its action plan more widely with its stakeholders.
Another emblematic example of stakeholder dialogue isthe formation of the Zero Discharge of Hazardous Chemicals(ZDHC) Group in response to the Greenpeace Detox campaignin 2011. PUMA is a leading force in the ZDHC, and publiclypledged in 2011 to remove dangerous chemicals from itsentire production chain by 2020.
True to its strong commitment to the oceans, Volcom hasstrengthened its partnership with the Surfrider Foundationby organising beach clean-ups, involving its customers byoffering them membership of the Foundation for anypurchase over €100.
In the Luxury business, of particular note is Gucci’sinvolvement in Social Accountability International (SAI).This is the body that developed the SA 8000 standard forcompanies to help them ensure respect for fundamentalworkers’ rights in their operations (subsidiaries andsuppliers) worldwide. Gucci is a member of SAI’s AdvisoryCommittee, and hosted a Board of Directors’ meeting at itspremises in Florence in 2016. Gucci’s constructive dialoguewith NGOs dates back several years. It is generally focusedeither on animal rights (National Wildlife Federation,WWF, etc.) or the rights of workers in supply chains(Solidaridad, Rainforest Alliance, etc.).
Stella McCartney has continued its commitment toCanopy to reduce the risk of deforestation associated withthe use of viscose. The brand also renewed its support forthe Ethical Trading Initiative (ETI), which works to promotethe respect of human rights throughout the supply chain.
Dialogue with customers, particularly on aspects ofsustainability, is another strong focus. After conducting asurvey of its customers in Europe and the Middle East in2015, Brioni took the process worldwide, initially targetingstore managers to assess their level of knowledge of thebrand’s sustainability initiatives and to provide them withtools to improve dialogue with customers around thesekey themes for the brand and the Group.
3SUPPORTING COMMUNITY DEVELOPMENT ~ SUSTAINABILITY
1192016 Reference Document ~ Kering

4.3.1. The protection of human rights at Kering and the fight againstcorruption: general framework,guiding principles and keycommitments
The protection of human rights, for all Group employeesas well as for all employees of the supply chains of itsvarious brands, is central to Kering’s ethical commitments.In many respects, it outweighs all other concerns. Theethical approach to business and the Group’s overallbehaviour, as transcribed in the Kering Code of ethics, isconsistently a central part of the Group’s values.
In a codified practice dating back to 1996, and buildingon a first version of a Code released in 2005 and revisedin 2009, the Kering Code of ethics, further updated andagain distributed to all employees in 2013, provides commonfoundations for business conduct and the Group’scommitments. It clearly sets out the ethical principlesthat should be applied everywhere and by all, the Group’svalues, what it believes in, and what it opposes.
In more precise terms, the Code incorporates the majorinternational reference texts in terms of ethics andhuman rights, which include the United Nations’ UniversalDeclaration of Human Rights and the European Conventionon Human Rights, the various conventions of the Interna -tional Labour Organization, especially 29, 105, 138, 182 (child labour and forced labour), 155 (health andsafety of workers), 111 (discrimination), 100 (remuneration),87 and 98 (freedom of association, right to organise andcollective bargaining), the OECD (Organisation forEconomic Co-operation and Development) guidelines formultinational companies, the UN convention on children’srights and the 10 principles of the United Nations GlobalCompact.
Since 2013, the Code has included the Group Suppliers’Charter, which sets out in detail Kering’s specific expectationsof its commercial partners in respect of social andenvironmental issues.
On the issue of preventing corruption, Kering prohibitsany political, trade union, cultural or charitable financingbeing carried out in exchange for direct or indirect material,commercial or personal advantages. The Group complieswith national and international regulations in the preventionof direct and indirect corruption.
The Group’s three Ethics Committees seek to ensurecompliance with the Code of ethics, and may have mattersreferred to them by any employee, either directly or viathe ethics hotline set up for all Group employees worldwidein 2013.
A new milestone was reached in 2015 with the creationof a Compliance structure, led by a Group Chief ComplianceOfficer (CCO) backed up by an international network ofBrand Compliance Officers (BCO) appointed by the CEOsof each brand, to ensure compliance with prevailing legalrequirements, including those relating to the fight againstcorruption and to competition law.
Lastly, refreshed annually and developed directly by theGroup, mandatory ethical training is provided to allemployees of all brands worldwide in nine languages. Itcovers all of the major principles defended by the Code,and also describes potential ethical dilemmas andspecific themes, including the fight against corruption,which is dealt with in a dedicated module each year. Forits third year in 2016, the training programme covered thefight against corruption, workplace behaviour, responsiblesourcing and the traceability of raw materials, and, lastly,business confidentiality.
This framework applies without exception to all of theGroup brands, wherever they operate. The brands are freeto supplement it or to integrate it into their own proceduresand materials, but it remains the common foundationshared by all.
This is, for example, the case at Gucci and Bottega Veneta,which in 2007 and 2009 respectively embarked on theprocess of obtaining SA 8000 (Social Accountability 8000)certification. This global standard takes into account notonly the Company itself, but also the companies in itssupply chain. It requires the certified company and itssuppliers to respect nine corporate responsibilityrequirements – relating to child labour, forced labour,health and safety, freedom of association and collectivebargaining, discrimination, disciplinary practices, workinghours, remuneration and management systems – and tocontinuously improve working conditions by setting up aspecific management system for this purpose. In 2013,Gucci and Bottega Veneta received SA 8000 certificationfor all their activities. Kering’s international logisticsplatform for its Luxury brands (Luxury Goods International,LGI) also enjoys SA 8000 certification.
Gucci is also deeply involved in SAI (Social AccountabilityInternational), which developed the SA 8000 standard. It isa member of SAI’s Advisory Committee, and hosted a Boardof Directors meeting at its premises in Florence in 2016.
Stella McCartney has also developed its own complementarycode of conduct, based on the principles of the ETI (EthicalTrade Initiative), which the maison joined in 2012.
4.3. Relationships with subcontractors and suppliers
3 SUSTAINABILITY ~ SUPPORTING COMMUNITY DEVELOPMENT
120 Kering ~ 2016 Reference Document

PUMA has had its own code of conduct for suppliers since1993. Since 2005, the brand has also issued pocketguides for its employees and suppliers. These guidespresent PUMA’s social, environmental and health andsafety standards. A Social Handbook is also available,with contact details to enable factory employees to reachthe PUMA.Safe team directly in case of breaches of thePUMA Code of Conduct. PUMA’s membership of the FairLabor Association (FLA) means that third parties are alsoentitled to file official complaints with the FLA if they feelthat there has been a breach of the Code. The cooperationbetween PUMA and FLA dates back to 2004, and aims tomanage and implement the required standards in termsof working conditions at suppliers. PUMA.Safe has beencertified by the Fair Labor Association since 2007. In2005, PUMA also undertook to publish an annual updateof its supplier list. An example is PUMA’s commitmentalongside the FLA and other contractor brands, since2015, to implement a national minimum wage policy inGeorgia with local stakeholders. 2016 also saw PUMAcontinue its work on the integration of the RuggieFramework (also known as the United Nations GuidingPrinciples on Business and Human Rights) into itsapproach to human rights. The Ruggie Frameworkdefines the set of Guiding Principles on Business andHuman Rights, and is the reference framework issued bythe United Nations on human rights. The brand revisitedits suppliers’ code of conduct in 2016 to incorporateelements in the fight against corruption.
The Volcom brand is also developing its code of conductthat its suppliers undertake to follow when they work forthe brand.
In 2016, against a backdrop of increasing attention paid bystakeholders and observers of the corporate world onrespect for human rights, Kering examined possible waysof further improving its Code of ethics and the systemsalready in place. Indeed, whether in response to nationallawmakers (like France’s law imposing a duty of vigilanceon parent companies or the United Kingdom’s 2015 ModernSlavery Act, in respect of which Kering has issued astatement available on its website) or from growing softlaw in this area (such as the United Nations Guiding Principleson Business and Human Rights, increasingly used to assesscompanies), the Group aims to work towards increasingefficiency in its policies and procedures. To this end,Kering in 2017 plans to conduct an analysis of the gappotentially existing between its internal procedures andthe UN Guiding Principles, and to examine more closelyhow to further develop its remediation mechanisms andways of addressing employee grievances about its supplychains based on the same principle that already exists forall Group employees worldwide (dedicated ethics hotline).
3SUPPORTING COMMUNITY DEVELOPMENT ~ SUSTAINABILITY
1212016 Reference Document ~ Kering

(1) Geographical breakdown of direct suppliers and contractors to the Luxury activities, managed within the centralised system introduced by Kering in 2016.(2) Geographical breakdown of the production plants of PUMA’s suppliers in 2016.
Luxury Thousands of smallsuppliers, highlyfragmented market,high level ofcraftsmanship
Average number of employees by supplier =less than 100
96% in Western Europe, predominantly in Italy (1):
Strong government presence, comprehensiveand long established and mature labourlaw, highly developed social dialogue
Sport & Lifestyle A few hundred largesuppliers
Average number ofemployees by supplier =more than 1,000
More than 80% in Asia (2):
Less government presence, nascent labour law, social dialogue left to private initiative
4.3.2. Implementation within the Group: the same ambition, the same logic, two separate organisations
No control system, regardless of how mature and tested it is, can guarantee the absence of risk, and it is up to the Groupand its brands to develop with suppliers the most efficient collaborative and control systems in order to keep risk to aminimum and implement any corrective action in cases where non-compliance is identified. A Group comprising leadingglobal brands, Kering operates on two very distinct major markets whose supply chains are structured in very different ways:
Geographical locationActivity Supplier portfolio Size of suppliers of Kering’s suppliers
3 SUSTAINABILITY ~ SUPPORTING COMMUNITY DEVELOPMENT
122 Kering ~ 2016 Reference Document
Italy 92%Eastern Europe 2%
Western Europe 4%(excl. Italy)
Asia2%
Asia 81%
EMEA 12%
Americas 7%

To meet the very different challenges encountered in thesetwo market segments while maintaining the determinationto serve a single ambition, Kering has established twoseparate organisations.
For the Luxury maisons, 2016 marked a turning point inthe approach to supplier management and assessment,with the complete redesign of the organisation. Thechallenge was that different maisons had potentiallyadopted different practices, and distinct audit and riskevaluation methods, and that a single supplier working forseveral of the Group’s brands could potentially facemultiple audits. Therefore, the decision was made in 2015to significantly improve the system’s efficiency and tounify practices and the monitoring of the process acrossKering’s entire Luxury business. On that basis, a singlecentral body allowing Kering to control the compliance ofits Luxury maisons’ suppliers was established in late 2015,and began operating in January 2016. The new organisationis based on six key pillars:
1. Sustainability principles established for all Luxurymaisons in 2015, are divided into three areas:
a) The social aspects related to human rights, labourrights, and health and safety: elimination of childlabour, forced labour, human trafficking in all itsforms and discrimination, compliance with statutoryworking hours, respect for the freedom of associationand the right to collective bargaining, etc.
b) Environmental aspects: compliance with laws aswell as restrictive lists of chemicals defined byKering, environmental management, waste watertreatment, etc.
c) Aspects related to the supply of raw materials andpackaging: respect for animal welfare and the five related freedoms, sourcing and traceabilityrequirements for a number of key materials usedby Kering, prohibition of certain substances and / orcertain sourcing regions (for reasons related to thesocial conditions of production – child or forced labour,for instance – or environmental issues), etc.
These principles are split into two broad categories: thosethat are mandatory due to requirements imposed byinternational and national laws, and those embodyingKering’s additional expectations and best practices in thefield of sustainability. They also make reference toconventions, agreements and major international texts,for which they represent a practical extension (ILOConventions and the United Nations Guiding Principleson Business and Human Rights, Millennium EcosystemAssessment, Ramsar Convention, etc.). These sustainabilityprinciples have been phased into supplier contracts since2016. Each supplier is in turn tasked with imposing theseprinciples on its own subcontractor network, if they have any.
2. Kering provides central management through a teamof 14 people (10 auditors specialised in conductingsupplier audits and monitoring anomalies, and 4 peoplededicated to risk management, control of procedures,and management of information support systems);depending on needs (locations, workload), this teamcan be assisted by an external service providerselected in 2016.
3. Clear and uniform procedures for all Luxury maisons,corresponding to the different stages of the supplierrelationship: activation procedure, monitoring procedure,termination of contract procedure, etc.
4. A risk evaluation used, on the basis of collective data(information in the possession of the relevant maison(s)and self assessment of the supplier prior to activation),to classify suppliers in accordance with three levels ofrisk (high, medium or low) and to construct an auditplan. Audit plans are updated monthly based on theneeds of the various maisons and / or the occurrenceof particular events.
5. A single and comprehensive audit methodology,including not only the key chapters related to socialcompliance, but also the essential elements relatingto health and safety, and environmental management.Containing 88 questions, the comprehensive auditquestionnaire is divided into 12 categories (child labour,forced labour, health and safety, freedom of associationand right to collective bargaining, discrimination,environment, etc.) and aligned with the best standardsin this area, in particular the SA 8000 and SMETAstandards. The results are naturally pooled between themaisons in order to avoid any overlap. Follow-up auditswith a smaller scope focus on the area(s) in whichbreaches of compliance were identified or observationswere made during the first comprehensive audit.
6. Findings classified in four categories and standardresponses to each case:
a) Breaches subject to zero tolerance (relating to themost serious situations liable to be encountered,specifically child labour, forced labour, irregular work,undeclared subcontractor, threats, discrimination,serious breaches of regulations, counterfeit, etc.).
Identification of a zero-tolerance breach triggers theimmediate establishment of a crisis unit bringingtogether the Kering audit team and the relevantmaison(s) to decide on the future of the relationshipwith the supplier: immediate shutdown of theapproval process if the supplier is in the process ofbeing activated but has not started working; anddiscussions about the possibility of remediationand support for the supplier or about the need toterminate the contractual relationship if the supplieris working on orders. The brand is the ultimatedecision-maker on the most appropriate response.
3SUPPORTING COMMUNITY DEVELOPMENT ~ SUSTAINABILITY
1232016 Reference Document ~ Kering

b) Serious breaches of compliance.
The supplier is given one month to resolve theserious breach of compliance, and a follow-upaudit is scheduled to confirm that the issue hasbeen resolved.
c) Moderate breaches of compliance.
The supplier is given three months to resolve themoderate breach of compliance, and a follow-upaudit is scheduled to confirm that the issue hasbeen resolved.
For each of the 12 categories of the comprehensiveaudit questionnaire, a detailed description of whatconstitutes zero-tolerance breaches, seriousbreaches of compliance, moderate breaches ofcompliance and observations has been prepared.For example, in the health and safety category,any situation potentially endangering the lives ofworkers is a zero-tolerance breach; the absence ofmandatory documentation on aspects liable tojeopardise the health or safety of workers (certificaterelating to fire safety for instance) is a seriousbreach of compliance; the absence of mandatorydocumentation other than that addressing areasbearing on the health or safety of workers (minutesof the meeting of site Health and Safety represen -tatives for instance) is a moderate breach ofcompliance; and a deviation from existing procedures(for example, first aid training running behindschedule) is an observation.
d) Observations give rise to a corrective action plan,and are the subject of a dedicated checklist at thenext audit. The supplier has six months to remedythe observation given.
Depending on the results of audits, suppliers areclassified as:
• compliant (no zero-tolerance breaches, no compliancebreaches, serious or moderate, fewer than fiveobservations);
• partially compliant (no zero-tolerance breaches, no seriouscompliance breaches, fewer than five observations);
• non-compliant (cases of zero-tolerance breaches, andnaturally whenever more than five compliance breaches,whether serious or moderate, are identified).
The new organisation, effective since January 1, 2016, wasphased in throughout the year, both for Kering’s Luxurymaisons and for their suppliers. Its deployment will becompleted in 2017 with the addition of the remainingmaisons yet to be brought into the system and theexpansion of supplier coverage to achieve 100% by theend of 2017. The transformation of the supplier compliancemanagement system for Kering’s Luxury business willthen be completed, notwithstanding any developmentsand future improvements made as part of the Group’scontinuous improvement process.
In the Sport & Lifestyle business, PUMA’s audits areperformed by PUMA.Safe (Social Accountability andFundamental Environmental Standards) and nineinternal auditors dedicated to these issues.
The comprehensive audit criteria used by PUMA combinesocial, environmental, and health and safety standardsset by the brand. They allow it to provide an overall ratingat the end of the audit, directly related to the percentageof compliance observed during the process:
• A rating assigned when compliance is between 95%and 100%. Sites of this nature are audited once a year;
• B+ rating assigned when compliance is between 90%and 95%. Breaches of compliance are minor and can becorrected immediately. Sites of this nature are auditedonce a year;
• B- rating assigned when compliance is between 85%and 90%. Sites of this nature are audited once a year. Ifduring the next audit, compliance breaches identifiedthe year before have not been corrected, the overallrating is lowered to C;
• C rating assigned when compliance is between 75%and 85%. Many instances of non-compliance or seriousbreaches of compliance are identified. In such cases, awarning letter is sent to the site management and afollow-up audit is organised within four months tocheck that the issues have been remedied;
• D rating assigned when compliance is below 75%. Thecontractual relationship is terminated or not finalised ifthe supplier was not yet active.
Volcom, lastly, follows a mixed approach by conductingsome audits with its own teams, others being conductedby an external firm commissioned by Volcom directly orby another of the supplier’s clients.
3 SUSTAINABILITY ~ SUPPORTING COMMUNITY DEVELOPMENT
124 Kering ~ 2016 Reference Document

4.3.3. Audits conducted and results obtained in 2016
For the Luxury activities
The supplier base managed by the Kering central teamfor the Luxury maisons has the following characteristics:
• it does not yet integrate all suppliers, 2016 being a yearof transition. The number of suppliers managed centrallyhas been growing, but does not yet cover all suppliers; inparticular, two maisons are to join the system in 2017.Watches & Jewelry brands will join the system in 2017;
• it covers 2,611 suppliers, breaking down as follows:- 22% direct (a supplier is deemed direct when it has
no subcontractor),
- 12% contractors (direct suppliers working for one or moremaisons, which subcontract part of their production),
- 66% subcontractors and suppliers. Note thatunauthorised subcontracting is forbidden.
A total of 1,822 audits were conducted within this portfolioof suppliers in 2016 (comprehensive and follow-up audits).These 1,822 audits revealed findings that break down asfollows:
REMEDIATION OF THE ANOMALIES OBSERVED DURING THE AUDITS CARRIED OUT IN 2016 WITHIN THE LUXURYACTIVITIES (CENTRALISED MANAGEMENT)
Robust corrective action plans were put together followingthe audits, wherever breaches of compliance, andparticularly serious breaches, were identified. Follow-upaudits were then conducted to verify the resolution of theproblem. The few zero-tolerance breaches found duringthe audits were the subject of immediate attention inaccordance with established rules and in coordinationwith the relevant maisons.
In addition to the 1,822 audits conducted by centralteam at Kering, 433 audits were conducted by the twomaisons that are to join the system in 2017, bringing thetotal number of audits for the Luxury activities to 2,255.
For the Sport & Lifestyle activities
Within the PUMA brand, 499 audits were conducted in2016. The audit results under the PUMA rating systemwere as follows:
Audits leading to the award of an A rating 16.36%
Audits leading to the award of a B+ rating 44.86%
Audits leading to the award of a B- rating 27.80%
Audits leading to the award of a C rating 9.34%
Audits leading to the award of a D rating 1.64%
The main challenges, as reported via the system implementedat PUMA for the transmission of grievances from supplychain employees, highlighted four major areas of concern:
BREAKDOWN BY THEME OF THE GRIEVANCES RECEIVED IN 2016 BY PUMA FROM EMPLOYEES IN THE BRAND’SSUPPLY CHAINS
Lastly, the Volcom brand conducted 14 audits in 2016.
This means that a total of 2,768 audits were conductedacross the entire Kering group in 2016.
Responsible purchasing policy
For non-retail (indirect) purchases, the Group’s IndirectPurchasing Department remains committed to responsiblesourcing based on a reciprocal undertaking with suppliersto respect the Kering Code of ethics. It also has specificcommitments tailored to each category of purchases,with buyers identifying the most relevant sustainabilitycriteria. To formalise this process, a responsible purchasingpolicy has been implemented at Group level. It sets outthe priorities to be shared and applied by all Groupemployees to manage purchasing ethically and responsibly.It has been distributed to all Kering employees. Keringfurther formalised these commitments in 2014 bysigning the 2010 “Responsible Supplier Relations” Charterframed by the French Ministry of the Economy and Finance,and the Compagnie des dirigeants et acheteurs de France(French purchasing managers body – CDAF). The Charter’spurpose is to promote the implementation of andcompliance with best practices in relation to suppliers inFrance, and to encourage the major signatory companies
3SUPPORTING COMMUNITY DEVELOPMENT ~ SUSTAINABILITY
1252016 Reference Document ~ Kering
Observations 62.2%
Moderate breachesof compliance 32.0%
Serious breaches of compliance 5.0%
Zerotolerancebreaches
0.8%
Human resources management 33%
Other 24%
Working hours 17%
Pay 26%

to implement a progress approach with their suppliers,especially small and medium-sized enterprises, in orderto develop a true partnership through mutual knowledgeand the respect for each party’s rights and duties.
4.3.4. Engaging with suppliers
Training and raising the awareness of suppliers, andhelping them adopt best practices, is the preferredavenue taken by the Group and its brands to achievetangible improvement in practices across their valuechains. This approach is also based on the recognitionthat the pooling of energies and a coalition approach arepowerful levers for change. The environmental part grewout of the lessons drawn from the EP&L approach and thepredominant role played by supply chains (Tiers 1 to 4) inthe Group’s environmental impact: without supplierssharing Kering’s commitment and belief in the need foraction, potential improvements would be limited.
The Group therefore acts at several levels, as a Group andwithin each of its brands, individually or severally.
In 2016, Kering and its Luxury brands organised two majorsupplier meetings. In April 2016, the main tanneriesworking for the Group’s maisons were invited to an eventdedicated to the management of chemicals, as part ofKering’s commitment to phase out hazardous substancesby 2020. The event brought together 30 key tanneriesalongside production teams from the various maisons.The key lessons from pilot projects conducted in 2015 onthe deployment of the Manufacturing RestrictedSubstance List (MRSL) were presented and discussed, aswas the methodology used to deploy large-scaleimplementation of the MRSL in tanneries.
A second meeting, held in November 2016, brought togetherleading European textile suppliers for a full day ofpresentations and discussions regarding the developmentof more sustainable supply chains. It was held in Novara,near Milan, and was attended by over 430 people, including300 suppliers. The agenda covered the sustainabilitystrategies of both the Group and its Luxury maisons, aswell as aspects including legal and compliance, quality,management of chemicals, social audits, the Group’senvironmental requirements and responsible sourcing viathe Materials Innovation Lab (MIL). Dedicated workshopswere also devoted to the EP&L, the certification process,the implementation of the MRSL and energy efficiencywith the Clean By Design project.
Meanwhile, in December 2016 Bottega Veneta organiseda meeting with 24 of its leather suppliers in the Venetoregion to discuss production, quality assurance, sustainabilityand supply chains in detail.
In addition to meetings devoted to presentation, exchangesand the co-construction of solutions with suppliers, Kering also works with their suppliers on the practicalimplementation of projects aimed at reducing itsenvironmental footprint, as evidenced by the Clean By
Design project. It was the Stella McCartney brand in 2013that first made a commitment to the National ResourceDefence Council (NRDC), as part of the Clean by Designprogramme aimed at reducing textile manufacturers’environmental footprint. In 2014, under the Group’simpetus, Gucci, Alexander McQueen, Saint Laurent,Balenciaga, Bottega Veneta and Brioni also joined theprogramme. A total of 25 suppliers, mostly weaving mills,and printing and dyeing workshops based in Italy, areinvolved in the programme. The initial audits, conductedin 2014 and 2015, identified simple changes that couldreduce their energy costs and greenhouse gas emissions by15% to 25% without affecting production, and with areturn on investment in less than five years. Between late2015 and early 2016, 24 suppliers implemented theseactions, which had generated an annual reduction of3,300 tonnes of CO2 equivalent by the end of 2016. Aspecialist made regular site visits throughout 2016 tomonitor and verify suppliers’ progress.
In the Sport & Lifestyle business, PUMA initiated the SAVE(Sustainable Action and Vision for a better Environment)programme. Launched in 2011 and completed in 2015, itenabled the brand’s 35 key suppliers in Cambodia, China,Bangladesh and Indonesia, through an innovative public-private partnership between PUMA and financial institutionDEG (Deutsche Investitions und Entwicklungsgesellschaft),in collaboration with H&M and ASSIST (Asia Society forSocial Improvement and Sustainable Transformation), tobe trained in the environmental management techniquesestablished by the United Nations Industrial DevelopmentOrganization. Replicating its approach in the SAVEprogramme, in late 2016 PUMA signed an agreement inVietnam with the International Finance Corporation (IFC),a member of the World Bank Group and the world’s pre-eminent development aid institution for activities performedexclusively in the private sector, for a new initiative set tostart in early 2017. Its purpose will be to integratebetween 8 and 10 key suppliers, focusing on energyefficiency and the development of renewable energy.
PUMA is also continuing its extensive programme oftraining and capacity building with its suppliers, andprimarily its key Tier 1 and Tier 2 suppliers. In 2016, trainingfocused on women’s empowerment, the legal integrationof Syrian refugees in the supply chain in Turkey, renewableenergy projects, waste disposal and the management ofwater and waste water.
Volcom meanwhile organised its second annual two-daysuppliers’ meeting in April 2016 in Shanghai (China),known as the Global Compliance Summit. The event wasattended by more than 100 people with its key focus thisyear was on product testing, changes in legislation, auditsand the Kering Code of ethics. In Japan, Volcom alsoraised local suppliers’ awareness of its commitments andactions in favour of sustainability, especially through theReduce, Reuse & Recycle approach, which is mandatoryfrom the product design stage.
3 SUSTAINABILITY ~ SUPPORTING COMMUNITY DEVELOPMENT
126 Kering ~ 2016 Reference Document

Kering’s responsibility towards society extends across thevalue chain, and the Group is keen to help raise awarenessof sustainability issues among consumers, while ensuringthat its products respect their health and the environment.
Consumer health and safety
To enable customers to enjoy the products developed bythe brands safely, Kering has defined a set of quality controlprocedures that comply with the strictest internationalconsumer health, safety and environmental standardsand regulations, such as REACH, US CPSIA, China SAC GBStandards, Japan Industrial Standards (JISL), etc. In 2014,a dedicated structure, the Product Compliance AdvisoryDepartment, was created at Group level. Aimed at poolingservices, its purpose is to advise brands on product testingprotocols to ensure that products comply with the localcharacteristics of each market. It naturally makes considerablereference to the Product Restricted Substance List (PRSL),which specifically lists the substances to be removed orthe threshold not to be exceeded, and applies the highestexisting standards for the disposal of hazardous chemicals.To take into account the pace of technological developmentand progress in chemical research, the PRSL is updatedevery year.
Evidence of the effectiveness of the organisation rolledout by Kering for the management of chemical substanceswas Gucci’s qualification in 2014 for an accreditationissued by China – the Certificate for Company with qualitypre-evaluation on imported garments – which allows thebrand to benefit from reduced customs checks. Thisaccreditation was made possible by the performance ofGucci products, and the robustness of internal systems formanaging product compliance. In 2015, this accreditationwas extended to Bottega Veneta, Stella McCartney andAlexander McQueen, followed by Balenciaga and SaintLaurent in 2016 thanks to the support of the ProductCompliance Advisory Department team.
Some brands also have specific initiatives, such as Girard-Perregaux, whose Quality Department helped create atechnical committee on watchmaking, also involvingUlysse Nardin, Gucci and Boucheron, in 2014. In 2016, theCommittee continued to discuss the framework foraction related to regulatory compliance in respect ofhazardous chemicals and the implementation in theiroperations and with their pool of suppliers of the ProductSubstance Restricted List (PRSL) and the ManufacturingRestricted Substance List (MRSL) drawn up by the Group.
The MRSL covers production processes as opposed toproducts. It also sets out the list of chemicals to beeliminated or restricted.
In the Sport & Lifestyle business, harmonisation has goneeven further, as the entire industry converges towardscommon standards. PUMA has accordingly adopted thePRSL advocated by the Apparel and Footwear InternationalRSL Management Group (AFIRM) and the Zero Dischargeof Hazardous Chemicals (ZDHC) MRSL. Launched in 2011,the ZDHC aims to eliminate all discharges of hazardouschemicals in the textile industry by 2020. It posts annualupdates on the progress made with this programme on itswebsite. PUMA has accordingly discontinued, along with otherindustry players, the use of dozens of chemical substancesdeemed detrimental to human health and the environment,going beyond prevailing regulatory requirements. Thesesubstances include heavy metals, phthalates, organiccompounds, azodyes and chlorobenzenes. In addition tothe PRSL, PUMA’s Handbook for Environmental Standardslays down test procedures to ensure compliance with thePRSL and the given thresholds. The PUMA Handbook forEnvironmental Standards is distributed to the brand’ssuppliers, who must in turn agree to comply with it.
Developing responsible products: a long-term strategy
Broadly speaking, Kering’s strategy is to seek to influencethe way in which products are designed as far up thesupply chain as possible. This is due to two key factors:
• the results of the EP&L carried out at the Group levelclearly show that the biggest environmental concerns arelocated far upstream, in particular at the raw materialproduction stage (farming, cultivation and mining),rather than in the Group’s own operations and sites;
• designing more responsible products is challengingwithout sustainable materials and processes. In termsof sustainability, the most important advances are likely tobe achieved in sourcing and by focusing on processingtechnologies.
The brands are therefore focusing their efforts on graduallyupgrading sourcing and improving their processes. Giventhe time it takes to effect such a major transformation, theportion of the Group’s responsible products in its variouscollections remains modest. The Group’s brands neverthelesseach year strive to broaden their range of sustainableproducts.
4.4. From risk management to development of responsible products
3SUPPORTING COMMUNITY DEVELOPMENT ~ SUSTAINABILITY
1272016 Reference Document ~ Kering

To this end, the Group’s brands can leverage the MaterialsInnovation Lab (MIL), which offers the brands, three yearsafter its launch, a library of more than 2,000 ecologicalfabrics and fibres to use in their collections. Working withKering’s Sustainability Department, the MIL team sharesits expertise with the brands and works with suppliers toidentify new materials that are better for the environment.In 2016, the MIL took the following noteworthy measures:
• development of a collaborative approach with stakeholdersin the value chain, from raw material producers toweavers and spinners, to ensure that the availability ofsustainable materials is in step with production cycles;
• organisation of a conference for ready-to-wear suppliersto raise awareness on Kering’s Sustainability strategy;
• deployment of an online database enabling brands toeasily access sustainable textiles proposed by the MIL;
• provision of information to fabric suppliers on thevarious existing or pending environmental and socialcertifications, supporting them if necessary in obtainingcertification;
• joint R&D with suppliers and research institutes onsustainable textile production and development processesusing the principles of a circular economy.
The MIL is also continuing its work aimed at integratingrecycled material into synthetic fibres such as polyesterand nylon. In particular, 2016 saw the MIL continue itscollaboration with Aquafil, the producer of Econyl®, asustainable and innovative nylon fibre made from fishingnets or other waste nylon.
True to the principle of materiality that guides their actions,Kering and its brands have focused primarily on materialsdeemed strategic by virtue of their volume, theirenvironmental impacts or their weight in collections.
The proportion of organic cotton used in the ready-to-wearcollections continues to increase. Bottega Veneta usednearly 3,000 kg of cotton certified GOTS (Global OrganicTextile Standard) in 2016. The brand also launched amajor project to expand the use of GOTS certified organiccotton in all flannel bags protecting leather goods,jewelry and shoes, about 2 million of which are madeeach year. Organic cotton accounted for more than 80%of the cotton used in Stella McCartney jeans collections in2016. Half of the Alexander McQueen 2017 Fall/Summermen’s collections used organic cotton in 2016. SaintLaurent has in turn chosen to focus the integration oforganic cotton and silk on its permanent collections.Lastly, after testing the integration of organic cotton indifferent items (shirts, jeans, T-shirts, etc.), Gucci plans toexpand its use on a larger scale to cover all collections ofchildren’s products, for example, as well as materials
used for lining ties (organic cotton and wool). In theSport & Lifestyle business, PUMA, which is the biggestuser of cotton in the Group, opted for BCI (Better CottonInitiative) cotton, which accounted for nearly 20% of totalcotton purchases in 2016.
Wool sourcing has also progressed within the Group,particularly on precious fibres such as cashmere. This isdue to an innovative process to recover scrap production,which is sorted by quality and colour to be converted intoa “regenerated” cashmere fibre. Depending on the collectionand the level of quality required, a certain percentage ofvirgin fibre can be added before the spinning stage. Thewhole process takes place in Italy and is environmentallyfriendly, fully traceable and enabled the reuse of 11.4 tonnesof cashmere offcuts in 2016. Gucci has introduced thisinnovative cashmere fibre into its ready-to-wear collections.Starting this year, Stella McCartney has also confined theuse of cashmere in its collections to this “regenerated” fibre.
Moreover, cellulosic fibres such as viscose are the subjectof great attention, because they are made from woodpulp and as such carry significant risks in terms ofdeforestation. This is why Stella McCartney has made acommitment alongside the NGO Canopy to ensure thatall cellulose based fibres used by the brand are traceableand sustainably sourced by 2017, ensuring that theirproduction is not the cause of deforestation in areas withhigh ecosystem value such as Indonesia and Brazil. Thisobjective was achieved in 2016, since all of the viscoseused in the spring 2017 ready-to-wear collections wasderived from sustainably managed forests in Sweden.The entire viscose production chain is traceable: thetransformation of the pulp into filament takes place inGermany before the cloth itself is made in Italy. Thistraceability ensures that the production process does nothave an adverse impact in terms of deforestation.
In leather goods, the brands continued the move tochrome- and metal-free tanning. The switch has now beenmade for the iconic Gucci handbags and customisablesmall leather items, while Bottega Veneta bought morethan 140,000 sq.m of leather tanned without the use ofchrome and metal in 2016, 47% more than in 2015. Keringin 2016 extended metal-free tanning to crocodile skins,notably those used for watchbands designed by itsFrance Croco tannery, a first in the luxury sector. In the nearfuture, Kering plans to publish the results of an analysisinitiated in 2015 on the life cycle of different tanningmethods in order to help create more sustainable tanningpractices in the luxury sector. Also noteworthy is theincreased use of knit technology by PUMA for its runningline to significantly reduce the use of leather in favour of synthetic fibres, which has a far lower environmentalimpact.
3 SUSTAINABILITY ~ SUPPORTING COMMUNITY DEVELOPMENT
128 Kering ~ 2016 Reference Document

In jewelry, Gucci continued to produce its Fairmined-certified gold ring in 2016. Dubbed the Good Gold Icon, itis made from gold mined in artisanal mines in southernPeru. This certification means that the gold used is ethical,or in other words that its extraction complies with stringentsafety conditions, that it has a limited environmentalfootprint, particularly as regards the use of chemicals, andthat a portion of the profit is donated to local communitiesin order to improve their living conditions (buildingschools, transport and drinking water networks, etc.).Moreover, this certification requires traceability along theentire production chain, guaranteeing the provenance ofthe gold used.
To strengthen the range of responsible products, it isessential to promote actions among customers, therebyhelping them identify such products more easily. Thisinvolves an array of actions, such as training for teams instores, displays of products’ environmental characteristicson the web and the development of capsule collectionslike the Brioni Sustainable collection, which includesorganic cotton shirts, and suits and jackets using merinowool of the highest quality (super 150S and 200S) madeto very exacting environmental and animal welfarecriteria. To go further in enhancing customer dialogue onaspects of sustainability, Brioni has developed a limited
edition of 500 notebooks featuring a cover made fromscrap fabric offcuts from Brioni workshops. Thesenotebooks, which were offered for sale to customersduring the 2016 Christmas period, served to initiatediscussion about responsible initiatives taken by thebrand. Half of the sales revenue was donated toHealthySeas, an NGO working for the protection of marineecosystems. The association has been heavily involved inthe recovery of plastic waste to be turned into recyclednylon filament used to make the famous Econyl® fabricused by other Group brands such as Volcom.
To go even further in the development of responsibleproducts and to promote them with customers, SaintLaurent sought, as part of the new strategy, to play theguiding role in defining the criteria to be taken intoaccount to qualify a product as responsible at every stageof its development (design, production, merchandising anddistribution). It will also be important to develop tools tomonitor the performance of these products and ensurethat they make up an increasing part of the variouscollections. This pilot scheme should ultimately enable theGroup to monitor and strengthen its responsible productoffering by ushering in common criteria for all brands.
3SUPPORTING COMMUNITY DEVELOPMENT ~ SUSTAINABILITY
1292016 Reference Document ~ Kering

The Kering Foundation: a greater socialimpact to combat violence against women
Established in 2008, the Kering Foundation – formerlyPPR Corporate Foundation for Women’s Dignity andRights – combats violence against women. The Foundationcommits Kering to a key issue that ties in with its brands’activities and customers, and an area where the Grouphas a vital role to play alongside governments and NGOs.
Since 2014, to step up its international impact, the KeringFoundation has focused its actions on three geographicareas: the Americas, Western Europe and Asia. In each ofthese regions, the Foundation focuses on a main cause(sexual violence, harmful traditional practices and domesticviolence, respectively) and selects a limited number ofNGO partners. It also supports social entrepreneurs,expanding its efforts to raise awareness and preventviolence against women. The Kering Foundation involvesthe Group’s 40,052 employees in its work.
As part of its business development in Asia, the Foundationonce again held regular Steering Committee meetingsevery six months, attended by beneficiary NGOs, expertsin the field and members of the Foundation. The purposeof the Steering Committee is to create a framework fordiscussion and cooperation with partner associations toassess and advance projects receiving support.
• Working alongside NGOs
Active in Europe in the fight against harmful traditionalpractices such as female genital mutilation (FGM) andforced marriage, the Foundation supports the Maison desFemmes in France alongside other corporate foundations(Elle Foundation, Raja, Sanofi Espoir, etc.). In response to thefact that 16% of patients at its maternity clinic have sufferedgenital mutilation, the team at the Centre Hospitalier deSaint-Denis decided to house the full range of servicesaddressing the various problems faced by women whoare vulnerable or victims of violence in a single location.These include access to sexual and reproductive healthcare,social outreach, support and advice for victims ofFGM. Maison des Femmes, as the centre is known, wasinaugurated in June 2016 and offers an undifferentiatedwelcome in a single place, allowing a comprehensiveresponse to all the situations women can face. In additionto three years of financial support, the Foundationprovides skills sponsorship whereby several Keringemployees provide continued support to the project.Funds were raised for the association during the WhiteRibbon For Women campaign in 2016.
In the United Kingdom, the Foundation has joined forceswith Trust For London, the Esmée Fairbairn Foundation,
Comic Relief and the Rosa Fund in supporting theTackling FGM Initiative launched in 2010 to coordinatethe work of grassroots organisations involved in theprevention of FGM through interaction with communities.
As part of this partnership, the Foundation has pledgedits support to two flagship projects:
• a capacity building programme between grassrootsorganisations, through the sharing of best practices thatwill involve men, religious leaders and young people indiscussions about FGM and topics such as human rights;
• mental health training and coaching for the NGOBirmingham and Solihull Women’s Aid (BSWA) throughThe Dahlia Project, a pioneering institution on thesubject in London.
In Asia, the Foundation focuses its action on domesticviolence in China, which affects 25% to 30% of womenaccording to a study conducted by the All-China Women’sFederation in 2004. It accordingly supports the MapleWomen’s Psychological Counselling Center in Beijing, whichprovides telephone support and multi-service coordination(accommodation, medical, psychological and legalassistance) for victims of domestic violence in Beijing. Thesecond project supported by the Foundation since 2015in China, the Zhongze Women’s Legal Counseling andService Center in Beijing, was closed down by a Chinesegovernment decision dated January 30, 2016.
In Hong Kong, the Board of Directors of the Foundationdecided to support the HER Fund as of 2016. HER is awomen’s rights fund that supports three grassrootsassociations to give marginalised women (migrants, ethnicminorities or LGBT) the tools to fight domestic violence. TheHER Fund also supports these structures by strengtheningtheir monitoring, evaluation and communication capacity.
In the Americas, the Foundation continued its support forthe fight against rape on campuses, in particular throughits partnership with the It’s On Us campaign led by CivicNation. One in five women are sexually assaulted on Americancampuses. The It’s On Us campaign is a movement aimingto achieve a cultural sea change by fundamentally shiftingthe perspective on sexual assault on campuses. The projectinvolves a range of partners, with collaborative workalongside student leaders to promote awareness campaignsand implement policy changes on campuses. In April, whichis prevention of sexual assault month in the United States,a week of events is organised to encourage students totake action. During that week in 2016, 410 events wereorganised by and for students in 40 states. Since thebeginning of this campaign, a total of 1,400 events have beenorganised on more than 533 campuses in the UnitedStates, and the petition to put an end to campus violence
4.5. Initiatives carried out by the Kering Foundationand sponsorship programmes
3 SUSTAINABILITY ~ SUPPORTING COMMUNITY DEVELOPMENT
130 Kering ~ 2016 Reference Document

has been signed by more than 360,000 people. Twogrants have been awarded as part of this partnership toorganisations created by student rape victims, namely EndRape On Campus (EROC) and Sexual Health Innovations (SHI).
Furthermore, sensitive to the refugee crisis and in particularthe situation in which it places women, the KeringFoundation continued its support dating back to 2015 forLebanese NGO Restart Center and its project promotingthe socioeconomic integration of 200 Syrian womenrefugees. In 2016, the Foundation began new partnershipswith Gynécologues sans Frontières and Planning Familialin camps in northern France, to offer these women medical,psychological and social support, but also to train NGOstakeholders in the “gender” approach to the deploymentof their activities.
• Partnering with social entrepreneurs acting for the benefit of women
Since 2008, in line with Kering’s entrepreneurial values, theFoundation has provided support to social entrepreneurscombining sustainable business models and solutions tosocial issues. In 2016, the Kering Foundation continuedits support of the Starfish Project, which designs andproduces jewelry in Beijing. Run by and for women victimsof violence, the project won a grant of €30,000 and twoyears’ mentoring with a Kering group executive. Furthermore,as part of a training programme, senior executives of theGroup conducted a one-week assignment aimed atstrengthening the expertise of Starfish and its businessmodel.
Similarly, the Foundation continued its support for WeEnd Violence, a social enterprise dedicated to the preventionof sexual violence in the United States, offering an innovativemodel to raise awareness and change the types ofbehaviour that induce gender-based violence.
• Raising awareness among staff and the general public
Combating violence against women means buildingawareness with a view to changing social representationsand behaviour: the Kering Foundation has made raisingawareness, both among its employees and the generalpublic, a key part of its programme.
When François-Henri Pinault joined forces with FédérationNationale Solidarité Femmes (FNSF) in 2010 to sign aCharter to prevent and combat domestic violence, theGroup pledged to inform and train employees within itsbrands to provide better help for potential victims. Thiswas done first in France and then in Italy, in 2013, inpartnership with Donne in Rete contro la violenza (D.i.Re).In January 2015, the Kering Foundation joined forces withBritish NGO Women’s Aid. In June 2016, the Foundation
extended its activities in the United States alongside theNGOs National Alliance to End Sexual Violence (NAESV)and the National Network to End Domestic Violence(NNEDV). Since 2011, 621 employees have been trainedon domestic violence issues.
To mark the Cannes Film Festival and the Kering for Womenprogramme, the Foundation organised a roundtable inMay 2016. Four speakers discussed the question “Canmovies, the film industry and new forms of communicationcontribute to better addressing the cause of women’srights?” They were:
• Salma Hayek-Pinault, actress, Director and producer,member of the Board of Directors of the Kering Foundation;
• Su Mei Thomson, CEO of the Women’s Foundation inHong Kong;
• Zainab Selbi, founder of Women for Women International,producer of the Nidaa’s Show;
• Lisa Azuelos, Director, producer and screenwriter.
In 2016, on the International Day for the Elimination ofViolence against Women on November 25, the Foundationlaunched the fifth edition of its White Ribbon for Womencampaign.
From November 18 to 27, 50,000 copies of the badge and180,000 copies of stickers designed by Stella McCartneywere distributed in 51 countries. Customers of over 800 Alexander McQueen, McQ, Balenciaga, Boucheron, Brioni,Dodo, Gucci, Pomellato, Qeelin and Stella McCartney stores,as well as the majority of the Group’s employees andcountless partners, journalists and opinion leaders, wereexposed to the campaign in this way.
This year, male ambassadors, namely French footballerAntoine Griezmann, American surfer Kelly Slater, andChinese actor Yang Yang, lent their voice to the campaignto show that the fight to end violence against womenmust be universal. In a series of portraits, the ambassadorsembody the testimonies of women supported by theKering Foundation after being victims of violence. Online,via the hashtag #BeHerVoice to encourage people tospeak out about violence against women, the fifthedition potentially reached more than 1.1 billion people.A crowdfunding campaign was also launched to encouragethe public to participate. The funds raised were paiddirectly to Kering Foundation partners working to supportwomen victims of violence.
In conjunction with this programme, the Kering Foundationunites the Group’s employees around its commitment towomen: their skills, both professional and personal, are avaluable source of support for NGOs and social entrepreneurs.
3SUPPORTING COMMUNITY DEVELOPMENT ~ SUSTAINABILITY
1312016 Reference Document ~ Kering

Since 2014, employees who take two weeks’ solidarityleave for an assignment in a foreign country have beengiven two to four days’ paid leave. Employees who offermore regular support to local organisations are given sixdays. In 2016, the Group gave 60 days’ paid leave forvolunteer work in support of women, including 16 days’pre-departure training. For example, two employees ofKering France and Saint Laurent left to strengthen theskills of the team at Mercado Global, a Guatemalan NGOthat gives indigenous women the means to escape povertyand become agents of change within their communities.
The philanthropy of the Kering group brands
Alongside the initiatives undertaken by the KeringFoundation in the Group’s name, each brand is committedto its own causes, in the form of product donations (bags,shoes, jewelry, etc.), private sales, participation in supportdinners, and long-term partnerships with local associations.Many such actions are carried out for the benefit ofwomen, the theme on which Kering group wants tostrengthen its social involvement.
Multiple initiatives benefiting women
In 2016, 29% of all initiatives carried out by brands,representing a total of 57 initiatives and funding in theamount of €1,247,000, were for the benefit of women.With its initiative Chime For Change, driven in partnershipwith the Global Citizen platform, Gucci is committed tothe rights of women and girls and their access toeducation with the #BooksBuildLives, #SheWill and#LevelTheLaw campaigns. These initiatives came with acrowdfunding platform that has funded more than 420 projects in 88 countries since 2013. The GlobalCitizen festival was held again this year, calling for peopleto take action to achieve the United Nations SustainableDevelopment Objectives, and to give girls and women avoice worldwide. Moreover, Stella McCartney has chosenamong other projects to support UN Women, Women’sAid and 100 Women in Hedge Funds through the provisionof products for auctions. Volcom has done the same withthe Manly Women’s Shelter and the Alice SpringsAboriginal Women’s Shelter in Australia. Boucheron bydonating jewelry and Qeelin by sponsoring the premiereof She Objects have both supported The Women’sFoundation in Hong Kong. She Objects is a documentaryhighlighting the representation of women in the mediaand the correlation with their self-esteem and theviolence they suffer in their professional and personallives. Brioni continues to support a nursery in Penne tofacilitate the work / life balance of its employees. Again inItaly, Pomellato chose CADMI, a member of the D.i.Renetwork, to offer medical and psychological support towomen victims of violence, and Dodo made a donation inkind to Oxfam Italy for women’s rights projects. In theUnited Kingdom, Alexander McQueen donated the €4,790
raised from admission fees to its private sale in Londonto Women’s Aid to fund their Power of Change programme.
The Group’s brands also joined forces for the fifth editionof the White Ribbon for Women campaign with theorganisation of different events, both internally foremployees, and externally within stores for their customers.Brioni, Pomellato and Gucci organised screenings ofdocumentaries, awareness breakfasts and special salesfor associations supported by the Kering Foundation.
Diversified resources for education and training
Thirty-seven percent of the brands’ philanthropic spending –more than €1,615,000 – was devoted to education andtraining in 2016. Brioni and Bottega Veneta gave fabricoffcuts to schools such as the London College of Fashionto allow students to develop their creativity. BottegaVeneta also supported the 2016-2017 curriculum ofItaly’s Accademia di Belle Arti di Brera in the amountof €50,000. Qeelin devoted €65,933 to education insupport of Hong Kong-based partners such as the FrenchInternational School, with product donations for eventsor auctions. PUMA donated more than 10,000 footballsand 400 air pumps to Right to Play, an NGO based in ninecountries, to contribute to the education of young peoplethrough sport and help them overcome the effects ofpoverty and conflict. An official partnership has beenestablished for the three years to come. Boucherondonated a ring to the association Avenir pour les Enfantsdu Monde (AEM) for the education of children in Rwanda.Alexander McQueen donated items for auction to thePrince’s Trust in the United Kingdom, which helps youngpeople access education and enter the workplace. Guccihas given financial support amounting to €1 million toUNICEF for the Girls Empowerment Initiative. Balenciagaalso showed its support for this body by donating apercentage of takings at its special sales. In the UnitedStates, Volcom focused on the training of young peoplethrough sport, in partnership with Soy Surf Camp.
A strong commitment to health and medical research
In 2016, 10% of the brands’ philanthropic activities,representing a total of 121 initiatives and more than€461,800, were devoted to health and medical research.The fight against cancer is a priority for the brands. StellaMcCartney holds an annual awareness campaign on thisissue: a bra has been designed especially for the occasionand a percentage of sales is donated to the LindaMcCartney Centre in the United Kingdom and the BreastCancer Research Foundation in the United States. Withproducts provided by Girard-Perregaux for auction,over €18,000 was raised for the Cancer Foundation in theUnited States for research and support for the mostdisadvantaged people affected by this disease. UlysseNardin supports the Kika Dutch Charity Foundation for
3 SUSTAINABILITY ~ SUPPORTING COMMUNITY DEVELOPMENT
132 Kering ~ 2016 Reference Document

research and the fight against cancer. On October 16,2016, 20 PUMA employees took part in the race againstcancer promoted by Ernährung und Sport bei Krebs e.V,while Volcom provided financial support for the Childrenwith Brain Cancer Fund in Australia. Saint Laurent alsogives its support to Esthétique et Cancer and theinternational NGO We Delete Blood Cancer, and donatesproducts to associations fighting against AIDS. BottegaVeneta supports the Korea Breast Cancer Foundation, andgave more than €25,000 to support Italian associationConvivio in the fight against AIDS. Sixty-two projectssponsored by Gucci are dedicated to health and medicalresearch. They include the Ogaan Cancer Foundation inIndia, the Fondazione Istituto Europeo di Oncologia inItaly and projects in the United States and Canada.
Culture & heritage
Thirty-four percent of the projects implemented by thebrands are in the cultural sector, representing in totalnearly €1.5 million. Brioni has since 1985 supported theScuola di Alta Sartoria school in the Abruzzo region topreserve traditional tailoring skills. The brand is also apartner of the NGO MUSAP Onlus, and in particular ofArazzeria Pennese that produces tapestry artwork.Bottega Veneta has continued its sponsorship of theHammer Museum in the United States for a fourth straightyear with financial support of more than €290,000 for2016. Meanwhile, Gucci has since 2011 been a sponsor ofthe Art Museum of Los Angeles County in the UnitedStates and the Veneranda Fabbrica del Duomo di Milano,contributing to the restoration of the Italian cathedral.Saint Laurent has devoted more than €40,000 to culturalprojects, including the Institut du Costume and theAssociation pour le Rayonnement de l’Opéra National deParis (AROP). In 2016, Balenciaga gave financial supportof €4,000 to the Mona Bismarck American Center for thePromotion of American culture in France.
Lastly, following the natural disasters that hit central Italyduring the summer of 2016, brands operating in theregion sought to offer their support to affected peopleand sites: Bottega Veneta hosted a fundraiser among itsemployees, topping up the amounts raised to bring thetotal to €37,000. Pomellato gave €10,000 to theProtezione Civile Italiana, responsible for prevention andassistance in Italy.
3SUPPORTING COMMUNITY DEVELOPMENT ~ SUSTAINABILITY
1332016 Reference Document ~ Kering

Pursuant to Grenelle II articles R. 225-104 and R. 225-105 Section of theof the French Commercial Code (Code de commerce) GRI Global compact Reference Document
1° Social information
Employment
Total number of employees and breakdown of employees by gender, age and region G4-10 3 to 6 Section 2.1.Hires and redundancies G4-LA1 Section 2.1.Remuneration and changes in remuneration G4-LA13 Section 2.2.
Work organisation
Organisation of working time G4-LA2 3 to 6 Section 2.6.Absenteeism G4-LA6 Section 2.6.
Social dialogue
Organisation of social dialogue, procedures for informing, consulting and negotiating with employees G4-LA4 3 to 6 Section 2.7.Collective bargaining agreements in place within the Group and their impacts on econcomic performance and working conditions of employees G4-LA5 Section 2.7.
Health and safety
Health and safety in the workplace G4-LA6 to 8 3 to 6 Section 2.6.Bargaining agreements signed with trade unions and employee representatives concerning health and safety in the workplace G4-LA6 Section 2.6.Work-related accidents, in particular frequency and severity, and work-related illnesses G4-LA7 Section 2.6.
Training
Training policies G4-LA11 3 to 6 Section 2.4.Total number of training hours G4-LA10 Section 2.4.
Diversity
Measures taken to promote gender equality G4-LA10 3 to 6 Section 2.5.Measures taken to promote the employment and integration of people with disabilities G4-LA12 Section 2.5.Policy concerning the fight against discrimination G4-LA12 and G4-HR3 Section 2.5.
Justification of exclusions
This report contains information on all social, environmentaland societal issues required by the decree governing theapplication of Article 225 of the Grenelle 2 law, with theexception of:
• noise, which is not applicable to Kering’s sectors ofactivity;
• the amount of provisions and guarantees forenvironmental risk, which is not consolidated at Grouplevel and concerns only a very small number of sites(tanneries and production sites).
This information relates to the activities and brands of theGroup’s Luxury and Sport & Lifestyle businesses. Subsidiarieswhose activities are considered to be discontinued underIFRS rules have been deliberately excluded from thescope of the published information.
5. Cross-reference tablepursuant to Articles R. 225-104 and R. 225-105 of the FrenchCommercial Code (Code de commerce) / Global Compact / GRI G4
3 SUSTAINABILITY ~ CROSS-REFERENCE TABLE
134 Kering ~ 2016 Reference Document

Promotion and compliance with the provisions of the ILO conventions
Compliance with freedom of association and the right to collective bargaining G4-HR4 and G4-LA4 3 to 6 Sections 2.3., 2.5. and 4.3.Elimination of discrimination in respect of employment and occupation G4-HR3 and G4-LA13 Sections 2.3. and 2.5.Elimination of forced and compulsory labour G4-HR6 Sections 2.3., 2.5. and 4.3.Effective abolition of child labour G4-HR5 Sections 2.3., 2.5. and 4.3.
2° Environmental information
General environmental policy
Organisation of steps taken to address environmental issues and environmental assessment and certification procedures 7 to 9 Sections 1.3. and 3.1.Initiatives taken to train and raise awareness among employees on environmental protection Section 3.1.Resources assigned to the prevention of environmental risks and pollution G4-EN31 N DAmount of provisions and guarantees covering environmental risks G4-EN31 and G4-EC2 N D
Pollution
Measures taken to prevent, reduce and rectify emissions into air, water and soil that have a significant impact on the environment G4-EN22 to 26 7 to 9 Sections 3.2. to 3.5.Steps taken to address noise and any other form of pollution relating to a specific activity ND
Circular economy
Measures taken to prevent, recycle and reuse waste, and other means of waste recovery and elimination G4-EN23 Sections 3.4. and 4.4.Steps taken to fight against food waste Section 3.4.Water consumption and supply of water in accordance with local regulations G4-EN8 7 to 9 Sections 3.2. and 3.4.Raw materials consumption and measures taken to promote more efficient use G4-EN1 and G4-EN27 Sections 3.2., 3.4. and 4.4.Energy consumption and measures taken to improve energy efficiency and use of renewable energy G4-EN3 to EN7 Sections 3.2. and 3.3.Land use Sections 3.2. and 3.4.
Climate change
Main sources of greenhouse gas emissions generated by the Group’s businesses, in particular through the usage of the goods and services it produces EN16, EN17, EN18, EN19, EN20 7 to 9 Sections 3.2. and 3.3.Adapting to the consequences of climate change EN18 and EC2 Sections 3.2. and 3.3.
Biodiversity
Measures taken to protect and develop biodiversity G4-EN11 to EN14 7 to 9 Section 3.5.
3CROSS-REFERENCE TABLE ~ SUSTAINABILITY
1352016 Reference Document ~ Kering
Pursuant to Grenelle II articles R. 225-104 and R. 225-105 Section of theof the French Commercial Code (Code de commerce) GRI Global compact Reference Document

3° Societal information
Territorial, economic and social impact of the Company’s activities
On employment and regional development G4-EC7 and G4-EC8 1 to 10 Section 4.1.On neighbouring or local populations G4-EC1, 5 and 6 Section 4.1.
Stakeholder engagement
Dialogue with stakeholders G4-24 to 27 1 to 10 Sections 1.1., 4.2. and 4.3.Partnership and sponsorship initiatives Section 4.5.
Subcontracting and suppliers
Incorporating social and environmental issues in the purchasing policy G4-EC9, G4-HR4, 5, 6, 8, 10 1 to 10 Sections 4.3. and 4.4.Scale of outsourcing and steps taken to raise awareness among suppliers and subcontractors with respect to corporate social responsibility Section 4.3.
Fair practices
Steps taken to fight against corruption G4-SO3 to 5 1, 2 and 10 Sections 2.3. and 4.3.Measures taken to promote consumer health and safety G4-PR1 and G4-PR2 Sections 3.4. and 4.4.Steps taken for the protection of human rights G4-HR Sections 2.2. and 4.3.
3 SUSTAINABILITY ~ CROSS-REFERENCE TABLE
136 Kering ~ 2016 Reference Document
Pursuant to Grenelle II articles R. 225-104 and R. 225-105 Section of theof the French Commercial Code (Code de commerce) GRI Global compact Reference Document

6. Report by one of the Statutory Auditors,appointed as independent third party, on the consolidated human resources, environmental andsocial information included in the Management Report
This is a free English translation of the Statutory Auditors’ report issued in French and is provided solely for the convenienceof English-speaking readers. This report should be read in conjunction with, and construed in accordance with, French lawand professional standards applicable in France.
To the Shareholders,
In our capacity as Statutory Auditors of Kering S.A (the “Company”), appointed as independent third party and certifiedby COFRAC under numbers 3-1048(1), we hereby report to you on the consolidated human resources, environmentaland social information for the year ended December 31st, 2016 included in the Management Report (hereinafternamed “CSR Information”), pursuant to article L. 225-102-1 of the French Commercial Code (Code de commerce).
Company’s responsibility
The Board of Directors is responsible for preparing a company’s Management Report including the CSR Informationrequired by article R. 225-105-1 of the French Commercial Code in accordance with the protocols used by the Company(hereinafter the “Guidelines”), summarised in the Management Report and available on request at the HumanResources and Sustainable Development Departments and summarised on Kering Internet website (www.kering.com).
Independence and quality control
Our independence is defined by regulatory texts, the French Code of ethics (Code de déontologie) of our profession andthe requirements of article L. 822-11 of the French Commercial Code. In addition, we have implemented a system ofquality control including documented policies and procedures regarding compliance with the ethical requirements,French professional standards and applicable legal and regulatory requirements.
Statutory Auditor(s)’s responsibility
On the basis of our work, our responsibility is to:
• attest that the required CSR Information is included in the Management Report or, in the event of non-disclosure of apart or all of the CSR Information, that an explanation is provided in accordance with the third paragraph of article R. 225-105 of the French Commercial Code (Attestation regarding the completeness of CSR Information);
• express a limited assurance conclusion that the CSR Information taken as a whole is, in all material respects, fairlypresented in accordance with the Guidelines (Conclusion on the fairness of CSR Information).
Our work involved seven persons and was conducted between October 2016 and March 2017 during a six week period.We were assisted in our work by our sustainability experts.
We performed our work in accordance with the order dated 13 May 2013 defining the conditions under which the independentthird party performs its engagement and the professional guidance issued by the French Institute of Statutory Auditors(Compagnie Nationale des Commissaires aux Comptes) relating to this engagement and with ISAE 3000(2) concerning ourconclusion on the fairness of CSR Information.
3REPORT BY ONE OF THE STATUTORY AUDITORS ~ SUSTAINABILITY
1372016 Reference Document ~ Kering
(1) Whose scope is available at www.cofrac.fr.(2) ISAE 3000 – Assurance engagements other than audits or reviews of historical financial information.

1. Attestation regarding the completeness of CSR Information
Nature and scope of our work
On the basis of interviews with the individuals in charge of the relevant departments, we obtained an understanding ofthe Company’s sustainability strategy regarding human resources and environmental impacts of its activities and itssocial commitments and, where applicable, any actions or programmes arising from them.
We compared the CSR Information presented in the Management Report with the list provided in article R. 225-105-1of the French Commercial Code.
For any consolidated information that is not disclosed, we verified that explanations were provided in accordance witharticle R. 225-105, paragraph 3 of the French Commercial Code.
We verified that the CSR Information covers the scope of consolidation, i.e., the Company, its subsidiaries as defined byarticle L. 233-1 and the controlled entities as defined by article L. 233-3 of the French Commercial Code within thelimitations set out in the methodological note, presented on the Group’s website.
Conclusion
Based on the work performed and given the limitations mentioned above, we attest that the required CSR Informationhas been disclosed in the Management Report.
2. Conclusion on the fairness of CSR Information
Nature and scope of our work
We conducted about twenty interviews with the persons responsible for preparing the CSR Information in thedepartments in charge of collecting the information and, where appropriate, responsible for internal control and riskmanagement procedures, in order to:
• assess the suitability of the Guidelines in terms of their relevance, completeness, reliability, neutrality andunderstandability, and taking into account industry best practices where appropriate;
• verify the implementation of data-collection, compilation, processing and control process to reach completeness andconsistency of the CSR Information and obtain an understanding of the internal control and risk managementprocedures used to prepare the CSR Information.
We determined the nature and scope of our tests and procedures based on the nature and importance of the CSRInformation with respect to the characteristics of the Company, the human resources and environmental challenges ofits activities, its sustainability strategy and industry best practices.
Regarding the CSR Information that we considered to be the most important(1):
• at parent entity, we referred to documentary sources and conducted interviews to corroborate the qualitativeinformation (organisation, policies, actions), performed analytical procedures on the quantitative information andverified, using sampling techniques, the calculations and the consolidation of the data. We also verified that theinformation was consistent and in agreement with the other information in the Management Report;
• at the level of a representative sample of entities / divisions / sites selected by us(2) on the basis of their activity, theircontribution to the consolidated indicators, their location and a risk analysis, we conducted interviews to verify thatprocedures are properly applied, and we performed tests of details, using sampling techniques, in order to verify thecalculations and reconcile the data with the supporting documents. The selected sample of entities and sub-levelsconsolidation represents on average 72% of headcount and between 71% and 100% of quantitative environmentaland societal data disclosed.
3 SUSTAINABILITY ~ REPORT BY ONE OF THE STATUTORY AUDITORS
(1) The concerned quantitative and qualitative information are listed in the annex of this report.(2) Entities audited on environmental and social indicators: Bottega Veneta Italy, Brioni Italy, Gucci China, Ulysse Nardin, Puma et Gucci (sub-levels consolidation);
Entities audited on social indicators only: Gucci Republic of Korea; YSL; Entities audited on environmental indicators only: Caravel, Luxury Tannery, Gucci MPC (packaging consumption), LGI (transport and energies and CO2 associated only).
138 Kering ~ 2016 Reference Document

For the remaining consolidated CSR Information, we assessed its consistency based on our understanding of the Company.
We also assessed the relevance of explanations provided for any information that was not disclosed, either in whole or in part.
We believe that the sampling methods and sample sizes we have used, based on our professional judgement, aresufficient to provide a basis for our limited assurance conclusion; a higher level of assurance would have required us tocarry out more extensive procedures. Due to the use of sampling techniques and other limitations inherent toinformation and internal control systems, the risk of not detecting a material misstatement in the CSR informationcannot be totally eliminated.
Conclusion
Based on the work performed, no material misstatement has come to our attention that causes us to believe that theCSR Information, taken as a whole, is not presented fairly in accordance with the Guidelines.
Neuilly-sur-Seine, March 28, 2017One of the Statutory Auditors
Deloitte & Associés
Frédéric Moulin Julien RivalsPartner Partner, Sustainability Services
3REPORT BY ONE OF THE STATUTORY AUDITORS ~ SUSTAINABILITY
1392016 Reference Document ~ Kering

AppendixCSR information selected by the independent third party
Quantitative social information
Workforce registered on 31 December (breakdown by sex, status, type of contract, geographical region)Allocation of hirings by permanent / non-permanentAllocation of permanent departures by reasonNumber of training hours (excluding safety training)Number of trained peopleNumber of disabled workersFrequency rate and severity rate of work accidentsOverall rate of absenteeism and illnessNumber of collective agreements concluded; overtime (France only)
Qualitative social information
Promotion and respect of ethicsDevelopment of skills and talentsInitiatives on diversitySocial dialogue initiatives
Quantitative environmental information
Energy consumption and associated CO2 emissionsRenewable electricity proportion at Group levelEmissions associated to transport and travelsTons of CO2 offsetPackaging consumptionIndustrial water consumption
Qualitative environmental information
Implementation of the EP&LGovernance & Organisation on sustainability issuesISR index
Quantitative societal information
Number of trained employees as part of Kering’s Charter to prevent and combat domestic violence
Societal information
Information regarding social auditsPartnerships with the Foundation and number of women involved and informedPVC elimination objectivesManagement for the elimination of hazardous chemicalsGold and diamonds responsible purchasingResponsible purchasing of leatherUses of responsibly sourced precious skins and furs
3 SUSTAINABILITY ~ APPENDIX
140 Kering ~ 2016 Reference Document

1412016 Reference Document ~ Kering
CHAPter 4
Corporate governance
1. Kering governance 1421.1. Reference Corporate Governance Code 1421.2. Combination of management roles 1421.3. Complementary nature of the duties of the Chairman
and Chief Executive Officer and the Group Managing Director 1431.4. Balance of power on the Board of Directors 1431.5. Dialogue with Executive Management and operational divisions 144
2. Membership of the Board of Directors and information on Directors and executive corporate officers 145
3. Remuneration of Directors and executive corporate officers 1623.1. Remuneration of executive corporate officers (Chief Executive Officer and Group Managing Director) 1623.2. Remuneration of non-executive corporate officers – Directors’ fees 1713.3. Regulatory information on Directors and executive corporate officers 1733.4. Other information on the Company’s Board of Directors 174
4. Group management 175
5. Report on the total remuneration of executive corporate officers policy 1775.1. 2016 remuneration policy 1775.2. 2017 remuneration policy 189
6. Report by the Chairman of the Board of Directors 1976.1. Membership of the Board of Directors 1976.2. Conditions of preparation and organisation of the work of the Board of Directors 1996.3. Internal control and risk management procedures implemented by the Company 211
7. Statutory Auditors’ report 220

In 2005, PPR adopted a governance structure with aBoard of Directors and appointed François-Henri Pinaultas Chairman of the Board of Directors and Chief ExecutiveOfficer.
Further to discussions of the Appointments Committee,the Board decided to combine the roles of Chairman ofthe Board and Chief Executive Officer and to renew thischoice after the Combined General Meeting of June 18,2013 renewed François-Henri Pinault’s term of office asDirector, considering that this arrangement was more intune with Kering’s specific characteristics. The decision tocombine the roles of Chairman of the Board and ChiefExecutive Officer was considered best suited to theGroup’s organisation, modus operandi and businesses.
In its decision, the Board took particular note of François-Henri Pinault’s specific position as both controllingshareholder and closely involved in conducting theGroup’s business, of which he has in-depth operationalknowledge and extensive experience. The Board alsounderlined the benefits of combining management rolesin the context of the Group’s transformation drive on thegrounds that this guarantees an effective strategicdecision-making process, enables the Group’s economicand financial performance to be optimised, and ensuresstrong, consistent communication.
This arrangement is also aligned with the Group’sshareholder structure, which includes individual shareownership, a controlling shareholder and institutionalshareholders, all of whom have a stake in Kering’s long-term development.
François Pinault, founder of the Group, is Honorary Chairmanof the Board of Directors but is not a Director.
1.2. Combination of management roles
The Company refers to the Corporate Governance Code ofListed Corporations resulting from the consolidation of theOctober 2003 AFEP and MEDEF report, the January 2007and October 2008 AFEP and MEDEF recommendationson the remuneration of Directors and executive corporate
officers and the April 2010 AFEP-MEDEF recommendationconcerning the strengthening of the representation ofwomen within the boards, as amended in November 2015and November 2016 (the revised AFEP-MEDEF Code).
1. Kering governance
1.1. Reference Corporate Governance Code
4 CORPORATE GOVERNANCE ~ KERING GOVERNANCE
142 Kering ~ 2016 Reference Document

The Group strives to ensure and maintain an appropriatebalance of power on its Board and seeks to ensure thatBoard membership is suitably balanced and diverse.Members of the Board have backgrounds in a variety ofindustries, are mainly independent (six out of the ten Boardmembers, excluding the Director representing employees,are classified as independent Directors), and includeseven women.
The operating rules and procedures of the Board ofDirectors are defined by law and the Company’s Articlesof Association along with the internal rules of the Boardand its five specialised Committees (see Chairman’sreport, page 197):
• audit Committee;
• remuneration Committee;
• appointments Committee;
• sustainability Committee;
• strategy & development Committee.
The specific provisions of the Company’s Articles ofAssociation regarding Directors are in line with basic legalrequirements. There are special provisions for the term ofoffice of Directors (four years, renewable), the age limit(no more than one-third of the Directors may be over 70),the Director representing the employees (appointed bythe Kering Works Council) and the minimum number ofshares that each Director must own (500). Concerningthis last point, it should be added that, in accordance withArticle L. 225-25 of the French Commercial Code (Code decommerce), the Director representing employees isexempt from the obligation to hold shares.
In order to ensure a streamlined reappointment processfor Board members, the Combined General Meeting onMay 7, 2009 chose to implement the staggered renewalof the Board of Directors.
Directors are expected to be diligent and fully committed tothe work of the Board and its Committees, which benefitfrom the diverse backgrounds, skills and expertise of theirmembers. Directors with an in-depth, long-standingknowledge of the Group are a perfect complement tonewly appointed Directors who bring a fresh perspectiveon the Group and help it evolve.
Notwithstanding the legal provisions governing theauthorisations required to be granted by the Board(related-party agreements, endorsements, suretyshipsand guarantees, divestments of shareholdings or sale ofreal property, etc.), Article 15 of the Company’s Articles ofAssociation states that the following decisions requirethe prior approval of the Board:
• matters and transactions that have a substantive effecton the strategy of the Company or the Kering group moregenerally, its financial structure or its scope of businessactivity;
• except in the event of a decision by the Annual GeneralMeeting, securities issues of all types that are liable tocause a change in the share capital;
1.4. Balance of power on the Board of Directors
Pursuant to a decision of February 26, 2008, Jean-FrançoisPalus, at that time PPR Chief Financial Officer, was appointedGroup Managing Director. The Combined General Meetingon June 18, 2013 renewed his term of office as Directorfor four years, while the Board of Directors’ meeting afterthe Combined General Meeting renewed his term ofoffice as Group Managing Director for the same period.
Since October 2012, Jean-François Palus has headedKering’s Sport & Lifestyle activities and has also served asChairman of the Board of Directors of PUMA SE sinceDecember 1, 2012. The Group Managing Director is alsodirectly responsible for operations at several brandswithin the Luxury activities.
He also helps to define the Group’s overall strategy alongsidethe Chairman and Chief Executive Officer.
1.3. Complementary nature of the duties of the Chairman and Chief Executive Officer and the Group Managing Director
4KERING GOVERNANCE ~ CORPORATE GOVERNANCE
1432016 Reference Document ~ Kering

The Directors can take up matters with ExecutiveManagement at any time and with complete transparency,and Executive Management keeps the Directors regularlyinformed of all important events concerning the conductof the Company’s business. The Board has the resourcesto freely discuss all matters which concern it, particularlyissues relating to the Group’s strategies, the implementationof those strategies and their follow-up. The Directors alsohave all of the information needed to freely makeinformed decisions and help Executive Managementdraw up the agendas for the meetings.
The Board can meet with Group senior executives at certainmeetings of the Board of Directors or its Committees(particularly during Strategy & Development Committee
meetings). At a meeting of the Board in October 2016, theDirectors were able to visit the Gucci store, showroom,workshops and new head office in Milan.
Each Director is also entitled, if he or she so wishes, tomeet the Group’s senior executives outside these meetingsin order to gain a better insight into the Group’s businessesor certain operational issues.
The Board’s membership and role ensures that it acts incompliance with the Group’s best interests at all times. Itprovides a platform for reflection and is a precious sourceof support for Executive Management, while ensuringthat it protects the interests of all stakeholders.
1.5. Dialogue with Executive Management and operational divisions
• the following transactions by the Company or any entitycontrolled by the Group, insofar as they each exceed€500 million, amount set annually by the Board ofDirectors:- all investments or divestments, including the acquisition,
sale or exchange of holdings in all existing or futurebusinesses,
- all purchases or sales of Company real property.
The internal rules of the Board provide that each Directormust inform the Board of any existing or potentialconflict of interest with Kering SA or any other Groupcompany, and must not vote on any matters that concernthem directly or indirectly. Each year, the Board ofDirectors assesses the position of the Directors withregard to conflicts of interest.
The internal rules are revised on a regular basis so theycan be brought into line with changes in governancerecommendations and practices. In 2016, changes weremade mainly to reflect the entry into force of the EURegulation on market abuse on July 3, 2016.
As indicated above, each Committee has its own internalrules, which are also updated on a regular basis. The lastupdate concerned the internal rules of the Audit Committeewhich were amended to include rules covering the approval
of services that may be provided by Statutory Auditors ortheir networks other than statutory audit services.
In accordance with the recommendations of the revisedAFEP-MEDEF Code, every three years the Board ofDirectors appoints an independent expert to carry out aformal assessment. Each year, the Board also organises adiscussion on its work. This annual self-assessment bythe Board concerns its membership, organisation andoperation. The assessment takes place in two stages:
• a questionnaire is given to each Director;
• each Director meets with the Vice-Chair of the Board(Patricia Barbizet), with the questionnaire used as thestarting point for discussions.
At the end of these meetings, the Directors set newobjectives for improving the quality of their organisationand ensure that all important issues have been suitablyprepared and addressed.
In line with the recommendations of the revised AFEP-MEDEF Code and in the context of the ongoing initiativeto improve the balance of power on the Board of Directors,meetings will be organised as from 2017 without thepresence of the executive corporate officers.
4 CORPORATE GOVERNANCE ~ KERING GOVERNANCE
144 Kering ~ 2016 Reference Document

François-Henri PinaultChairman of the Board of Directors and Chief Executive Officer
• Chairman of the Strategy &Development Committee
• Member of the Sustainability Committee
Patricia BarbizetVice-Chair of the Board of Directors
• Chair of the Appointments Committee• Member of the
Remuneration Committee• Member of the Audit Committee
Laurence BooneDirector
• Member of the Strategy &Development Committee
• Member of the Audit Committee
Sophie BouchillouDirector
Yseulys CostesDirector
• Member of the Remuneration Committee
• Member of the Appointments Committee
Jean-Pierre DenisDirector
• Chairman of the Audit Committee• Member of the
Remuneration Committee
Sophie L’HéliasDirector
• Chair of the Remuneration Committee• Member of the Audit Committee
Jean-François PalusGroup Managing Director
• Member of the Sustainability Committee
Baudouin ProtDirector
• Member of the Strategy &Development Committee
• Member of the Appointments Committee
Daniela RiccardiDirector
• Member of the Sustainability Committee
• Member of the Strategy &Development Committee
Sapna SoodDirector
• Chair of the Sustainability Committee• Member of the
Appointments Committee
As of December 31, 2016, the Board of Directors wascomposed of ten members, six of whom were independentDirectors according to the Board of Directors’ criteria.
In addition, there is one Director representing theemployees appointed by the Kering Works Council.
2. Membership of the Board of Directorsand information on Directors and executive corporate officers
4MEMBERSHIP OF THE BOARD OF DIRECTORS AND INFORMATION ON DIRECTORS AND EXECUTIVE CORPORATE OFFICERS ~ CORPORATE GOVERNANCE
1452016 Reference Document ~ Kering
François-Henri Pinault
Sapna Sood
Sophie Bouchillou
Jean-François Palus
Sophie L’Hélias
Yseulys Costes
Laurence Boone
Daniela Riccardi
Baudouin Prot
Independent DirectorDirector representing employees
Non-independent Director
Jean-Pierre DenisPatricia Barbizet

Following the Combined General Meeting on April 29, 2016, the membership of the Board’s specialised Committeeswas reviewed pursuant to a Board decision. The new composition reflects the Group’s wish to restructure theCommittees as well as routine departures and arrivals of Directors.
Audit Committee
Members prior to the Members after the Combined General Meeting on April 29, 2016 Combined General Meeting on April 29, 2016
Jean-Pierre Denis (Chairman) Jean-Pierre Denis (Chairman)Patricia Barbizet Patricia BarbizetYseulys Costes Laurence Boone
Sophie L’Hélias
Appointments Committee
Members prior to the Members after the Combined General Meeting on April 29, 2016 Combined General Meeting on April 29, 2016
Patricia Barbizet (Chair) Patricia Barbizet (Chair)Baudouin Prot Baudouin ProtLuca Cordero di Montezemolo Yseulys Costes
Sapna Sood
Remuneration Committee
Members prior to the Members after the Combined General Meeting on April 29, 2016 Combined General Meeting on April 29, 2016
Philippe Lagayette (Chairman) Sophie L’Hélias (Chair)Patricia Barbizet Patricia BarbizetJean-Pierre Denis Jean-Pierre DenisYseulys Costes Yseulys Costes
Sustainability Committee
Members prior to the Members after the Combined General Meeting on April 29, 2016 Combined General Meeting on April 29, 2016
Jochen Zeitz (Chairman) Sapna Sood (Chair)Patricia Barbizet Daniela RiccardiFrançois-Henri Pinault François-Henri PinaultJean-François Palus Jean-François PalusLuca Cordero di Montezemolo
Strategy & Development Committee
Members prior to the Members after the Combined General Meeting on April 29, 2016 Combined General Meeting on April 29, 2016
Patricia Barbizet (Chair) François-Henri Pinault (Chairman)François-Henri Pinault Baudouin ProtYseulys Costes Laurence BoonePhilippe Lagayette Daniela Riccardi
4 CORPORATE GOVERNANCE ~ MEMBERSHIP OF THE BOARD OF DIRECTORS AND INFORMATION ON DIRECTORS AND EXECUTIVE CORPORATE OFFICERS
146 Kering ~ 2016 Reference Document
Directors joining the Board in 2016
Laurence BooneSophie L’HéliasSapna Sood
Directors leaving the Board in 2016
Philippe LagayetteLucas Cordero di MontezemoloJochen Zeitz

List of members of the Board of Directors withinformation on their positions in other companies
The following information is presented separately foreach Director:
• professional experience and expertise in the area ofbusiness management;
• directorships and positions held in 2016;• other directorships and positions held in the last five
years.
Among Kering’s Directors and executive corporate officers,only François-Henri Pinault, Jean-François Palus andPatricia Barbizet hold or have held legal representative or executive corporate functions in the Group’s mainsubsidiaries.
Director expertise
Leadership
Finance and accounting
Economics
Technology
Industry
Marketing
Corporate Social Responsibility
Risk management
Corporate governance
4MEMBERSHIP OF THE BOARD OF DIRECTORS AND INFORMATION ON DIRECTORS AND EXECUTIVE CORPORATE OFFICERS ~ CORPORATE GOVERNANCE
1472016 Reference Document ~ Kering

Other directorships and positions held as of December 31, 2016: Start 1st term
Position Company Country of office
at the level of the majority shareholder group:
Manager Financière Pinault SCA France October 2000Chairman of the Board of Directors Artémis SA France May 2003Member of the Management Board SC Château Latour France June 1998Chairman of the Board of Directors Collection Pinault-Paris (SAS) France May 2016
within the Kering group:
Vice-Chairman of the Board of Directors PUMA SE (1) Germany July 2011Chairman of the Strategy Committee Boucheron Holding SAS France May 2005Director Stella McCartney Ltd United Kingdom June 2011Director Ulysse Nardin le Locle SA, manufacturer of prestige Swiss watches Switzerland November 2014Director Sapardis SE France May 2008Chairman of the Board of Directors Volcom Inc. United States July 2011Director Kering International Ltd United Kingdom May 2013Director Kering UK Services Ltd United Kingdom May 2014Director Kering Eyewear SpA Italy November 2014Chairman of the Board of Directors Yves Saint Laurent SAS France June 2013
outside the Kering group:
Director Soft Computing (1) France June 2001
(1) Listed companies (as of the date the position was held).
François-Henri Pinault
Chairman and Chief Executive Officer
Born on May 28, 1962 (54 years old)Kering: 40 rue de Sèvres, 75007 ParisFrench citizenFirst appointed in 1993Term of office last renewed on June 18, 2013Term of office expires at the Annual General Meetingcalled to approve the financial statements for the yearended December 31, 2016.
A graduate of HEC, François-Henri Pinault joined thePinault group in 1987 where he had various responsibilitiesin the main subsidiaries of the Group. After starting off asa salesman in the Évreux branch of Pinault Distribution, asubsidiary specialised in wood importation and distribution,in 1988 he set up said company’s purchasing group forwhich he was responsible until September 1989.
Appointed Chief Executive Officer of France Bois Industries,the Company comprising the industrial activities of thePinault group, he managed the 14 plants of this subsidiaryuntil December 1990, when he returned to PinaultDistribution to become Chairman. In 1993, his responsibilitieswere broadened upon his appointment as Chairman ofCfao and as member of the Executive Board of PinaultPrintemps Redoute. Four years later, he was appointedChairman and Chief Executive Officer of Fnac, a position he
held until February 2000. He was then appointed DeputyChief Executive Officer of Pinault Printemps Redoute withresponsibility for developing the Group’s Internet activities.François-Henri Pinault has been a member of the Boardof Directors of Bouygues SA since December 1998. Hebecame the co-manager of Financière Pinault in 2000 andwas appointed Chairman of the Artémis group in 2003. In2005, he was appointed Chairman of the Executive Boardand then Chairman and Chief Executive Officer of PPR,since renamed Kering.
After serving as Chairman of the Executive Board of PPR(from March 21, 2005 to May 19, 2005), Vice-Chairman of theSupervisory Board (from May 22, 2003 to March 21, 2005),and member of the Supervisory Board (from January 17,2001) and the Executive Board (from June 1993 to January2001), François-Henri Pinault has been the Chairman andChief Executive Officer of Kering since May 19, 2005.Following the Combined General Meeting on June 18,2013, the Board of Directors renewed his term of officeas Chairman and Chief Executive Officer for the durationof his directorship which will expire at the end of theAnnual General Meeting called to approve the financialstatements for the year ended December 31, 2016.
François-Henri Pinault is a member of the Strategy &Development Committee and of the SustainabilityCommittee. He attended all seven Board meetings in 2016and all meetings of the Committees on which he sits (twoSustainability Committee meetings and one Strategy &Development Committee meeting), representing anattendance rate of 100%.
4 CORPORATE GOVERNANCE ~ MEMBERSHIP OF THE BOARD OF DIRECTORS AND INFORMATION ON DIRECTORS AND EXECUTIVE CORPORATE OFFICERS
148 Kering ~ 2016 Reference Document

Other directorships and positions held in the last five years:Position Company Country Dates
Vice-Chairman of the Supervisory Board Cfao (1) France from October 2009 to July 2012Director Fnac SA France from October 1994 to June 2013Chairman of the Supervisory Board Yves Saint Laurent SAS France from April 2005 to June 2013Chairman of the Supervisory Board Kering Holland NV Netherlands from October 2005 to April 2013Director Christie’s International Plc United Kingdom from May 2003 to April 2014Chairman of the Board of Directors Sowind Group SA Switzerland from July 2011 to October 2015Director Brioni SpA Italy from January 2012 to May 2015Non-executive Director Kering Holland NV Netherlands from April 2013 to October 2016Non-executive Director Kering Netherlands BV Netherlands from April 2013 to October 2016Director Bouygues (1) France from December 1998 to April 2016
(1) Listed companies (as of the date the position was held).
Number of shares held: 36,201François-Henri Pinault is manager and managing partner of Financière Pinault, which directly and indirectly held 51,617,767 Kering shares as of December 31, 2016.
4MEMBERSHIP OF THE BOARD OF DIRECTORS AND INFORMATION ON DIRECTORS AND EXECUTIVE CORPORATE OFFICERS ~ CORPORATE GOVERNANCE
1492016 Reference Document ~ Kering

Other directorships and positions held as of December 31, 2016: Start 1st term
Position Company Country of office
at the level of the majority shareholder group, mainly:
Chief Executive Officer and Director Artémis SA France 1992Chief Executive Officer, non-corporate officer Financière Pinault SCA France June 2004Member of the Supervisory Board Financière Pinault SCA France January 2001Managing Director Palazzo Grassi Italy September 2005Member of the Management Board SC Château Latour France July 1993Permanent representativeof Artémis on the Board of Directors Agefi France July 2000Permanent representativeof Artémis on the Board of Directors Sebdo Le Point France July 1997Chair of the Supervisory Board Compagnie du Ponant France October 2015Member of the Supervisory Board Compagnie du Ponant France December 2015
within the Kering group:
Director Yves Saint Laurent SAS France June 2013
outside the Kering group:
Director Total (1) France May 2008Director Groupe Fnac (1) France June 2013Member of the Supervisory Board Peugeot SA (1) France April 2013
(1) Listed companies (as of the date the position was held).
Patricia Barbizet
Vice-Chair of the Board of Directors
Born on April 17, 1955 (61 years old)Artémis: 12 rue François 1er, 75008 ParisFrench citizenFirst appointed in 1992Term of office last renewed on June 18, 2013Term of office expires at the Annual General Meetingcalled to approve the financial statements for the yearended December 31, 2016.
A graduate of the École Supérieure de Commerce de Paris,Patricia Barbizet began her career with the Renault groupas treasurer of Renault Véhicules Industriels then as ChiefFinancial Officer of Renault Crédit International. She joinedthe Pinault group in 1989 as Chief Financial Officer.
In 1992, she became Chief Executive Officer of Artémisand in 2004 Chief Executive Officer of Financière Pinault.She is also a Director of Total, Groupe Fnac, and member
of the Supervisory Board of Peugeot SA. as well as beingthe Chair of the Supervisory Board of Ponant Holdingsince October 2015.
After serving as Chair of the Supervisory Board of PPR(from December 2001 to May 2005) and member of theSupervisory Board of PPR (from December 1992), PatriciaBarbizet has been Vice-Chair of the Board of Directors ofKering since May 19, 2005. Her term of office was renewedby the Combined General Meeting on June 18, 2013 andwill expire at the end of the Annual General Meetingcalled to approve the financial statements for the yearended December 31, 2016.
Patricia Barbizet is Chair of the Appointments Committeeand member of the Audit and Remuneration Committees.Prior to the Combined General Meeting on April 29, 2016,she was also a member of the Sustainability Committeeand Chair of the Strategy & Development Committee. Sheattended all seven Board meetings in 2016 and allmeetings of the Committees on which she sits or sat (oneAppointments Committee meeting, five Audit Committeemeetings, five Remuneration Committee meetings andone Sustainability Committee meeting), representing anattendance rate of 100%.
4 CORPORATE GOVERNANCE ~ MEMBERSHIP OF THE BOARD OF DIRECTORS AND INFORMATION ON DIRECTORS AND EXECUTIVE CORPORATE OFFICERS
150 Kering ~ 2016 Reference Document

Other directorships and positions held in the last five years:Position Company Country Dates
Director Air France-KLM (1) France from January 2003 to December 2013Director TF1 (1) France from July 2000 to April 2013Director Bouygues (1) France from December 1998 to April 2013Director Fonds Stratégique d’Investissement France from December 2008 to July 2013Member ofthe Supervisory Board Yves Saint Laurent SAS France from June 2003 to June 2013Director Tawa Plc (1) United Kingdom from April 2011 to June 2012Group Managing Director Société Nouvelle du Théâtre Marigny France from April 2010 to January 2012Director Société Nouvelle du Théâtre Marigny France from February 2000 to November 2015Chair of the Board of Directors Christie’s International Plc United Kingdom from March 2003 to December 2016Chief Executive Officer Christie’s International Plc United Kingdom from December 2014 to December 2016Non-executive Director Kering Holland NV Netherlands from July 1999 to October 2016
(1) Listed companies (as of the date the position was held).
Number of shares held: 1,040
4MEMBERSHIP OF THE BOARD OF DIRECTORS AND INFORMATION ON DIRECTORS AND EXECUTIVE CORPORATE OFFICERS ~ CORPORATE GOVERNANCE
1512016 Reference Document ~ Kering

Other directorships and positions held as of December 31, 2016: Start 1st term
Position Company Country of office
within the Kering group:
Chairman of the Board of Directors PUMA SE (1) Germany December 2012Director Pomellato SpA Italy July 2013Director Sowind Group SA Switzerland December 2013Director Kering Luxembourg SA Luxembourg May 2011Director Volcom LLC United States July 2011Director Kering Americas Inc. United States June 2011Director Volcom Luxembourg Holding SA Luxembourg October 2012Director Kering Tokyo Investment Japan November 2013Director Guccio Gucci SpA Italy June 2014Director Gucci America Inc. United States May 2014Director Kering Asia Pacific Ltd Hong Kong May 2014Director Yugen Kaisha Gucci Japan May 2014Director Kering South East Asia Singapore October 2014Director Birdswan Solutions Ltd United Kingdom May 2014Director Paintgate Ltd United Kingdom May 2014Director Christopher Kane Ltd United Kingdom June 2014Director Ulysse Nardin le Locle SA, manufacturer of prestige Swiss watches Switzerland November 2014Director Kering Eyewear SpA Italy November 2014
(1) Listed companies (as of the date the position was held).
Jean-François Palus
Director and Group Managing Director
Born on October 28, 1961 (55 years old)Kering International: 6 Carlos Place, W1K 3AP London,United KingdomFrench citizenFirst appointed in 2009Term of office last renewed on June 18, 2013Term of office expires at the Annual General Meetingcalled to approve the financial statements for the yearended December 31, 2016.
A graduate of HEC (class of 1984), Jean-François Palusbegan his career in 1985 with Arthur Andersen where hecarried out audit and financial advisory duties.
Before joining Artémis in 2001 as corporate officer andDirector, he spent ten years within the PPR group, holdingsuccessively the positions of Deputy Chief FinancialOfficer of the wood industry branch of Pinault SA (from1991 to 1993), Group Financial Control Director (from1993 to 1997), then store manager at Fnac (from 1997 to1998) and lastly Corporate Secretary and member of theExecutive Board of Conforama (from 1998 to 2001).
Since March 2005, Jean-François Palus has been in chargeof mergers and acquisitions at PPR (since renamedKering), reporting to François-Henri Pinault, Chairmanand Chief Executive Officer of the Group.
He was Chief Financial Officer of the PPR group fromDecember 2005 to January 2012 and he has been GroupManaging Director (Directeur Général délégué) of PPR(since renamed Kering) since February 26, 2008.Following the Combined General Meeting on June 18,2013, the Board of Directors renewed his term of officeas Group Managing Director for a term of four years.
Jean-François Palus has headed Kering’s Sport & Lifestyleactivities since October 2012. He has also held theposition of Chairman of the Administrative Board ofPUMA SE since December 1, 2012.
Jean-François Palus has been a Director of Kering sinceMay 7, 2009. His term of office will expire at the end of theAnnual General Meeting called to approve the financialstatements for the year ended December 31, 2016.
Jean-François Palus is a member of the SustainabilityCommittee. He attended all seven Board meetings in2016 and the two Sustainability Committee meetings,representing an attendance rate of 100%.
4 CORPORATE GOVERNANCE ~ MEMBERSHIP OF THE BOARD OF DIRECTORS AND INFORMATION ON DIRECTORS AND EXECUTIVE CORPORATE OFFICERS
152 Kering ~ 2016 Reference Document
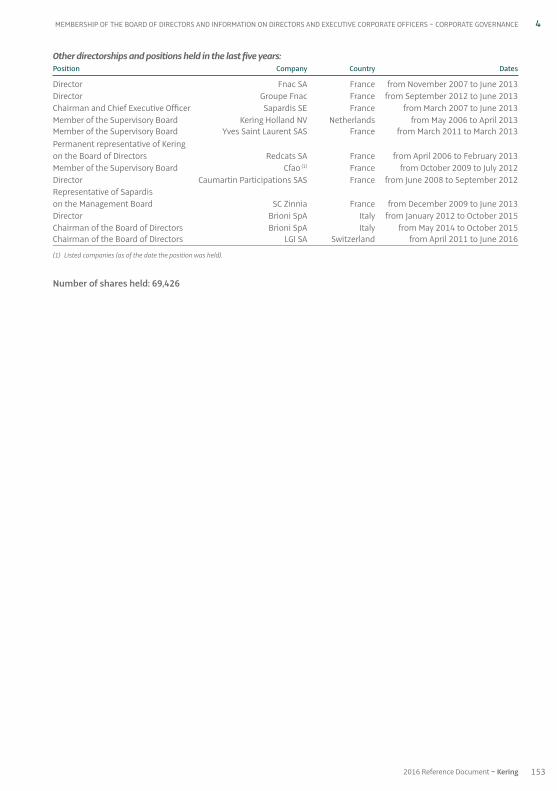
Other directorships and positions held in the last five years:Position Company Country Dates
Director Fnac SA France from November 2007 to June 2013Director Groupe Fnac France from September 2012 to June 2013Chairman and Chief Executive Officer Sapardis SE France from March 2007 to June 2013Member of the Supervisory Board Kering Holland NV Netherlands from May 2006 to April 2013Member of the Supervisory Board Yves Saint Laurent SAS France from March 2011 to March 2013Permanent representative of Keringon the Board of Directors Redcats SA France from April 2006 to February 2013Member of the Supervisory Board Cfao (1) France from October 2009 to July 2012Director Caumartin Participations SAS France from June 2008 to September 2012Representative of Sapardison the Management Board SC Zinnia France from December 2009 to June 2013Director Brioni SpA Italy from January 2012 to October 2015Chairman of the Board of Directors Brioni SpA Italy from May 2014 to October 2015Chairman of the Board of Directors LGI SA Switzerland from April 2011 to June 2016
(1) Listed companies (as of the date the position was held).
Number of shares held: 69,426
4MEMBERSHIP OF THE BOARD OF DIRECTORS AND INFORMATION ON DIRECTORS AND EXECUTIVE CORPORATE OFFICERS ~ CORPORATE GOVERNANCE
1532016 Reference Document ~ Kering

Other directorships and positions held as of December 31, 2016: Start 1st term
Position Company Country of office
Chair and Chief Executive Officer 1000mercis SA (1) France October 2000Chair of the Supervisory Board Ocito SAS (1000mercis group) France 2010Member of the Supervisory Board Vivendi (1) France April 2013Director SEB group (1) France May 2013
Other directorships and positions held in the last five years:Position Company Country Dates
Member of the Supervisory Board Numergy France from 2012 to 2014Member of the Supervisory Board Made in Presse SAS France from 2010 to 2012
(1) Listed companies (as of the date the position was held).
Number of shares held: 500
Yseulys Costes
Independent Director
Born on December 5, 1972 (44 years old)1000mercis: 28 rue de Châteaudun, 75009 ParisFrench citizenFirst appointed in 2010Term of office last renewed on May 6, 2014Term of office expires at the Annual General Meetingcalled to approve the financial statements for the yearending December 31, 2017.
Yseulys Costes holds a Master’s degree in ManagementSciences from Paris I Panthéon University, a postgraduatedegree in marketing and strategy from Paris IX DauphineUniversity and an MBA from Robert O. Anderson School (US).
Author of a number of works and articles on the topics ofonline marketing and databases, she was also thecoordinator of IAB France (Interactive Advertising Bureau)for two years before founding 1000mercis.com inFebruary 2000, of which she is now the Chair and ChiefExecutive Officer. The 1000mercis group, present in Parisand in London, and listed on the Alternext market of NYSE
Euronext Paris since January 2006, offers innovativesolutions to companies seeking to optimise their advertisingand marketing campaigns on interactive media (Internet,mobile phones, etc.). The 1000mercis group currently hasmore than 400 employees and posted consolidatedrevenues of €56.2 million in 2016.
A researcher in interactive marketing, Yseulys Costes wasreceived as a guest researcher at Harvard Business Schooland is a lecturer in interactive marketing at severalprestigious French higher education establishments(HEC, ESSEC, Paris IX Dauphine University).
Yseulys Costes has been a Director of Kering since May 19,2010. Her term of office was renewed by the CombinedGeneral Meeting on May 6, 2014 and will expire at the end ofthe Annual General Meeting called to approve the financialstatements for the year ending December 31, 2017.
Yseulys Costes is a member of the Appointments andRemuneration Committees. Prior to the CombinedGeneral Meeting on April 29, 2016, she was also memberof the Audit and Strategy & Development Committees. Sheattended all seven Board meetings in 2016 and all meetingsof the Committees on which she sits or sat (two AuditCommittee meetings and five Remuneration Committeemeetings), representing an attendance rate of 100%.
4 CORPORATE GOVERNANCE ~ MEMBERSHIP OF THE BOARD OF DIRECTORS AND INFORMATION ON DIRECTORS AND EXECUTIVE CORPORATE OFFICERS
154 Kering ~ 2016 Reference Document
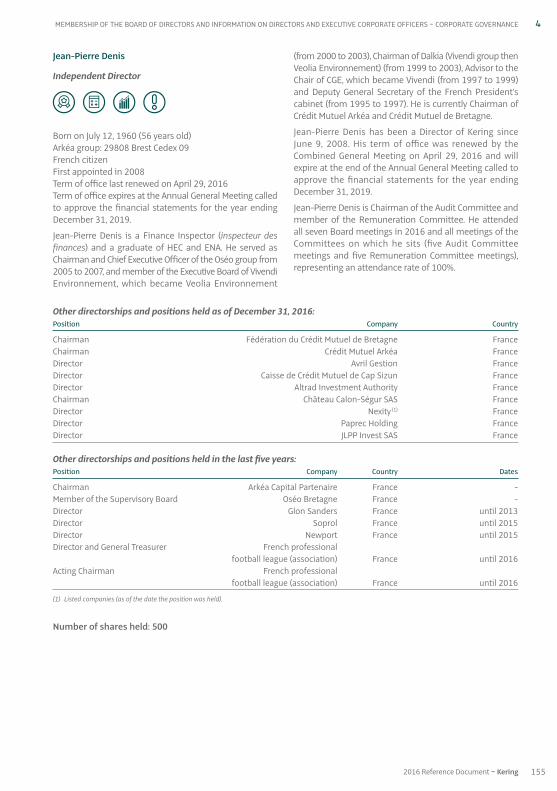
Other directorships and positions held as of December 31, 2016:Position Company Country
Chairman Fédération du Crédit Mutuel de Bretagne FranceChairman Crédit Mutuel Arkéa FranceDirector Avril Gestion FranceDirector Caisse de Crédit Mutuel de Cap Sizun FranceDirector Altrad Investment Authority FranceChairman Château Calon-Ségur SAS FranceDirector Nexity (1) FranceDirector Paprec Holding FranceDirector JLPP Invest SAS France
Other directorships and positions held in the last five years:Position Company Country Dates
Chairman Arkéa Capital Partenaire France -Member of the Supervisory Board Oséo Bretagne France -Director Glon Sanders France until 2013Director Soprol France until 2015Director Newport France until 2015Director and General Treasurer French professional football league (association) France until 2016Acting Chairman French professional football league (association) France until 2016
(1) Listed companies (as of the date the position was held).
Number of shares held: 500
Jean-Pierre Denis
Independent Director
Born on July 12, 1960 (56 years old)Arkéa group: 29808 Brest Cedex 09French citizenFirst appointed in 2008Term of office last renewed on April 29, 2016Term of office expires at the Annual General Meeting calledto approve the financial statements for the year endingDecember 31, 2019.
Jean-Pierre Denis is a Finance Inspector (inspecteur desfinances) and a graduate of HEC and ENA. He served asChairman and Chief Executive Officer of the Oséo group from2005 to 2007, and member of the Executive Board of VivendiEnvironnement, which became Veolia Environnement
(from 2000 to 2003), Chairman of Dalkia (Vivendi group thenVeolia Environnement) (from 1999 to 2003), Advisor to theChair of CGE, which became Vivendi (from 1997 to 1999)and Deputy General Secretary of the French President’scabinet (from 1995 to 1997). He is currently Chairman ofCrédit Mutuel Arkéa and Crédit Mutuel de Bretagne.
Jean-Pierre Denis has been a Director of Kering sinceJune 9, 2008. His term of office was renewed by theCombined General Meeting on April 29, 2016 and willexpire at the end of the Annual General Meeting called toapprove the financial statements for the year endingDecember 31, 2019.
Jean-Pierre Denis is Chairman of the Audit Committee andmember of the Remuneration Committee. He attendedall seven Board meetings in 2016 and all meetings of theCommittees on which he sits (five Audit Committeemeetings and five Remuneration Committee meetings),representing an attendance rate of 100%.
4MEMBERSHIP OF THE BOARD OF DIRECTORS AND INFORMATION ON DIRECTORS AND EXECUTIVE CORPORATE OFFICERS ~ CORPORATE GOVERNANCE
1552016 Reference Document ~ Kering

Other directorships and positions held as of December 31, 2016: Start 1st term
Position Company Country of office
Director Veolia Environnement SA (1) France April 2003Director BGL BNP Paribas (1) Luxembourg April 2015Director Foncia France December 2016
Other directorships and positions held in the last five years:Position Company Country Dates
Chairman of the Board of Directors BNP Paribas SA (1) France from December 2011 to December 2014Director Erbe SA Belgium from June 2004 to December 2013Director Pargesa Holding SA (1) Switzerland from May 2004 to December 2013Director Lafarge SA (1) France from May 2011 to August 2016
(1) Listed companies (as of the date the position was held).
Number of shares held: 600
Baudouin Prot
Director
Born on May 24, 1951 (65 years old)BNP Paribas: 3 rue d’Antin, 75002 ParisFrench citizenFirst appointed in 1998Term of office last renewed on June 18, 2013Term of office expires at the Annual General Meetingcalled to approve the financial statements for the yearended December 31, 2016.
After graduating from HEC in 1972 and from ENA in 1976,Baudouin Prot joined the French Ministry of Finance wherehe spent four years before serving as Deputy Director ofEnergy and Raw Materials at the French Ministry of Industryfor three years. He joined BNP in 1983 as Deputy Directorof Banque Nationale de Paris Intercontinentale, beforebecoming the Director for Europe in 1985. He joined theCentral Networks Department in 1987 and was promoted
to Central Director in 1990 then Deputy Chief ExecutiveOfficer of BNP in charge of networks in 1992. He becameChief Executive Officer of BNP in 1996 and Deputy ChiefExecutive Officer of BNP Paribas in 1999. In March 2000,he was appointed Director and Deputy Chief ExecutiveOfficer of BNP Paribas then Director and Chief ExecutiveOfficer of BNP Paribas in May 2003. From December 2011to December 2014, he served as non-executive Chairmanof BNP Paribas. He is an Officer of the National Order ofMerit and a Knight of the Legion of Honour.
Baudouin Prot has been a Director of Kering since May 19,2005, after having served as a member of the SupervisoryBoard (from March 11, 1998 to May 19, 2005). His term ofoffice was renewed by the Combined General Meeting onJune 18, 2013 and will expire at the end of the AnnualGeneral Meeting called to approve the financial statementsfor the year ended December 31, 2016.
Baudouin Prot is a member of the Appointments andStrategy & Development Committees. He attended all sevenBoard meetings in 2016 and the two meetings of theCommittees on which he sits, representing an attendancerate of 100%.
4 CORPORATE GOVERNANCE ~ MEMBERSHIP OF THE BOARD OF DIRECTORS AND INFORMATION ON DIRECTORS AND EXECUTIVE CORPORATE OFFICERS
156 Kering ~ 2016 Reference Document

Other directorships and positions held as of December 31, 2016: Start 1st term
Position Company Country of office
Chief Executive Officer Baccarat (1) France May 2013Director WPP Plc (1) United Kingdom September 2013
(1) Listed companies (as of the date the position was held).
Number of shares held: 500
Daniela Riccardi
Independent Director
Born on April 4, 1960 (56 years old)Baccarat: 11 place des États-Unis, 75116 ParisItalian citizenFirst appointed in 2014Term of office expires at the Annual General Meetingcalled to approve the financial statements for the yearending December 31, 2017.
Daniela Riccardi, an Italian national, is the Chief ExecutiveOfficer of Baccarat. She has recognised experience inbusiness development and branding in consumer retailand distribution. She joined Baccarat in May 2013 afterhaving served as Chief Executive Officer of the internationallifestyle brand Diesel since 2010. Daniela Riccardi wasresponsible for the creation and implementation of astrategic plan at Diesel which resulted in greater revenue
growth and product exposure through an ambitiousdistribution policy. Prior to Diesel, Daniela served 25 yearsat Procter & Gamble in various senior management rolesaround the world, including Vice-President of P&GColumbia, Mexico and Venezuela. From 2001 and 2004,she was Vice-President and General Manager of P&GEastern Europe and Russia, based in Moscow. Between2005 and 2010, she was President of Procter & Gamble inChina. She has been a member of the Colbert Committeesince June 2015.
Daniela studied political science and internationalrelations at Sapienza University of Rome, in Italy.
She has been a Director of Kering since May 6, 2014. Herterm of office will expire at the end of the Annual GeneralMeeting called to approve the financial statements forthe year ending December 31, 2017.
She is a member of the Sustainability and the Strategy &Development Committees. She attended six of the sevenBoard meetings in 2016 and the two meetings of theCommittees on which she sits, representing an attendancerate of 89%.
4MEMBERSHIP OF THE BOARD OF DIRECTORS AND INFORMATION ON DIRECTORS AND EXECUTIVE CORPORATE OFFICERS ~ CORPORATE GOVERNANCE
1572016 Reference Document ~ Kering

Laurence Boone
Independent Director
Born on May 15, 1969 (47 years old)AXA Investment Managers: Tour Majunga – 6 place desPyramides, 92908 Paris-La Défense cedexFrench citizenFirst appointed in 2010 (resigned in 2014)Term of office expires at the Annual General Meetingcalled to approve the financial statements for the yearending December 31, 2019.
Laurence Boone is a graduate of the Faculty of Economicsof Paris X Nanterre University and has a PhD in Economicsfrom the London Business School.
She began her career as an analyst at Merrill Lynch AssetManagement from 1995 to 1996. She then became aresearcher at the Centre d’Études Prospective et d’InformationsInternationales (CEPII) (France’s leading institute forresearch on the international economy) before joining theOECD as an economist in 1998. She successively becameDirector of Barclays Capital France in 2004 and ManagingDirector and Chief Economist in 2010. She was ManagingDirector, European Economic Research at Bank of AmericaMerrill Lynch from July 2011 to June 2014. BetweenJune 2014 and March 2016 she served as special advisorto the French President on multilateral and Europeaneconomic and financial affairs. Since March 2016, shehas been Chief Economist at AXA group, Head of researchand investment strategy at AXA Investment Managers, and
member of the Management Board of AXA InvestmentManagers, for whom she is also responsible for developingrelations with sovereign entities.
The author of numerous articles, Laurence taught at theÉcole Polytechnique, ENSAE (the National School of Statistics)and the École Normale Supérieure and is currently anassociate professor at the Institut de Sciences politiques ofParis. She is member of the French Circle of Economistsand a Knight of the Legion of Honour.
Laurence Boone has been a Director of Kering since May 19,2010. Her term of office was renewed at the 2014 AnnualGeneral Meeting but she resigned as on July 15, 2014following her appointment to the Office of the FrenchPresident as an advisor in economic and financial affairs.She was reappointed Director of Kering at the CombinedGeneral Meeting on April 29, 2016. Her term of office willexpire at the end of the Annual General Meeting called toapprove the financial statements for the year endingDecember 31, 2019.
Laurence Boone is a member of the Audit Committee andof the Strategy & Development Committee. Following herappointment at the Combined General Meeting onApril 29, 2016, she attended all four Board meetings andall meetings of the Committees on which she sits (threeAudit Committee meetings and one Strategy & DevelopmentCommittee meeting), representing an attendance rate of 100%.
Laurence Boone did not hold any other directorships orpositions at December 31, 2016, and has not held any othercorporate office over the past five years.
Number of shares held: 500
4 CORPORATE GOVERNANCE ~ MEMBERSHIP OF THE BOARD OF DIRECTORS AND INFORMATION ON DIRECTORS AND EXECUTIVE CORPORATE OFFICERS
158 Kering ~ 2016 Reference Document

Sophie L’Hélias
Independent Director
Born on December 15, 1963 (53 years old)56 avenue Paul Doumer, 75116 ParisFrench citizenFirst appointed in 2016Term of office expires at the Annual General Meetingcalled to approve the financial statements for the yearending December 31, 2019.
An inactive member of the Paris and New York bars,Sophie L’Hélias holds an MBA from INSEAD, an LLMdegree from the University of Pennsylvania Law School, aMasters of Law degree from the Paris I Pantheon-Sorbonne University and a degree from the EuropeanLaw Institute at the University of Saarbrücken in Germany.
Sophie began her career as an attorney specialised in M&Aand stock market law in New York and later in Paris. She alsoserved as Managing Director of an arbitrage fund in NewYork and founded a corporate governance advisory firm.
An expert on governance issues, she is co-founder of theInternational Corporate Governance Network (www.icgn.org),the leading international network of institutionalinvestors for corporate governance. She recently foundedLeaderxxchange™ in the US which collaborates withinstitutional investors, business leaders and other marketparticipants to promote diversity on corporate boards.
Author of the books “Le Retour de l’Actionnaire” (“TheShareholder Comeback”), she has frequently had articlespublished in Europe, the US and Canada, and is a regularspeaker at international business or academic forums oncorporate governance.
She has been a member of several non-profit and academicBoards in Canada and the US. She is a Senior Fellow atthe Conference Board Governance Centre and at theCardozo Law School in New York and a member of theGlobal Advisory Board at the Lazardis Institute in Canada.
Sophie has been a Director of Kering since April 29, 2016.Her term of office will expire at the end of the Annual GeneralMeeting called to approve the financial statements forthe year ending December 31, 2019.
She is Chair of the Appointments Committee and memberof the Audit Committee. Following her appointment atthe Combined General Meeting on April 29, 2016, sheattended all four Board meetings and all meetings of theCommittees on which she sits (three Audit Committeemeetings and one Strategy & Development Committeemeeting), representing an attendance rate of 100%.
Sophie did not hold any other directorships or positionsat December 31, 2016, and has not held any other corporateoffice over the past five years.
Number of shares held: 500
4MEMBERSHIP OF THE BOARD OF DIRECTORS AND INFORMATION ON DIRECTORS AND EXECUTIVE CORPORATE OFFICERS ~ CORPORATE GOVERNANCE
1592016 Reference Document ~ Kering

Sophie Bouchillou
Director representing the employees
Born on March 1, 1962 (54 years old)Kering: 40 rue de Sèvres, 75007 ParisFrench citizenFirst appointed in 2014Term of office expires at the Annual General Meetingcalled to approve the financial statements for the yearending December 31, 2017.
Sophie Bouchillou is Human Resources Project Coordinatorat Kering SA. She joined the Group in 1981 working forConforama as a sales and administrative agent andsubsequently executive sales assistant. From 2001 to
2009, she held the position of executive purchasingassistant at PPR Purchasing. She has been working in theHuman Resources Department of Kering SA since 2009.
Following the amendment of the Company’s Articles ofAssociation adopted by the Combined General Meetingon May 6, 2014, which provides for the appointment of aDirector representing the employees in accordance withthe law of June 14, 2013, Sophie Bouchillou was electedas a Director for a term of four years by the Kering WorksCouncil on July 10, 2014.
Her term of office will expire in July 2018.
Sophie Bouchillou did not hold any other corporateoffice at December 31, 2016.
Other directorships and positions held in the last five years:Position Company Country Dates
Non-executive Director Lafarge Malaysia Berhad Malaysia from November 2014 to 2016
Number of shares held: 500
Sapna Sood
Independent Director
Born on June 4, 1973 (43 years old)Holcim Philippines: Holcim Building, Bacnotan – Luna –Balaoan Rd, Quirino, Bacnotan, La Union, PhilippinesAustralian citizenFirst appointed in 2016Term of office expires at the Annual General Meetingcalled to approve the financial statements for the yearending December 31, 2019.
Sapna Sood has an Executive MBA from IMD BusinessSchool, a Graduate Certificate of Change Managementfrom the Australian Graduate School of Management anda Bachelor of Engineering from the University of Sydney.
She is currently Chief Operating Officer of LafargeHolcimPhilippines. Prior to this she served as Senior Vice-President,Health and Safety at LafargeHolcim based in Paris. Sapna
began her career as an Applications Engineer with Fisher-Rosemount. In 1997, she joined the Linde group (formerlyknown as the BOC group) under their Graduate DevelopmentProgram and subsequently held various senior positionsin the Linde group in Australia, the US, Singapore, Germanyand China. She joined the Lafarge group in 2013 as SeniorVice President of Health and Safety and with the mergerof Lafarge and Holcim took on the same responsibility forthe new group in July 2015.
Sapna has been a Director of Kering since April 29, 2016.Her term of office will expire at the end of the AnnualGeneral Meeting called to approve the financialstatements for the year ending December 31, 2019.
She is Chair of the Sustainability Committee and memberof the Appointments Committee. Following her appointmentat the Combined General Meeting on April 29, 2016, sheattended all four Board meetings and the two meetingsof the Committees on which she sits, representing anattendance rate of 100%.
Sapna Sood did not hold any other corporate office atDecember 31, 2016.
4 CORPORATE GOVERNANCE ~ MEMBERSHIP OF THE BOARD OF DIRECTORS AND INFORMATION ON DIRECTORS AND EXECUTIVE CORPORATE OFFICERS
160 Kering ~ 2016 Reference Document
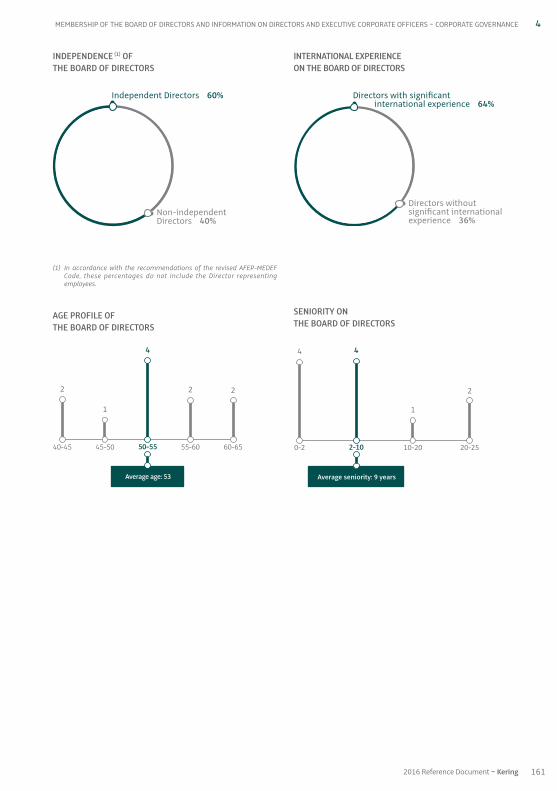
INDEPENDENCE (1) OFTHE BOARD OF DIRECTORS
(1) In accordance with the recommendations of the revised AFEP-MEDEFCode, these percentages do not include the Director representingemployees.
AGE PROFILE OF THE BOARD OF DIRECTORS
INTERNATIONAL EXPERIENCE ON THE BOARD OF DIRECTORS
SENIORITY ONTHE BOARD OF DIRECTORS
4MEMBERSHIP OF THE BOARD OF DIRECTORS AND INFORMATION ON DIRECTORS AND EXECUTIVE CORPORATE OFFICERS ~ CORPORATE GOVERNANCE
1612016 Reference Document ~ Kering
Independent Directors 60%
Non-independentDirectors 40%
Directors with significant international experience 64%
Directors withoutsignificant internationalexperience 36%
40-45
2
55-60
2
60-65
2
45-50
1
50-55
4
Average age: 53
0-2
4
20-25
2
10-20
1
Average seniority: 9 years
2-10
4

2016 2015Gross amounts (in €) Amounts Amounts Put to the Amounts AmountsFrançois-Henri Pinault payable paid during advisory vote of payable paid duringChairman and Chief Executive Officer for the year the year the shareholders for the year the year
Fixed remuneration 1,099,996 1,099,996 Yes 1,099,996 1,099,996Annual variable remuneration 1,407,318 1,158,960 Yes 1,158,960 1,560,900 (1)
Multi-annual variable remuneration 0 0 Yes 0 0Exceptional remuneration 0 0 Yes 0 0Directors’ fees (Kering) 64,679 74,431 Yes 74,431 68,867 (1)
Directors’ fees (subsidiaries) 52,500 52,500 Yes 52,500 52,500Benefits in kind 17,222 17,222 Yes 18,612 18,612
Total 2,641,715 2,403,109 - 2,404,499 2,800,875
Total employer contributionsborne by the Group 1,164,106 (2) 1,054,165 - 1,067,405 (2) 1,303,475
TOTAL COST FOR THE GROUP 3,805,821 3,457,274 - 3,494,123 4,104,350
Gross amounts 2016 2015 (restated (3))(in € and at comparable exchange rates) Amounts Amounts Put to the Amounts AmountsJean-François Palus payable paid during advisory vote of payable paid duringGroup Managing Director for the year the year the shareholders for the year the year
Fixed remuneration (4) 1,018,622 1,018,622 Yes 1,018,622 1,018,622Annual variable remuneration (5) 1,062,302 874,831 Yes 874,831 1,178,233 (1)
Multi-annual variable remuneration 0 0 Yes 0 0Exceptional remuneration 0 0 Yes 0 0Directors’ fees (Kering) 60,355 65,087 Yes 65,087 62,463 (1)
Directors’ fees (subsidiaries) 130,000 132,500 Yes 130,000 127,500Benefits in kind (4) (6) 1,098,257 1,098,257 Yes 1,098,257 1,098,257
Total 3,369,536 3,189,297 - 3,169,297 3,467,575
Total employer contributionsborne by the Group (4) 294,796 (2) 281,907 - 281,907 (2) 302,765
TOTAL COST FOR THE GROUP 3,664,332 3,471,204 - 3,468,704 3,787,840
(1) For 2014.(2) Current estimates.(3) Data restated to reflect the 2016 exchange rate to provide information at comparable exchange rates.(4) Translated into euros at the average 2016 exchange rate (0.81948).(5) Translated into euros at the December 31, 2016 closing exchange rate (0.85618).(6) Benefits in kind correspond to an annual allowance for a residence in London to which the Group Managing Director has been entitled since July 1, 2013
(amounting to GBP 900,000 for the relevant fiscal year).
The remuneration of executive corporate officersincludes a fixed portion and a variable portion. The Boardof Directors establishes the rules for setting suchremuneration each year based on the recommendationsissued by the Remuneration Committee.
The amounts payable, which are shown in the two tablesbelow, correspond to all remuneration granted to the
executive corporate officer during each of the fiscal yearsshown, regardless of the actual payment date.
The amounts shown as paid correspond to allremuneration received by the executive corporate officerduring each of the fiscal years shown.
3. Remuneration of Directors and executive corporate officers
3.1. Remuneration of executive corporate officers (ChiefExecutive Officer and Group Managing Director)
4 CORPORATE GOVERNANCE ~ REMUNERATION OF DIRECTORS AND EXECUTIVE CORPORATE OFFICERS
162 Kering ~ 2016 Reference Document

In terms of remuneration due to executive corporate officers,French law No. 2016-1691 of December 9, 2016 (“Sapin II”)sets out a dual role for the Shareholders’ Meeting of listedcompanies:
• the principles and criteria for determining, allocatingand awarding fixed, variable and exceptional componentsmaking up total remuneration and benefits of any kindgranted to the Chairman and Chief Executive Officerand Group Managing Director, in connection with theirterm of office, must be approved ex ante by theshareholders at least once a year. This provision isapplicable as from the 2017 Annual General Meeting;
• in the following year, in addition to holding an ex antevote for the following year, the Ordinary General Meetingmust also decide ex post on the fixed, variable andexceptional components making up total remunerationand benefits of any kind paid or granted in respect ofthe previous fiscal year to the Chairman and ChiefExecutive Officer and the Group Managing Directorunder the terms of different resolutions. This provisionis applicable as from the 2018 Annual General Meeting.
These “Sapin II” requirements are rounded out by the revisedAFEP-MEDEF Code: Article 26 states that “the Board shallpresent executive remuneration arrangements to theAnnual Ordinary Shareholders’ Meeting. These will includecomponents of remuneration due or awarded to eachexecutive corporate officer in respect of the fiscal yearended […]. It will be followed by a mandatory shareholdervote […]”. This recommendation is applicable to the 2017Annual General Meeting called to approve the 2016
financial statements for the first and last time, and willthen be replaced by the provisions of the Sapin II law onex post shareholder approval.
In other words, shareholders will have a dual vote at the2017 Annual General Meeting:
• a first ex ante vote as provided for under the Sapin II lawon remuneration due to executive corporate officers. Inthe event shareholders reject the remunerationproposals, the previously approved principles andcriteria will continue to apply;
• an advisory ex post vote on amounts paid, drawing onthe recommendations of the revised AFEP-MEDEFCode. In the event shareholders reject the proposals,the Board of Directors shall meet to decide on thechanges to be made and shall make its position known.
In light of the above, all annual variable remunerationdue in respect of 2016 will be paid during first-half 2017.
Fees payable to Directors in respect of their duties asmembers of the Board of Kering for 2015 were paid inFebruary 2016 and those payable for 2016 were paid inMarch 2017.
For 2016, the Board of Directors set the remuneration of theChairman and Chief Executive Officer and of the GroupManaging Director drawing on the recommendations ofthe Remuneration Committee. The structure of remuneration(i.e., the amount of the fixed portion and the rate of thevariable portion) is decided based on an analysis of marketpractices for senior executives of CAC 40 companies.
In the 2015 Reference Document, this data was presented as follows(1):
2015Gross amounts (in €) Amounts AmountsJean-François Palus payable paid duringGroup Managing Director for the year the year
Fixed remuneration 1,085,529 1,085,529Annual variable remuneration 947,413 1,275,987 (2)
Multi-annual variable remuneration 0 0Exceptional remuneration 0 0Directors’ fees (Kering) 65,087 62,463 (2)
Directors’ fees (subsidiaries) 122,500 127,500Benefits in kind 1,239,943 1,239,943
Total 3,460,472 3,791,422
Total employer contributions borne by the Group 321,324 283,329
TOTAL COST FOR THE GROUP 3,781,796 4,074,751
(1) Table provided by reference to restated data in the table on page 162.(2) For 2014.
4REMUNERATION OF DIRECTORS AND EXECUTIVE CORPORATE OFFICERS ~ CORPORATE GOVERNANCE
1632016 Reference Document ~ Kering

Fixed remuneration
Acting on a recommendation of the RemunerationCommittee, the Board of Directors’ meeting on February 16,2011 set the fixed remuneration of the Chairman andChief Executive Officer at €1,099,996. This amount hasremained unchanged since that date.
The fixed portion of the Group Managing Director’sremuneration also remained unchanged in 2016.Following the relocation of part of the Group ManagingDirector’s activities to London, as noted by the Board ofDirectors’ meeting on June 18, 2013, based on arecommendation of the Remuneration Committee,Kering Netherlands BV, the Group’s Dutch subsidiary andKering International Ltd, the Group’s subsidiary in the UK,each pay half of the Group Managing Director’s fixedremuneration (€500,000 for Kering Netherlands BV andGBP 425,000 for Kering International Ltd). This is inaccordance with the Employment Agreement and ServiceAgreement entered into with these two companies,respectively, covering the management of the Group’sactivities and the coordination of the Group’s internationalsupport functions.
These two employment agreements are related to theGroup Managing Director’s term of office and will lapseon the termination thereof.
Annual variable remuneration
The variable remuneration of the Chairman and ChiefExecutive Officer is based on the achievement of preciselydefined targets, set on the basis of the Group’s resultsafter the closing of the relevant fiscal year. For 2016, thevariable portion is equal to 120% of fixed remunerationwhen targets are exactly met, and up to 180% of fixedremuneration when they are exceeded.
In 2015, there were two targets, each accounting for 50%of the variable portion of remuneration: consolidatedrecurring operating income and consolidated free cashflow from operations.
In 2016, acting on a recommendation of the RemunerationCommittee, the Board decided to introduce new equally-weighted non-financial performance criteria that wouldbase 30% of annual variable remuneration on three areasunderpinning the Group’s strategy: organisation and talent management, Corporate Social Responsibility andsustainability. From this point forward, the Chairman andChief Executive Officer’s variable remuneration is linked tothe extent to which these targets are achieved, as follows:
Financial targets (quantitative)
Criteria Weighting
Consolidated recurring operating income 35%Consolidated free cash flow from operations 35%
TOTAL 70%
Non-financial targets (qualitative)
Criteria Weighting
Organisation and talent management 10%Corporate Social Responsibility 10%Sustainability 10%
TOTAL 30%
In view of the fact that these two targets for 2015 wereexceeded (consolidated recurring operating income andfree cash flow from operations), 87.8% of the amount ofvariable remuneration due when targets are exactly metwas awarded, representing payment of €1,158,960 invariable remuneration for the Chairman and ChiefExecutive Officer.
In light of the new non-financial performance-linkedtargets for determining a portion of annual variableremuneration, the Chairman and Chief Executive Officerwas awarded variable remuneration of €1,407,318 for2016. The rate of achievement for each of the targets ispresented in the table below. The rate of achievement ofeach financial target must be at least 75% for variableremuneration to be paid. If targets are met exactly, thevariable remuneration awarded corresponds to 100% ofthe target amount. If targets are exceeded by 140%, thevariable remuneration awarded is increased to 150% ofthe target amount. Non-financial targets are assessed bythe Board, after taking into account the performance ofthe Chairman and Chief Executive Officer and the GroupManaging Director. This assessment is based on a detailedproposal prepared by the Remuneration Committee,which is strongly based on objective information reportedby the Head of the Legal Department, the Head of HumanResources and the Head of Remuneration and EmployeeBenefits in relation to the strategic goals defined at thebeginning of the year.
Rate of achievementof financial targets Percentage of bonus awarded(versus target) (versus target amount)
<75% 0%
100% 100%
>140% 150%
4 CORPORATE GOVERNANCE ~ REMUNERATION OF DIRECTORS AND EXECUTIVE CORPORATE OFFICERS
164 Kering ~ 2016 Reference Document

Rate of achievement of targets in 2016
François-Henri Pinault Minimum % of Chairman and theoretical target % % of total AmountChief Executive Officer Criterion Targets achievement achieved awarded bonus (€)
Consolidated recurring operating income (in € millions) (1) Financial 1,827 75% 103.2 104 36.4 480,480
Consolidated cash flow from operations (in € millions) (1) Financial 1,062 75% 111.9 114.9 40.2 530,838
Organisation Management of Assessed and talent talent pool for the by the management (2) Non-financial Creative Division Board 100 100 10 132,000
Corporate Finalisation of the Assessed Social roll-out of the by the Responsibility (1) Non-financial compliance program Board 100 100 10 132,000
Sustainability (1) Definition and Assessed launch of the by the Non-financial “Advance” project Board 100 100 10 132,000
TOTAL 106.6 1,407,318
Variable remuneration achieved (in €) 1,407,318Variable remuneration achieved (as % of fixed remuneration) 127.9Target variable remuneration (in €) 1,319,995Target variable remuneration (as % of fixed remuneration) 120
(1) Targets applicable to both the Chairman and Chief Executive Officer and the Group Managing Director.(2) Target applicable to the Chairman and Chief Executive Officer only.
4REMUNERATION OF DIRECTORS AND EXECUTIVE CORPORATE OFFICERS ~ CORPORATE GOVERNANCE
1652016 Reference Document ~ Kering

Given the new performance-linked targets, in 2016 the Group Managing Director was awarded variable remunerationof €1,062,302. The rate of achievement for each of the targets is presented in the table below.
Rate of achievement of targets in 2016
Minimum % of Jean-François Palus theoretical target % % of total Amount (3)
Group Managing Director Criterion Targets achievement achieved awarded bonus (€)
Consolidated recurring operating income (in € millions) (1) Financial 1,827 75% 103.2 104 36.4 362,686
Consolidated cash flow from operations (in € millions) (1) Financial 1,062 75% 111.9 114.9 40.2 400,699
Organisation Finalisation of the and talent implementation of management (2) all components of the new Kering Logistics and Industrial Assessed Operations (KLLIO) by the Non-financial organisation Board 100 100 10 99,639
Corporate Social Finalisation of the Assessed Responsibility (1) roll-out of the by the Non-financial compliance program Board 100 100 10 99,639
Sustainability (1) Definition and Assessed launch of the by the
Non-financial “Advance” project Board 100 100 10 99,639
TOTAL 106.6 1,062,302
Variable remuneration achieved (in €) (3) 1,062,302Variable remuneration achieved (as % of fixed remuneration) 104.3Target variable remuneration (in €) (4) 1,018,622Target variable remuneration (as % of fixed remuneration) 100
(1) Targets applicable to both the Chairman and Chief Executive Officer and the Group Managing Director.(2) Target applicable to the Chairman and Chief Executive Officer only.(3) Translated into euros at the December 31, 2016 closing exchange rate.(4) Translated into euros at the average 2016 exchange rate.
4 CORPORATE GOVERNANCE ~ REMUNERATION OF DIRECTORS AND EXECUTIVE CORPORATE OFFICERS
166 Kering ~ 2016 Reference Document

Multi-annual variable remuneration
A new long-term incentive system was launched in 2013,based on Kering Monetary Units (and no longer onperformance shares) known as “KMUs”. The value of KMUsis indexed equally to both absolute changes in the Keringshare price and to changes in the Kering share pricerelative to a basket of nine Luxury and Sport & Lifestylestocks. These KMUs have a vesting period of three years asfrom January 1 of the year in which they are granted, afterwhich they may be cashed by the beneficiaries over atwo-year period (during two windows each year), whenthe beneficiaries may receive the cash equivalent of theirKMUs based on the last assessed value.
Past awards of KMUs to the Chairman and Chief ExecutiveOfficer and Group Managing Director since 2013 arepresented in the table below.
At its meeting on March 11, 2016, the Board of Directors,acting on a recommendation of the RemunerationCommittee, decided to maintain the KMU scheme providingfor a long-term performance bonus for the Chairman andChief Executive Officer and the Group Managing Director.The value of this award is equal to 70% of their total annualcash-based remuneration paid in 2016 (total annualcash-based remuneration is determined by addingtogether the annual fixed remuneration and variableremuneration for 2015).
In this context, and in accordance with the decision ofthe Board of Directors’ meeting on March 11, 2016, a totalof 9,526 and 8,448 KMUs, with a unit value of €166 as ofDecember 31, 2015, were awarded to the Chairman andChief Executive Officer and to the Group ManagingDirector, respectively, corresponding to a respective valueof €1,581,316 and €1,402,368.
For the Chairman and Chief Executive Officer and GroupManaging Director, final vesting of the KMUs is subject tothe condition of a minimum average increase in earningsper share from continuing operations attributable toowners over the vesting period. If the average increase is5% or above, all vested KMUs may be cashed in; between2.5% and 5%, the cash-in rights are reduced, and below2.5%, no KMUs may be cashed in.
In accordance with the purpose of long-term remunerationschemes such as performance shares, and by analogywith the AFEP-MEDEF recommendations on deferred
remuneration, the Board of Directors has set an obligationfor each beneficiary to purchase Kering shares at the endof the three-year vesting period. Under this obligation,the beneficiaries must invest 30% of the fully vested netvalue of their KMUs in Kering shares and hold, for theduration of their term of office, a number of Kering sharescorresponding to at least 30% of the sum of the amountsvested.
As with many other issuers, the Remuneration Committeeassessed the potential impacts of this obligation, as itparadoxically results in the excessive exposure of thebeneficiaries’ assets to a single market value, especially incompanies with stable management, such as Kering.
Following a benchmarking study, at its meeting onDecember 8, 2014 the Board of Directors, acting on arecommendation of the Remuneration Committee,decided to set a cap equal to the sum of the last twoyears of cash-based remuneration (fixed plus variableremuneration) at the date of assessment. The remunerationof both the Chairman and Chief Executive Officer and theGroup Managing Director reached this cap.
The KMUs awarded to the Chairman and Chief ExecutiveOfficer and the Group Managing Director in 2014 havevested and may be cashed in, though this is subject tothe performance condition of a minimum averageincrease in earnings per share from continuing operationsattributable to owners over the vesting period, asmentioned above.
In this case, the abovementioned condition was not met(as in 2015), since earnings per share from continuingoperations attributable to owners declined 1.9% over thelast three years (versus an increase of 1.7% for 2013-2015). Accordingly, the Chairman and Chief ExecutiveOfficer and the Group Managing Director will not be ableto cash in their KMUs and will not receive any payment aspart of the long-term incentive plan set up in 2014.
This loss of the right to cash in KMUs does not howeveraffect the December 2014 exceptional award of 9,900 KMUsto the Chairman and Chief Executive Officer (see below).These KMUs are not contingent on meeting performanceconditions. Based on the price of a KMU at December 31,2016 (€249), cashing in these 9,900 KMUs as fromApril 2017 could represent up to €2,465,100.
4REMUNERATION OF DIRECTORS AND EXECUTIVE CORPORATE OFFICERS ~ CORPORATE GOVERNANCE
1672016 Reference Document ~ Kering
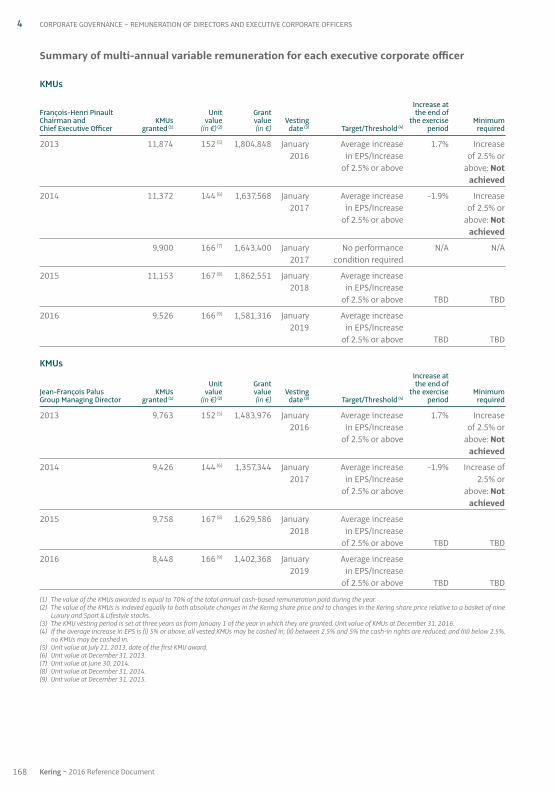
Summary of multi-annual variable remuneration for each executive corporate officer
KMUs
Increase at François-Henri Pinault Unit Grant the end of Chairman and KMUs value value Vesting the exercise MinimumChief Executive Officer granted (1) (in €) (2) (in €) date (3) Target / Threshold (4) period required
2013 11,874 152 (5) 1,804,848 January Average increase 1.7% Increase 2016 in EPS / Increase of 2.5% or of 2.5% or above above: Not
achieved
2014 11,372 144 (6) 1,637,568 January Average increase -1.9% Increase 2017 in EPS / Increase of 2.5% or of 2.5% or above above: Not achieved
9,900 166 (7) 1,643,400 January No performance N / A N / A 2017 condition required
2015 11,153 167 (8) 1,862,551 January Average increase 2018 in EPS / Increase of 2.5% or above TBD TBD
2016 9,526 166 (9) 1,581,316 January Average increase 2019 in EPS / Increase of 2.5% or above TBD TBD
KMUs Increase at Unit Grant the end of Jean-François Palus KMUs value value Vesting the exercise MinimumGroup Managing Director granted (1) (in €) (2) (in €) date (3) Target / Threshold (4) period required
2013 9,763 152 (5) 1,483,976 January Average increase 1.7% Increase 2016 in EPS / Increase of 2.5% or of 2.5% or above above: Not achieved
2014 9,426 144 (6) 1,357,344 January Average increase -1.9% Increase of 2017 in EPS / Increase 2.5% or of 2.5% or above above: Not achieved
2015 9,758 167 (8) 1,629,586 January Average increase 2018 in EPS / Increase of 2.5% or above TBD TBD
2016 8,448 166 (9) 1,402,368 January Average increase 2019 in EPS / Increase of 2.5% or above TBD TBD
(1) The value of the KMUs awarded is equal to 70% of the total annual cash-based remuneration paid during the year.(2) The value of the KMUs is indexed equally to both absolute changes in the Kering share price and to changes in the Kering share price relative to a basket of nine
Luxury and Sport & Lifestyle stocks.(3) The KMU vesting period is set at three years as from January 1 of the year in which they are granted. Unit value of KMUs at December 31, 2016.(4) If the average increase in EPS is (i) 5% or above, all vested KMUs may be cashed in; (ii) between 2.5% and 5% the cash-in rights are reduced; and (iii) below 2.5%,
no KMUs may be cashed in.(5) Unit value at July 21, 2013, date of the first KMU award.(6) Unit value at December 31, 2013.(7) Unit value at June 30, 2014.(8) Unit value at December 31, 2014.(9) Unit value at December 31, 2015.
4 CORPORATE GOVERNANCE ~ REMUNERATION OF DIRECTORS AND EXECUTIVE CORPORATE OFFICERS
168 Kering ~ 2016 Reference Document

At the beginning of 2010 the Board of Directors authorisedthe grant of a pension benefit to Jean-François Palus. Thisbenefit takes the form of a capital transfer of an amountof €3.568 million to a fund entitling him to payment of afull pension (with a right of reversion) from the legalretirement age, and is not subject to his presence withinthe Group. However, the payment of the benefit wassubject to Jean-François Palus not having left the Groupfor personal reasons before December 31, 2014 and theperformance criteria for entitlement to the variableportion of his remuneration for 2009 and 2010 had to befulfilled. The capital is intended to finance a target pensionannuity of a non-guaranteed amount, representingapproximately 25% of his annual remuneration paid in 2009according to the actuarial rates applied within the Group.
On March 18, 2015, the Board of Directors noted thatJean-François Palus had not left the Group for personalreasons and that his performance conditions for 2009and 2010 had been fulfilled. Consequently, the conditionno longer applied. In addition, on March 11, 2016, theBoard of Directors reviewed the agreement and agreedon its implementation, based on a total paymentof €4,724,540 (following application of a 5% interest rate
to the initial capital of €3,568,000 for the relevant period),and noted the extinguishment of the Group’s debt underthe aforementioned agreement.
It should be added that this benefit was not a pensionplan within the meaning of Decree No. 2016-182 ofFebruary 23, 2016 in application of the provisions of the“Macron law” No. 2015-990 of August 6, 2015 codified asArticle L. 225-102-1 of the French Commercial Code(Code de commerce), but the final payment of a fixedcapital amount to an institution in charge of paying thedeferred pension generated by this capital.
Other information and commitments
No stock subscription or purchase options were grantedto executive corporate officers in 2016, and no stockoptions were outstanding for François-Henri Pinault orJean-François Palus in respect of the options exercisedduring 2015.
The executive corporate officers have formally undertakennot to use hedges on their stock options or performanceshares, and no such hedges are currently in place.
Indemnities or benefits
owed or that may be payable Indemnities Employment Supplementary on termination or relating to a non- contract pension plan change of duties competition clauseExecutive corporate officers Yes No Yes No Yes No Yes No
François-Henri PinaultChairman and Chief Executive OfficerStart of term of office: May 19, 2005Expiry of term of office: 2017 AGM X X X X
Jean-François PalusGroup Managing Director Start of term of office: February 26, 2008 Expiry of term of office: 2017 AGM X X X X
Benefits in kind
Benefits in kind accruing to the Chairman and ChiefExecutive Officer correspond to the provision of acompany car. Since July 1, 2013, the Group ManagingDirector has been entitled to an annual allowance forresidence in London (amounting to GBP 900,000 for therelevant fiscal year or €1,098,257 at the average 2016exchange rate). The allowance provides the GroupManaging Director and his family with a residence inLondon following the relocation of his coordinationactivities for the Group’s international support functionsand the management of the Group’s activities. Theallowance meets the standards of the London real estatemarket to accommodate members of the top managementof an international corporation.
Termination payments
No indemnity is payable to the Chairman and ChiefExecutive Officer or the Group Managing Director in theevent of termination of their duties as corporate officers.
Supplementary pension plan
There are no supplementary defined benefit pensionplans for the executive corporate officers.
Non-competition indemnities
Executive corporate officers will not be eligible for anysuch indemnities.
4REMUNERATION OF DIRECTORS AND EXECUTIVE CORPORATE OFFICERS ~ CORPORATE GOVERNANCE
1692016 Reference Document ~ Kering

Performance shares granted to each executive corporate officer in 2016
Further to the decision by the Board of Directors to maintain the long-term incentive system based on monetaryinstruments, no performance shares have been granted to executive corporate officers since 2012.
Performance shares that became available during 2016 for each executive corporate officer
Number of shares that became Vesting Number and date of the plan available during the year conditions
François-Henri Pinault - - -
Jean-François Palus 2012-I Plan April 27, 2012 6,492 10% of the number of shares originally granted are to be purchased upon availability, within the limit of a ceiling equal to the sum of the last two years of cash-based remuneration (cumulative fixed and variable components) at the time of assessment
TOTAL 6,492
In 2016, no performance shares vested for François-Henri Pinault or Jean-François Palus.
Summary of remuneration, options and performance shares granted to each executive corporate officer
Gross amounts (in €)
François-Henri Pinault Amounts AmountsChairman and Chief Executive Officer for 2016 for 2015
Remuneration payable 2,641,715 2,404,499Value of multi-annual variable remuneration granted during the year (1) 1,092,633 1,154,337Value of options granted during the year - -Value of performance shares granted during the year - -
TOTAL 3,734,348 3,558,836
(1) This amount is determined at the grant date in accordance with IFRS 2 after taking into account any discount related to performance criteria and probability ofpresence in the Company at the end of the vesting period. The amount is recognised in the consolidated financial statements over the vesting period.
Gross amounts (in €)
Jean-François Palus Amounts AmountsGroup Managing Director for 2016 for 2015
Remuneration payable 3,352,036 3,460,472Value of multi-annual variable remuneration granted during the year (1) 968,985 1,009,953Value of options granted during the year (1) - -Value of performance shares granted during the year (1) - -
TOTAL 4,321,021 4,470,425
(1) This amount corresponds to the value of the options and financial instruments at the grant date as determined in accordance with IFRS 2 after taking intoaccount any discount related to performance criteria and probability of presence in the Company at the end of the vesting period, but prior to the recognition ofthe expense over the vesting period in accordance with IFRS 2.
4 CORPORATE GOVERNANCE ~ REMUNERATION OF DIRECTORS AND EXECUTIVE CORPORATE OFFICERS
170 Kering ~ 2016 Reference Document

The Annual General Meeting on May 6, 2014 had increasedthe total amount of Directors’ fees to be allocated to themembers of the Board of Directors for 2014 from€809,000 to €877,000, due to the appointment of anadditional Director. This amount remained unchanged in2015 and 2016.
Based on recommendations of the RemunerationCommittee, the Board of Directors’ meeting on February 9,2017 decided to allocate Directors’ fees on the basis ofthe actual presence of members at meetings of the Boardand its specialised Committees in 2016. In accordance withapplicable legislation, members cannot use videoconferenceor other remote technologies to participate in meetingsdiscussing the Annual Financial Statements and ManagementReport. Accordingly, Directors not physically in attendanceat the Board meeting approving the financial statementsare deemed absent and are not eligible for the relatedDirectors’ fees.
Out of the total amount set by the Annual General Meeting,the rule followed by the Board in order to comply withAFEP-MEDEF recommendation 20-1 for a significantvariable portion is to divide the total amount between a
40% fixed portion and a 60% variable portion. TheDirectors’ fees are allocated in the following manner:
a) a fixed portion, minus a special portion correspondingto the remuneration of the Chairs of the Audit,Remuneration and Appointments Committees,respectively (€23,000 each), the balance being allocatedwith a coefficient of 1 by Board membership, increasedby 0.5 per Committee;
b) a variable portion, allocated with a coefficient of 1 (2 forthe Vice-Chair) per presence at each meeting of theBoard and 0.5 for each attendance of a Committeemeeting.
For 2016, a total amount of €751,966 will be paid to thenon-executive Directors, allocated as follows:
• €303,077 for the fixed portion, of which €69,000 for thespecial portion;
• €448,892 for the variable portion.
Non-voting Directors do not collect any Directors’ fees inrespect of their participation in meetings of the Board ofDirectors which they are invited to attend.
3.2. Remuneration of non-executive corporate officers – Directors’ fees
4REMUNERATION OF DIRECTORS AND EXECUTIVE CORPORATE OFFICERS ~ CORPORATE GOVERNANCE
1712016 Reference Document ~ Kering

Directors’ feesThe table below shows Directors’ fees paid in 2015 and 2016 for fiscal years 2014 and 2015:
Members of the Board of Directors Amounts paidother than the Chief Executive Officer during the year (in €)and Group Managing Director 2016 2015
Patricia Barbizet Directors’ fees 174,870 173,552
Committee Chair 23,000 23,000Fixed portion 48,112 44,832Variable portion 103,758 105,721
Luca Cordero di Montezemolo Directors’ fees 62,079 54,451
Committee Chairman - -Fixed portion 27,493 25,618Variable portion 34,586 28,833
Yseulys Costes Directors’ fees 73,893 87,286
Committee Chair - -Fixed portion 34,366 32,023Variable portion 39,527 55,263
Jean-Pierre Denis Directors’ fees 104,842 108,687
Committee Chairman 23,000 23,000Fixed portion 27,493 25,618Variable portion 54,349 60,068
Philippe Lagayette Directors’ fees 97,431 99,076
Committee Chairman 23,000 23,000Fixed portion 27,493 25,618Variable portion 46,938 50,458
Baudouin Prot Directors’ fees 62,617 45,644
Committee Chairman - -Fixed portion 20,620 19,214Variable portion 41,997 26,430
Daniela Riccardi (1) Directors’ fees 48,332 2,804 (2)
Committee Chair - -Fixed portion 13,746 869Variable portion 34,586 1,935
Jochen Zeitz Directors’ fees 60,146 52,852
Committee Chairman - -Fixed portion 20,620 19,214Variable portion 39,527 33,638
Laurence Boone (3) Directors’ fees - 40,842
Committee Chairman - -Fixed portion - 9,607Variable portion - 31,236
Caroline Puel (4) Directors’ fees - 23,449
Committee Chairman - -Fixed portion - 4,227Variable portion - 19,222
Sophie Bouchillou (5) Directors’ fees 53,273 16,016
Committee Chair - -Fixed portion 13,746 6,405Variable portion 39,527 9,611
TOTAL 737,483 704,659
(1) The term of office of Daniela Riccardi started on May 6, 2014.(2) In December 2014, Daniela Riccardi received an advance of €25,000 on her Directors’ fees for 2014.(3) The term of office of Laurence Boone expired on July 15, 2014.(4) The term of office of Caroline Puel expired on May 6, 2014.(5) Sophie Bouchillou, Director representing the employees, was appointed on July 10, 2014.
4 CORPORATE GOVERNANCE ~ REMUNERATION OF DIRECTORS AND EXECUTIVE CORPORATE OFFICERS
172 Kering ~ 2016 Reference Document

To the Company’s knowledge:
• none of the Directors or executive corporate officershave been convicted for fraud in the last five years;
• none of the Directors or executive corporate officershave been associated in the last five years withbankruptcy, receivership or liquidation proceedings as amember of an administrative, management or supervisorybody or as Chief Executive Officer;
• no court order has been entered over the last five yearsagainst any of the Directors or executive corporateofficers that prohibits them from acting as a memberof an administrative, management or supervisory bodyof an issuer or from intervening in the management orrunning of the business of an issuer;
• no incrimination and / or official public penalty hasbeen entered against any of the Directors or executivecorporate officers by statutory or regulatory authorities(including designated professional bodies);
• none of the Directors or executive corporate officershave been given a commitment by the Company or any ofits subsidiaries corresponding to items of remuneration,indemnities or benefits payable or potentially payableon account of the commencement, termination orchange of his or her duties or subsequent thereto;
• none of the Directors or executive corporate officershave indicated the existence of an agreement with a mainshareholder, customer or supplier of the Companypursuant to which he or she was designated as Directoror executive corporate officer.
Moreover, no service contract providing for the grantingof benefits binds the Directors with the Kering group.
No assets belonging directly or indirectly to the Company’ssenior executives are used in Group operations.
In general, to the Company’s knowledge, none of theDirectors or executive corporate officers are in a positionof potential conflict of interest between their duties withregards to the Company and their private interests orother duties or have existing family ties with anotherDirector or executive corporate officer of the Company.
In accordance with Article L. 225-102-1 of the FrenchCommercial Code, François-Henri Pinault and Patricia Barbizetwere paid €1,225,208 and €1,690,350 respectively for2016 in respect of positions held at Financière PinaultSCA and Artémis SA.
The amounts stated above are unrelated to the corporateoffice held within Kering. They are paid by the Companyconcerned only.
3.3. Regulatory information on Directors and executive corporate officers
Neither the Company, nor any company that it controls,has made any commitment to its Directors or executivecorporate officers on account of the commencement,termination or change of duties or subsequent thereto.
No non-executive corporate officer or Director benefits fromany particular benefit or specific pension plan. They arenot entitled to any conditional or deferred remuneration.
Other than the remuneration set out above, neither theCompany, nor Artémis or Financière Pinault which controlit, has paid any remuneration or granted any benefits,directly or indirectly, to its Directors or executive corporateofficers in connection with their term of office, duties orassignments performed in or on behalf of the Company,and any company that it controls.
4REMUNERATION OF DIRECTORS AND EXECUTIVE CORPORATE OFFICERS ~ CORPORATE GOVERNANCE
1732016 Reference Document ~ Kering

Honorary Chairman of the Board of Directors
In accordance with the possibility provided for under theCompany’s Articles of Association, in its meeting onJune 18, 2013 which followed the Combined GeneralMeeting, the Board of Directors decided to confirmFrançois Pinault, founder of the PPR group, since renamedKering, as Honorary Chairman of the Board of Directors. Inthis capacity, François Pinault is invited to participate inthe meetings of the Board of Directors and of the Strategy &Development Committee on a consultative basis. He didnot participate in any of these meetings in 2016.
Vice-Chairman of the Board of Directors
In accordance with the possibility provided for under theCompany’s Articles of Association, in its meeting onJune 18, 2013 which followed the Combined GeneralMeeting, the Board of Directors renewed Patricia Barbizet’sterm of office as Vice-Chair of the Board of Directors forthe same duration as her term of office as Director. In thiscapacity, Patricia Barbizet prepares and coordinates thework of the Board of Directors and may chair Boardmeetings when the Chairman is absent.
Non-voting Directors
• Marco Bizzarri, Chairman and Chief Executive Officer ofGucci (appointed by the Board of Directors at itsmeeting on June 18, 2013);
• Björn Gulden, Chief Executive Officer of PUMA (appointedby the Board of Directors at its meeting on October 24,2013);
• Albert Bensoussan, CEO of Kering’s Luxury – Watches &Jewelry division (appointed by the Board of Directors atits meeting on July 30, 2014);
The main role of non-voting Directors is to attend Strategy &Development Committee meetings and, as required,Board of Directors’ meetings, to provide the necessaryinformation, expertise and knowledge of the Group’svarious businesses. They serve on a consultative basis. Thenon-voting Directors are appointed by the Board ofDirectors.
3.4. Other information on the Company’s Board of Directors
4 CORPORATE GOVERNANCE ~ REMUNERATION OF DIRECTORS AND EXECUTIVE CORPORATE OFFICERS
174 Kering ~ 2016 Reference Document

Group management is composed of the Group Executive Committee headed by François-Henri Pinault, Chairman andChief Executive Officer, and Jean-François Palus, Group Managing Director.
4. Group management
4GROUP MANAGEMENT ~ CORPORATE GOVERNANCE
1752016 Reference Document ~ Kering
EthicsCommittee
Insider GoodPractices Committee
Develops and monitorsadherence to ethics
principles within the Group
Develops and monitorsadherence to insider goodpractices within the Group
ExecutiveCommittee Divisions
ExecutiveManagement
RiskCommittee
Helps Identify and managestrategic, operational,reporting, reputationaland compliance risks
Managementand coordination
InformationConsultation
Setting of guidelinesand objectives Analysis of business performance
Board ofDirectors
Strategic decisions
Prior authorisation

Executive Committee
The Executive Committee meets regularly, with the ChiefExecutive Officers of the Group’s major brands andKering’s main operating officers. The 14-member ExecutiveCommittee is the Group’s key operational body andreflects Kering’s transformation into a more integratedgroup. It affords the Chief Executive Officers of its activitiesand major brands the opportunity to be more closelyinvolved in the Group’s key strategic decision-makingprocesses, alongside Kering’s main operating officers.
Members of the Executive Committee
• François-Henri Pinault (since March 2005), Chairmanand Chief Executive Officer;
• Jean-François Palus (since December 2005), GroupManaging Director;
• Jean-Philippe Bailly (since April 2016), Chief OperatingOfficer;
• Francesca Bellettini (since October 2015), ChiefExecutive Officer, Saint Laurent;
• Carlo Alberto Beretta (since October 2015), Group ChiefClient & Marketing Officer;
• Marco Bizzarri (since February 2012), Chairman andChief Executive Officer, Gucci;
• Jean-Marc Duplaix (since February 2012), Group ChiefFinancial Officer;
• Béatrice Lazat (since March 2016), Senior Vice-President,Group Human Resources;
• Marie-Claire Daveu (since September 2012), Group ChiefSustainability Officer and Head of International Affairs;
• Björn Gulden (since July 2013), Chief Executive Officer,PUMA;
• Albert Bensoussan (since June 2014), Chief ExecutiveOfficer of Kering’s Luxury – Watches & Jewelry division;
• Roberto Vedovotto (since March 2015), Chairman andChief Executive Officer, Kering Eyewear;
• Valérie Duport (since May 2016), Group Senior Vice-President, Communications and Image;
• Claus-Dietrich Lahrs (since October 2016), ChiefExecutive Officer, Bottega Veneta.
Monthly activity and budget reviewmeetings
The Executive Management of Kering, and the ChiefExecutive Officers of the major brands, hold regular meetingsto assess business developments. This assessment isbased on operational and financial metrics.
Insider Good Practices Committee
Composed of the Group Managing Director and the Headof the Legal Department, the Insider Good PracticesCommittee draws up the timetable of black-out periodsfor trading in Kering securities, lists of insiders, letters ofinformation and monitoring in relation to rules on insiderdealing, which are sent to the relevant managers and seniorexecutives of the Group as well as to occasional andpermanent insiders, in accordance with the GeneralRegulations of the French financial markets authority(Autorité des marchés financiers – AMF) and Regulation(EU) No. 596 / 2014 of April 16, 2014 of the EuropeanParliament and of the Council on market abuse. Themembers of the Group’s Executive Committee are requiredto consult the Insider Good Practices Committee beforetrading in Company shares or similar financial instruments.
Pursuant to the provisions of Article 223-26 of the AMF’sGeneral Regulations, to the Company’s knowledge, notransactions were carried out by the individuals referredto in Article L. 621-18-2 of the French Monetary and FinancialCode (Code monétaire et financier) on Kering’s financialinstruments during 2016, except as follows:
• on August 2, 2016, Marco Bizzarri sold 2,590 shares at aprice of €168.25 per share.
• on May 5, 2016, in accordance with the provisions ofthe Company’s Articles of Association, Sophie L’Hélias,newly appointed as a Director, acquired 500 shares at aprice of €150.59 per share.
Ethics Committee
Kering’s Ethics Committee was set up in 2005, and is nowsupported by two regional Ethics Committees: the Asia-Pacific Ethics Committee and the Americas EthicsCommittee and an international hotline available for allGroup staff. The Ethics Committees are composed ofrepresentatives of the Group’s brands and Kering staff.Their regional organisation reflects the Group’s policy ofdelegating responsibility, which results in better qualityresponses to queries. Operating on a “last resort” basisunder the authority of the Group Ethics Committee towhich they report, these Committees ensure that theGroup’s ethical principles are applied consistently.
4 CORPORATE GOVERNANCE ~ GROUP MANAGEMENT
176 Kering ~ 2016 Reference Document

The remuneration structure changed in 2016, with theintroduction of non-financial criteria for annual variableremuneration aimed at promoting the achievement ofshort- and medium-term targets. The purpose of therevised policy is to objectify and align the interests ofexecutive corporate officers with those of the Companyand its shareholders.
The remuneration structure in 2016 continued to bemade up of three components:
• a fixed annual portion;• a variable annual portion;• a multi-annual variable portion (KMUs).
An independent firm performed an in-depth study andbenchmarked comparable companies with regard to thesecomponents, assisted by the members of the RemunerationCommittee. The companies benchmarked are:
• international industry-based panel (13 companies):Burberry, Coach, Estée Lauder, Hermès, Hugo Boss,L’Oréal, Luxottica, LVMH, Prada, Ralph Lauren, Richemont,Swatch, Tiffany & Co;
• CAC 40 panel (14 companies): Accor, Cap Gemini,Danone, Essilor International, Lafarge, Legrand, L’Oréal,LVMH, Pernod Ricard, Publicis Groupe, Safran, Solvay,Valeo, Vivendi.
The amounts corresponding to 2016 remuneration areshown in the tables on page 162 et seq.
5.1. 2016 remuneration policy
Pursuant to Sapin II French Law, we set out below theprinciples and criteria for determining, allocating andawarding components making up the total remunerationof executive corporate officers. This report was preparedwith the assistance of the Remuneration Committee andwas approved by the Board of Directors at its meeting onMarch 10, 2017.
In its analysis and proposals, the RemunerationCommittee strives to comply with the recommendationsof the revised AFEP-MEDEF Code.
The remuneration policy takes into account the principlesof completeness, balance, coherence, intelligibility andproportion. All components of executive corporate officerremuneration are reviewed each year.
At various meetings held in 2016 and early 2017, theRemuneration Committee performed an in-depth reviewof the structure of executive corporate officer remuneration.
Certain proposals were adopted by the Board and wereapplied as from 2016. These include the introduction ofthree qualitative performance-based criteria on which30% of annual variable remuneration is based: onecriterion linked to a sustainability target, one to aCorporate Social Responsibility target and one relating toorganisation and talent management. The Committeealso looked to introduce greater linearity between therate of achievement of the targets and the rate ofremuneration awarded.
Elements relating to the remuneration policy andapplicable in 2016 are set out below, in section 5.1.
At its meeting on March 10, 2017, the Board alsoapproved all of the proposals made by the RemunerationCommittee as regards the overhaul of executive pay.These are set out hereinafter, in section 5.2.
5. Report on the total remuneration of executivecorporate officers policy
4REPORT ON THE TOTAL REMUNERATION OF EXECUTIVE CORPORATE OFFICERS POLICY ~ CORPORATE GOVERNANCE
1772016 Reference Document ~ Kering

Remuneration (1)
(in euros and at comparable exchange rates) 2013 2014 2015 2016
Fixed remuneration (2) 998,195 1,018,622 1,018,622 1,018,622Cash-based remuneration paid (3) 2,118,195 1,967,442 2,294,609 1,893,453LTI award (4) 1,483,976 1,357,344 1,629,586 1,402,368Total remuneration 3,602,171 3,324,786 3,924,195 3,295,821
(1) Amounts paid during the year.(2) Fixed remuneration translated into euros at the average 2016 exchange rate.(3) Cash-based remuneration paid includes fixed and annual variable remuneration.(4) The LTI award corresponds to an estimate based on an award equivalent to 70% [fixed remuneration Y + annual variable remuneration due for Y-1] / Value of KMUs
at December 31 of Y-1.
STRUCTURE OF TOTAL REMUNERATION OF THE GROUP MANAGING DIRECTOR
HISTORICAL TOTAL REMUNERATION OF THE GROUP MANAGING DIRECTOR
Remuneration (1) (in euros) 2013 2014 2015 2016
Fixed remuneration 1,099,996 1,099,996 1,099,996 1,099,996Cash-based remuneration paid (2) 2,578,396 2,339,476 2,660,896 2,258,956LTI award (3) 1,804,848 3,280,568 (4) 1,862,551 1,581,316Total remuneration 4,383,244 5,620,044 4,523,447 3,840,272
(1) Amounts paid during the year.(2) Cash-based remuneration paid during the year includes fixed and annual variable remuneration.(3) The LTI award corresponds to an estimate based on an award equivalent to 70% [fixed remuneration Y + annual variable remuneration due for Y-1] / Value of KMUs
at December 31 of Y-1.(4) The LTI award in 2014 includes the exceptional award of 9,900 KMUs.
4 CORPORATE GOVERNANCE ~ REPORT ON THE TOTAL REMUNERATION OF EXECUTIVE CORPORATE OFFICERS POLICY
178 Kering ~ 2016 Reference Document
STRUCTURE OF TOTAL REMUNERATION OF THE CHAIRMAN AND CHIEF EXECUTIVE OFFICER
HISTORICAL TOTAL REMUNERATION OF THE CHAIRMAN AND CHIEF EXECUTIVE OFFICER
Fixed remuneration 29%
Variableremuneration 30%
LTI 41%
Fixed remuneration 31%
Variableremuneration 27%LTI 42%
2013
€1m
€0m
€2m
€3m
€4m
€5m
€6m
€7m
2014 2015 2016
Fixed remunerationCash-based remuneration paid
Total remunerationLTI award
2013
€1m
€0m
€2m
€3m
€4m
€5m
€6m
€7m
2014 2015 2016
Fixed remunerationCash-based remuneration paid
Total remunerationLTI award

5.1.2.3. Targets set for 2016
Based on a recommendation of its Committees, at the beginning of the year the Board of Directors determines specificand ambitious qualitative and quantitative targets for the year ahead. Targets are assigned that apply to both theChairman and Chief Executive Officer and Group Managing Director as well to each officer individually:
Targets applicable to both the Chairman and Chief Executive Officer and the Group Managing Director Weighting
Recurring operating income (financial criterion) 35%Free cash flow from operations (financial criterion) 35%Sustainability: definition and launch of the “Advance” project at 10%Group level and at the level of the brands (non-financial criterion) Corporate Social Responsibility: finalisation of the roll-out of the 10%Group’s compliance program (non-financial criterion)
Targets applicable specifically to Targets applicable specifically to the Chairman and Chief Executive Officer the Group Managing Director
Organisation and talent management: management Organisation and talent management: finalisation 10%of the talent pool for the Creative Division for all of the implementation of all components of the new of the Group’s brands (non-financial criterion) KLLIO organisation (non-financial criterion)
5.1.1. Fixed remuneration
The annual fixed remuneration of the Chairman and ChiefExecutive Officer and Group Managing Director reflectstheir roles and responsibilities. The Chairman and ChiefExecutive Officer’s remuneration has remained unchangedsince 2011, while the Group Managing Director’sremuneration has remained unchanged since 2012.
5.1.2. Annual variable remuneration
Variable remuneration is designed to align the rewardaccruing to executive corporate officers with the Group’sannual performance and to help drive forward theGroup’s strategy year after year. Variable remuneration isexpressed as a percentage of annual fixed remuneration.
In 2016, the Remuneration Committee changed thevariable remuneration for executive corporate officers inorder to (i) introduce qualitative criteria, and (ii) increasethe linearity between the rate of achievement of thetargets set and the bonus paid.
Variable remuneration therefore reflects the seniorexecutive’s ability to achieve the performance targets andhis / her ability to create value for shareholders.
5.1.2.1. Alignment between the rate of achievementof targets and the bonus paid
Acting on a recommendation of the RemunerationCommittee, the Board of Directors considered the bestways to achieve greater linearity between the rate of thebonus awarded and the rate of achievement, andintroduced the following mechanism:
• minimum target achievement rate: 75%;
• full linearity for an achievement rate of between 75%and 100% (e.g., an 87.5% achievement rate gives rise tothe payment of 50% of the bonus);
• maximum of 150% potentially met when theachievement rate is 140% or more.
5.1.2.2. Introduction of qualitative criteria
Acting on a recommendation of the RemunerationCommittee, the Board of Directors decided to introduceequally-weighted non-financial performance criteria thatare in line with the Group’s sustainability objectives todetermine 30% of the variable remuneration of executivecorporate officers. These criteria are based around thefollowing three indicators:
• organisation and talent management;• Corporate Social Responsibility;• sustainability.
The targets associated with these three indicators areformulated and proposed to the Board of Directors on ayearly basis by the Remuneration Committee, assisted bythe competent Board Committees. These same Committeesdocument and place on record the extent to which eachcriterion has been met.
The criteria to be met for each target are both annual andmulti-annual when the achievement of the associatedtarget is also assessed over the long term.
Depending on the year, these targets may be the same ordifferent for each executive corporate officer.
4REPORT ON THE TOTAL REMUNERATION OF EXECUTIVE CORPORATE OFFICERS POLICY ~ CORPORATE GOVERNANCE
1792016 Reference Document ~ Kering

4 CORPORATE GOVERNANCE ~ REPORT ON THE TOTAL REMUNERATION OF EXECUTIVE CORPORATE OFFICERS POLICY
180 Kering ~ 2016 Reference Document
Sustainability: definition andlaunch of the “Advance” project atGroup level and at the level of thebrands (non-financial criterion)
Target applicable to both the Chairman and Chief Executive Officerand the Group Managing Director
• meetings with the Executive Committees of the brands;• meetings with designers and their teams;• introduction of a specific Steering Committee involving all of Kering’s Executive
Committee members;• support by Executive Committee members of Groupwide strategic issues;• organisation of workshops with each of the brands to prepare the “Advance” strategy
and action plan;• internal and worldwide communication.
Corporate Social Responsibility:finalisation of the roll-out of theGroup’s compliance program (non-financial criterion)
Target applicable to both the Chairman and Chief Executive Officer and the Group Managing Director
• roll-out of a network of Compliance Officers for the brands worldwide, responsible forimplementing policies and procedures devised by the Group’s Chief Compliance Officer;
• finalisation of guidelines, comprising:- an anti-corruption policy and six related procedures,- a competition policy (adapted to local laws) and a procedure covering involvement
in professional associations, rounded out by a series of recommendations and atraining kit,
- a campaign to increase awareness of competition law and an e-learning programme,- a review of contracts for the brands and distribution contract templates.
Organisation and talentmanagement: finalisation of the implementation of all components of the new Kering Logistics and Industrial Operations (KLLIO)organisation (non-financialcriterion)
Target applicable specifically to the Group Managing Director
Introduction of a shared “Operations” service to assist and support the development andgrowth of Luxury brands:
• four operational functions (Logistics, Industry, Product Development and IT) focusedon KLLIO core businesses. These are fully responsible for the quality of the servicesprovided on behalf of the brands, from product and service design to execution;
• two Group-wide functions (Sustainability and Sourcing) arranged in an effort toharmonise processes and leverage volume effects;
• three support functions (Finance, Human Resources and Legal) focused onorganisation, HR and cost optimisation issues.
A considerable amount of time was spent rallying a team around common values, andon defining and aligning roles and responsibilities, particularly in managing relationswith client brands.
Organisation and talentmanagement: management of the talent pool for the CreativeDivision for all of the Group’sbrands (non-financial criterion)
Target applicable specifically to theChairman and Chief Executive Officer
Recruitment of two Creative Directors, breathing new life into three Luxury brands:
• Demna Gvasalia (Balenciaga): highly visible in the media and on social networksafter presenting his first collection in February. A good degree of buzz, creating arenewed keen interest in the brand. Demna Gvasalia picked up a prize for hisBalenciaga collections at the Fashion Awards for best Prêt-à-Porter Designer;
• Anthony Vacarello (Saint Laurent): Anthony succeeded Hedi Slimane and his firstcollection unveiled in Paris in October was warmly received.
Stellar results should also be mentioned at Gucci, where Alessandro Michele,promoted internally in 2015, helped turn around the brand. The creative positioningof Gucci and the desirability of its products attracted new customers across allregions. Alessandro Michele picked up several international awards in 2016,including the CFDA in New York and Fashion Awards in London.
5.1.2.4. Achievements in 2016
For each target, the Committee concerned drew up a list of criteria to help determine the extent to which non-financialtargets had been met. Based on this, the Board of Directors then assessed the rate of achievement of each of thetargets (for more details on the achievement rates for each target, see pages 165 and 166).
Targets Basis for assessment in determining the extent to which targets are met

4REPORT ON THE TOTAL REMUNERATION OF EXECUTIVE CORPORATE OFFICERS POLICY ~ CORPORATE GOVERNANCE
1812016 Reference Document ~ Kering
5.1.3. Multi-annual variable remuneration
From 2013 onwards, the multi-annual variable remunerationsystem was changed to include Kering Monetary Units(KMUs), also awarded based on a performance condition(minimum average increase in Kering earnings per sharefrom continuing operations attributable to owners).
The extent to which the performance condition applicableto executive corporate officers is achieved is assessed asfollows: the number of KMUs exercisable at the end of thethree-year vesting period is reduced accordingly if theminimum average increase in earnings per share fromcontinuing operations attributable to owners for theperiod is less than 5%, and no KMUs can be exercised ifthe average increase is 2.5% or less.
5.1.4. Exceptional remuneration
Executive corporate officers were not awarded anyexceptional remuneration in 2016.
5.1.5. Directors’ fees
Executive corporate officers receive Directors’ fees forsome of the offices they hold within the Group.
5.1.6. Allotment of stock options and / or performance shares
Since the long-term incentive system based on Keringmonetary instruments remains in force, no performanceshares or stock options were granted to executivecorporate officers for 2016.
5.1.7. Benefits for taking up a position or termination payments
Executive corporate officers are not entitled to anybenefits for taking up a position or termination payments.
5.1.8. Supplementary pension plan
Executive corporate officers are not eligible for anysupplementary pension plans. Pension benefits in theform of capital accruing to the Group Managing Directorsince 2010 were closed out following payment of saidcapital amount pursuant to a decision of the Board ofDirectors on March 11, 2016.
5.1.9. Non-competition indemnities
Executive corporate officers are not eligible for any suchindemnities.
5.1.10. Benefits in kind
The Chairman and Chief Executive Officer is entitled to acompany car with a driver.
Since July 1, 2013, the Group Managing Director has beenbased in London. For this reason he receives an annualresidence allowance representing a total of GBP 900,000.The allowance provides the Group Managing Director andhis family with a residence in London following therelocation of his coordination activities for the Group’sinternational support functions and the management ofthe Group’s activities.

(1) Data restated to reflect the 2016 exchange rate.(2) Translated into euros at the average 2016 exchange rate.
Fixed remuneration due for the year 2015:
Payment of fixed remuneration of €1,018,622 (1).
Fixed remuneration due for the year 2016:
Payment of fixed remuneration of €1,018,622 (2).
Jean-François PalusGroup Managing Director
Fixed remuneration due for the year 2015:
Payment of fixed remuneration of €1,099,996.
Fixed remuneration due for the year 2016:
Payment of fixed remuneration of €1,099,996.
François-Henri Pinault Chairman and Chief Executive Officer
The Board of Directors set the fixed remuneration for theChairman and Chief Executive Officer at its meeting ofFebruary 16, 2011.
At its meeting on June 18, 2013, the Board of Directorsnoted, on the recommendation of the RemunerationCommittee, the relocation to London of part of the GroupManaging Director’s activities in the context of the deploymentof the Group’s international activities. Consequently, theBoard decided to implement for the Group ManagingDirector with effect from July 1, 2013, an EmploymentAgreement with Kering Netherlands BV, a Group subsidiarygoverned by Dutch law, as well as a Service Agreement(similar to an employment agreement) with KeringInternational Ltd, a Group subsidiary governed by Englishlaw. Under the terms of these two agreements, whichcover the management of the Group’s activities and thecoordination of the Group’s international supportfunctions respectively, these two companies will each payhalf of the Group Managing Director’s fixed annualremuneration (€500,000 for Kering Netherlands BV andGBP 425,000 for Kering International Ltd).
This amount remains unchanged.
Summary of changes to remuneration of the Chairman and Chief Executive Officer and Group Managing Director for 2016
Fixed remuneration
Principles applicable in 2015 Changes introduced in 2016
4 CORPORATE GOVERNANCE ~ REPORT ON THE TOTAL REMUNERATION OF EXECUTIVE CORPORATE OFFICERS POLICY
182 Kering ~ 2016 Reference Document

4REPORT ON THE TOTAL REMUNERATION OF EXECUTIVE CORPORATE OFFICERS POLICY ~ CORPORATE GOVERNANCE
1832016 Reference Document ~ Kering
The annual variable remuneration awarded depends onthe extent to which the targets set have been achieved, asassessed after the end of the fiscal year. KeringNetherlands BV and Kering International Ltd each pay halfof the Group Managing Director’s annual variableremuneration.
Introduction of non-financial targets. These were introducedby the Board of Directors based on a recommendation of theRemuneration Committee and are designed to meet thedemands of certain investors, as relayed by rating agencies. Theintroduction of non-financial targets fulfils a dual purpose: (i) toincrease the linearity between the rate of achievement of thetargets and the bonus awarded, and (ii) to introduce certainqualitative criteria within performance conditions.
In accordance with the recommendations of the revised AFEP-MEDEF Code, the rules for setting annual variable remunerationare consistent with the yearly assessment of the Chairman andChief Executive Officer’s performance and with Kering’s strategy.
Target amount:The rate of achievement of each of these targets must be atleast 90% for variable remuneration to be paid:
• when the rate of achievement is below 90%, no bonus isawarded;
• when the rate of achievement is 90%, a bonus is awardedequal to 75% of fixed remuneration, excluding any KMU-based remuneration;
• when the rate of achievement is 100%, a bonus is awardedequal to 120% of fixed remuneration for the Chairman andChief Executive Officer and to 100% of fixed remunerationfor the Group Managing Director, excluding any KMU-based remuneration;
• when the rate of achievement is 115%, a bonus is awardedequal to 150% of fixed remuneration for the Chairmanand Chief Executive Officer and Group Managing Director,excluding any KMU-based remuneration;
• when the rate of achievement is 125%, a bonus is awardedequal to 180% of fixed remuneration for the Chairman andChief Executive Officer only, excluding any KMU-basedremuneration.
Target amount:The rate of achievement of each of these financial targets must be at least 75% for variable remuneration to be paid.When the rate of achievement is below 75%, no bonus isawarded for the portion based on financial targets, i.e., 70% of annual variable remuneration. The minimum achievementrate for non-financial targets is subject to the Board’s approval.
Targets:There are two equally-weighted financial targets whencalculating variable remuneration:• consolidated recurring operating income (50%);• consolidated cash flow from operations (50%).
Targets:Financial targets now determine 70% of annual variableremuneration:• consolidated recurring operating income (35%);• consolidated free cash flow from operations (35%).
Introduction of new equally-weighted qualitative performancecriteria determining 30% of annual variable remuneration:• organisation and talent management (10%):
- build-up of the talent pool for the Creative Division for all ofthe Group’s brands (target applying to the Chairman andChief Executive Officer),
- finalisation of the roll-out of all components (operational, HR andlegal) of the new KLLIO organisation (target applying to the GroupManaging Director);
• corporate Social Responsibility (finalisation of the roll-out of theGroup’s compliance program (10%);
• sustainability (definition and launch of the “Advance” projectat Group level and at the level of the brands (10%).
Annual variable remuneration
Principles applicable in 2015 Changes introduced in 2016

(1) Data restated to reflect the 2016 exchange rate.(2) Translated into euros at the December 31, 2016 closing exchange rate.
Variable remuneration due for 2015:
• rate of achievement for the “Consolidated recurringoperating income” target: 98.3%;
• rate of achievement for the “Consolidated free cashflow from operations” target: 91.9%;
• combined rate of award: 87.8%.
Resulting in payment of variable remunerationof €874,831 (1).
Variable remuneration due for 2016:
• rate of achievement for the “Consolidated recurringoperating income” target: 36.4%;
• rate of achievement for the “Consolidated free cashflow from operations” target: 40.2%;
• rate of achievement for the “Organisation and talentmanagement” target: 10%;
• rate of achievement for the “Corporate SocialResponsibility” target: 10%;
• rate of achievement for the “Sustainability” target: 10%;• combined rate of award: 106.6%.
Resulting in payment of variable remunerationof €1,062,302 (2).
Jean-François PalusGroup Managing Director
Variable remuneration due for 2015:
• rate of achievement for the “Consolidated recurringoperating income” target: 98.3%;
• rate of achievement for the “Consolidated free cashflow from operations” target: 91.9%;
• combined rate of award: 87.8%.
Resulting in payment of variable remunerationof €1,158,960.
Variable remuneration due for 2016:
• rate of achievement for the “Consolidated recurringoperating income” target: 36.4%;
• rate of achievement for the “Consolidated free cashflow from operations” target: 40.2%;
• rate of achievement for the “Organisation and talentmanagement” target: 10%;
• rate of achievement for the “Corporate SocialResponsibility” target: 10%;
• rate of achievement for the “Sustainability” target: 10%;• combined rate of award: 106.6%.
Resulting in payment of variable remunerationof €1,407,318.
François-Henri PinaultChairman and Chief Executive Officer
4 CORPORATE GOVERNANCE ~ REPORT ON THE TOTAL REMUNERATION OF EXECUTIVE CORPORATE OFFICERS POLICY
184 Kering ~ 2016 Reference Document

4REPORT ON THE TOTAL REMUNERATION OF EXECUTIVE CORPORATE OFFICERS POLICY ~ CORPORATE GOVERNANCE
1852016 Reference Document ~ Kering
Long-term incentive scheme introduced in 2013 andbased on Kering Monetary Units, whose value is indexedequally to both absolute changes in the Kering share priceand changes in the Kering share price relative to a basketof nine Luxury and Sport & Lifestyle stocks.
No changes were made.
Award:The value of the multi-annual variable remunerationaward is equal to 70% of total annual cash-basedremuneration paid in year Y. The number of KMUsawarded in year Y therefore corresponds to: 70% [fixedremuneration Y + annual variable remuneration due for Y-1] / Value of KMUs at December 31 of Y-1.
No changes were made.
Benchmark:The following companies were used to compile thebenchmark: Adidas / Burberry / Ferragamo / LVMH / Nike / Prada / Richemont / Swatch / Tod’s.
No changes were made.
Vesting period:The KMU vesting period is set at three years as fromJanuary 1 of the year in which they are granted.
No changes were made.
Cash-ins:A two-year cash-in period begins at the end of the vestingperiod, with KMUs able to be cashed in twice a year, inApril and October.
No changes were made.
Vesting conditions:KMU vesting is subject to several cumulative conditions:
• increase in earnings per share from continuing operationsexcluding non-recurring items for Y-1 versus the previousyear, in accordance with the Group’s sustainable growthtarget:- if the increase is less than 2.5%, no KMUs are awarded,- if the increase is between 2.5% and 5%, KMUs are
awarded on a linear basis from 0% to 100%,- if the increase is more than 5%, 100% of KMUs are
awarded (award capped);• performance of the Kering share relative to a panel of
companies at the vesting date;• vesting and holding of a portion of Kering shares equal to
at least 30% of the net statutory and tax value of thecash-ins, subject to a cap equal to the sum of the last twoyears of cash-based remuneration (cumulative fixed andvariable components) at the time of the assessment;
• continuation of a qualifying activity within the Group.
No changes were made.
Multi-annual variable remuneration (KMUs)
Principles applicable in 2015 Changes introduced in 2016
Cash-ins during 2015:
Loss of the right to cash in the 9,763 KMUs awarded in2013 owing to the increase of 1.7% in earnings per sharefrom continuing operations attributable to owners overthe past three years.
Cash-ins during 2016:
Loss of the right to cash in the 9,426 KMUs awarded in2014 owing to the decrease of 1.9% in earnings per sharefrom continuing operations attributable to owners overthe past three years.
Award during 2015:
Award of 9,758 KMUs with a unit value of €167 atDecember 31, 2014, representing an award valueof €1,629,586.
The KMUs may be cashed in as from April 2018, subjectto meeting the aforementioned conditions.
Award during 2016:
Award of 8,448 KMUs with a unit value of €166 atDecember 31, 2015, representing an award valueof €1,402,368.
The KMUs may be cashed in as from April 2019, subject tomeeting the aforementioned conditions.
Jean-François PalusGroup Managing Director
Cash-ins during 2015:
Loss of the right to cash in the 11,874 KMUs awarded in2013 owing to the increase of 1.7% in earnings per sharefrom continuing operations attributable to owners overthe past three years.
Cash-ins during 2016:
Loss of the right to cash in the 11,372 KMUs awarded in2014 owing to the decrease of 1.9% in earnings per sharefrom continuing operations attributable to owners overthe past three years.
This loss of cash-in rights does not however concernthe 9,900 KMUs awarded to the Chairman and ChiefExecutive Officer on an exceptional basis pursuant to adecision of the Board of Directors’ meeting onDecember 8, 2014, acting on a recommendation of theRemuneration Committee, which is not subject to anyperformance conditions. This award of a long-termperformance bonus to the Chairman and Chief ExecutiveOfficer was approved in recognition of the Group’stransformation into a Luxury and Sport & Lifestyle business.The value of this bonus award in the form of KMUs wasequal to 70% of his total annual cash-based remunerationpaid in 2014, which amounted to €2,339,480. On thisbasis, 9,900 KMUs were granted with a unit value of €166as of June 30, 2014, corresponding to a total valueof €1,643,400.
Based on the price of a KMU at December 31, 2016(€249), cashing in these 9,900 KMUs as from April 2017could represent up to €2,465,100.
Award during 2015:
Award of 11,153 KMUs with a unit value of €167 atDecember 31, 2014, representing an award valueof €1,862,551.
The KMUs may be cashed in as from April 2018, subjectto meeting the aforementioned conditions.
Award during 2016:
Award of 9,526 KMUs with a unit value of €166 atDecember 31, 2015, representing an award valueof €1,581,316.
The KMUs may be cashed in as from April 2019, subject tomeeting the aforementioned conditions.
François-Henri PinaultChairman and Chief Executive Officer
4 CORPORATE GOVERNANCE ~ REPORT ON THE TOTAL REMUNERATION OF EXECUTIVE CORPORATE OFFICERS POLICY
186 Kering ~ 2016 Reference Document

4REPORT ON THE TOTAL REMUNERATION OF EXECUTIVE CORPORATE OFFICERS POLICY ~ CORPORATE GOVERNANCE
1872016 Reference Document ~ Kering
Benefits in kind
Principles applicable in 2015 Changes introduced in 2016
No changes were made to benefits in kind.
(1) Data restated to reflect the 2016 exchange rate.(2) Translated into euros at the average 2016 exchange rate.
Indemnities or benefits owed or that may be payable on termination or change of duties
Principles applicable in 2015 Changes introduced in 2016
Value of benefits in kind granted for 2015:The estimated value of benefits in kind was €1,098,257 (1).
Value of benefits in kind granted for 2016:The estimated value of benefits in kind was €1,098,257 (2).
Jean-François PalusGroup Managing Director
Value of benefits in kind granted for 2015:The estimated value of benefits in kind was €18,612.
Value of benefits in kind granted for 2016:The estimated value of benefits in kind was €17,222.
François-Henri PinaultChairman and Chief Executive Officer
Benefits in kind accruing to the Chairman and Chief ExecutiveOfficer correspond to the provision of a company car.
Since July 1, 2013, the Group Managing Director has beenentitled to an annual allowance for residence in London(amounting to GBP 900,000 for the relevant fiscal year). Theallowance provides the Group Managing Director and hisfamily with a residence in London following the relocation ofhis coordination activities for the Group’s international supportfunctions and the management of the Group’s activities.
No changes were made.The Chairman and Chief Executive Officer is not eligible forany indemnities in the event of termination of duties.
This is also the case for the Group Managing Director.

Directors’ fees
Principles applicable in 2015 Changes introduced in 2016
Out of the total amount set by the Annual General Meeting,the rule followed by the Board in order to comply with AFEP-MEDEF Recommendation 21-1 (recommended significantvariable portion) is to divide the total amount between a40% fixed portion and a 60% variable portion. The Directors’fees are allocated in the following manner:
a. a fixed portion, minus a special portion corresponding tothe remuneration of the Chairs of the Audit,Remuneration and Appointments Committees,respectively (€23,000 each), the balance being allocatedwith a coefficient of 1 by Board membership, increased by0.5 per Committee;
b. a variable portion, allocated with a coefficient of 1 (2for the Vice-Chair) per presence at each meeting of theBoard and 0.5 for each attendance of a Committeemeeting.
These Directors’ fees are increased by the Directors’ feespaid by the Group’s subsidiaries.
No changes were made.
4 CORPORATE GOVERNANCE ~ REPORT ON THE TOTAL REMUNERATION OF EXECUTIVE CORPORATE OFFICERS POLICY
188 Kering ~ 2016 Reference Document
Supplementary pension plan
Principles applicable in 2015 Changes introduced in 2016
There are no supplementary defined benefit pensionplans for the Chairman and Chief Executive Officer.
Concerning the Group Managing Director, at the beginning of2010 the Board of Directors authorised the grant of a pensionbenefit to Jean-François Palus. This benefit takes the formof a capital transfer of an amount of €3.568 million to a fundentitling him to payment of a full pension (with a right ofreversion) from the legal retirement age, and is not subjectto his presence within the Group. However, to benefit fromthe plan, Jean-François Palus must not have left the Groupfor personal reasons before December 31, 2014 and theperformance criteria for entitlement to the variable portionof his remuneration for 2009 and 2010 must be fulfilled.The capital was intended to finance a target pension annuityof a non-guaranteed amount, representing approximately25% of his annual remuneration paid in 2009 accordingto the actuarial rates applied within the Group.
On March 18, 2015, the Board of Directors noted that Jean -François Palus had not left the Group for personal reasons andthat his performance conditions for 2009 and 2010 had beenfulfilled. Consequently, the condition no longer applied. Inaddition, on March 11, 2016, the Board of Directors reviewed theagreement and agreed on its implementation, based on a totalpayment of €4,724,540 (following application of a 5% interestrate to the initial capital of €3,568,000 for the relevant period).
The Board of Directors therefore noted the extinguishment of theGroup’s debt under the aforementioned agreement.
Non-competition indemnities
Principles applicable in 2015 Changes introduced in 2016
The Chairman and Chief Executive Officer is not eligible for any non-competition indemnities.
This is also the case for the Group Managing Director.
No changes were made.
4REPORT ON THE TOTAL REMUNERATION OF EXECUTIVE CORPORATE OFFICERS POLICY ~ CORPORATE GOVERNANCE
1892016 Reference Document ~ Kering
Acting on a recommendation of the RemunerationCommittee, the Board of Directors’ meeting onFebruary 9, 2017 approved the remuneration policy forthe Chairman and Chief Executive Officer and the GroupManaging Director for 2017.
In compliance with the provisions of Article L. 225-37-2of the French Commercial Code, the remuneration policydescribed below, which includes the principles andcriteria for determining, allocating and awarding fixed,variable and exceptional components making up totalremuneration and benefits of any kind granted toexecutive corporate officers, will be submitted to theapproval of Kering’s 2017 Annual General Meeting (theremuneration due or awarded to the Chairman and ChiefExecutive Officer and the Group Managing Director for
2016, which is described above, will be submitted to theadvisory opinion of the shareholders).
5.2.1. Change in operating environment
The Remuneration Committee’s meetings took into accountthe changes that the Group underwent in 2015-2016 aswell as the changes in its regulatory environment, toensure that the proposal submitted for the Board’sapproval complies with the demands of shareholders atthe 2017 Annual General Meeting.
The elements adopted by the Board were reviewed byindependent experts, who considered the pertinence ofboth the remuneration structure put in place and theperformance criteria used.
On April 29, 2016, the Annual General Meeting gave a favourable opinion on the remuneration due or awarded to theChairman and Chief Executive Officer and the Group Managing Director for 2015.
5.2. 2017 remuneration policy
Exceptional remuneration
Principles applicable in 2015 Changes introduced in 2016
Directors’ fees payable for 2015:
Directors’ fees payable for 2015 totalled €195,087. A totalof €65,087 relates to Directors’ fees paid by Kering:
• €20,620 for the fixed portion;
• €44,468 for the variable portion.
And €130,000 relates to Directors’ fees paid by theGroup’s subsidiaries.
Directors’ fees payable for 2016:
Directors’ fees payable for 2016 totalled €190,355. A totalof €60,355 relates to Directors’ fees paid by Kering:
• €20,453 for the fixed portion;
• €39,901 for the variable portion.
And €130,000 relates to Directors’ fees paid by theGroup’s subsidiaries.
Jean-François PalusGroup Managing Director
Directors’ fees payable for 2015:
Directors’ fees payable for 2015 totalled €126,931. A totalof €74,431 relates to Directors’ fees paid by Kering:
• €27,493 for the fixed portion;
• €46,938 for the variable portion.
And €52,500 relates to Directors’ fees paid by the Group’ssubsidiaries.
Directors’ fees payable for 2016:
Directors’ fees payable for 2016 totalled €117,179. A totalof €64,679 relates to Directors’ fees paid by Kering:
• €27,271 for the fixed portion;
• €37,408 for the variable portion.
And €52,500 relates to Directors’ fees paid by the Group’ssubsidiaries.
François-Henri PinaultChairman and Chief Executive Officer
No exceptional remuneration was granted to the Chairmanand Chief Executive Officer in 2015.
This is also the case for the Group Managing Director.
No exceptional remuneration was approved in 2016.

The Board noted that another decisive step had beentaken towards the creation of a truly integrated Luxury Groupgenerating added value. Initiatives aimed at getting theGroup back on a profitable organic growth track focusedon return on capital employed for each brand also paiddividends in an unstable economic climate, giving Keringa strong positioning relative to its peers (for furtherdetails of the Group’s strategy, see pages 8 et seq.). Thesedeep-seated changes have prompted a redefinition ofthe roles of certain members of the management team,and particularly the Group Managing Director, who nowhas a direct say in the strategic and operationalmanagement of certain brands, and whose relocation toLondon is part of this global management drive.
5.2.2. A remuneration structure that reflects the Group’s medium-and long-term strategic goals
As described above, the executive remuneration policyadopted by the Board is aimed at putting in place abalanced mechanism with a focus on the long term so asto guarantee that the highest level of remuneration canonly be achieved as a result of consistent performancesover a fairly long period of time. The wide variety ofperformance criteria adopted enable the Group’sstrategic goals to be reflected as closely as possible. Thevaried criteria also serve to spread risk, avoiding anoverriding focus on one single indicator. And at least inthe current environment, the Group is maintaining a cash-based remuneration policy in the interests of simplicityand alignment with the remuneration payable to all ofthe Group’s managerial-grade employees.
The proposed remuneration policy to be put to the voteof the shareholders is described below.
5.2.2.1. Fixed remuneration
The Board recommends a fixed remuneration amountof €1,200,000 for the two executive corporate officers,representing 23% of the overall target remuneration forthe Chairman and Chief Executive Officer and 28% for theGroup Managing Director. This amount is in line withexecutive pay practices adopted by some of the Group’sCAC 40 and (International) Luxury market peers. Thecompanies selected for the benchmarking study are:
• CAC 40 (14 companies): Accor, Cap Gemini, Danone,Essilor International, Lafarge, Legrand, L’Oréal, LVMH,Pernod Ricard, Publicis Groupe, Safran, Solvay, Valeo,Vivendi;
• international market (13 companies): Burberry, Coach,Estée Lauder, Hermès, Hugo Boss, L’Oréal, Luxottica,LVMH, Prada, Ralph Lauren, Richemont, Swatch,Tiffany & Co.
It also takes into account the roles and responsibilities ofthe two senior executives (see part 1.3, page 143 of theReference Document).
In accordance with the recommendations of the revisedAFEP-MEDEF Code, the fixed remuneration amount mayonly be reviewed at relatively long intervals.
5.2.2.2. Annual variable remuneration
5.2.2.2.1. Annual variable remuneration structure
Variable remuneration is designed to align the rewardaccruing to executive corporate officers with the Group’sannual performance and to help drive forward theGroup’s strategy year after year. Variable remuneration isexpressed as a percentage of annual fixed remuneration.
The Board recommends maintaining the structure ofannual variable remuneration as follows:
• for the Chairman and Chief Executive Officer, annualvariable remuneration will be equal to 120% of fixedremuneration if the related performance targets areachieved at a rate of 100%, representing 27% of theoverall target remuneration. It may equal up to 150% offixed remuneration if targets are exceeded;
• for the Group Managing Director, annual variableremuneration will be equal to 100% of fixed remunerationif the related performance targets are achieved at a rate of100%, representing 28% of the overall target remuneration.It may equal up to 150% of fixed remuneration if targetsare exceeded.
The principles applied in 2016 aligning the criteria definingthe annual variable remuneration for senior executiveswith those measuring the Group’s performance (fromboth a financial and sustainability perspective) wouldtherefore be maintained.
Total variable remuneration due for 2017 will be paid in2018, following the Annual General Meeting’s approval ofthe financial statements. Payment is also subject to theAnnual General Meeting’s approval of the 2017remuneration policy.
5.2.2.2.2. Specific, predefined and ambitiousperformance criteria aligned with Kering’sstrategy and the interests of its investors
The financial criteria are those used to assess the Group’sperformance (free cash flow from operations and recurringoperating income – each determining 35% of the award)and ensure that amounts paid are aligned as closely aspossible with the extent to which the Group’s strategic goalshave been achieved. This also applies to non-financialperformance targets (sustainability – 10%, CorporateSocial Responsibility – 10% and talent management – 10%),which reflect Kering’s goals in these areas.
4 CORPORATE GOVERNANCE ~ REPORT ON THE TOTAL REMUNERATION OF EXECUTIVE CORPORATE OFFICERS POLICY
190 Kering ~ 2016 Reference Document

4REPORT ON THE TOTAL REMUNERATION OF EXECUTIVE CORPORATE OFFICERS POLICY ~ CORPORATE GOVERNANCE
1912016 Reference Document ~ Kering
Annual variable remuneration is aimed at better aligningthe Group with market practices and at encouraging executivecorporate officers to adopt a management approachfocused on long-term value creation. Performance criteriawere therefore revised with a dual aim in mind: to takeinto account a wide variety of indicators reflecting theactual situation and the impacts of Kering’s strategy.
5.2.2.2.3. Factors determining the payment of annual variable remuneration for 2017
The factors determining payment of annual variableremuneration function as described in the table below, itbeing specified that for confidentiality reasons, specificquantified targets will only be disclosed a posteriori at thetime of payment (rather than when targets are set). TheCompany recommends making the calculation rulesused to determine amounts payable more symmetricalwith the extent to which targets are achieved.
Actual performance Percentage ofversus targets set bonus awarded
<75% 0%100% 100%>125% 150%
5.2.2.3. Multi-annual variable remuneration
5.2.2.3.1. Multi-annual variable remuneration structure
Multi-annual variable remuneration will continue to bebased on Kering Monetary Units (KMUs). However, severalchanges are recommended:
Award:
For the Chairman and Chief Executive Officer, the value ofthe multi-annual variable remuneration award will be equalto 100% of the total annual cash-based remuneration paidin year Y (compared to 70% currently). The number of KMUsawarded in year Y will therefore correspond to: 100%[fixed remuneration Y + annual variable remunerationdue for Y-1] / Value of KMUs at December 31 of Y-1.
For the Group Managing Director, the value of the multi-annual variable remuneration award will be equal to 80%of the total annual cash-based remuneration paid in yearY (compared to 70% currently).
Vesting period:
The KMU vesting period will continue to be three years asfrom January 1 of the year of the grant.
Criteria for the non-financial targets defined for 2017 are listed below. For confidentiality reasons, the targetsassociated with financial criteria are not disclosed.
Financial criteria (quantitative) used to calculate annual variable remuneration Weighting
Free cash flow from operations 35%Recurring operating income 35%
SUB-TOTAL 70%
Non-financial criteria (qualitative) usedto calculate annual variable remuneration 2017 targets Weighting
Talent management Active support regarding implementation of the talent 10%management policy from brand management teams and of succession plans for members of the Group Executive Committee, CEOs and Creative Directors.
Corporate Social Responsibility Dissemination of a culture of performance and integrity 10%within the Group through personal commitment and regular communication on these issues
Sustainability Operational implementation of the “Advance 2025” plan 10%though the definition and roll-out of action plans for each brand
SUB-TOTAL 30%
TOTAL 100%

Vesting conditions:
Based on a recommendation of the RemunerationCommittee, the Board of Directors considered that theperformance conditions attached to long-term incentivepay for executive corporate officers should reflect theGroup’s economic and strategic priorities more directly.As from 2017, final vesting will therefore be subject toperformance criteria based on three indicators:
• recurring operating income (ROI);
• free cash flow from operations (FCF);
• recurring operating margin (ROM).
If an increase is observed in at least one of these threeindicators between the average amount over the three-year vesting period and the amount shown in Kering’sconsolidated financial statements for the year precedingthe year of the grant, 100% of the KMUs granted may becashed in. Failing this, no KMUs will be cashed in.
The accounting criteria are also based on the indicatorsused to assess the Group’s performance. The mechanismin place meets stricter requirements, since the KMU valueis not in itself a performance condition but influences theamount actually paid at the exercise date.
Cash-ins:
The cash-in period will start once the vesting period is complete and will be maintained at two years, with units able tobe cashed in twice per year, in April and October.
4 CORPORATE GOVERNANCE ~ REPORT ON THE TOTAL REMUNERATION OF EXECUTIVE CORPORATE OFFICERS POLICY
192 Kering ~ 2016 Reference Document
• Grant of KMUs• 100% of total annual remuneration in cash paid during the year to the Chairman and Chief Executive Officer/80% for the Group Managing Director
• Final vesting subject to conditions• ROI or FCF or ROM
• Conditions met (advancement in at least one of the three performance criteria): YES→ Encashment
• KMU grant value is set (“grant value”)
Dec. 31, 2016 April 2017
Vesting period (3 years)
Jan. 1, 2020 April or October 2020 and 2021
• Conditions met: NO→ No KMUs will be cashed in.
2017
Gran
tApri
l
Fina
l ves
ting
Apri
l
October
Apri
l
October
2018 2019 2020
Vesting period Encashment period
2021

4REPORT ON THE TOTAL REMUNERATION OF EXECUTIVE CORPORATE OFFICERS POLICY ~ CORPORATE GOVERNANCE
1932016 Reference Document ~ Kering
5.2.2.4. Exceptional remuneration
Besides changes in the roles shared between the twosenior executives following the departure of PUMA’s long-standing CEO Jochen Zeitz along with his successor FranzKoch, the Group Managing Director served as acting ChiefExecutive Officer, in addition to his duties within theGroup, as from late 2012. 2013 was spent defining anaction plan to restore profitability for the brand whichhad been declining since 2009. The “Warm-Up” project inparticular, devised in conjunction with PUMA, outlined
the principles for assisting the new CEO and managementteam with the following objectives: to determine thepositioning of the brand in France, the US, Germany andChina, and to draw up recommendations and analyseproduct processes from design to store in a bid toidentify areas for improvement. This was the basis for theroll-out of a new vision and the associated strategy. Thenew CEO, Björn Gulden, rolled out this action plan andhas helped revamp the products offered since that date,with convincing results as from the second half of 2015.
The following four scenarios illustrate the sensitivity of the KMUs to the Kering share price and the value of the basket of stocks:
Option KMU impact
-15% (Kering) vs -15% (basket) 15% decrease in KMU value
-10% (Kering) vs +5% (basket) 16.4% decrease in KMU value
+10% (Kering) vs -5% (basket) 18.7% increase in KMU value
+15% (Kering) vs +15% (basket) 15% increase in KMU value
KMU value would fall significantly in the event of a collapse in the Kering share price (e.g., of around 80%).
5.2.2.3.2. Description of Kering Monetary Units (KMUs)
The long-term component of executive remunerationconsists of Kering Monetary Units (KMUs), which are paid onthe same basis as the long-term remuneration plans forother managerial-grade employees of the Group eligiblefor such remuneration. However, the exercise of KMUs issubject to the performance conditions outlined above.
The long-term remuneration plan is therefore based onKering Monetary Units (and no longer on performanceshares) whose initial value of €100 (at December 31,2011) is indexed to changes in the Kering share pricerelative to a basket of nine Luxury and Sport & Lifestylestocks. These KMUs have a vesting period of three yearsas from their grant date, after which they may be cashedin by the beneficiaries over a two-year period (during twowindows each year), based on the value determinedduring the last opened window.
5.2.2.3.3. Method applied to value KMUs
The value of a KMU was set at €100 on December 31,2011. Changes in the KMU value are assessed on a six-monthly basis (at June 30 and December 31 each year),based on the Kering share price during the last 30 tradingdays, and the value is weighted for the performance ofthe Kering share relative to the basket of other stocks.
At the end of each six-month period, the value of a KeringMonetary Unit is calculated as follows:
Where:
UV = unit of value.
s+1 = the six-monthly closing date at which the unit ofvalue is assessed (06 / 30 or 12 / 31).
s = the previous six-monthly closing.
VK = the change in the Kering share price over the six-monthperiod, using the average share price over the 30 dayspreceding the six-monthly closing as the reference price.
VPV = the change in the price of a basket of stocks overthe six-month period, equal to the arithmetic averagechange in these stocks, using the average share price overthe 30 days preceding the six-monthly closing as thereference price.
The following companies were used to compile thebenchmark: Adidas / Burberry / Ferragamo / LVMH / Nike / Prada / Richemont / Swatch / Tod’s.
Since December 31, 2011, based on the valuationmethod described above, changes in the value of KMUsare as follows:
Date KMU value
December 31, 2011 €100June 30, 2012 €102December 31, 2012 €131July 21, 2013 (1) €152December 31, 2013 (1) €144June 30, 2014 €166December 31, 2014 €167June 30, 2015 €160December 31, 2015 €166June 30, 2016 €157December 31, 2016 €249
(1) Date of the first award of KMUs.
UVs+1 = UVs x ([1+VKs+1] + ([1+VKs+1] x [1+VKs+1] / [1+VPVs+1])) / 2

These positive results were confirmed in 2016 with a 7%rise in revenue as reported (10.4% on a comparable basis)versus 2015 in a still fiercely competitive market, and anincrease of 80 basis points in the profit margin to 3.5%, atlast reversing the brand’s downward financial trend.
Another decisive step was taken towards the creation ofan integrated Luxury Group built around a corporatestructure bolstered by the expertise and added valueprovided to the Group’s brands.
Similarly, under the aegis of the Group Managing Director,initiatives aimed at getting back on a path of profitableorganic growth focused on each brand’s return on capitalemployed have paid off in an unstable economic environmentthat has affected virtually all Luxury brands. Kering’s solidmarket positioning compared to its peers has drivensharp gains in its share price over the second half of 2016.
In this context, the Group decided to award 5,000 KMUson an exceptional basis to the Group Managing Directorin recognition of this performance. This proposedexceptional remuneration in the form of a fairly long-term retention bonus meets the requirements set out inthe revised AFEP-MEDEF Code, which states that“exceptional remuneration may only be awarded in veryspecific circumstances (e.g., matters of great significancefor the Company or matters which are significant interms of the commitment they call for and / or thedifficulties they present)”. In view of the exceptionalnature of this award, it is granted under the sameconditions as those applicable to the plans of the Group’semployees benefiting from remuneration of this type.
On the basis of 5,000 KMUs with a unit value of €249 asof December 31, 2016, the corresponding total value of theaward would be €1,245,000. The KMUs may be cashed inas from April 2020. The vesting of the 5,000 KMUs is subjectto beneficiaries’ continued presence within the Group.
5.2.2.5. Directors’ fees
The Board recommends maintaining the current policy ofallocating Directors’ fees. Executive corporate officersreceive Directors’ fees for some of the offices they holdwithin the Group.
5.2.2.6. Allotment of stock options and / or performance shares
Since long-term incentive arrangements based on KeringMonetary Units are to be maintained, the remunerationpolicy for executive corporate officers in 2017 will notinclude any performance share or stock option awards.
5.2.2.7. Benefits for taking up a position or termination payments
Executive corporate officers will not be eligible for anybenefits for taking up a position or termination payments.
5.2.2.8. Supplementary pension plan
Executive corporate officers will not be eligible for anysupplementary pension plans.
5.2.2.9. Non-competition indemnities
Executive corporate officers will not be eligible for anysuch indemnities.
5.2.2.10. Benefits in kind
The Chairman and Chief Executive Officer will continue tobenefit from a company car with a driver.
The Board recommends maintaining the Group ManagingDirector’s residence allowance (representing a total ofGBP 900,000 per year).
4 CORPORATE GOVERNANCE ~ REPORT ON THE TOTAL REMUNERATION OF EXECUTIVE CORPORATE OFFICERS POLICY
194 Kering ~ 2016 Reference Document

4REPORT ON THE TOTAL REMUNERATION OF EXECUTIVE CORPORATE OFFICERS POLICY ~ CORPORATE GOVERNANCE
1952016 Reference Document ~ Kering
Verification of performanceconditions
N / A By the Remuneration Committeebased on the financial statementsand reports drawn up by the managersconcerned on the achievement ofnon-quantitative targets
By the Remuneration Committee basedon the Company’s financial statementsand calculations of KMU value
Performanceconditionsdeterminingpayment
None • Non-financial targets:sustainability (10%), CorporateSocial Responsibility (10%), talentmanagement (10%)
• Financial targets: free cash flowfrom operations (35%), recurringoperating income (35%)
• At least 1 of the 3 financial targetsmust be achieved: recurring operatingincome, free cash flow from operations,recurring operating margin
• Failing this, no KMUs will be cashed in
Instrument Cash Cash Exercise of Kering Monetary Units(KMUs), paid in cash
Referenceperformance period
Current year 1 year 3 years
Grant date Reviewed at fairlylong intervals
Set in March by the Board of Directors,based on a recommendation of theRemuneration Committee
Set in March by the Board of Directors,based on a recommendation of theRemuneration Committee
5.2.3. Components of the remuneration structure
The principles outlined above are reflected in the remuneration structure, the components of which are detailed in thefollowing table:
Overall remuneration Fixed Annual variable Multi-annual variablecomponents remuneration remuneration (bonus) remuneration (KMUs)

5.2.5. Shareholder vote on remuneration accruing to executive corporate officers
In accordance with the Sapin II law and with therecommendations of the revised AFEP-MEDEF Code,shareholders at the Annual General Meeting on April 27,2017 will be asked to vote on the following:
• remuneration due or awarded to each of the Company’sexecutive corporate officers in respect of the past year,in two separate resolutions. The items of remunerationconcerned are as follows:- fixed portion,- annual variable portion,- multi-annual variable portion,- exceptional remuneration,- stock options, performance shares, and any other long-
term remuneration,- benefits for taking up a position or termination payments,- supplementary pension plan,- any other benefits.
• in accordance with the ex ante vote as provided for bythe Sapin II law, the principles and criteria for determining,allocating and awarding fixed, variable and exceptionalcomponents making up total remuneration andbenefits of any kind granted to the Chairman and ChiefExecutive Officer and the Group Managing Director include:- fixed portion,- annual variable portion,- multi-annual variable portion,- exceptional remuneration,- stock options, performance shares, and any other long-
term remuneration,- benefits for taking up a position or termination payments,- supplementary pension plan,- any other benefits.
5.2.4. Changes in the remuneration policy
5.2.4.1. Chairman and Chief Executive Officer remuneration
2016 2017
Target remuneration Fixed remuneration €1,099,996 €1,200,000Target bonus 120% base 120% baseTarget cash remuneration €1,319,995 €1,440,000Benefits in kind €17,222 €17,222 (2)
Long-term incentive (1) 70% [base + bonus] 100% [base + bonus]Total target remuneration €4,131,207 €5,297,222
(1) Value of award at December 31 of the year preceding the award.(2) Estimated based on the value of benefits in kind for 2016.
5.2.4.2. Group Managing Director remuneration
2016 2017
Target remuneration Fixed remuneration €1,018,622 (1) €1,200,000Target bonus 100% base 100% baseTarget cash remuneration €1,018,622 €1,200,000Benefits in kind (1) €1,098,257 €1,098,257 (2)
Long-term incentive (3) 70% [base + bonus] 80% [base + bonus]Exceptional remuneration - €1,245,000 (4)
Total target remuneration €4,561,572 €6,663,257
(1) Translated into euros at the average 2016 exchange rate.(2) Estimated based on the value of benefits in kind for 2016.(3) Value of award at December 31 of the year preceding the award.(4) Corresponding to the award of 5,000 KMUs with a value of €249.
4 CORPORATE GOVERNANCE ~ REPORT ON THE TOTAL REMUNERATION OF EXECUTIVE CORPORATE OFFICERS POLICY
196 Kering ~ 2016 Reference Document

4REPORT BY THE CHAIRMAN OF THE BOARD OF DIRECTORS ~ CORPORATE GOVERNANCE
1972016 Reference Document ~ Kering
6.1.1. Current membership of the Board
The Board is composed of Directors with wide and diversifiedexperience, relating in particular to corporate strategy,finance, governance, insurance, economics, social andenvironmental responsibility, the retail sector, industry,accounting, management and supervision of commercialand financial corporations. The Articles of Association providefor a renewable four-year term of office for Directors.
In order to avoid reappointing the entire Board simultaneouslyand to facilitate a smooth renewal process, the CombinedGeneral Meeting on May 7, 2009 adopted an amendment
to Article 10 of the Company’s Articles of Associationimplementing the staggered renewal of the Board ofDirectors.
After having considered the Board of Directors’ report andthe favourable opinion issued by the Company’s WorksCouncil, the Combined General Meeting on May 6, 2014decided to amend Article 10 of the Articles of Association inorder to establish the procedures for appointing Directorsrepresenting the employees in accordance with theFrench law dated June 14, 2013 in relation to job security.
6.1. Membership of the Board of Directors
Pursuant to Article L. 225-37, paragraph 6 of the FrenchCommercial Code (Code de commerce) amended by ActNo. 2008-649 of July 3, 2008, Ordinance No. 2009-80 ofJanuary 22, 2009, Act No. 2011-103 of January 27, 2011and Act No. 2015-992 of August 17, 2015, the compositionof the Board of Directors, the application of the principleof the balanced representation of women and men on theBoard, and the conditions of preparation and organisationof the work performed by the Board of Directors and theinternal control and risk management proceduresimplemented by the Company are reported hereinafter.This report specifies, in particular, the procedures relatingto the preparation and processing of financial andaccounting information for the consolidated financial
statements and the parent company financial statements.In addition, this report indicates any potential limitationsset by the Board on the powers of the Chairman andChief Executive Officer. It also reports on financial riskswith regard to climate change and the measures taken bythe Company to reduce these risks by implementing alow-carbon strategy across all its activities. The first partof this report was presented to the AppointmentsCommittee on February 2, 2017 and the second part wasthe subject of deliberations by the Company’s AuditCommittee on February 7, 2017.
The Board of Directors approved the entire report at itsmeeting on February 9, 2017 in accordance with theprovisions of Article L. 225-37 of the French Commercial Code.
6. Report by the Chairman of the Board of Directorson the composition of the board of directors and the applicationof the principle of balanced representation of women and men on the Board, on the conditions of preparationand organisation of the work performed by the board, on the internal control and risk management proceduresimplemented by the Company, on financial risks withregard to climate change, and on the measures taken by the Company to reduce these risks

Three non-voting Directors appointed by the Board ofDirectors for a term of four years pursuant to Article 18 of theCompany’s Articles of Association attend meetings of theBoard of Directors, as required, on a consultative basis.
The Board has set up five Committees responsible forassisting it in performing its task: the Audit Committee,the Remuneration Committee, the AppointmentsCommittee, the Strategy & Development Committee andthe Sustainability Committee.
A detailed list of the Directors and the non-votingDirectors is set out in a previous section of the ReferenceDocument, on pages 145 to 160 and 176.
6.1.2. Changes in the membership of the Board of Directors
The composition of the Board of Directors changedduring the 2016 fiscal year on account of terms of officeexpiring, and not being renewed, for three Directors: PhilippeLagayette, Luca Cordero di Montezemolo and Jochen Zeitz.Three new persons, including a former Director, weretherefore appointed to the Board following the CombinedGeneral Meeting of 29 April 2016: Sophie L’Hélias, SapnaSood and Laurence Boone. These appointments enhancethe Board’s technical competence, diversity andinternational coverage.
Jean-Pierre Denis’s directorship was renewed.
A detailed list of Directors appears in a previous sectionof the Reference Document, on pages 145 to 160.
The Board is currently made up of eleven Directors:
Participation in a committee End of Indepen- Strategy Start of current dent Remu- Appoint- & Deve- Sustai- 1st term term Name Position Age Director (1) Audit neration ments lopment nability of office of office Nationality
François-Henri Chairman and 54 √ √ 1993 (2) 2017 FrenchPinault Chief Executive Officer
Patricia Barbizet Vice-Chair 61 √ √ √ 1992 (3) 2017 French
Jean-François Group Managing 55 √ 2009 2017 FrenchPalus Director
Yseulys Costes Director 44 √ √ √ 2010 2018 French
Jean-Pierre Denis Director 56 √ √ √ 2008 2020 French
Baudouin Prot Director 65 √ √ 1998 (3) 2017 French
Daniela Riccardi Director 56 √ √ √ 2014 2018 Italian
Laurence Boone Director 47 √ √ √ 2010 2020 French
Sophie L’Hélias Director 53 √ √ √ 2016 2020 French
Sapna Sood Director 43 √ √ √ 2016 2020 Australian
Sophie Bouchillou Director 54 2014 2018 French representing the employees
Average Average age DI : DI : DI : DI : DI : DI : seniority
53 years 60% 75% 75% 50% 50% 50% 9 years
DI Degree of independence (in accordance with the provisions of the revised AFEP-MEDEF Code, the Director representing employees is not included in thecalculation of the degree of independence).
(1) According to the criteria of the revised AFEP-MEDEF Code and the Board of Directors set out below.(2) Member of the Executive Board from 1993 to 2001 and the Supervisory Board from 2001 to 2005.(3) Member of the Supervisory Board until 2005.
4 CORPORATE GOVERNANCE ~ REPORT BY THE CHAIRMAN OF THE BOARD OF DIRECTORS
198 Kering ~ 2016 Reference Document

4REPORT BY THE CHAIRMAN OF THE BOARD OF DIRECTORS ~ CORPORATE GOVERNANCE
1992016 Reference Document ~ Kering
6.2.1. Internal rules of the Board
The Board of Directors performs the duties and exercisesthe powers granted to it by law and the Articles ofAssociation.
It determines and assesses the strategy, objectives andperformance of the Company and ensures theirimplementation. The Board of Directors defines thefinancial communications policy and ensures thatshareholders and investors are provided with relevant,balanced and educational information which coversKering’s strategy, development model, integration of non-financial challenges that have a material impact on theCompany, as well as its long-term outlook. Subject to thepowers expressly granted to Annual General Meetingsand within the limit of the corporate purpose, the Boardreviews all issues concerning the smooth running of theCompany and acts on all matters over which it hasauthority.
The Board carries out the controls and verifications itdeems appropriate.
The conditions of preparation and organisation of the workof the Board of Directors are defined by law, the Company’sArticles of Association, the internal rules of the Board andthe work of its specialised Committees. The Board hasestablished internal rules for each committee.
Pursuant to its internal rules and the law, the Board ofDirectors meets at least four times a year. To enableDirectors to prepare in the best possible way for the topicsto be examined during the meeting, a comprehensive fileis sent to them in due time ahead of the meeting; itincludes, per topic addressed, the necessary informationon all items on the agenda.
In line with the relevant regulatory requirements, theinternal rules also set the rules applicable to Directors inrelation to restrictions on trading in the securities of theCompany, or more generally the Group, by establishingblack-out periods (in this respect, the internal rules of theBoard were updated on October 18, 2016 to reflect theentry into force of Regulation (EU) No. 596 / 2014 of theEuropean Parliament and of the Council of April 16, 2014on market abuse):
• the Directors must refrain from trading directly orindirectly in the listed securities and financial instrumentsof the Company and the Group for a period of 30calendar days preceding each of the periodic publicationsrelating to the annual and half-year consolidatedfinancial statements and 15 calendar days precedingeach of the quarterly publications relating to consolidatedrevenue and ending at the close of the trading day
following the publication of the relevant official pressrelease. In no way does this black-out period replace thelegal and regulatory provisions regarding insider tradingwith which each member of the Board must comply atthe time he / she decides to trade, no matter when thismight occur outside the defined black-out periods;
• the same obligations apply to each Director insofar asthe Director has knowledge of inside information relatingto any financial instrument listed on a regulated market,where the issuer of those financial instruments has aninsider relationship with the Group. In compliance withcurrent regulations, the internal rules also requireDirectors to declare trading in these securities.
The internal rules set the frequency and conditions ofBoard meetings and provide for meeting participation byvideoconference and / or conference call.
They also establish the principle of regular assessment ofthe functioning of the Board and set the terms andconditions by which Directors’ fees are allocated.
According to the internal rules, Directors are required toinform the Chairman of the Board of any conflicts ofinterest, or of any possible conflicts, between their dutiestowards the Company and their private interests and / orother duties, and they may not vote on any matters thatconcern them directly or indirectly.
The Chairman of the Board of Directors may ask theDirectors at any time for a written statement confirmingthat they are not involved in any conflicts of interest.
To reinforce its methods of functioning and in the interestof good governance, the internal rules of the Board ofDirectors set forth and formally lay down the rulesgoverning the organisation and operating methods of theBoard as well as the missions of its five Committees: theAudit Committee, the Remuneration Committee, theAppointments Committee, the Strategy & DevelopmentCommittee and the Sustainability Committee.
Executive Management may in all circumstances beheard within said Committees.
6.2.2. Executive Management
After the Combined General Meeting on May 19, 2005adopted the new Articles of Association of Kering (thenPPR), introducing governance by a Board of Directors, theBoard of Directors opted to combine the duties ofChairman and Chief Executive Officer, and maintainedthis option in May 2009. This choice has contributed toefficient governance in light of the organisation of theKering group within which François-Henri Pinault is the
6.2. Conditions of preparation and organisation of the work of the Board of Directors

Chairman and Chief Executive Officer of Kering, theGroup’s parent company. He is related to the controllingshareholder, is closely involved in conducting the Group’sbusiness and has precise operational knowledge and in-depth experience of this business. On the proposal of theChairman and Chief Executive Officer, the Board ofDirectors’ meeting on February 22, 2008 appointed aGroup Managing Director (Directeur Général délégué)whose term of office was renewed on June 18, 2013 andwho has the same powers with regard to third parties asthe Chief Executive Officer. The Group Managing Directorwas appointed as Director by the Combined GeneralMeeting on May 7, 2009 for a four-year term, renewed onJune 18, 2013 for another four years.
Management of the Luxury activities is the responsibility ofthe Chairman and Chief Executive Officer and the GroupManaging Director. The Group Managing Director is also incharge of the Sport & Lifestyle activities. More specifically,within the Luxury activities, the Chairman and ChiefExecutive Officer takes direct charge of the operations ofthe Gucci, Bottega Veneta and Yves Saint Laurent brandswhile the Group Managing Director takes charge of theother Luxury – Couture and Leather Goods brands.
The Chairman and Chief Executive Officer and the GroupManaging Director both take part, on an equal level, in thework of the Board of Directors, 60% of whose membersare independent Directors. The Board operates smoothlythanks to frequent meetings, the regular attendance ofits members and the assistance of its specialisedCommittees, as described below.
The Chairmen and Chief Executive Officers of the mainbrands (Gucci and PUMA) and the Chief Executive Officerof the Luxury – Watches & Jewelry division are membersof the Executive Committee and attend Board ofDirectors’ meetings as non-voting Directors. They are allthus able to provide, at those Board meetings they areinvited to attend, their views and information concerningthe Group’s activities and brands so that the non-executive Directors and more generally the Board may bewell-informed.
6.2.3. Limitations by the Board of Directorson the powers of the Chief ExecutiveOfficer and Group Managing Director
In connection with the Board of Directors’ statutory roleof determining the business orientation of the Companyand ensuring its implementation, and without prejudice tothe legal provisions governing the authorisations requiredto be granted by the Board (related-party agreements,
endorsements, suretyships and guarantees, divestmentsof shareholdings or sale of real property, etc.), theCompany’s Articles of Association provide that certaindecisions of the Chief Executive Officer and GroupManaging Director, by virtue of their nature or significance,require the prior approval of the Board of Directors:
a) matters and transactions that have a substantiveeffect on the strategy of the Group, its financial structureor its scope of business activity;
b) except in the event of a decision by the Annual GeneralMeeting, issues of securities, regardless of the naturethereof, that are liable to lead to a change in theshare capital;
c) the following transactions by the Company or anyentity controlled by the Group, insofar as they eachexceed an amount set annually by the Board ofDirectors (which was €500 million in 2016):
- all investments or divestments, including theacquisition, sale or exchange of holdings in allexisting or future businesses,
- all purchases or sales of Company real property.
These transactions are regularly submitted to the Boardof Directors, which examines them carefully.
6.2.4. Compliance with a code of corporate governance
On October 22, 2008, the Board of Directors announcedthat it had examined and adopted, as a referencecorporate governance framework, the AFEP-MEDEFrecommendations of October 6, 2008 on the remunerationof executive corporate officers of listed companies anddeemed that the corporate governance policies alreadyimplemented by the Company complied with all theaforementioned recommendations.
Accordingly, the Company now refers to the CorporateGovernance Code of Listed Corporations resulting from theconsolidation of the October 2003 AFEP and MEDEFreport, the aforementioned January 2007 and October 2008AFEP-MEDEF recommendations and the April 2010 AFEP-MEDEF recommendation concerning the strengtheningof the representation of women within boards, asamended in June 2013, November 2015 and November 2016(“the revised AFEP-MEDEF Code”) and its December 2016implementing guidelines, and has done so, in particular,for the preparation of this report. The revised AFEP-MEDEF Code is available in English on the AFEP websiteat http://www.afep.com / en / content / focus / corporate-governance-code-listed-corporations.
4 CORPORATE GOVERNANCE ~ REPORT BY THE CHAIRMAN OF THE BOARD OF DIRECTORS
200 Kering ~ 2016 Reference Document

4REPORT BY THE CHAIRMAN OF THE BOARD OF DIRECTORS ~ CORPORATE GOVERNANCE
Three provisions of the revised AFEP-MEDEF Code were not adopted:
AFEP-MEDEF recommendations Kering practice and explanations
Composition of the Appointments Committee The Committee currently comprises four Directors:(section 16.1 of the Code) – the Committee should Patricia Barbizet, Chair, Baudouin Prot,have a majority of independent Directors. Yseulys Costes and Sapna Sood.
The Company does not comply with the AFEP-MEDEF recommendationsregarding the proportion of independent members within theAppointments Committee. The Board of Directors considers that thisdoes not affect the Committee’s work. The Committee comprisesfour non-executive Directors, two of whom are independent, whichensures free discussion. In addition, the Committee’s work,recommendations and decisions are written up in detailed reportsand discussed by all Directors at Board meetings.
Composition of the Remuneration Committee The Committee currently comprises four Directors:(section 17.1 of the Code) – it is recommended Sophie L’Hélias, Chair, Patricia Barbizet,that the Committee should include an employee Jean-Pierre Denis and Yseulys Costes.representative Director.
The Company does not comply with the AFEP-MEDEF recommendations,since the employee representative Director is not a member of theCommittee. Since the Remuneration Committee comprises amajority of independent Directors, and is chaired by an independentDirector, it was not considered necessary to appoint the employeerepresentative Director to the Committee, especially since theemployee representative Director has access to the Strategy &Development Committee, which meets during the October BoardMeeting. The employee representative Director is therefore involvedin examining the overall Group strategy and operations of strategicimportance, and in reviewing the competition and the Group’smedium- and long-term outlook. In addition, the Committee’swork, recommendations and decisions are written up in detailedreports and discussed by all Directors at Board meetings.
As part of its continuous improvement programme in governancematters, the Board of Directors is nevertheless consideringappointing the employee representative Director to theRemuneration Committee in 2017.
Board meetings The Company does not comply with the AFEP-MEDEF, since no(section 10.3 of the Code) – it is recommended Board meetings are held that are not attended by executive to hold yearly meetings not attended by executive corporate officers.corporate officers. The Board of Directors considers that open discussion at meetings
is no way impeded by the presence of executive corporate officers,who are highly attentive to seeing that the Directors have access toall the information needed, and are able to express themselvesfreely and ask any questions they wish. The minutes of the Boardmeetings give a detailed account of the many such discussionsthat take place. Given the functions performed by the executivecorporate officers within the Group, the Board of Directors alsoconsiders that their presence at its meetings makes a major contributionto the quality of its work. We also note that the Board comprises amajority of independent Directors.
As part of its continuous improvement programme in governancematters, the Board of Directors is nevertheless considering holdinga meeting not attended by executive corporate officers in 2017.
2012016 Reference Document ~ Kering

6.2.5. Independence of Directors
In order to assess the independence of a Director and toavoid possible risks of conflicts of interest, the Boardapplied the criteria defined in the revised AFEP-MEDEFCode, whereby a Director cannot:
• be an employee or executive corporate officer of theCompany, or have been in such position in the past fiveyears;
• be an employee, executive corporate officer or Directorof its parent or of a company that the latter consolidates,or have been in such position in the past five years;
• be an executive corporate officer of a company in whichthe Company holds a directorship, directly or indirectly,or in which an employee appointed as such or a Directoror executive corporate officer of the Company (currentlyin office or having held office within the past five years)is a Director;
• be a significant customer, supplier, investment banker,or commercial banker of the Company or the Group, orfor which the Company or the Group represents asignificant portion of the activity;
• have any close family ties with a Director or executivecorporate officer;
• have been the auditor of the Company within the pastfive years;
• be a Director of the company for more than twelve years,the maximum period for which a Director is consideredindependent.
Upon analysing the situation of each Director with regardto these criteria and following a review by the AppointmentsCommittee on February 2, 2017, the Board of Directorsclassified as independent Directors, without prejudging theindependence of the other Directors, the following members:Yseulys Costes, Daniela Riccardi, Laurence Boone, SophieL’Hélias, Sapna Sood and Jean-Pierre Denis.
Accordingly, six of the ten(1) Directors currently serving onthe Board are classified as independent Directors, it beingnoted that the revised AFEP-MEDEF Code recommendsthat those companies with a controlling shareholder,which is the case of Kering, comply with the rule that atleast one-third of the Board members should beindependent Directors.
6.2.6. Activity of the Board of Directors and its specialised Committees
Activity of the Board of Directors in 2016 and up to February 9, 2017
Activity of the Board of Directors in 2016
During 2016, the Board met seven times with an averageattendance rate of 95%; the Chairman of the Boardchaired all Board meetings.
Directors present
Dates (attendance rate)
February 18 11 / 11 (100%)March 11 11 / 11 (100%)April 29 (before the Combined General Meeting) 8 / 11 (72.7%) (1)
April 29 (after the Combined General Meeting) 11 / 11 (100%)July 28 11 / 11 (100%)October 18 11 / 11 (100%)December 15 10 / 11 (90.9%)
(1) The three Directors who did not take place in this meeting were PhilippeLagayette, Luca Cordero di Montezemolo and Jochen Zeitz, whose terms ofoffice were to expire and not be renewed. Laurence Boone, Sophie L’Héliasand Sapna Sood, whose directorship nominations were put to theshareholders’ vote the same day, took part in the meeting as guests.
The following persons took part in the Board meetings:
• the Directors;
• the Board secretary (the Head of the Legal Department);
• the Works Council representative;
• the Statutory Auditors, the Internal Audit Director andnon-voting Directors (at some meetings).
The agendas for Board meetings are drawn up by thesecretary following discussions with the Chairman andChief Executive Officer and the Group Managing Directorand examination of the agendas of specialised committeemeetings and Directors’ proposals.
Several days before each Board meeting, each Directorreceives, via a secure file-sharing system, a copy of theagenda, the draft minutes of the previous meeting, anddocumentation relevant to the items on the agenda.
The minutes of each Board meeting are submitted forexplicit approval at the subsequent meeting.
In compliance with the internal rules of the Board, somematters undergo preliminary examination by the relevantCommittees, who can therefore issue their opinions forsubmission to the Board of Directors. The Chairmanreports on these preliminary Committee meetings ateach Board meeting.
4 CORPORATE GOVERNANCE ~ REPORT BY THE CHAIRMAN OF THE BOARD OF DIRECTORS
(1) The AFEP-MEDEF Code does not include Directors representing employees when calculating the percentage of independent Directors on the Board. This explainswhy the proportion of independent Directors on the Board is calculated based on 10 Directors instead of 11.
202 Kering ~ 2016 Reference Document

4REPORT BY THE CHAIRMAN OF THE BOARD OF DIRECTORS ~ CORPORATE GOVERNANCE
In 2016, the work of the Board of Directors mainly involvedreviewing the annual and interim financial statements,the Group’s business activity and strategic issues.
At the February 18, 2016 Board meeting the main itemon the agenda concerned the review of parent companyand consolidated financial statements for 2015. Thefollowing documents in particular were examined here:
• chairman’s report on activity of the Board, internalcontrol and risk management;
• statutory forecast documents (cash flow forecastmanagement: current assets and liabilities as ofDecember 31, 2015; uses and sources of funds for2016; funding plan; forecast income statement);
• statutory Auditors’ report.
The Board reviewed the work of the Audit Committee onthe key points raised with a view to the adoption of the2015 financial statements and on the Internal Auditactivity within the Group during the 2015 fiscal year. TheBoard accordingly approved the annual financialstatements and reports for the 2015 fiscal year for theCombined General Meeting, and adopted the draftManagement Report of the Board of Directors to be putbefore the Annual General Meeting. The Directorsdiscussed and approved the regulatory conventions, andgranted and allocated the Directors’ fees for 2015 inaccordance with the terms and conditions of its internalrules. The Board also decided to renew the EMTNprogramme. The Board issued a decision on the updateto Article 6 of the Articles of Association following theincrease in share capital resulting from the exercise ofstock options in 2015.
On March 11, 2016, the Board met to deliberate on theGroup’s 2016 budget. The Directors examined the work ofthe Remuneration Committee, on remuneration formembers of the Executive Committee, on the Group’sremuneration policies and on remuneration for executivecorporate officers. They heard the report on the work ofthe Appointments Committee, on matters including theindependence of Directors and the new Board composition.The Board examined the work carried out by theSustainability Committee in 2016. At this meeting, theDirectors also discussed the findings of the assessmentof the Board’s work carried out by an independent third-party expert.
The meeting concluded with a decision to convene theCombined General Meeting of April 29, 2016.
On April 29, 2016, the Board met prior to the CombinedGeneral Meeting held on the same day. This meeting wasattended by the applicants to the vacant directorships.Following discussions on preparations for the CombinedGeneral Meeting, including an examination of writtenquestions received, the Board reviewed an outline of thebusiness market.
The Board of Directors met again after the CombinedGeneral Meeting on April 29, 2016. The Board renewedthe authorisation given to the Chief Executive Officer, withthe possibility to sub-delegate such authorisation, tocarry out certain transactions, in particular those referredto in Article 15-2 of the Company’s Articles of Association,with a ceiling set at €500 million. The Board approved theimplementation of the share buy-back programmeauthorised by the Annual General Meeting on the sameday. The Board then proceeded with reforming each of itsCommittees.
On July 28, 2016, the Board reviewed the work of theAudit Committee, which had met on July 26, 2016, heardthe findings of the Statutory Auditors and a report onbusiness activity for the first half of 2016, and adoptedthe interim financial statements and reports. The agendaalso included an item on governance, the main aim beingto inform Directors on recent legislative and regulatorychanges, including:
• application of Regulation (EU) No. 596 / 2014 of theEuropean Parliament and of the Council of April 16,2014 on market abuse; and
• application of the Ordinance No. 2016-315 of March 17,2016 relating to Statutory Auditors and implementingthe recent audit reform.
Under this agenda item the Board also discussed therevised AFEP-MEDEF Code of Corporate Governance. TheDirectors approved relocation of the Company’s headoffice to 40 rue de Sèvres, 75007 Paris.
The Board meeting of October 18, 2016 was heldexceptionally in Milan. This was an opportunity for Directorsto visit the Gucci store, showroom, and workshops andthe new Milan head office. At this meeting, the boardheard a full account of third-quarter sales. This wasfollowed by a review of Group activity and strategic issues.Two points were discussed here. First, the Directorsconfirmed the three pillars of the Group strategydetermined in 2015:
• assert the leadership of the Kering group;
• maintain top ranking on sustainability;
• achieve leadership in return on capital employed.
2032016 Reference Document ~ Kering

Second, the Directors reviewed the four strategic actionplans:
• tap full growth potential by fielding a balanced portfolioof complementary brands;
• implement a development strategy rooted in organicgrowth, operating profitability and return on capitalemployed for each brand;
• create value through Group-wide integration;
• maintain leadership in sustainable development.
The Board then examined the risk map presented by theInternal Audit Director on the basis of Audit Committeerecommendations. The Directors adopted the new Codeof Conduct on prevention of insider trading and theBoard’s revised internal rules. The meeting concludedwith discussion and approval of the disclosure statementon the UK Slavery Act.
On December 15, 2016, the Board decided to pay aninterim dividend for 2016 as from January 18, 2017. TheBoard then heard a report on the work carried out by theAudit Committee.
Activity of the Board of Directors in 2017 up to February 9
Between January 1, 2017 and February 9, 2017, the Boardof Directors met once.
On February 9, 2017, the Board of Directors met to adoptthe 2016 annual financial statements and reports to besubmitted to the Annual General Meeting as well as toapprove this report. It also heard a report on the Group’sfinancial position. The Board then reviewed related-partyagreements and decided to grant and allocate theDirectors’ fees for 2016 in accordance with the criteriaadopted in March 2014, which remained unchanged.Lastly, the Board issued a favourable opinion on thecontinuation of the EMTN programme.
4 CORPORATE GOVERNANCE ~ REPORT BY THE CHAIRMAN OF THE BOARD OF DIRECTORS
204 Kering ~ 2016 Reference Document

4REPORT BY THE CHAIRMAN OF THE BOARD OF DIRECTORS ~ CORPORATE GOVERNANCE
Annual sessions not attended by executive corporateofficers (meetings of independent Directors)
No meeting was held without executive corporate officers in 2016,but there are plans to hold one in 2017
Consideration of the need to add the skills of other Directors with recognised experience in the luxury sector
This matter was discussed at a meeting of the Appointments Committee
Corporate governance
More regular interaction with the management teamoutside Board meetings, and ability to contribute to settingthe agenda
Directors can meet the management team on request, and may request amendments to the Board meeting’s agenda
Information provided further in advance of Board meetings
Preliminary documents for Board and Committee meetings areprovided to Directors via the secure file-sharing system
Organisation
Yearly debate on shifts in perception of the Company as a “luxury group” and on sustainability issues, attended bynew human resources and communications managers
This point is covered at the Board meeting on strategy, notattended by human resources or communications managers. A report submitted to the Board of Directors after each meetingof the Sustainability Committee
Off-site Board meetings The Board meeting on strategy was held in Milan, with priorvisits to the Gucci Montenapoleone store and showroom andthe Gucci workshops
Systematic analysis of risk / opportunity scenarios at theBoard meeting on strategy
A presentation is made and discussions held on opportunitiesand strategic dilemmas. The Internal Audit Director addressedthe Board meeting on strategy with presentation of a documentdrawn up based on the recommendations of the AuditCommittee and submitted to the Board
Provision of details on comparison with the competitionand understanding of the luxury sector
Documents on strategy and competition analysis are put up onthe secure file-sharing system
Presentation of brands by their senior executives A Brand presentation by its Chief Executive Officer was includedin the Board meeting on strategy
Strategy
Assessment of the Board of Directors
In accordance with its internal rules, since 2004 the Board of Directors has carried out an annual self-assessment. At leastonce every three years, an independent Director or third-party expert appointed by the Board assesses and reports on itsmembers and activity. The last assessment by a third-party expert was carried out by a specialised firm which reported tothe Board on March 11, 2016. Overall, the assessment gave grounds for satisfaction as to the quality of the work carried out bythe Board and its Committees. It did, however, pinpoint a number of areas for improvement, the main ones of which arelisted in the table below:
Area for improvement Remedial action
2052016 Reference Document ~ Kering

In line with Recommendation 9.2 of the revised AFEP-MEDEF Code, this assessment by a third-party expert alsocovered the effective contributions of individualDirectors. This involved confidential questionnaire-basedinterviews of each Director by the third-party expert. Eachwas invited to express opinions on fulfilment of theDirectors’ respective missions, and the Chair of theAppointments Committee used this input to report toeach Director on his or her specific contributions.
The questionnaire items were as follows:
• general impression on corporate governance;
• chairmanship of the Board of Directors;
• top management (Chairman and Chief Executive Officerand Group Managing Director);
• vice-Chair of the Board of Directors;
• functions of Committee Chairs;
• individual contributions of Directors other than theChairman and Chief Executive Officer and the GroupManaging Director.
The Board uses the results of this questionnaire to assessthe contribution and involvement of each Director in thework of the Board and its Committees.
In addition, Directors are free to express themselves at anytime on any dysfunction, and the contributions of eachDirector are assessed by both the Appointments Committeeand the Board of Directors, for example, when it comes torenewing the terms of office of Directors and Committeemembers.
For fiscal year 2016, in line with recommendations of therevised AFEP-MEDEF Code, it was decided to carry out aself-assessment of Board composition, organisation andoperation. This assessment, begun at the start of fiscalyear 2017, is carried out using a questionnaire sent to
each Director. Input from the completed questionnairesprovided the basis for individual interviews of the Directorsby the Vice-Chair of the Board of Directors. The issuescovered included the scheduling of Board meetings notattended by executive corporate officers, the involvementof operational departments at the Board meeting onstrategy, the activity and composition of Committees, andthe quality and relevance of information received. TheBoard will be hearing a report on these interviews at theend of the first quarter 2017.
Audit Committee
Duties
Set up in December 2002, the main assignment of the AuditCommittee, within the limit of the duties of the Board ofDirectors, is to review the annual and interim financialstatements, to verify the relevance, continuity and reliabilityof accounting methods applied within the Company andthe main subsidiaries and the implementation of internalcontrol and risk management procedures in the Group, tobe familiar with the policies implemented within theGroup in relation to sustainability and respect for theenvironment, and to hear and question the StatutoryAuditors. The Committee is notified of the main problemsidentified by the Kering group’s Internal Audit Department.In addition to these responsibilities, during the review ofthe financial statements, the Audit Committee examines anymajor transactions that may involve a conflict of interest.
The Audit Committee reports to the Board on a regular basisand provides it with its opinions or recommendations onall matters within its scope of duties. The Audit Committeereviews risks and material off-balance sheet commitmentsand informs the Board of Directors, when necessary.Meetings of the Audit Committee give rise to a writtenand approved report.
Discussions on Appointments Committee successionplans, with reports to the Board
This point was not addressed in 2016
New Chair for the Sustainability Committee, a positionrequiring firm commitment aligned with Group strategy
Sapna Sood was appointed Chair of the SustainabilityCommittee following the 2016 Combined General Meeting. Shewas formerly Health and Safety Director with LafargeHolcim andChair of the WBCSD Cement Sustainability Initiative’s workinggroup on health and safety
New Chair for the Remuneration Committee, a position requiring authority and independence
Sophie L’Hélias took over from Philippe Lagayette as Chair of theRemuneration Committee. She is independent and has theexperience and capacities needed in this position
Presentation of Committees’ work by their respective Chairs
All Board meetings include a review of the work of the Committees.Each Committee’s Chair reports on the points covered
Work of Committees
4 CORPORATE GOVERNANCE ~ REPORT BY THE CHAIRMAN OF THE BOARD OF DIRECTORS
Area for improvement Remedial action
206 Kering ~ 2016 Reference Document

4REPORT BY THE CHAIRMAN OF THE BOARD OF DIRECTORS ~ CORPORATE GOVERNANCE
The Committee may call on external experts and hear anyperson.
Each year it reviews the fees charged by the Company’sStatutory Auditors and assesses their independence. TheCommittee also considers potential Statutory Auditorsfor appointment.
Composition
The Kering Audit Committee comprises four Directors:Jean-Pierre Denis, Chairman, independent Director,Patricia Barbizet, Sophie L’Hélias, independent Director,and Laurence Boone, independent Director.
The four members of the Audit Committee have recognisedfinancial or accounting skills, combining their expertise ingeneral and operational management of banks andbusinesses as confirmed by their professional careers(see pages 150, 155, 158 and 159 of the Reference Document).
In accordance with the revised AFEP-MEDEF Code, two-thirds of the members of the Committee are independentDirectors, and no member is an executive corporateofficer.
Activities of the Audit Committee in 2016 and up to February 7, 2017
In 2016, the Committee met five times, with an averageattendance rate of 100%.
During 2016, the Chief Financial Officer and Group InternalAudit Director were regularly invited to present their workand answer questions at meetings of the Committee.
On January 18, 2016, the Audit Committee reviewedInternal Audit activities (audit missions and action plantracking) and Group risk exposure, and heard the InternalAudit Director’s presentation of the 2016 audit plan. Witha view to submitting its recommendations to the Boardof Directors, it also reviewed the accounting options forthe annual financial statements, the off-balance-sheetcommitments, the scope of the Statutory Auditors’engagement, the independence of the Statutory Auditors,and their general programme for audit work.
On February 15, 2016, the Committee met prior to theBoard meeting held to adopt the 2015 financial statements,a topic to which it devoted most of its work (with apresentation of the financial statements by the GroupChief Financial Officer), and heard the Statutory Auditorsin relation to their reports on the financial statements. Italso reviewed the services provided by Artémis in 2015.
At its meeting on June 8, 2016, the Committee began byreviewing the interim financial statements, on the basis
of a presentation by the Group Chief Financial Officer.This was followed by a presentation of Group InternalAudit missions by the Audit Director. The Committee alsoheard a report on the development of the Group complianceprogramme given by the Chief Compliance Officer, whohas a direct link to the Board of Directors via the AuditCommittee. The Chief Compliance Officer is thus fullyindependent, an important factor in any complianceprogramme.
With a view to the meeting of the Board on July 28, 2016to adopt the interim financial statements, the Committeemet on July 26 to review the financial statements. Thismeeting was attended by the Chief Financial Officer, theFinancial Control Director, the Financing and TreasuryDirector and the Investor Relations Director. TheCommittee also heard the Statutory Auditors’ reports onthe interim financial statements, and reviewed an interimreport on the audit reform. The Head of the LegalDepartment closed the session with an interim report oncompliance issues, with particular reference to Europeanregulations on market abuse.
The last Audit Committee meeting in 2016 was onSeptember 9, to prepare for the Board meeting onstrategy. A specific objective of this extraordinary sessionwas to prepare for discussions under the agenda item onrisks. The Group Internal Audit Director reported to theBoard on Internal Audit work.
The Audit Committee has met twice in 2017 so far, withan average attendance rate of 87.5%.
On January 11, 2017, the Head of the Internal AuditDepartment reported to the Committee on the InternalAudit activities and the Group’s risk exposure. With a viewto submitting its recommendations to the Board ofDirectors, the Committee reviewed the accountingoptions for the annual financial statements, off-balance-sheet commitments, the scope of the Statutory Auditors’assignment, the independence of the Statutory Auditors,and their general programme for audit work.
On February 7, 2017, the Committee met before the meetingof the Board to adopt the 2016 financial statements, atopic to which it devoted most of its work, and heard theStatutory Auditors in relation to their reports on the financialstatements. It also reviewed the services provided byArtémis in 2016, and heard a report on the performanceof the Kering share. The Committee members alsoexamined the Chairman’s report on internal control andrisk management.
On February 9, 2017, the Committee informed the Boardof its work and recommendations.
2072016 Reference Document ~ Kering

Remuneration Committee
Duties
The Remuneration Committee’s role is to review andmake proposals to the Board of Directors on all items andterms of remuneration of the Chairman and Chief ExecutiveOfficer and the Group Managing Director (as explainedabove in the section “Remuneration of executive corporateofficers”) and the method of allocating Directors’ feesgranted to the Board by the Annual General Meeting. Itreviews and assesses the remuneration policy for seniorexecutives as well as the remuneration and benefitsreceived or deferred, stock options, free share grantsand / or similar benefits including retirement benefits andany other benefits granted to members of the Keringgroup Executive Committee.
Composition
The Remuneration Committee currently comprises fourDirectors: Sophie L’Hélias, Chair, independent Director,Patricia Barbizet, Yseulys Costes, independent Director,and Jean-Pierre Denis, independent Director. Accordingly,with regard to the criteria of the revised AFEP-MEDEFCode, independent Directors represented the majority ofthe Remuneration Committee’s members and no memberis an executive corporate officer. However, contrary to theCode’s recommendations, the employee representativeDirector is not a member of the Committee.
Activities of the Remuneration Committee in 2016 and up to February 7, 2017
In 2016, the Committee met five times, with an averageattendance rate of 100%.
It met for the first time, with all its members, on February 15,2016, to discuss the remuneration of the members of theExecutive Committee for 2015. This meeting alsoexamined proposals for change in the variable remunerationsystem for executive corporate officers and orientationson long-term remuneration components (i.e., performanceshares and Kering Monetary Units).
On March 7, 2016, the Committee met to review anddetermine the variable components of the remunerationawarded to the Chairman and Chief Executive Officer andto the Group Managing Director for 2015, and thecomponents of remuneration for 2016. It determinedqualitative performance criteria conditionin g 30% of theirrespective variable remuneration (as detailed in thesection “Remuneration of executive corporate officers”).
The three following meetings, on 10 June, 2 Decemberand 12 December 2016, were given over entirely to thematter of remuneration components for executivecorporate officers. The Committee began by approvingthe Board’s validation of a more linear connectionbetween target achievement rates and bonus paymentrates in the annual variable remuneration system, and a
30% proportion of qualitative criteria based on corporatesocial responsibility objectives. It then discussed settingup a new structure governing remuneration for theChairman and Chief Executive Officer and the GroupManaging Director. Points covered here included therelevance of performance conditions applicable to long-term remuneration, and the need for a link between riskand reward. The Group Human Resources Director andthe Remuneration and Benefits Director took part inthese discussions.
On February 7, 2017, all the members of the Committeemet to conclude matters following the discussions of thethree previous meetings. The Committee issued aproposal on reconfiguring the system of remunerationfor executive corporate officers, and this was submittedto the Board of Directors at its meeting on February 9,2017. This Committee’s review was carried out on thebasis of estimates; the Committee will determine the rateof achievement for all remuneration at its next meeting,based on the Group’s 2016 results.
The Remuneration Committee reported on its work andrecommendations to the Board of Directors.
Appointments Committee
Duties
Set up in March 2003, the Appointments Committeereviews the proposed appointment of Directors as well astheir situation with regard to the independence criteriadefined by the Board. This review must be carried outprior to each appointment and at any time deemedappropriate by the Committee. It provides its opinionsand recommendations in these matters to the Board.
Composition
The Committee comprises four Directors: PatriciaBarbizet, Chair, Yseulys Costes, independent Director,Sapna Sood, independent Director, and Baudouin Prot.
In accordance with the revised AFEP-MEDEF Code, noexecutive corporate officers are a member of theCommittee.
Activities of the Appointments Committee in 2016 and up to February 2, 2017
In 2016, the Appointments Committee met once and allof its members were present.
On February 11, 2016, the Committee met for a progressreport on the assessment of the Board of Directors and toreview the resulting proposals in view of renewing theBoard and its Committees in connection with the expiryof the terms of office of Jean-Pierre Denis, PhilippeLagayette, Luca Cordero Di Montezemolo, and JochenZeitz, and of the seat vacated by Laurence Boone. Inaddition, it reviewed a draft of the section of this reporton corporate governance.
4 CORPORATE GOVERNANCE ~ REPORT BY THE CHAIRMAN OF THE BOARD OF DIRECTORS
208 Kering ~ 2016 Reference Document

4REPORT BY THE CHAIRMAN OF THE BOARD OF DIRECTORS ~ CORPORATE GOVERNANCE
On February 2, 2017, all Committee members met todiscuss Directors’ independence and composition of theBoard and its Committees. They also discussed theChair’s report on governance. The Committee proceededwith an interim review of work on Board assessment,with a view to submitting conclusions to the Boardmeeting of March 10, 2017.
The Appointments Committee accordingly reported onits work and made its recommendations to the Board ofDirectors.
Strategy & Development Committee
Duties
Within the limits of the duties of the Board of Directors,the Strategy & Development Committee’s role is toidentify, analyse and support the Kering group’s strategicdevelopment initiatives.
Composition
The Committee comprises four Directors: François-HenriPinault, Chair, Baudouin Prot, Daniela Riccardi, independentDirector, and Laurence Boone, independent Director.
Activities of the Strategy & Development Committee in 2016 and 2017
As in 2015, the Strategy & Development Committee metonce in 2016, on the occasion of the Board of Directors’meeting of October 18, 2016. All the members of theCommittee attended the meeting. This unusualarrangement was carried over in 2016 because it wasconsidered useful that all Directors should be able to takepart in discussions on Group strategy.
The Committee did not meet in early 2017.
Sustainability Committee
Duties
The Sustainability Committee’s role is to support theCompany and the Group in establishing, implementingand monitoring good corporate governance, taking intoaccount the aim of the Board of Directors and ExecutiveManagement to maintain a high level of sustainability intheir economic, social and environmental context, theGroup’s clear ambitions in terms of ethics and thecorporate citizenship policies and practices upheld bythe Group, its senior executives and employees.
Composition
The Committee comprises four Directors: Sapna Sood,Chair, François-Henri Pinault, Daniela Riccardi and Jean-François Palus.
Activities of the Sustainability Committee in 2016 and 2017
In 2016, the Committee met twice, with an averageattendance rate of 67%.
The Committee met on March 16, 2016 to discuss Groupactivities with regard to sustainability, consistent with thetargets set for 2016. Specific issues covered included theGroup sustainability priorities of the EP&L, innovativeprojects and sustainable sourcing.
A second meeting was held on October 27, 2016. Giventhe new Committee composition, members werereminded of the reasons for the major emphasis placedon sustainability in Kering’s strategy, and they proceededwith a brief interim review of the targets set for the period2012-2016. The Committee then reviewed the plan for thenext ten years (the Advance project), announced to thepublic in January 2017. The Committee members notedthat this new plan goes beyond strictly environmentalissues to cover two other points – social responsibility anddevelopment of new business models – and thus positionthe Group as a catalyst for positive change in these areas.
The Group Sustainability and Institutional Affairs Directortook part in both meetings of the Sustainability Committee.
The Committee did not meet in early 2017.
6.2.7. Shareholder participation
All shareholders are entitled to attend Annual GeneralMeetings in accordance with the conditions provided forby law. The terms and conditions of said attendance arespecified in the provisions of Article 20 of the Articles ofAssociation and are set out on page 381 of the ReferenceDocument.
6.2.8. Information likely to have an impactin the event of a public offer
No information other than that related to (i) the currentshareholding structure (Artémis being the majorityshareholder, with 40.88% of the capital and 57.41% ofvoting rights of Kering), (ii) the double voting rightprovided for under the Articles of Association, (iii) theshare buy-back programme, and (iv) the authorisationsgiven by the Annual General Meeting to increase thecapital, as expressly described in the ReferenceDocument, is liable to have an impact in the event of apublic offer or can have the effect of delaying, deferringor preventing a change of control.
To the Company’s knowledge, there are no agreementsbetween shareholders that could restrict the transfer ofshares or the exercise of voting rights.
2092016 Reference Document ~ Kering

6.2.9. 2016 remuneration policy with regard to Directors and executive corporate officers
Directors’ fees paid to the members of the Board of Directors
The Annual General Meeting determines the total amountof Directors’ fees allocated to members of the Board ofDirectors.
Based on the recommendations of the RemunerationCommittee, the Board of Directors allocates Directors’fees according to the actual presence of members atmeetings of the Board and of specialised Committeesheld during the relevant fiscal year.
Out of the total amount set by the Annual GeneralMeeting, the rule followed by the Board in order tocomply with AFEP-MEDEF Recommendation 20-1 for asignificant variable portion is to divide the total amountbetween a 40% fixed portion and a 60% variable portion.The Directors’ fees are allocated in the following manner:
a) a fixed portion, minus a special portion correspondingto the remuneration of the Chairs of the Audit,Remuneration and Appointments Committees,respectively (€23,000 each), the balance beingallocated with a coefficient of 1 by Board membership,increased by 0.5 per Committee;
b) a variable portion, allocated with a coefficient of 1 (2 forthe Vice-Chair) per presence at each meeting of theBoard and 0.5 for each attendance of a Committeemeeting.
In respect of 2016, Kering paid the members of its Boardof Directors €877,000 in Directors’ fees.
Other remuneration
The remuneration and benefits granted to executivecorporate officers primarily depend on the level ofresponsibilities attached to their position, the Group’sresults and achievement of the targets pursued. They alsotake into account the remuneration paid by companiesthat are comparable in terms of size, business sector andinternational presence.
The variable portion of the remuneration paid to executivecorporate officers is based on the achievement offinancial and non-financial targets. The Board of Directorsadopted two financial criteria for fiscal year 2016:
• recurring operating income;
• free cash flow from operations.
Each of these criteria is weighted at 50%. This variableremuneration portion is triggered at 75% achievement ofeach budgetary objective, then rises linearly up to a 140%achievement rate, which gives rise to payment of amaximum bonus set at 150% of the target bonus.
There are three non-financial objectives:
• organisation and talent management;
• corporate social responsibility;
• sustainability.
These non-financial objectives determine 30% of thevariable portion.
When targets are exactly met, the variable portion isequal to 120% of the fixed remuneration of the Chairmanand Chief Executive Officer and 100% of that of the GroupManaging Director.
The multi-annual variable portion is based on KeringMonetary Units (KMUs), with an initial value of €152, thenindexed equally to both absolute changes in the Keringshare and changes in the Kering share price relative to abasket of nine Luxury and Sport & Lifestyle stocks. TheseKMUs have a vesting period of three years as from theirgrant date, after which they may be cashed by thebeneficiaries over a two-year period (during two windowseach year), based on the most recently determined value.
The grant value of this remuneration is equal to 70% ofthe Chairman and Chief Executive Officer’s total annualcash-based remuneration (fixed remuneration plusvariable remuneration for the previous year). This is alsothe case for the Group Managing Director.
Final vesting of the KMUs is subject to the condition of aminimum average increase in earnings per share fromcontinuing operations attributable to owners over thevesting period:
• if this is 5% or more, the whole of this remunerationcomponent can be cashed;
• if it is from 2.5% to 5%, the remuneration componentcan be partially cashed;
• if it is less than 2.5%, it cannot be cashed.
None of Kering’s executive corporate officers benefit fromprovisions granting them a specific indemnity in theevent that they leave the Group.
Details on the remuneration policy and on individualremuneration for Kering Directors and executive corporateofficers appear on pages 162 to 172 of the ReferenceDocument.
4 CORPORATE GOVERNANCE ~ REPORT BY THE CHAIRMAN OF THE BOARD OF DIRECTORS
210 Kering ~ 2016 Reference Document

4REPORT BY THE CHAIRMAN OF THE BOARD OF DIRECTORS ~ CORPORATE GOVERNANCE
2112016 Reference Document ~ Kering
This part of the Report by the Chairman of the Board ofDirectors on the risk management and internal controlsystem within the Group is based on the AMF’s ReferenceFramework published in July 2010. The ReferenceFramework takes into account the legislative andregulatory changes since it was first published in 2007,including Act No. 2008-649 of July 3, 2008 and theOrdinance No. 2008-1278 of December 8, 2008, whichadapted French law to EU Directives 2006 / 46 / EC ofJune 14, 2006 and 2006 / 43 / CE of May 17, 2006, and alsosupplemented the Financial Security Act No. 2003-706 ofAugust 1, 2003. It also takes account of the requirementsset out in article 173 of the Act No. 2015-992 ofAugust 17, 2015 on energy transition for sustainabledevelopment.
The AMF’s framework is based not only on theaforementioned French and EU legislation and regulations,but also on internal control and risk management goodpractices and international standards, in particular ISO 31000 and COSO II. The COSO II internal controlframework was analysed in depth when the riskmanagement policy was drafted. This policy is set out inthe section “The components of risk management”.
6.3.1. Scope and principles of organisation
Kering is the parent company of the Kering group, whosemain operating entities are the Luxury and theSport & Lifestyle activities. The following report aims todescribe the internal control procedures in the Group, inparticular, the procedures relating to the preparation andprocessing of financial and accounting information. Thescope of the Group covered by the report includes allfully-consolidated subsidiaries, i.e., the companies inwhich the Group directly or indirectly exercises exclusivecontrol.
As a holding company, Kering’s own operations consist ofdefining and implementing its strategy, organising andmanaging its holdings, stimulating the development ofits activities, coordinating their financing, providingsupport and communication functions, and defining andimplementing the insurance cover policy.
The internal control function follows the generalorganisation of the Group. It is both:
• decentralised at the level of the activities: ExecutiveManagement of the operating and legal entities isresponsible for managing and coordinating the internalcontrol process;
• unified around a common methodology and a singleset of standards. The Kering holding company coordinatesits deployment across the Group, supported by teamsat Kering APAC and Kering Americas.
The section dedicated to internal control procedurescovers the Luxury activities. PUMA AG, listed on theGerman stock market, is subject to regulatory obligationsapplicable to internal control and risk reporting, whichare described in the Company’s annual report and whichmay be consulted to supplement this report. It should benoted that the Kering group’s best practices in this areahave been adopted by the PUMA group. PUMA SE’s AuditCommittee keeps the Kering Audit Committee regularlyinformed.
6.3.2. General principles of risk management
According to the definition of the AMF, risks represent thepossibility that an event may occur and could have animpact on people, assets, the environment, the Company’sobjectives and its reputation.
Risk management covers areas that are much wider thanjust financial risks: for example, strategic, operational,reputational and compliance risk. Risk management is akey management tool that helps:
• create and preserve the value, assets and reputation ofthe Company;
• render the Company’s decision-making and processessecure in order to support the achievement of itsobjectives;
• mitigate the risk of unexpected outcomes andoperating losses;
• ensure that initiatives are consistent with theCompany’s values;
• bring Company employees together to develop ashared view of the main risks.
6.3.3. The components of risk management
The Group constantly strives to make its operations moresecure and to improve its methodology to identify and dealwith risks. In 2016, the Group pressed ahead with changesto its risk management methodology initiated in 2011and the means used for its risk management system. TheGroup’s risk management system provides an organisationalframework, a three-step risk management process andcontinuous monitoring of the system.
6.3. Internal control and risk managementprocedures implemented by the Company

6.3.3.1. Organisational framework
This organisational framework includes:
• an organisation that sets out the roles and responsibilitiesof the various persons involved and sets out procedures,as well as consistent and clear standards, for the system;
• a risk management policy that sets out the objectivesof the system in line with the Company’s culture, theshared language used, and the process to identify,analyse and deal with risks;
• an IT system that makes it possible to share informationabout risks internally.
Risk Committee
Within the scope of the Group’s risk management policyand in accordance with Kering’s corporate governance,Kering’s Executive Management created a “Kering groupRisk Committee” in 2011. This Committee comprises theGroup Managing Director, the Chief Financial Officer, theHead of the Legal Department, the Head of the InternalAudit Department and the Head of the Security Department.As the Group’s operations and activities expand, andbecome more complex and more international, the RiskCommittee helps identify and manage strategic, operational,reporting, reputational and compliance risks that couldhave an impact on the Group’s business operations.Internal rules establish the rules for the Committee andhow it operates.
The Risk Committee reviews (i) the validation andmonitoring process for the Group’s risk managementpolicy, (ii) the monitoring of the topicality and relevanceof the analysis of strategic, operational, reporting,reputational and compliance risks, (iii) the analysissummaries of general and specific risks, and (iv) thevalidation and monitoring of the roll-out of action plansaimed at better controlling identified risks.
The Risk Committee’s work is brought to the attention ofthe Audit Committee, which is informed of theCommittee’s internal rules and has access to the reportsfrom its meetings.
Risk manager
The risk manager function was also created within theCompany to coordinate this reinforced risk managementsystem, ensure that the Executive Management teams ofthe activities analyse the main risks within their scope ofbusiness, and provide the members of the Risk Committee,prior to each meeting, with the information and documentsnecessary for their work and their discussions.
Risk management policy
After reviewing in particular the COSO II internal controlframework, the Group implemented a risk managementpolicy that was sent to the Kering and PUMA internalcontrol departments as well as the Executive Managementteams of the activities and brands. This documentdescribes the methods used by the Group for the riskanalysis work that it conducts every two years.
6.3.3.2. A three-step risk management process: The risk management process involves:
• identifying risks: this step makes it possible to identifyand centralise the main risks. A risk is characterised byan event, one or more internal or external sources, andone or more consequences. Risk identification withinthe Group is part of a continuous effort with assessmentsin principle on a twice-yearly basis;
• analysing risks: this step involves reviewing thepotential consequences of the main risks (for example,financial, human, legal or reputational consequences)and assessing their impact, whether they may occur aswell as the level of risk control. This is also a continuouseffort, and assessments are conducted in principletwice a year during work group sessions with the mainmanagers of the activities; the risk management policydescribes in detail the criteria and procedures for theseassessments;
• dealing with risk: during this last step, the most appropriateaction plan(s) for the Company is (are) identified.
This risk mapping system was put in place several yearsago and has been strengthened since 2011 with thepresentation made to the Risk Committee of a consolidatedrisk map for each of the activities. The risk managementprocess is monitored over the long-term.
In 2013, the Group deployed special software for themanagement of risk identification and analysis whichguarantees a common methodology across both activitiesand extends the responsibilities of the managers includedin these workshops.
In 2014, the Group extended its risk identification processthrough work sessions with the holding company’s mainmanagers.
In 2015, the Group extended its risk identification processthrough work sessions with the key managers of Kering’sregional divisions in the Americas and Asia-Pacific.
4 CORPORATE GOVERNANCE ~ REPORT BY THE CHAIRMAN OF THE BOARD OF DIRECTORS
212 Kering ~ 2016 Reference Document

4REPORT BY THE CHAIRMAN OF THE BOARD OF DIRECTORS ~ CORPORATE GOVERNANCE
2132016 Reference Document ~ Kering
6.3.3.3. Oversight of the risk management system
The risk management system is monitored and reviewedon a regular basis to help continuously improve thesystem. The objective is to identify and analyse the mainrisks and to learn from risks that have materialised.
The Risk Committee meets in principle at least twice ayear to review the risk maps drawn up by the InternalAudit Department of the Group and of PUMA, and tomonitor the progress of the specific action plans.
The Committee discusses its self-assessment once a year.
The Risk Committee met once in 2016, and the AuditCommittee and Board of Directors were apprised of itswork in December 2016.
6.3.4. Link between risk management and internal control
The risk management and internal control systems arecomplementary, and together help control the Group’sactivities:
• the risk management system is designed to identifyand analyse the main risks. Risks are dealt with andaddressed in action plans that can be adapted to theorganisation, may include project management, andmay also involve implementing controls. The controlsto be implemented are part of the internal controlsystem and may be reviewed based on the risk maps;
• the internal control system uses the risk managementsystem to identify the main risks to be controlled;
• the audit plan uses the risk map to test the assessmentof the level of control of the risks identified.
The link between and the combined balance of the twosystems depend on the control environment, which istheir common base, particularly the risk and control cultureof each company and the ethical values of the Group.
6.3.5. General principles of internal control
6.3.5.1. Definition of internal control
The internal control procedures applicable within theKering group rely on a set of means, policies, conduct,procedures and appropriate actions to ensure that thenecessary measures are taken in order to control:
• activities, operational effectiveness and the efficientuse of resources;
• strategic, operational, reporting, reputational orcompliance risks that could have a significant impacton the Company’s assets or the achievement of itsobjectives.
Internal control is defined as a process conducted byExecutive Management, under the supervision of theBoard of Directors, and implemented by seniorexecutives and all employees. Regardless of its qualityand its degree of application, it cannot provide anabsolute guarantee of the achievement of goals fallingwithin the following categories:
• compliance with laws and regulations in force;
• application of guidelines and directions set byExecutive Management;
• smooth operation of internal processes, particularlythose contributing to the safeguarding of assets;
• reliability of financial and accounting information.
6.3.5.2. Limits of internal control
The probability of meeting these objectives is subject tothe limits inherent in any internal control system, such as:
• human errors or malfunctions occurring when decisionsare made or applied;
• deliberate collusion amongst several individuals,enabling them to elude the control system;
• situations in which implementing or maintaining acontrol would be more expensive than the risk that it issupposed to remedy.
Furthermore, it is understood that in pursuing theobjectives indicated above, companies are faced with eventsand uncertainties beyond their control (unexpectedchanges in the markets, competitive environment orgeopolitical situation, or error in forecasting or assessingthe effects of such changes on the organisation, etc.).
6.3.6. Components of internal control
The quality of the internal control system is based on thefollowing components:
• the control environment based on rules of conduct andintegrity supported by Management and communicatedto all employees;
• an organisation that clearly defines responsibilities andhas adequate resources and skills;
• a system to identify, analyse and manage the main risks;
• ongoing oversight of the internal control system andregular review of the functioning of the system.

6.3.6.1. Internal control environment
The Group’s internal control system is based on adecentralised organisation that clearly definesresponsibilities through the Group Charter. It includesprinciples and values governing the conduct and ethics ofall its employees, presented in the Code of ethics. It alsoincludes an Internal Control Charter. Moreover, it relies onhuman resources management that ensures thecompetency, ethical conduct and involvement of itsemployees.
The Group Charter
The Kering group adopted a Group Charter several yearsago which was updated in 2012 and provides theframework for the decentralisation of the organisationand the responsibility of senior executives. The Charterdefines the guiding principles governing the relationsbetween Kering and its activities. It also defines, withineach functional area, (i) the matters that fall within thedelegated responsibility of the activities, (ii) those thatmust be communicated to Kering within appropriatetimeframes, and (iii) those requiring the priorauthorisation of Kering.
Group principles and values
The ethical principles of the Kering group are set out in theCode of ethics, first circulated in 2005 and then recirculatedin 2009 and 2013 to all Kering group employees.
The third edition of the Code of ethics included a Suppliers’Charter and the adoption of the precautionary principle,especially in environmental protection. It also presentsnew developments in the Group’s ethics organisation andthe steps to take in cases of suspected non-compliancewith key Kering commitments.
The Code sets out the Group’s commitments and rules ofconduct towards its main stakeholders:
• employees;
• customers and consumers;
• business partners and competitors;
• the environment;
• civil society;
• shareholders and financial markets.
This intensification of promotion and respect for ethicswithin the Group has also seen the implementation of anonline training programme in ethics and code compliancefor all Kering employees worldwide. It is based on casestudies that show ethics in the light of daily professionallife, and will be updated annually.
In addition to the first circulation of its Code of ethics in2005, Kering has also set up a Group Ethics Committee.
This Committee is now supported by two regional EthicsCommittees: the Asia-Pacific (APAC) Ethics Committeeand the Americas Ethics Committee. A global hotline isalso available to all staff in all 12 of the Code’s languages.
The Ethics Committees are composed of representativesof the Group’s brands and Kering staff (Corporate, KeringAPAC and Kering Americas). This entire structure ismanaged by Kering’s Chief Sustainability Officer and Headof International Affairs.
The Ethics Committees have three main functions:
• supervising the circulation and application of the Codeof ethics and the principles that it defends;
• responding to any issues raised by a Group employee,be it a simple request for clarification or a questionrelating to the interpretation of the Code and itsapplication, or a claim submitted to the Committee dueto alleged non-compliance with one of the Group’sethical principles;
• generating initiatives for developing the Group’ssustainable development policy and activities.
The changes made to the Code and the organisation ofethics within the Group are examined in detail in Chapter3 “Sustainability” of this report.
The activities may in addition set up their own specificadditional procedures and guidelines, such as suppliergift charters.
Moreover, the Insider Good Practices Committee, madeup of the Group Managing Director and the Head of theLegal Department, implements preventive measures toprotect against insider trading activities (e.g., a calendarof black-out periods, a list of permanent and occasionalinsiders, newsletters, etc.).
The Internal Control Charter
The Kering group adopted an Internal Control Charter in2010 that was circulated throughout the Group. In orderto adapt the Charter to changes in the Group since itsinitial publication, a new edition was published in 2015.The Charter defines internal control and sets out itsobjectives as presented in the AMF’s ReferenceFramework. It also specifies the limits of internal control,which cannot under any circumstances provide anabsolute guarantee that the Company’s objectives will beachieved. The Charter specifies that the holding companyserves to unite the various entities. It also sets out theresponsibilities of each of the activities and brands inimplementing an internal control system that is adaptedto their operations.
The Charter defines the role of each person involved inthe internal control system and the bodies responsiblefor oversight and assessment.
4 CORPORATE GOVERNANCE ~ REPORT BY THE CHAIRMAN OF THE BOARD OF DIRECTORS
214 Kering ~ 2016 Reference Document

4REPORT BY THE CHAIRMAN OF THE BOARD OF DIRECTORS ~ CORPORATE GOVERNANCE
2152016 Reference Document ~ Kering
Furthermore, the Charter specifies the existing tools forassessing internal control and risks which are self-assessment of internal control and mapping of majorrisks, as well as setting out the basic principles forcreating new procedures.
Human resources policy
Quality of human resources and cohesion of managementare key success factors of the Group. Kering makes surethat the various activities apply human resources policiesthat are adapted to their context and challenges, whilemeeting the highest local standards. The principle ofautonomy and empowerment of the activities is alsoapplied, but the Group guarantees the consistency of thepolicies implemented and their alignment with Kering’svalues and actions defined centrally.
With regard to social policy, the activities apply highstandards of dialogue and participation of employees inthe Company, while the Group engages in dialogue at thelevel of the Group’s employee representative bodies, theGroup Works Council and the European Works Council. In2010, the European Works Council and Kering’s Groupmanagement adopted a “Framework of Commitment onthe quality of life at work and the prevention of work-related stress”. Kering has also set up an employeeopinion survey conducted every two years, which alsoconcerns the activities. The survey was conducted againin 2015. The Group develops cross-functional trainingprogrammes and carries out talent reviews every year ofthe activities’ managerial resources. Kering thus ensuresthat there is a good match both now and in futurebetween the managerial resources and the challengesfacing the activities. Furthermore, the Group maintains anactive market monitoring policy for all key positions forwhich the internal succession plan does not appearsufficiently strong.
6.3.6.2. Organisation and resources
The organisation of internal control depends on actively-involved persons at every level of the chain of responsibility,from Executive Management to all employees, as well asthe bodies responsible for oversight and assessment: theBoard of Directors, the Audit Committees, the InternalAudit and Risk Management Departments and theStatutory Auditors.
Executive Committee
The Kering group Executive Committee, which is an ExecutiveManagement body, comprises the Chairman and ChiefExecutive Officer, the Group Managing Director, the ChiefExecutive Officer of Kering’s “Luxury – Watches & Jewelry”division, the Chief Executive Officers of Gucci, the ChiefExecutive Officers of Saint Laurent, Bottega Veneta, PUMASE and Kering Eyewear, the Chief Client and MarketingOfficer of Kering, and the Kering functional Directors (HumanResources, Finance, Sustainability and InternationalInstitutional Affairs, Communications).
The Executive Committee meets regularly, in accordancewith the policies of the Strategy & Development Committee,in order to:
• draw up and coordinate the Group’s operating strategy;
• define the priorities through objectives assigned to theactivities and the main functional projects;
• develop synergies between the activities;
• propose acquisitions and disposals to the Board ofDirectors;
• ensure proper implementation of the policies andprojects defined within the framework of KeringSustainability.
Kering group strategies and goals are discussed each yearvia the medium-term plans and the budgets of thebusiness units of each of the activities.
Executive Management teams
The Executive Management teams define, coordinate andoversee the Group’s internal control system. They are alsoin charge of initiating the necessary corrective measures.The Executive Management teams’ involvement is of keyimportance to the internal control system, given theKering group’s organisation.
Oversight of the system results in an annual report on internalcontrol prepared by the Chief Executive Officer of PUMA.
Management and employees
Management is the key operational player of internalcontrol; it relies on internal control to perform its dutiesand reach its objectives. In this respect, managementimplements the internal control operations related to itsarea of responsibility and ensures that the internalcontrol system is adapted to its activities.
Employees must have the knowledge and informationnecessary to set up, operate and oversee the internalcontrol system, with regard to the assigned objectives. Intheir day-to-day activities, they must follow the principlesand rules of control and may suggest ways to improveand detect malfunctions.
The bodies responsible for oversight and assessment are:
The Board of Directors
The Board of Directors contributes to the overall controlenvironment through the skills of its members. TheBoard is regularly informed about the methodologiesused for internal control and the management of majorrisks, which it presents in its Board report.
Audit Committee
Under the responsibility of the Board of Directors, to whichit regularly reports on these matters, the Kering AuditCommittee comprises four members, three of whom areindependent. It is in charge of monitoring:
• the procedures for preparing financial information;
• the effectiveness of internal control and risk managementsystems;
• the statutory audits of annual financial statements and,if need be, consolidated financial statements performedby the Statutory Auditors;
• the independence of the Statutory Auditors.
The Kering Audit Committee also carries out the followingactions:
• verifies that the Group has Internal Audit Departmentsthat are structured and adapted to the tasks ofidentifying, detecting and preventing risks, anomalies orirregularities in the management of the Group’s affairs;
• assesses the relevance and quality of the methods andprocedures used;
• reviews the Internal Audit reports and therecommendations issued;
• approves the annual Internal Audit plan;
• reviews the work conducted by the Risk Committee andhas access to the minutes of its meetings.
Kering’s Audit Committee meets at least four times a year.Similarly, there is an Audit Committee within PUMA,whose methods of operating and actions are identical tothose of Kering’s Audit Committee; it meets prior to themeeting of Kering’s Audit Committee.
Internal Audit and Risk Management Departments
PUMA, as a company listed in Germany, is required tohave an Internal Audit Department. This departmentworks with the Kering group’s Internal Audit Departmentto ensure that the audit teams are provided with fullcoverage of the Group.
Through their work, the Internal Audit and Risk ManagementDepartments help assess the internal control system andmake recommendations for its improvement. TheInternal Audit and Risk Management Departments arealso in charge of coordinating risk management, inparticular through risk mapping and monitoring theaction plans. The Heads of the Internal Audit Departments
report the main results of their assessments to ExecutiveManagement and the Audit Committee.
At the level of Kering, the Group Internal Audit Departmentreports to the Chairman. It coordinates, harmonises andoptimises the working methods and tools, as well asproviding services (regulatory intelligence, expertise,resources, etc.) and conducting audit assignments withinthe scope of the annual audit plan.
The Group Internal Audit Department centrally administersand analyses internal control pursuant to the FinancialSecurity Act, supplemented by Act No. 2008-649 of July 3,2008 and Ordinance No. 2008-1278 of December 8, 2008,as well as the new AMF Reference Framework describedin more detail in the section below entitled “Oversight ofthe system”.
The Group Internal Audit Department also performsactive intelligence monitoring with regard to best internalcontrol practices.
The Internal Audit Departments check the controlprocedures implemented by other Departments andconduct operational and financial audits within theirremit. During 2016, the Internal Audit teams takentogether conducted around sixty audit assignments,including special assignments.
The Internal Audit Departments draw up the audit plans,relying, in particular, on the Group’s process guidelinesand based on the major risks identified for the brands.They take account of special requests from seniormanagement and other operational departments. Theseprojects are discussed with the main persons in charge.The Audit Committees review and approve the auditplans thus drawn up.
The main issues identified by the Internal Audit Departmentsare reported to the Audit Committees. In this way, theAudit Committees are informed of the issues identifiedand the action plans set up by the entities concerned.
Apart from these assignments, all of the Internal Auditresources in the Kering group are dedicated to promotinginternal control on all business processes and activities,be they operational or financial, related to stores,warehouses or headquarters, distribution ormanufacturing activities.
At the end of 2016, the Internal Audit Department of theKering group consisted of 20 employees, versus 19 in2015 and 20 in 2014. Their rules of conduct are describedin their Audit Charter which stipulates that:
• at the end of each audit, the findings and recommendationsare presented to the managers of the area or areasconcerned;
• any agreements or disagreements made known by theaudited parties concerning the proposed recommendationsare included in the final report that specifies any actionplan, as well as responsibilities and the deadlines forimplementation;
4 CORPORATE GOVERNANCE ~ REPORT BY THE CHAIRMAN OF THE BOARD OF DIRECTORS
216 Kering ~ 2016 Reference Document

4REPORT BY THE CHAIRMAN OF THE BOARD OF DIRECTORS ~ CORPORATE GOVERNANCE
• the operational staff members concerned are responsiblefor implementing recommendations;
• the Internal Audit Department is in charge of verifyingtheir implementation.
The Internal Audit activities performed are consistentwith the work of the Audit Committees and the results ofthe work performed by the Statutory Auditors.
The Internal Audit Departments update their AuditCommittee on progress made on the audit plan and thefollow-up of their action plans at least twice a year.
In 2013, Kering’s Internal Audit Department publishedcharters that establish the methodology shared by bothactivities: the audit manual and the two audit approachdocuments. The development of the two audit approachesreflects the differences between the activities.
The Statutory Auditors
The Statutory Auditors review the internal controlsystems in order to certify the financial statements, byidentifying the strengths and weaknesses, by assessingthe risk of material misstatement, and where applicable,by making recommendations. Under no circumstancesdo the Statutory Auditors take the place of the Companyin implementing the internal control system.
The role of the Statutory Auditors is to annually certify thecompleteness, accuracy and fair presentation of theparent company and consolidated financial statementsand issue a review report on the Group’s interimconsolidated financial statements.
The audit engagements are allocated between the jointStatutory Auditors: Deloitte and KPMG.
The main issues covered by the Statutory Auditors are asfollows:
• identification of the risk areas and performance of testsby sampling in order to validate the completeness,accuracy and fair presentation of the financialstatements with regard to their company or consolidatedmateriality level;
• validation of the main accounting treatments andoptions throughout the year, in coordination with themanagement of the activities and Kering;
• application of the accounting standards defined byKering for the activities;
• preparation of an audit report for each brand, in orderto certify Kering’s consolidated financial statements,including any comments on internal control;
• presentation of a general overview of the Kering grouppresented to Kering’s Management and to the AuditCommittee;
• preparation of the Statutory Auditors’ reports for Kering’sshareholders. These reports appear in the ReferenceDocument on pages 137, 220, 344, 363 and 365.
6.3.6.3. Risk management
The risk management system is described in the section“Risk management” (see pages 252 to 260).
6.3.6.4. Oversight of the system
The ongoing oversight of the internal control system andregular review of its functioning are carried out by threemeans: the work performed by Internal Audit, the remarksmade by the Statutory Auditors and the annual self-assessments.
With regard to the annual self-assessments carried outwithin each of the activities for each process identified,the managers in charge are asked to assess the level ofinternal control through key controls for their operations,in order to identify any weaknesses and implementcorrective measures.
Self-assessment is not simply a reporting tool intended forthe Internal Audit departments or the Audit Committees;it is also a system that allows the Executive Managementteams of each of the activities to obtain reasonable assuranceregarding the strength of the internal control system.Self-assessment makes it possible to strengthen the levelof internal control through operational action plans.
The internal control analysis methodology is based onthe following principles:
• a self-assessment, using questionnaires, conductedwith the key operational staff members in each of theactivities following the breakdown of operations intokey processes. An overhaul of the self-assessmentquestionnaires was begun in 2011 and continued in2015 in order to make them more effective and betteradapted to business operations. In 2015, all of thequestionnaires were reviewed in the light of participants’responses during the previous annual assessment andthe comments of those making the assessments. Keycontrols as well as fraud risk controls were also identifiedand added to these questionnaires in order to strengthenthe effectiveness of the action plans. The self-assessmentcampaign was extended in 2016 to cover 100% ofKering’s and the activities’ identified operations;
• these questionnaires provide operational staff with anadditional indicator for assessing the quality of theinternal control procedures of which they are in charge.They make it possible to harmonise the level of internalcontrol applied throughout the Group and for allactivities to benefit from best practices, in particularnewly-acquired entities. They allow action plans to belaunched based on the results of these self-assessments;
• the questionnaire regarding the finance, accountingand management process is circulated each year. Ittakes into account the AMF’s Reference Framework and,in particular, its application guide. This questionnaireincludes 60 or so questions on the Group’s mandatorykey controls. It is circulated among the largest subsidiaries
2172016 Reference Document ~ Kering

in the Luxury and Sport & Lifestyle activities. There wasno change in the scope of processes covered in 2016,though more subsidiaries were included in the self-assessment campaigns for each of these processes,reflecting changes in the organisation of the Group’sbusinesses and the acquisition of new companies.
In 2013, the Group’s Internal Audit Department began toextend its self-assessment procedures to directly-ownedstores throughout the Luxury activities. These quarterlyself-assessments give the sales network managers anidea of the effectiveness of their internal control and ateaching aid to help store managers meet their internalcontrol obligations.
In 2016, the Group Internal Audit Department continuedto roll out this dedicated tool throughout the Luxuryactivities’ stores.
This approach was presented and approved by the KeringAudit Committee.
6.3.7. Description of internal control procedures relating to the preparation of financial and accounting information
Organisation of the accounting and management function
Financial and accounting information is prepared by theFinance Department. At the level of Kering, thisdepartment supervises the Financial Control Department,the Financing and Treasury Department, the InsuranceDepartment, the Tax Department and the FinancialCommunications Department.
The production and analysis of financial information isbased on a set of financial management proceduresincluding:
• medium-term plans, which measure the impact ofstrategic decisions on the Group’s key financial andmanagement balances. They are also used for theannual assessment by the Group of the value in use ofassets for the various cash-generating units;
• budgets, which are drawn up in two phases on the basisof discussions between the operating departments andthe members of the Group’s Executive Management.The first phase takes place in the fourth quarter of thefiscal year when a preliminary budget sets out the mainfinancial balances and operating action plans. Thesecond stage which finalises the budget takes place inthe first quarter of the following year and takes intoaccount any significant events that may have occurredin the meantime;
• monthly reporting that monitors the performance ofthe Luxury and Sport & Lifestyle activities throughoutthe fiscal year via specific indicators whose consistency
and reliability are reviewed by the Financial ControlDepartment. This department also oversees theconsistency of the accounting treatment applied by theactivities with Group rules and carries out, incollaboration with their financial controllers, ananalytical review by comparison with the budget andthe previous year;
• monthly meetings of the Executive Management ofKering and the senior executives of the Group’sactivities to assess business trends on the basis offinancial and operational data provided by themeetings’ participants;
• the Group’s regular monitoring of the activities’ off-balance sheet commitments. This control is carried out,in particular, as part of the statutory consolidationprocess insofar as the activities are required to providean exhaustive list of their commercial or financialcommitments and to monitor them from year to year.
Consolidation procedures
The statutory consolidation of the financial statements iscarried out at the end of June and December using theGroup consolidation tool. It enables financial informationto be transferred from the activities in real time after fullvalidation of the consolidation reporting packages by theactivities’ Statutory Auditors and by the Chief ExecutiveOfficers and Chief Financial Officers of the brands whocommit themselves via a signed representation letter,thus strengthening the quality of the financial informationtransferred.
Consolidation levels within the activities guarantee a firstlevel of control and consistency.
Kering’s Financial Control Department coordinates theprocess and is in charge of producing the Group’sconsolidated financial statements. For this purpose, thedepartment sends instructions to the activities specifyingthe reports to be sent, the assumptions to be applied aswell as the specific points to be taken into account.
Financial Communications
The purpose of the Financial Communications Departmentis to provide information on an ongoing or periodic basiswhich conveys a consistent and clear message as well asto respect the principle of equality between shareholdersin relation to disclosures.
Financial communication is meant for a diversified publiccomposed mainly of institutional investors, individualsand employees. Executive Management, the FinanceDepartment and the Financial Communications Departmentare the contacts for analysts and institutional investors.The Human Resources Department manages theinformation provided to employees alongside theFinancial Communications Department.
4 CORPORATE GOVERNANCE ~ REPORT BY THE CHAIRMAN OF THE BOARD OF DIRECTORS
218 Kering ~ 2016 Reference Document

4REPORT BY THE CHAIRMAN OF THE BOARD OF DIRECTORS ~ CORPORATE GOVERNANCE
2192016 Reference Document ~ Kering
Financial information is provided through Annual GeneralMeetings, periodic publications, press releases, etc., andall means of communication, including press, Internet,direct telephone contact and individual meetings.
Financing and Treasury Department
The Financing and Treasury Department managesliquidity, counterparty, foreign exchange and interest ratefinancial risks. It also coordinates the Group’s cashmanagement. It manages the Group’s banking policy,establishes guidelines regarding the allocation of activityby bank and coordinates Group calls for tender. It ensuresconsistency between published financial informationand policies governing interest rate, foreign exchange andliquidity risk management. Almost all of the financing isset up by Kering or Kering Finance. Exceptions areanalysed on a case-by-case basis according to specificopportunities or constraints and require Kering’sagreement.
Internal control is strengthened by the centralisation ofcertain functions within Kering:
The Legal Department
Apart from its specific function at Company level, theLegal Department assists the entire Group with importantlegal matters and coordinates analyses or studiescommon to the activities or of significant interest for theGroup. It also formulates Group policy and oversees itsapplication. It provides the activities with a methodologyfor identifying standard risks enabling them to anticipatesuch risks and inform the Legal Department.
The Tax Department
The Tax Department coordinates the Group’s tax policy,and advises and assists the activities on all issues relatedto tax law as well as on the implementation of taxconsolidation in France.
The Insurance Department
The Insurance Department sets up and manages theGroup’s insurance policy. It is responsible for identifying,quantifying and handling risks (prevention, self-insuranceor transfer to insurers or reinsurers).
The Communications Department
The Communications Department is involved in theGroup’s development by enhancing its image andreputation both internally and externally.
The Information Systems Department
The Information Systems Department is responsible forproviding optimal operational performance, controlling ITrisk and improving the Group’s information systems.
This report on internal control, resulting from thecontribution of the various internal control playersmentioned in the first section of this document, waspresented in draft form to Kering’s Audit Committee forits opinion and was approved by Kering’s Board ofDirectors on February 18, 2016.
The Chairman of the Board of Directors
7. Statutory Auditors’ report prepared in accordance with Article L.225-235 of the French Commercial Code (Code de commerce) on the Report of the Chairman of the Board of DirectorsYear ended December, 31 2016
This is a free translation into English of the Statutory Auditors’ report issued in French prepared in accordance with Article L. 225-235of the French Commercial Code on the report prepared by the Chairman of the Board of Directors of Kering S.A. on the internalcontrol and risk management procedures relating to the preparation and processing of accounting and financial informationissued in French and is provided solely for the convenience of English speaking users. This report should be read inconjunction and construed in accordance with French law and the relevant professional standards applicable in France.
To the Shareholders,
In our capacity as Statutory Auditors of Kering S.A. and in accordance with Article L. 225-235 of the French Commercial Code(Code de commerce), we hereby report to you on the report prepared by the Chairman of your Company in accordancewith Article L. 225-37 of the French Commercial Code for the year ended December 31, 2016.
It is the Chairman’s responsibility to prepare, and submit to the Board of Directors for approval, a report on the internalcontrol and risk management procedures implemented by the Company and containing the other disclosures requiredby Article L. 225-37 of the French Commercial Code, particularly in terms of corporate governance.
It is our responsibility:
• to report to you on the information contained in the Chairman’s report in respect of the internal control and riskmanagement procedures relating to the preparation and processing of accounting and financial information, and
• to attest that this report contains the other disclosures required by Article L. 225-37 of the French Commercial Code,it being specified that we are not responsible for verifying the fairness of these disclosures.
We conducted our work in accordance with professional standards applicable in France.
Information on the internal control and risk management procedures relating to the preparation and processingof accounting and financial information
The professional standards require that we perform the necessary procedures to assess the fairness of the informationprovided in the Chairman’s report in respect of the internal control and risk management procedures relating to thepreparation and processing of accounting and financial information. These procedures mainly consisted in:
• obtaining an understanding of the internal control and risk management procedures relating to the preparation andprocessing of accounting and financial information on which the information presented in the Chairman’s report isbased and the existing documentation;
• obtaining an understanding of the work involved in the preparation of this information and the existing documentation;
• determining whether any significant weaknesses in the internal control procedures relating to the preparation and processingof accounting and financial information that we would have noted in the course of our engagement are properlydisclosed in the Chairman’s report.
On the basis of our procedures, we have nothing to report on the information on the Company’s internal control and riskmanagement procedures relating to the preparation and processing of accounting and financial information contained inthe report prepared by the Chairman of the Board of Directors in accordance with Article L. 225-37 of the French Commercial Code.
Other disclosures
We hereby attest that the Report of the Chairman of the Board of Directors includes the other disclosures required byArticle L. 225-37 of the French Commercial Code.
Paris La Défense and Neuilly-sur-Seine, March 28, 2017The Statutory Auditors
KPMG Audit Deloitte & AssociésDivision of KPMG SA
Isabelle Allen Grégoire Menou Frédéric Moulin Stéphane Rimbeuf
4 CORPORATE GOVERNANCE ~ STATUTORY AUDITORS’ REPORT
220 Kering ~ 2016 Reference Document
2212016 Reference Document ~ Kering
CHAPter 5
Financial information
1. Activity report 2221.1. Foreword – Definitions 2221.2. 2016 highlights 2231.3. 2016 business review 2241.4. Analysis of operating performances by brand 2291.5. Comments on the Group’s financial position 2411.6. Parent company net income and dividend payment 2481.7. Transactions with related parties 2491.8. Subsequent events 2491.9. Outlook 249
2. Investment policy 2502.1. Financial investments 2502.2. Operating investments 250
3. Risk management 2523.1. Financial risks 2523.2. Strategic and operational risks 2543.3. Compliance risks 2593.4. Risk management 259
4. Consolidated financial statements 2614.1. Consolidated income statement 2614.2. Consolidated statement of comprehensive income 2624.3. Consolidated statement of financial position 2634.4. Consolidated statement of cash flows 2644.5. Consolidated statement of changes in equity 265
Notes to the consolidated financial statements 266
5. Statutory Auditors’ report on the consolidated financial statements 344
6. Parent company financial statements 3466.1. Balance sheet – assets 3466.2. Balance sheet – shareholders’ equity and liabilities 3476.3. Income statement 3486.4. Statement of cash flows 3486.5. Statement of changes in shareholders’ equity 3496.6. Notes to the parent company financial statements 3496.7. Five-year financial summary 362
7. Statutory Auditors’ report on the financial statements 363
8. Statutory Auditors’ special report on regulated agreements and commitments with third parties 365
05_A_VA_V4 04/04/2017 13:21 Page221

Definition of “reported” and “comparable” revenue
The Group’s “reported” revenue corresponds to publishedrevenue. The Group also uses “comparable” revenue tomeasure organic growth. “Comparable” revenue refers to2015 revenue adjusted as follows by:
• neutralising the portion of revenue corresponding toentities divested in 2015;
• including the portion of revenue corresponding toentities acquired in 2016;
• remeasuring 2015 revenue at 2016 exchange rates.
These adjustments give rise to comparative data at constantscope and exchange rates, which serves to measure organicgrowth.
Definition of recurring operating income
The Group’s total operating income includes all revenuesand expenses directly related to Group activities, whetherthese revenues and expenses are recurring or arise fromnon-recurring decisions or transactions.
“Other non-recurring operating income and expenses”consists of unusual items, notably as concerns the natureor frequency, that could distort the assessment of Groupentities’ economic performance. Other non-recurringoperating income and expenses include impairment ofgoodwill and other intangible assets, gains or losses ondisposals of non-current assets, restructuring costs andcosts relating to employee adaptation measures.
Consequently, Kering monitors its operating performanceusing “Recurring operating income”, defined as the differencebetween total operating income and other non-recurringoperating income and expenses (see Note 8 – Recurringoperating income, and Note 9 – Other non-recurringoperating income and expenses, to the consolidatedfinancial statements).
Recurring operating income is an intermediate line itemintended to facilitate the understanding of the Group’soperating performance and which can be used as a wayto estimate recurring performance. This indicator ispresented in a manner that is consistent and stable overthe long-term in order to ensure the continuity andrelevance of financial information.
Recurring operating income at comparable exchangerates for 2015 takes into account the currency impact onrevenue and Group acquisitions, the effective portion ofcurrency hedges and the impact of changes in exchangerates on the translation of the recurring operatingincome of consolidated entities located outside theeurozone.
Definition of EBITDA
The Group uses EBITDA to monitor its operatingperformance. This financial indicator corresponds torecurring operating income plus net charges to depreciation,amortisation and impairment of non-current operatingassets recognised in recurring operating income.
EBITDA at comparable exchange rates is defined usingthe same principles as for recurring operating income atcomparable exchange rates.
Definition of free cash flow from operationsand available cash flow
The Group also uses an intermediate line item, “Free cashflow from operations”, to monitor its financial performance.This financial indicator measures net operating cash flowless net operating investments (defined as purchases andsales of property, plant and equipment and intangible assets).
“Available cash flow” corresponds to free cash flow fromoperations plus interest and dividends received less interestpaid and equivalent.
Definition of net debt
As defined by CNC recommendation no. 2009-R-03 ofJuly 2, 2009, net debt comprises gross borrowings, includingaccrued interest, less net cash.
Net debt includes fair value hedging instruments recordedin the statement of financial position relating to bankborrowings and bonds whose interest rate risk is fully or partlyhedged as part of a fair value relationship (see Note 32 –Net debt, to the consolidated financial statements).
1. Activity report
1.1. Foreword – Definitions
5 FINANCIAL INFORMATION ~ ACTIVITY REPORT
222 Kering ~ 2016 Reference Document
05_A_VA_V4 04/04/2017 13:21 Page222

Creative and managerial change in the Luxury – Couture & Leather Goods division
On March 23, 2016, Brioni announced the appointmentof Justin O’Shea as Creative Director, responsible for thebrand’s collections as well as its image. He held thisposition from April 1 until October 4, 2016. The strategyof re-energising the Brioni House that began in early2016 was pursued during the course of the year throughlong-term action plans aimed at strengthening Brioni’spositioning in the men’s ready-to-wear market.
On April 1, 2016, Yves Saint Laurent announced the departureof Hedi Slimane as its Creative and Image Director at theend of a four year mission which has led to the completerepositioning of the brand. On April 4, 2016, Yves SaintLaurent announced the appointment of Anthony Vaccarelloas Creative Director of Yves Saint Laurent. Before joiningYves Saint Laurent, Anthony Vaccarello was CreativeDirector of his eponymous brand, which he founded in2009 following two years at Fendi.
2016 also saw the arrival of new CEOs within the Luxury –Couture & Leather Goods division: Claus-Dietrich Lahrs atBottega Veneta (also appointed a member of the GroupExecutive Committee), Emmanuel Gintzburger atAlexander McQueen, Nikolas Talonpoika at ChristopherKane, and Cédric Charbit at Balenciaga.
Sport & Lifestyle activities – Sale of Electric
On March 16, 2016, Volcom announced that it had soldthe Electric brand via a management buyout to a groupled by Eric Crane, Electric’s Chief Executive Officer. Thetransaction, which included all the assets of the Electricbrand, did not have a material impact in 2016 as the costof the sale had already been factored in at the end of 2015.
Appointments and corporate governance at Kering
In 2016, Kering announced the appointment of the followingnew members of the Group Executive Committee:Béatrice Lazat, Human Resources Director, Valérie Duport,Senior Vice President of Communications and Image andJean-Philippe Bailly, Chief Operating Officer. Carlo AlbertoBeretta, who was previously CEO of Bottega Veneta, wasappointed to the newly created role of Chief Client &Marketing Officer at Kering and remains a member of theGroup Executive Committee.
Since January 1, 2016, Kering has combined its Supply Chain,Logistics and Industrial Operations, under the worldwideleadership of Jean-Philippe Bailly.
Bond issue
On May 10, 2016, Kering carried out a €500 million issueof ten-year bonds with a fixed-rate coupon of 1.25%.
1.2. 2016 highlights
5ACTIVITY REPORT ~ FINANCIAL INFORMATION
2232016 Reference Document ~ Kering
05_A_VA_V4 04/04/2017 13:21 Page223

As in 2015, the market environment in 2016 was markedby significant geopolitical and economic instability, butexchange rate volatility was less pronounced. Against thisbackdrop, Luxury activities reported robust sales growth of7.7% as reported and 7.8% at comparable exchange rates.
In Western Europe, sales growth remained brisk despiteslowing tourist numbers and a shift in sales to Asia,primarily to Mainland China. Revenue in North Americarose year on year. Sales in Japan remained stable as therise in the yen affected sales to tourists and, to a certainextent, local customers. In emerging markets, sales wereup in the Asia Pacific region, with growth picking up pacein the second half of the year.
Revenue for Sport & Lifestyle activities was up 5.5% asreported. On a comparable basis, revenue growth cameto 9%, driven by brisk sales resulting from the actionplans implemented at PUMA which are delivering theexpected results.
The overall year-on-year increase in reported consolidatedrevenue includes a €25 million positive impact fromchanges in Group structure due to the divestments ofTretorn in June 2015 and Electric in March 2016.
Despite a stable US dollar and a stronger Japanese yen,exchange rate fluctuations and the decrease in value ofthe Group’s invoicing currencies against the euro had a€107 million adverse effect on revenue (including €66 milliondue to the depreciation of the pound sterling).
1.3. 2016 business review
Kering’s main financial indicators are as follows:
(in € millions) 2016 2015 Change
Revenue 12,384.9 11,584.2 +6.9%Recurring operating income 1,886.2 1,646.7 +14.5%
as a % of revenue 15.2% 14.2% +1.0 ptEBITDA 2,318.2 2,056.3 +12.7%
as a % of revenue 18.7% 17.8% +0.9 ptNet income attributable to owners of the parent 813.5 696.0 +16.9%
o / w continuing operations excluding non-recurring items 1,281.9 1,017.3 +26.0%
Gross operating investments (611.0) (672.1) -9.1%Free cash flow from operations 1,189.4 660.2 +80.2%
Total equity 11,963.9 11,623.1 +2.9%o / w attributable to owners of the parent 11,269.7 10,948.3 +2.9%
Net debt 4,370.7 4,679.4 -6.6%
Revenue
Consolidated revenue from continuing operations amounted to €12,385 million in 2016, up 6.9% on 2015 as reportedand 8.1% based on a comparable Group structure and exchange rates.
Reported Comparable(in € millions) 2016 2015 change change(1)
Luxury 8,469.4 7,865.3 +7.7% +7.8%Sport & Lifestyle 3,883.7 3,682.5 +5.5% +9.0%Corporate and other 31.8 36.4 - -
Total revenue 12,384.9 11,584.2 +6.9% +8.1%
(1) On a comparable Group structure and exchange rate basis.
5 FINANCIAL INFORMATION ~ ACTIVITY REPORT
224 Kering ~ 2016 Reference Document
05_A_VA_V4 04/04/2017 13:21 Page224

Quarterly revenue data
First Second Third Fourth Total(in € millions) quarter quarter quarter quarter 2016
Gucci 894.2 1,053.3 1,088.3 1,342.5 4,378.3Bottega Veneta 267.9 303.3 293.8 308.4 1,173.4Yves Saint Laurent 269.2 278.7 326.1 346.2 1,220.2Other Luxury brands 372.4 438.9 406.7 479.5 1,697.5
Luxury 1,803.7 2,074.2 2,114.9 2,476.6 8,469.4
PUMA 855.9 830.5 994.1 961.7 3,642.2Other Sport & Lifestyle brands 57.2 53.2 70.3 60.8 241.5
Sport & Lifestyle 913.1 883.7 1,064.4 1,022.5 3,883.7
Corporate and other 7.0 11.2 5.4 8.2 31.8
KERING TOTAL 2,723.8 2,969.1 3,184.7 3,507.3 12,384.9
First Second Third Fourth Total(in € millions) quarter quarter quarter quarter 2015
Gucci 869.0 1,005.2 924.1 1,099.7 3,898.0Bottega Veneta 290.0 339.2 324.0 332.6 1,285.8Yves Saint Laurent 211.4 231.7 243.4 287.1 973.6Other Luxury brands 383.6 431.9 397.0 495.4 1,707.9
Luxury 1,754.0 2,008.0 1,888.5 2,214.8 7,865.3
PUMA 825.0 776.2 918.2 884.0 3,403.4Other Sport & Lifestyle brands 65.0 64.8 81.4 67.9 279.1
Sport & Lifestyle 890.0 841.0 999.6 951.9 3,682.5
Corporate and other 7.2 12.3 7.1 9.8 36.4
KERING TOTAL 2,651.2 2,861.3 2,895.2 3,176.5 11,584.2
The differences in revenue growth levels between geographicregions were much less marked in 2016 than in 2015.
Comparable revenue growth was just as strong in maturemarkets (led by Western Europe) as in emerging markets.The Asia Pacific region (excluding Japan) accounted for
26% of total consolidated revenue in 2016 and postedcomparable-basis growth of almost 11%, led by theupswing seen in Mainland China.
Revenue generated outside the eurozone accounted for78% of the consolidated total in 2016.
Revenue by geographic area
Reported Comparable(in € millions) 2016 2015 change change(1)
Western Europe 3,885.9 3,562.4 +9.1% +11.4%North America 2,740.5 2,652.0 +3.3% +3.7%Japan 1,226.3 1,101.1 +11.4% -0.1%
Sub-total – mature markets 7,852.7 7,315.5 +7.3% +6.7%
Eastern Europe, Middle East and Africa 814.3 773.7 +5.2% +8.6%South and Central America 514.3 538.8 -4.5% +12.3%Asia Pacific (excluding Japan) 3,203.6 2,956.2 +8.4% +10.9%
Sub-total – emerging markets 4,532.2 4,268.7 +6.2% +10.7%
Total revenue 12,384.9 11,584.2 +6.9% +8.1%
(1) On a comparable Group structure and exchange rate basis.
5ACTIVITY REPORT ~ FINANCIAL INFORMATION
2252016 Reference Document ~ Kering
05_A_VA_V4 04/04/2017 13:21 Page225

The overall year-on-year increase in recurring operatingincome can be analysed as follows:
• consolidated gross margin for 2016 amounted to€7,790 million, up €715 million or 10.1% on the previousyear as reported, driven by growth in revenue and changesin the effective portion of currency hedges;
• operating expenses rose 8.8% or €476 million year-on-year on a reported basis, to €5,903 million. Thisincrease is primarily due to an increase in store network
operating costs linked to the expansion of the Yves SaintLaurent, Other Luxury brands and PUMA networks, as wellas capital expenditure in Gucci stores to re-energise thebrand. Spending on marketing and communicationalso increased overall with the aim of supporting thegrowth or recovery of the Group’s brands. During theyear, the Group exercised strong financial discipline torein in its cost base for other types of expenses.
First Second Third Fourth Full-year(Comparable change) (1) quarter quarter quarter quarter 2016
Gucci +3.1% +7.4% +17.0% +21.4% +12.7%Bottega Veneta -8.3% -9.8% -10.9% -8.6% -9.4%Yves Saint Laurent +26.5% +22.1% +33.9% +20.5% +25.5%Other Luxury brands -3.3% +2.9% +2.5% -3.0% -0.3%
Luxury +2.6% +5.2% +11.3% +11.3% +7.8%
PUMA +8.1% +13.2% +10.8% +9.8% +10.4%Other Sport & Lifestyle brands -7.1% -10.7% -7.7% -8.3% -8.4%
Sport & Lifestyle +7.0% +11.4% +9.3% +8.6% +9.0%
Corporate and other N / A N / A N / A N / A N / A
KERING TOTAL +4.0% +6.9% +10.5% +10.4% +8.1%
(1) On a comparable Group structure and exchange rate basis.
Recurring operating income
Kering’s recurring operating income amounted to €1,886 million in 2016, up 14.5% on 2015 as reported.
Consolidated recurring operating margin came to 15.2%, fuelled by Luxury activities whose recurring operating marginwidened by 1.2 points to 22.9%.
Recurring operating margin for the Group’s Sport & Lifestyle activities rose to 3.2%, up 60 basis points reflecting PUMA’shigher profitability.
(in € millions) 2016 2015 Change
Luxury 1,936.0 1,708.0 +13.3%Sport & Lifestyle 123.2 94.8 +30.0%Corporate and other (173.0) (156.1) -10.8%
Recurring operating income 1,886.2 1,646.7 +14.5%
5 FINANCIAL INFORMATION ~ ACTIVITY REPORT
226 Kering ~ 2016 Reference Document
05_A_VA_V4 04/04/2017 13:21 Page226

In 2016, the Group’s cost of net debt was just over€128 million.
This slight reduction compared with 2015 primarily stemmedfrom a decrease in the Group’s average outstanding netdebt as a result of favourable cash flow generation whichmore than offset the adverse effects of the changes inGroup structure that took place in 2015 and 2016.
The overall year-on-year improvement in cost of net debtwas mitigated by an adverse interest rate effect linked toa fall in average outstanding commercial paper. However,the increasing use of bonds has helped to extend thematurity of the Group’s debt in the current low interestrate environment.
“Other financial income and expenses” represented a netexpense of €74 million, down significantly on the€120 million net expense recorded for 2015. Thisconsiderable improvement was primarily due to the factthat in 2015 this item included the adverse impact of theineffective portion of the Luxury activities’ cash flowhedges whereas no such losses were recorded in 2016.
(See Note 10 – Finance costs (net), to the consolidatedfinancial statements).
Net finance costs
The Group’s net finance costs can be analysed as follows:
(in € millions) 2016 2015 Change
Cost of net debt (128.3) (128.8) -0.4%Other financial income and expenses (73.5) (120.3) -38.9%
Finance costs, net (201.8) (249.1) -19.0%
Other non-recurring operating income and expenses
Other non-recurring operating income and expensesconsist of unusual items that could distort the assessmentof each brand’s financial performance.
Other non-recurring operating income and expensesrepresented a net expense of €506 million in 2016 andprimarily comprised(i) manufacturing and commercialreorganisation costs, particularly for Luxury activities, and(ii) asset impairment losses, including a €297 millionwrite-down of Brioni’s and Ulysse Nardin’s brands andgoodwill. They also included operating losses recorded by Kering Eyewear, which was still in the ramp-up phasein 2016.
In 2015, the Group recorded a net €394 million expenseunder “Other non-recurring operating income andexpenses”, principally including restructuring costs and asset impairment losses (including write-downs of thegoodwill related to PUMA and one of the Other Luxurybrands as well as asset write-downs recorded by Gucci asa result of the brand’s transition). They also includeddisposal gains relating to the sale of the Tretorn brandand the sale of a property complex.
(See Note 9 – Other non-recurring operating income andexpenses, to the consolidated financial statements.)
EBITDA
At €2,318 million, consolidated EBITDA was 12.7% higher than in 2015, and the EBITDA margin widened by 0.9 of apercentage point to 18.7% from 17.8%.
(in € millions) 2016 2015 Change
Luxury 2,255.4 2,025.4 +11.4%Sport & Lifestyle 190.0 161.0 +18.0%Corporate and other (127.2) (130.1) +2.2%
EBITDA 2,318.2 2,056.3 +12.7%
(in € millions) 2016 2015 Change
Recurring operating income 1,886.2 1,646.7 +14.5%
Net recurring charges to depreciation, amortisationand provisions on non-current operating assets 432.0 409.6 +5.5%
EBITDA 2,318.2 2,056.3 +12.7%
5ACTIVITY REPORT ~ FINANCIAL INFORMATION
2272016 Reference Document ~ Kering
05_A_VA_V4 04/04/2017 13:21 Page227

Kering’s effective tax rate decreased to 25.1% in 2016from 32.0% in 2015 due to material permanent differencesrelating especially to non-recurring expenses, as well asthe combined effect of exchange rate fluctuations andcurrency hedges.
Adjusted for the effect of non-recurring items and the related taxes, the recurring tax rate contracted by 3.5 percentage points to 20.5%.
(See Note 11 – Income taxes, to the consolidatedfinancial statements).
Share in earnings (losses) of equity-accounted companies
At a negative €2 million in 2016, this item was on a parwith the previous year, and included the contribution ofWilderness, Tomas Maier, Altuzarra and two alligator farmsin the United States.
(See Note 20 – Investments in equity-accounted companies,to the consolidated financial statements).
Net income from continuing operations
Consolidated net income from continuing operationscame to €880 million in 2016 versus €680 million for theprevious year.
Attributable net income from continuing operationsamounted to €825 million compared with €655 millionin 2015.
Net income (loss) from discontinued operations
In 2016, the Group reported a €12 million net loss fromdiscontinued operations, which related to vendorwarranties granted in connection with prior-perioddisposals (mainly the sales of Redcats and Sergio Rossi).
(See Note 12 – Non-current assets held for sale anddiscontinued operations, to the consolidated financialstatements).
Net income attributable to non-controlling interests
Net income attributable to non-controlling intereststotalled €55 million in 2016 compared with €25 million in2015. This €30 million increase primarily reflects the risein PUMA’s net income compared with the previous year.
(See Note 15 – Non-controlling interests, to the consolidatedfinancial statements).
Net income attributable to owners of the parent
Net income attributable to owners of the parent amountedto €814 million in 2016 versus €696 million in 2015.
Adjusted for non-recurring items net of tax, attributablenet income from continuing operations advanced 26.1%to €1,282 million from €1,017 million in 2015.
Earnings per share
The weighted average number of Kering shares used tocalculate earnings per share was approximately 126 millionin 2016, virtually unchanged from the number used for 2015.
Earnings per share stood at €6.46 versus €5.52 for theprevious year.
Earnings per share from continuing operations totalled€6.55 in 2016, compared with €5.20 for 2015.
Excluding non-recurring items, earnings per share fromcontinuing operations amounted to €10.17, up 26.0% onthe 2015 figure.
(See Note 13 – Earnings per share, to the consolidatedfinancial statements).
Corporate income tax
The Group’s income tax charge breaks down as follows:
(in € millions) 2016 2015 Change
Tax on recurring income (345.3) (336.5) +2.6%Tax on non-recurring items 49.2 14.8 +232.4%
Total tax charge (296.1) (321.7) -8.0%
Effective tax rate 25.1% 32.0% -6.9 ptsRecurring tax rate 20.5% 24.0% -3.5 pts
5 FINANCIAL INFORMATION ~ ACTIVITY REPORT
228 Kering ~ 2016 Reference Document
05_A_VA_V4 04/04/2017 13:21 Page228

Following on from 2015 – a year marked by considerablegeopolitical and economic instability as well as highvolatility in both currency and stock markets, whichweighed on consumer spending for Luxury Goods – 2016did not see any significant upturn in the relevant market inwhich the Kering group’s Luxury brands operate. Accordingto the Bain Altagamma research survey, this marketnarrowed by 1% on a reported basis and was stable atconstant exchange rates.
The world’s major currencies were much less volatile in 2016than in 2015, leading to a virtual alignment of reportedgrowth and growth at constant exchange rates for theyear as a whole. The yen strengthened during 2016 –mainly in the first half – and the US dollar rose sharplytowards the end of the year. Conversely, sterling slumpedin late June following the Brexit referendum result andthe Chinese yuan continued to steadily trend downwardsthroughout the course of 2016.
In addition, in line with the trends observed in the lastquarter of 2015, there were less pronounced differencesin growth levels between geographic regions comparedwith the highly mixed picture seen in the first ninemonths of 2015.
In Western Europe, sales continued to rise in 2016, but ata much slower pace than in 2015, reflecting the fact thatalthough domestic demand picked up in the region,lower tourist numbers during the period had an adverseeffect on in-store footfall. This gave rise to a particularlyunfavourable basis of comparison with 2015 as touristpurchases in Western Europe increased sharply in thatyear, especially in the first half. A combination of factorswas responsible for the year-on-year decrease in tourism,with the main reason being the fear of terrorism,although there were signs of tourist levels picking up inthe fourth quarter of 2016. According to data publishedby Global Blue, sales to tourists in Europe fell 7% during2016, with a 17% drop in France.
Based on Bain Altagamma’s data, the Japanese marketcontracted in 2016 at constant exchange rates. This wasdue to the impact of the stronger yen, which pushed
down sales to tourists (mainly from China) and ledJapanese customers to redirect a portion of theirpurchases to other Asian countries or Europe.
In North America, the lacklustre market conditionsexperienced in the last quarter of 2015 continuedthroughout 2016, reflecting both lower tourist numbersas a result of the stronger dollar and American consumers’wait-and-see attitude (particularly because 2016 was aUS presidential election year).
In the Asia Pacific region (excluding Japan) the marketrecovered overall in 2016 despite another revenue declinein the first quarter. This improvement was spurred bysales trends in Mainland China, with China’s main citiesreporting the most significant progress, thanks partly tothe measures adopted by the Chinese government tostimulate domestic consumer spending (although thishad the knock-on effect of slowing down sales to Chinesetourists in Europe and Japan). Conversely, the marketenvironment remained very morose throughout 2016 inHong Kong and, to a lesser extent, Macao, although thefigures for the fourth quarter showed signs of a levellingoff. For the other countries in the Asia Pacific region(notably South Korea), overall business was once againbuoyed by high tourist numbers and strong levels of localconsumer spending.
Against this complex and volatile operating backdrop, theGroup’s Luxury activities nevertheless delivered veryrobust sales growth, and as a whole once again outperformedthe market, just as they did in 2015.
Overall revenue generated by Luxury activities totalled€8,469 million in 2016, up 7.7% as reported and 7.8% on acomparable Group structure and exchange rate basis. Therewere no changes in Group structure that affected Luxuryactivities in 2016.
Comparable-basis growth picked up pace in the secondhalf of the year, coming in at 11.3% (versus 4.0% in the firsthalf), with the increases evenly balanced between thefirst and second quarters.
1.4. Analysis of operating performances by brand
Luxury activities
(in € millions) 2016 2015 Change
Revenue 8,469.4 7,865.3 +7.7%Recurring operating income 1,936.0 1,708.0 +13.3%
as a % of revenue 22.9% 21.7% +1.2 ptEBITDA 2,255.4 2,025.4 +11.4%
as a % of revenue 26.6% 25.8% +0.8 pt
Gross operating investments 380.6 390.9 -2.6%
Average FTE headcount 21,559 21,576 -0.1%
5ACTIVITY REPORT ~ FINANCIAL INFORMATION
2292016 Reference Document ~ Kering
05_A_VA_V4 04/04/2017 13:21 Page229

Gucci contributed some 52% of Luxury activities’ totalrevenue in 2016, returning to the same proportion as in2014. Bottega Veneta and Yves Saint Laurent togetheraccounted for over 28% of the total, practicallyunchanged from 2015, and are now almost equal withone another in terms of their revenue weighting.
Retail sales in directly operated stores and online rose bya very robust 10.3% on a comparable basis, driven by afaster pace of growth in the second half and particularlyin the fourth quarter. The fourth-quarter rise came to17.6% and was led by excellent in-store sales momentumfor Gucci. Directly operated stores accounted for 72.3% oftotal revenue reported by Luxury activities in 2016, versus70.6% in 2015. This stability reflects the strategyimplemented by all of the Luxury brands to control theirdistribution more effectively and reinforce their exclusivity,as well as measures taken to prudently manage theexpansion of the directly operated store network. It alsoillustrates the Group’s objective of retaining and, whereappropriate, developing, a network of high-qualitywholesalers for certain brands and product categoriesand in certain regions.
Wholesale sales were 2.4% higher than in 2015 based oncomparable data, despite being weighed down by a 4.1%comparable-basis decrease in the fourth quarter. Thisfourth-quarter contraction was not, however, due to adecline in orders but rather adjustments to deliveryschedules which resulted in some sales being postponedto 2017. Performance for this distribution channel wasmixed across the Group’s different geographic regions,with very buoyant sales momentum in Western Europebut revenue for North America hampered by lower saleslevels in US department stores.
Other revenues (including royalties) were more or lessstable compared with 2015, reflecting much weakershowings by Gucci’s two main license holders (for theEyewear and Perfume & Cosmetics product categories).
By product category, overall revenue generated by theGroup’s Luxury activities is becoming increasingly balanced,reflecting the complementarity of the brands in the portfolio.Leather Goods, Ready-to-Wear and Shoes contributed 52%,16% and 14% to 2016 revenue respectively and reportedvery solid revenue increases for the year. Watches &Jewelry accounted for around 9% of overall revenue butcontinued to be held back by the sluggish timepiecesmarket. Other product categories generally posted sustainedgrowth, particularly thanks to the performance of categoriesin which Gucci has renewed its offering (scarves, ties andchildren’s wear).
After a 3.7% comparable-basis sales decline in emergingmarkets in 2015, revenue growth in 2016 was morebalanced between mature and emerging markets, whichsaw a recovery in business levels. The overall year-on-year increases came to 6.5% for mature markets (whichaccounted for 62.8% of total Luxury activities sales) and10.1% for emerging markets.
Western Europe (which made up 32.9% of Luxury activitiesrevenue) posted a strong 10.7% rise on a comparablebasis, driven by steadily increasing sales to local customersand the renewed appeal of the Gucci brand which wasonly marginally affected by the lower number of touristsduring the year.
In Japan, after three years of increases and a robust first-half, sales generated by Luxury activities were stable in 2016overall as performance in the second half of the year washit by the decrease in sales to Chinese tourists and thefact that Japanese consumers moved some of theirpurchases to other Asian countries.
In North America (19.3% of total revenue), sales were up 3.5%year-on-year on a comparable basis. The unfavourableconsumer spending environment (caused by the factorsdescribed above) primarily affected the wholesale distributionchannel as the main wholesalers were particularlyprudent in terms of purchase volumes and continued toimplement an aggressive policy of promotional offers.Directly operated stores turned in a more dynamic showing,fuelled by sales growth for Gucci and Yves Saint Laurent.
In emerging markets, comparable-basis sales were up10.9% in the Asia Pacific region (excluding Japan), withthe second half of the year seeing a marked acceleration.Except for Hong Kong and Taiwan, all of the key marketsin this region reported very solid sales increases. InMainland China, revenue jumped 15.4% year-on-year,spurred by the success of Gucci’s collections amongst itsChinese customers. Sales momentum was also veryrobust in South Korea, which is the region’s third-largestmarket in terms of size.
In the Luxury activities’ other emerging markets salesgrowth was extremely buoyant, especially in LatinAmerica (partly to the detriment of the United States) andin the Middle East.
Recurring operating income for the Group’s Luxury activitiesamounted to €1,936 million in 2016, up 13.3% as reported,and recurring operating margin widened by 120 basispoints as reported to 22.9%. The year-on-year increase inprofitability reflects the impact of exchange rate fluctuationsand currency hedges, which pushed up recurring operatingmargin slightly in 2016 whereas they had a significantdilutive effect in 2015. Taking advantage of this favourablesituation, a number of the Luxury brands took thedeliberate decision to increase some of their operatingexpenses with a view to driving their growth momentum,while strictly containing other components of their costbases. For the two brands that posted the highest growthrates – i.e. Gucci and Yves Saint Laurent – this resulted ina significant improvement in their reported recurringoperating margin figures.
The increase in recurring operating income was morepronounced in the second half of the year (up approximately21.5% compared with 4.2% in the first half) and the positiveoperational leverage effect – mainly stemming from Gucci’s
5 FINANCIAL INFORMATION ~ ACTIVITY REPORT
230 Kering ~ 2016 Reference Document
05_A_VA_V4 04/04/2017 13:21 Page230

In 2016, numerous indicators – both qualitative andquantitative – confirmed that Gucci’s new impetus ispicking up pace and that the strategic initiatives decidedand launched in 2015 are paying off. A particular turningpoint for the brand was the first collection entirelydesigned by Alessandro Michele (the 2016 Cruisecollection presented in June 2015).
Going forward, Gucci’s growth trajectory is set to continue,propelled by the rollout of numerous action plans by thebrand’s teams under the leadership of Marco Bizzarri, itsPresident and CEO.
The main highlights of 2016 were as follows:
• the fashion shows and collections presented by thebrand during the year were once again extremely wellreceived. Alessandro Michele’s talent and creativity areno longer just recognised by fashion experts but arealso appreciated by a much wider audience;
• after the changes introduced in 2015 in order to craft anew aesthetic for the brand and clarify its positioning,in 2016 the product offering continued to evolve, withthe main product categories revisited and rethoughtaccordingly. The brand’s merchandising teams workedhard to maximise the growth potential of each productcategory by constantly adapting the product offer. Theoverall process to rework the brand’s offering in line withits new aesthetic will be completed in 2017;
• the ramp-up programme for the new store conceptwas continued, with some 50 stores developed aroundor converted to the concept during the year;
• the brand’s new image was also relayed through in-storeevents, measures to further enhance the customerexperience, and the launch of more consistent andbetter targeted communication campaigns. The resourcesallocated to these initiatives were stepped up in 2016 andwere extended to incorporate a greater number of stores;
• the brand’s new online platform, Gucci.com – whichwas launched in the United States in 2015 – wasdeployed in other key markets in 2016, including WesternEurope. Thanks to the platform’s enriched content andmore user-friendly design, it is helping to speed up thebrand’s online growth.
In addition to the impact on revenue of Alessandro Michele’snow widely recognised talent, the above successesresulted in higher footfall in the brand’s stores and agreater number of online visitors, as well as an increase instore productivity.
Gucci posted €4,378 million in revenue in 2016, up 12.3%on 2015 as reported and 12.7% at comparable exchangerates. After a 5.4% comparable-basis increase in the firstsix months of the year, revenue rose at an even faster pacein the second half, with growth reaching 19.4% on theback of brisker sales momentum in Gucci’s store network.
Retail sales generated in directly operated stores accountedfor 83.3% of the brand’s total revenue in 2016 versus81.8% in 2015 (as reported). At constant exchange rates,sales from this distribution channel increased 14.8% year-on-year, fuelled by higher footfall and improvedproductivity in the brand’s stores. Growth accelerated inthe second half, reaching 28.2% in the final quarter. This
Gucci
(in € millions) 2016 2015 Change
Revenue 4,378.3 3,898.0 +12.3%Recurring operating income 1,256.3 1,032.3 +21.7%
as a % of revenue 28.7% 26.5% +2.2 ptsEBITDA 1,424.5 1,206.1 +18.1%
as a % of revenue 32.5% 30.9% +1.6 pts
Gross operating investments 184.7 192.8 -4.2%
Average FTE headcount 10,253 10,570 -3.0%
sales growth – led to a 190 basis-point rise in recurringoperating margin (versus 30 basis points in the first half).
EBITDA climbed 11.4% year-on-year to €2,255 millionand EBITDA margin widened significantly to 26.6%.
Luxury activities’ gross operating investments totalled€381 million in 2016, €10 million (or 2.6%) lower than in2015, reflecting the Group’s focus on achieving organicgrowth on a same-store basis and on consolidating theexisting store network. This strategy of tightly controllingcapital expenditure was one of the financial objectivesset for Luxury activities for 2016. As a proportion of
revenue, gross operating investments represented 4.5%in 2016 versus 5.0% in 2015.
As of December 31, 2016, Luxury activities had a networkof 1,305 directly operated stores, including 799 (61%) inmature markets and 506 in emerging markets. Net storeadditions during the year totalled 41, compared with 78in 2015. The stores added in 2016 were mainly due tonetwork expansions, primarily for Yves Saint Laurent (anet increase of 17 stores) and, to a lesser extent, forBalenciaga and Stella McCartney.
5ACTIVITY REPORT ~ FINANCIAL INFORMATION
2312016 Reference Document ~ Kering
05_A_VA_V4 04/04/2017 13:21 Page231
very robust sales performance was particularly healthy inview of the fact that it was less dependent on promotionalcampaigns than in 2015. The brand’s drastic revision ofits sales promotion policy notably affected fourth-quarter figures, further underscoring the success of itsnon-sale items, which were mainly from new collections.The proportion of revenue generated by new collectionswas over 85% in the last quarter of 2016 versus some50% in the first quarter.
In the brand’s mature markets, the year-on-year increasein revenue generated in directly operated stores wasmost pronounced in Western Europe, which accountedfor 25.2% of the brand’s total retail sales and postedcomparable-basis growth of 28.7%. Gucci’s brandrepositioning and clear focus on creativity – particularlyfor women’s ready-to-wear collections – have provedvery successful with its European clientele and have ledto a broader and younger customer base. This hasboosted spending by domestic customers and fuelledrenewed appeal for the brand with tourists, making it oneof the most purchased brands for visitors to Europe.
In Japan (which contributed 11.5% of Gucci’s retailrevenue), sales in directly operated stores rose 0.5% on acomparable basis. As was the case for the industry as awhole, the brand felt the adverse effects of the country’slower tourist numbers and the fact that Japanesecustomers made some of their purchases in other regions.In addition, it would appear that Gucci’s traditionalcustomers in Japan are taking longer than Europeancustomers to come to terms with the brand’s new artisticdirection. Several communication and merchandisingcampaigns launched during 2016 in order to speed upthe transition process helped to reverse the trendtowards the year-end, and in the fourth quarter sales inJapanese stores climbed 5.2%.
In North America (which represents 20.7% of the brand’sretail revenue), comparable-basis sales advanced 8.7%,with period-on-period increases throughout the year.Gucci’s turnaround in this region began in the latter partof the second quarter, and sales surged nearly 20% in thesecond half of the year after negative growth reported forthe first six months.
In emerging markets (42.7% of sales in directly operatedstores), after an overall decline in 2015, revenue generatedby this distribution channel returned to growth at constantexchange rates in 2016, with the year-on-year increasecoming in at 15.0%, slightly higher than the growth ratefor the brand’s mature markets. Growth in the Asia Pacificregion (excluding Japan) came to 15.6%, spurred by anexcellent performance in Mainland China where revenue
jumped 17.5% as the brand capitalised on its renewedappeal and felt the full effect of the luxury industry’srecovery. Sales volumes in the region’s other countriesrose sharply, except in Taiwan, Hong Kong and Macao(although trends in Hong Kong and Macao were morefavourable in the fourth quarter).
Gucci’s revenue in other emerging markets was higher overallthan in 2015, with growth rates of close to or above 10%.
All of the brand’s main product categories contributed tothe sales increase in directly operated stores in 2016.
Ready-to-Wear was the first product category to see thereplacement of older styles by Alessandro Michele’s newcollections and this category posted another sharp salesrise in 2016. The main growth driver was women’s lines buttrends for men’s ready-to-wear were also positive andsales of these lines are expected to be further boosted bythe measures taken to broaden the product offering.
For Leather Goods, the work on redesigning the productoffer and replacing the old collections was completed forthe handbag offering in 2016. New lines were successfullyintroduced and their sales are rising significantly. Thedesigns of small leather goods and luggage collections werereworked later on in the brand’s transformation processand sales figures for these items were still hampered bythe underperformance of old collections.
The Shoes category saw excellent sales momentum in 2016,owing much to the new lines presented each seasonsince the 2016 Cruise collection.
Overall, sales of Leather Goods, Shoes and Ready-to-Wearaccounted for 54.9%, 16.8% and 12.5% respectively of thebrand’s total revenue for the year (from both the retailand wholesale channels).
Sales generated in the wholesale network climbed 5.7%on a comparable basis. This year-on-year growth is basedon an almost constant number of distributors after thedrastic streamlining phase that had a very adverse effect onsales figures for 2015. Overall growth for this distributionchannel was weighed down in 2016 by the Watchescategory, which was in a repositioning phase anddelivered a weak performance during the year. ExcludingWatches, revenue generated with the wholesale networksaw double-digit growth, despite postponements ofdeliveries for the Cruise collection in the last quarter of theyear. These trends reflect how well Gucci’s transformationprocess has been received by distributors and the brand’sensuing market share gains.
Conversely, royalties were 17.4% lower than in 2015 asthe revenue generated from the Gucci brand was down
5 FINANCIAL INFORMATION ~ ACTIVITY REPORT
232 Kering ~ 2016 Reference Document
05_A_VA_V4 04/04/2017 13:21 Page232

Bottega Veneta’s positioning and its exposure to Asianclienteles mean that it is particularly sensitive to changesin the economic environment and currency fluctuations,which widen price differences between regions andcreate volatility in tourist numbers. As a result, the brand’sbusiness slowed in 2015, with a revenue contraction inthe fourth quarter of the year which continued throughoutthe course of 2016.
Going forward, as well as facing the challenges of itsoperating environment, Bottega Veneta needs to adaptits organisational structure and strategy in order to createthe right conditions for a new phase of sustainablegrowth. In 2016, the brand’s teams therefore put in placeaction plans aimed at re-energising the leather goodsoffering, continuing to develop other product categories,guaranteeing the brand’s exclusivity by optimisingdistribution, and increasing the brand’s penetration withlocal customers in mature markets through more
effective communications. The initial positive effects ofthese measures have not yet been sufficient to offset theoverall downward trend in sales. In 2017, Bottega Venetaintends to continue to invest in re-energising the brand’sperformance, notably by stepping up the measuresalready in place.
Bottega Veneta posted revenue of €1,173 million in 2016,down 8.7% as reported and 9.4% based on comparable data.
With a view to preserving its high-end positioning andexclusivity, Bottega Veneta’s preferred distributionchannel is its directly operated stores, which accountedfor 81.8% of the brand’s total sales in 2016. Revenuegenerated in directly operated stores retreated 8.7% in2016 based on comparable data but the decrease wasless pronounced in the second half of the year thanks tobetter trends in many geographic regions and a morefavourable basis of comparison in the final quarter.
Bottega Veneta
(in € millions) 2016 2015 Change
Revenue 1,173.4 1,285.8 -8.7%Recurring operating income 297.4 374.5 -20.6%
as a % of revenue 25.3% 29.1% -3.8 ptsEBITDA 341.7 413.8 -17.4%
as a % of revenue 29.1% 32.2% -3.1 pts
Gross operating investments 42.8 49.5 -13.5%
Average FTE headcount 3,417 3,401 +0.5%
sharply for its two main license-holders. In the Perfumeand Cosmetics category, Coty’s purchase of Procter &Gamble Prestige in October 2016 – more than one year afterthe deal was originally announced – led to the postponementof product launches and product-based events. And inthe Eyewear category, 2016 was a transition year beforethe transfer of Safilo’s license to Kering Eyewear onJanuary 1, 2017.
Gucci’s recurring operating income increased by 21.7% ona reported basis in 2016, coming in at €1,256 million, andits recurring operating margin widened by 220 basispoints to 28.7%. After the very dilutive effect of currencyhedges in 2015, the impact of exchange rate fluctuationsand currency hedges was low during 2016, but a proportionof this positive swing was offset by a relative increase incertain operating expenses. However, this increase wasmostly for expenses required to re-energise the brand,and other expense items continued to be tightly controlled.The excellent sales momentum in the fourth quartermade a significant contribution to the improvement inthe brand’s profitability in 2016 as it created a favourableoperational leverage effect.
EBITDA amounted to €1,425 million in 2016 and theEBITDA margin remained very high, at 32.5% of revenue.
As of December 31, 2016, Gucci operated 520 storesdirectly, including 216 in emerging markets. A net 5 storeswere closed during the year, giving the brand an overallnetwork more adapted to its operations in terms of storenumbers. As it does not consider that aggressivelyexpanding the store network is the right strategy intoday’s operating environment in the luxury industry, thebrand’s current focus is on increasing its organic growth.
Gucci’s gross operating investments totalled €185 millionin 2016, down 4.2% on 2015. This year-on-year decreasereflects the brand’s prudent approach to new storeopenings, as mentioned above, and its strategy ofallocating resources in priority to financing inventories inorder to support the upturn in the brand’s sales. Thefigure for 2016 includes the refurbishment programmeaimed at introducing the new store concept at thebrand’s most strategic stores. Gucci had set itself the goalof bringing the total number of stores with the newconcept to 80 by the end of 2016. This objective wasreached as 86 stores sporting the brand’s new aestheticwere either newly-opened or refurbished during 2015and 2016. The objective of keeping investments belowthe threshold of 5% of revenue was also met, as netoperating investments represented 4.2% of sales.
5ACTIVITY REPORT ~ FINANCIAL INFORMATION
2332016 Reference Document ~ Kering
05_A_VA_V4 04/04/2017 13:21 Page233

In Western Europe, direct retail sales fell 16.7% as in-store revenue was heavily affected by lower touristnumbers, despite an improvement in the final quarter.The French market alone accounted for over half of thesales decline, whereas the UK recorded double-digitrevenue growth.
In North America, the wait-and-see attitude of USconsumers, the impact of the strong dollar on tourists’purchasing power and the aggressive promotionalstrategies adopted by department stores all weighed onthe revenue derived from directly operated stores, whichcame in 17.4% lower than in 2015 on a comparable basis.
In Japan, the downward trends seen in the first quarter of 2016 continued into the rest of the year due to a decreasein purchases by Chinese tourists. Consequently, sales inJapan were down 15.0% for the full twelve months.
In emerging markets (which accounted for 44.1% of thebrand’s total revenue generated in directly operatedstores), Bottega Veneta’s direct sales were up 3.1% year-on-year on a comparable basis. The upswing in businesswas mainly attributable to Chinese customers making theirpurchases in the domestic market and certain regionalAsia Pacific markets rather than in mature markets. Thisled to solid growth in South Korea and Mainland China,but market conditions remained challenging in HongKong, where the brand’s performances were particularlyaffected by the change in customer profile in view ofBottega Veneta’s high-end price positioning.
Sales generated in the wholesale network contracted12.9% in 2016. Bottega Veneta continued to reorganisethis distribution channel during the year with the aims ofavoiding the risk of saturation in points of sale and onlyworking with the highest-quality partners. These measuresled the brand to deliberately limit delivery volumesthroughout the year, and particularly in the second half.
Leather Goods once again constituted the brand’s corebusiness, making up 86.1% of total sales in 2016. BottegaVeneta is currently paying particular attention toincreasing customer engagement for its handbagoffering, by creating seasonal variations of its iconicpieces as well as introducing new product references,notably by incorporating new techniques and materials.
However, the revenue growth generated thanks to thesenew styles was not yet sufficient to offset the significantdecline in sales of a number of the brand’s traditional lines.
Following on from 2015 when the brand reinforced itscreative teams in charge of diversification, in 2016Bottega Veneta pursued its strategy of developing itsShoes category by adapting the number of productreferences proposed, ensuring that its offering is of thehighest quality and increasing the space dedicated to thisproduct category in its stores. The Shoes category nowaccounts for 7.1% of Bottega Veneta’s total sales andregistered very robust sales growth during the year.
Bottega Veneta’s recurring operating income for 2016totalled €297 million, down €77 million on 2015. Recurringoperating margin came in at 25.3%, representing a 380basis-point decrease in reported sales. Profitability wasboosted during the year by more favourable effects ofexchange rate fluctuations and currency hedges than in2015 but suffered the significant adverse effect of anincrease in the ratio of operating expenses to revenue.The rise in this ratio was due to the fact that the cost basewas not reduced during the year in proportion to thecontraction in gross margin caused by the lower salesfigures. However, the brand’s situation in terms ofoperating expenses should be analysed in view of all ofthe initiatives put in place to enable Bottega Veneta toenter a new phase in its development and ensure that itis in a position to get back on the growth track after thetransition phase it is currently undergoing.
EBITDA totalled €342 million and the EBITDA marginnarrowed by 310 basis points to 29.1% – a level that isnonetheless very high for the industry.
In order to enable it to focus its action plans on achievingorganic growth, as from 2015 the brand decided tostabilise and restructure its directly owned store network.As of December 31, 2016, Bottega Veneta had 255directly operated stores, including 111 in emergingmarkets. There were 4 net store additions during the year,versus 15 in 2015.
Gross operating investments decreased by €7 million (or13.5%) year-on-year to €43 million in 2016, reflecting thebrand’s prudent approach to new projects.
5 FINANCIAL INFORMATION ~ ACTIVITY REPORT
234 Kering ~ 2016 Reference Document
05_A_VA_V4 04/04/2017 13:21 Page234

On April 4, 2016, Yves Saint Laurent and Kering announcedthe appointment of Anthony Vaccarello as CreativeDirector of Yves Saint Laurent, replacing Hedi Slimane.
Over recent years, Hedi Slimane was without question thecreative force behind Yves Saint Laurent’s exceptionalgrowth, but the brand also owes its success to the qualityof its teams working alongside the Creative Director andthe President and CEO, Francesca Bellettini. The MaisonYves Saint Laurent therefore has solid foundations todrive the brand’s continued growth going forward.
Against this backdrop, 2016 was another year of excellentgrowth momentum, with Yves Saint Laurent becomingthe Group’s second-largest Luxury brand in terms ofrevenue. Yves Saint Laurent’s 2016 revenue figure toppedthe one billion mark, coming in at €1,220 million andrepresenting a year-on-year increase of 25.3% as reportedand 25.5% at comparable exchange rates. Despite a highbasis of comparison, the brand’s growth for 2016 wasvery close to the 25.8% rate recorded for 2015. Inaddition, growth was relatively even between the two halvesof the year in 2016, amounting to 24.2% and 26.6%respectively.
The investments undertaken for the directly operatedstore network over the past four years have enabled YvesSaint Laurent to increase the portion of sales generatedthrough this exclusive distribution channel, whichaccounted for 68% of the brand’s total sales in 2016,compared with 64% in 2015. Revenue from retail sales indirectly operated stores soared 32.4% on a comparablebasis during 2016, led by a very strong increase in same-store sales. This performance reflects both the brand’seffective strategy of allocating and restocking itemswithin the store network as well as the excellence of itsteams’ in-store management.
Wholesale sales advanced 12.0% based on comparabledata for the full twelve months of 2016, with the majorityof the brand’s operating countries contributing to thisrobust increase. However, sales for this distribution channeldeclined in the fourth quarter, due to changes in thedelivery schedule for the first collection entirely designedby Antony Vaccarello (Summer 2017), which was deliveredin January 2017 as decided at the time of the Pilati-Slimane transition. The wholesale channel is still obviouslystrategically important for Yves Saint Laurent as itrepresents a perfect fit with its retail business.
The measures put in place since 2014 to align theperformances of licensed product categories began topay off in 2016, with revenue from royalties climbing 20%year-on-year.
All of Yves Saint Laurent’s main product categoriesregistered very strong sales growth again in 2016.
The Leather Goods offering – which the brand strives toconstantly renew and refresh, with a dedicated creativeteam – remained highly popular, both with long-standingand new customers. Sales posted by this categoryjumped 37.3% at constant exchange rates.
Revenue from Ready-to-Wear sales advanced 23.5% atconstant exchange rates and this category once againoccupied an essential place in the brand’s productoffering, with a balanced weighting of sales betweenwomen’s and men’s collections.
The brand’s third leading product category – Shoes,whose performance is closely correlated with growth inthe wholesale distribution channel – also reported arobust sales rise.
Yves Saint Laurent notched up revenue increases acrossall of its geographic regions in 2016.
In emerging markets – which contributed 30.1% to thebrand’s total revenue – sales growth came to 32.5%. Inthe Asia Pacific region (excluding Japan) – whichaccounted for three quarters of the brand’s sales inemerging markets – growth was extremely strong in YvesSaint Laurent’s main markets, especially in MainlandChina where the brand is particularly well known andsought after. Sales also rose strongly in the Middle Eastand growth was very brisk in Latin America.
Sales in Yves Saint Laurent’s traditional markets rose22.8% on a comparable basis, propelled by highernumbers of local customers and increased customerloyalty, as well as by the brand’s strong appeal amongsttourists (despite generally lower numbers of touristsduring the year). Growth rates were very even from oneregion to another, ranging from 21.6% for North Americato 23.6% for Western Europe.
Yves Saint Laurent
(in € millions) 2016 2015 Change
Revenue 1,220.2 973.6 +25.3%Recurring operating income 268.5 168.5 +59.3%
as a % of revenue 22.0% 17.3% +4.7 ptsEBITDA 312.2 207.9 +50.2%
as a % of revenue 25.6% 21.4% +4.2 pts
Gross operating investments 57.8 63.1 -8.4%
Average FTE headcount 2,204 1,943 +13.4%
5ACTIVITY REPORT ~ FINANCIAL INFORMATION
2352016 Reference Document ~ Kering
05_A_VA_V4 04/04/2017 13:21 Page235

Total revenue generated by Other Luxury brands in 2016amounted to €1,698 million, down by a slight 0.6% on 2015as reported. At comparable exchange rates, revenue wasmore or less stable year-on-year, edging down just 0.3%.
There were no changes in Group structure that affectedOther Luxury brands during 2016.
Other Luxury brands contributed some 20% of Luxuryactivities’ total revenue in 2016.
The Couture & Leather Goods brands posted satisfactoryrevenue growth despite a negative contribution from Brioni,which is currently in the process of restructuring itsmanufacturing base and distribution networks. Sales ofWatches & Jewelry brands continued to be weighed downby the weak timepieces market.
In 2016, the wholesale network was once again the maindistribution channel for Other Luxury brands, accountingfor 54.4% of sales. This proportion reflects the differing stagesof development of the Couture & Leather Goods brands aswell as the specific distribution characteristics for Watches &Jewelry. Sales generated in the wholesale network increased1.2% year-on-year on a comparable basis, primarilydriven by good performances from Stella McCartney andBalenciaga as well as by robust growth for the Jewelrybrands. However, wholesale sales were generally adverselyaffected by the prudent strategies adopted by USwholesalers in view of the wait-and-see attitude of USconsumers and lower numbers of tourists.
Retail sales in directly operated stores retreated 1.4%based on comparable data. This year-on-year decline wasmainly due to lower revenue recorded in the UnitedStates and in the eurozone – particularly in France which
is the third-largest market for Other Luxury brands – aswell as a high base of comparison with 2015. The UKbrands held up the best, registering very solid salesgrowth in directly operated stores. Trends were alsopositive for Balenciaga in the second half of the year.
Ready-to-Wear remained the best-selling productcategory, making up 29.6% of total Other Luxury brandsrevenue. Sales of women’s collections in this categorycontinued to rise, but men’s collections saw more mixedperformances across the various brands. Watches &Jewelry represented the second-largest revenue generator,contributing 28.3% to the total, but as was the case in2015, this category saw contrasting trends during theyear between its different segments (year-on-year growthfor jewelry, volatility for high jewelry, which is inherent inthis segment, and a contraction for watches). Shoesposted the highest revenue growth amongst Other Luxurybrands for 2016.
Other Luxury brands saw mixed performances acrossgeographic regions during 2016, but the trends wereinverted compared with 2015, with emerging marketsregistering 2.2% comparable-basis growth (following adecline in 2015) whereas overall revenue in maturemarkets inched down 1.2%.
Revenue growth in emerging markets was fuelled by salesrecoveries in Mainland China and South Korea. Meanwhile,although sales contracted in Hong Kong the decreasewas very contained.
In mature markets (which accounted for 72.1% of totalrevenue generated by Other Luxury brands), sales rosebriskly in Japan thanks to a good level of brand penetrationin the domestic market. However, after an excellent year
Other Luxury brands
(in € millions) 2016 2015 Change
Revenue 1,697.5 1,707.9 -0.6%Recurring operating income 113.8 132.7 -14.2%
as a % of revenue 6.7% 7.8% -1.1 ptEBITDA 177.0 197.6 -10.4%
as a % of revenue 10.4% 11.6% -1.2 pt
Gross operating investments 95.3 85.5 +11.5%
Average FTE headcount 5,685 5,662 +0.4%
Yves Saint Laurent ended 2016 with recurring operatingincome of €269 million, versus €169 million in 2015,representing a year-on-year increase of 59.3%. Recurringoperating margin passed the 20% mark for the first time,increasing by 470 basis points as reported to 22% andreflecting how the brand has now attained a size thatenhances the positive impact of its operating leverage.
EBITDA rose by €104 million to €312 million in 2016 andthe EBITDA margin approached the brand’s record levelof 26%.
As of December 31, 2016, the Yves Saint Laurent branddirectly operated 159 stores, including 70 in emergingmarkets. There were 17 net store openings during the year,including flagship stores in strategic countries or citieswhere the brand was not yet present and a high numberof concessions in department stores.
Overall, the brand’s gross operating investments werecontained in 2016, amounting to €58 million whichrepresents a €5 million decrease compared with 2015. Thisprudent investment strategy, combined with the increasein EBITDA, contributed to a significant improvement inthe brand’s free cash flow generation.
5 FINANCIAL INFORMATION ~ ACTIVITY REPORT
236 Kering ~ 2016 Reference Document
05_A_VA_V4 04/04/2017 13:21 Page236

in 2015, Western Europe reported a modest revenue riseduring 2016 reflecting lower sales in France, althoughthis effect was partly offset by some customers makingtheir purchases in the UK. Lastly, performance in NorthAmerica was adversely affected by lacklustre wholesalesales in the US.
Recurring operating income for Other Luxury brands wasdown 14.2% year-on-year at €114 million in 2016 andrecurring operating margin narrowed by 110 basis pointsto 6.7%, although the decline was more pronounced inthe first six months of the year than in the second half.The majority of the Group’s Other Luxury brands are at astage in their development when they still need sustainedreinforcement of their teams and structures. For thosewith more moderate sales growth, this resulted in lowerrecurring operating margins. At the same time, theWatches brands continued to be weighed down by thedrops in gross margin they suffered in 2015 due to thesharp rise in the Swiss franc and persistently unsettledmarket conditions.
EBITDA came in at €177 million, down 10.4% on 2015,and EBITDA margin remained above 10%.
The network of directly operated stores owned by OtherLuxury brands totalled 371 units as of December 31, 2016,including 262 in mature markets and 109 in emergingmarkets. Altogether, there were 25 net store additionsduring the year.
The Group’s Other Luxury brands adopted a strict andhighly selective capital expenditure strategy in 2016 andsought to reduce their gross operating investments. OnlyBrioni had a higher capital outlay for the year, due to therelocation of two of its flagship stores (in Paris and NewYork). Overall gross operating investments for OtherLuxury brands amounted to €95 million, representing a€10 million increase compared with 2015.
Other Luxury brands performed as follows in 2016,beginning with Couture & Leather Goods brands:
In line with 2015, Alexander McQueen posted very strongsales growth in directly operated stores. The brand’swholesale sales also delivered a good showing, especiallyin the second half of the year, led by the success of Fall-Winter collections and new store openings. Theseperformances drove a year-on-year increase in recurringoperating margin.
The McQ brand – which is positioned in the accessible luxurysegment – reported a solid sales increase and its recurringoperating margin was once again very satisfactory.
2016 was another year of growth for Balenciaga, whosecollections designed by Demna Gvasalia – the brand’sArtistic Director since October 2015 – have been verywarmly received by both the press and customers. Thisreworked offering helped to boost the brand’s salestrajectory in the second half of 2016. Also during the year,Balenciaga worked on optimising and expanding its
distribution network, both for directly operated stores(which accounted for around 60% of the brand’s totalrevenue) and for wholesale.
Brioni recorded a sales decline, mainly with wholesalers,reflecting the brand’s measures to streamline itsdistribution channels and reorganise its productionprocesses. This had an impact on recurring operatingmargin. Brioni nevertheless kept up a high level of grossoperating investments in 2016 in order to support itstransformation process, notably opening two flagshipstores in the second half of the year in the strategiclocations of Paris and New York.
For Christopher Kane – a brand with highly creative content –2016 was a year in which synergies with the Groupcontinued to be developed, the brand’s organisational anddistribution structures were consolidated, and an onlinestore was launched.
Stella McCartney experienced another year of very robustgrowth in 2016. This sales momentum, experiencedacross all of the brand’s distribution channels, helped tooffset the adverse impact of the expenditure incurred fornew store openings and strengthening the brand’sstructure, and fuelled an increase in both recurringoperating income and recurring operating margin.
For the Watches & Jewelry brands, performance was mixed:
Over the past several years, Boucheron has built up a verycoherent offering of jewelry and high-jewelry collections,including its flagship lines the Serpent Bohème and Quatre,and in 2016 the brand reported solid organic growthacross the vast majority of its collections. However, saleswere adversely affected by low tourist numbers in France –which is Boucheron’s main market – and by the volatilityinherent in the high-jewelry segment.
Revenue generated by the Pomellato and Dodo brandsrose briskly in 2016, particularly in the brands’ traditionalmarkets in Western Europe. The popularity of thesebrands amongst both domestic customers and touristsstems largely from their capacity to renew and refreshtheir product ranges. Thanks to these goodperformances, the two brands registered higher recurringoperating margins year on year.
Qeelin turned in a very good performance in 2016, postinghigh sales growth propelled by the brand’s expansion inMainland China and increasing visibility in Greater China.
Girard-Perregaux and Ulysse Nardin once again demonstratedthat they are benchmark players in the watch industry, asillustrated by awards received by the two brands forcertain models. However, the watch market in general didnot see any significant improvement in 2016, and bothbrands therefore continued their measures to streamlineorganisational structures and business processes. In viewof the brands’ sales contractions and despite a lower costbase, recurring operating income for the Group’s watchessegment was down sharply on 2015.
5ACTIVITY REPORT ~ FINANCIAL INFORMATION
2372016 Reference Document ~ Kering
05_A_VA_V4 04/04/2017 13:21 Page237

Kering’s Sport & Lifestyle activities reported revenue of€3,884 million in 2016, up 5.5% as reported and 9.0%based on a comparable Group structure and exchangerates. The reported growth figure was lower than that atconstant exchange rates because currency effects werenegative during 2016 whereas they were positive in 2015.This was due to weaker currency values in a number ofemerging markets that are of strategic importance toPUMA. The effect of changes in Group structure duringthe year related to (i) the sale of the Tretorn brand to ABGon June 30, 2015, and (ii) the management buyout ofElectric on March 16, 2016, which resulted in this brand’srevenue no longer being recognised in the consolidatedfinancial statements as from January 1, 2016.
Overall revenue growth for Sport & Lifestyle activities wassustained throughout the year, with the increase in thesecond half (8.9% on a comparable basis) very much inline with the 9.1% rise recorded for the first six months.
Following on from the upturn that began in 2014,wholesale sales (which represented 77.8% of totalrevenue generated by Sport & Lifestyle activities)increased by 8.1% on a comparable basis, with PUMAdelivering 10% growth (versus 6.4% in 2015). The furtherimprovement in this distribution channel’s performancefor PUMA reflects the measures taken since BjörnGulden’s arrival as the brand’s CEO to more effectivelymeet the needs and expectations of both distributorsand end-customers through an innovative productoffering and clearer positioning.
Retail sales in directly operated stores advanced 12.9%based on comparable data, driven by a very solid same-store sales performance and a 57.2% jump in onlinesales, which enabled PUMA and Volcom to strengthentheir positioning in online distribution.
By product category, Footwear sales (which represented42.2% of total Sport & Lifestyle revenue) rose by a sharp12.7% on a comparable basis, marking the tenthconsecutive quarter of growth for this category.
In a year that saw numerous major sporting events, theApparel category turned in a very good showing, withcomparable-basis sales up 7.1%.
Sales of Accessories rose 5.5% year-on-year as thiscategory was no longer weighed down by Electric’s weakperformance.
In emerging markets – which made up 34.8% of totalrevenue – Sport & Lifestyle activities posted brisk salesgrowth of 12.6% based on comparable data. All of theSport & Lifestyle activities’ emerging markets reportedvery robust rises, with Greater China and Eastern Europeexperiencing the fastest acceleration in growth.
Revenue generated by Sport & Lifestyle activities in theirmore mature markets climbed 7.2% on a comparablebasis, powered by an excellent performance in WesternEurope (up 13.4%) – particularly in the eurozone whereGermany and France (the two main markets in thisregion) continued, and even accelerated, their pace ofrecovery. After several quarters of sustained growth,revenue in North America rose by a more modest (butstill solid) 3.9%, as 2016 sales were held back by thedownturn in the region’s Action Sport market, whichparticularly affected Volcom. Sales in Japan were flat in2016 compared with 2015.
Recurring operating income for Sport & Lifestyle activitiesamounted to €123 million in 2016, up by €28 million, or30%, on 2015. Recurring operating margin widened by 60basis points to 3.2%, reflecting the combined impact ofan 80 basis-point increase for PUMA and a negativemargin reported by Volcom due to its lower revenuefigure.
EBITDA totalled €190 million, representing a year-on-yearincrease of 18.0%.
Gross operating investments amounted to €92 million in2016, up 1.1% compared with 2015. This slight year-on-year increase was due to expenditure incurred for theSport & Lifestyle brands in the areas of distribution,information systems and supply chain, especially forPUMA whose renewed growth needs to be sustained.However, measures were taken to ensure that operatinginvestments were fully in line with the brands’ financialand strategic objectives, and they only represented 2.4%of revenue for the year.
Sport & Lifestyle activities
(in € millions) 2016 2015 Change
Revenue 3,883.7 3,682.5 +5.5%Recurring operating income 123.2 94.8 +30.0%
as a % of revenue 3.2% 2.6% +0.6 ptEBITDA 190.0 161.0 +18.0%
as a % of revenue 4.9% 4.4% +0.5 pt
Gross operating investments 92.0 91.0 +1.1%
Average FTE headcount 11,873 11,772 +0.9%
5 FINANCIAL INFORMATION ~ ACTIVITY REPORT
238 Kering ~ 2016 Reference Document
05_A_VA_V4 04/04/2017 13:21 Page238

In 2016, PUMA pursued its strategy of streamlining itsoffering and making it more innovative and consequentlyregaining market share with major distributors. The brandis now in a position to fully capitalise on the partnershipsand alliances entered into or renewed in the last twoyears. For example, the sponsorship deal with Arsenaland the launch of collections designed with Rihannahave helped the brand build its reputation, break intonew markets and broaden its distribution network. Addedto this, 2016 was a year packed with major sportingevents, giving a real boost to sales of sport items.
PUMA’s revenue totalled €3,642 million in 2016, up 7.0%year-on-year as reported. At constant exchange rates andexcluding the impact of changes in Group structure (i.e.the sale of Tretorn in the first half of 2015), growth was avery solid 10.4% and was evenly balanced across both halvesof the year (10.6% and 10.3% respectively). Reportedrevenue growth came in lower than the comparable basisfigure due to weaker currency values (versus the euro) in anumber of emerging markets to which PUMA is exposed.
Wholesale sales – which accounted for 77.8% of thebrand’s total revenue – climbed by 10.0% on a comparablebasis. This distribution channel reported sales rises in allof the brand’s main regions, except for Japan where thesales figure was on a par with 2015. In North America,growth was once again robust, coming in at 10.0%, lednotably by the success of the collections designed withRihanna and women’s lines in general. For PUMA’s strategicmarkets, the highest growth figures were recorded inFrance, Germany and Mainland China, providing a tangiblesign of the brand’s renewed momentum.
Revenue posted by PUMA’s directly operated storesswung up 12.5%, fuelled by higher same-store sales.Online sales performed particularly well in 2016 and theInternet is becoming an increasingly importantdistribution channel for PUMA.
Sales of Footwear, which at 44.7% once again made upthe highest proportion of PUMA’s revenue, rose 13.0% ona comparable basis. The pace of growth accelerated in thesecond half of the year and especially in the last quarter,which was the tenth consecutive quarter of growth forthis key product category.
Apparel sales (36.6% of PUMA’s total revenue) climbed9.6% on a comparable basis, with particularly high growthin the first half, driven by sales of replica football shirts inconnection with the UEFA Euro and Copa Americachampionships.
Sales growth for the Accessories category remainedrobust, at 6.5% on a comparable basis, despite a flat yearfor the golf segment (COBRA brand).
Emerging markets made up 36.3% of PUMA’s 2016 revenueand sales in these markets rose 13.7% on a comparablebasis, with particularly positive trends in Mainland China,Argentina, Mexico and South Africa. India – which is oneof the brand’s main emerging markets – also deliveredanother strong sales performance.
In the brand’s more mature markets, revenue was up 8.7%year-on-year. Western Europe was the best performer inthese markets, with revenue progressing 13.9% thanks toexcellent sales momentum in the eurozone, and in NorthAmerica comparable-basis sales growth was once againbrisk, reaching 6.2%. These good performances wereattributable to the brand’s successful new product launchesand its enhanced appeal and exposure among distributors.In Japan, sales came in slightly higher than in 2015.
PUMA’s contribution to the Group’s recurring operatingincome totalled €127 million in 2016, up €34 million (or37.0%) on the 2015 figure. year-on-year growth in absolutevalue terms was boosted by a better absorption of operatingexpenses during a period of revenue growth for the brand,reflecting a tightly controlled cost base that saw containedincreases in all areas apart from communications andmarketing given that PUMA is still in the process of investingin its brand.
PUMA’s recurring operating margin widened by 80 basispoints to 3.5%. This year-on-year improvement marks aturning point in the brand’s financial trajectory and wasachieved despite it continuing to experience generallynegative currency effects in 2016. On the other hand, thebrand’s gross margin for the year was negatively affectedby the impact of the stronger US dollar, combined withthe fact that PUMA does not use hedges for a number ofemerging market currencies. However, gross marginremained stable year-on-year as reported, thanks to priceincreases and better procurement conditions. At constantexchange rates, the brand posted a sharp increase ingross margin.
PUMA
(in € millions) 2016 2015 Change
Revenue 3,642.2 3,403.4 +7.0%Recurring operating income 126.6 92.4 +37.0%
as a % of revenue 3.5% 2.7% +0.8 ptEBITDA 187.2 150.7 +24.2%
as a % of revenue 5.1% 4.4% +0.7 pt
Gross operating investments 84.3 84.5 -0.2%
Average FTE headcount 11,128 10,988 +1.3%
5ACTIVITY REPORT ~ FINANCIAL INFORMATION
2392016 Reference Document ~ Kering
05_A_VA_V4 04/04/2017 13:21 Page239

“Other Sport & Lifestyle brands” now only comprisesVolcom, as Electric was sold at the beginning of 2016.
Volcom recorded €242 million in revenue in 2016, down8.4% year-on-year at constant exchange rates.
The Surfwear and Action Sports market did not see anymajor improvement during the year and the brandsoperating in the sector as well as their distributionnetworks saw further revenue declines, which put evenmore pressure on gross margins and profitability. Thebankruptcies of Quiksilver US in September 2015 andPacific Sunwear in April 2016 (a strategic distributor forVolcom) clearly demonstrate the difficulties this marketis currently undergoing.
Against this backdrop, Volcom continued to implementthe strategy it launched in 2013 aimed at containing thedeterioration of its margins, improving distribution, andmore effectively harmonising its offering.
Despite these measures, the brand recorded a sharp13.9% decrease in wholesale sales, notably in the UnitedStates where wholesalers are continuing to streamlinetheir store networks. Conversely, revenue from directretail sales (directly operated stores and online, whichaccounted for 20.3% of Volcom’s total for the year) swungup 19.8%, with the online distribution channel recordingparticularly rapid growth (up 43.1%).
Volcom’s Apparel category once again contributed some84% of the brand’s revenue for the year and it experiencedthe most contained sales contraction out of the brand’sproduct categories (down 7.1%).
Volcom’s revenue generation is still highly concentratedon mature markets, and especially North America, whichin 2016 was once again the brand’s leading market,accounting for 64.9% of its total sales despite the revenuedecline reported in the region. Apart from Western Europe,where sales continued to rise, all of the brand’s othermarkets posted revenue decreases.
Volcom ended 2016 with a recurring operating loss of€3 million, mainly due to the further decrease in revenuecompared to 2015. During the year, Volcom continued toimplement measures to reduce its cost base and stemthe deterioration in its recurring operating loss figure.However these measures involved write-downs andreorganisation costs that weighed on recurring operatingresults.
Volcom’s directly operated store network comprised 70 stores as of December 31, 2016, including eight inemerging markets. This represents 20 more points of salethan as of December 31, 2015, but over three-quarters ofthis increase was due to taking over existing shop-in-shops within department stores in Europe.
Volcom’s gross operating investments amounted to€8 million in 2016, up €2 million on 2015 as a result ofthe expenditure incurred for expanding the store networkand online distribution channel.
Other Sport & Lifestyle brands
(in € millions) 2016 2015 Change
Revenue 241.5 279.1 -13.5%Recurring operating income (3.4) 2.4 -241.7%
as a % of revenue -1.4% 0.9% -2.3 ptsEBITDA 2.8 10.3 -72.8%
as a % of revenue 1.2% 3.7% -2.5 pts
Gross operating investments 7.7 6.5 +18.5%
Average FTE headcount 745 784 -5.0%
EBITDA surged 24.2% to €187 million and EBITDA margintopped the 5% mark, coming in at 5.1%.
As of December 31, 2016, PUMA’s directly operated retailnetwork included 664 stores, representing 13 net openingscompared with December 31, 2015. Around two-thirds ofexisting stores and the majority of the new stores openedduring the year are in emerging markets where thisdistribution channel is growing and is delivering goodmargins.
Gross operating investments amounted to €84 million,more or less unchanged from 2015. This year-on-yearstability reflects the brand’s more selective approach toprojects and, to a lesser extent, a favourable currencyeffect relating to investments undertaken in emergingmarkets.
5 FINANCIAL INFORMATION ~ ACTIVITY REPORT
240 Kering ~ 2016 Reference Document
05_A_VA_V4 04/04/2017 13:21 Page240

Capital employed
As of December 31, 2016, capital employed was €32 millionhigher than at the previous year-end.
Goodwill, brands and other intangible assets, net
As of December 31, 2016, “Goodwill, brands and otherintangible assets, net” represented 61% of total assets(versus 63% as of December 31, 2015) and mainlycomprised:
• goodwill amounting to €3,534 million, of which€2,551 million related to Luxury activities, €978 millionto Sport & Lifestyle activities, and €5 million to the“Corporate and other” segment. Goodwill decreased in2016 due to the recognition of a €236 million goodwill
impairment loss recognised against the goodwill relatedto the Brioni and Ulysse Nardin brands (see Note 16 –Goodwill, to the consolidated financial statements);
• brands valued at €10,807 million, of which €6,887 millionfor Luxury activities and €3,920 million for Sport &Lifestyle activities. This item was slightly lower than atDecember 31, 2015 due to a €61 million impairmentloss recognised against the Ulysse Nardin brand (seeNote 17 – Brands and other intangible assets, to theconsolidated financial statements).
Net of deferred tax liabilities relating to brands (which arerecorded under “other non-current assets, net”, as shownbelow), this item came to €12,067 million as ofDecember 31, 2016.
1.5. Comments on the Group’s financial position
(in € millions) Dec. 31, 2016 Dec. 31, 2015 Change
Goodwill, brands and other intangible assets, net 14,806.2 15,044.3 -238.1Other non-current assets, net 818.5 569.1 +249.4Current assets, net 1,078.4 1,071.0 +7.4Provisions (368.5) (381.9) +13.4
Capital employed 16,334.6 16,302.5 +32.1
Total equity 11,963.9 11,623.1 +340.8
Net debt 4,370.7 4,679.4 -308.7
Corporate and other
The “Corporate and other” segment comprises(i) Kering’scorporate departments and headquarters teams, (ii) Shared Services, which provide services to the brands,(iii) the Kering Sustainability Department, which isresponsible for the sustainability initiative launched byKering in 2011, and (iv) Kering’s Sourcing Department(KGS), a profit centre for services that it provides onbehalf of non-Group brands, such as the companiesmaking up the former Redcats group.
Kering Eyewear – the entity that is being used to bring theGroup’s Eyewear business (sunglasses and frames) in-house – will be consolidated within the “Corporate andother” segment as from 2017, the first year of operationsfor the Gucci license. For the 2014-2016 ramp-up periodof this business, the operating losses associated withKering Eyewear have been recognised as non-recurringoperating expenses.
Net costs recorded by the “Corporate and other” segmentin 2016 totalled €173 million, up by a contained 10.8%
compared with 2015. This increase was due to thetransfer to this segment of new assignments and cross-business projects carried out on behalf of the Group’sbrands, mainly in relation to the maintenance andupgrading of information systems for Luxury activities,the management of which has been handled centrally byKering since 2013.
Gross operating investments recorded by the “Corporateand other” segment came to €138 million, €52 million lowerthan in 2015. This reduction was attributable to the loweramount of expenditure dedicated to the creation of thehead offices of Kering in Paris and Gucci in Milan (both ofwhich were inaugurated during the year), and was achieveddespite a higher outlay on the Group’s transformationprojects and IT systems. In addition, as was the case in2015, gross operating investments for the “Corporate andother” segment included €30 million in compensationpaid to Safilo for the early termination of the Guccilicense (the last €30 million payment is due in 2018).
5ACTIVITY REPORT ~ FINANCIAL INFORMATION
2412016 Reference Document ~ Kering
05_A_VA_V4 04/04/2017 13:21 Page241

Property, plant and equipment corresponding to the Group’s operating infrastructure break down as follows in units:
Owned Finance Operating outright leases leases Dec. 31, 2016 Dec. 31, 2015
Stores Luxury 4 4 1,297 1,305 1,264 Sport & Lifestyle 4 0 730 734 702
Logistics units Luxury 6 1 73 80 81 Sport & Lifestyle 5 0 36 41 39
Production Luxury 37 1 59 97 71units & other Sport & Lifestyle 2 0 2 4 4
“Property, plant and equipment, net” was higher as ofDecember 31, 2016 than at December 31, 2015 due tothe impact of recurring transactions during the year (seeNote 18 – Property, plant and equipment, to theconsolidated financial statements).
“Deferred tax liabilities” chiefly relates to brandsrecognised on business combinations, notably Gucci andPUMA (see Note 11.2.2 – Changes in deferred tax assetsand liabilities, to the consolidated financial statements).
As of December 31, 2016, “Investments in equity-accountedcompanies” comprised shares in Wilderness, Tomas Maierand Altuzarra as well as shares in two new companies:WG Alligator Farm and Wall’s Gator Farm (see Note 20 –Investments in equity-accounted companies, to theconsolidated financial statements).
Other non-current assets, net
(in € millions) Dec. 31, 2016 Dec. 31, 2015 Change
Property, plant and equipment, net 2,206.5 2,073.0 +133.5Net deferred tax liabilities (1,927.5) (2,008.3) +80.8Investments in equity-accounted companies 48.3 20.9 +27.4Non-current financial assets, net 460.8 443.6 +17.2Other 30.4 39.9 -9.5
Other non-current assets, net 818.5 569.1 +249.4
5 FINANCIAL INFORMATION ~ ACTIVITY REPORT
242 Kering ~ 2016 Reference Document
05_A_VA_V4 04/04/2017 13:21 Page242

As of December 31, 2016, Kering’s total equity was higherthan at the previous year-end, with equity attributable toowners of the parent up €321 million, mainly due to thecombined impact of:
• €814 million in net income attributable to owners ofthe parent for 2016;
• €505 million in dividends and interim dividends paidby Kering;
• a €27 million positive effect from fair valueremeasurements of cash flow hedges;
• a €24 million positive effect from currency translationadjustments;
• a €39 million adverse effect of other changes (notablybuyouts of non-controlling interests).
Provisions
As of December 31, 2016, “Provisions for pensions and other post-employment benefits” was up by a slight €9 millioncompared with December 31, 2015. The portion of short-term provisions that will give rise to cash outflows in the coming12 months amounted to €8 million (see Note 26 – Employee benefits, to the consolidated financial statements).
“Other provisions” decreased in 2016, mainly reflecting the sale of Electric whose net assets had been fully provisionedat December 31, 2015 (see Note 27 – Provisions, to the consolidated financial statements).
(in € millions) Dec. 31, 2016 Dec. 31, 2015 Change
Provisions for pensions and other post-employment benefits 150.8 142.3 +8.5Other provisions for contingencies and losses 217.7 239.6 -21.9
Provisions 368.5 381.9 -13.4
Equity
(in € millions) Dec. 31, 2016 Dec. 31, 2015 Change
Equity attributable to owners of the parent 11,269.7 10,948.3 +321.4Equity attributable to non-controlling interests 694.2 674.8 +19.4
Total equity 11,963.9 11,623.1 +340.8
As of December 31, 2016, Kering’s net current assets werevirtually unchanged from the previous year end, up€7 million (0.7%).
After stripping out the impact of fluctuations in exchangerates and changes in Group structure, changes in workingcapital requirement led to a net cash outflow of€84 million:
• changes in inventories resulted in a net cash outflow of€229 million in 2016. The increase in inventoriesduring the year reflects higher volumes of purchasesmade by PUMA and Gucci in order to support their salesgrowth (see Note 22 – Inventories, to the consolidatedfinancial statements);
• the increase in trade receivables during 2016 led to a€62 million net cash outflow, reflecting growth inwholesale sales, notably at PUMA and Gucci (see Note23 – Trade receivables, to the consolidated financialstatements);
• the rise in trade payables and other operating receivablesand payables represented a €207 million cash inflowand was due to the higher revenue recorded by PUMAand Gucci as well as the ramp-up of the Kering Eyewearbusiness with the launch of the first Gucci collections atthe end of the second half.
(See Note 24 – Other current assets and liabilities, tothe consolidated financial statements).
Current assets, net
As of December 31, 2016, net current assets totalled €1,078 million, versus €1,071 million as of December 31, 2015.This item breaks down as follows:
(in € millions) Dec. 31, 2016 Dec. 31, 2015 Change
Inventories 2,432.2 2,191.2 +241.0Trade receivables 1,196.4 1,137.1 +59.3Trade payables (1,098.5) (939.7) -158.8Current tax receivables / payables (292.9) (210.8) -82.1Other current assets and liabilities (1,158.8) (1,106.8) -52.0
Current assets, net 1,078.4 1,071.0 +7.4
5ACTIVITY REPORT ~ FINANCIAL INFORMATION
2432016 Reference Document ~ Kering
05_A_VA_V4 04/04/2017 13:21 Page243

No bond redemptions were carried out in 2016. The mostsignificant repayments of borrowings mainly concernedcommercial paper.
New borrowings issued in 2016 included the first ten-year bonds issued by Kering SA, which represented a totalof €500 million and have a fixed-rate annual coupon of1.25%. The settlement / delivery date for these bonds wasMay 10, 2016.
As of December 31, 2016, the Group’s gross borrowingsincluded €95 million concerning put options granted tominority shareholders (compared with €76 million as ofDecember 31, 2015).
In accordance with the Group’s interest rate managementpolicy, fixed-rate borrowings accounted for 77.1% of theGroup’s total gross borrowings as of December 31, 2016(including hedges), compared with 75.8% one year earlier.
As of December 31, 2016, the Group’s gross borrowingswere mainly denominated in euros. The proportiondenominated in Japanese yen represented 8.0% of total
gross borrowings (6.5% as of December 31, 2015) and theproportion denominated in other currencies stood at8.5% (8.8% as of December 31, 2015).
Kering minimises its exposure to concentration risk bydiversifying its sources of financing. Therefore, non-bankdebt accounted for 83.6% of gross borrowings as ofDecember 31, 2016, versus 85.4% as of December 31, 2015.Kering’s credit facilities are taken out with a diversifiedpool of top-tier French and non-French banks. As ofDecember 31, 2016, 71.3% of the confirmed credit facilitiesgranted to Kering were provided by a total of ten banks.The Group’s three leading banking partners represented33.7% of the total and no single bank accounted for morethan 15% of the aggregate amount of confirmed creditfacilities available to the Group.
Kering only carries out borrowing and investment transactionswith leading financial institutions and it spreads thesetransactions amongst the various institutions concerned.
Net debt
The Group’s net debt totalled €4,371 million as of December 31, 2016, representing a decrease of €309 million or 6.6%compared with the previous year-end. As of December 31, 2016, Kering’s net debt broke down as follows:
(in € millions) Dec. 31, 2016 Dec. 31, 2015 Change
Bonds 4,180.9 3,674.5 +506.4Bank borrowings 335.1 313.4 +21.7Commercial paper 350.1 1,299.7 -949.6Other borrowings 554.2 538.2 +16.0
Gross borrowings 5,420.3 5,825.8 -405.5
Fair value hedges (interest rate) Cash and cash equivalents (1,049.6) (1,146.4) +96.8
Net debt 4,370.7 4,679.4 -308.7
During 2016, Kering carried out the following treasuryshare transactions:
• the acquisition and disposal of 1,556,728 shares underthe liquidity agreement;
• the acquisition of 1,304 shares followed by the allotmentof 28,902 shares (including 27,598 shares held intreasury as of December 31, 2015) to employees underthe 2012 free share plan.
As of December 31, 2016, Kering’s share capital was madeup of 126,279,322 shares with a par value of €4 each. At that date, Kering did not hold any shares either inconnection with the liquidity agreement or in treasury.
As of December 31, 2016, “Equity attributable to non-controlling interests” mainly related to PUMA, for a totalof €533 million (versus €512 million one year earlier),and the Luxury activities’ brands, for €162 million(€157 million as of December 31, 2015).
5 FINANCIAL INFORMATION ~ ACTIVITY REPORT
244 Kering ~ 2016 Reference Document
05_A_VA_V4 04/04/2017 13:21 Page244
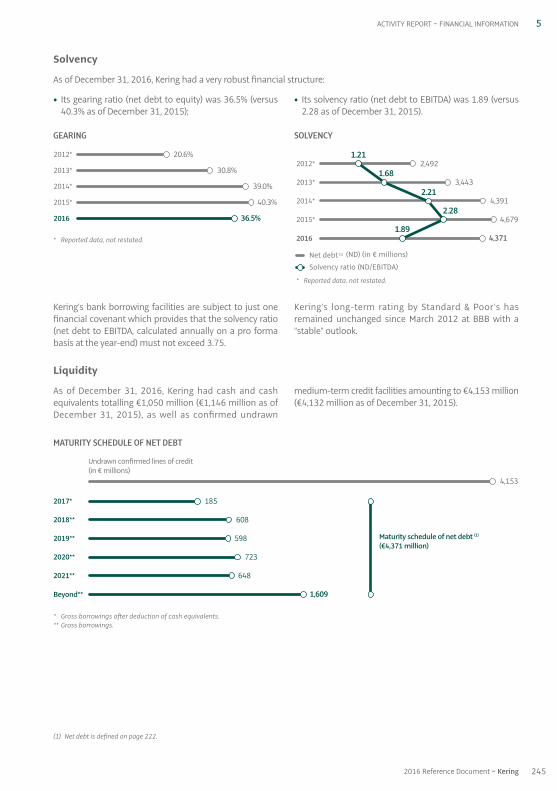
MATURITY SCHEDULE OF NET DEBT
As of December 31, 2016, Kering had cash and cashequivalents totalling €1,050 million (€1,146 million as ofDecember 31, 2015), as well as confirmed undrawn
medium-term credit facilities amounting to €4,153 million(€4,132 million as of December 31, 2015).
Liquidity
• Its gearing ratio (net debt to equity) was 36.5% (versus40.3% as of December 31, 2015);
GEARING
Kering’s bank borrowing facilities are subject to just onefinancial covenant which provides that the solvency ratio(net debt to EBITDA, calculated annually on a pro formabasis at the year-end) must not exceed 3.75.
• Its solvency ratio (net debt to EBITDA) was 1.89 (versus2.28 as of December 31, 2015).
SOLVENCY
Kering’s long-term rating by Standard & Poor’s hasremained unchanged since March 2012 at BBB with a“stable” outlook.
Solvency
As of December 31, 2016, Kering had a very robust financial structure:
5ACTIVITY REPORT ~ FINANCIAL INFORMATION
* Reported data, not restated.
2015* 40.3%
2016 36.5%
2014* 39.0%
2013* 30.8%
2012* 20.6%
2015* 4,679
2016 4,371
2014* 4,391
2013* 3,443
2012* 2,492
* Reported data, not restated.
Net debt (1) (ND) (in € millions)
Solvency ratio (ND/EBITDA)
1.89
2.28
2.21
1.68
1.21
* Gross borrowings after deduction of cash equivalents.** Gross borrowings.
2021** 648
Beyond** 1,609
2020** 723
2019** 598
2018** 608
2017*
Maturity schedule of net debt (1)
(€4,371 million)
185
Undrawn confirmed lines of credit(in € millions)
4,153
2452016 Reference Document ~ Kering
(1) Net debt is defined on page 222.
05_A_VA_V4 04/04/2017 13:21 Page245

In 2016, cash flow from operating activities before tax,dividends and interest was up 17.7% on 2015.
Changes in working capital requirement during 2016gave rise to a net cash outflow of €84 million versus€219 million in 2015.
This €135 million year-on-year improvement reflects thefollowing main factors:
• a €220 million positive impact from an increase intrade payables as a result of higher business volumes,compared with a decrease in trade payables in 2015which was mainly due to payment time lags at PUMA;
Changes in net debt
Changes in net debt during 2016 and 2015 can be analysed as follows:
(in € millions) 2016 2015
Net debt as of January 1 4,679.4 4,390.7
Free cash flow from operations (1,189.4) (660.2)Net interest paid and dividends received 172.6 166.4Dividends paid 541.4 561.5Acquisition (disposal) of Kering shares (0.5) 7.3Other acquisitions and disposals 169.7 67.3Other movements (2.5) 146.4
Net debt as of December 31 4,370.7 4,679.4
Free cash flow from operations
The generation of free cash flow from operations is a key financial objective for all of the Group’s brands. In 2016, theGroup’s free cash flow from operations totalled €1,189 million.
(in € millions) 2016 2015 Change
Cash flow from operating activities before tax, dividends and interest 2,171.8 1,845.3 +17.7%
Change in working capital requirement (excluding tax) (84.4) (219.3) -61.5%Corporate income tax paid (295.5) (330.4) -10.6%
Net cash from operating activities 1,791.9 1,295.6 +38.3%
Purchases of property, plant and equipment and intangible assets (611.0) (672.1) -9.1%Proceeds from disposals of property, plant and equipment and intangible assets 8.5 36.7 -76.8%
Free cash flow from operations 1,189.4 660.2 +80.2%
Interest and dividends received 14.0 12.4 +12.9%Interest paid and equivalent (186.6) (178.8) +4.4%
Available cash flow 1,016.8 493.8 +105.9%
In view of the above, the Group is not exposed to liquidity risk.
Short-term borrowings and borrowings maturing in fiveyears or beyond accounted for 22.8% and 41.7% respectivelyof total gross borrowings as of December 31, 2016,compared with 30.6% and 42.3% respectively as ofDecember 31, 2015.
Cash and cash equivalents exclusively comprise cashinstruments and money-market funds that are not subjectto any risk of changes in value. As of December 31, 2016,the Group had access to €4,189 million in confirmedcredit facilities (of which €36 million had been drawndown), versus €4,153 million as of December 31, 2015.
The Group’s loan agreements and bond indenturesfeature standard pari passu, cross default and negativepledge clauses.
The bonds issued between 2009 and 2016 within thescope of the EMTN programme are all subject to change-of-control clauses entitling bondholders to request earlyredemption at par if Kering’s rating is downgraded tonon-investment grade following a change of control.
In addition, the bonds issued in 2009 include a step-upcoupon clause that applies in the event that Kering’srating is downgraded to non-investment grade.
All of these borrowings are covered by the rating assignedto the Kering group by Standard & Poor’s (BBB with astable outlook) and are not subject to any financialcovenants.
The Group’s debt contracts do not include any ratingtrigger clauses.
(See Note 29 – Borrowings, to the consolidated financialstatements).
5 FINANCIAL INFORMATION ~ ACTIVITY REPORT
246 Kering ~ 2016 Reference Document
05_A_VA_V4 04/04/2017 13:21 Page246

The 2.6% year-on-year decrease in gross operatinginvestments for Luxury activities was due to this business’sfocus on achieving organic growth on a same-store basisand on consolidating the existing store network, in viewof the more unsettled operating environment in theluxury industry.
In 2016, 45% of the Group’s gross operating investmentsconcerned the store network (versus 46% in 2015).
Gross operating investments also decreased for the“Corporate and other” segment in 2016. In 2015, theyprimarily corresponded to investments in real-estateprojects in Milan, Paris and Tokyo, which were completedin 2016.
Available cash flow
In 2016, net cash outflows relating to finance costs included€14 million in interest and dividends received versus€12 million in 2015.
Available cash flow for the year amounted to €1,017 millioncompared with €494 million in 2015.
Dividends paid
Dividends paid in 2016 were slightly lower than in 2015.The 2016 figure included €36 million paid to minorityshareholders of consolidated subsidiaries (€57 million in2015), of which almost €20 million related to PUMA. Thecash dividend paid by Kering to its own shareholders in2016 amounted to €505 million (including the interimcash dividend paid on January 18, 2016), more or lessunchanged from 2015.
Acquisitions and disposals
The amount recorded under “Acquisition (disposal) ofKering shares” was less than €1 million for 2016. In 2015this item amounted to a positive €7 million and primarilycorresponded to the purchase of 133,021 shares for theGroup’s stock option and free share plans.
During 2016, Kering did not purchase any PUMA sharesand kept its interest in the company at 85.81%, unchangedfrom year-end 2015.
The impact of “Other acquisitions and disposals” during2016 included (i) €82 million in financial investmentsmade by the Group, primarily concerning real-estatecompanies acquired in 2016 and 2015 and the financingof other equity interests, and (ii) €18 million in financialcash flows related to discontinued operations.
In 2015, the impact of “Other acquisitions and disposals”mainly included (i) €84 million in financial investmentsmade by the Group, primarily concerning real-estateentities and (ii) €4 million in net financial cash flowsrelated to discontinued operations.
Other movements
This item primarily includes the impact of (i) fluctuationsin exchange rates, and (ii) fair value remeasurements offinancial instruments in accordance with IAS 32 and IAS 39.
(in € millions) 2016 2015 Change
Luxury 380.6 390.9 -2.6%Sport & Lifestyle 92.0 91.0 +1.1%Corporate and other 138.4 190.2 -27.2%
Gross operating investments 611.0 672.1 -9.1%
• a €159 million adverse impact resulting from a higherincrease in inventories for Luxury activities than in2015;
• a €74 million favourable impact from changes in otheritems of working capital requirement.
The net cash outflow relating to net operatinginvestments totalled €602 million in 2016, comparedwith €635 million in 2015.
Gross operating investments totalled €611 million in2016, down 9% on the €672 million recorded for 2015and breaking down as follows:
5ACTIVITY REPORT ~ FINANCIAL INFORMATION
2472016 Reference Document ~ Kering
05_A_VA_V4 04/04/2017 13:21 Page247

DIVIDEND PER SHARE (IN €)
PAYOUT RATIOS
The parent company ended 2016 with net income of€683 million, compared with €527 million in 2015. The2016 total includes €863 million in dividends receivedfrom subsidiaries (versus €657 million in 2015).
At its February 9, 2017 meeting, the Board decided that,at the Annual General Meeting to be held to approve thefinancial statements for the year ended December 31, 2016,it will ask shareholders to approve a €4.60 per share cashdividend for 2016.
An interim dividend amounting to €1.50 per share waspaid on January 18, 2017 pursuant to a decision by theBoard of Directors on December 15, 2016.
If the final dividend is approved, the total cash dividendpayout in 2017 will amount to €581 million.
Kering’s goal is to maintain well-balanced payout ratiosbearing in mind, on the one hand, changes in net incomefrom continuing operations (excluding non-recurringitems) attributable to owners of the parent and, on theother hand, the amount of available cash flow. The Group hasdecided to raise its 2016 dividend to €4.60, as a sign of itsconfidence in its future development.
1.6. Parent company net income and dividend payment
5 FINANCIAL INFORMATION ~ ACTIVITY REPORT
248 Kering ~ 2016 Reference Document
* Subject to the approval of the Annual General Meeting.
2015 4.00
2016* 4.60
2014 4.00
2013 3.75
2012 3.75
* Subject to the approval of the Annual General Meeting.** Reported data, not restated.
% of attributable recurring net income, from continuing operations% of free cash flow
2013** 38.5%64.0%
2014 42.9%59.4%
2015 49.6%102.2%
2016* 45.3%57.1%
2012** 37.3%61.6%
05_A_VA_V4 04/04/2017 13:21 Page248

Positioned in structurally high-growth markets, Keringenjoys very solid fundamentals and has a balancedportfolio of complementary, high-potential brands withclearly focused priorities.
As in 2016, the Group’s Luxury activities in 2017 will focuson achieving same-store revenue growth, while theexpansion of the store network will be targeted andselective, as well as on extending work currently underwayto durably strengthen operating margins. In the Group’sSport & Lifestyle activities, PUMA expects to deliver anotheryear of market improvement in revenue and recurringoperating margin.
The Group’s operating environment remains unsettled –from both economic and geopolitical standpoints – andis exposed to events that could influence consumertrends and tourism flows.
Against this backdrop, in 2017 and as it did in 2016, Keringplans to pursue its strategy of rigorously managing andallocating its resources in order to further enhance itsoperating performance, cash flow generation and returnon capital employed.
1.7. Transactions with related parties
Transactions with related parties are described in Note 35 – Transactions with related parties, to the consolidatedfinancial statements.
1.8. Subsequent events
No significant events occurred between December 31, 2016 and February 9, 2017 – the date on which the Board ofDirectors authorised the consolidated financial statements for issue.
1.9. Outlook
5ACTIVITY REPORT ~ FINANCIAL INFORMATION
2492016 Reference Document ~ Kering
05_A_VA_V4 04/04/2017 13:21 Page249

The Group conducts a targeted investment policydesigned to reinforce both its image and the uniquepositioning of its brands, as well as to increase its returnon capital employed.
The Group’s investment policy is focused on the developmentof its store network, the conversion and renovation of itsexisting points of sale, the establishment and maintenanceof manufacturing units in the Luxury sector, and thedevelopment of IT systems.
Gross operating investments amounted to €611 million in2016, down 9.1% on 2015. For the Luxury activities, the 2.6%contraction in investments reflects the focus on achievingorganic growth on a same-store basis and on consolidatingthe existing store network. The Sport & Lifestyle activities’gross operating investments amounted to €92 million in2016, up slightly by 1.1% compared with 2015.
In 2016, 45% of the Group’s gross operating investmentsconcerned the store network (versus 46% in 2015).
Gross operating investments recorded by the “Corporateand other” segment came to €138 million, €52 millionlower than in 2015. This decrease was attributable to thelower amount of expenditure dedicated to the creationof the head offices of Kering in Paris and Gucci in Milan
(both of which were inaugurated during the year), andwas achieved despite a higher outlay on the Group’stransformation projects and IT systems.
Luxury activities
The Luxury activities’ gross operating investmentsamounted to €381 million in 2016, €10 million (or 2.6%)lower than in 2015. This strategy of tightly controllingcapital expenditure was one of the financial objectivesset for Luxury activities for 2016. As a proportion ofrevenue, gross operating investments represented 4.5%in 2016 versus 5.0% in 2015.
As of December 31, 2016, Luxury activities had a networkof 1,305 directly operated stores, including 799 (61%) inmature markets and 506 in emerging markets. Net storeadditions during the year totalled 41, compared with 78 in 2015. The stores added in 2016 were mainly due tonetwork expansions, primarily for Yves Saint Laurent (anet increase of 17 stores) and, to a lesser extent, forBalenciaga and Stella McCartney.
2.2. Operating investments
The Group has a balanced portfolio of complementarybrands and did not undertake any major investments in2016 or 2015. Financial investments represented net cashoutflows of €10.2 million euros for the year (€25.6 millionfor 2015).
The cash impact of the sale of businesses restated inaccordance with IFRS 5 (mainly Sergio Rossi and the Redcatsgroup) is shown on the line “Net cash from (used in)discontinued operations” and represented a cash outflowof €17.7 million in 2016 (compared to a cash inflowof €3.5 million in 2015).
(See Note 12 – Discontinued operations, to the consolidatedfinancial statements.)
2.1. Financial investments
Kering’s investment policy is designed to support andenhance the Group’s growth potential on its markets and isfocused on financial investments (acquisitions and disposalsof assets) and investments related to operations (organicgrowth).
Financial investments reflect the Group’s strategy ofreinforcing profitable high-growth activities in the Luxury
market by acquiring attractive brands with strong growthpotential and market positions that perfectly complementits existing assets.
Operating investments are designed to accelerate organicgrowth for the Group’s brands. This is achieved by, forexample, developing and renovating the store networkand by investing in logistics centres or IT systems.
2. Investment policy
5 FINANCIAL INFORMATION ~ INVESTMENT POLICY
250 Kering ~ 2016 Reference Document

Gucci
As of December 31, 2016, Gucci operated 520 storesdirectly, including 216 in emerging markets. A net 5 storeswere closed during the year, giving the brand an overallnetwork more adapted to its operations in terms of storenumbers. As it does not consider that aggressivelyexpanding the store network is the right strategy intoday’s operating environment in the luxury industry, thebrand’s current focus is on increasing its organic growth.
Gucci’s gross operating investments amountedto €185 million in 2016, down 4.2% on 2015. This year-on-year decrease reflects the brand’s prudent approachto new store openings, as mentioned above, and itsstrategy of allocating resources in priority to financinginventories in order to support the upturn in the brand’ssales. The figure for 2016 includes the refurbishmentprogramme aimed at introducing the new store conceptat the brand’s most strategic stores. Gucci had set itselfthe goal of bringing the total number of stores with thenew concept to 80 by the end of 2016. This objective wasreached as 86 stores sporting the brand’s new aestheticwere either newly-opened or refurbished during 2015and 2016. The objective of keeping investments belowthe threshold of 5% of revenue was also met, as grossoperating investments represented 4.2% of sales.
Bottega Veneta
In order to enable it to focus its action plans on achievingorganic growth, as from 2015 the brand decided to stabiliseand restructure its directly-owned store network. As ofDecember 31, 2016, Bottega Veneta had 255 directlyoperated stores, including 111 in emerging markets. Therewere 4 net store additions during the year, versus 15 in 2015.
Gross operating investments decreased by €7 million (or13.5%) year on year to some €43 million in 2016, reflectingthe brand’s prudent approach to new projects.
Yves Saint Laurent
As of December 31, 2016, the Yves Saint Laurent branddirectly operated 159 stores, including 70 in emerging markets.There were 17 net store openings during the year, includingflagship stores in strategic countries or cities where the brandwas not yet present and a high number of concessions indepartment stores.
Overall, the brand’s gross operating investments werecontained in 2016, amounting to €58 million which representsa €5 million decrease compared with 2015. This prudentinvestment strategy, combined with the increase inEBITDA, contributed to a significant improvement in thebrand’s free cash flow generation.
Other Luxury brands
The network of directly operated stores owned by OtherLuxury brands totalled 371 stores as of December 31, 2016.There were 25 net store additions during the year. Thenetwork comprises 262 stores in mature markets and109 stores in emerging markets.
The Group’s Other Luxury brands adopted a strict and highlyselective capital expenditure strategy in 2016 and soughtto reduce their gross operating investments. Only Brioni hada higher capital outlay for the year, due to the relocationof two of its flagship stores in Paris and New York. Overallgross operating investments for Other Luxury brandsamounted to €95 million, representing a €10 millionincrease compared with 2015.
Sport & Lifestyle activities
Gross operating investments amounted to €92 million in2016, up 1.1% compared with 2015. This slight year-on-year increase was due to expenditure incurred for theSport & Lifestyle brands in the areas of distribution,information systems and supply chain, especially forPUMA whose renewed growth needs to be sustained.
As of December 31, 2016, the Sport & Lifestyle activities’network of directly operated stores had 734 points of sale.There were 33 net store additions during the year, ofwhich 23 in emerging markets.
PUMA
Gross operating investments amounted to €84 million,more or less unchanged from 2015. This year-on-yearstability reflects the brand’s more selective approach toprojects and, to a lesser extent, a favourable currency effectrelating to investments undertaken in emerging markets.
As of December 31, 2016, PUMA’s directly operated retailnetwork included 664 stores, representing 13 net openingscompared with December 31, 2015. Around two-thirds ofexisting stores and the majority of the new stores openedduring the year are in emerging markets where thisdistribution channel is growing and is delivering goodmargins.
Other Sport & Lifestyle brands
Volcom’s gross operating investments amountedto €8 million in 2016, up €2 million on 2015 as a result ofthe expenditure incurred for expanding the store networkand online distribution channel.
Volcom’s directly operated store network comprised 70stores as of December 31, 2016, including 8 in emergingmarkets. This represents 20 more points of sale than asof December 31, 2015, but over three-quarters of thisincrease was due to taking over existing shop-in-shopswithin department stores in Europe.
5INVESTMENT POLICY ~ FINANCIAL INFORMATION
2512016 Reference Document ~ Kering

5 FINANCIAL INFORMATION ~ RISK MANAGEMENT
The Kering group has established a centralised structurefor the management of liquidity, exchange rate andinterest rate risks. The Group’s Financing and TreasuryDepartment, which reports to the Finance Department, isresponsible for this organisation and has the necessaryexpertise, resources (particularly technical) andinformation systems to carry out the necessary tasks. Itexecutes transactions in various financial markets withoptimum efficiency and security via Kering Finance SNC,which is dedicated to cash management and financing.The Financing and Treasury Department also coordinatescash management for the subsidiaries and sets out theGroup’s banking policy.
The financial risks identified by the Group aresummarised below:
Counterparty risk
Kering minimises its exposure to counterparty risk bydealing only with investment grade companies and byspreading its exposure among its various counterparties,up to their respective exposure and maturity limits.Counterparties to derivative transactions are included inthe Group’s counterparty risk management procedures.Each of these transactions requires approval and isgoverned by limits and maturities that are reviewed on aregular basis. Counterparties are assessed using aninternal classification system based on the rating theyhave received from rating agencies. Counterparties mustbe rated at least “BBB” by Standard & Poor’s and theequivalent by Moody’s.
Equity risk
In the normal course of business, the Group enters intotransactions involving shares in consolidated companiesor shares issued by Kering. The Group trades in its ownsecurities either directly or through derivatives as part ofits share buy-back programme and in accordance withapplicable regulations. Kering has also signed anagreement with a financial broker in order to improve theliquidity of the Group’s shares and ensure share pricestability. This agreement complies with the Professional
Code of Conduct drawn up by the French association offinancial and investment firms (Association française desmarchés financiers – AMAFI) and approved by the Frenchfinancial markets authority (Autorité des marchésfinanciers – AMF).
Shares held in connection with non-consolidatedinvestments represent a low exposure risk for the Groupand are not hedged.
When Kering sets up financial investments in the form ofopen-ended investment funds or equivalent funds, itsystematically uses liquid monetary instruments withmaturities of less than three months in order to mitigaterisk. Consequently, the price risk borne by Kering isdeemed not to be material.
Additional information on equity risk is provided in Note 30.3 to the consolidated financial statements.
Foreign exchange risk
The Group uses derivative hedging instruments to reduceits exposure to currency risk based on the specificrequirements of each of the Luxury and Sport & Lifestyleactivities.
These instruments are used either to hedge foreigncurrency trade receivables and payables, or to hedgehighly probable forecast exposures and / or firmcommitments. Each entity hedges the risk generated byusing a currency other than its functional currency in itscommercial dealings.
Companies in the Sport & Lifestyle activities primarilyhedge the foreign exchange risk generated by highlyprobable purchase and sales of foreign currency. Periodsdepend on the activity specific to each company. Hedgingflows may be generated by inter-company flows throughpurchasing offices.
Foreign exchange risk hedging by the Luxury activity’sentities mainly covers sales made to their retailsubsidiaries, and to a lesser extent purchase flows. Theseare essentially inter-company flows.
Future foreign exchange exposures are determined usinga regularly updated budget procedure.
3.1. Financial risks
Risk management forms part of the ongoing identificationand evaluation process of Group risks (see section “Internal
control and risk management procedures” in the Chairman’sreport, page 211 of the Reference Document).
3. Risk management
252 Kering ~ 2016 Reference Document
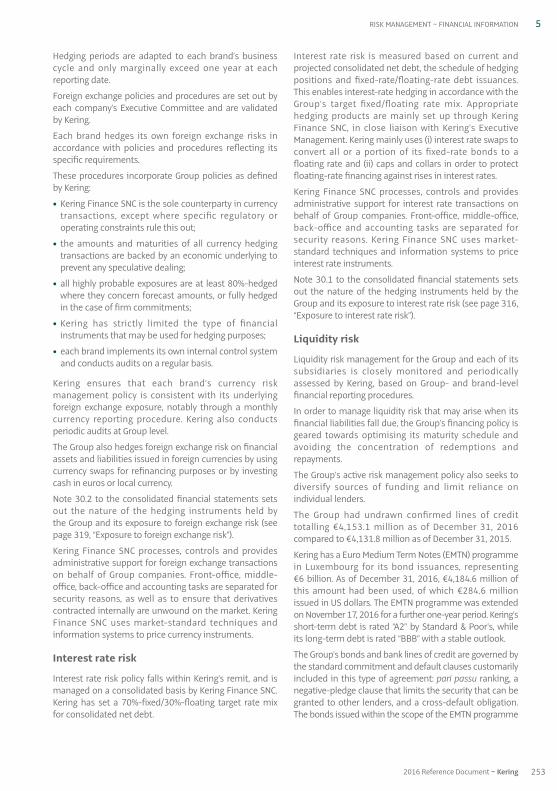
5RISK MANAGEMENT ~ FINANCIAL INFORMATION
Hedging periods are adapted to each brand’s businesscycle and only marginally exceed one year at eachreporting date.
Foreign exchange policies and procedures are set out byeach company’s Executive Committee and are validatedby Kering.
Each brand hedges its own foreign exchange risks inaccordance with policies and procedures reflecting itsspecific requirements.
These procedures incorporate Group policies as definedby Kering:
• Kering Finance SNC is the sole counterparty in currencytransactions, except where specific regulatory oroperating constraints rule this out;
• the amounts and maturities of all currency hedgingtransactions are backed by an economic underlying toprevent any speculative dealing;
• all highly probable exposures are at least 80%-hedgedwhere they concern forecast amounts, or fully hedgedin the case of firm commitments;
• Kering has strictly limited the type of financialinstruments that may be used for hedging purposes;
• each brand implements its own internal control systemand conducts audits on a regular basis.
Kering ensures that each brand’s currency riskmanagement policy is consistent with its underlyingforeign exchange exposure, notably through a monthlycurrency reporting procedure. Kering also conductsperiodic audits at Group level.
The Group also hedges foreign exchange risk on financialassets and liabilities issued in foreign currencies by usingcurrency swaps for refinancing purposes or by investingcash in euros or local currency.
Note 30.2 to the consolidated financial statements setsout the nature of the hedging instruments held by the Group and its exposure to foreign exchange risk (seepage 319, “Exposure to foreign exchange risk”).
Kering Finance SNC processes, controls and providesadministrative support for foreign exchange transactionson behalf of Group companies. Front-office, middle-office, back-office and accounting tasks are separated forsecurity reasons, as well as to ensure that derivativescontracted internally are unwound on the market. KeringFinance SNC uses market-standard techniques andinformation systems to price currency instruments.
Interest rate risk
Interest rate risk policy falls within Kering’s remit, and ismanaged on a consolidated basis by Kering Finance SNC.Kering has set a 70%-fixed / 30%-floating target rate mixfor consolidated net debt.
Interest rate risk is measured based on current andprojected consolidated net debt, the schedule of hedgingpositions and fixed-rate / floating-rate debt issuances.This enables interest-rate hedging in accordance with theGroup’s target fixed / floating rate mix. Appropriatehedging products are mainly set up through KeringFinance SNC, in close liaison with Kering’s ExecutiveManagement. Kering mainly uses (i) interest rate swaps toconvert all or a portion of its fixed-rate bonds to afloating rate and (ii) caps and collars in order to protectfloating-rate financing against rises in interest rates.
Kering Finance SNC processes, controls and providesadministrative support for interest rate transactions onbehalf of Group companies. Front-office, middle-office,back-office and accounting tasks are separated forsecurity reasons. Kering Finance SNC uses market-standard techniques and information systems to priceinterest rate instruments.
Note 30.1 to the consolidated financial statements setsout the nature of the hedging instruments held by theGroup and its exposure to interest rate risk (see page 316,“Exposure to interest rate risk”).
Liquidity risk
Liquidity risk management for the Group and each of itssubsidiaries is closely monitored and periodicallyassessed by Kering, based on Group- and brand-levelfinancial reporting procedures.
In order to manage liquidity risk that may arise when itsfinancial liabilities fall due, the Group’s financing policy isgeared towards optimising its maturity schedule andavoiding the concentration of redemptions andrepayments.
The Group’s active risk management policy also seeks todiversify sources of funding and limit reliance onindividual lenders.
The Group had undrawn confirmed lines of credittotalling €4,153.1 million as of December 31, 2016compared to €4,131.8 million as of December 31, 2015.
Kering has a Euro Medium Term Notes (EMTN) programmein Luxembourg for its bond issuances, representing€6 billion. As of December 31, 2016, €4,184.6 million ofthis amount had been used, of which €284.6 millionissued in US dollars. The EMTN programme was extendedon November 17, 2016 for a further one-year period. Kering’sshort-term debt is rated “A2” by Standard & Poor’s, whileits long-term debt is rated “BBB” with a stable outlook.
The Group’s bonds and bank lines of credit are governed bythe standard commitment and default clauses customarilyincluded in this type of agreement: pari passu ranking, anegative-pledge clause that limits the security that can begranted to other lenders, and a cross-default obligation.The bonds issued within the scope of the EMTN programme
2532016 Reference Document ~ Kering

In accordance with the AMF’s recommendations, thissection deals only with risks identified by the Group ashaving a potentially significant impact.
Macro-economic instability
Growth of the Luxury and Sport & Lifestyle markets is closelylinked to growth in the world economy. More particularly,these markets are driven by trends in "discretionary"consumption, which accounts for a varying percentage oftotal household spending depending on the maturity ofan economy, and therefore differs between developedand emerging markets.
Discretionary consumption is sensitive to any weaknessin global economic growth or a deterioration in themacroeconomic or geopolitical environment of a givencountry or region. This can impact consumer confidence,and lead consumers to limit or postpone any "non-essential" purchases.
These spending decisions can also be influenced by factorssuch as political instability, security threats, exchange ratevolatility, and changes in customs or tax policies which canalter consumers’ expectations and purchasing behaviour,for example by impacting their purchasing power anddisrupting tourist flows. 2015 saw strong currencyvolatility, shaped by a weaker euro and yen and a strongerUS dollar. The resulting price differentials prompted a risein spending in eurozone countries and in Japan by Asiantourists, and particularly those from continental China.
These trends reversed in 2016 following the terroristattacks that hit Europe and France in particular, a gradualrebalancing in prices between the world’s regions, and thestimulus measures taken by the Chinese government toincrease spending in the domestic market. Currency volatilityalso eased, although the slump in pound sterling shoredup UK growth in the wake of the Brexit vote and the stronger
yen limited the appeal of spending in Japan for Chinesetourists.
The balanced geographical coverage of Luxury and Sport& Lifestyle activities limits the Kering group’s exposure toexchange rate volatility and to uncertainties or even adeterioration in the economic conditions or security profileof a given country. The distribution network also enjoysbalanced geographical coverage: sales of Luxury productsare made through a network of 1,305 directly operatedstores including 799 stores in mature markets and 506 inemerging countries, while sales of Sport & Lifestyleproducts are made via a network of 734 directly-operatedstores, of which 454 in emerging markets. Direct sales aresupplemented by sales to third party distributors, and theGroup’s broad spectrum of products makes its lessdependent on any single category.
Both the Group’s market positioning and strategy (seepage 8 et seq. for more details) help limit the impacts ofmacroeconomic cycles and uncertainty on its activities.
As explained in the overviews (pages 18 and 46) describingthe Luxury and Sport & Lifestyle markets, besides cyclicalfactors, the Group is also exposed to structural medium-term growth patterns related to the increase in theworld’s population and changes in the population mix.Over the next few decades, the number of peoplebelonging to the "global middle class" is set to almostdouble, with Asia accounting for the bulk of this growth(source: OECD Observatory). More particularly, according tothe Economist Intelligence Unit (EIU), the upper middleclass in China is expected to grow at an average of 9% perannum between 2015 and 2030, to stand at 480 millionpeople in 2030 (35% of the Chinese population),compared to 132 million people in 2015 (10% of theChinese population), representing 350 million potentialnew consumers.
3.2. Strategic and operational risks
are all subject to change-of-control clauses entitlingbondholders to request early redemption at par ifKering’s rating is downgraded to non-investment gradefollowing a change of control.
In addition, the bonds issued in 2009 include a step-upcoupon clause that applies in the event that Kering’s ratingis downgraded to non-investment grade (see Notes 29.4and 29.5 to the consolidated financial statements).
Kering and Kering Finance SNC confirmed lines of creditinclude a default clause (early repayment) in the event offailure to comply with the following financial covenant:consolidated net debt / EBITDA less than or equal to 3.75(see Note 29.5.3 to the consolidated financial statements).This ratio is calculated based on pro forma data. As ofDecember 31, 2016, Kering and Kering Finance SNC had
not drawn down any of the confirmed lines of creditsubject to this covenant.
Euro bond issues are not subject to any financial ratiocovenants.
The Group was in compliance with all these covenants asof December 31, 2016 and there is no foreseeable risk ofbreach.
Information relating to liquidity risk is presented in Note 29 to the consolidated financial statements,including the breakdown of Group debt by maturity andcurrency, and in Note 30.6 to the consolidated financialstatements, which describes liquidity risk in accordancewith IFRS 7.39.
5 FINANCIAL INFORMATION ~ RISK MANAGEMENT
254 Kering ~ 2016 Reference Document

5RISK MANAGEMENT ~ FINANCIAL INFORMATION
Raw materials and strategic skills
To meet their customers’ expectations, the Luxuryactivities require unhindered availability of raw materialsthat comply with its quality criteria, and sustained skilllevels across its production teams. To this end, the Keringgroup has forged special partnerships with key suppliers,and pursues a policy of actively seeking new partners. Italso develops vertical integration throughout theproduction chain by means of acquisitions or strategicbusiness partnerships in the subcontracting market.
To maintain the know-how of its Luxury activities’ businessesover the long term, Kering runs personnel training andskills preservation initiatives, and internalises a numberof functions that were previously subcontracted.
Fluctuation in raw materials prices
Volatility in the prices of raw materials used by the Luxuryactivities correlates with high demand for leather, skinsand precious stones. Rising prices of the raw materialsused by the Sport & Lifestyle activities stem from variationsin outsourcing costs and in the prices of rubber, cottonand polyester. Rises in production costs can be wholly orpartially offset by corresponding rises in the sale prices offinished products.
Kering pays careful attention to the traceability of supplies,and insists that suppliers and subcontractors complywith legislation and the Group’s Code of ethics. TheLuxury activities are especially attentive to ensuring thatsupplies comply with international standards on miningconditions for gold, diamonds and precious stones. Thesefactors tend to restrict the scope of alternative sourcingoptions for certain materials. The Group is neverthelessstructured in order to regularly seek new suppliers capableof meeting its requirements on these issues.
Commercial appeal and brand value
Kering’s activities are underpinned by powerful globalbrands in the Group’s Luxury and Sport & Lifestylebusinesses. One of the Group’s main operational riskstherefore concerns the loss of commercial appeal andbrand value that could arise from poor consideration ofconsumer expectations, market changes, loss of keypartnerships, problems with product quality, or failure tocomply with the Group’s sustainability principles.
Consequently, as well as investments in communication,advertising and R&D spending, operating investmentsconcern store improvements, developments andrefurbishments (see also the section on operatinginvestments, page 250).
The accounting impacts of impairment losses are describedin Note 19 to the consolidated financial statements forthe year ended December 31, 2016, on page 299.
Consumer expectations
The brands’ creative leadership and the success of itscollections and resulting commercial appeal aremanaged by Creative Departments and their world-renowned designers, and perpetuated by remaining trueto the identity and fundamental values of the brand.Kering’s Sport & Lifestyle activities also play a major roleas trend setters for consumers, by investing in R&D andoffering new products and services.
The inability to anticipate changes in consumer expectationsrepresents a major risk to Kering’s business development.To counter this risk, Kering endeavours to streamline thesupply cycle, cutting lead times between product designand launch phases.
Kering also encourages its Luxury and Sport & Lifestyleactivities to stay ahead of consumer trends by keeping aconstant watch over market trends (attending trade fairs,working with trend forecasting agencies, runningconsumer surveys, etc.).
The Luxury activities are therefore broadening theirofferings, increasing the number of collections anddeveloping new partnerships with renowned designers.
Key partnerships
Partnerships with celebrities, athletes, sports teams andother brands make a significant contribution to enhancingthe Group’s image. Putting in place these partnerships islikely to be costly, particularly in terms of marketing andcommunication, which may not provide the benefits thatare expected (increased business, enhanced brandimage, etc.).
The risk of losing strategic partnerships is mitigated byrenewing major contracts in advance, extending thepartnership portfolio, and paying careful attention to thequality of relationships with figureheads and brandrepresentatives.
Product quality, health and safety risks
Ensuring the quality of goods and compliance withstringent safety standards are among the Group’s mainpriorities.
In order to bring high-quality products to market that arecompliant with these standards, the Group implementsquality control processes covering all of the stages in theproduct lifecycle, from design through to marketing.Products are classified using quality and safety standards,while suppliers are referenced on the basis of technicalaudits and adherence to the Group Suppliers’ Charter inthe Code of ethics. Product quality and safety controls arecarried out at all stages of the production process byquality engineers and accredited laboratories.
Procedures relating to product control are explained ingreater depth in Chapter 3 “Sustainability” of the ReferenceDocument, pages 127 to 129.
2552016 Reference Document ~ Kering

Kering’s Luxury and Sport & Lifestyle activities have “product”crisis management units. In the event of a known risk,they follow procedures ensuring that immediate andtransparent information is provided to the public, andthat defective products are recalled.
The Group has also taken out civil liability insurance tocover bodily harm or property damage to third partiescaused by products considered defective (see section 3.4“Main existing insurance programmes” page 259).
Image and reputation, respect for ethical rules and integrity
The Group carefully safeguards its image and reputationalassets.
Unfavourable or erroneous media coverage on theGroup’s products or practices, or negative discussions onsocial networks, could damage its image and reputationas well as give consumers a misleading perception of theGroup’s performance, potentially leading to a slowdownin sales.
Consequently, the Group seeks to ensure that no incidentarises due to unethical behaviour on the part of entitiesor individuals under its control, or those with which it hasbusiness dealings.
Each of Kering’s activities has a crisis management policyand unit that liaises with head office.
The Group also monitors adherence by personnel to theKering group Charter, which defines the framework forthe decentralisation of the organisation, and to the Code ofethics (the third edition of which is available in 12 languagesand was circulated to all of the Group’s employees in2013). A Group Ethics Committee has been establishedand is supported by two regional counterparts, the Asia-Pacific Ethics Committee and the Americas EthicsCommittee. All three Committees can be contacted via ahotline from 74 countries, operating in 12 languages.
The Group regularly examines ways to adapt thesedocuments to its organisation, ensures that suppliersadhere to the Group Suppliers’ Charter, which they arerequired to promote within their production units, andmonitors compliance by means of social audits atproduction sites (see Chapter 3 “Sustainability” of theReference Document, pages 120 to 126).
All of the Luxury activities implement appropriatemethods and steps to ensure their activities comply withthe Group’s Corporate Social Responsibility (CSR)standards: SA8000 and RJC certification, social audits andsupplier training programmes are examples of theactions and programmes that the brands have put inplace in their day-to-day operations.
The Sport & Lifestyle activities also ensure that theirsuppliers respect the Group’s CSR standards. PUMA forexample monitors suppliers’ observance of its SocialAccountability and Fundamental Environmental (SAFE)
standards, which prohibit child labour, unethicalemployment conditions, environmental damage and anybusiness relationships with criminal organisations.
Identity theft and false information
As a listed company on a regulated market, Kering isparticularly exposed to the risk of the circulation of falseinformation, the spreading of unfounded rumours andthe risk of identity theft. A significant increase in the riskof external fraud has been observed in a variety of forms,including fake president fraud, supplier fraud, cyber-attacks and ransomware.
To counter this growing risk, the Group has put in place alarge number of control and protection measures,including awareness raising and training for at-riskpersonnel, setting out processes and procedures anddeveloping targeted IT security systems.
In addition, Kering participates in peer working groups inorder to reduce exposure to these risks.
Counterfeiting and parallel distribution networks
Kering owns a large array of brands, models, copyrights,patents, designs and know-how, largely through itsLuxury and Sport & Lifestyle activities. This portfolioconstitutes intellectual property and a strategic asset forthe Group.
The distribution of brand products could be threatened ifthe Group’s intellectual property rights were to come intoconflict with the rights of certain competitors.
The Group’s legal departments therefore manage thebrand portfolio and other intellectual property rights, andimplement active and diversified policies to counterbreaches of these rights. Kering actively opposes paralleldistribution networks and illicit networks that sellcounterfeit or copied goods, in particular by working toincrease the traceability of its goods.
Protection of the Group’s intellectual property takes manyforms, from upstream practices of the brand portfolios,to downstream practices, including anti-counterfeitingcustom or police raids or legal action. The costs of monitoringmarkets and tackling counterfeiting, within the brandsand at the Group’s head office, are divided between legaland security functions, or among the stores. These costsare however relatively insignificant at Group level.
Kering also participates in bodies that represent theleading Luxury industry players. The Group prevents sales ofits products by parallel distribution networks by workingto increase the traceability of its goods, prohibiting directsales to these networks and implementing specificmeasures to tighten control over its distribution channels.
5 FINANCIAL INFORMATION ~ RISK MANAGEMENT
256 Kering ~ 2016 Reference Document

5RISK MANAGEMENT ~ FINANCIAL INFORMATION
Dependence on patents, licences and supply contracts
The Group is not significantly dependent on any patents,licences or third-party supply sources.
The Group owns or has licence rights to the trademarks,patents and intellectual property rights that it exploits,free of any restrictions as to right of priority or use (and ofrights likely to restrict such exploitation) in all relevantmarkets. The same applies to the corporate names anddomain names of the subsidiaries or entities, to thenames of the Group’s stores and points of sale and to thetrademarks and signs of the goods and productsmanufactured and marketed by the various Groupentities. This situation does not preclude any of thetrademarks belonging to the Group being licensed tothird parties for the sale of goods or services under itstrademark enhancement policy, as has been the case inperfumes and cosmetics. In all cases, such licensingagreements have been entered into under fair commercialand financial terms and conditions, and have no impacton the ownership of the trademarks and signs belongingto the Group. Further information on contractualobligations and other commitments is provided in Notes 34.2.1 and 34.2.3 to the 2016 consolidatedfinancial statements on pages 332 and 333.
Litigation
Group companies are involved or are likely to be involvedin a number of lawsuits or disputes arising in the normalcourse of business, including litigation with tax, socialsecurity and customs authorities, as well as variousgovernmental and competition authorities. Provisionshave been set aside by the companies for the probablecosts, as estimated by the entities and their experts.According to the Group entities’ experts and advisors, nolitigation currently in progress concerning Groupcompanies presents a risk for the normal operations ofthe Group, or for its future development. Provisions havebeen set aside in the Group’s 2016 consolidated financialstatements to cover all of the abovementioned legalrisks, including the impact of commitments given on thedisposal of controlling interests. None of these risks havebeen qualified as arising outside the scope of normalbusiness for Group companies.
The Group considers that the effective methods andprocedures for identifying and managing its industrialand environmental risks within each of the entitiesconcerned, which rely chiefly on the advice of dulyauthorised external organisations and advisors, meet, inrelevance and proportion, customary technical andprofessional standards under the prevailing regulatoryframework. An active prevention and safety policy is anintegral part of these methods and procedures.
Furthermore, the Group has granted various sellers’representations and warranties in connection withdisposals of controlling interests in subsidiaries madeover the last ten years (see Note 34.1 to the 2016consolidated financial statements, on page 330).
As regards the laws and regulations applicable to theGroup’s activities (excluding possible internationalsanctions that may be imposed against certain countriesbut have no impact on the Group’s activities), Kering’sbusinesses are subject to the same constraints andobligations as those directly applicable to its competitorson its different markets. None of its businesses aresubject to specific rules or exemptions in any of therelevant territories.
The Company is not aware of any foreseeable regulatoryor legislative changes in contradiction with the foregoing.
To the Company’s knowledge, during the last 12 monthsor more, there have been no governmental, legal orarbitration proceedings (including any pending orthreatened proceedings of which the issuer is aware) thathave had in the recent past or are likely to have in thefuture, a significant impact on the financial position orearnings of the Company or the Group.
Legal risks
The Group has a vast array of brands and domain names,as well as know-how and production processes that areunique to Kering. In particular, Kering has establishedlicensing agreements with its subsidiaries and partnerswho use its intellectual property rights, which make up asignificant portion of the Group’s assets.
Kering works to protect these rights and is active in thefight against counterfeiting, as counterfeiting can have animpact on revenue and damage the reputation of theGroup and its products. Initiatives are carried out by theLegal Department of the Group and its brands with thehelp of external advisors and in conjunction with therelevant local authorities.
The Company, aware that some of its employees haveaccess to confidential information, ensures that theyreceive information on best practices and the InternalControl Charter, which help minimise this risk, particularlywith regard to the use of information systems and socialmedia.
Lastly, the Group has formed legal organisations at theregional (Asia, the Americas and Europe), local(subsidiaries) and central levels in order to monitor itsobservance of various applicable laws and regulations.
Talent management
The Group recognises that the talent and creativity of itsemployees are one of the keys to its success. Its capacityto identify, attract and retain staff and nurture their skillsis critical for the Group.
2572016 Reference Document ~ Kering

Kering’s human resources policy therefore seeks topromote a stimulating and rewarding working environment,and to foster attachment to the Group and its values. This isdone by means of training programmes and profit-sharing.Kering also aims to boost its staff’s employability, toencourage internal mobility and to open up prospects forprofessional and personal development (see Chapter 3“Sustainability” of the Reference Document, pages 68 to 71).
Special attention is given to the creative teams, in orderto develop powerful, lasting brand identities.
There is a close relationship between a Luxury brand andits Creative Director, whose attitude has to reflect thevalues of the brand and respect the Group’s own values.The departure of a Creative Director leads to a period ofuncertainty that could have a significant impact on thebrand (particularly in terms of image and reputation, assetwritedowns, etc.). However, all Luxury Goods companieshave had to face and manage this risk at some time.Kering’s brand portfolio nevertheless helps limit theimpact of this risk at Group level. Highly talented CreativeDirectors have recently been appointed by the Group,including Alessandro Michele at Gucci and Demna Gvasaliaat Balenciaga. Others have left the Group, such as HediSlimane at Saint Laurent. However, in appointing AnthonyVaccarello, Kering will pursue the strategy adopted overthe past four years, providing a solid platform from whichto build a successful brand over the long term. And asspecialist media have noted, Anthony Vaccarello’s style isperfectly in tune with Yves Saint Laurent.
Information systems
Most of the Group’s production and transaction processesrely on information systems. The maturity of theinformation systems in use across the Group, as regardssuitability, security, rollout and functionality, is fairlyheterogeneous. The Group runs an ongoing investmentprogramme on the adaptation, improvement, securityand durability of its information systems. Businesscontinuity and recovery plans are regularly updated, andtheir efficacy closely monitored.
With the support of the Luxury and Sport & Lifestyleactivities’ security departments, the Group is introducingdata protection and business continuity plans.
Credit risk
Because of the nature of its businesses, a large proportionof Kering sales is not exposed to customer payment risks.This is true of direct customer sales by the Luxury activities.For sales through wholesalers, there is no strong dependencywhereby loss of particular customers might have asignificant impact on the Group’s business or earnings.
The Sport & Lifestyle activities are more exposed topayment default risks because a significant proportion oftheir products is distributed through wholesalers. Theymanage these risks by constantly monitoring outstanding
receivables. As applicable, provisions are set aside againstthe value of their assets. Credit risk is also minimised byappropriate insurance coverage.
Seasonality of sales
Following the disposals of the retail businesses in 2012and 2013, the Group has focused on the Luxury andSport & Lifestyle sectors. The seasonality of the Group’sactivities has decreased since this repositioning and is nolonger considered a significant risk.
However, for the Group’s Luxury brands, the fourthquarter is the most important in terms of revenue due toyear-end holiday purchases in western countries,although fourth-quarter revenue does not significantlyexceed revenue generated during the first three quartersof the year. In addition, the activity of the Luxury andSport & Lifestyle businesses generally revolves around thetwice-yearly nature of their collections and changes indelivery dates to wholesalers can result in sales beingdeferred from one quarter to the next.
Exceptional factors likely to have major consequences onthe political or macro-economic environment of one ormore of the Group’s main markets can also impact theGroup’s activities and quarterly results and consequentlychange the usual seasonality pattern in a given fiscal year.
Crisis management
Certain major events such as natural disasters, terroristattacks and pandemics could materially impact theGroup’s operations.
The risks related to the materialisation of such events aremitigated by the geographic balance of the Group’sdistribution network, the worldwide locations of itsbrands and the various crisis management units andpolicies described earlier in this chapter.
Crisis management exercises are organised each yearunder the supervision of the Group’s Security Departmentin order to raise awareness among those involved in andresponsible for these processes.
Climate change
The physical effects of climate change are susceptible toimpact the Group’s activities. While its own activities(production and distribution) are relatively unexposeddue to their low carbon footprint (Kering’s activities arenot subject to carbon emissions quota regulations), thisis not the case for the supply chain. The growingfrequency of extreme weather events (drought, flooding,etc.) could have a direct impact on the availability andquality of key raw materials such as cotton, cashmereand silk, which would translate into greater price volatility.A November 2015 report jointly authored with BSR, theglobal non-profit organization that works with a networkof member companies and partners to build a sustainable
5 FINANCIAL INFORMATION ~ RISK MANAGEMENT
258 Kering ~ 2016 Reference Document

5RISK MANAGEMENT ~ FINANCIAL INFORMATION
The Kering risk management policy is based on theongoing identification and evaluation of risks, riskprevention, protection of people and property, and safetyand business continuity plans.
The risk management policy also includes the transfer ofrisks to insurance companies.
Insurance against risks
The Group’s policy of transferring significant risks toinsurance companies is based on:
• achieving the best economic balance between riskcoverage, premiums and self-insurance;
and,
• the insurance available, insurance market constraintsand local regulations.
Coverage is based on the “all risks except those specificallyexcluded” approach, determined by assessing the financialconsequences for the Company of a possible claim,especially in the areas of:
• civil liability: bodily harm or property damage to thirdparties caused by products, fittings and equipment;
• fire, explosions, water damage, etc.;
• operating losses following direct damage.
Insurance coverage is purchased based on an assessmentby site and company of the level of coverage necessary toface reasonably estimated potential occurrences ofdiverse risks (liability, damage and third-party retailercounterparty). This assessment takes account of theanalyses of the insurers underwriting the Group’s risks.
3.4. Risk management
Kering’s international presence exposes it to risks regardingnon-compliance with legislation and national regulations,owing to the complexity and changing nature of regulationschiefly arising from corporate and tax law, customs dutiesand import restrictions applied by certain countries. To
guard against risks of non-compliance due to a lack ofawareness of legislative change, Kering provides theLuxury and Sport & Lifestyle activities with a regulatoryintelligence service through head office and supportcentres in the regions in which the Group operates.
3.3. Compliance risks
world, analyses exposure to climate risk. Entitled ClimateChange: Implications and Strategies for the Luxury FashionSector, it analyses current and future climate risks forcotton, cashmere, vicuña wool, silk and cow-, calf-, sheep-and lambskin leather. In order to mitigate these risks,Kering is acting to make its supply chain more resilient,starting with the Environmental P&L (EP&L). The EP&Lallows Kering to measure its environmental impacts,including its carbon footprint, throughout the value chainand to monetise them. Beyond the risk managementdimension, the EP&L is also used as a management tool toorient the Group towards sustainable sourcing solutionsand to assess the raw materials used in product design.
Property
Due to the extent of the Group’s activity on the propertymarket and the highly-competitive environment, theGroup is exposed to the risk that it may not be able tonegotiate and rent certain locations for its brands underthe best possible conditions.
More generally, the risks inherent to its property businessrelate to (i) the term of contractual commitments, (ii) theinvolvement of third party intermediaries in bothproperty transactions and development, and (iii) the lackof control over sales or economic factors.
However, the Group has set up various measures to limitthese risks, including (i) systematic reviews of contracts,(ii) separate invoicing, (iii) steering Committees for majorprojects, and (iv) the creation of a special department forproject management.
The Group’s property activities are placed under theresponsibility of dedicated, pooled teams that are notintegrated into a specific subsidiary.
These teams are responsible for five different tasks: (i) providing assistance to brands in connection with siteopenings, closures and relocations, (ii) acquiring property,(iii) managing works in stores and offices, (iv) managingowned or leased sites for Kering Corporate, and (v) operatingvarious outlets.
2592016 Reference Document ~ Kering

The insurance schemes now in force in the Group, whichcentralises most purchases of insurance policies such asproperty and casualty risks for subsidiaries, were taken outwith the assistance of internationally recognised insurancebrokers specialised in covering major risks, with reputableinsurers in the industrial risk insurance sector.
Main existing insurance programmes:
• property damage from fire, explosion, floods, machinebreakage, natural disasters affecting its own property:property, furnishings, equipment, merchandise, ITinstallations, and property for which it is responsible, as wellas any resulting operating losses, for any period deemednecessary for normal business activities to resume;
• damage and loss of equipment, merchandise and / orgoods in transit;
• damage resulting from theft, fraud, embezzlement, oracts of malice to valuable assets, data and / or property;
• bodily harm or property damage following constructionwork carried out as project owner (new buildings,renovations, refurbishments, etc.);
• liability for bodily or property damage to third partiesby motorised vehicles belonging to the differentcompanies;
• liability under general and environmental civil liabilityfor “operating risk”, “post-delivery risk” and “risk afterservices rendered”, due to damages caused to thirdparties in the course of the Group’s business;
• non-payment of receivables by third-party retailers,particularly in the event of default or insolvency.
Other insurance contracts are taken out by Group companiesto cover specific risks or to comply with local regulations.
Uninsured risks are exposures for which there is noinsurance coverage offered on the insurance market, or forwhich the cost of available insurance is disproportionatecompared to the potential benefits of the coverage.
The Kering group handles known and manageable risksgiven the current scientific and medical understanding ina manner consistent with other French and internationalindustrial groups with similar types of exposures. This isone of the reasons why the Group is able to place its riskswith insurers ready to deal with the unforeseeable anduncertain consequences of accidents.
Insurance coverage concerns all Group companies.
The levels of coverage in place for the main potentialrisks facing the Group as a whole as of January 1, 2016,were as follows:
• damages, fire, explosions or water damage and theensuing operating losses: €300 million;
• civil liability: €145 million;
• damage to or loss of goods in transit: €25 million;
• fraud and acts of malice to goods and valuables:€20 million.
In order to diversify the sources of its policies and securelasting coverage for highly volatile risks such asearthquakes in Japan, the Group has taken out insurancewith investors against natural disasters, which is bothindemnity-based and parametric.
Since the insurance market is currently more favourablefor these risks, this mechanism was discontinued onNovember 30, 2016.
The total risk financing cost for Kering includes two mainitems (in addition to “physical” protection and preventionexpenditure) and breaks down as follows:
• cost of deductibles and non-insured losses retained orself-insured by the subsidiaries in 2016: €0.988 million;
• claims covered by the Group itself through itsreinsurance company in 2016: €4.129 million (totalestimated at year-end 2016).
Taking out self-insurance through the Group’s reinsurancesubsidiary reduces insurance costs and enhancesperformance because (i) frequently occurring risks arepooled within the Group and insured for an amount thatis fixed per claim and (ii) exceptionally frequent claimsmade in a given year are covered by reinsurance.
Since July 1, 2016, the Group’s reinsurance company hascovered damage and operating losses of up to €5 millionper claim (for the period from July 1 to June 30):
• insurance premiums and management fees includingengineering visits and brokers fees, etc. (final 2016expenses): €17 million.
Specific additional policies may also be taken out bycertain companies or businesses or by virtue of localspecificities in certain countries (occupational accidents,contributions to natural disaster funds, etc.). These aremanaged at the level of each company and / or country.
Kering ~ 2016 Reference Document260
FINANCIAL INFORMATION ~ RISK MANAGEMENT5

5CONSOLIDATED FINANCIAL STATEMENTS AS OF DECEMBER 31, 2016 ~ FINANCIAL INFORMATION
4. Consolidated financial statementsas of December 31, 2016
4.1. Consolidated income statement for the years ended December 31, 2016 and 2015
(in € millions) Notes 2016 2015
CONTINUING OPERATIONS
Revenue 5 12,384.9 11,584.2Cost of sales (4,595.3) (4,510.0)
Gross margin 7,789.6 7,074.2
Payroll expenses 6-7 (1,983.7) (1,820.6)Other recurring operating income and expenses (3,919.7) (3,606.9)
Recurring operating income 8 1,886.2 1,646.7
Other non-recurring operating income and expenses 9 (506.0) (393.5)
Operating income 1,380.2 1,253.2
Finance costs, net 10 (201.8) (249.1)
Income before tax 1,178.4 1,004.1
Corporate income tax 11 (296.1) (321.7)Share in earnings (losses) of equity-accounted companies (2.2) (2.2)
Net income from continuing operations 880.1 680.2
o / w attributable to owners of the parent 825.1 655.0o / w attributable to non-controlling interests 15 55.0 25.2
DISCONTINUED OPERATIONS
Net income (loss) from discontinued operations 12 (11.6) 41.0
o / w attributable to owners of the parent (11.6) 41.0o / w attributable to non-controlling interests
Net income of consolidated companies 868.5 721.2
o / w attributable to owners of the parent 813.5 696.0o / w attributable to non-controlling interests 15 55.0 25.2
Net income attributable to owners of the parent 813.5 696.0
Earnings per share (in €) 13.1 6.46 5.52Fully diluted earnings per share (in €) 13.1 6.46 5.52
Net income from continuing operations attributable to owners of the parent 825.1 655.0
Earnings per share (in €) 13.1 6.55 5.20Fully diluted earnings per share (in €) 13.1 6.55 5.20
Net income from continuing operations (excluding non-recurring items) attributable to owners of the parent 1,281.9 1,017.3
Earnings per share (in €) 13.2 10.17 8.07Fully diluted earnings per share (in €) 13.2 10.17 8.07
2612016 Reference Document ~ Kering
05_D_VA_V4 04/04/2017 13:20 Page261

5 FINANCIAL INFORMATION ~ CONSOLIDATED FINANCIAL STATEMENTS AS OF DECEMBER 31, 2016
262 Kering ~ 2016 Reference Document
4.2. Consolidated statement of comprehensive incomefor the years ended December 31, 2016 and 2015
(in € millions) Notes 2016 2015
Net income 868.5 721.2
Actuarial gains and losses(1) (3.2) (29.7)
Total items not reclassified to income (3.2) (29.7)
Foreign exchange gains and losses 29.3 125.6Cash flow hedges(1) 31.5 74.9Available-for-sale financial assets(1) 4.9 0.4
Total items to be reclassified to income 65.7 200.9
Other comprehensive income, net of tax 14 62.5 171.2
Total comprehensive income 931.0 892.4
o / w attributable to owners of the parent 866.8 860.0o / w attributable to non-controlling interests 64.2 32.4
(1) Net of tax.
05_D_VA_V4 04/04/2017 13:20 Page262

5CONSOLIDATED FINANCIAL STATEMENTS AS OF DECEMBER 31, 2016 ~ FINANCIAL INFORMATION
4.3. Consolidated statement of financial position as of December 31, 2016 and 2015
Assets(in € millions) Notes Dec. 31, 2016 Dec. 31, 2015
Goodwill 16 3,533.5 3,758.8Brands and other intangible assets 17 11,272.7 11,285.5Property, plant and equipment 18 2,206.5 2,073.0Investments in equity-accounted companies 20 48.3 20.9Non-current financial assets 21 480.4 458.4Deferred tax assets 11.2 927.0 849.6Other non-current assets 30.4 39.9
Non-current assets 18,498.8 18,486.1
Inventories 22 2,432.2 2,191.2Trade receivables 23 1,196.4 1,137.1Current tax receivables 11.2 105.6 123.8Other current financial assets 24 131.0 81.2Other current assets 24 725.4 685.0Cash and cash equivalents 28 1,049.6 1,146.4
Current assets 5,640.2 5,364.7
TOTAL ASSETS 24,139.0 23,850.8
Equity and liabilities(in € millions) Notes Dec. 31, 2016 Dec. 31, 2015
Share capital 505.2 505.2Capital reserves 2,428.3 2,428.3Treasury shares (5.1)Translation adjustments 87.8 63.6Remeasurement of financial instruments 16.8 (9.9)Other reserves 8,231.6 7,966.2
Equity attributable to owners of the parent 25 11,269.7 10,948.3
Non-controlling interests 15 694.2 674.8
Total equity 25 11,963.9 11,623.1
Non-current borrowings 29 4,185.8 4,039.9Other non-current financial liabilities 30 19.6 14.8Provisions for pensions and other post-employment benefits 26 142.6 133.4Other non-current provisions 27 74.0 82.3Deferred tax liabilities 11.2 2,854.5 2,857.9
Non-current liabilities 7,276.5 7,128.3
Current borrowings 29 1,234.5 1,785.9Other current financial liabilities 24-30 285.9 238.9Trade payables 24 1,098.5 939.7Provisions for pensions and other post-employment benefits 26 8.2 8.9Other current provisions 27 143.7 157.3Current tax liabilities 11.2 398.5 334.6Other current liabilities 24 1,729.3 1,634.1
Current liabilities 4,898.6 5,099.4
TOTAL EQUITY AND LIABILITIES 24,139.0 23,850.8
2632016 Reference Document ~ Kering
05_D_VA_V4 04/04/2017 13:20 Page263

5 FINANCIAL INFORMATION ~ CONSOLIDATED FINANCIAL STATEMENTS AS OF DECEMBER 31, 2016
4.4. Consolidated statement of cash flows for the years ended December 31, 2016 and 2015
(in € millions) Notes 2016 2015
Net income from continuing operations 880.1 680.2Net recurring charges to depreciation, amortisation and provisions on non-current operating assets 432.0 409.6Other non-cash income and expenses 295.0 209.6
Cash flow from operating activities 33.2 1,607.1 1,299.4
Interest paid / received 179.3 168.8Dividends received (0.7) (1.4)Net income tax payable 11.1 386.1 378.5
Cash flow from operating activities before tax, dividends and interest 2,171.8 1,845.3
Change in working capital requirement 24 (84.4) (219.3)Corporate income tax paid 11.2.1 (295.5) (330.4)
Net cash from operating activities 1,791.9 1,295.6
Purchases of property, plant and equipment and intangible assets (611.0) (672.1)Proceeds from disposals of property, plant and equipment and intangible assets 8.5 36.7Acquisitions of subsidiaries, net of cash acquired (4.2) (20.2)Proceeds from disposals of subsidiaries and associates, net of cash transferred (6.0) (5.4)Purchases of other financial assets (87.4) (131.1)Proceeds from disposals of other financial assets 16.4 21.0Interest and dividends received 14.0 12.4
Net cash used in investing activities (669.7) (758.7)
Increase / decrease in share capital and other transactions with owners (0.2) 2.1Treasury share transactions 0.5 (7.3)Dividends paid to owners of the parent company (504.9) (504.9)Dividends paid to non-controlling interests (36.5) (56.6)Bond issues 29-33.3 570.5 1,070.4Debt redemptions / repayments 29-33.3 (51.9) (756.7)Increase / decrease in other borrowings 29-33.3 (1,054.7) 87.3Interest paid and equivalent (186.6) (178.8)
Net cash used in financing activities (1,263.8) (344.5)
Net cash from (used in) discontinued operations 12 (17.7) 3.5Impact of exchange rate variations 13.9 (98.4)
Net increase (decrease) in cash and cash equivalents (145.4) 97.5
Cash and cash equivalents at beginning of year 33.1 902.9 805.4Cash and cash equivalents at end of year 33.1 757.5 902.9
264 Kering ~ 2016 Reference Document
05_D_VA_V4 04/04/2017 13:20 Page264

5CONSOLIDATED FINANCIAL STATEMENTS AS OF DECEMBER 31, 2016 ~ FINANCIAL INFORMATION
4.5. Consolidated statement of changes in equity
(Before appropriation of net income) Other reserves and
Remeasu- net income Equity Number Cumulative rement attributable Owners Non- of shares Share Capital Treasury translation of financial to owners of of the controlling Total
(in € millions) outstanding (1) capital reserves shares adjustments instruments the parent parent interest equity
As of January 1, 2015 126,244,953 505.1 2,427.4 (3.4) (52.9) (86.9) 7,844.8 10,634.1 628.2 11,262.3
Total comprehensive income 116.5 77.0 666.5 860.0 32.4 892.4
Increase / decrease in share capital 12,832 0.1 0.9 1.0 1.0
Treasury shares(3) (6,061) (1.7) (3.6) (5.3) (5.3)
Valuation ofshare-based payment 0.6 0.6 0.6
Dividends paid andinterim dividends (504.9) (504.9) (56.6) (561.5)
Changes in Group structureand other changes (37.2) (37.2) 70.8 33.6
As of December 31, 2015 126,251,724 505.2 2,428.3 (5.1) 63.6 (9.9) 7,966.2 10,948.3 674.8 11,623.1
Total comprehensive income 24.2 26.7 815.9 866.8 64.2 931.0
Increase / decrease in share capital
Treasury shares(3) 27,598 5.1 (4.6) 0.5 0.5
Valuation of share-based payment 0.2 0.2 0.2
Dividends paid andinterim dividends (504.9) (504.9) (36.5) (541.4)
Changes in Group structureand other changes (41.2) (41.2) (8.3) (49.5)
As of December 31, 2016(2) 126,279,322 505.2 2,428.3 87.8 16.8 8,231.6 11,269.7 694.2 11,963.9
(1) Shares with a par value of €4 each.(2) Number of shares outstanding as of December 31, 2016: 126,279,322.(3) Net of tax.
2652016 Reference Document ~ Kering
05_D_VA_V4 04/04/2017 13:20 Page265

5 FINANCIAL INFORMATION ~ CONSOLIDATED FINANCIAL STATEMENTS AS OF DECEMBER 31, 2016
266 Kering ~ 2016 Reference Document
Notes to the consolidated financial statements for the year ended December 31, 2016
Note 1 Introduction 267
Note 2 Accounting policies and methods 267
Note 3 Highlights 278
Note 4 Operating segments 279
Note 5 Revenue 283
Note 6 Payroll expenses and headcount 284
Note 7 Share-based payment 285
Note 8 Recurring operating income 287
Note 9 Other non-recurring operating income and expenses 287
Note 10 Finance costs (net) 288
Note 11 Income taxes 289
Note 12 Discontinued operations 291
Note 13 Earnings per share 293
Note 14 Other comprehensive income 294
Note 15 Non-controlling interests 295
Note 16 Goodwill 296
Note 17 Brands and other intangible assets 297
Note 18 Property, plant and equipment 298
Note 19 Impairment tests on non-financial assets 299
Note 20 Investments in equity – accounted companies 300
Note 21 Non-current financial assets 301
Note 22 Inventories 301
Note 23 Trade receivables 302
Note 24 Other current assets and liabilities 302
Note 25 Equity 303
Note 26 Employee benefits 303
Note 27 Provisions 308
Note 28 Cash and cash equivalents 309
Note 29 Borrowings 310
Note 30 Exposure to interest rate, foreign exchange and equity risk 316
Note 31 Accounting classification and market value of financial instruments 326
Note 32 Net debt 328
Note 33 Statement of cash flows 329
Note 34 Contingent liabilities, contractual commitments not recognised and other contingencies 330
Note 35 Transactions with related parties 334
Note 36 Subsequent events 334
Note 37 List of consolidated subsidiaries as of December 31, 2016 335
Note 38 Statutory Auditors’ remuneration 343
05_D_VA_V4 04/04/2017 13:20 Page266

5CONSOLIDATED FINANCIAL STATEMENTS AS OF DECEMBER 31, 2016 ~ FINANCIAL INFORMATION
2672016 Reference Document ~ Kering
2.1. General principles and statement of compliance
Pursuant to European Regulation No. 1606 / 2002 ofJuly 19, 2002, the consolidated financial statements ofthe Kering group for the year ended December 31, 2016were prepared in accordance with applicable internationalaccounting standards published and adopted by theEuropean Union and mandatorily applicable as of that date.
These international standards comprise InternationalFinancial Reporting Standards (IFRS), InternationalAccounting Standards (IAS) and the interpretations of theInternational Financial Reporting Standards InterpretationsCommittee (IFRS IC).
The financial statements presented do not reflect thedraft standards and interpretations that were at theexposure draft stage with the International AccountingStandards Board (IASB) and the IFRS IC on the date thesefinancial statements were prepared.
All accounting standards and guidance adopted by theEuropean Union may be consulted on the European Unionlaw website at: http://eur-lex.europa.eu / homepage.html.
2.2. IFRS basis adopted
2.2.1. Standards, amendments and interpretationsadopted by the European Union andeffective as of January 1, 2016
The Group has applied the following amendments in itsconsolidated financial statements:
• the amendments to IAS 1, IAS 16, IAS 19 and IAS 38;
• the amendments contained in the Annual Improvementsto IFRSs 2010-2012 cycle and 2012-2014 cycle, publishedin December 2014 and December 2015, respectively.
Applying these amendments did not have any impact onthe Group’s consolidated financial statements.
2.2.2. Standards, amendments and interpretationsadopted by the European Union but notmandatorily applicable as of January 1, 2016
The Group has elected not to early adopt the followingstandards:
• IFRS 9 – Financial Instruments, published in November2016, which sets out the recognition and disclosureprinciples for financial assets and financial liabilities.These principles will ultimately supersede thosecontained in IAS 39 – Financial Instruments as fromJanuary 1, 2018;
• IFRS 15 – Revenue from Contracts with Customers,published in September 2016, which establishes newrevenue recognition principles and will ultimatelysupersede IAS 18 – Revenue as from January 1, 2018.
2.2.3. Standards, amendments and interpretationsthat have not yet been adopted by the European Union
The standards and amendments that have not yet beenadopted by the European Union are as follows:
• IFRS 16 – Leases, which establishes an accountingmodel for the recognition of leases and will ultimatelysupersede IAS 17 – Leases, which the IASB indicates willbe mandatorily applicable as from January 1, 2019;
• the various amendments to IAS 7 and IAS 12, which theIASB indicates will be mandatorily applicable as fromJanuary 1, 2017.
Note 2 – Accounting policies and methods
Kering, the Group’s parent company, is a société anonyme(French joint stock company) with a Board of Directors,incorporated under French law, whose registered office islocated at 40, rue de Sèvres, 75007 Paris, France. It isregistered with the Paris Trade and Companies Registryunder reference 552 075 020 RCS Paris, and is listed onthe Euronext Paris stock exchange.
The consolidated financial statements for the year ended
December 31, 2016 reflect the accounting position of Keringand its subsidiaries, together with its interests inassociates and joint ventures.
On February 9, 2017, the Board of Directors approved theconsolidated financial statements for the year endedDecember 31, 2016 and authorised their publication. Theseconsolidated financial statements will only be considered asfinal after their adoption by the Annual General Meeting.
Note 1 – Introduction
05_D_VA_V4 04/04/2017 13:20 Page267

2.2.4. Expected impacts of future standards,amendments and interpretations
The Group is currently assessing the impacts of IFRS 9 –Financial Instruments, which are not specifically knownat this time. IFRS 9 is applicable as from January 1, 2018.At this stage, the impacts are not expected to be materialfor the Group.
The Group is currently assessing the impacts of IFRS 15 –Revenue from Contracts with Customers, which are notspecifically known at this time. IFRS 15 is applicable asfrom January 1, 2018. Given the nature of its businessactivities, the impacts of this standard are not expectedto be material for the Group. It will therefore apply the“ cumulative catch-up ” transition method.
The Group is currently assessing the impacts of IFRS 16 –Leases, which are not specifically known at this time. IFRS16 is applicable as from January 1, 2019, pendingadoption by the European Union. Given the importanceof the Group’s retail operations, particularly within itsLuxury activities, it leases a large network of ownedstores. The impacts are therefore expected to be highlymaterial, as is the case for other Luxury sector players.These impacts can be estimated based on the obligationsin the operating leases presented in Note 34.2.1. –Contractual obligations).
2.3. Basis of preparation of theconsolidated financial statements
2.3.1. Basis of measurement
The consolidated financial statements are prepared inaccordance with the historical cost convention, with theexception of:
• certain financial assets and liabilities measured at fairvalue;
• defined benefit plan assets measured at fair value;
• liabilities in respect of cash-settled share-based payments(share appreciation rights or SARs) measured at fair value;
• non-current assets held for sale, which are measuredand recognised at the lower of net carrying amount andfair value less costs to sell as soon as their sale isconsidered highly probable. These assets are no longerdepreciated from the time they qualify as assets (ordisposal groups) held for sale.
2.3.2. Use of estimates and judgement
The preparation of consolidated financial statementsrequires Group management to make estimates andassumptions that can affect the carrying amounts ofcertain assets and liabilities, income and expenses, andthe disclosures in the accompanying notes. Groupmanagement reviews these estimates and assumptions
on a regular basis to ensure their pertinence with respectto past experience and the current economic situation. Itemsin future financial statements may differ from currentestimates as a result of changes in these assumptions.The impact of changes in accounting estimates isrecognised during the period in which the change occursand all affected future periods.
The main estimates made by management in thepreparation of the financial statements concern thevaluations and useful lives of operating assets, property,plant and equipment, intangible assets and goodwill, theamount of contingency provisions and other provisionsrelating to operations, and assumptions underlying thecalculation of obligations relating to employee benefits,share- based payment, deferred tax balances and financialinstruments. The Group notably uses discount rateassumptions based on market data to estimate the valueof its long-term assets and liabilities.
The main assumptions made by the Group are detailed inspecific sections of the notes to the consolidatedfinancial statements, and in particular:
• Note 7 – Share-based payment;
• Note 11 – Income taxes;
• Note 19 – Impairment tests on non-financial assets;
• Note 26 – Employee benefits;
• Note 27 – Provisions;
• Note 30 – Exposure to interest rate, foreign exchangeand equity risk;
• Note 31 – Accounting classification and market value offinancial instruments.
In addition to the use of estimates, Group managementuses judgement to determine the appropriate accountingtreatment for certain transactions, pending the clarificationof certain IFRS or where prevailing standards do not coverthe issue at hand. This is notably the case for put optionsgranted to non-controlling interests.
Put options granted to non-controlling interests
The Group has undertaken to repurchase the non-controllinginterests of shareholders of certain subsidiaries. The strikeprice of these put options may be set or determinedaccording to a predefined calculation formula, and theoptions may be exercised at any time or on a specific date.
The appropriate accounting treatment for acquisitions ofadditional shares in a subsidiary after control is obtainedis prescribed by IFRS. As permitted by the Frenchfinancial markets authority (Autorité des marchésfinanciers – AMF), the Group has decided to apply twodifferent accounting methods to these put options,depending on whether they were granted before or afterthe date the revised IFRS 3 first came into effect.
5 FINANCIAL INFORMATION ~ CONSOLIDATED FINANCIAL STATEMENTS AS OF DECEMBER 31, 2016
268 Kering ~ 2016 Reference Document
05_D_VA_V4 04/04/2017 13:20 Page268

Put options granted before January 1, 2009: existing goodwill method retained
The Group records a financial liability in respect of the putoptions granted to holders of non-controlling interests inthe entities concerned. The corresponding non-controllinginterests are derecognised, with an offsetting entry to the financial liability. The difference between the debtrepresenting the commitment to repurchase the non-controlling interests and the carrying amount ofreclassified non-controlling interests is recorded as goodwill.
This liability is initially recognised at the present value ofthe strike price. Subsequent changes in the value of thecommitment are recorded by an adjustment to goodwill.
Put options granted after January 1, 2009
The Group records a financial liability at the present valueof the strike price in respect of the put options granted toholders of non -controlling interests in the entitiesconcerned.
The offsetting entry for this financial liability will differdepending on whether the non-controlling interests havemaintained access at present to the economic benefits ofthe entity.
In the first case (access at present to the economic benefits),non-controlling interests are maintained in the statementof financial position and the liability is recognised againstequity attributable to owners of the parent. In the secondcase, the corresponding non -controlling interests arederecognised. The difference between the debt representingthe commitment to repurchase the non- controllinginterests and the carrying amount of derecognised non-controlling interests is recorded as a deduction fromequity attributable to owners of the parent.
Subsequent changes in the value of the commitment arerecorded by an adjustment to equity.
2.3.3. Statement of cash flows
The Group’s statement of cash flows is prepared inaccordance with IAS 7 – Statement of Cash Flows. TheGroup prepares its statement of cash flows using theindirect method.
2.4. Consolidation principles
The Kering group consolidated financial statementsinclude the financial statements of the companies listedin Note 37 – List of consolidated subsidiaries. Theyinclude the financial statements of companies acquiredas from the acquisition date and companies sold up untilthe date of disposal.
2.4.1. Subsidiaries
Subsidiaries are all entities (including structured entities)over which the Group exercises control. Control is defined
according to three criteria: (i) power over the investee; (ii) exposure, or rights, to variable returns from involvementwith the investee; and (iii) the ability to exert power overthe investee to affect the amount of the investor’sreturns. This definition of control implies that power overan investee can take many forms other than simplyholding voting rights. The existence and effect of potentialvoting rights are considered when assessing control, ifthe rights are substantive. Control generally implies directlyor indirectly holding more than 50% of the voting rightsbut can also exist when less than 50% of the voting rightsare held.
Subsidiaries are consolidated from the effective date ofcontrol.
Inter-company assets and liabilities and transactionsbetween consolidated companies are eliminated. Gainsand losses on internal transactions with controlledcompanies are fully eliminated.
Accounting policies and methods are modified wherenecessary to ensure consistency of accounting treatmentat Group level.
2.4.2. Associates
Associates are all entities in which the Group exercises asignificant influence over the entity’s management andfinancial policy, without exercising control or jointcontrol, and generally implies holding 20% to 50% of thevoting rights.
Associates are recognised using the equity method andinitially measured at cost, except when the associates werepreviously controlled by the Group, in which case they aremeasured at fair value through the income statement asof the date control is lost.
Subsequently, the share in profits or losses of the associateattributable to owners of the parent is recognised in“Share in earnings of associates”, and the share in othercomprehensive income of associates is carried on aseparate line of the statement of comprehensive income.If the Group’s share in the losses of an associate equals orexceeds its investment in that associate, the Group nolonger recognises its share of losses, unless it has legal orconstructive obligations to make payments on behalf ofthe associate.
Goodwill related to an associate is included in the carryingamount of the investment, presented separately within“Investments in associates” in the statement of financialposition.
Gains or losses on internal transactions with equity-accounted associates are eliminated in the amount ofthe Group’s investment in these companies.
The accounting policies and methods of associates aremodified where necessary to ensure consistency ofaccounting treatment at Group level.
5CONSOLIDATED FINANCIAL STATEMENTS AS OF DECEMBER 31, 2016 ~ FINANCIAL INFORMATION
2692016 Reference Document ~ Kering
05_D_VA_V4 04/04/2017 13:20 Page269

2.4.3. Business combinations
Business combinations, where the Group acquires controlof one or more other activities, are recognised using theacquisition method.
Business combinations are recognised and measured inaccordance with the provisions of the revised IFRS 3.Accordingly, the consideration transferred (acquisitionprice) is measured at the fair value of the assetstransferred, equity interests issued and liabilities incurredby the acquirer at the date of exchange. Identifiableassets and liabilities are generally measured at their fairvalue on the acquisition date. Costs directly attributableto the business combination are recognised in expenses.
The excess of the consideration transferred plus theamount of any non-controlling interest in the acquireeover the net fair value of the identifiable assets andliabilities acquired is recognised as goodwill. If thedifference is negative, the gain on the bargain purchase isimmediately recognised in income.
The Group may choose to measure any non-controllinginterests resulting from each business combination at fairvalue (full goodwill method) or at the proportionate sharein the identifiable net assets acquired, which are alsogenerally measured at fair value (partial goodwill method).
Goodwill is determined at the date control over theacquired entity is obtained and may not be adjusted afterthe measurement period. No additional goodwill is recognised on any subsequent acquisition of non-controlling interests. Acquisitions and disposals ofnon -controlling interests are recognised directly inconsolidated equity.
The accounting for a business combination must becompleted within 12 months of the acquisition date. Thisapplies to the measurement of identifiable assets andliabilities, consideration transferred and non-controllinginterests.
2.5. Foreign currency translation
2.5.1. Functional and presentation currency
Items included in the financial statements of each Groupentity are valued using the currency of the primaryeconomic environment in which the entity operates(functional currency). The Group’s consolidated financialstatements are presented in euros, which serves as thepresentation currency.
2.5.2. Foreign currency transactions
Transactions denominated in foreign currencies arerecognised in the entity’s functional currency at theexchange rate prevailing on the transaction date.
Monetary items in foreign currencies are translated at theclosing exchange rate at the end of each reporting period.
Translation adjustments arising from the settlement ofthese items are recognised in income or expenses for theperiod.
Non-monetary items in foreign currencies valued athistorical cost are translated at the rate prevailing on thetransaction date, and non-monetary items in foreigncurrencies measured at fair value are translated at therate prevailing on the date the fair value is determined.When a gain or loss on a non-monetary item is recogniseddirectly in other comprehensive income, the foreignexchange component is also recognised in othercomprehensive income. Otherwise, the component isrecognised in income or expenses for the period.
The treatment of foreign exchange rate hedges in theform of derivatives is described in the section on derivativeinstruments in Note 2.11 – Financial assets and liabilities.
2.5.3. Translation of the financial statements of foreign subsidiaries
The results and financial statements of Group entities witha functional currency that differs from the presentationcurrency are translated into euros as follows:
• items recorded in the statement of financial positionother than equity are translated at the exchange rate atthe end of the reporting period;
• income and cash flow statement items are translatedat the average rate for the period, corresponding to anapproximate value for the rate at the transaction datein the absence of significant fluctuations;
• foreign exchange differences are recognised as translationadjustments in the statement of comprehensive incomeunder other comprehensive income.
Goodwill and fair value adjustments arising from a businesscombination with a foreign activity are recognised in thefunctional currency of the entity acquired. They aresubsequently translated into the Group’s presentationcurrency at the closing exchange rate, and any resultingdifferences are transferred to other comprehensiveincome within the statement of comprehensive income.
2.5.4. Net investment in a foreign subsidiary
Foreign exchange gains or losses arising on thetranslation of a net investment in a foreign subsidiary arerecognised in the consolidated financial statements as aseparate component within the statement of comprehensiveincome, and in income on disposal of the net investment.Foreign exchange gains or losses in respect of foreigncurrency borrowings designated as a net investment in aforeign subsidiary are recognised in other comprehensiveincome (to the extent that the hedge is effective), withinthe statement of comprehensive income, and in incomeon disposal of the net investment.
5 FINANCIAL INFORMATION ~ CONSOLIDATED FINANCIAL STATEMENTS AS OF DECEMBER 31, 2016
270 Kering ~ 2016 Reference Document
05_D_VA_V4 04/04/2017 13:20 Page270
2.6. Goodwill
Goodwill is determined as indicated in Note 2.4.3. –Business combinations.
Goodwill is allocated as of the acquisition date to cash-generating units (CGUs) or groups of CGUs definedby the Group based on the characteristics of the corebusiness, market or geographical segment of each brand.The CGUs or groups of CGUs to which goodwill has beenallocated are tested for impairment during the second halfof each fiscal year or whenever events or circumstancesindicate that an impairment loss is likely.
Impairment tests are described in Note 2.10 – Assetimpairment.
2.7. Brands and other intangible assets
Intangible assets are recognised at cost less accumulatedamortisation and impairment losses.
Intangible assets acquired as part of a business combination,which are controlled by the Group and are separable orarise from contractual or other legal rights, are recognisedseparately from goodwill.
Intangible assets are amortised over their useful lives wherethis is finite and are tested for impairment when there isan indication that they may be impaired. Intangible assetswith indefinite useful lives are not amortised but are testedfor impairment at least annually or more frequently whenthere is an indication that an impairment loss is likely.
Brands representing a predominant category of theGroup’s intangible assets are recognised separately fromgoodwill when they meet the criteria set out in IAS 38.Recognition and durability criteria are then taken intoaccount to assess the useful life of the brand. Most of theGroup’s brands are intangible assets with indefiniteuseful lives.
Impairment tests are described in Note 2.10 – Assetimpairment.
In addition to the projected future cash flows method,the Group applies the royalties method, which consists ofdetermining the value of a brand based on future royaltyrevenue receivable where it is assumed that the brandwill be operated under licence by a third party.
Software acquired as part of recurring operations is usuallyamortised over a period not exceeding 12 months.
Software developed in-house by the Group and meetingall the criteria set out in IAS 38 is capitalised andamortised on a straight-line basis over its useful life,which is generally between three and ten years.
2.8. Property, plant and equipment
Property, plant and equipment are recognised at cost lessaccumulated depreciation and impairment losses withthe exception of land, which is presented at cost less
impairment losses. The various components of property,plant and equipment are recognised separately whentheir estimated useful life and therefore theirdepreciation periods are significantly different. The costof an asset includes the expenses that are directlyattributable to its acquisition.
Subsequent costs are included in the carrying amount ofthe asset or recognised as a separate component, wherenecessary, if it is probable that future economic benefits willflow to the Group and the cost of the asset can be reliablymeasured. All other routine repair and maintenancecosts are expensed in the year they are incurred.
Depreciation is calculated using the straight-line method,based on the purchase or production cost, less any residualvalue which is reviewed annually if considered material,over a period corresponding to the useful life of each assetcategory, i.e., 10 to 40 years for buildings and improvementsto land and buildings, and 3 to 10 years for equipment.
Property, plant and equipment are tested for impairmentwhen an indication of impairment loss exists, such as ascheduled closure, a redundancy plan or a downwardrevision of market forecasts. When the asset’s recoverableamount is less than its net carrying amount, an impairmentloss is recognised. Where the recoverable amount of anindividual asset cannot be determined precisely, theGroup determines the recoverable amount of the CGU orgroup of CGUs to which the asset belongs.
Lease contracts
Agreements whose fulfilment depends on the use of oneor more specific assets and which transfer the right touse the asset are classified as lease contracts.
Lease contracts which transfer to the Group substantiallyall the risks and rewards incidental to ownership of anasset are classified as finance leases.
Assets acquired under finance leases are recognised inproperty, plant and equipment against the correspondingdebt recognised in borrowings for the same amount, atthe lower of the fair value of the asset and the presentvalue of minimum lease payments. The correspondingassets are depreciated over a useful life identical to thatof property, plant and equipment acquired outright, orover the term of the lease, whichever is shorter.
Lease contracts that do not transfer substantially all therisks and rewards incidental to ownership are classifiedas operating leases. Payments made under operatingleases are recognised in recurring operating expenses ona straight-line basis over the term of the lease.
Capital gains on the sale and leaseback of assets arerecognised in full in income at the time of disposal whenthe lease qualifies as an operating lease and thetransaction is performed at fair value.
The same accounting treatment is applied to agreementsthat, while not presenting the legal form of a lease contract,
5CONSOLIDATED FINANCIAL STATEMENTS AS OF DECEMBER 31, 2016 ~ FINANCIAL INFORMATION
2712016 Reference Document ~ Kering
05_D_VA_V4 04/04/2017 13:20 Page271

confer on the Group the right to use a specific asset inexchange for a payment or series of payments.
2.9. Inventories
Inventories are valued at the lower of cost and netrealisable value. Net realisable value is the estimated saleprice in the normal course of operations, net of costs tobe incurred to complete the sale.
The same method for determining costs is adopted forinventories of a similar nature and use within the Group.Inventories are valued using the retail first-in-first-out(FIFO) method or weighted average cost method,depending on the Group activity.
Interest expenses are excluded from inventories andexpensed as finance costs in the year they are incurred.
The Group may recognise an inventory allowance basedon expected turnover if inventory items are damaged,have become wholly or partially obsolete, the selling pricehas declined, or if the estimated costs to completion orto be incurred to make the sale have increased.
2.10. Asset impairment
For the purposes of impairment testing, assets are groupedinto cash-generating units (CGUs), i.e., the smallest groupof assets that generates cash inflows from continuinguse, that are largely independent of the cash inflows fromother assets or CGUs. Goodwill arising from a businesscombination is allocated to CGUs or groups of CGUs thatare expected to benefit from the synergies of thecombination.
CGUs comprising goodwill and / or intangible assets withindefinite useful lives, such as certain brands, are testedfor impairment at least annually during the second halfof each reporting period.
An impairment test is also performed for all CGUs whenevents or circumstances indicate that they may beimpaired. Such events or circumstances concern materialunfavourable changes of a permanent nature affectingeither the economic environment or the assumptions orobjectives used on the acquisition date of the assets.
Impairment tests seek to determine whether the recoverableamount of a CGU is less than its net carrying amount.
The recoverable amount of a CGU is the higher of its fairvalue less costs to sell and its value in use.
The value in use is determined with respect to futurecash flow projections, taking into account the time valueof money and the specific risks attributable to the asset,CGU or group of CGUs.
Future cash flow projections are based on medium-termbudgets and plans. These plans are drawn up for a periodof four years with the exception of certain CGUs or groups
of CGUs undergoing strategic repositioning, for which alonger period may be applied. To calculate value in use, aterminal value equal to the perpetual capitalisation of anormative annual cash flow is added to the estimatedfuture cash flows.
Fair value corresponds to the price that would bereceived to sell an asset or paid to transfer a liability in anorderly transaction between market participants at themeasurement date. These values are determined basedon market data (comparison with similar listedcompanies, values adopted in recent transactions andstock market prices).
When the CGU’s recoverable amount is less than its netcarrying amount, an impairment loss is recognised.
Impairment is charged first to goodwill where appropriate,and recognised under “Other non-recurring operatingincome and expenses” in the income statement as partof operating income.
Impairment losses recognised in respect of property,plant and equipment and other intangible assets may bereversed at a later date if there is an indication that theimpairment loss no longer exists or has decreased.Impairment losses in respect of goodwill may not be reversed.
Goodwill relating to the partial disposal of a CGU ismeasured on a proportionate basis, except where analternative method is more appropriate.
2.11. Financial assets and liabilities
Derivative instruments are recognised in the statement offinancial position at fair value, in assets (positive fairvalue) or liabilities (negative fair value).
2.11.1. Financial assets
Pursuant to IAS 39, financial assets are classified withinone of the following four categories:
• financial assets at fair value through the incomestatement;
• loans and receivables;
• held-to-maturity investments;
• available-for-sale financial assets.
The classification determines the accounting treatmentfor the instrument. It is defined by the Group on the initialrecognition date, based on the objective behind theasset’s purchase. Purchases and sales of financial assetsare recognised on the trade date, which is the date theGroup is committed to the purchase or sale of the asset.A financial asset is derecognised if the contractual rightsto the cash flows from the financial asset expire or theasset is transferred.
5 FINANCIAL INFORMATION ~ CONSOLIDATED FINANCIAL STATEMENTS AS OF DECEMBER 31, 2016
272 Kering ~ 2016 Reference Document
05_D_VA_V4 04/04/2017 13:20 Page272

5CONSOLIDATED FINANCIAL STATEMENTS AS OF DECEMBER 31, 2016 ~ FINANCIAL INFORMATION
2732016 Reference Document ~ Kering
1. Financial assets at fair value through the income statement
These are financial assets held by the Group for short-termprofit, or assets voluntarily classified in this category.
These assets are measured at fair value, with changes infair value recognised in income.
They primarily comprise eligible money-market funds(OPCVMs) classified as current assets under cash equivalents,as well as derivatives not designated as hedginginstruments within a hedging relationship.
2. Loans and receivables
Loans and receivables are non-derivative financial assetswith fixed or determinable payments that are not listed inan active market and are not held for trading purposes orclassified as available for sale.
These assets are initially recognised at fair value andsubsequently at amortised cost using the effective interestmethod. For short term receivables without a statedinterest rate, fair value and amortised cost approximatethe amount of the original invoice unless the effectiveinterest rate has a material impact.
These assets are subject to impairment tests when thereis an indication of impairment loss. An impairment loss isrecognised if the carrying amount exceeds the estimatedrecoverable amount.
Loans and receivables due from non-consolidatedinvestments, deposits and guarantees, trade receivablesand other short-term receivables are included in thiscategory and are presented in non-current financialassets, trade receivables and other current financialassets in the statement of financial position.
3. Held-to-maturity investments
Held-to-maturity investments are non-derivativefinancial assets, other than loans or receivables, withfixed or determinable payments and a fixed maturity thatthe Group has the positive intention and ability to hold tomaturity. These assets are initially recognised at fair valueand subsequently at amortised cost using the effectiveinterest method.
These assets are subject to impairment tests when thereis an indication of impairment loss. An impairment loss isrecognised if the carrying amount exceeds the estimatedrecoverable amount.
Held-to-maturity investments are presented in non-currentfinancial assets.
4. Available-for-sale financial assets
Available-for-sale financial assets are non-derivativefinancial assets that are not included in the aforementionedcategories. They are recognised at fair value. Unrealisedcapital gains or losses are recognised in other comprehensiveincome until the disposal of the assets. However, where
there is an objective indication of loss in value of anavailable-for-sale financial asset, the accumulated loss isrecognised in income. Impairment losses recognised inrespect of shares cannot be reversed through the incomestatement at the end of a subsequent reporting period.
For listed securities, fair value corresponds to a marketprice. For unlisted securities, fair value is determined byreference to recent transactions or using valuationtechniques based on reliable and objective indicators.However, when the fair value of a security cannot bereasonably estimated, it is recorded at historical cost.These assets are subject to impairment tests in order toassess whether they are recoverable.
This category mainly comprises non-consolidatedinvestments and marketable securities that do not meetthe definitions of other financial asset categories. Theyare presented in non-current financial assets.
2.11.2. Financial liabilities
The measurement of financial liabilities depends on theirIAS 39 classification. Excluding put options granted tonon-controlling interests, derivative liabilities and financialliabilities accounted for under the fair value option, theGroup recognises all financial liabilities and particularlyborrowings, trade payables and other liabilities initially atfair value less transaction costs and subsequently atamortised cost, using the effective interest method.
The effective interest rate is determined for each transactionand corresponds to the rate that would provide the netcarrying amount of the financial liability by discounting itsestimated future cash flows until maturity or the nearestdate the price is reset to the market rate. The calculationincludes transaction costs and any premiums and / ordiscounts. Transaction costs correspond to the costs directlyattributable to the acquisition or issue of a financial liability.
The net carrying amount of financial liabilities that qualifyas hedged items as part of a fair value hedging relationshipand are valued at amortised cost, is adjusted with respectto the hedged risk.
Hedging relationships are described in the section onderivative instruments.
Financial liabilities accounted for under the fair value option,other than derivative liabilities, are carried at fair value.Changes in fair value are taken to the income statement.Transaction costs incurred in setting up these financialliabilities are recognised immediately in expenses.
2.11.3. Hybrid instruments
Certain financial instruments have both a standard debtcomponent and an equity component.
For the Group, this concerns in particular OCEANE bonds(bonds convertible or exchangeable into new or existingshares).
05_D_VA_V4 04/04/2017 13:20 Page273

Under IAS 32, convertible bonds are considered hybridinstruments insofar as the conversion option provides forthe repayment of the instrument against a fixed numberof equity instruments. There are several components:
• a financial liability (corresponding to the contractualcommitment to pay cash), representing the debtcomponent;
• the option converting the bonds into a fixed number ofordinary shares, offered to the subscriber, similar to acall option written by the issuer, representing an equityinstrument;
• potentially one or more embedded derivatives.
The accounting policies applicable to each of thesecomponents, at the issue date and at the end of eachsubsequent reporting period, are as follows:
• debt component: the amount initially recognised asdebt corresponds to the present value of the futurecash flows arising from interest and principal paymentsat the market rate for a similar bond with no conversionoption. If the convertible bond contains embeddedderivatives closely related to the borrowing within themeaning of IAS 39, the value of these components isallocated to the debt in order to determine the value ofthe equity component. The debt component issubsequently recognised at amortised cost;
• embedded derivatives not closely related to the debtare recognised at fair value with changes in fair valuerecognised in income;
• equity component: the value of the conversion optionis determined by deducting the value of any embeddedderivatives from the amount of the issue less the carryingamount of the debt component. The conversion optioncontinues to be recorded in equity at its initial value.Changes in value are not recognised;
• transaction costs are allocated pro rata to each component.
2.11.4. Derivative instruments
The Group uses various financial instruments to reduceits exposure to foreign exchange, interest rate and equityrisk. These instruments are listed on organised marketsor traded over the counter with leading counterparties.
All derivatives are recognised in the statement of financialposition under other current or non-current assets andliabilities depending on their maturity and accountingclassification, and are valued at fair value as of the tradedate. Changes in the fair value of derivatives are alwaysrecorded in income except in the case of cash flow andnet investment hedges.
Derivatives designated as hedging instruments areclassified by category of hedge based on the nature of therisks being hedged:
• a cash flow hedge is used to hedge the risk of changes incash flow from recognised assets or liabilities or a highlyprobable transaction that would impact consolidatednet income;
• a fair value hedge is used to hedge the risk of changesin the fair value of recognised assets or liabilities or afirm commitment not yet recognised that would impactconsolidated net income;
• a net investment hedge is used to hedge the foreignexchange risk arising on foreign activities.
Hedge accounting can only be applied if all the followingconditions are met:
• there is a clearly identified, formalised and documentedhedging relationship as of the date of inception;
• the effectiveness of the hedging relationship can bedemonstrated on a prospective and retrospective basis.The results obtained must attain a confidence level ofbetween 80% and 125%.
The accounting treatment of financial instruments qualifiedas hedging instruments, and their impact on the incomestatement and the statement of financial position, dependson the type of hedging relationship:
• cash flow and net investment hedges:- the effective portion of fair value gains and losses on
the hedging instrument is recognised directly in othercomprehensive income. These amounts are releasedto the income statement to match the recognition ofthe hedged items, mainly in gross profit for tradingtransaction hedges and in net finance costs forfinancial transaction hedges,
- the ineffective portion of the hedge is recognised inthe income statement;
• for fair value hedges, the hedged component of theseitems is measured in the statement of financial positionat fair value with respect to the hedged risk. Fair valuegains and losses are recorded in the income statementand are offset, to the extent effective, by matching fairvalue gains and losses on the hedging instrument.
2.11.5. Cash and cash equivalents
The “Cash and cash equivalents” line item recorded on theassets side of the consolidated statement of financialposition comprises cash, mutual or similar funds, short-term investments and other highly liquid instruments thatare readily convertible to known amounts of cash, subject toan insignificant risk of changes in value, and have a maximummaturity of three months as of the purchase date.
Investments with a maturity exceeding three months, andblocked or pledged bank accounts, are excluded fromcash. Bank overdrafts are presented in borrowings on theliabilities side of the statement of financial position.
5 FINANCIAL INFORMATION ~ CONSOLIDATED FINANCIAL STATEMENTS AS OF DECEMBER 31, 2016
274 Kering ~ 2016 Reference Document
05_D_VA_V4 04/04/2017 13:20 Page274

In the statement of cash flows, cash and cash equivalentsinclude accrued interest receivable on assets presentedin cash and cash equivalents and bank overdrafts. Aschedule reconciling cash per the statement of cashflows and per the statement of financial position isprovided in Note 33 – Statement of cash flows.
2.11.6. Definition of consolidated net debt
The concept of net debt used by Group companies comprisesgross debt including accrued interest receivable less netcash as defined by French accounting standards authority(Autorité des normes comptables – ANC) recommendationNo. 2013-03. Net debt includes fair value hedginginstruments recorded in the statement of financialposition relating to bank borrowings and bonds whoseinterest rate risk is fully or partly hedged as part of a fairvalue hedging relationship.
2.12. Treasury shares
Treasury shares, whether specifically allocated for grantto employees or allocated to the liquidity agreement or inany other case, as well as directly related transaction costs,are deducted from consolidated equity. On disposal, theconsideration received for these shares, net of transactioncosts and the related tax impacts, is recognised in equity.
2.13. Treasury share options
Treasury share options are treated according to theircharacteristics as derivative instruments, equity instrumentsor non-derivative financial liabilities.
Options classified as derivatives are recorded at fair valuethrough the income statement. Options classified asequity instruments are recorded in equity for their initialamount. Changes in value are not recognised. Theaccounting treatment of financial liabilities is describedin Note 2.11.2 – Financial liabilities.
2.14. Share-based payment
Free share plans, stock purchase plans and stocksubscription plans are awarded by the Group and settledin shares. In accordance with IFRS 2 – Share-based Payment,the fair value of these plans, determined by reference tothe fair value of services rendered by the beneficiaries, isassessed at the grant date. The mathematical models usedin these calculations are described in Note 7 – Share -based payment.
During the rights vesting period, the fair value of options andfree shares calculated as described above is amortised inproportion to the vesting of rights. This expense is recordedin payroll expenses with an offsetting increase in equity.
Share appreciation rights (SARs) granted by the Group alsoresult in the recognition of payroll expenses spread overthe rights vesting period and a matching liability which ismeasured at fair value through income at the end of eachreporting period.
2.15. Income taxes
The income tax charge for the year comprises the currentand deferred tax charge.
Deferred tax is calculated using the liability method on alltemporary differences between the carrying amountrecorded in the consolidated statement of financialposition and the tax value of assets and liabilities, exceptfor goodwill that is not deductible for tax purposes andcertain other exceptions. The valuation of deferred taxbalances depends on the way in which the Group intendsto recover or settle the carrying amount of assets andliabilities, using tax rates that have been enacted orsubstantively enacted at the end of the reporting period.
Deferred tax assets and liabilities are not discounted andare classified in the statement of financial position withinnon-current assets and liabilities.
A deferred tax asset is recognised on deductible temporarydifferences and for tax loss carry-forwards and tax creditsto the extent that their future offset is probable.
A deferred tax liability is recognised on taxable temporarydifferences relating to investments in subsidiaries, associatesand joint ventures unless the Group is able to control thetiming of the reversal of the temporary difference, and itis probable that the temporary difference will not reversein the foreseeable future.
2.16. Provisions
Provisions for litigation and disputes, and miscellaneouscontingencies and losses are recognised as soon as apresent obligation arises from past events, which is likelyto result in an outflow of resources embodying economicbenefits, the amount of which can be reliably estimated.
Provisions maturing in more than one year are valued atthe discounted amount representing the best estimate ofthe expense necessary to extinguish the current obligationat the end of the reporting period. The discount rate usedreflects current assessments of the time value of moneyand specific risks related to the liability.
A restructuring provision is recognised when there is aformal and detailed restructuring plan and the plan hasbegun to be implemented or its main features have beenannounced before the end of the reporting period.Restructuring costs for which a provision is madeessentially represent employee costs (severance pay,early retirement plans, payment in lieu of notice, etc.),work stoppages and compensation for breaches ofcontract with third parties.
5CONSOLIDATED FINANCIAL STATEMENTS AS OF DECEMBER 31, 2016 ~ FINANCIAL INFORMATION
2752016 Reference Document ~ Kering
05_D_VA_V4 04/04/2017 13:20 Page275

2.17. Post-employment benefits and otherlong-term employee benefits
Based on the laws and practices of each country, theGroup recognises various types of employee benefits.
Under defined contribution plans, the Group is notobliged to make additional payments over and abovecontributions already made to a fund if the fund does nothave sufficient assets to cover the benefits correspondingto services rendered by personnel during the currentperiod and prior periods. Contributions paid into theseplans are expensed as incurred.
Under defined benefit plans, obligations are valued usingthe projected unit credit method based on agreements ineffect in each company. Under this method, each periodof service gives rise to an additional unit of benefitentitlement and each unit is measured separately tobuild up the final obligation. The obligation is thendiscounted. The actuarial assumptions used to determinethe obligations vary according to the economic conditionsof the country where the plan is established. These plansare valued by independent actuaries on an annual basisfor the most significant plans and at regular intervals forthe other plans. The valuations take into account the levelof future compensation, the probable active life ofemployees, life expectancy and staff turnover.
Actuarial gains and losses are primarily due to changes inassumptions and the difference between estimatedresults based on actuarial assumptions and actualresults. All actuarial differences in respect of defined benefitplans are recognised in other comprehensive income.
The past service cost, designating the increase in anobligation following the introduction of a new plan or changesto an existing plan, is expensed immediately whether thebenefit entitlement has already vested or is still vesting.
Expenses relating to this type of plan are recognised inrecurring operating income (service cost) and net financecosts (net interest on the net defined benefit liability orasset). Curtailments, settlements and past service costsare recognised in recurring operating income. The provisionrecognised in the statement of financial position correspondsto the present value of the obligations calculated asdescribed above, less the fair value of plan assets.
2.18. Non-current assets (and disposal groups) held for sale
The Group applies IFRS 5 – Non-current Assets Held for Saleand Discontinued Operations. This requires the separaterecognition and presentation of non-current assets (ordisposal groups) held for sale and discontinued operations.
Non-current assets, or groups of assets and liabilitiesdirectly associated with those assets, are considered asheld for sale if it is highly probable that their carryingamount will be recovered principally through a salerather than through continuing use. Non-current assets(or disposal groups) held for sale are measured andrecognised at the lower of their net carrying amount andtheir fair value less the costs of disposal. These assets areno longer depreciated from the time they qualify as assets(or disposal groups) held for sale. They are presented onseparate lines in the consolidated statement of financialposition, without restatement for previous periods.
A discontinued operation is defined as a component of agroup that generates cash flows that can be clearlydistinguished from the rest of the group and represents aseparate major line of business or geographical area ofoperations. For all periods presented, the net income orloss from these activities is shown on a separate line ofthe income statement (“Discontinued operations”), and isrestated in the statement of cash flows.
2.19. Revenue recognition
Revenue mainly comprises sales of goods for resale,consumer goods and Luxury Goods, together with incomefrom sales-related services, royalties and operating licences.
Revenue is valued at the fair value of the considerationreceived for goods and services sold, royalties and licences,excluding taxes, net of rebates and discounts and afterelimination of inter-company sales.
In the event of deferred payment beyond the usual creditterms that is not assumed by a financing institution, therevenue from the sale is equal to the discounted price,with the difference between the discounted price and thecash payment recognised in financial income over thelife of the deferred payment if the transaction is material.
Sales of goods are recognised when a Group entity hastransferred the risks and rewards incidental to ownershipto the buyer (generally on delivery), when revenue can bereliably measured, when recovery is reasonably assuredand when the probability of the goods being returned canbe estimated with sufficient reliability.
Services such as those directly related to the sale of goodsare recognised over the period in which such services arerendered or, if the Group company acts as an intermediaryin the sale of these services, as of the date the contractualagreement is signed by the customer.
5 FINANCIAL INFORMATION ~ CONSOLIDATED FINANCIAL STATEMENTS AS OF DECEMBER 31, 2016
276 Kering ~ 2016 Reference Document
05_D_VA_V4 04/04/2017 13:20 Page276
2.20. Operating income
Operating income includes all revenue and expenses directlyrelated to Group activities, whether these revenue andexpenses are recurring or arise from non-recurring decisionsor transactions.
Recurring operating income is an analytical balance intendedto facilitate the understanding of the entity’s operatingperformance.
Other non-recurring operating income and expenses consistof items, which by their nature, amount or frequency,could distort the assessment of Group entities’ operatingperformance. Other non-recurring operating income andexpenses include:
• impairment of goodwill and other intangible assets;
• gains or losses on disposals of non-current assets;
• restructuring costs and costs relating to employeeadaptation measures.
2.21. Earnings per share
Earnings per share are calculated by dividing net incomeattributable to owners of the parent by the weightedaverage number of outstanding shares during the year,after deduction of the weighted average number oftreasury shares held by consolidated companies.
Fully diluted earnings per share are calculated byadjusting net income attributable to owners of the parentand the number of outstanding shares for all instrumentsgranting deferred access to the share capital of the Company,whether issued by Kering or one of its subsidiaries.Dilution is determined separately for each instrumentbased on the following conditions:
• when the proceeds corresponding to potential future shareissues are received at the time dilutive securities areissued (e.g., convertible bonds), the numerator is equal tonet income before dilution plus the interest expense thatwould be saved in the event of conversion, net of tax;
• when the proceeds are received at the time the rightsare exercised (e.g., stock subscription options), thedilution attached to the options is determined usingthe treasury shares method (theoretical number ofshares purchased at market price [average over theperiod] based on the proceeds received at the time therights are exercised).
In the case of material non-recurring items, earnings pershare excluding non-recurring items is calculated byadjusting net income attributable to owners of the parentfor non-recurring items net of taxes and non-controllinginterests. Non-recurring items taken into account for thiscalculation correspond to all the items included under“Other non-recurring operating income and expenses” inthe income statement.
2.22. Operating segments
In accordance with IFRS 8 – Operating Segments, segmentinformation is reported on the same basis as usedinternally by the Chairman and Chief Executive Officerand Deputy CEO – the Group’s chief operating decisionmakers – in order to allocate resources to segments andassess their performance.
An operating segment is a component of the Group thatengages in business activities from which it may earnrevenues and incur expenses, whose operating results areregularly reviewed by the entity’s chief operating decisionmaker, and for which discrete financial information isavailable.
Each operating segment is monitored separately forinternal reporting purposes, according to performanceindicators common to all of the Group’s segments.
The segments presented are operating segments orgroups of similar operating segments.
5CONSOLIDATED FINANCIAL STATEMENTS AS OF DECEMBER 31, 2016 ~ FINANCIAL INFORMATION
2772016 Reference Document ~ Kering
05_D_VA_V4 04/04/2017 13:20 Page277

5 FINANCIAL INFORMATION ~ CONSOLIDATED FINANCIAL STATEMENTS AS OF DECEMBER 31, 2016
278 Kering ~ 2016 Reference Document
Creative and managerial change in theLuxury – Couture & Leather Goods division
On March 23, 2016, Brioni announced the appointmentof Justin O’Shea as Creative Director, responsible for thebrand’s collections as well as its image. He held thisposition from April 1 until October 4, 2016. The strategy ofre-energising the Brioni House that began in early 2016was pursued during the course of the year through long-term action plans aimed at strengthening Brioni’spositioning in the men’s ready-to-wear market.
On April 1, 2016, Yves Saint Laurent announced the departureof Hedi Slimane as its Creative & Image Director at theend of a four -year mission which has led to the completerepositioning of the brand. On April 4, 2016, Yves SaintLaurent announced the appointment of AnthonyVaccarello as Creative Director of Yves Saint Laurent. Beforejoining Yves Saint Laurent, Anthony Vaccarello wasCreative Director of his eponymous brand, which hefounded in 2009 following two years at Fendi.
2016 also saw the arrival of new CEOs within the Luxury –Couture & Leather Goods division: Claus-Dietrich Lahrs atBottega Veneta (also appointed a member of the GroupExecutive Committee), Emmanuel Gintzburger at AlexanderMcQueen, Nikolas Talonpoika at Christopher Kane, andCédric Charbit at Balenciaga.
Sport & Lifestyle activities – Sale of Electric
On March 16, 2016, Volcom announced that it had soldthe Electric brand via a management buyout to a groupled by Eric Crane, Electric’s Chief Executive Officer. Thetransaction, which included all the assets of the Electricbrand, did not have a material impact in 2016 as the costof the sale had already been factored in at the end of 2015.
Appointments and corporate governance at Kering
In 2016, Kering announced the appointment of thefollowing new members of the Group Executive Committee:Béatrice Lazat, Human Resources Director, Valérie Duport,Senior Vice President of Communications and Image andJean-Philippe Bailly, Chief Operating Officer. Carlo AlbertoBeretta, who was previously CEO of Bottega Veneta, wasappointed to the newly created post of Chief Client &Marketing Officer at Kering and remains a member of theGroup Executive Committee.
Since January 1, 2016, Kering has combined its SupplyChain, Logistics and Industrial Operations, under theworldwide leadership of Jean-Philippe Bailly.
Bond issue
On May 10, 2016, Kering carried out a €500 million issueof ten-year bonds with a fixed-rate coupon of 1.25%.
Note 3 – Highlights
05_D_VA_V4 04/04/2017 13:20 Page278

5CONSOLIDATED FINANCIAL STATEMENTS AS OF DECEMBER 31, 2016 ~ FINANCIAL INFORMATION
2792016 Reference Document ~ Kering
The policies applied to determine the operating segmentspresented are set out in Note 2.22 – Operating segments.
Information provided on operating segments is preparedin accordance with the same accounting rules as in theconsolidated financial statements and set out in thenotes thereto.
The performance of each operating segment is measuredbased on recurring operating income, which is the methodused by the Group’s chief operating decision maker.
Net recurring charges to depreciation, amortisation andprovisions on non-current operating assets reflect netcharges to depreciation, amortisation and provisions onintangible assets and property, plant and equipmentrecognised in recurring operating income.
Purchases of property, plant and equipment andintangible assets correspond to gross non-current assetpurchases, including cash timing differences butexcluding purchases of assets under finance leases.
Non-current segment assets comprise goodwill, brandsand other intangible assets, property, plant andequipment and other non current assets.
Segment assets comprise non-current segment assets,inventories, trade receivables and other current assets.
Segment liabilities comprise deferred tax liabilities onbrands, trade payables and other current liabilities.
Note 4 – Operating segments
05_D_VA_V4 04/04/2017 13:20 Page279
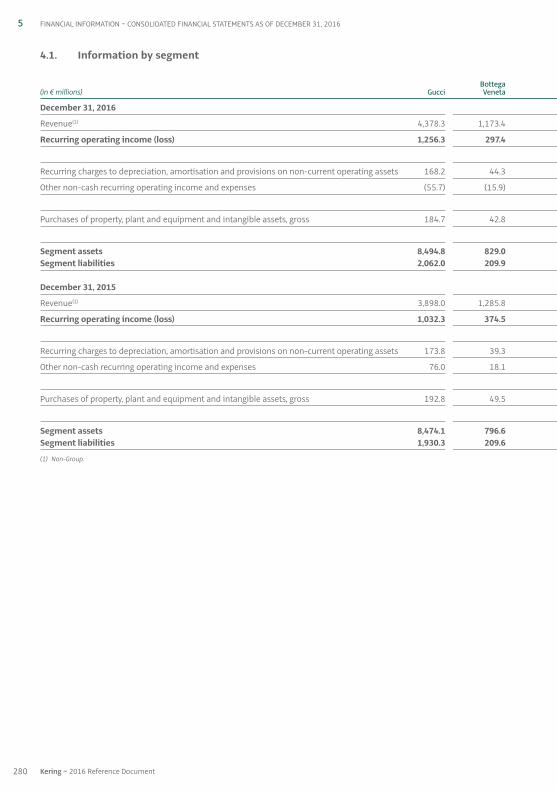
5 FINANCIAL INFORMATION ~ CONSOLIDATED FINANCIAL STATEMENTS AS OF DECEMBER 31, 2016
280 Kering ~ 2016 Reference Document
4.1. Information by segment
Bottega
(in € millions) Gucci Veneta
December 31, 2016
Revenue(1) 4,378.3 1,173.4
Recurring operating income (loss) 1,256.3 297.4
Recurring charges to depreciation, amortisation and provisions on non-current operating assets 168.2 44.3
Other non-cash recurring operating income and expenses (55.7) (15.9)
Purchases of property, plant and equipment and intangible assets, gross 184.7 42.8
Segment assets 8,494.8 829.0 Segment liabilities 2,062.0 209.9
December 31, 2015
Revenue(1) 3,898.0 1,285.8
Recurring operating income (loss) 1,032.3 374.5
Recurring charges to depreciation, amortisation and provisions on non-current operating assets 173.8 39.3
Other non-cash recurring operating income and expenses 76.0 18.1
Purchases of property, plant and equipment and intangible assets, gross 192.8 49.5
Segment assets 8,474.1 796.6 Segment liabilities 1,930.3 209.6
(1) Non-Group.
05_D_VA_V4 04/04/2017 13:20 Page280

5CONSOLIDATED FINANCIAL STATEMENTS AS OF DECEMBER 31, 2016 ~ FINANCIAL INFORMATION
2812016 Reference Document ~ Kering
Other Other Sport & Yves Saint Luxury Luxury Sport & Lifestyle Lifestyle Corporate Laurent brands activities PUMA brands activities and other Total
1,220.2 1,697.5 8,469.4 3,642.2 241.5 3,883.7 31.8 12,384.9
268.5 113.8 1,936.0 126.6 (3.4) 123.2 (173.0) 1,886.2
43.7 63.2 319.4 60.6 6.3 66.9 45.7 432.0
(5.0) (9.2) (85.8) 4.5 (2.0) 2.5 105.7 22.4
57.8 95.2 380.5 84.3 7.8 92.1 138.4 611.0
1,446.5 2,978.9 13,749.2 6,258.9 404.0 6,662.9 985.0 21,397.1 344.8 625.2 3,241.9 1,828.8 139.3 1,968.1 356.9 5,566.9
973.6 1,707.9 7,865.3 3,403.4 279.1 3,682.5 36.4 11,584.2
168.5 132.7 1,708.0 92.4 2.4 94.8 (156.1) 1,646.7
39.4 64.9 317.4 58.3 7.9 66.2 26.0 409.6
17.7 14.5 126.3 0.2 (2.9) (2.7) 134.6 258.2
63.1 85.5 390.9 84.5 6.5 91.0 190.2 672.1
1,419.9 3,201.3 13,891.9 6,148.9 425.1 6,574.0 704.6 21,170.5 308.5 601.8 3,050.2 1,755.2 140.6 1,895.8 369.9 5,315.9
05_D_VA_V4 04/04/2017 13:20 Page281

5 FINANCIAL INFORMATION ~ CONSOLIDATED FINANCIAL STATEMENTS AS OF DECEMBER 31, 2016
282 Kering ~ 2016 Reference Document
(in € millions) 2016 2015
Western Europe 3,885.9 3,562.4North America 2,740.5 2,652.0Japan 1,226.3 1,101.1
Sub-total – mature markets 7,852.7 7,315.5
Eastern Europe, Middle East and Africa 814.3 773.7South America 514.3 538.8Asia Pacific (excluding Japan) 3,203.6 2,956.2
Sub-total – emerging markets 4,532.2 4,268.7
Revenue 12,384.9 11,584.2
4.3. Reconciliation of segment assets and liabilities
(in € millions) 2016 2015
Goodwill 3,533.5 3,758.8Brands and other intangible assets 11,272.7 11,285.5Property, plant and equipment 2,206.5 2,073.0Other non-current assets 30.4 39.9
Non-current segment assets 17,043.1 17,157.2
Inventories 2,432.2 2,191.2Trade receivables 1,196.4 1,137.1Other current assets 725.4 685.0
Segment assets 21,397.1 21,170.5
Investments in equity-accounted companies 48.3 20.9Non-current financial assets 480.4 458.4Deferred tax assets 927.0 849.6Current tax receivables 105.6 123.8Other current financial assets 131.0 81.2Cash and cash equivalents 1,049.6 1,146.4
TOTAL ASSETS 24,139.0 23,850.8
4.2. Information by geographic area
The presentation of revenue by geographic area is basedon the geographic location of customers. Non-currentsegment assets are not broken down by geographic area
since these assets largely consist of goodwill and brands,which are analysed based on the revenue generated ineach region, and not based on their geographic location.
05_D_VA_V4 04/04/2017 13:20 Page282

5CONSOLIDATED FINANCIAL STATEMENTS AS OF DECEMBER 31, 2016 ~ FINANCIAL INFORMATION
2832016 Reference Document ~ Kering
(in € millions) 2016 2015
Deferred tax liabilities on brands 2,739.1 2,742.1Trade payables 1,098.5 939.7Other current liabilities 1,729.3 1,634.1
Segment liabilities 5,566.9 5,315.9
Total equity 11,963.9 11,623.1Non-current borrowings 4,185.8 4,039.9Other non-current financial liabilities 19.6 14.8Non-current provisions for pensions and other post-employment benefits 142.6 133.4Other non-current provisions 74.0 82.3Other deferred tax liabilities 115.4 115.8Current borrowings 1,234.5 1,785.9Other current financial liabilities 285.9 238.9Current provisions for pensions and other post-employment benefits 8.2 8.9Other current provisions 143.7 157.3Current tax liabilities 398.5 334.6
TOTAL EQUITY AND LIABILITIES 24,139.0 23,850.8
Note 5 – Revenue
(in € millions) 2016 2015
Net sales of goods 12,170.5 11,368.1Net sales of services 3.4 3.9Revenue from concessions and licences 167.1 164.0Other revenue 43.9 48.2
TOTAL 12,384.9 11,584.2
05_D_VA_V4 04/04/2017 13:20 Page283

5 FINANCIAL INFORMATION ~ CONSOLIDATED FINANCIAL STATEMENTS AS OF DECEMBER 31, 2016
284 Kering ~ 2016 Reference Document
(in € millions) 2016 2015
Luxury activities (1,265.6) (1,169.4)Sport & Lifestyle activities (532.5) (526.1)Corporate and other (185.6) (125.1)
TOTAL (1,983.7) (1,820.6)
6.2. Average headcount on a full-time equivalent basis by activity
2016 2015
Luxury activities 21,559 21,576Sport & Lifestyle activities 11,873 11,772Corporate and other 2,445 1,349
TOTAL 35,877 34,697
6.3. Headcount on the payroll at year-end by activity
2016 2015
Luxury activities 23,302 23,145Sport & Lifestyle activities 14,065 14,155Corporate and other 2,685 1,501
TOTAL 40,052 38,801
6.1. Payroll expenses by activity
Payroll expenses primarily include fixed and variableremuneration, social security charges, charges relating toemployee profit sharing and other incentives, trainingcosts, share-based payment expenses (as detailed in
Note 7 – Share-based payment) and expenses relating toemployee benefits recognised in recurring operatingincome (as detailed in Note 26 – Employee benefits).
Note 6 – Payroll expenses and headcount
05_D_VA_V4 04/04/2017 13:20 Page284

5CONSOLIDATED FINANCIAL STATEMENTS AS OF DECEMBER 31, 2016 ~ FINANCIAL INFORMATION
2852016 Reference Document ~ Kering
7.1. Cash-settled share-based payment transactions: Kering Monetary Units (KMUs)
Since 2013, the Group has granted certain employees Kering Monetary Units (KMUs), which represent share-basedpayment plans systematically settled in cash.
The unit value of the KMUs awarded (and any changes in that value) is determined based on the intrinsic value of the Keringshare price and in comparison with the average increase in a basket of nine stocks from the Luxury and Sports industries.
Plans based on Kering Monetary Units 2013 Plan 2014 Plan 2015 Plan 2016 Plan
Grant date 07 / 21 / 2013 04 / 22 / 2014 05 / 22 / 2015 05 / 20 / 2016Vesting period 3 years 3 years 3 years 3 yearsExercise period(1) 2 years 2 years 2 years 2 yearsNumber of beneficiaries 264 301 316 323
Number initially granted 124,126 122,643 114,997 126,974
Number of KMUs existing as of Jan. 1, 2016 86,379 110,797 114,716 -
Number awarded in 2016 - - - 126,974Number forfeited in 2016 26,112 10,921 12,860 1,182Number exercised in 2016 51,443 - - -
Number of KMUs existing as of Dec. 31, 2016 8,824 99,876 101,856 125,792
Number exercisable as of Dec. 31, 2016 8,824 N / A N / A N / A
Fair value at measurement date (in €) 152.00 144.00 167.00 166.00Weighted average price of KMUs paid (in €) 165.57 N / A N / A N / A
(1) Vested rights may be exercised over a period of two years, during which beneficiaries can opt to cash out some or all of their KMUs in April or October, at theirdiscretion, based on the most recently determined value.
In 2016, the Group recognised a €23.8 million expense within recurring operating income in respect of vested KMUs(€15.2 million expense in 2015). The 2013 KMU plan gave rise to a cash outflow of €10.5 million in 2016.
In consideration for services rendered, the Group grantscertain employees share-based payment plans settled incash or in shares.
The Group recognises its obligation as services are renderedby the beneficiaries, over the period from the grant dateto the vesting date:
• the grant date is the date on which the plans wereindividually approved by the relevant decision-makingbody (Board of Directors or other) and corresponds tothe initial measurement date of the plans;
• as from the grant date, the rights vesting period is theso-called “lock-in” period during which the specifiedvesting conditions are to be satisfied (service andperformance conditions);
• the exercise date is the date at which all of the specifiedvesting conditions have been satisfied, and as of which thebeneficiaries are entitled to ask for payment of their rights.
Note 7 – Share-based payment
05_D_VA_V4 04/04/2017 13:20 Page285

5 FINANCIAL INFORMATION ~ CONSOLIDATED FINANCIAL STATEMENTS AS OF DECEMBER 31, 2016
7.2. Equity-settled share-based payment transactions: Kering free shares
Kering’s last free share plan was granted to certain employees in 2012. This plan expired in 2016 with no resulting increase incapital (see Note 25 – Equity).
The value of each free share awarded, as determined by an independent expert applying a Black & Scholes-type modelbased on a Monte Carlo algorithm to two underlyings, factored in stock market performance conditions.
In 2016, the Group recognised a €0.2 million expense in respect of the free share plan within recurring operatingincome (€0.6 million expense in 2015).
Free share plan 2012 / 2 Plan
Grant date 04 / 27 / 2012Vesting period 4 yearsExpiry date 04 / 27 / 2016Number of beneficiaries 88
Number initially granted 39,640
Number outstanding as of Jan. 1, 2016 29,140
Number forfeited in 2016 238Number exercised in 2016 -Number of shares issued 28,902Number expired in 2016 -
Number outstanding as of Dec. 31, 2016 -Number exercisable as of Dec. 31, 2016 -
Main actuarial assumptions – Volatility(1) 29.00%– Risk-free interest rate(2) 0.97%
Fair value at measurement date (in €) 74.62
(1) The volatility indicated is the expected volatility of the plan in light of the maturity and strike price available at the grant date. The dividends used for valuationpurposes are those expected by the market at the grant date.
(2) The risk-free interest rates correspond to the one-to-ten year interest rate curve for interbank swaps at the grant date.
7.3. Share-based payment transactions settled in PUMA SE equity instruments
In 2008, PUMA set up a stock subscription option plan for certain employees based on its own shares and on stockmarket performance conditions.
2008 / IV Plan 2008 / V Plan Subscription Subscription options options
Grant date 4 / 15 / 2011 4 / 30 / 2012Vesting period 2 years 2 yearsExpiry date 4 / 21 / 2016 4 / 21 / 2017
Number initially granted 151,290 145,375
Number outstanding as of Jan. 1, 2016 101,463 106,969
Number exercised in 2016 - -Number forfeited / (reinstated) in 2016 101,463 8,485
Number outstanding as of Dec. 31, 2016 - 98,484Number exercisable as of Dec. 31, 2016 - 98,484
Main actuarial assumptions – Volatility 29.20% 26.80%– Risk-free interest rate 2.40% 0.30%
Weighted average price of options exercised (in €) N / A N / A
No expense was recognized in respect of these stock subscription option plans in 2016 or 2015.
286 Kering ~ 2016 Reference Document
05_D_VA_V4 04/04/2017 13:20 Page286

5CONSOLIDATED FINANCIAL STATEMENTS AS OF DECEMBER 31, 2016 ~ FINANCIAL INFORMATION
2872016 Reference Document ~ Kering
Other non-recurring operating income and expensesconsist of unusual items that could distort the assessmentof each brand’s financial performance.
In 2016, other non-recurring operating income andexpenses included:
• impairment of intangible assets (goodwill and brands)within Other Luxury brands (Brioni and Ulysse Nardin) for€296.6 million. This did not impact the Group’s cash (seeNote 19 – Impairment tests on non-financial assets);
• impairment of property, plant and equipment withinLuxury activities and Kering’s industrial operations for€38.8 million;
• costs of restructuring industrial and sales operations,mainly within the Luxury – Couture & Leather Goodsdivision for €57.2 million.
Other items mainly relate to operating losses of €61.5million for Kering Eyewear, which continued to ramp upoperations in 2016 with the launch of the first Guccicollections slated for early 2017, and the outcome ofdisputes arising in prior years.
Pursuant to the agreement with Safilo announced onJanuary 12, 2015 and the payment of €90 million incompensation - of which the first two instalments were paidin January 2015 and December 2016 – the Group recognisedan intangible asset in an amount of €60 million. Theremaining balance was considered to be compensation
Note 8 – Recurring operating income
Recurring operating income and EBITDA are key indicators of the Group’s operating performance.
8.1. Recurring operating income by activity
(in € millions) 2016 2015
Luxury activities 1,936.0 1,708.0Sport & Lifestyle activities 123.2 94.8Corporate and other (173.0) (156.1)
TOTAL 1,886.2 1,646.7
8.2. Reconciliation of recurring operating income with EBITDA
(in € millions) 2016 2015
Recurring operating income 1,886.2 1,646.7
Net recurring charges to depreciation, amortisation and provisions on non current operating assets 432.0 409.6
EBITDA 2,318.2 2,056.3
Note 9 – Other non-recurring operating income and expenses
(in € millions) 2016 2015
Non-recurring operating expenses (520.4) (541.8)
Asset impairment (335.4) (501.8)Restructuring costs (57.2) (39.6)Capital losses on disposals (6.2) -Other (121.6) (0.4)
Non-recurring operating income 14.4 148.3
Capital gains on disposals 7.3 148.3Other 7.1 -
TOTAL (506.0) (393.5)
05_D_VA_V4 04/04/2017 13:20 Page287

5 FINANCIAL INFORMATION ~ CONSOLIDATED FINANCIAL STATEMENTS AS OF DECEMBER 31, 2016
288 Kering ~ 2016 Reference Document
Note 10 – Finance costs (net)
This caption breaks down as follows:
(in € millions) 2016 2015
Cost of net debt (128.3) (128.8)
Income from cash and cash equivalents 8.9 8.9Finance costs at amortised cost (135.6) (136.1)Gains and losses on borrowings hedged by fair value hedges Gains and losses on fair value and cash flow hedging derivatives (1.6) (1.6)
Other financial income and expenses (73.5) (120.3)
Net gains and losses on available-for-sale financial assets (0.7) 0.1Foreign exchange gains and losses (2.8) (14.8)Ineffective portion of cash flow hedges (62.9) (95.1)Gains and losses on derivative instruments not qualifying for hedge accounting (foreign exchange and interest rate hedges) 0.4 (0.3)Impact of discounting assets and liabilities (4.8) (10.2)Other finance costs (2.7) -
TOTAL (201.8) (249.1)
and was recorded in other non-recurring expenses in the2016 financial statements. In light of the additional cashflows expected by the Group, it confirms that it willrecover this intangible asset which will be amortised as ofJanuary 1, 2017.
In 2015, other non-recurring operating income andexpenses included:
• asset impairment totalling €501.8 million, including€123.0 million charged against PUMA goodwill,
€27.0 million charged against the goodwill of one of theOther Luxury brands, and €192.0 million chargedagainst Gucci assets in connection with the brand’scurrent period of transition;
• restructuring costs of €39.6 million, mainly concerningLuxury activities;
• net capital gains on disposals totalling €148.3 million,mainly including the sale of a property complex.
05_D_VA_V4 04/04/2017 13:20 Page288

5CONSOLIDATED FINANCIAL STATEMENTS AS OF DECEMBER 31, 2016 ~ FINANCIAL INFORMATION
2892016 Reference Document ~ Kering
In 2016, the income tax rate applicable in France was thestandard rate of 33.33%, plus the social surtax of 3.3%,bringing the overall rate to 34.43%. The 10.7% one-offlevy for French companies in effect since 2011 wasabolished in 2016.
In 2016 and 2015, “Other” relates mainly to the tax ondividends and the CVAE tax on value-added in France, theIRAP regional production tax in Italy, and taxreassessments.
11.1.2. Reconciliation of the tax rate
(as a % of pre-tax income) 2016 2015
Tax rate applicable in France 34.4% 38.0%
Impact of taxation of foreign subsidiaries -21.5% -18.4%
Theoretical tax rate 14.3% 19.6%
Effect of items taxed at reduced rates 0.1% -Effect of permanent differences 2.2% 2.6%Effect of unrecognised temporary differences -0.2% 1.3%Effect of unrecognised tax losses carried forward 4.1% 4.1%Effect of changes in tax rates 0.9% 0.2%Other 5.1% 4.2%
Effective tax rate 25.1% 32.0%
Income tax expense on dividends was recognised in anamount of €15.1 million in both 2016 and 2015.
The maximum income tax expense on the balance ofdividends to be paid in 2017 in respect of 2016 isestimated at €11.7 million.
Note 11 – Income taxes
11.1. Analysis of the income tax expense in respect of continuing operations
11.1.1. Income tax expense
(in € millions) 2016 2015
Income before tax 1,178.4 1,004.1
Taxes paid out of operating income (386.1) (378.5)Other taxes payable not impacting operating cash flow 10.6 1.5Income tax payable (375.5) (377.0)Deferred tax income / (expense) 79.4 55.3
Total tax charge (296.1) (321.7)
Effective tax rate 25.1% 32.0%
05_D_VA_V4 04/04/2017 13:20 Page289

5 FINANCIAL INFORMATION ~ CONSOLIDATED FINANCIAL STATEMENTS AS OF DECEMBER 31, 2016
290 Kering ~ 2016 Reference Document
11.1.3. Recurring tax rate
(in € millions) 2016 2015
Income before tax 1,178.4 1,004.1Non-recurring items (506.0) (393.5)
Recurring income before tax 1,684.4 1,397.6
Total tax charge (296.1) (321.7)Tax on non-recurring items 49.2 14.8
Recurring tax charge (345.3) (336.5)
Recurring tax rate 20.5% 24.0%
11.2. Movement in statement of financial position headings
11.2.1. Changes in net current tax liabilities
Cash Cash outflows outflows relating to relating to Other items Net operating investing recognised (in € millions) 2015 income activities activities Other(1) in equity 2016
Current tax receivables 123.8 105.6Current tax liabilities (334.6) (398.5)
Net current tax liabilities (210.8) (386.1) 295.5 2.1 (2.5) 8.9 (292.9)
(1) ”Other” includes changes in Group structure and exchange rates, and reclassifications of statement of financial position items.
The income statement impact is described in Note 11.1.1 – Income tax expense.
11.2.2. Changes in deferred tax assets and liabilities
Other items Net recognised (in € millions) 2015 income Other(1) in equity 2016
Intangible assets (2,739.1) 1.7 (5.2) (2,742.6)Property, plant and equipment 55.6 (0.1) (2.6) 52.9Other non-current assets 34.5 18.4 0.4 (0.8) 52.5Other current assets 348.1 47.4 7.0 402.5Total equity (0.4) (0.4)Borrowings (4.9) 5.9 (0.1) 0.9Provisions for pensions and other post-employment benefits 69.8 (1.3) (3.6) 2.1 67.0Provisions 4.2 2.1 0.5 6.8Other current liabilities 84.7 6.5 5.7 4.8 101.7Recognised tax losses and tax credits 139.2 (1.2) (6.8) 131.2
Net deferred tax assets (liabilities) (2,008.3) 79.4 (4.7) 6.1 (1,927.5)
Deferred tax assets 849.6 927.0Deferred tax liabilities (2,857.9) (2,854.5)
Deferred tax (2,008.3) 79.4 (4.7) 6.1 (1,927.5)
(1) ”Other” includes changes in Group structure and exchange rates, and reclassifications of different types of deferred tax items.
The income statement impact is described in Note 11.1.1 – Income tax expense.
05_D_VA_V4 04/04/2017 13:20 Page290

5CONSOLIDATED FINANCIAL STATEMENTS AS OF DECEMBER 31, 2016 ~ FINANCIAL INFORMATION
2912016 Reference Document ~ Kering
For all periods presented, discontinued operations mainlycomprise Redcats and Sergio Rossi. Kering completed thesale of the Redcats group in January 2015 by sellingMovitex (operating the Daxon and Balsamik brands) to itsmanagement team. Discontinued operations as ofDecember 31, 2015 included the proceeds from GroupeFnac’s redemption of its undated deeply subordinatednotes (TSSDI). Sergio Rossi was also sold in 2015 (onDecember 9), to Investindustrial.
Net income (loss) from discontinued operations is shownon a separate line of the income statement and is restatedin the statement of cash flows. Assets and liabilitiesrelating to discontinued operations are not shown onseparate lines of the statement of financial position.
11.3. Unrecognised deferred tax assets
Changes in and maturities of tax losses and tax credits for which no deferred tax assets were recognised in thestatement of financial position can be analysed as follows:
(in € millions)
As of January 1, 2015 2,471.2
Losses generated during the year 110.3Losses utilised and time barred during the year (260.0)Effect of changes in Group structure and exchange rates (46.8)
As of December 31, 2015 2,274.7
Losses generated during the year 105.3Losses utilised and time barred during the year (159.7)Effect of changes in Group structure and exchange rates 20.6
As of December 31, 2016 2,240.9
Ordinary tax loss carry-forwards 347.5Less than five years 180.7More than five years 166.8
Indefinite tax loss carry-forwards 1,893.4
TOTAL 2,240.9
There were no unrecognised deferred taxes in respect of temporary differences relating to investments in subsidiaries,associates and joint ventures.
Note 12 – Discontinued operations
05_D_VA_V4 04/04/2017 13:20 Page291

5 FINANCIAL INFORMATION ~ CONSOLIDATED FINANCIAL STATEMENTS AS OF DECEMBER 31, 2016
292 Kering ~ 2016 Reference Document
12.2. Impact of discontinued operations in the statement of cash flows
(in € millions) 2016 2015
Net cash used in operating activities (17.7) (52.9)Net cash from investing activities - 21.0Net cash from financing activities - 35.4
Net cash from (used in) discontinued operations (17.7) 3.5
In 2016, the Group reported a net loss of €11.6 million inrespect of discontinued operations, due mainly to therevised vendor warranties relating to disposals in priorperiods.
In 2015, the Group reported net income of €41.0 millionfrom discontinued operations, notably including theimpacts of the sale of Sergio Rossi as well as the positiveimpact of the termination of commitments given underprevious sale agreements.
12.1. Impact of discontinued operations in the income statement
(in € millions) 2016 2015
Revenue - 77.9Cost of sales - (40.5)
Gross margin - 37.4
Payroll expenses - (19.4)Other recurring operating income and expenses - (34.0)
Recurring operating income (loss) - (16.0)
Other non-recurring operating income and expenses - (1.8)
Operating income (loss) - (17.8)
Finance costs, net - (0.7)
Income (loss) before tax - (18.5)
Corporate income tax - 1.9Net income (loss) on disposal of discontinued operations (11.6) 57.6
Net income (loss) (11.6) 41.0o / w attributable to owners of the parent (11.6) 41.0o / w attributable to non-controlling interests - -
05_D_VA_V4 04/04/2017 13:20 Page292

5CONSOLIDATED FINANCIAL STATEMENTS AS OF DECEMBER 31, 2016 ~ FINANCIAL INFORMATION
2932016 Reference Document ~ Kering
13.1. Earnings per share
2016 Consolidated Continuing Discontinued
(in € millions) Group operations operations
Net income (loss) attributable to ordinary shareholders 813.5 825.1 (11.6)
Weighted average number of ordinary shares outstanding 126,332,226 126,332,226 126,332,226Weighted average number of treasury shares (332,032) (332,032) (332,032)Weighted average number of ordinary shares 126,000,194 126,000,194 126,000,194
Basic earnings (loss) per share (in €) 6.46 6.55 (0.09)
Net income (loss) attributable to ordinary shareholders 813.5 825.1 (11.6)
Convertible and exchangeable instruments
Diluted net income (loss) attributable to owners of the parent 813.5 825.1 (11.6)
Weighted average number of ordinary shares 126,000,194 126,000,194 126,000,194Potentially dilutive ordinary shares - - -Weighted average number of diluted ordinary shares 126,000,194 126,000,194 126,000,194
Fully diluted earnings (loss) per share (in €) 6.46 6.55 (0.09)
2015 Consolidated Continuing Discontinued
(in € millions) Group operations operations
Net income attributable to ordinary shareholders 696.0 655.0 41.0
Weighted average number of ordinary shares outstanding 126,332,226 126,332,226 126,335,226Weighted average number of treasury shares (335,899) (335,899) (335,899)Weighted average number of ordinary shares 125,996,327 125,996,327 125,999,327
Basic earnings per share (in €) 5.52 5.20 0.33
Net income attributable to ordinary shareholders 696.0 655.0 41.0
Convertible and exchangeable instruments
Diluted net income attributable to owners of the parent 696.0 655.0 41.0
Weighted average number of ordinary shares 125,996,327 125,996,327 125,999,327Potentially dilutive ordinary shares - - -Weighted average number of diluted ordinary shares 125,996,327 125,996,327 125,999,327
Fully diluted earnings per share (in €) 5.52 5.20 0.33
Basic earnings per share are calculated on the basis of theweighted average number of shares outstanding, afterdeduction of the weighted average number of shares heldby consolidated companies.
Fully diluted earnings per share are based on the weightedaverage number of shares as defined above, plus the
weighted average number of potentially dilutive ordinaryshares. Potentially dilutive shares correspond to sharesgranted to employees as part of equity-settled share-basedpayment plans (see Note 7 – Share-based payment).Earnings are adjusted for the theoretical interest charge,net of tax, on convertible and exchangeable instruments.
Note 13 – Earnings per share
05_D_VA_V4 04/04/2017 13:20 Page293

5 FINANCIAL INFORMATION ~ CONSOLIDATED FINANCIAL STATEMENTS AS OF DECEMBER 31, 2016
294 Kering ~ 2016 Reference Document
(in € millions) Gross Income tax Net
Foreign exchange gains and losses 125.6 125.6Cash flow hedges 71.2 3.7 74.9
– change in fair value (184.1) – gains and losses reclassified to income 255.3
Available-for-sale financial assets 0.6 (0.2) 0.4– change in fair value 0.6 – gains and losses reclassified to income
Actuarial gains and losses (31.2) 1.5 (29.7)
Other comprehensive income as of December 31, 2015 166.2 5.0 171.2
The components of other comprehensive income include:
• gains and losses arising from translating the financialstatements of foreign operations;
• the effective portion of gains and losses on cash flowhedging instruments;
• gains and losses on remeasuring available-for-salefinancial assets and other financial instruments;
• components relating to the measurement of employeebenefit obligations: unrecognised surplus of pensionplan assets and actuarial gains and losses on definedbenefit plans.
13.2. Earnings per share from continuing operations excluding non-recurring items
Non-recurring items presented below consist of the income statement line “Other non-recurring operating income andexpenses” (see Note 9 – Other non-recurring operating income and expenses), reported net of tax and non-controllinginterests.
(in € millions) 2016 2015
Net income attributable to ordinary shareholders 825.1 655.0
Other non-recurring operating income and expenses (506.0) (393.5)Income tax on other non-recurring operating income and expenses 49.2 14.8Non-controlling interests in other non-recurring operating income and expenses 16.4
Net income excluding non-recurring items 1,281.9 1,017.3
Weighted average number of ordinary shares outstanding 126,332,226 126,332,226Weighted average number of treasury shares (332,032) (335,899)Weighted average number of ordinary shares 126,000,194 125,996,327
Basic earnings per share excluding non-recurring items (in €) 10.17 8.07
Net income excluding non-recurring items 1,281.9 1,017.3
Convertible and exchangeable instruments
Diluted net income attributable to owners of the parent 1,281.9 1,017.3
Weighted average number of ordinary shares 126,000,194 125,996,327Potentially dilutive ordinary shares Weighted average number of diluted ordinary shares 126,000,194 125,996,327
Fully diluted earnings per share (in €) 10.17 8.07
Note 14 – Other comprehensive income
05_D_VA_V4 04/04/2017 13:20 Page294

5CONSOLIDATED FINANCIAL STATEMENTS AS OF DECEMBER 31, 2016 ~ FINANCIAL INFORMATION
2952016 Reference Document ~ Kering
Note 15 – Non-controlling interests
15.1. Net income attributable to non-controlling interests
(in € millions) 2016 2015
Luxury activities 28.5 15.0Sport & Lifestyle activities 34.9 15.8Corporate and other (8.4) (5.6)
TOTAL 55.0 25.2
15.2. Non-controlling interests in equity
(in € millions) 2016 2015
Luxury activities 161.9 156.8Sport & Lifestyle activities 532.8 511.9Corporate and other (0.5) 6.1
TOTAL 694.2 674.8
A negative amount on the “Gains and losses reclassified toincome” line item corresponds to a gain recognised in theincome statement.
Gains and losses on cash flow hedging instrumentsreclassified to income are recognised under gross margin.
Gains and losses on available-for-sale financial assetsreclassified to income are recognised under net financecosts.
(in € millions) Gross Income tax Net
Foreign exchange gains and losses 29.3 29.3Cash flow hedges 26.7 4.8 31.5
– change in fair value 37.8 – gains and losses reclassified to income (11.1)
Available-for-sale financial assets 5.6 (0.7) 4.9– change in fair value 5.6 – gains and losses reclassified to income
Actuarial gains and losses (5.2) 2.0 (3.2)
Other comprehensive income as of December 31, 2016 56.4 6.1 62.5
05_D_VA_V4 04/04/2017 13:20 Page295

5 FINANCIAL INFORMATION ~ CONSOLIDATED FINANCIAL STATEMENTS AS OF DECEMBER 31, 2016
296 Kering ~ 2016 Reference Document
Note 16 – Goodwill
16.1. Changes in goodwill
Impairment(in € millions) Gross losses Net
Goodwill as of January 1, 2015 4,571.5 (531.6) 4,039.9
Acquisitions 17.2 17.2Allocation of goodwill to identifiable assets and liabilities (187.0) (187.0)Impairment losses (150.0) (150.0)Impact of put options granted to non-controlling shareholders 2.5 2.5Translation adjustments 60.5 (24.3) 36.2
Goodwill as of December 31, 2015 4,464.7 (705.9) 3,758.8
Acquisitions 8.0 8.0Disposals (5.3) 5.3 Impairment losses (235.9) (235.9)Impact of put options granted to non-controlling shareholders 2.0 2.0Translation adjustments 10.5 (9.6) 0.9Other movements 0.1 (0.4) (0.3)
Goodwill as of December 31, 2016 4,480.0 (946.5) 3,533.5
The Group did not carry out any material acquisitions in 2015 or 2016. Note 19.3 – Impairment losses recognised duringthe period, provides details of goodwill impairment recognised in 2015 and 2016.
In 2015, the Group had finalised the Ulysse Nardin purchase price allocation in an amount of €187 million, which includedallocation of a brand value.
16.2. Goodwill by activity
(in € millions) 2016 2015
Luxury activities 2,551.1 2,788.3Sport & Lifestyle activities 977.7 970.5Corporate and other 4.7 -
TOTAL 3,533.5 3,758.8
05_D_VA_V4 04/04/2017 13:20 Page296

5CONSOLIDATED FINANCIAL STATEMENTS AS OF DECEMBER 31, 2016 ~ FINANCIAL INFORMATION
2972016 Reference Document ~ Kering
Note 17 – Brands and other intangible assets
17.1. Changes in brands and other intangible assets
Internally generated Other
intangible intangible (in € millions) Brands assets assets Total
Carrying amount as of December 31, 2015 10,850.5 435.0 11,285.5
Changes in Group structure 5.4 5.4Acquisitions 23.9 107.2 131.1Disposals (2.8) (2.8)Amortisation (98.2) (98.2)Impairment losses (60.7) (3.0) (63.7)Translation adjustments 17.4 (0.8) 16.6Other movements (0.1) (1.1) (1.2)
Carrying amount as of December 31, 2016 10,807.1 23.9 441.7 11,272.7
Gross value as of December 31, 2016 10,890.4 23.9 1,057.3 11,971.6Accumulated amortisation and impairment as of December 31, 2016 (83.3) (615.6) (698.9)
Internally generated Other
intangible intangible (in € millions) Brands assets assets Total
Carrying amount as of December 31, 2014 10,464.8 283.3 10,748.1
Changes in Group structure 319.4 1.6 321.0Acquisitions 210.9 210.9Disposals (1.8) (1.8)Amortisation (65.6) (65.6)Impairment losses (24.5) (24.5)Translation adjustments 90.8 8.8 99.6Other movements (2.2) (2.2)
Carrying amount as of December 31, 2015 10,850.5 435.0 11,285.5
Gross value as of December 31, 2015 10,897.0 948.9 11,845.9Accumulated amortisation and impairment as of December 31, 2015 (46.5) (513.9) (560.4)
Note 19.3 – Impairment losses recognised during the period, provides details of goodwill impairment recognised in2015 and 2016.
17.2. Brands by activity
(in € millions) 2016 2015
Luxury activities 6,886.6 6,943.4Sport & Lifestyle activities 3,920.5 3,907.1
TOTAL 10,807.1 10,850.5
05_D_VA_V4 04/04/2017 13:20 Page297

5 FINANCIAL INFORMATION ~ CONSOLIDATED FINANCIAL STATEMENTS AS OF DECEMBER 31, 2016
298 Kering ~ 2016 Reference Document
Note 18 – Property, plant and equipment
Land and Plant and Other(in € millions) buildings equipment PP&E Total
Carrying amount as of December 31, 2015 757.1 1,067.5 248.4 2,073.0
Changes in Group structure - (1.8) (4.0) (5.8)Acquisitions 43.2 296.5 141.2 480.9Disposals (1.1) (3.6) (0.7) (5.4)Depreciation (27.2) (319.9) (20.6) (367.7)Translation adjustments 8.6 9.4 1.6 19.6Other movements 3.6 176.0 (167.7) 11.9
Carrying amount as of December 31, 2016 784.2 1,224.1 198.2 2,206.5
o / w gross value 1,029.4 2,934.5 325.0 4,288.9o / w depreciation and impairment (245.2) (1,710.4) (126.8) (2,082.4)
Carrying amount as of December 31, 2016 784.2 1,224.1 198.2 2,206.5
o / w assets owned outright 704.0 1,223.8 198.2 2,126.0o / w assets held under finance leases 80.2 0.3 - 80.5
Land and Plant and Other(in € millions) buildings equipment PP&E Total
Carrying amount as of December 31, 2014 718.1 1,025.3 143.8 1,887.2
Changes in Group structure 4.2 7.7 - 11.9Acquisitions 6.1 307.8 166.4 480.3Disposals (6.3) (9.3) (1.6) (17.2)Depreciation (17.0) (371.2) (18.7) (406.9)Translation adjustments 35.7 58.9 2.9 97.5Other movements 16.3 48.3 (44.4) 20.2
Carrying amount as of December 31, 2015 757.1 1,067.5 248.4 2,073.0
o / w gross value 1,001.3 2,662.1 373.8 4,037.2o / w depreciation and impairment (244.2) (1,594.6) (125.4) (1,964.2)
Carrying amount as of December 31, 2015 757.1 1,067.5 248.4 2,073.0
o / w assets owned outright 704.6 1,067.5 248.2 2,020.3o / w assets held under finance leases 52.5 - 0.2 52.7
Charges to depreciation are recognised under “Cost of sales” and “Other recurring operating income and expenses” inthe income statement.
05_D_VA_V4 04/04/2017 13:20 Page298

5CONSOLIDATED FINANCIAL STATEMENTS AS OF DECEMBER 31, 2016 ~ FINANCIAL INFORMATION
2992016 Reference Document ~ Kering
19.2. Impairment tests on major items
In the case of the Gucci CGU, whose goodwill accounts fora significant portion of the goodwill of Luxury activities,the CGU’s recoverable amount was determined on thebasis of its value in use. Value in use is determined withrespect to projected future cash flows, taking intoaccount the time value of money and specific risksassociated with the CGU. Future cash flow projectionswere prepared during the second half of the year on thebasis of budgets and medium-term plans with a four-year timescale. To calculate value in use, a terminal valueequal to the perpetual capitalisation of a normative annualcash flow is added to the estimated future cash flows.
The growth rate used to extrapolate projected cash flowsto perpetuity is 3.0%.
The pre-tax discount rate applied to projected cash flowsis 8.7%.
In the case of the Gucci brand, which is the highest-valued Luxury activities brand, its value based on futureroyalty revenue receivable (where it is assumed that thebrand will be operated under licence by a third party) wascalculated using a royalty rate of 15.0%, a 3.0% perpetualgrowth rate and an 8.3% pre-tax discount rate.
In the case of the PUMA CGU, the CGU’s recoverableamount was determined on the basis of its value in use.
Value in use is determined with respect to projectedfuture cash flows, taking into account the time value ofmoney and specific risks associated with the CGU. Futurecash flow projections were prepared during the secondhalf of the year on the basis of budgets and medium-term plans with a four-year timescale. To calculate value inuse, a terminal value equal to the perpetual capitalisationof a normative annual cash flow is added to the estimatedfuture cash flows.
The growth rate used to extrapolate projected cash flowsto perpetuity is 2.25%.
The pre-tax discount rate applied to projected cash flowsis 10.4%.
For information purposes, PUMA’s market capitalisationwas €3.7 billion as of December 31, 2016. This valuationdoes not represent a relevant indication of impairmentgiven the limited free float and resulting lack of liquidityof the PUMA share. As of December 31, 2016, Kering heldan 85.81% controlling interest in PUMA.
In the case of the PUMA brand, which is the highest-valued Sport & Lifestyle activities brand, its value basedon future royalty revenue receivable (where it is assumedthat the brand will be operated under licence by a thirdparty) was calculated using a royalty rate of 8.0%, a 2.25%perpetual growth rate and a 10.1% pre-tax discount rate.
19.1. Assumptions underlying impairment tests
The pre-tax discount and perpetual growth rates applied to expected cash flows in light of the economic assumptionsand forecast operating conditions retained by the Group are as follows:
Discount rate Perpetual growth rate
2016 2015 2016 20 15
Luxury activities 7.6%-11.6% 8.3%-10.5% 3.0% 3.0%Sport & Lifestyle activities 10.1%-11.9% 9.8%-11.0% 2.25% 2.25%
The growth rates are appropriate in view of the country mix (the Group now operates in regions whose markets areenjoying faster paced growth than in Europe), the rise in the cost of raw materials and inflation.
As discussed in Note 2.10 – Asset impairment, the business plans for certain CGUs are drawn up over longer periods of10 years. These CGUs currently being repositioned are Boucheron, Volcom, Brioni, Sowind, Pomellato, Christopher Kane,Qeelin and Ulysse Nardin.
The principles governing the impairment of non-financialassets are set out in Note 2.10 – Asset impairment.
The main items of goodwill, brands and other intangibleassets are broken down by activity in Note 16 – Goodwill,and Note 17 – Brands and other intangible assets.
Note 19 – Impairment tests on non-financial assets
05_D_VA_V4 04/04/2017 13:20 Page299

5 FINANCIAL INFORMATION ~ CONSOLIDATED FINANCIAL STATEMENTS AS OF DECEMBER 31, 2016
300 Kering ~ 2016 Reference Document
As of December 31, 2016, investments in equity-accountedcompanies mainly comprised shares in Wildemess,Tomas Maier, Altuzarra, WG Alligator Farm and Wall’sGator Farm.
The market value of the Group’s interest in Wildernessamounts to €25.3 million.
Note 20 – Investments in equity – accountedcompanies
(in € millions) 2016 2015
Investments in equity-accounted companies 48.3 20.9
19.3. Impairment losses recognised during the period
The asset impairment tests carried out in 2016 led theGroup to recognise an impairment loss against certainitems of goodwill allocated to the Brioni and UlysseNardin CGUs (€235.9 million) and against the UlysseNardin brand (€60.7 million). These impairment lossesrecognised against the goodwill of Other Luxury brandsresult from the difference between the carrying amountof these CGUs and their recoverable amount. Thedifference between these amounts for Ulysse Nardin ismainly attributable to continued weakness in theWatches segment. The impairment recognised againstBrioni reflects weaker revenue trends in the context ofthe brand’s restructuring.
The expense is recognised in the income statement under“Other non-recurring operating income and expenses” (seeNote 9 – Other non-recurring operating income and expenses).
Besides impairment losses recognised against thegoodwill of these two CGUs and against one of the OtherLuxury brands, the Group considers that, based on eventsthat are foreseeable within reason, any changes impactingthe key assumptions described below would not give riseto the recognition of a significant impairment loss againstother CGUs.
The impairment tests carried out by the Group in 2015 gaverise to the recognition of an impairment loss against thegoodwill of the PUMA CGU (€123.0 million), against thegoodwill of one of the Other Luxury brands (€27.0 million),and against one of the Other Sport & Lifestyle brands(€24.0 million). In the case of PUMA, this loss results fromthe difference between the carrying amount of theseCGUs and their recoverable amount, as well as strongcurrency volatility.
Sensitivity to changes in key assumptions is shown below:
Impairment loss due to: Value of net 10 basis point 10 basis point 10 basis point assets concerned increase in post-tax decrease in perpetual decrease in normative(in € millions) as of Dec. 31, 2016 discount rate growth rate cash flows
Luxury activities 11,314 (9) (6) -
Sport & Lifestyle activities 4,802 - - -
Gucci brand 4,800 - - N / A
PUMA brand 3,500 - - N / A
The Other Luxury brands CGU is sensitive to a rise of 0.1 basis point in the post-tax discount rate and to a decrease of 0.1basis point in the perpetual growth rate.
05_D_VA_V4 04/04/2017 13:20 Page300

5CONSOLIDATED FINANCIAL STATEMENTS AS OF DECEMBER 31, 2016 ~ FINANCIAL INFORMATION
3012016 Reference Document ~ Kering
Note 21 – Non-current financial assets
(in € millions) 2016 2015
Non-consolidated investments 140.7 156.6Available-for-sale financial assets 26.3 20.7Loans and receivables due from non-consolidated investments 48.9 37.3Deposits and guarantees 167.9 157.8Other 96.6 86.0
TOTAL 480.4 458.4
Note 22 – Inventories
(in € millions) 2016 2015
Commercial inventories 2,811.5 2,508.4Industrial inventories 562.8 460.3
Gross amount 3,374.3 2,968.7
Allowances (942.1) (777.5)
Carrying amount 2,432.2 2,191.2
Movements in allowances 2016 2015
As of January 1 (777.5) (609.8)
Additions (277.0) (241.1)Reversals 127.4 196.6Changes in Group structure 4.2 (87.9)Translation adjustments (8.3) (35.3)Other movements (10.9) -
As of December 31 (942.1) (777.5)
No inventories were pledged to secure liabilities as of December 31, 2016 or December 31, 2015.
Changes in gross inventories recognised during the period under “Cost of sales” represented an increase of€334.7 million (decrease of €30.7 million in 2015).
05_D_VA_V4 04/04/2017 13:20 Page301

5 FINANCIAL INFORMATION ~ CONSOLIDATED FINANCIAL STATEMENTS AS OF DECEMBER 31, 2016
302 Kering ~ 2016 Reference Document
Note 23 – Trade receivables
(in € millions) 2016 2015
Trade receivables 1,278.7 1,211.2Allowances (82.3) (74.1)
Carrying amount 1,196.4 1,137.1
Movements in allowances 2016 2015
As of January 1 (74.1) (73.9)
Net (additions) / reversals (3.7) 3.0Changes in Group structure 3.6 0.1Discontinued operations - (1.1)Translation adjustments (0.9) (2.2)Other movements (7.2) -
As of December 31 (82.3) (74.1)
Provisions are calculated on the basis of the probability of recovering the receivables concerned. Trade receivablesbreak down by age as follows:
(in € millions) 2016 2015
Not past due 976.1 915.5Less than one month past due 183.6 147.4One to six months past due 59.4 93.0More than six months past due 59.6 55.3Allowance for doubtful receivables (82.3) (74.1)
Carrying amount 1,196.4 1,137.1
No trade receivables were pledged to secure liabilities during the periods presented.
Given the nature of its activities, the Group’s exposure to customer default would not have a material impact on itsbusiness, financial position or net assets.
Note 24 – Other current assets and liabilities
Working Changes in Translation capital Other Group adjustments (in € millions) 2015 cash flows cash flows structure and other 2016
Inventories 2,191.2 229.4 (6.5) 18.1 2,432.2Trade receivables 1,137.1 61.5 (10.3) 8.1 1,196.4Other financial assets and liabilities (157.7) 0.7 2.1 (154.9)Current tax receivables / payables (210.8) (88.5) (2.5) 8.9 (292.9)Trade payables (939.7) (145.5) 2.1 (15.4) (1,098.5)Other (949.1) (61.0) 4.2 18.9 (16.9) (1,003.9)
Other current assets and liabilities 1,071.0 84.4 (83.6) 1.7 4.9 1,078.4
05_D_VA_V4 04/04/2017 13:20 Page302

5CONSOLIDATED FINANCIAL STATEMENTS AS OF DECEMBER 31, 2016 ~ FINANCIAL INFORMATION
3032016 Reference Document ~ Kering
26.1. Description of the main pension plans and other post-employment benefits
In accordance with the laws and practices in eachcountry, Group employees receive long-term or post-employment benefits in addition to their short-termremuneration. These additional benefits take the form ofdefined contribution or defined benefit plans.
Under defined contribution plans, the Group is notobliged to make any additional payments beyondcontributions already made. Contributions to these plansare expensed as incurred.
An actuarial valuation of defined benefit plans is carriedout by independent experts. These benefits primarilyconcern mandatory supplementary pension plans (LPP)
in Switzerland, a supplementary pension plan in the UK,statutory dismissal compensation (TFR) in Italy, andretirement termination payments and long-servicebonuses in France.
• Mandatory supplementary pension plans (LPP) – Switzerland
In Switzerland, pension plans are defined contributionplans which guarantee a minimum yield and provide fora fixed salary conversion rate on retirement. However, thepension plans operated by the Group’s entities inSwitzerland offer benefits over and above thosestipulated in the LPP / BVG pension law. Consequently, aprovision is booked in respect of defined benefit plansfor the amounts that exceed LPP / BVG pension lawrequirements.
Note 26 – Employee benefits
As of December 31, 2016, the share capital amounted to€505,117,288, comprising 126,279,322 fully paid-upshares with a par value of €4 each (unchanged fromDecember 31, 2015).
25.1. Kering treasury shares and options on Kering shares
In 2016, the Group made a net disposal of 27,598 treasuryshares, resulting from the following transactions:
• the acquisition of 1,556,728 shares under the liquidityagreement;
• the disposal of 1,556,728 shares under the liquidityagreement;
• the acquisition of 1,304 Kering shares to be allotted toemployees under the last 2012 free share plan;
• the allotment of 28,902 shares to employees under the2012 free share plan expiring in April 2016.
No stock subscription options were exercised during 2016.
On May 26, 2004, Kering signed an agreement with a financialbroker in order to improve the liquidity of the Group’sshares and ensure share price stability. This liquidityagreement complies with the Professional Code ofConduct drawn up by the French Association of Financialand Investment Firms (Association française des marchésfinanciers – AMAFI) and approved by the French financialmarkets authority (Autorité des marchés financiers – AMF).The agreement was initially endowed with €40.0 million,half of which was provided in cash and half in Kering
shares. An additional €20.0 million in cash was allocatedto the agreement on September 3, 2004, and a further€30.0 million on December 18, 2007. Since the amendmentdated December 15, 2016, Kering has only maintained acredit balance of €5.0 million in the liquidity account withthe financial broker.
As of December 31, 2016 or December 31, 2015, Keringdid not hold any shares in treasury under the liquidityagreement.
It still held 27,598 shares within the scope of the freeshare plan (see Note 7 – Share-based payment) as ofDecember 31, 2015. Kering’s last free share plan expiredin 2016.
25.2. Appropriation of 2016 net income
At its February 9, 2017 meeting, the Board decided that,at the Annual General Meeting to be held to approve thefinancial statements for the year ended December 31,2016, it will ask shareholders to approve a €4.60 per-share cash dividend for 2016.
An interim dividend amounting to €1.50 per share waspaid on January 18, 2017 pursuant to a decision by theBoard of Directors on December 15, 2016.
The total cash dividend payout in 2017 would thusamount to €580.9 million.
The cash dividend paid for 2015 amounted to €4.00 pershare, representing a total payout of €504.9 million (nodividends are paid on treasury shares).
Note 25 – Equity
05_D_VA_V4 04/04/2017 13:20 Page303

5 FINANCIAL INFORMATION ~ CONSOLIDATED FINANCIAL STATEMENTS AS OF DECEMBER 31, 2016
304 Kering ~ 2016 Reference Document
These pension plans are generally operated as separatelegal entities in the form of a foundation, which may be acollective institution or affiliated to a specific plan. TheBoard of Trustees of these foundations, comprising anequal number of employer and employee representatives,is responsible for administering the plan and bears theinvestment and longevity risks. Collective foundationsinsure some of their risk with an insurance company.
The large majority of plans operated by Kering groupcompanies in Switzerland are currently over-fundedcompared to local practices and no additional funding istherefore required.
• Final salary type supplementary pension plans – UK
In the UK, the Group operates two pension plans: astandard defined contribution plan along with a definedbenefit plan which was closed to new entrants in 2006.
The defined benefit plan is subject to the minimumfunding requirement introduced in the UK by thePensions Act 2004. The value of the plan is assessed atleast once every three years to determine if the minimumfunding requirement is satisfied.
This plan is managed by a Board of Trustees appointed byplan participants. The Board is responsible for obtainingplan valuations, fixing the desired funding threshold andthe contributions payable by the Company, managingbenefit payments, investing plan assets and determininginvestment strategy after consulting with the Company.
• Statutory dismissal compensation (TFR) in Italy
The TFR (Trattamento di Fine Rapporto) plans in Italy werecreated by Act no. 297 adopted on May 29, 1982 and areapplicable to all workers in the private sector on terminationof employment for whatever reason (resignation,termination at the employer’s initiative, death, incapacity,retirement).
Since 2007, companies with at least 50 employees havehad to transfer their TFR funding to an external fundmanager. This concerns the large majority of plansoperated by Kering group companies.
• Retirement termination benefits and long-servicebonuses – France
In France, retirement termination benefits are fixed andpaid by the company to the employee on retirement. Theamount paid depends on the years of service on retirementand is defined in the collective bargaining agreement.The payments do not confer any vested entitlement toemployees until they reach retirement age. Retirementtermination benefits are not related to other statutoryretirement benefits such as pensions paid by social securitybodies or top-up pension funds such as ARRCO andAGIRC in France, which are defined contribution plans.
Long-service bonuses are not compulsory in France (thereis no legal option to pay such awards to employees), buthold a symbolic value. Nevertheless, some of Kering’s Frenchentities choose to pay long-service bonuses after 20, 30,35 and 40 years of service.
05_D_VA_V4 04/04/2017 13:20 Page304

5CONSOLIDATED FINANCIAL STATEMENTS AS OF DECEMBER 31, 2016 ~ FINANCIAL INFORMATION
3052016 Reference Document ~ Kering
As of December 31, 2016, the present value of the benefitobligation amounted to €304.9 million, breaking down as:
• €59.6 million in respect of wholly unfunded plans(€57.3 million as of end-2015);
• €245.3 million in respect of fully or partially fundedplans (€225.2 million as of end-2015).
26.2. Changes in provisions for pensions and other post-employment benefits
(in € millions) Dec. 31, 2016 Other Present Fair value compre- value of plan Financial hensive Expense of obligation assets position Change Provision income recognised
As of January 1 282.5 140.2 142.3 142.3 71.1
Current service cost 16.7 16.7 16.7 (16.7)Curtailments and settlements (4.0) (3.4) (0.6) (0.6) Interest cost 4.3 4.3 4.3 (4.3)Interest income on plan assets 2.3 (2.3) (2.3) 2.3Past service cost (2.6) (2.6) (2.6) 2.6Actuarial gains and losses 18.7 13.5 5.2 5.2 5.2
Impact of changes in demographic assumptions (9.1) (9.1) (9.1) (9.1)
Impact of changes in financial assumptions 30.0 30.0 30.0 30.0
Impact of experience adjustments (2.2) (2.2) (2.2) (2.2) Return on plan assets
(excluding interest income) 13.5 (13.5) (13.5) (13.5)
Benefits paid (8.0) (4.1) (3.9) (3.9) Contributions paid by beneficiaries 5.4 5.4 Contributions paid by employer 7.2 (7.2) (7.2) Changes in Group structure (0.5) (0.2) (0.3) (0.3) Insurance contract (1.3) (1.3) Administrative expense (0.6) 0.6 0.6 (0.6)Exchange differences (6.3) (4.9) (1.4) (1.4)
As of December 31 304.9 154.1 150.8 150.8 76.3 (16.7)
o / w continuing operations 150.8 (16.7)o / w discontinued operations
05_D_VA_V4 04/04/2017 13:20 Page305

5 FINANCIAL INFORMATION ~ CONSOLIDATED FINANCIAL STATEMENTS AS OF DECEMBER 31, 2016
306 Kering ~ 2016 Reference Document
(in € millions) Dec. 31, 2015 Other Present Fair value compre- value of plan Financial hensive Expense of obligation assets position Change Provision income recognised
As of January 1 227.3 106.6 120.7 120.7 102.3
Current service cost 16.0 16.0 16.0 (16.0)Curtailments and settlements (3.2) (3.2) Interest cost 5.4 5.4 5.4 (5.4)Interest income on plan assets 3.0 (3.0) (3.0) 3.0Past service cost (1.1) (1.1) (1.1) 1.1Actuarial gains and losses 7.1 3.2 3.9 3.9 (3.9)
Impact of changes in demographic assumptions (1.7) (1.7) (1.7) 1.7
Impact of changes in financial assumptions 9.3 9.3 9.3 (9.3)
Impact of experience adjustments (0.5) (0.5) (0.5) 0.5 Return on plan assets
(excluding interest income) 3.2 (3.2) (3.2) 3.2
Benefits paid (14.5) (8.3) (6.2) (6.2) Contributions paid by beneficiaries 5.0 5.0 Contributions paid by employer 7.3 (7.3) (7.3) Changes in Group structure 32.7 20.3 12.4 12.4 Discontinued operations (1.6) (1.6) (1.6) (27.3) Insurance contract (1.2) (1.2) Administrative expense (0.7) 0.7 0.7 (0.7)Exchange differences 10.6 8.2 2.4 2.4
As of December 31 282.5 140.2 142.3 142.3 71.1 (18.1)
o / w continuing operations 142.3 (18.1)o / w discontinued operations
26.3. Breakdown of the present value of the benefit obligation by country
(in € millions) 2016 2015
Supplementary pension plans (LPP) – Switzerland 171.3 157.6Supplementary pension plans – United Kingdom 41.6 37.9Statutory dismissal compensation (TFR) – Italy 34.7 33.5Retirement termination benefits – France 21.8 19.9Other 35.5 33.6
Present value of benefit obligation as of December 31 304.9 282.5
26.4. Contributions payable in 2017 by country
(in € millions) Total Switzerland Italy France Other
Employer contributions in respect of 2017 7.2 5.5 - - 1.7
05_D_VA_V4 04/04/2017 13:20 Page306

5CONSOLIDATED FINANCIAL STATEMENTS AS OF DECEMBER 31, 2016 ~ FINANCIAL INFORMATION
3072016 Reference Document ~ Kering
26.5. Fair value of plan assets by type of financial instrument
(in € millions) 2016 % 2015 %
Debt instruments 52.4 34.0% 48.2 34.3%Equity instruments 27.9 18.1% 25.4 18.1%Real estate 22.3 14.5% 16.9 12.1%Investment funds 17.2 11.1% 19.6 14.0%Insurance contracts 15.5 10.0% 16.0 11.4%Derivatives 8.4 5.4% 5.6 4.0%Cash and cash equivalents 3.1 2.0% 2.6 1.9%Other assets 7.3 4.9% 5.9 4.2%
Fair value of plan assets as of December 31 154.1 140.2
26.6. Actuarial assumptions
France Switzerland Italy UK 2016 2015 2016 2015 2016 2015 2016 2015
Average maturity of plans 10.3 12.0 16.3 17.0 12.5 11.0 24.2 24.0Discount rate 1.25% 2.00% 0.35% 0.90% 1.25% 2.00% 2.80% 4.00%Expected rate of increase in salaries 3.18% 3.27% 1.07% 1.17% 3.00% 2.86% 1.00% 4.20%Inflation rate 1.75% 1.75% 0.60% 0.60% 1.75% 1.75% 2.50% 2.50%
Based on the sensitivity tests of actuarial assumptions, the impact of a 50 basis-point increase or decrease in thediscount rate would not be material and would represent less than 0.2% of consolidated equity.
05_D_VA_V4 04/04/2017 13:20 Page307

5 FINANCIAL INFORMATION ~ CONSOLIDATED FINANCIAL STATEMENTS AS OF DECEMBER 31, 2016
308 Kering ~ 2016 Reference Document
Note 27 – Provisions
Reversal Reversal (utilised (surplus Translation
(in € millions) 2015 Charge provision) provision) adjustments Other 2016
Provision for restructuring costs 9.3 (0.2) 0.4 9.5Provision for claims and litigation 6.6 7.2 (1.5) 0.1 (1.2) 11.2Other provisions 75.7 3.1 (30.2) 1.3 3.4 53.3
Other non-current provisions 82.3 19.6 (31.9) 1.8 2.2 74.0
Provision for restructuring costs 25.2 19.5 (22.3) (3.3) (0.1) 5.1 24.1Provision for claims and litigation 49.9 7.2 (20.4) (5.2) 2.9 34.4Other provisions 82.2 26.9 (13.0) (9.7) 0.1 (1.3) 85.2
Other current provisions 157.3 53.6 (55.7) (18.2) 6.7 143.7
TOTAL 239.6 73.2 (87.6) (18.2) 1.8 8.9 217.7
Impact on income (59.1) (73.2) 18.2 (55.0)
– on recurring operating income (19.6) (35.7) 3.0 (32.7)– on other non-recurring
operating income and expenses (38.1) (30.0) 6.1 (23.9)– on net finance costs (0.1)– on income taxes– on income (loss)
from discontinued operations (1.3) (7.5) 9.1 1.6
The “Other provisions” line mainly corresponds to vendor warranties granted within the scope of disposals in previousperiods. The decrease in this item in 2016 reflects the early-2016 sale of the Electric brand, the net assets of which hadbeen provisioned in full as of December 31, 2015.
05_D_VA_V4 04/04/2017 13:20 Page308

5CONSOLIDATED FINANCIAL STATEMENTS AS OF DECEMBER 31, 2016 ~ FINANCIAL INFORMATION
3092016 Reference Document ~ Kering
28.2. Breakdown by currency
(in € millions) 2016 % 2015 %
EUR 260.6 24.8% 528.9 46.1%CNY 150.4 14.4% 86.3 7.5%USD 120.8 11.5% 114.1 10.0%KRW 104.0 9.9% 62.9 5.5%CHF 61.8 5.9% 44.7 3.9%HKD 52.7 5.0% 41.4 3.6%GBP 51.6 4.9% 54.4 4.8%Other currencies 247.7 23.6% 213.7 18.6%
TOTAL 1,049.6 1,146.4
As of December 31, 2016, cash equivalents includemoney-market funds, certificates of deposit and termdeposits and accounts with a maturity of less than threemonths.
The items classified by the Group as cash and cashequivalents strictly comply with the AMF’s position
published in 2008 and updated in 2011 and 2013. Inparticular, cash investments are reviewed on a regularbasis in accordance with Group procedures and in strictcompliance with the eligibility criteria set out in IAS 7 andwith the AMF’s recommendations. As of December 31, 2016,no reclassifications were made as a result of these reviews.
Note 28 – Cash and cash equivalents
28.1. Breakdown by category
Cash and cash equivalents break down as follows:
(in € millions) 2016 2015
Cash 1,040.4 943.5Cash equivalents 9.2 202.9
TOTAL 1,049.6 1,146.4
05_D_VA_V4 04/04/2017 13:20 Page309

5 FINANCIAL INFORMATION ~ CONSOLIDATED FINANCIAL STATEMENTS AS OF DECEMBER 31, 2016
310 Kering ~ 2016 Reference Document
All gross borrowings as of December 31, 2016 arerecognised at amortised cost based on an effectiveinterest rate determined after taking into account anyidentified issue costs and redemption or issue premiumsrelating to each liability.
Bond issues represented 77.1% of gross borrowings as ofDecember 31, 2016 versus 63.1% as of end-2015.
Borrowings with a maturity of more than one yearrepresented 77.2% of total gross borrowings as of
December 31, 2016 and 69.4% as of December 31, 2015.
The total amount of confirmed lines of credit was€4,188.6 million at the end of the reporting period,including €35.5 million available in the form of short-term loans.
Short-term drawdowns on facilities backed by confirmedlines of credit maturing in more than one year areincluded in non-current borrowings.
Accrued interest is recorded in “Other borrowings”.
Note 29 – Borrowings
29.1. Breakdown of borrowings by maturity
(in € millions) 2016 Y+1 Y+2 Y+3 Y+4 Y+5 Beyond
Non-current borrowings 4,185.8 608.0 597.9 723.3 648.0 1,608.6
Bonds 3,831.3 498.8 497.9 640.7 639.8 1,554.1Confirmed lines of credit Other bank borrowings 212.2 97.8 38.4 61.1 2.7 12.2Obligations under finance leases 89.4 8.2 36.3 5.3 5.5 34.1Other borrowings 52.9 3.2 25.3 16.2 8.2
Current borrowings 1,234.5 1,234.5
Bonds 349.6 349.6 Confirmed lines of credit Drawdowns on unconfirmed lines of credit 23.4 23.4 Other bank borrowings 122.9 122.9 Obligations under finance leases 7.5 7.5 Bank overdrafts 292.1 292.1 Commercial paper 350.1 350.1 Other borrowings 88.9 88.9
TOTAL 5,420.3 1,234.5 608.0 597.9 723.3 648.0 1,608.6% 22.8% 11.2% 11.0% 13.3% 12.0% 29.7%
(in € millions) 2015 Y+1 Y+2 Y+3 Y+4 Y+5 Beyond
Non-current borrowings 4,039.9 447.8 593.0 536.6 692.7 1,769.8
Bonds 3,674.5 349.4 498.2 497.0 635.8 1,694.1Confirmed lines of credit Other bank borrowings 234.4 84.4 82.2 3.9 42.1 21.8Obligations under finance leases 63.5 4.8 5.4 3.5 3.9 45.9Other borrowings 67.5 9.2 7.2 32.2 10.9 8.0
Current borrowings 1,785.9 1,785.9
Bonds Confirmed lines of credit Drawdowns on unconfirmed lines of credit 105.4 105.4 Other bank borrowings 79.0 79.0 Obligations under finance leases 7.6 7.6 Bank overdrafts 243.5 243.5 Commercial paper 1,299.7 1,299.7 Other borrowings 50.7 50.7
TOTAL 5,825.8 1,785.9 447.8 593.0 536.6 692.7 1,769.8% 30.6% 7.7% 10.2% 9.2% 11.9% 30.4%
05_D_VA_V4 04/04/2017 13:20 Page310

5CONSOLIDATED FINANCIAL STATEMENTS AS OF DECEMBER 31, 2016 ~ FINANCIAL INFORMATION
3112016 Reference Document ~ Kering
29.4. Description of the main bond issues
Kering bond issues
The Group has a Euro Medium Term Notes (EMTN) programmecapped at €6,000 million as of December 31, 2016.
This programme was signed and approved byLuxembourg’s financial sector supervisory commission(Conseil de Surveillance du Secteur Financier – CSSF) onNovember 17, 2016. The existing programme as ofDecember 31, 2016 expires on November 17, 2017.
As of December 31, 2016, the bonds issued under thisprogramme totalled €4,184.6 million, of which€284.6 million were issued in US dollars.
All of these borrowings are covered by the rating assignedto the Kering group by Standard & Poor’s (“BBB” with astable outlook) and are not subject to any financialcovenants.
29.2. Breakdown by repayment currency
Non-current Current (in € millions) 2016 borrowings borrowings % 2015 %
EUR 4,523.2 3,640.4 882.8 83.5% 4,936.5 84.7%JPY 435.0 179.4 255.6 8.0% 377.0 6.5%USD 368.0 328.5 39.5 6.8% 341.5 5.9%CHF 33.2 17.9 15.3 0.6% 26.8 0.5%GBP 11.3 11.1 0.2 0.2% 6.2 0.1%HKD 8.5 8.5 0.1% 8.1 0.1%Other currencies 41.1 41.1 0.8% 129.7 2.2%
Total 5,420.3 4,185.8 1,234.5 5,825.8
Borrowings denominated in currencies other than the euro are distributed to Group subsidiaries for local financingpurposes.
29.3. Breakdown of gross borrowings by category
The Kering group’s gross borrowings break down as follows:
(in € millions) 2016 2015
Bonds 4,180.9 3,674.5Other bank borrowings 335.1 313.4Confirmed lines of credit Drawdowns on unconfirmed lines of credit 23.4 105.4Commercial paper 350.1 1,299.7Obligations under finance leases 96.9 71.1Bank overdrafts 292.1 243.5Other borrowings 141.8 118.2
TOTAL 5,420.3 5,825.8
Group borrowings primarily consist of bonds, bank borrowings and commercial paper issues, which accounted for92.4% of gross borrowings as of December 31, 2016 (92.8% as of December 31, 2015).
As of December 31, 2016, the Group’s other borrowings included €95.3 million concerning put options granted to non-controlling shareholders (see Note 2.3.2 – Use of estimates and judgement).
05_D_VA_V4 04/04/2017 13:20 Page311

5 FINANCIAL INFORMATION ~ CONSOLIDATED FINANCIAL STATEMENTS AS OF DECEMBER 31, 2016
312 Kering ~ 2016 Reference Document
Kering euro bond issues
(in € millions)
Issue Effective Documented/ interest interest Issue non-documented Par value rate rate date hedge Maturity 2016 2015
150.0 (1) 6.50% fixed 6.57% 06 / 29 / 2009 - 06 / 29 / 2017 149.8 149.7
200.0 (2) 6.50% fixed 6.57% 11 / 06 / 2009 - 11 / 06 / 2017 199.8 199.7
500.0 (3) 3.125% fixed 3.31% 04 / 23 / 2012 - 04 / 23 / 2019 497.9 497.0
500.0 (4) 2.50% fixed 2.58% 07 / 15 / 2013 - 07 / 15 / 2020 498.6 498.3
500.0 (5) 1.875% fixed 2.01% 10 / 08 / 2013 - 10 / 08 / 2018 498.8 498.2
500.0 (6) 2.75% fixed 2.81% 04 / 08 / 2014 - 04 / 08 / 2024 512.6 514.3 & 2.57% & 05 / 30 / 2014 & 2.50% & 06 / 26 / 2014 & 2.01% & 09 / 22 / 2015 & 1.87% & 11 / 05 / 2015
500.0 (7) 1.375% fixed 1.47% 10 / 01 / 2014 - 10 / 01 / 2021 497.7 497.2
500.0 (8) 0.875% fixed 1.02% 03 / 27 / 2015 - 03 / 28 / 2022 496.3 495.6
50.0 (9) 1.60% fixed 1.66% 04 / 16 / 2015 - 04 / 16 / 2035 49.5 49.5
500.0 (10) 1.25% fixed 1.35% 05 / 10 / 2016 - 05 / 10 / 2026 495.7
(1) Issue price: bond issue on June 29, 2009, comprising 3,000 bonds with a par value of €50,000 each under the EMTN programme.Redemption: in full on June 29, 2017.
(2) Issue price: bond issue on November 6, 2009, comprising 4,000 bonds with a par value of €50,000 each under the EMTN programme.Redemption: in full on November 6, 2017.
(3) Issue price: bond issue on April 23, 2012, comprising 500,000 bonds with a par value of €1,000 each under the EMTN programme.Redemption: in full on April 23, 2019.
(4) Issue price: bond issue on July 15, 2013, comprising 5,000 bonds with a par value of €100,000 each under the EMTN programme.Redemption: in full on July 15, 2020.
(5) Issue price: bond issue on October 8, 2013, comprising 5,000 bonds with a par value of €100,000 each under the EMTN programme.Redemption: in full on October 8, 2018.
(6) Issue price: bond issue on April 8, 2014, comprising 1,000 bonds with a par value of €100,000 each under the EMTN programme, 1,000 additional bonds issuedon May 30, 2014, 1,000 additional bonds issued on June 26, 2014, 1,500 additional bonds issued on September 22, 2015 and 500 additional bonds issued onNovember 5, 2015, thereby raising the issue to 5,000 bonds.Redemption: in full on April 8, 2024.
(7) Issue price: bond issue on October 1, 2014, comprising 5,000 bonds with a par value of €100,000 each under the EMTN programme.Redemption: in full on October 1, 2021.
(8) Issue price: bond issue on March 27, 2015, comprising 5,000 bonds with a par value of €100,000 each under the EMTN programme.Redemption: in full on March 28, 2022.
(9) Issue price: bond issue on April 16, 2015, comprising 500 bonds with a par value of €100,000 each under the EMTN programme.Redemption: in full on April 16, 2035.
(10) Issue price: bond issue on May 10, 2016, comprising 5,000 bonds with a par value of €100,000 each under the EMTN programme.Redemption: in full on May 10, 2026.
05_D_VA_V4 04/04/2017 13:20 Page312

5CONSOLIDATED FINANCIAL STATEMENTS AS OF DECEMBER 31, 2016 ~ FINANCIAL INFORMATION
3132016 Reference Document ~ Kering
The bonds issued between 2009 and 2016 within the scopeof the EMTN programme are all subject to change-of-control clauses entitling bondholders to request earlyredemption at par if Kering’s rating is downgraded tonon-investment grade following a change of control.
In addition, the bonds issued in 2009 include a step-upcoupon clause that applies in the event that Kering’srating is downgraded to non-investment grade.
The corresponding amounts are recognised in the statementof financial position at amortised cost based on the effectiveinterest rate, taking account of the fair value adjustmentresulting from the hedging relationship documented inaccordance with IAS 39.
Accrued interest is recorded in “Other borrowings”.
Kering USD bond issues
(in € millions)
Issue Effective Documented/ interest interest Issue non-documented Par value rate rate date hedge Maturity 2016 2015
142.3 (1) Floating 1.55% 03 / 09 / 2015 2.589% 03 / 09 / 2020 142.1 137.5 3 -month fixed -rate swap
USD Libor for the full amount +0.73% Documented under IFRS
142.3 (2) 2.887% fixed 2.94% 06 / 09 / 2015 - 06 / 09 / 2021 142.1 137.5
(1) Issue price: bond issue on March 9, 2015 in the form of floating-rate notes, comprising 150 notes with a par value of USD 1,000,000 each under the EMTNprogramme, i.e., representing a total of USD 150 million.Redemption: in full on March 9, 2020.
(2) Issue price: bond issue on June 9, 2015, comprising 150 bonds with a par value of USD 1,000,000 each under the EMTN programme, i.e., representing a total ofUSD 150 million.Redemption: in full on June 9, 2021.
05_D_VA_V4 04/04/2017 13:20 Page313

5 FINANCIAL INFORMATION ~ CONSOLIDATED FINANCIAL STATEMENTS AS OF DECEMBER 31, 2016
314 Kering ~ 2016 Reference Document
29.5. Main bank borrowings and confirmed lines of credit
29.5.1. Breakdown of the main bank borrowings
The Group has the following bank borrowings:
Long- and medium-term borrowings contracted by the Luxury activities
(in € millions)
Issue Effective Documented/ interest interest Issue non-documented Par value rate rate date hedge Maturity 2016 2015
32.4 (1) Floating - 03 / 31 / 2011 - 03 / 31 / 2016 3.1 JPY Tibor
+0.35%
46.6 (2) Floating - 09 / 30 / 2013 - 09 / 30 / 2016 32.2 JPY Tibor
+0.45%
37.0 (3) Floating - 04 / 15 / 2014 - 04 / 15 / 2017 26.6 28.7 JPY Tibor
+0.38%
32.4 (4) Floating - 12 / 14 / 2014 - 12 / 14 / 2018 32.4 30.5 JPY Tibor
+0.40%
40.5 (5) Floating - 04 / 15 / 2015 - 04 / 15 / 2020 40.5 38.1 JPY Tibor
+0.40%
16.2 (6) Floating - 03 / 31 / 2016 - 03 / 31 / 2020 16.2 JPY Tibor
+0.35%
16.2 (7) Floating - 03 / 31 / 2016 - 03 / 31 / 2021 14.6 JPY Tibor
+0.25%
30.6 (8) Floating - 09 / 30 / 2016 - 09 / 30 / 2019 28.7 JPY Tibor
+0.29%
(1) Redeemable loan contracted in March 2011 for JPY 4,000 million (€32.4 million).(2) Redeemable loan contracted in September 2013 for JPY 5,756 million (€46.6 million).(3) Redeemable loan contracted in April 2014 for JPY 4,560 million (€37.0 million). The outstanding balance on this loan was JPY 3,280 million (€26.6 million) as of
December 31, 2016.(4) Loan contracted in December 2014 for JPY 4,000 million (€32.4 million).(5) Loan contracted in April 2015 for JPY 5,000 million (€40.5 million).(6) Loan contracted in March 2016 for JPY 2,000 million (€16.2 million).(7) Redeemable loan contracted in March 2016 for JPY 2,000 million (€16.2 million). The outstanding balance on this loan was JPY 1,800 million (€14.6 million) as
of December 31, 2016.(8) Redeemable loan contracted in September 2016 for JPY 3,771 million (€30.6 million). The outstanding balance on this loan was JPY 3,545 million
(€28.7 million) as of December 31, 2016.
05_D_VA_V4 04/04/2017 13:20 Page314

5CONSOLIDATED FINANCIAL STATEMENTS AS OF DECEMBER 31, 2016 ~ FINANCIAL INFORMATION
3152016 Reference Document ~ Kering
The Group’s confirmed bank lines of credit are governedby the standard commitment and default clausescustomarily included in this type of agreement: paripassu ranking, a negative-pledge clause that limits thesecurity that can be granted to other lenders, and a cross-default obligation.
Kering and Kering Finance SNC confirmed lines of creditinclude a default clause (early repayment) in the event offailure to comply with the following financial covenant:Consolidated net debt / Consolidated EBITDA less than or equalto 3.75. This ratio is calculated based on pro forma data.
As of December 31, 2016, Kering and Kering Finance SNChad not drawn down any of the €3,901.0 million availableunder confirmed lines of credit subject to this covenant.
The Group was in compliance with all of these covenantsas of December 31, 2016 and there is no foreseeable riskof breach.
The undrawn balance on these confirmed lines of credit as of December 31, 2016 was €4,153.1 million(€4,131.8 million as of December 31, 2015).
The undrawn confirmed lines of credit guarantee theGroup’s liquidity and back the commercial paper issueprogramme, on which a total of €350.1 million remainedoutstanding as of December 31, 2016 (€1,299.7 millionas of December 31, 2015).
Other confirmed lines of credit: €287.6 million breaking down by maturity as follows:
Less than One to More than (in € millions) 2016 one year five years five years 2015
PUMA (1) 287.6 255.7 31.9 251.7(1) PUMA: including €35.5 million drawn down in the form of bank borrowings as of the end of December 2016.
The confirmed lines of credit include a syndicated facilityfor €2.5 billion signed on June 27, 2014 and initiallymaturing in June 2019. This facility provides for two one-year loan extension options. The Group confirmed that itwould exercise the extension options in June 2015 andJune 2016, respectively. As a result, €2,442.5 million ofthis syndicated facility now matures in June 2021 and the
remaining €57.5 million in June 2019.
This June 2014 syndicated loan had not been drawn bythe Group as of December 31, 2016. Total confirmedundrawn credit lines available to Kering and KeringFinance SNC amounted to €3,901.0 million as ofDecember 31, 2016.
29.5.2. Confirmed lines of credit available to the Group
As of December 31, 2016, the Group had access to €4,188.6 million in confirmed lines of credit versus €4,152.7 millionas of December 31, 2015.
29.5.3. Breakdown of confirmed lines of credit
Kering and Kering Finance SNC: €3,901.0 million breaking down by maturity as follows:
Less than One to More than (in € millions) 2016 one year five years five years 2015
Confirmed lines of credit 3,901.0 3,901.0 3,901.0
05_D_VA_V4 04/04/2017 13:20 Page315

5 FINANCIAL INFORMATION ~ CONSOLIDATED FINANCIAL STATEMENTS AS OF DECEMBER 31, 2016
316 Kering ~ 2016 Reference Document
These interest rate derivatives are recognised in thestatement of financial position at their market value atthe end of the reporting period.
The accounting treatment of fair value movementsdepends on the purpose of the derivative instrument andthe resulting accounting classification.
In the case of interest rate derivatives designated as fairvalue hedges, fair value movements are recognised in netincome for the year, fully or partly offsetting symmetricalchanges in the fair value of the hedged debt. Theineffective portion impacts net finance costs for the year.
In the case of interest rate derivatives designated as cashflow hedges, the effective portion of changes in fair valueis initially recognised in other comprehensive incomeand subsequently taken to income when the hedgedposition itself affects income. The ineffective portionimpacts net finance costs for the year.
Movements in the fair value of non-documented derivativeinstruments are recognised directly in income, with animpact on net finance costs for the year.
As of December 31, 2016, derivative instruments that didnot qualify for hedge accounting under IAS 39 primarilycomprised options in the form of interest rate swapsintended to hedge revolving financing issued at fixedrates.
As of December 31, 2016, documented and non-documented financial instruments can be analysed as follows:
Fair value Cash flow Non-documented(in € millions) 2016 hedges hedges hedges
Swaps: fixed-rate lender 400.0 400.0Swaps: fixed-rate borrower 152.9 152.9 Other interest rate instruments
TOTAL 552.9 152.9 400.0
In accordance with the interest rate risk hedging policy,these instruments are chiefly designed to convert fixedinterest rates on negotiable debt securities, fixed-rateborrowings and credit line drawdowns into floating rates.
The Group has also entered into fixed-rate lender swapsin an amount of €400 million.
These instruments also convert floating-rate bonds intofixed-rate debt.
As of December 31, 2016, fixed-rate borrower swaps for a notional amount of USD 150 million converted all USD bond debt initially issued at floating rates intofixed-rate debt.
In accordance with IAS 39, these financial instrumentswere analysed with respect to hedge accounting eligibilitycriteria.
Note 30 – Exposure to interest rate, foreignexchange and equity risk
The Group uses derivative financial instruments to manage its exposure to market risks.
Derivatives used by the Group as of December 31, 2016 are described below.
30.1. Exposure to interest rate risk
To manage interest rate risk on its financial assets and liabilities, and particularly on its borrowings, the Kering groupuses instruments with the following outstanding notional amounts:
(in € millions) 2016 Y+1 Y+2 Y+3 Y+4 Y+5 Beyond 2015
Swaps: fixed-rate lender 400.0 400.0 500.0Swaps: fixed-rate borrower 152.9 142.3 10.6 149.6Other interest rate instruments 100.0
TOTAL 552.9 400.0 142.3 10.6 749.6
05_D_VA_V4 04/04/2017 13:20 Page316

5CONSOLIDATED FINANCIAL STATEMENTS AS OF DECEMBER 31, 2016 ~ FINANCIAL INFORMATION
3172016 Reference Document ~ Kering
The Group’s exposure to interest rate risk before the impact of hedging is presented below, with a distinction made between:
• fixed-rate financial assets and liabilities, exposed to a price risk before hedging:
2016 maturities Less than One to More than (in € millions) 2016 one year five years five years 2015
Fixed-rate financial assets 56.6 10.9 45.7 58.1
Bonds 4,038.8 349.6 2,135.1 1,554.1 3,537.0Commercial paper 350.1 350.1 1,299.7Other borrowings 39.0 24.4 14.4 0.2 28.4
Fixed-rate financial liabilities 4,427.9 724.1 2,149.5 1,554.3 4,865.1
• floating-rate financial assets and liabilities, exposed to a cash flow risk before hedging:
2016 maturities Less than One to More than (in € millions) 2016 one year five years five years 2015
Floating-rate financial assets 1,138.8 1,062.7 30.0 46.1 1,271.2
Bonds 142.1 142.1 137.5Commercial paper Other borrowings 850.3 510.4 285.6 54.3 823.2
Floating-rate financial liabilities 992.4 510.4 427.7 54.3 960.7
The Group’s exposure to interest rate risk after the impact of hedging is presented below, with a distinction madebetween:
• fixed-rate financial assets and liabilities, exposed to a price risk after hedging:
2016 maturities Less than One to More than (in € millions) 2016 one year five years five years 20 15
Fixed-rate financial assets 56.6 10.9 45.7 58.1
Bonds 3,980.9 149.6 2,277.2 1,554.1 3,474.5Commercial paper 150.1 150.1 899.7Other borrowings 49.6 25.7 20.1 3.8 40.3
Fixed-rate financial liabilities 4,180.6 325.4 2,297.3 1,557.9 4,414.5
• floating-rate financial assets and liabilities, exposed to a cash flow risk after hedging:
2016 maturities Less than One to More than (in € millions) 2016 one year five years five years 20 15
Floating-rate financial assets 1,138.8 1,062.7 30.0 46.1 1,271.2
Bonds 200.0 200.0 200.0Commercial paper 200.0 200.0 400.0Other borrowings 839.7 509.1 279.9 50.7 811.3
Floating-rate financial liabilities 1,239.7 909.1 279.9 50.7 1,411.3
Financial assets and liabilities consist of interest-bearing items recorded in the statement of financial position.
05_D_VA_V4 04/04/2017 13:20 Page317
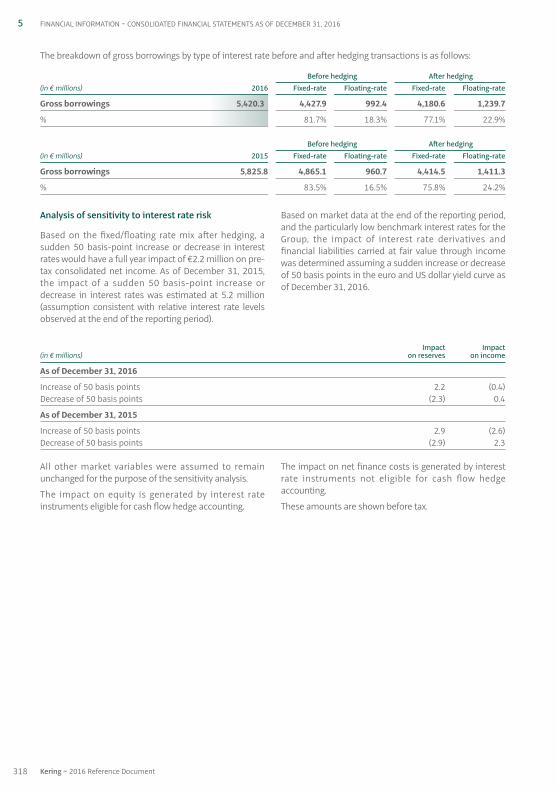
5 FINANCIAL INFORMATION ~ CONSOLIDATED FINANCIAL STATEMENTS AS OF DECEMBER 31, 2016
318 Kering ~ 2016 Reference Document
All other market variables were assumed to remainunchanged for the purpose of the sensitivity analysis.
The impact on equity is generated by interest rateinstruments eligible for cash flow hedge accounting.
The impact on net finance costs is generated by interestrate instruments not eligible for cash flow hedgeaccounting.
These amounts are shown before tax.
Impact Impact(in € millions) on reserves on income
As of December 31, 2016
Increase of 50 basis points 2.2 (0.4)Decrease of 50 basis points (2.3) 0.4
As of December 31, 2015
Increase of 50 basis points 2.9 (2.6)Decrease of 50 basis points (2.9) 2.3
Analysis of sensitivity to interest rate risk
Based on the fixed / floating rate mix after hedging, asudden 50 basis-point increase or decrease in interestrates would have a full year impact of €2.2 million on pre-tax consolidated net income. As of December 31, 2015,the impact of a sudden 50 basis-point increase ordecrease in interest rates was estimated at 5.2 million(assumption consistent with relative interest rate levelsobserved at the end of the reporting period).
Based on market data at the end of the reporting period,and the particularly low benchmark interest rates for theGroup, the impact of interest rate derivatives andfinancial liabilities carried at fair value through incomewas determined assuming a sudden increase or decreaseof 50 basis points in the euro and US dollar yield curve asof December 31, 2016.
The breakdown of gross borrowings by type of interest rate before and after hedging transactions is as follows:
Before hedging After hedging(in € millions) 2016 Fixed-rate Floating-rate Fixed-rate Floating-rate
Gross borrowings 5,420.3 4,427.9 992.4 4,180.6 1,239.7
% 81.7% 18.3% 77.1% 22.9%
Before hedging After hedging(in € millions) 2015 Fixed-rate Floating-rate Fixed-rate Floating-rate
Gross borrowings 5,825.8 4,865.1 960.7 4,414.5 1,411.3
% 83.5% 16.5% 75.8% 24.2%
05_D_VA_V4 04/04/2017 13:20 Page318

5CONSOLIDATED FINANCIAL STATEMENTS AS OF DECEMBER 31, 2016 ~ FINANCIAL INFORMATION
3192016 Reference Document ~ Kering
The Group primarily uses forward currency contractsand / or currency / cross-currency swaps to hedgecommercial import / export risks and to hedge thefinancial risks stemming in particular from inter-company refinancing transactions in foreign currencies.
The Group may also implement plain vanilla optionstrategies (purchases of options or tunnels) to hedgefuture exposures.
These derivative financial instruments were analysedwith respect to IAS 39 hedge accounting eligibility criteria.The Group has no derivatives eligible for net investmenthedge accounting.
30.2. Exposure to foreign exchange risk
The outstanding notional amounts of instruments used by the Kering group to manage its foreign exchange risk areshown below:
(in € millions) 2016 2015
Currency forwards (3,253.2) (3,332.9)Cross currency swaps (107.8) (101.5)Currency options – export tunnels (204.2) (55.3)Currency options – purchases (90.6) (137.2)Currency options – sales
TOTAL (3,655.8) (3,626.9)
05_D_VA_V4 04/04/2017 13:20 Page319
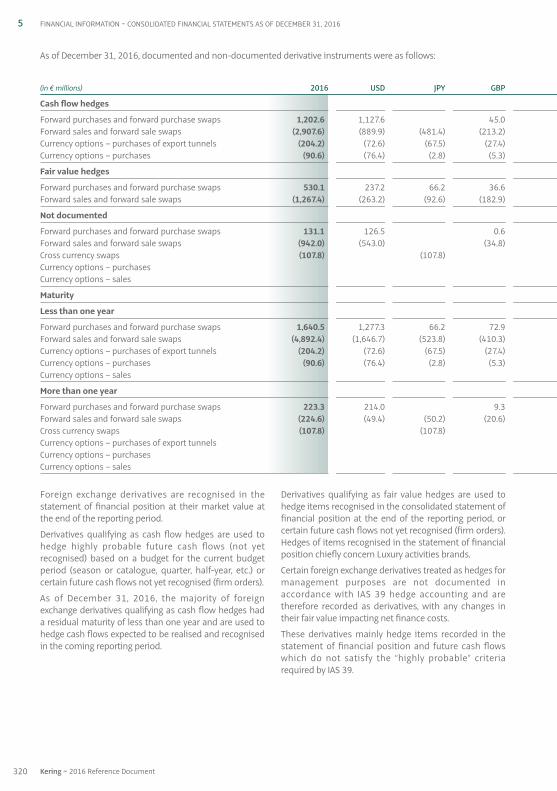
5 FINANCIAL INFORMATION ~ CONSOLIDATED FINANCIAL STATEMENTS AS OF DECEMBER 31, 2016
320 Kering ~ 2016 Reference Document
(in € millions) 2016 USD JPY GBP
Cash flow hedges
Forward purchases and forward purchase swaps 1,202.6 1,127.6 45.0 Forward sales and forward sale swaps (2,907.6) (889.9) (481.4) (213.2) Currency options – purchases of export tunnels (204.2) (72.6) (67.5) (27.4) Currency options – purchases (90.6) (76.4) (2.8) (5.3)
Fair value hedges
Forward purchases and forward purchase swaps 530.1 237.2 66.2 36.6 Forward sales and forward sale swaps (1,267.4) (263.2) (92.6) (182.9)
Not documented
Forward purchases and forward purchase swaps 131.1 126.5 0.6 Forward sales and forward sale swaps (942.0) (543.0) (34.8) Cross currency swaps (107.8) (107.8) Currency options – purchases Currency options – sales
Maturity
Less than one year
Forward purchases and forward purchase swaps 1,640.5 1,277.3 66.2 72.9 Forward sales and forward sale swaps (4,892.4) (1,646.7) (523.8) (410.3) Currency options – purchases of export tunnels (204.2) (72.6) (67.5) (27.4) Currency options – purchases (90.6) (76.4) (2.8) (5.3) Currency options – sales
More than one year
Forward purchases and forward purchase swaps 223.3 214.0 9.3 Forward sales and forward sale swaps (224.6) (49.4) (50.2) (20.6) Cross currency swaps (107.8) (107.8) Currency options – purchases of export tunnels Currency options – purchases Currency options – sales
Foreign exchange derivatives are recognised in thestatement of financial position at their market value atthe end of the reporting period.
Derivatives qualifying as cash flow hedges are used tohedge highly probable future cash flows (not yetrecognised) based on a budget for the current budgetperiod (season or catalogue, quarter, half-year, etc.) orcertain future cash flows not yet recognised (firm orders).
As of December 31, 2016, the majority of foreignexchange derivatives qualifying as cash flow hedges hada residual maturity of less than one year and are used tohedge cash flows expected to be realised and recognisedin the coming reporting period.
Derivatives qualifying as fair value hedges are used tohedge items recognised in the consolidated statement offinancial position at the end of the reporting period, orcertain future cash flows not yet recognised (firm orders).Hedges of items recognised in the statement of financialposition chiefly concern Luxury activities brands.
Certain foreign exchange derivatives treated as hedges formanagement purposes are not documented inaccordance with IAS 39 hedge accounting and aretherefore recorded as derivatives, with any changes intheir fair value impacting net finance costs.
These derivatives mainly hedge items recorded in thestatement of financial position and future cash flowswhich do not satisfy the “ highly probable ” criteriarequired by IAS 39.
As of December 31, 2016, documented and non-documented derivative instruments were as follows:
05_D_VA_V4 04/04/2017 13:20 Page320

5CONSOLIDATED FINANCIAL STATEMENTS AS OF DECEMBER 31, 2016 ~ FINANCIAL INFORMATION
3212016 Reference Document ~ Kering
CHF HKD CNY SGD TWD KRW Other 2015
30.0 929.2 (284.7) (382.6) (46.4) (57.0) (169.6) (382.8) (2,815.7) (36.7) (55.3) (6.1) (137.2)
24.0 20.8 67.0 4.0 4.7 20.2 49.4 444.1 (14.5) (158.2) (172.7) (35.6) (28.7) (68.5) (250.5) (1,203.2)
1.9 2.1 193.6 (309.7) (49.0) (5.5) (880.9) (101.5)
25.9 20.8 67.0 4.0 4.7 20.2 81.5 1,402.0 (324.2) (469.3) (536.0) (75.4) (80.0) (229.4) (597.3) (4,794.9) (36.7) (55.3) (6.1) (137.2)
164.9 (22.6) (19.3) (6.6) (5.7) (8.7) (41.5) (104.9) (101.5)
05_D_VA_V4 04/04/2017 13:20 Page321

5 FINANCIAL INFORMATION ~ CONSOLIDATED FINANCIAL STATEMENTS AS OF DECEMBER 31, 2016
322 Kering ~ 2016 Reference Document
Monetary assets comprise loans and receivables, bank balances, and investments and cash equivalents maturingwithin three months of the acquisition date.
Monetary liabilities comprise borrowings, operating payables and other payables.
Most of these monetary items are denominated in the functional currency in which the subsidiary operates or are convertedinto the Group’s functional currency using foreign exchange derivatives in accordance with applicable procedures.
Analysis of sensitivity to foreign exchange risk
This analysis excludes the impact of translating the financial statements of each Group entity into the presentationcurrency (euro) and the measurement of the foreign exchange position on the statement of financial position, notconsidered material as of the end of the reporting period.
Based on market data as of December 31, 2016, the impact of foreign exchange derivative instruments in the event of asudden 10% increase or decrease in the euro exchange rate against the principal currencies to which the Group isexposed (USD, JPY and CNY) would be as follows:
As of December 31, 2016 Impact on reserves Impact on income(in € millions) 10% increase 10% decrease 10% increase 10% decrease
USD (16.1) 18.5 2.2 0.9JPY 50.0 (56.5) (0.9) (2.1)CNY 34.8 (42.5) (1.2) 1.4
As of December 31, 2015 Impact on reserves Impact on income(in € millions) 10% increase 10% decrease 10% increase 10% decrease
USD 10.2 (5.6) 0.7 (3.4)JPY 43.5 (49.9) (0.2) (0.5)CNY 27.1 (33.1) (1.2) 1.4
All other market variables were assumed to remain unchanged for the purpose of the sensitivity analysis.
The impact on equity is generated by foreign exchange instruments eligible for cash flow hedge accounting.
The impact on net finance costs arises from foreign exchange instruments not eligible for cash flow hedge accountingand from the change in the ineffective portion of cash flow hedges.
These amounts are shown before tax.
As of December 31, 2016, the exposure to foreign exchange risk on the statement of financial position was as follows:
(in € millions) 2016 USD JPY GBP
Monetary assets 3,309.2 1,177.6 227.8 230.0 Monetary liabilities 1,433.9 788.1 455.6 25.4
Gross exposure in the statement of financial position 1,875.3 389.5 (227.8) 204.6
Forecast exposure 1,991.0 (101.9) 551.7 200.9
Gross exposure before hedging 3,866.3 287.6 323.9 405.5
Hedging instruments (3,650.5) (462.1) (685.9) (381.4)
Gross exposure after hedging 215.8 (174.5) (362.0) 24.1
05_D_VA_V4 04/04/2017 13:20 Page322

5CONSOLIDATED FINANCIAL STATEMENTS AS OF DECEMBER 31, 2016 ~ FINANCIAL INFORMATION
3232016 Reference Document ~ Kering
30.3. Exposure to equity risk
In the normal course of its business, the Group enters intotransactions involving shares in consolidated companiesor shares issued by Kering.
Shares held in connection with non-consolidated investmentsrepresent a low exposure risk for the Group and are nothedged.
As of December 31, 2016, no equity risk hedging transactionhad been recognised as a derivative instrument inaccordance with IAS 39.
30.4. Other market risks – Credit risk
The Group uses derivative instruments solely to reduceits overall exposure to foreign exchange, interest rate andequity risk arising in the normal course of business. Alltransactions involving derivatives are carried out onorganised markets or over the counter with leading firms.
All bonds issued in 2009 within the scope of the EMTNprogramme are subject to a step-up coupon clause in theevent that Kering’s rating is downgraded to non-investment grade. This would increase the couponpayable on each issue by 1.25%, and could lead to anincrease of €3.0 million in finance costs over a full year.
The Group has a large number of customers in a wide rangeof business segments and is therefore not exposed to anyconcentration of credit risk on its receivables. Generally,the Group considers that it is not exposed to any specificcredit risk on these financial assets.
30.5. Derivative instruments at market value
As of December 31, 2016, and in accordance with IAS 39,the market value of derivative financial instruments isrecognised in assets under the headings “Non-currentfinancial assets” and “Other current financial assets”, andin liabilities under the headings “Other non-currentfinancial liabilities” and “Other current financial liabilities”.
The fair value of derivatives hedging interest rate risk isrecognised in non-current or current assets or liabilitiesdepending on the maturity of the underlying debt.
The fair value of derivatives hedging the foreign exchangerisk on commercial transactions is recognised in othercurrent financial assets or liabilities.
The fair value of derivatives hedging the foreign exchange riskon financial transactions is recognised in non-currentfinancial assets or liabilities if their term exceeds one year.
CHF HKD CNY SGD TWD KRW Other 2015
377.9 207.4 281.1 46.1 52.5 154.8 554.0 3,206.7 56.4 10.4 17.8 7.7 4.4 0.4 67.7 1,427.3
321.5 197.0 263.3 38.4 48.1 154.4 486.3 1,779.4
327.6 382.6 46.4 56.9 169.6 357.2 2,092.2
321.5 524.6 645.9 84.8 105.0 324.0 843.5 3,871.6
(298.3) (514.0) (488.3) (78.0) 29.3 (217.9) (553.9) (3,626.8)
23.2 10.6 157.6 6.8 134.3 106.1 289.6 244.8
05_D_VA_V4 04/04/2017 13:20 Page323

5 FINANCIAL INFORMATION ~ CONSOLIDATED FINANCIAL STATEMENTS AS OF DECEMBER 31, 2016
324 Kering ~ 2016 Reference Document
The effective portion of derivatives hedging future cashflows is recorded against equity.
Changes in the cash flow hedging reserve in 2016 arepresented in Note 14 – Other comprehensive income.
In accordance with IFRS 13, derivatives were measured asof December 31, 2016 taking into account credit anddebit value adjustments (CVA / DVA). The probability ofdefault used is based on market data where this isavailable for the counterparty. The impact of this revisedmeasurement was not material for the Group as of theend of the reporting period.
30.6. Liquidity risk
Liquidity risk management for the Group and each of itssubsidiaries is closely monitored and periodicallyassessed by Kering within the scope of Group financialreporting procedures.
In order to guarantee its liquidity, the Group holdsconfirmed lines of credit totalling €4,188.6 million. As ofDecember 31, 2016, this includes an amount of€4,153.1 million not yet drawn and available cash of€1,049.6 million.
The table below shows contractual commitments relatingto borrowings and trade payables. It includes accruedinterest payable and excludes the impact of nettingagreements. The table also includes Group commitmentsrelating to derivative instruments recorded in assets orliabilities.
Forecast cash flows relating to accrued interest payableare included in “Other borrowings” and calculated up tothe maturity of the borrowings to which they relate.Future floating-rate interest is set based on the lastcoupon for the current period, based on fixingsapplicable at the end of the reporting period for flowsassociated with subsequent maturities.
The future cash flows presented have not beendiscounted.
Based on data available as of the end of the reportingperiod, the Group does not expect that the cash flowsindicated will materialise before the scheduled date orthat the amounts concerned will differ significantly fromthose set out in the maturity schedule.
This analysis excludes non-derivative financial assets inthe statement of financial position and in particular, thecash and cash equivalents and trade receivables lineitems, which amounted to €1,049.6 million and€1,196.4 million, respectively, as of December 31, 2016.
Interest Foreign Other (in € millions) 2016 rate risk exchange risk market risks 2015
Derivative assets 121.9 121.9 72.0
Non-current At fair value through income Cash flow hedges Fair value hedges
Current 121.9 121.9 72.0At fair value through income 1.6 1.6 2.7Cash flow hedges 104.6 104.6 53.1Fair value hedges 15.7 15.7 16.2
Derivative liabilities 115.9 1.6 114.3 62.5
Non-current 19.6 1.6 18.0 14.8At fair value through income 18.0 18.0 12.3Cash flow hedges 1.6 1.6 2.5Fair value hedges
Current 96.3 96.3 47.7At fair value through income 5.2 5.2 2.3Cash flow hedges 81.6 81.6 34.9Fair value hedges 9.5 9.5 10.5
TOTAL 6.0 (1.6) 7.6 9.5
05_D_VA_V4 04/04/2017 13:20 Page324

5CONSOLIDATED FINANCIAL STATEMENTS AS OF DECEMBER 31, 2016 ~ FINANCIAL INFORMATION
3252016 Reference Document ~ Kering
2016 Carrying Cash flow Less than One to More than(in € millions) amount one year five years five years
Non-derivative financial instruments
Bonds 4,180.9 (4,184.6) (350.0) (2,284.6) (1,550.0)Commercial paper 350.1 (350.1) (350.1) Other borrowings 889.3 (1,228.7) (554.2) (525.3) (149.2)Trade payables 1,098.5 (1,098.5) (1,098.5) Other non-derivative financial instruments associated with assets classified as held for sale
Derivative financial instruments
Interest rate hedges 1.6
Interest rate swaps (4.9) (1.5) (3.3) (0.1)Other interest rate instruments
Foreign exchange hedges (7.6)
Currency forwards and currency swaps Outflows (6,890.1) (6,456.7) (433.4) Inflows 6,888.3 6,442.1 446.2 Other foreign exchange instruments Outflows (361.8) (253.8) (108.0) Inflows 346.8 256.5 90.3
TOTAL 6,512.8 (6,883.6) (2,366.2) (2,818.1) (1,699.3)
2015 Carrying Cash flow Less than One to More than(in € millions) amount one year five years five yearsNon-derivative financial instruments
Bonds 3,674.5 (3,675.6) (1,987.8) (1,687.8)Commercial paper 1,299.7 (1,299.8) (1,299.8) Other borrowings 851.6 (1,267.2) (541.2) (587.7) (138.3)Trade payables 939.7 (939.7) (939.7) Other non-derivative financial instruments associated with assets classified as held for sale
Derivative financial instruments
Interest rate hedges 2.9
Interest rate swaps (7.2) (1.6) (5.4) (0.2)Other interest rate instruments
Foreign exchange hedges (12.4)
Currency forwards and currency swaps Outflows (5,596.9) (5,346.2) (250.7) Inflows 5,597.3 5,341.8 255.5 Other foreign exchange instruments Outflows (169.6) (67.4) (102.2) Inflows 156.1 65.3 90.8
TOTAL 6,756.0 (7,202.6) (2,788.8) (2,587.5) (1,826.3)
05_D_VA_V4 04/04/2017 13:20 Page325

5 FINANCIAL INFORMATION ~ CONSOLIDATED FINANCIAL STATEMENTS AS OF DECEMBER 31, 2016
326 Kering ~ 2016 Reference Document
Note 31 – Accounting classification and marketvalue of financial instruments
The basis of measurement for financial instruments and the market value of these instruments as of December 31,2016 are presented below:
2016 Breakdown by accounting classification Carrying Market Fair Available- Loans Amortised Derivatives Derivatives amount value value for-sale and cost qualifying not qualifying through financial receivables for hedge for hedge(in € millions) income assets accounting accounting
Non-current assets Non-current financial assets 480,4 480,4 167,0 313,4 Current assets Trade receivables 1 196,4 1 196,4 1 196,4 Other current financial assets 131,0 131,0 9,1 120,3 1,6
Cash and cash equivalents 1 049,6 1 049,6 9,2 1 040,4
Non-current liabilities Non-current borrowings 4 185,8 4 381,6 4 185,8 Other non-current financial liabilities 19,6 19,6 1,6 18,0Current liabilities Current borrowings 1 234,5 1 250,7 1 234,5 Other current financial liabilities 285,9 285,9 189,6 91,1 5,2Trade payables 1 098,5 1 098,5 1 098,5
05_D_VA_V4 04/04/2017 13:20 Page326
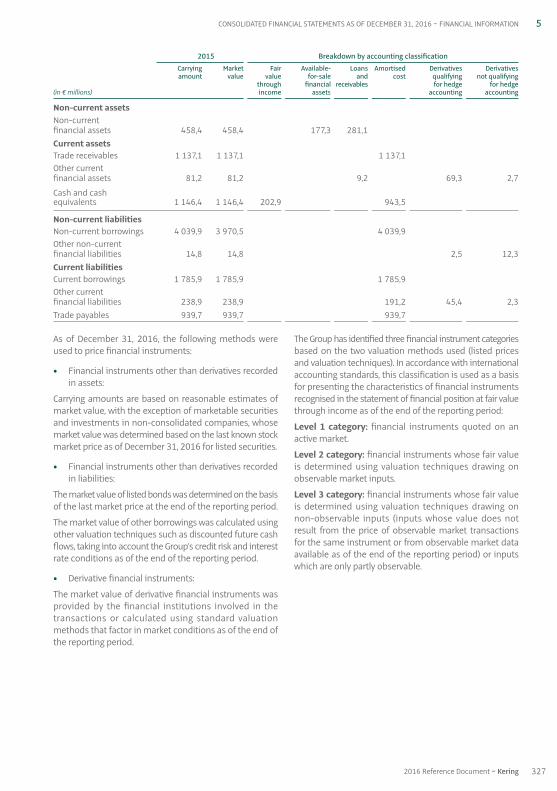
5CONSOLIDATED FINANCIAL STATEMENTS AS OF DECEMBER 31, 2016 ~ FINANCIAL INFORMATION
3272016 Reference Document ~ Kering
As of December 31, 2016, the following methods wereused to price financial instruments:
• Financial instruments other than derivatives recordedin assets:
Carrying amounts are based on reasonable estimates ofmarket value, with the exception of marketable securitiesand investments in non-consolidated companies, whosemarket value was determined based on the last known stockmarket price as of December 31, 2016 for listed securities.
• Financial instruments other than derivatives recordedin liabilities:
The market value of listed bonds was determined on the basisof the last market price at the end of the reporting period.
The market value of other borrowings was calculated usingother valuation techniques such as discounted future cashflows, taking into account the Group’s credit risk and interestrate conditions as of the end of the reporting period.
• Derivative financial instruments:
The market value of derivative financial instruments wasprovided by the financial institutions involved in thetransactions or calculated using standard valuationmethods that factor in market conditions as of the end ofthe reporting period.
The Group has identified three financial instrument categoriesbased on the two valuation methods used (listed pricesand valuation techniques). In accordance with internationalaccounting standards, this classification is used as a basisfor presenting the characteristics of financial instrumentsrecognised in the statement of financial position at fair valuethrough income as of the end of the reporting period:
Level 1 category: financial instruments quoted on anactive market.
Level 2 category: financial instruments whose fair valueis determined using valuation techniques drawing onobservable market inputs.
Level 3 category: financial instruments whose fair valueis determined using valuation techniques drawing onnon-observable inputs (inputs whose value does notresult from the price of observable market transactionsfor the same instrument or from observable market dataavailable as of the end of the reporting period) or inputswhich are only partly observable.
2015 Breakdown by accounting classification Carrying Market Fair Available- Loans Amortised Derivatives Derivatives amount value value for-sale and cost qualifying not qualifying through financial receivables for hedge for hedge(in € millions) income assets accounting accounting
Non-current assets Non-current financial assets 458,4 458,4 177,3 281,1 Current assets Trade receivables 1 137,1 1 137,1 1 137,1 Other current financial assets 81,2 81,2 9,2 69,3 2,7
Cash and cash equivalents 1 146,4 1 146,4 202,9 943,5
Non-current liabilities Non-current borrowings 4 039,9 3 970,5 4 039,9 Other non-current financial liabilities 14,8 14,8 2,5 12,3Current liabilities Current borrowings 1 785,9 1 785,9 1 785,9 Other current financial liabilities 238,9 238,9 191,2 45,4 2,3Trade payables 939,7 939,7 939,7
05_D_VA_V4 04/04/2017 13:20 Page327

5 FINANCIAL INFORMATION ~ CONSOLIDATED FINANCIAL STATEMENTS AS OF DECEMBER 31, 2016
328 Kering ~ 2016 Reference Document
The table below shows the fair value hierarchy by financial instrument category as of December 31, 2016:
(in € millions) Fair value hierarchy 2016 Market price = Models based Models based Level 1 on observable on non-observable inputs = Level 2 inputs = Level 3
Non-current assets Non-current financial assets 26.3 454.1 480.4Current assets Trade receivables 1,196.4 1,196.4Other current financial assets 121.9 9.1 131.0Cash and cash equivalents 9.2 1,040.4 1,049.6
Non-current liabilities Non-current borrowings 4,185.8 4,185.8Other non-current financial liabilities 19.6 19.6Current liabilities Current borrowings 1,234.5 1,234.5Other current financial liabilities 96.3 189.6 285.9Trade payables 1098.5 1098.5
(in € millions) Fair value hierarchy 2015 Market price = Models based Models based Level 1 on observable on non-observable inputs = Level 2 inputs = Level 3
Non-current assets Non-current financial assets 20.7 437.7 458.4Current assets Trade receivables 1,137.1 1,137.1Other current financial assets 72.0 9.2 81.2Cash and cash equivalents 56.8 146.1 943.5 1,146.4
Non-current liabilities Non-current borrowings 4,039.9 4,039.9Other non-current financial liabilities 14.8 14.8Current liabilities Current borrowings 1,785.9 1,785.9Other current financial liabilities 47.7 191.2 238.9Trade payables 939.7 939.7
Note 32 – Net debt
(in € millions) 2016 2015
Gross borrowings 5,420.3 5,825.8Fair value hedges (interest rate) Cash and cash equivalents (1,049.6) (1,146.4)
Net debt 4,370.7 4,679.4
05_D_VA_V4 04/04/2017 13:21 Page328

5CONSOLIDATED FINANCIAL STATEMENTS AS OF DECEMBER 31, 2016 ~ FINANCIAL INFORMATION
3292016 Reference Document ~ Kering
New borrowings issued in 2016 included the first ten-year bonds issued by Kering SA, which represented a totalof €500 million and have a fixed-rate annual coupon of1.25%. The settlement / delivery date for these bonds wasMay 10, 2016.
Debt redemptions / repayments primarily relate to theimpacts of annual repayments on certain JPY bank loans.
Changes in other borrowings chiefly comprise issues andredemptions of Kering Finance commercial paper.
Note 33 – Statement of cash flows
33.1. Reconciliation of cash and cash equivalents as reported in the statement of financialposition with cash and cash equivalents as reported in the statement of cash flows
Cash and cash equivalents net of bank overdrafts amounted to €757.5 million as of December 31, 2016, reflecting totalcash and cash equivalents presented in the statement of cash flows.
(in € millions) 2016 2015
Cash and cash equivalents as reported in the statement of financial position 1,049.6 1,146.4
Bank overdrafts (292.1) (243.5)
Cash and cash equivalents as reported in the statement of cash flows 757.5 902.9
33.2. Breakdown of cash flow from operating activities
(in € millions) 2016 2015
Net income from continuing operations 880.1 680.2Net recurring charges to depreciation, amortisation and provisions on non-current operating assets 432.0 409.6Other non-cash income and expenses: 295.0 209.6
Recurring operating income and expenses (Note 4) 22.4 258.2o / w: Fair value of foreign exchange rate hedges 7.5 249.5Other 14.9 8.7
Non-recurring operating income and expenses 272.6 (48.6)o / w: Impairment losses on non-current operating assets 296.6 174.3Asset impairment 53.2 63.1Fair value of foreign exchange rate hedges in net finance costs (10.6) (265.6)Deferred tax (79.4) (55.3)Share in earnings (losses) of equity-accounted companies 2.2 2.2Other 10.6 32.7
Cash flow from operating activities 1,607.1 1,299.4
33.3. Debt issues and redemptions
(in € millions) 2016 2015
Bond issues 570.5 1,070.4Debt redemptions / repayments (51.9) (756.7)Increase / decrease in other borrowings (1,054.7) 87.3
TOTAL (536.1) 401.0
05_D_VA_V4 04/04/2017 13:21 Page329

5 FINANCIAL INFORMATION ~ CONSOLIDATED FINANCIAL STATEMENTS AS OF DECEMBER 31, 2016
330 Kering ~ 2016 Reference Document
Note 34 – Contingent liabilities, contractualcommitments not recognised and other contingencies
34.1. Commitments given and received following asset disposals
Vendor warranties given by the Group on the sale of companies are summarised below:
Disposals Vendor warranties
December 2010 Sale of Conforama Vendor warranties covering tax-related or similar claims expiring when the period becomes
time barred, capped at €120 million. This disposal is related to the commitment by Keringto continue commercial relations between Conforama and the BNP Paribas group asregards customer loans.
December 2012 Sale of The Sportsman’s Vendor warranties covering (i) tax-related or similar claims expiring when the period Guide and The Golf Warehouse becomes time barred, (ii) certain fundamental representations (including with respect to
organisation, capitalisation and authority) which survive indefinitely and (iii) representationswith respect to employment and benefit plans which terminate six months after theapplicable statute of limitations. The warranty is capped at USD 21.5 million.
February 2013 Sale of OneStopPlus Vendor warranty covering (i) tax-related or similar claims expiring when the period
becomes time barred, (ii) certain fundamental representations (including with respect toorganisation, capitalisation and authority) which survive indefinitely and (iii) certainenvironmental obligations. The warranty is capped at USD 52.5 million.
March 2013 Sale of Redcats’ Children Vendor warranty concerning (i) tax-related or similar claims expiring when the periodand Family division becomes time barred, and (ii) representations with respect to employment and benefit
plans, trademark and title ownership, which expire five years after the sale transactiondate. The warranty is capped at €10 million.
June 2013 Sale of Ellos Customary vendor warranty expiring after December 31, 2014, except for certain fundamental
representations (including with respect to organisation, capitalisation and authority),which survive indefinitely. The warranty is capped at €29 million. Specific vendor warrantycovering tax-related or similar claims which expires on June 2, 2019 and is capped at€40 million. This was accompanied by a commitment received as regards the continuationof commercial relations with Finaref, covered by a €70 million bank guarantee expiring in 2023.
05_D_VA_V4 04/04/2017 13:21 Page330

5CONSOLIDATED FINANCIAL STATEMENTS AS OF DECEMBER 31, 2016 ~ FINANCIAL INFORMATION
3312016 Reference Document ~ Kering
June 2014 Sale of La Redoute Customary vendor warranty covering certain fundamental representations (in particularand Relais Colis as regards the existence of the companies sold, the availability of the shares sold and the
power to complete the sale), which expire as applicable when the period becomes time barred,or on December 31, 2017. This general warranty is capped at €10 million.
Vendor warranties covering tax-related claims capped at €10 million, expiring when theperiod becomes time barred.
Specific vendor warranties for an indefinite amount covering the Group’s restructuringoperations prior to its sale, commercial litigation and environmental risks, expiring onDecember 31, 2021.
December 2015 Sale of Sergio Rossi Vendor warranties concerning (i) tax-related or similar claims expiring when the period
becomes time barred in each jurisdiction concerned; (ii) certain fundamental representations(including with respect to organisation, capitalisation, securities and authority) whichsurvive indefinitely; (iii) employment and employee benefit plans, and (iv) certainenvironmental obligations, guarantees relating to intellectual property rights and othercustomary business warranties; with (iii) and (iv) expiring 18 months after the date of thesale. These general warranties are capped at €15 million with the exception of (ii), which iscapped at the sale price.
Specific vendor warranties concerning (i) tax audits in progress for the years 2010 and 2012; (ii) the tax impact of the group’s restructuring operations prior to its sale; and (iii) intellectual property claims and potential disputes with certain managerial-gradeemployees (cadres) survive indefinitely. These warranties are not capped.
March 2016 Disposal of Electric Customary vendor warranty concerning certain fundamental representations, including with
respect to organisation, capitalisation and authority. The vendor warranties are limited tothe seller’s knowledge of insurance, litigation and tax-related matters. These warrantiesare not capped.
In addition to the vendor warranties described above, minor vendor warranty agreements with standard terms were setup for the purchasers of the other companies sold by the Group.
Disposals Vendor warranties
05_D_VA_V4 04/04/2017 13:21 Page331

5 FINANCIAL INFORMATION ~ CONSOLIDATED FINANCIAL STATEMENTS AS OF DECEMBER 31, 2016
332 Kering ~ 2016 Reference Document
Finance leases
The present value of future lease payments included in “Borrowings” and relating to capitalised assets meeting thedefinition of a finance lease set out in IAS 17 is as follows:
(in € millions) 2016 2015
Less than one year 9.7 10.3One to five years 65.3 49.6More than five years 40.5 23.4
115.5 83.3
Finance costs included (18.6) (12.2)
Present value of future minimum lease payments 96.9 71.1
As of December 31, 2016, the Group does not expect to receive future minimum lease payments under non-cancellablesub-lease agreements.
Operating leases
The amount of contractual obligations presented on the line“Operating lease agreements” represents future minimumlease payments under operating lease agreements forthe year, which cannot be cancelled by the lessee. Thesemainly include non cancellable rental payments inrespect of stores, logistics hubs and other buildings (headoffices and administrative offices).
As of December 31, 2016, total future minimum leasepayments which the Group expects to receive under non-cancellable sub-lease agreements amounted to€7.0 million (€8.0 million as of December 31, 2015).
The rental expense for 2016 corresponding to minimumlease payments amounts to €749.9 million (€669.1 millionin 2015). The contingent consideration expense,calculated on the basis of actual revenue, was €413.9 million(€393.1 million in 2015).
Sub-lease revenue totalled €2.7 million in both 2016 and 2015.
34.2. Other commitments given
34.2.1. Contractual obligations
The table below shows all the Group’s contractual commitments and obligations, excluding employee benefitobligations presented in Note 26 – Employee benefits.
Payments due by period Less than One to More than
(in € millions) one year five years five years 2016 2015
Borrowings (Note 29) 1,234.5 2,577.2 1,608.6 5,420.3 5,825.8Operating lease agreements 715.5 1,736.2 1,280.6 3,732.3 3,317.6Binding purchase commitments 122.4 184.2 306.6 311.3
TOTAL COMMITMENTS GIVEN 2,072.4 4,497.6 2,889.2 9,459.2 9,454.7
05_D_VA_V4 04/04/2017 13:21 Page332

5CONSOLIDATED FINANCIAL STATEMENTS AS OF DECEMBER 31, 2016 ~ FINANCIAL INFORMATION
3332016 Reference Document ~ Kering
34.3. Dependence on patents, licences and supply contracts
The Group is not significantly dependent on any patents,licences or supply contracts.
34.4. Litigation
Group companies are involved in a number of lawsuits ordisputes arising in the normal course of business,including litigation with tax, social security and customsauthorities. Provisions have been set aside for theprobable costs, as estimated by the Group’s entities andtheir counsel.
According to the Group’s legal counsel, no litigationcurrently in progress is likely to have a material impact onnormal or foreseeable operations or the planneddevelopment of the Group or any of its subsidiaries.
The Group believes there is no known litigation likely tohave a potential material impact on its net assets, earningsor financial position that is not adequately covered byprovisions recorded at the end of the reporting period. Noindividual claim is material to the Company or the Group.
The Group is not aware of any other dispute or arbitration,which has had in the recent past, or is likely to have in thefuture, a material impact on the financial position, activityor earnings of the Company or Group.
34.2.2. Guarantees and other collateral
Statement Amount of financial Amount of assets position total of assets Pledge Pledge pledged as of (carrying Corresponding pledged as of(in € millions) start date expiry date Dec. 31, 2016 amount) % Dec. 31, 2015
Intangible assets 11,272.7 Property, plant and equipment 06 / 08 / 2001 03 / 31 / 2028 34.0 2,206.5 1.5% 101.6Non-current financial assets 480.4
TOTAL NON-CURRENT ASSETS PLEDGED AS COLLATERAL 34.0 13,959.6 0.2% 101.6
34.2.3. Other commitments
Payments due by period Less than One to More than
(in € millions) one year five years five years 2016 2015
Confirmed lines of credit (see Note 29) 255.7 3,932.9 4,188.6 4,152.7Letters of credit 20.6 1.9 22.5 20.4Other guarantees received 32.0 5.1 2.5 39.6 29.5
TOTAL COMMITMENTS RECEIVED 308.3 3,938.0 4.4 4,250.7 4,202.6
Guarantees given to banks responsible for cash pooling arrangements 0.2 0.1 1.9 2.2 27.3Rent guarantees, property guarantees 10.2 3.3 4.0 17.5 13.8Sponsoring and advertising commitments 159.7 296.2 34.2 490.1 596.7Other commitments 26.1 13.7 3.0 42.8 55.1
TOTAL COMMITMENTS GIVEN 196.2 313.3 43.1 552.6 692.9
Other commitments given primarily include customs warranties and operating guarantees.
To the best of the Group’s knowledge, there are no significant contingent liabilities.
05_D_VA_V4 04/04/2017 13:21 Page333

5 FINANCIAL INFORMATION ~ CONSOLIDATED FINANCIAL STATEMENTS AS OF DECEMBER 31, 2016
334 Kering ~ 2016 Reference Document
Note 36 – Subsequent events
None.
Short-term benefits, long-term benefits and terminationbenefits correspond to amounts paid during the year;post-employment benefits and share-based paymentcorrespond to the amounts recognised as expenses.
A list of the members of the Board of Directors andExecutive Committee is provided in the “CorporateGovernance” section of the Reference Document.
35.3. Remuneration paid to members of the Board of Directors and the Group’s Executive Committee
(in € millions) 2016 2015
Short-term benefits 25.2 24.5Payroll taxes 5.2 5.2Post-employment benefits 1.0 1.0Other long-term benefits 2.6 2.0Termination indemnities 2.2 16.6Share-based payment 9.7 7.2
TOTAL 45.9 56.5
35.1. Related party controlling the Group
Kering SA is controlled by Artémis, which in turn is whollyowned by Financière Pinault. As of December 31, 2016,the Artémis group held 40.9% of Kering’s share capitaland 57.4% of its voting rights.
The main transactions carried out between Kering’sconsolidated companies and Artémis in 2016 aredescribed below:
• payment of an interim dividend in respect of 2016totalling €77.4 million in January 2017, approved onDecember 15, 2016;
• balancing payment of the dividend for 2015 of€129.0 million, further to the payment of an interimdividend of €77.5 million in January 2016 (€207.6 millionfor the full 2014 dividend);
• recognition of fees totalling €3.2 million in 2016(€3.0 million in 2015) for (i) business developmentconsulting services and complex transaction support,and (ii) the supply of development opportunities, newbusiness and cost reduction solutions. These fees aregoverned by an agreement reviewed by the AuditCommittee and approved by the Board of Directors.
35.2. Associates
In the normal course of business, the Group enters intotransactions with associates on an arm’s length basis.
These transactions are not material.
Note 35 – Transactions with related parties
05_D_VA_V4 04/04/2017 13:21 Page334

5CONSOLIDATED FINANCIAL STATEMENTS AS OF DECEMBER 31, 2016 ~ FINANCIAL INFORMATION
3352016 Reference Document ~ Kering
KERING Parent company
LUXURY ACTIVITIES
France
ALEXANDER McQUEEN FRANCE SAS C 100.00 C 100.00
ARCADES PONTHIEU SA C 95.00 C 95.00
BALENCIAGA SA C 100.00 C 100.00
BOTTEGA VENETA FRANCE SAS C 100.00 C 100.00
BOUCHERON HOLDING SAS C 100.00 C 100.00
BOUCHERON PARFUMS SAS C 100.00 C 100.00
BOUCHERON SAS C 100.00 C 100.00
BRIONI FRANCE SA C 100.00 C 100.00
C. MENDES SAS C 100.00 C 100.00
CHRISTOPHER KANE FRANCE SA C 80.00 Creation
DODO PARIS SAS C 81.00 C 81.00
FRANCE CROCO SAS C 100.00 C 85.00
GG FRANCE SERVICES SAS C 100.00 C 100.00
GPO HOLDING SAS C 100.00 C 100.00
GUCCI FRANCE SAS C 100.00 C 100.00
GUCCI GROUP WATCHES FRANCE SAS C 100.00 C 100.00
LES BOUTIQUES BOUCHERON SAS C 100.00 C 100.00
POMELLATO PARIS SA C 81.00 C 81.00
QEELIN FRANCE SARL C 100.00 C 100.00
SOWIND FRANCE SAS C 100.00 C 100.00
STELLA McCARTNEY FRANCE SAS C 50.00 C 50.00
TANNERIE DE PERIERS SAS C 100.00 C 85.00
YSL VENTES PRIVEES FRANCE SAS C 100.00 C 100.00
YVES SAINT LAURENT BOUTIQUE FRANCE SAS C 100.00 C 100.00
YVES SAINT LAURENT PARFUMS SAS C 100.00 C 100.00
YVES SAINT LAURENT SAS C 100.00 C 100.00
Germany
BRANDON GERMANY GmbH C 100.00 Creation
BOTTEGA VENETA GERMANY GmbH C 100.00 C 100.00
BRIONI GERMANY GmbH C 100.00 Creation
DODO DEUTSCHLAND GmbH C 81.00 C 81.00
GG LUXURY GOODS GmbH C 100.00 C 100.00
POMELLATO DEUTSCHLAND GmbH C 81.00 C 81.00
TRADEMA GmbH C 100.00 C 100.00
KERING WATCHES LUXURY DIVISION GmbH C 100.00 C 100.00
YVES SAINT LAURENT GERMANY GmbH C 100.00 C 100.00
Austria
ALEXANDER McQUEEN GmbH C 100.00 C 100.00
BOTTEGA VENETA AUSTRIA GmbH C 100.00 C 100.00
BRIONI AUSTRIA GmbH C 100.00 C 100.00
GUCCI AUSTRIA GmbH C 100.00 C 100.00
YVES SAINT LAURENT AUSTRIA GmbH C 100.00 C 100.00
Belgium
GUCCI BELGIUM SA C 100.00 C 100.00
Spain
BALENCIAGA SPAIN SL C 100.00 C 100.00
BOTTEGA VENETA ESPAÑA SL C 100.00 C 100.00
BRIONI RETAIL ESPAÑA SL C 100.00 C 100.00
DODO SPAIN SA C 81.00 C 81.00
LUXURY GOODS SPAIN SL C 100.00 C 100.00
LUXURY TIMEPIECES ESPAÑA SL C 100.00 C 100.00
STELLA McCARTNEY SPAIN SL C 50.00 C 50.00
YVES SAINT LAURENT SPAIN SA C 100.00 C 100.00
United Kingdom
ALEXANDER McQUEEN TRADING Ltd C 100.00 C 100.00
AUTUMNPAPER Ltd C 100.00 C 100.00
BALENCIAGA UK Ltd C 100.00 C 100.00
BIRDSWAN SOLUTIONS Ltd C 100.00 C 100.00
BOTTEGA VENETA UK Co. Ltd C 100.00 C 100.00
BOUCHERON UK Ltd C 100.00 C 100.00
Company % interestDec. 31, 2016 Dec. 31, 2015
Company % interestDec. 31, 2016 Dec. 31, 2015
Note 37 – List of consolidated subsidiaries as of December 31, 2016
Details of Group subsidiaries are provided below.
Consolidation method: Full consolidation: C
Equity method: E
05_D_VA_V4 04/04/2017 13:21 Page335

5 FINANCIAL INFORMATION ~ CONSOLIDATED FINANCIAL STATEMENTS AS OF DECEMBER 31, 2016
BRIONI UK Ltd C 100.00 C 100.00
CHRISTOPHER KANE Ltd C 80.00 C 80.00
DODO (UK) Ltd C 81.00 C 81.00
GUCCI Ltd C 100.00 C 100.00
LUXURY TIMEPIECES UK Ltd C 100.00 C 100.00
LUXURY TIMEPIECES & JEWELLERY OUTLETS Ltd C 100.00 Creation
PAINTGATE Ltd C 100.00 C 100.00
POMELLATO (UK) Ltd C 81.00 C 81.00
QEELIN UK Ltd C 100.00 C 100.00
STELLA McCARTNEY Ltd C 50.00 C 50.00
YVES SAINT LAURENT UK Ltd C 100.00 C 100.00
Greece
LUXURY GOODS GREECE AE C 99.80 C 94.75
Hungary
GUCCI HUNGARY KFT C 100.00 C 100.00
Ireland
GUCCI IRELAND Ltd C 100.00 C 100.00
Italy
ALEXANDER McQUEEN ITALIA SRL C 100.00 C 100.00
ARDORA SRL C 100.00 C 100.00
BALENCIAGA LOGISTICA SRL C 100.00 C 100.00
BALENCIAGA RETAIL ITALIA SRL C 100.00 C 100.00
BRIONI SpA C 100.00 C 100.00
BRIONI OUTLET SRL C 100.00 C 100.00
BRIONI RETAIL SRL C 100.00 C 100.00
BRIONI RETAIL ITALIA SRL C 100.00 C 100.00
BV CALZATURE SRL C 100.00 C 100.00
BV ITALIA SRL C 100.00 C 100.00
BV OUTLET SRL Merger C 100.00
BV SERVIZI SRL C 100.00 C 100.00
BOTTEGA VENETA SRL C 100.00 C 100.00
CALZATURIFICIO CREST SRL C 100.00 C 100.00
CALZATURIFICIO FLORA SRL C 100.00 C 100.00
CAPRI GROUP SRL Merger C 100.00
CARAVEL PELLI PREGIATE SpA C 100.00 C 100.00
CHRISTOPHER KANE SRL C 80.00 C 80.00
CONCERIA BLUTONIC SpA C 51.00 C 51.00
DESIGN MANAGEMENT SRL C 100.00 C 100.00
DESIGN MANAGEMENT 2 SRL C 100.00 Creation
E_LITE SpA C 51.00 C 51.00
GARPE SRL C 100.00 C 100.00
GAUGUIN SRL C 100.00 C 100.00
G COMMERCE EUROPE SpA C 100.00 C 100.00
G.F. LOGISTICA SRL C 100.00 C 100.00
G.F. SERVICES SRL C 100.00 C 100.00
GGW ITALIA SRL C 100.00 C 100.00
GJP SRL C 100.00 C 100.00
GPA SRL C 100.00 C 100.00
GT SRL C 100.00 C 100.00
GUCCI IMMOBILLARE LECCIO SRL C 100.00 C 100.00
GUCCI LOGISTICA SpA C 100.00 C 100.00
GUCCIO GUCCI SpA C 100.00 C 100.00
LGM SRL C 73.30 C 51.00
LUXURY GOODS ITALIA SpA C 100.00 C 100.00
LUXURY GOODS OUTLET SRL C 100.00 C 100.00
MANIFATTURA VENETA PELLETERIE SRL C 100.00 C 100.00
PIGINI SRL C 100.00 C 100.00
POMELLATO SpA C 81.00 C 81.00
POMELLATO EUROPA SpA C 81.00 C 81.00
ROMAN STYLE SpA C 100.00 C 100.00
SFORZA SRL C 100.00 C 100.00
SOWIND ITALIA SRL C 100.00 C 100.00
STELLA McCARTNEY ITALIA SRL C 50.00 C 50.00
SL LUXURY RETAIL SRL C 100.00 C 100.00
THE MALL SRL C 100.00 C 100.00
TIGER FLEX SRL C 100.00 C 100.00
ULYSSE NARDIN ITALIA SRL C 100.00 C 100.00
YVES SAINT LAURENT DEVELOPMENT SRL C 100.00 C 100.00
YSL LOGISTICA SRL C 100.00 C 100.00
Luxembourg
BOTTEGA VENETA INTERNATIONAL SARL C 100.00 C 100.00
CASTERA SARL C 100.00 C 100.00
GUCCI GULF INVESTMENTS SARL C 100.00 C 100.00
LUXURY FASHION LUXEMBOURG SA C 50.00 C 50.00
QEELIN HOLDING LUXEMBOURG SA C 100.00 C 100.00
Monaco
BOUCHERON SAM C 100.00 C 100.00
GUCCI SAM C 100.00 C 100.00
KERING RETAIL MONACO SAM C 100.00 C 100.00
Company % interestDec. 31, 2016 Dec. 31, 2015
Company % interestDec. 31, 2016 Dec. 31, 2015
336 Kering ~ 2016 Reference Document
05_D_VA_V4 04/04/2017 13:21 Page336

5CONSOLIDATED FINANCIAL STATEMENTS AS OF DECEMBER 31, 2016 ~ FINANCIAL INFORMATION
3372016 Reference Document ~ Kering
SMHJ SAM C 80.83 C 80.83
YVES SAINT LAURENT OF MONACO SAM C 100.00 C 100.00
Netherlands
BOTTEGA VENETA HOLDING BV C 100.00 C 100.00
G DISTRIBUTION BV C 100.00 C 100.00
GG MIDDLE EAST BV C 100.00 C 100.00
GG OTHER TERRITORIES BV C 100.00 C 100.00
KERING ASIAN HOLDING BV C 100.00 C 100.00
GUCCI NETHERLANDS BV C 100.00 C 100.00
OLIMA BV Liquidation C 100.00
Czech Republic
BRIONI CZECH REPUBLIC SRO C 100.00 C 100.00
LUXURY GOODS CZECH REPUBLIC SRO C 100.00 C 100.00
Russia
BOUCHERON RUSSIA OOO C 100.00 Creation
GUCCI RUS OOO C 100.00 C 100.00
ULYSSE NARDIN RUSSIA LLC C 100.00 C 100.00
Serbia
LUXURY TANNERY DOO C 51.00 C 51.00
Switzerland
BOTTEGA VENETA SA C 100.00 C 100.00
BOUCHERON (SUISSE) SA C 100.00 C 100.00
BRIONI SWITZERLAND SA C 100.00 C 100.00
DONZE CADRANS SA C 100.00 C 100.00
FABBRICA QUADRANTI SA C 51.00 C 51.00
GT SILK SA C 76.00 C 76.00
LUXURY FASHION SA C 50.00 C 50.00
LUXURY GOODS INTERNATIONAL SA C 100.00 C 100.00
LUXURY GOODS OUTLETS EUROPE SAGL C 100.00 C 100.00
OCHS UND JUNIOR SA E 32.80 E 32.80
SIGATEC SA E 50.00 E 50.00
SOWIND GROUP SA C 100.00 C 100.00
SOWIND SA C 100.00 C 100.00
THE MALL LUXURY OUTLET SA C 100.00 C 100.00
ULYSSE NARDIN LE LOCLE SA C 100.00 C 100.00
UNCA SA E 50.00 E 50.00
Sweden
GUCCI SWEDEN AB Disposal C 100.00
Aruba
GEMINI ARUBA NV C 100.00 C 100.00
Brazil
BOTTEGA VENETA HOLDING Ltda C 100.00 C 100.00
GUCCI BRASIL IMPORTACAO E EXPORTACAO Ltda C 100.00 C 100.00
SAINT LAURENT BRASIL IMPORTACAO E EXPORTACAO Ltda C 100.00 C 100.00
Canada
G. BOUTIQUES Inc. C 100.00 C 100.00
SAINT LAURENT CANADA BOUTIQUES Inc. C 100.00 Creation
Chile
LUXURY GOODS CHILE SpA C 51.00 C 51.00
United States
ALEXANDER McQUEEN TRADING AMERICA Inc. C 100.00 C 100.00
741 MADISON AVENUE Corp. C 81.00 C 81.00
BALENCIAGA AMERICA Inc. C 100.00 C 100.00
BOTTEGA VENETA Inc. C 100.00 C 100.00
BOUCHERON JOAILLERIE (USA) Inc. C 100.00 C 100.00
BRIONI AMERICA Inc. C 100.00 C 100.00
BRIONI AMERICA HOLDING Inc. C 100.00 C 100.00
CHRISTOPHER KANE Inc. C 80.00 C 80.00
E_LITE US Inc. C 51.00 C 51.00
G GATOR USA LLC C 100.00 C 100.00
GUCCI AMERICA Inc. C 100.00 C 100.00
GUCCI CARIBBEAN Inc. C 100.00 C 100.00
GUCCI GROUP WATCHES Inc. C 100.00 C 100.00
JOSEPH ALTUZARRA E 38.50 E 38.50
LUXURY HOLDINGS Inc. C 100.00 C 100.00
POMELLATO USA Inc. C 81.00 C 81.00
STELLA McCARTNEY AMERICA Inc. C 50.00 C 50.00
TOMAS MAIER HOLDING LLC E 51.00 E 51.00
TRADEMA OF AMERICA Inc. C 100.00 C 100.00
ULYSSE NARDIN Inc. C 100.00 C 100.00
WALL’S GATOR FARM II LLC E 40.00 -
WG ALLIGATOR FARM LLC E 40.00 -
YVES SAINT LAURENT AMERICA HOLDING Inc. C 100.00 C 100.00
YVES SAINT LAURENT AMERICA Inc. C 100.00 C 100.00
Company % interestDec. 31, 2016 Dec. 31, 2015
Company % interestDec. 31, 2016 Dec. 31, 2015
05_D_VA_V4 04/04/2017 13:21 Page337

5 FINANCIAL INFORMATION ~ CONSOLIDATED FINANCIAL STATEMENTS AS OF DECEMBER 31, 2016
Mexico
BOTTEGA VENETA MEXICO, S DE RL DE CV C 100.00 C 100.00
BOTTEGA VENETA SERVICIOS S DE RL DE CV C 100.00 C 100.00
D ITALIAN CHARMS SA DE CV C 81.00 C 81.00
GUCCI IMPORTACIONES SA DE CV C 100.00 C 100.00
GUCCI MEXICO SA DE CV C 100.00 C 100.00
RETAIL LUXURY SERVICIOS SA DE CV C 100.00 C 100.00
SAINT LAURENT MEXICO, S DE RL DE CV C 100.00 C 100.00
SAINT LAURENT SERVICIOS, S DE RL DE CV C 100.00 C 100.00
Panama
LUXURY GOODS PANAMA S DE RL C 51.00 C 51.00
Australia
BOTTEGA VENETA AUSTRALIA Pty Ltd C 100.00 C 100.00
GUCCI AUSTRALIA PTY Ltd C 100.00 C 100.00
SAINT LAURENT AUSTRALIA Pty Ltd C 100.00 Creation
New Zealand
GUCCI NEW ZEALAND Ltd C 100.00 C 100.00
China
1921 (SHANGHAI) RESTAURANT Limited C 100.00 C 100.00
ALEXANDER McQUEEN (HONG KONG) Limited C 100.00 C 100.00
ALEXANDER McQUEEN (MACAU) Ltd C 100.00 C 100.00
ALEXANDER McQUEEN (SHANGHAI) TRADING Limited C 100.00 C 100.00
BALENCIAGA ASIA PACIFIC Ltd C 100.00 C 100.00
BALENCIAGA FASHION SHANGAI Co. Ltd C 100.00 C 100.00
BALENCIAGA MACAU Ltd C 100.00 C 100.00
BOTTEGA VENETA (CHINA) TRADING Ltd C 100.00 C 100.00
BOTTEGA VENETA HONG KONG Limited C 100.00 C 100.00
BOTTEGA VENETA MACAU Ltd C 100.00 C 100.00
BRIONI MACAU Ltd C 100.00 C 100.00
BRIONI (SHANGHAI) TRADING Ltd C 100.00 C 100.00
BRIONI HONG KONG Ltd C 100.00 C 100.00
BOUCHERON (SHANGHAI) TRADING Ltd C 100.00 Creation
BOUCHERON HONG KONG Ltd C 100.00 C 100.00
GUCCI ASIA COMPANY Ltd C 100.00 C 100.00
GUCCI (CHINA) TRADING Ltd C 100.00 C 100.00
GUCCI (HONG KONG) Ltd C 100.00 C 100.00
GUCCI MACAU Ltd C 100.00 C 100.00
GUCCI WATCHES MARKETING CONSULTING (SHANGHAI) Ltd C 100.00 C 100.00
LGI (SHANGHAI) ENTERPRISE MANAGEMENT Ltd C 100.00 C 100.00
LUXURY TIMEPIECES (HONG KONG) Ltd C 100.00 C 100.00
MOVEN INTERNATIONAL Ltd C 100.00 C 100.00
POMELLATO CHINA Ltd C 81.00 C 81.00
POMELLATO SHANGHAI Co. Ltd C 81.00 C 81.00
POMELLATO PACIFIC Ltd C 81.00 C 81.00
QEELIN Ltd C 100.00 C 100.00
QEELIN TRADING (SHANGHAI) Co. Ltd C 100.00 C 100.00
QEELIN MACAU Ltd C 100.00 C 100.00
STELLA McCARTNEY HONG KONG Ltd C 50.00 Creation
STELLA McCARTNEY (SHANGHAI) TRADING Ltd C 50.00 C 50.00
SOWIND ASIA Ltd C 100.00 C 100.00
ULYSSE NARDIN (ASIA PACIFIC) Ltd C 100.00 C 100.00
YVES SAINT LAURENT MACAU Ltd C 100.00 C 100.00
YVES SAINT LAURENT (SHANGHAI) TRADING Limited C 100.00 C 100.00
YVES SAINT LAURENT (HONG KONG) Limited C 100.00 C 100.00
Korea
BALENCIAGA KOREA Ltd C 100.00 C 100.00
BOTTEGA VENETA KOREA Ltd C 100.00 C 100.00
BOUCHERON KOREA Ltd C 100.00 C 100.00
GUCCI KOREA Ltd C 100.00 C 100.00
YVES SAINT LAURENT KOREA Ltd C 100.00 C 100.00
Guam
BOTTEGA VENETA GUAM Inc. C 100.00 C 100.00
GUCCI GROUP GUAM Inc. C 100.00 C 100.00
India
GUCCI INDIA PRIVATE Ltd C 100.00 C 100.00
LUXURY GOODS RETAIL PRIVATE Limited LGR C 51.00 C 51.00
Company % interestDec. 31, 2016 Dec. 31, 2015
Company % interestDec. 31, 2016 Dec. 31, 2015
338 Kering ~ 2016 Reference Document
05_D_VA_V4 04/04/2017 13:21 Page338

5CONSOLIDATED FINANCIAL STATEMENTS AS OF DECEMBER 31, 2016 ~ FINANCIAL INFORMATION
Japan
BALENCIAGA JAPAN Ltd C 100.00 C 100.00
BOTTEGA VENETA JAPAN Limited C 100.00 C 100.00
BOUCHERON JAPAN Ltd C 100.00 C 100.00
BRIONI JAPAN & Co. Ltd C 100.00 C 100.00
E_LITE JAPAN Ltd C 51.00 C 51.00
LUXURY TIMEPIECES JAPAN Limited C 100.00 C 100.00
POMELLATO JAPAN Co. Ltd C 81.00 C 81.00
STELLA McCARTNEY JAPAN Ltd C 50.00 C 50.00
SOWIND JAPAN KK C 100.00 C 100.00
Vietnam
GUCCI VIETNAM Co. Ltd C 100.00 C 100.00
Bahrain
FLORENCE 1921 WLL C 49.00 C 49.00
United Arab Emirates
ATELIER LUXURY GULF LLC C 49.00 C 49.00
LUXURY GOODS GULF LLC C 49.00 C 49.00
LUXURY FASHION GULF LLC C 49.00 C 49.00
Kazakhstan
ULYSSE NARDIN KAZAKHSTAN LLP E 50.00 E 50.00
Kuwait
LUXURY GOODS KUWAIT WLL C 49.00 C 49.00
Qatar
SAINT LAURENT PARIS LLC C 24.00 C 24.00
LUXURY GOODS QATAR LLC C 49.00 C 49.00
Malaysia
BOTTEGA VENETA MALAYSIA SDN BHD C 100.00 C 100.00
GUCCI (MALAYSIA) SDN BHD C 100.00 C 100.00
SAINT LAURENT (MALAYSIA) SDN BHD C 100.00 Creation
Mongolia
ULYSSE NARDIN MONGOLIA LLC E 50.00 E 50.00
Singapore
ALEXANDER McQUEEN (SINGAPORE) PTE Ltd C 100.00 C 100.00
BOTTEGA VENETA SINGAPORE PRIVATE Limited C 100.00 C 100.00
GUCCI SINGAPORE PTE Ltd C 100.00 C 100.00
SAINT LAURENT (SINGAPORE) PTE Limited C 100.00 C 100.00
Taiwan
BOUCHERON TAIWAN Co. Ltd C 100.00 C 100.00
GUCCI GROUP WATCHES TAIWAN Limited C 100.00 C 100.00
ULYSSE NARDIN (TAIWAN) Ltd C 100.00 C 100.00
Turkey
POMELLATO MUCEVHERAT VE AKSESUAR DAGITIM VE TICARET LIMITED SIRKETI C 81.00 C 81.00
Thailand
CLOSED-CYCLE BREEDING INTERNATIONAL Ltd C 48.00 C 48.00
G-OPERATIONS FRASEC Ltd C 49.00 C 49.00
GUCCI THAILAND Co. Ltd C 100.00 C 100.00
SAINT LAURENT (THAILAND) Co. C 100.00 C 100.00
South Africa
GG LUXURY RETAIL SOUTH AFRICA PTE Ltd C 62.00 C 62.00
PUMA
PUMA SE (GERMANY) C 85.81 C 85.81
France
DOBOTEX FRANCE SAS C 85.81 C 85.81
PUMA FRANCE SAS C 85.81 C 85.81
Germany
DOBOTEX DEUTSCHLAND GmbH C 85.81 C 85.81
PUMA EUROPE GmbH C 85.81 C 85.81
PUMA INTERNATIONAL TRADING GmbH C 85.81 C 85.81
PUMA MOSTRO GmbH C 85.81 C 85.81
PUMA SPRINT GmbH C 85.81 C 85.81
PUMA VERTRIEB GmbH C 85.81 C 85.81
Austria
AUSTRIA PUMA DASSLER GES MBH C 85.81 C 85.81
DOBOTEX AUSTRIA GmbH C 85.81 C 85.81
Cyprus
SPORT EQUIPMENT TI CYPRUS Ltd C 85.81 C 85.81
Croatia
PUMA SPORT HRVATSKA DOO C 85.81 C 85.81
Denmark
PUMA DENMARK A / S C 85.81 C 85.81
Spain
DOBOTEX SPAIN SL C 85.81 C 85.81
PUMA IBERIA SLU C 85.81 C 85.81
Company % interestDec. 31, 2016 Dec. 31, 2015
Company % interestDec. 31, 2016 Dec. 31, 2015
3392016 Reference Document ~ Kering
05_D_VA_V4 04/04/2017 13:21 Page339

5 FINANCIAL INFORMATION ~ CONSOLIDATED FINANCIAL STATEMENTS AS OF DECEMBER 31, 2016
Estonia
PUMA ESTONIA OU C 85.81 C 85.81
Finland
BRANDON OY Disposal C 85.81
PUMA FINLAND OY C 85.81 C 85.81
United Kingdom
ADMIRAL TEAMSPORTS Ltd C 85.81 Creation
DOBOTEX UK Ltd C 85.81 C 85.81
BRANDED SPORTS MERCHANDISING UK Ltd C 85.81 C 85.81
GENESIS GROUP INTERNATIONAL Ltd C 85.81 Creation
PUMA PREMIER Ltd C 85.81 C 85.81
PUMA UNITED KINGDOM Ltd C 85.81 C 85.81
Greece
PUMA HELLAS SA C 85.81 C 85.81
Israel
PUMA SPORT ISRAEL Ltd C 85.81 C 85.81
Italy
DOBOTEX ITALIA SRL C 85.81 C 85.81
PUMA ITALIA SRL C 85.81 C 85.81
Lithuania
PUMA BALTIC UAB Liquidation C 85.81
Malta
PUMA MALTA Ltd C 85.81 C 85.81
PUMA RACING Ltd C 85.81 C 85.81
Norway
PUMA NORWAY AS C 85.81 C 85.81
Netherlands
BRANDED SPORTS MERCHANDISING BV C 85.81 C 85.81
DOBO LOGIC BV C 85.81 C 85.81
DOBOTEX INTERNATIONAL BV C 85.81 C 85.81
DOBOTEX LICENSING HOLDING BV C 85.81 C 85.81
DOBOTEX BV C 85.81 C 85.81
BRAND PLUS LICENSING BV C 85.81 C 85.81
PUMA INTERNATIONAL SPORTS MARKETING BV C 85.81 C 85.81
PUMA BENELUX BV C 85.81 C 85.81
Philippines
PUMA INFORMATION TECHNOLOGY SERVICES PHILIPPINES COMPANY Limited Inc. C 85.81 Creation
Poland
PUMA POLSKA SPOLKA ZOO C 85.81 C 85.81
Czech Republic
PUMA CZECH REPUBLIC SRO C 85.81 C 85.81
Romania
PUMA SPORT ROMANIA SRL C 85.81 C 85.81
Russia
PUMA-RUS Ltd C 85.81 C 85.81
Slovakia
PUMA SLOVAKIA SRO C 85.81 C 85.81
Sweden
BRANDON AB Disposal C 85.81
BRANDON COMPANY AB Disposal C 85.81
PUMA NORDIC AB C 85.81 C 85.81
NROTERT AB C 85.81 C 85.81
NROTERT SWEDEN AB C 85.81 C 85.81
Switzerland
DOBOTEX SWITZERLAND AG C 85.81 C 85.81
MOUNT PUMA AG (SWITZERLAND) C 85.81 C 85.81
PUMA RETAIL AG C 85.81 C 85.81
Ukraine
PUMA UKRAINE TOV C 85.81 C 85.81
Argentina
UNISOL SA C 85.81 C 85.81
Brazil
PUMA SPORTS Ltda C 85.81 C 85.81
Canada
JANED CANADA LLC C 43.76 Creation
PUMA CANADA Inc. C 85.81 C 85.81
PUMA KIDS APPAREL CANADA, LLC C 43.76 Creation
Chile
PUMA CHILE SA C 85.81 C 85.81
PUMA SERVICIOS SpA C 85.81 C 85.81
United States
BRANDON USA Inc. Disposal C 85.81
COBRA GOLF Inc. C 85.81 C 85.81
JANED LLC C 43.76 C 43.76
PUMA KIDS APPAREL NORTH AMERICA, LLC C 43.76 C 43.76
PUMA NORTH AMERICA Inc. C 85.81 C 85.81
PUMA SUEDE HOLDING Inc. C 85.81 C 85.81
PUMA ACCESSORIES NORTH AMERCIA LLC C 72.94 C 72.94
Company % interestDec. 31, 2016 Dec. 31, 2015
Company % interestDec. 31, 2016 Dec. 31, 2015
340 Kering ~ 2016 Reference Document
05_D_VA_V4 04/04/2017 13:21 Page340

5CONSOLIDATED FINANCIAL STATEMENTS AS OF DECEMBER 31, 2016 ~ FINANCIAL INFORMATION
3412016 Reference Document ~ Kering
British Virgin Islands
LIBERTY CHINA HOLDING Ltd C 85.81 C 85.81
Mexico
DOBOTEX DE MEXICO SA DE CV C 85.81 C 85.81
IMPORTATIONES BRAND PLUS LICENSING SA DE CV C 85.81 C 85.81
IMPORTACIONES RDS SA DE CV C 85.81 C 85.81
PUMA MEXICO SPORT SA DE CV C 85.81 C 85.81
SERVICIOS PROFESIONALES RDS SA DE CV C 85.81 C 85.81
Peru
DISTRUIBUIDORA DEPORTIVA PUMA SAC C 85.81 C 85.81
DISTRUIBUIDORA DEPORTIVA PUMA TACNA SAC C 85.81 C 85.81
PUMA RETAIL PERU SAC C 85.81 C 85.81
Uruguay
PUMA SPORTS LA SA C 85.81 C 85.81
Botswana
WILDERNESS HOLDINGS Ltd E 22.16 E 22.16
South Africa
PUMA SPORTS DISTRIBUTORS PTY Ltd C 85.81 C 85.81
PUMA SPORTS SA C 85.81 C 85.81
Australia
KALOLA PTY Ltd C 85.81 C 85.81
PUMA AUSTRALIA PTY Ltd C 85.81 C 85.81
WHITE DIAMOND AUSTRALIA PTY Ltd C 85.81 C 85.81
WHITE DIAMOND PROPERTIES PTY Ltd C 85.81 C 85.81
New Zealand
PUMA NEW ZEALAND Ltd C 85.81 C 85.81
United Arab Emirates
PUMA MIDDLE EAST FZ LLC C 85.81 C 85.81
PUMA UAE LLC C 85.81 C 85.81
Turkey
PUMA SPOR GIYIM SANANYI VE TICARET AS C 85.81 C 85.81
China
BRANDON TRADING (SHANGHAI) Ltd Disposal C 85.81
DOBOTEX CHINA Ltd C 85.81 C 85.81
GUANGZHOU WORLD CAT INFORMATION CONSULTING SERVICES Co. Ltd C 85.81 C 85.81
PUMA CHINA Ltd C 85.81 C 85.81
Hong Kong
BRANDON HONG KONG Ltd Disposal C 85.81
DEVELOPMENT SERVICES Ltd C 85.81 C 85.81
DOBOTEX Ltd C 85.81 C 85.81
PUMA ASIA PACIFIC Ltd C 85.81 C 85.81
PUMA HONG KONG Ltd C 85.81 C 85.81
PUMA INTERNATIONAL TRADING SERVICES Ltd C 85.81 C 85.81
WORLD CAT Ltd C 85.81 C 85.81
India
PUMA SPORTS INDIA PVT Ltd C 85.81 C 85.81
PUMA INDIA CORPORATE SERVICES PVT Ltd C 85.81 C 85.81
WORLD CAT SOURCING INDIA Ltd C 85.81 C 85.81
Indonesia
PT PUMA CAT INDONESIA C 85.81 C 85.81
Japan
PUMA JAPAN KK C 85.81 C 85.81
Korea
DOBOTEX KOREA Ltd C 85.81 C 85.81
PUMA KOREA Ltd C 85.81 C 85.81
Malaysia
PUMA SPORTS GOODS SDN BHD C 85.81 C 85.81
Singapore
PUMA SPORTS SEA TRADING Pte Ltd C 85.81 C 85.81
PUMA SEA HOLDING Pte Ltd C 85.81 C 85.81
Taiwan
PUMA TAIWAN SPORTS Ltd C 85.81 C 85.81
Vietnam
WORLD CAT VIETNAM CO. Ltd C 85.81 C 85.81
WORLD CAT VIETNAM SOURCING & DEVELOPMENT SERVICES CO. Ltd C 85.81 C 85.81
VOLCOM
VOLCOM LLC C 100.00 C 100.00
United States
LS&S RETAIL LLC C 100.00 C 100.00
VOLCOM RETAIL LLC C 100.00 C 100.00
Company % interestDec. 31, 2016 Dec. 31, 2015
Company % interestDec. 31, 2016 Dec. 31, 2015
05_D_VA_V4 04/04/2017 13:21 Page341

VOLCOM RETAIL OUTLET LLC C 100.00 C 100.00
ELECTRIC VISUAL EVOLUTION LLC Disposal C 100.00
Luxembourg
VOLCOM LUXEMBOURG HOLDING SA C 100.00 C 100.00
Switzerland
VOLCOM INTERNATIONAL SARL C 100.00 C 100.00
WELCOM DISTRIBUTION SARL C 100.00 C 100.00
Spain
VOLCOM DISTRIBUTION SPAIN SL C 100.00 C 100.00
France
VOLCOM SAS C 100.00 C 100.00
VOLCOM RETAIL FRANCE C 100.00 C 100.00
ELECTRIC EUROPE SARL Disposal C 100.00
United Kingdom
VOLCOM DISTRIBUTION (UK) Limited C 100.00 C 100.00
VOLCOM RETAIL (UK) Limited C 100.00 C 100.00
Australia
VOLCOM AUSTRALIA HOLDING COMPANY PTY Ltd C 100.00 C 100.00
VOLCOM AUSTRALIA PTY Ltd C 100.00 C 100.00
ELECTRIC VISUAL EVOLUTION AUSTRALIA PTY Ltd Disposal C 100.00
Canada
VOLCOM CANADA Inc. C 100.00 C 100.00
New Zealand
VOLCOM NEW ZEALAND Ltd C 100.00 C 100.00
Japan
VOLCOM JAPAN GODOGAISHIYA C 100.00 C 100.00
China
VOLCOM ASIA PACIFIC Ltd C 100.00 C 100.00
HOLDING COMPANIES AND OTHER
France
CONSEIL ET ASSISTANCE C 100.00 C 100.00
DISCODIS SAS C 100.00 C 100.00
GG FRANCE 13 SAS C 100.00 C 100.00
GG FRANCE 14 SAS C 100.00 C 100.00
GG FRANCE HOLDING SAS C 100.00 C 100.00
KERING EYEWEAR FRANCE SAS C 80.00 C 80.00
KERING FINANCE SNC C 100.00 C 100.00
SAPARDIS C 100.00 C 100.00
SAPRODIS SERVICES SAS C 100.00 C 100.00
Germany
KERING EYEWEAR DACH GmbH C 80.00 C 80.00
SAPARDIS DEUTSCHLAND SE C 100.00 C 100.00
Spain
KERING EYEWEAR ESPAÑA SA C 80.00 C 80.00
KERING SPAIN SL C 100.00 C 100.00
United Kingdom
KERING EYEWEAR UK Ltd C 80.00 C 80.00
KERING INTERNATIONAL Limited C 100.00 C 100.00
KERING UK SERVICES Ltd C 100.00 C 100.00
Italy
KERING EYEWEAR SpA C 80.00 C 80.00
KERING ITALIA SpA C 100.00 C 100.00
KERING OPERATIONS & SERVICES ITALIA SRL C 100.00 Creation
KERING SERVICE ITALIA SpA C 100.00 C 100.00
Luxembourg
BOUCHERON LUXEMBOURG SARL C 100.00 C 100.00
KERING RE C 100.00 C 100.00
KERING LUXEMBOURG SA C 100.00 C 100.00
E-KERING LUX SA C 100.00 C 100.00
PPR DISTRI LUX SA C 100.00 C 100.00
PPR INTERNATIONAL C 100.00 C 100.00
Netherlands
G OPERATIONS BV C 100.00 C 100.00
GUCCI INTERNATIONAL NV C 100.00 C 100.00
GUCCI PARTICIPATION BV C 100.00 C 100.00
KERING HOLLAND NV C 100.00 C 100.00
KERING NETHERLANDS BV C 100.00 C 100.00
KERING INVESTMENTS EUROPE BV C 100.00 C 100.00
Switzerland
LUXURY GOODS SERVICES SA C 100.00 C 100.00
LUXURY GOODS LOGISTICS SA C 51.00 C 51.00
LUXURY GOODS OPERATIONS SA C 51.00 C 51.00
China
GUANGZHOU KGS CORPORATE MANAGEMENT & CONSULTANCY Limited C 100.00 C 100.00
KERING ASIA PACIFIC Ltd C 100.00 C 100.00
KERING (CHINA) ENTERPRISE MANAGEMENT Ltd C 100.00 C 100.00
KERING EYEWEAR APAC Ltd C 80.00 C 80.00
342 Kering ~ 2016 Reference Document
Company % interestDec. 31, 2016 Dec. 31, 2015
Company % interestDec. 31, 2016 Dec. 31, 2015
05_D_VA_V4 04/04/2017 13:21 Page342
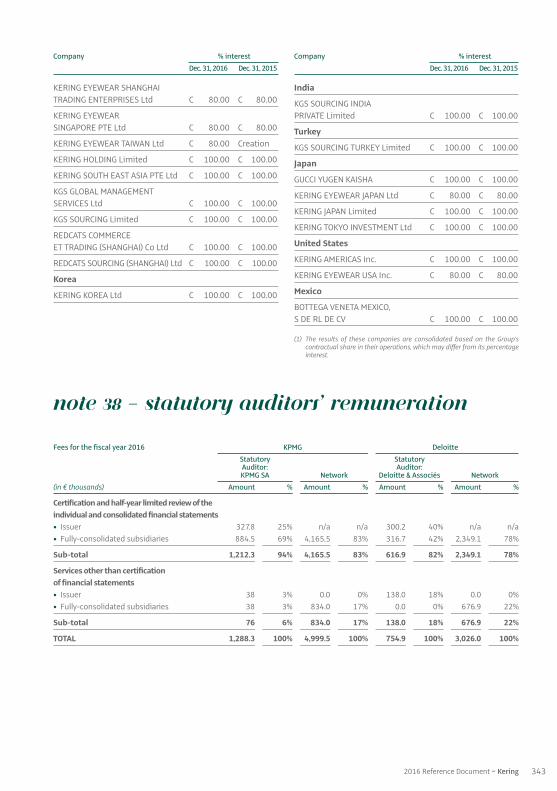
Note 38 – Statutory Auditors’ remuneration
Fees for the fiscal year 2016 KPMG Deloitte Statutory Statutory Auditor: Auditor: KPMG SA Network Deloitte & Associés Network(in € thousands) Amount % Amount % Amount % Amount %
Certification and half-year limited review of the individual and consolidated financial statements • Issuer 327.8 25% n / a n / a 300.2 40% n / a n / a• Fully-consolidated subsidiaries 884.5 69% 4,165.5 83% 316.7 42% 2,349.1 78%
Sub-total 1,212.3 94% 4,165.5 83% 616.9 82% 2,349.1 78%
Services other than certification of financial statements • Issuer 38 3% 0.0 0% 138.0 18% 0.0 0%• Fully-consolidated subsidiaries 38 3% 834.0 17% 0.0 0% 676.9 22%
Sub-total 76 6% 834.0 17% 138.0 18% 676.9 22%
TOTAL 1,288.3 100% 4,999.5 100% 754.9 100% 3,026.0 100%
KERING EYEWEAR SHANGHAI TRADING ENTERPRISES Ltd C 80.00 C 80.00
KERING EYEWEAR SINGAPORE PTE Ltd C 80.00 C 80.00
KERING EYEWEAR TAIWAN Ltd C 80.00 Creation
KERING HOLDING Limited C 100.00 C 100.00
KERING SOUTH EAST ASIA PTE Ltd C 100.00 C 100.00
KGS GLOBAL MANAGEMENT SERVICES Ltd C 100.00 C 100.00
KGS SOURCING Limited C 100.00 C 100.00
REDCATS COMMERCE ET TRADING (SHANGHAI) Co Ltd C 100.00 C 100.00
REDCATS SOURCING (SHANGHAI) Ltd C 100.00 C 100.00
Korea
KERING KOREA Ltd C 100.00 C 100.00
India
KGS SOURCING INDIA PRIVATE Limited C 100.00 C 100.00
Turkey
KGS SOURCING TURKEY Limited C 100.00 C 100.00
Japan
GUCCI YUGEN KAISHA C 100.00 C 100.00
KERING EYEWEAR JAPAN Ltd C 80.00 C 80.00
KERING JAPAN Limited C 100.00 C 100.00
KERING TOKYO INVESTMENT Ltd C 100.00 C 100.00
United States
KERING AMERICAS Inc. C 100.00 C 100.00
KERING EYEWEAR USA Inc. C 80.00 C 80.00
Mexico
BOTTEGA VENETA MEXICO, S DE RL DE CV C 100.00 C 100.00
(1) The results of these companies are consolidated based on the Group’scontractual share in their operations, which may differ from its percentageinterest.
3432016 Reference Document ~ Kering
Company % interestDec. 31, 2016 Dec. 31, 2015
Company % interestDec. 31, 2016 Dec. 31, 2015
05_D_VA_V4 04/04/2017 13:21 Page343

5. Statutory Auditors’ report on theconsolidated financial statementsYear ended December 31, 2016
This is a free translation into English of the Statutory Auditors’ report issued in French and is provided solely for theconvenience of English speaking readers. The Statutory Auditors’ report includes information specifically required by Frenchlaw in such reports, whether modified or not. This information is presented below the opinion on the consolidated financialstatements and includes an explanatory paragraph discussing the Auditors’ assessments of certain significant accountingand auditing matters. These assessments were considered for the purpose of issuing an audit opinion on the consolidatedfinancial statements taken as a whole and not to provide separate assurance on individual account captions or oninformation taken outside of the consolidated financial statements. This report should be read in conjunction with, andconstrued in accordance with, French law and professional auditing standards applicable in France.
To the Shareholders,
In accordance with our appointment as Statutory Auditors at your Annual General Meetings, we hereby report to you forthe year ended December 31, 2016 on:
• the audit of the accompanying consolidated financial statements of Kering;
• the justification of our assessments;
• the specific verification required by law.
These consolidated financial statements have been approved by the Board of Directors. Our role is to express anopinion on these consolidated financial statements based on our audit.
1. Opinion on the consolidated financial statements
We conducted our audit in accordance with professional standards applicable in France. These standards require thatwe plan and perform the audit to obtain reasonable assurance about whether the consolidated financial statementsare free of material misstatement. An audit includes examining, using sample testing techniques or other selectionmethods, evidence supporting the amounts and disclosures in the consolidated financial statements. An audit alsoincludes assessing the accounting principles used and significant estimates made, as well as evaluating the overallfinancial statement presentation. We believe that the audit evidence we have obtained is sufficient and appropriate toprovide a reasonable basis for our opinion.
In our opinion, the consolidated financial statements give a true and fair view of the financial position and assets andliabilities of the Group as of December 31, 2016 and of the results of its operations for the year then ended inaccordance with International Financial Reporting Standards as adopted by the European Union.
5 FINANCIAL INFORMATION ~ STATUTORY AUDITORS’ REPORT ON THE CONSOLIDATED FINANCIAL STATEMENTS
344 Kering ~ 2016 Reference Document
05_D_VA_V4 04/04/2017 13:21 Page344

2. Justification of our assessments
Pursuant to Article L. 823-9 of the French Commercial Code (Code de commerce) governing the justification of ourassessments, we hereby report on the following:
• During the second half of the year, your Company systematically tests goodwill and assets with an indefinite usefullife for impairment, and also assesses whether there is indication of impairment of long-term assets, in accordancewith the methods described in Note 2.10 to the consolidated financial statements. We examined the methods usedto implement these impairment tests, the cash flow forecasts and assumptions used and verified that Note 19 to theconsolidated financial statements provides the appropriate disclosure.
• Your Company recognizes provisions, as described in Note 2.16 to the consolidated financial statements. Ourprocedures mainly consisted in assessing the data and assumptions underlying such estimates, verifying, on a testbasis, the Company’s calculations and examining the Management approval procedures for these estimates. We haveassessed the reasonableness of those estimates based on this work.
• Note 2.17 to the consolidated financial statements sets out the methods used to measure post-employmentbenefits and other long-term employee benefit obligations. These obligations were measured by independentactuaries. Our procedures consisted in examining the data used, assessing the underlying assumptions and verifyingthat Note 26 to the consolidated financial statements provides the appropriate disclosures.
These assessments were performed as part of our audit approach for the consolidated financial statements taken as awhole and therefore contributed to the expression of our opinion in the first part of this report.
3. Specific verification
We have also performed the other procedures required by law on the information presented in the Group’sManagement Report, in accordance with professional standards applicable in France.
We have no matters to report as to its fair presentation and its consistency with the consolidated financial statements.
Paris La Défense and Neuilly-sur-Seine, March 6, 2017
The Statutory Auditors
KPMG Audit Deloitte & AssociésDivision of KPMG S.A.
Isabelle Allen Grégoire Menou Frédéric Moulin Stéphane Rimbeuf
5STATUTORY AUDITORS’ REPORT ON THE CONSOLIDATED FINANCIAL STATEMENTS ~ FINANCIAL INFORMATION
3452016 Reference Document ~ Kering
05_D_VA_V4 04/04/2017 13:21 Page345

6. Parent company financial statements
6.1. Balance sheet – assets as of December 31, 2016 and 2015
ASSETS Dec. 31, 2016 Dec. 31, 2015 Depreciation, amortisation Carrying Carrying
(in € millions) Notes Gross and provisions amount amount
Non-current assets Investments 11,169.4 (1,847.7) 9,321.7 8,766.1Other long-term investments (1) 304.6 304.6 319.3 3 11,474.0 (1,847.7) 9,626.3 9,085.4Property, plant and equipment and intangible assets 4 105.4 (26.2) 79.2 483.1
Non-current assets 11,579.4 (1,873.9) 9,705.5 9,568.5
Current assets Receivables (2) (3) 5 95.4 (1.1) 94.3 70.7Marketable securities 6 0.0 0.0 61.9Cash (3) 6 1,779.2 1,779.2 1,733.7
Current assets 1,874.6 (1.1) 1,873.5 1,866.3
TOTAL ASSETS 13,454.0 (1,875.0) 11,579.0 11,434.8
(1) o / w due in less than one year: 19.8 0.4
(2) o / w due in more than one year: 0.0 0.0
(3) o / w concerning associates: 1,812.6 1,615.9
5 FINANCIAL INFORMATION ~ PARENT COMPANY FINANCIAL STATEMENTS
346 Kering ~ 2016 Reference Document

6.2. Balance sheet – shareholders’ equity and liabilities as of December 31, 2016 and 2015
SHAREHOLDERS’ EQUITY AND LIABILITIES (in € millions) Notes Dec. 31, 2016 Dec. 31, 2015
Shareholders’ equity Share capital 505.1 505.1Additional paid-in capital 2,052.4 2,052.4Reserves 7 1,585.5 1,586.3Retained earnings 2,121.1 2,098.6Net income for the year 682.9 527.4
Shareholders’ equity 6,947.0 6,769.8
Provisions 8 95.6 611.4Liabilities
Bonds (1) 9.1 4,184.6 3,675.6Other borrowings (1) (3) 9.1 46.1 41.8Other liabilities (2) (3) 10 305.7 336.2
4,536.4 4,053.6
TOTAL SHAREHOLDERS’ EQUITY AND LIABILITIES 11,579.0 11,434.8
(1) o / w due in more than one year: 3,834.6 3,675.6
(2) o / w due in more than one year: 30.0 32.7
(3) o / w concerning associates: 17.2 19.4
5PARENT COMPANY FINANCIAL STATEMENTS ~ FINANCIAL INFORMATION
3472016 Reference Document ~ Kering

6.3. Income statement
For the years ended December 31, 2016 and 2015
(in € millions) Notes 2016 2015
Operating income 129.9 105.6Operating expenses (162.4) (141.1)
Net operating loss 12 (32.5) (35.5)
Dividends 863.3 657.4Other financial income and expenses (97.0) (97.6)
Net financial income 13 766.3 559.8
Recurring income before tax 733.8 524.3
Net non-recurring expense 14 (75.5) (18.3)Employee profit-sharing (2.8) (2.1)Income tax 15 27.4 23.5
Net income for the year 682.9 527.4
6.4. Statement of cash flows
For the years ended December 31, 2016 and 2015
(in € millions) 2016 2015
Dividends received 863.3 657.4Interest on borrowings (96.1) (91.4)Income tax received 27.1 11.4Other (79.6) (92.1)
Change in cash resulting from operating activities 714.7 485.3
(Acquisitions) / disposals of operating assets (64.5) (60.4)Change in long-term investments (663.1) (318.1)
Change in cash resulting from investing activities (727.6) (378.5)
Net change in borrowings 501.4 271.5Share capital increases - 1.0Dividends paid by Kering (504.9) (504.9)
Change in cash resulting from financing activities (3.5) (232.4)
Change in cash and cash equivalents (16.4) (125.6)
Cash and cash equivalents at beginning of year 1,795.6 1,921.2
Cash and cash equivalents at end of year 1,779.2 1,795.6
5 FINANCIAL INFORMATION ~ PARENT COMPANY FINANCIAL STATEMENTS
348 Kering ~ 2016 Reference Document

Note 1. 2016 highlights
During 2016, Kering moved its registered office to 40 ruede Sèvres, 75007 Paris, France.
On May 10, 2016, Kering issued €500 million worth of 10-year fixed rate notes paying a coupon of 1.25%.
Note 2. Accounting policies and methods
The annual financial statements are prepared inaccordance with the provisions of the French accountingstandards setter (Autorité des normes comptables – ANC)Regulation No. 2014-03.
2.1. Property, plant and equipment and intangible assets
Property, plant and equipment and intangible assets arerecorded in the balance sheet at their acquisition cost.Depreciation and amortisation are calculated using thestraight-line method based on the nature and useful lifeof each component.
2.2. Long-term investments
Investments
Securities classified as “Investments” are those considerednecessary for the Company’s activities, particularly becausethey provide the Company with influence over, or controlof, the issuer.
Pursuant to notice No. 2007-C issued by the EmergingIssues Taskforce of the French accounting standardsauthority (Conseil National de la Comptabilité – CNC) onJune 15, 2007, the Company elected to recogniseacquisition fees as part of the cost of investments.
As of the end of the reporting period, the gross amount ofinvestments is compared to their value in use to theCompany, determined with reference to the subsidiary’sestimated economic value and taking into considerationthe purpose of the original transaction. Value in use isdetermined using a multi-criteria approach based onfuture cash flow projections, the revised asset value, andthe share of consolidated or revalued shareholders’equity. Other methods are used where necessary.
An impairment loss is recorded when market value fallsbelow the gross value.
6.5. Statement of changes in shareholders’ equity
Additional Reserves (in € millions) Number Share paid-in and retained Net income Shareholders’(before appropriation of net income) of shares capital capital earnings for the year equity
As of December 31, 2014 126,266,490 505.1 2,051.4 3,373.0 817.6 6,747.1
Appropriation of 2014 net income 817.6 (817.6) -Dividends paid (315.5) (315.5)Interim dividend (189.4) (189.4)Exercise of stock options 12,832 1.0 1.0Changes in tax-driven provisions (0.8) (0.8)2015 net income 527.4 527.4
As of December 31, 2015 126,279,322 505.1 2,052.4 3,684.9 527.4 6,769.8
Appropriation of 2015 net income 527.4 (527.4) -Dividends paid (315.5) (315.5)Interim dividend (189.4) (189.4)Changes in tax-driven provisions (0.8) (0.8)2016 net income 682.9 682.9
As of December 31, 2016 126,279,322 505.1 2,052.4 3,706.6 682.9 6,947.0
As of December 31, 2016, Kering’s share capital comprised 126,279,322 shares with a par value of €4 each.
6.6. Notes to the parent company financialstatements
5PARENT COMPANY FINANCIAL STATEMENTS ~ FINANCIAL INFORMATION
3492016 Reference Document ~ Kering

Other long-term investments
Other long-term investments include other investmentsand certain treasury shares.
Other investments (excluding treasury shares)
Other investments are investments that the Companyplans or is required to hold on a long-term basis, but whichare not deemed necessary for the Company’s activities.
The gross amount of such investments is equal to theacquisition cost plus any related acquisition fees.
An impairment loss is recognised based on the value inuse of these securities to the Company.
Treasury shares
Treasury shares acquired under liquidity agreements arerecorded under “Other long-term investments”. Theseshares are written down where necessary to reflect theaverage share price over the last month of the fiscal year.
Treasury shares acquired for the express purpose of beingused in a future capital reduction are also classifiedunder “Other long-term investments”. These shares arenot written down to reflect the share price.
2.3. Receivables
Receivables are recorded in the balance sheet at theirnominal value, and are written down where they presenta risk of non-recovery.
2.4. Marketable securities and negotiable debt securities
Treasury shares
Treasury shares acquired for the express purpose of beingsubsequently granted to employees under stock purchaseoption plans and free share plans are recorded under“Marketable securities”. No impairment is recognised ontreasury shares to reflect the share price.
Other shares
Shares are recorded at their acquisition cost. An impairmentloss is recognised when their closing price falls belowtheir carrying amount.
Bonds
Bonds are recorded on the acquisition date at their parvalue adjusted by the premium or discount. Accruedinterest as of the acquisition date and as of the end of thereporting period is recorded in an accrued interest account.
As of the end of the reporting period, the cost of thebonds is compared to the market value of the principalover the last month of the year, excluding accrued interest.An impairment loss is recorded when market value fallsbelow the gross value.
Mutual funds (Sicav)
Shares in mutual funds are recorded at their acquisitioncost excluding subscription fees, and their net asset valueis estimated as of the end of the reporting period. Aprovision for impairment is recorded in respect of anyunrealised capital losses. No unrealised capital gains arerecognised.
Negotiable certificates of deposit, certificates of deposit and notes issued by financing companies
These negotiable debt securities are subscribed on theprimary market or purchased on the secondary market.They are recorded at acquisition cost less accruedinterest as of the acquisition date when purchased onthe secondary market.
Prepaid interest is recognised as financial income on aproportional basis for the fiscal year.
2.5. Financial instruments
All foreign currency and interest rate positions are takenvia instruments listed on exchange-traded or over-the-counter markets representing minimal counterparty risk.Any gains or losses generated on financial instrumentsused in hedging transactions are offset against thecorresponding gain or loss on the hedged items.
Where financial instruments do not qualify as hedges,any gains or losses resulting from changes in their marketvalue are recorded in the income statement, except forover-the-counter transactions. For these transactions, aprovision is recorded for any unrealised losses, whileunrealised gains are not recognised.
2.6. Foreign currency transactions
Income and expenses denominated in foreign currenciesare recorded at their euro-equivalent value on thetransaction date. Borrowings, receivables and liquiditypositions denominated in foreign currencies are translatedat the closing exchange rate. In the case of foreign currencyhedging, borrowings and receivables are translated at thehedging rate.
Any translation differences resulting from the valuationof foreign currency borrowings and receivables arerecorded in accrual accounts, as an asset for unrealisedlosses and as a liability for unrealised gains. A contingencyprovision is recorded to cover any unhedged unrealisedlosses. Where borrowings and receivables are hedged byfinancial instruments, any foreign currency gains orlosses are immediately recorded in the income statement.
5 FINANCIAL INFORMATION ~ PARENT COMPANY FINANCIAL STATEMENTS
350 Kering ~ 2016 Reference Document

2.7. Bond issue and capital increase fees – Bond redemption premiums
Bond issue fees are recognised as of the issue date.
Costs associated with increases in capital, mergers orrestructuring are charged against the additional paid-incapital arising from the merger or restructuring.
Bonds are recorded at their par value.
Any issue or redemption premiums are assigned to therelevant balance sheet item and amortised over the termof the bond.
For convertible bonds, the redemption premium isrecognised over the term of the bond, in accordance withthe benchmark accounting treatment.
In the case of an indexed bond issue, a contingencyprovision must be recorded in respect of redemption whenthe estimated amount required to redeem the bonds asof the end of the reporting period exceeds the amount ofthe issue. This provision is calculated on a proportionalbasis over the term of the bond.
2.8. Provisions
Provisions are recognised in accordance with CNCRegulation No. 2000.06 and include pension and otheremployee benefit obligations pursuant to ANCRecommendation No. 2013-02.
Under defined benefit plans, obligations are valued usingthe projected unit credit method based on agreements ineffect in the Company. Under this method, each period ofservice gives rise to an additional unit of benefitentitlement and each unit is measured separately to buildup the final obligation. The obligation is then discounted.The actuarial assumptions used to determine theobligations vary depending on economic conditions.
These benefit obligations are assessed by independentactuaries on an annual basis. The valuations take intoaccount the level of future compensation, the probableactive life of employees, life expectancy and staff turnover.
Kering applies the notice relating to CRC Regulation No. 2008-15 of December 4, 2008 on the accounting treatmentof stock option plans and employee free share plans.
2.9. Tax consolidation
Kering has set up a tax consolidation group in France withseveral sub-groups and subsidiaries.
Each subsidiary recognises a tax expense for the amountof tax it would have paid on a stand-alone basis. The taxsavings generated by the Group as a result of taxconsolidation are retained by Kering as parent companyof the tax consolidation group.
5PARENT COMPANY FINANCIAL STATEMENTS ~ FINANCIAL INFORMATION
3512016 Reference Document ~ Kering
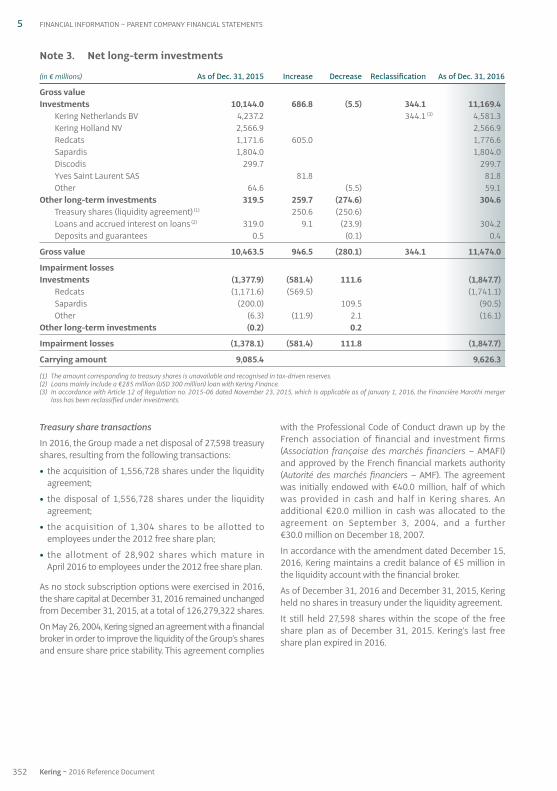
Treasury share transactions
In 2016, the Group made a net disposal of 27,598 treasuryshares, resulting from the following transactions:
• the acquisition of 1,556,728 shares under the liquidityagreement;
• the disposal of 1,556,728 shares under the liquidityagreement;
• the acquisition of 1,304 shares to be allotted toemployees under the 2012 free share plan;
• the allotment of 28,902 shares which mature inApril 2016 to employees under the 2012 free share plan.
As no stock subscription options were exercised in 2016,the share capital at December 31, 2016 remained unchangedfrom December 31, 2015, at a total of 126,279,322 shares.
On May 26, 2004, Kering signed an agreement with a financialbroker in order to improve the liquidity of the Group’s sharesand ensure share price stability. This agreement complies
with the Professional Code of Conduct drawn up by theFrench association of financial and investment firms(Association française des marchés financiers – AMAFI)and approved by the French financial markets authority(Autorité des marchés financiers – AMF). The agreementwas initially endowed with €40.0 million, half of whichwas provided in cash and half in Kering shares. Anadditional €20.0 million in cash was allocated to theagreement on September 3, 2004, and a further€30.0 million on December 18, 2007.
In accordance with the amendment dated December 15,2016, Kering maintains a credit balance of €5 million inthe liquidity account with the financial broker.
As of December 31, 2016 and December 31, 2015, Keringheld no shares in treasury under the liquidity agreement.
It still held 27,598 shares within the scope of the freeshare plan as of December 31, 2015. Kering’s last freeshare plan expired in 2016.
Note 3. Net long-term investments
(in € millions) As of Dec. 31, 2015 Increase Decrease Reclassification As of Dec. 31, 2016
Gross value Investments 10,144.0 686.8 (5.5) 344.1 11,169.4
Kering Netherlands BV 4,237.2 344.1 (3) 4,581.3Kering Holland NV 2,566.9 2,566.9Redcats 1,171.6 605.0 1,776.6Sapardis 1,804.0 1,804.0Discodis 299.7 299.7Yves Saint Laurent SAS 81.8 81.8Other 64.6 (5.5) 59.1
Other long-term investments 319.5 259.7 (274.6) 304.6Treasury shares (liquidity agreement) (1) 250.6 (250.6) Loans and accrued interest on loans (2) 319.0 9.1 (23.9) 304.2Deposits and guarantees 0.5 (0.1) 0.4
Gross value 10,463.5 946.5 (280.1) 344.1 11,474.0
Impairment losses Investments (1,377.9) (581.4) 111.6 (1,847.7)
Redcats (1,171.6) (569.5) (1,741.1)Sapardis (200.0) 109.5 (90.5)Other (6.3) (11.9) 2.1 (16.1)
Other long-term investments (0.2) 0.2
Impairment losses (1,378.1) (581.4) 111.8 (1,847.7)
Carrying amount 9,085.4 9,626.3
(1) The amount corresponding to treasury shares is unavailable and recognised in tax-driven reserves.(2) Loans mainly include a €285 million (USD 300 million) loan with Kering Finance.(3) In accordance with Article 12 of Regulation no. 2015-06 dated November 23, 2015, which is applicable as of January 1, 2016, the Financière Marothi merger
loss has been reclassified under investments.
5 FINANCIAL INFORMATION ~ PARENT COMPANY FINANCIAL STATEMENTS
352 Kering ~ 2016 Reference Document

Note 4. Property, plant and equipment and intangible assets
Movements in property, plant and equipment and intangible assets are presented below:
Other Property, intangible plant and (in € millions) Software assets equipment Total
Gross value
December 31, 2015 30.9 436.1 41.3 508.3
Acquisitions 36.2 10.6 46.8Reclassification (344.1) (1) (344.1)Other movements (92.0) (2) (92.0)Disposals (13.6) (13.6)
December 31, 2016 67.1 0.0 38.3 105.4
Depreciation, amortisation and provisions
December 31, 2015 (13.2) (12.0) (25.2)
Additions (4.4) (1.8) (6.2)Reversals on disposals 5.2 5.2
December 31, 2016 (17.6) 0.0 (8.6) (26.2)
Carrying amount
December 31, 2015 17.7 436.1 29.3 483.1
December 31, 2016 49.5 0.0 29.7 79.2
(1) In accordance with Article 12 of Regulation No. 2015-06 dated November 23, 2015, and applicable as of January 1, 2016, the Financière Marothi merger losshas been reclassified under investments.
(2) Following a review of the terms of its agreements with Safilo, Kering SA considered that of the €92 million, €62 million corresponded to compensationrecognised in other non-recurring expenses in the period, and €30 million was recorded under receivables.
Note 5. Receivables
These line items break down as follows:
(in € millions) Dec. 31, 2016 Dec. 31, 2015
Tax consolidation current accounts 5.8 7.5Kadéos account - 9.4Income tax benefit 14.9 13.6Group customers 29.2 11.3Bond issue premiums (4.4) (7.2)Other (1) 44.6 33.9Prepaid expenses 4.2 2.2
TOTAL 94.3 70.7
o / w concerning associates: 38.5 18.8
(1) o / w €4.0 million in respect of collateral (escrow).
5PARENT COMPANY FINANCIAL STATEMENTS ~ FINANCIAL INFORMATION
3532016 Reference Document ~ Kering

Note 6. Marketable securities and cash
These line items break down as follows:
(in € millions) Dec. 31, 2016 Dec. 31, 2015
Treasury shares pending employee grants - 5.1Listed securities - 56.8
Marketable securities 61.9
Bank deposits and fund transfers 5.1 136.6Cash current accounts 1,774.1 1,597.1
Cash 1,779.2 1,733.7
CASH AND CASH EQUIVALENTS 1,779.2 1,795.6
o / w concerning associates: 1,774.1 1,597.1
Listed securities as of December 31, 2015 mainly comprised mutual funds (Sicav) for €56.8 million.
Bank deposits include certificates of deposit and term deposits and accounts with a maturity of less than three months.
Note 7. Reserves
The Company’s reserves before the appropriation of net income break down as follows:
(in € millions) Dec. 31, 2016 Dec. 31, 2015
Legal reserve 51.4 51.4Tax-driven reserves 1,293.6 1,293.6Other reserves 240.3 240.3
Reserves 1,585.3 1,585.3
Tax-driven provisions 0.2 1.0
TOTAL 1,585.5 1,586.3
Note 8. Provisions
Reversals Reversals (utilised (surplus (in € millions) Dec. 31, 2015 Additions provisions) provisions) Dec. 31, 2016
Disputes 33.1 0.2 14.8 4.7 13.8Risks relating to subsidiaries 546.5 58.1 545.3 (1) 59.3Pensions and other employee benefit obligations 8.4 1.0 0.9 8.5Other contingencies 22.1 2.1 3.2 7.3 13.7Foreign exchange risk 1.3 0.3 1.3 0.3
TOTAL 611.4 61.7 564.6 12.9 95.6
o / w: operating items 0.7 financing items 0.7 1.3 0.9 non-recurring items 60.3 563.3 12.0
(1) Following the recapitalisation of the subsidiary Redcats (see Note 3 above).
The main actuarial assumptions used to determine pensions and other employee benefit obligations are:
• discount rate of 1.25% versus 2.00% in 2015;
• salary increase rate of 3.00% (unchanged from 2015).
5 FINANCIAL INFORMATION ~ PARENT COMPANY FINANCIAL STATEMENTS
354 Kering ~ 2016 Reference Document

Note 9. Borrowings
Bond issues
Euro-denominated bond issues(in € millions) Interest rate Issue date Hedge Maturity Dec. 31, 2016 Dec. 31, 2015
Bond issue (1) 6.50% fixed 06 / 29 / 2009 - 06 / 29 / 2017 150.0 150.0
Bond issue (2) 6.50% fixed 11 / 06 / 2009 - 11 / 06 / 2017 200.0 200.0
Bond issue (3) 3.125% fixed 04 / 23 / 2012 - 04 / 23 / 2019 500.0 500.0
Bond issue (4) 2.50% fixed 07 / 15 / 2013 - 07 / 15 / 2020 500.0 500.0
Bond issue (5) 1.875% fixed 10 / 08 / 2013 - 10 / 08 / 2018 500.0 500.0
Bond issue (6) 2.75% fixed 04 / 08 / 2014 & - 04 / 08 / 2024 500.0 500.0 05 / 30 / 2014 & 06 / 26 / 2014 & 09 / 22 / 2015 & 11 / 05 / 2015
Bond issue (7) 1.375% fixed 10 / 01 / 2014 - 10 / 01 / 2021 500.0 500.0
Bond issue (8) 0.875% fixed 03 / 27 / 2015 - 03 / 28 / 2022 500.0 500.0
Bond issue (9) 1.60% fixed 04 / 16 / 2015 - 04 / 16 / 2035 50.0 50.0
Bond issue (10) 1.25% fixed 05 / 10 / 2016 - 05 / 10 / 2026 500.0 -
(1) Issue price: bond issue on June 29, 2009, comprising 3,000 bonds with a par value of €50,000 each under the EMTN programme.Redemption: in full on June 29, 2017.
(2) Issue price: bond issue on November 6, 2009, comprising 4,000 bonds with a par value of €50,000 each under the EMTN programme.Redemption: in full on November 6, 2017.
(3) Issue price: bond issue on April 23, 2012, comprising 500,000 bonds with a par value of €1,000 each under the EMTN programme.Redemption: in full on April 23, 2019.
(4) Issue price: bond issue on July 15, 2013, comprising 5,000 bonds with a par value of €100,000 each under the EMTN programme.Redemption: in full on July 15, 2020.
(5) Issue price: bond issue on October 8, 2013, comprising 5,000 bonds with a par value of €100,000 each under the EMTN programme.Redemption: in full on October 8, 2018.
(6) Issue price: bond issue on April 8, 2014, comprising 1,000 bonds with a par value of €100,000 each under the EMTN programme, 1,000 additional bonds issuedon May 30, 2014, 1,000 additional bonds issued on June 26, 2014, 1,500 additional bonds issued on September 22, 2015 and 500 additional bonds issued onNovember 5, 2015, thereby raising the issue to 5,000 bonds.Redemption: in full on April 8, 2024.
(7) Issue price: bond issue on October 1, 2014, comprising 5,000 bonds with a par value of €100,000 each under the EMTN programme.Redemption: in full on October 1, 2021.
(8) Issue price: bond issue on March 27, 2015, comprising 5,000 bonds with a par value of €100,000 each under the EMTN programme.Redemption: in full on March 28, 2022.
(9) Issue price: bond issue on April 16, 2015, comprising 500 bonds with a par value of €100,000 each under the EMTN programme.Redemption: in full on April 16, 2035.
(10) Issue price: bond issue on May 10, 2016, comprising 5,000 bonds with a par value of €100,000 each under the EMTN programme.Redemption: in full on May 10, 2026.
USD-denominated bond issues(in € millions) Interest rate Issue date Hedge Maturity Dec. 31, 2016 Dec. 31, 2015
Bond issue (1) Floating 03 / 09 / 2015 - 03 / 09 / 2020 142.3 137.8 3-month USD Libor + 0.73%
Bond issue (2) 2.887% fixed 06 / 09 / 2015 - 06 / 09 / 2021 142.3 137.8
(1) Issue price: bond issue on March 9, 2015 in the form of floating-rate notes, comprising 150 notes with a par value of USD 1,000,000 under the EMTNprogramme, i.e., representing a total of USD 150 million.Redemption: in full on March 9, 2020.
(2) Issue price: bond issue on June 9, 2015, comprising 150 bonds with a par value of USD 1,000,000 each under the EMTN programme, i.e., representing a total ofUSD 150 million.Redemption: in full on June 9, 2021.
5PARENT COMPANY FINANCIAL STATEMENTS ~ FINANCIAL INFORMATION
3552016 Reference Document ~ Kering

9.1. Breakdown by type
(in € millions) Dec. 31, 2016 Dec. 31, 2015
Bonds 4,184.6 3,675.6Interest on bond issues 46.0 41.8Cash current accounts 0.1 -Other borrowings 46.1 41.8
TOTAL 4,230.7 3,717.4
o / w concerning associates: 0.1 -
As of December 31, 2016 and 2015, no borrowings were secured by collateral.
9.2. Breakdown by maturity
(in € millions) Dec. 31, 2016 Dec. 31, 2015
Less than one year 396.1 41.8One to five years 2,284.6 1,987.8More than five years 1,550.0 1,687.8
TOTAL 4,230.7 3,717.4
9.3. Net debt
(in € millions) Dec. 31, 2016 Dec. 31, 2015
Borrowings 4,230.7 3,717.4Marketable securities - (61.9)Cash (1,779.2) (1,733.7)
TOTAL 2,451.5 1,921.8
9.4. Information on interest rates
Dec. 31, 2016 Dec. 31, 2015
Average gross interest rate over the year 2.41% 2.61%% average gross debt at fixed rates 96.60% 96.90%% average gross debt at floating rates 3.40% 3.10%
Note 10. Other liabilities
These line items break down as follows:
(in € millions) Dec. 31, 2016 Dec. 31, 2015
Tax consolidation current accounts 4.3 4.6Dividends to be paid 189.4 189.4Tax and employee-related liabilities 43.1 34.8Other 68.9 107.4
TOTAL 305.7 336.2
o / w concerning associates: 17.1 19.4
“Other” includes €30 million in respect of Safilo, payable in September 2018.
The bonds issued between 2009 and 2016 within thescope of the EMTN programme are all subject to change-of-control clauses entitling bondholders to request earlyredemption at par if Kering’s rating is downgraded tonon-investment grade following a change of control.
In addition, the bonds issued in 2009 include a step-upcoupon clause that applies in the event that Kering’srating is downgraded to non-investment grade.
5 FINANCIAL INFORMATION ~ PARENT COMPANY FINANCIAL STATEMENTS
356 Kering ~ 2016 Reference Document

Note 11. Off-balance sheet commitments
11.1. Interest rate hedges
As part of the Group’s policy of hedging interest rate risk, Kering sets up interest rate swaps in connection with certainborrowings.
No interest rate hedges were in place at December 31, 2016.
11.2. Stock option and free share plans
The nature and main characteristics of the plans are indicated in the table below: 2012/2 PlanStock option and free share plans Free shares
Grant date 04 / 27 / 2012Expiry date N / AVesting of rights (a)Number of beneficiaries 88
Number initially granted 39,640
Number outstanding as of Jan. 1, 2016 29,140
Number forfeited in 2016 238Number of shares issued (AGM) 28,902Number expired in 2016
Number outstanding as of Dec. 31, 2016 Number exercisable as of Dec. 31, 2016
Strike price (in €) N / A
(a) Shares were subject to a four-year lock-in period, commencing on the grant date. Shares vested four years after being granted, except in the event ofresignation or dismissal for gross negligence or misconduct (when all rights are lost). The final number of shares granted was subject to stock marketperformance conditions. These shares are not subject to a non-transferability period.
11.3. Other off-balance sheet commitments
(in € millions) Dec. 31, 2016 Dec. 31, 2015
Endorsements and guarantees in favour of: associates - -third parties outside the Group 24.8 29.7
Endorsements and guarantees 24.8 29.7
Collateral: in favour of subsidiaries - -in favour of third parties - -
5PARENT COMPANY FINANCIAL STATEMENTS ~ FINANCIAL INFORMATION
3572016 Reference Document ~ Kering

Note 12. Net operating loss
Net operating loss breaks down as follows:
(in € millions) 2016 2015
Group management fees 92.2 80.3Property rental income 4.8 0.2Payroll expenses (51.6) (44.7)External purchases and expenses, taxes (91.5) (82.5)Depreciation, amortisation and provisions (6.9) (4.5)Other income and expenses 20.5 15.7
TOTAL (32.5) (35.5)
o / w Directors’ fees: (0.9) (0.9)
Note 13. Net financial income
Net financial income breaks down as follows:
(in € millions) 2016 2015
Net interest expense (97.0) (97.6)Expenses and interest on non-Group debt (97.0) (97.6)
Dividends 863.3 657.4Kering Netherlands BV 450.0 275.0Kering Holland NV 335.3 335.3Discodis 19.2 -Kering Finance 57.0 47.0Other 1.8 0.1
TOTAL 766.3 559.8
o / w concerning associates: Dividends 863.3 657.4
Note 14. Net non-recurring expense
Net non-recurring expense breaks down as follows:
(in € millions) 2016 2015
Net proceeds from disposals of operating assets (0.1) -Net proceeds from disposals of securities, impairment losses and related transactions 7.9 (2.3)Cost of disputes, litigation and restructuring 3.4 3.2Other non-recurring income / (expense) (86.7) (19.2)
TOTAL (75.5) (18.3)
In 2016, net non-recurring expense mainly reflects the reclassification of compensation paid to Safilo.
5 FINANCIAL INFORMATION ~ PARENT COMPANY FINANCIAL STATEMENTS
358 Kering ~ 2016 Reference Document

17.3. Executive compensation
In 2016, total compensation of €17.7 million was awardedto members of the governance and management bodies,versus €10.6 million in 2015.
17.4. Consolidating company
Kering is controlled by Artémis, which holds 40.88% of itsshare capital. Artémis is wholly owned by FinancièrePinault.
17.5. Transactions with related parties
The support agreement between Artémis and Keringsigned on September 27, 1993 generated an expenseof €3.3 million in 2016 compared with an expenseof €3.0 million in 2015.
The other transactions with related parties were contractedat arm’s length conditions. As a result, no additionaldisclosures are required pursuant to Article R. 183-198 11of the French Commercial Code.
Note 15. Income tax
Income tax breaks down as follows:
(in € millions) 2016 2015
Tax consolidation benefit 42.9 39.9Income tax on dividends (15.2) (15.1)Other (0.3) (1.3)
TOTAL 27.4 23.5
Under a tax consolidation agreement that came into effect on January 1, 1988, Kering pays the tax due by members ofthe tax consolidation group and fulfils all relevant tax obligations.
The tax consolidation group comprised 39 companies in 2016 and 40 in 2015.
If no tax consolidation arrangement had existed, the Company would not have paid any income tax.
Note 16. Deferred tax assets and liabilities (34.433% rate)
(in € millions)
Deferred tax assets Retirement termination benefits 1.3Employee profit-sharing 1.0Other 0.5
Note 17. Other information
17.1. Average headcount
The Company had an average of 259 employees in 2016 compared to 240 in 2015.
17.2. Fees paid to Statutory Auditors
Statutory Auditors’ fees recorded in the income statement are shown below:
KPMG Audit Deloitte & Associés(in € thousands) 2016 2015 2016 2015
Certification and half-year limited review of the individual and consolidated financial statements 328 328 300 300Services other than certification of financial statements 38 42 138 222
TOTAL 366 370 438 522
5PARENT COMPANY FINANCIAL STATEMENTS ~ FINANCIAL INFORMATION
3592016 Reference Document ~ Kering

Note 18. Subsequent events
On January 18, 2017, Kering paid out an interim dividend amounting to €1.50 per share.
Subsidiaries and investments as of December 31, 2016
Shareholders’ equity excl. share capital and net (in € thousands) Share capital income
I – DETAILED INFORMATION
A – Subsidiaries (more than 50%-owned and representing over 1% of the share capital)
Conseil et Assistance France 2,010 1,921 Discodis France 153,567 (1) 161,079 (1) Kering Netherlands BV Netherlands 20,000 (1) 5,382,390 (1) Christopher Kane Limited (2) UK 1 (1) (1,642) (1) Kering International (2) UK 17,031 (1) 550 (1) Redcats France 401 (1) (705,962) (1) Sapardis France 1,799,936 (317,946) Trémi 2 France 20,710 (93) Sub-total
B – Investments (less than 50%-ownedand representing over 1% of the share capital)
Kering Holland NV Netherlands 108 (1) 2,708 (1) Yves Saint Laurent France 123,811 (1) (33,648) (1) Sub-total
II – SUMMARY INFORMATION
A – Subsidiaries not listed in I
French subsidiaries Non-French subsidiaries
B – Investments not listed in I
French investments Non-French investments
(1) Based on accounts as of December 31, 2015.(2) GBP exchange rate as of December 31, 2015.(3) Including the Financière Marothi merger loss of €344,066 thousand.
5 FINANCIAL INFORMATION ~ PARENT COMPANY FINANCIAL STATEMENTS
360 Kering ~ 2016 Reference Document

5PARENT COMPANY FINANCIAL STATEMENTS ~ FINANCIAL INFORMATION
3612016 Reference Document ~ Kering
Carrying amount Endorsements Dividends of shares Outstanding and Last Last received by loans granted guarantees published published the Company % of capital by the given by the revenue net income during held Gross Net Company Company excl. VAT (loss) the year
90.00 7,724 3,603 73 99.99 299,736 299,736 7,375 (1) 19,196 100.00 4,581,306 (3) 4,581,306 671,220 (1) 450,000 51.00 12,174 262 11,818 (1) (11,746) (1)
100.00 14,773 14,773 8,270 (1) 357 (1)
99.99 1,776,587 35,454 1,477 (1) 100.00 1,804,008 1,713,508 (14,918) 100.00 20,475 20,475 (12) 8,516,783 6,669,117
33.53 2,566,912 2,566,912 143,657 (1) 807 (1) 335,308 1.97 81,873 81,873 191,010 (1) 28,378 (1) 2,648,785 2,648,785
487 425 31 0
0 0 37 37
11,166,123 9,318,364

6.7. Five-year financial summary
2016 2015 2014 2013 20 12
Share capital at year-end
Share capital (in €) 505,117,288 505,117,288 505,065,960 504,907,044 504,466,808Number of ordinary shares outstanding 126,279,322 126,279,322 126,266,490 126,226,761 126,116,702Maximum number of potential shares to be issued 0 0 14,146 70,795 188,160
by conversion of bonds by exercise of stock subscription options 0 0 14,146 70,795 188,160
Operations and results for the year (in € thousands)
Income from operating activities 92,248 80,383 70,811 88,795 73,581Net income before tax, employee profit-sharing, depreciation, amortisation and provisions 618,657 481,459 968,460 1,635,162 680,689Income tax (expense) / benefit 27,436 23,500 22,320 20,139 142,124Employee profit-sharing for the year 2,809 2,071 2,406 3,339 2,055Net income after tax, employee profit-sharing, depreciation, amortisation and provisions 682,887 527,399 817,551 832,903 505,561Dividend distribution 580,885 (1) 505,117 505,066 473,350 472,937 (2)
Per share data (in €)
Net income after tax, employee profit-sharing, but before depreciation, amortisation and provisions 5.09 3.98 7.83 13.09 6.51
Net income after tax, employee profit-sharing, depreciation, amortisation and provisions 5.41 4.18 6.47 6.60 4.01Dividend:
Net dividend per share (3) 4.60 (1) 4.00 4.00 3.75 3.75
Employee data
Average number of employees during the year 259 240 194 171 146Total annual payroll (in € thousands) 36,964 32,114 27,124 21,602 19,794Total employee benefits paid during the year (social security, social works, etc.) (in € thousands) 14,648 12,617 11,169 10,222 8,817
(1) Subject to approval by the Annual General Meeting. Including an interim dividend of €1.50 per share paid on January 18, 2017.(2) At the Annual General Meeting on June 18, 2013, the shareholders authorised a dividend in the form of Groupe Fnac shares at a ratio of one Groupe Fnac share for
every eight Kering shares held.(3) Pursuant to Article 243 bis of the French Tax Code (Code général des impôts), the full amount of the dividend paid to individuals who are tax residents in France
qualifies for the 40% tax credit provided under Article 158-3,2 of said Code.
5 FINANCIAL INFORMATION ~ PARENT COMPANY FINANCIAL STATEMENTS
362 Kering ~ 2016 Reference Document

7. Statutory Auditors’ report on the financial statementsYear ended December, 31 2016
This is a free translation into English of the Statutory Auditors’ report issued in French and is provided solely for theconvenience of English speaking users. The Statutory Auditors’ report includes information specifically required by Frenchlaw in such reports, whether modified or not. This information is presented below the opinion on the Company financialstatements and includes an explanatory paragraph discussing the auditors’ assessments of certain significant accountingand auditing matters. These assessments were considered for the purpose of issuing an audit opinion on the Companyfinancial statements taken as a whole and not to provide separate assurance on individual account captions or oninformation taken outside of the Company financial statements. This report should be read in conjunction and construed inaccordance with French law and professional auditing standards applicable in France.
To the Shareholders,
In accordance with our appointment as Statutory Auditors at your Annual General Meetings, we hereby report to you forthe year ended December 31, 2016 on:
• the audit of the accompanying financial statements of Kering SA;
• the justification of our assessments;
• the specific procedures and disclosures required by law.
The financial statements have been approved by the Board of Directors. Our role is to express an opinion on thesefinancial statements, based on our audit.
1. Opinion on the financial statements
We conducted our audit in accordance with professional standards applicable in France. These standards require thatwe plan and perform the audit to obtain reasonable assurance about whether the financial statements are free ofmaterial misstatement. An audit includes examining, using sample testing techniques or other selection methods,evidence supporting the amounts and disclosures in the financial statements. An audit also includes assessing theaccounting principles used and significant estimates made, as well as evaluating the overall financial statementpresentation. We believe that the audit evidence we have obtained is sufficient and appropriate to provide a reasonablebasis for our opinion.
In our opinion, the financial statements give a true and fair view of the financial position and the assets and liabilities ofthe Company as of December 31, 2016 and the results of its operations for the year then ended in accordance withaccounting principles generally accepted in France.
Without challenging the opinion expressed above, we would like to draw your attention to Notes 3 and 4 to the financialstatements which describes the change in accounting method regarding the allocation of technical losses inaccordance with Article 12 of Regulation No. 2015-06 of November 23, 2015.
5STATUTORY AUDITORS’ REPORT ON THE FINANCIAL STATEMENTS ~ FINANCIAL INFORMATION
3632016 Reference Document ~ Kering
2. Justification of our assessments
Pursuant to Article L. 823-9 of the French Commercial Code (Code de commerce) governing the justification of our assessments,we hereby report on the following:
As mentioned in the first part in this report, Notes 3 and 4 to the financial statements describes the change inaccounting method pursuant to the new accounting regulation on the allocation of technical losses.
As part of our assessment of the accounting policies implemented by your Company, we have verified the correctimplementation of the above-mentioned accounting method change and its correct presentation.
Note 2.2 to the financial statements describes the accounting policies relating to the measurement of long-terminvestments.
As part of our assessment of the accounting policies implemented by your Company, we have verified theappropriateness of the above-mentioned accounting methods and their proper application.
These assessments were performed as part of our audit approach for the financial statements taken as a whole andtherefore contributed to the expression of our opinion in the first part of this report.
3. Specific procedures and disclosures
We have also performed the other procedures required by law, in accordance with professional standards applicable inFrance.
We have no matters to report regarding the fair presentation and consistency with the financial statements of the informationgiven in the Management Report of the Board of Directors and in the documents addressed to the shareholders inrespect of the financial position and the financial statements.
Concerning the information given in accordance with the requirements of Article L. 225-102-1 of the French CommercialCode relating to remuneration and benefits received by the corporate officers and any other commitments made in theirfavor, we have verified its consistency with the financial statements, or with the underlying information used to preparethese financial statements and, where applicable, with the information obtained by your company from companiescontrolling your company or controlled by it. Based on this work, we attest that such information is accurate and fair.
Pursuant to the law, we have verified that the Management Report contains the appropriate disclosures as to theidentity of and voting rights held by shareholders.
Paris La Défense and Neuilly-sur-Seine, March 28, 2017The Statutory Auditors
KPMG Audit Deloitte & AssociésDivision of KPMG SA
Isabelle Allen Grégoire Menou Frédéric Moulin Stéphane Rimbeuf
5 FINANCIAL INFORMATION ~ STATUTORY AUDITORS’ REPORT ON THE FINANCIAL STATEMENTS
364 Kering ~ 2016 Reference Document

8. Statutory Auditors’ special reporton regulated agreements andcommitments with third partiesShareholders’ Meeting held to approve the financialstatements for the year ended December 31, 2016
This is a free translation into English of the Statutory Auditors’ special report on regulated agreements and commitmentswith third parties that is issued in the French language and is provided solely for the convenience of English speakingreaders. This report on regulated agreements and commitments should be read in conjunction and construed inaccordance with French law and professional auditing standards applicable in France. It should be understood that theagreements reported on are only those provided by the French Commercial Code (Code de commerce) and that the reportdoes not apply to those related party transactions described in IAS 24 or other equivalent accounting standards.
To the Shareholders,
In our capacity as Statutory Auditors of your Company, we hereby report to you on regulated agreements and commitmentswith third parties.
The terms of our engagement require us to communicate to you, based on information provided to us, the principal termsand conditions of those agreements and commitments brought to our attention or which we may have discovered duringthe course of our audit, and the reasons justifying that these commitments and agreements are in the Company’sinterest, without expressing an opinion on their usefulness and appropriateness or identifying such other agreements,if any. It is your responsibility, pursuant to Article R. 225-31 of the French Commercial Code (Code de commerce), toassess the interest involved in respect of the conclusion of these agreements for the purpose of approving them.
Our role is also to provide you with the information provided for in Article R. 225-31 of the French Commercial Code inrespect of the performance of the agreements and commitments, already authorized by the Shareholders’ Meeting andhaving continuing effect during the year, if any.
We conducted the procedures we deemed necessary in accordance with the professional guidelines of the French NationalInstitute of Statutory Auditors (Compagnie Nationale des Commissaires aux Comptes) relating to this engagement. Theseprocedures consisted in agreeing the information provided to us with the relevant source documents.
Agreements and commitments submitted to the approval of the shareholders’ meeting
Agreements and commitments authorized during the year
We inform you that we have not been advised of any agreement or commitment authorized during the year subject tothe approval of the shareholder Meetings pursuant to Article L. 225-38 of the French Commercial Code.
5STATUTORY AUDITORS’ SPECIAL REPORT ON REGULATED AGREEMENTS AND COMMITMENTS WITH THIRD PARTIES ~ FINANCIAL INFORMATION
3652016 Reference Document ~ Kering

Agreements and commitments previously approved by the shareholders’ meeting
Agreements and commitments authorized in previous years and having continuing effect during the year
Pursuant to Article R. 225-31 of the French Commercial Code, we have been advised that the following agreements andcommitments authorized in previous years by the Shareholders’ Meeting have had continuing effect during the year.
• Support agreement for services provided by Artémis SA
Pursuant to the terms of a support agreement between Kering SA and Artémis SA signed on September 27, 1993,Artémis SA carries out research and advisory work for Kering S.A. in the following areas:
• strategy and development of the Kering group and support in carrying out complex legal, tax, financial and real estatetransactions;
• sourcing of business development opportunities in France and abroad or cost-cutting measures.
At its March 10, 1999 meeting, the Kering SA Supervisory Board authorized payment for these services amounting to0.037% of consolidated net revenue (excluding VAT).
In line with the appropriate modifications to Kering SA’s corporate governance rules, your Board of Directors resolved onJuly 6, 2005, without amending the agreement in force since September 27, 1993, that the Kering SA Audit Committeewould perform, in addition to the usual annual review of the substance of the support provided by Artemis SA to Kering SA,an annual assessment of the services and their fair price given the facilities provided and the cost savings realized inthe common interest.
The methods for assessing the contractually-agreed amount were reviewed by the Audit Committee which, at itsmeeting of February 7, 2017, noted that Kering SA had continued to benefit, during 2016, from the advice and assistanceof Artemis SA on recurring issues including communications, public and institutional relations, as well as thedevelopment strategy and its implementation.
At its February 9, 2017 meeting, your Board of Directors re-examined this agreement, and duly noted the payment of€3,235,000 (excluding VAT) under this agreement in respect of 2016, it being specified that the revenue of the PUMAgroup was excluded from the calculation of this fee, as was the case in previous years, together with revenue fromdiscontinued operations.
Persons involved: Mrs. Patricia Barbizet and Mr. François-Henri Pinault, members of the Board of Directors of ArtémisS.A., a Kering S.A. shareholder with more than 10% of voting rights.
Paris La Défense and Neuilly-sur-Seine, March 28, 2017The Statutory Auditors
KPMG Audit Deloitte & AssociésDivision of KPMG SA
Isabelle Allen Grégoire Menou Frédéric Moulin Stéphane Rimbeuf
5 FINANCIAL INFORMATION ~ STATUTORY AUDITORS’ SPECIAL REPORT ON REGULATED AGREEMENTS AND COMMITMENTS WITH THIRD PARTIES
366 Kering ~ 2016 Reference Document

3672016 Reference Document ~ Kering
CHAPter 6
Share capital and ownership structure
1. Share capital 3681.1. Share capital 3681.2. Treasury shares held by the Company and its subsidiaries 3681.3. Authorisations to issue securities giving access to the share capital 3701.4. Employee share ownership 3721.5. Appropriation of net income – Dividends paid by the Company 3721.6. Share pledges 3731.7. Arrangements and agreements 373
2. Share ownership structure 374

Acquisition of treasury shares by the Company
Pursuant to a liquidity agreement dated May 26, 2004,Kering signed an agreement with a financial broker inorder to improve the liquidity of the Group’s shares andensure share price stability. This agreement complieswith the Professional Code of Conduct drawn up by theFrench association of financial and investment firms(Association française des marchés financiers – AMAFI)and approved by the French financial markets authority(Autorité des marchés financiers – AMF).
The agreement was initially endowed with €40 million,half of which was provided in cash and half in Keringshares. An additional €20 million in cash was allocated to
the agreement on September 3, 2004, and a further€30 million on December 18, 2007.
In accordance with an amendment dated December 15,2016, Kering maintains a credit balance of €5 million inthe liquidity account with the financial broker.
The Annual General Meeting on May 6, 2014 authorisedthe Board of Directors to trade in Company shares for aperiod of 18 months in accordance with the goals and termsof the share buy-back programme filed with the AMF. Thisprogramme specifies a maximum purchase price of €220per share and states that the number of shares purchasedmay not exceed 10% of the share capital.
The authorisation given to the Board of Directors to tradein Company shares for a period of 18 months was renewed
6 SHARE CAPITAL AND OWNERSHIP STRUCTURE ~ SHARE CAPITAL
368 Kering ~ 2016 Reference Document
Share capital movements over the past three years
Aggregate Aggregate Additional Aggregate amounts number of number of Description paid-in Nominal amount of of Company capital ordinary €4 shares voting rights(1)
Year of transaction capital capital changes (as of Dec. 31) (as of Dec. 31) (as of Dec. 31)
2016 - - - 505,117,288 126,279,322 179,011,319
2015 Exercise of options €950,080 €51,328 12,832 €950,080 €51,328 €505,117,288 126,279,322 179,001,033
2014 Exercise of options €3,106,096 €158,916 39,729 €3,106,096 €158,916 €505,065,960 126,266,490 179,359,204
(1) Total number of voting rights, including treasury shares.
1.2. Treasury shares held by the Company and its subsidiaries
Share capital as of December 31, 2016
As of December 31, 2016, the share capital amounted to€505,117,288 and was divided into 126,279,322 shareswith a par value of €4 each (all of the same class), all fullypaid up. The number of voting rights at the same datetotalled 179,011,319 (after deducting treasury shares,which do not carry voting rights).
At the same date, to the Company’s knowledge:
• the Directors directly held 0.087% of the share capital,representing 0.120% of the voting rights (after deductingtreasury shares, which do not carry voting rights);
• the Company did not hold any treasury shares nor did ithold any shares under the liquidity agreement; none ofthe Company’s shares were held by controlledcompanies.
As of January 1, 2016, the share capital amounted to€505,117,288 and was divided into 126,279,322 shares.
1. Share capital
1.1. Share capital

at the Annual General Meetings on April 23, 2015 (maximumpurchase price of €250 per share) and April 29, 2016(maximum purchase price of €230 per share).
On April 27, 2017, the Annual General Meeting will be askedto authorise the Company to trade in its own sharesunder a new share buy-back programme under the sameconditions as those stipulated for previous authorisations.The maximum purchase price would be raised to €320per share.
Buy-backs and sales of shares during 2016 – Trading costs – Number of treasury shares held as of December 31, 2016
Share buy-backs
• 1,016,019 shares were bought back by the Companypursuant to the authorisation given by the AnnualGeneral Meeting on April 23, 2015, at an average priceof €153.06 per share;
• 542,013 shares were bought back by the Companypursuant to the authorisation given by the AnnualGeneral Meeting on April 29, 2016, at an average priceof €175.72 per share.
In 2016, Kering therefore bought back a total of1,558,032 shares at an average price of €160.94 for thefollowing purposes:
• 1,304 shares to be granted to employees under the2012 free share plans;
• 1,556,728 shares purchased under the liquidityagreement.
The number of shares bought back represent 1.23% ofthe share capital.
Sales of treasury shares
In 2016, Kering sold 1,556,728 shares at an average priceof €161.37 per share, under the liquidity agreement.
A further 28,902 shares were granted to employees underthe 2012 free share plans, maturing in April 2016.
The number of shares sold represent 1.23% of the sharecapital.
Trading costs
Total share trading costs for buy-backs and salesamounted to €0.5 million in 2016.
Share cancellations in 2016
No Kering shares were cancelled during the year.
As of the end of the reporting period, the Company didnot hold any treasury shares.
Buy-backs and sales of Kering shares carried outbetween January 1 and March 10, 2017
Since January 1, 2017, the Company has acquired106,594 shares at an average price of €224.33 and hassold 106,594 shares at an average price of €224.64, inconnection with the liquidity agreement.
As of March 10, 2017, the Company did not hold anyshares under the liquidity agreement.
Outside the scope of the liquidity agreement, theCompany did not acquire any Kering shares.
As of March 10, 2017, Kering did not therefore hold anytreasury shares.
Share cancellations in 2017
No shares were cancelled between January 1 andMarch 10, 2017.
Use of derivatives in 2016
Kering did not buy any call options on its own shares in 2016.
As of December 31, 2016, Kering did not hold any calloptions on its own shares.
6SHARE CAPITAL ~ SHARE CAPITAL AND OWNERSHIP STRUCTURE
3692016 Reference Document ~ Kering

As indicated in the above table, the Extraordinary GeneralMeetings on April 23, 2015 and April 29, 2016 authorisedthe Board of Directors to issue, with or without pre-emptive subscription rights, securities giving access tothe Company’s share capital, either immediately or in the
future, to increase the share capital by capitalisingreserves, profits or additional paid-in capital and to grantfree shares.
These delegations of authority were not used during theyear.
1.3. Authorisations to issue securities giving access to the share capital
Authorisations to issue shares or other securities in force as of December 31, 2016
Pursuant to the decisions of the Extraordinary General Meeting, the Board of Directors has the following authorisations:
Date of Annual General Term of validity Maximum authorised Description of authorisation Meeting (resolution No.) (expiry date) nominal amount Current use
Share capital increases with pre-emptive subscription rights
Share capital increase via the issue, April 23, 2015 (8th) 26 months €200 million Unusedwith pre-emptive subscription rights, (June 2017) of shares, warrants and / or securities giving access, either immediately or in the future, to shares or to debt securities (1)
Share capital increase via the capitalisation April 23, 2015 (9th) 26 months €200 million (2) Unusedof reserves, profits or additional paid-in capital (June 2017)
Share capital increases without pre-emptive subscription rights
Share capital increase via the issue, April 23, 2015 (10th) 26 months €50.5 million (2) Unusedwithout pre-emptive subscription rights, (June 2017) by public offering, of shares, warrants and / or securities giving access, either immediately or in the future, to shares in the Company, including as consideration for shares tendered in a public exchange offer, or to debt securities
Share capital increase via the issue, without April 23, 2015 (11th) 26 months €50.5 million(1) (3) Unusedpre-emptive subscription rights, by private (June 2017) placement, of shares, warrants and / or securities giving access, either immediately or in the future, to shares in the Company or to debt securities
Authorisation to set the issue price for a share April 23, 2015 (12th) 26 months €25.3 million Unusedcapital increase, without pre-emptive subscription (related to the 10th and (June 2017) per year rights, by public offering or private placement, 11th resolutions above) limited to 5% of the share capital per year
Share capital increase in consideration for in-kind April 23, 2015 (14th) 26 months €50.5 million(3) Unusedcontributions, limited to 10% of the share capital (June 2017)
Share capital increase with or without pre-emptive subscription rights
Increase in the number of shares or securities April 23, 2015 (13th) 26 months 15% of the amount Unusedto be issued within the scope of a share capital (June 2017) of the initial issue increase, with or without pre-emptive subscription rights, in the event of excess demand
Share capital reductions by cancelling shares
Authorisation to reduce the share capital April 23, 2015 (7th) 24 months 10% of the share capital Unusedby cancelling shares (April 2017) per 24-month period
Free share grants
Grant of existing shares or shares to be issued, April 29, 2016 (15th) 24 months 0.5% of the share capital Unusedreserved for employees and corporate officers (April 2018) at the grant date
(1) Limited by Article L. 225-136 of the French Commercial Code to 20% of the share capital per year in all cases.(2) This amount is deductible from the overall €200 million cap for issues of shares and / or securities giving access to the share capital set by the 8th resolution.(3) This amount is deductible from the €200 million and €50 million caps for issues of shares and / or securities giving access to the share capital set by the 8th and
10th resolutions.
6 SHARE CAPITAL AND OWNERSHIP STRUCTURE ~ SHARE CAPITAL
370 Kering ~ 2016 Reference Document

Changes in share capital and rights attached to shares
Any changes in the share capital and the rights attachedto shares are governed by the legal requirements and thespecific provisions of the Articles of Association as set outbelow.
Under Article 15 of the Articles of Association, in theCompany’s internal organisation, decisions by the ChiefExecutive Officer and, where applicable, the GroupManaging Director relating to the issue of securities,regardless of their nature, require the prior approval bythe Board of Directors when such issues are likely tochange the share capital.
Kering free shares plan as of Dec. 31, 2016 2012-II Plan
Date of Annual General Meeting 05 / 19 / 2010
Date of Board meeting 04 / 27 / 2012
Number of shares initially granted 39,640
to François-Henri Pinault to Jean-François Palus
Shares forfeited as of Dec. 31, 2016 10,738
Number of shares issued as of April 27, 2016 0
Number of shares outstanding as of Dec. 31, 2016 0
Number of beneficiaries 88
Vesting date 04 / 27 / 2016
Date on which shares may be sold 04 / 27 / 2016
Performance shares granted to the top ten employee beneficiaries Total number of(excluding Directors and executive corporate officers) of the Company free shares granted
Free shares granted in 2016 by Kering or any other company 0within the scope of the share grant to the ten employees (excluding Directors and executive corporate officers) of Kering receiving the most shares
Other securities giving access to the share capital
Special report on stock subscription and purchase options and free share grants
No new free shares have been granted since 2014.
Stock option plans
Grants are, in principle, made annually. However, no stocksubscription and purchase option plans have been set upsince 2007.
The plans set up in 2006 and 2007 have terms of eightyears (compared to terms of ten years for previous plans)and the options granted are purchase options. As theyhave no impact on the number of shares comprising theshare capital, they are not dilutive.
As of December 31, 2016, there were no stock subscriptionor purchase options outstanding.
Performance share plans
No performance shares were granted in 2016.
The Group granted Kering Monetary Units (KMUs) instead ofperformance shares, as described on pages 167, 168, 186,194 and 285.
Performance shares vest fully at the end of a two-yearvesting period, which is followed by a two-year lock-inperiod during which the performance shares grantedmay not be sold (four years for foreign residents, with nolock-up period).
The last performance share plan set up for foreignresidents in 2012 vested on April 27, 2016.
6SHARE CAPITAL ~ SHARE CAPITAL AND OWNERSHIP STRUCTURE
3712016 Reference Document ~ Kering

Dividends paid out over the past three fiscal years
Year of payment Net dividend Qualifying for a tax allowance of
2016 €4 40%2015 €4 40%2014 €3.75 40%
The Board of Directors will propose to the Annual GeneralMeeting on April 27, 2017 the payment of a dividend of€4.60 per share eligible for dividends as of January 1, 2016.
An interim dividend in the amount of €1.50 per share waspaid on January 18, 2017 pursuant to a decision by the
Board of Directors on December 15, 2016.
If this dividend is approved, the balance of €3.10 pershare will have an ex-dividend date of May 3, 2017 andwill be payable as from May 5, 2017.
1.5. Appropriation of net income – Dividends paid by the Company
Appropriation of net income
At its meeting on February 9, 2017, the Board of Directors acknowledged and proposed the following net incomeappropriation to the Annual General Meeting:
(in €)
Source
Retained earnings 2,121,093,708.39Net income for the year 682,887,416.34Total for appropriation 2,803,981,124.73
Appropriation
Legal reserve (1) -Dividend (2) 580,884,881.20Retained earnings 2,412,515,226.53Total 2,803,981,124.73(1) No further charge to the legal reserve is proposed since the reserve stood at €51,354,910 as of December 31, 2016, i.e., above the minimum amount required by
law (10% of the share capital).(2) Representing a dividend of €4.60 per share qualifying for the 40% tax allowance, payable on May 5, 2017. This amount corresponds to the interim dividend
(€1.50 per share) paid on January 18, 2017 (€189,418,983.00) plus the final dividend of €391,465,898.20, equal to €3.10 per share, calculated on the basis ofthe maximum number of shares carrying dividend rights.
As of December 31, 2016, Company and Group employeesheld 459,417 shares, representing 0.36% of the sharecapital, under the provisions of Article L. 225-102 of the
French Commercial Code (Code de commerce). Companyemployees also held 14,296 shares via an employeeinvestment fund, representing 0.01% of the share capital.
1.4. Employee share ownership
6 SHARE CAPITAL AND OWNERSHIP STRUCTURE ~ SHARE CAPITAL
372 Kering ~ 2016 Reference Document

To the Company’s knowledge, there are no contractualarrangements or agreements involving shares or votingrights of the Company that should have been disclosed to
the AMF pursuant to Article L. 233-11 of the FrenchCommercial Code.
1.6. Share pledges
As of December 31, 2016, 8,750,000 registered shares were pledged by the Artémis group.
% of the Terms of Number of issuer’s
Name of registered Pledge Pledge release of issuer shares capitalshareholder Beneficiary start date expiry date the pledges pledged pledged (2)
Artémis CA CIB 07 / 23 / 2015 Unspecified (1) 3,850,000 3.05%Artémis CA CIB 12 / 07 / 2015 Unspecified (1) 1,600,000 1.27%Artémis CA CIB 07 / 25 / 2016 Unspecified (1) 3,300,000 2.61%
(1) Full reimbursement or payment of the receivable.(2) Based on the share capital as of December 31, 2016, comprising 126,279,322 shares with a par value of €4 each.
1.7. Arrangements and agreements
6SHARE CAPITAL ~ SHARE CAPITAL AND OWNERSHIP STRUCTURE
3732016 Reference Document ~ Kering

Artémis is wholly owned by Financière Pinault, itselfcontrolled by the Pinault family. Artémis holds 57.41% ofthe Company’s voting rights and as such has de jurecontrol of the Company within the meaning of ArticleL. 233-3-I of the French Commercial Code.
On August 23, 2016, The Capital Group Companies, Inc. (5),based in Los Angeles (United States), reported that it hadcrossed above the 5% threshold of Kering’s voting rightson August 18, 2016 and that it held 8,951,212 sharesrepresenting an equal number of voting rights, i.e., 7.09%of the share capital and 5.0002% of the voting rights. OnNovember 7, 2016, The Capital Group Companies, Inc.reported that it had crossed below the 5% threshold ofKering’s voting rights on November 3, 2016 and that itheld 8,943,087 shares representing an equal number ofvoting rights, i.e., 7.08% of the share capital and 4.99% ofthe voting rights. This threshold was crossed as a result ofa sale of Kering shares on the open market.
To the Company’s knowledge, no other shareholder directly,indirectly, or jointly holds 5% or more of the share capitalor voting rights.
Regarding the majority shareholder’s control of the Company,the organisation and operating rules of the Board and ofits specialised Committees, the number of independentDirectors – representing (i) more than half of the Boardmembers (who oversee the prevention of conflicts ofinterest and regularly carry out a self-assessment), (ii) three-quarters of the Audit Committee, and (iii) three-quarters of the Remuneration Committee, it beingspecified that no executive corporate officer is a memberof these Committees – and general compliance withcurrent rules, internal rules and good governance practicesall contribute to maintaining an effective balance of power(see Chapter 4 “Corporate governance”).
2. Share ownership structureChange in share ownership and voting rights as of December 31, 2016
2016 2015 Number % of Number % of Number % of share of voting voting Number % of share of voting voting of shares capital rights (1) rights (2) of shares capital rights (1) rights (2)
Artémis group 51,617,767 40.88% 102,770,114 57.41% 51,638,516 40.89% 102,746,612 57.41%Harris Associates(4) - 6,318,723 5.00% 6,318,723 3.53%The Capital Group(5) 8,943,087 7.08% 8,943,087 4.99% 6,348,513 5.03% 6,348,513 3.55%Kering 0 0.00% 0(3) 0.00% 27,598 0.02% 27,598(3) 0.00%Employees 476,713 0.38% 904,377 0.51% 510,379 0.41% 929,288 0.52%Free float 65,241,755 51.66% 66,393,741 37.09% 61,435,593 48.65% 62,630,299 34.99%
TOTAL 126,279,322 100.00% 179,011,319 100.00% 126,279,322 100.00% 179,001,033 100.00%
20 14
Number % of Number % of share of voting voting of shares capital rights (1) rights (2)
Artémis group 51,675,702 40.93% 103,216,483 57.56%Harris Associates (4) -The Capital Group (5) -Kering 21,537 0.02% 21,537 (3) 0.00%Employees 542,579 0.43% 904,522 0.51%Free float 74,026,672 58.62% 75,216,662 41.93%
TOTAL 126,266,490 100.00% 179,359,204 100.00%
(1) Total number of voting rights, including treasury shares.(2) Shares held for more than two years in a registered account in the name of the same shareholder carry double voting rights (see the section entitled “General
information – Annual General Meetings” on page 381).(3) Theoretical voting rights, in the Annual General Meeting these shares lose their voting rights.(4) On February 11, 2016, Harris Associates L.P., based in Chicago (United States) and acting on behalf of funds and clients for whom it provides asset management
services, reported that it had crossed below the 5% threshold of Kering’s share capital on February 9, 2016, and that it held, on behalf of said funds and clients,6,275,730 Kering shares representing an equal number of voting rights, i.e., 4.97% of the share capital and 3.51% of the voting rights. This threshold wascrossed as a result of a sale of Kering shares on the open market. Harris Associates L.P., controlled by Natixis Global Asset Management, L. P., itself controlled byNatixis, L.P., states that it acts independently from the person that controls it, in accordance with the conditions laid down in Article L. 233-9 II of the FrenchCommercial Code and Articles 223-12 and 223-12-1 of the AMF’s General Regulations.
(5) Acting as an investment adviser on behalf of the funds. The Capital Group Companies, Inc. combines the positions held by Capital Research and ManagementCompany (CRMC) and Capital Group International (CGI).
6 SHARE CAPITAL AND OWNERSHIP STRUCTURE ~ SHARE OWNERSHIP STRUCTURE
374 Kering ~ 2016 Reference Document

Change in the price of the Kering share compared to the CAC 40 index from January 1, 2016 to Feruary 28, 2017
Market price and trading volume of the Kering share
2016 2015 2014 2013 2012
High (1) (in €) 214.35 197.00 167.40 184.50 144.50Low (1) (in €) 138.60 139.05 137.35 140.28 106.35Price (1) as of December 31 (in €) 213.30 157.95 159.50 153.65 140.90Market capitalisation as of December 31 (in € millions) 26,935 19,946 20,140 19,395 17,764Daily average trading volume (in number of shares) 255,805 356,633 224,261 254,343 317,960
Number of shares as of December 31 126,279,322 126,279,322 126,266,490 126,226,761 126,116,702
(1) Closing price.Source: Euronext.
BREAKDOWN OF SHARE CAPITAL AS OF DECEMBER 31, 2016(ROUNDED FIGURES)
Source: Identifiable Bearer Security (Titre au Porteur Identifiable) as ofDecember 31, 2016.
As of December 31, 2016, private individual shareholdersheld 4.7% of the Group’s share capital. Institutional investorsowned 54.0% of the share capital, with 7.3% held by Frenchinstitutions and 46.7% by investors residing outside France.
Among the international institutional investors, NorthAmerican-based and UK-based shareholders held 20.6%and 10.9% of the share capital, respectively. ContinentalEuropean investors (excluding France) held 6.9% of theshare capital, including notably Switzerland (1.9%) andNorway (1.4%). Shareholders based in the Asia-Pacificregion represented 3.7% of the share capital.
Stock market information
Kering share
Place of listing Euronext Paris
Market Eurolist A
Benchmark index CAC 40
Initial public offering October 25, 1988 on the Second MarketFebruary 9, 1995 on the CAC 40
Number of shares 126,279,322 as of December 31, 2016
Tickers ISIN code: FR 00 00 121 485Reuters: KER.PA
Bloomberg: KERFP
6SHARE OWNERSHIP STRUCTURE ~ SHARE CAPITAL AND OWNERSHIP STRUCTURE
3752016 Reference Document ~ Kering
Artémis group40.9%
French institutionalinvestors 7.3%
Employeeshareholders
0.4%
Internationalinstitutionalinvestors46.7%
Private individualshareholders 4.7%
120
140
160
100
180
200
220In euros
CAC 40Kering
201601 02 03 04 05 06 07 08 09 10 11 12 01 02
2017
+ 51%
+ 7%

Listed securities of the Group as of December 31, 2016
Securities listed on Euronext Paris ISIN code
EquitiesKering FR 00 00 121 485
Securities listed on the Luxembourg Stock Exchange ISIN code
BondsKering 6.50% November 2017 FR 00 10 784 082Kering 1.875% October 2018 FR 00 11 584 929Kering 3.125% April 2019 FR 00 11 236 983Kering 1.375% October 2021 FR 00 12 199 008Kering 2.75% April 2024 FR 00 11 832 039Kering 2.50% July 2020 FR 00 11 535 764Kering 0.875% March 2022 FR 00 12 648 244Kering 1.25% May 2026 FR 00 13 165 677Kering 1.6% April 2035 FR 00 12 669 257
Stock market dataKering share
20 15 Share price (in €) Volume Average daily Shares traded Monthly (in number Number Average (1) High (2) Low (2) change of shares) €m of shares
January 167.34 181.75 152.70 +12.5% 278,695 985 5,852,599February 180.66 185.00 174.75 +1.4% 242,083 872 4,841,652March 187.35 198.50 180.15 -0.1% 332,143 1,373 7,307,148April 173.94 184.70 164.95 -10.7% 478,344 1,659 9,118,029May 164.85 171.85 158.35 -3.1% 326,617 1,074 6,532,333June 158.78 164.50 152.55 +0.1% 400,562 1,403 8,812,363July 165.81 176.70 154.40 +9.6% 357,438 1,367 8,221,064August 166.56 181.95 146.20 -13.0% 388,856 1,339 8,165,983September 145.91 155.05 136.75 -4.4% 502,069 1,618 11,045,515October 158.05 174.40 141.75 +15.4% 381,638 1,329 8,396,041November 166.96 176.70 159.00 -3.0% 268,021 938 5,628,449December 158.42 167.55 153.25 -3.4% 335,308 1,169 7,376,786
2016 Share price (in €) Volume Average daily Shares traded Monthly (in number Number Average (1) High (2) Low (2) change of shares) €m of shares
January 147.90 156.50 138.65 -1.8% 317,834 938 6,356,677February 155.00 165.35 143.20 +3.6% 399,321 1,304 8,385,740March 161.11 167.85 153.20 -2.2% 257,553 871 5,408,622April 153.44 162.15 146.70 -4.7% 314,685 1,012 6,608,395May 145.05 152.70 140.35 -3.0% 188,140 600 4,139,082June 148.65 156.70 136.55 +0.2% 293,493 958 6,456,855July 153.21 173.30 140.55 +16.8% 233,005 763 4,893,096August 171.98 177.00 167.85 0.0% 173,403 685 3,988,278September 176.70 184.35 170.05 +5.6% 222,983 864 4,905,619October 191.30 206.40 179.00 +12.5% 286,084 1,162 6,007,770November 198.80 206.95 191.30 +1.5% 208,692 912 4,591,226December 210.29 214.90 200.55 +4.0% 190,504 825 4,000,588
(1) Closing price.(2) Intra-day price.Source: Euronext.
6 SHARE CAPITAL AND OWNERSHIP STRUCTURE ~ SHARE OWNERSHIP STRUCTURE
376 Kering ~ 2016 Reference Document
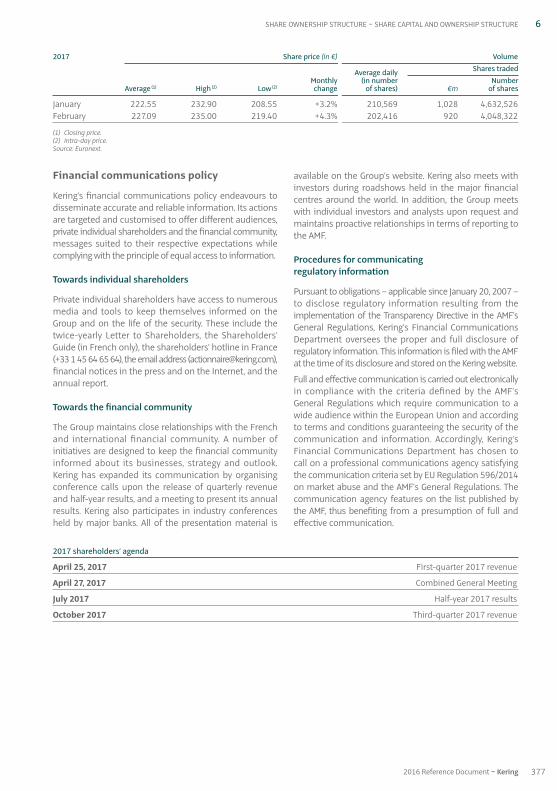
2017 shareholders’ agenda
April 25, 2017 First-quarter 2017 revenue
April 27, 2017 Combined General Meeting
July 2017 Half-year 2017 results
October 2017 Third-quarter 2017 revenue
Financial communications policy
Kering’s financial communications policy endeavours todisseminate accurate and reliable information. Its actionsare targeted and customised to offer different audiences,private individual shareholders and the financial community,messages suited to their respective expectations whilecomplying with the principle of equal access to information.
Towards individual shareholders
Private individual shareholders have access to numerousmedia and tools to keep themselves informed on theGroup and on the life of the security. These include thetwice-yearly Letter to Shareholders, the Shareholders’Guide (in French only), the shareholders’ hotline in France(+33 1 45 64 65 64), the email address ([email protected]),financial notices in the press and on the Internet, and theannual report.
Towards the financial community
The Group maintains close relationships with the Frenchand international financial community. A number ofinitiatives are designed to keep the financial communityinformed about its businesses, strategy and outlook.Kering has expanded its communication by organisingconference calls upon the release of quarterly revenueand half-year results, and a meeting to present its annualresults. Kering also participates in industry conferencesheld by major banks. All of the presentation material is
available on the Group’s website. Kering also meets withinvestors during roadshows held in the major financialcentres around the world. In addition, the Group meetswith individual investors and analysts upon request andmaintains proactive relationships in terms of reporting tothe AMF.
Procedures for communicating regulatory information
Pursuant to obligations – applicable since January 20, 2007 –to disclose regulatory information resulting from theimplementation of the Transparency Directive in the AMF’sGeneral Regulations, Kering’s Financial CommunicationsDepartment oversees the proper and full disclosure ofregulatory information. This information is filed with the AMFat the time of its disclosure and stored on the Kering website.
Full and effective communication is carried out electronicallyin compliance with the criteria defined by the AMF’sGeneral Regulations which require communication to awide audience within the European Union and accordingto terms and conditions guaranteeing the security of thecommunication and information. Accordingly, Kering’sFinancial Communications Department has chosen tocall on a professional communications agency satisfyingthe communication criteria set by EU Regulation 596/2014on market abuse and the AMF’s General Regulations. Thecommunication agency features on the list published bythe AMF, thus benefiting from a presumption of full andeffective communication.
2017 Share price (in €) Volume Average daily Shares traded Monthly (in number Number Average (1) High (2) Low (2) change of shares) €m of shares
January 222.55 232.90 208.55 +3.2% 210,569 1,028 4,632,526February 227.09 235.00 219.40 +4.3% 202,416 920 4,048,322
(1) Closing price.(2) Intra-day price.Source: Euronext.
6SHARE OWNERSHIP STRUCTURE ~ SHARE CAPITAL AND OWNERSHIP STRUCTURE
3772016 Reference Document ~ Kering

378 Kering ~ 2016 Reference Document

3792016 Reference Document ~ Kering
CHAPter 7
Additional information
1. Additional information 3801.1. General information 3801.2. Information on trade payables – payment terms 3821.3. Information on trade receivables – payment terms 382
2. Person responsible for the Reference Document 3832.1. Declaration by the person responsible for
the Reference Document and for the Annual Financial Report 383
3. Statutory Auditors 3843.1. Principal Statutory Auditors 3843.2. Substitute Statutory Auditors 384
4. Documents incorporated by reference 385
5. Cross-reference tableto the disclosure requirements set outin Annex 1 of European Regulation No. 809 / 2004 386
6. Cross-reference table for the Management Report(articles L. 225-100 et seq., L. 232-1 and R. 225-102 of the French Commercial Code) 389
7. Cross-reference table for the Annual Financial Report(article 222-3 of the AMF’s general regulations) 391
8. Index 392
Company name and registered office
Company name: Kering
Registered office: 40 rue de Sèvres, 75007 Paris, France
Legal form
A French joint stock company (société anonyme)
Applicable law
French law
Date of incorporation and term
The Company was incorporated on June 24, 1881 for aterm of 99 years. The term was extended to May 26, 2066by the Extraordinary General Meeting on May 26, 1967,except in the case of an early dissolution or of anextension approved by the Extraordinary General Meeting.
Corporate purpose
• the purchase, retail sale or wholesale, either directly orindirectly, by all means and using all existing or futuretechniques, of all goods, products, commodities orservices;
• the creation, acquisition, leasing, operating or sale,either directly or indirectly, of all establishments, storesor warehouses, by all means and using all existing orfuture techniques, for the retail sale or wholesale of allgoods, products, commodities or services;
• the direct or indirect manufacture of all goods, productsor commodities that are useful for corporate operations;
• the direct or indirect supply of all services;
• the purchase, operation and sale of all buildings thatare useful for corporate operations;
• the creation of all commercial, non-trading, industrialand financial concerns, whether in moveable or realproperty, service or other businesses, the acquisition ofparticipating interests by all means, subscription,acquisition, contribution, merger or otherwise in, to orof such concerns and businesses and the managementof its participating interests;
• and, in general, all commercial, non-trading, industrialand financial operations, whether in moveable or realproperty, service or other businesses that can bedirectly or indirectly connected to the purposes specifiedabove or to all similar, complementary or related purposes
or purposes that are liable to favour the creation ordevelopment thereof.
(Article 5 of the Articles of Association)
Trade and Companies Registry
552 075 020 RCS Paris
APE code: 7010Z
Consultation of legal documents
The Articles of Association, the minutes of Annual GeneralMeetings and other corporate documents may beconsulted at the registered office under the conditionsprovided for by law.
Fiscal year
The Company’s fiscal year begins on January 1 and endson December 31 of the same year.
Appropriation of earnings
From the profit for the fiscal year, less deferred losseswhere applicable, a minimum withdrawal of one-twentieth is made and paid into a reserve fund known asthe “legal reserve”. Said withdrawal ceases to be mandatoryonce said reserve reaches one-tenth of the share capital.
From the distributable profit, which is made up of theprofit for the fiscal year less the deferred losses and thewithdrawal referred to above, as well as the amounts tobe paid into the reserves in accordance with the law, plusdeferred profits, the Annual General Meeting, pursuant toa proposal by the Board of Directors, may withdraw allamounts it deems appropriate, either to be deferred tothe subsequent fiscal year, or to be entered into one ormore extraordinary, general or special reserve funds, theallocation and use of which is determined by the AnnualGeneral Meeting.
The balance, if any, is allocated among the shareholders.
The Annual General Meeting that votes on the financialstatements for the fiscal year has the option of grantingeach shareholder, for all or part of the dividend or interimdividend distributed, an option between the payment ofthe dividend or the interim dividend in cash, in kind or inshares. The Annual General Meeting may also decide, forall or part of the dividend, interim dividends, reserves, orpremiums distributed, or for any capital reduction, thatthe distribution of dividends, reserves or premiums or the
7 ADDITIONAL INFORMATION ~ ADDITIONAL INFORMATION
380 Kering ~ 2016 Reference Document
1.1. General information
1. Additional information

capital reduction will be made in kind in the form ofcorporate assets, including securities.(Article 22 of the Articles of Association)
Dividends not claimed after five years are paid to theFrench State.
Dividends paid over the last three fiscal years arepresented in the Management Report.
Administrative and management bodies
Information regarding administrative and managementbodies is presented in the “Corporate governance”chapter.
Annual General Meetings – Double voting rights
Annual General Meetings are convened by the Board ofDirectors and deliberate on their agenda under theconditions provided for by the law and the regulations.
Meetings are held at the registered office or in any otherplace specified in the convening notice.
All shareholders may attend meetings, either in person orvia a proxy, under the conditions laid down by law, subjectto providing proof of their identity and of the title to theirsecurities, by the recognition of said securities in theaccounts in their name within the regulatory timeframes,either in the accounts of registered securities held by theCompany, or in the accounts of bearer securities held byan accredited intermediary. Proof of the capacity of ashareholder can be provided electronically, under theconditions set by the regulations in force. Pursuant to adecision of the Board of Directors, shareholders mayparticipate in meetings via video-conference or viatelecommunications means that make it possible toidentify them under the conditions laid down by theregulations in force. All shareholders may vote bycorrespondence using a form filled out and sent to theCompany under the conditions laid down by theregulations in force, including electronically, pursuant to adecision by the Board of Directors. This form must reachthe Company in accordance with the regulatoryconditions in order to be taken into account. The Boardof Directors may reduce said timeframe for the benefit ofall shareholders. The owners of securities who are notresident on French territory may be represented by anintermediary who is registered in accordance with theconditions laid down by the regulations in force.
Meetings are chaired by the Chairman of the Board ofDirectors or, in his / her absence, by the member of theBoard who is specifically appointed for this purpose bythe Board. Failing this, the meeting elects its own chair.
Meeting minutes are prepared and copies thereof arecertified and issued in accordance with the law.
In all Annual General Meetings, a voting right that isdouble that conferred on the other shares is granted to
all shares that are fully paid up and for which proof isprovided that they have been held in registered form forat least two years in the name of the same shareholder.This double voting right, which existed in the Articles ofAssociation of Pinault SA prior to its merger with PrintempsSA, was restated at the time of their 1992 merger.
This double voting right may be withdrawn outright atany time pursuant to a decision of the ExtraordinaryGeneral Meeting and after ratification by a specialmeeting of the beneficiary shareholders.(Article 20 of the Articles of Association)
The double voting right existed in Pinault SA andPrintemps SA prior to their 1992 merger. The Company’sArticles of Association do not provide that, in the event ofa free allocation of registered shares to a shareholder inrespect of old shares for which he / she / it had a doublevoting right, the new shares are also entitled to a doublevoting right.
Pursuant to the relevant legislation, double voting rightsare cancelled for any share converted to a bearer share orin the event of a transfer of ownership except in the caseof a transfer following inheritance, liquidation of jointproperty between spouses, or donation between living familymembers (spouse or relative) with legal inheritance rights.
Voting rights are not limited under the Articles ofAssociation.
The legal and regulatory provisions relating to thecrossing of thresholds by shareholders apply. The Company’sArticles of Association do not include any special provisionin this regard.
There are no shares not representing capital.
The steps required to amend shareholder rights are thoseprovided for by law.
Share capital
The Company is authorised to use the provisions of thelaw and regulations regarding the identification of theholders of securities that grant immediate or deferredaccess to voting rights at its own Annual General Meetings.(Article 7 of the Articles of Association)
In addition to the voting right that is granted to each shareby the law and by the specific provisions of Article 20 below,each share grants the right to a percentage, which isproportional to the number and par value of the existingshares, of the corporate assets, the profit after deductionof the deductions provided for by law and the Articles ofAssociation, or of the liquidating dividend.
In order for all the shares to receive the same net amount,without distinction, and to be listed on the same line, theCompany shall, unless prohibited by law, pay the amountof any proportional tax that may be owed on certainshares only, in particular upon a winding up of theCompany or capital reduction; however, the Company willnot make this payment when the tax applies under the
7ADDITIONAL INFORMATION ~ ADDITIONAL INFORMATION
3812016 Reference Document ~ Kering

1.2. Information on trade payables – payment terms
Kering’s trade payables, amounting to €16.3 million as of December 31, 2016 (€17 million as of December 31, 2015),fall due in less than 60 days.
1.3. Information on trade receivables – payment terms
Kering’s trade receivables, amounting to €33 million as of December 31, 2016 (€16.6 million as of December 31, 2015),fall due 30 days after the invoice date.
same conditions to all the shares in the same class, ifthere are several classes of shares to which differentrights are attached.
Each time it is necessary to possess more than one sharein order to exercise a right, it is the responsibility of theowners who do not possess such number to makearrangements to regroup the required number of shares.(Article 8 of the Articles of Association)
In the event of liquidation of the Company, the remainingshareholders’ equity after repayment of the par value ofthe shares will be allocated among the shareholders inthe same proportions as their holdings in the capital.(Article 24 of the Articles of Association)
Any changes in the share capital or the rights attached toshares are governed by the legal requirements and thespecific provisions of the Articles of Association as set outbelow.
Under Article 15 of the Articles of Association, in theCompany’s internal organisation, decisions by the ChiefExecutive Officer and the Group Managing Directorrelating to the issue of securities, regardless of theirnature, require the prior approval by the Board ofDirectors when such issues are likely to change the sharecapital, except in the event of a decision by the AnnualGeneral Meeting.
7 ADDITIONAL INFORMATION ~ ADDITIONAL INFORMATION
382 Kering ~ 2016 Reference Document

2. Person responsible for the Reference Document
Jean-François Palus
Group Managing Director
2.1. Declaration by the person responsible for the Reference Document and for the Annual Financial Report
Having taken all reasonable measures to that effect, I hereby attest that the information in this Reference Document is,to my knowledge, in accordance with the facts and contains no omission likely to affect its import.
I certify that, to my knowledge, the annual consolidated and parent company financial statements of Kering SA for theyear ended December 31, 2016 have been prepared in accordance with applicable accounting standards and give atrue and fair view of the assets, liabilities, financial position and results of the Company and the undertakings includedin the consolidation, and that the Management Report (the cross-reference table for which is shown on page 389)includes a fair review of the development of the business, the results of operations and the financial position of theCompany and of all the undertakings included in the consolidation and also describes the main risks and uncertaintiesto which they are exposed.
I have obtained a statement from the Statutory Auditors, KPMG Audit and Deloitte & Associés, confirming that they haveaudited the information contained in this document relating to the financial position and the financial statementscontained herein, and that they have read this document in its entirety.
The annual consolidated and parent company financial statements of Kering SA for the year ended December 31, 2016shown in the Reference Document are subject to reports by the Statutory Auditors on pages 344-345 and 363-364respectively of said document. The Statutory Auditors’ report on the parent company financial statements contains anemphasis of matter regarding the information presented in the Management Report on remuneration paid andbenefits granted to corporate officers.
Londres, March 28, 2017
Jean-François Palus
Group Managing Director (Directeur Général délégué)
7PERSON RESPONSIBLE FOR THE REFERENCE DOCUMENT ~ ADDITIONAL INFORMATION
3832016 Reference Document ~ Kering

3. Statutory Auditors
3.1. Principal Statutory Auditors
KPMG SA
Tour EQHO, 2 avenue Gambetta, CS 60055, 92066 Paris-La Défense, France
Grégoire Menou and Isabelle Allen
Date of first appointment: Annual General Meeting of June 18, 1992.
Reappointment, term and expiry: reappointed at the Combined General Meeting on April 29, 2016 for six years untilthe Annual General Meeting called to approve the 2021 financial statements.
Deloitte & Associés
185 avenue Charles-de-Gaulle, 92524 Neuilly-sur-Seine Cedex, France
Frédéric Moulin and Stéphane Rimbeuf
Date of first appointment: Annual General Meeting of May 18, 1994.
Reappointment, term and expiry: reappointed at the Combined General Meeting on May 6, 2014 for six years until theAnnual General Meeting called to approve the 2019 financial statements.
3.2. Substitute Statutory Auditors
Salustro Reydel
Tour EQHO, 2 avenue Gambetta, CS 60055, 92066 Paris-La Défense, France
Date of first appointment: Annual General Meeting of April 29, 2016.
Appointment, term and expiry: appointed at the Combined General Meeting on April 29, 2016 for six years until theAnnual General Meeting called to approve the 2021 financial statements.
BEAS
7-9 Villa Houssay, 92524 Neuilly-sur-Seine Cedex, France
Date of first appointment: Annual General Meeting of May 19, 2005.
Reappointment, term and expiry: reappointed at the Combined General Meeting on May 6, 2014 for six years until theAnnual General Meeting called to approve the 2019 financial statements.
7 ADDITIONAL INFORMATION ~ STATUTORY AUDITORS
384 Kering ~ 2016 Reference Document

In compliance with Article 28 of European Regulation No. 809 / 2004 dated April 29, 2004, this ReferenceDocument incorporates by reference the followinginformation, to which the reader is invited to refer:
• for the fiscal year ended on December 31, 2015: keyfigures, activities of the Group, activity report,investment policy, consolidated financial statements,parent company financial statements and the relatedStatutory Auditors’ reports, set out on pages 6-7, 15-55,176-203, 204-206, 215-302, 304-320, 303 and 321respectively of the Reference Document filed on April 4,2016 with the AMF;
• for the fiscal year ended on December 31, 2014: keyfigures, activities of the Group, activity report,investment policy, consolidated financial statements,parent company financial statements and the relatedStatutory Auditors’ reports, set out on pages 6-7, 15-55,168-193, 195-198, 207-294, 298-316, 295 and 317respectively of the Reference Document filed on April 1,2015 with the AMF.
Information included in these two Reference Documentsother than that listed above is, where relevant, replacedor updated by the information included in this ReferenceDocument. These two Reference Documents areavailable at the Group’s registered office and on itswebsite: www.kering.com, under the Finance section.
4. Documents incorporated by reference
7DOCUMENTS INCORPORATED BY REFERENCE ~ ADDITIONAL INFORMATION
3852016 Reference Document ~ Kering

5. Cross-reference tableTo the disclosure requirements set out in Annex 1 of European Regulation No. 809 / 2004
1. Person responsible
1.1. Name and position of the person responsible 3831.2. Declaration by the person responsible 383
2. Statutory Auditors
2.1. Names and addresses of the Statutory Auditors 3842.2. Resigned, removed or not reappointed N / A
3. Selected financial information and key figures 6-7
3.1. Selected historical financial information 6-73.2. Selected financial information for interim periods N / A
4. Risk factors 211-219, 252-260, 316- 325
5. Information about the Company
5.1. The Company’s history and development5.1.1. The Company’s legal and commercial name 3805.1.2. Place of registration and registration number 3805.1.3. Date of incorporation and term 3805.1.4. Registered office and legal form 3805.1.5. Important events in the development of the business 4-5, 223, 278
5.2. Investments5.2.1. Principal investments made by the Company for each fiscal year for the period
covered by the historical financial information 17-56, 250-2515.2.2. Principal investments in progress, the geographic distribution of these investments
(France and abroad) and the method of financing (internal or external) 279-282, 3295.2.3. Information concerning the issuer’s principal future investments to which its
management bodies are already firmly committed N / A
6. Business overview
6.1. Principal activities6.1.1. Nature of operations and principal activities 17-566.1.2. Significant new products and / or services introduced 26-45, 52-56
6.2. Principal markets 17-566.3. Exceptional factors6.4. Any dependencies N / A6.5. The basis for any statements made by the Company
regarding its competitive position 8-14, 18-23, 27, 30, 33, 46-49, 53
7. Organisational structure
7.1. Brief description of the Group 8-157.2. List of the Company’s significant subsidiaries 15
8. Property, plant and equipment
8.1. Existing or planned material property, plant and equipment 242, 246, 2988.2. Environmental issues that may affect the utilisation of property, plant and equipment 85-115
7 ADDITIONAL INFORMATION ~ CROSS-REFERENCE TABLE
386 Kering ~ 2016 Reference Document
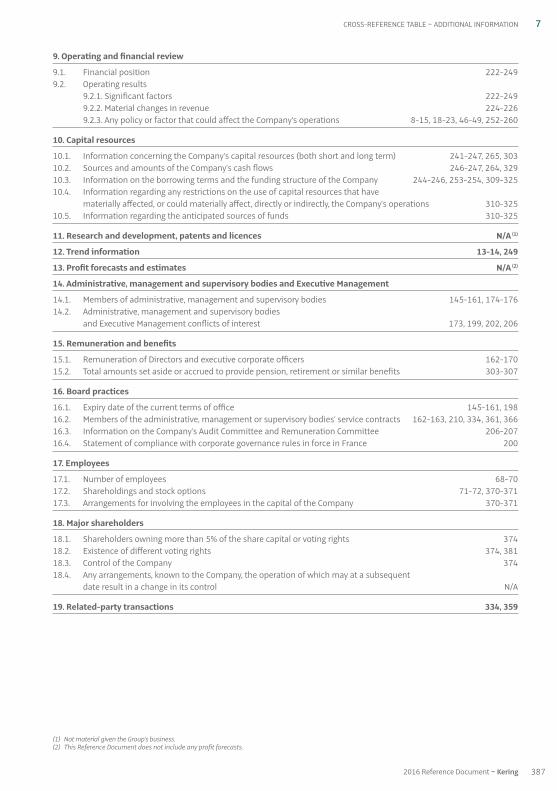
9. Operating and financial review
9.1. Financial position 222-2499.2. Operating results
9.2.1. Significant factors 222-2499.2.2. Material changes in revenue 224-2269.2.3. Any policy or factor that could affect the Company’s operations 8-15, 18-23, 46-49, 252-260
10. Capital resources
10.1. Information concerning the Company’s capital resources (both short and long term) 241-247, 265, 30310.2. Sources and amounts of the Company’s cash flows 246-247, 264, 32910.3. Information on the borrowing terms and the funding structure of the Company 244-246, 253-254, 309-32510.4. Information regarding any restrictions on the use of capital resources that have
materially affected, or could materially affect, directly or indirectly, the Company’s operations 310-32510.5. Information regarding the anticipated sources of funds 310-325
11. Research and development, patents and licences N / A (1)
12. Trend information 13-14, 249
13. Profit forecasts and estimates N / A (2)
14. Administrative, management and supervisory bodies and Executive Management
14.1. Members of administrative, management and supervisory bodies 145-161, 174-17614.2. Administrative, management and supervisory bodies
and Executive Management conflicts of interest 173, 199, 202, 206
15. Remuneration and benefits
15.1. Remuneration of Directors and executive corporate officers 162-17015.2. Total amounts set aside or accrued to provide pension, retirement or similar benefits 303-307
16. Board practices
16.1. Expiry date of the current terms of office 145-161, 19816.2. Members of the administrative, management or supervisory bodies’ service contracts 162-163, 210, 334, 361, 36616.3. Information on the Company’s Audit Committee and Remuneration Committee 206-20716.4. Statement of compliance with corporate governance rules in force in France 200
17. Employees
17.1. Number of employees 68-7017.2. Shareholdings and stock options 71-72, 370-37117.3. Arrangements for involving the employees in the capital of the Company 370-371
18. Major shareholders
18.1. Shareholders owning more than 5% of the share capital or voting rights 37418.2. Existence of different voting rights 374, 38118.3. Control of the Company 37418.4. Any arrangements, known to the Company, the operation of which may at a subsequent
date result in a change in its control N / A
19. Related-party transactions 334, 359
7CROSS-REFERENCE TABLE ~ ADDITIONAL INFORMATION
(1) Not material given the Group’s business.(2) This Reference Document does not include any profit forecasts.
3872016 Reference Document ~ Kering

20. Financial information concerning the issuer’s assets and liabilities, financial position and profits and losses
20.1. Historical financial information 261-343, 346-36220.2. Proforma financial information N / A20.3. Financial statements 261-343, 346-36220.4. Auditing of historical annual financial information
20.4.1. Statement that the historical financial information has been audited 344-345, 362-36320.4.2. Other information audited by the Statutory Auditors 137-139, 220, 365-36620.4.3. Source of financial data not extracted from the issuer’s audited financial statements N / A
20.5. Date of latest financial information 261, 34620.6. Interim and other financial information N / A (3)
20.7. Dividend distribution policy 246-248, 303, 362, 37220.7.1. Amount of dividend per share adjusted, where the number of shares in the issuer has
changed, to make it comparable N / A
20.8. Legal and arbitration proceedings 25720.9. Significant change in the financial or trading position N / A
21. Additional information
21.1. Share capital21.1.1. Amount of issued capital 36821.1.2. Shares not representing capital N / A21.1.3. Shares held by the Company, on its behalf or by subsidiaries 368-36921.1.4. Amount of any convertible securities, exchangeable securities or securities with warrants N / A21.1.5. Information about the terms of any acquisition rights and / or any obligations
over capital issued but not paid-up or an undertaking to increase the capital N / A21.1.6. Information about the capital of any member of the Group which is under option
or agreed conditionally or unconditionally to be put under option N / A21.1.7. History of share capital 368
21.2. Memorandum and Articles of Association21.2.1. Corporate purpose 38021.2.2. Provisions with respect to the members of the Company’s administrative bodies 197-21021.2.3. Rights, preferences and restrictions attaching to each class of existing shares 374, 380-381 21.2.4. Action necessary to change the shareholders’ rights N / A21.2.5. Conditions governing the manner in which Annual General Meetings are called 38121.2.6. Provisions that would have an effect of delaying, deferring or preventing a change in control 20921.2.7. Provision governing the ownership threshold above which holdings must be disclosed 38121.2.8. Conditions, articles or Charter governing changes in the capital 381-382
22. Material contracts N / A (4)
23. Third party information and statements by experts and declarations of any interest N / A
24. Documents on display 377, 380, 385
25. Information on holdings 335-343, 360-361
7 ADDITIONAL INFORMATION ~ CROSS-REFERENCE TABLE
(3) No quarterly financial statements have been published between the closing of the annual financial statements and the publication of the Reference Document.(4) Not material.
388 Kering ~ 2016 Reference Document

6. Cross-reference table for the Management Report(articles L. 225-100 et seq., L. 232-1 and R. 225-102 of the French Commercial Code)
Position of the Company and activity over the past fiscal year 222-249
Results of operations of the Company, its subsidiaries and companies under their control 222-241
Key financial performance indicators 6-7
Review of the business, results of operations and financial position 222-249
Trade payables and trade receivables – Payment terms 382
Progress achieved and problems encountered 223, 244-247
Description of main risks and uncertainties 252-260, 316-325
Notes on the use of financial instruments: the Company’s financial risk management policies and objectives 316-325
Information on market risks (interest rate, foreign exchange and equity) 316-325
Information on country risks 254
Significant events that have occurred between the end of the reporting period and the date of the Management Report N/A
Planned development of the Company and of entities within the scope of the consolidation and outlook 249
List of positions held and duties performed by each Director (or equivalent) and executive corporate officer in all companies 148-160
Total remuneration and benefits in kind paid to each Director and executive corporate officer during the year (including the principles and rules used to determine the remuneration and benefits allocated to them) 162-173
Commitments of any kind entered into by the Company in favour of its Directors and executive corporate officers 162-173
Transactions by management, Directors and executive corporate officers in the Company’s securities 176
Key environmental and social indicators 67
Employee information 68-84
Employee share-ownership 372, 375
Environmental information 85-115
Information on the risk-reduction policy for technological accidents N / A
Significant shareholdings in companies with registered offices in France N / A
Changes in the presentation of the annual parent company or consolidated financial statements 222-223
Major shareholders, share ownership structure and voting rights as of December 31, 2016 374
Information on factors likely to have an impact in the event of a public offering 209
Company’s management structure 142-144, 199-200
Special report on stock subscription and purchase options and free share grants 371
Information on the share buy-back programme – transactions carried out by the Company in its own shares (number and average exchange price of purchases and sales, reasons for acquisitions and proportion of the capital they represent, etc.) 368-369
7CROSS-REFERENCE TABLE FOR THE MANAGEMENT REPORT ~ ADDITIONAL INFORMATION
3892016 Reference Document ~ Kering
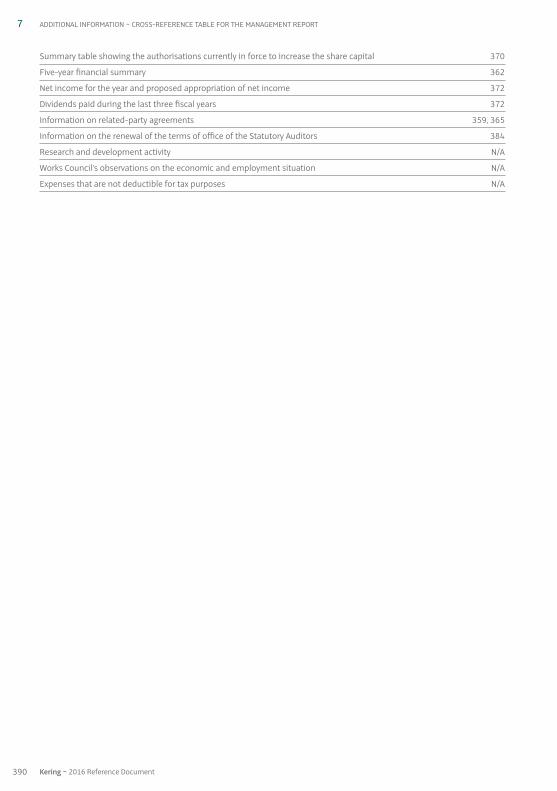
Summary table showing the authorisations currently in force to increase the share capital 370
Five-year financial summary 362
Net income for the year and proposed appropriation of net income 372
Dividends paid during the last three fiscal years 372
Information on related-party agreements 359, 365
Information on the renewal of the terms of office of the Statutory Auditors 384
Research and development activity N / A
Works Council’s observations on the economic and employment situation N / A
Expenses that are not deductible for tax purposes N / A
7 ADDITIONAL INFORMATION ~ CROSS-REFERENCE TABLE FOR THE MANAGEMENT REPORT
390 Kering ~ 2016 Reference Document

7. Cross-reference table for the Annual Financial Report(article 222-3 of the AMF’s general regulations)
Kering SA parent company financial statements 346-362
Kering group consolidated financial statements 261-343
Management Report refer to the cross-reference table for the Management report
Statement by the person responsible for the Annual Financial Report 383
Statutory Auditors’ report on the financial statements 363-364
Statutory Auditors’ report on the consolidated financial statements 344-345
Fees paid to Statutory Auditors 343
Report by the Chairman of the Board of Directors on the conditions of preparation and organisation of the work performed by the Board, and on the internal control and risk management procedures implemented by the Company 197-219
Statutory Auditors’ report prepared in accordance with Article L. 225-235 of the French Commercial Code on the report prepared by the Chairman of the Board of Directors 220
7CROSS-REFERENCE TABLE FOR THE ANNUAL FINANCIAL REPORT ~ ADDITIONAL INFORMATION
3912016 Reference Document ~ Kering
8. IndexAAccounting methods and principles 206, 268, 344, 363-364
Activities
Luxury 7, 15, 24, 60, 66, 80, 122, 125, 143, 200, 211, 218, 224, 226-227,229-231, 236, 241, 244, 247, 249-250, 255-256, 258, 268,
284, 287-288, 295-297, 299-300, 314, 320, 335
Sport & Lifestyle 4, 7, 10, 15, 47, 50, 66, 125, 143, 152, 200, 211, 218, 223-224, 226, 238, 241, 249-252, 254-256,
258-259, 278, 284, 287, 295-297, 299-300
AFEP-MEDEF Code 71, 142, 144, 161, 163, 177, 190, 194, 196, 198, 200-203, 206-208
Alexander McQueen 4, 11, 15, 21, 35-36, 79, 99, 106-107, 111, 113,126-128, 131-132, 223, 237, 278, 335-339
Annual General Meeting 6, 71, 143, 148, 150, 152, 154-160, 163, 171, 188-190, 196, 199-200, 203-204, 208-210, 219, 248, 267, 303, 344,
362-363, 368-369, 371-372, 374, 380-382, 384, 388
APE code (French activity code) 380
Arrangements and agreements 373
Artémis 45, 148, 150, 152, 173, 207, 209, 334, 359, 366, 373-375
Audit
internal 124, 202-207, 212-213, 215-218
social 67, 118, 126, 140, 256
BBalenciaga 4, 11, 15, 21, 35, 37, 77, 80-81, 83, 86-87,
98-99, 107, 110-113, 126-127, 131-133, 180, 223, 231, 236-237, 250, 258, 278, 335-339
Black-out periods 176, 199, 214
Board of Directors
Composition of the Board of Directors 197-198
Internal rules of the Board of Directors 199
Work of the Board of Directors 174, 199, 200, 203
Bottega Veneta 4, 11, 15, 21, 24-25, 29-31, 71, 77, 79, 86-88, 98-99, 102, 104-109, 111-113, 116, 119-120, 126-128, 132-133, 138,
176, 200, 215, 223, 225-226, 230, 233-234, 251, 278, 335-339, 343
Boucheron 4, 11, 15, 22, 35, 38, 80-82, 86, 99, 108-109, 111, 116, 127, 131-132, 148, 237, 299, 335-339, 342
Brioni 5, 9, 11, 15, 21, 35, 39, 69, 77, 87, 99, 109, 111-112, 116-117, 119, 126, 129, 131-133, 138, 149, 153, 223, 227, 236-237, 241, 251, 278, 287, 299-300, 335-339
7 ADDITIONAL INFORMATION ~ INDEX
392 Kering ~ 2016 Reference Document

CCfao 4-5, 8, 148-149, 153
Christopher Kane 5, 9, 11, 15, 21, 35, 40, 79, 152, 223, 237, 278, 299, 335-337, 360
COBRA 5, 52, 55, 107, 239, 340
Code of Business Practices 58
Code of ethics 60, 65, 72-73, 76, 78, 120-121, 125-126, 137, 214, 255-256
Committees
Appointments 66, 142-143, 145-146, 150, 159-160, 171, 188, 197-199, 201-203, 205-206, 208-210
Audit 66, 143-146, 150, 154-155, 158-159, 197-199, 203-207, 211-213, 215-219, 334, 366, 374, 387
Ethics and Corporate Social Responsibility Committee (ECSRC) 58, 72
European Works Council 78, 80, 83-84, 215
Executive 12, 58, 63, 65-66, 69, 76, 78, 85, 91, 175-176, 180, 191, 200, 203, 208, 215, 223, 253, 278, 334
Insider Good Practices 175-176, 214
Remuneration 66, 143, 145-146, 150, 154-155, 162-164, 167, 171, 177, 179, 182-183, 186, 189, 192, 195,
198-199, 201, 203, 206, 208, 210, 374, 387
Strategy and Development 66, 143-146, 148, 150, 154, 156-159, 174, 198-199, 201, 209, 215
Sustainability 58, 63, 65-66, 143, 145-146, 148, 150, 152, 160, 198-199, 203, 205-206, 209
Commodities / Raw materials 11, 61, 63-64, 73, 85-86, 88-95, 103-105, 107, 110-111, 115, 117, 119-120, 123, 135, 156, 255, 258-259, 299, 380
Control of the Company 374, 387
Corporate governance 63, 141-142, 147, 159, 200, 203, 205-206, 208-209, 212, 220, 223, 278, 334, 366, 374, 381, 387
Corporate Social Responsibility 58, 72, 136, 147, 164, 177, 179-180, 183-184, 190-191, 195, 208, 210, 256
DDebt 6, 169, 188, 222, 224, 227, 241, 244-246, 253-254, 264, 269, 271,
273-275, 288, 307, 315-316, 323, 328-329, 350, 356, 358, 370
Directors 13, 58, 62-63, 65-66, 70-71, 74-75, 78, 85, 116, 118-120, 130-131, 137, 142-164, 167, 169-175, 177, 179-183, 186, 188-189, 191-192,
194-195, 197-211, 213, 215-220, 248-249, 258, 267, 285, 303, 334, 344, 358, 363-364, 366, 368, 370-372, 374, 380-382, 387, 389, 391
Directors’ fees 162-163, 171-172, 181, 188-189, 194, 199, 203-204, 208, 210, 358
Dividend 6, 79, 190, 204, 222, 243, 246-248, 264-265, 286, 289, 303, 334, 348-349, 356, 358-362, 372, 380-381, 388, 390
Documents on display 388
Dodo (see Pomellato)
7INDEX ~ ADDITIONAL INFORMATION
3932016 Reference Document ~ Kering

EEBITDA 6, 222, 224, 227, 229, 231-240, 245, 251, 254, 287, 315
Electric 4-5, 56, 67, 94-97, 99, 102-103, 112, 140, 223-224, 238, 240, 243, 278, 308, 331, 342
Employees (see Human resources)
Employee benefits 63-64, 71, 164, 243, 268, 276, 284, 303, 332, 362
Employee profit-sharing 348, 359, 362
Employee savings plan 72
EMTN 203-204, 246, 253, 311-313, 323, 355-356
Environment
Paper 60, 86, 90, 104, 108-113, 227, 244, 310-311, 315, 317, 325, 329, 335, 398
Transport and energy policy 12, 61, 64, 67, 71, 85-86, 88, 91, 94-103, 105, 110-112, 126, 129, 135, 138, 140, 156, 211
Waste recycling 112
Water 54, 60, 63-65, 67, 86, 88, 90-93, 98-99, 105, 107-108, 111, 113-115, 123, 126, 129, 135, 140, 259-260
Equity 6, 224, 228, 241-245, 247, 252, 261, 263, 265, 268-270, 273-275, 282-283, 286, 290, 293, 295, 300, 303, 307, 316, 318, 322-324, 329, 335, 347, 349, 360, 382, 389
Executive Management 78, 144, 175-176, 199, 209, 211, 212-213, 215-218, 253, 387
FFinancial and accounting information 197, 211, 213, 218
Financial communications 199, 218, 377
Financial statements
consolidated 170, 192, 197, 199, 203, 216-218, 222, 227-228, 238, 241-243, 246, 249-250, 252-255, 257, 261, 266-270,
279, 343-345, 359, 385, 389, 391
parent company 197, 200, 203, 211, 217, 248, 264, 267, 335, 346, 349, 351, 383, 385, 389, 391
Five-year financial summary 362, 390
Fnac 4-5, 8, 148-150, 152-153, 291, 362
Free share grants 208, 370-371, 389
GGeneral information 380
Girard-Perregaux 5, 11, 15, 22, 35, 41, 86, 98-99, 108-109, 119, 127, 132, 237
Gucci 4-5, 8, 11, 13, 15, 21-28, 71, 77-78, 80-81, 83, 86-88, 98-99, 102, 105, 107-108, 111-113, 116, 119-120, 126-129, 131-133, 138, 144, 152, 174, 176, 180, 200, 203, 205, 215, 225-227, 230-233, 241-243,
250-251, 258, 280, 287-288, 299-300, 335-339, 342-343
Gucci Group 4-5, 8, 335, 337-339
7 ADDITIONAL INFORMATION ~ INDEX
394 Kering ~ 2016 Reference Document

HHighlights 27, 30, 33, 54, 59, 62, 78, 223, 231, 278, 349
History 4-5
Human resources 11-12, 66, 68-69, 71, 73-74, 77-79, 83-84, 86, 125, 137-138,160, 164, 176, 180, 205, 208, 214-215, 218, 223, 258, 278
IIFRS 134, 170, 250, 254, 267-268, 270, 275-277, 313, 324
Insurance 71, 197, 211, 218-219, 256, 258-260, 304-307, 331
Internal control
Chairman’s report (section on internal control) 143, 203, 207, 220, 252
Internal control procedures 211, 213, 217-218, 220
Internal rules 143-144, 199, 202-205, 212, 374
Investment policy 250, 385
JJEANRICHARD 5, 15, 35, 41
KKering Foundation 13, 59, 62, 65, 67, 76, 130-132
Kering share
Pledges 119, 130-131, 246, 253, 274, 301-302, 315, 333, 373
Share performance 285
Stock market prices 272, 327
Treasury shares 244, 263-265, 275, 277, 293-294, 303, 350, 352, 354, 368-369, 374
Key figures 24, 26, 29, 32, 35, 50, 52, 56, 67, 385-386
LLa Redoute 4-5, 8, 331
Luxury (see Activities)
MMcQ (see Alexander McQueen)
NNon-controlling interests 228, 243, 261-264, 268-270, 273, 277, 292, 294-295
Non-voting Directors 171, 174, 198, 200, 202
OOCEANE bonds 273
Organisational structure of the Group 233, 237, 386
Ownership structure 367, 374, 377, 389
7INDEX ~ ADDITIONAL INFORMATION
3952016 Reference Document ~ Kering
PPension plan 169, 173, 181, 188, 194, 196, 294, 303-304, 306
Pomellato 5, 9, 11, 15, 22, 35, 42, 71, 82-83, 86, 99, 108-109, 111, 131-133, 152, 237, 299, 335, 336-339
Public offer (impact) 209, 370, 375, 389
PUMA 4-5, 13, 15, 47, 49, 51-55, 58, 71, 77-79, 81-83, 85-87, 99, 102, 105-106, 111, 113-114, 118-119, 121-122, 124-128, 132-133, 138, 143, 148, 152,
174, 176, 193, 200, 211-213, 215-216, 224-228, 238-240, 242-244, 246-247, 249, 251, 256, 281, 286, 288, 299-300, 315, 339-341, 366
QQeelin 5, 9, 11, 15, 22, 35, 43, 131-132, 237, 299, 335-336, 338
RRedcats 4, 5, 8, 153, 228, 241, 250, 291, 330, 343, 352-354, 360
Remuneration
paid to executive corporate officers 71, 162-170, 178-179, 182-189
paid to other corporate officers (see Directors’ fees)
Reports
business review 65, 85, 224
Chairman’s report 143, 203, 207, 220, 252
Statutory Auditors’ report (see Statutory Auditors)
Risk
credit 258, 323, 327
equity 252, 268, 274, 316, 323
financial 197, 211, 219, 252, 319, 389
foreign exchange 252-253, 274, 319, 322-323, 354
insurance 197, 218-219
interest rate 222, 252-253, 275, 316-318, 323, 357
legal 257
operational 254-255
prevention (see Risk prevention)
Risk prevention 81, 259
SSaint Laurent (see Yves Saint Laurent)
Securities market 374-375
Seller’s warranties 228, 292, 308, 330-331
Sergio Rossi 4-5, 228, 250, 291-292, 331
Share buy-back (programme) 203, 209, 252, 368-369, 389
7 ADDITIONAL INFORMATION ~ INDEX
396 Kering ~ 2016 Reference Document

Share capital 143, 200, 203, 244, 263-265, 277, 303, 334, 347-349, 352, 359-360, 362, 367-375, 377, 380-382, 387-388, 390, 398
Share capital structure 374-375
Share capital transactions 368-369
Sport & Lifestyle (see Activities)
Staff 12, 14, 63, 74, 81-82, 86, 131, 176, 214, 217, 257-258, 276, 351
Statutory Auditors 137, 139, 144, 202-203, 206-207, 215-218, 220, 343-345, 359, 363-366, 383-386, 388, 390-391
Engagement 61, 136-137, 207, 217, 220, 234, 365
Fees 207, 343, 359, 391
Reports
by the Chairman 197, 211on related-party agreements and commitments 365on the consolidated financial statements 344on the financial statements 363
Stella McCartney 4, 11, 13, 15, 21, 35, 44, 62, 79, 83, 87, 98-99, 102, 104-107, 109, 111, 113, 116-120, 126-128, 131-132, 148, 231, 236-237, 250, 335-339
Subsidiaries and investments 360
Suppliers 12, 54, 60, 63-67, 9-92, 94, 99, 103-108, 111-114, 116, 118-128, 136, 173, 202, 214, 255-256
Stock market prices 272, 327
Stock options (see Stock subscription and purchase options)
Stock subscription and purchase options 169, 275, 277, 286, 303, 350, 352, 362, 371, 389
Strategy 8-13, 19, 27, 30, 33-34, 37, 39, 42, 44, 53, 58-63, 65-69, 71, 76, 82, 84-87, 89, 91, 94-95, 104-106, 117-119, 127-129, 138,
143-146, 148, 150, 154, 156-159, 164, 174, 179-180, 183, 190-191, 193, 197-201, 203-207, 209, 211, 215, 223, 230-231, 233-237,
239-240, 249-251, 254, 258, 278, 304, 366, 377
TThresholds 127, 168, 233, 251, 304, 374, 381, 388
Tomas Maier 30-31, 228, 242, 300, 337
Trade and Companies Registry 267, 380
Tretorn 5, 224, 227, 238-239
UUlysse Nardin 5, 9, 11, 15, 22, 35, 45, 77, 86, 98-99, 109, 116, 119, 127,
132, 138, 148, 152, 227, 237, 241, 287, 296, 299-300, 336-339
VVolcom 5, 15, 47, 56, 85, 87-88, 99, 101, 104-105, 112, 118-119, 121,
124-126, 129, 132-133, 148, 152, 223, 238, 240, 251, 278, 299, 341-342
Voting rights 209, 269, 334, 364, 366, 368, 373-374, 381, 387, 389
YYves Saint Laurent 4, 15, 32-34, 148-151, 153, 200, 223, 225-226,
230-231, 235-236, 250-251, 258, 278, 335-338, 352, 360
7INDEX ~ ADDITIONAL INFORMATION
3972016 Reference Document ~ Kering
Kering
Société anonyme (a French corporation) with a share capital of €505,117,288Registered office: 40 rue de Sèvres - 75007 Paris
552 075 020 RCS ParisTel.: +33 1 45 64 61 00 – Fax: +33 1 45 64 60 00
kering.com
This document was produced by an “Imprim’Vert” eco-responsible printer on PEFC certified paper from sustainably managed forests.
Design and Production: Agence Marc Praquin