2016 Annual Report
116
ANNUAL REPORT 2016 For the year ended March 31, 2016 Initiatives Responding to Change
-
Upload
khangminh22 -
Category
Documents
-
view
2 -
download
0
Transcript of 2016 Annual Report

ANNUAL REPORT 2016For the year ended March 31, 2016
Initiatives Responding to Change

Contents
2 Our History
3 Business Portfolio
4 Risks and Opportunities
6 Our Calling
8 Financial Highlights
10 Selected Financial Data
13 Stock Information
14 A Message from the Management
16 Interview with the President
26 JR East Group Management Vision V—Ever Onward:
Priority Initiatives Going Forward
28 Feature: Priority Initiatives
01 Railway Network Expansion
02 Shinagawa Development Project
03 Advancement of Strategies for Visitors to Japan
from Overseas
34 Review of Operations 34 Transportation > Tokyo Metropolitan Area Network,
Intercity Network, and Shinkansen
37 Transportation > Railcar Manufacturing Operations
38 Non-Transportation > Station Space Utilization
40 Non-Transportation > Shopping Centers & Office Buildings
42 Others > Suica
44 Others > Hotel Operations / Credit Card Business
45 Column: JRE POINT / JR East Dynamic Rail Pack
46 To Achieve Sustainable Growth 46 Pursuing “Extreme Safety Levels”
49 Service Quality Reforms
50 Technological Innovation > Environment
51 Technological Innovation > Research and Development
52 Strengthening Collaboration with Local Communities
53 Tackling New Business Areas
54 Developing Employees and Creating a Corporate Culture
that Maximizes Human Potential
56 Board of Directors and Corporate Auditors
58 Corporate Governance
63 Compliance
64 Organization
65 Facts and Figures 66 JR East: Domestic and International Perspectives
75 Management’s Discussion and Analysis of
Financial Condition and Results of Operations
79 Operational and Other Risk Information
84 Consolidated Financial Statements
89 Notes to Consolidated Financial Statements
108 Independent Auditor’s Report
109 Glossary
110 Consolidated Subsidiaries and
Equity-Method Affiliated Companies
112 Corporate Data
113 Further Information about JR East

Thriving with Communities,
Growing GloballyThe Great East Japan Earthquake poignantly reminded us of the fact
that companies cannot thrive without sound and vibrant communities.
The East Japan area, our home ground, and Japan as a whole currently face
a host of issues. As a corporate citizen, we are determined to fulfill our mission
and execute businesses unique to the JR East Group in an effort to help solve
those issues. The goal is to draw a blueprint for the future together with
members of the community as we do our part to build vibrant communities.
However, taking root in communities does not mean becoming complacent by
turning inward. To continue to fulfill our mission, we must constantly transform
ourselves and achieve growth. We must look outward and step out into the world,
while actively seeking knowledge and technology externally. We believe that doing
so will provide fertile ground for capturing new growth opportunities. To unlock
our full potential, we must boldly step out into the world.
1Annual Report 2016

Our History
1991
Operating Revenues
¥2,107.0billion
Operating Income
¥297.8billion
2001
Operating Revenues
¥2,546.0billion
Operating Income
¥323.8billion
2011
Operating Revenues
¥2,537.4billion
Operating Income
¥345.1billion
2016
Operating Revenues
¥2,867.2billion
Operating Income
¥487.8billion
April 1987
Establishment of JR East
December 2010
Opening of the Tohoku Shinkansen Line to Shin-Aomori
July 1992
Launch of the Yamagata Shinkansen Tsubasa service
March 1997
Launch of the Akita Shinkansen Komachi service
October 2012
Grand reopening of the Tokyo Station Marunouchi Building
November 2001
Launch of Suica
February 2002
Launch of the Station Renaissance program with
the opening of atré Ueno
March 2015
Opening of the Hokuriku Shinkansen Line to Kanazawa
Opening of the Ueno-Tokyo Line
March 2004
Start of Suica electronic money service
March 2016
Opening of the Hokkaido Shinkansen Line to
Shin-Hakodate Hokuto
March 2005
Opening of ecute Omiya
Operating Revenues
Operating Income
Transportation Non-transportation Station Space Utilization Shopping Centers & Office Buildings Others
2 East Japan Railway Company
Railway Transportation
- Railway Business, Bus Services, Railcar Manufacturing Operations
Growth drivers: Expansion and improvement of
network, enhancement of transportation quality, and
encouragement of tourism
Shopping Centers & Office Buildings
- Shopping Center Operation, Office Leasing
Growth drivers: Development of large terminal stations
and development of desirable line-side area brands
Station Space Utilization
- Retailing, Restaurants in Stations
Growth drivers: Maximization of railway stations’
value through creation of appealing commercial
spaces and reinvigoration of regional industry
Others
- Advertising, Hotel Operations, Credit Card Business, etc.
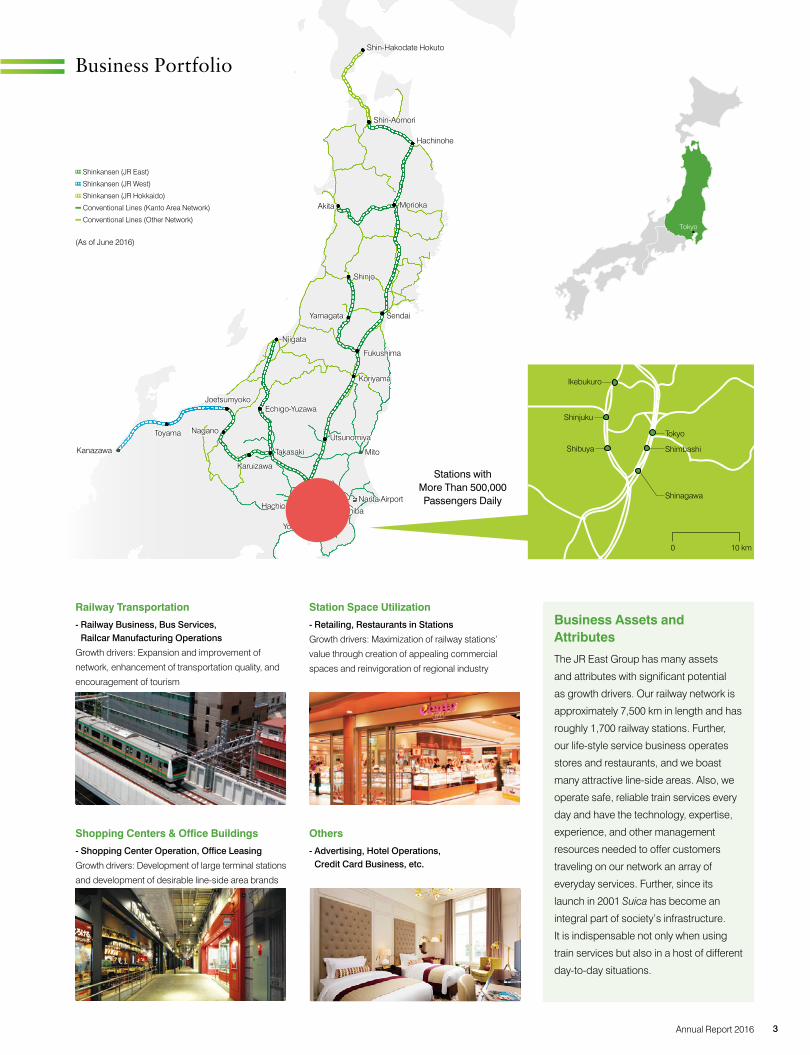
Business Portfolio
Business Assets and Attributes
The JR East Group has many assets
and attributes with significant potential
as growth drivers. Our railway network is
approximately 7,500 km in length and has
roughly 1,700 railway stations. Further,
our life-style service business operates
stores and restaurants, and we boast
many attractive line-side areas. Also, we
operate safe, reliable train services every
day and have the technology, expertise,
experience, and other management
resources needed to offer customers
traveling on our network an array of
everyday services. Further, since its
launch in 2001 Suica has become an
integral part of society’s infrastructure.
It is indispensable not only when using
train services but also in a host of different
day-to-day situations.
Shin-Hakodate Hokuto
Shin-Aomori
Hachinohe
Morioka
Sendai
Shinjo
Yamagata
Niigata
Akita
Fukushima
Koriyama
Echigo-YuzawaJoetsumyoko
Toyama Nagano
Karuizawa
Kanazawa Takasaki Mito
Utsunomiya
Omiya
Narita AirportTokyoHachioji
Yokohama
Chiba
Tokyo
Shibuya
Shinjuku
Ikebukuro
0 10 km
Shimbashi
Shinagawa
Stations with More Than 500,000 Passengers Daily
Tokyo
(As of June 2016)
Shinkansen (JR East)
Shinkansen (JR West)
Shinkansen (JR Hokkaido)
Conventional Lines (Kanto Area Network)
Conventional Lines (Other Network)
3Annual Report 2016

Risks and Opportunities
Changes in Business ConditionsIn Japan, economic conditions promise to recover modestly as the employment market and personal income continue to improve and the benefits of
government policies emerge. Over the medium-to-long term, Japan’s population is expected to decline, age, and concentrate in cities at an acceler-
ated pace. At the same time, technological innovation, globalization, and demand from visitors to Japan are likely to increase.
Japan’s DemographicsIn Japan, population decline and the population’s concentration in cities will advance. Further, in eastern Japan the working-age population is decreas-
ing. By 2020, the elderly will account for approximately 30% of Japan’s population. These trends will significantly affect the businesses of the JR East
Group, particularly its railway business.
10 11 12 13 14 15 16 17 18 19 20 21 22 23 24 25
102
100
98
96
94
92
90
Total Population of Japan %
(Comparison scale: Year 2010=100)
Source: Population projection for Japan, National Institute of Population and Social Security Research, Jan. 2012. Population projection for prefectures, National Institute of Population and Social Security Research, Mar. 2013.
Nationwide (2012 estimate) Tokyo metropolitan area (2013 estimate)
87 88 89 90 91 92 93 94 95 96 97 98 99 00 01 02 03 04 05 06 07 08 09 10 11 12 151413
200,000
150,000
100,000
50,000
0
–50,000
Net Migration in the Three Major Metropolitan Areas Number of net migration
Source: Report on Internal Migration in Japan, Ministry of Internal Affairs and Communications, Apr. 2016.
Tokyo metropolitan area Nagoya metropolitan area Osaka metropolitan area
Year
Year
4 East Japan Railway Company

Expansion of the Overseas Railway MarketThe overseas railway market is expected to see average annual growth of 2.5% and account for revenues ¥22 trillion by 2020.
Asia-Pacific
¥6.3 trillion
The Commonwealth of
Independent States (CIS)
¥2.6 trillion
The United States,
Canada, and Mexico
¥3.7 trillion
Americas(excluding the United States,
Canada, and Mexico)
¥0.9 trillion
Western Europe
¥6.1 trillion
Eastern Europe
¥1.4 trillion
Middle East and Africa
¥1.0 trillion
Increase in Tourists Visiting JapanIn 2015, 19.7 million tourists visited Japan, up 47% year on year. Further,
the government’s “Council for the Development of a Tourism Vision to
Support the Future of Japan” has set out as targets for the number of
tourists visiting Japan of 40 million by 2020 and 60 million by 2030. Also,
the council aims to increase spending by such tourists to ¥8 trillion by
2020 and ¥15 trillion by 2030.
Visitors to Japan Millions
Competition with Other CompaniesThe JR East’s railway business competes with other railway operators and
other modes of transportation, such as aircraft, automobiles, and buses.
Intensified competition in the transportation market arising from the
advancement of large-scale improvement work by other companies in the
Tokyo metropolitan area, an increase in low-cost airlines’ routes, or lower
expressway tolls could affect the earnings of the JR East’s railway business.
Competition with Airlines
Distance from Tokyokm
Time Required JR Share%
Aomori 713.7 2:59 78
Akita 662.6 3:37 60
Morioka 535.3 2:10 100
Sendai 351.8 1:30 100
Yamagata 359.9 2:26 97
Niigata 333.9 1:37 100
Kanazawa 450.5 2:28 76
Note: Data shown here is as of March 31, 2016. Information concerning required time is according to the JR Time Table, June 2016 issue. Market shares of trains and flights are calculated based on the number of flight departures and arrivals at Haneda Airport. Approximate time required for trains is indicated using the maximum speed of a regularly-operated train from Tokyo.
Source: UNIFE Worldwide Rail Market Study
03 12 13 14 15 20 30
70
60
50
40
30
20
10
0
Start of Visit Japan Campaign
Year
(Target)
(Target)
Source: Japan National Tourism Organization
5Annual Report 2016

Our Calling
Thriving with Communities,
The JRCustomers
Local Communities and Society
Eternal Mission
Strengthening collaboration with local communities
Supporting earthquake recovery, stimulating tourism, and revitalizing communities
Service quality reformsEnhancing railway transportation networks and other measures
Pursuing “extreme safety levels”Building a railway capable of withstanding natural disasters
Through the experience of the Great East Japan Earthquake, gained a real sense of our ties to local
communities and the expectations of society
6 East Japan Railway Company

Growing Globally
Sustained Growth
East Group
Shareholders and
Investors
Employees
Pursuing Unlimited PotentialTechnological innovation
Forging strategies for conserving energy and the environment, utilizing ICT (information and communication technology), and
operating Shinkansen at faster speeds
Tackling new business areasGlobalization
Developing employees and creating a corporate culture that
maximizes human potential
Our slogan for sustaining growth amid the volatility since the Great East Japan Earthquake
7Annual Report 2016

Financial HighlightsEast Japan Railway Company and SubsidiariesYears ended March 31
Millions of Yen Millions of U.S. Dollars *6
(except for Per share data, Ratios, Number of consolidated subsidiaries, and Number of employees) YoY Change % (except for Per share data)
2006 2007 2008 2009 2010 2011 2012 2013 2014 2015 2016 2016 / 2015 2016
Operating results Operating revenues ¥2,592,393 ¥2,657,346 ¥2,703,564 ¥2,697,000 ¥2,573,724 ¥2,537,353 ¥2,532,174 ¥2,671,823 ¥2,702,917 ¥2,756,165 ¥2,867,200 4.0% $25,373 Operating expenses 2,196,293 2,229,248 2,258,404 2,264,445 2,228,875 2,192,266 2,172,149 2,274,260 2,296,123 2,328,643 2,379,379 2.2% 21,056 Operating income 396,100 428,098 445,160 432,555 344,849 345,087 360,025 397,563 406,794 427,522 487,821 14.1% 4,317 Profit attributable to owners of parent 157,575 175,871 189,673 187,291 120,214 76,224 108,738 175,385 199,940 180,398 245,310 36.0% 2,171 Comprehensive income *1 N/A N/A N/A N/A N/A 73,644 109,304 197,740 214,632 229,293 217,419 –5.2% 1,924Segment information Operating revenues from outside customers: Transportation 1,805,406 1,825,387 1,857,756 1,831,933 1,757,994 1,721,922 1,705,794 1,809,554 1,827,467 1,852,040 1,954,588 5.5% 17,297 Station Space Utilization 383,904 399,998 404,006 415,020 387,104 385,891 396,168 404,207 400,948 396,368 399,960 0.9% 3,540 Shopping centers & office buildings 190,466 197,140 205,347 222,628 226,932 223,293 229,637 238,945 251,070 254,997 255,979 0.4% 2,265 Others 212,617 234,821 236,455 227,419 201,694 206,247 200,575 219,117 223,432 252,760 256,673 1.5% 2,271 Total 2,592,393 2,657,346 2,703,564 2,697,000 2,573,724 2,537,353 2,532,174 2,671,823 2,702,917 2,756,165 2,867,200 4.0% 25,373Financial position Total assets 6,821,584 6,968,032 6,942,003 6,965,793 6,995,494 7,042,900 7,060,409 7,223,205 7,428,304 7,605,690 7,789,762 2.4% 68,936 Interest-bearing debt 3,681,192 3,574,822 3,535,343 3,429,871 3,394,970 3,433,010 3,340,233 3,307,483 3,288,401 3,275,523 3,241,979 –1.0% 28,690 Shareholders’ equity *2 1,357,359 1,488,554 1,596,398 1,718,587 1,780,584 1,809,355 1,874,404 2,030,666 2,180,633 2,285,658 2,442,129 6.8% 21,611Cash flows Cash flows from operating activities 447,722 541,850 475,601 584,360 479,180 508,846 558,650 588,529 562,764 622,762 673,110 8.1% 5,957 Cash flows from investing activities (309,489) (348,800) (400,789) (396,796) (391,682) (433,179) (370,685) (465,952) (474,698) (476,844) (499,575) 4.8% (4,421) Cash flows from financing activities (141,599) (172,027) (80,407) (159,238) (115,327) (27,512) (152,428) (101,151) (91,367) (86,636) (110,266) 27.3% (976)Per share data *3
Earnings 39,370 44,008 47,464 469 303 193 275 444 507 459 626 36.4% 6 Shareholders’ equity *2 339,599 372,493 399,483 4,301 4,501 4,574 4,739 5,136 5,529 5,818 6,232 7.1% 55 Cash dividends *4 8,000 9,000 10,000 110 110 110 110 120 120 120 130 8.3% 1Ratios Profit attributable to owners of parent as a percentage of revenues 6.1 6.6 7.0 6.9 4.7 3.0 4.3 6.6 7.4 6.5 8.6 Return on average equity (ROE) 12.4 12.4 12.3 11.3 6.9 4.2 5.9 9.0 9.5 8.1 10.4 Ratio of operating income to average assets (ROA) 5.9 6.2 6.4 6.2 4.9 4.9 5.1 5.6 5.6 5.7 6.3 Equity ratio 19.9 21.4 23.0 24.7 25.5 25.7 26.5 28.1 29.4 30.1 31.4 Interest-bearing debt to shareholders’ equity 2.7 2.4 2.2 2.0 1.9 1.9 1.8 1.6 1.5 1.4 1.3 Interest coverage ratio 3.2 4.2 3.8 4.8 4.2 4.8 5.5 6.2 6.3 7.6 8.8 Interest-bearing debt / Net cash provided by operating activities 8.2 6.6 7.4 5.9 7.1 6.7 6.0 5.6 5.8 5.3 4.8 Dividend payout ratio 20.3 20.5 21.1 23.5 36.3 57.1 40.0 27.0 23.7 26.1 20.8 Other data Depreciation 316,038 318,526 335,587 343,101 356,365 366,415 358,704 346,808 348,042 353,251 359,515 1.8% 3,182 Capital expenditures *5 361,372 413,310 417,144 402,582 434,754 425,835 370,199 480,717 525,708 522,127 541,949 3.8% 4,796 Interest expense 136,548 131,376 126,047 120,395 112,596 105,918 101,073 95,312 88,279 81,962 76,332 –6.9% 676 Number of consolidated subsidiaries (As of March 31) 86 85 82 82 73 75 72 72 73 72 67 Number of employees 72,802 71,316 72,214 72,550 71,854 71,749 71,729 73,017 73,551 73,329 73,053 Electric power: Independent (Billions of kWh) 3.5 3.4 3.5 3.5 3.4 3.5 3.4 3.3 3.3 3.3 3.3 Electric power: Purchased (Billions of kWh) 2.8 2.7 2.7 2.7 2.7 2.6 2.4 2.6 2.6 2.6 2.5
*1 Accounting Standard for Presentation of Comprehensive Income was adopted beginning the year ended March 31, 2011.*2 Shareholders’ equity equals total net assets less non-controlling interests beginning with the year ended March 31, 2007 (as in the balance sheets).*3 JR East implemented a stock split at a ratio of 100 shares for 1 share of common stock with an effective date of January 4, 2009. Per share data for fiscal 2009 reflects the stock split.*4 The total amount of dividends for the year ended March 31 comprises interim dividends for the interim period ended September 30 and year-end dividends for the year ended March 31,
which were decided at the annual shareholders’ meetings in June.*5 These figures exclude expenditures funded by third parties, mainly governments and their agencies, which will benefit from the resulting facilities.*6 Yen figures have been translated into U.S. dollars, solely for the convenience of readers, at the rate of ¥113 to U.S.$1, the prevailing exchange rate at March 31, 2016.
Average Stock Price*3
(Calculated quarterly using closing prices)
Hundreds of Yen
2016 FY20152014201320122011201020092008200720060
12,000
10,000
8,000
6,000
4,000
2,000
0
12,000
10,000
8,000
6,000
4,000
2,000
0
12,000
10,000
8,000
6,000
4,000
2,000
Yen
8 East Japan Railway Company

Millions of Yen Millions of U.S. Dollars *6
(except for Per share data, Ratios, Number of consolidated subsidiaries, and Number of employees) YoY Change % (except for Per share data)
2006 2007 2008 2009 2010 2011 2012 2013 2014 2015 2016 2016 / 2015 2016
Operating results Operating revenues ¥2,592,393 ¥2,657,346 ¥2,703,564 ¥2,697,000 ¥2,573,724 ¥2,537,353 ¥2,532,174 ¥2,671,823 ¥2,702,917 ¥2,756,165 ¥2,867,200 4.0% $25,373 Operating expenses 2,196,293 2,229,248 2,258,404 2,264,445 2,228,875 2,192,266 2,172,149 2,274,260 2,296,123 2,328,643 2,379,379 2.2% 21,056 Operating income 396,100 428,098 445,160 432,555 344,849 345,087 360,025 397,563 406,794 427,522 487,821 14.1% 4,317 Profit attributable to owners of parent 157,575 175,871 189,673 187,291 120,214 76,224 108,738 175,385 199,940 180,398 245,310 36.0% 2,171 Comprehensive income *1 N/A N/A N/A N/A N/A 73,644 109,304 197,740 214,632 229,293 217,419 –5.2% 1,924Segment information Operating revenues from outside customers: Transportation 1,805,406 1,825,387 1,857,756 1,831,933 1,757,994 1,721,922 1,705,794 1,809,554 1,827,467 1,852,040 1,954,588 5.5% 17,297 Station Space Utilization 383,904 399,998 404,006 415,020 387,104 385,891 396,168 404,207 400,948 396,368 399,960 0.9% 3,540 Shopping centers & office buildings 190,466 197,140 205,347 222,628 226,932 223,293 229,637 238,945 251,070 254,997 255,979 0.4% 2,265 Others 212,617 234,821 236,455 227,419 201,694 206,247 200,575 219,117 223,432 252,760 256,673 1.5% 2,271 Total 2,592,393 2,657,346 2,703,564 2,697,000 2,573,724 2,537,353 2,532,174 2,671,823 2,702,917 2,756,165 2,867,200 4.0% 25,373Financial position Total assets 6,821,584 6,968,032 6,942,003 6,965,793 6,995,494 7,042,900 7,060,409 7,223,205 7,428,304 7,605,690 7,789,762 2.4% 68,936 Interest-bearing debt 3,681,192 3,574,822 3,535,343 3,429,871 3,394,970 3,433,010 3,340,233 3,307,483 3,288,401 3,275,523 3,241,979 –1.0% 28,690 Shareholders’ equity *2 1,357,359 1,488,554 1,596,398 1,718,587 1,780,584 1,809,355 1,874,404 2,030,666 2,180,633 2,285,658 2,442,129 6.8% 21,611Cash flows Cash flows from operating activities 447,722 541,850 475,601 584,360 479,180 508,846 558,650 588,529 562,764 622,762 673,110 8.1% 5,957 Cash flows from investing activities (309,489) (348,800) (400,789) (396,796) (391,682) (433,179) (370,685) (465,952) (474,698) (476,844) (499,575) 4.8% (4,421) Cash flows from financing activities (141,599) (172,027) (80,407) (159,238) (115,327) (27,512) (152,428) (101,151) (91,367) (86,636) (110,266) 27.3% (976)Per share data *3
Earnings 39,370 44,008 47,464 469 303 193 275 444 507 459 626 36.4% 6 Shareholders’ equity *2 339,599 372,493 399,483 4,301 4,501 4,574 4,739 5,136 5,529 5,818 6,232 7.1% 55 Cash dividends *4 8,000 9,000 10,000 110 110 110 110 120 120 120 130 8.3% 1Ratios Profit attributable to owners of parent as a percentage of revenues 6.1 6.6 7.0 6.9 4.7 3.0 4.3 6.6 7.4 6.5 8.6 Return on average equity (ROE) 12.4 12.4 12.3 11.3 6.9 4.2 5.9 9.0 9.5 8.1 10.4 Ratio of operating income to average assets (ROA) 5.9 6.2 6.4 6.2 4.9 4.9 5.1 5.6 5.6 5.7 6.3 Equity ratio 19.9 21.4 23.0 24.7 25.5 25.7 26.5 28.1 29.4 30.1 31.4 Interest-bearing debt to shareholders’ equity 2.7 2.4 2.2 2.0 1.9 1.9 1.8 1.6 1.5 1.4 1.3 Interest coverage ratio 3.2 4.2 3.8 4.8 4.2 4.8 5.5 6.2 6.3 7.6 8.8 Interest-bearing debt / Net cash provided by operating activities 8.2 6.6 7.4 5.9 7.1 6.7 6.0 5.6 5.8 5.3 4.8 Dividend payout ratio 20.3 20.5 21.1 23.5 36.3 57.1 40.0 27.0 23.7 26.1 20.8 Other data Depreciation 316,038 318,526 335,587 343,101 356,365 366,415 358,704 346,808 348,042 353,251 359,515 1.8% 3,182 Capital expenditures *5 361,372 413,310 417,144 402,582 434,754 425,835 370,199 480,717 525,708 522,127 541,949 3.8% 4,796 Interest expense 136,548 131,376 126,047 120,395 112,596 105,918 101,073 95,312 88,279 81,962 76,332 –6.9% 676 Number of consolidated subsidiaries (As of March 31) 86 85 82 82 73 75 72 72 73 72 67 Number of employees 72,802 71,316 72,214 72,550 71,854 71,749 71,729 73,017 73,551 73,329 73,053 Electric power: Independent (Billions of kWh) 3.5 3.4 3.5 3.5 3.4 3.5 3.4 3.3 3.3 3.3 3.3 Electric power: Purchased (Billions of kWh) 2.8 2.7 2.7 2.7 2.7 2.6 2.4 2.6 2.6 2.6 2.5
*7 Pursuant to an amendment of the Japanese Tax Law, from the year ended March 31, 2008, a depreciation method based on the amended Japanese Tax Law has been used for property, plant and equipment acquired on or after April 1, 2007. Further, for property, plant and equipment acquired on or before March 31, 2007, from the fiscal year following the fiscal year in which assets reach 5% of acquisition cost through the application of a depreciation method based on the Japanese Tax Law prior to amendment, the difference between the amount equivalent to 5% of the acquisition cost and the memorandum value (residual value under the amended Japanese Tax Law) is depreciated evenly over a five-year period and recognized in depreciation.
Long-Term Credit Rating
Rating agency Rating
Moody’s Aa3 [Stable]
Standard & Poor’s (S&P) AA– [Stable]
Rating & Investment Information (R&I)
AA+ [Stable]
2016 FY20152014201320122011201020092008200720060
12,000
10,000
8,000
6,000
4,000
2,000
0
12,000
10,000
8,000
6,000
4,000
2,000
0
12,000
10,000
8,000
6,000
4,000
2,000
Yen
9Annual Report 2016

Selected Financial DataEast Japan Railway Company and SubsidiariesYears ended March 31
2006 2007 2008 2009 2010 2011 2012 2013 2014 2015 2016
17.0
2,867.2
487.8
4,000
2,000
3,000
1,000
0
20
10
15
5
0
800
400
600
200
0
673.1
173.5
2006 2007 2008 2009 2010 2011 2012 2013 2014 2015 2016
Operating Revenues, Operating Income, and Ratio of Operating Income to Operating RevenuesBillions of Yen %
Cash Flows from Operating Activities and Free Cash FlowsBillions of Yen
Earnings per Share and Cash Flows from Operating Activities per Share*Yen
Operating revenues (left) Operating income (left) Ratio of operating income to operating revenues (right)
Cash flows from operating activities Free cash flows
Earnings per share Cash flows from operating activities per share
* JR East implemented a stock split at a ratio of 100 shares for 1 share of common stock with an effective date of January 4, 2009. Earnings per share and cash flows from operating activities per share from 2005 to 2008 have been calculated based on the supposition that the stock split was implemented at the beginning of each year.
15
12
6
9
3
0 2006 2007 2008 2009 2010 2011 2012 2013 2014 2015 2016
6.3
10.4
Return on Average Equity (ROE) and Ratio of Operating Income to Average Assets (ROA)%
Return on average equity (ROE) Ratio of operating income to average assets (ROA)
1,800
1,500
900
1,200
600
300
0 2006 2007 2008 2009 2010 2011 2012 2013 2014 2015 2016
626
1,717
10 East Japan Railway Company

Operating revenues Operating income
Operating revenues Operating income Operating revenues Operating income Operating revenues Operating income
0 0 0
0
250 150 150
1,000
500 300 300
2,000
2012
2013
2014
2015
2016
2017 (Forecast)
2012
2013
2014
2015
2016
2017 (Forecast)
2012
2013
2014
2015
2016
2017 (Forecast)
2012
2013
2014
2015
2016
2017 (Forecast)
Operating Revenues and Operating IncomeBillions of Yen
Operating Revenues and Operating IncomeBillions of Yen
Operating Revenues and Operating IncomeBillions of Yen
Operating Revenues and Operating IncomeBillions of Yen
Operating Revenues Operating Income
400.0
402.0
35.1
33.0
71.6 35.0
75.0 35.0
256.0 256.7
274.0 251.0
(For the year ended March 31, 2016)
Transportation Station Space Utilization Shopping Centers & Office Buildings Others
STATION SPACE UTILIZATION OTHERS
TRANSPORTATION
SHOPPING CENTERS & OFFICE BUILDINGS
348.6
308.0
1,951.0
1,954.6
¥2,867.2 billion
¥487.8 billion
68.2% 71.1%7.2%
14.6%
7.1%
13.9%
8.9%
9.0%
11Annual Report 2016
Principal Businesses
Retailing:
Retailing activities, such as kiosk outlets,
convenience stores, and ecute shopping
centers at railway stations and sales of snacks,
drinks, and other goods inside trains
Restaurants:
Fast-food restaurants and a variety of other
restaurants operated mainly at or near railway
stations
Principal Businesses
Shopping Centers:
Development and leasing of space to retailers
and other tenants in shopping centers at
railway stations
Office Buildings:
Development and operation of buildings used
primarily as office space
Principal Businesses
Suica:
Electronic money that enables rapid payment
inside and outside railway stations
Hotel Operations:
Chain hotel businesses, including Metropolitan
Hotels and HOTEL METS, operated as part of
the JR East Hotel Chain
Advertising and Publicity:
Advertising and publicity in railway stations
and in and on railcars

600
500
300
400
200
100
0 2006 2007 2008 2009 2010 2011 2012 2013 2014 2015 2016
541.9
359.5
Capital Expenditures and DepreciationBillions of Yen
Capital expenditures Depreciation
Selected Financial DataEast Japan Railway Company and SubsidiariesYears ended March 31
2006 2007 2008 2009 2010 2011 2012 2013 2014 2015 2016
1.3
3,242.0
4,000
2,000
3,000
1,000
0
4
2
3
1
0
2006 2007 2008 2009 2010 2011 2012 2013 2014 2015 2016
2,442.1
7,789.8
31.4
8,000
4,000
6,000
2,000
0
40
20
30
10
0
2006 2007 2008 2009 2010 2011 2012 2013 2014 2015 2016
51.0
30.0
33.0100
75
25
50
0
40
30
10
20
0
Interest-Bearing Debt and Interest-Bearing Debt to Shareholders’ EquityBillions of Yen Times
Total Assets, Shareholders’ Equity, and Equity RatioBillions of Yen %
Cash Dividends, Share Buybacks, and Total Return RatioBillions of Yen %
Total assets (left) Shareholders’ equity (left) Equity ratio (right)
Interest-bearing debt (left) Interest-bearing debt to shareholders’ equity (right)
Cash dividends (left) Share buybacks (left) Total return ratio (right)
12 East Japan Railway Company

Stock Information
0
5,000
10,000
15,000
Stock Price (Stock Code: 9020)Yen
Major Shareholders
As of March 31, 2016Number of Shares Held
(Shares)Voting Right Percentage
(%)
Mizuho Bank, Ltd. 19,300,000 4.92
Japan Trustee Services Bank, Ltd. (as Trustee) 12,715,900 3.24
The Master Trust Bank of Japan, Ltd. (as Trustee) 12,613,100 3.22
The Bank of Tokyo-Mitsubishi UFJ, Ltd. 12,520,315 3.19
Sumitomo Mitsui Banking Corporation 10,530,315 2.69
The JR East Employees Shareholding Association 10,298,400 2.63
Nippon Life Insurance Company 8,015,560 2.04
The Dai-ichi Life Insurance Company, Limited 8,000,000 2.04
STATE STREET BANK AND TRUST COMPANY 6,198,370 1.58
GIC PRIVATE LIMITED 5,467,900 1.39
Note: Japan Trustee Services Bank, Ltd., and The Master Trust Bank of Japan, Ltd., hold all shares as trustee.
0
Stock price JR East average stock price
2Q 3Q 4Q2009
1Q 2Q 3Q 4Q2010
1Q 2Q 3Q 4Q2011
1Q 2Q 3Q 4Q2012
1Q 2Q 3Q 4Q2013
1Q 2Q 3Q 4Q2014
1Q 2Q 3Q 4Q2015
1Q2016
13Annual Report 2016

A Message from the Management
SATOSHI SEINOChairman
TETSURO TOMITAPresident and CEO
Group Philosophy
The JR East Group aims to contribute to the growth and
prosperity of the East Japan area by providing quality leading-edge services,
with train station and railway businesses at its core,
to customers and communities.
We will continue to embrace the challenge of pursuing “extreme safety levels”
and service quality reforms. Through technological innovation and globalization,
we will strive to attain goals such as nurturing personnel with an expansive
perspective, spurring the advancement of railways, and making line-side areas
more attractive and convenient. To this end, JR East will continue
to rigorously pursue its unlimited potential.
We aim to grow continuously while meeting our social responsibilities
as a Trusted Life-Style Service Creating Group.
14 East Japan Railway Company
We would like to thank our shareholders and
other investors sincerely for their remarkable support.
In the year ended March 31, 2016, the Japanese economy improved in such areas as employment and
income conditions and continued to recover gradually. Under these conditions, and guided by “JR East Group
Management Vision V—Ever Onward,” the East Japan Railway Company and its consolidated subsidiaries and
equity-method affiliated companies (JR East) steadily executed various initiatives centered around the railway
and life-style service businesses, as well as Suica operations.
As a result, during the fiscal year under review, operating revenues increased 4.0%, to ¥2,867.2 billion, and
operating income increased 14.1%, to ¥487.8 billion, mainly due to growth in JR East’s transportation revenues
primarily from Shinkansen revenues. Further, mainly due to a decrease in interest expense, and profit attributable
to owners of parent increased 36.0%, to ¥245.3 billion.
As employment and income conditions continue improving, the Japanese economy is expected to trend
toward gradual recovery, in part due to the effect of various government initiatives. Medium-to-long-term
projections include further decreases in population and further aging of society, concentration of population
on the Tokyo metropolitan area, technological innovation, advances in globalization, and a rise in demand
from tourists visiting Japan.
Amid these economic conditions, as it approaches the 30th anniversary of its establishment, the JR East
Group faces a range of different “change points,” such as the transition to the next generation of employees,
the increasingly flat division of work with respect to which the JR East Group and partner companies share
responsibilities and roles, and the operation of trains at higher speeds and the introduction of the direct-through
operation of trains accompanying changes in systems.
To respond appropriately to these changes, in October 2012 the JR East Group formulated a management
vision entitled “JR East Group Management Vision V—Ever Onward” and set forth a management policy for
“Thriving with Communities, Growing Globally.” Based on this, the Group has made efforts to meet the expecta-
tions of customers and local communities by fulfilling its “Eternal Mission” and taking on the ongoing challenge of
“Pursuing Unlimited Potential.” Every year, JR East has reviewed the progress under “Priority Initiatives Going
Forward” and updated its initiatives. These are initiatives that JR East will work particularly hard to advance in the
future with a view to accelerating the realization of “JR East Group Management Vision V—Ever Onward.” This
year, JR East will focus on improving the safety and reliability of transportation.
We will do our utmost to realize sustainable growth and satisfy our shareholders and other investors in the
medium-to-long term. As we pursue this management goal, we would like to ask our shareholders and other
investors for their continued support and understanding.
August 2016
Chairman President and CEO
15Annual Report 2016

Interview with the President
TETSURO TOMITAPresident and CEO
We will achieve tangible results by continuing concerted efforts focused on
two important pillars: realizing our “Eternal Mission” and “Pursuing Unlimited
Potential” in accordance with “JR East Group Management Vision V.”
Also, through the concrete action of each employee as well as teamwork, we aim
to realize our commitment to “Thriving with Communities, Growing Globally.”
East Japan Railway Company16

Having reached the 30th year since our establishment, I think this is an
appropriate point at which to reexamine where we stand. The aging of
society and the concentration of the population in cities are becoming
more marked. Further, Japan’s overall growth potential is weakening.
Meanwhile, a large wave of technological innovation, the so-called fourth
industrial revolution, is approaching, and economic activities are global-
izing. Given the unprecedented conditions that we are facing, I think we
need to reconfirm fundamentals. At the same time, we have to respond
to changing conditions and prepare for the future. Through to 2020 and
beyond will be an extremely important period for the JR East Group.
Our starting point was the privatization of Japanese National Railways
(JNR) almost 30 years ago. Recognizing that we are a private company
providing public services in the form of train services and that the ser-
vices we provide are technology-based, we will reexamine our current
status. In these efforts, safety will be our highest management priority.
Safety underpins everything we do, and I believe it is extremely important
that each employee views safety as their responsibility rather than some-
one else’s and performs all common tasks properly. With this in mind, we
will establish systems for advancing measures to reinforce each employ-
ee’s capabilities. Specifically, we need to conduct practical training
rigorously and renew and increase training facilities. Further, I want to
have individual employees understand the practical ramifications of each
component of their jobs. To this end, we will revise teaching materials
with a view to explaining why certain procedures are needed, what would
happen if they were not implemented, and what we have learned from
past experience. In this way, I want to further cultivate professionalism
and a strong awareness of safety among employees.
Increasingly, our operations are dependent upon the capabilities of
partner companies and Group companies. In other words, the division
of responsibility for operations is becoming increasingly horizontal. As a
result, concerted efforts among JR East, Group companies, and partner
companies to upgrade safety-related technological capabilities across
the Group are critical. Therefore, personnel exchanges are needed at
a range of different employee ranks. Further, I want to encourage open
communication within the Group by sharing information on and discuss-
ing areas of danger and other risks. In addition, physical infrastructure
measures are, of course, extremely important. For this reason, we are
continuing seismic reinforcement work. However, new problems are
arising due to such factors as the operation of Shinkansen at higher
speeds. Responding to such problems calls for additional capital invest-
ment and the strengthening of aged facilities.
Raising safety to a level that gives customers peace of mind is an
important theme. To give customers peace of mind based on assured
safety, we will rigorously ensure that each employee conducts operations
based on a commitment to pursuing ultimate safety levels, considering
what they should do, and fulfilling their duties.
Question 1 What is the JR East Group’s approach to ensuring safe and reliable transportation?
- As we near our 30th anniversary, we will return to our starting point and through the actions of all Group
employees build safety, our highest management priority.
- By focusing on the fundamentals—ensuring safety and enhancing the quality of railway transportation
services—we want to give customers peace of mind based on assured safety.
Question 1-2 What is your approach to enhancing safety and service quality?
When considering peace of mind based on assured safety, it is very
important to think about how to heighten service quality. With meeting
safety requirements as a major premise, we have to upgrade service
quality. Every fall, we conduct a customer satisfaction survey. Looking at
the results, compared with other railway operators in Japan, transporta-
tion reliability is our main weakness. I think railway station facilities, railcar
facilities, and employees’ attitude toward customers have improved to
a certain level. However, customers evaluated us harshly and indicated
that we have significant scope for improvement with regard to transpor-
tation reliability, the provision of information to customers when transpor-
tation service disruptions occur, and the restoration of timetabled
services following such disruptions.
The provision of reliable transportation services begins with each
employee performing their duties properly. Since 2015, there has been a
series of significant accidents and incidents that have led to transporta-
tion service disruptions. We will check whether we are consistently taking
17Annual Report 2016

Interview with the President
As a private company, generating earnings is important. To grow earnings,
we have to be hungrier and step up the pace of measures. In fiscal 2016,
our business results were comparatively favorable. At times like these,
complacency is a danger. Treading water lowers employee morale and saps
a company’s vitality. To grow amid today’s dramatically changing business
conditions, companies must aim for ambitious goals rather than preserve
the status quo. Also, such goals contribute greatly to employees’ job
satisfaction. I want us to believe in our own potential and strengthen
our appetite for taking on initiatives that will generate more earnings.
For example, we will take advantage of our high-speed railway
network centered on Shinkansen service to create new passenger flows.
In the first fiscal year following the extension of the Hokuriku Shinkansen
Line, total passenger traffic, including airline passengers, between the
Tokyo metropolitan area and Kanazawa / Toyama rose approximately 1.6
times year on year, from approximately 5 million passengers to 8 million
passengers. Initially, we set an ambitious target, seeking to increase total
passenger traffic 2.0 times, to 10 million. In reality, however, total pas-
senger traffic grew 1.6 times. Nonetheless, we are steadily nearing our
goal. Rather than simply having customers use Shinkansen services
instead of aircraft, our goal is to increase overall passenger flows,
thereby invigorating regional economies and energizing local communi-
ties. Further, significant potential remains that we can unearth by promot-
ing Toyama and Kanazawa as well as areas beyond these destinations,
such as Fukui and the Noto Peninsula, and by encouraging passenger
flows across a wide area that includes the surrounding prefectures,
such as Niigata, Nagano, and Gifu. We are committed to working in
preventive measures established in response to these accidents and
incidents and reiterate the importance of preventive measures where
necessary. These efforts will include JR East, Group companies, and
partner companies. Specifically, we are implementing countermeasures
based on lessons learned from past experience, including severed
overhead wires, incinerated cables, and railcar and railcar door failures.
However, we need to check again where problems actually remain and
revise countermeasures accordingly. Also, to increase our ability to
respond during transportation service disruptions, we need training
based on specific scenarios. To minimize the effect of transportation
service disruptions, we use contingency shuttle and alternative line
operations. However, we have to enhance these measures even further.
At the same time, through simulation training, we must hone our ability to
provide customers with accurate guidance information in a timely manner.
I think our greatest responsibility and task is to meet the expectations
of customers and give them peace of mind based on assured safety by
increasing efforts aimed at ensuring safe and reliable transportation. We
must satisfy fundamental requirements by ensuring safety and enhanc-
ing the quality of railway transportation services.
Question 2 What priority management measures will the JR East Group tackle?
- We aim to use the expansion of our railway network that has resulted from such initiatives as the opening of the
Hokkaido Shinkansen Line, the extension of the Hokuriku Shinkansen Line, and the opening of the Ueno-Tokyo
Line to grow inter-regional railway travel.
- In the life-style service business, we will accelerate the realization of projects with our sights set on the next five
years as well as the coming decade.
18 East Japan Railway Company

partnership with local communities to grow passenger flows with a view
to boosting total passenger traffic between the Tokyo metropolitan area
and the Hokuriku region to 10 million passengers.
Also, we want to increase passenger flows between the Tokyo metro-
politan area and southern Hokkaido and between the Tohoku region and
southern Hokkaido by exploiting the Hokkaido Shinkansen Line, which
opened in March 2016. From Tokyo Station to Shin-Hakodate Hokuto
Station takes about four hours. However, from Sendai Station to Shin-
Hakodate Hokuto Station only takes roughly two and a half hours. In
other words, by straddling the Tsugaru Straits, the Hokkaido Shinkansen
Line has brought the Tohoku region and southern Hokkaido much closer
together. We are keen to collaborate closely with local communities to
create appealing new tourism routes, encourage tourism from overseas,
and boost business activities. Not many visitors to Japan travel to the
Tohoku region, but many of them visit Hokkaido. We believe that we can
attract tourists from overseas to the Tohoku region by working with local
communities to create new tourism routes. For example, we can encour-
age tourists from overseas who are visiting Hokkaido to use the
Hokkaido Shinkansen and Tohoku Shinkansen lines to visit Aomori,
Morioka, Sendai, and Fukushima or Yamagata and Akita and return
home via Tokyo. Another promising idea is a tourism route taking advan-
tage of the newly privatized Sendai Airport to integrate air and land trans-
portation services. Given the burgeoning potential of our high-speed
railway network centered on Shinkansen services, we intend to develop
it into a major source of earnings.
Further, revenues from conventional lines in the Tokyo metropolitan
area are the mainstay of JR East, accounting for approximately two-
thirds of its revenues from railways. Currently, as well as competition with
other modes of transportation, competition between railway operators
is becoming fiercer. In response, we aim to redouble efforts aimed at
ensuring safe and reliable transportation so that customers choose
our conventional line services. By achieving this goal, I believe we can
increase passenger flows, even in the Tokyo metropolitan area, which is
expected to see its working-age population and total population decline.
In addition, the life-style service business will play a significant role in
growing revenues. Currently, businesses other than the railway business
account for roughly one-third of the Group’s revenues, or revenues of
approximately ¥900.0 billion. Moreover, we plan to increase these
Major Projects Going Forward (as of June 2016)
(FY) 2016 2017 2018 2019 2020 2021 2022 and beyond
■ Station Space Utilization ■ Shopping Centers & Office Buildings ■ Others
Opening of Hokkaido Shinkansen Line to Shin-Hakodate Hokuto
Opening of Odasakae Station New station between Tamachi and Shinagawa
JR Shinjuku Miraina Tower (March-April 2016)
Marunouchi underground area of Tokyo Station (Summer 2017)
Development of area in and around north passage of Tokyo Station
(2020)
Sendai Station East Exit Development(March 2016-Spring 2017)
Opening of Purple Line(scheduled for August 2016)
[Bangkok, Thailand]
Haneda Airport Access Line design
Overseas projects
Main building and facilities of Chiba Station(around November 2016-Summer 2018 and beyond)
Yokohama Station West Exit Station Development Building
(provisional name)(2020)
Saitama-Shintoshin Bldg. (provisional name)(early summer 2017)
Shibuya Station Development (joint development)(FY2020 / FY2028)
Shinagawa Development
Rai
lway
Ope
ratio
nsLi
fe-S
tyle
Ser
vice
Bus
ines
s
19Annual Report 2016

Interview with the President
revenues. Until now, although we have described the railway business
and the life-style service business as the two pillars of the Group, there
has always been a sense of railways as the mainstay with life-style ser-
vices in attendance. Going forward, however, we must aim for an era in
which the life-style service business drives the growth of the railway
business. With this in mind, we intend to makes railway stations more
appealing. In doing so, the surrounding towns will become more attrac-
tive, thereby generating new passenger flows. I think the life-style service
business will play a major role in developing appealing railway stations,
increasing passenger flows, and energizing towns. We have enhanced
shopping centers, office buildings, hotels, and businesses inside railway
stations considerably, but if we fail to do anything further customers will
begin to lose interest. With our sights set five or 10 years ahead, we have
to adopt fresh approaches to developing railway stations, the areas
inside railway stations, shopping centers, office buildings, and hotels.
Fortunately, our service area includes the Tokyo metropolitan area, which
is a significant advantage, and I believe we will be able to rise to the
challenge of capitalizing on the many business opportunities that this
area offers. To put this another way, the life-style service business pro-
vides a wide range of opportunities for employees to realize their
capabilities. I would like such employees to welcome these opportuni-
ties, avoid complacency, and become more ambitious. Already, we are
redeveloping Tokyo, Shinjuku, Shibuya, Yokohama, Chiba, and Sendia
stations. However, we aim to accelerate such efforts and create further
appealing spaces.
One of the JR East Group’s major roles is to energize towns and
invigorate local communities by combining the railway and life-style
service businesses to increase passenger flows while heightening the
appeal of railway stations. By sharpening our appetite for establishing
additional revenue sources, I want to vitalize local economies and have
local communities feel that their regions are becoming energized. We
should have high aspirations as we tackle initiatives for local communi-
ties and feel privileged that we have the opportunities to do so. I think our
employees find benefiting the public makes their work enjoyable and
rewarding. Therefore, I trust that all employees will make a concentrated
effort to realize our ambitions.
20 East Japan Railway Company

As significant targets for the coming three fiscal years, we aim to achieve
operating revenues of ¥2,967.0 billion and operating income of ¥498.0
billion by fiscal 2019. We will maintain ROA at the current level of 6% and
ROE at the current level of 10%.
Over the coming three fiscal years, we will generate total consolidated
cash flows from operating activities of approximately ¥2,000.0 billion, of
which ¥1,600.0 billion is earmarked for capital investment. We want to
realize a total return ratio target of 33% by continuing to pay stable cash
dividends and using surplus funds to buyback and cancel shares. We
also want to reduce consolidated interest-bearing debt from the present
level of approximately ¥3,200.0 billion to ¥3,000.0 billion during the
2020s. Although interest rates are unprecedentedly low or even negative,
we cannot predict interest rates. Therefore, we will adhere to our existing
approach of steadily reducing debt.
Anticipating the use of cash flows five years, 10 years, and further
ahead is paramount. Of the ¥1,600.0 billion we have earmarked for
capital investment, we will invest roughly ¥1,000.0 billion in maintenance
and renewal. Further, we want to invest ¥600.0 billion of this amount in
measures aimed at ensuring safe and reliable transportation, including
seismic reinforcement measures, safety measures for platforms and
railway crossings, and disaster countermeasures. Also, during the next
three fiscal years plans call for approximately ¥600.0 billion of growth
investment, which will cover such initiatives as redeveloping railway
stations and introducing new railcars. Given that we expect consolidated
cash flows from operating activities to be comparatively plentiful for
some time to come, we want to use them in effective, farsighted ways
that will facilitate business management going forward.
We have set targets for revenues and earnings at conservative levels
because the economic outlook for Japan remains uncertain in some
respects. Further, we plan to control costs steadily. Each year roughly
3,000 employees will retire, which will reduce personnel expenses. On
the other hand, we face the problems of how to increase efficiency and
how to compensate for a shortage of manpower. We intend to respond
to the problem of growing numbers of retirees by increasing productivity
through technological innovation, outsourcing operations, and utilizing
Group companies and partner companies. While personnel expenses
are decreasing, outsourcing expenses are rising slightly. Despite this
increase, we are confident that we can reduce total personnel expenses
and outsourcing expenses steadily. Although we have set a conservative
target for revenues, I think that we will be able to generate stable operat-
ing income by controlling costs steadily. In-house, I am urging employ-
ees to aim higher because the revenue target represents the lowest limit.
In addition, I am calling on the life-style service business to increase its
pace of development. This is a challenge because there are significant
time restrictions on work conducted at busy railway stations in the Tokyo
metropolitan area and other railway stations that large numbers of cus-
tomers use. Nonetheless, I would like to bring forward development
initiatives as much as we can.
Question 3 What are the Group’s management strategies for growth?
- We aim to post operating revenues of approximately ¥3,000.0 billion and operating income of ¥500.0 billion in
fiscal 2019.
- Our target for total consolidated cash flows from operating activities between fiscal 2017 and fiscal 2019 is
approximately ¥2,000.0 billion. Of this, we will allocate ¥1,600.0 billion to capital investment. We intend to pay
stable cash dividends and maintain a flexible policy on share buybacks. Also, aiming to strengthen our financial
position, we will steadily move toward our goal of reducing consolidated interest-bearing debt to ¥3,000.0 billion
during the 2020s.
21Annual Report 2016

Interview with the President
Question 4 Can you please outline the Group’s long-term vision for growth after 2020?
- Aiming to capture demand from visitors to Japan, we will publicize the Tohoku and Joshinetsu regions.
- We will collaborate with region municipal authorities to contribute to town development centered on railway stations.
- We will incorporate open innovation to advance technological innovation.
- We aim to be a corporate group in which diverse personnel can realize their capabilities and play important roles.
I would like to begin with tourism. Developing tourism into a robust
growth industry has become a national mission in Japan. We will step
up initiatives aimed at encouraging more tourists to visit the Tohoku and
Joshinetsu regions and energize local communities through tourism. The
government aims to attract 40 million visitors to Japan by 2020 and 60
million by 2030. Moreover, the government has set out targets for spend-
ing by visitors to Japan of ¥8,000.0 billion by 2020 and ¥15,000.0 billion
by 2030. With a view to regional revitalization, I think we should attract
some of this large number of tourists from the Tokyo–Kyoto–Osaka route
to the Tohoku and Joshinetsu regions. As well as forming these efforts
into a major pillar of our operations, I believe such efforts aimed at
regional revitalization are a role we should fulfill.
Currently, efforts to attract tourists from overseas to the Tohoku region
are gathering a great deal of momentum. For example, the region’s six
prefectures are planning to conduct a joint promotional campaign target-
ing tourists from overseas. This initiative began at a symposium aimed at
revitalizing the Tohoku region through tourism, which was held in April
2016 in Sendai and attended by the governors of the Tohoku region’s six
prefectures. We want to play an active role in supporting such efforts.
The Tohoku region has many hidden tourism resources. We will unearth
appealing tourism resources with which even Japanese people are
unfamiliar and that showcase history and culture, hot springs, cuisine,
and nature and then develop and publicize them. Through such efforts,
I believe we can further realize the Tohoku region’s significant potential.
TRAIN SUITE SHIKI-SHIMA, a luxury sleeper and cruise train, will begin
operations in May 2017. I want to exploit train services such as this to
distribute information about new tourism resources on the sightseeing
routes that they follow.
Next, we will expand the life-style service business in areas beyond
railways. In the Tokyo metropolitan area, we will proceed with develop-
ment on the former site of the JR Shinagawa Depot railway yard. By
downsizing the railway yard between Shinagawa and Tamachi stations,
we will free up for development a 13-hectare plot of land, equivalent to
half of the railway yard’s original area. Our goal is to develop this prime
downtown location into a new gateway that welcomes the world to Tokyo,
Japan, and Asia. As for regional initiatives, we are proceeding with devel-
opment in Sendai. Also, I think we need to revitalize other core regional
cities and their railway stations, including Akita, Aomori, and Niigata, by
advancing town development centered on railway stations. I am confi-
dent that we can bring new vitality to cities by collaborating with regional
municipal authorities’ efforts based on the “compact cities” concept and
helping to concentrate the development of not only shopping centers,
offices, and hotels but also medical, childcare, nursing care, university,
and cultural facilities around railway stations.
In addition, technological innovation is important for the Group’s
growth and employee motivation. Railways still have abundant scope for
technological innovation, and I want to realize this potential. Currently,
the applications for ICT (information and communications technology)
are increasing steadily. No exception to this trend, we plan to use ICT
to enable completely novel approaches to maintenance. For example,
using wireless train control systems such as ATACS (Advanced Train
Administration and Communications System) enables us to minimize
22 East Japan Railway Company

signaling equipment, communications equipment, and other ground
equipment, thereby reducing maintenance and costs. Another example
is the use of big data and the Internet of Things (IoT). We need to use the
IoT to collect online data about the status of railcars, railway tracks, and
electrical facilities so that we can identify failure precursors. This will allow
us to prevent accidents and increase efficiency by conducting condition-
based maintenance, which entails timing maintenance optimally in light
of the condition of target facilities. In addition, we want to make more
use of sensor-based technology and monitoring technology to facilitate
disaster countermeasures and the safety of platforms and railway cross-
ings. Using such technology will enable us to detect earthquakes earlier,
identify suspicious persons, take terrorism countermeasures, and iden-
tify signs of landslides rapidly. Further, we will advance technological
development in relation to countermeasures for gusts of wind that incor-
porate Doppler radar. Such technological innovation will reduce acci-
dents, strengthen disaster countermeasures, and heighten safety. In
other fields, given the progress in developing hydrogen batteries and fuel
cells that power automobiles, the development of fuel cells for trains is
a natural progression I think. As for energy resources, we are already
developing wind and solar power generation and other renewable
energy sources, and we plan to move forward with technological innova-
tion in this field. Further, I believe we can use robots to clean railway
stations and provide customers with guidance information. In particular,
robots are an effective way of compensating for manpower shortages
and increasing productivity. Focusing on this range of initiatives, we are
having in-house discussions about accelerating efforts and setting out
targets and timeframes with a view to preparing plans. Establishing
targets and timeframes and proceeding with technological innovation is
absolutely essential I feel. We have many young, ambitious employees.
Therefore, I would like to incorporate open innovation and work with
outside manufacturers in Japan and overseas as well as universities to
drive technological innovation forward. I want to make such initiatives the
third pillar of our operations.
Lastly, personnel are indispensable to the JR East Group. We aim to
create a workplace culture that enables the Group’s various talented
personnel to fully realize their potential. With this in mind, we must create
conditions conducive to taking on new challenges. We will cultivate a
proactive culture in the Group by continuing to seek new overseas proj-
ects in such areas as high-speed railways and urban railways. Due to
the nature of their business, railway operators tend to be inward looking.
Consequently, it is important for us to expand our horizons and transform
our culture by developing initiatives to grow revenues based on promot-
ing tourism, tackling technological innovation, and participating in over-
seas projects. Specifically, we will develop personnel who are able to
work internationally by sending more than 600 employees a year over-
seas to study under short- and long-term programs or to receive a range
of on-the-job training. By continuing such initiatives we intend to foster
personnel with global, outward-looking viewpoints and become a
To Tokyo
Tamachi Station
Sengakuji Station
Photograph in May 2014
Cyclic Route 4
Shinagawa Station
Route 15
Tokaido Line (up line), Yamanote Line, Keihin-Tohoku Line (after transference)
Yamanote Line Keihin-Tohoku Line Tokaido Line Yokosuka Line Other Companies’ Line Road
Shinagawa Development Project
New station between Tamachi and Shinagawa
Area for development: 13 ha
corporate group that can take advantage of these attributes. Further, with
a focus on female employees and promoting diversity, we will encourage
a variety of different personnel to play important roles in our organization.
The percentage of female employees in JR East has risen to 11%, and
female employees account for approximately 30% of new recruits.
Moreover, we have more than 400 female managers. Thus, female
employees make a major contribution to our operations. I have said this
before, however, given that half of our customers are women, we defi-
nitely need to reflect women’s viewpoints in our business management.
Therefore, I want to see female employees playing important roles in an
even broader range of workplaces.
Beyond 2020—when initiatives in the life-style service business and
overseas projects will have expanded our business area—will be a good
time to change as a company and as an organization. However, our
fundamental commitment to giving customers peace of mind based on
assured safety through efforts to ensure safety and enhance service
quality will remain unchanged. Exploiting an expanded railway network,
we will take measures to increase inter-regional railway travel while pro-
moting tourism and developing towns to energize local communities.
Also, we will give priority to tackling overseas projects, technological
innovation, and personnel development as we step up efforts to pursue
our unlimited potential.
23Annual Report 2016

Total Transportation Station Space Utilization Shopping Centers & Office Buildings
Others
2016Results
2019Target
200
600
400
0 0 2016Results
2019Target
200
600
400
20
60
40
0 2016Results
2019Target
30
90
60
0 2016Results
2019Target
20
60
40
0 2016Results
2019Target
Interview with the President
Uses of Consolidated Cash Flows
Targets Fiscal 2017
Consolidated cash flows from operating activities Approx. ¥2.0 trillion(Three-year total to fiscal 2019)
Capital expenditures Approx. ¥1.6 trillion(Three-year total to fiscal 2019)
¥520.0 billion*1
Investment needed for the continuousoperation of business(Safety practice and transportation stability)
Approx. ¥1,000.0 billion(Approx. ¥600.0 billion)
¥342.0 billion
Growth investment Approx. ¥600.0 billion ¥178.0 billion
Shareholder returns
[Medium- to long-term target]33% total return ratio
(to profit attributable to owners of parent)
¥130/share dividendShare buybacks*2
Debt reduction
(During the 2020s)¥3.0 trillion
interest-bearing debt balance
Reduce interest-bearing debtAround ¥30.0 billion
*1 In addition, priority budget allocation maximum of ¥30.0 billion from the deposit balance on March 31, 2016 (capital expenditures of approximately ¥550.0 billion in total)*2 Share buybacks of maximum 3.3 million shares or ¥30.0 billion (April 28 to July 29, 2016)
Consolidated ROA (Ratio of operating income to average assets)
Fiscal 2016 Results At the end of fiscal 2019
6.3% Around 6%
Consolidated ROE (Return on average equity)
Fiscal 2016 Results At the end of fiscal 2019
10.4% Around 10%
Consolidated Operating Revenues Billions of Yen (Years ended / ending March 31)
Total
2016Results
2019Target
1,000
3,000
2,000
0
2,967.02,900.0
Transportation
1,000
3,000
2,000
0 2016Results
2019Target
Station Space Utilization
200
600
400
0 2016Results
2019Target
400.0 427.0
Shopping Centers & Office Buildings
100
300
200
0 2016Results
2019Target
256.0
Others
100
300
200
0 2016Results
2019Target
256.7 265.0296.0
1,954.6
Consolidated Operating Income Billions of Yen (Years ended / ending March 31)
487.8 498.0
348.6 342.0
71.684.0
35.0 36.037.0
2,867.2
35.1
1,979.0
24 East Japan Railway Company

Main Capital Expenditures in Fiscal 2017
Approval of the Allowance Reserve Plan of the Major Improvement Works of Shinkansen Railways
Fiscal 2017Operating cash flow
Fiscal 2016Deposit balance
With respect to the Tokyo-Morioka section of the Tohoku Shinkansen
Line and the Omiya-Niigata section of the Joetsu Shinkansen Line
owned by JR East, the need for large-scale renovation to ensure reliable
transportation going forward was recognized, and on March 29, 2016,
the Allowance Reserve Plan of the Major Improvement Works of Shinkansen
Railways was approved by the Minister of Land, Infrastructure,
Transport and Tourism based on Article 16, Paragraph 1 of the
Nationwide Shinkansen Railway Development Act (Act No. 71 of 1970).
Consequently, for each of the fiscal years starting with the fiscal
year ending March 31, 2017 and ending with the fiscal year ending
March 31, 2031, there will be additional operating expenses of ¥24.0
billion resulting from the provision to such allowance compared to the
operating expenses of the fiscal year ended March 31, 2016. The total
of the allowance will amount to ¥360.0 billion. Subsequently, for each
of the fiscal years starting with the fiscal year ending March 31, 2032
and ending with the fiscal year ending March 31, 2041, there will be a
reversal of such allowance and resulting reduction of operating
expenses of ¥36.0 billion compared to the operating expenses of the
fiscal year ended March 31, 2016.
Details of allowance provision plan
Large-scale
renovation
Period April 2031-March 2041 (10 years)
Total amount of
expenses¥1,040.6 billion
Allowance
Provision period April 2016-March 2031 (15 years)
Total amount of
provision¥360.0 billion
2016.4 2031.3
2031.4
Start large-scale renovation
Provision period (15 years)¥360.0 billion
(¥24.0 billion / year)→ Subtract from taxable income
Priority budget allocation: ¥30.0 billionSafety and reliability of transportation, service quality reforms, tourism and regional revitalization, technological innova-tion, global business development (including investments, M&As)
Consolidated ¥520.0 billion
Reversal period (10 years)¥360.0 billion
(¥36.0 billion / year)→ Add to taxable income
Increase in operating cost
Decrease in operating cost
Non-consolidated ¥420.0 billion Subsidiaries ¥100.0 billion
Life-style business Approx. ¥66.0 billion
• Main building and facilities of Chiba Station• Sendai Station East Exit Development• Saitama-Shintoshin Bldg. (provisional
name), etc.
Safety practice, transportation stability
Large-scale earthquake countermeasures Approx. ¥98.0 billion
Replacement of aging ground facilities
• Installation of automatic platform gates
• Develop elevators and other facilities
• Renewable energy facilities • Introduction of 12-car trains
to Chuo Line, etc.
Rolling stock investment Approx. ¥60.0 billion• TRAIN SUITE SHIKI-SHIMA
cruise train• Series E5, etc.
25Annual Report 2016

26 East Japan Railway Company
Eternal Mission
JR East Group Management Vision V—Ever Onward: Priority Initiatives Going Forward
With continued fulfillment of its “Eternal Mission,” including the safety and reliability of transportation, and sustaining growth by
“Pursuing Unlimited Potential” positioned as the two important management pillars of the Group, JR East has set out the six
basic policies below.
1. Advance “Group Safety Plan 2018”
steadily
- Advance concrete measures that reflect the
basic approach of “Group Safety Plan 2018,”
including renewal of facilities and revision of
educational materials aimed at practical safety
education and training
- Advance measures aimed at “prevention of
recurrence of incidents” and “prevention
through understanding of risks and weak-
nesses” in response to such incidents as the
collapse of an electrical pole on the Yamanote
Line
- Improvement of technical capabilities as a
Group in collaboration with Group companies
and partner companies
- Implement rigorous accident prevention
measures (tangible and intangible) reflecting
the lessons from the derailment accident in
Kawasaki Station
2. Build a railway capable of
withstanding natural disasters
- Expect to complete approximately 80% of the
planned seismic reinforcements by the end of
fiscal 2017
- Properly renew aging facilities such as struc-
tures, track equipment, and station buildings
1. Advance the “Medium-term Vision for
Service Quality Reforms 2017”
- Prevent transportation service disruptions
including through the advancement of counter-
measures for natural disasters and enhance-
ment of security
- Minimize the impact of transportation service
disruptions, respond to customers rapidly, and
resume operations as soon as possible follow-
ing disruptions
- Enhance information provision and support that
use ICT and other technologies through such
measures as increasing the number of lines
covered by services providing information on
the operational status of trains
2. Promote usage of the Hokuriku
Shinkansen Line and the Hokkaido
Shinkansen Line
- Promote usage of the Hokuriku Shinkansen
Line and the Hokkaido Shinkansen Line by
advancing the development of destination-
driven tourism and establishing inter-regional
sightseeing routes
- Review business schemes including through
the development of a specific plan for a
Haneda Airport Access Line
1. Steadily promote the three approaches
to town development
- Establish the brand power of and improve the
convenience of Shinagawa and other large-
scale stations
- Promote the line-side brand appeal of railway
lines including through promotion of the Chuo
Line Mall Project and the HAPPY CHILD
PROJECT
- Develop towns around Akita and other core
train stations in regional areas in collaboration
with local municipal authorities and other
bodies
2. Revitalize local industries
- Expand sales of local products in Tokyo
metropolitan area and improve trend-setting
capabilities
- Promote the sextic industrialization of agricul-
ture, fishing, and forestry including through the
NOMONO 1-2-3 Project
3. Promote Japan as a tourism-
oriented nation
- Create appealing trains that are ridden for the
ride experience itself
- Prepare for introduction of the TRAIN SUITE
SHIKI-SHIMA cruise train
>>01
>>02
MIGAKU (Improve):Service quality reforms
KIWAMERU (Excel):Pursuing
“extreme safety levels”
TOMO NI IKIRU (Together):Strengthening
collaboration with local communities

27Annual Report 2016
Initiatives in preparation for Tokyo 2020 Olympic and Paralympic Games*- Enhance stations and other facilities near game venues and, during events, reinforce transportation capacity
- Promote barrier-free environments through such measures as installing more lifts and multi-functional restrooms
Advance strategies for visitors to Japan- Increase the profile of the Tohoku area through collaboration with Tohoku Tourism Promotion Organization and other organizations
- Capture demand from non-Japanese tourists on a Group basis by increasing and improving stores that offer duty-free shopping services
- Establish an environment that accommodates the needs of visitors to Japan and increase convenience
through such measures as increasing the number of and improving tourism centers for visitors to Japan
Pursuing Unlimited Potential
1. Take on the challenge of
overseas projects
- Advance operations for the Purple Line urban
mass transit railway system in Bangkok,
Thailand
- Expand technological support provided to and
other measures for railway operators in
Indonesia and Myanmar
- Advance initiatives aimed at participation in
overseas high-speed rail projects
- Market sustina stainless-steel railcars proactively
and win orders for railway projects
- Develop the life-style service business overseas
2. Incorporate outstanding technologies
and services from outside the Company
1. Provide further growth opportunities to
motivate employees
- Enhance open-application programs for
personnel transfer and training
- Strengthen the development of global human
resources through the continued development
of a diverse overseas assignment program
- Promote diversity
2. Promote cohesive Group management
- Establish “Group Stretch Targets”
- Expand and improve JRE POINT as a common
service throughout the JR East Group
3. Reform the work style and streamline
organizational management
>>03
NOBIRU (Grow):Tackling
new business areas
HABATAKU (Empower):Developing employees and creating a corporate culture
that maximizes human potential
HIRAKU (Pioneer):Technological innovation
1. Promote energy and
environmental strategies
- Introduce catenary and battery-powered
hybrid railcars to alternating current (AC)
segments
- Transform the northern Tohoku region into a
renewable energy base (solar power, wind
power, geothermal power, biomass)
2. Utilize ICT to innovate operations
- Innovate maintenance operations including
through the introduction of monitoring devices
to model line segments
- Build new sales systems through such initia-
tives as the establishment of capabilities for
selling View travel products online
- Innovate the transportation system through
the introduction of wireless train control
systems
3. Advance technological innovation
* East Japan Railway Company is an Official Passenger Rail Transportation Services Partner of the Tokyo 2020 Olympic and Paralympic Games.

Total Passenger Traffic between the Tokyo Metropolitan Area and Kanazawa / ToyamaIn the first fiscal year following the extension of the Hokuriku Shinkansen Line, fiscal 2016, total
passenger traffic (including airlines) between the Tokyo metropolitan area and Kanazawa / Toyama
increased approximately 1.6 times year on year.
Increase passenger traffic
Establish inter-regional sightseeing routes
Establish strategic products
Following on from the March 2015 opening of the Hokuriku Shinkansen Line
from Nagano to Kanazawa, March 2016 saw the opening of the Hokkaido
Shinkansen Line. JR East will take full advantage of this expanded railway
network to increase railway use even further.
Capture demand from inbound tourists
2014 20142015 2015
JR 42% JR 64%JR 76% JR 86%
Air 58% Air 36%Air 24% Air 14%
Tokyo – Kanazawa 4.8 million people(JR: 450.5km, Shortest travel time: 2 hours 28 mins)
Tokyo – Toyama 3.4 million people(JR: 391.9km, Shortest travel time: 2 hours 8 mins)
* Between Joetsumyoko and Kanazawa section lies within the area of JR West
28 East Japan Railway Company
Feature: Priority Initiative 01 Railway Network Expansion

Opening of the Hokkaido Shinkansen Line to Shin-Hakodate Hokuto
In March 2016, to coincide with the opening of the Hokkaido Shinkansen
Line from Shin-Aomori to Shin-Hakodate Hokuto, which JR Hokkaido
operates, JR East began direct services between the Tohoku Shinkansen
Line and the new Shinkansen line. As a result, the shortest journey
between Tokyo and Shin-Hakodate Hokuto takes 4 hours and 2 minutes,
and the shortest journey between Sendai and Shin-Hakodate Hokuto
takes 2 hours and 30 minutes.
Aiming to increase passenger flows between the Tokyo metropolitan
area, the Tohoku region, and Hokkaido, the entire JR Group will attract
tourists by holding the Aomori Prefecture and Hakodate Destination
Campaign from July to September 2016. Moreover, plans call for exploit-
ing the Hokkaido Shinkansen Line to increase passenger flows between
the Tohoku region and Hokkaido. Further, low-cost carriers (LCCs) began
flying to Sendai Airport, following its privatization in July 2016. We will
exploit this development in combination with the new Hokkaido
Shinkansen Line to generate even more interest and passenger flows.
Benefits of Extending the Hokuriku Shinkansen Line
The opening of the Hokuriku Shinkansen Line from Nagano to Kanazawa
in March 2015 has reduced travel time between Tokyo and Kanazawa
significantly, from 3 hours and 51 minutes to 2 hours and 28 minutes
(from Tokyo to Kanazawa).
In fiscal 2016, the extension of the Hokuriku Shinkansen Line added
¥45.5 billion to passenger revenues year on year. This contribution
mainly reflected increased passenger flows not only between the Tokyo
metropolitan area and the Hokuriku region but also between the
Hokuriku region and areas outside the Tokyo metropolitan area, such as
the Joshinetsu and Tohoku regions, and favorable usage of GranClass
and Green Car services.
JR East-South Hokkaido Rail PassJR East and JR Hokkaido have launched the JR East-South Hokkaido Rail Pass, using the opening of the Hokkaido
Shinkansen Line as an opportunity to encourage visitors to Japan to enjoy wide-ranging sightseeing. The rail pass enables
discount travel on Shinkansen and limited express services in JR Hokkaido’s service area—southern Hokkaido, including
Sapporo, Hakodate, and the New Chitose Airport—and JR East’s service area, which comprises eastern Japan and
includes the Tohoku region. Based on such discount tickets, we will step up collaborations with local communities to pro-
mote wide-ranging sightseeing routes.
Sales Initiatives in the Second Year since the Extension of the Hokuriku Shinkansen LineFrom March to September 2016, the JR East Group is collaborating with JR West to conduct a campaign marking
the first anniversary of the extension of the Hokuriku Shinkansen Line. We hope this campaign will offset a year-
on-year dip in passenger numbers expected during this period due to the absence of Zenkoji Gokaicho*, which
was held in April and May 2015. Following on from the first anniversary campaign, we will roll out a continuous
series of sales initiatives, including the Hokuriku After Destination Campaign in the fall and the Japanese Beauty
Hokuriku Campaign in the winter. In conjunction with these initiatives, we will establish products aimed at increas-
ing use of wide-ranging sightseeing routes that include View Buses, and we plan to develop new wide-ranging
sightseeing routes.
* A special event held every seven years in Zenkoji Temple in Nagano.
WebWeb
Web
SapporoSapporo
New Chitose AirportNew Chitose AirportShin-Hakodate-HokutoShin-Hakodate-Hokuto
Shin-AomoriShin-Aomori
MoriokaMorioka
SendaiSendai
TōkyōTōkyō
Narita AirportNarita AirportHaneda AirportHaneda Airport
YamagataYamagata
KaruizawaKaruizawa
ŌmiyaŌmiya
Sendai AirportSendai Airport
AkitaAkita
Rapid AirportRapid Airport
Ltd. Exp. Super HokutoLtd. Exp. Super Hokuto
Ltd. Exp. TsugaruLtd. Exp. Tsugaru
Ltd. Exp. Narita ExpressLtd. Exp. Narita Express
Yamagata Shinkansen / TsubasaYamagata Shinkansen / Tsubasa
Akita Shinkansen / KomachiAkita Shinkansen / Komachi
Tohoku Shinkansen / HayabusaTohoku Shinkansen / Hayabusa
Hokkaido Shinkansen
Hokkaido Shinkansen
To obtain this pass, please purchase an Exchange Order at a nearby designated travel agent before your departure, or purchase the pass directly at a designated station or Travel Service Center in Japan. The pass may only be used by foreign visitors who have been given landing permission with a short-term stay stamp. When purchasing or exchanging the voucher for a pass at a designated station or Travel Service Center, you must present a passport with this stamp.You may freely choose six days to ride the trains out of a 14-day period from the purchase or exchange date. The six days do not need to be consecutive. For example, if you purchase or exchange for the pass on May 1, you may ride the trains on your preferred days until May 14.
This rail pass is for unlimited train travel in an allotted period of time.Use it within a free travel area that includes eastern Japan and Hokkaido.
Enjoy traveling economically by train in Japan!
JR East-South Hokkaido Rail PassPurchase and Usage Period: From April 1, 2016
Flexible6 days
Regular Price(purchased inside Japan)
Pre-purchase discount price(purchased outside Japan)
Special Price! Adults (age 12 and over)
26,000 yen 13,000 yen
27,000 yen 13,500 yen
Children (age 6-11)
JR East-South Hokkaido Rail Passwww.jreasthokkaido.com/e/
www.jreast.co.jp/e/ www2.jrhokkaido.co.jp/globalwww.facebook.com/hokkaidotravel
Service on the Hokkaido Shinkansen begins March 26, 2016!
6 Flexible Days
JR East-South HokkaidoJR East-South HokkaidoRail PassRail Pass
EE2801-062Pamphlet No.
The logo of the campaign marking the first anniversary of the extension of the Hokuriku Shinkansen Line
29Annual Report 2016
JR East-South Hokkaido Rail Pass poster

Global Gateway Shinagawa
- Access to downtown Tokyo
Tokyo metropolitan area network
Access to highly appealing downtown areas
- Japan’s terminal
Opening of Linear Chuo Shinkansen scheduled for 2027
Enhanced access to regions around Japan
- Gateway to the world
Accessibility of Haneda Airport
Hub connecting Tokyo to the world
Sengakuji Station
Shinagawa Station
Tamachi Station
New Station (Plan)
Former site of JR Shinagawa Depot railway yard
Under the Shinagawa development project, JR East has scheduled the provisional opening of a new railway station
between Tamachi and Shinagawa stations for 2020 and the unveiling of a new town around 2023 or 2024.
Basic Summary of Town Development of the Shinagawa Development ProjectThe Shinagawa development project is one of the largest development initiatives in Japan. The project has a site that covers roughly 130,000 square
meters, and will create around 1,000,000 square meters of floor space. We are passionate about developing a new type of town that symbolizes
Japan’s openness to the world. The investment will total approximately ¥500.0 billion, and while the development will include hotels, commercial facili-
ties, and cultural facilities, it will mainly be comprised of offices and condominiums.
In April 2016, the town plan, which the JR East Group prepared in collaboration with other parties, received approval from the Prime Minister of Japan
as a zone plan of a national strategic special zone. Further, under this project, based on the Global Gateway Shinagawa concept, JR East will develop a town
that enables innovative, internationally appealing companies and personnel to gather and create new businesses and cultures through diverse exchanges.
30 East Japan Railway Company
Feature: Priority Initiative 02 Shinagawa Development Project

Providing venue for realization of next-generation business models* More detailed facility plans will be prepared going forward.
Establishing future image for town development and developing infrastructure
in advance
Publicize Japan’s appeal
Promote new town
Foster progressive technology that enables smooth, dynamic movement of
and exchanges among people
• Next-generation mobility, etc. • Use of leading-edge ICT technology, etc.
Create system that links people and regions through transport networks and cyclically fosters their appeal
* Rendered image
Establish an urban development role model for the world with economically and
environmentally sustainable strategy
• Contribute actively to reduction of greenhouse gases by promoting use of renewable energy
Business and cultural exchange functionFormation of town that integrates multiple functions befitting international exchange hub
• Accommodation, commercial, and residential functions • Culture and entertainment • MICE
District Planning
Land readjustment project
City planning road
Business support functionVenues and services that support multiple needs of global companies, venture companies, etc.
• Support for exchanges and incubation
Regions around Japan
Regions worldwide
Opening of Linear Chuo Shinkansen (plan)Provisional opening of new station
Tokyo 2020 Olympic and Paralympic Games*
Transportation and
communication
Japan valueEnvironment
Three priority themes of
next-generation business creation
Shinagawa
Japan departmentOne-stop introduction to Japan / Travel support providing links to regions and experiences
Next-generation-manufacturing LABOProfessionals systematizing
processes from design through to business establishment
* While being an international town where personnel gather from around the world, the town will publicize Japan’s appeal and value (Japan value) and facilitate the creation of new businesses and flows of people to respective regions.
Tourism, experience Product, service, technology
Attracting visitors from overseas Publicity and presentation
Street-based urban design * Rendered image
Fusing a train station building with the surrounding neighborhood
* Rendered image
Exchange×
Value creation
2016 2020 2027 2030s–
Continuing growth as international exchange hub (new international town)
Opening of town (partial opening)
Interim use
Present
31Annual Report 2016
Vision of the International Exchange HubNew international town
Using the new town as a platform, JR East will create and facilitate next-generation businesses continuously based on three priority themes: transportation
and communication, environment, and Japan value.
Schedule for the Formation of an International Exchange HubTown able to continue growing
We aim to create a town that can continue growing as an international exchange hub through interim use with a view to Tokyo 2020 Olympic and
Paralympic Games* and the subsequent opening of the town.
* East Japan Railway Company is an Official Passenger Rail Transportation Services Partner of the Tokyo 2020 Olympic and Paralympic Games.

As part of strategies aimed at capturing demand from visitors to Japan from overseas, which has continued to increase in
recent years, the JR East Group as a whole took measures to increase and improve products and develop capabilities to
service such customers.
Summary of Strategies for Visitors to Japan from OverseasIn July 2015, a JR East subsidiary entered into comprehensive operational alliances with two travel companies that have particular competence in
Thailand, Indonesia, and China. In November 2015, JR East launched the JR TOKYO Wide Pass, a “free pass” that covers popular tourism areas and
winter resorts. Furthermore, in April 2016 JR East launched the Tokyo-Osaka Hokuriku Arch Pass, which includes the Hokuriku Shinkansen Line, and the
JR East-South Hokkaido Rail Pass, which includes the Hokkaido Shinkansen Line.
Also, the JR East Group extended the provision of a free public wireless LAN service to all stations within the Yamanote Line and established duty-free
counters in station concourses and station buildings. In February 2016, the JR East Group expanded the JR EAST Travel Service Center at Haneda
Airport and introduced multilingual, online Internet reservation services for non-Japanese customers overseas.
Visitors to Japan from OverseasIn 2015, visitors to Japan from overseas increased 47% year on year, to
19.7 million, surpassing the record set in the previous year by 6.3 million.
Further, we expect visitors to Japan from overseas to reach 40 million by
2020, and we are looking forward to revenues from visitors to Japan from
overseas growing in step with this increase.
03 12 13 14 15 20 30
70
60
50
40
30
20
10
0
Visitors to Japan Millions
Start of Visit Japan Campaign
Year
(Target)
(Target)
Source: Japan National Tourism Organization
32 East Japan Railway Company
Feature: Priority Initiative 03 Advancement of Strategies for Visitors to Japan from Overseas

15 16 17 18 19 20 21
Revenues from Visitors to Japan from Overseas Billions of Yen
Revenues from Visitors to Japan from OverseasWe intend to boost revenues from visitors to Japan from overseas even
further by attracting them to the Tohoku and Shinetsu regions and other
regions in our service area. In fiscal 2016, JR East’s range of rail passes
for visitors to Japan from overseas generated ¥12.5 billion in revenues. In
fiscal 2017, we plan to increase this by ¥4.0 billion, to ¥16.5 billion.
Expansion of Free Public Wireless LAN Service for Visitors to Japan from OverseasIn October 2012, JR East began a free public wireless LAN service for
visitors to Japan from overseas: JR-EAST FREE Wi-Fi. Initially, this service
was available at 41 railway stations and five JR EAST Travel Service Center
sites. We have introduced JR-EAST FREE Wi-Fi to a further 47 railway
stations that many visitors to Japan from overseas are likely to use. As a
result, from the current fiscal year visitors to Japan from overseas can use
the service at 88 railway stations and five JR EAST Travel Service Center
sites. Other initiatives to provide visitors to Japan from overseas with
Internet access include our introduction of a free public wireless LAN
service onboard the Narita Express.
In addition, the JR East Group provides a
free public wireless LAN service at 44 shop-
ping centers, 39 hotels, and one sports and
leisure facility. We plan to extend this service to
include more facilities.
Duty-Free Sales in Station Concourses and Station BuildingsThe JR East Group has begun to establish
duty-free counters in the commercial facilities
of station concourses and station buildings. As
well as expanding our network of duty-free
counters, we will provide duty-free sales in an
increasing number of facilities.
Expansion of the JR EAST Travel Service Center at Haneda AirportBecause service counters were becoming
congested due to the increasing numbers of
visitors to Japan from overseas, the JR East
Group expanded the Haneda Airport JR EAST
Travel Service Center, which is inside the Tokyo
Monorail’s Haneda Airport International
Terminal Station, in February 2016. This center
provides in exchange for vouchers the JAPAN RAIL PASS; sells, or pro-
vides in exchange for vouchers, JR East rail passes for visitors to Japan
from overseas; and sells other JR tickets.
Opening of a Center to Attract Visitors from Singapore to Japan, JAPAN RAIL CAFEAmid the rising number of visitors to Japan from overseas, the number of
visitors from countries in the ASEAN region is increasing steadily. In
particular, more than 70% of visitors to Japan from Singapore make
return visits. Such visitors not only seek general tourist information but
also want the latest, in-depth information about diverse aspects of
Japan. With this in mind, we aim to create a new type of center for pro-
moting travel to Japan in the ASEAN region by unveiling the JAPAN RAIL
CAFE in Singapore in November 2016. As well as providing information
about Japan’s various regions, the center will encourage exchanges of
information among Japan travel fans.
8.5
12.5
16.5(Plan)
FY
33Annual Report 2016
JR TOKYO Wide Pass poster
Tokyo-Osaka Hokuriku Arch Pass poster
WebWeb
Web
SapporoSapporo
New Chitose AirportNew Chitose AirportShin-Hakodate-HokutoShin-Hakodate-Hokuto
Shin-AomoriShin-Aomori
MoriokaMorioka
SendaiSendai
TōkyōTōkyō
Narita AirportNarita AirportHaneda AirportHaneda Airport
YamagataYamagata
KaruizawaKaruizawa
ŌmiyaŌmiya
Sendai AirportSendai Airport
AkitaAkita
Rapid AirportRapid Airport
Ltd. Exp. Super HokutoLtd. Exp. Super Hokuto
Ltd. Exp. TsugaruLtd. Exp. Tsugaru
Ltd. Exp. Narita ExpressLtd. Exp. Narita Express
Yamagata Shinkansen / TsubasaYamagata Shinkansen / Tsubasa
Akita Shinkansen / KomachiAkita Shinkansen / Komachi
Tohoku Shinkansen / HayabusaTohoku Shinkansen / Hayabusa
Hokkaido Shinkansen
Hokkaido Shinkansen
To obtain this pass, please purchase an Exchange Order at a nearby designated travel agent before your departure, or purchase the pass directly at a designated station or Travel Service Center in Japan. The pass may only be used by foreign visitors who have been given landing permission with a short-term stay stamp. When purchasing or exchanging the voucher for a pass at a designated station or Travel Service Center, you must present a passport with this stamp.You may freely choose six days to ride the trains out of a 14-day period from the purchase or exchange date. The six days do not need to be consecutive. For example, if you purchase or exchange for the pass on May 1, you may ride the trains on your preferred days until May 14.
This rail pass is for unlimited train travel in an allotted period of time.Use it within a free travel area that includes eastern Japan and Hokkaido.
Enjoy traveling economically by train in Japan!
JR East-South Hokkaido Rail PassPurchase and Usage Period: From April 1, 2016
Flexible6 days
Regular Price(purchased inside Japan)
Pre-purchase discount price(purchased outside Japan)
Special Price! Adults (age 12 and over)
26,000 yen 13,000 yen
27,000 yen 13,500 yen
Children (age 6-11)
JR East-South Hokkaido Rail Passwww.jreasthokkaido.com/e/
www.jreast.co.jp/e/ www2.jrhokkaido.co.jp/globalwww.facebook.com/hokkaidotravel
Service on the Hokkaido Shinkansen begins March 26, 2016!
6 Flexible Days
JR East-South HokkaidoJR East-South HokkaidoRail PassRail Pass
EE2801-062Pamphlet No.
JR East-South Hokkaido Rail Pass poster
Narita Express
Duty-free counter
JR EAST Travel Service Center
A rendered image of the JAPAN RAIL CAFE

34 East Japan Railway Company
REVIEW OF OPERATIONS
Transportation > Tokyo Metropolitan Area Network, Intercity Network, and Shinkansen
Creation of Attractive Trains Ridden for the ExperienceAs one of our initiatives to open the way toward a new future for railways,
over the past several years we have been creating attractive trains that,
rather than simply being a means of transportation, cater to customers
who are focused on the ride experience itself and which offer a range of
novel travel experiences. For example, on conventional lines JR East
operates the Pokémon with YOU train, which began operating in
December 2012 on the Ofunato Line; the Tohoku Emotion restaurant
train, which began operating in October 2013 on the Hachinohe Line; the
SL Ginga steam locomotive train, which began operating in April 2014 on
the Kamaishi Line; and the Koshino Shu*Kura service, which began
operating in May 2014 from Takada Station*1 on the Shin-etsu Main Line
to Tokamachi Station on the Iiyama Line. As for Shinkansen lines, we
operate the Toreiyu Tsubasa service, which began operating in July 2014
on the Yamagata Shinkansen Line between Fukushima and Shinjo
stations and the GENBI SHINKANSEN, which began operating on April
29, 2016, on the Joetsu Shinkansen Line between Echigo-Yuzawa and
Niigata stations.
Further, in accordance with “JR East Group Management Vision V—
Ever Onward,” which calls on the Group to promote Japan as a tourism-
oriented nation, JR East is preparing to begin operating the TRAIN SUITE
SHIKI-SHIMA cruise train. The cruise train will offer trips that give custom-
ers a variety of options for enjoying the abundant, beautiful countryside
of Japan, its industries rooted in local communities, and its regional
cultures that are still part of day-to-day life. Our themed trains will carry
customers through a rich series of experiences and places in a manner
unique to train travel.
*1 At the time, the railway station was operated by what is now Echigo TOKImeki Railway Company.
TRAIN SUITE SHIKI-SHIMA cruise train GENBI SHINKANSEN

Haneda Airport Access Line design (Under examination)
To Shinjuku, Shibuya
To Tokyo
To Shin-Kiba
Haneda Airport
Shinagawa
JR Line (Including freight line)
Rinkai Line
Establishing line
Increasing line
35Annual Report 2016
Fiscal 2016 SummaryIn transportation, JR East began direct services between the Tohoku
Shinkansen and Hokkaido Shinkansen lines, after revising timetables
in March 2016 for the opening of the Hokkaido Shinkansen Line. As a
result, the shortest journey between Tokyo and Shin-Hakodate Hokuto
takes 4 hours and 2 minutes, and the shortest journey between
Sendai and Shin-Hakodate Hokuto takes 2 hours and 30 minutes.
Further, in light of observed usage following the opening of the
Hokuriku Shinkansen Line and the Ueno-Tokyo Line, JR East
improved the transportation network through such initiatives as
reviewing connections and strengthening transportation capabilities
during rush hours. Also, given the expansion of the direct service
network, such as the opening of the Ueno-Tokyo Line, JR East
improved the quality of transportation by expanding contingency
shuttle operations when transportation services are disrupted.
As for marketing and sales activities, JR East conducted
the Fukushima Destination Campaign and the Ikuze, Tohoku.
Campaign to increase passenger traffic. Also, JR East prepared for the
Aomori Prefecture and Hakodate Destination Campaign, scheduled for
July 2016. In addition, we promoted further use of the Hokuriku
Shinkansen Line and implemented initiatives to grow inter-regional
railway travel. In November 2015, JR East launched the JR East
Dynamic Rail Pack, which allows customers to purchase travel prod-
ucts that combine the train services and accommodation of their
choice. Moreover, JR East enabled purchasing of these products via
smartphones in January 2016.
Improvement of Access to Haneda AirportStrengthening the capabilities of Haneda Airport is expected to be pos-
sible through such measures as increasing its capacity for international
flights. Moreover, the government aims to attract 40 million visitors to
Japan by 2020 and 60 million by 2030. Therefore, the airport’s passenger
numbers are expected to grow.
Further, in April 2016 a council on transportation policy tasked with
examining the future of urban railways in the Tokyo metropolitan area
concluded that the Haneda Airport Access Line will help strengthen
international competitiveness. With this in mind, we aim to develop a
specific plan for the Haneda Airport Access Line by reviewing facility plans
and business schemes in greater depth and coordinating with stakeholders.
Revitalization of Communities and Stimulation of TourismIn March 2016, the Hokkaido Shinkansen Line opened to Shin-Hakodate
Hokuto. Aiming to attract visitors and encourage the use of its services,
JR East will conduct the Aomori Prefecture and Hakodate Destination
Campaign from July to September 2016 in close collaboration with local
municipal authorities, developers of local tourism, and travel companies.
Such initiatives and the new Shinkansen line segment are likely to boost
interest in southern Hokkaido. At the same time, interest in JR East’s
service area promises to increase in Hokkaido.
Also, November 2011 saw the launch of a year-round promotional
campaign, Ikuze, Tohoku., which is aimed at supporting the Tohoku
region’s restoration by stimulating tourism. Since then, JR East has been
advertising the particular charm of the Tohoku region’s different areas in
each season through television commercials, posters, and Internet-
based promotions.
Ikuze, Tohoku. Campaign poster

The Ueno-Tokyo Line
36 East Japan Railway Company
REVIEW OF OPERATIONS
Transportation > Tokyo Metropolitan Area Network, Intercity Network, and Shinkansen
>Priority Initiatives
• Promote use of the Hokuriku Shinkansen and Hokkaido Shinkansen lines
• Expand and improve Tokyo metropolitan area network • Improve transportation quality • Stimulate tourism
>Numbers
Conventional network (Kanto area) Operating Kilometers
2,535.9 kilometers (as of March 31, 2016)
Fiscal 2016 Conventional revenues (Kanto area) from passenger tickets
¥1,156.2 billion
Conventional network (Outside Kanto area) Operating kilometers
3,727.2 kilometers (as of March 31, 2016)
Fiscal 2016 Conventional revenues (Outside Kanto area) from passenger tickets
¥70.5 billion
Shinkansen network operating kilometers:
1,194.2 kilometers (as of March 31, 2016)
Fiscal 2016 Shinkansen revenues from passenger tickets:
¥578.2 billion
Expansion of the Direct-Service NetworkTo expand and improve the Tokyo metropolitan area network further, on
March 14, 2015, JR East opened the Ueno-Tokyo Line, which established
a main artery linking Tokyo Station, located in an area that is a political
and economic hub, with Ueno Station, located in an area known for art
and culture. The new line has enabled direct services from the
Utsunomiya, Takasaki, and Joban lines to Tokyo and Shinagawa stations
and from the Tokaido Line to Ueno Station. The elimination of transfers
has reduced travel times and increased convenience.
In a separate initiative, direct services are to be established between
the Sotetsu Line and JR lines by constructing a new connecting line of
approximately 2.7 km between Nishiya Station on the Sotetsu Line and a
location near Yokohama-Hazawa Station on the Tokaido Freight Line.
Although the Japan Railway Construction, Transport and Technology
Agency (JRTT) has primary responsibility for development of the
connecting line, JR East will build the frameworks of structures connecting
the location to Yokohama-Hazawa Station on the Tokaido Freight Line
and implement renovation work within the railway station. The establish-
ment of this connecting line will directly link western Yokohama and
central Kanagawa Prefecture to downtown Tokyo and establish a
wide-ranging railway network. Further, this project promises to heighten
the convenience of railway services by shortening travel times and
reducing transfers.
Operating framework of the Ueno-Tokyo Line
Kumagaya
Oyama
Omiya
Akabane
Kita-SenjuUeno
Tokyo
Shinagawa
Kawasaki
Yokohama
Chigasaki
Ofuna
Kashiwa
Tsuchiura
Narita
Takasaki LineUtsunomiya Line
Tokaido Line
Joban Line

37Annual Report 2016
Introduction of Series E235 sustina RailcarsThe brand name sustina refers to the stainless-steel railcars that JR East
designs and manufactures and which incorporate next-generation
technologies. For many years, J-TREC has developed and marketed JR
East’s leading-edge sustina stainless-steel railcars. Recently, the com-
pany manufactured and delivered Series E235 railcars for the Yamanote
Line, which are the first mass-production commuter railcars for large
cities in the sustina series. The features of sustina stainless-steel railcars
are attractive designs; frequent use of common platforms for railcar
structures and equipment systems; advanced safety features, such as
impact-absorbing structures and built-in roll bars; environment-friendly,
100% recyclable stainless-steel railcar bodies; and simultaneous real-
ization of reliability and lower railcar life-cycle costs.
In the sustina series, JR East has designed and manufactured Tokyu
Corporation Series 5050, car no. 5576, railcars, which incorporate laser-
welded railcar bodies; sustina Hybrid Series EV-E301 railcars for trains
that include rechargeable batteries for JR East’s Karasuyama Line; and
Series HB-E210 diesel hybrid railcars for use on JR East’s lines in the
Sendai area.
As a railway operator, JR East will continue offering solutions based
on sustina stainless-steel railcars.
Transportation > Railcar Manufacturing Operations
Fiscal 2016 SummaryJR East prepared to begin maintenance operations in
Bangkok, Thailand, for the Purple Line, an urban mass
transit system scheduled to enter service in August 2016.
At the same time, JR East subsidiary Japan Transport
Engineering Company (J-TREC) manufactured sustina
stainless-steel railcars and delivered them to a railway
yard in Thailand.
>Priority Initiatives
• Establish railcar manufacturing operations as
a fourth business pillar
• Market sustina stainless-steel railcars
proactively and win orders for railway projects
Series E235 railcars debut on the Yamanote Line
Series HB-E210 diesel hybrid railcars for use in the Sendai area
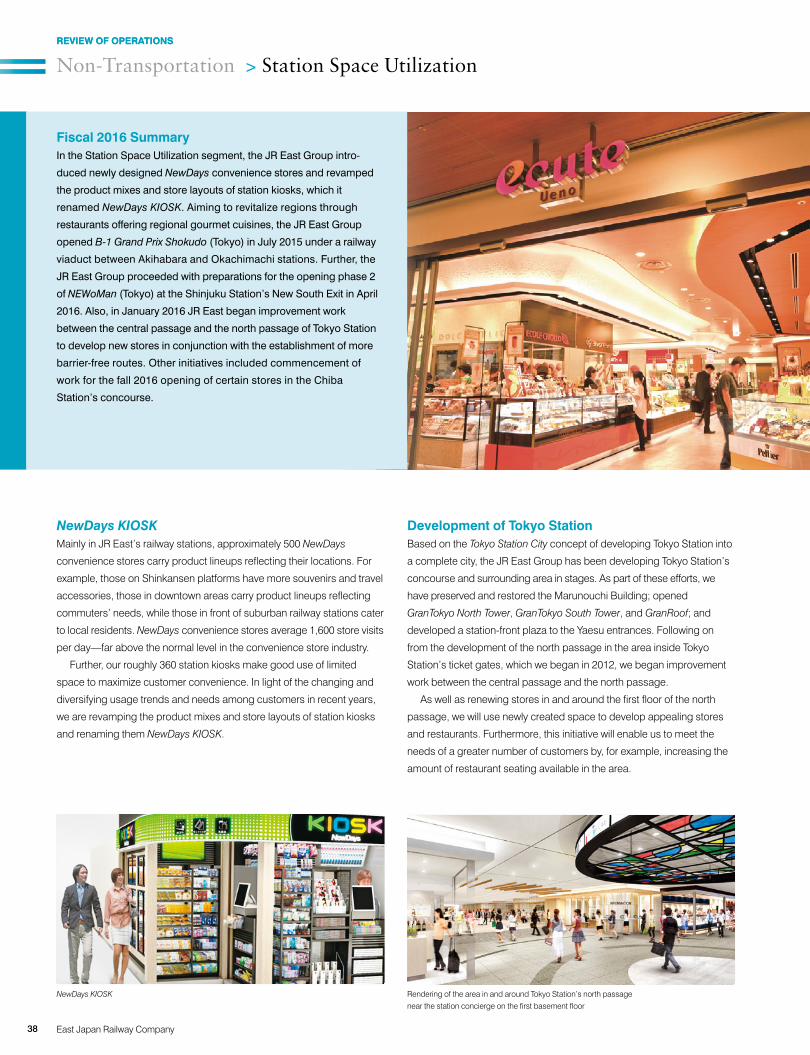
38 East Japan Railway Company
REVIEW OF OPERATIONS
Non-Transportation > Station Space UtilizationREVIEW OF OPERATIONS
NewDays KIOSKMainly in JR East’s railway stations, approximately 500 NewDays
convenience stores carry product lineups reflecting their locations. For
example, those on Shinkansen platforms have more souvenirs and travel
accessories, those in downtown areas carry product lineups reflecting
commuters’ needs, while those in front of suburban railway stations cater
to local residents. NewDays convenience stores average 1,600 store visits
per day—far above the normal level in the convenience store industry.
Further, our roughly 360 station kiosks make good use of limited
space to maximize customer convenience. In light of the changing and
diversifying usage trends and needs among customers in recent years,
we are revamping the product mixes and store layouts of station kiosks
and renaming them NewDays KIOSK.
Development of Tokyo StationBased on the Tokyo Station City concept of developing Tokyo Station into
a complete city, the JR East Group has been developing Tokyo Station’s
concourse and surrounding area in stages. As part of these efforts, we
have preserved and restored the Marunouchi Building; opened
GranTokyo North Tower, GranTokyo South Tower, and GranRoof; and
developed a station-front plaza to the Yaesu entrances. Following on
from the development of the north passage in the area inside Tokyo
Station’s ticket gates, which we began in 2012, we began improvement
work between the central passage and the north passage.
As well as renewing stores in and around the first floor of the north
passage, we will use newly created space to develop appealing stores
and restaurants. Furthermore, this initiative will enable us to meet the
needs of a greater number of customers by, for example, increasing the
amount of restaurant seating available in the area.
Rendering of the area in and around Tokyo Station’s north passage near the station concierge on the first basement floor
NewDays KIOSK
Fiscal 2016 SummaryIn the Station Space Utilization segment, the JR East Group intro-
duced newly designed NewDays convenience stores and revamped
the product mixes and store layouts of station kiosks, which it
renamed NewDays KIOSK. Aiming to revitalize regions through
restaurants offering regional gourmet cuisines, the JR East Group
opened B-1 Grand Prix Shokudo (Tokyo) in July 2015 under a railway
viaduct between Akihabara and Okachimachi stations. Further, the
JR East Group proceeded with preparations for the opening phase 2
of NEWoMan (Tokyo) at the Shinjuku Station’s New South Exit in April
2016. Also, in January 2016 JR East began improvement work
between the central passage and the north passage of Tokyo Station
to develop new stores in conjunction with the establishment of more
barrier-free routes. Other initiatives included commencement of
work for the fall 2016 opening of certain stores in the Chiba
Station’s concourse.

39Annual Report 2016
EKIBEN, our store at Paris-Gare de Lyon StationNOMONO Izakaya Kayoiji
Rediscovering the Region ProjectUnder the Rediscovering the Region Project, the JR East Group
collaborates with local communities to invigorate regions by promoting
the circulation of people and goods. As part of these efforts, we opened
NOMONO shops, featuring foods grown and processed in various
regions, in Ueno Station in January 2012 and in Akihabara Station in
March 2014. Mainly through NOMONO Kitchen Ikebukuro Higashiguchi,
opened in November 2015, and NOMONO Izakaya Kayoiji, opened in
January 2016, we offer dishes featuring regional and seasonal ingredi-
ents and emphasize food culture.
The JR East Group will help reinvigorate local communities by
expanding NOMONO as a brand that is based on regional food culture
and which provides customers in the Tokyo metropolitan area with
surprises, discoveries, and enjoyment.
EkibenEkiben, which are boxed lunches sold at railway stations, add flavor to a
memorable railway journey by featuring recommended or popular dishes
unique to each season or region. Opened in August 2012, the Ekibenya
Matsuri in Tokyo Station has a lineup of approximately 170 varieties of
ekiben sold in stations throughout Japan. Also, the Ekibenya Matsuri has
gained popularity for its two demonstration booths where cooks prepare
and sell fresh ekiben.
Further, as part of efforts to take on new business areas, we held
special events in Singapore and Taiwan to promote sales of ekiben.
Also, in March 2016, we opened a store, EKIBEN , which sold ekiben for
a limited period at Paris-Gare de Lyon Station, in France. By providing
traditional Japanese ekiben and original Paris-Gare de Lyon Bento, the
store introduced customers to makunouchi orizuru bento, a popular part
of Japan’s food culture for more than a century.
>Environment
>Priority Initiatives
• Maximize the value of railway stations by
creating appealing commercial spaces
• Revitalize regional industries
>Numbers
Railway stations used by more than100,000 passengers per day:
94 (as of March 31, 2016)
Railway stations used by more than200,000 passengers per day:
39 (as of March 31, 2016)
* The number of station users represents twice
the number of passengers embarking.
Station
Number of Passengers per Day
1 Shinjuku 1,520,086
2 Ikebukuro 1,113,560
3 Tokyo 869,266
4 Yokohama 822,766
5 Shibuya 744,468
6 Shinagawa 722,932
7 Shimbashi 531,910
8 Omiya 500,958
9 Akihabara 487,842
10 Kita-Senju 419,988
11 Kawasaki 415,450
12 Takadanobaba 405,108
13 Ueno 363,176
14 Yurakucho 334,848
15 Tachikawa 327,806
16 Hamamatsucho 310,668
17 Osaki 309,088
18 Tamachi 297,668
19 Nakano 289,832
20 Kamata 286,544
Top 20 Stations with Large Daily Passenger Use
Omiya
Kita-Senju
UenoAkihabaraTokyo
Osaki
ShibuyaShinjuku
Nakano
Tachikawa TakadanobabaIkebukuro
KamataKawasaki
Yokohama 0 10km
YurakuchoShimbashiHamamatsuchoTamachiShinagawa
* The number of station users represents
twice the number of passengers embarking.

Fiscal 2016 SummaryIn the Shopping Centers & Office Buildings segment, with a view to
strengthening store development capabilities and realizing regionally
rooted management, the JR East Group placed three subsidiaries
responsible for managing station buildings in the northern Kanto area
under the control of subsidiary atré Co., Ltd., in April 2015. Further, the
JR East Group launched JRE POINT as a common Groupwide service in
February 2016. Also, following its opening of atré URAWA (Saitama) in
November 2015 and tekute Nagamachi (Miyagi) in December 2015, JR
East opened the JR SHINJUKU MIRAINA TOWER (Tokyo), phase 1 of
NEWoMan (Tokyo), and S-PAL Sendai East Building (Miyagi) in March
2016. In addition, the JR East Group opened nonowa Kunitachi EAST
(Tokyo) in April 2015 and opened nonowa Musashikoganei WEST
(Tokyo) in December 2015. At the same time, we prepared to open
nonowa Kunitachi WEST (Tokyo) and atré Ebisu west building (Tokyo) in
April 2016. Also, we proceeded with the construction of JEBL Akihabara
Square (Tokyo), scheduled for completion in August 2016; phase 1 of the
Shibuya Station Area Development Plan (East Bldg.), scheduled for com-
pletion in fiscal 2020; and the Yokohama Station West Exit Station
Building Plan (provisional name), scheduled to open in 2020.
40 East Japan Railway Company
REVIEW OF OPERATIONS
Non-Transportation > Shopping Centers & Office Buildings
Opening of JR SHINJUKU MIRAINA TOWER and NEWoManMarch 2016 saw the completion of Shinjuku’s new landmark: JR
SHINJUKU MIRAINA TOWER. Approximately 170 meters high, the new
multipurpose building is located on the former site of Shinjuku Station’s
New South Exit station building. The tower’s 5th to 32nd floors comprise
offices. Meanwhile, the commercial facility NEWoMan occupies six of the
tower’s floors; one floor of Shinjuku Station’s New South Exit concourse,
and three floors of an elevated structure above the train tracks, including
the roof. We plan to create an integrated multipurpose facility that
includes stores and a host of other amenities, such as the culture-creat-
ing space LUMINE ZERO, a clinic including a gynecology department, a
nursery facility, an outdoor plaza, and a rooftop garden. A further aim is
to develop and manage facilities with town development in mind. To this
end, we will unify the designs of facilities near the Shinjuku Station and
develop its environs.
nonowaEstablished in December 2010, JR Chuo Line Mall Co., Ltd., leads the
Chuo Line Mall Project, tasked with heightening the line-side value of the
Chuo Line. Currently, the project is developing the area between Mitaka
and Tachikawa based on the concept of “green × people × linking
towns.” For the JR East Group, the project represents a completely new,
highly significant mission: fostering an overall brand that establishes the
line-side area as a desirable residential zone while advancing painstak-
ing collaborations with local communities.
Approaching development, railway station operations, and commer-
cial facility management in an integrated manner, we will work with store
owners’ associations, commerce and industry associations, and other
stakeholders living and working near railway stations to develop prosper-
ous regions and develop sales areas, railway stations, and communities
that generate regional value.
nonowa Kunitachi EASTNEWoMan
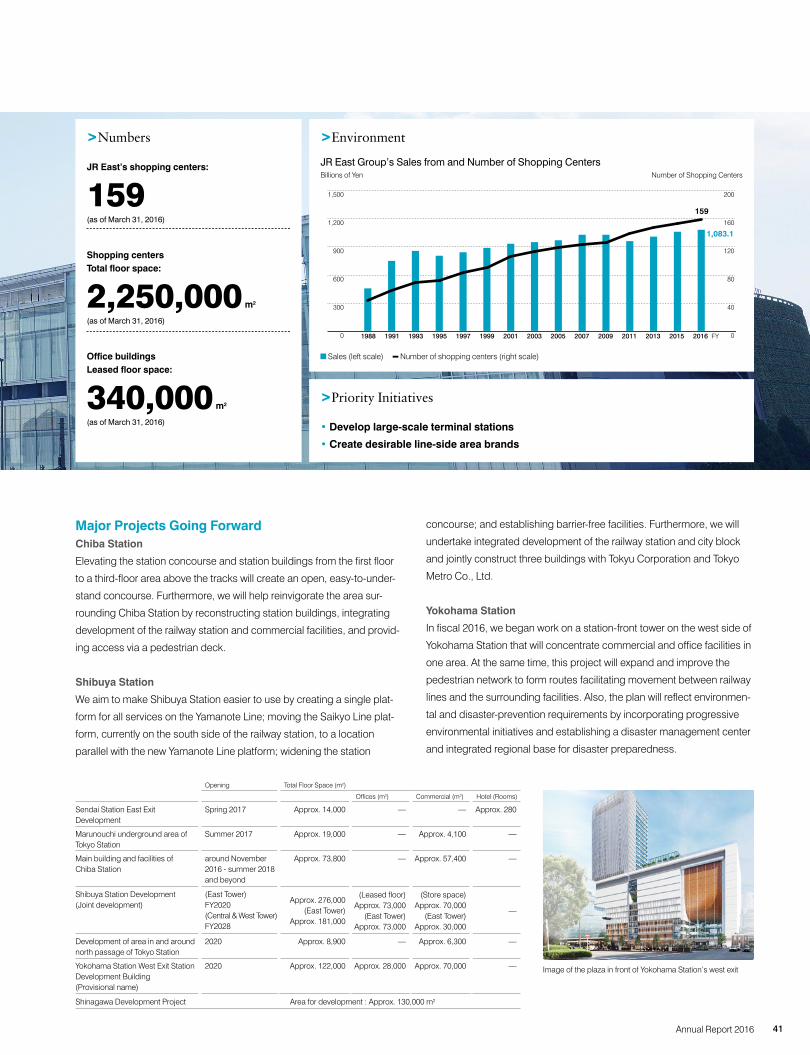
>Priority Initiatives
• Develop large-scale terminal stations • Create desirable line-side area brands
>Numbers
JR East’s shopping centers:
159 (as of March 31, 2016)
Shopping centers Total floor space:
2,250,000 m2
(as of March 31, 2016)
Office buildings Leased floor space:
340,000 m2
(as of March 31, 2016)
JR East Group’s Sales from and Number of Shopping Centers Billions of Yen Number of Shopping Centers
1988 1991 1993 1995 1997 1999 2001 2003 2005 2007 2009 2011 2013 20162015
1,500
1,200
900
300
600
0
200
160
120
40
80
0
159
1,083.1
>Environment
Sales (left scale) Number of shopping centers (right scale)
FY
41Annual Report 2016
Image of the plaza in front of Yokohama Station’s west exit
Major Projects Going ForwardChiba Station
Elevating the station concourse and station buildings from the first floor
to a third-floor area above the tracks will create an open, easy-to-under-
stand concourse. Furthermore, we will help reinvigorate the area sur-
rounding Chiba Station by reconstructing station buildings, integrating
development of the railway station and commercial facilities, and provid-
ing access via a pedestrian deck.
Shibuya Station
We aim to make Shibuya Station easier to use by creating a single plat-
form for all services on the Yamanote Line; moving the Saikyo Line plat-
form, currently on the south side of the railway station, to a location
parallel with the new Yamanote Line platform; widening the station
Opening Total Floor Space (m2)
Offices (m2) Commercial (m2) Hotel (Rooms)
Sendai Station East Exit Development
Spring 2017 Approx. 14,000 — — Approx. 280
Marunouchi underground area of Tokyo Station
Summer 2017 Approx. 19,000 — Approx. 4,100 —
Main building and facilities of Chiba Station
around November 2016 - summer 2018 and beyond
Approx. 73,800 — Approx. 57,400 —
Shibuya Station Development (Joint development)
(East Tower) FY2020 (Central & West Tower) FY2028
Approx. 276,000(East Tower)
Approx. 181,000
(Leased floor) Approx. 73,000
(East Tower) Approx. 73,000
(Store space) Approx. 70,000
(East Tower) Approx. 30,000
—
Development of area in and around north passage of Tokyo Station
2020 Approx. 8,900 — Approx. 6,300 —
Yokohama Station West Exit Station Development Building (Provisional name)
2020 Approx. 122,000 Approx. 28,000 Approx. 70,000 —
Shinagawa Development Project Area for development : Approx. 130,000 m2
concourse; and establishing barrier-free facilities. Furthermore, we will
undertake integrated development of the railway station and city block
and jointly construct three buildings with Tokyu Corporation and Tokyo
Metro Co., Ltd.
Yokohama Station
In fiscal 2016, we began work on a station-front tower on the west side of
Yokohama Station that will concentrate commercial and office facilities in
one area. At the same time, this project will expand and improve the
pedestrian network to form routes facilitating movement between railway
lines and the surrounding facilities. Also, the plan will reflect environmen-
tal and disaster-prevention requirements by incorporating progressive
environmental initiatives and establishing a disaster management center
and integrated regional base for disaster preparedness.

42 East Japan Railway Company
REVIEW OF OPERATIONS
Fiscal 2016 SummaryIn Suica operations, JR East began mutual usage of Suica with the
Sendai City Transportation Bureau’s icsca card in the Sendai area in
March 2016. From December 14, 2015, to heighten the convenience of
Suica further, JR East began Mobile Suica services for SIM-free hand-
sets*1 that are compatible with the services of MVNO*2. The 10th anniver-
sary of the launch of Mobile Suica services was in January 2016.
*1 SIM-free handsets are mobile phone handsets that allow users to insert and use a SIM (subscriber identity module) card of their choice.
*2 An MVNO (mobile virtual network operator) is a communications services provider that uses the network of a major mobile phone company.
Others > Suica
Suica Usage AreaJR East introduced Suica as a prepaid fare collection system based on IC
cards in November 2001 and launched Suica electronic money services in
March 2004. The Suica card’s convenience has earned it strong customer
support. Customers can use the card to make purchases from beverage
vending machines and at stores inside as well as outside railway stations.
As for the Suica usage area, efforts to improve customer convenience
culminated in the launch of a nationwide mutual service network linking
10 public transportation IC cards*3 in March 2013. To make this network
possible, transportation companies abandoned bilateral agreements on
mutual usage in favor of a blanket approach. Today, travelers can use Suica,
or any one of the IC public transportation cards, for most train and bus
services—and some other modes of public transportation—in almost every
major city in Japan. Suica was usable at approximately 4,670 railway stations
and for approximately 28,000 bus services nationwide as of March 31, 2016.
*3. Kitaca, PASMO, Suica, manaca, TOICA, PiTaPa, ICOCA, Hayakaken, nimoca, and SUGOCA
Suica Electronic MoneySince launching Suica electronic money in March 2004, JR East has been
expanding business partnerships for the card with the aim of popularizing
its usage in a wide variety of settings. We have extended the card’s
usability beyond in-station stores and vending machines to include
convenience stores, shopping centers, and mass retailers of electronics
and home appliances outside railway stations. In addition, JR East is
broadening Suica’s usage environment to include various other aspects
of daily life, such as online shopping, domestic in-flight shopping, home
video game consoles, and gas stations.
As a result of these efforts, usage of Suica electronic money has
grown continually. As of March 31, 2016, Suica was usable at approxi-
mately 342,600 stores, and the record for daily transactions for public
transportation electronic money reached approximately 5.2 million. The
target record for daily transactions for public transportation electronic
money is eight million by fiscal 2021.
Using Suica electronic money at a vending machineNationwide mutual usage service
• As a basic rule, IC cards cannot be used for continuous travel from an area served by one IC card to another. However, as an exception to this rule, IC cards can be used on direct service between lines served by the Suica and PASMO cards in the Tokyo metropolitan area, and certain direct service segments served by the SUGOCA and Hayakaken cards in Kyushu.
• Some transportation companies do not accept IC cards.
Kitaca area
Suica area
PASMO area
TOICA area
PiTaPa areaICOCA area
SUGOCA area
nimoca area
Hayakaken area
manaca area

43Annual Report 2016
>Priority Initiatives
• Enhance convenience as IC railway ticket
• Promote further growth in electronic money business
>Numbers
Suica cards issued:
59.2 million (as of March 31, 2016)
Public transportation electronic money, record daily transactions:
5.2 million (Heighest ever)
(as of March 31, 2016)
Public transportation electronic money, compatible stores:
342,600 (as of March 31, 2016)
The Mobile Suica interface Using Mobile Suica on a smartphone
Mobile SuicaAn evolved version of Suica that uses the telecommunications and dis-
play functions of mobile phone handsets, Mobile Suica was launched in
January 28, 2006. By using a pre-registered credit card to add credit to
their mobile phone handsets, customers can use them as Suica cards to
pay for railway services or purchase goods. In addition, Mobile Suica
caters to customers’ needs by enabling the purchase of a wide range of
tickets and services. These include commuter passes; a Suica Green
ticket; EASY Mobile Suica, for which credit card registration is not
required; Mobile Suica limited express tickets, which enable ticketless
use of the Hokkaido, Tohoku, Yamagata, Akita, Joetsu, and Hokuriku
Shinkansen services; and ticketless use of the Tokaido and Sanyo
Shinkansen EX-IC services.
Synergies between Suica and Non-Suica BusinessesIn addition to functioning as an IC railway ticket and as electronic money,
Suica has a variety of other functions. This convenience leads to synergy
benefits for JR East’s non-Suica businesses. For example, increasing
use of IC railway tickets is allowing us to remove more automated ticket
vending machines, freeing up space in station concourses. Group
companies use these spaces to build restaurants or stores or to install
in-station VIEW ALTTE ATMs, thereby creating new business opportunities.
New business opportunitiesTaking on challenge of “data businesses” that analyze
and utilize Suica travel and settlement data
• Reduced equipment
maintenance costs
• Increased operational
efficiency due to reduction
in automated ticket
vending machines
• Paperless tickets, etc.
• Increased revenues due to enhanced efficiency of cash-register operation
• Improved operational efficiency due to reduced cash handling
• Provision of speedy settlement services, etc.
Commission revenues from outside companies
Railway operations
Life-style service business
Innovation in railway operations
area
Innovation in life-style
service business area
Synergies between Suica and non-Suica businesses
Suica business
Synergy1
Synergy3
Synergy2
Record Daily Transaction Volume of Public Transportation Electronic Money Cards*1 Million Transactions
*1 Comprising Kitaca, PASMO, Suica, manaca, TOICA, ICOCA, Hayakaken, nimoca, and SUGOCA
March2009
July2010
July2011
July2012
August2015
July2014
July2013
6.0
5.0
5.2
4.0
3.0
2.0
1.0
0
>Environment

44 East Japan Railway Company
REVIEW OF OPERATIONS
Fiscal 2016 SummaryExploiting its network, the JR East
Group operates various hotels, ranging
from city hotels near railway stations
through to relaxing hotels surrounded
by nature. The Group plans to continue
development initiatives that take full
advantage of its management resources.
>Numbers
Hotels: Guest rooms:
45 6,687 (as of March 31, 2016)
Metropolitan Hotels occupancy:
82.5% (as of March 31, 2016)
HOTEL METS occupancy:
82.6% (as of March 31, 2016)
Others > Hotel Operations
The Tokyo Station HotelFirst opened in 1915, The Tokyo Station Hotel suspended operations in March 2006 while Tokyo
Station Marunouchi Building underwent restoration. The hotel reopened in October 2012 as a
unique leading-edge facility housed in the historically restored splendor of the station building,
designated as an Important Cultural Property of Japan. Occupying two basement floors and four
above-ground floors, the hotel has a floor area of 20,800 m2 and 150 guest rooms.
HOTEL METS: Accommodation-Based Hotels Providing Comfortable EnvironmentsNear railway stations and used mainly for accommodation, HOTEL METS hotels are ideal bases for
business or tourism. These new-type business hotels have become popular by offering comfortable,
reasonably priced rooms with facilities comparable with those of city hotels. Aiming to strengthen
the competitiveness of existing hotels, the JR East Group renewed HOTEL METS Musashisakai
(Tokyo), HOTEL METS Nagaoka (Niigata), HOTEL METS Mizonokuchi (Kanagawa), and HOTEL
METS Urawa (Saitama).
View CardIn April 2015, Viewcard Co., Ltd., began soliciting applications for the JR East Group’s first gold
credit card, View Gold Plus Card. The credit card is designed to make day-to-day life more conve-
nient by being highly useful. Customers can use it to pay for daily travel on railways in the JR East
Group’s service area and a range of services in railway stations. Moreover, View Gold Plus Card
offers benefits not only to card holders but also their family members.
Further, we opened the View Gold Lounge on the first floor of GranRoof at Tokyo Station’s Yaesu
Central Exit in December 2015. View Gold Plus Card members riding in the Green Cars of
Shinkansen or limited express services departing from Tokyo Station and customers riding in the
GranClass railcars of Shinkansen services departing from Tokyo Station can use the lounge free of
charge. It offers beverages, light snacks, and other services before departure on the day of travel.
Others > Credit Card Business
Guestroom in The Tokyo Station Hotel
View Gold Plus Card
View Gold Lounge

45Annual Report 2016
Column 1
Column 2
JRE POINT
JR East Dynamic Rail Pack
To promote cohesive Group management in accordance with “JR East Group Management Vision
V—Ever Onward,” we have launched JRE POINT as a common Groupwide points service. Our
goal is to establish a service that makes points easy to save and use.
To this end, the JR East Group made JRE POINT the common points service for the points
services of atré, Boxhill, GRANDUO, Shapo, and TERMINA on February 23, 2016. The next step will
be to incorporate the points services of other station buildings into JRE POINT. Ultimately, plans
call for unification of View Thanks Point and Suica Point with JRE POINT.
JR East Dynamic Rail Pack is a variable-price travel product that allows
customers to combine Shinkansen or limited express services within
the JR East Group’s service area and hotels. Prices of train services and
accommodation vary depending on when customers buy them, the
season they travel in, and demand trends. Through the JR East
Dynamic Rail Pack website, customers are free to choose and buy
products suited to their plans and aims. Further, individual customers
can buy the travel product.
Service Details
Collect Points at a Range of
Different Station Buildings!
Customers receive one point for every ¥100*
spent on goods, food, and other items at JRE
POINT-affiliated station buildings. Points are
easy to save because saved points automati-
cally become valid for a further two years
each time customers use points.
* Not including tax
1 Point = ¥ 1 !
When shopping at JRE POINT-affiliated station
buildings, one JRE POINT is worth ¥1. Also,
customers can exchange points for railway-
related products.
Customers Can Check Points
Anytime!
Customers can use the JRE POINT website
to check their point balance or history and
campaign information. In addition, we will
use the website to inform customers about
JRE POINT.
Website:
eki-net, in JR East domestic tours section under
JR East Dynamic Rail Pack
Personal computers: http://www.eki-net.com/travel/
Smartphones: http://www.eki-net.com/travel/sp/
Business hours: 5:30 a.m.–11:40 p.m., year round
Train services included:
Shinkansen services and main limited express services on conventional
lines in JR East’s service area
Note: Hokuriku Shinkansen services (in JR West’s service area beyond Joetsumyoko Station), Tokaido Shinkansen services, limited express services between JR East’s service area and those of other railway operators, and certain limited express direct services between JR East’s service area and those of private railway operators are not included.
JRE POINT Logo JRE POINT Card
Website: http://www.jrepoint.jp/ (in Japan)
Step (1)Choose destination
Step (2)Choose hotel
Step (3)Choose train
Step (4)Pay
Step (5)Go!
JR East Dynamic Rail Pack (rendered image)

46 East Japan Railway Company
TO ACHIEVE SUSTAINABLE GROWTH
Pursuing “Extreme Safety Levels”
Our Basic Approach to SafetySafety has been the JR East Group’s top management priority since its establishment, and the Company has worked con-
stantly to heighten safety levels. Learning from unfortunate accidents in the past, we are continuing accident prevention
efforts, which focus on physical infrastructure as well as less tangible systemic and personnel initiatives.
Safety measures never end. We will continue to work tirelessly to improve safety by pursuing a goal of zero accidents
involving passenger injuries or fatalities and zero accidents involving employee fatalities, including employees of Group
companies and partner companies.
“JR East Group Safety Plan 2018”Reflecting the high priority of safety, we have completed a series of
five-year safety plans since our establishment.
In fiscal 2015, we began a sixth five-year safety plan, “JR East Group
Safety Plan 2018.” Through the safety improvement efforts of each
employee in the railway business, the whole JR East Group will take on
the challenge of realizing “extreme safety levels.”
“JR East Group Safety Plan 2018” clarifies policies in relation to
preventing accidents, such as accidents due to internal factors, and sets
out specific measures. Under the plan, we will improve safety manage-
ment capabilities by ensuring skills and expertise are passed on and
promoting an appreciation of the gravity of accidents to foster safety-
conscious personnel.
Overview of “JR East Group Safety Plan 2018”
Zero accidents involving passenger injuries or fatalities, zero accidents involving employee fatalities, and a reduction in employee injuries
In “JR East Group Safety Plan 2018,” ‘employees’ refers to each of our employees involved in the railway busi-ness, including those of JR East, the JR East Group, and partner companies.
Ingraining the cultures of safety
Steadily reducing risk
Improving safety management
Priority improvement plan
for safety equipment
Four pillars
Goals
Accidents due to internal factors
Ensuring zero occurrence
Targeted directions
Accidents due to external factors
Reducing risk as planned
Accidents closely related to the public
Comprehensive measures in cooperation with the community
0
Legend : Newly added items of priority in “JR East Group Safety Plan 2018”
Each employee works to expand his or her own capabilities and
improve safety through teamwork.
1988 1989 1990 1991 1992 1993 1994 1995 1996 1997 1998 1999 2000 2001 2002 2003 2004 2005 2006 2007 2008 2009 2010 2011 2012 2013 2014 2015 2016 FY
400
300
200
100
0
Trends in Railway Accidents Railway Accidents

47Annual Report 2016
An example of our risk evaluation methods
Sangen Principle: Three Actualities PrincipleAccidents and incidents always occur at the Genba*. This means that the sources of accident
prevention can also be found at the Genba.
Reflecting the Three Actualities Principle, which emphasizes actual locations, actual objects, and
actual people, the JR East Group will continue seeking solutions that cannot be found through abstract
theorizing.
* Genba: Genba means the actual locations, objects, and people that directly affect the safety of our operations. These locations, objects, and people are our points of contact with our customers and the basis of our transportation and services.
Reducing Risk SteadilyWe have categorized accidents into accidents due to internal factors,
accidents due to external factors, and accidents closely related to the
public and established policies for each type of accident. Based on
these policies, we will take measures aimed at steadily reducing risk.
Eradicating Accidents Due to Internal Factors Completely
Our goal is to eradicate preventable accidents due to internal factors by
further upgrading railway operation and maintenance systems. In addi-
tion to our risk reduction measures for personnel and management, such
as education and training, we will further strengthen risk reduction mea-
sures that we have been implementing. Also, we intend to use all pos-
sible means to reduce risk, including reforming systems through the
utilization of technological developments in ICT, big data, and GPS.
Reducing the Risk of Accidents Due to External Factors
We will steadily reduce the risk of damage due to abnormal weather,
such as the increasing occurrence of torrential localized rain and gusts of
wind; floods; and volcanic eruptions. To minimize damage caused by
natural disasters due to external factors, the JR East Group will take
planned risk reduction measures immediately after natural disasters.
Reducing the Risk of Accidents Closely Related to the Public
We will steadily take measures to prevent accidents at railway crossings
and to prevent customers from falling from platforms. At the same time,
we will continue furthering understanding of the risks associated with
railways among customers and local residents and seeking their coop-
eration to prevent the occurrence of such accidents. The JR East Group
intends to take comprehensive measures, including the conducting of
accident prevention campaigns for platforms, escalators, and railway
crossings and the elimination of railway crossings in cooperation with
local municipalities.
The Three Actualities Principle
Genchi (Actual location): Go to the actual location to comprehend the circumstances
Genbutsu (Actual object): Examine the actual object (rolling stock, equipment, machine, or tool) to comprehend its condition
Genjin (Actual people): Meet face-to-face with the people actually involved to comprehend the situation
The Three Actualities Principle in effect
Unearthing Hidden Risks and Advancing Preemptive MeasuresPhenomena not currently viewed as risks can emerge as risks due to
changes in conditions surrounding railways. We will continue to monitor
risk regularly, identify emerging risks, and take preemptive measures.
Furthermore, we will use risk evaluation methods to regularly monitor
changes in the risk of accidents occurring and analyze the prioritization
of countermeasures.
Passengers on platforms coming into contact with trains
Railway-crossing derailments
Low-speed derailments
Major earthquake
Derailments due to excessive speed
Wheel-climb derailments due to earth and sand
Envisioned damage ranking
High
Major
Low
Minor
Freq
uanc
y of
acc
iden
t occ
urre
nce

48 East Japan Railway Company
TO ACHIEVE SUSTAINABLE GROWTH
Priority Improvement Plan for Safety Equipment• JR East has invested more than ¥3 trillion in priority improvements to safety equipment since the Company’s establishment in 1987.
• We will continue priority improvements to safety equipment in fiscal 2017.
• During the five-year period from 2014, we expect to invest approximately ¥1 trillion in safety.
Building a Railway Capable of Withstanding Natural DisastersLearning from past earthquakes, such as the Great Hanshin-Awaji
Earthquake, the Sanriku Minami Earthquake, and the Niigata Chuetsu
Earthquake, JR East has been focusing on the following three earthquake
countermeasures.
(1) Stopping trains immediately (emergency train-stop measures)
(2) Preventing structural damage (seismic reinforcement measures)
(3) Minimizing secondary accidents following derailments (measures to
prevent derailed trains leaving track area)
Although the Great East Japan Earthquake damaged some seismically
reinforced viaduct columns, in seismically reinforced locations it did not
Pursuing “Extreme Safety Levels”
FY1988 1989 1990 1991 1992 1993 1994 1995 1996 1997 1998 1999 2000 2001 2002 2003 2004 2005 2006 2007 2008 2009 2010 2011 2012 2013 2016 2017Plan
2014 2015
500
400
300
200
100
0
Trends in Safety Investment Billions of Yen
Safety investment Other investment
cause shear failure or the falling or collapsing of railway viaducts. On
conventional lines, however, the earthquake damaged some bridges that
were not seismically reinforced. Further, the earthquake caused electric
poles to collapse and materials to fall from the ceilings of station buildings.
In light of the lessons of the Great East Japan Earthquake, JR East
aims to build a railway capable of withstanding natural disasters. To this
end, we have designated the five-year period from fiscal 2013 as a priority
improvement period in which we plan to invest approximately ¥300 billion.
During the remainder of this period, we will continue implementing seismic
reinforcement in preparation for a possible earthquake directly beneath
the Tokyo metropolitan area, increasing seismic reinforcement in Sendai
and other areas, and strengthening seismic observation systems and
telecommunications capabilities during disasters.
Seismic reinforcement measuresArch viaducts built from bricks
Rail rollover prevention devices
Operational Restrictions when Earthquakes Occur
Natural vibration periods of structures
Spee
d
Period (sec.)
0.1 2.5
Operation control order
Conventional lines:
Disaster prevention information system
Shinkansen:
Computerized Safety, Maintenance and
Operation Systems of Shinkansen
(COSMOS)
SI value
Earthquake Seismometer
Reinforced section

Customer satisfaction level of at least 88%
Improve transportation quality
Provide reliable transportation
services
Realize railway services customers
can use confidently
Enhance information provision during
transportation service disruptions
Realize railway services customers
can use comfortably
Provide impressive customer service
Pursue customer-friendly railway services
Increase mutual communication with customer feedback as starting point
Develop personnel and organizations that proactively think and act from the customer’s perspective
No. 1 for customer satisfaction in the Japanese railway industry
Sustainable growth
“Medium-term Vision for Service Quality Reforms 2017”
Provide Reliable Transportation ServicesWe are implementing various measures to improve transportation quality
by preventing transportation service disruptions, realizing prompt
resumption of train operations after transportation service disruptions,
and minimizing the effects of disruptions on other line segments.
Our ongoing disruption countermeasures include the introduction of
railcars with dual systems*, the increased installation of next-generation
track switches that are less likely to fail, and the prevention of lightning
strike damage to electric facilities.
To realize prompt resumption of operations, we are continuing to
enhance our post-disruption response capabilities through such mea-
sures as drills for dealing with accidents that have resulted in casualties
and rescuing passengers.
In addition, to minimize the impact on customers, on line segments in
which operations have not been disrupted, wherever possible we use
contingency shuttle operations—which turn trains back before they enter
a disrupted line segment—as well as alternative line operations.
* Railcars with dual systems: Railcars that have increased reliability thanks to their duplication of major equipment based on the concept of build-in redundancy.
Enhance Information Provision during Transportation Service DisruptionsTo enhance information provision during transportation service disruptions,
JR East is taking steps to provide customers with more accurate informa-
tion by announcing the expected time of transportation service resumption
within 10 minutes of suspending operations due to an accident that has
caused casualties and providing subsequent updates.
In addition, we have installed displays for providing information on
transportation service disruptions (at 249 stations as of March 31, 2016).
For smartphones, we offer the “JR East Train Operation Information
Push Notification” service, which provides timely information on train
services on conventional and Shinkansen lines in our service area. Also,
JR East provides JR-EAST Train Info app, Doko-Train, and NETRAINS+,
which distribute real-time information on train services and enable cus-
tomers to use smartphones or tablet computers to check the operational
status of individual trains without going to a railway station.
49Annual Report 2016
Service Quality Reforms
Our Basic Approach to Service Quality“JR East Group Management Vision V—Ever Onward” cites
“Service Quality Reforms” as part of the Group’s “Eternal
Mission.” To become a corporate group that is the preferred
choice of customers and local communities, JR East will
reform service quality through cross-divisional and cross-
sectional teamwork with the aim of becoming Japan’s No.1
railway in terms of customer satisfaction.
We prepared the “Medium-term Vision for Service
Quality Reforms 2017,” a three-year plan that began in
2015. This vision is founded on increasing mutual commu-
nication with customer feedback as the starting point and
developing personnel and organizations that proactively
think and act from the customer’s perspective. On these
foundations, the vision positions five pillars for further
improvement: reliability, information provision during
service disruptions, confidence, comfort, and service.
JR-EAST Train Info app Doko-Train

Energy Conservation and CO2 Reduction—Measures to prevent global warming—
The electricity consumed by JR East for train operations as well as for
lighting and air-conditioning at railway stations and in offices is supplied
by its own power plants and electric power companies. Besides electric-
ity, we use diesel fuel and kerosene for diesel train operations and for
air-conditioning at stations and in offices. We will continue saving energy
in train operations, which account for about 80% of our total energy
consumption, and taking a range of measures at operating bases to
reduce CO2 emissions.
50 East Japan Railway Company
TO ACHIEVE SUSTAINABLE GROWTH
Technological Innovation > Environment
Our Basic Approach to EnvironmentThe JR East Group formalized its basic philosophy and policies in 1992 and established activity guidelines in 1996. Our
specific environmental protection measures are based on these.
Basic philosophy
• The entire JR East Group, as a member of society, will diligently strive to balance global environmental protection with its business activities.
Basic policies
• To contribute to creating a global environment for the future through our business activities for our customers and local communities
• To develop and provide the technology needed to protect the global environment
• To maintain our concern for the global environment and raise the global environmental awareness of our employees
Environmental Superiority of RailwaysRegarding passenger transportation in Japan, railways provide approximately 28% of passenger transportation but only account for roughly 3.9% of
total energy consumption. This clearly demonstrates that trains have better energy efficiency per unit of transportation volume than automobiles and
other means of transportation.
Energy Consumption Volume and Transportation Market Share (Fiscal 2014 result)
Breakdown of JR East’s Energy Consumption Billions of MJ
Automobiles Railways Airways
Source: Compiled based on data from the Energy Conservation Center, Japan (ECCJ)’s Handbook of Energy & Economic Statistics in Japan 2016
0% 20% 40% 60% 80% 100%
Energy consumption by passenger transportation mode
88.6 3.9 7.5
Market share by passenger transportation mode
65.8 28.4 5.8
Calculation MethodFigures have been calculated pursuant to the calculation methods stipulated in the Act on the Rational Use of Energy and the Act on Promotion of Global Warming Countermeasures. However, figures for electricity generated by JR East have been multiplied by 9.76 MJ/kWh.
2011 2012 2013 2014 2015 2016
60
50
40
30
20
10
0 FY
Conventional line operation Shinkansen line operation Railway stations, rolling stock centers, etc. Head office, branch office buildings, etc.

51Annual Report 2016
Technological Innovation > Research and Development
Our Basic Approach to Research and DevelopmentIn accordance with “JR East Group Management Vision V—Ever Onward,” we are stepping up the pursuit of “extreme
safety levels” through efforts aimed at “building a railway capable of withstanding natural disasters” and the “development
of railways that passengers can utilize reliably.” Also, in a range of fields we are energetically advancing technological
innovation with particular emphasis on the three pillars of technological innovation: “establishing energy and environmental
strategies,” “utilizing ICT,” and “operating Shinkansen at faster speeds.”
Development of a system for monitoring device from trains in operation * Rendered image
JR East is currently developing a system that
will allow constant monitoring of onboard
devices and wayside equipment by trains in
operation. We are testing the durability of the
system by conducting trial monitoring. At the
same time, we are proceeding with R&D on
data transfer technologies.
If, through monitoring, we can assess each
piece of equipment’s state of deterioration, we
will be able to predict failures and conduct
repairs in a more systematic manner, thereby
further enhancing our ability to provide safe
and reliable transportation. In conjunction with
this initiative, we are studying ways of utilizing
the frequency data that we acquire through
monitoring.
Pursuing “Extreme Safety Levels”Our R&D activities include research on human factors, which seeks to
understand accidents and their causes accurately and prevent accidents
through cause analysis; research on the safety of railcars to prevent
wheel-climb derailments at low speeds; development of safety systems
for maintenance work; research on safety evaluation in relation to natural
disasters such as wind gusts, earthquakes, torrential rain, and snow; and
research to ensure the safety of customers at railway stations.
Establishing Energy and Environmental StrategiesTo advance initiatives for the prevention of global warming steadily, the JR
East Group has set out environmental goals and proceeded with a range of
environmental preservation measures. However, reaching our environmen-
tal goals will require stepped-up innovation in the environmental technology
field. Aiming to establish energy and environmental strategies, we are
pursuing R&D activities focused on three areas: utilizing renewable energy
sources, energy conservation, and smart grid technology for railways.
Utilizing ICTWe are actively utilizing ICT (information and communications technology),
which has advanced rapidly in recent years, and are furthering R&D with
a view to realizing the provision of information that caters to the needs of
each customer. Also, we are advancing R&D aimed at using ICT to
innovate transportation systems, maintenance work, and other frontline
operations. In the transportation system field, with a view to transforming
the Tokyo metropolitan area transportation system, we have tackled such
initiatives as R&D for a next-generation train control system. In the main-
tenance field, viewing target facilities and equipment as assets, we have
introduced a “smart maintenance strategy” that maximizes asset perfor-
mance. We are conducting R&D to realize this strategy.
Operating Shinkansen at Faster SpeedsAiming to operate Shinkansen at speeds of up to 360 km/h, we are
proceeding with R&D focused on such areas as improving stability during
high-speed operation. Also, by reflecting the achievements of this research
in the operation of Shinkansen at 320 km/h, we will enhance safety and
reliability even further.
Track facilities monitoring device
Electrical facilities monitoring deviceTemperature sensor

52 East Japan Railway Company
TO ACHIEVE SUSTAINABLE GROWTH
Communities → New industries→ Job creation
Strengthening Collaboration with Local Communities
Our Basic Approach to Collaboration with Local CommunitiesThe JR East Group’s existence depends on the vitality of eastern Japan and of Japan as a whole. Therefore, as a company
responsible for railways—which form part of society’s infrastructure—and as a member of local communities, we will
work with each community to establish and move toward its target profile. In addition, the Group will take advantage of its
unique capabilities to invigorate local communities and promote tourism while advancing the development of appealing
railway station-centered towns.
NOMONO 1-2-3 ProjectTo strengthen collaboration with local communities further, our Rediscovering the Regions Project has been creating
attractive products by applying advanced processing technology to local produce and other high-quality regional
ingredients. Through this initiative, the JR East Group is encouraging manufacturing that integrates regions’ primary,
secondary, and tertiary industries to achieve sextic industrialization*.
The NOMONO 1-2-3 Project is a manufacturing initiative aimed at supporting eastern Japan through product
development and sales in collaboration with regional farming, forestry, and fishery industries. The name “NOMONO
1-2-3” derives from the idea of discovering seasonal goods, shun no mono; local goods, chi no mono; and traditional
goods, yukari no mono; and JR East’s promotion of manufacturing that integrates primary, secondary, and tertiary
industries to achieve sextic industrialization.
* The expansion of agriculture, forestry, and fisheries to include food processing, logistics, and marketing
JR Tomato Land Iwaki Farm Co., Ltd.—Thriving in Partnership with Communities
We are expanding sales channels for local products and introducing
sextic industrialization to regions. For example, we collaborated with
progressive farmers in Iwaki, Fukushima Prefecture, to establish a
new company engaged in tomato production on September 4, 2014.
The new company constructed a sunlight-based plant factory,
which would safely and reliably produce high-quality tomatoes. At
the same time, JR East will collaborate with the local community and
Group companies to integrate production, distribution, and sales,
thereby increasing railway travel and invigorating the region.
Business Scheme
JR East formed an alliance with leading
tomato producer Tomatolandiwaki Co., Ltd.,
a pioneer in the construction of sunlight-
based plant factories. With this partner, JR
East established JR Tomato Land Iwaki
Farm Co., Ltd., which is growing tomatoes for Group Companies in the
Tokyo metropolitan area to use in their operations. Moreover, Wonder
Farm processes, sells, and features tomato dishes in its restaurant.
NOMONO 1-2-3 Project Conceptual Diagram
Advanced technologyGoods producers
Manufacturing added value
Group company:Station buildings
Group company:Retail / catering
Group company:Hotels, etc.
Internet
Non-Group companies
Primary industry: Production Secondary industry: Processing Tertiary industry: Sales
Appealing ingredients / materials (agriculture, forestry, and fishery products)
Process development (technology)
Information distribution Marketing site
NOMONO
Production area tourism Inter-regional exchange
Marketing feedback on consumer demand
Distribution of information on NOMONO 1-2-3 Project
Test-marketing channel utilization
Marketing channelCoordination among branch offices and Group companies
station

53Annual Report 2016
Tackling New Business Areas
Our Basic Approach to Tackling New Business AreasBased on “JR East Group Management Vision V—Ever Onward,” the JR East Group continues to venture into new business
areas. The overseas railway market is expected to see average annual growth of 2.5% and account for revenues of ¥22
trillion by 2020.
Given this expected market expansion, the JR East Group is actively planning and participating in international railway
business projects in partnership with companies in Japan and overseas with the aim of growing the Group. To gather
information for such projects, we have established five overseas offices in New York, Paris, Brussels, Singapore, and London.
Developing International Railway ProjectsAs well as supplying rolling stock overseas, we are moving forward with
various international railway projects, including projects in the fields of
operation and maintenance. In December 2013, in partnership with
Marubeni Corporation and Toshiba Corporation, we established an
operating company, Japan Transport Technology (Thailand) Co., Ltd.
(JTT), tasked with performing comprehensive maintenance for the rolling
stock and ground installations of the Purple Line*, a mass rapid transit
railway currently under construction in Bangkok, Thailand. We are con-
tinuing to move forward with this project, for which the JR East Group’s
Japan Transport Engineering Company provided 63 railcars, comprising
21 sets of three-car stainless steel trains.
This project will mark the first use of Japanese-made rolling stock on
the rapid transit rail network in Bangkok. Furthermore, it will be the first
participation in an overseas railway maintenance business of an alliance
of companies that includes a Japanese railway operator. Operations are
scheduled to begin in August 2016.
* The Purple Line is a railway line in Thailand’s capital, Bangkok, which will link the Bang Sue district, in the northern part of the city, to the Bang Yai district in the northwestern suburbs. A Thai railway operator, Bangkok Expressway and Metro Public Company Limited, will manage the railway line, which will have 16 stations and a length of approximately 23 km. (as of June 2016)
Supporting Overseas Railway OperatorsWe provide support to overseas railway operators to help them and
expand the scope of our business. Between 2013 and 2015, we trans-
ferred 476 205-Series, formerly used on the Saikyo Line, Yokohama Line,
and other lines, to the PT KAI Commuter Jabodetabek urban rail system
in Indonesia*. In addition, we have provided technical support for the
maintenance of the transferred rolling stock by dispatching in-house
technicians. Further, we provided technical support for the inspection
and servicing of rolling stock by train crew members. Also, in 2015 JR
East transferred diesel trains to Myanmar. We transferred to Myanmar
Railways 19 diesel railcars (Kiha 40 Series, Kiha 48 Series) that were
used in the Tohoku and Niigata regions and dispatched employees to
provide technical support for rolling stock maintenance. We will continue
developing such collaborations further by offering more comprehensive
technical support.
* PT KAI Commuter Jabodetabek is a railway company that operates commuter railways in the Jakarta metropolitan area of Indonesia.
The delivery of railcars for the Purple Line Providing technical support in Myanmar

FY
Developing Employees and Creating a Corporate Culture that Maximizes Human Potential
Our Basic Approach to Personnel DevelopmentThe capabilities of each employee underpin the JR East Group. Our basic philosophy is to employ personnel based on
their personalities and capabilities and foster personnel patiently until they fully realize their potential.
Realizing the Capabilities of PersonnelTo ensure safe and reliable railway transportation services and provide
services that satisfy customers, creating an environment in which the JR
East Group’s personnel can fully realize their potential is paramount. It is
not an exaggeration to say that our success in fostering personnel who
can decide the role they should play and then act accordingly will deter-
mine the future of our entire organization.
Given that society and working people’s attitudes and environments
are changing constantly, the JR East Group must sustain the motivation
and ambition of employees as they endeavor to meet their responsibili-
ties. We believe that, ultimately, such efforts will improve safety and
increase customer satisfaction.
We aim to provide a workplace environment in which all employees can
enjoy their work and set ambitious goals. To this end, we focus on sus-
taining the motivation and ambition of each employee, ensuring work-life
balance, and benefiting from the talents of an even more diverse spec-
trum of personnel. Bearing these points in mind, we are taking a variety
of measures to create a company that develops personnel through work.
“JR East Group Management Vision V—Ever Onward” calls on us to
motivate employees by establishing additional open training programs
and projects and stepping up personnel exchanges with other compa-
nies. Further, the vision emphasizes building a corporate culture that is
open to the outside world and fostering broadminded personnel by
passing on technical knowledge and skills to the next generation and
participating in technological innovation and overseas railway projects.
Promoting DiversityWe believe that employees who find their work worthwhile and satisfying
are able to take full advantage of their capabilities and fulfill their roles,
thereby enhancing our competitiveness.
To cultivate a corporate culture in which diverse personnel can play
important roles, we implement the Work-Life Program and promote
diversity and work-life balance. Specifically, we are reforming employees’
mindsets and creating a new culture by conducting seminars, operating a
diversity-themed intranet site, and taking measures in each organization
through the Work-Life Program
Network, which underpins the
advancement of the Work-Life
Program in workplaces. We also
encourage awareness of work-life
balance among employees by
inviting their families to visit work-
places during our Family Day event. Employees’ families visiting a workplace on Family Day
Supporting Balance between Work and Childcare / Nursing Care• Extended availability of childcare leave by one year, until child reaches
three years of age (April 2010)
• Introduced system of reduced daily working hours and increased
holiday entitlement (April 2010)
• Established workplace nursery schools (two in Tokyo and one in
Sendai) and hospital nursery school (JR Tokyo General Hospital)
• Began conducting seminars to help employees balance work and
childcare / nursing care
2010200920082007200620052004 2011 2012 2013 2014 2015 2016
500
400
300
200
100
0
25
20
15
10
5
0
Employees Taking Childcare Leave and Percentage of whom Male Employees Persons %
Female employees Male employees Percentage of male employees
Main Concepts and Pillars of the Work-Life Program
Main concepts
Main pillars
Gender equality Diversity Work-life balance
Supporting bal-ance between
work and childcare / nursing care
Helping employ-ees fully realize
capabilities
Reforming employees’ mindsets and creating a new
culture
54 East Japan Railway Company
TO ACHIEVE SUSTAINABLE GROWTH

Increasing Employment Opportunities for WomenTo increase women’s employment opportunities, we ensure that women
account for more than 20% of our new recruits. At the same time, we are
making more positions available to women in such areas as frontline
operations and planning departments. For example, around 40% of the
crews working on the Yamanote Line are female employees. Also, the
number of female managers is increasing year by year. More women are
working in such important positions as deputy general managers at the
head office and branch offices; supervisors of facilities in the field, such as
station managers; and executives of Group companies. The promotion of
a female employee to the position of corporate officer for the first time
testifies to the growing employment opportunities for women. Moreover, by
establishing child-rearing support programs and developing our in-house
culture, we have increased the retention rate among female employees.
Only accounting for 0.8% of employees when the JR East Group was
established, female employees account for 11.3% as of April 1, 2016.
Employing People with DisabilitiesIn the JR East Group, a wide variety of personnel play significant roles
irrespective of gender, age, nationality, or whether or not they have dis-
abilities. Employees with disabilities accounted for 2.46% of our work-
force as of June 2016. Also, aiming to meet our social responsibility to an
2011201020092008200720062005 2012 2013 2014 2015 2016 2017*
500
400
300
200
100
0
Number of Female Managers Persons
even greater degree by promoting the employment of people with dis-
abilities and establishing working conditions amenable to them, we
established JR East Green Partners Co., Ltd., in April 2008. The company
acquired certification as a special subsidiary in May 2009.
Promoting Skills DevelopmentDeveloping personnel and ensuring the passing on of technical knowl-
edge and skills are vital to the JR East Group’s sustained growth.
Committed to developing personnel through work, the JR East Group is
enhancing its capabilities as an organization and developing the next
generation of personnel.
Developing the Next Generation of Railway Engineers at Skills Training CentersAs part of our efforts to ensure that experienced employees pass on their
technical knowledge and skills to the next generation of railway engi-
neers, we have established 104 skills training centers at new and existing
training facilities. These centers support the passing on of railway-spe-
cific technical knowledge and skills at each workplace by simulating
conditions in the field. For example, in our rolling stock maintenance
section, the skills training center has railcar mockups that include power
collection equipment, door opening-closing devices, and braking equip-
ment. Meanwhile, the facilities maintenance section’s skills training
center has installed such railway facilities, as tracks, turnouts, platforms,
overhead line equipment, and signals.
Training at skills training centers
FY
* As of April 1, 2016
55Annual Report 2016
Planting business of JR East Green Partners
Seminar to help employees balance work and childcare

56 East Japan Railway Company
TO ACHIEVE SUSTAINABLE GROWTH
Board of Directors and Corporate AuditorsAs of June 23, 2016
Tetsuro Tomita*1
President and CEONumber of Company shares owned: 7,900 shares
Brief Personal Record, Position, and Business in Charge
Apr. 1974 Entered Japanese National RailwaysApr. 1987 Entered the CompanyJun. 1998 General Manager of Life-Style Business Development
HeadquartersJun. 2000 Director and General Manager of Management Administration
Department, Corporate Planning HeadquartersJun. 2003 Executive Director and Deputy Director General of Corporate
Planning HeadquartersJul. 2004 Executive Director and Deputy Director General of Corporate
Planning Headquarters and General Manager of IT Business Department, Corporate Planning Headquarters
Jun. 2005 Executive Director and Deputy Director General of Corporate Planning Headquarters
Jun. 2008 Executive Vice President and Representative Director and Director General of Life-Style Business Development Headquarters
Jun. 2009 Executive Vice President and Representative Director and Director General of Corporate Planning Headquarters
Apr. 2012 President and Representative Director and Director General of Corporate Planning Headquarters
Jun. 2012 President and Representative Director (continuing to the present)
Satoshi Seino
ChairmanNumber of Company shares owned: 12,600 shares
Brief Personal Record, Position, and Business in Charge
Apr. 1970 Entered Japanese National RailwaysApr. 1987 Entered the CompanyJun. 1991 General Manager of Administration DepartmentMay 1992 General Manager of Finance DepartmentJan. 1994 General Manager of Personnel DepartmentJun. 1996 Director and General Manager of Personnel Department and
Human Resources Development DepartmentJun. 1997 Director and General Manager of Personnel DepartmentJun. 2000 Executive DirectorJun. 2002 Executive Vice President and Representative Director and
Director General of Corporate Planning HeadquartersApr. 2006 President and Representative DirectorApr. 2012 Chairman and Director (continuing to the present)
Masaki Ogata
Vice Chairman, Technology and Overseas Related AffairsNumber of Company shares owned: 7,900 shares
Brief Personal Record, Position, and Business in Charge
Apr. 1974 Entered Japanese National RailwaysApr. 1987 Entered the CompanyJun. 1998 General Manager of Transport Safety Department, Railway
Operations HeadquartersJun. 2000 General Manager of Public Relations DepartmentJun. 2002 Director and General Manager of Transport & Rolling Stock
Department, Railway Operations HeadquartersJun. 2004 Executive Director and Deputy Director General of Railway
Operations HeadquartersJun. 2006 Executive Director and Director General of IT Business
Development Headquarters and Deputy Director General of Railway Operations Headquarters
Jul. 2007 Executive Director and Director General of IT & Suica Business Development Headquarters and Deputy Director General of Railway Operations Headquarters
Yuji Fukasawa*1
Executive Vice PresidentAssistant to President; In charge of Indian High-Speed Railway ProjectNumber of Company shares owned: 4,500 shares
Brief Personal Record, Position, and Business in Charge
Apr. 1978 Entered Japanese National RailwaysApr. 1987 Entered the CompanyJun. 2003 General Manager of Investment Planning Department,
Corporate Planning HeadquartersJun. 2006 Director and General Manager of Personnel Department and
Director of JR East General Education CenterJun. 2008 Executive DirectorJun. 2012 Executive Vice President and Representative DirectorJun. 2016 Executive Vice President and Representative Director Assistant to President; In charge of Indian High-Speed Railway
Project (continuing to the present)
Osamu Kawanobe*1
Executive Vice PresidentAssistant to President; Director General of Railway Operations HeadquartersNumber of Company shares owned: 3,500 shares
Brief Personal Record, Position, and Business in Charge
Apr. 1979 Entered Japanese National RailwaysApr. 1987 Entered the CompanyJul. 2005 General Manager of Public Relations DepartmentJun. 2008 Director and General Manager of Transport & Rolling Stock
Department, Railway Operations HeadquartersJun. 2010 Director and General Manager of Administration DepartmentJun. 2012 Executive Director and Deputy Director General of Railway
Operations HeadquartersJun. 2014 Executive Director and Director General of Railway Operations
Headquarters Jun. 2016 Executive Vice President and Representative Director Assistant to President; Director General of Railway Operations
Headquarters (continuing to the present)
Jun. 2008 Executive Vice President and Representative Director and Director General of Railway Operations Headquarters; Director General of IT & Suica Business Development Headquarters
Jun. 2009 Executive Vice President and Representative Director and Director General of Railway Operations Headquarters
Jun. 2010 Executive Vice President and Representative DirectorJun. 2011 Vice Chairman and DirectorJun. 2012 Vice Chairman and Director, Technology and Overseas Related
Affairs (continuing to the present)

57Annual Report 2016
Executive Directors
Masao Hino
Deputy Director General of Railway Operations Headquarters; In charge of Marketing Department, Railway Operations Headquarters; In charge of Tourism Promotion; In charge of Olympic and Paralympic Games*Number of Company shares owned: 800 shares
Tadao Maekawa
General Manager of Tokyo Branch OfficeNumber of Company shares owned: 4,800 shares
Akihiko Ishikawa
In charge of Public Relations Department; In charge of Personnel Department; In charge of Health & Welfare Department;In charge of Legal Department; In charge of Administration DepartmentNumber of Company shares owned: 1,000 shares
Directors
Reiko Amano*2
Number of Company shares owned: 0 shares
Motoshige Itoh*2
Number of Company shares owned: 0 shares
Tomokazu Hamaguchi*2
Number of Company shares owned: 1,100 shares
Takashi Eto
Stationmaster of Tokyo Station, Tokyo Branch OfficeNumber of Company shares owned: 1,400 shares
Yuji Morimoto
Director General of Corporate Planning Headquarters; In charge of Inquiry & Audit Department; In charge of Finance Department; In charge of Tourism StrategyNumber of Company shares owned: 5,500 shares
Toshiro Ichinose
Director General of Life-Style Business Development Headquarters; In charge of Customer Service Quality Reformation Department, Railway Operations HeadquartersNumber of Company shares owned: 5,300 shares
Masahiko Nakai
Deputy Director General of Railway Operations Headquarters; In charge of Shinanogawa Power Station Improvement Department, Railway Operations Headquarters;In charge of Construction Department; In charge of Indian High-Speed Railway ProjectNumber of Company shares owned: 3,400 shares
Takao Nishiyama
In charge of Overseas Related AffairsNumber of Company shares owned: 3,400 shares
Full-Time Corporate Auditors Corporate Auditors
Shigeo Hoshino*3
Hajime Higashikawa*3
Toshiaki Yamaguchi*3
(Certified Public Accountant)Yoshio Ishida*3
Seishi Kanetsuki*3
*1 Representative director*2 Outside corporate director*3 Outside corporate auditor
* East Japan Railway Company is an Official Passenger Rail Transportation Services Partner of the Tokyo 2020 Olympic and Paralympic Games.

58 East Japan Railway Company
TO ACHIEVE SUSTAINABLE GROWTH
JR East’s Basic Corporate Governance PhilosophyCorporate Governance Guidelines (Article 2)
The Company aims to meet the expectations of its stakeholders, includ-
ing shareholders, customers, and communities, by making transparent,
fair, and prompt decisions in addressing its challenges, such as ensuring
safe and reliable transportation services and implementing service qual-
ity reforms. JR East thereby works toward its goals of achieving sustain-
able growth in its business centered on train stations and railway facilities
and improvements in corporate value over the medium to long term.
Because of the special characteristics of JR East’s mainstay railway
transportation operations, the Company emphasizes making manage-
ment decisions based on a long-term perspective. Accordingly, JR East
believes the most appropriate course is to enhance corporate gover-
nance based on its current auditor system of governance.
Corporate Governance Guidelines (Established November 25, 2015)
http://www.jreast.co.jp/e/data/pdf/20151125_guidelines.pdf
Current Status of Corporate Governance SystemsReason for Adopting Current Corporate Governance System
Corporate Governance Guidelines (Article 16)
As a range of knowledge and experience on safety maintenance and
other matters, combined with decision-making from a medium- to long-
term perspective, is necessary for JR East’s primary business—railway
transportation operations—the Company has established a Board of
Directors and also a Board of Corporate Auditors composed of corpo-
rate auditors that are independent from the Board of Directors.
Overview of Corporate Governance Units
JR East’s Board of Directors comprised 16 directors, including three
outside corporate directors as of June 23, 2016. Meeting once a month
in principle, the Board of Directors decides on key operational issues
relating to statutory requirements and other matters and supervises
overall operations. Created by the Board of Directors, the Executive
Committee includes all directors with executive functions. Meeting once
a week in principle, the Executive Committee deliberates on matters to
be decided by the Board of Directors and other important management
issues. In addition, the Group Strategy Formulation Committee, which
mainly consists of directors with executive functions, convenes as
required and considers management strategy for respective operational
areas and other significant Group issues with a view to developing the JR
East Group as a whole.
Meeting once a month in principle, the Board of Corporate Auditors
comprises five corporate auditors, including two full-time and three
part-time corporate auditors, of whom four are outside auditors. In accor-
dance with guidelines established by the Board of Corporate Auditors,
the corporate auditors supervise the directors’ implementation of opera-
tions by attending meetings of the Board of Directors, the Executive
Committee, and other committees as well as by making inquiries regarding
JR East’s operations and assets.
Conceptual Diagram of Corporate Governance
EAST JAPAN RAILWAY COMPANY (As of June 23, 2016)
General Meeting of Shareholders
Board of DirectorsConsists of 16 directors (of whom three are
outside directors) Decides and oversees major business activities
Board of Corporate AuditorsConsists of two full-time and
three part-time corporate auditors (of whom four are outside auditors) Audits
the activities of the Board of Directors, Company operations, and assets
Independent Auditor KPMG AZSA LLC
Performs independent audits in and at the end
of each fiscal year
Subsidiaries
Collaboration and cooperation to ensure the efficient performance of business activities
Executive CommitteeConsists of all directors with executive functions Deliberates on resolutions to be submitted to the Board of Directors
and major management issues
Head Office Departments, Branches, and
Operational Bodies
Inquiry & Audit Department (Head Office) and Inquiry &
Audit Divisions (Branche office)
Perform oversight functions to ensure that business activities are
conducted in compliance with applicable laws and regulations
Group Strategy Formulation Committee
Consists of directors with executive functions and others Deliberates on major issues affecting
the entire Group
Remuneration Deliberation Committee
(Consists of independent outside directors, etc.)
Advises the president on matters regarding director
remuneration
President
Corporate Governance

59Annual Report 2016
Basic Internal Control Policy for Financial Reports
JR East’s basic internal control policy for financial reports is as follows:
1) JR East will establish and operate systems required to ensure the
appropriateness of documents relating to the financial statements
and other information.
2) Regarding the establishment and operation of the systems indicated
in the previous item, JR East will adhere to generally accepted stan-
dards for the evaluation of internal controls in relation to financial
reports and evaluate internal controls each fiscal year.
Current State of Risk Management Systems
JR East has established the Transportation Operations Center, which
operates 24 hours a day and has the task of ensuring rapid and appro-
priate responses in the event of an accident or disaster affecting railway
operations. JR East has also established two specialized internal com-
mittees, the Railway Safety Promotion Committee and the Customer
Comments Committee. The former stresses the prompt review, effective
formulation, and promotion of measures for preventing railway operation
accidents and accidents involving injury and death. The latter focuses on
the effective formulation and promotion of measures for preventing the
malfunction of railway cars, facilities, and equipment, and improving the
response to service disruptions once a transportation malfunction occurs,
with the aim of enhancing transportation service quality. In addition, the
Railway-Related Risk Mitigation Committee was formed to facilitate the
pursuit of higher levels of transportation safety and reliability through
measures to prevent reoccurrence of transportation-related accidents
and disruptions and to avoid such incidents altogether by maintaining an
understanding of the risks and vulnerabilities faced by the Company.
With regard to the risk of a significant adverse influence on corporate
operations due to such incidents as external offenses or internal miscon-
duct and legal violations by JR East or its subsidiaries, all JR East depart-
ments undertake risk management activities. In addition, JR East has
established the Crisis Management Headquarters based around
departments responsible for risk management, as well as implemented
crisis management-related internal regulations. In the event of a problem,
JR East’s crisis management system calls for top management to partici-
pate in the immediate establishment of a preliminary task force that
rapidly undertakes such actions as gathering the relevant information
and implementing countermeasures.
Current State of Internal Audits, Corporate Audits, and Accounting
Audits (Systems for Internal Audits, Corporate Audits, and
Accounting Audits)
Regarding internal audits, JR East has established an internal auditing
system involving approximately 100 full-time employees in the Inquiry &
Audit Department at the Head Office and Inquiry & Audit divisions at
branch offices, and together they work to ensure that corporate opera-
tions are executed lawfully and efficiently. Audits of the business execu-
tion status of the Head Office, Branch Offices, Operational Body, and
other entities are performed according to an audit plan, and requests are
made for the submission of progress updates for items requiring
improvement. The audit results are reported to representative directors at
the end of each accounting period and at other times deemed neces-
sary. In addition, the Inquiry & Audit Department audits subsidiaries.
Regarding corporate audits, corporate auditors exchange information
at monthly meetings of the Board of Corporate Auditors, and they also
exchange auditing information with corporate auditors of subsidiaries at
liaison meetings held at regular intervals. The audits of corporate auditors
are supported by approximately 10 specialized staff. The system for the
oversight of the implementation of operations by directors, carried out in
accordance with the rules established by the Board of Corporate Auditors,
centers on full-time corporate auditors who attend meetings of the Board
of Directors, the Executive Committee, and other important in-house
meetings as well as investigate financial situations and other items. Further,
corporate auditor Toshiaki Yamaguchi is a certified public accountant
and has extensive expertise with regard to finance and accounting.
Evaluation of the Effectiveness of the Board of DirectorsCorporate Governance Guidelines (Article 25)
An analysis and evaluation of the effectiveness of the Board of
Directors was conducted at a meeting of the Board of Directors
convened on March 15, 2016. The results were as follows.
The Board of Directors is sufficiently fulfilling its role and duties and
has been judged to be effective. Specifically, the Board of Directors
conducts appropriate discussions regarding agenda items and
makes reports sufficient for use in supervising the execution of busi-
ness duties. In addition, it was confirmed that compliance and other
systems had been effectively put in place.
In order to improve effectiveness of the Board of Directors, the
standards for submitting matters for discussion by the Board of
Directors were partially revised to allow for discussions to be focused
more on important matters to facilitate more in-depth examination.
Furthermore, based on input from independent outside directors, the
Company also decided to begin providing opportunities for discus-
sions to be held with such directors in regard to strategically impor-
tant tasks for the Company.

60 East Japan Railway Company
TO ACHIEVE SUSTAINABLE GROWTH
Corporate Governance
Regarding accounting audits, the consolidated accounts of JR East
are audited under contract by an independent auditor (accounting
auditor), KPMG AZSA LLC, in and at the end of each fiscal year. The
following is a breakdown of the certified public accountants who con-
ducted accounting audits in the fiscal year under review as well as their
auditing assistants.
• Designated certified public accountants:
Shozo Tokuda, Kazuhiko Azami, and Mamoru Ando
• Breakdown of auditing assistants:
Certified public accountants 17
Other 20
JR East facilitates coordination and information sharing to promote
efficient and effective auditing. For example, full-time corporate auditors
and the director responsible for internal auditing units hold liaison meet-
ings, and full-time corporate auditors receive regular updates on audit
implementation from the accounting auditor five times a year and at any
other time deemed necessary.
Outside Directors and Outside Corporate Auditors
Corporate Governance Guidelines (Article 17)
The Company has three outside directors and four outside corporate
auditors.
There is no conflict of interest between these outside directors, out-
side corporate auditors, and JR East with regard to personal relation-
ships, capital relationships, business relationships, or other potentially
conflicting interests the Company is obliged to disclose.
In addition to overseeing the business from an independent perspec-
tive, outside directors will be appointed with the goal of taking advantage
of their significant knowledge and experience in the Company’s busi-
ness. The Company will appoint such directors from a variety of areas in
the interest of management diversity.
In order for corporate auditors to audit the execution of duties by
directors from a perspective independent from that of the Board of Directors,
the Company will nominate corporate auditors that have significant
knowledge and experience in a variety of areas, including one or more
persons that have expert knowledge in financing and accounting. Of the
Company’s five corporate auditors, four are outside corporate auditors.
Principal Activities of Outside Directors and Outside Corporate Auditors
Title Name Principal activities
Outside Director Takeshi Sasaki Attended all 16 meetings of the Board of Directors during this fiscal year (attendance rate 100%) and spoke on the Company’s management issues based on his wide experience as an expert.
Outside Director Tomokazu Hamaguchi Attended all 16 meetings of the Board of Directors during this fiscal year (attendance rate 100%) and spoke on the Company’s management issues based on his wide experience as a top executive.
Outside Director Motoshige Itoh Attended all 12 meetings of the Board of Directors held during this fiscal year during his tenure (attendance rate 100%) and spoke on the Company’s management issues based on his wide experience as an expert.
Outside Corporate Auditor Shigeo Hoshino Attended 15 out of 16 meetings of the Board of Directors held during this fiscal year (attendance rate 94%) and 15 out of 16 meetings of the Board of Corporate Auditors held during this fiscal year (attendance rate 94%) and spoke on the Company’s management issues based on his wide experience in government.
Outside Corporate Auditor Hajime Higashikawa Attended all 16 meetings of the Board of Directors held during this fiscal year (attendance rate 100%) and all 16 meetings of the Board of Corporate Auditors held during this fiscal year (attendance rate 100%) and spoke on the Company’s management issues based on his wide experience in government.
Outside Corporate Auditor Toshiaki Yamaguchi Attended all 16 meetings of the Board of Directors during this fiscal year (attendance rate 100%) and all 16 meetings of the Board of Corporate Auditors during this fiscal year (attendance rate 100%) and spoke on the Company’s management issues based on his wide experience as a certified public accountant.
Outside Corporate Auditor Mutsuo Nitta Attended 8 out of 10 meetings of the Board of Directors held during this fiscal year until retirement due to decease on November 2, 2015 (attendance rate 80%) and 8 meetings out of all 10 meetings of the Board of Corporate Auditors held until retirement during this fiscal year (attendance rate 80%) and spoke on the Company’s management issues based on his wide experience as an attorney-at-law.

61Annual Report 2016
In order to enable independent outside directors to effectively fulfill their roles, the Company provides the following support:
Corporate Governance Guidelines (Article 23)
(1) Opportunities for independent outside directors to mutually exchange opinions
(2) Opportunities for independent outside directors to exchange opinions with the representative director and other individuals
(3) Opportunities for independent outside directors to exchange opinions with corporate auditors
(4) Opportunities for independent outside directors to exchange opinions with the independent auditor (accounting auditor)
(5) Provision of sufficient information to independent outside directors such as by supplying them with explanations of agendas of Board of Directors’
meetings in advance
Appointment Status of Outside Directors (As of July 2016)
Name Positions at other entities Reasons for election
Tomokazu Hamaguchi Director of IHI Corporation Director of KURARAY CO., LTD. Director of FPT CORPORATION
Mr. Tomokazu Hamaguchi has experience as President and Representative Director of NTT DATA Corporation among other experiences. He is suitable as an outside director based on his sound judgment and insight necessary for company management and his ability to supervise and advise on the Company’s management.
Motoshige Itoh Professor of Gakushuin University, Faculty of International Social Sciences
Mr. Motoshige Itoh has experience as Dean of the Graduate School of Economics and Faculty of Economics of the University of Tokyo. He is suitable as an outside director based on his sound judgment and insight necessary for company management and his ability to supervise and advise on the Company’s management.
Reiko Amano Executive Director of National Research Institute for Earth Science and Disaster Resilience
Ms. Reiko Amano held important offices at Kajima Corporation and the National Research Institute for Earth Science and Disaster Resilience. She is suitable as an outside director based on her sound judgment and insight necessary for company management and her ability to supervise and advise on the Company’s management.
Compensation of Directors and Corporate AuditorsJR East’s Total Remuneration of Directors and Corporate Auditors by Classification, Total Remuneration by Type, and Number of
Directors and Corporate Auditors Receiving Remuneration
Total Amount of Remuneration
(¥ Million)
Total Amount of Remuneration by Type (¥ Million)
PositionBasic
Remuneration Bonuses Number of Recipients
Directors (not including outside directors) 723 558 165 16
Corporate auditors
(not including outside corporate auditors)10 8 2 1
Outside directors and outside corporate auditors 109 87 21 7
Total 843 654 189 24
The amount of remuneration, etc., includes the amount paid to two directors that resigned as of the conclusion of the 28th Ordinary General Meeting of Shareholders held on June 23, 2015, and one outside director that resigned on November 2, 2015.

62 East Japan Railway Company
TO ACHIEVE SUSTAINABLE GROWTH
Corporate Governance
Total Remuneration of Individual JR East Directors
Not recorded because no individual received total consolidated remu-
neration of ¥100 million or more.
Policies for Determining Remuneration and Calculation Method
for Remuneration of Directors and Corporate Auditors
Corporate Governance Guidelines (Article 18)
The Company pays directors other than outside directors, as
consideration for their daily execution of business, monthly remuneration
based on their positions, within the limit on remuneration as determined
by resolution of the general meeting of shareholders, and performance-
based remuneration, in lieu of bonuses, upon consideration of the oper-
ating results, dividends paid to shareholders and their contribution to the
results for the applicable term as well as the degree of their contribution
toward the achievement of targets established in the medium-term
management plan and other factors. The Company pays to outside
directors and corporate auditors, as consideration for their execution of
business, monthly remuneration within the limit on remuneration as
determined by resolution of the general meeting of shareholders, but no
performance-based remuneration is in consideration of the nature of
their position.
To ensure the transparency and fairness of the decision-making
procedures for director remuneration, a remuneration deliberation com-
mittee composed of independent outside directors and other directors
discuss remuneration levels prior to the finalization of decisions.
Furthermore, as of fiscal 2016, payments of bonuses were discontin-
ued for directors, other than outside directors, in light of the introduction
of performance-based remuneration and for outside directors and cor-
porate auditors in consideration of the nature of their position.
Shareholdings in Selected Companies
Corporate Governance Guidelines (Article 5)
The Company holds shares in selected companies that contributes to its
corporate value, in order to maintain and strengthen stable business
relationships and close cooperative relationships with such companies
over the medium to long term.
The Company examines the medium- to long-term economic ratio-
nale and future outlook of major shareholdings on an annual basis at the
Board of Directors, and disclose the objectives therefor and other mat-
ters in the annual securities report.
The Company evaluated the medium- to long-term economic rationale
and future outlook of such holdings at the Board of Directors’ meeting
held on May 17, 2016. This evaluation deemed these holdings rational.
The Company excercises its rights as a shareholder of a company by
examining the details of proposals for each general meeting of share-
holders of such company and requesting any explanation therefor, as
necessary, in consideration of its objectives and other factors for such
shareholdings.
Remuneration for Auditing ServicesRemuneration for Independent Auditors
(¥ Million)
Fiscal 2015 Fiscal 2016
ClassificationRemuneration for Auditing Services
Remuneration for Non-auditing Services
Remuneration for Auditing Services
Remuneration for Non-auditing Services
JR East 245 8 245 2
Consolidated subsidiaries 478 3 466 1
Total 723 11 711 3

The JR East Group’s Basic Approach to ComplianceThe JR East Group advances compliance-related initiatives and has established the “Policy on Legal
and Regulatory Compliance and Corporate Ethics” to provide guidelines on corporate conduct.
Also, the Group has established Compliance Hotlines inside and outside the Group for whistle-blowing.
In addition, the Group cultivates compliance awareness by conducting education for all Group employees annually.
The “Policy on Legal and Regulatory Compliance and Corporate Ethics” and the “Compliance Action Plan”The “Policy on Legal and Regulatory Compliance and Corporate Ethics”
establishes the JR East Group’s approach to compliance and corporate
ethics based on the Group Philosophy and Basic Principles. To heighten
the policy’s effectiveness and explain desirable employee conduct, the
Group prepared the “Compliance Action Plan” and distributed a hand-
book based on it to all Group employees. Further, given its stepped-up
overseas business development, the Group prepared and announced
the “Basic Policy Aimed at Preventing Bribery in Relation to Non-
Japanese Civil Servants” in June 2014.
Education of All EmployeesAiming to further each employee’s understanding of compliance’s
importance, the guidelines, and the action plan, the JR East Group has
conducted an annual compliance education program that targets all
Group employees since fiscal 2010. Initially, the program mainly involved
lectures using DVDs as educational material. In recent years, however,
the program educates by encouraging employees to consider and
discuss issues. In this format, department leaders conduct study groups
for each workplace using materials prepared by the Head Office, and the
groups focus on case studies taken from operations that are familiar to
each set of employees. The JR East Group will continue inculcating
compliance awareness through education that reflects society’s expec-
tations regarding corporate social responsibility and changes in the
awareness of Group employees.
Main Compliance Seminars in Fiscal 2016
TitleNumber of Sessions Participants Contents and Objectives
Number of Participants
Compliance Training for All Employees
1JR East and Group company employees
Rigorous compliance awareness All employees
New Recruit Training 1 JR East new recruits Rigorous compliance awareness All new recruits
Basic Legal Training 1Group company legal affairs and compliance personnel
Acquisition of basic legal and compliance knowledge
30
Legal Training for Newly Appointed Legal Affairs Personnel
1Newly appointed legal affairs personnel of Head Office and branch offices
Acquisition of basic legal and compliance knowledge
16
Legal Skills Training 1Legal affairs personnel of Head Office and branch offices
Acquisition of legal and compliance knowledge related to dutiesEnhancement of legal reasoning and problem-solving skills, etc.
20
Legal Seminar 3JR East and Group company executives and employees
Explanation of new and amended lawsAdvancement of legal compliance awareness
600
Compliance Seminar 2Head Office executives, general managers, etc.
Rigorous awareness of compliance-based business management
150
Group Company Compliance Seminar
1Group company executives and employees
Rigorous awareness of compliance-based business management
80
63Annual Report 2016
Compliance

64 East Japan Railway Company
TO ACHIEVE SUSTAINABLE GROWTH
OrganizationAs of July 2016
General Meeting of Shareholders
Board of Directors
Chairman
President
Corporate Auditors
Corporate Auditors Office
Reconstruction Planning Dept.
Technology Planning Dept.
Facilities Dept.
Shinagawa and Large-scale Developments Dept.
International Dept.
Electrical & Signal Network System Dept.
Tourism Strategy Office
Transport Safety Dept.
Shinanogawa Power Station Improvement Dept.
Management Planning Dept.
Customer Service Quality Reformation Dept.
Information Systems Planning Dept.
Marketing Dept.
Investment Planning Dept.
Transport & Rolling Stock Dept.
External Relations Office
Construction Dept.
Administration Dept.
Energy Management Center
Corporate Planning Headquarters
Public Relations Dept.
Research & Development Center of JR East Group
Structural Engineering Center
Inquiry & Audit Dept.
Finance Dept.
Overseas Offices (New York, Paris,
Brussels, London, and Singapore)
Railway Operations Headquarters
Personnel Dept.
JR East General Education Center
Life-style Business Development Headquarters
Health & Welfare Dept.
JR Tokyo General Hospital
IT & Suica Business Development Headquarters
Legal Dept.
JR East Health Promotion Center
Tokyo Branch Office
Chiba Branch Office
Akita Branch Office
Tokyo Electrical Construction and System Integration Office
Yokohama Branch Office
Sendai Branch Office
Niigata Branch Office
Tohoku Construction Office
Hachioji Branch Office
Yamagata Branch
Nagano Branch Office
Omiya Branch Office
Fukushima Branch
Shinkansen Transport Dept.
Takasaki Branch Office
Morioka Branch Office
Tokyo Construction Office
Mito Branch Office
Aomori Branch
Joshinetsu Construction Office
FACTS & FIGURES
66 JR East: Domestic and International Perspectives
75 Management’s Discussion and Analysis of
Financial Condition and Results of Operations
79 Operational and Other Risk Information
84 Consolidated Financial Statements
89 Notes to Consolidated Financial Statements
108 Independent Auditor’s Report
109 Glossary
110 Consolidated Subsidiaries and
Equity-Method Affiliated Companies
112 Corporate Data
113 Further Information about JR East
65Annual Report 2016

FACTS AND FIGURES
JR East: Domestic and International Perspectives
Peer Group ComparisonsIn this section, several key performance indicators illustrate how JR East compares with selected well-known companies.
In scale and profitability, JR East is not to be outdone by any of the world’s renowned transportation companies. It is a benchmark among public utilities in
Japan—including the power and telecommunications companies—of an overwhelming scale and earnings performance above all of the other domestic airline
and private railway operators.
INTERNATIONAL
JR East 33,681
IAG 17,769
Lufthansa 7,659
Union Pacific 66,190
FedEx 48,923
UPS 85,105
* Data in these graphs has been computed from each company’s share price and shares outstanding at the end of the previous fiscal year.
JR East 5,957
IAG 2,228
Lufthansa 3,841
Union Pacific 7,344
FedEx 5,366
UPS 7,430
JR East 25,373
IAG 25,875
Lufthansa 36,287
Union Pacific 21,813
FedEx 47,453
UPS 58,363
JR East 10.4
IAG 34.3
Lufthansa 34.9
Union Pacific 22.8
FedEx 6.9
UPS 210.1
Average equity is the average of equity at the end of the previous and applicable fiscal years.
JR East 2,171
IAG 1,692
Lufthansa 1,922
Union Pacific 4,772
FedEx 1,050
UPS 4,844
JR East 6.3
IAG 8.9
Lufthansa 4.9
Union Pacific 15.1
FedEx 5.3
UPS 20.8
Average assets is the average of assets at the end of the previous and applicable fiscal years.
Total Stock Market ValueMillions of U.S. Dollars
Cash Flows from Operating ActivitiesMillions of U.S. Dollars
Operating RevenuesMillions of U.S. Dollars
Return on Average Equity (ROE)%
Profit attributable to owners of parentMillions of U.S. Dollars
Ratio of Operating Income to Average Assets (ROA)%
66 East Japan Railway Company

DOMESTIC
- In January 2011, British Airways and IBERIA underwent management integration to become IAG (International Airlines Group).- Year ended March 31, 2016 (Year ended December 31, 2015, for IAG, Lufthansa, Union Pacific, and UPS and year ended May 31, 2015, for FedEx).- ANA: ANA HOLDINGS INC.; Tokyu: Tokyu Corporation; NTT: Nippon Telegraph and Telephone Corporation- Data in this section is based on consolidated figures from each company’s annual report or financial press releases.- The exchange rate used is the rate on March 31, 2016 (U.S.$1=¥113, £1=$1.44, €1=$1.13).- Share prices at the close of the respective previous fiscal years and computed using the above exchange rates are $85.96 for JR East, $8.77 for IAG, $16.49 for Lufthansa, $78.20 for Union Pacific, $173.22 for FedEx, $96.23 for UPS, $2.81 for ANA, $8.35 for Tokyu, $8.82 for Kansai Electric Power, and $42.90 for NTT.
JR East 33,681
ANA 9,814
Tokyu 10,236
Kansai Electric Power 7,880
NTT 89,930
* Data in these graphs has been computed from each company’s share price and shares outstanding at the end of the previous fiscal year.
JR East 5,957
ANA 2,335
Tokyu 1,147
Kansai Electric Power 5,267
NTT 23,999
JR East 25,373
ANA 15,851
Tokyu 9,659
Kansai Electric Power 28,725
NTT 102,133
JR East 10.4
ANA 9.8
Tokyu 9.8
Kansai Electric Power 12.7
NTT 8.4
Average equity is the average of equity at the end of the previous and applicable fiscal years.
JR East 2,171
ANA 692
Tokyu 489
Kansai Electric Power 1,246
NTT 6,529
JR East 6.3
ANA 6.0
Tokyu 3.7
Kansai Electric Power 3.4
NTT 6.5
Average assets is the average of assets at the end of the previous and applicable fiscal years.
Total Stock Market ValueMillions of U.S. Dollars
Cash Flows from Operating ActivitiesMillions of U.S. Dollars
Operating RevenuesMillions of U.S. Dollars
Return on Average Equity (ROE)%
Profit attributable to owners of parentMillions of U.S. Dollars
Ratio of Operating Income to Average Assets (ROA)%
67Annual Report 2016

FACTS AND FIGURES
JR East: Domestic and International Perspectives
International Railway ComparisonsJapan relies on railways for around 30% of its transportation needs, a ratio much higher than in most other countries. This high reliance on railways due to the size
of the economy and geographic characteristics affords railway companies an extremely large source of demand, especially in urban areas. In addition to being
Japan’s top railway company, JR East is one of the largest railway companies in the world.
- Figures are as of March 2016 for JR East, March 2014 for the U.K., December 2013 for France and Germany, and September 2010 for the U.S.
- U.K.: Association of Train Operating Companies (Railway tracks are owned by Network Rail Ltd.); Germany: Deutsche Bahn AG; France: Société Nationale des Chemins de fer Français (SNCF) (Railway tracks are owned by Réseau Ferré de France (RFF)); and U.S.: National Railroad Passenger Corporation (Amtrak).
- Revenues from railway operations do not include freight and other service revenues.
- Figures for JR East do not include Tokyo Monorail.- The exchange rate used is U.S.$1=¥113 as of March 2016 for
JR East and €1=U.S.$1.38 as of March 2014 for the others.Source: International Railway Statistics 2013 and 2012,
Statistics Centre of the International Union of Railway, 2015 and 2014.
- JR East calculated these figures by using the following data and definition of each country’s habitable land area.PopulationJapan: Current Population Estimates, Ministry of Internal Affairs and Communications Statistics Bureau Other countries: United Nations dataHabitable land areaJapan: Land White Paper, Ministry of Land, Infrastructure, Transport and Tourism. Total area minus forests and woodland, barren
land, area under inland water bodies, and other Other countries: Global Forest Resources Assessment 2015, FAO
JR East 7,457
U.K. 15,748
Germany 33,449
France 30,013
U.S. 34,082
2015
Japan 4,991
U.K. 2,663
Germany 3,859
France 2,664
U.S. 17,947
JR East 48,894
U.K. 35,261
Germany 293,765
France 150,070
U.S. 20,047
JR East 15,973
U.K. 13,233
Germany 23,242
France 18,411
U.S. 2,269
2015
Japan 127.1
U.K. 64.7
Germany 80.7
France 64.4
U.S. 321.8
JR East 134,428
U.K. 59,171
Germany 79,906
France 84,785
U.S. 10,331
JR East 6,364
U.K. 1,562
Germany 2,008
France 1,126
U.S. 29
2015
Japan336
1,628
U.K.267307
Germany226332
France117169
U.S.33 48
Railway Line NetworksKilometers
Gross Domestic ProductBillions of U.S. Dollars
Number of Employees
Revenues from Railway OperationsMillions of U.S. Dollars
PopulationMillions
Passenger KilometersMillions
Number of PassengersMillions
Population DensityPer Square Kilometer
Population per square kilometer of total national land area
Population per square kilometer of habitable land area
TRANSPORTATION MARKET
FUNDAMENTALS
68 East Japan Railway Company

Railway Operations in JapanRailways play a vital role in Japan, a nation of limited landmass and high population density. Here, railways carry roughly 30% of the passenger volume in all
modes of transportation, and JR East accounts for roughly 30% of the passenger volume in railways.
As of March 31, 2014- Figures for Passenger Line Network do not include freight traffic.- Figures for Rolling Stock Kilometers do not include locomo-
tives and freight cars.- Figures for Tokyo Monorail are included in other railways.Source: Statistics of Railways 2013, Ministry of Land,
Infrastructure, Transport and Tourism
Passenger Line Networkkm
Revenues from Passenger TicketsBillions of Yen
Number of PassengersMillions
Rolling Stock KilometersMillions
Passenger KilometersMillions
JR East .....7,513
JR Central .....1,971
JR West.....5,016
Other JR Companies.....5,628
Other Railways.....7,480
Total.....27,607
JR East .....1,697
JR Central .....1,215
JR West.....781
Other JR Companies.....234
Other Railways.....2,339
Total.....6,265
JR East .....6,247
JR Central .....538
JR West.....1,858
Other JR Companies.....504
Other Railways.....14,538
Total.....23,685
JR East .....2,211
JR Central .....893
JR West.....1,001
Other JR Companies.....335
Other Railways.....2,762
Total.....7,202
JR East .....131,111
JR Central .....58,102
JR West.....55,894
Other JR Companies.....14,910
Other Railways.....154,403
Total.....414,421
SHARE OF DOMESTIC RAILWAYS
2014
2014 2014
2014 2014
27.2%
27.1%
26.4%
30.7%
31.6%
69Annual Report 2016

FACTS AND FIGURES
JR East: Domestic and International Perspectives
Financial Overview of JR Passenger Railway CompaniesJR East accounts for about 50% of the total operating revenues of the three largest
JR passenger railway companies. JR East’s immense and stable operating base contributes
to large and consistent earnings and cash flows.
- Data in this section has been calculated by JR East based on figures in JR Central’s and JR West’s financial press releases.
2016
JR East 2,867.2
JR Central 1,738.4
JR West 1,451.3
2015
JR East 2,756.2
JR Central 1,672.3
JR West 1,350.3
2016
JR East 10.4
JR Central 15.6
JR West 10.2
2015
JR East 8.1
JR Central 14.0
JR West 8.4
2016
JR East 245.3
JR Central 337.4
JR West 85.9
2015
JR East 180.4
JR Central 264.1
JR West 66.7
2016
JR East 6.3
JR Central 11.0
JR West 6.4
2015
JR East 5.7
JR Central 9.7
JR West 5.1
2016
JR East 173.5
JR Central 431.2
JR West 26.7
2015
JR East 145.9
JR Central 306.8
JR West 10.7
2016
JR East 31.4
JR Central 44.0
JR West 30.9
2015
JR East 30.1
JR Central 38.7
JR West 28.8
Millions of Yen
Years ended March 31 2015 2016
JR East 2,756,165 2,867,200
JR Central 1,672,295 1,738,409
JR West 1,350,336 1,451,300
%
Years ended March 31 2015 2016
JR East 8.1 10.4
JR Central 14.0 15.6
JR West 8.4 10.2
Millions of Yen
Years ended March 31 2015 2016
JR East 180,398 245,310
JR Central 264,134 337,440
JR West 66,712 85,868
%
Years ended March 31 2015 2016
JR East 5.7 6.3
JR Central 9.7 11.0
JR West 5.1 6.4
Millions of Yen
Years ended March 31 2015 2016
JR East 145,918 173,534
JR Central 306,836 431,190
JR West 10,701 26,661
%
Years ended March 31 2015 2016
JR East 30.1 31.4
JR Central 38.7 44.0
JR West 28.8 30.9
Operating RevenuesBillions of Yen
Return on Average Equity (ROE)%
Profit attributable to owners of parentBillions of Yen
Ratio of Operating Income to Average Assets (ROA)%
Free Cash FlowsBillions of Yen
Equity Ratio%
JR East
JR Central
JR West
70 East Japan Railway Company

Railway Operations in TokyoThe Tokyo metropolitan area accounts for roughly 30% of the population and economic base in Japan and has a population density far higher than any other region
in the country. JR East alone provides nearly half of the huge volume of railway transportation in the Tokyo metropolitan area, where railways account for roughly 50%
of all transportation.
*1 As of March 31, 2015.*2 For the year ended March 31, 2015. - Figures do not include freight lines. - Data used for JR East is that of the Tokyo Metropolitan Area Network and does not include Tokyo Monorail.Sources:- Toei (Tokyo Metropolitan Government): Figures are from the website of the Transportation Bureau of the Tokyo Metropolitan Government. Passenger kilometers are from Statistics of Railways 2015,
Ministry of Land, Infrastructure, Transport and Tourism.- Other: Website of the Association of Japanese Private Railways. Revenues from passenger tickets are based on figures from the financial press releases of each company.
JR East 1,106.1
Tobu 463.3
Tokyo Metro 195.1
Seibu 176.6
Keisei 152.3
Toei 131.2
Odakyu 120.5
Tokyu 104.9
Keikyu 87.0
Keio 84.7
Sagami 35.9
JR East 80,477
Tobu 12,440
Tokyo Metro 20,048
Seibu 8,589
Keisei 3,746
Toei 6,445
Odakyu 11,337
Tokyu 10,701
Keikyu 6,258
Keio 7,417
Sagami 2,508
JR East 882.7
Tobu 142.2
Tokyo Metro 316.4
Seibu 95.0
Keisei 56.0
Toei 145.8
Odakyu 117.2
Tokyu 133.5
Keikyu 76.9
Keio 78.3
Sagami 30.4
Passenger Line Networks*1 Passenger Kilometers*2 Revenues from Passenger Tickets2
km % Millions % Billions of Yen %
JR East 1,106.1 41.6 80,477 47.3 882.7 42.5
Tobu Railway 463.3 17.4 12,440 7.3 142.2 6.9
Tokyo Metro 195.1 7.3 20,048 11.8 316.4 15.2
Seibu Railway 176.6 6.7 8,589 5.1 95.0 4.6
Keisei Electric Railway 152.3 5.7 3,746 2.2 56.0 2.7
Toei (Tokyo Metropolitan Government) 131.2 4.9 6,445 3.8 145.8 7.0
Odakyu Electric Railway 120.5 4.5 11,337 6.7 117.2 5.7
Tokyu Corporation 104.9 4.0 10,701 6.3 133.5 6.4
Keikyu Corporation 87.0 3.3 6,258 3.7 76.9 3.7
Keio Electric Railway 84.7 3.2 7,417 4.3 78.3 3.8
Sagami Railway 35.9 1.4 2,508 1.5 30.4 1.5
Total 2,657.6 100.0 169,966 100.0 2,074.5 100.0
Passenger Line NetworksKilometers
Passenger KilometersMillions
Revenues from Passenger TicketsBillions of Yen
Year ended March 31, 2014Source: Annual Report on Prefectural Economies,
Cabinet Office
As of October 1, 2015Source: Current Population Estimates and Census,
Ministry of Internal Affairs and Communications
As of October 1, 2015- JR East calculated these figures by using data from the
following sources: Current Population Estimates and Census, Ministry of Internal Affairs and Communications, and statistics from the Geographical Survey Institute.
- The statistics on this page are based on governmental boundaries and do not strictly correspond with JR East’s operating area segments.
2015
Tokyo Area 2,664
Other 250
National Average 336
Population DensityPer Square Kilometer
Net Domestic ProductBillions of Yen
PopulationMillions
Tokyo Area.....122,296
Other.....251,121
Total.....373,417
Tokyo Area.....36.1
Other.....91.0
Total.....127.1
FUNDAMENTALS
2014 2015
32.8% 28.4%
71Annual Report 2016

FACTS AND FIGURES
JR East: Domestic and International Perspectives
Analysis of JR East’s Railway OperationsThe fact that two-thirds of its transportation revenues come from Tokyo and the Kanto region, where most of the population and economic base in Japan resides,
shows the solidness of JR East’s management platform.
As another strength, the Company is largely immune to economic fluctuations, as commuter passes account for over a fourth of transportation revenues
overall, and 40% of those revenues are from the Kanto region.
*1 As of March 31, 2016*2 Year ended March 31, 2016- Revenues from the conventional line segments of hybrid Shinkansen services are included in Conventional Lines (Other Network).- Figures do not include Tokyo Monorail.
Passenger Line Network*1 Passenger Kilometers*2 Revenues from Passenger Tickets*2
km % Millions % Millions of Yen %
Shinkansen Network 1,194.2 16.0 22,848 17.0 578,213 32.0
Conventional Lines (Kanto Area Network) 2,535.9 34.0 105,875 78.8 1,156,186 64.1
Conventional Lines (Other Network) 3,727.2 50.0 5,704 4.2 70,533 3.9
Total 7,457.3 100.0 134,428 100.0 1,804,932 100.0
Number of Passengers Passenger Kilometers*2 Revenues from Passenger Tickets*2
Millions % Millions % Millions of Yen %
Commuter Passes 3,918 61.6 74,732 55.6 494,439 27.4
Other 2,447 38.4 59,695 44.4 1,310,493 72.6
Total 6,365 100.0 134,428 100.0 1,804,932 100.0
Passenger Line Network
Number of Passengers
Passenger Kilometers
Passenger Kilometers
Revenues from Passenger Tickets
Revenues from Passenger Tickets
Shinkansen Network .....16.0%
Conventional Lines (Kanto Area Network).....34.0%
Conventional Lines (Other Network).....50.0%
Commuter Passes .....61.6%
Other .....38.4%
Commuter Passes .....55.6%
Other .....44.4%
Commuter Passes .....27.4%
Other .....72.6%
Shinkansen Network .....17.0%
Conventional Lines (Kanto Area Network).....78.8%
Conventional Lines (Other Network).....4.2%
Shinkansen Network .....32.0%
Conventional Lines (Kanto Area Network).....64.1%
Conventional Lines (Other Network).....3.9%
2016
2016
2016
2016
2016
2016
COMPOSITION BY OPERATING AREA
COMPOSITION OF COMMUTER PASSES
72 East Japan Railway Company

- Passenger kilometers and revenues from the conventional line segments of hybrid Shinkansen services are credited to Conventional Lines (Other Network).
- Figures do not include Tokyo Monorail.- The Kanto Area Network encompasses the area encompassed under the previous classification of the Tokyo Metropolitan Area
Network (Tokyo Branch Office, Yokohama Branch Office, Hachioji Branch Office, and Omiya Branch Office) and the areas covered by Takasaki Branch Office, Mito Branch Office, and Chiba Branch Office.
- Percentages represent revenues from passenger tickets attributable to commuter passes for each segment.- Revenues from the conventional line segments of hybrid Shinkansen services are credited to Conventional Lines (Other Network).
Millions %
2015 2016 2016 / 2015
Shinkansen Network Commuter Passes 1,675 1,740 103.9
Other 19,238 21,108 109.7
Total 20,914 22,848 109.2
Conventional Lines Total Commuter Passes 71,444 72,992 102.2
Other 37,710 38,587 102.3
Total 109,154 111,579 102.2
Kanto Area Network Commuter Passes 68,375 69,908 102.2
Other 34,935 35,966 103.0
Total 103,310 105,875 102.5
Other Network Commuter Passes 3,068 3,083 100.5
Other 2,775 2,621 94.4
Total 5,844 5,704 97.6
Total Commuter Passes 73,119 74,732 102.2
Other 56,949 59,695 104.8
Total 130,068 134,428 103.4
Millions of Yen %
2015 2016 2016 / 2015
Shinkansen Network Commuter Passes 23,232 23,616 101.7
Other 497,997 554,596 111.4
Total 521,229 578,213 110.9
Conventional Lines Total Commuter Passes 466,985 470,822 100.8
Other 737,687 755,896 102.5
Total 1,204,672 1,226,719 101.8
Kanto Area Network Commuter Passes 448,259 452,336 100.9
Other 683,445 703,850 103.0
Total 1,131,705 1,156,186 102.2
Other Network Commuter Passes 18,725 18,486 98.7
Other 54,241 52,046 96.0
Total 72,967 70,533 96.7
Total Commuter Passes 490,217 494,439 100.9
Other 1,235,685 1,310,493 106.1
Total 1,725,902 1,804,932 104.6
Shinkansen Network
Commuter Passes .....7.6%
Other .....92.4%2016
Shinkansen Network
Commuter Passes .....4.1%
Other .....95.9%2016
Conventional Lines (Kanto Area Network)
Commuter Passes .....66.0%
Other .....34.0%2016
Conventional Lines (Kanto Area Network)
Commuter Passes .....39.1%
Other .....60.9%2016
Conventional Lines (Other Network)
Commuter Passes .....54.0%
Other .....46.0%2016
Conventional Lines (Other Network)
Commuter Passes .....26.2%
Other .....73.8%2016
PASSENGER KILOMETERS
REVENUES FROM PASSENGER TICKETS
73Annual Report 2016

FACTS AND FIGURES
Other DataJR East owns many stations with high potential that are used by numerous customers. JR East is carrying out its life-style service business utilizing these stations
to enhance customer convenience and comfort and to raise profitability.
JR East JR Hokkaido JR West
Shin-Aomori
Shin-Hakodate Hokuto
Hachinohe
Akita
Shinjo
Yamagata
Niigata
Kanazawa
Toyama
Joetsumyoko
Fukushima
Omiya
Takasaki
Nagano
Morioka
Sendai
Tokyo
JR East’s Shinkansen Network Competition with Airlines
Distance from Tokyokm
Time Required JR Share%
Aomori 713.7 2:59 78
Akita 662.6 3:37 60
Morioka 535.3 2:10 100
Sendai 351.8 1:30 100
Yamagata 359.9 2:26 97
Niigata 333.9 1:37 100
Kanazawa 450.5 2:28 76
Note: Data shown here is as of March 31, 2016. Information concerning required time is according to the JR Time Table, June 2016 issue. Market shares of trains and flights are calculated based on the number of flight departures and arrivals at Haneda Airport. Approximate time required for trains is indicated using the maximum speed of a regularly-operated train from Tokyo.
Notes:- Tokyu = Tokyu Corporation- Year ended March 31, 2015, for JR Central and JR West,
year ended March 31, 2016, for JR East and Tokyu.- Data is based on figures from JR Central, JR West, and Tokyu.- The number of station users at stations of JR East,
JR Central, and JR West represents twice the number of passengers embarking.
Notes:- Takashimaya = Takashimaya Company, Limited;
7-Eleven Japan = Seven-Eleven Japan Co., Ltd.; Tokyu = Tokyu Corporation
- Year ended March 31, 2016 (year ended February 28, 2016, for Takashimaya and 7-Eleven Japan)
- Data is based on figures from the financial press releases of each company.
- The following figures are used as operating revenues: JR East: Station space utilization, segment revenues from outside customers; Takashimaya: Department store business, segment revenues from outside customers; 7-Eleven Japan: Total store sales (nonconsolidated); Tokyu: Retail operating revenues; and JR West: Sales of goods and food services business, segment revenues from third parties.
Notes:- Mitsui = Mitsui Fudosan Co., Ltd.
Tokyu = Tokyu Corporation- Year ended March 31, 2016- Data is based on figures from the financial press releases of
each company.- The following figures are used as operating revenues:
JR East: Shopping centers & office buildings, segment revenues from outside customers Mitsui: Office buildings and commercial facilities revenues in leasing segment, outside customers Tokyu: Real estate business, segment revenues from outside customers JR West: Real estate business, segment revenues from third parties
2016
JR East 94
JR Central 5
JR West 13
Tokyu 19
Operating Revenues
JR East 400.0
Takashimaya 814.1
7-Eleven Japan 4,291.1
Tokyu 631.4
JR West 232.1
Operating Revenues
JR East 256.0
Mitsui 495.0
Tokyu 158.4
JR West 108.9
More than 200,000 passengers per day
More than 100,000 passengers per day
JR East 39 94
JR Central 1 5
JR West 5 13
Tokyu 5 19
Millions of Yen
JR East 399,960
Takashimaya 814,095
7-Eleven Japan 4,291,067
Tokyu 631,429
JR West 232,071
Millions of Yen
JR East 255,978
Mitsui 495,034
Tokyu 158,441
JR West 108,897
Number of Busy StationsStations
Comparison of Major Department Stores, Retail Sales, and Convenience StoresBillions of Yen
Comparison of Real Estate Leasing to Retailers and Other TenantsBillions of Yen
More than 200,000 passengers per day
More than 100,000 passengers per day
JR East: Domestic and International Perspectives
74 East Japan Railway Company

Management’s Discussion and Analysis of Financial Condition and Results of Operations
Forward-looking statements in the following discussion and analysis are
judgments of the JR East Group as of March 31, 2016.
Key Accounting Policies and EstimatesJR East prepares consolidated financial statements in accordance with
accounting principles generally accepted in Japan. Forward-looking estimates
included in those financial statements are based on a variety of factors that,
in light of JR East’s past performance and current circumstances, can be
reasonably assumed to have affected results for assets and liabilities on the
consolidated settlement date and consolidated revenues and expenses in
fiscal 2016, ended March 31, 2016. JR East continuously assesses those
factors. Actual results may differ materially from those estimates, given the
uncertainty of forward-looking statements.
Performance AnalysisOverviewIn fiscal 2016, the Japanese economy improved in such areas as employment
and income conditions and continued to recover gradually. Under these
conditions, and guided by “JR East Group Management Vision V—Ever
Onward,” the Group (consisting of the Company, its consolidated subsidiaries,
and affiliated companies that were accounted for by the equity method)
steadily executed various initiatives centered on the railway and life-style
service businesses and Suica operations.
As a result, operating revenues for fiscal 2016 increased 4.0%, to ¥2,867.2
billion ($25,373 million), and operating income increased 14.1%, to ¥487.8
billion ($4,317 million), mainly due to growth in the Company’s transportation
revenues, primarily from Shinkansen revenues. Profit attributable to owners of
parent increased 36.0%, to ¥245.3 billion ($2,171 million).
In light of a serious incident in April 2015 in which an electrical pole collapsed
and obstructed a train track on the Kanda–Akihabara segment of the Yamanote
Line, we sought to prevent this type of incident from recurring. We established
within the Railway Safety Promotion Committee an exploratory committee,
with the Director General of Railway Operations Headquarters as chief investi-
gator, that conducted investigations and an analysis of background factors to
determine the cause. As a result, we are taking countermeasures that include
the establishment of an Electric Power Technology Management Center and
the review of safety education and training to focus on what is needed in
practice to strengthen risk management and technical support for design and
construction. In addition, following such serious incidents as the interruptions
to transportation services in April 2015 and thereafter, including the severing
of overhead wires on the Tohoku Shinkansen Line and the Negishi Line and a
breakdown of electric facilities on the Takasaki Line, we implemented preven-
tive measures and also took measures to enable us to resume operations
earlier and to respond to customers’ needs more rapidly when transportation
services are disrupted. We are working to improve the safety and reliability of
transportation through initiatives that include the October 2015 establishment
of the Railway-Related Risk Mitigation Committee, which is tasked with pre-
venting the recurrence of accidents and incidents that affect transportation
and with identifying potential risks and weaknesses.
As part of strategies aimed at capturing demand from non-Japanese tourists
visiting Japan, which has continued to increase in recent years, the Group as
a whole took measures to increase and improve product lineups and develop
capabilities for serving such customers. Specifically, in July 2015 a subsidiary
of the Company entered into comprehensive operational alliances with two travel
companies that are strong in Thailand, Indonesia, and China. In November 2015,
the Company launched the JR TOKYO Wide Pass, a “free pass” that covers
popular tourism areas and snow resorts. Further, the Company prepared for the
April 2016 launch of the Tokyo–Osaka Hokuriku Arch Pass, which also enables
use of the Hokuriku Shinkansen Line, and the JR East-South Hokkaido Rail
Pass, which also enables use of the Hokkaido Shinkansen Line. The
Company also extended the provision of a free public wireless LAN service to
all stations within the Yamanote Line and established duty-free counters in
station concourses and station buildings. In February 2016, the Company
expanded the JR EAST Travel Service Center at Haneda Airport and intro-
duced multilingual, online Internet reservation services for non-Japanese
customers overseas.
With respect to regional revitalization, the Group advanced such initiatives
as promotion of tourism, revitalization of local industries, and town development
centered on regional core railway stations. Specifically, the Company advanced
initiatives to create attractive trains that serve customers who seek the ride
experience itself. For example, the Company proceeded with preparations for
the commencement of operations of an art-cafe Shinkansen in April 2016, the
GENBI SHINKANSEN, which enables customers to enjoy the Niigata area. Also,
planning to begin operations in May 2017, the Company publicly announced the
route of the TRAIN SUITE SHIKI-SHIMA cruise train and other details. Further,
the Company implemented measures for the sextic industrialization of agricul-
ture, forestry, and fisheries. As part of such efforts, in January 2016 the
Company established JR Niigata Farm Co., Ltd., in a National Strategic
Special Zone located in Niigata City. The new company will produce rice
suitable for use as a basic ingredient of sake. As part of initiatives to transform
the northern Tohoku area into a renewable energy base by taking advantage
of the region’s rich natural environment, in April 2015 we established JR EAST
Energy Development Co., Ltd., which is mainly engaged in wind power gen-
eration businesses. In addition, in September 2015 Akita Prefecture, Akita
City, and the Company concluded a “Partnership Agreement in Relation to the
Development of Compact Cities for Regional Revitalization.”
With respect to the area surrounding Shinagawa Station and Tamachi
Station, as some of the land used for the Shinagawa Depot railway yard will
become available for other uses, the Company is endeavoring to develop an
international exchange hub by implementing plans for urban development in
cooperation with the Government of Japan, the Tokyo Metropolitan
Government, relevant wards, and other stakeholders. In April 2016, the urban
plan that was prepared received approval from the prime minister as a zone
plan of a National Strategic Special Zone.
To enable the Group to make a concerted effort to improve service quality
and efficiency, in July 2015 the Company reorganized subsidiaries in the
Tokyo metropolitan and Tohoku areas that are responsible for railway station
management, railway station concourse, and other businesses.
Business results by business segment were as follows.
Segment InformationTRANSPORTATION
In the Transportation segment, with railway operations as its core operations,
the Company promoted the use of its railway networks to secure revenues while
75Annual Report 2016
FACTS AND FIGURES
ensuring safe and reliable transportation and enhancing customer satisfaction.
With respect to safety, we steadily implemented measures based on our
sixth five-year safety plan, “Group Safety Plan 2018.” We also implemented
seismic reinforcement in preparation for a major earthquake, such as a possible
earthquake directly beneath the Tokyo metropolitan area. The Company has
earmarked a total of ¥300 billion for investment in such measures for a five-year
intensive implementation period ending March 31, 2017. Approximately 70%
of the work that is currently planned was completed by the end of fiscal 2016.
The Company also commenced the operation of automatic platform gates at
five railway stations on the Yamanote Line, including Nippori Station. The new
gates increased the total number of stations with such gates to 23 stations as of
March 31, 2016. As for lines other than the Yamanote Line, we prepared for the
introduction of automatic platform gates to such railway stations as Shin-Koiwa
Station on the Sobu Line Rapid Service based on review of line segment
conditions, how the stations are used, and other factors. As measures for
preventing railway crossing accidents, we continued converting to type-1
railway crossings, eliminating and consolidating railway crossings, and
installing more obstruction warning devices and obstacle detection devices for
railway crossings. In addition, to improve the safety of personnel that perform
maintenance work, we developed a train approach alarm system that utilizes
GPS and began using it on the Hachiko Line and the Iiyama Line in April 2016.
In relation to service quality, the Group promoted measures aimed at
becoming “No. 1 for customer satisfaction in the Japanese railway industry”
based on the “Medium-term Vision for Service Quality Reforms 2017,” which
was implemented in April 2015. Given the expansion of the direct service
network, such as the opening of the Ueno-Tokyo Line, we worked to improve
the quality of transportation by expanding contingency shuttle operations when
transportation services are disrupted. To provide individual customers with
timely information, we extended the range of lines for which the train position
information can be received through the JR-EAST Train Info app to include the
Ueno-Tokyo Line, and the number of application downloads reached approxi-
mately 1.8 million on a cumulative basis as of March 31, 2016. We jointly held a
“Let’s Stop Viewing Smartphones while Walking” campaign with related
companies and other organizations and conducted an assistance campaign in
which personnel ask nearby customers whether they require assistance.
With respect to transportation, when revising our timetables in March 2016,
in conjunction with the opening of the Hokkaido Shinkansen Line, we began
direct services connecting the Tohoku Shinkansen Line and the Hokkaido
Shinkansen Line. As a result, the shortest journey between Tokyo and Shin-
Hakodate Hokuto takes 4 hours and 2 minutes, and the shortest journey
between Sendai and Shin-Hakodate Hokuto takes 2 hours and 30 minutes.
Further, in light of observed usage following the opening of the Hokuriku
Shinkansen Line and the Ueno-Tokyo Line, we sought to improve our transpor-
tation systems through such initiatives as reviewing connections and strengthening
transportation capabilities during rush hours.
With respect to marketing and sales activities, we conducted such campaigns
as the Fukushima Destination Campaign and the Ikuze, Tohoku. Campaign to
increase passenger traffic. Further, we proceeded with preparations for the
Aomori Prefecture and Hakodate Destination Campaign, which we plan to hold
starting in July 2016. In connection with the opening of the Hokuriku Shinkansen
Line to Kanazawa, we promoted usage of Shinkansen services such as Kagayaki,
the fastest service, and Hakutaka, a service that stops at most stations between
Tokyo and Kanazawa, and took measures to use the expanded railway network
to grow inter-regional railway travel. In addition, we used the Hokuriku Destination
Campaign as an opportunity to increase wide-ranging inter-regional sightseeing
that encompasses Hokuriku and Shinshu, for example through the promotion
of products that take advantage of the Tenku no Hida Kairo View Bus (Hida
Mountains Excursion Bus). In November 2015, we commenced sale of the JR East
Dynamic Rail Pack, a variable-price travel product that allows customers to freely
select their choice of train services and lodging accommodations. In January
2016, we enabled the purchase of these travel product via smartphones.
In Suica operations, we began mutual usage of Suica with the Sendai City
Transportation Bureau’s icsca card in the Sendai area in March 2016. We have
also conducted the 10th Anniversary of Mobile Suica Campaign since January
2016 to further increase usage of Suica. The number of Suica cards issued
and outstanding was approximately 59.23 million as of March 31, 2016.
With respect to participation in overseas railway projects, we proceeded with
preparations to begin maintenance operations for the Purple Line (Bangkok,
Thailand), an urban mass transit system scheduled to enter service in August
2016. At the same time, the Company’s subsidiary, Japan Transport Engineering
Company (J-TREC), manufactured sustina stainless-steel railcars and delivered
them to a railway yard in Thailand. We also jointly held the “9th UIC World
Congress on High Speed Rail” with the International Union of Railways (UIC)
in July 2015 and strengthened our networks with those involved in high-speed
railways and governments outside Japan. We promoted our “Global Human
Resource Development Program—Ever Onward” to nurture personnel that
can take on global business development. This included continuation of
overseas study programs and on-the-job trainee programs in the overseas
railway consulting business, among other assignments.
As a result of the above, JR East’s railway traffic volume was higher than
that of the previous fiscal year, and operating revenues in the Transportation
segment increased 5.3%, to ¥2,008.0 billion ($17,770 million), and operating
income increased 18.3%, to ¥348.6 billion ($3,085 million).
To advance reconstruction along line segments on the Pacific coast,
where severe damage was suffered due to the March 2011 Great East Japan
Earthquake, the Company is working in close collaboration with the national
government and relevant local authorities to formulate and advance plans for
developing towns and rebuilding the area as a whole. We resumed operations on
all segments of the Senseki Line and began operations of the Senseki-Tohoku
Line, a direct service connecting to the Tohoku Line in May 2015. Further, we
began restoration work on the line segment between Miyako and Kamaishi on
the Yamada Line to integrate operation of the line segment with that of the
North and South Rias Lines by Sanriku Railway Company. With respect to the
provisional Bus Rapid Transit (“BRT”) systems on the Kesennuma Line and
the Ofunato Line, an agreement was reached with the heads of all municipal
authorities of the line-side areas to undertake full-scale restoration through the
use of BRT systems. In addition, we conducted restoration work with a view to
resuming operations between Soma and Hamayoshida on the Joban Line by the
end of December 2016. The Company’s policy for areas within a 20-kilometer
radius of the Fukushima Daiichi Nuclear Power Station is to prepare to resume
operations in the areas designated as “areas to which evacuation orders are
ready to be lifted” through the cooperation of the national government and local
authorities, which are working to decontaminate line-side areas and return
residents to their homes. Based on this policy, we conducted restoration work
and took other measures with a view to resuming operations between Odaka and
Haranomachi on the Joban Line by July 2016, between Namie and Odaka by
Management’s Discussion and Analysis of Financial Condition and Results of Operations
76 East Japan Railway Company

spring 2017, and between Tatsuta and Tomioka by the end of 2017. Further, in
the areas designated as “areas where it is expected that the residents will have
difficulties in returning for a long time,” in conjunction with the restoration of
damaged facilities, we aim to open lines after the completion of decontamination
work required for opening lines and the implementation of measures to ensure
the safety of users in emergencies with the support and cooperation of the
national government and local authorities. To this end, we began implementing
trial decontamination work between Yonomori and Futaba on the Joban Line in
August 2015. In addition, with respect to the disposal of and other measures
relating to waste material and soil arising from decontamination and restoration
work, in light of developments, including the fact that a more definite outlook for
the resolution of such issues has been established, in March 2016 we began
restoration work with a view to resuming operations between Tomioka and
Namie on the Joban Line by March 31, 2020.
SHINKANSEN NETWORK
In the Shinkansen network, passenger kilometers increased 9.2% year on year,
to 22.8 billion, mainly due to the opening of the Hokuriku Shinkansen Line to
Kanazawa and an increase in visitors from abroad boarding as passengers.
Revenues from passenger tickets increased 10.9% year on year, to ¥578.2
billion ($5,117 million). Included in this figure, Shinkansen commuter pass
revenues increased 1.7% year on year, to ¥23.6 billion ($209 million), and
non-commuter pass revenues rose 11.4%, to ¥554.6 billion ($4,908 million).
CONVENTIONAL LINES (KANTO AREA NETWORK)
For conventional lines in the Kanto area network, passenger kilometers
increased 2.5% year on year, to 105.9 billion. Revenues from passenger
tickets increased 2.2%, to ¥1,156.2 billion ($10,232 million). Included in this
figure, commuter pass revenues increased 0.9%, to ¥452.3 billion ($4,003
million), while non-commuter pass revenues increased 3.0%, to ¥703.9 billion
($6,229 million), following impressive usage levels during Silver Week and
other extended holidays as well as the opening of the Ueno-Tokyo Line.
CONVENTIONAL LINES (OTHER NETWORK)
In the conventional lines other than the Kanto area network, passenger kilometers
decreased 2.4% year on year, to 5.7 billion. Revenues from passenger tickets
decreased 3.3%, to ¥70.5 billion ($624 million). Included in this figure, com-
muter pass revenues decreased 1.3%, to ¥18.5 billion ($164 million), while
non-commuter pass revenues decreased 4.0%, to ¥52.0 billion ($460 million).
STATION SPACE UTILIZATION
In the Station Space Utilization segment, we introduced stores with new designs
for NewDays (convenience stores) and also launched NewDays KIOSK, which
includes such features as renewed product mixes and store layouts for station
kiosks. With the aim of revitalizing regions with restaurants offering regional
gourmet cuisines, we opened B-1 Grand Prix Shokudo (Tokyo) in July 2015
under a railway viaduct between Akihabara and Okachimachi stations. Further,
we proceeded with preparations for the April 2016 opening of phase 2 of NEWoMan
(Tokyo) at the JR Shinjuku Station New South Exit. In addition, in January 2016 we
began improvement work between the central passage and the north passage
of Tokyo Station to develop new stores in conjunction with the establishment of
more barrier-free routes. Other initiatives included commencement of work for
the opening of certain stores in Chiba Station’s concourse in November 2016.
As a result of these initiatives as well as factors including the favorable
sales at stores in Tokyo Station’s concourse, operating revenues of the Station
Space Utilization segment increased 1.0%, to ¥416.1 billion ($3,682 million),
and operating income increased 1.6%, to ¥35.1 billion ($311 million).
SHOPPING CENTERS & OFFICE BUILDINGS
In the Shopping Centers & Office Buildings segment, in April 2015 we placed
under the control of subsidiary atré Co., Ltd., three subsidiaries responsible for
managing station buildings in the northern Kanto area in order to strengthen
store development capacities and other capabilities for the implementation of
a management style that is rooted in regions. Further, we launched JRE POINT
as a common Groupwide service in February 2016. Also, following the opening
of atré URAWA (Saitama) in November 2015 and tekute Nagamachi (Miyagi) in
December 2015, we opened the JR SHINJUKU MIRAINA TOWER (Tokyo),
phase 1 of NEWoMan (Tokyo), and S-PAL Sendai East Building (Miyagi) in
March 2016. In addition, we opened nonowa Kunitachi EAST (Tokyo) in April
2015 and nonowa Musashikoganei WEST (Tokyo) in December 2015. At the same
time, we advanced preparations to open nonowa Kunitachi WEST (Tokyo) and
atré Ebisu West Building (Tokyo) in April 2016. In addition, we proceeded with
the construction of JEBL Akihabara Square (Tokyo), which is scheduled for
completion in August 2016; phase 1 of the Shibuya Station Area Development
Plan (East Bldg.), which is scheduled for completion in fiscal 2020; and the
Yokohama Station West Exit Station Building Plan (provisional name), which is
scheduled to open in 2020.
As a result of these initiatives, as well as factors including favorable sales of
LUMINE Co., Ltd., and an increase in revenues accompanying the opening of
MIDORI NAGANO (Nagano), operating revenues of the Shopping Centers &
Office Buildings segment increased 0.4% year on year, to ¥267.6 billion
($2,368 million). However, due to factors such as the recognition of costs arising
from the opening of JR SHINJUKU MIRAINA TOWER (Tokyo), operating
income declined 1.0%, to ¥71.6 billion ($634 million).
OTHERS
In hotel operations, to increase the competitiveness of existing hotels, we
renovated HOTEL METS Musashisakai (Tokyo), HOTEL METS Nagaoka (Niigata),
HOTEL METS Mizonokuchi (Kanagawa), and HOTEL METS Urawa (Saitama). In
advertising and publicity operations, we worked to promote advertising sales for
J-AD Vision, an advertising medium at stations that uses large LCD screens, and
Train Channel, an advertising medium that shows video commercials on trains.
In credit card operations, we increased convenience for customers who use
the Group’s services frequently by beginning the View Gold Plus Card service in
April 2015 and opening View Gold Lounge in Tokyo Station in December 2015.
In Suica shopping services (electronic money), we continued to actively develop
the network of participating stores and business establishments through efforts
that included introduction of Suica electronic money at chain restaurants and
chain stores and other business establishments with wide operating areas. As
a result of these measures, Suica electronic money was usable at approximately
340,000 stores as of March 31, 2016.
In other initiatives, as part of the HAPPY CHILD PROJECT, we opened a
multipurpose child rearing-support and senior citizen-care facility, COTONIOR
Akabane (Tokyo), in April 2015. Also, we prepared for the opening of COTONIOR
Nishi-Funabashi (Chiba) in April 2016. Further, we proceeded with the devel-
opment of childcare support facilities inside station buildings and at other places,
giving us a total of 82 facilities as of March 31, 2016.
As a result of these initiatives, as well as factors including an increase in
sales accompanying work related to the Hokkaido Shinkansen Line and
favorable performances by advertising and publicity and hotel operations,
operating revenues from the Others segment increased 3.2% year on year, to
¥634.0 billion ($5,610 million), and operating income increased 27.4%, to
¥35.0 billion ($310 million).
Notes: 1. The Group applies the Accounting Standard for Disclosures about Segments of an Enterprise and Related Information (Accounting Standards Board of Japan (ASBJ) Statement No. 17, June 30, 2010) and the Guidance on Accounting Standard for Disclosures about Segments of an Enterprise and Related Information (ASBJ Guidance No. 20, March 21, 2008). The operating income of each segment of the Group cor-responds to the segment income under the above Accounting Standard and Guidance.
2. icsca is a registered trademark of Sendai City. 3. Silver Week refers to an extended period of holidays that sometimes occurs in mid-
September as a result of the arrangement of national holidays in that month.
77Annual Report 2016

FACTS AND FIGURES
Management’s Discussion and Analysis of Financial Condition and Results of Operations
Operating IncomeOperating expenses increased 2.2% year on year, to ¥2,379.4 billion ($21,056
million). Operating expenses as a percentage of operating revenues were 83.0%,
compared with 84.5% in the previous fiscal year.
Transportation, other services and cost of sales increased 1.9%, to ¥1,841.0
billion ($16,292 million), because of an increase in cost of equipment.
Selling, general and administrative expenses increased 3.0%, to ¥538.4 billion
($4,764 million), which was due to an increase in cost of equipment.
Operating income rose 14.1%, to ¥487.8 billion ($4,317 million), increasing
for the sixth consecutive fiscal year and reaching a new record high. Operating
income as a percentage of operating revenues was 17.0%, compared with
15.5% in the previous fiscal year.
Income before Income TaxesOther income decreased 33.4%, to ¥58.3 billion ($516 million), due mainly to
a decrease in construction grants received.
Other expenses decreased 19.3%, to ¥161.3 billion ($1,427 million), mainly
as a result of lower losses on reduction entry for construction grants.
Interest and dividend income and other financial income, net of interest
and other financial expenses, amounted to a ¥72.4 billion ($640 million)
expense, which was 7.4% lower than the expense recorded in the previous
fiscal year.
Income before income taxes increased 22.1%, to ¥384.9 billion ($3,406
million). Income before income taxes as a percentage of operating revenues
was 13.4%, compared with 11.4% in the previous fiscal year.
Profit Attributable to Owners of ParentProfit attributable to owners of parent increased 36.0%, to a new record high
of ¥245.3 billion ($2,171 million), following higher income before income
taxes. Earnings per share were ¥626 ($6), up from ¥459 per share. Further,
profit attributable to owners of parent as a percentage of operating revenues
was 8.6%, compared with 6.5% in the previous fiscal year.
Liquidity and Capital ResourcesCash FlowsIn fiscal 2016, net cash provided by operating activities totaled ¥673.1 billion
($5,957 million), ¥50.3 billion more than in the previous fiscal year. This result
was mainly due to an increase in income before income taxes.
Net cash used in investing activities amounted to ¥499.6 billion ($4,421
million), ¥22.7 billion more than in the previous fiscal year. This result was
mainly due to higher payments for purchases of fixed assets.
Capital expenditures were as follows.
In transportation operations, JR East implemented capital expenditures to
further measures for ensuring transportation safety and reliability, institute
countermeasures for large-scale earthquakes, install automatic platform gates
at Yamanote Line stations, and produce new trains. In station space utilization
operations, we opened new stores and conducted renovation work at existing
stores. In shopping centers and office buildings operations, JR East made
capital expenditures related to JR SHINJUKU MIRAINA TOWER (Tokyo),
S-PAL Sendai East Building (Miyagi), and atré URAWA (Saitama). In the
Others segment, capital expenditures included those for systems development
and functional enhancements as well as the renovation of existing hotels.
Further, free cash flows increased ¥27.6 billion, to a positive ¥173.5 billion
($1,536 million).
Net cash used in financing activities came to ¥110.3 billion ($976 million),
¥23.6 billion more than in the previous fiscal year. This result was mainly due
to a decrease in the procurement of funds through interest-bearing debt.
Consequently, cash and cash equivalents as of March 31, 2016, were
¥307.8 billion ($2,724 million), an increase of ¥62.6 billion from ¥245.2 billion
on March 31, 2015.
Financial PolicyInterest-bearing debt at March 31, 2016, stood at ¥3,242.0 billion ($28,690 million).
Long-term liabilities incurred for purchase of railway facilities associated
with JR East’s assumption of Shinkansen railway facilities are paid in equal
semi-annual installments, consisting of principal and interest payments, and
are divided into the following three tranches:
a. ¥44.6 billion ($394 million) payable at a variable interest rate (annual interest
rate in fiscal 2016: 4.13%) through March 31, 2017;
b. ¥48.6 billion ($430 million) payable at a fixed annual interest rate of 6.35%
through March 31, 2017; and
c. ¥336.4 billion ($2,977 million) payable at a fixed annual interest rate of
6.55% through September 30, 2051.
In addition, at the fiscal year-end JR East had long-term liabilities incurred
for purchase of railway facilities of ¥6.8 billion ($60 million) for the Akita hybrid
Shinkansen facilities and ¥2.0 billion ($18 million) for Tokyo Monorail Co., Ltd.
Since fiscal 1998, JR East has made annual early repayments of long-term
liabilities incurred for the purchase of railway facilities associated with JR
East’s assumption of Shinkansen railway facilities based on an agreement
with the Japan Railway Construction, Transport and Technology Agency
(JRTT). JR East made early repayments of ¥7.3 billion ($64 million) in fiscal 2016.
In fiscal 2002, JR East introduced a cash management system that integrated
the management of the Group’s cash and funding, which previously was carried
out separately by subsidiaries, with the aim of reducing the Company’s total
interest-bearing debt. Also, JR East is enhancing capital management methods,
including offsetting internal settlements among subsidiaries and consolidating
payments by subsidiaries.
In fiscal 2016, JR East issued seven unsecured straight bonds in Japan,
with a total nominal amount of ¥100.0 billion ($885 million) and maturities from
2021 through 2046. Rating and Investment Information, Inc. (R&I), a Japanese
rating agency, rated these bonds AA+. Further, JR East received long-term
debt ratings from Standard & Poor’s Ratings Japan K.K. and Moody’s Japan
K.K. of AA– and Aa3, respectively.
In order to respond to short-term financing requirements, JR East has bank
overdraft facilities with its principal banks totaling ¥330.0 billion ($2,920 million).
JR East did not have any bank overdrafts on March 31, 2016. R&I and Moody’s
rated JR East’s commercial paper a-1+ and P-1, respectively, as of the end of
fiscal 2016. There was no outstanding balance of commercial paper issued
by JR East as of March 31, 2016.
In April 2015, JR East established a committed bank credit line (a financing
framework that permits unrestricted borrowing within contract limits based on
certain conditions) with an amount of ¥60.0 billion ($531 million).
78 East Japan Railway Company

The following are issues related to the operational and accounting
procedures that may have a significant bearing on the decisions of investors.
Forward-looking statements in the following section are based on the
assessments of the JR East Group as of March 31, 2016.
Legal Issues Relating to OperationsAs a railway operator, JR East manages its railway operations pursuant to the
stipulations of the Railway Business Act. JR East is generally excluded from
the provisions of the Act on Passenger Railway Companies and Japan Freight
Railway Company (hereinafter the “JR Law”). However, JR East is required to
manage its railway operations in accordance with guidelines relating to mat-
ters that should be considered for the foreseeable future, which are stipulated
in a supplementary provision of a partial amendment of the JR Law (hereinaf-
ter the “amended JR Law”). Details of relevant laws are as follows.
Railway Business Act (Act No. 92 of 1986)Under the Railway Business Act, railway operators are required to obtain the
permission of the Minister of Land, Infrastructure, Transport and Tourism
(hereinafter the “Minister”) for each type of line and railway business operated
(Article 3). Operators receive approval from the Minister for the upper limit of
passenger fares and Shinkansen limited express surcharges (hereinafter
“fares and surcharges”). Subject to prior notification, railway operators can
then set or change fares and surcharges within those upper limits (Article 16).
Operators are also required to give the Minister advance notice of the elimina-
tion or suspension of railway operations. In the case of eliminating operations,
the notice must be given at least one year in advance (Article 28, paragraphs
1 and 2).
JR Law (Act No. 88 of 1986)AIM OF THE ESTABLISHMENT OF THE JR LAW
Prior to its amendment, the JR Law regulated the investments and the estab-
lishment of JR East, Hokkaido Railway Company (JR Hokkaido), Central Japan
Railway Company (JR Central), West Japan Railway Company (JR West),
Shikoku Railway Company (JR Shikoku), Kyushu Railway Company (JR
Kyushu), and Japan Freight Railway Company (JR Freight) and included
provisions on the operational purposes and scopes of those companies
(hereinafter the “JR Companies”). In addition to the provisions of the Railway
Business Act, the JR Companies are subject to provisions of the JR Law that
require the approval of the Minister with respect to significant management
decisions. Also, under the JR Law preferential measures were applied to the
JR Companies, such as those entitling holders of the bonds of the JR
Companies to preferential rights over the claims of unsecured creditors
(general mortgage).
AMENDED JR LAW
(a) The amended JR Law enacted on December 1, 2001 (Act No. 61 of 2001),
excluded JR East, JR Central, and JR West (the three JR passenger
railway companies operating on Japan’s main island of Honshu,
hereinafter the “three JR Honshu Companies”) from the provisions of the
JR Law that had been applicable to them until then.
(b) Further, the amended JR Law enables the Minister to issue guidelines
relating to matters that should be considered for the foreseeable future
with respect to the management of the railway operations of the new
companies, including any additional companies that may become
involved in the management of all or a part of those railway operations as
a result of assignations, mergers, divisions, or successions as designated
by the Minister on or after the date of enactment of the amended JR Law
(supplementary provision, Article 2, paragraph 1). Those guidelines were
issued on November 7, 2001, and applied on December 1, 2001.
(c) The guidelines stipulate items relating to the following three areas:
• Items relating to ensuring alliances and cooperation among companies
(among the new companies or among the new companies and JR
Companies) with respect to the establishment of appropriate passenger
fares and surcharges, the unhindered utilization of railway facilities, and
other factors relating to railway operations.
• Items relating to the appropriate maintenance of railway routes currently
in operation reflecting trends in transportation demand and other
changes in circumstances following the restructuring of Japanese
National Railways (JNR) and items relating to ensuring the convenience
of users through the development of stations and other railway facilities.
• Items stating that the new companies should give consideration to the
avoidance of actions that inappropriately obstruct business activities or
infringe upon the interests of small and medium-sized companies
operating businesses within the operational areas of the new compa-
nies that are similar to the businesses of the new companies.
(d) The Minister may advise and issue instructions to the new companies to
secure operations that are in accordance with those guidelines (supple-
mentary provision, Article 3). Moreover, the amended JR Law enables the
Minister to issue warnings and directives in the event that operational
management runs counter to the guidelines without any justifiable reason
(supplementary provision, Article 4).
(e) With respect to the provisions of those guidelines, JR East has always
given, and of course will continue to give, adequate consideration to such
items in the management of its railway operations. Therefore, JR East
does not anticipate that those provisions will have a significant impact on
its management.
(f) In addition, the amended JR Law includes required transitional measures,
such as the stipulation that all bonds issued by the three JR Honshu
Companies prior to the amended JR Law’s enactment date are and will
continue to be general mortgage bonds as determined in Article 4 of the
JR Law (supplementary provision, Article 7).
Establishment of and Changes to Fares and Surcharges
The required procedures when JR East sets or changes fares and
surcharges for its railway operations are stipulated in the Railway Business
Act. Changes to those procedures or the inability to flexibly change fares and
surcharges based on those procedures for whatever reason could affect JR
East’s earnings. Details of those procedures are as follows.
Systems and Procedures for Approval of Fares and SurchargesThe Railway Business Act stipulates that railway operators are required to
obtain the approval of the Minister when setting or changing the upper limit for
fares and surcharges (Railway Business Act, Article 16, paragraph 1).
Operational and Other Risk Information
79Annual Report 2016

FACTS AND FIGURES
Subject to prior notification, railway operators can then set or change fares
and surcharges within those upper limits, including limited express sur-
charges on conventional lines and other charges (Railway Business Act,
Article 16, paragraphs 3 and 4).
Currently, fares and surcharges for passengers and freight spanning the
use of two or more JR companies are allowed to be added cumulatively
based on agreements among the JR companies, with fares adjusted accord-
ing to the tapering distance rate. This measure was intended to ensure user
convenience, etc., when implementing the JNR reforms, and does not prevent
the JR Companies from independently setting fares.
JR East’s Stance(a) JR East has not raised fares since its establishment in April 1987,
other than to reflect the consumption tax introduction (April 1989) and
subsequent revisions (April 1997 and April 2014).
Through efficient business operation realized by securing revenues and
reducing expenses, JR East has worked to create a management base
that is not dependent on raising fares. However, if JR East was unable to
secure appropriate profit levels as a result of such factors as changes in
the operating environment, it would view the timely implementation of fare
revisions as necessary to secure appropriate profit levels.
(b) With the efficient management of operations as a precondition, JR East
believes securing a profit level that enables capital expenditures for the
future and the strengthening of its financial condition—in addition to the
distribution of profits to shareholders—to be essential.
(c) JR East primarily undertakes capital expenditures, which has a
significant impact on the capital usage of railway operations, with a view
to establishing a robust management base through ensuring safe and
reliable transportation, offering high-quality services, and implementing
other measures. Further, JR East appreciates the need to proactively
conduct capital expenditures while clearly defining the responsibilities of
management in business operation.
Stance of the Ministry of Land, Infrastructure, Transport and Tourism (hereinafter the “MLIT”)With respect to the implementation of fare revisions by JR East, the position of
the MLIT is as follows.
(a) The Minister will approve applications for the revision of the upper limits of
fares from railway operators, including from JR East, upon conducting
inspections to determine that the fares do not exceed the sum of reason-
able costs and profits that can be expected to be incurred through the
efficient management of those companies (hereinafter “total cost”)
(Railway Business Act, Article 16, paragraph 2).
In addition, a three-year period is stipulated for the calculation of costs.
(b) Even if the railway operator has non-railway businesses, the calculation of
total cost—which comprises reasonable costs and reasonable profits,
including required dividend payments to shareholders—is based only on
the operator’s railway operations.
Further, operators are required to submit their capital expenditure plans
for increasing transportation services to ease crowding of commuter
services and for other improvements in passenger services. The capital
usage necessary for such enhancements is recognized in the calculation
of total cost.
(c) Total cost is calculated using a “rate base method” that estimates the
capital cost (interest payments, dividend payments, and other financial
costs) arising from the provision of a fair and appropriate return, based on
the opportunity cost concept, in relation to the capital invested in the said
railway operations. The calculation of total cost is as follows:
• total cost = operating cost*1 + operational return
• operational return = assets utilized in railway business operations (rate
base) x operational return rate
• assets utilized in railway business operations = railway business opera-
tions fixed assets + construction in progress + deferred assets +
working capital*2
• operational return rate = equity ratio*3 x return rate on equity*4 +
borrowed capital ratio*3 x return rate on borrowed capital*4
*1 With respect to comparable costs among railway operators, in order to promote enhanced management efficiency, a “yardstick formula” is used to encourage indirect competition among respective operators. The results of those comparisons are released at the end of every fiscal year and form the basis for the calculation of costs.
*2 Working capital = operating costs and certain inventories*3 Equity ratio = 30%, Borrowed capital ratio = 70%.*4 Return rate on equity is based on the average of yields on public and corporate bonds and the
overall industrial average return on equity and dividend yield ratio. Return rate on borrowed capital is based on the average actual rate on loans and other liabilities.
(d) Subject to the prior notification of the Minister, railway operators can set or
change fares and surcharges within the upper limits approved along with
other charges. However, the Minister can issue directives requiring
changes in fares and surcharges by specified terms if the fares and
surcharges submitted are deemed to fall within the following categories
(Railway Business Act, Article 16, paragraph 5):
• The changes would lead to unjustifiable discrimination in the treatment
of certain passengers.
• There is concern that the changes would give rise to unfair competition
with other railway transportation operators.
Plan for the Development of New Shinkansen LinesConstruction Plans for New Shinkansen LinesNew Shinkansen lines are those lines indicated in the plan for the Shinkansen
line network that was decided pursuant to the Nationwide Shinkansen Railway
Development Law (Act No. 71 of 1970). Finalized in 1973, that plan called for
the development of the Tohoku Shinkansen Line (Morioka–Aomori), the
Hokuriku Shinkansen Line (Tokyo–Nagano–Toyama–Osaka), the Kyushu
Shinkansen Line (Fukuoka–Kagoshima), and other Shinkansen lines.
Following the division and privatization of JNR, JR East was selected as the
operator of the Takasaki–Joetsu segment of the Hokuriku Shinkansen Line
and the Morioka–Aomori segment of the Tohoku Shinkansen Line. JR East
started operation of the Hokuriku Shinkansen Line between Takasaki and
Nagano on October 1, 1997; the Tohoku Shinkansen Line between Morioka
and Hachinohe on December 1, 2002, and between Hachinohe and Shin-
Aomori on December 4, 2010; and then on the Hokuriku Shinkansen Line
between Nagano and Joetsumyoko on March 14, 2015.
Operational and Other Risk Information
80 East Japan Railway Company

New Shinkansen lines not under the jurisdiction of JR East are being
developed on the Shin-Hakodate Hokuto–Sapporo segment of the Hokkaido
Shinkansen Line, the Kanazawa–Tsuruga segment of the Hokuriku
Shinkansen Line, and the Takeo-Onsen–Nagasaki segment of the Kyushu
Shinkansen Line.
Cost Burden of the Development of New Shinkansen Lines(a) The national government, local governments, and the JR Companies
assume the cost of new Shinkansen lines constructed by the Japan
Railway Construction, Transportation and Technology Agency (JRTT).
Amounts to be funded by the JR Companies are to be paid out of
the following:
1) Usage fees and other charges paid by the JR Companies as the
operator of the line,
2) Funds made available from the JRTT, to which JR East, JR Central, and
JR West make payments of amounts due on their Shinkansen pur-
chase liabilities.
(b) In October 1997, the opening of the Takasaki–Nagano segment of the
Hokuriku Shinkansen Line was accompanied by new standards for the
amount of usage fees paid by the JR Companies as the operator of the
line. Those usage fees are now regulated under the Japan Railway
Construction, Transport and Technology Agency Law (enforcement
ordinance, Article 6).
That enforcement ordinance stipulates that the JRTT will determine the
amount of usage fees based on the benefit received as the operator of the
said Shinkansen line after opening and the sum of taxes and maintenance
fees paid by the JRTT for railway facilities leased. Of those, the benefits
received as the operator are calculated by comparing the estimated
revenues and expenses generated by the new segment of the
Shinkansen line and related line segments after opening with the rev-
enues and expenses that would likely be generated by parallel conven-
tional lines and related line segments if the new segment of the
Shinkansen line was not opened. The expected benefits are the difference
between the amount that the operator of the new Shinkansen line should
receive as a result of operation and the amount that would be received if
the new Shinkansen lines did not commence service. Specifically, the
expected benefits are calculated based on expected demand and rev-
enues and expenses over a 30-year period after opening. Further,
a part of the usage fees, which are calculated based on the expected
benefits, is fixed for the 30-year period after commencing services. In
addition, the taxes and maintenance fees are included in calculations of
the corresponding benefits as an expense of the operator of the
Shinkansen line after opening. Therefore, the burden of the operator is
kept within the limits of the corresponding benefits.
With respect to the usage fee amount for the Takasaki–Nagano seg-
ment of the Hokuriku Shinkansen Line, which opened in October 1997, JR
East decided that the usage fees calculated by the former Japan Railway
Construction Public Corporation (JRCC) (currently, the JRTT) were within
the limits of the corresponding benefits to result from the opening of that
line and concluded an agreement with the JRCC in September 1997.
Also, the JRCC received approval for those usage fees from the Minister
of Transport in September 1997. Usage fees for fiscal 2016 totaled ¥20.8
billion ($184 million), comprising the fixed amount calculated based on
the corresponding benefits of ¥17.5 billion ($155 million) and taxes and
maintenance fees of ¥3.3 billion ($29 million).
In November 2002, JR East also concluded an agreement with the
JRCC regarding the usage fee amount for the Morioka–Hachinohe seg-
ment of the Tohoku Shinkansen Line, which opened in December 2002.
The JRCC received approval for those usage fees from the Minister in
November 2002. Usage fees for fiscal 2016 totaled ¥10.3 billion ($91
million), comprising the fixed amount calculated based on the corre-
sponding benefits of ¥7.9 billion ($70 million) and taxes and maintenance
fees of ¥2.4 billion ($21 million).
In December 2010, JR East also concluded an agreement with the
JRTT regarding the usage fee amount for the Hachinohe–Shin-Aomori
segment of the Tohoku Shinkansen Line, which opened in December
2010. The JRTT received approval for those usage fees from the Minister
in December 2010. Usage fees for fiscal 2016 totaled ¥8.1 billion ($72
million), comprising the fixed amount calculated based on the corre-
sponding benefits of ¥7.0 billion ($62 million) and taxes and maintenance
fees of ¥1.1 billion ($10 million).
IIn March 2016, JR East concluded an agreement with the JRTT regard-
ing the additional usage fee amount to be added to the usage fee amount
for the Hachinohe–Shin-Aomori segment of the Tohoku Shinkansen Line
in relation to the Shin-Aomori–Shin-Hakodate Hokuto segment of the
Hokkaido Shinkansen Line, which opened in March 2016. The usage fee
amount to be paid by JR East in each fiscal year is defined as comprising
the fixed amount calculated based on the corresponding benefits of ¥2.2
billion ($19 million). However, usage fees for fiscal 2016 were calculated
per diem as the line segment opened partway through the fiscal year.
These usage fees totaled ¥0.0 billion ($0 million).
In March 2015, JR East concluded an agreement with the JRTT regard-
ing the usage fee amount for the Nagano–Joetsumyoko segment of the
Hokuriku Shinkansen Line, which opened in March 2015. The JRTT
received approval for those usage fees from the MLIT in March 2015.
Usage fees for fiscal 2016 totaled ¥16.6 billion ($147 million), comprising
the fixed amount calculated based on the corresponding benefits of
¥16.5 billion ($146 million) and taxes and maintenance fees of ¥0.1 billion
($1 million).
(c) Compared with periods when there is no construction of new Shinkansen
lines, costs related to new Shinkansen lines, such as depreciation of railcars
and other costs, can have an impact on JR East’s single-year revenues and
expenses in the initial period after opening. However, given the nature of
usage fees mentioned in (b) above, JR East believes that such factors will not
have an impact on revenues and expenses over the 30-year period following
the opening.
End of Loan PeriodThe treatment of railway facilities along the Takasaki–Joetsu myoko segment
of the Hokuriku Shinkansen Line and the Morioka–Shin-Aomori segment of
the Tohoku Shinkansen Line—both on loan from the JRTT—will be discussed
and re-determined 30 years after the commence date of the loaning.
81Annual Report 2016

FACTS AND FIGURES
Operational and Other Risk Information
Safety MeasuresRailway operations can potentially suffer significant damage resulting from
accidents due to natural disasters, human error, crime, or terrorism; accidents
at nuclear power plants; the large-scale spread of infectious diseases; or
other factors.
The JR East Group regards ensuring safety as a top management priority.
Accordingly, JR East is taking measures to build a railway with high safety
levels by addressing infrastructural and operational issues, and is steadily
advancing the measures described in the sixth five-year safety plan, “JR East
Group Safety Plan 2018.”
Specifically, we implemented seismic reinforcement in preparation for a
major earthquake, such as a possible earthquake directly beneath the Tokyo
metropolitan area. The Company has earmarked a total of ¥300 billion for
investment in such measures for a five-year intensive implementation period
ending March 31, 2017. Approximately 70% of the work that is currently
planned has been completed. The Company also commenced the operation
of automatic platform gates at five railway stations on the Yamanote Line,
including Nippori Station. The new gates increased the total number of sta-
tions with such gates to 23 stations. As for lines other than the Yamanote Line,
we prepared for the introduction of automatic platform gates to such railway
stations as Shin-Koiwa Station on the Sobu Line Rapid Service based on
review of line segment conditions, how the stations are used, and other
factors. As measures for preventing railway crossing accidents, we continued
converting to type-1 railway crossings, eliminating and consolidating railway
crossings, and installing more obstruction warning devices and obstacle
detection devices for railway crossings. In addition, to improve the safety of
personnel that perform maintenance work, we developed a train approach
alarm system that utilizes GPS and began using it on the Hachiko Line and
the Iiyama Line in April 2016.
Information Systems and Protection of Personal Data
The JR East Group currently uses many information systems in its various
railway and life-style service businesses, and Suica operations. Further,
information systems play an important role for travel agencies as well as
Railway Information Systems Co., Ltd., and other companies with which the
JR East Group has close business relationships. If the functions of those
information systems were seriously damaged as a result of natural disasters
or human error, this could have an impact on the operations of JR East.
Moreover, in the event that personal data stored in those information systems
was leaked to unrelated third parties or altered due to information systems
becoming infected by viruses or unauthorized manipulation, it could affect JR
East’s financial condition and business performance.
The JR East Group takes measures to prevent damage and ensure secu-
rity, such as continuously upgrading the functions of in-house systems and
training related personnel. In the unlikely event of a system problem, JR East
would minimize the impact by taking measures through an initial action frame-
work that would be promptly set up and coordinated across operational
divisions. Further, JR East is doing its utmost to ensure the strict management
and protection of personal data through the establishment of in-house regula-
tions that include stipulations for the appropriate treatment of personal data,
restricted authorization for access to personal data, control of access author-
ity, and the construction of a system of in-house checks.
Development of the Life-Style Service BusinessThe JR East Group has positioned the life-style service business as a central
pillar of management. In the life-style service business, JR East is developing
station space utilization, shopping centers and office buildings, and other
operations (hotel operations, advertising and publicity, and other services).
In the life-style service business, JR East faces the risk of a downturn in
consumption associated with an economic recession or unseasonable
weather, which could lead to lower revenues from its shopping centers, office
buildings, restaurants, and stores in railway stations, hotels, and other opera-
tions. Such eventualities could also adversely affect sales of advertisement
services and cause an increase in demands from tenants for rent reductions.
Further, a defect in manufactured products or sold products, such as an
outbreak of food poisoning or a similar incident, could reduce sales, damage
trust in the JR East Group, or result in the bankruptcy of tenants or business
partners. The occurrence of any of those contingencies could have an impact
on the JR East Group’s financial condition and business performance. The JR
East Group will fully leverage its railway stations as its largest management
resource to develop operations. At the same time, the JR East Group will
enhance earnings and secure customer trust by implementing stringent
management of hygiene and information on business partners.
82 East Japan Railway Company

CompetitionThe JR East Group’s railway business competes with transportation sources
including airlines, automobiles, buses, and other railway companies. Further,
the JR East Group’s life-style service business competes with existing and
newly established businesses. The competition of the JR East Group’s railway
and life-style service businesses with such rivals could have an impact on the
JR East Group’s financial condition and business performance.
Intensified competition in the transportation market could adversely affect
earnings from JR East’s railway business. Such competition includes the
expansion of low-cost carrier (LCC) routes, toll discounts and other sales
promotion measures on expressways, and the advancement of large-scale
upgrading works by other railway operators in the Tokyo metropolitan area.
Also, developments such as the new entry of other companies into markets or
the renovation or reopening of existing commercial facilities could result in
increased competition, and thereby adversely affect earnings from JR East’s
life-style service business.
Reduction of Total Interest-Bearing DebtOn March 31, 2016, total interest-bearing debt stood at ¥3,242.0 billion
($28,690 million). In addition, interest expense in fiscal 2016 amounted to
¥76.3 billion ($676 million), which was equivalent to 15.6% of operating
income.
JR East will continue to reduce interest-bearing debt and refinance to
obtain lower interest rates. However, a reduction in free cash flows due to
unforeseen circumstances or a change in borrowing rates due to fluctuation
in interest rates could affect JR East’s financial condition and business
performance.
ComplianceThe JR East Group conducts operations in a variety of areas, including
the railway and life-style service businesses, and Suica operations. These
operations are advanced in a manner pursuant to the stipulations of related
statutory laws and regulations, such as the Railway Business Act, and in
adherence to corporate ethics. However, becoming subject to administrative
measures or losing public confidence due to a breach of those statutory laws
and regulations or corporate ethics could affect the JR East Group’s financial
condition and business performance.
The JR East Group, in addition to establishing the Legal Compliance and
Corporate Ethics Guidelines, works to ensure legal compliance through such
initiatives as enhancing employee education about legal compliance and
checking the status of compliance with statutory laws and regulations that
relate to all the areas of its operations.
83Annual Report 2016

FACTS AND FIGURES
Consolidated Balance SheetsEast Japan Railway Company and SubsidiariesMarch 31, 2015 and 2016
Millions of Yen
Millions ofU.S. Dollars(Note 2 (1))
2015 2016 2016
Assets
Current Assets:
Cash and cash equivalents (Notes 5 and 9) ¥ 245,171 ¥ 307,809 $ 2,724 Receivables (Note 9):
Accounts receivable–trade 453,620 467,734 4,139 Unconsolidated subsidiaries and affiliated companies 9,313 10,665 94 Other 6,030 5,962 53 Allowance for doubtful accounts (Note 2 (4)) (1,667) (1,573) (14)
467,296 482,788 4,272 Inventories (Notes 2 (5) and 6) 52,856 47,835 423 Real estate for sale (Notes 2 (6) and 7) 1,099 904 8 Deferred tax assets (Note 21) 43,635 49,188 435 Other current assets 45,728 45,995 408
Total current assets 855,785 934,519 8,270
Investments:
Unconsolidated subsidiaries and affiliated companies (Notes 2 (2), (3) and 8) 52,707 53,529 474 Other (Notes 2 (7), 9 and 10) 197,660 160,574 1,421
250,367 214,103 1,895
Property, Plant and Equipment (Notes 2 (8), 11, 12 and 22):
Buildings 2,415,148 2,519,190 22,294 Fixtures 5,706,075 5,798,964 51,318 Machinery, rolling stock and vehicles 2,692,386 2,721,599 24,085 Land 1,991,792 2,002,530 17,722 Construction in progress 254,959 306,398 2,711 Other 228,212 236,498 2,093
13,288,572 13,585,179 120,223 Less accumulated depreciation 7,199,572 7,351,637 65,059
Net property, plant and equipment 6,089,000 6,233,542 55,164
Other Assets:
Long-term deferred tax assets (Note 21) 218,974 217,256 1,923 Other 191,564 190,342 1,684
410,538 407,598 3,607 ¥ 7,605,690 ¥ 7,789,762 $ 68,936
See accompanying notes.
84 East Japan Railway Company
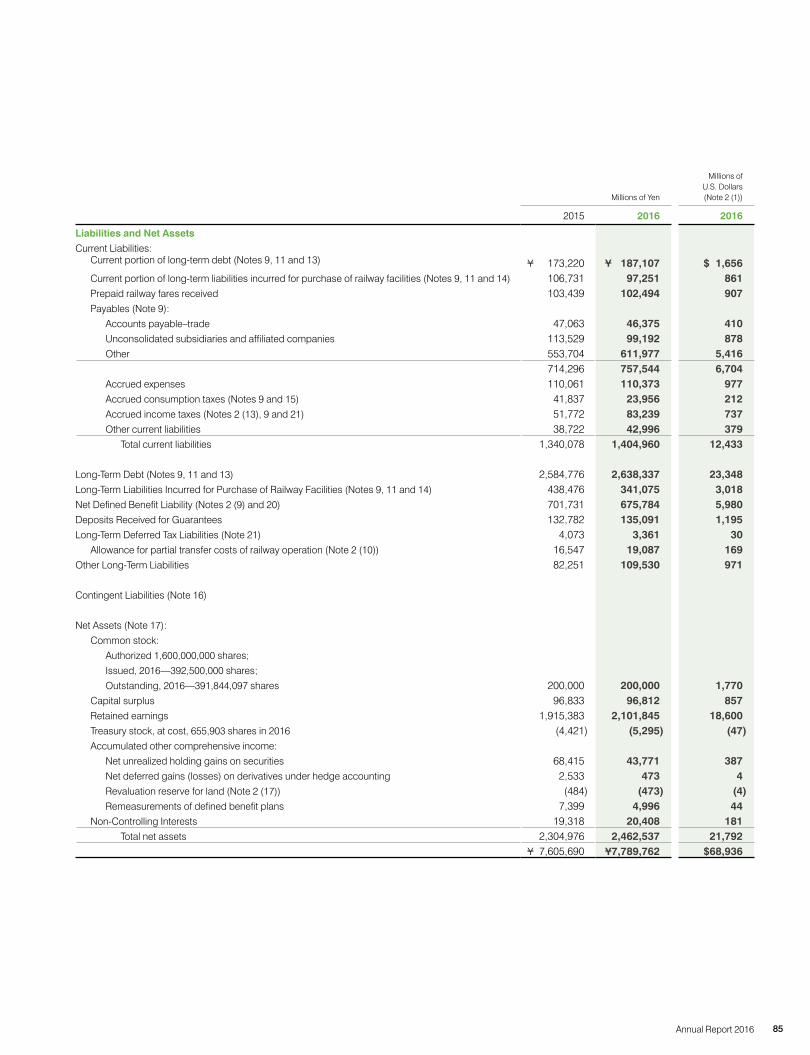
Millions of Yen
Millions ofU.S. Dollars(Note 2 (1))
2015 2016 2016
Liabilities and Net Assets
Current Liabilities:Current portion of long-term debt (Notes 9, 11 and 13) ¥ 173,220 ¥ 187,107 $ 1,656 Current portion of long-term liabilities incurred for purchase of railway facilities (Notes 9, 11 and 14) 106,731 97,251 861 Prepaid railway fares received 103,439 102,494 907 Payables (Note 9):
Accounts payable–trade 47,063 46,375 410 Unconsolidated subsidiaries and affiliated companies 113,529 99,192 878Other 553,704 611,977 5,416
714,296 757,544 6,704 Accrued expenses 110,061 110,373 977 Accrued consumption taxes (Notes 9 and 15) 41,837 23,956 212 Accrued income taxes (Notes 2 (13), 9 and 21) 51,772 83,239 737 Other current liabilities 38,722 42,996 379
Total current liabilities 1,340,078 1,404,960 12,433
Long-Term Debt (Notes 9, 11 and 13) 2,584,776 2,638,337 23,348 Long-Term Liabilities Incurred for Purchase of Railway Facilities (Notes 9, 11 and 14) 438,476 341,075 3,018 Net Defined Benefit Liability (Notes 2 (9) and 20) 701,731 675,784 5,980 Deposits Received for Guarantees 132,782 135,091 1,195 Long-Term Deferred Tax Liabilities (Note 21) 4,073 3,361 30
Allowance for partial transfer costs of railway operation (Note 2 (10)) 16,547 19,087 169 Other Long-Term Liabilities 82,251 109,530 971
Contingent Liabilities (Note 16)
Net Assets (Note 17):
Common stock:
Authorized 1,600,000,000 shares;
Issued, 2016—392,500,000 shares;
Outstanding, 2016—391,844,097 shares 200,000 200,000 1,770 Capital surplus 96,833 96,812 857 Retained earnings 1,915,383 2,101,845 18,600 Treasury stock, at cost, 655,903 shares in 2016 (4,421) (5,295) (47)Accumulated other comprehensive income:
Net unrealized holding gains on securities 68,415 43,771 387 Net deferred gains (losses) on derivatives under hedge accounting 2,533 473 4 Revaluation reserve for land (Note 2 (17)) (484) (473) (4)Remeasurements of defined benefit plans 7,399 4,996 44
Non-Controlling Interests 19,318 20,408 181 Total net assets 2,304,976 2,462,537 21,792
¥ 7,605,690 ¥7,789,762 $68,936
85Annual Report 2016

FACTS AND FIGURES
Consolidated Statements of Income and Comprehensive IncomeEast Japan Railway Company and SubsidiariesYears ended March 31, 2015 and 2016
(I) CONSOLIDATED STATEMENTS OF INCOME
(II) CONSOLIDATED STATEMENTS OF COMPREHENSIVE INCOME (Note 24)
Millions of Yen
Millions ofU.S. Dollars(Note 2 (1))
2015 2016 2016
Operating Revenues (Note 23) ¥2,756,165 ¥2,867,200 $25,373 Operating Expenses:
Transportation, other services and cost of sales 1,806,181 1,841,026 16,292Selling, general and administrative expenses 522,462 538,353 4,764
2,328,643 2,379,379 21,056Operating Income (Note 23) 427,522 487,821 4,317
Other Income (Expenses):
Interest expense on short-and long-term debt (45,310) (45,559) (403)Interest expense incurred for purchase of railway facilities (36,652) (30,773) (272)Loss on sales of fixed assets (2,088) (1,102) (10)Impairment losses on fixed assets (Notes 2 (16), 12 and 23) (12,738) (12,297) (109)Interest and dividend income 3,756 3,918 35 Equity in net income (loss) of affiliated companies 3,134 2,566 23 Gain on sales of fixed assets 1,212 839 7 Other, net (23,535) (20,552) (182)
(112,221) (102,960) (911)Income before Income Taxes 315,301 384,861 3,406
Income Taxes (Notes 2 (13) and 21):
Current 107,540 128,972 1,141 Deferred 26,203 9,327 83
Profit 181,558 246,562 2,182
Profit Attributable to Non-Controlling Interests (1,160) (1,252) (11)Profit Attributable to Owners of Parent ¥ 180,398 ¥ 245,310 $ 2,171
YenU.S. Dollars(Note 2 (1))
Earnings per Share (Note 2 (14)) ¥ 459 ¥ 626 $ 6Cash Dividends Applicable to the Year (Note 2 (14)) 120 130 1
See accompanying notes.
Millions of Yen
Millions ofU.S. Dollars(Note 2 (1))
2015 2016 2016
Profit ¥181,558 ¥246,562 $2,182 Other Comprehensive Income: 47,735 (29,143) (258)
Net unrealized holding gains (losses) on securities 29,310 (24,070) (213)Net deferred gains (losses) on derivatives under hedge accounting 1,319 (1,091) (10)Remeasurements of defined benefit plans 13,033 (906) (8)Share of other comprehensive income of associates accounted for using equity method 4,073 (3,076) (27)
Comprehensive Income ¥229,293 ¥217,419 $1,924 Comprehensive Income Attributable to
Comprehensive income attributable to owners of parent ¥228,100 ¥216,215 $1,913 Comprehensive income attributable to non-controlling interests 1,193 1,204 11
See accompanying notes.
86 East Japan Railway Company

Consolidated Statements of Changes in Net AssetsEast Japan Railway Company and SubsidiariesYears ended March 31, 2015 and 2016
Shares Millions of Yen
Number of Issued Shares of
Common StockCommon
StockCapital Surplus
Retained Earnings
Treasury Stock
Net Unrealized Holding Gains
(Losses) on Securities
Net Deferred Gains (Losses) on Derivatives under Hedge
Accounting
Revaluation Reserve for
Land
Remeasure-ments of
Defined Benefit Plans
Non-Controlling
Interests Total
Balance at March 31, 2014 395,000,000 ¥200,000 ¥96,791 ¥1,858,008 ¥ (4,327) ¥36,857 ¥1,650 ¥(504) ¥ (7,842) ¥18,725 ¥2,199,358 C umulative effects of changes in
accounting policies — — — (64,882) — — — — — (82) (64,964) Restated balance 395,000,000 200,000 96,791 1,793,126 (4,327) 36,857 1,650 (504) (7,842) 18,643 2,134,394 C ash dividends (¥120 per share) — — — (47,272) — — — — — — (47,272) P rofit attributable to owners of parent — — — 180,398 — — — — — — 180,398 Increase due to merger — — — 493 — — — — — — 493 Purchase of treasury stock — — — — (11,386) — — — — — (11,386) Disposal of treasury stock — — 0 — 1 — — — — — 1 Retirement of treasury stock (1,500,000) — (0) (11,361) 11,361 — — — — — — C hange in equity in affiliated
companiese accounted for by equity method-treasury stock — — — — (70) — — — — — (70)
C hange of scope of consolidation — — — (1) — — — — — — (1) C apital increase of consolidated
subsidiaries — — 15 — — — — — — — 15 P urchase of shares of
consolidated subsidiaries — — 27 — — — — — — — 27 I ncrease by corporate division in
consolidated subsidiaries — — — — — — — — — — — Other — — — — — 31,558 883 20 15,241 675 48,377Balance at March 31, 2015 393,500,000 ¥200,000 ¥96,833 ¥1,915,383 ¥ (4,421) ¥68,415 ¥2,533 ¥(484) ¥ 7,399 ¥19,318 ¥2,304,976 C umlative effects of changes in
accounting policies — — — — — — — — — — — Restated balance 393,500,000 200,000 96,833 1,915,383 (4,421) 68,415 2,533 (484) 7,399 19,318 2,304,976 Cash dividends(¥130 per share) — — — (49,083) — — — — — — (49,083) P rofit attributable to owners of parent — — — 245,310 — — — — — — 245,310 Increase due to merger — — — — — — — — — — — Purchase of treasury stock — — — — (11,085) — — — — — (11,085) Disposal of treasury stock — — — — — — — — — — — Retirement of treasury stock (1,000,000) — — (10,211) 10,211 — — — — — — C hange in equity in affiliated
companiese accounted for by equity method-treasury stock — — — — — — — — — — —
Change of scope of consolidation — — — 424 — — — — — — 424 C apital increase of consolidated
subsidiaries — — — — — — — — — — — P urchase of shares of consolidated
subsidiaries — — 0 — — — — — — — 0 I ncrease by corporate division in
consolidated subsidiaries — — (21) 22 — — — — — — 1 Other — — — — — (24,644) (2,060) 11 (2,403) 1,090 (28,006)Balance at March 31,2016 392,500,000 ¥200,000 ¥96,812 ¥2,101,845 ¥ (5,295) ¥ 43,771 ¥ 473 ¥(473) ¥ 4,996 ¥20,408 ¥2,462,537
Shares Millions of U.S. Dollars (Note 2 (1))
Number of Issued Shares of
Common StockCommon
StockCapital Surplus
Retained Earnings
Treasury Stock
Net Unrealized Holding Gains
(Losses) on Securities
Net Deferred Gains (Losses) on Derivatives under Hedge
Accounting
Revaluation Reserve for
Land
Remeasure-ments of
Defined Benefit Plans
Non-Controlling
Interests Total
Balance at March 31, 2015 393,500,000 $1,770 $857 $16,950 $(39) $ 605 $ 22 $(4) $ 65 $171 $20,397 C umulative effects of changes in
accounting policies — — — — — — — — — — — Restated balance 393,500,000 1,770 857 16,950 (39) 605 22 (4) 65 171 20,397 C ash dividends ($1 per share) — — — (435) — — — — — — (435) P rofit attributable to owners of parent — — — 2,171 — — — — — — 2,171 Increase due to merger — — — — — — — — — — — Purchase of treasury stock — — — — (98) — — — — — (98) Disposal of treasury stock — — — — — — — — — — — Retirement of treasury stock (1,000,000) — — (90) 90 — — — — — — C hange in equity in affiliated
companiese accounted for by equity method-treasury stock — — — — — — — — — — —
C hange of scope of consolidation — — — 4 — — — — — — 4 C apital increase of consolidated
subsidiaries — — — — — — — — — — — P urchase of shares of
consolidated subsidiaries — — 0 — — — — — — — 0 I ncrease by corporate division in
consolidated subsidiaries — — (0) 0 — — — — — — 0 Other — — — — — (218) (18) 0 (21) 10 (247)Balance at March 31, 2016 392,500,000 $1,770 $857 $18,600 $(47) $ 387 $ 4 $(4) $ 44 $181 $21,792
See accompanying notes.
87Annual Report 2016

FACTS AND FIGURES
Consolidated Statements of Cash FlowsEast Japan Railway Company and SubsidiariesYears ended March 31, 2015 and 2016
Millions of Yen
Millions ofU.S. Dollars(Note 2 (1))
2015 2016 2016
Cash Flows from Operating Activities:
Income before income taxes ¥ 315,301 ¥ 384,861 $ 3,406 Depreciation 353,251 359,515 3,182 Impairment losses on fixed assets 12,738 12,297 109 Amortization of long-term prepaid expense 8,244 8,720 77 Net change in net defined benefit liability (24,100) (27,649) (245)Interest and dividend income (3,422) (3,918) (35)Interest expense 81,962 76,332 676 Construction grants received (59,206) (24,487) (217)Loss from disposition and provision for cost reduction of fixed assets 91,856 55,071 487 Net change in major receivables (3,898) (27,638) (245)Net change in major payables (28,181) 13,688 121 Other 69,322 5,468 49
Sub-total 813,867 832,260 7,365 Proceeds from interest and dividends 4,160 4,408 39 Payments of interest (82,205) (76,488) (677)Insurance proceeds related to earthquake 3,362 14,688 130 Payments of earthquake-damage losses (3,060) (1,338) (12)Payments of partial transfer costs of railway operation — (452) (4)Payments of income taxes (113,362) (99,968) (884)
Net cash provided by operating activities 622,762 673,110 5,957
Cash Flows from Investing Activities:
Payments for purchases of fixed assets (503,747) (538,245) (4,763)Proceeds from sales of fixed assets 1,039 11,531 102 Proceeds from construction grants 33,750 32,123 284 Payments for purchases of investment in securities (4,158) (714) (6)Proceeds from sales of investment in securities 4,729 4,664 41 Other (8,457) (8,934) (79)
Net cash used in investing activities (476,844) (499,575) (4,421)
Cash Flows from Financing Activities:
Proceeds from long-term loans 182,500 140,600 1,244 Payments of long-term loans (123,006) (118,212) (1,046)Proceeds from issuance of bonds 120,000 100,000 885 Payments for redemption of bonds (75,000) (55,000) (487)Payments of liabilities incurred for purchase of railway facilities (121,209) (106,881) (946)Payments of acquisition of treasury stock (11,320) (11,086) (98)Cash dividends paid (47,272) (49,082) (434)Other (11,329) (10,605) (94)
Net cash used in financing activities (86,636) (110,266) (976)
Net Change in Cash and Cash Equivalents 59,282 63,269 560 Cash and Cash Equivalents at Beginning of Year 186,058 245,171 2,170 Decrease in Cash and Cash Equivalents Resulting from Exclusion of Subsidiaries from Consolidation (598) (631) (6)Increase in Cash and Cash Equivalents due to Merger 429 — —Cash and Cash Equivalents at End of Year ¥ 245,171 ¥ 307,809 $ 2,724
See accompanying notes.
88 East Japan Railway Company
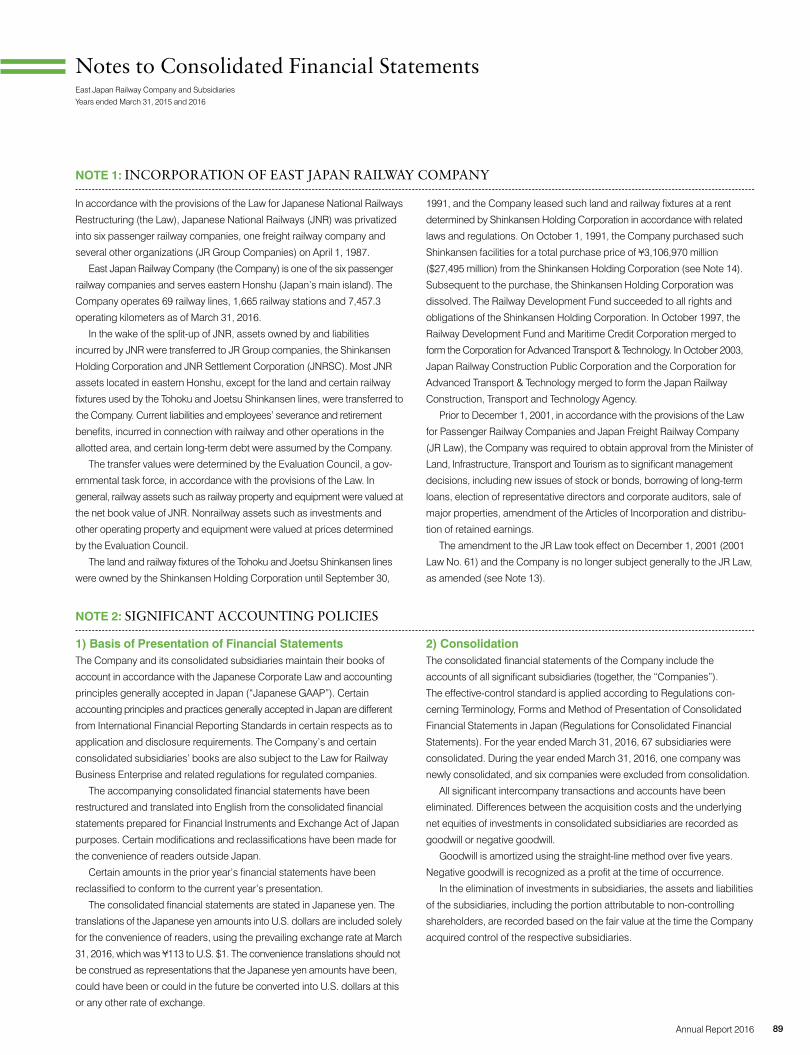
Notes to Consolidated Financial StatementsEast Japan Railway Company and SubsidiariesYears ended March 31, 2015 and 2016
NOTE 1: INCORPORATION OF EAST JAPAN RAILWAY COMPANY
In accordance with the provisions of the Law for Japanese National Railways
Restructuring (the Law), Japanese National Railways (JNR) was privatized
into six passenger railway companies, one freight railway company and
several other organizations (JR Group Companies) on April 1, 1987.
East Japan Railway Company (the Company) is one of the six passenger
railway companies and serves eastern Honshu (Japan’s main island). The
Company operates 69 railway lines, 1,665 railway stations and 7,457.3
operating kilometers as of March 31, 2016.
In the wake of the split-up of JNR, assets owned by and liabilities
incurred by JNR were transferred to JR Group companies, the Shinkansen
Holding Corporation and JNR Settlement Corporation (JNRSC). Most JNR
assets located in eastern Honshu, except for the land and certain railway
fixtures used by the Tohoku and Joetsu Shinkansen lines, were transferred to
the Company. Current liabilities and employees’ severance and retirement
benefits, incurred in connection with railway and other operations in the
allotted area, and certain long-term debt were assumed by the Company.
The transfer values were determined by the Evaluation Council, a gov-
ernmental task force, in accordance with the provisions of the Law. In
general, railway assets such as railway property and equipment were valued at
the net book value of JNR. Nonrailway assets such as investments and
other operating property and equipment were valued at prices determined
by the Evaluation Council.
The land and railway fixtures of the Tohoku and Joetsu Shinkansen lines
were owned by the Shinkansen Holding Corporation until September 30,
1991, and the Company leased such land and railway fixtures at a rent
determined by Shinkansen Holding Corporation in accordance with related
laws and regulations. On October 1, 1991, the Company purchased such
Shinkansen facilities for a total purchase price of ¥3,106,970 million
($27,495 million) from the Shinkansen Holding Corporation (see Note 14).
Subsequent to the purchase, the Shinkansen Holding Corporation was
dissolved. The Railway Development Fund succeeded to all rights and
obligations of the Shinkansen Holding Corporation. In October 1997, the
Railway Development Fund and Maritime Credit Corporation merged to
form the Corporation for Advanced Transport & Technology. In October 2003,
Japan Railway Construction Public Corporation and the Corporation for
Advanced Transport & Technology merged to form the Japan Railway
Construction, Transport and Technology Agency.
Prior to December 1, 2001, in accordance with the provisions of the Law
for Passenger Railway Companies and Japan Freight Railway Company
(JR Law), the Company was required to obtain approval from the Minister of
Land, Infrastructure, Transport and Tourism as to significant management
decisions, including new issues of stock or bonds, borrowing of long-term
loans, election of representative directors and corporate auditors, sale of
major properties, amendment of the Articles of Incorporation and distribu-
tion of retained earnings.
The amendment to the JR Law took effect on December 1, 2001 (2001
Law No. 61) and the Company is no longer subject generally to the JR Law,
as amended (see Note 13).
NOTE 2: SIGNIFICANT ACCOUNTING POLICIES
1) Basis of Presentation of Financial StatementsThe Company and its consolidated subsidiaries maintain their books of
account in accordance with the Japanese Corporate Law and accounting
principles generally accepted in Japan (“Japanese GAAP”). Certain
accounting principles and practices generally accepted in Japan are different
from International Financial Reporting Standards in certain respects as to
application and disclosure requirements. The Company’s and certain
consolidated subsidiaries’ books are also subject to the Law for Railway
Business Enterprise and related regulations for regulated companies.
The accompanying consolidated financial statements have been
restructured and translated into English from the consolidated financial
statements prepared for Financial Instruments and Exchange Act of Japan
purposes. Certain modifications and reclassifications have been made for
the convenience of readers outside Japan.
Certain amounts in the prior year’s financial statements have been
reclassified to conform to the current year’s presentation.
The consolidated financial statements are stated in Japanese yen. The
translations of the Japanese yen amounts into U.S. dollars are included solely
for the convenience of readers, using the prevailing exchange rate at March
31, 2016, which was ¥113 to U.S. $1. The convenience translations should not
be construed as representations that the Japanese yen amounts have been,
could have been or could in the future be converted into U.S. dollars at this
or any other rate of exchange.
2) ConsolidationThe consolidated financial statements of the Company include the
accounts of all significant subsidiaries (together, the “Companies”).
The effective-control standard is applied according to Regulations con-
cerning Terminology, Forms and Method of Presentation of Consolidated
Financial Statements in Japan (Regulations for Consolidated Financial
Statements). For the year ended March 31, 2016, 67 subsidiaries were
consolidated. During the year ended March 31, 2016, one company was
newly consolidated, and six companies were excluded from consolidation.
All significant intercompany transactions and accounts have been
eliminated. Differences between the acquisition costs and the underlying
net equities of investments in consolidated subsidiaries are recorded as
goodwill or negative goodwill.
Goodwill is amortized using the straight-line method over five years.
Negative goodwill is recognized as a profit at the time of occurrence.
In the elimination of investments in subsidiaries, the assets and liabilities
of the subsidiaries, including the portion attributable to non-controlling
shareholders, are recorded based on the fair value at the time the Company
acquired control of the respective subsidiaries.
89Annual Report 2016

FACTS AND FIGURES
3) Equity MethodThe effective-influence standard is applied according to Regulations for
Consolidated Financial Statements. For the year ended March 31, 2016,
five affiliated companies were accounted for by the equity method, and
there was no change in those companies during the year.
Investments in unconsolidated subsidiaries and other affiliated
companies are stated mainly at moving-average cost since their equity
earnings in the aggregate are not material in relation to consolidated net
income and retained earnings.
4) Allowance for Doubtful AccountsAccording to the Japanese Accounting Standards for Financial
Instruments, the Companies provide an allowance based on the past loan
loss experience for a certain reference period in general.
Furthermore, for receivables from debtors with financial difficulty, which
could affect their ability to perform in accordance with their obligations, the
allowance is provided for estimated unrecoverable amounts on an indi-
vidual basis.
5) InventoriesInventories are stated at cost as follows:
Merchandise and finished goods: mainly retail cost method or gross
average cost method (carrying amount in the balance sheet is calculated with
consideration of write-downs due to decreased profitability of inventories)
Work in process: mainly identified cost method (carrying amount in the
balance sheet is calculated with consideration of write-downs due to
decreased profitability of inventories)
Raw materials and supplies: mainly moving-average cost method
(carrying amount in the balance sheet is calculated with consideration of
write-downs due to decreased profitability of inventories)
6) Real Estate for SaleReal estate for sale is stated at the identified cost (carrying amount in the
balance sheet is calculated with consideration of write-downs due to
decreased profitability of real estate for sale)
7) SecuritiesSecurities are classified and stated as follows:
(1) Trading securities are stated at market value. The Companies had no
trading securities through the year ended March 31, 2016.
(2) Held-to-maturity debt securities are stated at amortized cost.
(3) Equity securities issued by subsidiaries and affiliated companies that
are neither consolidated nor accounted for using the equity method are
mainly stated at moving-average cost.
(4) Available-for-sale securities are stated as follows:
(a) Available-for-sale securities with market value
According to the Japanese Accounting Standards for Financial
Instruments, available-for-sale securities for which market quotations
are available are stated at market value as of the balance sheet date.
Net deferred gains or losses on these securities are reported as a
separate item in net assets at an amount net of applicable income
taxes and non-controlling interests. The cost of sales of such securities
is calculated mainly by the moving-average method.
(b) Available-for-sale securities without market value
Available-for-sale securities for which market quotations are not avail-
able are mainly stated at moving-average cost.
If there are significant declines in the market values of held-to-maturity
debt securities, equity securities issued by subsidiaries and affiliated com-
panies that are neither consolidated nor accounted for using the equity
method or available-for-sale securities, the securities are stated at market
values in the balance sheet, and the difference between the market value
and the original book value is recognized as a loss in the period. The
Companies’ policy for such write-offs stipulates that if the market value as
of the year-end has declined by 50% or more of the book value of the said
security, it should be stated at the market value. If the market value has
declined by 30% or more but less than 50%, the said security should be
written off by the amount determined as necessary after taking the possibil-
ity of market value recovery into account.
8) Property, Plant and EquipmentProperty, plant and equipment are generally stated at cost or the transfer
value referred to in Note 1. To comply with the regulations, contributions
received in connection with construction of certain railway improvements
are deducted from the cost of acquired assets.
Notes to Consolidated Financial Statements
90 East Japan Railway Company

Depreciation is calculated primarily by the declining balance method
based on the estimated useful lives of the assets as prescribed by the
Japanese Tax Law. Regarding the replacement method for certain fixtures,
the initial acquisition costs are depreciated to 50% of the costs under the
condition that subsequent replacement costs are charged to income.
Certain property, plant and equipment of the consolidated subsidiaries are
depreciated using the straight-line method. Buildings (excluding related
fixtures) acquired from April 1, 1998 onward are depreciated using the
straight-line method according to the Japanese Tax Law.
The range of useful lives is mainly as follows:
Buildings 3 to 50 years
Fixtures 3 to 60 years
Machinery, rolling stock and vehicles 3 to 20 years
9) Accounting for Employees’ Retirement BenefitsAlmost all employees of the Companies are generally entitled to receive
lump-sum severance and retirement benefits (some subsidiaries have
adopted a pension plan of their own in addition to those severance and
retirement benefits). Furthermore, some consolidated subsidiaries have
established retirement benefit trusts.
For the calculation of projected benefit obligations, the Companies
adopted the benefit formula basis as the method for attributing expected
benefits to periods.
The past service costs that are yet to be recognized are amortized by the
straight-line method and charged to income over the number of years (mainly
10 years), which does not exceed the average remaining service years of
employees at the time when the past service costs were incurred.
Actuarial gains and losses are recognized in expenses using the
straight-line basis over constant years (mainly 10 years) within the expected
average remaining working lives commencing with the following year.
10) Allowance for Partial Transfer Costs of Railway Operation
The Company provides an allowance based on the estimated cost of
restoration to the original state and other activities aimed at the transfer of
management of the section between Miyako and Kamaishi on the Yamada
Line from the Company to Sanriku Railway Company.
11) Accounting for Certain Lease TransactionsWith respect to finance leases that do not transfer ownership to lessees,
depreciation is calculated by the straight-line method based on the lease
term and estimated residual is zero.
With regard to finance leases that do not transfer ownership for which
the starting date for the transaction is prior to March 31, 2008, they continue
to be accounted for by a method used for operating lease.
12) Accounting for Research and Development CostsAccording to the Accounting Standards for Research and Development
Costs, etc., in Japan, research and development costs are recognized as
they are incurred. Research and development costs included in operating
expenses for the years ended March 31, 2015 and 2016 were ¥16,424
million and ¥16,886 million ($149 million), respectively.
13) Income Taxes Income taxes comprise corporation, enterprise and inhabitants’ taxes.
Deferred tax assets are recognized for temporary differences between the
financial statement basis and the tax basis of assets and liabilities.
14) Per Share Data(1) Earnings per share
Earnings per share shown in the consolidated statements of income
are computed by dividing income available to common shareholders
by the weighted average number of common stock outstanding during
the year. Diluted earnings per share are not shown, since there are no
outstanding securities with dilutive effect on earnings per share such as
convertible bonds.
(2) Cash dividends per share
Cash dividends per share comprises interim dividends for the interim
period ended September 30 and year-end dividends for the year ended
March 31, which were decided at the annual shareholders’ meeting in June.
15) Derivative TransactionsDerivative transactions that do not meet requirements for hedge account-
ing are stated at fair value and the gains or losses resulting from change
in the fair value of those transactions are recognized as income or expense
in the period.
Derivative transactions that meet requirements for hedge accounting are
stated at fair value, and the gains and losses resulting from changes in fair
value of those transactions are deferred until the losses and gains of the
hedged items are recognized on the consolidated statements of income.
Of those, certain derivative transactions of the Companies that meet
certain hedging criteria are accounted in the following manner:
(1) Regarding forward exchange contracts and foreign currency swap
contracts, the hedged foreign currency receivable and payable are
recorded using the Japanese yen amount of the contracted forward
rate or swap rate, and no gains or losses on the forward exchange
contracts or foreign currency swap contracts are recorded.
(2) Regarding interest rate swap contracts, the net amount to be paid or
received under the interest rate swap contract is added to or deducted
from the interest on the assets or liabilities for which the swap contract
was executed.
91Annual Report 2016

FACTS AND FIGURES
Notes to Consolidated Financial Statements
16) Impairment of Fixed AssetsAccounting Standards for Impairment of Fixed Assets require that fixed
assets be reviewed for impairment whenever events or changes in circum-
stances indicate that the book value of an asset or asset group may not be
recoverable.
The impairment losses are recognized when the book value of an asset
or asset group exceeds the sum of the undiscounted future cash flows
expected to result from the continuing use and eventual disposition of the
asset or asset group.
The impairment losses are measured as the amount by which the book
value of the asset exceeds its recoverable amounts, which is the higher of
the discounted cash flows from the continuing use and eventual disposition of
the asset or the net selling price.
Restoration of previously recognized impairment losses is prohibited.
For cumulative impairment losses, the Companies deducted directly from
respective asset amounts based on the revised regulation on the consoli-
dated financial statements.
17) Revaluation of LandJTB Corp., an equity-method affiliated of the Company, absorbed JTB
Estate Corp. by merger on April 1, 2012. Prior to this absorption merger,
JTB Estate Corp. had been revaluating its land for business use pursuant
to the Law on Revaluation of Land (Law No. 34 of 1998) and the Law for
Partial Revision of the Law on Revaluation of Land (Law No. 19 of 2001).
Consequently, the Company’s equity-method portion of “Revaluation
reserve for land” recorded on JTB Corp.’s balance sheets was recorded in
the Company’s consolidated balance sheets as “Revaluation reserve for
land” under Net assets, Accumulated other comprehensive income.
(1) Revaluation method
Rational adjustment based on roadside land value and other standards
pursuant to the Order for Enforcement of the Law on Revaluation of
Land (Cabinet Order No. 119 of 1998) Article 2-4
(2) Revaluation date
March 31, 2002
(3) Difference between book value after revaluation and market value on
March 31, 2016
Difference was not recorded because the market value of the revalu-
ated land was higher than the book value after revaluation.
18) Changes in Presentation Method(Adoption of the provisions of Article 39 of the “Revised Accounting
Standard for Consolidated Financial Statements”)
The Company has adopted the provisions of Article 39 of the “Revised
Accounting Standard for Consolidated Financial Statements” (Accounting
Standards Board of Japan (ASBJ) Statement No. 22, September 13, 2013);
changed the presentation of “Net income,” etc.; and changed the presen-
tation of “Minority interests” to “Non-controlling interests.” To reflect the
said changes in presentation, the Company has reclassified the consoli-
dated financial statement of the previous fiscal year.
(Consolidated statements of income)
From the fiscal year under review, the Company has presented and
included “Provision for allowance for partial transfer costs of railway opera-
tion” in “Other, net” of “Other expenses” because in the fiscal year under
review the monetary significance was negligible. In the previous fiscal year,
the Company classified “Provision for allowance for partial transfer costs of
railway operation” separately. To reflect this change in presentation
method, in the consolidated statement of income for the previous fiscal
year the Company has presented and included ¥16,616 million in “Other,
net” of “Other expenses” that was classified separately as “Provision for
allowance for partial transfer costs of railway operation.”
(Consolidated statements of cash flows)
(1) From the fiscal year under review, the Company has presented and
included “Insurance proceeds related to earthquake” in “Other” of
“Cash flows from operating activities” because in the fiscal year under
review the monetary significance was negligible. To reflect this change
in presentation method, in the consolidated statement of cash flows for
the previous fiscal year the Company has presented and included
¥3,362 million in “Other” of “Cash flows from operating activities” that
was classified separately as “Insurance proceeds related to
earthquake.”
(2) From the fiscal year under review, the Company has presented and
included “Provision for allowance for partial transfer costs of railway
operation” in “Other” of “Cash flows from operating activities” because
in the fiscal year under review the monetary significance was negligible.
To reflect this change in presentation method, in the consolidated state-
ment of cash flows for the previous fiscal year the Company has pre-
sented and included ¥16,616 million in “Other” of “Cash flows from
operating activities” that was classified separately as “Provision for
allowance for partial transfer costs of railway operation.”
92 East Japan Railway Company

NOTE 3: EARTHQUAKE DAMAGE
The Company’s Tohoku Shinkansen Line and conventional lines and vari-
ous other facilities were damaged severely in the Great East Japan
Earthquake on March 11, 2011.
There had also been further damage to the Company’s railroad and
other facilities due to intermittent earthquakes since April 2011.
For the damages caused by the Great East Japan Earthquake on March
11, 2011, the Companies recorded allowance for earthquake-damage
losses as “Other current liabilities” and “Other Long-Term Liabilities” on the
consolidated balance sheets for the estimated amount of restoration and
other expenses in the fiscal year.
However, restoration and other expenses that are difficult to reasonably
estimate at this time are not included in allowance for earthquake-damage
losses.
Furthermore, the Company’s railway line facilities, railway stop facilities
(excluding station buildings), electric cable facilities and other fixtures,
which were owned by or leased by the Company, were insured against
earthquakes for up to ¥71,000 million ($628 million) (¥10,000 million
deductible) as of March 11, 2011.
The aggregate amount of insurance proceeds received for such
insurance was ¥51,935 million ($460 million) as of March 31, 2016.
NOTE 4: APPROVAL OF THE ALLOWANCE RESERVE PLAN OF THE MAJOR IMPROVEMENT WORKS OF SHINKANSEN RAILWAYS
With respect to the Tokyo-Morioka section of the Tohoku Shinkansen Line
and the Omiya-Niigata section of the Joetsu Shinkansen Line owned by JR
East, the need for large-scale renovation to ensure reliable transportation
going forward was recognized, and on March 29, 2016, the Allowance
Reserve Plan of the Major Improvement Works of Shinkansen Railways was
approved by the Minister of Land, Infrastructure, Transport and Tourism
based on Article 16, Paragraph 1 of the Nationwide Shinkansen Railway
Development Act (Act No. 71 of 1970).
Consequently, for each of the fiscal years starting with the year ending
March 31, 2017 and ending with the year ending March 31, 2031, there will
be additional operating expenses of ¥24,000 million
($212 million) resulting from the provision to such allowance compared to
the operating expenses of the year ended March 31, 2016. The
total of the allowance will amount to ¥360,000 million ($3,186 million).
Subsequently, for each of the years starting with the year ending March 31,
2032 and ending with the fiscal year ending March 31, 2041, there will be a
reversal of such allowance and resulting reduction of operating expenses
of ¥36,000 million ($319 million) compared to the operating expenses of
the fiscal year ended March 31, 2016.
93Annual Report 2016

FACTS AND FIGURES
Notes to Consolidated Financial Statements
NOTE 5: CASH AND CASH EQUIVALENTS
Cash and cash equivalents include all cash balances and highly liquid investments with maturities not exceeding three months at the time of purchase.
NOTE 6: INVENTORIES
Inventories at March 31, 2015 and 2016 consisted of the following:
Millions of YenMillions of
U.S. Dollars
2015 2016 2016
Merchandise and finished goods ¥ 8,772 ¥ 8,890 $ 78
Work in process 16,820 11,283 100
Raw materials and supplies 27,264 27,662 245
¥52,856 ¥47,835 $423
NOTE 7: REAL ESTATE FOR SALE
Real estate for sale represents the cost of land acquired and related land improvements in connection with residential home site developments in eastern
Honshu.
NOTE 8: INVESTMENTS IN AND ADVANCES TO UNCONSOLIDATED SUBSIDIARIES AND AFFILIATED COMPANIES
Investments in and advances to unconsolidated subsidiaries and affiliated companies at March 31, 2015 and 2016 consisted of the following:
Millions of YenMillions of
U.S. Dollars
2015 2016 2016
Unconsolidated subsidiaries:
Investments ¥ 4,989 ¥ 5,994 $ 53
Advances 500 1,060 10
5,489 7,054 63
Affiliated companies:
Investments (including equity in earnings of affiliated companies) ¥47,147 ¥46,439 $411
Advances 71 36 0
47,218 46,475 411
¥52,707 ¥53,529 $474
94 East Japan Railway Company

NOTE 9: FINANCIAL INSTRUMENTS
1) Items Relating to the Status of Financial Instrumentsa) Policy in relation to financial instruments
If surplus funds arise, the Companies use only financial assets with high
degrees of safety for the management of funds. The Companies principally
use bond issuances and bank loans in order to raise funds. Further, the
Companies use derivatives to reduce risk, as described below, and do not
conduct speculative trading.
b) Details of financial instruments and related risk
Trade receivables are exposed to credit risk in relation to customers,
transportation operators with connecting railway services, and other par-
ties. Further, short-term loans receivable, which principally comprise loans
receivable as a result of credit card cashing services, are exposed to credit
risk in relation to customers. Regarding the said risk, pursuant to the inter-
nal regulations of the Companies, due dates and balances are managed
appropriately for each counterparty. Securities are exposed to market price
fluctuation risk. Substantially all of trade payables—payables, accrued
consumption taxes and accrued income taxes—have payment due dates
within one year. Bonds and loans are exposed to risk associated with
inability to make payments on due dates because of unforeseen decreases
in free cash flow. Further, certain bonds and loans are exposed to market
price fluctuation risk (foreign exchange / interest rates). Long-term liabilities
incurred for purchase of railway facilities are liabilities with regard to the
Japan Railway Construction, Transport and Technology Agency and,
pursuant to the Law Related to the Transference of Shinkansen Railway
Facilities, comprise principally interest-bearing debt related to the Company’s
purchase of Shinkansen railway facilities for a total purchase price of
¥3,106,970 million ($27,495 million) from the Shinkansen Holding
Corporation on October 1, 1991. The Company pays such purchase price,
based on regulations pursuant to the Law Related to the Transference of
Shinkansen Railway Facilities, enacted in 1991, and other laws, in semian-
nual installments calculated using the equal payment method, whereby
interest and principal are paid in equal amounts semiannually, based on
interest rates approved by the Minister of Land, Infrastructure, Transport
and Tourism (at the time of enactment). Long-term liabilities incurred for
purchase of railway facilities are exposed to risk associated with inability to
make payments on due dates because of a decrease in free cash flow for
unforeseen reasons. Further, certain long-term liabilities incurred for purchase
of railway facilities are exposed to market price fluctuation risk (interest rates).
c) Risk management system for financial instruments
The Companies use forward exchange contract transactions, currency
swap transactions, and interest rate swap transactions with the aim of
avoiding risk (market risk) related to fluctuation in future market prices
(foreign exchange / interest rates) in relation to, among others, bonds and
loans. Further, commodity swap transactions are used with the aim of
avoiding product price fluctuation risk related to fuel purchasing, and
natural disaster derivatives are used with the aim of avoiding revenue
expenditure fluctuation risk due to natural disasters. Because all of the
derivative transaction contracts that the Companies enter into are transac-
tions whose counterparties are financial institutions that have high credit-
worthiness, the Companies believe that there is nearly no risk of parties to
contracts defaulting on obligations. Under the basic policy approved by the
Board of Directors, with the aim of appropriately executing transactions and
risk management, financial departments in the relevant companies process
those derivative transactions following appropriate internal procedures or
approval of the Board of Directors, based on relevant internal regulations.
d) Supplementary explanation of items relating to the fair values of
financial instruments
The fair values of financial instruments include market prices or reasonably
estimated values if there are no market prices. Because estimation of fair
values incorporates variable factors, adopting different assumptions can
change the values.
95Annual Report 2016

FACTS AND FIGURES
Notes to Consolidated Financial Statements
2) Items Relating to the Fair Values of Financial InstrumentsAmounts recognized for selective items in the consolidated balance sheets as of March 31, 2015 and 2016, fair values of such items, and the differences between
such amounts and values are shown below. Further, items for which fair values were extremely difficult to establish were not included in the following table.
Notes: 1. Items relating to securities, derivatives transactions, and method of estimating the fair values of financial instruments
Assets a. Cash and cash equivalents b. Receivables Because these assets are settled over short terms, fair values and book values are
nearly equivalent. Therefore, relevant book values are used. c. Securities The fair values of these securities are based mainly on market prices.
Liabilities a. Payables b. Accrued consumption taxes c. Accrued income taxes Because these liabilities are settled over short terms, fair values and book values
are nearly equivalent. Therefore, relevant book values are used. d. Long-term debt Bonds The fair values of domestic bonds are based on market prices. The fair values of foreign currency denominated bonds, which are subject to
treatment using foreign currency swaps, are estimated by discounting the foreign currency swaps and future cash flows treated in combination with them based on estimated interest rates if similar domestic bonds were newly issued.
Long-term loans The fair values of long-term loans are principally estimated by discounting future
cash flows based on estimated interest rates if similar new loans were imple-mented. Further, the fair values of certain long-term loans, which are subject to treatment using foreign currency swaps or interest rate swaps, are estimated by discounting the foreign currency swaps or interest rate swaps and future cash flows treated in combination with them based on estimated interest rates if similar new loans were implemented.
e. Long-term liabilities incurred for purchase of railway facilities Because these liabilities are special monetary liabilities that are subject to con-
straints pursuant to laws and statutory regulations and not based exclusively on free
agreement between contracting parties in accordance with market principles, and because repeating fund-raising using similar methods would be difficult, as stated in “1) Items relating to the status of financial instruments, b. Details of financial instruments and related risk,” the fair values of long-term liabilities incurred for purchase of railway facilities are estimated by assuming that future cash flows were raised through bonds, the Company’s basic method of fund-raising, and discounting them based on estimated interest rates if similar domestic bonds were newly issued. Further, certain long-term liabilities incurred for purchase of railway facilities with variable interest rates are estimated based on the most recent interest rates, notification of which is provided by the Japan Railway Construction, Transport and Technology Agency.
Derivative Transactions (See Note 19)
2. Financial instruments whose fair values were extremely difficult to establishConsolidated balance sheet amount
Millions of YenMillions of
U.S. Dollars
Classification 2015 2016 2016Unlisted equity securities ¥6,647 ¥6,653 $59Unlisted corporate bonds 360 360 3Preferred equity securities 1,000 1,000 9Natural disaster derivative transactions 1,261 1,131 10
*1 Because the fair values of these financial instruments were extremely difficult to establish, given that they did not have market prices and future cash flows could not be estimated, they were not included in “c Securities–Available-for-sale securities.”
*2 The fair value of natural disaster derivative transactions was not measured because it is extremely difficult to establish a fair value.
3. The amounts recognized in the consolidated balance sheets and fair values related to bonds, long-term loans, and long-term liabilities incurred for purchase of railway facilities included, respectively, the current portion of bonds, the current portion of long-term loans, and the current portion of long-term liabilities incurred for purchase of railway facilities.
Millions of Yen Millions of U.S. Dollars
2015 2016 2016Consolidated
balance sheetamount Fair value Difference
Consolidatedbalance sheet
amount Fair value Difference
Consolidatedbalance sheet
amount Fair value Difference
a Cash and cash equivalents ¥ 245,171 ¥ 245,171 ¥ — ¥ 307,809 ¥ 307,809 ¥ — $ 2,724 $ 2,724 $ —
b Receivables 468,963 468,963 — 484,361 484,361 — 4,286 4,286 —
c Securities:
Held-to-maturity debt securities 158 160 2 157 162 5 1 1 0
Available-for-sale securities 186,250 186,250 — 149,775 149,775 — 1,325 1,325 —
Assets ¥ 900,542 ¥ 900,544 ¥ 2 ¥ 942,102 ¥ 942,107 ¥ 5 $ 8,336 $ 8,336 $ 0
a Payables ¥ 714,296 ¥ 714,296 ¥ — ¥ 757,544 ¥ 757,544 ¥ — $ 6,704 $ 6,704 $ —
b Accrued consumption taxes 41,837 41,837 — 23,956 23,956 — 212 212 —
c Accrued income taxes 51,772 51,772 — 83,239 83,239 — 737 737 —
d Long-term debt:
Bonds 1,764,854 1,963,353 198,499 1,809,914 2,075,179 265,265 16,017 18,364 2,347
Long-term loans 993,142 1,035,055 41,913 1,015,530 1,089,102 73,572 8,987 9,638 651
e Long-term liabilities incurred for purchase of railway facilities 545,207 902,312 357,105 438,326 867,081 428,755 3,879 7,673 3,794
Liabilities ¥4,111,108 ¥4,708,625 ¥597,517 ¥4,128,509 ¥4,896,101 ¥767,592 $36,536 $43,328 $6,792
Derivative transactions*1:
Hedge accounting applied ¥ 3,386 ¥ 3,386 ¥ — ¥ 1,738 ¥ 1,738 ¥ — $ 15 $ 15 $ —
*1 Net receivables/payables arising from derivatives are shown. Items that are net payables are shown in parenthesis.
96 East Japan Railway Company

4. The annual maturities of financial assets and securities with maturities at March 31, 2015 and 2016 were as follows:Millions of Yen Millions of U.S. Dollars
2015 2016 2016
1 year or less
5 years orless but
more than1 year
10 yearsor less butmore than
5 yearsMore than
10 years1 year or less
5 years orless but
more than1 year
10 yearsor less butmore than
5 yearsMore than
10 years1 year or less
5 years orless but
more than1 year
10 yearsor less butmore than
5 yearsMore than
10 years
Cash and cash equivalents ¥245,171 ¥ — ¥ — ¥ — ¥307,809 ¥ — ¥ — ¥— $2,724 $— $— $—
Receivables 462,476 6,472 15 — 477,542 6,407 322 90 4,226 56 3 1
Securities:
Held-to-maturity debt securities (Government bonds) — 10 140 10 — 10 150 — — 0 1 —
Available-for-sale securities which have maturity (Government bonds) 6 — — — — — 6 — — — 0 —
Total ¥707,653 ¥6,482 ¥155 ¥10 ¥785,351 ¥6,417 ¥478 ¥90 $6,950 $56 $ 4 $ 1
5. The annual maturities of bonds, long-term loans, and long-term liabilities incurred for purchase of railway facilities at March 31, 2016 (See Notes 13 and 14).
NOTE 10: SECURITIES
For held-to-maturity debt securities, the amount on balance sheets and market value at March 31, 2015 and 2016 were as follows: Millions of Yen Millions of U.S. Dollars
2015 2016 2016Amount on
balancesheet Market value Difference
Amount onbalance
sheet Market value Difference
Amount onbalance
sheet Market value Difference
Of which market value exceeds the amount on balance sheet:
Government, municipal bonds, etc. ¥148 ¥150 ¥ 2 ¥157 ¥162 ¥5 $1 $1 $0
Of which market value does not exceed the amount on balance sheet:
Government, municipal bonds, etc. 10 10 (0) — — — — — —
Total ¥158 ¥160 ¥ 2 ¥157 ¥162 ¥5 $1 $1 $0
For available-for-sale securities, the acquisition cost and amount on balance sheets at March 31, 2015 and 2016 were as follows:Millions of Yen Millions of U.S. Dollars
2015 2016 2016
Acquisition cost
Amount onbalance
sheet Difference Acquisition cost
Amount onbalance
sheet Difference Acquisition cost
Amount onbalance
sheet Difference
Of which amount on balance sheet exceeds the acquisition cost:
Equity shares ¥87,498 ¥182,681 ¥95,183 ¥62,951 ¥126,580 ¥63,629 $557 $1,120 $563
Debt securities 6 6 0 6 6 0 0 0 0
Of which amount on balance sheet does not exceed the acquisition cost:
Equity shares 4,984 3,563 (1,421) 29,544 23,189 (6,355) 261 205 (56)
Debt securities — — — — — — — — —
Total ¥92,488 ¥186,250 ¥93,762 ¥92,501 ¥149,775 ¥57,274 $818 $1,325 $507
Note: In the previous fiscal year and the fiscal year under review, treatment for impairment has not been implemented for other securities with market value. The Companies’ policy for such write-offs stipulates that if the market value as of the year-end has declined by 50% or more of the book value of the said security, it should be stated at the
market value. If the market value has declined by 30% or more but less than 50%, the said security should be written off by the amount determined as necessary after taking the possibility of market value recovery into account.
97Annual Report 2016

FACTS AND FIGURES
NOTE 11: PLEDGED ASSETS
Pledged assets at March 31, 2015 and 2016 were summarized as follows:
Pledged assets as a collateral
Millions of YenMillions of
U.S. Dollars
2015 2016 2016
Buildings and fixtures with net book value ¥20,538 ¥19,406 $172
Other assets with net book value 978 966 9
Counterpart long-term debt and other liabilities
Millions of YenMillions of
U.S. Dollars
2015 2016 2016
Long-term debt and other liabilities ¥1,484 ¥1,232 $11
Pledged assets as a mortgage for long-term liabilities
Millions of YenMillions of
U.S. Dollars
2015 2016 2016
Buildings and fixtures with net book value ¥50,721 ¥49,367 $437
Other assets with net book value 11,838 12,377 110
Counterpart long-term liabilities
Millions of YenMillions of
U.S. Dollars
2015 2016 2016
Long-term liabilities incurred for purchase of railway facilities ¥2,443 ¥1,968 $18
NOTE 12: IMPAIRMENT LOSSES ON FIXED ASSETS
In adherence with management accounting classifications, the Companies
generally categorize assets according to operations or properties. For
railway business assets, the Companies treat railway lines as a single asset
group because the railway network generates cash flow as a whole. Also,
the Companies separately categorize assets that are slated to be disposed
of or idle. The Companies determine recoverable amounts for the above
asset groups by measuring the net selling prices or values in use. In case
the Companies determine recoverable amounts for the above asset groups
by measuring the net selling prices, the prices and other amounts are
adjusted rationally applying the tax-appraised value of fixed assets. Values
in use for the measurement of recoverable amounts are based on the
present values of expected cash flows with the discount rate of 5.0%.
For assets with fair value in sharp decline compared with book value or
with profitability in sharp decline, the book values were reduced to the
recoverable amounts and the reductions were recognized as impairment
losses on fixed assets.
Impairment losses on fixed assets at March 31, 2015 and 2016 were
summarized as follows:
Millions of YenMillions of
U.S. Dollars
2015 2016 2016
Land ¥ 1,180 ¥ 5,146 $ 46
Buildings and fixtures 4,390 6,680 59
Others 7,168 471 4
Total ¥12,738 ¥12,297 $109
Notes to Consolidated Financial Statements
98 East Japan Railway Company

NOTE 13: LONG-TERM DEBT
Long-term debt at March 31, 2015 and 2016 were summarized as follows:
Millions of YenMillions of
U.S. Dollars
2015 2016 2016
General mortgage bonds issued in 1997 to 2001 with interest rates ranging from 2.30% to 3.30% due in 2017 to 2021 ¥ 179,900 ¥ 179,900 $ 1,592
Unsecured bonds issued in 2002 to 2016 with interest rates ranging from 0.13% to 2.55% due in 2016 to 2046 1,345,921 1,390,932 12,309
Secured loans due in 2016 to 2018 principally from banks and insurance companies with interest rates mainly ranging from 1.95% to 6.50% 633 233 2
Unsecured loans due in 2016 to 2045 principally from banks and insurance companies with interest rates mainly ranging from 0.31% to 3.30% 992,509 1,015,297 8,985
Euro-pound bonds issued in 2006 to 2007 with interest rates ranging from 4.50% to 5.25% due in 2031 to 2036 239,033 239,082 2,116
2,757,996 2,825,444 25,004
Less current portion 173,220 187,107 1,656
¥2,584,776 ¥2,638,337 $23,348
Issue and maturity years above are expressed in calendar years (ending
December 31 in the same year).
Although the Company is no longer subject generally to the JR Law, as
amended, all bonds issued by the Company prior to December 1, 2001, the
effective date of the amendment to the JR Law, are and will continue to be
general mortgage bonds as required under the JR Law, which are entitled
to a statutory preferential right over the claims of unsecured creditors of the
Company. Any bonds issued on or after December 1, 2001 are unsecured
bonds without general mortgage preferential rights.
The annual maturities of bonds at March 31, 2016 were as follows:
Year ending March 31, Millions of YenMillions of
U.S. Dollars
2017 ¥ 80,000 $ 708
2018 159,900 1,415
2019 165,000 1,460
2020 125,000 1,106
2021 120,000 1,062
2022 and thereafter 1,160,959 10,274
The annual maturities of long-term loans at March 31, 2016 were as
follows:
Year ending March 31, Millions of YenMillions of
U.S. Dollars
2017 ¥107,108 $ 948
2018 116,820 1,034
2019 119,676 1,059
2020 110,423 977
2021 115,663 1,024
2022 and thereafter 445,840 3,945
NOTE 14: LONG-TERM LIABILITIES INCURRED FOR PURCHASE OF RAILWAY FACILITIES
In October 1991, the Company purchased the Tohoku and Joetsu
Shinkansen facilities from the Shinkansen Holding Corporation for a total
purchase price of ¥3,106,970 million ($27,495 million) payable in equal
semiannual installments consisting of principal and interest payments in
three tranches: ¥2,101,898 million ($18,601 million) and ¥638,506 million
($5,650 million) in principal amounts payable through March 2017; and
¥366,566 million ($3,244 million) payable through September 2051. In
March 1997, the liability of ¥27,946 million ($247 million) payable in equal
semiannual installments through March 2022 to Japan Railway
Construction Public Corporation was incurred with respect to the acquisi-
tion of the Akita hybrid Shinkansen facilities. In February 2002, the
Company acquired a majority interest in Tokyo Monorail Co., Ltd. As a
result, the consolidated balance sheets as of March 31, 2002 included
liabilities of Tokyo Monorail Co., Ltd. amounting to ¥36,726 million
($325 million) payable to Japan Railway Construction Public Corporation.
99Annual Report 2016

FACTS AND FIGURES
Notes to Consolidated Financial Statements
NOTE 15: CONSUMPTION TAXES
The Japanese consumption tax is an indirect tax levied at the rate of 8%. Accrued consumption tax represents the difference between consumption taxes
collected from customers and consumption taxes paid on purchases.
NOTE 16: CONTINGENT LIABILITIES
The Company has extended contingent liabilities of ¥11,172 million ($99 million) for orders received by Japan Transportation Technology (Thailand) Co., Ltd.
The long-term liabilities incurred for purchase of railway facilities outstanding at March 31, 2015 and 2016 were as follows:
Millions of YenMillions of
U.S. Dollars
2015 2016 2016
Long-term liability incurred for purchase of the Tohoku and Joetsu Shinkansen facilities:
Payable semiannually including interest at a rate currently approximating 4.13% through 2017 ¥101,829 ¥ 44,585 $ 394
Payable semiannually including interest at 6.35% through 2017 94,166 48,554 430
Payable semiannually including interest at 6.55% through 2051 338,779 336,408 2,977
534,774 429,547 3,801
Long-term liability incurred for purchase of the Akita hybrid Shinkansen facilities:
Payable semiannually at an average rate currently approximating 1.52% through 2022 7,990 6,811 60
Long-term liability incurred for purchase of the Tokyo Monorail facilities:
Payable semiannually at an average rate currently approximating 2.32% through 2029 2,443 1,968 18
545,207 438,326 3,879
Less current portion:
The Tohoku and Joetsu Shinkansen purchase liability 105,170 95,668 847
The Akita hybrid Shinkansen purchase liability 1,085 1,093 10
Tokyo Monorail purchase liability 476 490 4
106,731 97,251 861
¥438,476 ¥341,075 $3,018
Maturity years above are expressed in calendar years (ending
December 31 in the same year).
The annual payments of long-term liabilities incurred for purchase of
railway facilities at March 31, 2016 were as follows:
Year ending March 31, Millions of YenMillions of
U.S. Dollars
2017 ¥ 97,251 $ 861
2018 4,309 38
2019 4,303 38
2020 4,301 38
2021 4,523 40
2022 and thereafter 323,639 2,864
100 East Japan Railway Company

NOTE 18: INFORMATION REGARDING CERTAIN LEASES
Future lease payments for non-cancellable operating leases, including those due within one year, at March 31, 2015 and 2016 were as follows:Millions of Yen Millions of U.S. Dollars
2015 2016 2016Within one year Total Within one year Total Within one year Total
Non-cancellable operating leases ¥2,421 ¥34,613 ¥4,066 ¥47,327 $36 $419
NOTE 19: INFORMATION FOR DERIVATIVE TRANSACTIONS
1) Items Regarding Trading Circumstances (See Note 9)
2) Derivative Transactions Applied to Hedge AccountingMillions of Yen
2015 2016
Type Hedged itemContract
amount, etc.
Of whichmore-than-
one-year contractamount, etc. Fair value*2
Contractamount, etc.
Of whichmore-than-
one-year contractamount, etc. Fair value*2
Currency swap Long-term loans ¥ 20,000 ¥ 20,000 ¥3,756 ¥ 20,000 ¥ 20,000 ¥2,699
Forward exchange Accounts payable–trade 617 — 15 56 — (0)
Commodity swap Fuel purchasing 2,315 1,517 (385) 2,190 1,402 (961)
Currency swap Foreign currency denominated bonds 239,959 239,959 *1 239,959 239,959 *1
Interest swap Long-term loans 55,400 55,400 *1 65,400 65,400 *1
Total ¥318,291 ¥316,876 ¥3,386 ¥327,605 ¥326,761 ¥1,738
Millions of U.S. Dollars
2016
Type Hedged itemContract
amount, etc.
Of whichmore-than-
one-year contractamount, etc. Fair value*2
Currency swap Long-term loans $ 177 $ 177 $24
Forward exchange Accounts payable–trade 0 — (0)
Commodity swap Fuel purchasing 19 12 (9)
Currency swap Foreign currency denominated bonds 2,124 2,124 *1
Interest swap Long-term loans 579 579 *1
Total $2,899 $2,892 $15
Notes: 1. Derivative transactions that meet certain hedging criteria, regarding foreign currency swaps, or interest rate swaps, are treated in combination with bonds or long-term loans, the fair values of these derivatives are included in the fair values of these bonds or long-term loans (See Note 9).
2. Fair value is calculated based on the current value presented by financial institutions, etc., with which transactions are conducted.
NOTE 17: NET ASSETS
Under Japanese laws and regulations, the entire amount paid for new
shares is required to be designated as common stock. However, a com-
pany may, by a resolution of the Board of Directors, designate an amount
not exceeding one-half of the price of the new shares as additional paid-in
capital, which is included in capital surplus.
Under the Corporate Law, in cases where a dividend distribution of
surplus is made, the smaller of an amount equal to 10% of the dividend or
the excess, if any, of 25% of common stock over the total of additional
paid-in capital and legal earnings reserve must be set aside as additional
paid-in capital or legal earnings reserve. Legal earnings reserve is included in
retained earnings in the accompanying consolidated balance sheets.
In addition, under the Corporate Law, by a resolution of the general
meeting of shareholders, all additional paid-in capital and all legal earnings
reserve may be transferred to other capital surplus and other retained earn-
ings, respectively, which are potentially available for dividends.
The maximum amount that the Company can distribute as dividends is
calculated based on the non-consolidated financial statements of the
Company in accordance with Japanese laws and regulations.
At the general meeting of shareholders held in June 2016, the sharehold-
ers approved cash dividends amounting to ¥25,492 million ($226 million).
Such appropriations have not been accrued in the consolidated financial
statements as of March 31, 2016. Such appropriations are recognized in
the period in which they are approved by the shareholders.
101Annual Report 2016

FACTS AND FIGURES
Notes to Consolidated Financial Statements
NOTE 20: NET DEFINED BENEFIT LIABILITY
Net defined benefit liability included in the liability section of the consoli-
dated balance sheets as of March 31, 2015 and 2016 consisted of
the following:
1) Movement in Retirement Benefit Obligations
Millions of YenMillions of
U.S. Dollars
2015 2016 2016
B alance at the beginning of the fiscal year ¥651,783 ¥709,599 $6,280
C umulative effects of changes in accounting policies 100,144 — —
Restated balance 751,927 709,599 6,280
Service costs 28,976 28,003 248
Interest costs 4,623 4,382 39
Actuarial losses (gains) (20,530) 2,713 24
Benefits paid (55,704) (60,309) (534)
Past service costs 180 261 2
Other 127 (123) (1)
Balance at the end of the fiscal year ¥709,599 ¥684,526 $6,058
2) Movements in Plan Assets
Millions of YenMillions of
U.S. Dollars
2015 2016 2016
Balance at the beginning of the year ¥7,356 ¥8,279 $73
Expected return on plan assets 88 98 1
Actuarial losses (gains) 569 23 0
Contributions paid by the employer 713 857 8
Benefits paid (447) (402) (3)
Balance at the end of the year ¥8,279 ¥8,855 $79
3) Reconciliation from Retirement Benefit Obligations and Plan Assets to Liability (Asset) for Retirement Benefits
Millions of YenMillions of
U.S. Dollars
2015 2016 2016
Funded retirement benefit obligations ¥ 9,650 ¥ 10,793 $ 96
Plan assets (8,279) (8,855) (79)
1,371 1,938 17
Unfunded retirement benefit obligations 699,949 673,733 5,962
T otal net liability (asset) for retirement benefits at March 31 701,320 675,671 5,979
Liability for retirement benefits 701,731 675,784 5,980
Asset for retirement benefits (411) (113) (1)
Total net liability (asset) for retirement benefits at March 31 ¥701,320 ¥675,671 $5,979
Employees’ severance and retirement benefit expenses included in the
consolidated statements of income for the years ended March 31, 2015
and 2016 consisted of the following:
4) Retirement Benefit Costs
Millions of YenMillions of
U.S. Dollars
2015 2016 2016
Service costs ¥28,976 ¥28,003 $248
Interest costs 4,623 4,382 39
Expected return on plan assets (88) (98) (1)
Net actuarial loss amortization (1,543) 1,442 13
Past service costs amortization (433) (316) (3)
Other 562 47 0
T otal retirement benefit costs for the fiscal year ended March 31 ¥32,097 ¥33,460 $296
102 East Japan Railway Company

NOTE 21: INCOME TAXES
The major components of deferred tax assets and deferred tax liabilities at March 31, 2015 and 2016 were as follows:
Millions of YenMillions of
U.S. Dollars
2015 2016 2016
Deferred tax assets:
Net defined benefit liability ¥225,848 ¥206,670 $1,829
Reserves for bonuses 23,527 22,640 200
Losses on impairment of fixed assets 22,283 21,518 190
Unrealized holding gains on fixed assets 12,184 12,902 114
Environmental conservation cost 8,621 7,660 68
Allowance for partial transfer costs of railway operation 5,334 6,013 53
Accrued enterprise tax 4,215 5,744 51
Excess depreciation and amortization of fixed assets 6,119 5,202 46
Asset retirement obligations 4,221 4,492 40
Loss carry forwards for tax purposes 5,292 4,367 39
Devaluation losses on fixed assets 4,059 3,856 34
Other 29,718 38,512 341
351,421 339,576 3,005
Less valuation allowance (28,396) (24,897) (220)
Less amounts offset against deferred tax liabilities (60,416) (48,235) (427)
Net deferred tax assets 262,609 266,444 2,358
Deferred tax liabilities:
Tax deferment for gain on transfers of certain fixed assets 26,811 25,571 226
Net unrealized holding gains on securities 29,705 18,768 166
Valuation for assets and liabilities of consolidated subsidiaries 2,609 2,341 21
Other 5,570 5,109 45
64,695 51,789 458
Less amounts offset against deferred tax assets (60,416) (48,235) (427)
Net deferred tax liabilities ¥ 4,279 ¥ 3,554 $ 31
5) Adjustments for Retirement Benefit CostsAdjustments for retirement benefit costs (before adjustments in tax effect
accounting) are as follows:
Millions of YenMillions of
U.S. Dollars
2015 2016 2016
P ast service costs that are yet to be recognized ¥ (613) ¥ (578) $ (5)
A ctuarial gains and losses that are yet to be recognized 19,556 (1,247) (11)
Total balance at March 31 ¥18,943 ¥(1,825) $(16)
6) Accumulated Adjustments for Retirement BenefitAccumulated adjustments for retirement benefit (before adjustments in tax
effect accounting) are as follows:
Millions of YenMillions of
U.S. Dollars
2015 2016 2016
P ast service costs that are yet to be recognized ¥ 4,703 ¥ 4,125 $ 37
A ctuarial gains and losses that are yet to be recognized 10,861 9,614 85
Total balance at March 31 ¥15,564 ¥13,739 $122
7) Plan Assets
2015 2016
Bonds 7% 7%
Equity securities 32% 30%
Cash and time deposit 9% —
General account of life insurers 48% 53%
Other 4% 10%
The discount rates are mainly 0.6% in the years ended March 31, 2015
and 2016. The rates of expected return on pension assets used by the
Companies were mainly 2.0% and 1.4% in the years ended March 31, 2015
and 2016, respectively.
The required contributions to the defined contribution plans of the
Company and its consolidated subsidiaries were ¥750 million and ¥1,057
million ($9 million) in the years ended March 31, 2015 and 2016, respectively.
103Annual Report 2016

FACTS AND FIGURES
Notes to Consolidated Financial Statements
For the year ended March 31, 2016, the actual effective income tax rate differed from the effective tax rate for the following reasons:
2016
The effective tax rate 32.9%
Adjustments:
Effect of tax rate change 3.8
Other, net (0.8)
The actual effective rate after applying tax effect accounting 35.9%
NOTE 22: INVESTMENT AND RENTAL PROPERTY
The Companies own rental office buildings and rental commercial facilities
(hereafter “investment and rental property”) principally within the Company’s
service area. In the years ended March 31, 2015 and March 31, 2016, the
amounts of net income related to rental property were ¥71,866 million and
¥70,239 million ($622 million) (rental income is recognized in operating
revenues and rental expense is principally charged to operating expenses),
respectively. The amounts recognized in the consolidated balance sheets
and fair values related to investment and rental property were as follows.
Corrections in the amounts posted as deferred tax assets and deferred
tax liabilities due to change in the income tax rate
The income tax rate and other tax rates changed from fiscal years com-
mencing on or after April 1, 2016, pursuant to the Act for Partial Revision of
the Income Tax Act, etc., and the Act to Amend the Local Taxation Act, etc.,
which a Diet session enacted on March 29, 2016. As a result, among
deferred tax assets and liabilities at the end of the fiscal year under review,
the effective tax rate utilized for the measurement of deferred tax assets
and liabilities expected to be settled or realized from April 1, 2016, to March
31, 2018, has changed from 32.1% to 30.7%, mainly. Further, the effective
tax rate utilized for the measurement of deferred tax assets and liabilities
expected to be settled or realized on or after April 1, 2018, has changed to
30.5%, mainly.
Due to these changes in effective tax rates, net deferred tax assets
(after deducting the deferred tax liabilities) decreased by ¥12,290 million
($109 million) as of March 31, 2016, deferred income tax expense recog-
nized for the year ended March 31, 2016 increased by ¥13,408 million
($119 million).
The effect of this change on net unrealized holding gains on securities
and remeasurements of defined benefit plans were negligible.
Millions of Yen Millions of U.S. Dollars
Consolidated balance sheet amount Fair value
Consolidatedbalance sheet
amount Fair value
2015 Difference 2016 2016 2016 2016
¥542,781 ¥49,325 ¥592,106 ¥1,861,419 $5,240 $16,473
Notes: 1. The consolidated balance sheet amount is the amount equal to acquisition cost, less accumulated depreciation. 2. Regarding difference in above the table, the increases in the years ended March 31, 2016, were principally attributable to acquisition of real estate and renewal (¥73,760 million/$653 million),
and the decreases were mainly attributable to depreciation expenses (¥21,362 million/$189 million). 3. Regarding fair values at the end of fiscal year, the amount for significant properties is based on real-estate appraisals prepared by external real-estate appraisers, and the amount for other
properties is estimated by the Company based on certain appraisal values or indicators that reflect appropriate market prices. If after obtaining a property from a third party or since the most recent appraisal there has been no material change in the relevant appraisal values or indicators that reflect the appropriate market prices, the amount is based on such appraisal values or indicators.
4. Because fair values are extremely difficult to establish, this table does not include property that is being constructed or developed for future use as investment property.
104 East Japan Railway Company

Fiscal 2015 (April 1, 2014 to March 31, 2015) Millions of Yen
TransportationStation Space
UtilizationShopping Centers& Office Buildings
Others(Note 1) Total
Adjustment(Note 2)
Consolidated(Note 3)
Operating revenues:
Outside customers ¥1,852,040 ¥396,368 ¥254,997 ¥ 252,760 ¥2,756,165 ¥ — ¥2,756,165
Inside group 55,223 15,630 11,560 361,435 443,848 (443,848) —
Total 1,907,263 411,998 266,557 614,195 3,200,013 (443,848) 2,756,165
Segment income ¥ 294,607 ¥ 34,539 ¥ 72,324 ¥ 27,490 ¥ 428,960 ¥ (1,438) ¥ 427,522
Segment assets ¥6,027,312 ¥203,513 ¥976,232 ¥1,133,507 ¥8,340,564 ¥(734,874) ¥7,605,690
Depreciation 273,441 10,361 31,743 37,706 353,251 — 353,251
Increase in fixed assets (Note 5) 432,877 11,442 45,958 62,894 553,171 — 553,171
Notes: 1. “Others” represents categories of business that are not included in reportable segments and include hotel operations, and advertising and publicity services. 2. The ¥(1,438) million downward adjustment to segment income included a ¥(1,798) million elimination of unrealized holding gains (losses) on fixed assets and inventory assets and a ¥317
million elimination for intersegment transactions. Moreover, the ¥(734,874) million downward adjustment to segment assets included a ¥(1,133,269) million elimination of intersegment claims and obligations, offset by ¥398,395 million in corporate assets not allocated to each reportable segment.
3. Segment income was adjusted to ensure consistency with the operating income set forth in the consolidated statements of income. 4. Segment information on liabilities was omitted from record, as it is not a metric used in deciding the allocation of management resources or evaluating earnings performance. 5. Increase in fixed assets included a portion contributed mainly by national and local governments.
Fiscal 2016 (April 1, 2015 to March 31, 2016) Millions of Yen
TransportationStation Space
UtilizationShopping Centers& Office Buildings
Others(Note 1) Total
Adjustment(Note 2)
Consolidated(Note 3)
Operating revenues:
Outside customers ¥1,954,588 ¥399,960 ¥ 255,979 ¥ 256,673 ¥2,867,200 ¥ — ¥2,867,200
Inside group 53,411 16,090 11,614 377,284 458,399 (458,399) —
Total 2,007,999 416,050 267,593 633,957 3,325,599 (458,399) 2,867,200
Segment income ¥ 348,576 ¥ 35,100 ¥ 71,611 ¥ 35,025 ¥ 490,312 ¥ (2,491) ¥ 487,821
Segment assets ¥6,282,910 ¥207,259 ¥1,060,236 ¥1,169,089 ¥8,719,494 ¥(929,732) ¥7,789,762
Depreciation 277,896 10,301 31,885 39,433 359,515 — 359,515
Increase in fixed assets (Note 5) 420,578 15,337 96,924 37,468 570,307 — 570,307
NOTE 23: SEGMENT INFORMATION
1) General Information about Reportable SegmentsTransportation, Station Space Utilization, and Shopping Centers & Office
Buildings comprise the Company’s three reportable segments. Each
reportable segment is in turn comprised of business units within the Group
with respect to which separate financial information is obtainable. These
reportable segments are reviewed periodically by the Company’s Board of
Directors and form the basis on which to evaluate business performance
and decide on how to allocate management resources of the Company.
The Transportation segment is primarily engaged in passenger transpor-
tation services centered on railway operations, and railcar manufacturing
operations. The Station Space Utilization segment creates commercial
spaces in railway stations and develops various types of businesses,
including retail sales and restaurant operations. The Shopping Centers &
Office Buildings segment develops railway stations and land near railway
stations, operates shopping centers, and leases office buildings, etc.
2) Basis of Measurement about Reportable Segment Operating Revenues, Segment Income or Loss, Segment Assets, and Other Material Items
The accounting treatment for each reportable segment is largely the same
as that set forth in the “Significant accounting policies (Note 2).” Moreover,
intersegment transactions are between consolidated subsidiaries and
based on market prices and other fair values.
105Annual Report 2016

FACTS AND FIGURES
Notes to Consolidated Financial Statements
Millions of U.S. Dollars
TransportationStation Space
UtilizationShopping Centers& Office Buildings
Others(Note 1) Total
Adjustment(Note 2)
Consolidated(Note 3)
Operating revenues:
Outside customers $17,297 $3,540 $2,265 $ 2,271 $25,373 $ — $25,373
Inside group 473 142 103 3,339 4,057 (4,057) —
Total 17,770 3,682 2,368 5,610 29,430 (4,057) 25,373
Segment income $ 3,085 $ 311 $ 634 $ 310 $ 4,340 $ (23) $ 4,317
Segment assets $55,601 $1,834 $9,383 $10,346 $77,164 $(8,228) $68,936
Depreciation 2,460 91 282 349 3,182 — 3,182
Increase in fixed assets (Note 5) 3,722 136 858 331 5,047 — 5,047
Notes: 1. “Others” represent categories of business that are not included in reportable segments and include hotel operations, and advertising and publicity services. 2. The ¥(2,491) million ($(23) million) downward adjustment to segment income included a ¥(2,681) million ($(24) million) elimination of unrealized holding gains (losses) on fixed assets and
inventory assets and a ¥196 million ($2 million) elimination for intersegment transactions. Moreover, the ¥(929,732) million ($(8,228) million) downward adjustment to segment assets included a ¥(1,190,930) million ($(10,539) million) elimination of intersegment claims and obligations, offset by ¥261,198 million ($2,311 million) in corporate assets not allocated to each reportable segment.
3. Segment income was adjusted to ensure consistency with the operating income set forth in the consolidated statements of income. 4. Segment information on liabilities was omitted from record, as it is not a metric used in deciding the allocation of management resources or evaluating earnings performance. 5. Increase in fixed assets included a portion contributed mainly by national and local governments.
3) Relevant Informationi. Information about products and services
Information about products and services was omitted as the Company classifies such segments in the same way as it does its reportable segments.
ii. Information about geographic areas
a. Operating revenues
Information about geographic areas was omitted as operating revenues attributable to outside customers in Japan exceed 90% of the operating
revenues reported in the consolidated statements of income.
b. Property, plant and equipment
Information about geographic areas was omitted as property, plant and equipment in Japan exceed 90% of the property, plant and equipment
reported in the consolidated balance sheets.
iii. Information about major customers
Information about major customers was omitted as no single outside customer contributes 10% or more to operating revenues in the consolidated
statements of income.
4) Information about Impairment Losses on Fixed Assets in Reportable SegmentsFiscal 2015 (Year ended March 31, 2015)
Millions of Yen
TransportationStation Space
UtilizationShopping Centers &
Office BuildingsOthers(Note) Total
Impairment losses on fixed assets ¥8,439 ¥1,056 ¥2,471 ¥772 ¥12,738
Fiscal 2016 (Year ended March 31, 2016)Millions of Yen
TransportationStation Space
UtilizationShopping Centers &
Office BuildingsOthers(Note) Total
Impairment losses on fixed assets ¥3,105 ¥1,642 ¥5,910 ¥1,640 ¥12,297
Millions of U.S. Dollars
TransportationStation Space
UtilizationShopping Centers &
Office BuildingsOthers(Note) Total
Impairment losses on fixed assets $27 $15 $52 $15 $109
Note: The amount in Others is the amount in connection with business segments and other operations excluded from the reportable segments.
106 East Japan Railway Company

NOTE 24: CONSOLIDATED STATEMENTS OF COMPREHENSIVE INCOME
For the Years Ended March 31, 2015 and 2016Amounts reclassified to net income (loss) in the current period that were recognized in other comprehensive income in the current or previous periods and
tax effects for each component of other comprehensive income are as follows:
Millions of YenMillions of
U.S. Dollars
2015 2016 2016
Net unrealized holding gains (losses) on securities
Amount arising during the year ¥ 41,660 ¥(36,478) $(323)
Reclassification adjustments (1,268) (10) (0)
Sub-total, before tax 40,392 (36,488) (323)
Tax (expense) benefit (11,082) 12,418 110
Sub-total, net of tax 29,310 (24,070) (213)
Net deferred gains (losses) on derivatives under hedge accounting
Amount arising during the year 2,135 (1,747) (15)
Reclassification adjustments (136) (179) (2)
Acquisition cost adjustments (130) 277 2
Sub-total, before tax 1,869 (1,649) (15)
Tax (expense) benefit (550) 558 5
Sub-total, net of tax 1,319 (1,091) (10)
Remeasurements of defined benefit plans
Amount arising during the year 21,122 (2,951) (26)
Acquisition cost adjustments (2,179) 1,126 10
Sub-total, before tax 18,943 (1,825) (16)
Tax (expense) benefit (5,910) 919 8
Sub-total, net of tax 13,033 (906) (8)
Share of other comprehensive income of associates accounted for using equity method
Amount arising during the year 3,495 (3,798) (33)
Reclassification adjustments 578 722 6
Sub-total 4,073 (3,076) (27)
Total other comprehensive income ¥ 47,735 ¥(29,143) $(258)
NOTE 25: SUBSEQUENT EVENT
Share RepurchaseThe Board of Directors of the Company resolved at its meeting held on April 27, 2016 matters concerning the Company’s repurchase of its common stock
pursuant to Article 156 of the Business Corporation Law as applied pursuant to Article 165, Paragraph 3 thereof, as detailed below.
(1) Reason for share repurchase: To enhance returns to shareholders
(2) Class of shares to be repurchased: Common stock
(3) Total number of shares that may be repurchased: 3,300,000 shares (maximum) (0.84% of issued shares (excluding treasury stock))
(4) Aggregate repurchase price: ¥30,000 million (maximum)
(5) Period of repurchase: From April 28, 2016 to July 29, 2016
The repurchase of the Company’s common stock based on this resolution was completed after market purchases on the Tokyo Stock Exchange from May
2, 2016 to June 16, 2016. The total repurchased was 3,092,100 shares of common stock at an aggregate repurchase price of ¥29,999 million ($265 million).
5) Information about Amortized Amount of Goodwill and Unamortized Balance of Goodwill by Reportable Segments Information about amortized amount of goodwill and unamortized balance of goodwill by reportable segments was omitted as the amount was negligible.
6) Information about Gain on Negative Goodwill by Reportable SegmentsInformation about gain on negative goodwill by reportable segments was omitted as the amount was negligible.
107Annual Report 2016

FACTS AND FIGURES
Independent Auditor’s Report
108 East Japan Railway Company

Glossary
Commuter Pass refers to a credit card-sized pass
that is either magnetically encoded or contains an
integrated circuit (IC) chip to allow travel between two
stations during a period of one, three, or six months.
Mobile Suica, a service based on cell phones embedded
with such IC chips, was introduced in January 2006.
Hybrid Shinkansen refers to intercity railway systems
that provide direct services to certain destinations
that are not part of a regular Shinkansen network,
using specially designed trains capable of running on
both Shinkansen lines and conventional lines that
have been widened to a standard gauge. Hybrid
Shinkansen lines are not covered by the Nationwide
Shinkansen Railway Development Law.
JNR stands for Japanese National Railways, the
government-owned public entity that was restruc-
tured into JNRSC (as defined below) on April 1, 1987.
The railway operations and certain related businesses
of JNR, along with certain necessary assets and
associated liabilities, were succeeded to by the JR
Companies (as defined below), the Shinkansen
Holding Corporation (currently, JRTT (as defined below)),
Railway Telecommunication Co., Ltd. (a predecessor
of SOFTBANK TELECOM Corp.), Railway Information
Systems Co., Ltd., and the Railway Technical
Research Institute, and all of its other assets and
liabilities became assets and liabilities of JNRSC.
JNRSC stands for JNR Settlement Corporation.
JNRSC was dissolved on October 22, 1998, and all of
its assets (including the 1,500,000 shares of JR East’s
common stock it beneficially owned at the time of
such transfer) and a portion of its liabilities were
transferred to JRCC.
JR Companies refers to, collectively, JR East,
Hokkaido Railway Company (JR Hokkaido),
Central Japan Railway Company (JR Central), West
Japan Railway Company (JR West), Shikoku Railway
Company (JR Shikoku), Kyushu Railway Company
(JR Kyushu), and Japan Freight Railway Company
(JR Freight).
JR East refers to East Japan Railway Company on
a consolidated basis or, if the context so requires,
on a nonconsolidated basis.
JR Law means the Law for Passenger Railway
Companies and Japan Freight Railway Company of
1986, as amended, which created the framework for
the establishment of the JR Companies.
JRTT stands for the Japan Railway Construction,
Transport and Technology Agency, an incorporated
administrative agency established in October 2003
upon the merger of the Japan Railway Construction
Public Corporation (JRCC) and the Corporation for
Advanced Transport & Technology. Its primary activities
include the construction of Shinkansen lines under
the Nationwide Shinkansen Railway Development
Law (see “Shinkansen”) and other national projects.
JR East rents the Takasaki–Joetsumyoko segment of
the Hokuriku Shinkansen Line and the Morioka–Shin-
Aomori segment of the Tohoku Shinkansen Line from
JRTT. JR East also rents some conventional lines
from JRTT.
Number of Passengers comprises both passengers
who begin their journey at a JR East station and
passengers who transfer to JR East from other railway
companies’ lines at the station.
Operating Kilometers means the actual length of
a railway line between two stations, regardless of the
number of tracks along the line. Fare and charge
calculations are based on this figure.
PASMO refers to IC cards with transportation ticket
functions, sold by Tokyo-area private railways, subways,
and bus companies. Ever since their launch on March
18, 2007, PASMO cards have been interchangeable
with Suica. Besides Tokyo-area private railways,
subways, and bus companies, the PASMO card
system has spread to cover some transportation
companies in Shizuoka and Yamanashi prefectures.
The PASMO name is a registered trademark of
Pasmo K.K.
Passenger Kilometers means the number of
passengers moving from one station to another
multiplied by the distance (in operating kilometers)
between such stations.
Rolling Stock Kilometers means the number of
train kilometers (as defined below) multiplied by the
number of railcars comprising the train.
Shinkansen refers to Japan’s high-speed intercity
rail systems operated by JR East, JR Central, JR
West, and JR Kyushu. Several new Shinkansen lines
are now under construction or in advanced planning
stages under the Nationwide Shinkansen Railway
Development Law.
Station Renaissance refers to a program aimed at
proactively developing the potential of JR East
stations, which are used by about 17 million people
daily and are considered to be the JR East Group’s
largest management asset. Based on thorough
consideration of customers’ perspectives and the goal
of increasing Group value in line with the increased
emphasis now being placed on Group management,
JR East is fundamentally reevaluating station layouts
and comprehensively leveraging the Group’s diverse
capabilities to undertake zero-base redevelopment
projects that optimize the facilities at each station. In
these ways, JR East is working to create new 21st
century station environments that offer increased
appeal to customers as well as greater profitability.
Suica refers to a prepaid IC card that can be used
at nearly all of JR East’s stations in the Tokyo metro-
politan area, the Sendai area, and the Niigata area,
permitting smooth, contactless passage through
ticket gates. There are two types of cards: a high-tech
commuter pass (Suica Commuter Pass) and a
stored-fare railway ticket (Suica card). Also, an electronic
money function makes it possible to use them to
purchase goods at stores in train station concourses
and in downtown stores.
Train Kilometers means the number of kilometers
traveled by a train on operational routes, excluding
movement within stations and rail yards.
C R
S
T
H
J N
O
P
109Annual Report 2016

FACTS AND FIGURES
Consolidated Subsidiaries and Equity-Method Affiliated CompaniesAs of March 31, 2016
Consolidated Subsidiaries
Company NameCapitalization
(Millions of Yen)Voting Right
Percentage (Note 1) Main Business Activities
1 Tokyo Monorail Co., Ltd. ¥3,000 79.0 Railway passenger transport services
2 JR Bus Kanto Co., Ltd. 4,000 100.0 Bus services
3 JR Bus Tohoku Co., Ltd. 2,350 100.0 Bus services
4 Japan Transport Engineering Company 3,100 100.0 Railcar manufacturing operations
5 JR East Retail Net Co., Ltd. 3,855 100.0 Retail sales
6 JR East Water Business Co., Ltd. 490 100.0 Retail sales
7 JR East Tohoku Sogo Service Co., Ltd. (Note 2) 490 100.0 Retail sales
8 JR East Station Retailing Co., Ltd. 480 100.0 Retail sales
9 Tokky Co., Ltd. 400 100.0 Retail sales, hotel operations, and shopping center operations
10 Kinokuniya Co., Ltd. 310 100.0 Retail sales
11 Nippon Restaurant Enterprise Co., Ltd. 730 100.0 Restaurant business, retail sales, and hotel operations
12 JR East Food Business Co., Ltd. 721 100.0 Restaurant business
13 LUMINE Co., Ltd. 2,375 95.1 Shopping center operations
14 atre Co., Ltd. (Note 3) 1,630 92.1 Shopping center operations
15 JR East Urban Development Corporation 1,450 100.0 Shopping center operations and retail sales
16 JR East Department Store Co., Ltd. 1,140 84.6 Shopping center operations
17 JR Tokyo West Development Co., Ltd. 1,000 93.3 Shopping center operations
18 Station Building MIDORI Co., Ltd. 450 100.0 Shopping center operations
19 Tetsudo Kaikan Co., Ltd. 340 100.0 Shopping center operations
20 Chiba Station Building Co., Ltd. 200 100.0 Shopping center operations
21 Shonan Station Building Co., Ltd. 200 90.7 Shopping center operations
22 Yokohama Station Building Co., Ltd. 200 90.3 Shopping center operations
23 Kinshicho Station Building Co., Ltd. 160 71.3 Shopping center operations
24 JR Chuo Line Mall Co., Ltd. 1,230 100.0 Shopping center operations
25 JR East Aomori Business-development Company Co., Ltd. 280 100.0 Shopping center operations
26 JR East Building Co., Ltd. 480 100.0 Leasing of office buildings
27 Viewcard Co., Ltd. 5,000 100.0 Credit card business
28 Nippon Hotel Co., Ltd. 4,000 100.0 Hotel operations
29 Sendai Terminal Building Co., Ltd. 1,800 99.5 Hotel operations and shopping center operations
30 Morioka Terminal Building Co., Ltd. 900 100.0 Hotel operations and shopping center operations
31 Akita Station Building Co., Ltd. 450 98.2 Hotel operations and shopping center operations
32 East Japan Marketing & Communications, Inc. 250 100.0 Advertising and publicity
33 Tokyo Media Service Co., Ltd. 104 100.0 Advertising and publicity
34 Shinjuku South Energy Service Co., Ltd. 750 57.6 Supplying thermal energy
35 JR-EAST Energy Development Co., Ltd. (Note 4) 150 80.0 Supplying wind energy
36 The Orangepage, Inc. 500 100.0 Publishing
37 JR East View Travel Service Co., Ltd. 550 73.8 Travel agency services
38 East Japan Railway Trading Co., Ltd. 560 100.0 Wholesale
39 JR East Logistics Co., Ltd. 100 100.0 Truck delivery services
40 JR East Information Systems Company (Note 5) 500 100.0 Information processing
41 JR East Net Station Co., Ltd. 460 100.0 Information processing
42 JR East Management Service Co., Ltd. 80 100.0 Information services
43 JR East Green Partners Co., Ltd. 100 100.0 Inventory control, issuance, and collection operation for uniforms of JR East employees
44 JR East Personnel Service Co., Ltd. 100 100.0 Seminar and staff sending business
45 JR East Station Service Co., Ltd. 50 100.0 Station operations
110 East Japan Railway Company

Company NameCapitalization
(Millions of Yen)Voting Right
Percentage (Note 1) Main Business Activities
46 East Japan Eco Access Co., Ltd. 120 100.0 Cleaning services
47 JR Chiba Railway Services Co., Ltd. 12 100.0 Cleaning services
48 JR Takasaki Railway Services Co., Ltd. 10 100.0 Cleaning services
49 JR Mito Railway Services Co., Ltd. 10 100.0 Cleaning services
50 JR East Transportation Services Co., Ltd. 38 100.0 Cleaning services
51 JR East TESSEI Co., Ltd. 38 100.0 Cleaning services
52 JR Technoservice Sendai Co., Ltd. 25 100.0 Cleaning services
53 JR Niigata Railway Services Co., Ltd. 17 100.0 Cleaning services
54 Morioka Railway Servicing Co., Ltd. 13 100.0 Cleaning services
55 JR Akita Railway Services Co., Ltd. 10 100.0 Cleaning services
56 JR Nagano Railway Services Co., Ltd. 10 100.0 Cleaning services
57 JR East Sports Co., Ltd. 400 100.0 Athletic club operations
58 GALA YUZAWA Co., Ltd. 300 92.7 Ski resort operations
59 JR East Rental & Lease Co., Ltd. 165 89.4 Car leasing
60 Union Construction Co., Ltd. 120 90.0 Construction
61 JR East Mechatronics Co., Ltd. 100 100.0 Maintenance services
62 JR Higashinihon Linen Co., Ltd. 100 100.0 Linen supply
63 JR East Rail Car Technology & Maintenance Co., LTD. (Note 6) 200 100.0 Machinery and rolling stock maintenance
64 Japan International Consultants for Transportation Co., Ltd. 495 52.5 Consulting
65 JR East Consultants Company 50 100.0 Consulting
66 JR East Design Corporation 50 100.0 Consulting
67 JR East Facility Management Co., Ltd. 50 100.0 Building maintenance
Equity-Method Affiliated Companies
Company NameCapitalization
(Millions of Yen)Voting Right
Percentage (Note 1) Main Business Activities
1 UQ Communications Inc. (Note 7) ¥71,425 17.6 Internet connect service
2 Central Security Patrols Co., Ltd. 2,924 25.4 Security business operations
3 JTB Corp. 2,304 21.9 Travel agency services
4 NIPPON DENSETSU KOGYO CO., LTD. (Note 7) 8,494 19.1 Construction
5 NIPPON RIETEC CO., LTD. (Note 7) 1,430 17.4 Construction
Notes:1. Voting right percentages represent direct voting right percentages.2. On July 1, 2015, JR East Tohoku Sogo Service Co., Ltd., merged with Jaster Co., Ltd., and JR Atlis Co., Ltd. Further, as a result of this merger Jaster Co., Ltd. and JR Atlis Co., Ltd. ceased to exist.3. On April 1, 2015, Utsunomiya Station Development Co., Ltd., Takasaki Terminal Building Co., Ltd., and Mito Station Development Co., Ltd., became subsidiaries of atre Co., Ltd.,
through a transfer of shares that East Japan Railway Company owned.4. From the fiscal year under review, JR-EAST Energy Development Co., Ltd., was newly included in consolidation.5. On April 1, 2015, JR East Japan Information Systems Company changed its business name to JR East Information Systems Company.6. On April 1, 2015, East Japan Transport Technology Co., Ltd., merged with Tohoku Rolling Stock Machinery Co., Ltd., and changed its business name to
JR East Rail Car Technology & Maintenance Co., LTD. Further, as a result of this merger Tohoku Rolling Stock Machinery Co., Ltd., ceased to exist.7. Although East Japan Railway Company owns less than 20% of the voting rights of UQ Communications Inc., NIPPON DENSETSU KOGYO CO., LTD.,
and NIPPON RIETEC CO., LTD., they were made affiliated companies because East Japan Railway Company effectively controls them.
111Annual Report 2016

FACTS AND FIGURES
Corporate DataAs of March 31, 2016
Basic Information
Number of Employees73,053* (48,894 at parent company)
* Excluding employees assigned to other companies and employees on temporary leave
Number of Stations1,665
Number of Rolling Stocks12,960
Passenger Line Network7,457.3 kilometers
Number of Passengers Served DailyAbout 17 million (average for the year ended March 31, 2016)
Total Number of Shares Issued392,500,000
Total Number of Shares Outstanding391,844,097
Paid-in Capital¥200,000 million
Number of Shareholders216,307
Stock Exchange ListingTokyo
Transfer AgentMitsubishi UFJ Trust and Banking Corporation
4-5, Marunouchi 1-chome, Chiyoda-ku, Tokyo 100-8212, Japan
Rating InformationAA+ (Rating and Investment Information, Inc.)
AA – (Standard & Poor’s Ratings Services)
Aa3 (Moody’s Investors Service)
For Inquiries
Head Office2-2, Yoyogi 2-chome, Shibuya-ku,
Tokyo 151-8578, Japan
Phone: +81 (3) 5334-1310
Facsimile: +81 (3) 5334-1320
E-mail: [email protected]
New York OfficeEmpire State Building,
Suite 4220, 350 Fifth Avenue,
New York, NY 10118, U.S.A.
Phone, Facsimile:
+1 (212) 332-8686
Paris Office3, rue de Faubourg St. Honoré,
75008 Paris, France
Phone: +33 (1) 45-22-60-48
Facsimile: +33 (1) 43-87-82-87
Brussels BranchSquare de Meeûs 23, 1000 Brussels, Belgium
Phone: +32 (0) 2 808-36-43
Facsimile: +32 (0) 2 808-36-49
Singapore Branch4 Shenton Way, #18-04 SGX Centre, Singapore 068807
Phone: +65-6536-1357
Facsimile: +65-6536-1297
London Office1st Floor, Boston House, 63-64 New Broad Street,
London EC2M 1JJ, U.K.
Phone: +44 (0) 20-7786-9900
Facsimile: +44 (0) 20-7374-2210
Internet AddressesJR East: http://www.jreast.co.jp/e/
Environment: http://www.jreast.co.jp/e/environment/
(CSR Report)
112 East Japan Railway Company

113Annual Report 2016
Further Information about JR East
Websites
Publications
App Facebook
Home Page
http://www.jreast.co.jp/e/index.html
Fact Sheets
http://www.jreast.co.jp/e/investor/factsheet/index.html
JR-EAST Train Info
http://www.jreast-app.jp/en/
JR East’s official Facebook page
https://ja-jp.facebook.com/jreast.jp
Investor Relations
http://www.jreast.co.jp/e/investor/index.html
CSR Report
http://www.jreast.co.jp/e/
environment/index.html
JR East Group
Management Vision V—Ever Onward
http://www.jreast.co.jp/e/investor/everonward/index.html

2-2, Yoyogi 2-chome, Shibuya-ku, Tokyo 151-8578, Japanhttp://www.jreast.co.jp/e/
Printed in Japan