
2013 Outlook for Asia - The page cannot be found
140
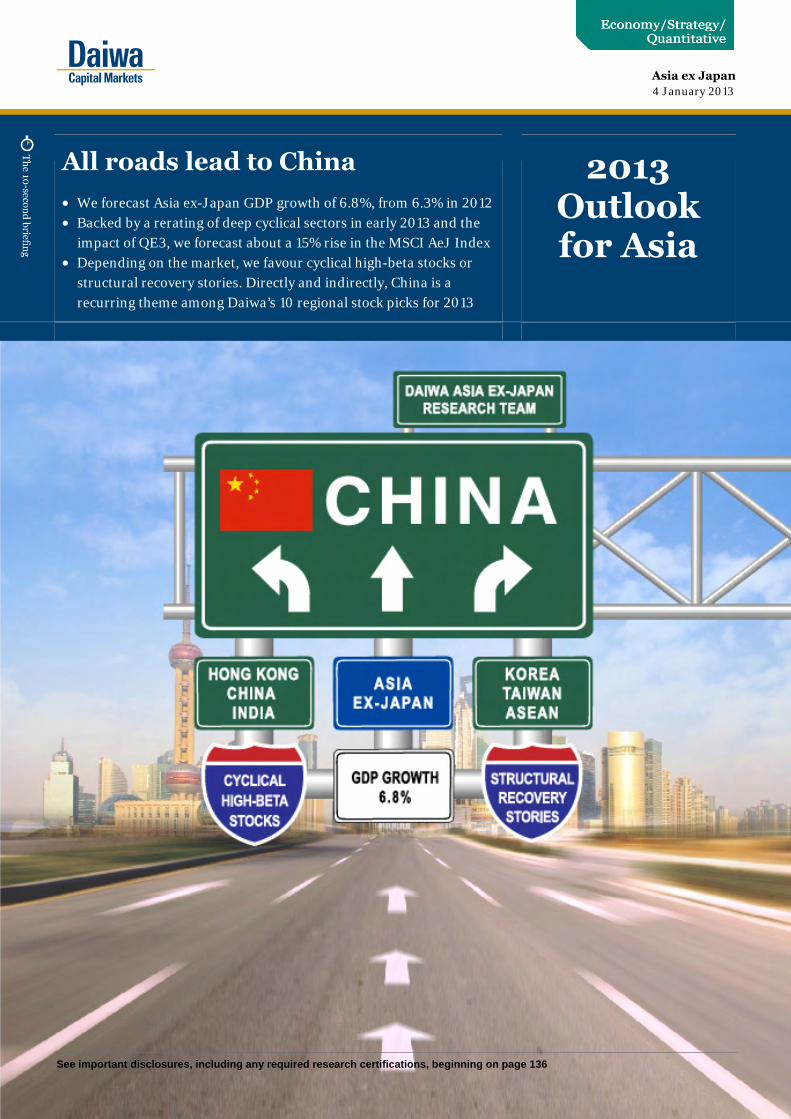
See important disclosures, including any required research certifications, beginning on page 136 4 January 2013 All roads lead to China • We forecast Asia ex-Japan GDP growth of 6.8%, from 6.3% in 2012 • Backed by a rerating of deep cyclical sectors in early 2013 and the impact of QE3, we forecast about a 15% rise in the MSCI AeJ Index • Depending on the market, we favour cyclical high-beta stocks or structural recovery stories. Directly and indirectly, China is a recurring theme among Daiwa’s 10 regional stock picks for 2013 2013 Outlook for Asia Asia ex Japan
-
Upload
khangminh22 -
Category
Documents
-
view
3 -
download
0
Transcript of 2013 Outlook for Asia - The page cannot be found
See important disclosures, including any required research certifications, beginning on page 136
4 January 2013
All roads lead to China
• We forecast Asia ex-Japan GDP growth of 6.8%, from 6.3% in 2012 • Backed by a rerating of deep cyclical sectors in early 2013 and the
impact of QE3, we forecast about a 15% rise in the MSCI AeJ Index • Depending on the market, we favour cyclical high-beta stocks or
structural recovery stories. Directly and indirectly, China is a recurring theme among Daiwa’s 10 regional stock picks for 2013
2013 Outlook for Asia
Asia ex Japan

2013 Outlook for Asia 4 January 2013
Sector rating Analyst Page
Stock picks for 2013 Pranab Kumar Sarmah Daiwa Asia ex-Japan Research Team
3
Macroeconomic outlook for 2013 Mingchun Sun/Kevin Lai/Chi Sun/ Christie Chien
9
Market outlook for 2013 Pranab Kumar Sarmah/ Chang H. Lee/Mark Chang/ Alan Chan
20
Sector outlooks Regional Oil & Gas Neutral Adrian Loh 42 Small/Mid-Caps Positive John Choi 44 Transportation Positive Kelvin Lau 46Greater China Semiconductors Neutral Eric Chen 48 Smartphones Positive Birdy Lu 50 PC Hardware Neutral Christine Wang 52Hong Kong/China Auto (China) Positive Jeff Chung 54 Banks (China) Positive Grace Wu/Leon Qi 56 City Gas (China) Positive Dave Dai 58 Construction Materials and
Building Products (China) Positive Felix Lam 60
Gaming (Macau) Neutral Bing Zhou 62 Infrastructure (China) Positive Joseph Ho/Winston Cao 64 Internet (China) Positive John Choi 66 Property (China) Positive Jonas Kan/Felix Lam/Maurine Wan 68 Property (Hong Kong) Positive Jonas Kan/Maurine Wan 70 Thermal Coal (China) Positive Dave Dai 72India Auto Positive Navin Matta 74 Financials Positive Punit Srivastava 76 Capital Goods Positive Saurabh Mehta 78 Consumer Neutral Mihir P. Shah 80 Materials Positive Deepak Poddar 82 Oil and Gas Positive Nirmal Raghavan 84Korea Auto Positive Sung Yop Chung 86 Banks Positive Anderson Cha 88 Casinos Positive Thomas Y. Kwon/Francis Kim 90 Construction Neutral Mike Oh 92 Consumer Positive Sang Hee Park 94 Internet and Online Games Positive Thomas Y. Kwon/Francis Kim 96 Machinery Positive Mike Oh 98 Shipbuilding Positive Sung Yop Chung 100 IT Hardware Positive Jae H. Lee 102 Telecoms Neutral Thomas Y. Kwon/Francis Kim 104 Utilities Positive Mike Oh 106Philippines Capital Goods Positive Rommel Rodrigo 108Singapore Capital Goods Positive Adrian Loh 110 REITs Neutral David Lum 112Taiwan Automation Positive Christine Wang 114 Financials Positive Jerry Yang 116 TFT-LCD Positive Chris Lin 118 Touch Panels Positive Chris Lin 120ASEAN Banks Positive Srikanth Vadlamani 122 Telecoms Positive Ramakrishna Maruvada/Jame Osman 124
Note: closing share prices as at 28 December 2012
Contents

2013 Outlook for Asia 4 January 2013
- 1 -
All roads lead to China Macro outlook • After the mixed bag of events we saw in 2012, the region’s economic hopes for 2013 are being
pinned on China once again, and its ability to stoke intra-Asian demand growth. We forecast Asia ex-Japan’s GDP to grow by 6.8% YoY for 2013, up from 6.3% YoY for 2012E.
• We expect a cyclical recovery in China until at least the middle of 2013, driven by restocking activity and the lagged effects of policy easing. Starting from 3Q13, we expect China to embark on mild policy tightening (two 25bp rate hikes) to ease renewed concerns about inflation.
• Asian currencies (excluding the Yen) should continue to appreciate on the back of QE3 and good regional economic fundamentals.
• We expect continued resilience among the ASEAN economies, on the back of strong domestic demand, their willingness to spend fiscally, and a cyclical recovery in China in 1H13.
• The Reserve Bank of India (RBI) is likely to depart from calibrated policy easing to more pervasive easing to protect growth; we forecast interest-rate cuts totalling 100bps in 2013.
• Risks: 1) more risk aversion during Spain’s and Italy’s large bond redemptions in the summer, 2) a potential increase in the risk premium for US treasuries, 3) a potential escalation of Sino-Japan political tensions, 4) higher-than-expected inflation in Asia due to a sharp rise in crude-oil prices and food prices, and 5) a meltdown in China’s shadow-banking system.
Market outlook • We forecast an increase of about 15% in the MSCI Asia ex-Japan Index over 2013, backed by
earnings growth and a moderate rerating of cyclical stocks. We forecast about 10% or more upside potential for the KOSPI, SENSEX, and Hang Seng Index over this year, while the TAIEX could end 2013 at the current level.
• We expect markets that host cyclical stocks, such as Hong Kong, China, and Taiwan, to see strong earnings recoveries in 2013. The Won’s strength over the Yen is an issue for Korea.
Stock picks • Most of our regional top picks have a connection with China, and four of our top picks from
China are directly linked to domestic demand.
• We prefer stocks from cyclical sectors in China and India, and companies that we believe offer structural recovery stories in Korea, Taiwan, and the ASEAN countries.
• Our preferred sectors are China property, Asia banks, shipping, China and India materials and infrastructure, consumer discretionary, and players in the smartphone chain.
• Our top-two non-consensus regional Sell ideas are Dongfeng Motor Group and AREIT.
Daiwa’s key regional stock calls for 2013 Company B’berg code Rating Share price (local) Target price Mkt. cap (USDm) Daiwa comment Guangzhou R&F Prop 2777 HK Buy 12.88 15.90 5,356 An undervalued regional play Orient Overseas Int’l 316 HK Buy 50.30 67.00 4,061 Upside potential from restocking demand ICBC 1398 HK Buy 5.53 6.70 249,029 Cyclical macro recovery should override any rise in
funding costs ENN Energy 2688 HK Buy 33.70 43.00 4,564 Structural earnings growth with a cyclical boost China Railway Const’n 1186 HK Buy 8.81 10.53 14,022 Policy-driven pick Samsung Electronics 005930 KS Buy 1,522,000 1,800,000 209,410 Cyclical earnings boost likely ahead Amorepacific 090430 KS Outperform 1,214,000 1,360,000 6,607 Increasing consumer demand from China and Korea MediaTek 2454 TT Buy 323.50 383.00 15,032 Beneficiary of China handset upgrade cycle Tata Steel TATA IN Buy 428.35 505.00 7,592 Well prepared to ride on a cyclical recovery Bank of Ayudhya BAY TB Buy 32.50 38.00 6,453 ASEAN consumer-demand pick Source: Daiwa. Note: prices in local currency as of close of 28 December 2012

2013 Outlook for Asia 4 January 2013
- 2 -

2013 Outlook for Asia 4 January 2013
- 3 -
Stock picks for 2013 Pranab Kumar Sarmah, CFA (852) 2848 4441 ([email protected]) Daiwa Asia ex-Japan Research Team
Top-10 regional picks
For 2013, our preference lies with stocks from cyclical sectors in China and India, and companies that we believe offer structural recovery stories in Korea, Taiwan and ASEAN countries. Our preferred sectors are China property, Asian banks, shipping, China/India infrastructure, consumer discretionary, and players in the smartphone chain. Our top picks are as follows. 1. Guangzhou R&F Properties (2777 HK) – an
undervalued regional play
2. Orient Overseas International (316 HK) – upside potential from restocking demand
3. ICBC (1398 HK) – cyclical macro recovery should override any rise in funding costs
4. ENN Energy (2688 HK) – structural earnings growth with a cyclical boost
5. China Railway Construction Corporation (1186 HK) – policy-driven pick
6. Samsung Electronics (005930 KS) – cyclical earnings boost likely ahead
7. Amorepacific (090430 KS – should benefit from increasing consumer demand from China and Korea
8. MediaTek (2454 TT) –beneficiary of China handset upgrade cycle
9. Tata Steel (TATA IN) – well prepared to ride on a cyclical recovery.
10. Bank of Ayudhya (BAY TB) – ASEAN consumer-demand pick
Our top two non-consensus regional Sell ideas are Dongfeng Motor Group (489 HK) and Ascendas Real Estate Investment Trust (AREIT SP).
China exposure a blessing
In this report, our economics team presents its top-five macro themes for Asia ex Japan for 2013, and our regional analysts give their top Buy and Sell ideas within 42 sub-sectors. We have screened our top-10 Buy ideas based on the following metrics:
a) relevance to our macro themes,
b) structural stories, and
c) valuations. Most of our picks from the regions have a connection with China. For instance, one of our top picks in ASEAN is Bank of Ayudhya, which we believe stands to benefit from rising consumer demand as more manufacturing activities migrate from China to ASEAN countries. Another of our picks, Amorepacific in Korea, is selected for its exposure to rising consumer demand from China and high-end product demand in Korea. Four of our top picks from China are directly linked to domestic demand. For those stock markets that underperformed vs. the MSCI Asia ex-Japan Index in 2012 (mainly China), our picks are cyclical high-beta stocks. For markets that outperformed (such as ASEAN), or appear fairly valued now (such as Korea and Taiwan), our picks are mainly structural recovery stories.

2013 Outlook for Asia 4 January 2013
- 4 -
Our key macro themes and sector impact
Themes and sector impact for 2013 Theme Sector impact Theme 1. We expect a cyclical recovery in China to at least mid-2013, driven by restocking activity and the lagged effects of policy easing.
We expect to see a continuous improvement in sales volumes and profits of China demand-driven cyclical sectors such as property, transportation, building materials, etc. Indirect beneficiaries should be supporting industries such as banks, insurance and consumer discretionary. Among our stock picks, Guangzhou R&F Properties, Orient Overseas International, ICBC and China Railway Construction Corporation are beneficiaries of this macro theme.
Theme 2. Starting from 3Q13, we expect China to embark on mild policy tightening (two 25bp rate hikes) to ease potentially renewed concerns about inflation.
We believe such a move will prompt investors to park money in defensive sectors such as Telecoms, Utilities with low gearing, etc, in 2H13. However, banks should benefit during the early stage of an interest-rate-hike cycle due to improved NIMs. We think it is too early to park money in defensive sectors, thus we are not recommending any stocks in these except ENN Energy, which we believe has a structural growth story and policy-specific upside potential (possible gas-price hike).
Theme 3. Asian currencies (ex JPY) should continue to appreciate on QE3 and good economic fundamentals.
We expect the KRW’s strength against the JPY to impact negatively companies in Korea that compete directly with Japanese groups. These are in the auto, auto-components and electronics raw-material sectors. The health of Korea’s domestic consumption is likely to depend on the overall economy, which we expect to improve slightly in 2013. Appreciation of ASEAN currencies in 2013 should favour domestic-consumption, utilities, airlines, and telecoms names in those economies.
Theme 4. We expect continued resilience of ASEAN economies, on the back of strong domestic demand, their willingness to spend fiscally, and a cyclical recovery in China in 1H13.
QE3 should help drive a rerating of all Asian markets. The magnitude is difficult to quantify. However, we have seen increased fund flows from the US and Europe to Asian markets since late November 2012. In a strong economic recovery scenario, REITs are likely to underperform. We have a non-consensus Underperform rating on AREIT. Our pick for the ASEAN consumption theme are Bank of Ayudhya of Thailand. Amorepacific of Korea is a beneficiary of China/Korea discretionary consumer spending.
Theme 5. The Reserve Bank of India (RBI) is likely to depart from calibrated policy easing to more pervasive easing to protect economic growth; we forecast interest-rate cuts totalling 100bps in 2013.
Sectors with high financial leverage such as property and its derivatives such as infrastructure, construction, etc., should benefit from potential interest-rate cuts in India in 2H13. At this stage, we would favour quality cyclicals and our pick here is Tata Steel. Interestingly, in India interest cuts tend to have a limited impact on NIMs at private-sector banks but a high impact at public-sector banks.
Source: Daiwa
Structural recovery stories For most ASEAN markets and the Taiwan market that we believe are fairly valued now, we have focused on structural recovery stories and our two top picks here are Bank of Ayudhya (BAY) in Thailand and MediaTek in Taiwan. We forecast BAY’s ROE to improve by 2.6pp over the next two years, on the back of a change in its business mix. Samsung Electronics (SEC), our top pick in Korea, is also in a structural recovery phase. We forecast SEC to deliver operating-profit growth of 12.4% YoY for 2013, backed by its structural business growth in smartphones and a cyclical boost from the memory and TFT-LCD sectors. We expect strong revenue growth and profit-margin expansion for MediaTek in 2013 due to a favourable shift in its product mix.
2013 Outlook for Asia 4 January 2013
- 5 -
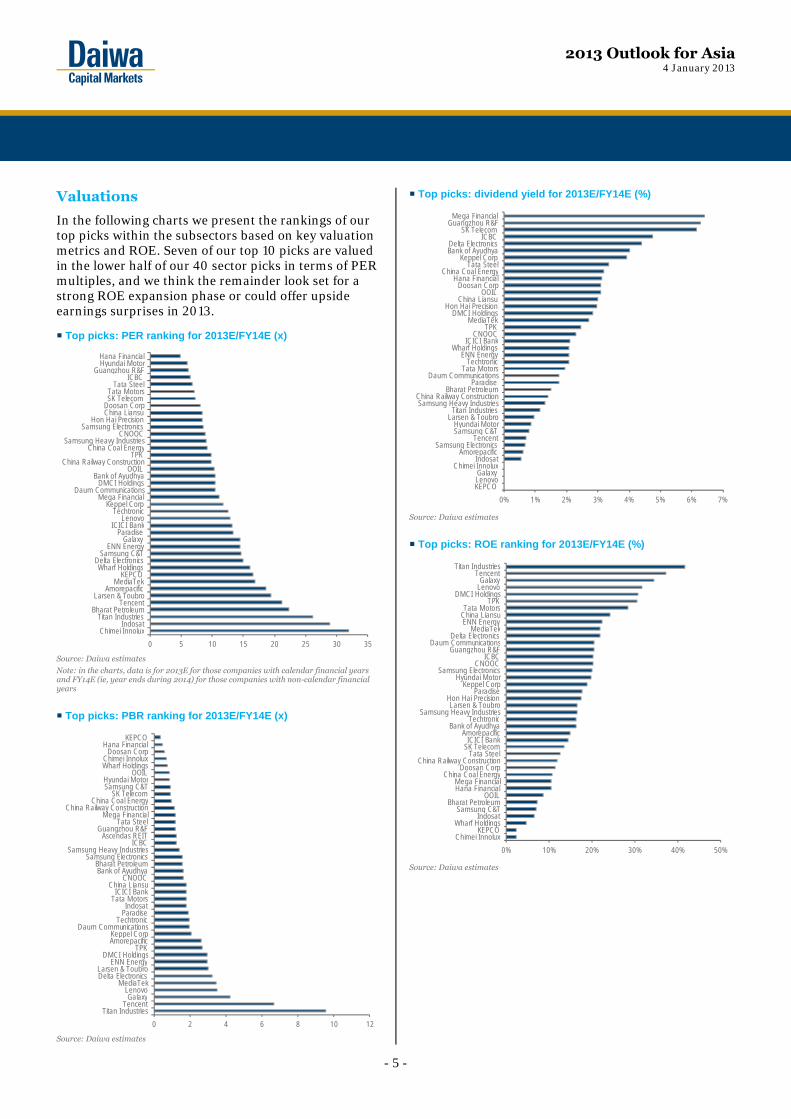
Valuations
In the following charts we present the rankings of our top picks within the subsectors based on key valuation metrics and ROE. Seven of our top 10 picks are valued in the lower half of our 40 sector picks in terms of PER multiples, and we think the remainder look set for a strong ROE expansion phase or could offer upside earnings surprises in 2013. Top picks: PER ranking for 2013E/FY14E (x)
Source: Daiwa estimates
Note: in the charts, data is for 2013E for those companies with calendar financial years and FY14E (ie, year ends during 2014) for those companies with non-calendar financial years
Top picks: PBR ranking for 2013E/FY14E (x)
Source: Daiwa estimates
Top picks: dividend yield for 2013E/FY14E (%)
Source: Daiwa estimates
Top picks: ROE ranking for 2013E/FY14E (%)
Source: Daiwa estimates
0 5 10 15 20 25 30 35Chimei Innolux
IndosatTitan Industries
Bharat PetroleumTencent
Larsen & ToubroAmorepacific
MediaTekKEPCO
Wharf HoldingsDelta Electronics
Samsung C&TENN Energy
GalaxyParadise
ICICI BankLenovo
TechtronicKeppel Corp
Mega FinancialDaum Communications
DMCI HoldingsBank of Ayudhya
OOILChina Railway Construction
TPKChina Coal Energy
Samsung Heavy IndustriesCNOOC
Samsung ElectronicsHon Hai Precision
China LiansuDoosan CorpSK TelecomTata Motors
Tata SteelICBC
Guangzhou R&FHyundai MotorHana Financial
0 2 4 6 8 10 12Titan Industries
TencentGalaxy
LenovoMediaTek
Delta ElectronicsLarsen & Toubro
ENN EnergyDMCI Holdings
TPKAmorepacificKeppel Corp
Daum CommunicationsTechtronic
ParadiseIndosat
Tata MotorsICICI Bank
China LiansuCNOOC
Bank of AyudhyaBharat Petroleum
Samsung ElectronicsSamsung Heavy Industries
ICBCAscendas REIT
Guangzhou R&FTata Steel
Mega FinancialChina Railway Construction
China Coal EnergySK Telecom
Samsung C&THyundai Motor
OOILWharf HoldingsChimei Innolux
Doosan CorpHana Financial
KEPCO
0% 1% 2% 3% 4% 5% 6% 7%KEPCOLenovoGalaxy
Chimei InnoluxIndosat
AmorepacificSamsung Electronics
TencentSamsung C&THyundai Motor
Larsen & ToubroTitan Industries
Samsung Heavy IndustriesChina Railway Construction
Bharat PetroleumParadise
Daum CommunicationsTata Motors
TechtronicENN Energy
Wharf HoldingsICICI Bank
CNOOCTPK
MediaTekDMCI Holdings
Hon Hai PrecisionChina Liansu
OOILDoosan Corp
Hana FinancialChina Coal Energy
Tata SteelKeppel Corp
Bank of AyudhyaDelta Electronics
ICBCSK Telecom
Guangzhou R&FMega Financial
0% 10% 20% 30% 40% 50%Chimei Innolux
KEPCOWharf Holdings
IndosatSamsung C&T
Bharat PetroleumOOIL
Hana FinancialMega Financial
China Coal EnergyDoosan Corp
China Railway ConstructionTata Steel
SK TelecomICICI Bank
AmorepacificBank of Ayudhya
TechtronicSamsung Heavy Industries
Larsen & ToubroHon Hai Precision
ParadiseKeppel Corp
Hyundai MotorSamsung Electronics
CNOOCICBC
Guangzhou R&FDaum Communications
Delta ElectronicsMediaTek
ENN EnergyChina LiansuTata Motors
TPKDMCI Holdings
LenovoGalaxy
TencentTitan Industries

2013 Outlook for Asia 4 January 2013
- 6 -
Top-10 Buy ideas
Guangzhou R&F Properties (2777 HK, HKD12.88, Buy [1]) An undervalued regional play. The share prices of leading China national property companies’ rallied substantially in 4Q12, and are now close to fair value, in our view. We believe it is now time for the valuations of quality regional players to catch up. Guangzhou R&F Properties (Guangzhou R&F) is a quality regional player, in our view, with a solid presence in Guangzhou, Beijing and Tianjin, is expanding to second-tier cities, and is trading at a significant discount to current NAV. With its strong balance sheet, we expect the company to become more active in replenishing its landbank in 2013. Its progress in securing urban-renewal projects in major cities should be another positive development this year. Our six-month target price of HKD15.9 is based on a 30% discount applied to our end-2013 NAV forecast. Orient Overseas International (316 HK, HKD50.3, Buy [1]) Upside potential from restocking demand. In the global shipping market, we expect capacity consolidation to remain intact and freight demand to recover by 6% YoY in 2013. Note that few major liners have announced capacity cuts for 2013. We believe liner Orient Overseas International (OOIL) stands to benefit from potential restocking demand in the near term due to low inventory levels in many industries in the US and better-than-expected US holiday-period sales. An increasing revenue contribution from inter-Asia routes would be a structural revenue-growth driver for the company. Also, we expect OOIL to be the most profitable liner globally at operating-profit level in 2013. Our six-month target price of HKD67 is based on a target PBR of 1.1x applied to our 2013E BVPS. ICBC (1398 HK, HK5.53, Buy [1]) Cyclical macro recovery should override any rise in funding costs. We expect NIM compression to become visible for the PRC Banks Sector from 1Q13 onwards and believe large banks such as ICBC will be less impacted than small ones. We expect ICBC to leverage on its low cost of funds stemming from its strong deposit franchise, steady asset quality and strong capital base. Also, the cyclical economic recovery that our economics team forecasts for China (GDP growth to accelerate to 8.7% YoY for 2Q13E) should ease concerns about asset quality for ICBC as it should help to offset any resultant rise in funding costs. Our six-month target price of HKD6.70 is based on the SOTP method and implies a blended PBR of 1.6x for 2013E.
ENN Energy (2688 HK, HKD33.7, Buy [1]) Structural earnings growth with a cyclical boost. Among the various utilities sub-sectors, China’s demand for gas has not slowed over the past decade and we expect full gas-price reform China in 2013, leading to a gas-price hike. ENN Energy (ENN) is our top pick for this theme, due to what we consider as its superior organic earnings growth, cheap valuation, and upside potential from the expansion of its refilling-station business. We forecast ENN’s organic growth to average around 23% per year over 2013-14 on strong natural-gas sales. Another earnings-growth driver is its investment in liquefied natural gas (LNG)-refilling stations. The company projects higher returns from LNG-refilling stations than from compressed-natural gas (CNG)-refilling stations. On valuation, the stock is trading at a below-sector-average 2013E PER based on our EPS forecast, while we forecast it to deliver the highest ROE in its sector this year. Our six-month target price of HKD43 is derived from our DCF valuation. China Railway Construction Corporation (1186 HK, HKD8.81, Buy [1]) Policy-driven pick. China Railway Construction Corporation (CRCC) is China’s largest railway construction group by revenue. We are upbeat about the company’s 2013 earnings outlook, as the Ministry of Railways (MOR) resumed awarding new railway-construction contracts in 4Q12. In addition, CRCC is China’s second-largest subway-construction contractor, with more than a 30% share of the market currently. The expansion of China’s subway network bodes well for CRCC in 2013 and 2014 in terms of potential new order wins, on our view. Also, subway-construction contracts generally have higher gross-profit margins than railway-construction ones, thus we see good prospects for profit-margin expansion for CRCC. Our six-month target price is HKD10.53, based on a target PER of 11.7x (compared with CRCC’s past-three-year average one-year-forward PER of 10.5x) applied to our 2013 EPS forecast. Samsung Electronics (005930 KS, KRW1,522,000, Buy [1]) Cyclical boost ahead. The smartphone, memory-device and OLED-display markets look set to remain key drivers for the Korea tech space in 2013, and SEC is among the market leaders in these product categories. We expect the company to upgrade its flagship products from its mobile division (65% of our 2012E operating profit), such as the Galaxy S and Note-series products, during 2013, with industry-leading specs, which are likely to drive market-share gains for the company in the high-end smartphone/tablet segment.

2013 Outlook for Asia 4 January 2013
- 7 -
While it also plans to introduce low/mid-end smartphones to expand its share in emerging markets like China. We forecast SEC to ship 300m smartphones in 2013, up from 215m in 2012E. We believe there is significant scope for further earnings growth in 2013 as improvements are only just starting at its cyclical businesses (semiconductors and TFT-LCD). Riding on continuous growth of its telecoms division and a recovery in its cyclical business, we forecast the company’s operating profit to increase by 12.4% YoY to KRW32.0tn for 2013. Our SOTP-derived six month target price for SEC is KRW1.8m. Amorepacific (090430 KS, KRW1,214,000, Outperform [2]) Polarisation a positive. Amorepacific’s growing high-end brand business in Korea, a strong Won, and rapid business growth in China should benefit the company in 2013. The polarisation of consumer spending benefits the sales growth of high-end brands, and we forecast high-end brands (which also enjoy high margins) to account for 62% of Amorepacific’s total cosmetics sales for 2012. The China division should account for the highest sales growth for 2012-14E, as sales are rising by 25-30% a year on the back of its expanded distribution coverage, geographical expansion and new brand launches. China sales account for around 8% of Amorepacific’s total sales. We forecast the company to maintain its operating-profit margin for 2013 and 2014 at the 2012E level of 8%. Our six-month target price for KRW1,360,000 is based on a DCF methodology due to the company’s steady free cash flow-generating ability. Our target price implies a 2013E PER of 20.8x, which is in line with the 20.5x average of its peers globally based on the Bloomberg-consensus 2013 forecast. MediaTek (2454 TT, TWD323.5, Buy [1]) Beneficiary of China handset upgrade cycle. We project profit-margin expansion for MediaTek in 2013 on the back of a rebound in its blended ASP from rising smartphone-IC shipments and its shift to a more favourable product mix. One of the key growth drivers for semiconductors in 2013 is smartphone ICs for each of Apple, SEC and China (to which MediaTek has exposure), which we expect to outpace global semiconductor shipment growth in 2013. We forecast smartphone-IC shipments for MediaTek of 205m units for 2013, up from 108m for 2012E. We believe the Bloomberg consensus earnings forecasts for 2013 currently do not assume such strong shipment growth and are likely to be raised. Our six-month target price of TWD383 is based on PER of 20x (the stock’s average over the past year) applied to our 2013 EPS forecast.
Tata Steel (TATA IN, INR428.35, Buy [1]) Well prepared to ride on a cyclical recovery. Tata Steel is our pick from India. A reduction in material costs, recovery in China steel demand (FAI) and India demand (interest-rate cuts) would create a favourable environment for the steel players in 2013. The company commissioned a 2.9mtpa steel capacity expansion in India in 1H FY13 (increasing capacity by 43%), with the impact on output set to be felt in 2H FY13. We forecast a strong steel-sales CAGR of 15% for FY12-14. Further, the strong correction in the coking-coal price during July-December has benefited both the company’s India and its European divisions. Vertical integration to iron-ore mining for India operation makes it immune to the iron-ore shortages being faced by a peer. Our six-month target price of INR505 is based on our SOTP valuation. We value the Indian business at an FY14E EV/EBITDA multiple of 6.5x and the European business at 3.5x. Bank of Ayudhya (BAY TB, THB32.5, Buy [1])
ASEAN consumer demand looks set to pick up. Potentially rising funding costs would be the key issue for Asian banks in 2013, in our view. However, we would expect the impact on the Thai banks to be less severe than on other banks in the ASEAN region as we envisage strong growth in their high-yield consumer lending. Bank of Ayudhya (BAY) is our key call. We believe the bank’s high-yielding personal loans and credit-card businesses are growing rapidly due to rising consumer demand and the bank’s market-share gains, which should lead to 7bps YoY expansion of its NIM for 2013E, despite rising funding costs. Due to operating-expense and credit-cost leverage, we forecast the bank to record a 2pp decline in its cost-to-income ratio over the next two years. We project its ROE to expand to 16.3% for 2014, from 13.7% for 1H12. Our six-month target price of THB38 is based on our Gordon Growth Model.
2013 Outlook for Asia 4 January 2013
- 8 -
Top Sell ideas
Dongfeng Motor Group (489 HK, HKD11.98, Underperform [4]) Loser in the pack. While we have a positive view on China’s auto sector and forecast 10-12% YoY sales-volume growth for passenger vehicles in 2013 (backed by demand from inland areas), we would advise investors to be selective in their stock-picking following the sector’s strong performance in 2012. Dongfeng Motor (DFM) is our non-consensus Underperform call. We believe the company’s golden period of earnings growth has ended, and therefore expect its business momentum to lag peers in 2013 and the stock to continue to derate to the end of 2013. We forecast only a 6.7% EPS CAGR for 2012-14, down sharply from the 38.4% CAGR the company recorded for 2008-11. The company’s ageing passenger vehicle models and less-competitive products in the growing SUV market are likely to be key structural issues for DFM in 2013, in our view. Our six-month target price of HKD8.75 is based on a PER of 7x (which is 0.5SD lower than its past-five-year average) applied to our 2013 EPS forecast.
Ascendas Real Estate Investment Trust (AREIT SP, SGD2.39, Underperform [4]) For the sector, we believe the yield-gap theme is fully played out. We expect a deceleration in rental growth in 2013 due to sub-par GDP growth and a less hospitable operating environment. AREIT trades at a considerable premium (based on yield and NAV) to its industrial property S-REIT peers. AREIT is widely viewed as defensive, but we believe it is probably more vulnerable than its peers, due to its high exposure to multi-tenanted industrial properties. Moreover, we cannot rule out the possibility of a short-term share-price drag from another private placement in 2013, as occurred in early 2011 and 2012. Our six-month target price of SGD2.20 is pegged to parity with our 10-year DDM valuation.

2013 Outlook for Asia 4 January 2013
- 9 -
Macroeconomic outlook for 2013 Mingchun Sun (852) 2773 8751 ([email protected]) Kevin Lai (852) 2848 4926 ([email protected]) Chi Sun (852) 2848 4427 ([email protected]) Christie Chien (852) 2848 4482 ([email protected])
Top-5 macro themes
1. A cyclical recovery in China until mid-2013 (we forecast GDP growth of about 8.5% YoY for 1H13), driven by restocking activity and the lagged effects of policy easing.
2. Starting from 3Q13, China embarks on a round of mild policy tightening (eg, two 25bp rate hikes) to assuage renewed concern about inflation.
3. Asian currencies continue to appreciate on the back of QE3 and good economic fundamentals.
4. The continued resilience of the ASEAN economies, on the back of strong domestic demand, their willingness to spend fiscally, and China’s cyclical recovery in 1H13.
5. The Reserve Bank of India’s (RBI) departure from calibrated policy easing to more pervasive easing in order to protect economic growth – we forecast interest-rate cuts totalling 100bps over the course of 2013.
Top-5 risks
1. Another period of risk aversion globally during the summer, when Spain and Italy face large bond redemptions (in July and August, respectively).
2. A potential increase in the risk premium on US treasuries, reflecting investor concerns about the sustainability of the US debt level in the absence of a credible plan for medium-term consolidation.
3. A potential escalation of Sino-Japanese political tension stemming from territorial disputes.
4. A sharp rise in crude-oil prices stemming from geopolitical risks, or a sharp rise in food prices due to severe weather conditions or the outbreak of disease among livestock, leading to higher-than-expected inflation in Asia and stronger-than-expected policy tightening
5. A potential meltdown of China’s shadow banking system, which could spill over into the overall financial system and the economy at large.
Global outlook
2012: a year of disappointments and excitement In retrospect, 2012 was a year mixed with ‘growth scares’ and policy excitement. A year ago, the FocusEconomics consensus 2012 GDP growth forecast for Asia ex-Japan was 7.5% YoY. Throughout 2012, this forecast was cut progressively. The region is now on track to achieve somewhere close to 6.3% YoY growth, down from 7.3% YoY for 2011. The biggest disappointments were from Hong Kong, Singapore, Taiwan, Korea, and India. For the first three markets, the consensus cut its growth forecasts by more than half. Gap between the consensus forecasts and reality (2012 GDP)
Source: FocusEconomics, CEIC
However, stock markets in Asia performed fairly well, except for those in China. In 1Q12, the policy excitement from Operation Twist, Long-term Refinancing Operations, and numerous Asian central banks provided the reason for a change in sentiment. Then came the growth scare in 2Q12, on the back of Greece’s near Euro-exit, fear of a hard-landing in China, and consensus cuts to regional growth forecasts. In 3Q12, the introduction of Outright Monetary Transactions and QE3, and a cyclical recovery in China set the stage for another change in sentiment, sending markets higher.
0.01.02.03.04.05.06.07.08.09.0
China
Philip
pines
Indon
esia
India
Malay
sia
Thail
and
Korea
Sing
apore
Hong
Kon
g
Taiw
an
Overa
ll
GDP growth (9M12) Consensus forecast in Dec 2011
(% YoY)

2013 Outlook for Asia 4 January 2013
- 10 -
Stock-market performances (2012)
Source: CEIC, Daiwa
Note: last trading day in 2012 for China, Hong Kong, Singapore, Malaysia, and India is 31 December. Last trading day in 2012 for Taiwan, Korea, Thailand, Indonesia and the Philippines is 28 December.
2013: Asia should hold up better than G3 We believe the outlook for 2013 will again be highly dependent upon what extent there will be growth scares and the extent of policy excitement. We expect global demand growth to be slightly weaker. In particular, we find it hard to be upbeat about the G3 economies – Europe, the US, and Japan – which collectively continue to account for about half of all of Asia’s exports. We look for GDP growth for the G3 to be 1.0% YoY for 2013, down from 1.4% YoY for 2012. Global: GDP forecasts
2012E 2013E (% YoY) Daiwa Consensus Daiwa Consensus US 2.3 2.2 1.9 2.0 EU (0.5) (0.5) (0.2) 0.1 Japan 2.0 2.0 0.9 0.9 G3 1.4 1.4 1.0 1.2 Source: Bloomberg, Daiwa forecasts
Note: fiscal-year data for Japan
G3: GDP growth (1996-2013E)
Source: CEIC, Daiwa forecasts
The European crisis should continue to be the source of many problems. With governments compelled to undertake significant fiscal austerity, we expect deep recessions in the periphery countries. The possibility
that the crisis will escalate remains a major downside risk to our outlook, until the underlying issues are resolved. The degree of deleveraging stress is likely to continue. The largest burden of projected credit supply contraction falls on the periphery countries. Following on from a 0.5% YoY drop in euro-area GDP for 2012E, we forecast another 0.2% YoY decline for 2013. We believe the recession will be deeper and more prolonged than official forecasts currently suggest. Event risks concentrated in the summer In terms of event risks, we see them heavily concentrated in April and July-August. There will be general elections in Italy in April. Current polls in Italy predict no clear majority for any party, thus risking a Greek-style political gridlock. Spain faces large bond redemptions in July. Spain’s central government will have to keep funding its regions as their yields remain high. The highly front-loaded nature of the debt will put a large burden on the country’s finances. The risk is that Spain may need to request a bailout sometime in the summer. Italy faces similar large bond redemptions in August. The balance sheets of the country’s banks are already loaded with government bonds. US growth to remain anaemic Meanwhile, we expect the US to avoid excessive fiscal consolidation (fiscal cliff) in 2013, to raise the debt ceiling promptly, and to agree on a credible medium-term fiscal consolidation plan. We do not expect Congress to extend all the current tax breaks and to allow some scheduled spending cuts. In this regard, while economic growth is likely to remain low, we do not see a recession developing in the country. We forecast US GDP growth to fall slightly, from 2.3% YoY for 2012 to 1.9% YoY for 2013. Additional headwinds from Japan Given significant headwinds, both external and domestic, Japan’s economic growth peaked in March 2012 and has since slipped into recession. We believe the economy stagnated again in 4Q12, but expect some growth to return in 2013 and after, supported by: 1) earthquake-related reconstruction demand, 2) a recovery in China, and 3) further monetary easing by the BOJ. Meanwhile, the downside risks are: 1) any deterioration in Japan-China relations, 2) a sharp rise in crude-oil prices stemming from geopolitical risk, and 3) the current-account balance turning negative. We forecast Japan’s GDP growth to slow from 2.0% YoY for FY12 to 0.9% YoY for FY13.
35.833.0
25.722.9
19.7
12.99.5 9.4 8.9
3.1
0
5
10
15
20
25
30
35
40
Thai
land
Phili
ppin
es
Indi
a
Hong
Kon
g
Sing
apor
e
Indo
nesi
a
Mal
aysi
a
Kore
a
Taiw
an
Chin
a A
-sh
are
(%)
-5
-4
-3
-2
-1
0
1
2
3
4
1996
1997
1998
1999
2000
2001
2002
2003
2004
2005
2006
2007
2008
2009
2010
2011
2012
E
2013
E
G3 Real GDP growth(% ,YoY)

2013 Outlook for Asia 4 January 2013
- 11 -
Regional macro outlook
Hopes are being pinned on China again As demand from the G3 is unlikely to be inspiring for 2013, the region cannot rely on a demand recovery from those economies. Asia consumes about 30% of its exports itself. Intra-Asia demand is probably the only area that might offset G3 weakness. Therefore, our overall outlook for regional growth depends to a large extent on Asia’s ability to boost its internal demand. China will continue to be the major source of intra-Asian demand growth. We expect the country’s cyclical rebound to last into 1H13, as destocking ends and restocking starts. A low base of comparison (1H12) and the lagged impact of stimulus programmes should also push GDP growth higher in 1H13, possibly to almost 9.0% YoY for 2Q13. This level of GDP growth, however, is likely to invite another round of (mild) policy tightening in 3Q13, which should bring GDP growth back to a downtrend. China: GDP and final demand
Source: CEIC, Daiwa forecasts
At the same time, we see inflation becoming a fresh concern again in China in 3Q13, on the back of a food-price rise and a weak base of comparison (3Q12). We expect CPI inflation to rise above 3.0% YoY for 3Q13 and 4.0% YoY for 4Q13, triggering two 25bp rate hikes in 2H13 as the People’s bank of China (PBOC) tries to narrow the magnitude of negative real rates. In this regard, China would provide a cyclical boost to intra-Asia demand but this would only last for about 6-9 months from now.
CPI inflation and one-year deposit rate
Source: CEIC, Daiwa forecasts
As this cyclical bounce is driven mostly by inventory adjustments and the ‘mini stimulus programme’ that focuses on infrastructure investment (see our report Mini stimulus under way, published on 26 June 2012), the extra demand should come mainly from commodities rather than capital goods. The benefits would be mostly felt by the ASEAN economies. Some of the policy space has been used up Elsewhere in Asia, the space for further policy easing is likely to be more limited this year, and depends highly on the US Dollar trend. Numerous rate cuts in Asia have used up the space available – output gaps are still positive and real policy rates remain well below their pre-crisis averages. Nominal policy rates are either close to or barely above CPI inflation levels. Moreover, in view of QE3 and its potential inflation challenges (including inflation expectations), the room for more easing should be much less in 2013 than in 2012. Besides China, we expect Malaysia, Indonesia, Thailand, and the Philippines to reverse some of the easing they undertook in 2012, mostly in 2H13, but any rate hikes are likely to be moderate because of the need to protect economic growth at the same time. For the same reason, the space for currency depreciation to boost exports should be equally limited. QE3-driven inflation challenges mean that Asian central banks are still required to allow currency appreciation to mitigate import inflation pressures. With the exception of the Rupee, we expect Asian currencies to be 1.4-5.2% stronger throughout 2013. There is still room for fiscal expansion but it should be more limited in 2013. Most of the Asian countries are likely to continue to run fiscal deficits. Lingering inflation concerns should also limit the space for further fiscal spending. For example, despite a very sharp economic slowdown, Singapore has resisted the temptation to launch major fiscal measures. Instead, it believes in policies to boost productivity over the long run.
6
9
12
15
Mar-0
1
Mar-0
2
Mar-0
3
Mar-0
4
Mar-0
5
Mar-0
6
Mar-0
7
Mar-0
8
Mar-0
9
Mar-1
0
Mar-1
1
Mar-1
2
Mar-1
3
Final demand Aggregate demand (GDP)
(% YoY)
ForecastInventory accumulation
Destocking
(2)02468
10
Jan-
03
Jan-
04
Jan-
05
Jan-
06
Jan-
07
Jan-
08
Jan-
09
Jan-
10
Jan-
11
Jan-
12
Jan-
13
(%) Estimate
1-year deposit rate, % p.a. CPI inflation, % YoY

2013 Outlook for Asia 4 January 2013
- 12 -
Keep an eye on the US Dollar However, if the US Dollar continues to strengthen, it would help reduce the inflation pressure on Asian economies, especially in the more industrialised northeast part of the region, and thus provide more space for easing in terms of both rate cuts and currency depreciation. Under such a scenario, the chance of a domestic-demand recovery would be higher. In our base case, however, we expect the US Dollar to be relatively flat compared with the current level throughout the whole year, as we do not see any strong catalysts to drive it either higher or lower. ASEAN: an oasis in the desert In our base-case scenario, we continue to favour ASEAN economies in 2013. They were resilient in 2012. The clear advantage is their ability to provide policy support to boost domestic demand at times when external demand tumbles. While Asia as a whole should see limited room for policy manoeuvre, the ASEAN countries are in a better position to maintain domestic demand because of their willingness and commitment to invest in infrastructure and development projects. The fortunes they have amassed (in many ways at the expense of the more industrialised Asian economies) could allow them to spend their way out of the difficult times for a few more years. Moreover, if the US Dollar were to weaken against the other major currencies, the ASEAN economies would continue to enjoy a terms-of-trade advantage over the industrialised economies. US Dollar index
Source: CEIC, Daiwa In the event that the US Dollar strengthened against the other major currencies in 2013, we would favour the more industrialised and more Dollar-centric Asian countries, including China, Korea, Taiwan, Hong Kong and Singapore. In this scenario, we would expect these economies to experience terms-of-trade improvements, lower import inflation pressure, and see more space for monetary easing and currency depreciation. All these factors might facilitate a domestic-demand recovery.
India’s sharp rate cuts to protect demand India’s economy has been quite problematic because of the country’s need to control inflation and deficits simultaneously. As growth slowed rapidly in 2012, the RBI was no longer under pressure to act aggressively to suppress inflation. We expect the RBI to be increasingly dovish over the course of 2013, and forecast the policy rate to be cut by 100bps over the year. A slowdown in GDP growth from 8.6% YoY for 1H11 to just 5.4% YoY for 9M12 can be seen almost as a hard-landing, in our view. The balance of risk between inflation and growth has started to tilt. The task for the RBI in 2013 is likely to be to protect growth rather than fight inflation. Regional growth should be mildly better YoY for 2013 Overall, we forecast Asia ex-Japan GDP growth to be mildly better, at 6.3% YoY for 2012 and 6.8% YoY for 2013. This compares with a FocusEconomics consensus forecast of 6.8% YoY for 2013. In this regard, we believe the consensus forecast is more or less in line with the fundamentals. While the space for policy excitement is likely to be less in 2013 than in 2012, the room for further growth scares should also be more limited. Barring any major negative developments globally, we forecast Asia ex-Japan economic growth to be 6.6% YoY for 2014, on the back of a slowdown in China from a long-term perspective. Asia ex-Japan: real GDP growth
Source: IMF, Daiwa forecasts
90
95
100
105
110
115
120
125
130
Nov-0
2Ma
r-03
Jul-0
3No
v-03
Mar-0
4Ju
l-04
Nov-0
4Ma
r-05
Jul-0
5No
v-05
Mar-0
6Ju
l-06
Nov-0
6Ma
r-07
Jul-0
7No
v-07
Mar-0
8Ju
l-08
Nov-0
8Ma
r-09
Jul-0
9No
v-09
Mar-1
0Ju
l-10
Nov-1
0Ma
r-11
Jul-1
1No
v-11
Mar-1
2Ju
l-12
Nov-1
2
(1997=100)
QE1+QE2
(4)(2)
02468
10121416
1999
2000
2001
2002
2003
2004
2005
2006
2007
2008
2009
2010
2011
2012
E
2013
E
2014
E
Forecasts(% YoY)

2013 Outlook for Asia 4 January 2013
- 13 -
Regional: GDP forecasts 2012E 2013E
(% YoY) Daiwa Consensus Daiwa Consensus Asia ex-Japan 6.3 6.3 6.8 6.8 China 7.8 7.7 8.4 8.1 Hong Kong 0.9 1.6 2.3 3.4 Taiwan 1.2 1.4 3.0 3.4 Korea 2.2 2.4 3.3 3.3 India 5.6 5.7 6.0 6.3 Singapore 1.3 2.0 3.0 2.9 Indonesia 6.2 6.2 6.2 6.2 Malaysia 5.2 4.8 5.3 4.9 Philippines 6.4 5.4 5.8 5.3 Thailand 6.0 5.3 4.8 4.5 Source: FocusEconomics, Daiwa forecasts
Note: Fiscal year for India
Region: CPI forecasts
2012E 2013E (% YoY) Daiwa Consensus Daiwa Consensus Asia ex-Japan 3.4 3.5 3.8 3.8 China 2.6 2.7 3.3 3.3 Hong Kong 4.1 4.0 3.5 3.9 Taiwan 2.0 1.9 1.5 1.8 Korea 2.2 2.3 2.8 2.8 India 7.5 7.6 6.5 6.5 Singapore 4.6 4.5 3.8 3.7 Indonesia 4.3 4.5 6.0 5.3 Malaysia 1.7 1.8 2.8 2.5 Philippines 3.3 3.3 4.0 3.9 Thailand 3.0 3.1 3.5 3.3 Source: FocusEconomics, Daiwa forecasts
Note: WPI data and fiscal year for India
Market-by-market macro outlook
China: a cyclical upturn As China’s economic recovery was likely to have started in 4Q12 and should last into 2Q13, we now boost our real GDP growth forecast for 2013 to 8.4% YoY (versus 8.0% YoY previously), from 7.8% YoY for 2012. We also expect the country’s new leaders to embark on a broad range of economic reforms in 2013, aiming to put the economy on a more sustainable path. However, we do not believe reforms will change the long-term downtrend in China’s GDP growth. China: annual real GDP growth (1981-2015)
Source: CEIC, Daiwa forecasts
Investment should be the key driver of economic growth again. The impact of the mini stimulus programme introduced in the summer of 2012 should become more obvious in 2013, underpinning infrastructure investment growth. Improved liquidity conditions for developers, due to strong sales and a loosened credit policy, should support a recovery in property investment growth. Meanwhile, consumption growth should remain solid and stable, as we expect income growth to maintain a high single-digit pace throughout this year. On the other hand, we expect net exports to make a small negative contribution to GDP growth, due to weakness in external demand from the EU and Japan. Contribution to real GDP growth
Source: CEIC, Daiwa forecasts
CPI inflation should rise steadily in 2013. Pork prices have stayed below/at the breakeven level since April 2012, and so we expect them to rise in 2013. Combined with a low base effect, the rises in pork prices and other food prices should push CPI inflation to 3.3% YoY for 2013E from 2.6% YoY for 2012E. Property prices should remain stable in 2013, with a bias towards the upside. However, prices are unlikely to rise sharply as long as the current purchase-restriction policy remains in place. Given our forecasts for GDP, CPI, and property prices, we expect mild policy tightening in 2H13. In particular, we expect two 25bp interest-rate hikes in the period, but the PBOC should keep the reserve requirement ratio unchanged. Meanwhile, fiscal policy should remain supportive of the economy. We now forecast the fiscal deficit to widen to 1.8% of GDP for 2013 from 1.5% for 2012. The government is likely to spend more on social welfare (such as education, healthcare, and pensions) as it focuses on improving the quality of life for people.
2
4
6
8
10
12
14
16
1981
1983
1985
1987
1989
1991
1993
1995
1997
1999
2001
2003
2005
2007
2009
2011
2013
E
2015
E
(% YoY) 6 years 7 years 8 years
(3)
0
3
6
9
12
1520
00
2001
2002
2003
2004
2005
2006
2007
2008
2009
2010
2011
2012
E
2013
E
2014
E
(pp)
Consumption Investment Net exports

2013 Outlook for Asia 4 January 2013
- 14 -
We expect the Renminbi to appreciate against the US Dollar in 2013, forecasting it to reach USD1:CNY6.10 by the end of the year. This is likely to be driven by trade and current-account surpluses, as well as net foreign direct investment inflows. CNY exchange rate against the US Dollar
Source: CEIC, Daiwa forecasts
We expect a lot of reforms to be introduced this year, judging by the recent encouraging comments from the new leaders. In our view, time is running out for China to embark on major economic reforms (eg, financial-market liberalisation, deregulation of the service sector, and the privatisation of state-controlled sectors), and the new leaders are aware of the urgency and complexity of the reforms. If such reforms are implemented successfully and in a timely manner, it would be very positive for China’s economy and the financial markets, in our view. Risks. Inflation and the shadow banking system are the key issues to watch. If there is unexpectedly bad weather or outbreaks of disease among livestock, CPI inflation could rise sharply, forcing policymakers to tighten more aggressively than we expect. In the financial sector, if some of the trust loans or wealth-management products were to default, the risks to the country’s shadow banking system could be exposed and spill over into the rest of the financial system and the economy.
China: key forecasts 1Q12 2Q12 3Q12 4Q12E 1Q13E 2Q13E 3Q13E 4Q13E 2012E 2013E 2014EReal GDP YoY % 8.1 7.6 7.4 8.1 8.5 8.7 8.5 7.9 7.8 8.4 7.5CPI YoY % 3.8 2.8 1.9 2.1 2.2 2.8 3.7 4.3 2.6 3.3 3.5PPI YoY % 0.1 (1.4) (3.3) (2.0) (0.2) (0.2) 2.1 2.7 (1.6) 1.1 3.6Fixed assets investment (nominal, YTD) YoY % 20.9 20.4 20.5 20.5 20.4 20.5 20.0 18.0 20.5 18.0 16.0Retail sales (nominal) YoY % 15.8 13.9 13.5 14.1 14.6 15.3 15.4 14.9 14.3 15.0 14.8Industrial production YoY % 11.5 9.5 9.1 9.7 9.9 10.3 10.1 9.8 9.9 10.0 9.0Exports YoY % 7.6 10.5 4.5 10.4 7.2 9.3 10.7 8.4 8.2 9.0 11.0Imports YoY % 6.9 6.4 1.4 1.8 9.0 12.0 13.0 12.0 4.0 11.0 13.0Trade balance USDbn 0.3 68.6 79.4 92.8 (2.5) 70.6 77.0 80.5 241 226 210 Exchange rate CNY/USD 6.29 6.32 6.28 6.23 6.20 6.15 6.12 6.10 6.23 6.10 6.00M2 YoY % 13.4 13.6 14.8 14.0 13.7 13.2 12.6 12.0 14.0 12.0 10.01-year base lending rate % pa 6.56 6.31 6.00 6.00 6.00 6.00 6.25 6.50 6.00 6.50 6.501-year deposit rate % pa 3.50 3.25 3.00 3.00 3.00 3.00 3.25 3.50 3.00 3.50 3.50Required reserve ratio % 20.0 19.5 19.5 19.5 19.5 19.5 19.5 19.5 19.5 19.5 19.5Current account balance % of GDP 2.6 2.2 1.9Foreign reserves USDtn 3.3 3.2 3.3 3.4 3.4 3.5 3.5 3.5 3.5 3.5 3.5Fiscal balance % of GDP (1.5) (1.8) (2.0)Source: CEIC, Daiwa forecasts
Hong Kong: market exuberance versus economic fundamentals A year ago, the FocusEconomics consensus forecast 2012 GDP growth of 4.5%. For 9M12, the result was just 1.0%, easily the biggest disappointment in the region. We expect the economy to end the year with just 0.9% growth (full year), implying another dip to 0.6% YoY for 4Q12E, on the back of weaker exports and retail sales. In our view, the consensus has significantly underestimated the impact of the three external shocks on a small open economy like Hong Kong, ie, the European debt crisis, China’s economic slowdown and QE-driven inflation. These three factors have hit
where it hurts – service exports (financial services, tourism, etc) and domestic consumption. Both were considered to be resilient. We expect exports (of goods and services) to benefit mildly from a cyclical recovery in China in 1H13, although the pain from G3 demand softness and European deleveraging is here to stay for now. Market sentiment in Hong Kong has been more positive. There is a clear disconnect with the fundamentals. The onset of QE3 and the Fed’s willingness to keep rates low seem to be keeping sentiment running high. This will probably continue in 2013. But this disconnect could spell problems in the longer term. Interest rates have been too low for too long. Households and companies have taken low rates
6.05
6.15
6.25
6.35
6.45
6.55
6.65
Jan-11 Aug-11 Mar-12 Oct-12 May-13 Dec-13
Reference rate (set by PBoC) Closing spot rate
Appreciation
Daily trading spread: from 0.5% to 1.0%
(CNY/USD)
Forecasts
2013 Outlook for Asia 4 January 2013
- 15 -
completely for granted. In this environment, risks will remain underpriced, probably for another 2-3 years. For the time being, the party will go on. But how long will it last? The Fed told us this would continue until the US employment rate falls below 6.5% and projected inflation rises above 2.5% YoY. With the US Dollar keeping firm given the current QE3 backdrop, we are less concerned about inflation pressure going forward. For 11M12, headline CPI was up 4.1% YoY, well short of our 4.8% full-year forecast. We now look for just 3.5% in 2013, down from our previous forecast of 4.0% YoY. Real interest rates are likely to remain negative, but probably less so than in 2012. Lower inflation pressures should also provide moderate relief to domestic consumption. Loans versus property prices
Source: CEIC, Daiwa
For these reasons, we now look for GDP growth to be 2.3% YoY for 2013, up from 2.0% previously. Other than the potential deterioration in the outlook for the G3, the main risk to our forecast stems from a mounting pressure to destock. Inventory has built up significantly over the past three years, in anticipation of very strong demand growth. On an accumulative basis, the size of the restocking has been close to 1.5% of GDP on average since 3Q09. Destocking only began in 3Q12 and is most likely to continue. We are mindful that the destocking factor could once again take GDP growth down and surprise the (FocusEconomics) consensus, which looks for 3.4% YoY growth for 2013.
Daiwa’s forecasts: Hong Kong 2010 2011 2012E 2013E 2014EReal GDP 7.1 5.0 0.9 2.3 3.0 CPI inflation 2.4 5.3 4.1 3.5 2.5 Exports 22.8 10.1 1.0 5.0 10.0 Imports 25.0 11.9 2.5 5.0 9.0 Trade balance, USDbn (43) (55) (63) (66) (67)Retail sales, value 18.3 24.8 9.3 9.8 9.0 Unemployment rate, s.a., end-of-period 3.7 3.1 3.5 3.8 3.8Current account balance, % of GDP 5.5 5.3 (2.0) (3.1) (3.4)Fiscal balance, % of GDP 4.3 3.9 (0.5) (0.9) (0.9)3-month Hibor, end-of-period 0.33 0.33 0.45 0.45 0.45 USD:HKD, end of period 7.77 7.80 7.75 7.76 7.80
Source: CEIC, Daiwa forecasts
Taiwan: structural tailwinds Sluggish private consumption would be the main downside risk to GDP growth besides global uncertainty. Private consumption growth was 0.9% YoY for 3Q12, the slowest pace since 3Q09. A weak labour market and stagnant income growth should be blamed for this, but the accumulated impact of inflation, especially when the pressure is concentrated on daily necessities such as food and utilities, is also hammering households’ real purchasing power. The depreciating trend of the Yen against the US Dollar should be another focus, even though we are not that concerned about Taiwan losing export share to Japanese firms. As Japan is Taiwan’s major supplier of key components, Yen depreciation would reduce import costs simultaneously. What worries us is the possibility that the Won could depreciate as well. If such a scenario were to occur, Taiwan would feel the impact of stronger competition from the Korean exporters (they compete head on with their Taiwanese counterparts). There could be some upside to growth as well. Given the closer cross-strait relationship between Mainland China and Taiwan, China’s rebound in 1H13E should help. Strong investment demand from the ASEAN countries should buffer Taiwan’s exports, which largely comprise capital goods. We forecast Taiwan’s export growth to pick up to 6% YoY for 2013. Meanwhile, the importance of Taiwan’s service sector is ever-increasing. In 2010, Taiwan’s service-account surplus was 6.3% of the overall current account surplus. This number surged to 10.3% for 2011, with Mainland tourists one of the main contributors. Going forward, besides tourism, we expect Renminbi-New Taiwan Dollar settlements and service-trade agreements implemented in 2013 to boost service trade flows across the straits.
(30)
20
70
120
170
220
0
1,000
2,000
3,000
4,000
5,000
6,000
1989
1990
1991
1991
1992
1993
1994
1995
1996
1997
1998
1999
2000
2001
2002
2002
2003
2004
2005
2006
2007
2008
2009
2010
2011
2012
(HKDbn) (1999=100)
Loans
Residential property price index

2013 Outlook for Asia 4 January 2013
- 16 -
Current account: services
Source: CEIC, Daiwa
Finally, policy support could help. Despite limited room for fiscal and monetary expansion, deregulation could lure investment. For example, we expect a free economic demonstration zone, with more relaxed laws on hiring, land acquisition and Mainland capital inflows, to be set up in 2013. This is more of a long-term project; however, we are still pinning hopes on its ability to attract investment in the near term. Although some buffers do exist, as a highly open economy with a lack of product-line diversity, any deterioration in global prospects could drag the island back to a recession. We forecast real GDP to grow by 1.2% YoY for 2012 and 3.0% YoY for 2013. Meanwhile, inflation should be tame, as the one-off utility-price adjustment effect dissipates and the high base effect kicks in. The Central Bank of China (CBC) is likely to resume its rate normalisation schedule as it sees more solid growth in 2013. And we expect the CBC to raise rates from 1.875% to 2.25% by the end of 2013.
Daiwa’s forecasts: Taiwan 2010 2011 2012E 2013E 2014EReal GDP 10.7 4.0 1.2 3.0 4.0 CPI inflation 1.0 1.4 1.9 1.5 1.9 Exports 34.8 12.3 (2.0) 6.0 7.0 Imports 44.1 12.0 (2.5) 6.5 8.5 Trade balance, USDbn 23.4 26.8 27.7 28.0 25.6 Current-account balance, % of GDP 9.3 8.9 9.2 8.7 7.8 Fiscal balance, % of GDP (3.3) (2.2) (2.1) (2.0) (1.8)Benchmark interest rate, end of period 1.625 1.875 1.875 2.25 2.75 USD:TWD, end of period 30.5 30.3 29.0 28.6 28.3Source: CIEC, Daiwa forecasts
Korea: some cyclical improvements Last year was not a good one for Korea. In our 2012 outlook, we highlighted that troubles from the G3 and China’s slowdown would present significant problems for the country. The consensus GDP forecast has been consistently cut from 3.9% to 2.4%. And the consensus is now looking for 3.3% YoY growth in 2013, which is broadly in line with our forecasts.
The key impediments for a recovery in Korea remain: 1) G3 and intra-Asia demand weaknesses, 2) a lack of policy stimulus, and 3) the negative impact of inflation pressures on domestic demand. These impediments have been dominant in 2012. However, we expect some cyclical improvements at least from: 1) a demand recovery in China, 2) lower inflation pressures helped by lower import prices, and 3) the accumulated impact of monetary-policy easing. We now expect the BOK to deliver one more 25bp interest-rate cut in January or February before keeping rates on hold for the rest of the year. On top of this, the current Yen depreciation against the US Dollar and other currencies could also present challenges for the Korean manufacturers. Yen strength has been a major cyclical force in the region for the past two years, and the Korean companies seem to have benefited from it. We project the Won to keep appreciating to 1,020 against the US Dollar until the end of 2013, representing about 5.2% appreciation over 2013. Nevertheless, the US Dollar trend itself is also important. If the US Dollar continues to slide against other currencies, we think it would still make sense for the Won to keep appreciating to protect its terms-of-trade position and vice versa if the US Dollar strengthens going forward.
Korea: Won strength can help protect purchasing power
Source: CEIC, Daiwa
As our base case is for the US Dollar to remain flat on a trade-weighted basis, we believe that any potential Yen depreciation would only reduce some of the pressure on the Won’s appreciation. For the time being, we are leaving our Won forecasts unchanged, as a relatively strong Won is still needed to reduce import inflation pressures, especially when crude-oil prices remain too high for the Koreans.
-3
-2
-1
0
1
2
3
Sep-9
8Ma
r-99
Sep-9
9Ma
r-00
Sep-0
0Ma
r-01
Sep-0
1Ma
r-02
Sep-0
2Ma
r-03
Sep-0
3Ma
r-04
Sep-0
4Ma
r-05
Sep-0
5Ma
r-06
Sep-0
6Ma
r-07
Sep-0
7Ma
r-08
Sep-0
8Ma
r-09
Sep-0
9Ma
r-10
Sep-1
0Ma
r-11
Sep-1
1Ma
r-12
Sep-1
2
(USDm) Open for Chinese tourism
Signature of ECFA
50
60
70
80
90
100
Mar-0
2Se
p-02
Mar-0
3Se
p-03
Mar-0
4Se
p-04
Mar-0
5Se
p-05
Mar-0
6Se
p-06
Mar-0
7Se
p-07
Mar-0
8Se
p-08
Mar-0
9Se
p-09
Mar-1
0Se
p-10
Mar-1
1Se
p-11
Mar-1
2Se
p-12
(Jan 02 = 100) Ter ms of tr ade index
Weak USD
Strong USD
Weak USD

2013 Outlook for Asia 4 January 2013
- 17 -
We now look for GDP growth to be 3.3% YoY for 2013, a tad lower than our previous 3.5% forecast. Compared with our forecast of 2.2% for 2012, our forecast still points to a modest cyclical improvement for 2013 on the back of China’s demand recovery and a better inflation profile for the economy. We are cutting our CPI inflation forecast from 3.8% to 2.8% for 2013.
Daiwa’s forecasts: Korea
2010 2011 2012E 2013E 2014EReal GDP 6.3 3.6 2.2 3.3 4.0 CPI inflation 2.9 4.0 2.2 2.8 2.5 Exports 28.3 19.0 (0.9) 6.0 12.0 Imports 31.6 23.3 (0.5) 5.9 11.0 Trade balance, USDbn 41.2 30.8 28.4 30.7 39.9 Current account balance, % of GDP 2.9 2.3 2.2 2.1 2.6 Fiscal balance, % of GDP 1.4 1.5 (0.5) (0.6) 0.0 Policy rate, end of period 2.50 3.25 2.75 2.50 3.00USD:Won, end of period 1,135 1,152 1,064 1,020 1,000 Source: CEIC, Daiwa forecasts
India: when doves fly For FY12/13, the consensus GDP forecast has been cut from 7.8% YoY a year ago to just 5.7% now. In our view, India’s growth-inflation dynamic has started to change, with rising downside risks to growth. GDP growth decelerated from 9.2% YoY for 1Q11 to 5.4% YoY for 9M12, which could arguably be described as a hard-landing. The slowdown in investment demand has been acute. Poor external demand and crude oil-price rises have adversely affected net exports. Industrial growth has been more or less stagnant for four quarters. The economy seems to be operating significantly below its potential. The Reserve Bank of India’s (RBI) baseline GDP projection was recently cut from 6.5% YoY to 5.8% YoY for FY12/13, just above our 5.6% YoY forecast. For 1H FY12/13, GDP growth reached just 5.4%, undershooting this projection. To satisfy this assumption, growth needs to be 6.2% YoY for 2H FY12/13, which should be very difficult to achieve without any policy support. In its latest policy assessment, the RBI attributed the slowdown to several factors, including ‘monetary tightening’. This kind of assessment has been rare in the past, because the RBI seemed to believe that aggregate demand was too strong, to which tightening was a necessary policy response. Since April 2012, the RBI has shifted its policy stance to more ‘calibrated easing’, through a 50bp cut in the policy rate (repo) and two 25bp reductions in the cash reserve ratio (CRR). It has not been prepared for more pervasive easing, mainly due to lingering concerns about inflation.
Inflation pressure should be about to ease. The headline Wholesale Price Index (WPI) moderated from its peak of 10.9% YoY in April 2010, to an average of 7.6% YoY for January-November 2012 (and 7.2% YoY for November). In the short term, the RBI is still under the pressure to manage the effects from energy price increases, poor harvests, wage rises, and household inflation expectations. However, it believes inflation should start easing in 1Q13, amid slower growth, capacity underutilisation in some sectors, and stability in global commodity prices. We look for headline WPI to fall further to 7.0% YoY over the next 3 months and to 6.5% YoY on average for FY13/14. On top of this, the RBI can also take comfort from a mild improvement in the current-account deficit in 2Q12 and some improvement in the projected fiscal deficit.
India: policy interest rate (repo)
Source: CEIC, Daiwa
We forecast a 25bp rate cut in 1Q13, followed by three more 25bp cuts over 2013. We now forecast the policy rate to drop from 8.0% to 7.0% over 2013. We believe a progressively dovish RBI could help arrest some of the growth slowdown, giving investment demand, in particular, much-needed relief. As such, while our FY12/13 GDP forecast remains 5.6% YoY, we recently raised our FY13/14 forecast to 6.0% from 5.8%.
Daiwa’s forecasts: India 10/11 11/12 12/13E 13/14E 14/15EReal GDP 8.4 6.5 5.6 6.0 6.5WPI inflation 9.6 9.0 7.5 6.5 6.0Exports 42.3 21.4 (4.0) 9.0 14.0Imports 22.3 32.2 (3.0) 4.0 8.0Trade balance, USDbn (119) (184) (182) (174) (169)Current account balance, % of GDP (2.7) (4.2) (4.9) (3.8) (2.8)General fiscal balance, % of GDP (4.9) (5.8) (5.8) (5.3) (4.8)Policy rate, end of period 6.75 8.50 7.75 7.00 6.75INR:USD, end of period 44.9 50.4 54.7 58.0 58.0Source: CEIC, Daiwa forecasts
0123456789
10
Apr-0
5Au
g-05
Dec-0
5A p
r-06
Aug-0
6De
c-06
A pr-0
7Au
g-07
Dec-0
7A p
r-08
Aug-0
8De
c-08
A pr-0
9Au
g-09
Dec-0
9A p
r-10
Aug-1
0De
c-10
A pr-1
1Au
g-11
Dec-1
1A p
r-12
Aug-1
2De
c-12
Apr-1
3Au
g-13
Dec-1
3
(% )Daiwa's forecast

2013 Outlook for Asia 4 January 2013
- 18 -
ASEAN: in the midst of a long-term upturn Robust domestic demand has shielded most of the ASEAN economies from the global downturn in 2012. For 2013, we still see plenty of cushions. Private consumption has been resilient, thanks to stable growth in real income and on-going urbanisation. Low-income members of ASEAN have become another ideal production base for labour-intensive manufacturing, which has triggered acceleration in public investment in infrastructure and attracted private and foreign investment in manufacturing. Most ASEAN economies still have plenty of room for fiscal expansion, as their fiscal deficits are well within control (mostly below 2% of GDP), and their debt-to-GDP ratios remain below 60%. ASEAN: fiscal balance as a % of GDP (2011)
Source: CEIC, Daiwa
China’s restocking cycle in the coming quarters is likely to bolster ASEAN members that are more exposed to commodity exports (such as Malaysia and Indonesia). Moreover, if the US Dollar weakens and if the weakness drives up commodity prices, these ASEAN economies will benefit from better terms of trade. Nevertheless, Japan’s lethargic demand for commodities, exacerbated by the depreciation of the Yen against the US Dollar if the trend continues, could be a downside risk, as Japan still consumes more than 10% of ASEAN’s exports. Although China’s recovery is likely to mitigate the shock, the uncertainties should increase in 2H13 when China starts to tighten its policy. Overall, economic growth in most ASEAN countries should remain robust in 2013. Inflation pressure is likely to increase across the region on the back of strong credit growth and rising wages. We expect most of the ASEAN central banks to turn hawkish and hike interest rates by 25-50bps in 2013.
Indonesia Robust domestic demand should support our GDP growth forecast at 6.2% YoY in 2013 (largely unchanged), the same as in 2012. But an indicator to watch is the 2012 current-account balance, which is likely to have ended up in a deficit, at 2.4% of GDP. We expect the deficit to remain and to narrow, as rising commodity exports (possibly at higher prices) should more than offset increased imports for domestic consumption and investment. However, given that 16.6% of its exports were shipped to Japan in 2011, a higher exposure than its ASEAN neighbours (around 10%), weaker-than-expected demand from Japan could pose a downside risk to our forecast. Due to its high short-term external debt to FX reserves ratio (38.1% as at the end of 3Q12), if Indonesia’s current-account deficit were to widen, this could increase the volatility of the IDR and hurt investor confidence. Malaysia An expansive fiscal policy and acceleration in infrastructure investment should provide considerable support to the economy in 2013. A 4% fiscal deficit, set in ‘Budget 2013 Malaysia’, should create a spill-over effect not only for consumption but also for investment activities. For example, a one-off RM250 cash hand-out to low income households and some tax relief could boost private consumption. Tax incentives for private corporates in the oil and gas industry and more support on financing to SMEs should encourage private investment. The projects under the Economic Transformation Programme (ETP) announced in November 2012, with investment totalling RM26.1bn, should underpin public investment. Therefore, we expect strong domestic demand to push up our real GDP growth forecast to 5.3% YoY in 2013 (versus 4.8% YoY previously), from 5.2% in 2012. The Philippines Due to its export structure, the Philippines is less exposed to commodity exports. As such, the economy moves more closely with the global electronics cycle, which makes it more vulnerable to demand shocks from the US and Europe, and means it will benefit less from China’s recovery in 2013. Due to a high base for 1Q13, YoY real GDP growth is likely drop below 6% YoY as the new year starts. That said, due to the fact that the services sector accounts for a large share of GDP (56.4% in 2011), the economy should maintain robust growth as long as the service industries (such as business-process outsourcing) continue to do well. Meanwhile, overseas-worker remittances have been holding up well despite the global economic slowdown. With strong private consumption growth and aggressive
1.3
-1.1 -1.4-2.0
-5.0-6.0
-5.0
-4.0
-3.0
-2.0
-1.0
0.0
1.0
2.0
Singapore Indonesia Thailand Philippines Malaysia
(% of GDP)

2013 Outlook for Asia 4 January 2013
- 19 -
fiscal expansion, we now forecast the economy to grow by 5.8% YoY in 2013 (versus 4.5% YoY previously), which compares with 6.4% YoY in 2012. Thailand Despite a high base (due to a surge in post-flood reconstruction activities in 1H12), we now forecast Thailand’s real GDP to grow by 4.8% YoY in 2013 (up from 4.2% YoY previously), thanks to continued efforts in post-flood reconstruction, an export recovery and aggressive fiscal policy aimed at pushing up investment. Similar to the Philippines, Thailand is also more exposed to weaknesses in developed economies as it relies more on exports of manufacturing products than commodities. Hence, it is likely to benefit less from an economic recovery in China in 2013 than Malaysia or Indonesia will do. In addition, political risk is something that investors need to watch out for in 2013, as was the case in the past few years.
Singapore As an international financial and trade centre, Singapore’s economy is more open and more exposed to global demand shocks and financial turmoil. Being the most export-dependent economy in the region (228% of GDP in 2011) and with high exposure to the EU banks, Singapore is set to face another challenging year as the EU enters another year of recession, and Japan and the US continue to deliver sluggish growth. The good news is that the recovery in China and resilient growth in its ASEAN neighbours should help offset the downward pressure from the developed economies. Therefore, we now forecast a rebound in real GDP growth to 3.0% YoY in 2013 (versus 2.5% YoY previously), from 1.3% YoY in 2012.
Daiwa forecasts: ASEAN
GDP (% YoY) CPI (% YoY) Fiscal balance % of GDP 2011 2012E 2013E 2014E 2011 2012E 2013E 2014E 2011 2012E 2013E 2014E
Singapore 4.9 1.3 3.0 4.5 5.3 4.6 3.8 3.0 1.3 1.0 1.2 1.3Indonesia 6.5 6.2 6.2 6.4 5.4 4.3 6.0 5.0 (1.1) (2.0) (1.5) (1.2)Malaysia 5.1 5.2 5.3 5.5 3.2 1.7 2.8 3.5 (5.0) (5.0) (4.2) (4.0)Philippines 3.9 6.4 5.8 6.5 4.7 3.3 4.0 4.5 (2.0) (2.6) (2.2) (2.0)Thailand 0.1 6.0 4.8 5.0 3.8 3.0 3.5 4.0 (1.4) (3.0) (3.0) (2.5)Source: CEIC, Daiwa forecasts
Daiwa forecasts: ASEAN
Current account balance % of GDP Policy rate (%, end of period) Exchange rate (end of period) 2011 2012E 2013E 2014E 2011 2012 2013E 2014E 2011 2012 2013E 2014E
Singapore 21.9 16.0 15.0 18.0 - - - - 1.30 1.20 1.18 1.15Indonesia 0.2 (2.4) (1.8) (0.7) 6.00 5.75 6.25 7.00 9,068 9,637 9,200 9,000Malaysia 11.0 5.3 6.8 9.5 3.00 3.00 3.25 3.75 3.18 3.06 2.90 2.80Philippines 3.2 2.6 2.5 2.4 4.50 3.50 4.00 4.50 43.9 41.1 39.0 38.0Thailand 1.7 0.7 0.5 1.0 3.25 2.75 3.25 3.75 31.7 30.6 29.5 29.0Source: CEIC, Daiwa forecasts

2013 Outlook for Asia 4 January 2013
- 20 -
Market outlook for 2013 Pranab Kumar Sarmah, CFA (852) 2848 4441 ([email protected]) Alan Chan, CFA (852) 2848 4970 ([email protected]) Daiwa’s end-2013E index targets and valuations Index target
Index Daiwa's Range Upside (%) EPS growth (%) PER (x) PBR (x) Based on historical PER Based on historical PBR (31/12/2012) End-2013E target 2012E 2013E 2013E 2013E Average +1SD -1SD Average +1SD -1SDMSCI Asia ex-Japan 466 530 425-580 14 8.6 13.8 10.9 1.50 517 589 445 526 638 415Hang Seng 22,656 24,800 22,000-28,000 9 -1.9 7.2 11.0 1.36 26,852 31,896 21,809 28,709 35,129 22,290KOSPI 1,997 2,300 1,870-2,400 15 27.2 20.2 9.5 1.01 1,880 2,170 1,591 2,117 2,476 1,759TAIEX 7,699 7,800 7,000-8,600 1 3.5 29.0 14.7 1.52 7,009 8,423 5,594 8,255 9,244 7,266SENSEX 19,435 21,800 18,000-24,800 12 10.2 14.4 14.0 2.30 21,325 24,807 17,844 23,699 29,103 18,294
Source: Thomson Reuters, Daiwa forecasts
We expect a rally of about 15% from current levels We forecast an increase of about 15% in the MSCI Asia ex-Japan Index in 2013 after its 18% rally in 2012. Our economics team forecasts GDP growth for Asia ex-Japan of 6.8% YoY for 2013 (up from 6.3% YoY for 2012), which is in line with the consensus forecast, and therefore, we believe the consensus index earnings growth forecast of 13.8% YoY for 2013 is achievable. We also expect a rerating in the index to at least its mid-cycle PER valuation of 12.1x, due mainly to our expectation of a rerating of deep cyclical sectors in early 2013 and the impact of QE3. MSCI Asia markets: real GDP growth (2010-13E) Year to 31-Dec 2010 2011 2012E 2013EAsia ex-Japan 9.3 7.3 6.3 6.8China 10.4 9.2 7.8 8.4Hong Kong 7.1 5.0 0.9 2.3India* 8.4 6.5 5.6 6.0Korea 6.3 3.6 2.2 3.3Singapore 14.8 4.9 1.3 3.0Taiwan 10.7 4.0 1.2 3.0
Source: CEIC, Daiwa estimates and forecasts Note: fiscal year to end-March for India
Our economists’ GDP growth forecasts for 2013 are higher than those of the consensus for China and most ASEAN countries, but lower for Hong Kong, India, and Taiwan. By country, China, Korea, Singapore, Hong Kong and India are trading at a discount while the Indonesia, Philippines, and Thailand are trading at a premium to the historical PER valuations of the respective indices. We expect a rerating of the China
market to continue to early 2013 before slowing down by mid-2013. MSCI Asia markets: premium/(discount) to historical PER (by country)
Source: Thomson Reuters
The MSCI Asia ex-Japan Index rose by 18% in 2012, the fifth-highest yearly gain over the past 10 years. Among the larger markets, the outperformers in 2012 were India, Hong Kong and Singapore, while the underperformers were Korea, Taiwan and China. The smaller ASEAN markets experiencing a structural recovery, such as Thailand and the Philippines, also outperformed the index substantially, while the markets that rely on commodity prices, such as Indonesia and Malaysia, underperformed the MSCI Asia ex Japan Index.
(30%)(25%)(20%)(15%)(10%)(5%)
0%5%
10%15%20%
MSC
I Phi
lippi
nes
MSC
I Ind
ones
ia
MSC
I Tha
iland
MSC
I Tai
wan
MSC
I Mal
aysi
a
MSC
I Hon
g Ko
ng
MSC
I Sin
gapo
re
MSC
I Asi
a x
Japa
n
MSC
I Ind
ia
MSC
I Kor
ea
MSC
I Chi
na

2013 Outlook for Asia 4 January 2013
- 21 -
MSCI Asia x Japan, China, Korea, Taiwan, India - 2012 Performance (Rebased to 100)
MSCI Asia x Japan, Singapore, Philippines, Indonesia, Thailand - 2012 Performance (Rebased to 100)
Source: Bloomberg Source: Bloomberg
Earnings growth looks set to accelerate modestly in 2013 As our economics team expects GDP growth in Asia ex-Japan to be stronger in 2013 than in 2012, most major markets in Asia should see accelerating earnings growth in 2013. We would expect stock markets that host cyclical stocks, such as Hong Kong/China and tech-heavy Taiwan, to see strong earnings recoveries this year. MSCI Asia markets: EPS growth (YoY %)
Year to 31-Dec 2010 2011 2012E 2013EMSCI Asia ex-Japan 36.1 -1.4 8.6 13.8China 34.3 10.8 0.8 9.8Hong Kong 32.3 23.7 -12.4 10.6India* 23.0 7.0 9.9 14.6Korea 41.6 -15.9 32.0 19.0Singapore 26.8 -2.3 6.1 3.3Taiwan 55.8 -27.5 6.0 23.6Source: Thomson Reuters Note: * fiscal year to end-March for India
We expect the MSCI Hong Kong Index to enter into positive earnings-growth territory in 2013, post a decline in earnings for 2012E. Korea is the only market whose earnings-growth momentum looks set to slow in 2013, in our view, due to 2012’s high earnings base for index-heavy companies such as SEC, Hyundai Motor, POSCO etc., and the Won’s relative strength over the Yen. Earnings revision momentum has turned positive for the Taiwan market since November 2012, as year-end demand for electronics products in the West was healthy. However, a question-mark hangs over whether there will be further upward earnings revisions due to the anaemic economic growth of the US and continued headwinds from the European market.
Rerating likely in 1H13 We expect a moderate rerating of the MSCI Asia ex-Japan Index, from an FY13 PER of 11x to an FY13 PER of more than 12x in 2013, based on the consensus forecasts, as the impact of QE3 is felt and an earnings recovery takes hold in cyclical sectors, such as property, building materials, coal, steel, and banks. Our steel analyst, Joey Chen expects Chinese steel companies to have started achieving a small profit from 4Q12, after recording losses for four consecutive quarters. Two markets – mainly Taiwan and Korea – which underperformed the MSCI Asia-ex Japan in 2012 look fairly valued following the December rally, and we may not see any meaningful rerating for those two markets. MSCI Asia-ex-Japan: Banks, Materials and Real Estate – PBR
Source: Thomson Reuters
Sector valuations and earnings revisions Within the MSCI Asia ex-Japan Index, banks, the consumer discretionary, IT, real estate, industrials and energy sectors are all trading at forward PERs that are at deep discounts to their past-eight-year averages, while the defensive sectors, ie. consumer staples, healthcare and telecoms are trading at premiums. Interestingly, materials, also a cyclical sector, is trading at premium to its past-eight-year average PER
80
90
100
110
120
130
140
Jan-12 Mar-12 May-12 Jul-12 Sep-12 Nov-12MSCI Asia x Japan MSCI China MSCI Korea
MSCI Taiwan MSCI India
80
90
100
110
120
130
140
Jan-12 Mar-12 May-12 Jul-12 Sep-12 Nov-12MSCI Asia x Japan MSCI Singapore MSCI Philippines
MSCI Indonesia MSCI Thailand
0.00.51.01.52.02.53.03.5
Jan-0
6
Jul-0
6
Jan-0
7
Jul-0
7
Jan-0
8
Jul-0
8
Jan-0
9
Jul-0
9
Jan-1
0
Jul-1
0
Jan-1
1
Jul-1
1
Jan-1
2
Jul-1
2
Banks Materials Real Estate
(x)

2013 Outlook for Asia 4 January 2013
- 22 -
following a recent rerating. During the past three months, the earnings revision cycle has turned negative for telecoms, utilities and consumer staples. Among the cyclical sectors, the property sector has seen significant upward revisions to earnings forecasts in past three months. We expect to see upward earnings-forecast revisions for industrials and financials in the coming months, especially during the 4Q12 earnings-announcement period from January to March. Our economics team expects a continuous recovery in Asia (ex-Japan) GDP until 2Q13.
MSCI Asia markets: premium/(discount) to historical PER (by sector)
Source: Thomson Reuters
MSCI Asia-ex-Japan: PER trend MSCI Asia-ex Japan: PBR trend
Source: Thomson Reuters Source: Thomson Reuters
MSCI Asia-ex Japan: earnings-revision cycle
Source: Thomson Reuters
(30%)(25%)(20%)(15%)(10%)
(5%)0%5%
10%15%20%
Cons
umer
Stap
les
Mater
ials
Healt
hcare
Telec
oms
Utilit
ies
Energ
y
Indus
trials
Real
Estat
e IT
Cons
umer
Disc
retion
ary
Bank
s
5
7
9
11
13
15
17
Jan-0
6
Jul-0
6
Jan-0
7
Jul-0
7
Jan-0
8
Jul-0
8
Jan-0
9
Jul-0
9
Jan-1
0
Jul-1
0
Jan-1
1
Jul-1
1
Jan-1
2
Jul-1
2
12-mth forward PER ratio Mean1+STDV 1-STDV
(x)
0.0
0.5
1.0
1.5
2.0
2.5
3.0
Jan-0
6
Jul-0
6
Jan-0
7
Jul-0
7
Jan-0
8
Jul-0
8
Jan-0
9
Jul-0
9
Jan-1
0
Jul-1
0
Jan-1
1
Jul-1
1
Jan-1
2
Jul-1
2
12-mth forward PBR ratio Mean1+STDV 1-STDV
(x)
(24)(20)(16)(12)
(8)(4)
048
12
Mar-0
6Ju
n-06
Sep-0
6De
c-06
Mar-0
7Ju
n-07
Sep-0
7De
c-07
Mar-0
8Ju
n-08
Sep-0
8De
c-08
Mar-0
9Ju
n-09
Sep-0
9De
c-09
Mar-1
0Ju
n-10
Sep-1
0De
c-10
Mar-1
1Ju
n-11
Sep-1
1De
c-11
Mar-1
2Ju
n-12
Sep-1
2De
c-12
(%)
2013 Outlook for Asia 4 January 2013
- 23 -
Hong Kong/China market
Pranab Kumar Sarmah, CFA (852) 2848 4441 ([email protected]) Alan Chan, CFA (852) 2848 4970 ([email protected])
Hang Seng Index: expect 24,800 by end-2013E (range 22,000-28,000) We expect the Hong Kong and China markets to rally further in the months ahead, driven by an earnings recovery and a rerating from the wall of liquidity. The Thomson Reuters consensus forecast implies 7.2% YoY growth for the HSI for 2013 after an earnings decline for 2012E. We believe the fair value of the index will be below its past-eight-year average PER, as its 2013E EPS growth looks set to lag that of the MSCI Asia-ex Japan Index. Our year-end index target is 24,800, equivalent to a PER of 12.0x (an 8% discount to its past-eight-year average), based on the 2013 consensus EPS forecasts. We look for a trading range of 22,000-28,000, which is near +/- 1SD its forward PBR, and expect the index to peak by mid-2013. Cyclical recovery should outweigh defensives in early 2013 We expect a strong rebound in the Hong Kong and China equity markets in 1H13, backed by a cyclical recovery in China up to mid-2013, driven in turn by restocking activity and the lagged effects of policy easing. Starting from 3Q13, our economics team expects China to embark on a round of mild policy tightening (two 25bp rate hikes) to assuage renewed concerns about inflation; this could lead to fund flows into defensive sectors around mid 2013. Shipping, materials, property and banks Despite a stock-market recovery for these cyclical sectors in 4Q12, most cyclical sectors are trading currently at a PBR discount to their mid-cycle valuations. We like shipping and building materials companies in view of capacity discipline amid moderate demand growth that we envisage for 2013, large banks for their rational pricing despite slowing loan growth, and regional quality property companies which are trading currently at discounts to NAV. In order to boost the economy, China is expanding fixed asset investment in rail, subways, public housing, etc., which should benefit those construction companies that are linked to such infrastructure projects.
In the energy space, we think Chinese oil and gas companies are cost-competitive in a global context, but that this is not so for the coal companies. Daiwa’s scenario of accelerating GDP growth in China in early 2013, low OPEC spare capacity and a weak US dollar, stand to support oil prices in 2013. In the coal space, investment opportunities look limited to companies with high exposure to spot prices, as we expect a near-term convergence of spot and contract prices. After the strong rally in share prices for the auto sector last year, 2013 is likely to be a less eventful year. We forecast 10-12% YoY sales-volume growth for passenger vehicles for 2013, backed by rising demand from inland areas. We would advise investors to lower their exposure to companies with ageing fleet models and to be selective when it comes to stock-picking. China gas and mobile Internet enablers: secular stories Among the various utilities sub-sectors, gas demand did not slow in past decade and we expect full gas price reform in 2013, leading to tariff rises for consumer and industrial customers. We therefore are bullish on China gas and related companies. Still, we plan to revisit other defensive sectors, such as telecoms, IPPs, etc., in mid-2013, if we see signs of a slowing economy in China then. In the tech space, we look for secular growth stories around mobile Internet and e-commerce to be the key investment themes. Launches of more low-priced smartphones in China in 2013 would provide a major boost to the use of mobile internet. Overall demand for PCs and handsets has matured in China, and we therefore see the investment theme being related to mobile Internet and low-priced China smartphones. China is a key theme for Hong Kong names as well In Hong Kong and Macau, we would focus on companies that would benefit from a recovery in China, namely, property and bank names with solid China franchises. For Macau gaming names, the focus is likely to be on execution, and we would expect companies with superior table-optimisation capabilities to outperform their peers.

2013 Outlook for Asia 4 January 2013
- 24 -
Hang Sang Index: 12-month forward PER Hang Sang Index: 12-month forward PBR
Source: Bloomberg Source: Bloomberg
Hang Sang Index: earnings revision index
Source: Bloomberg
579
11131517192123
Jan-0
6Ma
y-06
Sep-0
6Ja
n-07
May-0
7Se
p-07
Jan-0
8Ma
y-08
Sep-0
8Ja
n-09
May-0
9Se
p-09
Jan-1
0Ma
y-10
Sep-1
0Ja
n-11
May-1
1Se
p-11
Jan-1
2Ma
y-12
Sep-1
212-mth forward PER ratio average +1sd -1sd
(x)
0.00.51.01.52.02.53.03.5
Jan-0
6Ma
y-06
Sep-0
6Ja
n-07
May-0
7Se
p-07
Jan-0
8Ma
y-08
Sep-0
8Ja
n-09
May-0
9Se
p-09
Jan-1
0Ma
y-10
Sep-1
0Ja
n-11
May-1
1Se
p-11
Jan-1
2Ma
y-12
Sep-1
2
12-mth forward PBR ratio average +1sd -1sd
(x)
-80%
-60%
-40%
-20%
0%
20%
40%
60%
80%
Jan-0
6Ma
y-06
Sep-0
6Ja
n-07
May-0
7Se
p-07
Jan-0
8Ma
y-08
Sep-0
8Ja
n-09
May-0
9Se
p-09
Jan-1
0Ma
y-10
Sep-1
0Ja
n-11
May-1
1Se
p-11
Jan-1
2Ma
y-12
Sep-1
2

2013 Outlook for Asia 4 January 2013
- 25 -
Korea market
Chang H. Lee (82) 2 787 9177 ([email protected])
KOSPI: expect 2,300 by end-2013E (range 1,870-2,400) Over 2012 the KOSPI rose by 9.38% to 1,997.05 points, following an 11% drop over 2011. The electronics, utilities, and F&B sectors had all meaningfully outperformed the benchmark through the end of December, while the machinery and construction sectors had substantially underperformed. Earnings growth set to remain healthy in 2013 In 2013, we see the KOSPI breaking out of the 1,780-2,000 trading range in 2012, backed by strong earnings growth of 20.2% YoY for 2013, as forecast by the Thomson Reuters consensus. In addition, the Korea stock market looks attractive compared with other markets in the region, trading currently at a 12-month forward PBR of 1.0x and 12-month forward PER of 9.5x, respectively. We forecast the KOSPI to rise by 15% over 2013 We forecast the KOSPI to trade in a range of 1,870-2,400 this year, and arrive at our year-end 2013 KOSPI target level of 2,300, which is based on its 12-month forward PBR trend and assuming mean reversion to the past-eight-year average PBR, as we expect a relatively benign global economic outlook (our year-end target is also equivalent to a 11.0x target PER). The reason for basing our forecast KOSPI range for 2013 on PBR rather than its historical PER is that the PER is more volatile to earnings changes than the PBR. Most of the time in the past, the consensus earnings forecasts have been most optimistic before the start of a new year.
IT sector and China consumption plays should outperform Given the economic outlook of our economists – which calls for: 1) China’s economy to recover faster than the market expects during 1H13, 2) the Eurozone to be stable until the debts extended to Spain and Italy start to mature from the end of 2Q13, and 3) US GDP growth to be stable despite the potential risk associated with the ‘fiscal cliff’ – we believe that both the KOSPI and the Won will be strong this year, backed by foreign money inflows. History shows that a strong Won is associated with a strong performance by the KOSPI. In our view, the IT sector, led by Samsung Electronics, and the China consumption plays, should see relatively better share-price performances than their peers this year. Won vs. Yen rate critical for share-price performance for a few sectors The new government in Korea may implement policies to enable the Won to strengthen against the US Dollar and the Yen, and cut interest rates as a means to improve domestic consumption and alleviate the interest payment burden on households. We would see the lowering of interest rates in 2013 as having a positive impact on the stock market, as money would then start to move from bonds back to equities. However, should Korea’s new government favour a strong Won policy, this could pose a risk to the economy, especially if the degree and speed of Won appreciation, particularly against the Yen, were exacerbated by the Abe administration’s avowed policy of a weaker Yen. Under such a scenario, the construction, shipbuilder, and auto stocks could face strong challenges from Japanese companies. Given the high dependence of Korea’s economy on global trade, a benign and improving global economic outlook should lead to both a strong KOSPI and a strong Won. However, any event that undermines such an outlook could weigh on the upside to the KOSPI.

2013 Outlook for Asia 4 January 2013
- 26 -
KOSPI: 12-month forward PER KOSPI: 12-month forward PBR
Source: Bloomberg Source: Bloomberg
KOSPI: earnings revision index
Source: Bloomberg
4
6
8
10
12
14
Jan-0
6Ma
y-06
Sep-0
6Ja
n-07
May-0
7Se
p-07
Jan-0
8Ma
y-08
Sep-0
8Ja
n-09
May-0
9Se
p-09
Jan-1
0Ma
y-10
Sep-1
0Ja
n-11
May-1
1Se
p-11
Jan-1
2Ma
y-12
Sep-1
212-mth forward PER ratio average +1sd -1sd
(x)
0.5
0.7
0.9
1.1
1.3
1.5
1.7
Jan-0
6Ma
y-06
Sep-0
6Ja
n-07
May-0
7Se
p-07
Jan-0
8Ma
y-08
Sep-0
8Ja
n-09
May-0
9Se
p-09
Jan-1
0Ma
y-10
Sep-1
0Ja
n-11
May-1
1Se
p-11
Jan-1
2Ma
y-12
Sep-1
2
12-mth forward PBR ratio average +1sd -1sd
(x)
-50%-40%-30%-20%-10%
0%10%20%30%40%
Jan-0
6Ma
y-06
Sep-0
6Ja
n-07
May-0
7Se
p-07
Jan-0
8Ma
y-08
Sep-0
8Ja
n-09
May-0
9Se
p-09
Jan-1
0Ma
y-10
Sep-1
0Ja
n-11
May-1
1Se
p-11
Jan-1
2Ma
y-12
Sep-1
2

2013 Outlook for Asia 4 January 2013
- 27 -
Taiwan market
Mark Chang, CFA (886) 2 8758 6245 ([email protected]) TAIEX: expect 7,800 by end-2013E (range 7,000- 8,600) The TAIEX ranked ninth among the major indices globally in terms of performance over 2012, with an increase of only 1%. Our index target for year-end 2013 of 7,800 is equivalent to a PER of 14.7x, based on the Thomson Reuters consensus EPS forecasts. The key reasons why we see upside are: 1) likely government support, 2) treasury stock buybacks by listed companies, 3) increased liquidity in the economy, with M1B growth expected by Daiwa to exceed that for M2, and 4) a rise in market liquidity. We would be much more positive if more fundamental factors showed signs of a recovery, in addition to these non-fundamental factors. Market support mechanism On 22 November 2012, the Taiwan Government said that 7,000 should mark the bottom of the TAIEX. As the TAIEX was trading at just 1.5% above that level on that day, at 7,106, this resulted in a positive response (the market rose by 7% over the rest of month). Another driver for the TAIEX was the announcements
of share buybacks by companies. In November, a total of 37 companies announced buybacks, one of the highest monthly levels in 2012. Leading indicators and liquidity are turning positive for Taiwan’s export orders (a 1-3 month leading indicator for exports,) which surged by 11.1% YoY for November, with orders increasing from most trading partners. Average daily turnover on the TAIEX increased by 38% between 23 November and the end of December compared with the average for the preceding five-week period after the government announced that 7,000 would mark the bottom of the market, implying potential support from government funds. The average daily turnover post the government’s announcement was 40% more than that at the start of November. Still cautious on the macro front Fundamentally, we remain cautious on the Taiwan economy. Daiwa economist Christie Chien believes it is too early to confirm a recovery in the Taiwan economy, although the latest leading indicators (ie, export orders) are a positive signal. Prospects for economies globally remain challenging. Another worrying sign on the macroeconomic front is the employment data. Although the country’ unemployment rate picked up only slightly during the past four months, the number of employees taking unpaid leave has increased since October 2012.
TAIEX: 12-month forward PER TAIEX: 12-month forward PBR
Source: Bloomberg Source: Bloomberg
TAIEX: earnings revision index
Source: Bloomberg
5
10
15
20
25
Jan-0
6Ma
y-06
Sep-0
6Ja
n-07
May-0
7Se
p-07
Jan-0
8Ma
y-08
Sep-0
8Ja
n-09
May-0
9Se
p-09
Jan-1
0Ma
y-10
Sep-1
0Ja
n-11
May-1
1Se
p-11
Jan-1
2Ma
y-12
Sep-1
2
12-mth forward PER ratio average +1sd -1sd
(x)
0.5
1.0
1.5
2.0
2.5
Jan-0
6Ma
y-06
Sep-0
6Ja
n-07
May-0
7Se
p-07
Jan-0
8Ma
y-08
Sep-0
8Ja
n-09
May-0
9Se
p-09
Jan-1
0Ma
y-10
Sep-1
0Ja
n-11
May-1
1Se
p-11
Jan-1
2Ma
y-12
Sep-1
2
12-mth forward PBR ratio average +1sd -1sd
(x)
-100%-80%-60%-40%-20%
0%20%40%60%80%
Jan-0
6Ma
y-06
Sep-0
6Ja
n-07
May-0
7Se
p-07
Jan-0
8Ma
y-08
Sep-0
8Ja
n-09
May-0
9Se
p-09
Jan-1
0Ma
y-10
Sep-1
0Ja
n-11
May-1
1Se
p-11
Jan-1
2Ma
y-12
Sep-1
2

2013 Outlook for Asia 4 January 2013
- 28 -
India market
Pranab Kumar Sarmah, CFA (852) 2848 4441 ([email protected]) Alan Chan, CFA (852) 2848 4970 ([email protected]) SENSEX: expect 21,800 by year-end 2013E (range 18,000-24,800) Our target for the SENSEX is 21,800 by end-2013E, equivalent to a PER of 15.7x, based on the Thomson Reuters consensus EPS forecasts for FY14 (year-end 31 March 2014). We expect the SENSEX to trade in a range of 18,000-24,800, near -1SD forward PBR and +1SD forward PER. Overall, the high ROE of the SENSEX, along with global liquidity, should see the index maintain its PBR multiple premium vis-à-vis other markets. The consensus forecasts the index EPS to increase by 14.4% YoY for FY14, outpacing slightly the MSCI Asia-ex Japan’s 2013E growth of 13.8% YoY. Growth focus Our economics team believes India’s growth-inflation dynamic has started to change, with increasing downside risks to growth. The team expects a slow recovery in GDP growth in 2013 through a 50bp cut in the policy rate (repo) and two 25bp reductions in the cash reserve ratio (CRR). So far, the RBI has not been prepared to implement more pervasive measures, due
mainly to lingering concerns about inflation. In an environment of declining interest rates and modest GDP growth, we expect the high-growth cyclical stocks to outperform high-quality defensive stocks. Materials, banks, and infrastructure Lower material costs, a recovery in China’s steel demand (fixed-asset investment) and India demand (interest-rate cuts) should probably present a more favourable environment for the steel players in 2013. Falling interest rates, improving asset quality and policy action should lead to bank sector outperformance in 2013, with the share prices of private-sector banks likely to perform better than those of public-sector banks, in our view. In the infrastructure space, we expect strong growth for the railways, defence, mining and water segments. Despite the critical need for power equipment in India, execution risk due to the weak financial positions of the state electricity boards is a concern. Share prices in the oil sector should be policy-driven in 2013 and we expect supportive government policies for this sector. For the auto sector, we expect sales-volume growth for both passenger vehicles and commercial vehicles in India in 2013, but the investment theme for the auto sector looks less compelling compared with the cyclical and policy-driven sectors discussed above. Although the underlying consumption growth story appears intact, we believe the consumer sector is overvalued.
SENSEX: 12-month forward PER SENSEX: 12-month forward PBR
Source: Bloomberg Source: Bloomberg
5
10
15
20
25
Jan-0
6Ma
y-06
Sep-0
6Ja
n-07
May-0
7Se
p-07
Jan-0
8Ma
y-08
Sep-0
8Ja
n-09
May-0
9Se
p-09
Jan-1
0Ma
y-10
Sep-1
0Ja
n-11
May-1
1Se
p-11
Jan-1
2Ma
y-12
Sep-1
2
12-mth forward PER ratio average +1sd -1sd
(x)
0.51.01.52.02.53.03.54.04.5
Jan-0
6Ma
y-06
Sep-0
6Ja
n-07
May-0
7Se
p-07
Jan-0
8Ma
y-08
Sep-0
8Ja
n-09
May-0
9Se
p-09
Jan-1
0Ma
y-10
Sep-1
0Ja
n-11
May-1
1Se
p-11
Jan-1
2Ma
y-12
Sep-1
2
12-mth forward PBR ratio average +1sd -1sd
(x)

2013 Outlook for Asia 4 January 2013
- 29 -
SENSEX: earnings revision index
Source: Bloomberg
ASEAN markets
We do not have a year-end 2013 index target for the ASEAN market, as we are selective in our stock coverage in the region. Except for Singapore, all markets are trading above their past-eight-year average PER and PBR multiples. We see a high possibility of upward earnings revisions for the ASEAN markets in 2013 due to our expectation of a structural recovery. Domestic private consumption has been resilient since 2008 thanks to steady growth in real incomes and ongoing urbanisation. China’s restocking cycle in the coming quarters is likely to bolster ASEAN members that are more exposed to commodity exports (such as Malaysia and Indonesia). The projects under the Economic Transformation Programme (ETP) in Malaysia, with investment totalling MYR26.1bn, should underpin public investment. Though the Philippines and Thailand are more exposed to weaknesses in developed economies as they rely more on exports of manufacturing
products, we expect a faster shift of manufacturing bases from China to those countries in an environment of weak global demand, which would be a structural positive for the ASEAN job market and consumption story. In our view, 2013 will be strong year for the Philippines due to a potential credit-rating upgrade and increased consumption demand likely in an election year. Domestic consumption and its derivatives Domestic consumption is our top investment theme for the ASEAN market for 2013. The outlook for the ASEAN banks sector looks healthy this year, backed by stable asset quality and a robust loan-growth outlook. Banks with high exposure to consumer finance should be favoured by investors and should be beneficiaries of the growth in domestic consumption that we expect. In the telecoms space, a rise in data services by consumers and regulatory development should be the key share-price drivers for 2013, which would favour telecoms companies in all ASEAN countries excluding the Philippines. We are negative on the Singapore property market and believe the yield-gap theme has been fully played out for the Singapore REIT sector. Global infrastructure investment Large cap stocks listed in Singapore that do not rely heavily on the domestic economy are engineering and oil services companies; they compete directly with Korean counterparts for global projects for oil rigs, ship repairs, etc. We expect oil rig order books to improve in 2013, though a strengthening Won could put Korean oil-rig makers at a disadvantage compared to their Singapore peers.
MSCI Singapore: 12-month forward PER MSCI Singapore: 12-month forward PBR
Source: Thomson Reuters Source: Thomson Reuters
-80%
-60%
-40%
-20%
0%
20%
40%
60%
80%
Jan-0
6Ma
y-06
Sep-0
6Ja
n-07
May-0
7Se
p-07
Jan-0
8Ma
y-08
Sep-0
8Ja
n-09
May-0
9Se
p-09
Jan-1
0Ma
y-10
Sep-1
0Ja
n-11
May-1
1Se
p-11
Jan-1
2Ma
y-12
Sep-1
2
4
8
12
16
20
Jan-0
6
Jul-0
6
Jan-0
7
Jul-0
7
Jan-0
8
Jul-0
8
Jan-0
9
Jul-0
9
Jan-1
0
Jul-1
0
Jan-1
1
Jul-1
1
Jan-1
2
Jul-1
2
12-mth forward PER ratio Mean1+STDV 1-STDV
(x)
0.0
0.5
1.0
1.5
2.0
2.5
Jan-0
6
Jul-0
6
Jan-0
7
Jul-0
7
Jan-0
8
Jul-0
8
Jan-0
9
Jul-0
9
Jan-1
0
Jul-1
0
Jan-1
1
Jul-1
1
Jan-1
2
Jul-1
2
12-mth forward PBR ratio Mean1+STDV 1-STDV
(x)

2013 Outlook for Asia 4 January 2013
- 30 -
MSCI Singapore: earnings revision index
Source: Thomson Reuters
MSCI Malaysia: 12-month forward PER MSCI Malaysia: 12-month forward PBR
Source: Thomson Reuters Source: Thomson Reuters
MSCI Malaysia: earnings revision index
Source: Thomson Reuters
(24)(20)(16)(12)(8)(4)
048
12
Mar-0
6Ju
n-06
Sep-0
6De
c-06
Mar-0
7Ju
n-07
Sep-0
7De
c-07
Mar-0
8Ju
n-08
Sep-0
8De
c-08
Mar-0
9Ju
n-09
Sep-0
9De
c-09
Mar-1
0Ju
n-10
Sep-1
0De
c-10
Mar-1
1Ju
n-11
Sep-1
1De
c-11
Mar-1
2Ju
n-12
Sep-1
2De
c-12
(%)
8
10
12
14
16
18
Jan-0
6
Jul-0
6
Jan-0
7
Jul-0
7
Jan-0
8
Jul-0
8
Jan-0
9
Jul-0
9
Jan-1
0
Jul-1
0
Jan-1
1
Jul-1
1
Jan-1
2
Jul-1
2
12-mth forward PER ratio Mean1+STDV 1-STDV
(x)
1.0
1.5
2.0
2.5Ja
n-06
Jul-0
6
Jan-0
7
Jul-0
7
Jan-0
8
Jul-0
8
Jan-0
9
Jul-0
9
Jan-1
0
Jul-1
0
Jan-1
1
Jul-1
1
Jan-1
2
Jul-1
2
12-mth forward PBR ratio Mean1+STDV 1-STDV
(x)
(20)
(16)
(12)
(8)
(4)
0
4
8
Mar-0
6Ju
n-06
Sep-0
6De
c-06
Mar-0
7Ju
n-07
Sep-0
7De
c-07
Mar-0
8Ju
n-08
Sep-0
8De
c-08
Mar-0
9Ju
n-09
Sep-0
9De
c-09
Mar-1
0Ju
n-10
Sep-1
0De
c-10
Mar-1
1Ju
n-11
Sep-1
1De
c-11
Mar-1
2Ju
n-12
Sep-1
2De
c-12
(%)
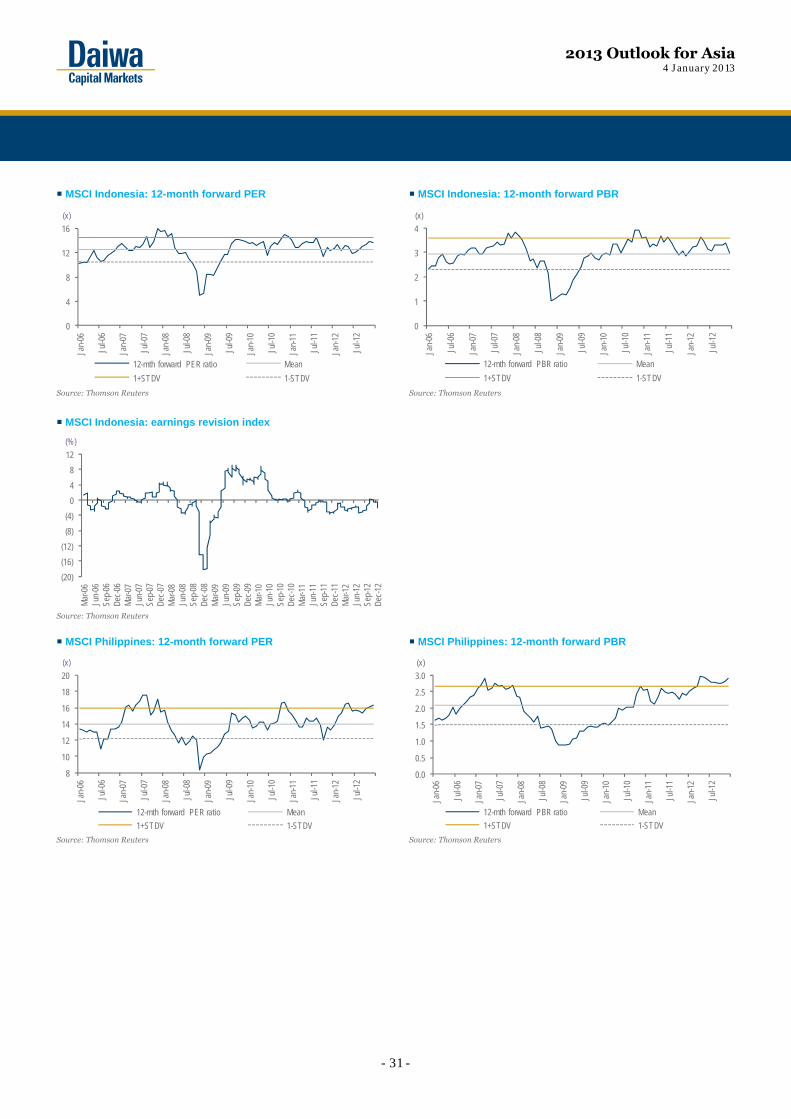
2013 Outlook for Asia 4 January 2013
- 31 -
MSCI Indonesia: 12-month forward PER MSCI Indonesia: 12-month forward PBR
Source: Thomson Reuters Source: Thomson Reuters
MSCI Indonesia: earnings revision index
Source: Thomson Reuters
MSCI Philippines: 12-month forward PER MSCI Philippines: 12-month forward PBR
Source: Thomson Reuters Source: Thomson Reuters
0
4
8
12
16
Jan-0
6
Jul-0
6
Jan-0
7
Jul-0
7
Jan-0
8
Jul-0
8
Jan-0
9
Jul-0
9
Jan-1
0
Jul-1
0
Jan-1
1
Jul-1
1
Jan-1
2
Jul-1
212-mth forward PER ratio Mean1+STDV 1-STDV
(x)
0
1
2
3
4
Jan-0
6
Jul-0
6
Jan-0
7
Jul-0
7
Jan-0
8
Jul-0
8
Jan-0
9
Jul-0
9
Jan-1
0
Jul-1
0
Jan-1
1
Jul-1
1
Jan-1
2
Jul-1
2
12-mth forward PBR ratio Mean1+STDV 1-STDV
(x)
(20)(16)(12)(8)(4)
048
12
Mar-0
6Ju
n-06
Sep-0
6De
c-06
Mar-0
7Ju
n-07
Sep-0
7De
c-07
Mar-0
8Ju
n-08
Sep-0
8De
c-08
Mar-0
9Ju
n-09
Sep-0
9De
c-09
Mar-1
0Ju
n-10
Sep-1
0De
c-10
Mar-1
1Ju
n-11
Sep-1
1De
c-11
Mar-1
2Ju
n-12
Sep-1
2De
c-12
(%)
8
10
12
14
16
18
20
Jan-0
6
Jul-0
6
Jan-0
7
Jul-0
7
Jan-0
8
Jul-0
8
Jan-0
9
Jul-0
9
Jan-1
0
Jul-1
0
Jan-1
1
Jul-1
1
Jan-1
2
Jul-1
2
12-mth forward PER ratio Mean1+STDV 1-STDV
(x)
0.0
0.5
1.0
1.5
2.0
2.5
3.0
Jan-0
6
Jul-0
6
Jan-0
7
Jul-0
7
Jan-0
8
Jul-0
8
Jan-0
9
Jul-0
9
Jan-1
0
Jul-1
0
Jan-1
1
Jul-1
1
Jan-1
2
Jul-1
2
12-mth forward PBR ratio Mean1+STDV 1-STDV
(x)

2013 Outlook for Asia 4 January 2013
- 32 -
MSCI Philippines: earnings revision index
Source: Thomson Reuters
MSCI Thailand: 12-month forward PER MSCI Thailand: 12-month forward PBR
Source: Thomson Reuters Source: Thomson Reuters
MSCI Thailand: earnings revision index
Source: Thomson Reuters
(16)
(12)
(8)
(4)
0
4
8
Mar-0
6Ju
n-06
Sep-0
6De
c-06
Mar-0
7Ju
n-07
Sep-0
7De
c-07
Mar-0
8Ju
n-08
Sep-0
8De
c-08
Mar-0
9Ju
n-09
Sep-0
9De
c-09
Mar-1
0Ju
n-10
Sep-1
0De
c-10
Mar-1
1Ju
n-11
Sep-1
1De
c-11
Mar-1
2Ju
n-12
Sep-1
2De
c-12
(%)
4
6
8
10
12
14
Jan-0
6
Jul-0
6
Jan-0
7
Jul-0
7
Jan-0
8
Jul-0
8
Jan-0
9
Jul-0
9
Jan-1
0
Jul-1
0
Jan-1
1
Jul-1
1
Jan-1
2
Jul-1
2
12-mth forward PER ratio Mean1+STDV 1-STDV
(x)
0.0
0.5
1.0
1.5
2.0
2.5
3.0Ja
n-06
Jul-0
6
Jan-0
7
Jul-0
7
Jan-0
8
Jul-0
8
Jan-0
9
Jul-0
9
Jan-1
0
Jul-1
0
Jan-1
1
Jul-1
1
Jan-1
2
Jul-1
2
12-mth forward PBR ratio Mean1+STDV 1-STDV
(x)
(32)(28)(24)(20)(16)(12)(8)(4)
048
12
Mar-0
6Ju
n-06
Sep-0
6De
c-06
Mar-0
7Ju
n-07
Sep-0
7De
c-07
Mar-0
8Ju
n-08
Sep-0
8De
c-08
Mar-0
9Ju
n-09
Sep-0
9De
c-09
Mar-1
0Ju
n-10
Sep-1
0De
c-10
Mar-1
1Ju
n-11
Sep-1
1De
c-11
Mar-1
2Ju
n-12
Sep-1
2De
c-12
(%)

2013 Outlook for Asia 4 January 2013
- 33 -
MSCI Asia ex-Japan Energy: 12-month forward PER MSCI Asia ex-Japan Energy: 12-month forward PBR
Source: Thomson Reuters Source: Thomson Reuters
MSCI Asia ex-Japan Materials: 12-month forward PER MSCI Asia ex-Japan Materials: 12-month forward PBR
Source: Thomson Reuters Source: Thomson Reuters
MSCI Asia ex-Japan Industrials: 12-month forward PER MSCI Asia ex-Japan Industrials: 12-month forward PBR
Source: Thomson Reuters Source: Thomson Reuters
02468
101214161820
Jan-0
6
Jul-0
6
Jan-0
7
Jul-0
7
Jan-0
8
Jul-0
8
Jan-0
9
Jul-0
9
Jan-1
0
Jul-1
0
Jan-1
1
Jul-1
1
Jan-1
2
Jul-1
212-mth forward PER ratio Mean1+STDV 1-STDV
(x)
0
1
2
3
4
Jan-0
6
Jul-0
6
Jan-0
7
Jul-0
7
Jan-0
8
Jul-0
8
Jan-0
9
Jul-0
9
Jan-1
0
Jul-1
0
Jan-1
1
Jul-1
1
Jan-1
2
Jul-1
2
12-mth forward PBR ratio Mean1+STDV 1-STDV
(x)
4
6
8
10
12
14
16
Jan-0
6
Jul-0
6
Jan-0
7
Jul-0
7
Jan-0
8
Jul-0
8
Jan-0
9
Jul-0
9
Jan-1
0
Jul-1
0
Jan-1
1
Jul-1
1
Jan-1
2
Jul-1
2
12-mth forward PER ratio Mean1+STDV 1-STDV
(x)
0.0
0.5
1.0
1.5
2.0
2.5
3.0
Jan-0
6
Jul-0
6
Jan-0
7
Jul-0
7
Jan-0
8
Jul-0
8
Jan-0
9
Jul-0
9
Jan-1
0
Jul-1
0
Jan-1
1
Jul-1
1
Jan-1
2
Jul-1
2
12-mth forward PBR ratio Mean1+STDV 1-STDV
(x)
0
4
8
12
16
20
24
Jan-0
6
Jul-0
6
Jan-0
7
Jul-0
7
Jan-0
8
Jul-0
8
Jan-0
9
Jul-0
9
Jan-1
0
Jul-1
0
Jan-1
1
Jul-1
1
Jan-1
2
Jul-1
2
12-mth forward PER ratio Mean1+STDV 1-STDV
(x)
0.0
0.5
1.0
1.5
2.0
2.5
3.0
Jan-0
6
Jul-0
6
Jan-0
7
Jul-0
7
Jan-0
8
Jul-0
8
Jan-0
9
Jul-0
9
Jan-1
0
Jul-1
0
Jan-1
1
Jul-1
1
Jan-1
2
Jul-1
2
12-mth forward PBR ratio Mean1+STDV 1-STDV
(x)

2013 Outlook for Asia 4 January 2013
- 34 -
MSCI Asia ex-Japan Consumer Discretionary: 12-month forward PER
MSCI Asia ex-Japan Consumer Discretionary: 12-month forward PBR
Source: Thomson Reuters Source: Thomson Reuters
MSCI Asia ex-Japan Consumer Staples: 12-month forward
PER MSCI Asia ex-Japan Consumer Staples: 12-month forward
PBR
Source: Thomson Reuters Source: Thomson Reuters
MSCI Asia ex-Japan Healthcare: 12-month forward PER MSCI Asia ex-Japan Healthcare: 12-month forward PBR
Source: Thomson Reuters Source: Thomson Reuters
4
8
12
16
20
Jan-0
6
Jul-0
6
Jan-0
7
Jul-0
7
Jan-0
8
Jul-0
8
Jan-0
9
Jul-0
9
Jan-1
0
Jul-1
0
Jan-1
1
Jul-1
1
Jan-1
2
Jul-1
2
12-mth forward PER ratio Mean1+STDV 1-STDV
(x)
1.01.21.41.61.82.02.22.42.6
Jan-0
6
Jul-0
6
Jan-0
7
Jul-0
7
Jan-0
8
Jul-0
8
Jan-0
9
Jul-0
9
Jan-1
0
Jul-1
0
Jan-1
1
Jul-1
1
Jan-1
2
Jul-1
2
12-mth forward PBR ratio Mean1+STDV 1-STDV
(x)
810121416182022
Jan-0
6
Jul-0
6
Jan-0
7
Jul-0
7
Jan-0
8
Jul-0
8
Jan-0
9
Jul-0
9
Jan-1
0
Jul-1
0
Jan-1
1
Jul-1
1
Jan-1
2
Jul-1
2
12-mth forward PER ratio Mean1+STDV 1-STDV
(x)
1.5
2.0
2.5
3.0
3.5
4.0
Jan-0
6
Jul-0
6
Jan-0
7
Jul-0
7
Jan-0
8
Jul-0
8
Jan-0
9
Jul-0
9
Jan-1
0
Jul-1
0
Jan-1
1
Jul-1
1
Jan-1
2
Jul-1
2
12-mth forward PBR ratio Mean1+STDV 1-STDV
(x)
8
12
16
20
24
Jan-0
6
Jul-0
6
Jan-0
7
Jul-0
7
Jan-0
8
Jul-0
8
Jan-0
9
Jul-0
9
Jan-1
0
Jul-1
0
Jan-1
1
Jul-1
1
Jan-1
2
Jul-1
2
12-mth forward PER ratio Mean1+STDV 1-STDV
(x)
1.5
2.0
2.5
3.0
3.5
4.0
4.5
Jan-0
6
Jul-0
6
Jan-0
7
Jul-0
7
Jan-0
8
Jul-0
8
Jan-0
9
Jul-0
9
Jan-1
0
Jul-1
0
Jan-1
1
Jul-1
1
Jan-1
2
Jul-1
2
12-mth forward PBR ratio Mean1+STDV 1-STDV
(x)

2013 Outlook for Asia 4 January 2013
- 35 -
MSCI Asia ex-Japan Banks: 12-month forward PER MSCI Asia ex-Japan Banks: 12-month forward PBR
Source: Thomson Reuters Source: Thomson Reuters
MSCI Asia ex-Japan Real Estate: 12-month forward PER MSCI Asia ex-Japan Real Estate: 12-month forward PBR
Source: Thomson Reuters Source: Thomson Reuters
MSCI Asia ex-Japan IT: 12-month forward PER MSCI Asia ex-Japan IT: 12-month forward PBR
Source: Thomson Reuters Source: Thomson Reuters
4
8
12
16
Jan-0
6
Jul-0
6
Jan-0
7
Jul-0
7
Jan-0
8
Jul-0
8
Jan-0
9
Jul-0
9
Jan-1
0
Jul-1
0
Jan-1
1
Jul-1
1
Jan-1
2
Jul-1
212-mth forward PER ratio Mean1+STDV 1-STDV
(x)
0.5
1.0
1.5
2.0
2.5
Jan-0
6
Jul-0
6
Jan-0
7
Jul-0
7
Jan-0
8
Jul-0
8
Jan-0
9
Jul-0
9
Jan-1
0
Jul-1
0
Jan-1
1
Jul-1
1
Jan-1
2
Jul-1
2
12-mth forward PBR ratio Mean1+STDV 1-STDV
(x)
4
8
12
16
20
24
Jan-0
6
Jul-0
6
Jan-0
7
Jul-0
7
Jan-0
8
Jul-0
8
Jan-0
9
Jul-0
9
Jan-1
0
Jul-1
0
Jan-1
1
Jul-1
1
Jan-1
2
Jul-1
2
12-mth forward PER ratio Mean1+STDV 1-STDV
(x)
0.0
0.5
1.0
1.5
2.0
Jan-0
6
Jul-0
6
Jan-0
7
Jul-0
7
Jan-0
8
Jul-0
8
Jan-0
9
Jul-0
9
Jan-1
0
Jul-1
0
Jan-1
1
Jul-1
1
Jan-1
2
Jul-1
2
12-mth forward PBR ratio Mean1+STDV 1-STDV
(x)
05
1015202530354045
Jan-0
6
Jul-0
6
Jan-0
7
Jul-0
7
Jan-0
8
Jul-0
8
Jan-0
9
Jul-0
9
Jan-1
0
Jul-1
0
Jan-1
1
Jul-1
1
Jan-1
2
Jul-1
2
12-mth forward PER ratio Mean1+STDV 1-STDV
(x)
1.01.21.41.61.82.02.22.42.6
Jan-0
6
Jul-0
6
Jan-0
7
Jul-0
7
Jan-0
8
Jul-0
8
Jan-0
9
Jul-0
9
Jan-1
0
Jul-1
0
Jan-1
1
Jul-1
1
Jan-1
2
Jul-1
2
12-mth forward PBR ratio Mean1+STDV 1-STDV
(x)

2013 Outlook for Asia 4 January 2013
- 36 -
MSCI Asia ex-Japan Telecoms: 12-month forward PER MSCI Asia ex-Japan Telecoms: 12-month forward PBR
Source: Thomson Reuters Source: Thomson Reuters
MSCI Asia ex-Japan Utilities: 12-month forward PER MSCI Asia ex-Japan Utilities: 12-month forward PBR
Source: Thomson Reuters Source: Thomson Reuters
810121416182022
Jan-0
6
Jul-0
6
Jan-0
7
Jul-0
7
Jan-0
8
Jul-0
8
Jan-0
9
Jul-0
9
Jan-1
0
Jul-1
0
Jan-1
1
Jul-1
1
Jan-1
2
Jul-1
212-mth forward PER ratio Mean1+STDV 1-STDV
(x)
1.0
1.5
2.0
2.5
3.0
3.5
4.0
Jan-0
6
Jul-0
6
Jan-0
7
Jul-0
7
Jan-0
8
Jul-0
8
Jan-0
9
Jul-0
9
Jan-1
0
Jul-1
0
Jan-1
1
Jul-1
1
Jan-1
2
Jul-1
2
12-mth forward PBR ratio Mean1+STDV 1-STDV
(x)
10
12
14
16
18
Jan-0
6
Jul-0
6
Jan-0
7
Jul-0
7
Jan-0
8
Jul-0
8
Jan-0
9
Jul-0
9
Jan-1
0
Jul-1
0
Jan-1
1
Jul-1
1
Jan-1
2
Jul-1
2
12-mth forward PER ratio Mean1+STDV 1-STDV
(x)
1.01.11.21.31.41.51.61.71.8
Jan-0
6
Jul-0
6
Jan-0
7
Jul-0
7
Jan-0
8
Jul-0
8
Jan-0
9
Jul-0
9
Jan-1
0
Jul-1
0
Jan-1
1
Jul-1
1
Jan-1
2
Jul-1
2
12-mth forward PBR ratio Mean1+STDV 1-STDV
(x)

2013 Outlook for Asia 4 January 2013
- 37 -
Sector-by-sector outlooks

2013 Outlook for Asia 4 January 2013
- 38 -
Sector-by-sector summary Sector recommendations
Country/ Sector Rating Comment Stock pick Bloomberg Rating Share price Target Mkt cap Analyst region code 28-12-2012 Price (LC) (USDm)Regional Oil & Gas Neutral Accelerating economic growth in China in early 2013E, low
OPEC spare capacity and a weak USD should support oil prices in 2013. Chinese companies’ success in exploration and drilling in 2013 should be key stock catalysts. We expect CNOOC to record strong production growth from 2013-15 from new projects. Also, this stock is trading at discount to its valuation.
CNOOC 883 HK Buy 16.84 20.80 97,039 Adrian Loh
Regional Small/Mid Caps Positive The key factors we would focus on include beneficiaries of an inflow of Chinese tourists into Asian countries, a recovery of the US economy and selective stocks in the textile industry. Techtronic is our top pick, as we are seeing signs of a recovery in the US housing market, the key driver for its power-tool business, and we also expect margin expansion on an improved product mix.
Techtronic Industries
669 HK Buy 14.60 19.20 3,451 John Choi
Regional Transportation Positive Capacity consolidation should remain intact in 2013, while we expect freight demand to recover to 6% YoY for 2013. We see upside potential for freight demand from restocking demand. OOIL is likely to benefit in 2013 from restocking demand and capacity cuts by major liners. Industry's demand supply growth should reach equilibrium by 2014.
Orient Overseas International
316 HK Buy 50.30 67.00 4,061 Kelvin Lau
Greater China
Semiconductor Positive The key growth drivers for the semiconductor space in 2013 should be smartphone IC, broadband and Win 8-based products. We expect Apple’s, SEC’s, and China smartphone semiconductor shipment growth to remain high in 2013. Our top pick is MediaTek whose revenue and profit margins we expect to expand on the back of an improved product mix/offerings.
MediaTek 2454 TT Buy 323.50 383.00 15,032 Eric Chen
Greater China
Smartphones Positive Shipment growth momentum, market-share consolidation and design upgrades are three key factors to watch in 2013. We forecast 30% YoY global smartphone shipment growth in 2013. Our pick is Hon Hai, which we forecast to deliver 32% earnings growth for 2013, benefiting from market-share consolidation and growth in smartphone shipments.
Hon Hai Precision Industry
2317 TT Buy 88.90 127.00 36,235 Birdy Lu
Greater China
PC Hardware Neutral We expect the PC market to remain sluggish in 2013, with 354m shipments, zero growth YoY (vs. tablet shipment growth of 54% YoY). The success of Win 8 will be key and we are bearish on this front. Our top pick is Lenovo, which we believe has a balanced product line, strong global distribution channel, and healthy financials.
Lenovo Group 992 HK Outperform 7.18 8.30 9,386 Christine Wang
China Automobiles Positive We are positive on the sector and forecast 10-12% YoY sales volume growth for passenger vehicles for 2013, backed by rising demand from inland areas. We expect SUVs to outperform PVs in terms of shipment growth. However, we believe DFM’s golden period of earnings growth has come to an end, and expect its business momentum to lag peers, and the stock to continue to derate through 2013.
Dongfeng Motor Group
489 HK Underperform 11.98 8.75 13,315 Jeff Chung
China Banks Positive There should be a marked QoQ NIM squeeze from 1Q13, which we believe will have a greater impact on small banks than on large ones. Despite slowing loan growth, banks are remaining rational on pricing. ICBC is our top pick because of its low cost of funding (strong deposit base), steady asset quality, and strong capital base.
ICBC 1398 HK Buy 5.53 6.70 249,029 Grace Wu
China City Gas Positive Among the various utilities sub-sectors, gas demand has not slowed in the past decade and we expect full gas price reform in 2013 leading to a price hike. ENN is our top pick due to the superior >20% YoY organic earnings growth we forecast for the next three years, cheap valuation in our view, and potential upside from the expansion of its LNG refilling stations business.
ENN Energy 2688 HK Buy 33.70 43.00 4,564 Dave Dai
China Construction materials
Positive We envisage moderate demand growth and supply discipline and see a stable outlook for the construction materials sector in 2013. Our top pick is China Liansu, which operates in an industry that is supported by the government investment plans. The company is cost-competitive and should see strong earnings growth in 2013.
China Liansu Group
2128 HK Buy 5.32 7.00 2,063 Felix Lam
Macau Gaming Neutral As the industry’s top-line growth begins to normalise, we believe attention should be paid to bottom-line growth through mass-market gaming revenue and table-optimisation strategies. Our top pick is Galaxy, which has the most balanced property mix and improving ROI (we forecast an ROI of 45% for 2013) from new projects.
Galaxy Entertainment Group
27 HK Buy 30.55 35.00 16,580 Bing Zhou
Source: Daiwa

2013 Outlook for Asia 4 January 2013
- 39 -
Sector recommendations (cont’d) Country/ Sector Rating Comment Stock pick Bloomberg Rating Share price Target Mkt cap Analyst region code 28-12-2012 Price (LC) (USDm)China Infrastructure Positive Infrastructure is a policy-driven sector. The Ministry of Railways’
(MOR) announcement of the railway infrastructure capex budget, affordable housing programme and subway expansion in 2013 will be share-price drivers. We are upbeat on the outlook for China Railway Construction (CRG) in 2013 as MOR plans to resume the award of new railway construction contracts, and CRG is the largest contractor in rapidly growing high margin subway construction in China.
China Railway Construction
1186 HK Buy 8.81 10.53 14,022 Joseph Ho
China Internet Positive Mobile Internet, e-commerce and the launch of any blockbuster Internet games will be the key themes in 2013. Tencent is our top pick in the sector, as we are positive on its online gaming (new blockbuster title launch) and Wechat business outlook.
Tencent Holdings
700 HK Buy 250 320 59,499 John Choi
China Property Positive Leading regional players should be in focus in 2013 after the strong performance of the domestic players in 2012. Companies plan to replenish their city landbanks in 2013. We see R&F as a quality regional player, expanding in tier-2 cities and trading at a significant discount to NAV.
Guangzhou R&F Properties
2777 HK Buy 12.88 15.90 5,356 Jonas Kan
Hong Kong Property Positive We see 2013 as a year for mid-range properties in Hong Kong, whether residential, office or retail properties. Hong Kong companies with China investments should benefit in 2013. Wharf’s investment in retail and China property is reaching fruition which should benefit the company in 2013 and beyond, and is likely to elevate it to the level of a premier stock on the global property stage. We believe a multi-year rerating story has just started.
Wharf Holdings 4 HK Buy 60.05 67.90 23,464 Jonas Kan
China Thermal Coal Positive We expect price stability in 2013 due to an improving supply and demand balance, while in the near term, the convergence of spot and contract prices will benefit companies with high exposure to low contract prices. Our top pick is China Coal, which has the best fundamentals (low cost and pricing stability), but which, along with its peers, has underperformed the HSCEI Index for the past three consecutive years.
China Coal Energy
1898 HK Buy 8.36 10.00 14,299 Dave Dai
India Auto Positive The India Auto Sector looks set to benefit from macro factors such as a potential decline in interest rates, improving GDP growth and benign commodity prices in 2013. We expect volume growth to recover for PVs and CVs in 2013. Tata Motors is one of our top picks in the India Auto space, as its JLR business is at the cusp of transforming Tata Motors into a meaningful player in the premium car market.
Tata Motors TTMT IN Outperform 310.05 335.00 18,021 Navin Matta
India Financials Positive Falling rates, improving asset quality and policy action should lead to sector outperformance in 2013. While we are positive on the private sector banks, we recently turned incrementally bullish on public sector banks and non-banking financial companies on their improving asset quality. We believe ICICI Bank would be a beneficiary of interest rate cuts in FY13, as it is highly leveraged to retail/SME loans, and the risk associated with the asset quality of such loans should decline with a fall in interest rates.
ICICI Bank ICICIBC IN Buy 1,141.55 1,365.00 24,024 Punit Srivastava
India Capital Goods Positive Order inflow and execution should be key price catalysts in 2013, as we expect the sector's margins to be stable to down for FY14. Opportunities exist in the railways, infrastructure, defence, mining and water segments. The weak financials of the SEBs are likely to affect the power equipment sector. Our pick is diversified company L&T, for which we forecast a 14% revenue CAGR from 2012-15 (primary beneficiary of the capex cycle upturn in India). Potential asset divestment would further improve its earnings quality.
Larsen & Toubro
LT IN Outperform 1,619.95 1,780.00 18,080 Saurabh Mehta
India Consumer Neutral Although the underlying consumption growth story appears intact, we believe the sector’s valuations have run ahead of its fundamentals. Companies strengthening their distribution networks and those with innovative new products in the pipeline should fare well. Titan is our pick in the consumer discretionary space, as we forecast it to deliver 30% YoY EPS growth for FY14, backed by aggressive expansion and margin improvement in its jewellery business.
Titan Industries TTAN IN Buy 281.15 340.00 4,551 Mihir Shah
India Materials Positive A reduction in material costs, recovery in China steel demand (FAI) and India demand (interest-rate cuts) would create a favourable environment for the steel players in 2013. Tata Steel is our preferred pick, as we believe many concerns such as ASPs, production growth, raw material costs, etc. are likely to be alleviated from 2H FY13.
Tata Steel TATA IN Buy 428.55 505.00 7,592 Deepak Poddar
India Oil and Gas Positive The key earnings and share-price drivers for refiners are the trend in under-recoveries, which should decline in FY14 from FY13 on rising diesel prices and stable input costs. Government policy is becoming more supportive for the sector. BPCL is our pick on positive trends in sector reforms, attractive E&P portfolio and attractive valuation.
Bharat Petroleum
BPCL IN Buy 352.30 402.00 4,658 Nirmal Raghavan
Source: Daiwa
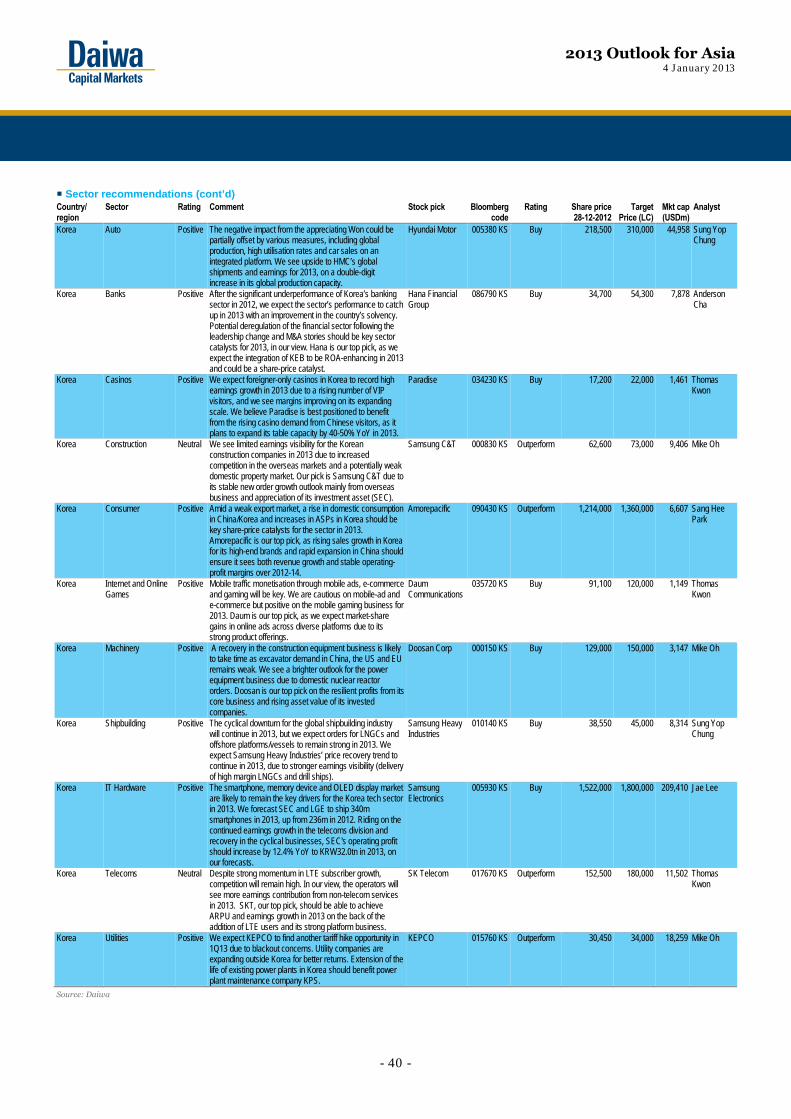
2013 Outlook for Asia 4 January 2013
- 40 -
Sector recommendations (cont’d) Country/ Sector Rating Comment Stock pick Bloomberg Rating Share price Target Mkt cap Analyst region code 28-12-2012 Price (LC) (USDm)Korea Auto Positive The negative impact from the appreciating Won could be
partially offset by various measures, including global production, high utilisation rates and car sales on an integrated platform. We see upside to HMC’s global shipments and earnings for 2013, on a double-digit increase in its global production capacity.
Hyundai Motor 005380 KS Buy 218,500 310,000 44,958 Sung Yop Chung
Korea Banks Positive After the significant underperformance of Korea’s banking sector in 2012, we expect the sector’s performance to catch up in 2013 with an improvement in the country’s solvency. Potential deregulation of the financial sector following the leadership change and M&A stories should be key sector catalysts for 2013, in our view. Hana is our top pick, as we expect the integration of KEB to be ROA-enhancing in 2013 and could be a share-price catalyst.
Hana Financial Group
086790 KS Buy 34,700 54,300 7,878 Anderson Cha
Korea Casinos Positive We expect foreigner-only casinos in Korea to record high earnings growth in 2013 due to a rising number of VIP visitors, and we see margins improving on its expanding scale. We believe Paradise is best positioned to benefit from the rising casino demand from Chinese visitors, as it plans to expand its table capacity by 40-50% YoY in 2013.
Paradise 034230 KS Buy 17,200 22,000 1,461 Thomas Kwon
Korea Construction Neutral We see limited earnings visibility for the Korean construction companies in 2013 due to increased competition in the overseas markets and a potentially weak domestic property market. Our pick is Samsung C&T due to its stable new order growth outlook mainly from overseas business and appreciation of its investment asset (SEC).
Samsung C&T 000830 KS Outperform 62,600 73,000 9,406 Mike Oh
Korea Consumer Positive Amid a weak export market, a rise in domestic consumption in China/Korea and increases in ASPs in Korea should be key share-price catalysts for the sector in 2013. Amorepacific is our top pick, as rising sales growth in Korea for its high-end brands and rapid expansion in China should ensure it sees both revenue growth and stable operating-profit margins over 2012-14.
Amorepacific 090430 KS Outperform 1,214,000 1,360,000 6,607 Sang Hee Park
Korea Internet and Online Games
Positive Mobile traffic monetisation through mobile ads, e-commerce and gaming will be key. We are cautious on mobile-ad and e-commerce but positive on the mobile gaming business for 2013. Daum is our top pick, as we expect market-share gains in online ads across diverse platforms due to its strong product offerings.
Daum Communications
035720 KS Buy 91,100 120,000 1,149 Thomas Kwon
Korea Machinery Positive A recovery in the construction equipment business is likely to take time as excavator demand in China, the US and EU remains weak. We see a brighter outlook for the power equipment business due to domestic nuclear reactor orders. Doosan is our top pick on the resilient profits from its core business and rising asset value of its invested companies.
Doosan Corp 000150 KS Buy 129,000 150,000 3,147 Mike Oh
Korea Shipbuilding Positive The cyclical downturn for the global shipbuilding industry will continue in 2013, but we expect orders for LNGCs and offshore platforms/vessels to remain strong in 2013. We expect Samsung Heavy Industries’ price recovery trend to continue in 2013, due to stronger earnings visibility (delivery of high margin LNGCs and drill ships).
Samsung Heavy Industries
010140 KS Buy 38,550 45,000 8,314 Sung Yop Chung
Korea IT Hardware Positive The smartphone, memory device and OLED display market are likely to remain the key drivers for the Korea tech sector in 2013. We forecast SEC and LGE to ship 340m smartphones in 2013, up from 236m in 2012. Riding on the continued earnings growth in the telecoms division and recovery in the cyclical businesses, SEC's operating profit should increase by 12.4% YoY to KRW32.0tn in 2013, on our forecasts.
Samsung Electronics
005930 KS Buy 1,522,000 1,800,000 209,410 Jae Lee
Korea Telecoms Neutral Despite strong momentum in LTE subscriber growth, competition will remain high. In our view, the operators will see more earnings contribution from non-telecom services in 2013. SKT, our top pick, should be able to achieve ARPU and earnings growth in 2013 on the back of the addition of LTE users and its strong platform business.
SK Telecom 017670 KS Outperform 152,500 180,000 11,502 Thomas Kwon
Korea Utilities Positive We expect KEPCO to find another tariff hike opportunity in 1Q13 due to blackout concerns. Utility companies are expanding outside Korea for better returns. Extension of the life of existing power plants in Korea should benefit power plant maintenance company KPS.
KEPCO 015760 KS Outperform 30,450 34,000 18,259 Mike Oh
Source: Daiwa

2013 Outlook for Asia 4 January 2013
- 41 -
Sector recommendations (cont’d) Country/ Sector Rating Comment Stock pick Bloomberg Rating Share price Target Mkt cap Analyst region code 28-12-2012 Price (LC) (USDm)Philippines Capital goods Positive 2013 should be a strong year for the Philippines due to a
potential credit-rating upgrade and increased consumption demand in an election year. Moreover, infrastructure project mobilisation should benefit the sector. We see an improving quality of earnings for DMC in 2013 due to improved operating performances of key units. Public private partnership project mobilisation should be another catalyst for the construction business.
DMCI Holdings DMC PM Outperform 53.95 64.90 3,489 Rommel Rodrigo
Singapore Capital Goods Positive Order books and margins are key price catalysts for rig-builders and we expect >35 deep/ultra deep new rig orders globally in 2013. Keppel is our top pick for its strong order-backlog as a result of its technical ability (ultra deepwater assets) and geographical diversification (Brazil and Africa).
Keppel Corp KEP SP Outperform 11.00 12.45 16,038 Adrian Loh
Singapore REITs Neutral In our view, the yield-gap theme has been fully played out. We expect a deceleration in rental growth in 2013 due to sub-par GDP growth and a less hospitable operating environment. Further fundraising risk is another issue. AREIT trades at a considerable premium based on yield and NAV to peers, but we believe its DPU is probably more vulnerable than peers, due to its high exposure to multi-tenanted industrial properties.
Ascendas Real Estate Investment Trust
AREIT SP Underperform 2.39 2.20 4,371 David Lum
Taiwan Automation Positive Inventory reductions and a potential demand recovery from China from 2Q13 should be the key drivers for the sector. Recent China PMI data supports our view on an upcoming China demand recovery. We prefer component makers over machine tool makers. Short-term seasonal weakness should provide a good entry point for Delta, which we believe is structurally moving in the right direction to improve its revenue and margins through 2014.
Delta Electronics 2308 TT Outperform 106.50 123.00 8,814 Christine Wang
Taiwan Financials Positive Though growth metrics could slow in 2013 and credit cost increase marginally from historically low levels, we expect corporate-centric financial names to fare better than other financial companies in 2013 on high-margin US Dollar lending and the building-up of Renminbi deposits. Mega is our top pick given its stable cash dividend payout, strong capital position with a 9.6% tier-1 ratio and unrivalled forex franchise.
Mega Financial 2886 TT Buy 22.60 26.00 8,911 Jerry Yang
Taiwan TFT-LCD Positive We expect the demand-supply gap to continue to narrow in 2013 due to capacity consolidation, and an increase in area demand from large size TVs. The upcycle is likely to last at least three quarters, and we would suggest taking profits before 3Q13. Our top pick is CMI on its turnaround story.
Chimei Innolux 3481 TT Buy 15.60 19.10 4,251 Chris Lin
Taiwan Touch Panels Positive The one-glass solutions for touch-enabled notebooks should benefit laminate makers such as TPK in 2013. We expect the penetration of touch-enabled notebook-like products in 2013 to rise to >20% from only 2% in 2012. Customer diversification and rising demand for large size touch panels should boost TPK's 2013 earnings by >25% YoY, on our forecasts, and the stock is our top pick.
TPK 3673 TT Buy 513.00 626.00 6,005 Chris Lin
ASEAN Banks Positive We see a healthy sector outlook for 2013 backed by a stable asset quality and robust loan growth outlook. We expect banks in Thailand and Malaysia to see less pressure on their NIMs than those in Indonesia and Singapore, on rising funding costs. Bank of Ayudhya (BAY) is our top buy, as we believe it is gaining market share in the growing high-yielding personal loans/credit card businesses, and it started enjoying positive opex and credit cost leverage in 2012.
Bank of Ayudhya BAY TB Buy 32.5 38.0 6,453 Srikanth Vadlamani
ASEAN Telecommunications Positive A rise in data services and regulatory development should be the key share price drivers for 2013. Telecom companies in all ASEAN countries except for the Philippines stand to benefit from this trend. Indosat is our top pick; we see a few turnaround catalysts for it, such as the securing of regulatory approval to operate a 3G network, changes in management, and completion of a divestment of towers.
Indosat Tbk PT ISAT IJ Buy 6,450 7,335 3,637 Ramakrishna Maruvada
Source: Daiwa

2013 Outlook for Asia 4 January 2013
- 42 -
Regional Oil & Gas – Neutral Adrian Loh (65) 6499 6548 ([email protected])
Top-3 share-price drivers
• Oil prices. The sector is highly positively correlated to oil prices, and China is the largest contributor to marginal demand globally. Accelerating growth in China in early 2013, which Daiwa economists currently forecast, should provide a floor for oil prices, which would in turn provide sufficient earnings visibility to drive the sector up. In addition, we think the lack of spare OPEC capacity, plus the potentially inflationary effects of QE3 (especially a weaker US Dollar), could support an oil price increase.
• Exploration and drilling success. The announcement of a material exploration success could materially drive up a company’s share price, as it would: 1) lead to strong reserves bookings in the 1-2 years thereafter, 2) help keep a company’s Reserves Replacement Ratio above 100%, and 3) allow for NAV accretion in the longer term.
• Cost control. Evidence of whether a company has been successful in cost control arrives during every quarterly or interim results report. Failure to contain costs would reduce the profitability per barrel of oil equivalent and weigh on the company’s Return on Equity and Return on Assets.
Sector outlook for 2013
Heading into 2013, the oil market should remain adequately supplied. However, we do not think that the market will reflect this, and thus witness a lower oil price, given the paucity of OPEC spare capacity coupled with ongoing geopolitical concerns. As can be seen in the chart below, OPEC spare capacity in 3Q12 fell below 2mmbpd for the first time since 2008, which explains to a large degree why oil prices were stubbornly high in 2012, despite a general global economic slowdown. In fact, OPEC’s spare capacity is nearly 70% lower than the 6mmbpd seen on average
between 2000 and 2005. In this context, Daiwa’s 2013 average Brent oil price forecast of USD110/bbl looks attainable, if not conservative.
OPEC spare capacity vs. Brent oil price
Source: US Energy Information Administration
We also highlight that over 95% of this spare capacity is held within Saudi Arabia, thus magnifying the geopolitical risk in the Middle East. Thus, despite the fact that US oil production has increased steadily since 2008 due to the “shale gale”, and looks set to continue increasing YoY in 2013, the concentration of global spare capacity within one country remains a concern, in our view.
Breakdown of OPEC spare capacity by country
Source: US Energy Information Administration
The key downside risk for oil is a weak global economy, which may cause a contraction in oil demand. Should this occur, the markets will likely focus on high crude oil inventories globally and increasing US crude oil production data.
0
1
2
3
4
5
6
0
20
40
60
80
100
120
140
1Q07 2Q 3Q 4Q
1Q08 2Q 3Q 4Q
1Q09 2Q 3Q 4Q
1Q10 2Q 3Q 4Q
1Q11 2Q 3Q 4Q
1Q12 2Q 3Q
Brent oil price (LHS) OPEC spare capacity (RHS)
(mmbpd)(USD/bbl)
0.00 0.20 0.40 0.60 0.80 1.00 1.20 1.40 1.60 1.80 2.00
AlgeriaAngola
EcuadorIranIraq
KuwaitLibya
NigeriaQatar
Saudi ArabiaUAE
Venezuela
(mmbpd)
OPEC spare capacity is only held in three countries, with Saudi Arabia representing 96% of total OPEC spare capacity

2013 Outlook for Asia 4 January 2013
- 43 -
Key stock call for 2013
CNOOC Ltd (883 HK, HKD16.8, Buy [1]) Investment thesis For CNOOC, 2013 should be the first of three years of material production growth over 2013-15. Significant contributors include major projects in offshore China, both in shallow and deep water, as well as offshore West Africa and onshore US. In addition, we think regular quarterly project updates, together with news on progress for CNOOC’s new wells, could prove to be important share price drivers over the course of 2013. Relative to its Chinese oil company peers, we highlight CNOOC’s lack of regulatory risk, given it does not have a refining business in China. The company’s accelerating production growth does not appear to have been priced into the share price, as CNOOC is only trading at a 2013 PER of 8.8x, a 21% discount to the stock’s 10-year average of 11.1x. In the past two years, CNOOC’s production growth has arguably disappointed investors and, as a result, we believe the market is looking for tangible evidence of a return to growth. Importantly, the past 12 months has seen CNOOC trading at a PER discount to PetroChina (857 HK, HKD11.0, Outperform [2]), which is unusual since the former has traded at a circa 10% premium over the past 10 years.
CNOOC’s strategy review at the end of January 2013 should see the company reaffirm its 2011-15 production CAGR target of 6-11%, which we believe would be positive for the stock. In 2011, CNOOC’s low-single-digit production growth disappointed the market, which was exacerbated by the shutting-down of one of its largest oil fields, Penglai 19-3, due to an oil spill. The knock-on effect was felt in 2012 as the field was offline for the majority of 1H12 and thus production growth in 2012 will likely be slow again. Valuation We value CNOOC at HKD20.80 using a blended DCF/PER methodology. Our DCF utilises a WACC of 9.7% and a long-term (2016) oil price of USD95/bbl, while our target PER for 2013 is 11.0x, in line with the stock’s 10-year (2002-12) average. Risks to our call Downside risks to our positive view on CNOOC include lower oil and gas prices, operational risks associated with the extraction of oil and gas, and adverse government policies (either in its domestic or international operations), which could lower profitability and returns.
Regional Oil & Gas: valuation summary
Stock Price (LC) Mkt. cap Target Year-end PER (x) PBR (x) EV/EBITDA (x) Dividend yield (%) ROE (%)Company code 28-Dec-12 (USDm) Rating price (LC) Month FY1E FY2E FY1E FY2E FY1E FY2E FY1E FY2E FY2ECNOOC 883 HK 16.8 97,039 Buy 20.8 31-Dec 9.6 8.8 1.9 1.6 5.2 4.6 2.1 2.3 20.2PTT Exploration & Production PCL PTTEP TB 164.0 21,279 Buy 194.0 31-Dec 9.8 9.2 1.9 1.7 5.5 4.8 3.3 4.0 19.7PetroChina 857 HK 11.0 260,182 Outperform 11.8 31-Dec 12.4 9.8 1.5 1.4 5.7 4.9 3.3 4.2 14.7PTT PCL PTT TB 332.0 30,964 Outperform 380.0 31-Dec 9.2 8.0 1.5 1.3 6.3 5.7 3.3 3.8 17.9Oil & Natural Gas Corp ONGC IN 265.9 41,498 Outperform 285.0 31-Mar 10.2 8.1 1.5 1.4 4.0 3.2 3.8 3.8 17.7Sinopec Corp 386 HK 8.8 97,866 Underperform 7.3 31-Dec 10.1 8.6 1.2 1.1 5.2 4.7 2.2 2.6 13.0Thai Oil PCL TOP TB 68 4,502 Underperform 57 31-Dec 10.3 13.1 1.6 1.5 5.5 5.7 3.9 3.0 11.7Cairn India CAIR IN 320 11,136 Buy 390 31-Mar 5.2 4.6 1.0 0.9 3.2 2.3 3.8 4.3 20.2Source: Bloomberg, Daiwa forecasts
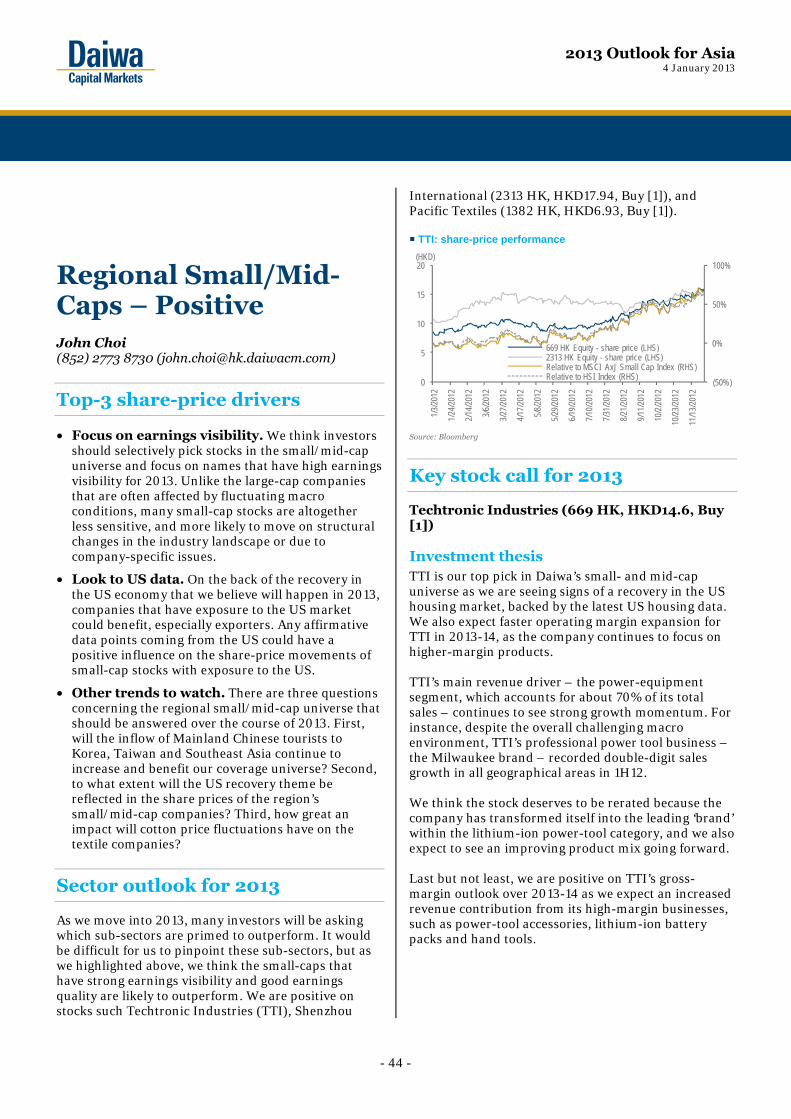
2013 Outlook for Asia 4 January 2013
- 44 -
Regional Small/Mid-Caps – Positive John Choi (852) 2773 8730 ([email protected])
Top-3 share-price drivers
• Focus on earnings visibility. We think investors should selectively pick stocks in the small/mid-cap universe and focus on names that have high earnings visibility for 2013. Unlike the large-cap companies that are often affected by fluctuating macro conditions, many small-cap stocks are altogether less sensitive, and more likely to move on structural changes in the industry landscape or due to company-specific issues.
• Look to US data. On the back of the recovery in the US economy that we believe will happen in 2013, companies that have exposure to the US market could benefit, especially exporters. Any affirmative data points coming from the US could have a positive influence on the share-price movements of small-cap stocks with exposure to the US.
• Other trends to watch. There are three questions concerning the regional small/mid-cap universe that should be answered over the course of 2013. First, will the inflow of Mainland Chinese tourists to Korea, Taiwan and Southeast Asia continue to increase and benefit our coverage universe? Second, to what extent will the US recovery theme be reflected in the share prices of the region’s small/mid-cap companies? Third, how great an impact will cotton price fluctuations have on the textile companies?
Sector outlook for 2013
As we move into 2013, many investors will be asking which sub-sectors are primed to outperform. It would be difficult for us to pinpoint these sub-sectors, but as we highlighted above, we think the small-caps that have strong earnings visibility and good earnings quality are likely to outperform. We are positive on stocks such Techtronic Industries (TTI), Shenzhou
International (2313 HK, HKD17.94, Buy [1]), and Pacific Textiles (1382 HK, HKD6.93, Buy [1]).
TTI: share-price performance
Source: Bloomberg
Key stock call for 2013
Techtronic Industries (669 HK, HKD14.6, Buy [1]) Investment thesis TTI is our top pick in Daiwa’s small- and mid-cap universe as we are seeing signs of a recovery in the US housing market, backed by the latest US housing data. We also expect faster operating margin expansion for TTI in 2013-14, as the company continues to focus on higher-margin products. TTI’s main revenue driver – the power-equipment segment, which accounts for about 70% of its total sales – continues to see strong growth momentum. For instance, despite the overall challenging macro environment, TTI’s professional power tool business – the Milwaukee brand – recorded double-digit sales growth in all geographical areas in 1H12. We think the stock deserves to be rerated because the company has transformed itself into the leading ‘brand’ within the lithium-ion power-tool category, and we also expect to see an improving product mix going forward. Last but not least, we are positive on TTI’s gross-margin outlook over 2013-14 as we expect an increased revenue contribution from its high-margin businesses, such as power-tool accessories, lithium-ion battery packs and hand tools.
(50%)
0%
50%
100%
0
5
10
15
20
1/3/20
12
1/24/2
012
2/14/2
012
3/6/20
12
3/27/2
012
4/17/2
012
5/8/20
12
5/29/2
012
6/19/2
012
7/10/2
012
7/31/2
012
8/21/2
012
9/11/2
012
10/2/
2012
10/23
/2012
11/13
/2012
669 HK Equity - share price (LHS)2313 HK Equity - share price (LHS)Relative to MSCI AxJ Small Cap Index (RHS) Relative to HSI Index (RHS)
(HKD)

2013 Outlook for Asia 4 January 2013
- 45 -
Valuation Our six-month target price for TTI is HKD19.20, which is based on a 2013E target PER of 16.5x (equivalent to TTI’s average of 16.4x over 2001-06, which was a period of high growth for the company), backed by our forecast earnings CAGR of 25% for 2012-14E.
Risks to our call The key risk to our call would be a significant deterioration in the US economy, especially worse-than-expected data in the US housing market.
Regional Small/Mid-Caps: valuation summary
Stock Price (LC) Mkt. cap Target Year-end PER (x) PBR (x) EV/EBITDA (x) Dividend yield (%) ROE (%)Company code 28-Dec-12 (USDm) Rating price (LC) Month FY1E FY2E FY1E FY2E FY1E FY2E FY1E FY2E FY2ETechtronic Industries 669 HK 14.60 3,395 Buy 19.2 31-Dec 16.0 12.4 2.2 1.9 8.7 7.2 1.6 2.1 16.3Pacific Textiles Holdings 1382 HK 6.93 1,287 Buy 7.7 31-Mar 10.3 9.1 2.3 2.1 6.0 5.3 9.7 7.2 24.3Source: Bloomberg, Daiwa forecasts

2013 Outlook for Asia 4 January 2013
- 46 -
Regional Transportation – Positive Kelvin Lau (852) 2848 4467 ([email protected])
Top-3 share-price drivers
• We believe market sentiment is currently overly bearish on the outlook for the container-shipping industry in 2013. We expect capacity discipline to continue in 2013 through an increase in scrapping and idling.
Current idle capacity and our forecasts
Source: Alphaliner, Daiwa forecasts
• As a result of better capacity discipline, freight rates should remain at profitable levels for most routes globally, which would mean improved profitability for the liner companies in 2013. The rate of decline we have seen since September 2012 has been due to usual seasonal factors, in our view.
Trend of SCFI index
Source: Shanghai Shipping Exchange
Note: Europe: USD/TEU, US: USD/FEU; SCFI: Shanghai Containerized Freight Index
• Though we have low expectations for global demand growth in 2013, a gradual global economic recovery and the consistent demand recovery we are seeing in the US housing and auto markets could result in a positive surprise for restocking demand in 2013.
US: new housing starts
Source: Bloomberg
Sector outlook for 2013
We forecast global freight demand to remain stable for 2013, posting around a 6% YoY increase. The major drag is likely to remain trade on the Asia-Europe route. However, we expect the liners to remain cautious when it comes to allocating capacity, which should lead to an effective capacity increase of only 7% YoY in 2013, based on our forecasts, in line with our demand-growth forecast. Demand and supply for the container-shipping industry
Source: Alphaliner, Daiwa forecasts
0%
3%
6%
9%
12%
15%
0.0
0.4
0.8
1.2
1.6
Jan-1
0Ma
r-10
A pr-1
0Ju
n-10
Aug-1
0Oc
t-10
Dec-1
0Ja
n-11
Mar-1
1Ma
y-11
Jul-1
1Se
p-11
Nov-1
1Ja
n-12
Feb-1
2Ap
r-12
Jun-1
2Au
g-12
Oct-1
220
13E
(TEU m)
Idle capacity (LHS) Idle capacity forecasts (LHS)Idle % (RHS) Idle % forecasts (RHS)
0
800
1,600
2,400
3,200
4,000
4,800
Jan-1
1Fe
b-11
Mar-1
1Ap
r-11
May-1
1Ju
n-11
Jul-1
1Au
g-11
Sep-1
1Oc
t-11
Nov-1
1De
c-11
Jan-1
2Fe
b-12
Mar-1
2Ap
r-12
May-1
2Ju
n-12
Jul-1
2Au
g-12
Sep-1
2Oc
t-12
Nov-1
2
(Index)
Overall Index Europe USWC USEC
(60)
(40)
(20)
0
20
40
60
Jan-0
5
Jul-0
5
Jan-0
6
Jul-0
6
Jan-0
7
Jul-0
7
Jan-0
8
Jul-0
8
Jan-0
9
Jul-0
9
Jan-1
0
Jul-1
0
Jan-1
1
Jul-1
1
Jan-1
2
Jul-1
2
(YoY %)
(10)
(5)
0
5
10
15
20
2000
2001
2002
2003
2004
2005
2006
2007
2008
2009
2010
2011
2012
E
2013
E
2014
E
(YoY %)
Supply DemandSupply forecasts Demand forecasts

2013 Outlook for Asia 4 January 2013
- 47 -
Key stock call for 2013
Orient Overseas International (OOIL) (316 HK, HKD50.3, Buy [1]) Investment thesis The liners should benefit from potential restocking demand in the near term, especially in the US, due to a continuous improvement of consumer confidence in the US since August. Also, the current low inventory-to-sales ratio should trigger more restocking demand. US: inventory-to-sales ratio and consumer confidence index
Source: Bloomberg
We believe OOIL has the best exposure mix, with more to the US and less to Asia-Europe routes. A potentially high revenue contribution from the intra-Asia route in 2013 would also provide stable earnings growth for the company and would capture the structural changes we are seeing from the increase in intra-Asia demand. We expect OOIL to remain the most profitable liner in the world in 2013.
Revenue breakdown for the liners 2011 (%) OOIL COSCO NOL MOL CSCL Hanjin EMC YMM SITCTranspacific 34 37 52 36 31 51 40 42 Asia-Europe 19 28 22 35 23 29 25 31 Trans-Atlantic 12 5 Intra-Asia /Australasia 34 19 26 15 17 15 21 24 100 Domestic 11 21 3 Others 5 14 8 14 0 Total % of IA, TP and domestic 69 68 78 51 69 66 61 69 100 Source: Companies
For 2013, we expect OOIL to benefit from the announced capacity cuts by the major liners, such as Maersk (Not rated) and CMA CGM Group (Not listed); and for 2014, demand and supply growth is likely to reach equilibrium. Capacity cuts on US/EU routes
Source: Alphaliner, Daiwa forecasts
Note: AE = Asia-Europe route, TP = Trans-Pacific route
Valuation Our six-month target price for OOIL of HKD67 is based on a 2013E PBR of 1.1x, which is based on the stock’s 12-month average PBR for the 2H06-1H07 period, when the industry was in a recovery cycle. Risks to our call The major risks to our call on OOIL would include a worse-than-expected uplift in freight volume and freight increases, and higher-than-expected fuel price rises.
Regional Transportation: valuation summary Stock Price (LC) Mkt. cap Target Year-end PER (x) PBR (x) EV/EBITDA (x) Dividend yield (%) ROE (%)Company code 28-Dec-12 (USDm) Rating price (LC) Month FY1E FY2E FY1E FY2E FY1E FY2E FY1E FY2E FY2EOrient Overseas International 316 HK 50.3 4,061 Buy 67 31-Dec 15.2 10.2 0.9 0.8 8.9 7.3 2.1 3.1 8.5China COSCO 1919 HK 3.8 5,021 Buy 4.6 31-Dec nm nm 1.2 1.2 nm 39.9 0.0 0.0 NmChina Shipping Container Lines 2866 HK 2.3 3,436 Buy 2.74 31-Dec 527.9 17.4 0.8 0.8 19.9 8.6 0.0 0.0 4.5Neptune Orient Lines (Singapore) NOL SP 1.1 2,420 Hold 1.2 31-Dec nm 15.0 1.1 0.9 37.9 8.2 0.0 4.3 6.5Evergreen Marine 2603 TT 17.4 2,076 Hold 16.4 31-Dec 56.6 11.6 1.0 0.9 14.7 7.5 0.0 0.0 8.0Yang Ming Marine Transport 2609 TT 13.9 1,349 Sell 11.0 31-Dec nm 15.6 1.5 1.4 17.0 7.4 0.0 0.0 9.0Source: Bloomberg, Daiwa forecasts
020406080100120140160
1.12
1.18
1.24
1.30
1.36
1.42
1.48
Jan-0
0
Jan-0
1
Jan-0
2
Jan-0
3
Jan-0
4
Jan-0
5
Jan-0
6
Jan-0
7
Jan-0
8
Jan-0
9
Jan-1
0
Jan-1
1
Jan-1
2
(Index)(Index)
Inventory-to-sales Consumer confidence (10%)(8%)(6%)(4%)(2%)
0%2%4%
Jan-1
2
Feb-1
2
Mar-1
2
Apr-1
2
May-1
2
Jun-1
2
Jul-1
2
Aug-1
2
Sep-1
2
Oct-1
2
Nov-1
2
Dec-1
2 E
(YoY)
AE AE - forecasts TP TP - forecasts

2013 Outlook for Asia 4 January 2013
- 48 -
Greater China Semiconductors – Neutral Eric Chen (852) 2773 8702 ([email protected])
Top-3 share-price drivers
• In short, the big players outperformed in terms of market-share gains and share prices, and became the key drivers of revenue growth in each subsector (foundry, fabless and backend companies) in 2012. The technology and capex investment gap between the leading players and their second-tier peers increased. We expect the big semiconductor manufacturers, such as TSMC and Samsung Electronics (SEC), to continue to gain market share in 2013 on the back of successful technology migration in 2012.
• In terms of semiconductor demand, the communications segment (smartphones and broadband ICs) is likely to have seen greater revenue growth in 2012 than the PC and consumer segments. Qualcomm’s FY12 (September year end) revenue growth of 28% YoY and our 2012 revenue forecast for MediaTek of 18% YoY are likely to have been driven by strong smartphone shipments, mainly due to the rapidly growing China smartphone market.
• We think the technology/product gap between the China smartphone players and the global brand-name players is narrowing (ie, for multiple-core products), while we estimate that the bill of materials cost for China smartphones is 40% lower than that of the global makers. Meanwhile, we have seen more people in emerging markets shifting from feature phones to affordable smartphones. We believe the China handset makers are attempting to duplicate rapidly their success with feature phones in the smartphone segment. On our forecasts, China’s smartphone-IC shipments should peak over 2012-14, rising at a 61% CAGR, essentially mirroring the trend in China’s feature-phone IC shipments. However, the second-tier global brands should be negatively affected by losing market share to their China-based rivals.
MediaTek: smartphone and feature-phone IC business
Source: Company, Daiwa forecasts
MediaTek vs. Qualcomm: dual core and quad core competition
MediaTek Qualcomm for China Qualcomm for global
brands Single core MT6575 MSM7227A Process 40nm 45nm AP CPU 1GHz, Cortex A9 1GHz, Cortex A5 Schedule for commercialised shipments
1Q12 1Q12
Dual code MT6577 (MT6583 in 2Q13)
MSM 8225 (8227) MSM 8960
Process 40nm 45nm 28nm AP CPU Dual-core, 1GHz, Cortex
A9 Dual-core, 1GHz, Cortex
A5 Dual-core, 1.4 GHz,
Cortex A6 Schedule for commercialised shipments
end-2Q12 2Q12 1Q12
Quad core MT6588 (6589) /MT6599 MSM8225Q MSM 8064 Process 28nm 28nm 28nm AP CPU Quad-core, 1.5GHz,
Cortex A7 Quad-core, 1.5GHz,
Cortex A5 Quad-core, 1.7GHz,
Krait Schedule for commercialised shipments
1Q13 1Q13 3Q12
Source: Daiwa
Sector outlook for 2013
We believe the key revenue-growth drivers for the semiconductor sector in 2013 should be the smartphone IC segment, broadband, Windows 8, and technology migration. As such, we expect Apple’s, SEC, and China’s smartphone semiconductor shipment growth to remain high for 2013. We forecast China smartphone-IC shipments to rise in 2013 to 430m units from 240m units in 2012E. We also forecast China smartphone shipments to account for over 42% of global smartphone shipments in 2013, up from 32% in 2012. In China’s smartphone food chain, we believe the chipset makers are in a position to realise relatively large gross-profit margins. We attribute the China smartphone-IC makers’ value to their competence in turnkey solutions incorporating advanced system design, the Android OS and software development. IC makers with a wide range of products look to be the best positioned to expand in 2013. We note that MediaTek has
2011 2012E 2013E 2014E 2015E 2016E
-
100
200
300
400
500
600
0
100
200
300
400
500
600
2004 2005 2006 2007 2008 2009 2010 2011
(m units)(m units)
Feature phone IC (LHS) Smartphone IC (RHS)
2012-2014ECAGR 61%
2005-2009CAGR 78%

2013 Outlook for Asia 4 January 2013
- 49 -
been trying to narrow the technology gap with Qualcomm and increase its portfolio in line with Qualcomm’s. China: smartphone shipments
Source: Daiwa forecasts
Competition among the main players (Qualcomm, MediaTek, and Spreadtrum Communications) should be keen among the global smartphone-IC players in 2013. For the next 1-2 years, we prefer to believe that the local players are better positioned to meet the local supply-chain’s/ecosystem’s turnkey solution requirements. Our market research indicates that MediaTek’s new quad-core smartphone model is likely to gain more market share than Qualcomm’s quad-core 8225Q smartphone IC in the China smartphone market in 2013. We forecast the 2013 capex of the major semiconductor players to fall by 9% YoY (while the pace of capex growth for the tier-two foundry makers is likely to be even slower). Even with their more disciplined capex plans, TSMC and SEC should maintain their leading technology positions on the back of them having successfully migrated technology in 2012. Their 20nm process wafer primary shipments are likely to start from the end of 2013, and this should be an important share-price driver over the next couple of quarters.
Key stock call for 2013
MediaTek (2454 TT, TWD323.5, Buy [1])
Investment thesis We expect MediaTek’s profit margin to expand over the long term on the back of a rebound in its blended ASP from rising smartphone-IC shipments and a better product mix/offering. We forecast the company’s 2013 revenue to rise by 17% YoY (excluding the impact of it acquiring 100% of MStar Semiconductor in May 2013). Although we forecast a 5% YoY drop in handset-IC shipments for 2012 (on declining feature-phone IC shipments) and price competition to weigh on the gross-profit margin over the next 1-2 quarters, MediaTek’s aim of prioritising market-share gains (using its aggressive pricing strategy) should leave the company well positioned to gain market share over the long term. We forecast the company’s 2013 smartphone-IC shipments to be 205m units, up from 108m units for 2012. With rising smartphone-IC shipments, we forecast a 17% YoY improvement in the handset-IC blended ASP, to USD4.9 for 2013, compared with a 16% YoY increase in 2012 and a 31% YoY decline in 2011. We believe the Bloomberg consensus 2013-14 earnings forecasts are likely to be raised as the upward trend in the blended ASP, improved economies of scale, and rapid product migration should support gross and operating-profit margin improvements over 2013-14E. Valuation The stock is trading currently at a PER of 16.9x on our 2013 EPS forecast, compared with a 5.5-34.3x PER range on its 12-month forward EPS over the past five years. We have a Buy (1) rating and six-month target price of TWD383, based on a PER of 20x (the stock’s average over the past year) on our 2013 EPS forecast. Risks The main risks to our call would include lower-than-expected smartphone-IC shipments to China.
Greater China Semiconductors: valuation summary Stock Price (LC) Mkt. cap Target Year-end PER (x) PBR (x) EV/EBITDA (x) Dividend yield (%) ROE (%)Company code 28-Dec-12 (USDm) Rating price (LC) Month FY1E FY2E FY1E FY2E FY1E FY2E FY1E FY2E FY2EMediaTek 2454 TT 323.5 15,102 Buy 383.0 31-Dec 24.6 17.0 3.5 3.4 20.9 9.5 2.3 2.7 21.9Advanced Semiconductor Engineering
2311 TT 25.20 6,837 Buy 27.4 31-Dec 14.6 12.9 1.6 1.5 6.1 5.3 2.0 1.7 11.9
Semiconductor Manufacturing Int'l Corp
981 HK 0.39 1,531 Underperform 0.3 31-Dec nm nm 0.7 0.7 3.5 2.7 0.0 0.0 0.1
Siliconware Precision 2325 TT 31.00 3,338 Underperform 27.4 31-Dec 17.5 16.2 1.6 1.6 6.1 5.8 3.8 4.3 9.9Taiwan Semiconductor Manufacturing
2330 TT 97.00 89,774 Hold 92.9 31-Dec 15.7 15.3 3.4 3.0 8.3 7.6 2.6 2.6 20.9
United Microelectronics 2303 TT 11.70 5,317 Hold 11.4 31-Dec 17.5 15.4 0.7 0.7 3.9 4.1 3.4 2.8 4.5ASM Pacific Technology 522 HK 93.75 4,832 Sell 72.3 31-Dec 22.3 14.7 5.1 4.3 17.8 10.0 2.7 3.7 31.5Source: Bloomberg, Daiwa forecasts
64
240
430
0
100
200
300
400
500
2011 2012E 2013E
(m units)
TD-SCDMA EDGE WCDMA CDMA
+275% YoY
+79% YoY

2013 Outlook for Asia 4 January 2013
- 50 -
Greater China Smartphones – Positive Birdy Lu (886) 2 8758 6248 ([email protected])
Top-3 share-price drivers
• Strong shipment growth. We forecast global smartphone shipments to reach 860m units for 2013, up 30% YoY, driven mainly by demand from emerging markets (notably Greater China, the Middle East and Africa).
Smartphone demand should continue to surge
Source: Gartner, “Market Share: Mobile Devices by Region and Country, 2Q12’, by Anshul Gupta, David Glenn, Roberta Cozza, Tuong Huy Nguyen, Carolina Milanesi, Sandy Shen, Hugues J. De La Vergne, CK Lu, published 13 August 2012; compiled by Daiwa
• Market-share consolidation. In our view, smartphones are becoming mass-market consumer-electronic devices (like digital cameras, flat-panel TVs, etc). In this type of market, we believe vendors with high-performance premium devices (Apple and Samsung Electronics [SEC]) and those with low-cost devices (Chinese vendors, such as ZTE, Huawei, Lenovo, etc.) can gain market share in 2013.
Market shares of major players (3Q12)
Source: Gartner, ‘Market Share: Mobile Devices by Region and Country, 2Q12’, by Anshul Gupta, David Glenn, Roberta Cozza, Tuong Huy Nguyen, Carolina Milanesi, Sandy Shen, Hugues J. De La Vergne, CK Lu, published 13 August 2012; compiled by Daiwa
• Design upgrades. To take users’ experience to the next level, we believe smartphone vendors will need to upgrade those components that can make their devices look, sound, and handle touch better, such as displays, cameras, acoustics and mechanical components.
Sector outlook for 2013
Smartphone penetration should continue to rise We expect strong demand for smartphones to be the major driver of smartphone shipment growth in 2013. At the same time, we still see room for smartphone penetration to rise further in developed countries (particularly North America and Western Europe). Gartner projects penetration in developed countries to increase from 60%+ in 2012 to 70%+ in 2013. As such, we expect smartphone shipment growth to be maintained at 15-20% YoY in developed countries in 2013.
Smartphone penetration by region Smartphone penetration (%) 2008 2009 2010 2011 2012E 2013E 2014E 2015E 2016EAsia-Pacific 6 8 10 18 26 30 34 39 45Japan 49 52 53 68 84 95 98 99 99Western Europe 18 24 44 54 64 71 79 84 89North America 20 25 38 55 67 79 84 88 90Latin America 3 6 11 18 22 27 36 43 50Middle East & Africa 9 10 12 17 20 27 34 40 46Eastern Europe 8 9 13 18 29 43 55 61 67Total 11 14 19 27 35 40 46 50 56Source: Gartner (‘Market Share: Mobile Devices by Region and Country, 2Q12’ by Anshul Gupta, David Glenn, Roberta Cozza, Tuong Huy Nguyen, Carolina Milanesi, Sandy Shen, Hugues J. De La Vergne, Annette Zimmermann, Atsuro Sato and CK Lu, published on 13 August 2012), compiled by Daiwa
0%
10%
20%
30%
40%
50%
60%
70%
0
200
400
600
800
1,000
1,200
1,400
2011 2012E 2013E 2014E 2015E 2016E
Smartphone shipment (LHS) YoY growth (RHS)
(m unit)
Apple13.9%
SEC32.5%
RIM5.3%
Nokia4.2%
HTC5.0%
ZTE4.5%
Huawei4.6%
Others29.9%

2013 Outlook for Asia 4 January 2013
- 51 -
Key stock call for 2013
Hon Hai Precision Industry (2317 TT, TWD88.9, Buy [1]) Investment thesis Hon Hai Precision Industry (Hon Hai) is our top pick in the sector. Hon Hai is a key manufacturer of Apple’s iPhone, iPad, iPad Mini, iPod, Apple TVs (set-top boxes) and iMacs (DT PC) for Apple. Market-share gains. We believe premium device providers such as Apple and SEC will continue to gain market share in 2013. As the key supplier to Apple, Hon Hai should remain a direct beneficiary of the strong demand for all i-devices. Margin improvements. We expect Hon Hai’s gross-profit margin and operating-profit margin to trend up in 2013 and 2014, due to our expectations of easing pricing pressure from key clients, increased investment by the company in process automation, and the company supplying more of its mechanical components in-house.
Strong revenue growth. Hon Hai should benefit not only from Apple’s market-share gains (we forecast the iPhone and iPad together to account for about 40% of Hon Hai’s sales for 2012 and 44% for 2013), but also from its market-share gains in big-size LCD-TV OEM business from Sharp, Vizio and cable-TV operators. Valuation We have a Buy (1) rating on Hon Hai. Our six-month target price is TWD127, based on a target PER of 12x (close to the stock’s trading average over the past three years) applied to our 2013 EPS forecast. Risks to our call The key sector risks would include: 1) sharper-than-expected price competition leading to ASP and margin pressures in the smartphone supply chain, and 2) USD depreciation against Asian currencies, including the TWD, which could also weigh on the supply chain’s gross margin.
Greater China Smartphone: valuation summary Stock Price (LC) Mkt. cap Target Year-end PER (x) PBR (x) EV/EBITDA (x) Dividend yield (%) ROE (%)Company code 28-Dec-12 (USDm) Rating price (LC) Month FY1E FY2E FY1E FY2E FY1E FY2E FY1E FY2E FY2EHon Hai Precision Industry 2317 TT 88.9 36,154 Buy 127.0 31-Dec 11.1 8.4 1.6 1.4 5.9 4.4 2.3 3.0 17.4Largan Precision 3008 TT 778.0 3,843 Buy 999.0 31-Dec 21.0 12.5 4.6 3.7 13.6 8.5 2.4 4.0 32.9AAC Technologies 2018 HK 27.0 4,373 Buy 34.5 31-Dec 15.3 11.5 4.4 3.5 11.6 8.3 3.1 4.1 34.3TXC Corp 3042 TT 47.8 495 Buy 63.0 31-Dec 13.1 10.6 1.9 1.7 6.7 5.5 4.6 5.7 17.2Foxconn International Holdings 2038 HK 3.7 3,536 Buy 3.8 31-Dec nm 198.9 1.0 1.0 nm 7.4 0.0 0.0 0.5Catcher Technology 2474 TT 144.0 3,787 Outperform 165.0 31-Dec 11.9 9.4 1.8 1.6 5.8 4.6 3.4 4.2 17.6HTC Corp 2498 TT 300.5 8,891 Hold 265.0 31-Dec 15.4 17.9 3.1 2.8 9.6 10.7 3.2 3.1 16.5Source: Bloomberg, Daiwa forecasts

2013 Outlook for Asia 4 January 2013
- 52 -
Greater China PC Hardware – Neutral Christine Wang (886) 2 8758 6249 ([email protected])
Top-3 share-price drivers
• Better-than-expected demand for Windows 8 would be positive for share prices. We do not expect the release of Microsoft’s Windows 8 to trigger demand for notebook PCs. In our view, Windows 8 is designed primarily for the tablet and smartphone markets, not the notebook market. In the consumer-PC market, it is the pricing of the new Wintel platform (Ivy Bridge and Windows 8) products, not the appeal of the design, which is key to demand, in our view. For tablet PCs, we do not think screens larger than 13 inches work for touch, because it is difficult to both type and hold a tablet at the same time if the screen is too large. This is why most tablets have a screen size of less than 11 inches. That said, if sales of Windows 8 devices and the Microsoft Surface Pro are better than we and the market expects in 1H13, we believe this would be a positive catalyst for sector share prices in 2013, as current expectations among the supply chain are very low.
• Diversified products might trigger demand, but clear market segmentation is required. So many different new products (tablets, Windows 8 notebook PCs and converged devices) came onto the market in 4Q12 that many consumers are still confused when it comes to choosing what they really want. We believe clear target marketing is needed for the PC OEMs to educate consumers about which devices to buy, and think it might take 1-2 quarters for consumers to work out which devices they really want.
• We prefer OEMs over ODMs. We expect the original equipment manufacturers (OEM) to benefit from better cost structures than the ODMs, as our outlook for no growth in PC shipments in 2013 is likely to compel ODMs to compete aggressively for orders. As such, we continue to prefer the OEMs over the ODMs, and believe that in addition to better operating-profit margins on the PC products, they should see lower revenue volatility than the ODMs.
Sector outlook for 2013
We expect the PC market to remain sluggish in 2013 and forecast global shipments of 354m units, flat YoY. We forecast notebook-PC shipments to rise by only 1% YoY to 204m units and desk-top PC shipments to dip by 1% YoY to 149m units for 2013. We are more positive on the outlook for tablets and forecast global shipments of 180m units for 2013, up 54% YoY compared with 117m for 2012E. We think the large players in the tablet market will remain the same, with Apple still top of the league. Global PC shipments and growth (2002-14E)
Source: IDC, Daiwa forecasts
Global tablet shipments vs. notebook shipments (2010-14E)
Source: IDC, Daiwa forecasts
We do not expect demand for Windows 8 products to take off before 2H13 – until consumers have a better idea of the types of devices that match their needs. Initial feedback from the retail channels indicates that Windows 8 notebooks with a touch function are selling better than those without a touch function, but pricing and design are still the two key factors influencing sales. For example, ASUSTeK’s low-priced Vivobook and Acer’s high-priced S7 are both selling well. Turning to the ultrabook, we believe pricing is crucial to trigger demand for this product in 2H13, especially
(5% )
0%
5%
10%
15%
20%
050
100150200250300350400
2002
2003
2004
2005
2006
2007
2008
2009
2010
2011
2012
E
2013
E
2014
E
Worldwide PC shipments (LHS) YoY growth (RHS)
(m)
(50% )
0%
50%
100%
150%
200%
250%
0
50
100
150
200
250
2010 2011 2012E 2013E 2014ENotebooks (LHS) Tablets (LHS)
NB YoY (RHS) Tablet YoY (RHS)
(m)

2013 Outlook for Asia 4 January 2013
- 53 -
those models with the touch function. Most ultrabooks are still priced at above USD1,000 and the market for them is small (5% of total notebook shipments globally for 2012E based on our forecasts). Touch panels, the new Microsoft operating system, storage and casing design are all likely to have an impact on the bill-of-material (BOM) cost. While we expect global penetration of the ultrabook to increase to 19% (shipments of 43m units) in 2013, up from 6% for 2012E, we believe 2014 will be a critical year for this product, when pricing and costs are likely to come down and should lead to penetration of 30% that year. Strength in tablet shipments might not be favourable for the ODMs, in our view, as many are adopting the electronic manufacturing services (EMS) business model, which is likely to lead to lower profitability. In addition, the current trend among OEMs to put more R&D resources into in-house design for high-end flagship models also looks negative for ODMs. As such, we would avoid ODMs in general.
Key stock call for 2013
Lenovo (992HK, HKD7.2, Outperform [2]) Investment thesis Best-placed of the OEMs. We think Lenovo is the best-positioned of the PC OEMs globally in terms of its strategy for PCs and other devices. We expect the company to continue to gain market share in the PC market throughout 2013 given its strength in both consumer and commercial products, and its recent expansion through M&A into key emerging markets – Eastern Europe, Brazil, etc. We project growth in its notebook-PC shipments to continue to outpace global industry growth for 2013, accelerating by 17% YoY versus flat industry shipment growth globally.
Balanced product lines. Aside from its PC business, Lenovo’s strong smartphone shipments demonstrate that its strategy of focusing on the mid-to-low end and its fast-to-market approach are working, in our view. We forecast its mobile-Internet and digital-home (MIDH) business to account for 10% of its total revenue for FY14 (up from 5% for FY12 and 8% for FY13E). This contrasts sharply with other PC OEM brands – Acer, ASUSTeK, HP and Dell – which have not delivered strong smartphone offerings yet.
Lenovo: revenue breakdown by product
Source: Company, Daiwa forecasts
Strong earnings growth for FY14E. We forecast Lenovo to deliver strong net profit growth of 27% YoY for FY14, on the back of 10% YoY revenue growth and slight margin expansion (we project its operating-profit margin to expand from 2.2% for FY13 to 2.5% for FY14). Valuation Our six-month target price is HKD8.30, based on a target PER of 15x (close to the stock’s past-5-year mid-cycle PER) applied to our FY14 EPS forecast. Risks to our call The main risk would be slower-than-expected global PC market demand.
Greater China PC Hardware: valuation summary Stock Price (LC) Mkt. cap Target Year-end PER (x) PBR (x) EV/EBITDA (x) Dividend yield (%) ROE (%)Company code 28-Dec-12 (USDm) Rating price (LC) Month FY1E FY2E FY1E FY2E FY1E FY2E FY1E FY2E FY2EPegatron Corp 4938 TT 37.6 2,918 Buy 47.0 31-Dec 14.8 9.7 0.8 0.8 10.4 8.8 0.0 4.1 8.0Lenovo Group 992 HK 7.2 9,386 Outperform 8.3 31-Mar 16.1 12.8 4.7 3.5 5.2 3.4 0.0 0.0 31.6Compal Electronics 2324 TT 19.6 2,970 Hold 17.0 31-Dec 12.7 10.2 0.7 0.7 3.5 3.0 7.2 4.4 7.2Wistron 3231 TT 30.1 2,279 Hold 27.0 31-Dec 9.2 7.7 1.0 1.0 4.0 3.0 7.3 5.5 12.8ASUSTeK Computer 2357 TT 326.5 8,464 Underperform 270.0 31-Dec 11.3 11.2 1.9 1.8 8.0 7.3 4.4 5.8 16.7Acer 2353 TT 25.2 2,460 Sell 20.0 31-Dec 80.5 18.1 0.9 0.9 10.3 4.8 0.0 0.5 5.0Source: Bloomberg, Daiwa forecasts
0%
20%
40%
60%
80%
100%
FY08 FY09 FY10 FY11 FY12 FY13E FY14E FY15ENotebooks Desktops MIDH Others

2013 Outlook for Asia 4 January 2013
- 54 -
China Auto – Positive Jeff Chung (852) 2773 8783 ([email protected])
Top-3 share-price drivers
• Strong growth in lower-tier cities. We expect relatively strong GDP growth in China’s lower-tier cities to continue to support new car sales in 2013. While Daiwa forecasts GDP growth of 8% YoY for China as a whole in 2013, we look for growth in passenger vehicle sales in tier-2 to tier-4 cities to exceed 15% YoY in 2013-14.
• Mid-range segment could cannibalise luxury segment. With fixed costs such as licence fees and parking charges rising, we believe entry-level luxury cars are becoming more appealing to customers. This is likely to trigger a substitution effect, whereby would-be buyers shift their attention from mid-range cars to more affordable models such as the BMW 3-series and X1 SUV.
• Positive outlook for SUV sales. We are upbeat on the outlook for SUV sales at the sector and company levels. We estimate that SUV sales accounted for 13.6% of passenger vehicle sales volume in 2012, up from 11% in 2011. Moreover, we note SUV sales growth has outperformed sedan sales growth by 20-43pp over the past 33 months (growth for 11M12 stood at 24% YoY), indicating a marked shift in buyers’ preferences. Separately, we expect ongoing market consolidation to lead to around 12% of the SUV sales volume shifting from lower-tier domestic brands to quality names.
Sector outlook for 2013
We remain positive on the sector, and forecast 10-12% YoY sales volume growth for passenger vehicles, backed by strong demand in inland areas, the recent recovery in the PMI, as well as stronger M2 growth.
China passenger vehicle sales growth
Source: CAAM, Daiwa forecasts
Key stock call for 2013
Dongfeng Motor (489 HK, HKD11.98, Underperform [4]) Investment thesis We believe Dongfeng Motor Group’s (DFM) ‘golden period’ of earnings growth has ended. In our view, the company has decoupled from broader sector growth trends, such that its earnings growth is likely to underperform the sector’s average for the next two years. We forecast DFM to record a 6.7% EPS CAGR for 2012-14, down sharply from the 38.4% CAGR it saw for 2008-12. As we see it, the company’s ageing product line-up is likely to dampen the prospect of a significant recovery in its sales in 2013. We expect growth in sales of DFM’s high-margin products — such as the Teana and CR-V — to fall short of sales growth in the mass market as a whole in 2013. At the same time, DFM’s share of the SUV market, which had declined to 6.6% by October 2012, from 10.4% in July 2012, is likely to wane further amid heightened competition in 2013. Valuation Given our expectation that earnings growth at DFM for 2012-14 will be markedly lower than in recent years, we value the shares on a 2013E PER of 7x, set at a 0.5SD to the stock’s past-5-year average multiple. Our six-month target price of HKD8.75 is equivalent to 1x PBR for 2013E.
33.4%
5.0%7.0%
11.0%14.0%
16.0%
4.6% 5.5% 6.3% 7.4% 8.5% 9.8%
0%
5%
10%
15%
20%
25%
30%
35%
40%
2010 2011 2012E 2013E 2014E 2015E
YoY growth (PV)Penetration rate (PV)

2013 Outlook for Asia 4 January 2013
- 55 -
Risks to our call 1. If the government were to introduce additional hard or soft subsidies, such as a VAT cut, the market’s earnings forecasts for the auto companies would likely increase, since customers in China are sensitive to price changes.
2. If China were to experience a significant recovery in its GDP growth in 2013, we would likely raise our sales growth outlook for the sector.
3. A rapid recovery in commercial vehicle sales growth spurred by unexpected government initiatives would be a risk to our Underperform call.
4. If DFM’s JV partners, Nissan and Honda, were to aggressively launch new models in 2014, thereby lowering the average age of the company’s product line, DFM would become more competitive and its earnings prospects for 2014 would be better than we now assume.
China Auto: valuation summary
Stock Price (LC) Mkt. cap Target Year-end PER (x) PBR (x) EV/EBITDA (x) Dividend yield (%) ROE (%)Company code 28-Dec-12 (USDm) Rating price (LC) Month FY1E FY2E FY1E FY2E FY1E FY2E FY1E FY2E FY2EBrilliance China Automotive 1114 HK 9.46 6,155 Buy 11.40 31-Dec 15.9 11.0 4.1 3.0 11.6 7.8 0.0 0.0 31.3Geely Automobile 175 HK 3.70 3,574 Outperform 3.95 31-Dec 12.2 9.2 1.9 1.6 6.3 4.6 0.9 1.1 21.7Dongfeng Motor Group 489 HK 11.98 13,315 Underperform 8.75 31-Dec 9.9 9.6 1.6 1.4 3.8 3.3 1.5 1.6 15.2Source: Bloomberg, Daiwa forecasts
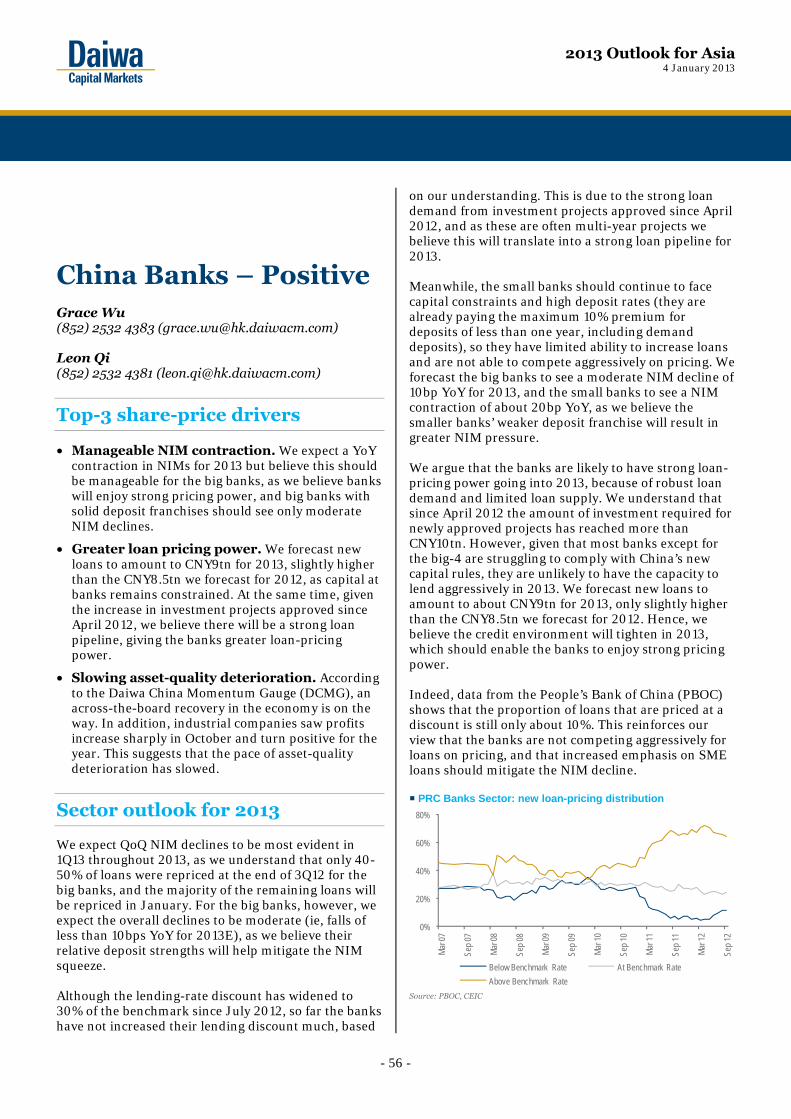
2013 Outlook for Asia 4 January 2013
- 56 -
China Banks – Positive Grace Wu (852) 2532 4383 ([email protected]) Leon Qi (852) 2532 4381 ([email protected])
Top-3 share-price drivers
• Manageable NIM contraction. We expect a YoY contraction in NIMs for 2013 but believe this should be manageable for the big banks, as we believe banks will enjoy strong pricing power, and big banks with solid deposit franchises should see only moderate NIM declines.
• Greater loan pricing power. We forecast new loans to amount to CNY9tn for 2013, slightly higher than the CNY8.5tn we forecast for 2012, as capital at banks remains constrained. At the same time, given the increase in investment projects approved since April 2012, we believe there will be a strong loan pipeline, giving the banks greater loan-pricing power.
• Slowing asset-quality deterioration. According to the Daiwa China Momentum Gauge (DCMG), an across-the-board recovery in the economy is on the way. In addition, industrial companies saw profits increase sharply in October and turn positive for the year. This suggests that the pace of asset-quality deterioration has slowed.
Sector outlook for 2013
We expect QoQ NIM declines to be most evident in 1Q13 throughout 2013, as we understand that only 40-50% of loans were repriced at the end of 3Q12 for the big banks, and the majority of the remaining loans will be repriced in January. For the big banks, however, we expect the overall declines to be moderate (ie, falls of less than 10bps YoY for 2013E), as we believe their relative deposit strengths will help mitigate the NIM squeeze. Although the lending-rate discount has widened to 30% of the benchmark since July 2012, so far the banks have not increased their lending discount much, based
on our understanding. This is due to the strong loan demand from investment projects approved since April 2012, and as these are often multi-year projects we believe this will translate into a strong loan pipeline for 2013. Meanwhile, the small banks should continue to face capital constraints and high deposit rates (they are already paying the maximum 10% premium for deposits of less than one year, including demand deposits), so they have limited ability to increase loans and are not able to compete aggressively on pricing. We forecast the big banks to see a moderate NIM decline of 10bp YoY for 2013, and the small banks to see a NIM contraction of about 20bp YoY, as we believe the smaller banks’ weaker deposit franchise will result in greater NIM pressure. We argue that the banks are likely to have strong loan-pricing power going into 2013, because of robust loan demand and limited loan supply. We understand that since April 2012 the amount of investment required for newly approved projects has reached more than CNY10tn. However, given that most banks except for the big-4 are struggling to comply with China’s new capital rules, they are unlikely to have the capacity to lend aggressively in 2013. We forecast new loans to amount to about CNY9tn for 2013, only slightly higher than the CNY8.5tn we forecast for 2012. Hence, we believe the credit environment will tighten in 2013, which should enable the banks to enjoy strong pricing power. Indeed, data from the People’s Bank of China (PBOC) shows that the proportion of loans that are priced at a discount is still only about 10%. This reinforces our view that the banks are not competing aggressively for loans on pricing, and that increased emphasis on SME loans should mitigate the NIM decline.
PRC Banks Sector: new loan-pricing distribution
Source: PBOC, CEIC
0%
20%
40%
60%
80%
Mar 0
7
Sep 0
7
Mar 0
8
Sep 0
8
Mar 0
9
Sep 0
9
Mar 1
0
Sep 1
0
Mar 1
1
Sep 1
1
Mar 1
2
Sep 1
2
Below Benchmark Rate At Benchmark RateAbove Benchmark Rate

2013 Outlook for Asia 4 January 2013
- 57 -
The DCMG, which tracks 20 economic indicators and counts the number of them exceeding their 12-month moving averages (12mma), jumped to 13 for October from 9 in September. Of these 20 indicators, 14 improved in October, compared with 11 in September. Both indicators point to a more broad-based improvement in the economy. This means corporate cash positions should be improving, hence we expect overall asset quality to remain stable as the pace of asset deterioration appears to have bottomed in 3Q12.
Key stock call for 2013
ICBC (1398 HK, HKD5.53, Buy [1]) Investment thesis ICBC is our top pick in the sector for 2013, due to its strong deposit franchise, steady asset quality, and strong capital base.
Low cost of funds. We believe a bank’s deposit franchise will differentiate its NIM, and hence its earnings. ICBC’s cost of funds remains one of the lowest among the listed PRC banks. We estimate its average cost of funds was 2.1% for 9M12, only marginally higher than Agricultural Bank of China’s 2.0%, while all the other banks under our coverage had an average cost of funds of 2.5%. Given that it had the largest number of branches and a comfortable loan-to-deposit ratio of only 63.4% at the end of 3Q12, ICBC does not need to pay high costs to compete for deposits. This provides a sustainable, low funding cost, in our view.
Steady asset quality. Due to its historically prudent underwriting standards and risk management, we believe ICBC’s asset quality is stronger than peers. From 3Q08-3Q12, the company’s loans increased by a CAGR of 12% compared with 20% for the sector. We understand ICBC also saw its overdue loans decline QoQ for 3Q12, while most banks continued to see modestly higher overdue loans. Strong capital base. ICBC had core and total capital adequacy ratios (CAR) of 10.51% and 13.61%, respectively, at the end of 3Q12, and we believe it will be one of the few PRC banks to see a higher CAR following the adoption of the new capital rules in 2013.
Valuation We use a blended 2012-13E BVPS as the basis for our target price for ICBC. Our Gordon Growth Model-derived PBR of 1.8x implies a fundamental valuation of HKD7.40/share. Factoring in a 30% discount from its local government financial vehicle exposure (or HKD0.70/share), we derive our SOTP-based six-month target price of HKD6.70, implying a 1.6x blended PBR. Risks to our call The key risk to our call on ICBC would be a share disposal by Goldman Sachs, which has a 1.2% stake in the company. Another risk would be execution risk in its overseas expansion, as ICBC has previously outlined ambitious targets to expand its overseas operations.
China Banks: valuation summary
Stock Price (LC) Mkt. cap Target Year-end PER (x) PBR (x) Dividend yield (%) ROE (%)Company code 28-Dec-12 (USDm) Rating price (LC) Month FY1E FY2E FY1E FY2E FY1E FY2E FY2EICBC 1398 HK 5.53 249,029 Buy 6.70 31-Dec 6.8 6.4 1.4 1.2 4.5% 4.7% 20.3%Bank of China 3988 HK 3.46 124,596 Buy 3.75 31-Dec 6.0 5.7 0.9 0.8 5.2% 5.5% 16.3%Agricultural Bank of China 1288 HK 3.83 160,473 Buy 4.05 31-Dec 6.9 6.4 1.3 1.1 4.3% 4.7% 19.1%China Construction Bank 939 HK 6.24 201,251 Outperform 6.45 31-Dec 6.5 6.3 1.3 1.1 4.6% 4.8% 19.4%China Merchants Bank 3968 HK 17.00 47,319 Outperform 18.10 31-Dec 6.7 7.0 1.5 1.3 3.7% 3.3% 19.6%Bank of Communications 3328 HK 5.79 55,468 Hold 5.15 31-Dec 5.5 6.2 0.9 0.8 4.0% 4.0% 13.7%China Citic Bank 998 HK 4.56 27,522 Hold 4.00 31-Dec 5.4 5.7 0.9 0.8 4.6% 4.4% 14.2%Source: Bloomberg, Daiwa forecasts

2013 Outlook for Asia 4 January 2013
- 58 -
China City Gas – Positive Dave Dai (852) 2848 4068 ([email protected])
Top-3 share-price drivers
• More diversified demand should reduce the risks to overall margins for the city gas operators. On the demand side, the key change we have seen recently is the National Development and Reform Commission’s (NDRC) revision of the gas usage policy, which could fuel industry growth by providing policies/initiatives to boost demand. One major positive development is the introduction of an additional number of gas users on the government’s priority list, which should also help boost demand. In our view, this will be positive for the city gas operators.
• LNG is set to be a big demand driver. Gas in liquid form, or liquefied natural gas (LNG), has wide applications for transportation. China has seen a rapid rise in demand for gas for both private and public vehicles. LNG can be used for public transportation vehicles, like buses and coaches and heavy-duty trucks, as a cleaner alternative to diesel. Besides providing cost savings, LNG vehicles (LNGVs) are usually less noisy, more environmentally friendly, and safer.
Payback calculation on vehicle conversion
Payback calculation of a CNG taxi
Payback calculation of a new LNG truck
Average gasoline price (CNY/litre) 7.5 Average diesel price (CNY/litre) 7.1Average CNG price (CNY/cm) 3.9 Average LNG price (CNY/cm) 4.4Gasoline consumption per km (litre) 0.05 Diesel consumption per km (litre) 0.4CNG consumption per km (cm) 0.06 LNG consumption per km (cm) 0.5Cost saved per km (CNY) 0.141 Cost saved per km (CNY) 0.64Average driving distance (km/day) 400 Average driving distance (km/day) 400Daily average savings (CNY) 46.4 Daily average savings (CNY) 256Monthly average savings (CNY) 1,692 Monthly average savings (CNY) 7,680Conversion fee (CNY) 3,500 Price difference of LNG truck & diesel
truck (CNY) 80,000
Monthly maintenance cost (CNY) 175 Monthly maintenance cost (CNY) 150Payback period (months) 2 Payback period (months) 10Source: ENN
• Possible full implementation of gas price reforms in 2013. In December 2011, the NDRC announced a pilot programme for gas price reform in Guangdong and Guangxi provinces, linking gas prices to spot fuel oil and LPG prices. Although little progress was seen in 2012, we are concerned that full price reform could take place in 2013, which we forecast would lead to a 20% rise in unit gas costs for the city-gas companies in mid-2013. We believe companies with less exposure to households and more to commercial and industrial (C&I) customers should be able to avoid margin erosion by passing on higher gas prices to C&I customers.
Sector outlook for 2013
Among the various utilities sub-sectors, the gas industry is one of the very few that have not seen a major slowdown in demand over the past few years. According to official estimates, China’s gas consumption is expected to reach 230bn cm by 2015 and 300bn by 2020. This implies a 16% CAGR from 2011-15, and a further 5% from 2015-20. In 2013, we expect the sector to continue to grow (in terms of sales volume) at a high-teen percentage, given the more favourable macro economy and increasing gas supply in China. China: natural gas consumption (2001-11)
Source: CEIC, National Energy Administration
0
5
10
15
20
25
30
0
20
40
60
80
100
120
140
2001 2002 2003 2004 2005 2006 2007 2008 2009 2010 2011
(%)(bn cm)
Gas consumption (LHS) YoY (RHS)

2013 Outlook for Asia 4 January 2013
- 59 -
Key stock call for 2013
ENN Energy (2688 HK, HKD33.7, Buy [1]) Investment thesis ENN Energy (ENN) is our top pick within the sector. We like the stock for its superior organic growth, cheap valuation, and potential upside from the expansion of its LNG refilling stations business. With China’s continuing gas shortage and the availability of new natural gas sources over the next few years, we expect ENN to maintain at least 20% organic earnings growth per year on strong natural gas sales. Based on our recent checks with the company, management also expects new household connections to remain stable for the next two years, suggesting limited downside for connection fee revenue. Another earnings-growth driver should be the company’s investment in LNG-refilling stations for both private/public vehicles (it plans to open 50-100 stations a year by the end of 2015). ENN believes LNG stations will have higher projected returns than compressed natural gas (CNG) stations. LNG stations are bigger than CNG stations, and their sales-volume growth prospects are promising given China’s rising LNG imports (we forecast LNG to account for 21% of
China’s total gas supply by 2015, from about 12% currently). ENN is not the only company to develop an LNG business – China’s upstream oil & gas companies have also started to invest aggressively. CNOOC (883 HK, HKD16.84, Buy [1]) was reported recently (in the local PRC press) to be building more than 1,000 LNG stations over the next five years. ENN stock is now trading below the industry average 2013E PER and is the only company among the city gas stocks we cover for which we forecast a 2013E ROE of more than 20%. Valuation We recently raised our DCF-based six-month target price for ENN from HKD33.5 to HKD43.0 to incorporate an increase in the number of the company’s LNG stations (we forecast an average of 90 a year for 2012-20). We also expect ENN’s ROE to remain above 22% for both 2013-14. Risks to our call The main downside risks to our call would be lower-than-expected volume sales and a larger-than-expected margin squeeze from the possible implementation of full gas price reform in 2013.
China City Gas: valuation summary
Stock Price (LC) Mkt. cap Target Year-end PER (x) PBR (x) EV/EBITDA (x) Dividend yield (%) ROE (%)Company code 28-Dec-12 (USDm) Rating price (LC) Month FY1E FY2E FY1E FY2E FY1E FY2E FY1E FY2E FY2EENN Energy 2688 HK 33.7 4,564 Buy 43 31-Dec 18.4 14.5 3.5 3.0 9.8 7.8 1.4 2.1 22.3Beijing Enterprises 392 HK 50.5 7,411 Outperform 59 31-Dec 17.3 13.8 1.4 1.3 9.0 8.5 1.7 2.2 10.1Source: Bloomberg, Daiwa forecasts

2013 Outlook for Asia 4 January 2013
- 60 -
China Construction Materials and Building Products – Positive Felix Lam (852) 2532 4341 ([email protected])
Top-3 share-price drivers
• Recovery in construction activity. We believe a structural recovery in construction activity would be the most important driver for a sustainable rally in the share prices of the companies specialising in steel, cement, glass and other construction materials and building products in 2013. This recovery would have to be supported by an acceleration in the pace of infrastructure projects, which we forecast to account for 45% of the country’s national cement consumption and 65-70% of China Liansu’s revenue in 2013.
• Positive surprise in property. Apart from infrastructure, property is another swing factor that could provide positive surprises in the construction-material and building-product markets. We believe a turnaround in new floor space started – from a 9% YoY decline for 10M12 to positive growth in 2013 – would indicate faster property development, which would be positive for cement demand.
• Enhanced supply/price discipline. Supply discipline and pricing co-ordination should be sustained during the year in the east and central regions, the biggest cement markets (the two regions produce about half of the country’s needs). This would be in sharp contrast to the ineffective supply discipline that we saw for most of 2012, which dragged cement prices and share prices down sharply for the first nine months of the year.
Sector outlook for 2013
We saw uncertainty, by and large, for China for most of 2012, as GDP growth slowed in the first three quarters (below 8% YoY) and there were concerns in the market about China’s political environment given the change in leadership. Construction work, especially for infrastructure projects, has slowed considerably since
the middle of 2011 as local governments have struggled to secure financing for their projects. Construction work in the property segment has also slowed given the tight cash flows of the property developers. However, as we have already started to see signs of an improving economy and the new Politburo is now on board, our economics team forecasts GDP growth to return to 8% YoY and loan growth to increase to CNY9bn for 2013. We believe there will be stronger financial support for local governments, helping them to speed up the construction of infrastructure projects. With regard to the property segment, strong contract sales in 2H12 are translating into better cash flows for the property developers. With this and the better market sentiment we are seeing for property buyers and investors, we expect floor space starts to increase moderately for 2013. In a nutshell, we expect moderate year-on-year demand growth for construction materials and building products for 2013. We reaffirm our Positive rating for the sector.
Infrastructure investment and floor space starts
Source: CEIC, Daiwa
Key stock call for 2013
China Liansu (2128 HK, HKD5.32, Buy [1]) Investment thesis As the leading producer of plastic pipes and pipe fittings, China Liansu is a key beneficiary of China’s growing infrastructure investment related to improving the country’s water resources. Noticeably, 65-70% of its sales revenue currently comes from the government’s infrastructure projects and the rest goes to the property segment, including affordable housing projects. The company is the biggest producer in the plastic-pipe industry by revenue. Of its 1H12 revenue, some 75% (by application) came from water-supply and drainage-pipe products and 79% (by product type) from PVC
(30)
(20)
(10)
0
10
20
30
40
Jan-11 Apr-11 Jul-11 Oct-11 Jan-12 Apr-12 Jul-12 Oct-12
(YoY chg)
Infrastructure investment Floor space started

2013 Outlook for Asia 4 January 2013
- 61 -
pipes and pipe fittings. In addition to pipes and pipe fittings, Liansu launched three new product categories: 1) plastic-steel doors and windows, 2) sanitary products, and 3) holistic kitchens. While we also like CNBM (3323 HK, HKD11.32, Buy [1]) and CR Cement (1313 HK, HKD5.09, Buy [1]) and expect their earnings to rebound significantly in 2013, the China cement companies are facing medium-term structural issues including nationwide overcapacity, peaking demand and generally high debt levels. We like China Liansu not only for 2013 but also for the next 3-5 years, for the following three key reasons:
• Policies favouring the industry. China’s improving water resources (eg, piping water from the south to the north to ensure more even distribution of water resources in the country, enhancing the irrigation of arable land, and improving water quality) is at the top of the central government’s agenda. China has budgeted to invest CNY4tn in water-resource infrastructure in 2011-20. Noticeably, investment in the water supply and conservation projects accelerated in 2011-12, despite a sharp deceleration in the growth of overall infrastructure investment during the same period.
Water infrastructure investment
Source: CEIC, Daiwa
• Competitive edge. The mass production of plastic pipes and pipe fittings with just a few specifications could be easy, but producing hundreds and thousands of specifications on a large scale would be a challenge. Distributing products to customers and
building up a brand-name are also difficult missions. Liansu has proved that it has overcome all these issues. While it is not impossible for its competitors to catch up, we think the chance of this occurring in the near term is limited. In terms of 2011 revenue, Liansu’s revenue was three times larger than China’s second-largest producer of plastic-pipe products.
• Promising earnings outlook for its core business and new products. We forecast China Liansu’s earnings to increase by 19% YoY for 2013, driven mainly by 15% YoY sales volume growth for its core business and a boost in revenue from its new products. Management conservatively guides that 5-8% of its total revenue will come from new products in 3-5 years. In the medium term, we forecast China Liansu to achieve earnings growth of 15-20% YoY for 2012-16/2017 through capacity growth and the expansion of its distribution network across the country.
Valuation Our six-month target price of HKD7.00 is based on a 2013E PER of 11x, which is at the high end of the target PERs that we are assigning to the producers of construction materials and building products. Given China Liansu’s earnings-growth prospects and stable profit margins, we believe our target multiple is undemanding. Risks to our call The biggest risk to our view would be a further slowdown in infrastructure construction, as 65-70% of China Liansu’s sales are tied to infrastructure projects. At the industry level, the plastic-pipe market is a fairly small one in the construction-material and building-products space. As such, there is fairly limited industry information we can follow on a regular basis. Transparency is perceived by analysts and investors as low for the industry. Also, a surge in raw-materials prices, mainly that for plastic resins (consistently accounting for about 70-75% of production cost), could hurt China Liansu’s earnings, as we would not expect the company to immediately pass on any sharp cost-price inflation.
China Construction Materials and Building Products: valuation summary
Stock Price (LC) Mkt. cap Target Year-end PER (x) PBR (x) EV/EBITDA (x) Dividend yield (%) ROE (%)Company code 28-Dec-12 (USDm) Rating price (LC) Month FY1E FY2E FY1E FY2E FY1E FY2E FY1E FY2E FY2EChina Liansu Group 2128 HK 5.3 2,063 Buy 7.0 31-Dec 9.8 8.3 2.1 1.8 6.4 5.2 2.6 3.0 24.1China National Building Material 3323 HK 11.3 7,884 Buy 14.2 31-Dec 8.1 6.6 1.6 1.3 7.1 6.3 1.8 2.3 21.7China Resources Cement Holdings 1313 HK 5.1 4,281 Buy 6.15 31-Dec 16.5 10.1 1.6 1.4 9.4 6.7 0.0 0.0 14.8Anhui Conch Cement 914 HK 28.3 19,346 Hold 25.5 31-Dec 16.6 12.3 2.4 2.1 9.8 7.6 1.1 1.5 18.1West China Cement 2233 HK 1.6 915 Underperform 1.25 31-Dec 12.3 11.1 1.2 1.1 7.9 5.8 0.0 0.0 10.0China Shanshui Cement Group 691 HK 5.6 2,038 Sell 4.7 31-Dec 9.6 8.6 1.5 1.3 5.9 5.4 2.6 2.9 16.3China National Materials 1893 HK 2.4 1,087 Sell 1.45 31-Dec 11.0 10.8 0.6 0.6 6.3 6.3 1.4 1.4 5.5Source: Bloomberg, Daiwa forecasts
0
10
20
30
40
50
60
0
100
200
300
400
500
600
2008 2009 2010 2011 10M12
(% )(CNYbn)
Water resources infrastructure (amount) (LHS)Water resources infrastructure YoY chg (RHS)Total infrastructure YoY chg (RHS)

2013 Outlook for Asia 4 January 2013
- 62 -
Macau Gaming – Neutral Bing Zhou (852) 2773 8782 ([email protected])
Top-3 share-price drivers
• Potential for upside surprises from VIP revenue growth. The flattish trend in VIP revenue over recent months suggests to us that the VIP segment is past its worst point, and we do not expect VIP revenue growth in 2013 to weaken compared with its 1% YoY decline recorded for 3Q12. In addition, we are encouraged by the gradual YoY pick-up in rolling-chip volume during 4Q12. Although the VIP market as a whole has been clouded by reports of a crackdown by authorities on some junket operators that were alleged to have been offering illegal credit, we are more positive on the outlook for VIP revenue than the Bloomberg consensus forecast. We forecast 8% YoY growth in VIP revenue for 2013, versus a consensus range of 0-5% YoY growth, due to increasing liquidity and macro improvements in China. We think that better momentum in the VIP segment prior to 2Q13 will lead to upward revisions to the consensus forecasts for full-year 2013.
Macau gaming sector: VIP gaming revenue growth compared
with China M2 money supply growth (YoY)
Source: DICJ, Daiwa forecasts
• Infrastructure and retail attractions should drive mass-market revenue growth. Revenue for the mass-market segment has been resilient over the past year, in contrast to the weakening VIP
gaming revenue environment. Starting from 1Q13, we think the completion of infrastructure improvements, such as the expansion of the Gongbei Gate, intercity railway and highway between Guangzhou and Zhuha, together with a resort development on Hengqin Island, should underpin revenue growth in the mass-market segment in 2013.
Macau gaming sector: key infrastructure developments
Development Expected completion
scheduleExpansion of the Gongbei Gate end-2012Extension of Guangzhou-Zhuhai intercity railway 1Q13Extension of Guangzhou-Zhuhai super highway (terminating at Hengqin island)
1H13
Chime-Long Int’l Ocean Resort in Hengqin Island (Phase I) 1H13Source: various media reports
• Operating leverage likely to be in focus. We forecast Macau gaming revenue growth to slow further to 11% YoY for 2013 (from 42% YoY for 2011 and 12% YoY for 2012E), but still expect the operators to maintain steady EBITDA growth of 16% YoY for 2013. The operators should achieve better operating leverage through: 1) optimising their revenue mix between the VIP and mass-market segments, 2) attracting higher-quality mass-market players, and 3) maximising table productivity through table redesignations.
Macau Gaming Sector: EBITDA market shares
2011 1Q12 2Q12 3Q12 4Q12E 2012E 2013E Sands China 27.0% 26.6% 25.0% 27.7% 29.3% 27.2% 30.8% Wynn Macau 20.3% 16.9% 17.6% 16.6% 16.6% 17.0% 15.4% Melco Crown Entertainment 14.9% 15.3% 12.8% 13.8% 14.3% 14.1% 13.5% SJM Holdings 14.9% 14.3% 14.2% 13.4% 13.3% 13.7% 12.7% Galaxy Entertainment 12.0% 16.5% 18.8% 19.5% 16.5% 17.9% 18.1% MGM China 11.0% 10.3% 11.6% 9.0% 9.9% 10.2% 9.6% Macau Peninsula 59.1% 55.1% 55.2% 50.5% 52.3% 53.2% 49.1%Cotai/Taipa 40.9% 44.9% 44.8% 49.5% 47.7% 46.8% 50.9%Source: Companies, Daiwa forecasts
Sector outlook for 2013
As the industry’s top-line growth begins to moderate to its normal level, we believe attention will increasingly turn to bottom-line growth, rendering monthly headline figures, which are backward-looking and skewed by volatile win/hold rates and calendar shifts, less relevant. In the meantime, despite a slowing in revenue growth, increasing profitability, strong cash flows and implied dividend payouts over the longer term should help bolster valuations. Still, we suggest a stock-picking approach rather than a basket-buy approach. Our preferred stocks are Galaxy Entertainment (Galaxy), Melco Crown Entertainment (Melco) and Sands China.
0%
5%
10%
15%
20%
25%
30%
35%
(40%)(20%)
0%20%40%60%80%
100%120%
1Q08
2Q08
3Q08
4Q08
1Q09
2Q09
3Q09
4Q09
1Q10
2Q10
3Q10
4Q10
1Q11
2Q11
3Q11
4Q11
1Q12
2Q12
3Q12
4Q12
1Q13
2Q13
VIP revenue (LHS) China M2 (9M lag) (RHS)
IVS tightening
correlation=73%

2013 Outlook for Asia 4 January 2013
- 63 -
Macau gaming sector: gaming revenue growth
Source: DICJ, Daiwa forecasts
Key stock call for 2013
Galaxy Entertainment Group (27 HK, HKD30.6, Buy [1]) Investment thesis Among the Macau gaming stocks, Galaxy has the most balanced property mix, straddling both the peninsula and Cotai, in our view. In terms of the company’s flagship properties, Starworld’s rolling-chip market
share has proved resilient, while Galaxy Macau’s ROI still looks to be a ‘honeymoon curve’ (we forecast Galaxy Macau’s normalised ROI to be 45% in 2013). We believe any upward revisions to the Bloomberg-consensus expectations, which forecast only 10% YoY EBITDA growth for 2013, will be share-price catalysts. Valuation As we expect Galaxy to exhibit superior EBITDA growth (18% YoY for the company vs. 16% YoY for the whole sector for 2013E based on our forecasts), we believe the stock deserves to trade at a premium to our target sector EV/EBITDA multiple of 11x. Our six-month target price of HKD35 is set at a target EV/EBITDA multiple of 12x applied to our 2013 EPS forecast. Risks to our call We believe the company-specific risks to our bullish stance would be a slower-than-expected ramp-up for Galaxy Macau and loss of market share to Sands Cotai Central.
Macau Gaming: valuation summary Stock Price (LC) Mkt. cap Target Year-end PER (x) PBR (x) EV/EBITDA (x) Dividend yield (%) ROE (%)Company code 28-Dec-12 (USDm) Rating price (LC) Month FY1E FY2E FY1E FY2E FY1E FY2E FY1E FY2E FY2EGalaxy Entertainment Group 27 HK 30.6 16,580 Buy 35 31-Dec 17.6 14.4 6.0 4.2 13.1 10.4 0.0 0.0 34.3Melco Crown Entertainment MPEL US 16.3 8,960 Outperform 17.3 31-Dec 22.5 19.1 2.7 2.3 11.4 10.0 0.0 0.0 13.0Sands China 1928 HK 34.2 35,521 Outperform 35.8 31-Dec 32.9 19.8 6.6 6.0 19.9 14.8 3.6 4.0 31.6SJM Holdings 880 HK 18.1 12,969 Hold 17.3 31-Dec 15.6 14.4 5.1 4.8 10.9 10.0 5.5 5.9 34.5MGM China Holdings 2282 HK 14.0 6,873 Hold 13.8 31-Dec 11.6 11.7 8.9 7.1 9.6 9.2 5.8 3.6 67.3Wynn Macau 1128 HK 20.9 13,987 Underperform 19.3 31-Dec 16.3 15.1 24.4 13.5 13.7 12.9 5.7 3.3 114.8Source: Bloomberg, Daiwa forecasts
(10%)0%
10%20%30%40%50%60%70%80%
2005 2006 2007 2008 2009 2010 2011 2012E 2013EVIP Mass

2013 Outlook for Asia 4 January 2013
- 64 -
China Infrastructure – Positive Joseph Ho, CFA (852) 2848 4443 ([email protected]) Winston Cao (852) 2848 4469 ([email protected])
Top-3 share-price drivers
• The Ministry of Railways’ (MOR) announcement of its 2013 railway-infrastructure capex budget. Railway infrastructure capex for 2011 and 11M12 was CNY461bn and CNY432bn, respectively (2012E: CNY516bn). Average capex for 2013-15 should be CNY441bn (see the following chart), based on the MOR’s budget of CNY2.3tn for railway-infrastructure investment under the 12th Five-Year Plan (2011-15). We expect the MOR’s 2013 infrastructure capex to be higher than the 2012 level, and that this will be viewed positively by the market. We forecast the MOR to set its 2013 infrastructure capex at CNY530bn by bringing forward the spending it had previously earmarked for 2014 and 2015. We also think there is a chance it will raise its spending target of CNY2.3tn under the 12th Five-Year Plan in 2013.
MOR: railway-infrastructure spending (based on 12th Five-Year
Plan)
Source: MOR
• The award of affordable-housing contracts. China plans to build 36m affordable housing units under the 12th Five-Year Plan. New starts in 2011 amounted to 10.4m units and 7.22m units for 10M12 (note: total investment in affordable housing was CNY1.08tn for 10M12). We forecast no less than 5m new starts for 2013, with construction usually taking about two years.
• The NDRC’s approval of subway-expansion plans and the award of subway-construction contracts. Urbanisation is a key policy of China’s new leadership, and subway construction is at the centre of the urbanisation process, addressing the alarming traffic congestion in the country’s major cities. Subway development is still at an early stage in China (see the following table) and the government has budgeted about CNY1tn for subway investment under the 12th Five-Year Plan. News flow on approvals by the National Development and Reform Commission (NDRC) of new subway projects and that the various municipal governments have awarded subway-construction contracts should be another share-price driver.
Subway density analysis: China vs. cities overseas
City
Subwaylength
2011 (km)
Subway length by
end of 2015 (km)
Population (m)
Density by 2011
(km/m population)
Density by 2015
(km/m population)
China Shanghai 458 761 23.0 20 33 Beijing 414 592 20.2 20 29 Guangzhou 235 347 12.7 19 27 Shenzhen 183 288 15.5 12 19 Dalian 113 237 6.7 17 35 Nanjing 84 336 8.1 10 41 Tianjin 79 323 13.6 6 24
Overseas cities London 400 410 7.2 56 57 Tokyo 650 700 13.0 50 54 New York 337 380 8.2 41 46 Singapore 199 278* 5.2 38 53* Hong Kong 218 274 7.1 31 39 Paris 298 300 10.0 30 30 Taipei 100 140 6.0 17 23 Source: Compiled by Daiwa
Note: *By 2020
Sector outlook for 2013
We continue to be positive on the earnings outlook for companies involved in the construction of affordable housing (ie, China State Construction International [CSCI]) and railway and subway construction (ie, China Railway Construction Corp [CRCC] and China Railway Group [CRG]) in view of the improving backlog-to-sales conversion rates that we expect for 2013. In China, there is no lack of investment projects
154 179
338
600 707
461 516
441 441 441
0100200300400500600700800900
1,000
2006 2007 2008 2009 2010 2011 2012E 2013E 2014E 2015E
(CNYbn) 11th Five-Year PlanCNY1.98tn
12th Five-Year PlanCNY2.3tn
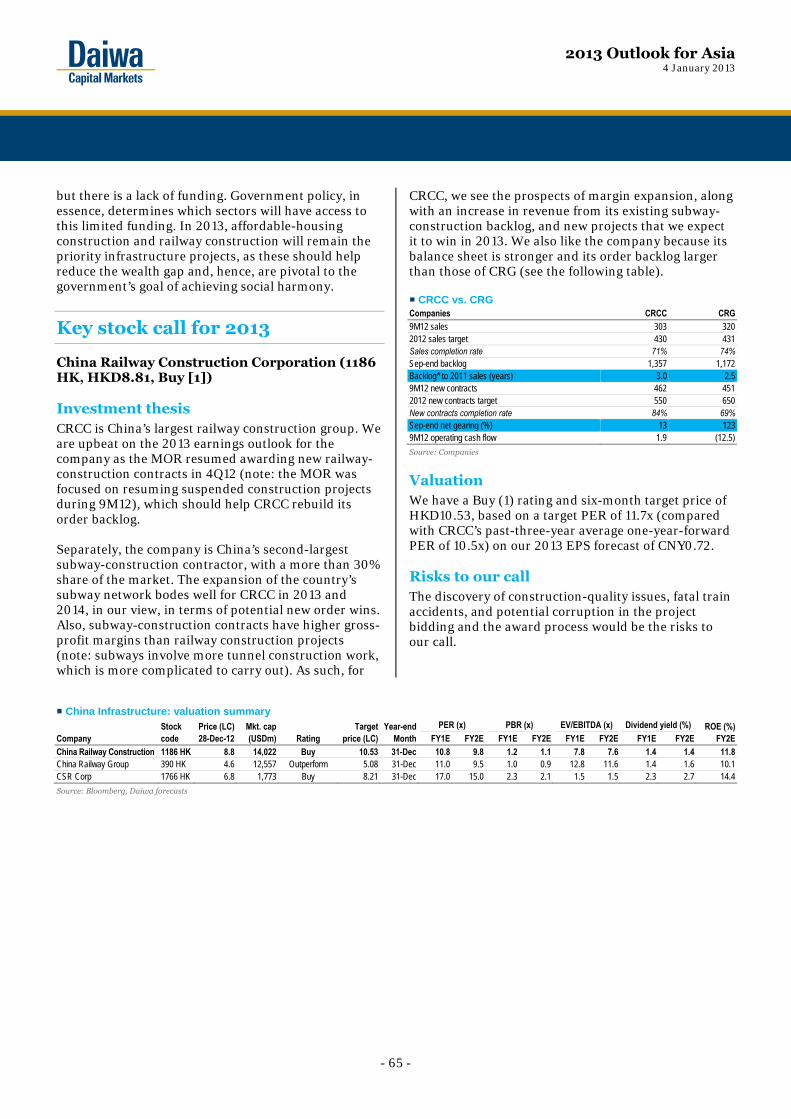
2013 Outlook for Asia 4 January 2013
- 65 -
but there is a lack of funding. Government policy, in essence, determines which sectors will have access to this limited funding. In 2013, affordable-housing construction and railway construction will remain the priority infrastructure projects, as these should help reduce the wealth gap and, hence, are pivotal to the government’s goal of achieving social harmony.
Key stock call for 2013
China Railway Construction Corporation (1186 HK, HKD8.81, Buy [1]) Investment thesis CRCC is China’s largest railway construction group. We are upbeat on the 2013 earnings outlook for the company as the MOR resumed awarding new railway-construction contracts in 4Q12 (note: the MOR was focused on resuming suspended construction projects during 9M12), which should help CRCC rebuild its order backlog. Separately, the company is China’s second-largest subway-construction contractor, with a more than 30% share of the market. The expansion of the country’s subway network bodes well for CRCC in 2013 and 2014, in our view, in terms of potential new order wins. Also, subway-construction contracts have higher gross-profit margins than railway construction projects (note: subways involve more tunnel construction work, which is more complicated to carry out). As such, for
CRCC, we see the prospects of margin expansion, along with an increase in revenue from its existing subway-construction backlog, and new projects that we expect it to win in 2013. We also like the company because its balance sheet is stronger and its order backlog larger than those of CRG (see the following table).
CRCC vs. CRG Companies CRCC CRG 9M12 sales 303 320 2012 sales target 430 431 Sales completion rate 71% 74%Sep-end backlog 1,357 1,172 Backlog* to 2011 sales (years) 3.0 2.5 9M12 new contracts 462 451 2012 new contracts target 550 650 New contracts completion rate 84% 69%Sep-end net gearing (%) 13 123 9M12 operating cash flow 1.9 (12.5)Source: Companies
Valuation We have a Buy (1) rating and six-month target price of HKD10.53, based on a target PER of 11.7x (compared with CRCC’s past-three-year average one-year-forward PER of 10.5x) on our 2013 EPS forecast of CNY0.72. Risks to our call The discovery of construction-quality issues, fatal train accidents, and potential corruption in the project bidding and the award process would be the risks to our call.
China Infrastructure: valuation summary Stock Price (LC) Mkt. cap Target Year-end PER (x) PBR (x) EV/EBITDA (x) Dividend yield (%) ROE (%)Company code 28-Dec-12 (USDm) Rating price (LC) Month FY1E FY2E FY1E FY2E FY1E FY2E FY1E FY2E FY2EChina Railway Construction 1186 HK 8.8 14,022 Buy 10.53 31-Dec 10.8 9.8 1.2 1.1 7.8 7.6 1.4 1.4 11.8China Railway Group 390 HK 4.6 12,557 Outperform 5.08 31-Dec 11.0 9.5 1.0 0.9 12.8 11.6 1.4 1.6 10.1CSR Corp 1766 HK 6.8 1,773 Buy 8.21 31-Dec 17.0 15.0 2.3 2.1 1.5 1.5 2.3 2.7 14.4Source: Bloomberg, Daiwa forecasts

2013 Outlook for Asia 4 January 2013
- 66 -
China Internet – Positive John Choi (852) 2773 8730 ([email protected])
Top-3 share-price drivers
• Going mobile. Mobile Internet usage is likely to be a major theme in the China Internet sector in 2013. Tencent’s WeChat (Weixin) and Weibo have taken on a much higher profile on the back of this theme, and we think investors will continue to monitor developments in this area closely. Although most mobile Internet business models are still at the fledgling stage of development, we strongly believe that increasing penetration of smartphones will accelerate growth of mobile Internet usage.
• Blockbuster titles. The launch of blockbuster game titles could drive share prices. Titles such as Blade & Soul and Call of Duty are in the launch pipeline for 2013, and we think positive news flow on these and other big titles could propel share prices.
• E-commerce consolidation? E-commerce has been a hot theme in the China Internet space during the past couple of years, but for all the attention it has received, most e-commerce-related companies are recording operating losses in an environment of increased competition. Any event that signals the start of a period of consolidation within the e-commerce industry would be well received by investors, in our view.
Sector outlook for 2013
We think mobile Internet and e-commerce will be the key themes in 2013, and we expect positive business developments in both areas. For the mobile Internet space, we anticipate that mobile messaging services will continue to sign up more subscribers, thereby helping to establish mobile messaging as a leading mobile platform. Moreover, we look for growth momentum in the transaction value in e-commerce to accelerate, with several vendors now aggressively promoting their services.
China mobile Internet users
Source: CEIC
Key stock call for 2013
Tencent (700 HK, HKD250, Buy [1]) Investment thesis Tencent is our top pick in the China Internet sector. We expect healthy growth in the company’s game revenue, backed by its existing games and its strong pipeline of titles scheduled for launch in 2013. In addition, we think WeChat (Weixin) will continue to record strong growth in user numbers, thereby cementing its claims to be a leading mobile platform in China. We expect revenue growth for Tencent’s online games operation, which accounts for more than 50% of its total revenue, to show an acceleration in 2H12 and 2013. We were encouraged to learn that the user base of League of Legends, Tencent’s massively multiplayer online game (MMOG), totalled some 70m globally as of October 2012, making it one of the world’s most popular online games. Besides, we think investors should monitor carefully the development of the company’s new business growth drivers, such as WeChat (Weixin). We think WeChat will continue to expand its user base against the backdrop of rising penetration of smartphones in China. In sum, we expect Tencent to maintain strong revenue-growth momentum in the next few years. In our view, the company is primed to deliver balanced growth across its key business units, which we think gives it a defensive quality. We forecast a revenue CAGR for Tencent of 27% for 2012-14.
1% 4%9%
18%23%
28%12%
24%
40%
61%66%
73%
4%9%
18%31%
35% 36%
0%
20%
40%
60%
80%
0
100
200
300
400
2006 2007 2008 2009 2010 2011
China Mobile Internet users (LHS) As % of total population (RHS)As % of Internet users (RHS) As % of mobile users (RHS)
(m)

2013 Outlook for Asia 4 January 2013
- 67 -
Valuation We value Tencent based on a target PER of 28x applied to our 2013 EPS forecast, and derive a six-month target price of HKD320. We see scope for significant upside as the company continues to extend its service reach, benefiting from its expanding scale, and monetises its initiatives for new platforms.
Risks to our call The main risks include the following: 1) a sharp decline in Tencent’s revenue from core games, which would weigh on its key revenue driver, the online game segment, 2) intensifying competition from the likes of Sina Weibo and Alibaba, 3) faster-than-expected migration of the service platform to mobile (if this were to Tencent might lose revenue from PC-online based services before it is even able to ramp up its mobile services), and 4) greater-than-expected losses in e-commerce.
China Internet: valuation summary
Stock Price (LC) Mkt. cap Target Year-end PER (x) PBR (x) EV/EBITDA (x) Dividend yield (%) ROE (%)Company code 28-Dec-12 (USDm) Rating price (LC) Month FY1E FY2E FY1E FY2E FY1E FY2E FY1E FY2E FY2ETencent Holdings 700 HK 250.0 59,499 Buy 320 31-Dec 28.0 21.2 9.1 6.7 17.8 13.3 0.5 0.7 37.2Source: Bloomberg, Daiwa forecasts

2013 Outlook for Asia 4 January 2013
- 68 -
China Property – Positive Jonas Kan, CFA (852) 2848 4439 ([email protected]) Felix Lam (852) 2532 4341 ([email protected]) Maurine Wan (852) 2848 4451 ([email protected])
Top-3 share-price drivers
• Positive spillover effect from strong share-price performances of leading nationwide players. With the share prices of some of the leading players having reached all-time highs and concerns in the market diminishing about further government measures, we expect increased interest in the quality regional players, the earnings bases of which are smaller and the valuations of which are well below those of the leading nationwide players.
• Growing interest in companies with city landbanks. We expect the PRC developers to become increasingly keen to acquire land, especially in the major cities where supply is limited. The government encouraging urbanisation and saying it will work on improving the living environment for migrants to the cities also means there is likely to be sustained population growth in the major cities. This should bode well for investors interested in players that have built up landbanks in major cities and can find ways to secure land in city areas at reasonable cost (eg, through urban-renewal projects, and acquiring sites from parent or related companies).
• Increase in commercial-property transactions. We believe that continued economic growth and M2 expansion will bode well for achieved rents and the market values of prime commercial properties in the major cities. This should be supported by the Home Purchase Restrictions (HPR) on residential properties and the trend for some insurance companies and major business groups to buy commercial properties for self-use or investment. This will boost interest in companies that own prime commercial property assets and are experienced in developing commercial properties for sale, in our view.
Sector outlook for 2013
We think the stocks in the China Property Sector are moving from the distressed valuations in 4Q11 towards fair value. A rerating of the leading nationwide players has been ongoing, with some of them now trading at all-time highs. In terms of absolute valuations, while we think the stocks are not yet over-valued, we believe the easy money has most likely already been made. We believe the share-price performances of the PRC property stocks in 2012 were driven mainly by policy factors. Hence, investors focused more on the strong leading players, which should be able to weather the policy challenges best, and companies for which the valuations appear to have over-discounted the policy risks. In 2013, we expect the importance of policy concerns to ease and more emphasis to be put on bottom-up factors, especially for those companies that are able to achieve positive breakthroughs in terms of fundamentals. While investors seemed to focus mainly on contract-sales performances in 2012, we see this as only one aspect of a property company’s fundamentals. We believe factors that are equally important include landbank quality, landbanking strategy, corporate strategy, recurrent income, and financial profile. In our view, the key for the PRC developers is sustained market-share expansion, and we expect investors to look beyond just contract sales when it comes to analysing a property company’s fundamentals. We believe a breakthrough in fundamentals will be one of the main themes for PRC property companies in 2013. Sales revenue for the China property industry
Source: CEIC, Daiwa
0
1,000
2,000
3,000
4,000
5,000
6,000
1998 1999 2000 2001 2002 2003 2004 2005 2006 2007 2008 2009 2010 2011
(CNYbn)

2013 Outlook for Asia 4 January 2013
- 69 -
Key stock call for 2013
Guangzhou R&F (2777 HK, HKD12.88, Buy [1]) Investment thesis We see Guangzhou R&F as a quality regional player with a solid presence in the Guangzhou and Beijing-Tianjin markets. At the same time, the company has been able to expand its presence in markets such as Taiyuan, Chongqing, Harbin, and Hainan. It is also one among the most advanced in the sector in terms of building up its recurrent income base, with gross rental income and hotel revenue poised to exceed CNY1.4bn for 2012, based on our forecast. The stock was derated after 2007, but we think many of the problems the company faced at that time have been resolved, with its net gearing ratio falling to 69% as at the end of June 2012, a rise in its gross rental income (CNY292m for 1H12), and a profit turnaround in its hotel division. While Guangzhou R&F’s contract-sales performance was not outstanding in 2012, we believe this should be seen in the context that it did not have major new launches in the year; its achieved profit margin remained high at more than 40% for 1H12, even though it had not been aggressive in selling its office properties in the Pearl River New Town. With a strengthening balance sheet, we expect the company to become more active in landbank replenishment in 2013, and progress in securing urban renewal projects in major cities should be seen as positive developments, in our view. Valuation While Guangzhou R&F’s share price performed well in 2012, we think there is still considerable room for its valuation to improve given the gap in valuation between the stock and the leading nationwide players. Based on our forecasts, it also offers a dividend yield of
more than 6% for 2013 and provides earnings and NAV growth potential. We have a Buy (1) rating and six-month target price of HKD15.90, based on a 30% discount to our end-2013 NAV forecast of HKD22.70. Risks to our call The main risk to our call would be a major slowdown in property sales in the Guangzhou and Beijing-Tianjin markets, to which the company has a high level of exposure.
Guangzhou R&F: PER
Source: Bloomberg, Company, Daiwa estimate
Guangzhou R&F: PBR
Source: Bloomberg, Company, Daiwa
China Property: valuation summary Stock Price (LC) Mkt. cap Target Year-end PER (x) PBR (x) Dividend yield (%) ROE (%)Company code 28-Dec-12 (USDm) Rating price (LC) Month FY1E FY2E FY1E FY2E FY1E FY2E FY2EChina Overseas Land & Investment 688 HK 22.95 24,195 Buy 23.80 31-Dec 13.1 11.3 2.3 2.0 1.7 1.9 18.7China Resources Land 1109 HK 21.10 15,859 Buy 21.80 31-Dec 17.9 16.1 1.9 1.7 1.5 1.7 11.2Guangzhou R&F Properties 2777 HK 12.88 5,356 Buy 15.90 31-Dec 6.7 6.1 1.3 1.2 5.8 6.3 20.3Source: Bloomberg, Daiwa forecasts
Average since 2006: 13.7x
+1SD: 24.4x
-1SD: 3.0x0
10
20
30
40
50
60
70
Jan 0
6
Jul 0
6
Jan 0
7
Jul 0
7
Jan 0
8
Jul 0
8
Jan 0
9
Jul 0
9
Jan 1
0
Jul 1
0
Jan 1
1
Jul 1
1
Jan 1
2
Jul 1
2
(x )
0.01.02.03.04.05.06.07.0
Jan 0
8Ap
r 08
Jul 0
8Oc
t 08
Jan 0
9Ap
r 09
Jul 0
9Oc
t 09
Jan 1
0Ap
r 10
Jul 1
0Oc
t 10
Jan 1
1Ap
r 11
Jul 1
1Oc
t 11
Jan 1
2Ap
r 12
Jul 1
2Oc
t 12
PBR Historical avg. since 08
(x )

2013 Outlook for Asia 4 January 2013
- 70 -
Hong Kong Property – Positive Jonas Kan, CFA (852) 2848 4439 ([email protected]) Maurine Wan (852) 2848 4451 ([email protected])
Top-3 share-price drivers
• Recognition of the value and potential of Hong Kong companies’ China investments. We believe the market is increasingly appreciating the value of Hong Kong companies’ investments in China, a process that will likely be spurred by operating and market data, as well as the companies’ upcoming results announcements.
• Recognition that there is solid upgrade demand for Hong Kong residential property. This is being captured by the primary market and
should continue to show in the market’s response to primary-market sales in 2013
• Concerns over the Central office market gradually recede. Alongside a diminution of investor concerns about Central, we detect a growing recognition that many districts in Hong Kong are undergoing a transformation that should generate value-enhancing opportunities for owners of commercial property assets.
Sector outlook for 2013
We expect 2013 to be the year of mid-range properties, whether residential, office or retail. There is little doubt that Hong Kong is transforming from a city of 6-7m people into being an integral part of China, supported by its status as a major international financial centre. As we see it, this structural trend is bound to have ramifications for the Hong Kong property market, particularly with the supply of most types of land having been relatively restrained for the past decade. Surging demand has resulted in top-end property assets in Hong Kong becoming as expensive as anywhere in the world, and we see considerable room for lower-tier assets to emerge as credible alternatives. Indeed, we believe this trend is already taking shape and 2013 is likely to bring it into sharper focus.
Range of achieved rents for retail properties in Hong Kong
Source: Company report, Daiwa estimates
*Based on GFA
0100200300400500600700800
High
stre
et sh
op in
Rus
sell
Stre
et
High
stre
et sh
op in
majo
r str
eet in
CW
B or
TST
Harb
our C
ity
Wha
rf
Pacif
ic Pla
ce
Land
mark
Swire
Sheu
ng S
hui S
hopp
ing A
rcade
Hysa
n
HK L
and
Cham
pion
REIT
Chine
se E
state
s
Hend
erso
n
HLP
SHKP
Sino
Land
Sunli
ght R
EIT
MTRC
Metro
City
Pha
se 1
Fortu
ne R
EIT
New
Wor
ld CK
The
Link R
EIT
(HKD/sq ft) *
2,6002,5002,400

2013 Outlook for Asia 4 January 2013
- 71 -
Key stock call for 2013
Wharf Holdings (4 HK, HKD60.05, Buy [1]) Investment thesis Wharf Holdings’ (Wharf) investment in retail management expertise and China property looks to be coming to fruition, and 2013 and beyond should see the company in harvesting mode. In our view, this will elevate the company in the eyes of investors, taking it from being another asset play in Hong Kong into potentially one of the premier stocks in global property. While Wharf’s strong share price performance in 2012 (+73%) suggests a rerating is already under way, we contend that Wharf’s transformation will take time to run its course and 2013 should be the year when there is broad market recognition of the grounds for a fundamental rerating of the stock. Valuation Currently trading at a 34% discount to our end-2013 NAV estimate of HKD90.50, Wharf is still attractively valued, in our view. Since 1990, the stock has traded at an average discount to NAV of 31%. Its average discount to NAV narrowed to 15.2% during 1991-94 when the group was being rerated on the back of its efforts to actively unlock the value of its quality assets.
Wharf: discount to NAV since 1990
Source: Datastream, Daiwa estimates
In this context, we see considerable room for the company’s NAV to expand and the stock’s discount to NAV to narrow, as the market comes to recognise the scope for Wharf to become a premier player in global property. We have a six-month target price of HKD67.90, which is based on a 25% discount to our end-2013 NAV estimate. Risks to our call The main risk to our call on Wharf would be greater-than-expected weakness in the Hong Kong and China economies, which could lead to a slowdown in retail sales in those markets.
Hong Kong Property: valuation summary
Stock Price (LC) Mkt. cap Target Year-end PER (x) PBR (x) Dividend yield (%) ROE (%)Company code 28-Dec-12 (USDm) Rating price (LC) Month FY1E FY2E FY1E FY2E FY1E FY2E FY2EWharf Holdings 4 HK 60.05 23,464 Buy 67.90 31-Dec 18.1 16.1 0.8 0.7 1.9 2.1 4.7Hang Lung Properties 101 HK 30.40 17,542 Buy 34.40 31-Dec 27.1 21.4 1.2 1.2 2.5 2.6 5.5Hysan Development 14 HK 37.30 5,081 Buy 42.80 31-Dec 24.5 20.6 0.8 0.8 2.7 3.5 3.9Sunlight REIT 435 HK 3.31 693 Buy 4.00 30-Jun 19.3 18.1 0.6 0.6 5.7 6.1 3.2SHK Properties 16 HK 116.10 38,491 Buy 136.50 30-Jun 12.5 11.6 0.8 0.8 3.2 3.4 7.0The Link REIT 823 HK 38.75 11,459 Outperform 42.10 31-Mar 26.6 24.1 1.3 1.3 3.8 4.1 5.3Cheung Kong 1 HK 118.90 35,527 Buy 143.70 31-Dec 10.2 8.8 0.8 0.8 2.9 3.1 9.3Henderson Land 12 HK 55.45 16,996 Buy 67.30 31-Dec 20.1 16.5 0.7 0.7 2.2 2.3 4.2Sino Land 83 HK 14.06 10,723 Buy 16.73 30-Jun 13.9 12.4 0.9 0.9 3.6 3.9 7.0Source: Bloomberg, Daiwa forecasts
(80% )(70% )(60% )(50% )(40% )(30% )(20% )(10% )
0%10%20%
1991
1992
1993
1994
1995
1996
1997
1998
1999
2000
2001
2002
2003
2004
2005
2006
2007
2008
2009
2010
2011
2012
Wharf NAV discount Average Since 1990
(Disc)/prem.
91-94 avg:
-15.2%
96-97 avg:
-26.8%
94-95 avg:
-21.3%
97-03 avg:
-37.4%
04-08 avg:
-31.7%
08-09 avg:
-42.8%
10-now avg:
-35.5%

2013 Outlook for Asia 4 January 2013
- 72 -
China Thermal Coal – Positive Dave Dai, CFA (852) 2848 4068 ([email protected])
Top-3 share-price drivers
• Near-term opportunity: convergence of spot and contract coal prices. During 1H12, following a narrowing of the gap between spot and contract coal prices, China’s National Development and Reform Commission (NDRC) started a study of possible contract-spot price convergence. On 25 December, the government formally recommended termination of key contract coal, leaving coal producers and IPPs to negotiate directly. As a result, we expect the coal producers to see an increase in contract prices given that the 2012 contract price is still trading at a 6% discount to the latest benchmark spot coal price. China Coal (1898 HK, HKD8.4, Buy [1]) and China Shenhua (1088 HK, HKD34.0, Buy [1]) would likely be the key beneficiaries of any price convergence because their contract prices are currently at significant discounts to spot prices (especially in the seaborne coal market).
2013E EPS sensitivity to changes in thermal-coal prices (%)
Every 1% increase in Contract SpotShenhua +0.3 +0.9China Coal +1.9 +2.5Yanzhou +0.7 +9.4Source: Daiwa estimates
Note: For domestic thermal coal only, Yanzhou is also sensitive to changes in Australian coal prices and domestic coking-coal prices
• Supply discipline. We expect supply discipline to prevail in 2013, due to both profitability issues and safety concerns. According to local press reports, in the first 8 months of 2012, 16 large state-owned coal producers recorded net losses, meaning 17.8% of China’s large-scale coal producers were loss-making. Besides, in the short term, we do not expect the small coal mines that were closed down in July 2012 amid safety concerns to resume full production until the 18th National People’s Congress in March 2013 — particularly after recent press reports of a couple of fatal coal-mine accidents in Guizhou Province.
• Sequential demand growth. On the demand side, we forecast sequential coal demand growth in 2013, driven largely by an increase in power demand (+7% YoY). Besides, Daiwa forecasts China’s FAI growth to remain solid (20.5% YoY for 2012, 18.0% YoY for 2013), which would augur well for a recovery in coal demand.
Commercial coal consumption forecasts by driver
2009 2010 2011 2012E 2013E 2014E 2015EDomestic Consumption (mt) 3,092 3,331 3,659 3,764 3,947 4,135 4,294 Consumption growth (%) 12.1 7.7 7.1 2.8 4.9 4.8 3.8- Power 1,461 1,615 1,869 1,912 2,048 2,175 2,276 - Steel 533 578 617 630 648 681 717 - Construction 375 429 475 505 536 562 585 - Chemical 92 89 91 96 96 96 96 - Others 631 620 608 620 620 620 620 Breakdown (%) - Power 47 48 51 51 52 53 53- Steel 17 17 17 17 16 16 17- Construction 12 13 13 13 14 14 14- Chemical 3 3 3 3 2 2 2- Others 20 19 16 16 16 15 14Growth (%) - Power 7 11 16 2 7 6 5- Steel 16 9 7 2 3 5 5- Construction 17 14 11 7 6 5 4- Chemical 3 (3) 2 5 0 0 0- Others 21 (2) (2) 2 0 0 0Underlying drivers - Coal-fired power consumption (TWh) 2,983 3,325 3,898 3,988 4,271 4,537 4,747 - Crude steel production (mt) 566 626 684 712 732 770 810 - Cement production (mt) 1,629 1,868 2,063 2,197 2,330 2,435 2,529 - Fertilizer production (mt) 67 66 60 63 63 63 63 Growth (%) - Coal-fired power consumption (TWh) 6 11 17 2 7 6 5- Crude steel production (mt) 14 11 9 4 3 5 5- Cement production (mt) 17 15 10 7 6 5 4- Fertilizer production (mt) 14 (1) (9) 5 0 0 0Source: CEIC, Daiwa forecasts
Sector outlook for 2013
We believe the supply and demand balance will continue to improve in 2013, with demand growth (4.9% YoY) outpacing supply growth (2.5% YoY). Factoring in a steady rise in the amount of imported coal (up 1.8% YoY for 2013E), we expect system inventory to decline by 3 days to 28 days. As a result, we expect the spot coal price to increase by a further 1%.

2013 Outlook for Asia 4 January 2013
- 73 -
China: spot coal price (Qinhuangdao) forecasts
Source: SX Coal, Daiwa forecasts
Key stock call for 2013
China Coal (1898 HK, HKD8.4, Buy [1]) Investment thesis With the stock having underperformed the HSCEI for three years, we see a favourable risk-reward profile for China Coal in the near term. The success of China Coal’s cost-management efforts was a positive surprise to us in 3Q12, though cost escalation in the fourth quarter of prior years has been a seasonal consideration. The company’s present cost structure means it is less exposed than its peers to certain imminent cost-inflation factors, such as labour costs. In our view, its closest peer, Yanzhou Coal (1171 HK, HKD12.8, Hold [3]), has greater earnings risk if labour costs rise by more than expected; hence we project a lower rise in operating costs (4% YoY) for China Coal in 2013.
China Coal’s earnings visibility is more straightforward, with: 1) no margin erosion from overseas operations, 2) a cost structure that is relatively insulated from rising labour costs and the risk of changes to the resources tax (a process which should be implemented in stages). For 2013, we project 13% YoY growth in net profit for China Coal, driven by self-production growth of 14% YoY on the back of two new mines. Since China Coal has historically realised higher contract prices than Shenhua, its earnings would benefit more if contract coal prices were to move toward market prices, especially in the seaborne coal market, where the contract price is lower than the spot price. The parent company intends to increase its stake (currently at 57.5%) in China Coal by up to 2.5% between October 2012 and October 2013 — while not a substantial increase, the intended move might suggest this is an undervalued business. Valuation Our DCF-based six-month target price is HKD10.0. The stock is trading currently at a deep discount to its past-five-year forward PER, which looks appealing to us. Risks to our call The contract pricing negotiations between coal producers and IPPs are still on-going. If the contract price increases less than our expectations (up 3% YoY) in 2013, there could be downside risk to our earnings forecasts for the sector in 2013.
2013E EPS downside in case of no change in contract price % EPS downsideShenhua -0.9China Coal -5.7Yanzhou -2.1Source: Daiwa forecasts
China Thermal Coal: valuation summary Stock Price (LC) Mkt. cap Target Year-end PER (x) PBR (x) EV/EBITDA (x) Dividend yield (%) ROE (%)Company code 28-Dec-12 (USDm) Rating price (LC) Month FY1E FY2E FY1E FY2E FY1E FY2E FY1E FY2E FY2EChina Shenhua Energy 1088 HK 34.0 87,110 Buy 38.0 31-Dec 11.5 10.3 2.1 1.9 8.0 7.1 3.5 3.9 19.5China Coal Energy 1898 HK 8.4 14,299 Buy 10.0 31-Dec 10.3 9.1 1.0 0.9 8.8 8.4 2.8 3.2 10.7Source: Bloomberg, Daiwa forecasts
200300400500600700800900
1,0001,100
Jan-06 Jan-07 Jan-08 Jan-09 Jan-10 Jan-11 Jan-12 Jan-13
(CNY/t)
Shanxi premium blend 5500kcal
2012's low

2013 Outlook for Asia 4 January 2013
- 74 -
India Auto – Positive Navin Matta (91) 22 6622 8411 ([email protected])
Top-3 share-price drivers
• Interest-rate cuts to drive industry growth. Given India’s flagging GDP growth, Daiwa’s economics team forecasts interest rates to be cut by 100bps in 2013. We expect this to have a positive impact on the Indian Auto industry. Our analysis shows that interest rates are negatively correlated with auto sales volume growth, in varying degrees across sub-segments, with the greatest impact seen in the passenger vehicle segment, followed by the commercial vehicle and two-wheeler segments.
Interest rates vs. domestic passenger vehicle sales growth
Source: Bloomberg, SIAM, Daiwa
• Currency movements to be largely
favourable. The forex movements forecast by Daiwa’s economists should be an important driver for the sector. Continued depreciation of the Rupee in FY14/15 would be beneficial to major net exporters including Bajaj Auto and Bharat Forge. Importantly, our economists also expect the Yen to depreciate sharply, which would likely offset the negative impact of Rupee depreciation borne by Maruti Suzuki, given the company’s large net import exposure, primarily in Yen.
• Benign commodity price environment to provide headroom for margin expansion. Our materials team expects prices for ferrous/non-ferrous metals to be flat or even decline in some cases for 2013. This could be an important driver of
profitability for the sector. But the resulting benefits for companies should depend on the competitive environment in each sub-sector. We expect competitive dynamics to worsen in the commercial vehicle and two-wheeler segment, but to improve in the passenger vehicle segment in the near term.
Sector outlook for 2013
We expect the India Auto sector to benefit from improving macro factors — namely higher GDP growth and declining interest rates. In the passenger vehicle segment, we expect volume growth to recover in FY14 (year ending March 2014), premised on indications of pent-up demand and a revival in petrol segment sales (45% of industry volume). Given the strong macro correlation, we expect commercial vehicle sales volumes to pick up in FY14 after a sharp decline in the current year, FY13 (ending March 2013), but the competitive environment is likely to worsen as some of the newer players are looking to gain market share. In the two-wheeler segment, the market structure is changing following the split between Hero and Honda. As a result, we believe Honda is likely to focus aggressively on gaining market share, especially once its new capacity comes on stream in mid-2013. India Auto sector: domestic sales volume growth
Source: Company, SIAM, Daiwa forecasts
Key stock call for 2013
Tata Motors (TTMT, INR309.65, Outperform [2]) Investment thesis Our positive view on Tata Motors is premised on the Jaguar-Land Rover (JLR) business continuing to perform strongly. We believe that the growing appetite for sports utility vehicles (SUVs) in the premium car segment augurs well for JLR, since it has a strong
(30)
(15)
0
15
30
45
60
89
10111213141516
1Q F
Y04
3Q F
Y04
1Q F
Y05
3Q F
Y05
1Q F
Y06
3Q F
Y06
1Q F
Y07
3Q F
Y07
1Q F
Y08
3Q F
Y08
1Q F
Y09
3Q F
Y09
1Q F
Y10
3Q F
Y10
1Q F
Y11
3Q F
Y11
1Q F
Y12
3Q F
Y12
1Q F
Y13
SBI PLR (%) (LHS) PV (% YoY) (RHS)
26 28
4 8
18
39
27
19
7
13
26 26
14
5 9
05
1015202530354045
FY10 FY11 FY12 FY13E FY14EPV CV 2W
(YoY %)

2013 Outlook for Asia 4 January 2013
- 75 -
product range in the segment. Moreover, we expect JLR’s strong pipeline of new product introductions to enable the company to maintain healthy volume growth momentum and steadily improve its EBITDA margin. JLR has proven its product development capabilities with the success of the Range Rover Evoque and the market’s initial response to the new Range Rover, which is based on the company’s premium lightweight architecture (PLA). Its strong pipeline of new products, scheduled to launch in 2013-14, should lead to market-share gains in the global premium car segment. We also expect a moderate recovery in the standalone business, largely due to a cyclical uptick in commercial vehicle demand on the back of our forecast improvement in economic growth and reduction in interest rates. In response to increasing competition, Tata Motors plans to expand its product range and further strengthen its service network. Alongside Maruti, Tata Motors is one of our top picks in the India Auto sector, with its JLR business on the brink of becoming a meaningful player, in terms of volumes, in the premium car market. Although the
company is in a period of heavy investment across its business lines, we like the fact that this should be largely funded internally, with headroom for further deleveraging in its consolidated balance sheet. We believe that the JLR business should be re-rated as investors come to recognise the company’s execution, as well as the areas of the market it has yet to tap into. Valuation We recently raised our six-month target price for Tata Motors to INR335, incorporating a value of INR198-220 per share (EV of 3.5x adjusted EBITDA) for JLR, INR98-108 per share for the standalone business (EV of 6.5x EBITDA), and INR30 for other subsidiaries less net auto debt of INR31 per share. At our target price, the stock would trade at an EV of 4x-4.4x FY14E EBITDA. Risks to our call Significant delays in product launches and a deterioration in the pricing environment are the key risks to our investment view.
India Auto: valuation summary Stock Price (LC) Mkt. cap Target Year-end PER (x) PBR (x) EV/EBITDA (x) Dividend yield (%) ROE (%)Company code 28-Dec-12 (USDm) Rating price (LC) Month FY1E FY2E FY1E FY2E FY1E FY2E FY1E FY2E FY2EMaruti Suzuki India MSIL IN 1,500.2 7,910 Outperform 1624 31-Mar 21.9 15.9 2.6 2.2 11.7 8.4 0.5 0.7 15.1Tata Motors TTMT IN 309.7 18,021 Outperform 335 31-Mar 8.6 7.1 2.3 1.8 5.2 4.4 1.6 1.9 28.4Hero Motocorp HMCL IN 1,894.0 6,901 Hold 1907 31-Mar 15.8 14.9 6.7 5.4 9.9 8.5 2.4 2.6 40.1Source: Bloomberg, Daiwa forecasts
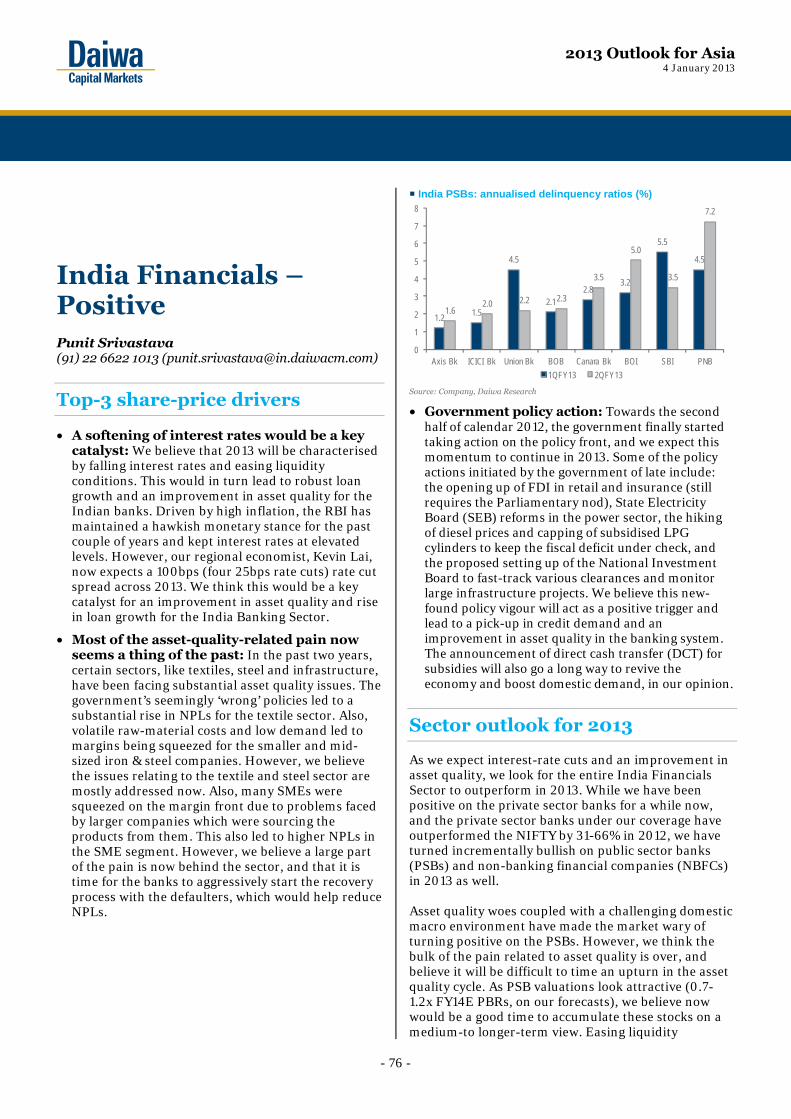
2013 Outlook for Asia 4 January 2013
- 76 -
India Financials – Positive Punit Srivastava (91) 22 6622 1013 ([email protected])
Top-3 share-price drivers
• A softening of interest rates would be a key catalyst: We believe that 2013 will be characterised by falling interest rates and easing liquidity conditions. This would in turn lead to robust loan growth and an improvement in asset quality for the Indian banks. Driven by high inflation, the RBI has maintained a hawkish monetary stance for the past couple of years and kept interest rates at elevated levels. However, our regional economist, Kevin Lai, now expects a 100bps (four 25bps rate cuts) rate cut spread across 2013. We think this would be a key catalyst for an improvement in asset quality and rise in loan growth for the India Banking Sector.
• Most of the asset-quality-related pain now seems a thing of the past: In the past two years, certain sectors, like textiles, steel and infrastructure, have been facing substantial asset quality issues. The government’s seemingly ‘wrong’ policies led to a substantial rise in NPLs for the textile sector. Also, volatile raw-material costs and low demand led to margins being squeezed for the smaller and mid-sized iron & steel companies. However, we believe the issues relating to the textile and steel sector are mostly addressed now. Also, many SMEs were squeezed on the margin front due to problems faced by larger companies which were sourcing the products from them. This also led to higher NPLs in the SME segment. However, we believe a large part of the pain is now behind the sector, and that it is time for the banks to aggressively start the recovery process with the defaulters, which would help reduce NPLs.
India PSBs: annualised delinquency ratios (%)
Source: Company, Daiwa Research
• Government policy action: Towards the second half of calendar 2012, the government finally started taking action on the policy front, and we expect this momentum to continue in 2013. Some of the policy actions initiated by the government of late include: the opening up of FDI in retail and insurance (still requires the Parliamentary nod), State Electricity Board (SEB) reforms in the power sector, the hiking of diesel prices and capping of subsidised LPG cylinders to keep the fiscal deficit under check, and the proposed setting up of the National Investment Board to fast-track various clearances and monitor large infrastructure projects. We believe this new-found policy vigour will act as a positive trigger and lead to a pick-up in credit demand and an improvement in asset quality in the banking system. The announcement of direct cash transfer (DCT) for subsidies will also go a long way to revive the economy and boost domestic demand, in our opinion.
Sector outlook for 2013
As we expect interest-rate cuts and an improvement in asset quality, we look for the entire India Financials Sector to outperform in 2013. While we have been positive on the private sector banks for a while now, and the private sector banks under our coverage have outperformed the NIFTY by 31-66% in 2012, we have turned incrementally bullish on public sector banks (PSBs) and non-banking financial companies (NBFCs) in 2013 as well. Asset quality woes coupled with a challenging domestic macro environment have made the market wary of turning positive on the PSBs. However, we think the bulk of the pain related to asset quality is over, and believe it will be difficult to time an upturn in the asset quality cycle. As PSB valuations look attractive (0.7-1.2x FY14E PBRs, on our forecasts), we believe now would be a good time to accumulate these stocks on a medium-to longer-term view. Easing liquidity
1.2 1.5
4.5
2.12.8
3.2
5.5
4.5
1.62.0 2.2 2.3
3.5
5.0
3.5
7.2
0
1
2
3
4
5
6
7
8
Axis Bk ICICI Bk Union Bk BOB Canara Bk BOI SBI PNB1QFY13 2QFY13

2013 Outlook for Asia 4 January 2013
- 77 -
conditions leading to a fall in wholesale rates would be the key positive trigger for the NBFCs in 2013. India: interest rates expected to head southwards
Source: Daiwa forecasts
Key stock call for 2013
ICICI Bank (ICICIBC IN, INR1,14.25, Buy [1])
Investment thesis In our view, ICICI Bank would be one of the key beneficiaries of any interest-rate cuts in FY13. As we expect easing liquidity conditions and a fall in interest rates, the bank’s loan-growth prospects look likely to improve. ICICI Bank is also well-positioned to benefit from higher demand for retail and SME loans, and some of its issues associated with asset quality could be addressed with a fall in interest rates. High Tier-1 ratio: ICICI Bank’s high Tier-1 ratio of 12.8% (2Q FY13) is one of the best among its peers and should support the bank’s overall earnings growth over the next two years.
Banking ROE to improve: We forecast its banking ROE to improve to around 16% for FY13 and 17.5% for FY14, from 12.6% for FY11, and expect the NIM to remain stable with the potential for upside over the next 3-4 quarters (3% for 2Q FY13). Improvement in the macro environment: If the macro environment improves in India driven by government action, and both domestic and global macro conditions show signs of stability, we believe there is considerable rerating potential for the stock as the asset quality related issues start to be addressed. Valuation We reiterate our Buy (1) rating on ICICI Bank. Our SOTP-based six-month target price of INR1,365 assigns a valuation of 2.1x to the banking BVPS (based on our FY14 forecasts) and INR260/share for the value of the bank’s investments. We believe the bank’s ROE will improve further as we expect better leverage over the next two years, and hence regard the current PBR valuation, at 1.8x on our FY14 BVPS forecast, as attractive. Risks to our call A sustained level of high inflation, which would prevent the RBI from cutting interest rates, would be one of the key risks to our call. Higher-than-expected NPLs, an increase in the restructured loan book, and stalling of government policy actions in Parliament are other variables that remain risks to our call.
India Financials: valuation summary
Stock Price (LC) Mkt. cap Target Year-end PER (x) PBR (x) Dividend yield (%) ROE (%)Company code 28-Dec-12 (USDm) Rating price (LC) Month FY1E FY2E FY1E FY2E FY1E FY2E FY2EICICI Bank ICICIBC IN 1,142.25 24,024 Buy 1,365 31-Mar 16.2 13.2 2.0 1.8 1.8 2.1 14.4Rural Electrification RECL IN 241.90 4,358 Buy 265 31-Mar 7.0 5.8 1.5 1.2 3.7 4.3 23.1State Bank of India SBIN IN 2,377.75 29,111 Hold 2,365 31-Mar 10.1 9.1 1.5 1.3 1.3 1.4 15.5Source: Bloomberg, Daiwa forecasts
0.0
2.0
4.0
6.0
8.0
10.0
Oct-0
7Ja
n-08
Apr-0
8Ju
l-08
Oct-0
8Ja
n-09
Apr-0
9Ju
l-09
Oct-0
9Ja
n-10
Apr-1
0Ju
l-10
Oct-1
0Ja
n-11
Apr-1
1Ju
l-11
Oct-1
1Ja
n-12
Apr-1
2Ju
l-12
Oct-1
2Ja
n-13
Apr-1
3Ju
l-13
Oct-1
3
Repo rate % CRR %
Four rate cuts of 25 bps each expected in 2013
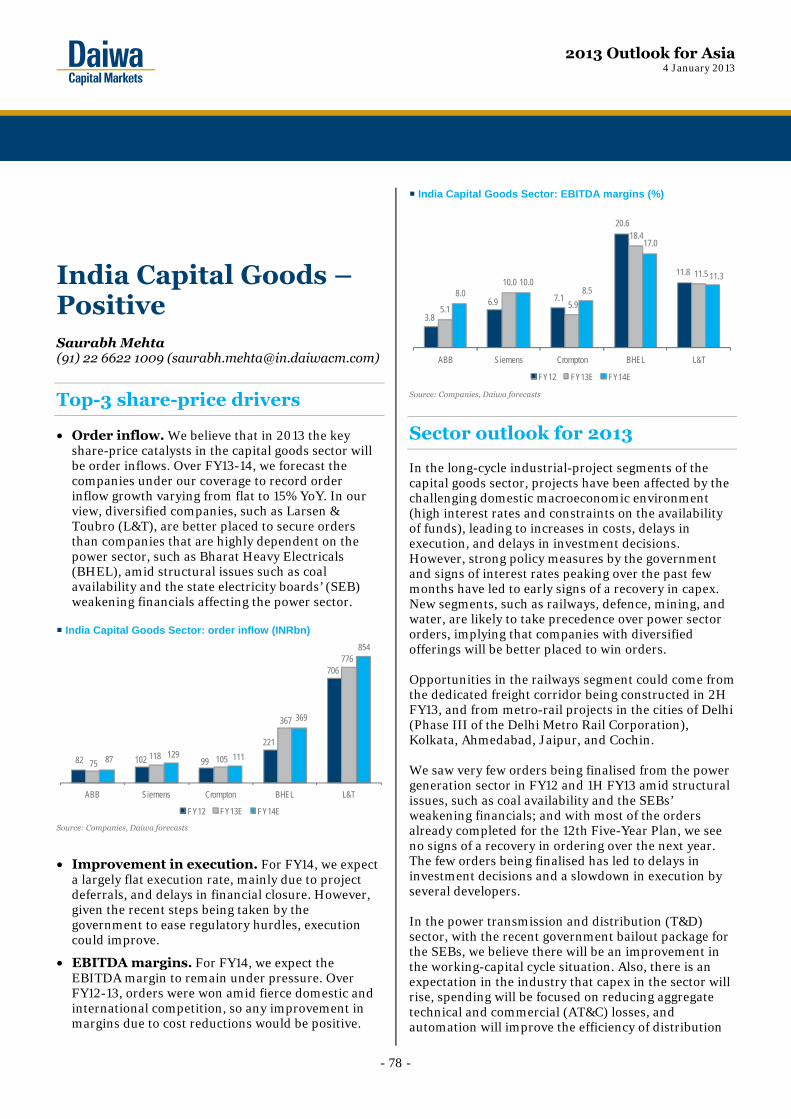
2013 Outlook for Asia 4 January 2013
- 78 -
India Capital Goods – Positive Saurabh Mehta (91) 22 6622 1009 ([email protected])
Top-3 share-price drivers
• Order inflow. We believe that in 2013 the key share-price catalysts in the capital goods sector will be order inflows. Over FY13-14, we forecast the companies under our coverage to record order inflow growth varying from flat to 15% YoY. In our view, diversified companies, such as Larsen & Toubro (L&T), are better placed to secure orders than companies that are highly dependent on the power sector, such as Bharat Heavy Electricals (BHEL), amid structural issues such as coal availability and the state electricity boards’ (SEB) weakening financials affecting the power sector.
India Capital Goods Sector: order inflow (INRbn)
Source: Companies, Daiwa forecasts
• Improvement in execution. For FY14, we expect a largely flat execution rate, mainly due to project deferrals, and delays in financial closure. However, given the recent steps being taken by the government to ease regulatory hurdles, execution could improve.
• EBITDA margins. For FY14, we expect the EBITDA margin to remain under pressure. Over FY12-13, orders were won amid fierce domestic and international competition, so any improvement in margins due to cost reductions would be positive.
India Capital Goods Sector: EBITDA margins (%)
Source: Companies, Daiwa forecasts
Sector outlook for 2013
In the long-cycle industrial-project segments of the capital goods sector, projects have been affected by the challenging domestic macroeconomic environment (high interest rates and constraints on the availability of funds), leading to increases in costs, delays in execution, and delays in investment decisions. However, strong policy measures by the government and signs of interest rates peaking over the past few months have led to early signs of a recovery in capex. New segments, such as railways, defence, mining, and water, are likely to take precedence over power sector orders, implying that companies with diversified offerings will be better placed to win orders. Opportunities in the railways segment could come from the dedicated freight corridor being constructed in 2H FY13, and from metro-rail projects in the cities of Delhi (Phase III of the Delhi Metro Rail Corporation), Kolkata, Ahmedabad, Jaipur, and Cochin. We saw very few orders being finalised from the power generation sector in FY12 and 1H FY13 amid structural issues, such as coal availability and the SEBs’ weakening financials; and with most of the orders already completed for the 12th Five-Year Plan, we see no signs of a recovery in ordering over the next year. The few orders being finalised has led to delays in investment decisions and a slowdown in execution by several developers. In the power transmission and distribution (T&D) sector, with the recent government bailout package for the SEBs, we believe there will be an improvement in the working-capital cycle situation. Also, there is an expectation in the industry that capex in the sector will rise, spending will be focused on reducing aggregate technical and commercial (AT&C) losses, and automation will improve the efficiency of distribution
82 102 99
221
706
75 118 105
367
776
87 129 111
369
854
ABB Siemens Crompton BHEL L&T
FY12 FY13E FY14E
3.8
6.9 7.1
20.6
11.8
5.1
10.0
5.9
18.4
11.5
8.0 10.0
8.5
17.0
11.3
ABB Siemens Crompton BHEL L&T
FY12 FY13E FY14E

2013 Outlook for Asia 4 January 2013
- 79 -
networks. Further, there should be investment in the transformer segment; however, due to overcapacity, this segment should continue to be affected by fierce competition among domestic players. India: correlation between industrial growth and real interest
rates
Source: Bloomberg
Key stock call for 2013
Larsen & Toubro (LT IN, INR1,618.2, Outperform [2]) Investment thesis Although the company’s share price has outperformed SENSEX by 30%+ over the past year, L&T remains our preferred pick in the capital goods space. We believe that against the current macroeconomic backdrop, diversified players, such as L&T, will be the primary beneficiaries of a potential revival in industrial capex. Also, given the company’s strong order backlog of INR1.6tn at the end of 1H FY13 and strong execution, we forecast revenue growth of 14% a year and annual adjusted profit growth of 9% over FY12-15, backed by a 2.7x book-to-bill ratio (trailing 12-month revenue).
L&T appears best-positioned to capitalise on the upturn in the capex cycle. As order inflow drives the share price, we forecast the company to see Rs776bn (up 10% YoY) worth of new orders in FY13, driven by the road, airports, and oil and gas infrastructure sectors. A pick-up in order inflows has in the past been followed by upward revisions to the consensus earnings forecasts. Further orders could come from the railway, mining, and defence sectors, which are benefiting from positive government policy changes. Investment in railways, for example, is set to accelerate, driven by a new dedicated freight corridor, and Metrorail opportunities in a number of cities. Also, increased local sourcing in defence contracts could be the next demand driver. Moreover, L&T is looking to divest various infrastructure assets (if these projects were sold at premiums to book values, this would lead to a rerating of L&T’s entire infrastructure portfolio, which we currently value at book [INR106/share]), which would free up the company’s balance sheet (equity invested at INR49bn and a further equity investment of INR93bn), allowing it to bid for more projects. A few of these assets are loss-making, so selling them would lead to an improvement in the consolidated ROE. Valuation We value L&T on a SOTP basis, and have a six-month target price of INR1,780. We assign a target FY14E PER of 18x to the company’s core business (L&T’s parent), reflecting the stock’s mid-cycle multiple. Risks to our call A further slowdown in capex, prompted by a further deterioration in the macroeconomic environment, could lead to lower order-inflow growth than we expect.
India Capital Goods: valuation summary
Stock Price (LC) Mkt. cap Target Year-end PER (x) PBR (x) EV/EBITDA (x) Dividend yield (%) ROE (%)Company code 28-Dec-12 (USDm) Rating price (LC) Month FY1E FY2E FY1E FY2E FY1E FY2E FY1E FY2E FY2ELarsen & Toubro LT IN 1,618.2 18,080 Outperform 1,780 31-Mar 21.2 19.4 3.4 3.0 14.4 12.9 1.0 1.0 16.6Bharat Heavy Electricals BHEL IN 227.5 10,157 Underperform 192 31-Mar 9.5 10.4 1.9 1.7 5.8 5.7 2.9 2.9 17.1Siemens India SIEM IN 668.5 4,150 Underperform 566 30-Sep 41.9 29.5 5.8 5.1 23.5 16.2 0.9 1.0 18.4Crompton Greaves CRG IN 115.6 1,352 Underperform 102 31-Mar 22.2 12.2 1.9 1.7 11.2 6.7 1.2 1.7 14.9ABB Ltd (India) ABB IN 698.3 2,700 Sell 444 31-Dec 64.7 39.3 5.4 4.8 37.7 22.7 0.2 0.2 12.9Source: Bloomberg, Daiwa forecasts
(10)
(5)
0
5
10
15
20
Jun-0
6
Nov-0
6
Apr-0
7
Sep-0
7
Feb-0
8
Jul-0
8
Dec-0
8
May-0
9
Oct-0
9
Mar-1
0
Aug-1
0
Jan-1
1
Jun-1
1
Nov-1
1
Apr-1
2
Sep-1
2
Index of Industrial Production % change YoY: 3mmaReal repo rate %
(%)

2013 Outlook for Asia 4 January 2013
- 80 -
India Consumer – Neutral Mihir P. Shah (91) 22 6622 1020 ([email protected])
Top-3 share-price drivers
• Distribution reach. Amid growing rural demand, and with the cost of servicing rural areas becoming less prohibitive, the extent of a consumer company’s distribution capabilities is emerging as an important differentiating factor, particularly in today’s competitive environment. We believe companies that actively seek to expand their distribution reach or increase their retail space should quickly see benefits in terms of additional sales.
• New products and segments. We are seeing consumers gradually shift to products offering ‘functional benefits’ in all categories, even at the cost of premiumisation (paying more for better products). Examples include consumers switching from soap to face wash, and from cold cream to fairness cream/under-eye cream/anti-ageing cream/hand and body lotion/sun screen. We believe companies that innovate, launch new products, or make forays into new categories that are perceived to offer additional value to consumers will benefit from this increasing demand.
• Competitive intensity has been high for a couple of years. Although we believe this is considered to be ‘the new normal’, if competition intensifies from this point — which we believe is unlikely, albeit difficult to predict — it may weigh on the EBITDA margins of the consumer companies. We expect a continuation of high competitive intensity to pressure margins.
Sector outlook for 2013
The India consumer sector performed strongly in the 12 months to 26 December 2012, rising by 49% and outperforming the Sensex by 24%. The sector is trading at multi-year-high valuations, driven by strong fundamentals as well as the scarcity premium awarded to defensive stocks in a challenging environment. There has been no significant change in the underlying
consumption story, and we believe upside surprises to EPS are unlikely. Given valuations are already high relative to recent years, it is hard to see meaningful upside to share prices. Indeed, we believe the sector’s valuations have run ahead of its fundamentals, and multiples are likely to correct by 10-15% in the medium term. However, we do not expect negative returns on a 12-month basis, given our forecast for mid- to high-teens EPS growth in FY14 and FY15 for most companies in the sector. In expectation of an improving economic environment in 2013, we favour the consumer discretionary stocks over the staples.
FMCG valuation vs. SENSEX
Source: Bloomberg, Company, Daiwa
Key stock call for 2013
Titan Industries (TTAN IN, INR281, Buy [1]) Investment thesis Titan Industries is India’s largest organised watch and jewellery manufacturer, with strong brands and sub-brands such as Titan, Tanishq, Sonata and Fast Track among others. In our view, the watch and jewellery markets offer direct exposure to the discretionary spending power of Indian consumers and the ongoing shift in preference for branded products from unbranded ones. We believe Titan Industries has multiple growth drivers, which should be boosted by improving consumer sentiment. We expect the company to deliver a circa-30% EPS CAGR for the next 3-5 years, largely driven by the jewellery business. Titan is our top pick in the India consumer discretionary space. Aggressive expansion plans in jewellery segment. The company has been steadily expanding its distribution reach and adding new retail space in its jewellery business. In FY12, it added about 100,000sq ft of retail space, and plans to add 200,000sq ft in FY13. We believe that expanding stores during an economic slowdown and increasing consumer touch
-20%
0%
20%
40%
60%
80%
100%
120%
140%
0
5
10
15
20
25
30
35
Jan-03 Jan-04 Jan-05 Jan-06 Jan-07 Jan-08 Jan-09 Jan-10 Jan-11 Jan-12FMCG PER (LHS) Sensex PER (LHS) Premium / Discount (RHS)
(x)

2013 Outlook for Asia 4 January 2013
- 81 -
points will not only maintain but grow sales volume, supporting market-share gains. Jewellery margins likely to improve. We believe there are multiple levers at play for the company to expand its jewellery margins. First, it is focusing on increasing its circa-25% share of the diamond jewellery segment, in which margins are higher than in the plain-gold jewellery segment. Second, the government has permitted Titan to directly import gold under a new licence, which should allow the company to save about 50-70bps of costs. Such savings should flow directly to its EBIT margin. Third, the 1% excise duty on branded jewellery was lifted in March 2012, which should also improve Titan’s EBIT margin. Edge in innovation. In our view, Titan stands out for its ability to innovate across its key business lines of watches, jewellery, eyewear and accessories. We expect the company to deliver a steady stream of new products
and collections, underpinning incremental revenue growth in 2013. In sum, we see Titan as an attractive blend of retail and fast-moving consumer goods (FMCG) that incorporates the best elements of both — it has the high revenue growth of retail players and the superior cash flow-generating abilities of FMCG companies. We reaffirm our Buy call. Valuation Our six-month target price for Titan is INR340. We value the stock on a PER of 28x applied to the average of our FY14-15 EPS forecasts, similar to the average current trading PER of FMCG stocks in India. Risks to our call An economic slowdown could cause a dip in consumer demand for discretionary purchases, while volatile gold prices could result in consumers deferring purchases.
India Consumer: valuation summary
Stock Price (LC) Mkt. cap Target Year-end PER (x) PBR (x) EV/EBITDA (x) Dividend yield (%) ROE (%)Company code 28-Dec-12 (USDm) Rating price (LC) Month FY1E FY2E FY1E FY2E FY1E FY2E FY1E FY2E FY2ETitan Industries TTAN IN 281.0 4,551 Buy 340 31-Mar 33.0 26.1 12.5 9.6 23.4 18.5 0.8 1.2 41.5Source: Bloomberg, Daiwa forecasts

2013 Outlook for Asia 4 January 2013
- 82 -
India Materials – Positive Deepak Poddar, CFA (91) 22 6622 1016 ([email protected])
Top-3 share-price drivers
• Lower raw-material costs likely to drive EBITDA margins. In 2012, the spot coking-coal price declined by 33%, with most of this decline occurring from June to December when coking-coal prices declined by 27%. The Indian steel companies remain the key beneficiaries of declining global coking-coal prices, as coking-coal costs form 23-45% of their cost of production. We believe the Indian steel players will start realising the benefit of lower coking-coal prices from 3Q FY13 (4Q12) onwards, which would be likely to drive EBITDA margins.
The coking-coal contract price for 3Q FY13 was settled at USD170/t (down USD55/t QoQ). Further, our outlook for coking-coal prices remains subdued, driven largely by our expectation of a global surplus of coking coal in 2013 and 2014. On the contrary, stable iron-ore prices will likely keep the cost of production in China and other countries at elevated levels, which in turn would support steel prices.
Spot coking-coal price movements
Source: AME Group, Daiwa
• China economy expected to rebound. Daiwa’s regional economist, Mingchun Sun, expects a cyclical recovery in China’s economy driven by restocking activity. Daiwa forecasts China’s real GDP growth to pick up from 7.4% YoY for 3Q12 to 8.2%
YoY for 4Q12, to 8.5% YoY for 1Q13 and to 8.6% YoY for 2Q13. Further, in China, traders’ steel inventory in major regions is at its lowest level of the past two years, and any restocking activity henceforth could drive the steel market. We are already witnessing buoyancy in Chinese steel prices (up 13% from October-December 2012).
China: steel inventory in key regions
Source: Bloomberg
• Volume growth. The iron-ore mining issues in Goa, Karnataka an Orissa have created a shortage of usable iron ore within the country, and we expect them to lead to an 8-10% decline in the country’s steel-producing capacity for 2013. However, the impact should be most heavily felt by the smaller players, which are not-self sufficient in iron ore, rather than Tata Steel and Steel Authority of India (SAIL), which are 100% self-sufficient in iron ore.
In 1H FY13, larger steel players’ production grew by 6.6% YoY, while that for smaller players declined by 1% YoY. We expect 2H FY13 and FY14 to be much better in terms of steel demand growth than we witnessed in 1H FY13, when steel consumption grew by 5.5% YoY. Accordingly, we forecast steel sales volume growth for the players under our coverage to rise at a CAGR of 11.6% over FY12-14, exceeding the 8.5% CAGR we forecast for industry steel sales volume over FY12-14.
India steel companies: sales volume growth forecasts
Source: Company, Daiwa forecasts
0
100
200
300
400
500
Jan-0
6Ma
y-06
Sep-0
6Ja
n-07
May-0
7Se
p-07
Jan-0
8Ma
y-08
Sep-0
8Ja
n-09
May-0
9Se
p-09
Jan-1
0Ma
y-10
Sep-1
0Ja
n-11
May-1
1Se
p-11
Jan-1
2Ma
y-12
Sep-1
2
(USD/t)
Spot coking coal price (USD/t)
In the past year, the coking coal spot price has declined
by 33%
0
150
300
450
600
750
900
Jul-06 Jul-07 Jul-08 Jul-09 Jul-10 Jul-11 Jul-12
('000 tonnes)
Shanghai Guangzhou WuhanBeijing Shenyang Aggregate
2.2%
8.9%
12.3%
14.6%17.1%
11.2%
0%
4%
8%
12%
16%
20%
0
10
20
30
40
Jindal Steel SAIL JSW Steel Tata Steel India
Bhushan steel
Aggregate
(mt)
FY12 FY14E FY12-FY14 CAGR (RHS)

2013 Outlook for Asia 4 January 2013
- 83 -
Sector outlook for 2013
With the global downturn, the metals stocks corrected in 2H12, underperforming the SENSEX by 14%. We believe the meltdown in materials-sector stocks was driven largely by concerns over a slowdown in demand, a meltdown in steel prices in developing and developed economies, and concerns over regulatory matters in India. However, we believe the stocks are coming out of their worst phase in 1H FY13, with 2H FY13 and FY14 set to be incrementally better in terms of lower raw-material prices, a better demand outlook and stable steel prices. Further, Daiwa expects a series of interest-rate cuts throughout 2013 in India to drive economic growth and present a supportive economic environment for the steel players. In addition, the valuations of all the steel players appear attractive and help justify our positive view on the sector. However, sector headwinds in terms of regulatory issues, like the Shah Commission probe into alleged illegal mining, and implementation of the draft Mines and Minerals (Development and Regulation) (MMDR) bill, are the biggest risks to our sector stance. India steel companies: one-year-forward PBR (x)
Source: Company, Bloomberg, Daiwa forecasts
Key stock call for 2013
Tata Steel (TATA IN, INR428.35, Buy [1])
Investment thesis Tata Steel is our preferred pick in the sector. While there are concerns in the steel space about lower ASPs, subdued demand, and high raw-material costs, we believe many of these factors are likely to turn favourable in 2H FY13 and FY14. The company commissioned a 2.9mtpa steel capacity expansion in India in 1H FY13 (increasing capacity by 43%), with the impact on output set to be felt in 2H FY13 and FY14. It maintains an incremental sales volume target of 1mt for the India operation in FY13, which is expected to be realised during 2H FY13. We forecast a strong 15% CAGR in steel sales during FY12-14, driven by higher capacity utilisation as a result of its capacity expansion in 1H FY13. Further, the strong correction in coking-coal prices in July-December benefits both the company’s India division (50% external coking coal purchases) and its European division (100% external coking coal purchases). In FY12, coking-coal costs alone accounted for 26% of its India division’s total cost of production. We expect these raw-material benefits to be realised during 2H FY13 and FY14, as our outlook for coking-coal prices remains bearish. The company’s India operation is self-sufficient in iron ore, which makes it immune to the iron-ore shortages being faced by JSW Steel, and which could be faced by Bhushan Steel with the restrictions in place on merchant mining in Orissa. We therefore believe Tata Steel is in an advantageous position relative to its peers in India. Valuation Our six-month target price of INR505 is based on a SOTP valuation. We value the Indian business at an FY14E EV/EBITDA multiple of 6.5x and the European business at 3.5x. Risks to our call The risks to our call remain a further decline in steel prices and lower-than-expected sales volume at its India operation. Further, the Shah Commission is probing alleged illegal mining in the Orissa region, and any adverse outcome in terms of an outright mining ban in the region could adversely affect the company.
India Materials: valuation summary
Stock Price (LC) Mkt. cap Target Year-end PER (x) PBR (x) EV/EBITDA (x) Dividend yield (%) ROE (%)Company code 28-Dec-12 (USDm) Rating price (LC) Month FY1E FY2E FY1E FY2E FY1E FY2E FY1E FY2E FY2ETata Steel TATA IN 428.4 7,592 Buy 505 31-Mar 9.5 6.8 1.3 1.2 6.5 5.6 3.3 3.4 12.6JSW Steel JSTL IN 812.2 3,306 Buy 848 31-Mar 8.1 7.0 1.0 0.9 5.4 5.0 0.6 0.6 13.0Steel Authority of India SAIL IN 90.6 6,824 Outperform 95 31-Mar 9.1 8.5 0.9 0.8 6.9 5.7 1.9 2.0 9.7Jindal Steel & Power JSP IN 445.5 7,565 Outperform 477 31-Mar 10.0 9.1 2.4 1.9 8.7 7.9 1.1 1.1 23.3Bhushan Steel BHUS IN 473.7 1,835 Hold 465 31-Mar 9.8 8.0 1.5 1.2 9.2 7.0 0.1 0.1 16.8Source: Bloomberg, Daiwa forecasts
0
2
4
6
8
May-0
3
Apr-0
4
Mar-0
5
Feb-0
6
Jan-0
7
Dec-0
7
Nov-0
8
Oct-0
9
Sep-1
0
Aug-1
1
Jul-1
2
Tata steel JSW steel SAILJSPL Bhushans teel

2013 Outlook for Asia 4 January 2013
- 84 -
India Oil and Gas – Positive Nirmal Raghavan (91) 22 6622 1018 ([email protected])
Top-3 share-price drivers
• Under-recoveries. For public-sector companies in the India oil and gas industry, earnings and share-price performance rest largely on the trend in under-recoveries, the loss in revenue due to below-market pricing of diesel, kerosene and LPG. Trends in crude prices, exchange rates, and the retail prices of diesel, LPG and kerosene all have an impact on the gross under-recovery level, and hence are potential share-price drivers.
• Gas prices. The government’s policy stance on gas prices — chiefly in terms of whether to raise prices —has clear implications for the earnings of companies such as Reliance Industries (RIL), Oil & Natural Gas Corp (ONGC) and Oil India.
• Cash transfer scheme. The government is moving ahead with the cash transfer scheme. Successful implementation could reduce the gross under-recovery burden of the India oil and gas industry, and hence would be a positive share-price catalyst.
Sector outlook for 2013
Public-sector oil companies. We expect Brent Crude prices to remain steady at USD110/bbl in 2013-2014. The government’s move in September to raise the diesel price and cap the number of subsidised cylinders at 6 per family per year should help to reduce under-recoveries in FY14. We expect a gross under-recovery level of INR1.33tn in FY14, less than the INR1.55tn that we expect in FY13. This will, in our view, benefit the public-sector oil and gas companies. Gas sector. In the medium term, we do not see many avenues for gas volume growth for the India gas companies such as GAIL India, Petronet LNG, Gujarat State Petronet (GSPL). In response, the gas companies are likely to step up efforts to sign more long-term LNG
contracts in order to secure long-term gas volume growth.
Yearly gross under-recoveries
Source: Companies, Daiwa Estimates
We are likely to see further discussions between companies such as RIL and government policymakers on gas prices, and would like to see more discussion of RIL’s coal bed methane (CBM) gas price, as well as the price of gas from RIL’s KGD6 from FY14 onward. In our view, gas prices are likely to increase from the current level of USD4.2/mmbtu only after March 2014, although discussions are expected to happen in 2013.
Key stock call for 2013
Bharat Petroleum (BPCL IN, INR353.1, Buy [1]) Investment thesis Within the India oil and gas sector, we highlight Bharat Petroleum (BPCL), given steadily developing positive trends in sector reforms, along with what we view as the company’s attractive E&P portfolio and the stock’s appealing valuations. We expect BPCL to have a gross under-recovery of INR319.3bn for FY14, lower than the INR378.5bn we forecast for FY13. The expected decline is due largely to the positive impact of the government’s move to raise the diesel price and limit the number of subsidised LPG cylinders. Further, as has been the trend in recent years, a large part of the gross under-recovery level should be covered by the upstream discount and cash compensation paid by the government. We believe that successful implementation of the cash transfer scheme will increase investors’ confidence in the prospect of lower gross under-recoveries for oil marketing companies in general and BPCL in particular. The exploration and appraisal programme at Rovuma Basin is ongoing. We think there is a chance that the size of the hydrocarbon reserves at the Rovuma Basin
0200,000400,000600,000800,000
1,000,0001,200,0001,400,0001,600,0001,800,000
FY06 FY07 FY08 FY09 FY10 FY11 FY12 FY13E FY14E FY15E
Gross under recoveries (INRm)
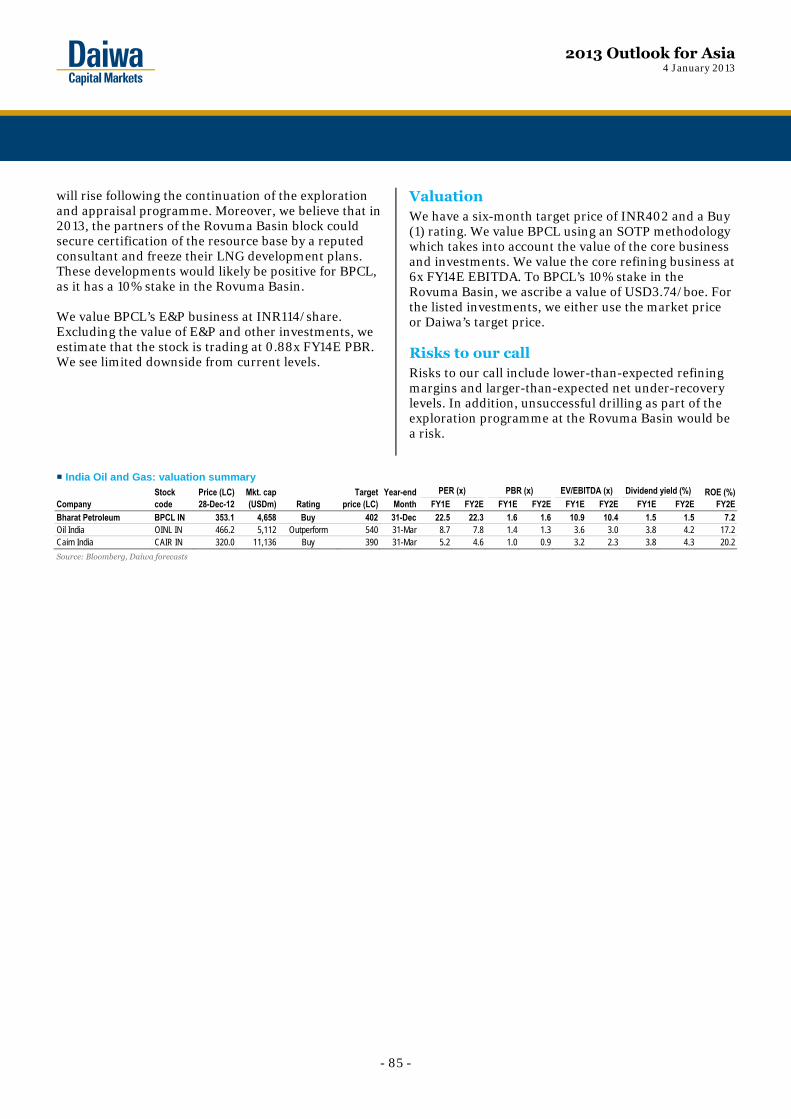
2013 Outlook for Asia 4 January 2013
- 85 -
will rise following the continuation of the exploration and appraisal programme. Moreover, we believe that in 2013, the partners of the Rovuma Basin block could secure certification of the resource base by a reputed consultant and freeze their LNG development plans. These developments would likely be positive for BPCL, as it has a 10% stake in the Rovuma Basin. We value BPCL’s E&P business at INR114/share. Excluding the value of E&P and other investments, we estimate that the stock is trading at 0.88x FY14E PBR. We see limited downside from current levels.
Valuation We have a six-month target price of INR402 and a Buy (1) rating. We value BPCL using an SOTP methodology which takes into account the value of the core business and investments. We value the core refining business at 6x FY14E EBITDA. To BPCL’s 10% stake in the Rovuma Basin, we ascribe a value of USD3.74/boe. For the listed investments, we either use the market price or Daiwa’s target price. Risks to our call Risks to our call include lower-than-expected refining margins and larger-than-expected net under-recovery levels. In addition, unsuccessful drilling as part of the exploration programme at the Rovuma Basin would be a risk.
India Oil and Gas: valuation summary
Stock Price (LC) Mkt. cap Target Year-end PER (x) PBR (x) EV/EBITDA (x) Dividend yield (%) ROE (%)Company code 28-Dec-12 (USDm) Rating price (LC) Month FY1E FY2E FY1E FY2E FY1E FY2E FY1E FY2E FY2EBharat Petroleum BPCL IN 353.1 4,658 Buy 402 31-Dec 22.5 22.3 1.6 1.6 10.9 10.4 1.5 1.5 7.2Oil India OINL IN 466.2 5,112 Outperform 540 31-Mar 8.7 7.8 1.4 1.3 3.6 3.0 3.8 4.2 17.2Cairn India CAIR IN 320.0 11,136 Buy 390 31-Mar 5.2 4.6 1.0 0.9 3.2 2.3 3.8 4.3 20.2Source: Bloomberg, Daiwa forecasts

2013 Outlook for Asia 4 January 2013
- 86 -
Korea Auto – Positive Sung Yop Chung (82) 2 787 9157 ([email protected])
Top-3 share-price drivers
• Have the Korean auto makers turned the corner? After 3.5 years of outperformance against the KOSPI and global peers, the Korea Auto Sector has been a poor sector to invest in during recent months. There has been a series of negative developments, including relatively manageable ones such as the overstatement of fuel-efficiency figures in the US, and more challenging ones such as the market’s expectation of a further appreciation of the Won against the US Dollar, and a weaker Yen against the US Dollar, which could make the Japan automakers more competitive.
Global automakers: share-price performance (to respective country index) 2008-2012YTD
Source: Bloomberg
• Forex impact could be offset by a number of factors. We believe the market is overly concerned about a significant depreciation of the US Dollar and the Yen against the Won. We have run a sensitivity analysis of HMC’s 2013 operating profit, incorporating the following underlying assumptions: 1) 14% of HMC’s 2013E revenue is US Dollar-denominated, 2) a depreciation of JPY1 against the US Dollar reduces HMC’s global shipments by 2,527 vehicles (excluding China) from our existing forecast of 3.56m units, based on our regression analysis showing that a 1% depreciation of the Yen against US Dollar over the past two years resulted in a decline in shipments of 1,264 units annually in the US market, and 3) base-case earnings forecasts
based on exchange rates of USD1:KRW1,100 and USD1:JPY80.
The result is a decline in HMC’s 2013 operating profit of 3% relative to our existing forecast. We believe the negative impact could be mostly absorbed by greater capacity utilisation, as our sensitivity analysis suggests a 1% increase in HMC’s 2013 capacity utilisation could lead to its 2013 operating profit increasing by 2.7%. Furthermore, the positive impact of cars being sold under an integrated platform should help HMC to overcome the possible changes in forex rates for 2013.
Impact of KRW/USD and JPY/USD on HMC’s 2013 operating-
profit (2013E) JPY/USD 70 75 78 80 82 85 90 1,144 7.9% 6.9% 6.2% 5.8% 5.4% 4.8% 3.8% 1,133 6.4% 5.4% 4.8% 4.4% 4.0% 3.4% 2.3% 1,122 4.9% 3.9% 3.3% 2.9% 2.5% 1.9% 0.9% 1,111 3.4% 2.4% 1.9% 1.5% 1.1% 0.5% -0.5%KRW/USD 1,100 1.9% 1.0% 0.4% 0.0% -0.4% -1.0% -1.9% 1,089 1.9% 1.0% 0.4% -1.5% -1.8% -2.4% -3.4% 1,078 -1.0% -2.0% -2.5% -2.9% -3.3% -3.9% -4.8% 1,067 -2.5% -3.4% -4.0% -4.4% -4.7% -5.3% -6.2% 1,056 -4.0% -4.9% -5.5% -5.8% -6.2% -6.7% -7.7%Source: Company, Daiwa forecasts
HMC: sensitivity analysis of plant utilisation (2013E) (vs. base case) OP change OPM changes NP change NPM changes EPS change
5.0% 13.1% 0.91%pt 8.0% 0.36%pt 39,492 4.0% 10.5% 0.73%pt 6.4% 0.29%pt 38,908 3.0% 7.9% 0.56%pt 4.8% 0.22%pt 38,323 2.0% 5.2% 0.37%pt 3.2% 0.15%pt 37,739 1.0% 2.6% 0.19%pt 1.6% 0.07%pt 37,154 0.0% 0.0% 0.00%pt 0.0% 0.00%pt 36,570 -1.0% -2.6% -0.19%pt -1.6% -0.08%pt 35,985 -2.0% -5.2% -0.39%pt -3.2% -0.15%pt 35,400 -3.0% -7.9% -0.59%pt -4.8% -0.23%pt 34,816 -4.0% -10.5% -0.79%pt -6.4% -0.31%pt 34,231 -5.0% -13.1% -1.00%pt -8.0% -0.40%pt 33,647
Source: Company, Daiwa forecasts
• Global unit shipments could continue to favour Korea automakers, especially HMC. We are optimistic about the Korea automakers’ global shipments, especially those of HMC, which intends to increase its production capacity in 2013 by more than Kia intends to. Here we highlight two factors: 1) a 10.9% YoY increase in HMC’s 2013 production capacity to 4.58m units, with most of the addition expected to be in China and Brazil (compared with our forecast for only 3% YoY growth in 2013 global auto demand to 77m units), and 2) Korea automakers’ competitive advantage in emerging markets (50% of HMC’s and Kia Motors’s combined 2011 global unit shipments went to emerging markets) and in small cars (A/B/C-segment cars accounted for 58% of HMC and Kia’s combined 2011 global unit shipments).
(300)
(100)
100
300
500
700
Jan-0
8Ap
r-08
Jul-0
8Oc
t-08
Jan-0
9Ap
r-09
Jul-0
9Oc
t-09
Jan-1
0A p
r-10
Jul-1
0Oc
t-10
Jan-1
1A p
r-11
Jul-1
1Oc
t-11
Jan-1
2A p
r-12
Jul-1
2Oc
t-12
(% )
HMC Kia Toyota HondaNissan Ford BMW

2013 Outlook for Asia 4 January 2013
- 87 -
HMC: global capacity expansion plan
Source: Company, Daiwa forecasts
Note: (P): company plan
Sector outlook for 2013
Despite market concerns about headwinds from currency movements, and a lack of new-model launches planned for 2014, we recommend taking advantage of what we view as Korea automakers’ compelling valuations ahead of upgrades we expect to the Bloomberg-consensus 2013 EPS forecasts for HMC. In our view, the following factors could result in possible upward earnings revisions for HMC: 1) 2013 global shipments, fuelled by China, the US, and Brazil, reflecting HMC’s competitive advantage in emerging markets and the impact of its recently launched volume sellers, 2) the positive impact of cars being sold under an integrated platform, and 3) the continued trend of offering low incentives, supported by HMC vehicles’ increased residual value and the company’s enhanced brand equity.
HMC: consensus EPS and PER revision cycle
Source: Bloomberg
Key stock call for 2013
Hyundai Motor Company (005380KS, KRW218,500, Buy [1]) Investment thesis We see upside to HMC’s 2013 global shipments target and its 2013 earnings outlook, as we look for a double-digit increase in its global production capacity in 2013, backed by capacity additions for emerging markets such as China and India. Moreover, we believe the negative implications of Daiwa’s forecast of a stronger Won against the US Dollar and weaker Yen against the US Dollar will be offset by a further increase in HMC’s global capacity utilisation rate. In our view, HMC has a well-balanced strategy of focusing on volume growth in emerging markets and enhancing its brand equity through higher prices in developed markets. This approach, backed by a more flexible cost structure as a result of platform integration, should drive the company’s 2013 earnings. Valuation We have a Buy (1) rating and DCF/PER-based six-month target-price of KRW310,000. We believe HMC’s share price appeals on most key parameters. The stock is trading at its past-five-year low PER and at nearly a 30% PER discount to its global peers for 2012. HMC: PER bands
Source: Fnguide, Daiwa
Risks to our call Risks include a rapid appreciation of the Won against the US Dollar or Yen.
Korea Auto: valuation summary Stock Price (LC) Mkt. cap Target Year-end PER (x) PBR (x) EV/EBITDA (x) Dividend yield (%) ROE (%)Company code 28-Dec-12 (USDm) Rating price (LC) Month FY1E FY2E FY1E FY2E FY1E FY2E FY1E FY2E FY2EHyundai Motor 005380 KS 218,500 44,958 Buy 310,000 31-Dec 6.4 6.0 1.0 0.9 6.2 5.4 0.8 0.9 19.8Hyundai Mobis 012330 KS 288,000 26,187 Hold 290,000 31-Dec 8.6 8.6 1.7 1.5 5.9 5.3 0.6 0.7 18.5Mando Corp 060980 KS 128,500 2,186 Buy 165,000 31-Dec 12.1 7.8 1.5 1.3 4.9 3.5 8.2 12.8 17.5Hyundai Wia Corp 011210 KS 173,000 4,158 Buy 215,000 31-Dec 10.4 7.8 2.4 1.9 5.7 4.5 0.3 0.4 27.9Source: Bloomberg, Daiwa forecasts
1,870 1,820 1,820 1,870 1,870
300 300 360 360 600 600 700 1,000 150 600 600 600
600
2,130
3,620 3,870 4,160
4,580
0
1,000
2,000
3,000
4,000
5,000
0
1,000
2,000
3,000
4,000
5,000
2003 2010 2011 2012P 2013E
Korea US China India Turkey Czech Russia Brazil
('000 units)03-12 CAGR: 7.7%
FY13 :11%
4
5
6
7
8
9
29,00030,00031,00032,00033,00034,00035,00036,000
Oct-1
1
Nov-1
1
Dec-1
1
Jan-1
2
Feb-1
2
Mar-1
2
Apr-1
2
May-1
2
Jun-1
2
Jul-1
2
Aug-1
2
Sep-1
2
Oct-1
2
FY12 EPS (LHS) FY12 PER (RHS)
(x )(W)
0
50,000
100,000
150,000
200,000
250,000
300,000
350,000
Jan-0
3Ju
l-03
Jan-0
4Ju
l-04
Jan-0
5Ju
l-05
Jan-0
6Ju
l-06
Jan-0
7Ju
l-07
Jan-0
8Ju
l-08
Jan-0
9Ju
l-09
Jan-1
0Ju
l-10
Jan-1
1Ju
l-11
Jan-1
2Ju
l-12
Adj. Prc. 6.0X 7.5X 9.0X 10.5X
(W)

2013 Outlook for Asia 4 January 2013
- 88 -
Korea Banks – Positive Anderson Cha (82) 2 787 9185 ([email protected])
Top-3 share-price drivers
• M&A should continue to be one of the main catalysts for the sector. We think Hana Financial Group (HFG) could try to purchase the remaining 40% stake in Korea Exchange Bank (KEB) in 2013. On top of this, we expect the other major financial holding companies in Korea to try to seek opportunities overseas, and we could witness further sector consolidation, triggered by the privatisation of Woori Financial (Woori) and the potential sale of Standard Chartered Korea (Not listed).
• Earnings momentum should pick up from 2H13, largely on the back of the low base in 2H12, bottoming-out net interest margins, and a further stabilisation in credit costs. Since the start of 2012, the Bloomberg consensus has cut its 2013 EPS forecasts for the Korea banks under our coverage by 19.0% on average. We think the market’s 2013 EPS consensus forecasts are too conservative.
• Potential deregulation of the financial sector. Following the presidential election on 19 December 2012, we believe regulatory intervention on the banking business is likely to ease. Given the tough economic environment ahead, we expect the new administration to try to boost domestic consumption by encouraging the banks to inject more credit into the system. As the banks and the local regulator will have more clarity on how to comply with Basel III, the sector’s dividend pay-out ratio is likely to improve gradually over the next few years. In addition, more accommodative policies for the domestic property market would be positive for investment sentiment, especially given that we are seeing a tightening in property-price policies in other Asian markets, such as Hong Kong and Singapore.
Sector outlook for 2013
The share prices of the Korea banks have been in retreat since April 2012, despite the continued improvement in
Korea’s sovereign solvency. Given that the Korea banks are trading currently at a 50% discount to the KOSPI in terms of PBR multiples, in line with the trough level of March 2009, we think the bank shares will catch up in line with the improvement in Korea’s sovereign solvency rating for 2013. At prevailing valuations, we think the bank shares could be more sensitive to positive catalysts than to potentially negative ones, given that investors appear to have low expectations for the sector. We also see limited share-price downside.
Korea CDS (Credit Default Swap) vs. KRX Banks Index
Source: Bloomberg, Fnguide, Daiwa
Key stock call for 2013
Hana Financial Group (086790 KS, KRW34,700, Buy [1]) Investment thesis We believe the ROA-enhancing integration of KEB into HFG will be HFG’s main share-price catalyst for 2013. We continue to believe that HFG will try to integrate KEB as a 100%-owned subsidiary in an EPS-accretive fashion (ie, a cash purchase for the remaining stake in KEB). Also, we note that HFG should be able to finance the cash purchase of some parts of the outstanding stake in KEB without issuing new shares. In the near term, HFG’s potential cash purchase of the KEB stake held by the Bank of Korea (BOK) (6.1%) would be a share-price catalyst, in our view. In the meantime, we expect its earnings momentum on a recurring basis to pick up from 2013, as we foresee an improvement in KEB’s productivity, given its enlarged loanbook and the disappearance of various types of ‘one-off’ expenses (eg, special bonuses, KEB’s additional provisioning) that were recognised throughout 2012. Lastly, operating synergies are yet to materialise, but once they do, they could lead to a prolonged rerating of the stock. In its 2Q12 results release, HFG said it could improve the group’s earnings to the tune of KRW1.16tn over the next three years, mainly through a reduction
(200)
0
200
400
600
800 0200400600800
1,0001,2001,400
Jul-0
7
Nov-0
7
Mar-0
8
Jul-0
8
Nov-0
8
Mar-0
9
Jul-0
9
Nov-0
9
Mar-1
0
Jul-1
0
Nov-1
0
Mar-1
1
Jul-1
1
Nov-1
1
Mar-1
2
Jul-1
2
Nov-1
2
KRX Banks Index Korea CDS - 5 year (RHS)
(Index ) (bps) (Inverted)

2013 Outlook for Asia 4 January 2013
- 89 -
in costs from the integration of IT systems and its credit-card network. Valuation We derive our six-month target price of KRW54,300 using the Gordon Growth Model. Risks to our call A larger-than-expected share swap, and a resulting higher-than-expected put-back option exercise by dissenting shareholders, would be the key risk to our bullish call on HFG.
HFG: changes in EPS in the case of a cash purchase of stake in KEB (2013E)
Source: Daiwa forecasts; Note: cash purchase to different shareholding levels in KEB
Korea Banks: valuation summary Stock Price (LC) Mkt. cap Target Year-end PER (x) PBR (x) Dividend yield (%) ROE (%)Company code 28-Dec-12 (USDm) Rating price (LC) Month FY1E FY2E FY1E FY2E FY1E FY2E FY2EKB Financial Group 105560 KS 37,900 13,677 Buy 50,000 31-Dec 6.7 5.6 0.6 0.5 3.0 3.6 10.1Hana Financial Group 086790 KS 34,700 7,878 Buy 54,300 31-Dec 3.6 4.9 0.5 0.5 2.2 3.1 10.3Source: Bloomberg, Daiwa forecasts
7,141
7,854 8,184
8,512 8,786
5,000
6,000
7,000
8,000
9,000
Current (60% ) 10% 20% 30% 40%
(KRW)

2013 Outlook for Asia 4 January 2013
- 90 -
Korea Casinos – Positive Thomas Y. Kwon (82) 2 787 9181 ([email protected]) Francis Kim (82) 2 787 9143 ([email protected])
Top-3 share-price drivers
• Increasing number of VIPs at foreigner-only casinos. We believe the two foreigner-only casino operators in Korea (Paradise and Grand Korea Leisure (GKL), will continue to benefit from an increasing number of VIP visitors in 2013, especially from China. We expect the number of Chinese high rollers for GKL and Paradise to increase by 20% YoY and 12% YoY, respectively, for this year, supported by the casino operators’ enhanced direct-sales networks and the growing demand for casino gaming in the region. A strong increase in Chinese VIP gamblers would improve the drop mix of foreigner-only casinos due to the Chinese VIP gamblers’ higher gaming spend per visitor than other players in the region.
GKL and Paradise: Chinese VIP visitors/gamblers
Source: Companies, Daiwa forecasts
• Capacity expansion. Over the past decade, casino gaming sales in Asia have been driven heavily by capacity expansion in the region. We believe 2013 will be a year of capacity expansion for Korea’s casinos. Kangwon Land (which operates Kangwon Land casino) plans to increase the number of casino tables by 52% and slot machines by 42% in 2Q13, as
the company received approval from the government to do so in November 2012. Paradise plans to double its casino space and increase the number of gambling facilities by 40-50% in 4Q13, after finalising the contract terms with Walkerhill Hotel by 1Q13. In our view, such expansion of casino capacity will provide a strong engine for the companies’ business growth over the long term.
Top-3 casinos in Korea: total casino tables and slot machines
Source: Kangwon Land, GKL, Paradise, Daiwa forecasts
• Fatter margins. The profitability of GKL and Paradise has been improving YoY since 2010, backed by a combination of solid growth in visitor numbers and drop, and the increasing scale of their casino operations. We believe the domestic casino operators will be able to leverage on the increased casino capacity and enhanced marketing channels in China in 2013. We forecast the operating-profit margins for all three casinos to improve this year, from 33% for 2012 to 38% for Kangwon Land, from 28% in 2012 to 30% for GKL, and for Paradise, from 22% in 2012 to 25%.
Korea casino gaming: revenue and operating-profit margin
Source: Companies, Daiwa forecasts
Note: K-GAAP basis before 2010, Paradise’s 2006-10 revenue was adjusted to reflect the revenue recognition methodology change in 2011
0
2
4
6
8
10
12
1Q09
2Q09
3Q09
4Q09
1Q10
2Q10
3Q10
4Q10
1Q11
2Q11
3Q11
4Q11
1Q12
2Q12
3Q12
4Q12
E1Q
13E
2Q13
E3Q
13E
4Q13
E
('000)
GKL Chinses VIP visitors Paradise Chinses VIP gamers
0
500
1,000
1,500
2,000
0
100
200
300
400
500
600
2006 2007 2008 2009 2010 2011 2012E 2013E 2014ENumber of table games (LHS) Number of machine games (RHS)
(20%)
0%
20%
40%
60%
0
500
1,000
1,500
2,000
2006 2007 2008 2009 2010 2011 2012E 2013E
(KRWbn)
Kangwon Land revenue (LHS) GKL revenue (LHS)Paradise revenue (LHS) Kangwon Land OPM (RHS)GKL OPM (RHS) Paradise (RHS)

2013 Outlook for Asia 4 January 2013
- 91 -
Sector outlook for 2013
We project Korea’s two foreigner-only casino operators to see solid growth in visitor traffic and spending per visitor this year, while maintaining a hold ratio of 13-14%. The two casino operators are likely to expand their direct marketing channels in China into tier 2-3 cities to attract more VIP customers. In addition, we believe the companies will continue to benefit from a growing number of mass-gaming visitors, as they see more inbound tourists to Korea. In 2013, the casino operators will continue to capitalise on their rising casino-gaming drop, driven by Chinese VIP gamblers with high gaming spend per visitor and increasing disposable income in the region. We forecast the 2013 drops for GKL and Paradise to rise by 11% YoY and 20% YoY, respectively. We also believe Kangwon Land could benefit from increased casino capacity after 2Q13, and forecast record visitor growth of 7% YoY and total drop growth of 24% YoY for 2013. Korea casino gaming: visitor traffic and drop
Source: Companies, Daiwa forecasts
Key stock call for 2013
Paradise (034230 KS, KRW17,200, Buy [1])
Investment thesis We believe the company is best positioned among the Korea casino companies we follow to benefit from the
increasing demand for casino gaming in East Asia. The casino resort plans to gear up for its capacity expansion and aggressively monetise a solid rise in visitor traffic from China and mass-gaming demand in the region. Paradise is well geared towards the China market, and we forecast it to generate over 50% of its total drop from Chinese gamblers in 2012, compared with 34% for GKL. Its drop from Chinese VIP visitors rose by 41% YoY for 1Q-3Q12 after the company expanded its sales coverage in China. We are confident that Paradise can achieve a 20% YoY rise in drop in 2013, due to the likely expansion of its casino capacity and the sales contribution from the recently merged Paradise Casino Jeju Grand. It plans to expand the casino floor of its Paradise Casino Walkerhill by 100% in terms of floorspace and the number of casino gaming tables and machine games by 40-50% this year. We expect the visibility on Paradise’s plans to expand capacity to improve in 2013. In 2012, the company established a joint venture with Sega Sammy Holdings to build a multiplex casino resort near Incheon International Airport by 2016. It also plans to move quickly to integrate the casino operations in Busan and Jeju within the Paradise group over 2013-15. In our view, such restructuring should play out well over the medium term. Valuation We have a Buy (1) rating for Paradise and six-month target price of KRW22,000, based on a PER of 16.5x on our 2013 EPS forecast. We believe the high visibility of its capacity-expansion plan and the potential business synergies from the acquisition of affiliates’ casinos justify our target PER being at a premium to those of its peers. Risks to our call The key risks to our call would be delays in the casino expansion schedule and higher-than-expected comps (complimentary items for gamers) and promotional costs.
Korea Casinos: valuation summary
Stock Price (LC) Mkt. cap Target Year-end PER (x) PBR (x) EV/EBITDA (x) Dividend yield (%) ROE (%)Company code 28-Dec-12 (USDm) Rating price (LC) Month FY1E FY2E FY1E FY2E FY1E FY2E FY1E FY2E FY2EParadise 034230 KS 17,200 1,461 Buy 22000 31-Dec 18.2 13.4 2.2 1.9 14.2 10.2 1.2 1.7 17.7Grand Korea Leisure 114090 KS 28,650 1,655 Buy 38000 31-Dec 11.6 11.0 5.2 4.2 8.1 6.1 4.5 4.5 42.1Source: Bloomberg, Daiwa forecasts
(50%)
(25%)
0%
25%
50%
01,0002,0003,0004,0005,0006,0007,0008,000
2007 2008 2009 2010 2011 2012E 2013E
(KRWbn)
Kangwon Land drop (LHS) GKL drop (LHS)Paradise drop (LHS) Kangwon Land visitor growth (RHS)GKL visitor growth (RHS) Paradise visitor growth (RHS)

2013 Outlook for Asia 4 January 2013
- 92 -
Korea Construction – Neutral Mike Oh (82) 2 787 9179 ([email protected])
Top-3 share-price drivers
• Overseas new orders trend. We expect overseas new orders to remain tough for the Korea construction companies in 2012. The strength of the Won can be expected to diminish these companies’ price competitiveness in the Middle East market.
• Deregulatory measures in the domestic property market. We believe recovery in the domestic property market will not materialise in 2013, since it will be difficult for the new administration to implement major deregulatory measures in 2013.
• Earnings visibility. We think constructors’ earnings visibility will take on greater importance in 2013, with many overseas projects due to be completed in 2013-14.
Sector outlook for 2013
We believe the Korea construction companies will face greater competition in the overseas plant-engineering market in the next few years, as the European engineering firms have become more aggressive in bidding and the Euro remains weak relative to the Won. As a result, we expect overseas new orders to grow by only 6.8% YoY in 2013. Korea Construction Sector: new order forecasts
Source: Companies, Daiwa forecasts
Korea construction companies market cap vs. USD/KRW
Source: Bloomberg, FnGuide
Given continuing uncertainty over housing policy following the December 2012 presidential election, we expect only a subdued recovery in the domestic property market in 2013. We believe the key signals for a turnaround in the domestic housing market would be rises in transaction volume and prices in metropolitan areas. We expect investors to focus on companies’ overseas gross margins, as major overseas projects due for completion in 2013-14 were secured in 2009-11 at relatively thin margins. In our view, constructors’ overseas gross margins will likely continue to decline over the next two years. But we believe the overseas margins of Samsung C&T, Hyundai E&C, and Daelim Industrial will prove relatively resilient, since these companies’ overseas backlogs are superior to those of their peers. Key companies’ overseas business: gross-profit margins
Source: Companies (Daelim, Daewoo E&C, GS E&C, Hyundai E&C, and SE)
With potential catalysts lacking, we remain Neutral on the sector. Our stock picks include Samsung C&T, Hyundai E&C, and Daelim Industrial.
39 42 42 45
35 44 47 48
0
20
40
60
80
100
2011 2012E 2013E 2014E
(KRWtn)
Domestic Overseas
7486 89 93
1060
1080
1100
1120
1140
1160
28
30
32
34
36
38
40
Jul-12 Aug-12 Sep-12 Oct-12 Nov-12
Aggregate market cap of 5 major construction companies (LHS)USD:KRW rate (RHS)
(KRWtn) (KRW)
10.3 10.511.8
10.9
7.4 7.3 7.0
0
2
4
6
8
10
12
14
2008 2009 2010 2011 2012E 2013E 2014E
(% )

2013 Outlook for Asia 4 January 2013
- 93 -
Korea Construction Sector: PBR valuations
(x) 2008 trough Past 5-year
average 2013E Target PBRDaelim 0.2 0.8 0.6 0.7Daewoo E&C 0.8 1.4 1.0 1.0GS E&C 0.8 1.5 0.6 0.6HDV 0.8 1.2 0.6 0.5Hyundai E&C 1.4 2.1 1.4 1.6Samsung C&T 0.7 1.2 0.9 1.1Samsung Engineering 1.5 4.8 3.0 2.7Average 0.9 1.9 1.1 1.2Average (excl. SE) 0.8 1.4 0.8 0.9
Source: FnGuide, Daiwa forecasts
Key stock call for 2013
Samsung C&T (000830 KS, KRW62,600, Outperform [2]) Investment thesis Samsung C&T is our top pick in the Korea construction sector, primarily owing to its stable new order growth outlook. We believe the company’s active engagement in overseas development projects will support sustainable order growth, while its strong brand power in the housing market and captive orders from affiliates should underpin stable earnings domestically. Value chain expansion should protect overseas order growth. We think highly of Samsung C&T’s efforts to expand its value chain by becoming involved in more overseas development projects. In our view, this approach will pave the way for stable YoY order growth in the coming years. Stable orders from affiliates to continue providing a good buffer for Samsung C&T. We expect new orders from Samsung Group affiliates to continue to account for at least 15-20% of the company’s total new orders in the next few years.
Potential increase in asset value from stakes in affiliates is a positive. Samsung C&T has a 4% stake in Samsung Electronics (005930 KS, KRW1,522,000, Buy[1]), as well as holdings in other Samsung affiliates. Any increases in Samsung Electronics’ share price would enhance the asset value of Samsung C&T. Valuation Our target price for Samsung C&T of KRW73,000 is based on a SOTP valuation. We apply an EV/EBITDA multiple of 5.8x, which we believe reflects the recent contraction in the sector’s average multiple. Our target price is equivalent to a 2013E PBR multiple of 1.1x, in line with the stock’s three-year average PBR. The stock has a five-year average PBR of 1.1x, and we expect the share price to get close to its mid-cycle PBR in the coming months. Samsung C&T: one-year forward PBR bands
Source: FnGuide, Daiwa forecasts
Risks to our call Risks to our call on Samsung C&T include delays in planned development projects and a decrease in orders from Samsung Group affiliates.
Korea Construction: valuation summary
Stock Price (LC) Mkt. cap Target Year-end PER (x) PBR (x) EV/EBITDA (x) Dividend yield (%) ROE (%)Company code 28-Dec-12 (USDm) Rating price (LC) Month FY1E FY2E FY1E FY2E FY1E FY2E FY1E FY2E FY2EHyundai Engineering & Construction
000720 KS 70,000 7,288 Outperform 78,000 31-Dec 13.2 9.4 1.7 1.4 9.5 6.3 1.0 1.1 16.4
Samsung C&T 000830 KS 62,600 9,406 Outperform 73,000 31-Dec 20.1 14.6 1.0 0.9 15.0 12.9 0.8 0.8 6.9Samsung Engineering 028050 KS 165,500 6,184 Hold 144,000 31-Dec 12.1 11.7 3.7 3.0 8.2 8.6 2.1 2.2 28.0Daewoo Engineering & Construction
047040 KS 9,950 3,863 Hold 9,000 31-Dec 20.1 12.1 1.2 1.1 13.5 9.6 0.0 0.0 9.3
GS Engineering & Construction
006360 KS 57,300 2,730 Underperform 55,000 31-Dec 10.9 9.4 0.8 0.7 13.8 12.0 1.7 1.9 8.1
Hyundai Development 012630 KS 21,650 1,524 Underperform 17,000 31-Dec 14.2 11.9 0.6 0.6 16.3 15.3 3.2 3.7 5.2Source: Bloomberg, Daiwa forecasts
020,00040,00060,00080,000
100,000120,000140,000160,000180,000200,000
2002
2003
2004
2005
2006
2007
2008
2009
2010
2011
2012
(KRW)
2.7x
2.1x
1.6x
1.0x
0.4x

2013 Outlook for Asia 4 January 2013
- 94 -
Korea Consumer – Positive Sang Hee Park (82) 2 787 9165 ([email protected])
Top-3 share-price drivers
• Consumer sentiment and Economic Composite Index. The Consumer Sentiment Index and the Leading Economic Composite Index are two indicators that we follow closely to predict consumer spending habits. The November consumer sentiment index recovered slightly after reaching a low in October. However, the Leading Economic Composite Index has continued to weaken and the Korea Government now expects an L-shaped recovery from 4Q12. Although consumer spending likely bottomed out in October, the market’s lack of conviction about a turnaround in the EU is likely to hinder consumption growth over the near term.
• Wider margins as companies lift product prices. The government has been keen to control the rate of inflation; therefore, raising consumer prices was fairly difficult until the start of 1H12. However, in 2H12, more companies raised product prices as the inflation rate fell to less than 3% YoY (1.6% YoY currently). We believe the consumer-product companies that did not raise prices in 2012 are likely to do so in 2013, and on the back of this, margins should also improve.
• The China factor. Consumer companies exposed to China should continue to see strong earnings. Under the leadership of Xi Jinping, the country’s economic policy appears to have shifted to stimulating domestic consumption and away from investment and export-dependent economic growth. As such, we believe the Korea consumer companies with a good presence in China, and strong brand value, should continue to see double-digit YoY sales growth from there.
Sector outlook for 2013
Given the weak global economy and uncertainties about Korea’s export-driven growth, we believe the government will focus on boosting private consumption to sustain GDP growth. In 2013, we suggest investors focus on: 1) consumer-product companies that can increase sales on the back of rises in product prices, and 2) consumer cyclical companies, such as the department stores (ie, selected department stores, such as Hyundai Department Store) that could see earnings growth on the back of store expansion, and 3) those that remain relatively regulatory risk-free. Korea retail sales growth vs. Leading Economic Composite
Index
Source: Statistics Korea, Bank of Korea
Key stock call for 2013
Amorepacific (090430 KS, KRW1,214,000, Outperform [2]) Investment thesis Amorepacific is a safe-haven stock in times of market uncertainty, in our view. The Korean cosmetics industry is defensive in nature as cosmetics are considered a basic necessity by consumers. The polarisation in consumer spending that we are seeing benefits the sales growth of high-end brands, and for Amorepacific high-end brands should have accounted for 62% of the company’s total cosmetics sales in 2012E. The high-end channels (department stores and door-to-door sales) account for a greater percentage of the company’s earnings as the operating-profit margins in these channels are higher than the company’s average operating-profit margin across all of its products. The China division should account for the highest sales growth for 2012-14E, as we forecast sales to rise by 25-30% a year on the back of its expanded distribution coverage, geographical expansion and new brand
(10)(5)0510152025
(4)(3)(2)(1)
012345
Mar-9
9
Mar-0
0
Mar-0
1
Mar-0
2
Mar-0
3
Mar-0
4
Mar-0
5
Mar-0
6
Mar-0
7
Mar-0
8
Mar-0
9
Mar-1
0
Mar-1
1
Mar-1
2
(pp)
YoY change leading composite index (LHS) Retail sales growth YoY (RHS)
(% )
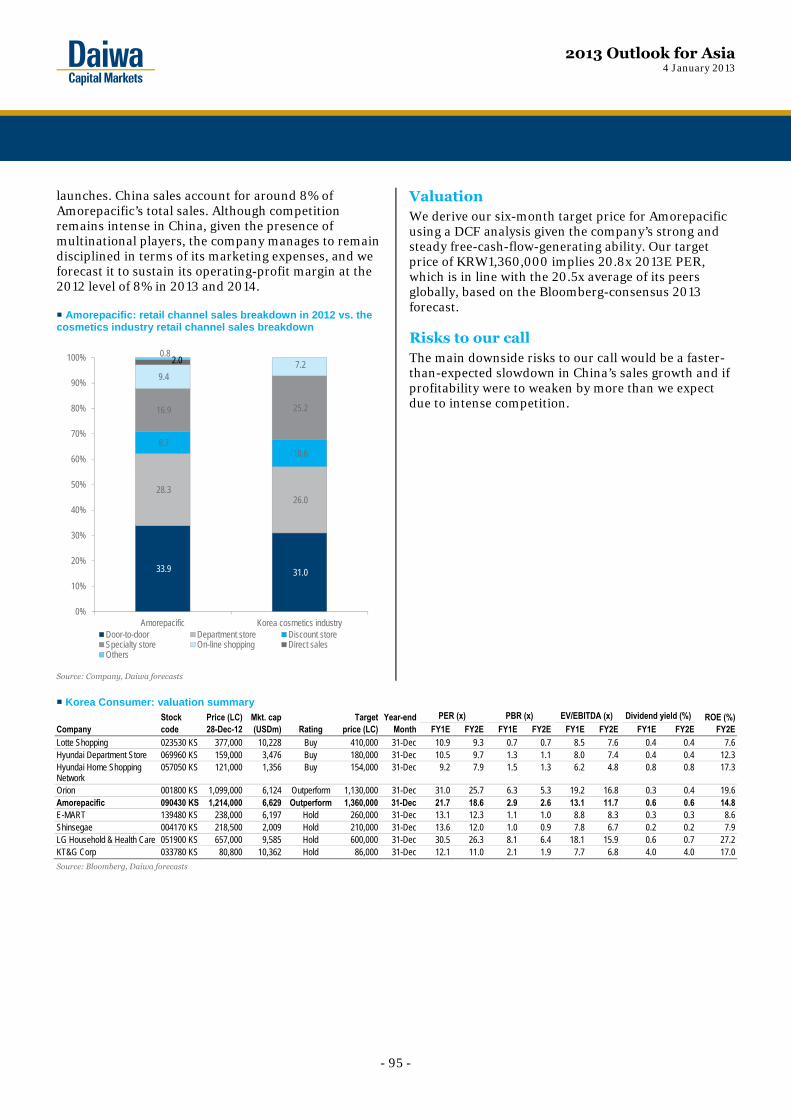
2013 Outlook for Asia 4 January 2013
- 95 -
launches. China sales account for around 8% of Amorepacific’s total sales. Although competition remains intense in China, given the presence of multinational players, the company manages to remain disciplined in terms of its marketing expenses, and we forecast it to sustain its operating-profit margin at the 2012 level of 8% in 2013 and 2014. Amorepacific: retail channel sales breakdown in 2012 vs. the
cosmetics industry retail channel sales breakdown
Source: Company, Daiwa forecasts
Valuation We derive our six-month target price for Amorepacific using a DCF analysis given the company’s strong and steady free-cash-flow-generating ability. Our target price of KRW1,360,000 implies 20.8x 2013E PER, which is in line with the 20.5x average of its peers globally, based on the Bloomberg-consensus 2013 forecast. Risks to our call The main downside risks to our call would be a faster-than-expected slowdown in China’s sales growth and if profitability were to weaken by more than we expect due to intense competition.
Korea Consumer: valuation summary
Stock Price (LC) Mkt. cap Target Year-end PER (x) PBR (x) EV/EBITDA (x) Dividend yield (%) ROE (%)Company code 28-Dec-12 (USDm) Rating price (LC) Month FY1E FY2E FY1E FY2E FY1E FY2E FY1E FY2E FY2ELotte Shopping 023530 KS 377,000 10,228 Buy 410,000 31-Dec 10.9 9.3 0.7 0.7 8.5 7.6 0.4 0.4 7.6Hyundai Department Store 069960 KS 159,000 3,476 Buy 180,000 31-Dec 10.5 9.7 1.3 1.1 8.0 7.4 0.4 0.4 12.3Hyundai Home Shopping Network
057050 KS 121,000 1,356 Buy 154,000 31-Dec 9.2 7.9 1.5 1.3 6.2 4.8 0.8 0.8 17.3
Orion 001800 KS 1,099,000 6,124 Outperform 1,130,000 31-Dec 31.0 25.7 6.3 5.3 19.2 16.8 0.3 0.4 19.6Amorepacific 090430 KS 1,214,000 6,629 Outperform 1,360,000 31-Dec 21.7 18.6 2.9 2.6 13.1 11.7 0.6 0.6 14.8E-MART 139480 KS 238,000 6,197 Hold 260,000 31-Dec 13.1 12.3 1.1 1.0 8.8 8.3 0.3 0.3 8.6Shinsegae 004170 KS 218,500 2,009 Hold 210,000 31-Dec 13.6 12.0 1.0 0.9 7.8 6.7 0.2 0.2 7.9LG Household & Health Care 051900 KS 657,000 9,585 Hold 600,000 31-Dec 30.5 26.3 8.1 6.4 18.1 15.9 0.6 0.7 27.2KT&G Corp 033780 KS 80,800 10,362 Hold 86,000 31-Dec 12.1 11.0 2.1 1.9 7.7 6.8 4.0 4.0 17.0Source: Bloomberg, Daiwa forecasts
33.9 31.0
28.3 26.0
8.7 10.6
16.9 25.2
9.4 7.2 2.0
0.8
0%
10%
20%
30%
40%
50%
60%
70%
80%
90%
100%
Amorepacific Korea cosmetics industryDoor-to-door Department store Discount storeSpecialty store On-line shopping Direct salesOthers

2013 Outlook for Asia 4 January 2013
- 96 -
Korea Internet and Online Games – Positive Thomas Y. Kwon (82) 2 787 9181 ([email protected]) Francis Kim (82) 2 787 9143 ([email protected])
Top-3 share-price drivers
• Mobile traffic monetisation. Mobile-ad products and mobile-game content are likely to become the main revenue-growth drivers for the online-service companies in 2013. We forecast the mobile unique visitors (UVs) and page views (PVs) of NHN and Daum Communications (Daum) to be equivalent to 70-80% of the desktop UVs and PVs in 2013.
Mobile PVs compared with desktop PVs
Source: Companies, Daiwa
• The mobile advertising opportunity. We see mobile display-ad sales rising strongly in value terms, driven by location-based features and targeted advertisements. Mobile-search ad revenue should continue to increase steadily due to solid mobile-commerce transactions. We forecast Korea’s mobile-ad sales to expand by 73% YoY and account for 15% of the total online-ad market in 2013.
Korea: the mobile-advertising opportunity
Source: Cheil Worldwide, Daiwa
• Growing popularity of mobile instant-messaging solution (MIM). The leading MIM operators are likely to accelerate the diversification of their revenue models with digital-item commerce, game content, and possibly advertising products. Meanwhile, we think these sites will need further investment to evolve into platforms, and are likely to face competition from a number of different players. Therefore, while we see MIM as a share-price driver, there might be a longer-than-expected gestation period before revenue from advertising on the MIM platform becomes meaningful.
Korea: top free MIM applications (number of users)
Source: Companies, Daiwa
Sector outlook for 2013
In our view, ad-dollar spending will stall in 2013 due to macro concerns. Weak domestic consumption could dampen ad spending in Korea, especially for paid searches by SME advertisers. As online shoppers continue to reduce their budgets for e-commerce transactions, the search-engine companies are likely to see weak growth in price-per-click (PPC) in 2013. We forecast Korea’s online-ad revenue to increase by just 14% YoY to KRW2.4tn for 2013 (22% of the total advertising market), from a 21% YoY increase for 2012E.
0%
10%
20%
30%
40%
50%
60%
70%
80%
1Q10 2Q10 3Q10 4Q10 1Q11 2Q11 3Q11 4Q11 1Q12 2Q12 3Q12
NHN Daum
0%
1%
2%
3%
4%
5%
0
100
200
300
400
500
600
2010 2011 2012E 2013E 2014E
(KRWbn)
Mobile ad market (LHS) % of total ad market (RHS)
0102030405060708090
Jan-1
1Fe
b-11
Mar-1
1Ap
r-11
May-1
1Ju
n-11
Jul-1
1Au
g-11
Sep-1
1Oc
t-11
Nov-1
1De
c-11
Jan-1
2Fe
b-12
Mar-1
2Ap
r-12
May-1
2Ju
n-12
Jul-1
2Au
g-12
Sep-1
2Oc
t-12
Nov-1
2
(m)
Kakao Talk LINE

2013 Outlook for Asia 4 January 2013
- 97 -
We believe the current competitive environment in the paid-search segment will remain unchanged this year, while ad platforms are moving towards mobile rapidly and advertiser networks are likely to be shaken up as a result of the shutdown in January 2013 of Overture Korea (Not listed). Despite rising competition in the mobile games and free casual games space, we forecast Korea’s online-game market to expand by 13% YoY to KRW8.3tn for 2013, still 10 times bigger than the mobile-game market (at KRW0.8tn) for 2013E. Korea: advertising market outlook by ad format
Source: Cheil Worldwide, Daiwa forecasts
Key stock call for 2013
Daum Communications (035720 KS, KRW91,100, Buy [1]) Investment thesis Daum is our top pick in the Korea Internet and Online Games Sector, as we expect the company to start to leverage on its solid media power and its new ad products for diverse platforms, ranging from desktop to offline media. Potential near-term catalysts include a robust rise in PPC, the ongoing addition of advertisers
to the company’s ad network for both desktop and mobile devices, and an increasing revenue contribution from the mobile-game portal service. At the analyst briefing for its 3Q12 results, Daum indicated that its PPC may have reached the level of Overture Korea in November 2012, and is likely to narrow the PPC gap with NHN rapidly as it benefits from migrating advertisers from the previous partner’s (Overture) ad network and replacing the tier-1 and tier-2 ad areas with its own ad products. We expect the company’s revenue to rise substantially and start to see strong operating leverage from 2Q13 due to the rollout of competitive ad-products on all advertising platforms. We forecast the company’s paid-search sales to increase by 20% YoY for 2013 due to a rise in PPC and solid demand for convergence ad-products. The company should be able to control the overall costs associated with building its own platform for cost-per-click (CPC) advertising, which would help boost the operating profit in 2013. Valuation We have a Buy (1) rating for Daum and six-month target price of KRW120,000, based on a DCF/peer comparison. We apply a target PER of 13x and a target EV/EBITDA multiple of 8x on our 2013 earnings forecast, given what we see as the company’s strong potential to reignite its growth momentum in online-ad sales and monetise its huge mobile traffic. Risks to our call The main risks to our call include a slower-than-expected recovery in PPC, and a ramp-up in operating costs for mobile services and its own CPC advertising services.
Korea Internet and Online Games: valuation summary Stock Price (LC) Mkt. cap Target Year-end PER (x) PBR (x) EV/EBITDA (x) Dividend yield (%) ROE (%)Company code 28-Dec-12 (USDm) Rating price (LC) Month FY1E FY2E FY1E FY2E FY1E FY2E FY1E FY2E FY2EGamevil Inc 063080 KS 100,800 522 Buy 147,000 31-Dec 24.4 16.4 6.1 4.4 17.2 10.8 0.0 0.0 31.5Daum Communications 035720 KS 91,100 1,149 Buy 120,000 31-Dec 14.1 10.5 2.3 2.0 6.8 4.9 1.8 1.8 20.4NCsoft 036570 KS 150,500 3,078 Buy 300,000 31-Dec 21.9 10.2 3.3 2.5 12.0 5.0 0.4 0.4 28.0Neowiz Games 095660 KS 25,000 512 Hold 25,000 31-Dec 5.9 6.3 1.6 1.3 3.6 3.3 0.0 0.0 22.5Source: Bloomberg, Daiwa forecasts
0
2
4
6
8
10
12
2000
2001
2002
2003
2004
2005
2006
2007
2008
2009
2010
2011
2012
E
2013
E
2014
E
(KRWtn)
Newspaper TV Radio Magazine Others Online

2013 Outlook for Asia 4 January 2013
- 98 -
Korea Machinery – Positive Mike Oh (82) 2 787 9179 ([email protected])
Top-3 share-price drivers
• China excavator demand. We highlight excavator demand from China as a key share-price driver for Doosan Infracore (DI).
• Global power-equipment demand. Given that Doosan Heavy Industries (DHI) is looking to overseas orders to boost its operating profit, power-equipment demand should be a key share-price driver for the company. Order trends in the Middle East, Vietnam, and India should be key to it achieving its annual order target.
• US machine-tool demand. Against the backdrop of weak machine-tool demand in Europe, we believe resilient machine tool demand in the US will be central to an export recovery for Korea makers.
Sector outlook for 2013
As we believe DI’s excavator sales in China are unlikely to recover substantially in 2013, we expect a recovery in the company’s business there to take time to come through. We think DI’s share of the China excavator market is likely to decline in 2013, as local players are more price competitive in that market. DI and competitors: market shares in China (%)
Manufacturer 2006 2007 2008 2009 2010 20112012
(Oct.)Komatsu 15.7% 15.5% 15.6% 15.8% 14. % 11.3% 8.1%Sany .0% 2.6% 3.7% 6.6% 8.5% 11.6% 13.9%Hyundai 7.0% 15 7% 11.6% 10.8% 11.3% 9.7% 7.5%DI 18.0% 8.2% 16.7% 15.6% 13.4% 9.4% 8.2%Hitachi 13.1% 14.7% 14.3% 12.1% 10.8% 8.6% 7.2%Kobelco 6.9% 7.0% 7.2% 8.2% 9.1% 7.3% 7.0%CAT 7.8% 7.4% 7.2% 6.5% 6.3% 6.3% 6.6%Overseas makers 82.8% 83.4% 77.9% 74.7% 72.0% 57.8% 50.6%China makers 17.2% 16.6% 22.1% 25.3% 28.0% 42.2% 49.4% Total units sold 41,083 60,438 72,434 93,323 162,908 178,345 101,821Source: CMBOL, Daiwa
Note: 2012 figures Jan-Oct cumulative
Some investors would see any improvement in the US construction market as positive for DI, given that the company has a construction machinery subsidiary in the country. However, in our view, a demand recovery in the US construction machinery market would not in itself be sufficient to turn around the company’s operating profit this year. We still expect the operating profit contribution from China to be much bigger than that of the US operation. Still, with the likely resumption of nuclear orders domestically, we believe the outlook for the power-equipment business across the sector is brighter than in 2012. We expect the Korea Government’s forthcoming announcement of the 6th Electricity Plan to be a positive catalyst for power-equipment makers. Considering Korea’s persistent power shortage, we think the new electricity plan is likely to feature aggressive capacity expansion plans, mostly involving coal- and gas-fired power plants. Such a development would likely herald good order flows for the Korean power equipment makers, including DHI. We maintain that nuclear-power equipment will be in steady demand in Korea for the next 1o years, as the country is unlikely to find alternative sources to meet the strong domestic electricity demand growth likely over the next decade. DHI: new orders
Source: Company, Daiwa forecasts
0
2,000
4,000
6,000
8,000
10,000
12,000
14,000
2007 2008 2009 2010 2011 2012E 2013E
(KRWbn)

2013 Outlook for Asia 4 January 2013
- 99 -
Key stock call for 2013
Doosan Corp (000150 KS, KRW129,000, Buy [1]) Investment thesis Doosan Corp is our top pick in the Korea Machinery Sector, as the operating profit from its core business is relatively resilient. Moreover, as a holding company, its asset value is appealing. Core business has room to expand. Doosan Corp completed its capacity expansion in the China market in 2011. We believe operating profit at the company’s electro-material business will be resilient, backed by increasing shipments of smartphone components. Asset value. Doosan Corp is a holding company of Doosan Group. Hence, a gradual turnaround in the business performance of its subsidiaries would be reflected in Doosan Corp’s asset value. Dividend yield. We forecast the company to pay a DPS of KRW4,000 in 2013, equivalent to a 3.1% dividend yield. This company has consistently sought to improve shareholder value in recent years, and we believe its favourable shareholder policy will be maintained this year.
Valuation Our six-month target price for Doosan Corp of KRW150,000 is based on an SOTP valuation, in which we assign a 2013E EV/EBITDA multiple of 6.5x, based on the average of Daiwa’s Korea coverage, for the company’s core businesses. Doosan Heavy accounts for 55% of the company’s total adjusted NAV. We expect the EBITDA of the core business and the market cap of DHI to be the key factors in Doosan Corp’s share-price performance. Our target price is equivalent to a 2013E PBR multiple of 1.5x. Doosan Corp: SOTP valuation
(KRWbn) Discount NAV NAV per share (KRW)(A) Operating value 1,411 54,015 (B) Non-operating value 2,783 106,564 - Investment securities 30% discount 2,173 83,214 - Treasury shares 40% discount 305 11,683 - Real estate asset 30% discount 305 11,666 (C) Brand value 388 14,850 (D) Net debt 683 26,169 (E) Adj. NAV (E=A+B+C-D) 3,898 149,000 (F) Target price (KRW/share) 150,000 Source: Daiwa forecasts
Risks to our call The main risk to our call includes a slower-than-expected recovery in Doosan Corp’s subsidiaries’ operating profit in 2013.
Korea Machinery: valuation summary
Stock Price (LC) Mkt. cap Target Year-end PER (x) PBR (x) EV/EBITDA (x) Dividend yield (%) ROE (%)Company code 28-Dec-12 (USDm) Rating price (LC) Month FY1E FY2E FY1E FY2E FY1E FY2E FY1E FY2E FY2EDoosan Corp 000150 KS 129,000 3,147 Buy 150,000 31-Dec 11.0 8.1 0.6 0.6 10.1 7.0 2.7 3.1 11.3Doosan Heavy Industries and Construction 034020 KS 45,200 4,468 Outperform 62,000 31-Dec 11.1 7.7 0.8 0.7 11.4 8.3 1.7 1.7 11.6Source: Bloomberg, Daiwa forecasts

2013 Outlook for Asia 4 January 2013
- 100 -
Korea Shipbuilding – Positive Sung Yop Chung (82) 2 787 9157 ([email protected])
Top-3 share-price drivers
• Cyclical downturn for the global shipbuilding industry should continue in 2013. Bolstered by: 1) continued weakness in the freight indices for commercial vessels (bulk carriers and containerships), 2) a lack of ship financing, and 3) looming overcapacity from a strong increase in global new shipbuilding orders from 2006-08. As such, we expect global shipbuilding orders to remain weak this year and do not believe there will be a rebound in Clarkson’s new shipbuilding price index over the next year.
Korea Shipbuilding Sector: annual new orders by ship type
Source: Clarkson, Daiwa forecasts
• But we expect global shipbuilding orders for LNGCs and offshore platforms/vessels to remain solid in 2013. Amid the ongoing sector downturn, we expect shipbuilding orders for LNGCs, and offshore platforms/vessels to continue to lead the momentum for new shipbuilding orders globally this year. For LNGCs, chartering spot rates have increased continuously over the past 3-4 years, with many countries focusing more on alternative energy sources. We expect US companies to export shale gas to Asia, providing a catalyst for more LNGC orders in 2013. For drill-ships, despite our forecast of demand for deep-water rigs declining YoY after two years of exceptionally strong growth, we note
that deep-water drill-rig prices are still solid and that capacity utilisation rates remain high. We continue to expect the oil majors’ increasing exploration and production (E&P) capex to support drill-ship orders over the next few years.
LNGC: global new shipbuilding orders (number of ships)
Source: Clarkson, Daiwa forecasts
Global deep-water rig orders (number of vessels)
Source: RS Platou, SHI, Daiwa forecasts
• We expect the Korean Big-3 to continue to dominate in 2013. As mentioned above, of all the vessel segments, we expect orders for only LNGCs and drill-ships to remain solid for 2013. Given the strong track records of the Korean Big-3, their market presence, and the high technological entry barriers for LNGCs and drill-ships, we expect the Big-3 to continue to dominate this space next year.
LNGC: order book by shipyards (as at 30 November 2012)
Source: Clarkson, Daiwa
0
20
40
60
80
100
1996
1997
1998
1999
2000
2001
2002
2003
2004
2005
2006
2007
2008
2009
2010
2011
2012
E
2013
E
(CGTm)
Tankers Bulkers Containers LNG Offshores Others
7 101 5
20 21 2015
70
48
36
25
50
6
50
28 27
01020304050607080
1996
1997
1998
1999
2000
2001
2002
2003
2004
2005
2006
2007
2008
2009
2010
2011
2012
E
2013
E
(# of ships)
0
5
10
15
20
25
30
35
2005 2006 2007 2008 2009 2010 2011 2012 YTD
2013E
Drillship Semi
Samsung H.I.48.8%
Hyundai H.I.11.8%
Daewoo10.8%
Other Korean12.2%
Others16.3%

2013 Outlook for Asia 4 January 2013
- 101 -
Drill-ships: order book by shipyard (as at 30 November 2012)
Source: Clarkson, Daiwa
Sector outlook for 2013
Stock selection will be critical when it comes to the Korean shipyards in 2013. We expect the Korea shipyards to fare better than shipyards elsewhere, due to their strong competitive advantages in deep-water drill-rigs, even compared with the Singaporean jack-up companies, and also as we view the Korea players’ valuations as compelling compared with their global peers. Nevertheless, we recommend investors be more selective in their picks for the sector in 2013, given that the order intakes, earnings visibility and profit margins of the Korea shipbuilders are likely to vary. Samsung Heavy Industries (SHI): consensus EPS and PER
forecast revisions
Source: Bloomberg
Key stock call for 2013
Samsung Heavy Industries (010140 KS, KRW38,550, BUY [1]) Investment thesis Samsung Heavy Industries (SHI) was the only stock among the Korea shipyards to see a meaningful earnings rebound in 2012. We expect this trend to continue this year, due to a combination of: 1) stronger earnings visibility and financials compared with its peers, backed by an expected increase in the delivery of high-margin LNGCs and drill-ships in 2013 , and 2) its market leading position in manufacturing LNGCs and drill-ships. Also, we are particularly positive on the company having the highest exposure to LNGCs, offshore platforms, and deep-water rigs in its order book, given that these vessels not only have high profit margins, but are less susceptible to order cancellations/delays during a cyclical downturn.
SHI: order book breakdown (as at end-October 2012)
Source: Company, Daiwa forecasts
Valuation We have a Buy (1) rating and DCF/PER-based six-month target price of KRW45,000. We believe SHI’s valuation looks appealing, trading at its past-five-year mid-cycle PBR trough of 1.4x, based on our 2013 BVPS forecast. Risks to our call The risks to our call would be a prolonged economic downturn and oil prices falling below USD70/bbl.
Korea Shipbuilding: valuation summary
Stock Price (LC) Mkt. cap Target Year-end PER (x) PBR (x) EV/EBITDA (x) Dividend yield (%) ROE (%)Company code 28-Dec-12 (USDm) Rating price (LC) Month FY1E FY2E FY1E FY2E FY1E FY2E FY1E FY2E FY2ESamsung Heavy Industries 010140 KS 38,550 8,314 Buy 45,000 31-Dec 9.7 9.1 1.6 1.4 4.5 4.1 1.3 1.3 16.4Hyundai Heavy Industries 009540 KS 242,000 17,180 Hold 240,000 31-Dec 10.5 9.9 0.9 0.9 5.9 5.9 2.1 2.1 9.2Source: Bloomberg, Daiwa forecasts
SHI47.6%
HHI12.9%
DSME13.7%
Other Korean1.1%
Others24.8%
0
5
10
15
20
2,500
3,000
3,500
4,000
4,500
Oct-1
1
Nov-1
1
Dec-1
1
Jan-1
2
Feb-1
2
Mar-1
2
Apr-1
2
May-1
2
Jun-1
2
Jul-1
2
Aug-1
2
Sep-1
2
Oct-1
2
SHI FY12 EPS (LHS) SHI FY12 PER (RHS)
(KRW) (x )
Containerships14.0%
Tankers6.0%
Production Facility32.0%
LNGCs15.0%
Drillships32.0%
Others1.0%
Or der book of USD37.9 bn

2013 Outlook for Asia 4 January 2013
- 102 -
Korea IT Hardware – Positive Jae H. Lee (82) 2 787 9173 ([email protected])
Top-3 share-price drivers
• SEC and component suppliers still well-placed. Benefiting from a sharp increase in demand for smart devices as well as from market-share gains, SEC and its core component suppliers are on track for record earnings in 2012-13. We expect their share prices to remain strong in 2013.
Share-price performances of Korea tech subsectors
2010 2011 2012 YTDLarge-cap electronics 13.7 1.5 28.3Diversified components 22.9 (40.0) 25.5Touch screen 48.6 (3.0) 26.3LED (10.0) (42.6) 10.6Equipment 64.3 9.8 (38.8)PCB 66.9 27.3 45.9Backend 38.8 37.7 (24.8)Passive components 37.3 22.9 41.2Materials 15.9 20.0 (31.3)Source: FnData
• Bright fundamentals for first-tier memory players. We are positive on the outlook for the memory-chip market in 2013 as industry players are becoming less aggressive in their investing. In addition, as many of the second-tier DRAM makers are phasing out commodity DRAM production, the DRAM fundamentals are looking bright for first-tiers.
Memory-chip and LCD operating profit
Source: Companies, Daiwa forecasts
Note: memory-chip operating profit for SEC and Hynix and LCD operating profit for SEC and LGD
• Round two for OLED TV and flexible displays. Although organic light-emitting diode (OLED) TV and flexible displays were considered the most prominent new products in 2012, they did not take off since key manufacturers suffered from production yield issues. However, as critical processes have been addressed, we believe these two products may resurface as key products in 2013.
Sector outlook for 2013
There is no doubt that the PC and TV markets globally have matured, with low annual shipment growth and a declining market value. However, we forecast global smartphone shipment volume to continue to see robust growth, expanding by 30% YoY to 876m units for 2013 from 42% YoY to 673m units for 2012. Shipment growth for TVs, PCs, and smartphones
Source: Daiwa forecasts
As SEC aims to ship over 300m smartphones in 2013, from 215m in 2012, and more than double its tablet shipments in 2013 from about 15m for 2012, we believe its supply chain will benefit as well. Meanwhile, we forecast LG Electronics’s smartphone shipments to rise to 40m units for 2013 from 26m units for 2012.
SEC and LG Electronics: smartphone shipments
Source: Companies, Daiwa forecasts
-1.5-1.0-0.50.00.51.01.52.02.5
1Q11 3Q11 1Q12 3Q12 1Q13E 3Q13E
Memory LCD
(KRWtn)
0
200
400
600
800
1,000
2009 2010 2011 2012E 2013ETV PC Smartphones
(m units)
0102030405060708090
1Q10 3Q10 1Q11 3Q11 1Q12 3Q12 1Q13E 3Q13E
SEC LGE
(m units)

2013 Outlook for Asia 4 January 2013
- 103 -
Key stock call for 2013
Samsung Electronics (005930 KS, KRW1,522,000, Buy [1]) Investment thesis SEC’s telecoms division has continued to surprise the market with record smartphone shipments and earnings over the past few quarters. Despite investor concerns about potential erosion of the operating-profit margin due to rising marketing expenses, the company has maintained a high level of profitability, with costs well under control. As we expect its flagship products, such as the Galaxy S and Note-series smartphones, to be refreshed again this year, we believe the company will see robust earnings growth for 2013. As we forecast the IT and mobile communications division to account for about 65% of total 2012 operating profit, SEC’s efforts to expand into low-to mid-range smartphones could depress profitability. However, we do not expect any substantial erosion in the average selling prices of handsets as the company’s feature-phone sales are being replaced by rising smartphone sales volume. SEC: quarterly feature phone and smartphone shipments
Source: Company, Daiwa forecasts
Meanwhile, the semiconductor division was affected by weak chip prices throughout 2012 due to soft demand for IT and consumer products, despite production cuts by some memory-chip companies. However, NAND-flash prices recovered from early September while DRAM prices stabilised from early-November, due mainly to adjustments on the supply side. As memory-chip fundamentals have been weak, with low-earnings and marginal cash flow, we believe there is further downside to the industry’s capital investments in 2013, boding well for supply-demand dynamics. Although SEC is on track to post record earnings for 2012, as its cyclical businesses are only beginning to improve, we believe there is scope for further growth in 2013. For this year, we forecast the company’s revenue to rise by 10.2% YoY and operating profit to increase by 12.4% YoY to KRW32.0tn.
SEC: annual operating-profit forecasts by division
Source: Company, Daiwa forecasts
Valuation We have a Buy (1) rating on the stock and an SOTP-derived six-month target price of KRW1.8m. Risks to our call The risks our target price and rating include the core demand drivers, such as sales of PCs, mobile handsets, and flat-panel TV, weakening more than we expect, as well as macroeconomic issues.
Korea IT Hardware: valuation summary
Stock Price (LC) Mkt. cap Target Year-end PER (x) PBR (x) EV/EBITDA (x) Dividend yield (%) ROE (%)Company code 28-Dec-12 (USDm) Rating price (LC) Month FY1E FY2E FY1E FY2E FY1E FY2E FY1E FY2E FY2ESamsung Electronics 005930 KS 1,522,000 209,410 Buy 1,800,000 31-Dec 9.7 8.6 1.9 1.6 5.1 4.4 0.6 0.7% 19.9%SK Hynix 000660 KS 25,750 16,695 Buy 28,000 31-Dec nm 13.9 1.8 1.6 6.5 4.1 0.0 0.4 12.8LG Electronics 066570 KS 73,600 11,250 Hold 70,000 31-Dec 17.2 10.5 0.9 0.8 7.1 6.4 0.4 0.6 8.2LG Display 034220 KS 31,050 10,378 Hold 30,000 31-Dec 54.9 12.3 1.1 1.0 2.7 2.1 0.0 1.0 8.5Samsung SDI 006400 KS 151,000 6,426 Outperform 170,000 31-Dec 4.4 12.2 0.9 0.8 3.4 10.1 1.0 1.2 7.0SFA Engineering 056190 KS 47,200 792 Buy 57,000 31-Dec 13.4 9.1 2.2 1.8 7.6 4.8 1.9 2.5 21.7Iljin Display 020760 KS 22,100 646 Outperform 23,000 31-Dec 11.1 10.2 4.1 3.0 9.7 7.9 0.7 0.7 33.9Melfas Inc 096640 KS 27,050 451 Outperform 30,000 31-Dec 24.4 13.9 2.9 2.5 14.1 9.2 0.7 1.1 19.3Source: Bloomberg, Daiwa forecasts
0
20
40
60
80
100
0
20
40
60
80
100
120
140
1Q09 1Q10 1Q11 1Q12 1Q13E 1Q14E
Smartphone Feature phone Smartphone portion (RHS)
(m units) (% )(5)
05
101520253035
2008 2009 2010 2011 2012E 2013E
Semiconductor Display panel Telecom Digital media
(Wtn)

2013 Outlook for Asia 4 January 2013
- 104 -
Korea Telecoms – Neutral Thomas Y. Kwon (82) 2 787 9181 ([email protected]) Francis Kim (82) 2 787 9143 ([email protected])
Top-3 share-price drivers
• Strong momentum in LTE subscriber growth. We look for ongoing user migration to the LTE service in 2013 on the back of the enhancement to smartphone offerings and mobile content. We forecast the number of LTE users to rise by 94% YoY to 31m and account for 57% of the total number of wireless subscribers in Korea. We contend that LTE subscribers will contribute to a rise in overall ARPU in 2013 due mainly to the higher ARPU for LTE users than that for 2-3G subscribers. Meanwhile, we expect the level of LTE ARPU to fall gradually on the ongoing acquisition by local operators of smartphone users with low monthly service plans.
Korea: market opportunity for smartphones and LTE
Source: Companies, Daiwa forecasts
• Competitive landscape here to stay. Local operators are likely to gear up their LTE services to acquire premium LTE subscribers in 2013, following the completion of nationwide network coverage in 2012. Despite the regulator’s close monitoring of operators to ensure they do not extend excessive handset subsidies to consumers, we believe the carriers will resume a marketing war, which could reduce the visibility on an improvement in
profitability for 2013. We forecast the sector’s EBITDA margin to improve slightly to 23% in 2013 from 22% in 2012, thanks to the revenue benefit from LTE users and lower marketing expenses. We believe SK Telecom could successfully defend its leadership in the LTE segment in 2013.
Korea Telecoms Sector: marketing costs and EBITDA margin
Source: Companies, Daiwa forecasts
Note: KT numbers are on a post-merger basis from 2008 and with re-categorized marketing costs from 2011; LGU is post-merger and on an IFRS basis from 2009
• Benefiting from robust IPTV-user growth. Korea’s Internet Protocol TV (IPTV) users rose in number by 33% YoY to reach 6.1m in 3Q12 (29% of the total number of paid TV users in the country). With low pricing and aggressive cross-selling promotions with their parent companies, local IPTV service providers will continue to take share away from the cable TV operators, in our view. IPTV users are likely to help the integrated telecom operators improve their subscriber mixes and revenue streams over the medium term. We forecast the leading operators for IPTV services to add 1.5m IPTV users and increase their subscriber numbers by 23% YoY to 8.0m for 2013.
Korea: IPTV subscriber outlook
Source: Companies, Daiwa
0%
20%
40%
60%
80%
0
20
40
60
1Q11
2Q11
3Q11
4Q11
1Q12
2Q12
3Q12
4Q12
E
1Q13
E
2Q13
E
3Q13
E
4Q13
E
(m)
Feature phone subscribers (LHS) 3G smartphone subscribers (LHS)LTE smartphone subscribers (LHS) Smartphone penetration (RHS)LTE penetration (RHS)
0%
5%
10%
15%
20%
25%
30%
35%
40%
0
2
4
6
8
10
2002 2003 2004 2005 2006 2007 2008 2009 2010 2011 2012E 2013E
(KRWtn)
Marketing cost (LHS) EBITDA margin (RHS)
0123456789
1Q10
2Q10
3Q10
4Q10
1Q11
2Q11
3Q11
4Q11
1Q12
2Q12
3Q12
4Q12
E
1Q13
E
2Q13
E
3Q13
E
4Q13
E
(m)
KT SK Broadband LG Uplus

2013 Outlook for Asia 4 January 2013
- 105 -
Sector outlook for 2013
We forecast the total number of smartphone users in Korea to rise by 24% YoY to 41m, accounting for 76% of total wireless subscribers in 2013. However, we do not expect any change in the competitive landscape for wireless services in Korea. Local wireless carriers look set to maintain a relatively high capex level to expand their capacity of mobile broadband and network upgrades by 1H13. But, we forecast the sector’s total capex to decline by 6% YoY for 2013.
In our view, the operators might see more earnings contribution from non-telecom services in 2013, on the back of ongoing efforts to diversify their revenue streams since 2011. SKT believes its platform businesses, like 11st Street and T-Store, will represent an enterprise value of KRW1-2tn and its B2B revenue will double to KRW3tn in 2015. We believe LTE offerings might be commoditised rapidly, given there are no major differences among smartphone line-ups, mobile content, and the 4G network quality among the operators. Korea Telecoms Sector: capex and EBITDA
Source: Companies, Daiwa forecasts
Note: KT numbers are on a post-merger basis from 2008; LGU is post-merger and on an IFRS basis from 2009; SKT, KT, SKBB are IFRS basis from 2010
Key stock call for 2013
SK Telecom (017670 KS, KRW152,500, Outperform [2]) Investment thesis We believe SKT will continue to benefit from the LTE boom in Korea by leveraging its dominant position in the domestic wireless service market. Near-term stock catalysts would include a turnaround in ARPU in 4Q12, market-share gains in the LTE segment with competitive smartphone line-ups, and solid earnings contributions from non-telecom affiliates. We expect SKT will demonstrate steady ARPU growth in 2013 given the turnaround in its 4Q12 ARPU on a YoY basis, on the back of ongoing additions of LTE users with higher monthly subscription plans. Actually, SKT’s ARPU (excluding interconnection and signing fees) fell by 0.3% YoY for 3Q12. However, we forecast the company’s ARPU to increase by 3.9% YoY for 2013 and contribute solid top line growth. SKT has successfully maintained its market leadership with a 48% share in the LTE space as of 3Q12. In our view, the operator will gain more market share on the back of its competitive handset models and appealing content offerings. Management expects its platform businesses to start to pay off from 2013 and to contribute strong revenue and earnings growth for 2013-15, thanks to the solid platform demand for commerce, communication, and content publishing. Valuation We maintain our Outperform (2) rating on SKT with a six-month target price of KRW180,000, based on our target 2013E EBITDA multiple of 3.5x. Risks to our call The risks to our call would be a slower-than-expected ARPU recovery, resumption of a marketing war, and potential regulatory intervention by the government after the presidential election in December 2012.
Korea Telecoms: valuation summary
Stock Price (LC) Mkt. cap Target Year-end PER (x) PBR (x) EV/EBITDA (x) Dividend yield (%) ROE (%)Company code 28-Dec-12 (USDm) Rating price (LC) Month FY1E FY2E FY1E FY2E FY1E FY2E FY1E FY2E FY2ESK Telecom 017670 KS 152,500 11,502 Outperform 180,000 31-Dec 9.8 7.2 1.0 0.9 3.4 3.0 6.2 6.2 13.4KT Corporation 030200 KS 35,500 8,658 Hold 40,000 31-Dec 7.1 7.0 0.7 0.7 3.6 3.4 5.6 5.6 10.2LG Uplus 032640 KS 7,800 3,181 Hold 7,500 31-Dec 575.6 8.0 0.9 0.8 5.0 3.7 0.0 3.2 10.6SK Broadband 033630 KS 4,665 1,290 Hold 4,100 31-Dec 35.4 16.2 1.2 1.1 4.5 3.8 0.0 0.0 7.3Source: Bloomberg, Daiwa forecasts
0
2
4
6
8
10
12
14
0123456789
2005 2006 2007 2008 2009 2010 2011 2012E 2013E
(KRWtn)(KRWtn)
Capex (LHS) EBITDA (RHS) Depreciation (RHS)

2013 Outlook for Asia 4 January 2013
- 106 -
Korea Utilities – Positive Mike Oh (82) 2 787 9179 ([email protected])
Top-3 share-price drivers
• Electricity shortage. We expect Korea’s ongoing electricity shortage to be a key share-price driver for the utilities companies in 2013. In our view, Korea continues to be exposed to the risk of partial power blackouts and, as such, we believe the degree of the next tariff hike targeting consumers (likely in 1Q13) could be much higher than the market expects, at around the 3-5% level. We forecast KEPCO to raise its tariffs by 7% in 1Q13.
The country’s continuing electricity shortage should also provide a good opportunity for KEPCO Plant Service & Engineering (KPS) to win further orders in 2013 (as power-plant maintenance is likely to be ramped up to avoid blackouts), given its position as Korea’s leading power-plant maintenance company.
• Overseas revenue growth. Korean utilities firms are going overseas to diversify their revenue streams. Winning more overseas orders would be an important catalyst in 2013. Despite KEPCO’s weak balance sheet, we expect it to fully utilise borrowing and equity investments from state-owned financial institutions and national pension funds (which are willing to invest in long-term projects like overseas power plants) to penetrate the overseas markets in 2013.
• Fuel costs/KRW:USD exchange rate. Stabilising fuel prices (ie, coal, oil, LNG) and the further strengthening of the Won against the US Dollar should also be share-price drivers in 2013. A decline in fuel prices and further Won appreciation would lower KEPCO’s cost burden and lead to stronger-than-expected operating profit for 2013.
Sector outlook for 2013
We expect KEPCO to raise tariffs in 1Q13 on the back of lingering concerns about potential power blackouts, and believe this would be a good way of lowering demand for power. Also, we expect power-plant maintenance companies, such as KPS, to see a sustainable rise in orders in 2013, as a result of increased demand for power-plant maintenance to secure sufficient electricity reserves by lowering the chance of power-plant malfunctions. We think power-capacity additions will come on stream slowly in 2013. Due to KEPCO’s weak cash-generating capability, its subsidiaries are likely to pay it higher dividends in 2013 to improve KEPCO’s balance sheet. As such, we expect subsidiary KPS to continue to maintain a favourable dividend payout ratio of 64% for 2013.
Key stock call for 2013
KEPCO (015760 KS, KRW30,450, Outperform [2]) Investment thesis Next tariff hike expected in 1Q13. We believe the current ongoing electricity shortages will lead to another tariff hike in early 2013. Moreover, major macro variables (like the forex and fuel price trend) remain favourable for KEPCO’s current share price. KEPCO’s cost coverage ratio was 90.3% at the time of the previous tariff hike in August 2012. We believe KEPCO’s management and the Korean Government are striving to improve this ratio, and therefore another tariff hike looks likely in 1Q13 given: 1) the country’s electricity supply remains tight, and 2) the pace of capacity additions is slow. We expect major generation capacity additions to come online in 2014, which imply that capacity shortages could linger in 2013. We also expect tight electricity reserves again this winter, as Korea’s peak demand for electricity now occurs in the winter, rather than in the summer previously, as more people now depend on electricity (rather than other sources of fuel) for their heating. This has led to electricity demand growth for heating accelerating over the past five years, while cooling demand has grown relatively steadily.

2013 Outlook for Asia 4 January 2013
- 107 -
KEPCO: GDP and electricity sales-volume growth (YoY)
Source: KEPCO, Daiwa forecasts
KEPCO: generation capacity increase (2010-14E)
Source: KEPCO, Daiwa forecasts
The more the KRW appreciates the better for KEPCO’s earnings. We think KEPCO will continue to benefit from the ongoing appreciation in the Won against the US Dollar as this will continue to reduce its fuel import costs. Based on our analysis, a 1% appreciation in the Won against the US Dollar would lead to a 1% drop in KEPCO’s cost of fuel. Hence, any appreciation in the Won should offset any negative impact on earnings due to a high fuel cost.
We believe that coal prices, which we estimate accounted for 42% of KEPCO’s fuel costs for 2012, will remain relatively low. We expect the company’s coal input costs to continue to decline on a quarter-on-quarter basis for 1H13. Although we expect a sudden spike in the fuel price in 1H13, we believe any further appreciation of the Won would have a bigger impact on KEPCO’s net profit in the near term than would fluctuations in fuel prices. KEPCO: key variables vs. impact on operating profit (2013E)
Item Variable Revenue Cost Earnings
Impact on operating profit of a 1% change
(KRWbn)
Weak GDP growth down 1%
248.0 Tariff hike up 1
573 Fuel price (oil, LNG, coal) down 1%
243
Won depreciation 1% depreciation
(225)
Source: Daiwa estimates
Valuation Our SOTP-based six-month target price for KEPCO is KRW34,000. Within our SOTP model, we apply an EV/EBITDA multiple of 7.5x to factor in the recovery in the KOSPI in 2H12. Our target price is equivalent to a 0.4x FY13E PBR and 19.3x FY13E PER. However, given that we expect KEPCO to return to profitability in 2013, after five consecutive loss-making years, the stock appears expensive to us in terms of PER valuation; hence, we stick with our SOTP methodology to value the company. Risks to our call The risk to our call would be a lower-than-expected tariff hike in 1Q13. If more nuclear power plants in Korea were suddenly shut down as a result of malfunctions, this would also be negative for the company, as it would lead to an increase in its fuel costs.
Korea Utilities: valuation summary
Stock Price (LC) Mkt. cap Target Year-end PER (x) PBR (x) EV/EBITDA (x) Dividend yield (%) ROE (%)Company code 28-Dec-12 (USDm) Rating price (LC) Month FY1E FY2E FY1E FY2E FY1E FY2E FY1E FY2E FY2EKEPCO 015760 KS 30,450 18,259 Outperform 34,000 31-Dec nm 16.5 0.4 0.4 10.8 6.2 0.0 0.0 2.3KEPCO Plant Service & Engineering
051600 KS 60,900 2,560 Outperform 64,000 31-Dec 20.8 17.0 5.1 4.5 14.0 11.0 3.1 3.8 28.1
KEPCO Engineering & Construction
052690 KS 70,100 2,503 Hold 75,000 31-Dec 19.4 16.8 5.8 6.2 13.2 11.6 3.6 4.0 35.7
Source: Bloomberg, Daiwa forecasts
02468
101214
2000
2001
2002
2003
2004
2005
2006
2007
2008
2009
2010
2011
2012
E
2013
E
(% )
GDP growth (% ) Demand growth (% )
76,078 85,924
92,150
-3,259
2,538
4,048
6,226
-
70,000
75,000
80,000
85,000
90,000
95,000
2010 2011 2012E 2013E 2014E 2014E Total
(MW)

2013 Outlook for Asia 4 January 2013
- 108 -
Philippines Capital Goods – Positive Rommel Rodrigo (63) 2 813 7344 ([email protected])
Top-3 share-price drivers
• Investment upgrade a possibility. The possibility of the rating agencies upgrading the Philippines’ investment rating in 2013 does not seem far-fetched given the economy’s improved performance, and would likely boost trading activity within the market. Fitch is expected to update its rating for the Philippines in June 2013.
• Election-year effect. Historically, an election year is accompanied by strong consumption demand, which benefits sectors underpinned by a solid base of consumption (food & beverage, utilities and telecommunication). 2013 will be an election year, which is likely to be positive for the stock market.
• Benign inflation. In our view, prices for costs and expenditures are likely to see modest increases, and inflation should be benign in 2013 (Daiwa’s forecast for CPI is 3.5%). This should enhance operating margins at the corporate level.
Sector outlook for 2013
The lack of infrastructure facilities in the Philippines has been a big drag for investors. But, with the Public-Private Partnership (PPP) projects taking on a higher profile (if still progressing slowly), we think the conglomerate companies are best placed to take advantage of an infrastructure boom, especially those with strong infrastructure portfolios.
Selected Philippine conglomerates PER (x-axis) & ROE (y-axis)
Source: Bloomberg consensus, Daiwa estimates for DMC
Key stock call for 2013
DMCI Holdings (DMC PM, PHP54, Outperform [2]) Investment thesis We like DMC, which we believe has a well-balanced portfolio. We see the company being a direct infrastructure play in the Philippines Capital Goods space, particularly in the power and construction segments, given its engineering expertise and experience in these fields. The company focuses on underserved industries in the domestic economy. We believe DMC offers improving earnings quality in 2013, backed by an enhanced operating margin as expenditure should be contained in the context of our benign inflation forecast. With progress on PPP projects starting to gather steam, DMC looks to us to be a front-line beneficiary of related construction opportunities, based on our 2013 ROAE forecast for DMC of 30.6%, the highest among its peers with similar business profiles. Valuation We use an SOTP methodology to value DMC, employing a DCF approach for the company’s main operating units (96% of the DMC’s NAV, on our estimates). Risks to our call The continued slowdown in the global economy could affect DMC’s coal businesses, which we forecast to contribute some 33% of the company’s consolidated revenue in 2013.
AC
AEV
MPI
DMC
0.0
5.0
10.0
15.0
20.0
25.0
30.0
35.0
- 5.00 10.00 15.00 20.00 25.00 30.00
ROE
2013E
PER 2013E
Attractive Premium
Opportunistic Laggard

2013 Outlook for Asia 4 January 2013
- 109 -
Philippines Capital Goods: valuation summary Stock Price (LC) Mkt. cap Target Year-end PER (x) PBR (x) EV/EBITDA (x) Dividend yield (%) ROE (%)Company code 28-Dec-12 (USDm) Rating price (LC) Month FY1E FY2E FY1E FY2E FY1E FY2E FY1E FY2E FY2EDMCI Holdings DMC PM 54.0 3,489 Outperform 64.9 31-Dec 12.5 10.4 3.5 2.9 7.2 6.4 2.3 2.8 30.6Source: Bloomberg, Daiwa forecasts

2013 Outlook for Asia 4 January 2013
- 110 -
Singapore Capital Goods – Positive Adrian Loh (65) 6499 6548 ([email protected])
Top-3 share-price drivers
• Rig-order wins and orderbook expansion. We think the Singaporean yards will need to see new orders internationally from rig owners and oil companies, as well as the exercising of any outstanding newbuild-rig options they have in hand. It will also be important for the Singaporean yards to see a continuation of deepwater asset orders, capitalising on their respective successes in getting semi-sub (for Keppel) and drillship (for Sembcorp Marine) orders from Petrobras in 2012.
• Quarterly profit margins. Singapore rig builders have given a general range of operating-profit margins they expect for 2013, and any shortfall, or underperformance relative to peers, would be viewed negatively by the market.
• Oil prices. Historically, the sector has been positively correlated to oil prices, with an R² of at least 0.75 or higher. A long-term oil price that is above USD95/bbl would, in our view, allow for deepwater offshore projects to earn a high rate of economic return, and thus lend positive sentiment to rig owners and oil companies to order offshore assets.
Historical and forecast deepwater capex by global oil majors
Source: Wood Mackenzie (historical data), Daiwa forecasts
Sector outlook for 2013
We believe the sector could see strengthening share prices in 1H13, as renewed confidence in the global economy would be supportive of oil prices and therefore rig order flow. In particular, we forecast the global rig-building industry to see at least 35 deepwater and ultra-deepwater rig orders in 2013. In addition, we do not foresee oil prices dropping meaningfully below USD90/bbl (Brent), which could stall rig orders. As at 31 December 2012, the Brent forward oil price for December 2015 was USD96.9, and thus should be supportive of rig order flow over the next 2-3 years. Should global risk aversion increase in 2H13 as a result of continued issues in the EU, the sector could see profit-taking on the back of lower oil prices. Increasing no. of drillships being ordered in the past eight
years compared to semi-subs
Source: Riglogix
Key stock call for 2013
Keppel Corp (KEP SP, SGD11.0, Outperform [2]) Investment thesis We like Keppel for its operational track record and earnings transparency for at least the next two years, given its current order backlog of over SGD12bn. The company’s early entry into the offshore Brazil market should help stave off competition from Chinese yards, and allow the company to continue its market expansion, both in terms of technical ability (building more deepwater and ultra deepwater assets) as well as geographically (exposure to Brazil as well as west and east Africa). We prefer Keppel over Sembcorp Marine (SMM SP, SGD4.63, Outperform [2]) due to the former’s better positioning regarding any potential Petrobras contracts, and its better earnings transparency in 2012/13.
20.2 26.6 31.2 34.8 36.8 40.5 41.6 41.8 46.3 50.0 50.64.25.3
7.0 7.5 8.6 8.2 12.922.7
28.0 28.9 36.1
0
20
40
60
80
100
2005 2006 2007 2008 2009 2010 2011 2012E 2013E 2014E 2015EDeepwater Ultra deepwater
CAGR of deepwater capex2005-2011: +14%2011-2015E : +12%
(USDbn)
0%
20%
40%
60%
80%
100%
120%
0
10
20
30
40
50
60
2005 2006 2007 2008 2009 2010 2011 2012Semi-subs (LHS) Drillships (LHS) % of Drillships (RHS)
(units)

2013 Outlook for Asia 4 January 2013
- 111 -
Valuation We value Keppel at SGD12.45, which is an average of our SOTP-based valuation as well as a PER valuation. Our SOTP valuation includes a DCF for the company’s offshore and marine segment, which incorporates a WACC of 8.4% and a terminal growth rate of 2%. Our PER valuation uses a target 2013E PER of 10.3x, which is pegged to the company’s past-10-year (2002-12) average.
Risks to our call Downside risks to our positive view on Keppel include lower oil and gas prices, operational risks associated with the construction of rigs, and adverse government policies (either in its domestic or international operations), which could lower profitability and returns. In addition, Korean yards were aggressive in terms of pricing semi-subs in 2012 which could see Keppel lose market share, while competition for lower-specification jack-ups has intensified due to the expansion of Chinese shipyards into rig-building.
Singapore Capital Goods: valuation summary
Stock Price (LC) Mkt. cap Target Year-end PER (x) PBR (x) EV/EBITDA (x) Dividend yield (%) ROE (%)Company code 28-Dec-12 (USDm) Rating price (LC) Month FY1E FY2E FY1E FY2E FY1E FY2E FY1E FY2E FY2EKeppel Corp KEP SP 11.00 16,038 Outperform 12.45 31-Dec 10.2 11.6 2.3 2.1 5.9 6.4 4.5 3.9 18.8SembCorp Marine SMM SP 4.63 7,917 Outperform 5.36 31-Dec 16.3 12.8 3.9 3.4 10.2 7.8 3.7 4.7 28.2Sembcorp Industries SCI SP 5.27 7,710 Outperform 5.78 31-Dec 12.3 11.2 2.0 1.8 7.3 6.5 3.3 3.6 17.4Cosco Corp Singapore COS SP 0.90 1,639 Underperform 0.76 31-Dec 19.4 22.8 1.5 1.4 5.9 6.2 1.6 1.3 6.3Yangzijiang Shipbuilding YZJ SP 0.97 3,026 Underperform 0.84 31-Dec 5.6 8.4 1.2 1.1 4.2 6.0 4.9 3.6 13.9Source: Bloomberg, Daiwa forecasts
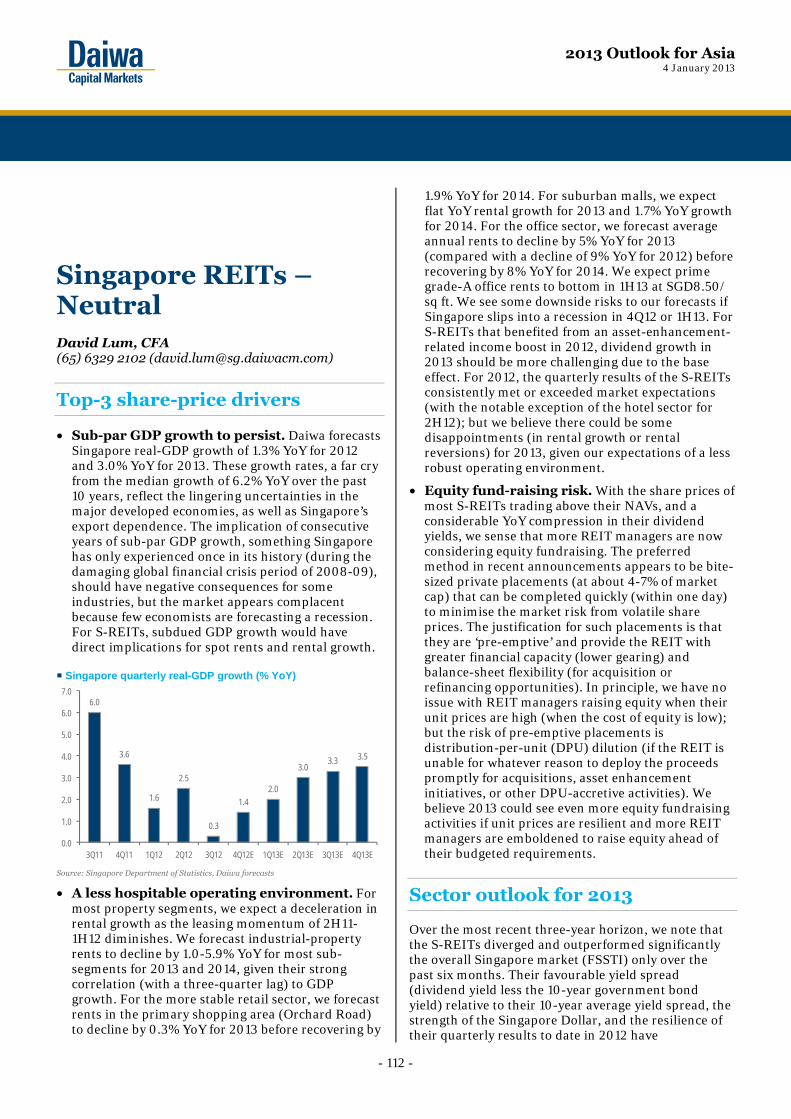
2013 Outlook for Asia 4 January 2013
- 112 -
Singapore REITs – Neutral David Lum, CFA (65) 6329 2102 ([email protected])
Top-3 share-price drivers
• Sub-par GDP growth to persist. Daiwa forecasts Singapore real-GDP growth of 1.3% YoY for 2012 and 3.0% YoY for 2013. These growth rates, a far cry from the median growth of 6.2% YoY over the past 10 years, reflect the lingering uncertainties in the major developed economies, as well as Singapore’s export dependence. The implication of consecutive years of sub-par GDP growth, something Singapore has only experienced once in its history (during the damaging global financial crisis period of 2008-09), should have negative consequences for some industries, but the market appears complacent because few economists are forecasting a recession. For S-REITs, subdued GDP growth would have direct implications for spot rents and rental growth.
Singapore quarterly real-GDP growth (% YoY)
Source: Singapore Department of Statistics, Daiwa forecasts
• A less hospitable operating environment. For most property segments, we expect a deceleration in rental growth as the leasing momentum of 2H11-1H12 diminishes. We forecast industrial-property rents to decline by 1.0-5.9% YoY for most sub-segments for 2013 and 2014, given their strong correlation (with a three-quarter lag) to GDP growth. For the more stable retail sector, we forecast rents in the primary shopping area (Orchard Road) to decline by 0.3% YoY for 2013 before recovering by
1.9% YoY for 2014. For suburban malls, we expect flat YoY rental growth for 2013 and 1.7% YoY growth for 2014. For the office sector, we forecast average annual rents to decline by 5% YoY for 2013 (compared with a decline of 9% YoY for 2012) before recovering by 8% YoY for 2014. We expect prime grade-A office rents to bottom in 1H13 at SGD8.50/ sq ft. We see some downside risks to our forecasts if Singapore slips into a recession in 4Q12 or 1H13. For S-REITs that benefited from an asset-enhancement-related income boost in 2012, dividend growth in 2013 should be more challenging due to the base effect. For 2012, the quarterly results of the S-REITs consistently met or exceeded market expectations (with the notable exception of the hotel sector for 2H12); but we believe there could be some disappointments (in rental growth or rental reversions) for 2013, given our expectations of a less robust operating environment.
• Equity fund-raising risk. With the share prices of most S-REITs trading above their NAVs, and a considerable YoY compression in their dividend yields, we sense that more REIT managers are now considering equity fundraising. The preferred method in recent announcements appears to be bite-sized private placements (at about 4-7% of market cap) that can be completed quickly (within one day) to minimise the market risk from volatile share prices. The justification for such placements is that they are ‘pre-emptive’ and provide the REIT with greater financial capacity (lower gearing) and balance-sheet flexibility (for acquisition or refinancing opportunities). In principle, we have no issue with REIT managers raising equity when their unit prices are high (when the cost of equity is low); but the risk of pre-emptive placements is distribution-per-unit (DPU) dilution (if the REIT is unable for whatever reason to deploy the proceeds promptly for acquisitions, asset enhancement initiatives, or other DPU-accretive activities). We believe 2013 could see even more equity fundraising activities if unit prices are resilient and more REIT managers are emboldened to raise equity ahead of their budgeted requirements.
Sector outlook for 2013
Over the most recent three-year horizon, we note that the S-REITs diverged and outperformed significantly the overall Singapore market (FSSTI) only over the past six months. Their favourable yield spread (dividend yield less the 10-year government bond yield) relative to their 10-year average yield spread, the strength of the Singapore Dollar, and the resilience of their quarterly results to date in 2012 have
6.0
3.6
1.6
2.5
0.3
1.42.0
3.03.3 3.5
0.0
1.0
2.0
3.0
4.0
5.0
6.0
7.0
3Q11 4Q11 1Q12 2Q12 3Q12 4Q12E 1Q13E 2Q13E 3Q13E 4Q13E

2013 Outlook for Asia 4 January 2013
- 113 -
underpinned their absolute appreciation and relative outperformance (vs. the FSSTI). Although these factors are likely to persist in 2013, we believe there is no guarantee that the S-REIT sector’s outperformance will continue. Our overall view on the S-REIT sector is Neutral, but we remain Positive on office S-REITs given our preference for value (they still trade on average at a discount [albeit much narrower than 1 year or 6 months ago] to their NAVs) and our expectations for office rents to bottom by 1H13. We are Neutral on retail S-REITs because we believe their high PBRs already reflect fully their defensiveness. We are Negative on industrial S-REITs because we believe they could be vulnerable to industrial-rent declines and their yields do not adequately compensate investors for the current macro, sector, and market risks. Relative performance of FSSTI and FSTREI*
Source: Bloomberg, Daiwa; *FTSE Straits Times Real Estate Investment Trust Index
Key stock call for 2013
Ascendas REIT (AREIT SP, SGD2.39, Underperform [4]) Investment thesis AREIT trades at a considerable premium (based on yield and NAV) to its industrial-property S-REIT peers and at one of the highest premiums to book value and NAV in the S-REIT sector. AREIT is widely viewed as defensive, but we believe AREIT is probably more vulnerable than its peers, due to its high exposure to multi-tenanted properties in the business park and hi-tech industrial segments (and their high rental-growth correlation to GDP), if the weak economy persists. Moreover, AREIT has surprised the market with private placements in early 2011 and 2012, and we cannot rule out another ‘pre-emptive’ surprise, which would likely impose a short-term drag on the price, in 2013. Valuation Our target price of SGD2.20 is pegged to parity with our 10-year DDM valuation. Our valuation assumes a cost of equity of 8.4% and a long-term growth rate of 1.5%, equivalent to an effective cap rate of 6.9%. Our DDM valuation also reflects AREIT’s weighted average remaining leasehold tenure of 48 years. Risks to our call The major risk to our negative call would be further inflows to the S-REIT sector as investors continue to chase yield. In our view, AREIT still looks demanding relative to its mean PBR of 1.35x and yield spread of 4.2% since listing.
Singapore REITs: valuation summary
Stock Price (LC) Mkt. cap Target Year-end PER (x) PBR (x) Dividend yield (%) ROE (%)Company code 28-Dec-12 (USDm) Rating price (LC) Month FY1E FY2E FY1E FY2E FY1E FY2E FY2EAscott Residence Trust ART SP 1.37 1,275 Buy 1.50 31-Dec 8.7 13.0 1.0 1.0 6.5 6.9 7.5Suntec REIT SUN SP 1.67 3,070 Buy 1.83 31-Dec 26.6 34.4 0.9 0.9 5.6 5.6 2.5Starhill Global REIT SGREIT SP 0.79 1,247 Outperform 0.83 31-Dec 8.2 6.2 0.9 0.8 5.6 6.2 13.6CapitaMall Trust CT SP 2.15 5,857 Hold 2.06 31-Dec 14.2 12.5 1.3 1.3 4.5 5.1 10.3Frasers Centrepoint Trust FCT SP 2.00 1,349 Hold 1.96 30-Sep 10.5 13.9 1.2 1.2 5.3 5.4 8.8Ascendas Real Estate Investment Trust AREIT SP 2.39 4,371 Underperform 2.20 31-Mar 14.6 11.7 1.3 1.2 5.8 6.3 10.6CapitaRetail China Trust CRCT SP 1.64 1,004 Underperform 1.47 31-Dec 9.6 11.1 1.2 1.2 5.9 5.8 10.6CDL Hospitality Trusts CDREIT SP 1.91 1,515 Underperform 1.84 31-Dec 19.4 13.1 1.2 1.2 6.0 6.2 9.1Cambridge Industrial Trust CREIT SP 0.68 672 Underperform 0.60 31-Dec 16.7 12.1 1.1 1.1 7.0 7.2 8.8Mapletree Logistics Trust MLT SP 1.14 2,261 Underperform 1.07 31-Mar 17.0 15.7 1.3 1.3 6.2 6.4 8.0Source: Bloomberg, Daiwa forecasts
0.60
0.70
0.80
0.90
1.00
1.10
1.20
1.30
12/1/
2009
2/1/20
10
4/1/20
10
6/1/20
10
8/1/20
10
10/1/
2010
12/1/
2010
2/1/20
11
4/1/20
11
6/1/20
11
8/1/20
11
10/1/
2011
12/1/
2011
2/1/20
12
4/1/20
12
6/1/20
12
8/1/20
12
10/1/
2012
FSSTI FSTREI

2013 Outlook for Asia 4 January 2013
- 114 -
Taiwan Automation – Positive Christine Wang (886) 2 8758 6249 ([email protected])
Top-3 share-price drivers
• Inventory levels set to decline. High inventory levels were an issue for the industry in 2012, due to overstocking and double booking in 2011 when market demand was good. The supply chain absorbed the excess inventory in 2012, but inventory levels for some components were high at the end of 2012 as end demand for general machinery remained low. We expect the digestion of inventory to accelerate this year, because of rising orders on hand among the Taiwan machine-tool makers in December. We expect inventory levels to fall before there is a meaningful pick-up in end demand, likely in 2Q13.
• China the biggest swing factor. The worst situation (in terms of the number of orders) was in July and August 2012. Some rush orders were placed in September and October, hence end-demand should have bottomed out. However, our research in the market suggests that a more significant and broad-based demand recovery will start from 2Q13. As most Taiwan component players are still heavily reliant on China (more than 30% of their total sales), we expect demand from that market to be the biggest swing factor in the component makers’ revenue and earnings growth for 2013.
• PMI data should improve over 2013. Our analysis shows that PMI data is a leading indicator of the automation component players’ quarterly revenue. We see a stabilising PMI trend (please see the following chart) in China and Germany. The improvements in the PMI data would be positive for the supply chain and share prices.
PMI comparison between China and Germany
Source: Bloomberg, Daiwa
Sector outlook for 2013
Orders on hand increasing. Orders on hand for the Taiwan machine-tool companies started to improve in November 2012. Most of the machine-tool makers expect 2013 to be a better year than 2012 (in terms of orders). By region, the US, Southeast Asia, and Japan should do better in 2013 than in 2012 (in terms of demand), based on feedback from the supply chain. For China, some machine-tool makers saw end demand start to improve slightly in December, while others expect to see a more meaningful recovery in 2Q13. Europe, however, is the only region in which no companies in the supply chain expect demand to recover in 2013. Component makers outperform machine-tool makers. The component makers were more affected than the machine-tool makers in 2012 by excess inventory. However, they are likely to outperform the machine-tool makers (in terms of YoY revenue growth) this year as inventory levels should drop before end demand recovers. In addition, those companies that gain market share globally should see the highest revenue growth: hence, their operating-profit margins should recover on increased utilisation rates. The following chart shows the orders on hand between THK and the Japan machine-tool makers. The orders on hand for THK, an automation-component provider, started to improve in October last year, while those for key Japan machine-tool companies remain low.
25
35
45
55
65
75
1/1/20
027/1
/2002
1/1/20
037/1
/2003
1/1/20
047/1
/2004
1/1/20
057/1
/2005
1/1/20
067/1
/2006
1/1/20
077/1
/2007
1/1/20
087/1
/2008
1/1/20
097/1
/2009
1/1/20
107/1
/2010
1/1/20
117/1
/2011
1/1/20
127/1
/2012
Germany manufacturing PMI China manufacturing PMI

2013 Outlook for Asia 4 January 2013
- 115 -
THK: orders vs. Japan machine-tool companies’ orders
Source: Company, Daiwa Japan
Key stock call for 2013
Delta Electronics (2308 TT, TWD107, Outperform [2]) Investment thesis Short-term operating-margin weakness should provide a good entry point. We expect the company’s operating margin to contract in the months prior to 2Q13 due to seasonal factors and weak automation demand in China. However, this should not prevent its operating margin from expanding over 2013-14. Our analysis shows that the current high R&D-expenses-to-sales ratio will lead to operating-margin expansion in 2013-14. As Delta Electronics’s (Delta) share price has a positive correlation to its operating-margin trend, we believe any weakness in the operating margin should provide a good entry point. Delta: share price positively correlated to operating margin
Source: Company, Bloomberg, Daiwa estimates Note: Forecast from Dec 2012
Sales growth in industrial-automation business may turn positive YoY from 3Q13. There has been a positive correlation between Delta’s industrial-automation sales and China’s industrial output and exports since 2004. We expect YoY sales growth for the company’s industrial-automation business to turn positive from 3Q13, due to the high base in 1H12. Positives should outweigh negatives over the long term. Delta should see stable earnings growth over 2013-14 due to a shift in the company’s product mix to cloud-computing solutions and automation products, despite headwinds in the PC and solar industry. We recently adjusted our model to factor in Delta’s recent sale of its 55% stake in solar-panel maker DelSolar to NeoSolar. Though we forecast Delta to book related investment losses of about TWD400m in 4Q12 and a further TWD1bn in 2013, we expect a lower net loss for its solar business overall compared with previous years (greater than TWD1.5bn). We view the above move as positive for Delta’s earnings from 2014 and beyond.
Delta: high earnings growth segments High-growth segment 2012E 2013E 2014E Trend% as of total sales 46% 50% 53% Increase% as of total gross profit 57% 59% 61% IncreaseSource: Daiwa forecasts
Note: High-growth segments include data-centre-related business, passive components, and industrial automation
Valuation We have an Outperform (2) rating and six-month target price of TWD123, based on a 2013E PER of 17x, which is slightly above the stock’s past-5-year trading average of 16x. We think a rerating is possible if a recovery in end demand is better than we expected, especially in the high-operating-margin segments. Risks to our call The key risks include a slower-than-expected demand recovery in China’s automation segment, and/or higher-than-expected selling and marketing expenses.
Taiwan Automation: valuation summary
Stock Price (LC) Mkt. cap Target Year-end PER (x) PBR (x) EV/EBITDA (x) Dividend yield (%) ROE (%)Company code 28-Dec-12 (USDm) Rating price (LC) Month FY1E FY2E FY1E FY2E FY1E FY2E FY1E FY2E FY2EChroma ATE 2360 TT 65 839 Buy 70 31-Dec 21.9 15.4 3.0 2.7 19.2 13.6 3.9 3.7 18.7Delta Electronics 2308 TT 107 8,814 Outperform 123 31-Dec 16.3 15.0 3.3 3.2 10.2 8.3 3.3 4.4 21.8Hiwin Technologies Corp 2049 TT 213 1,802 Outperform 250 31-Dec 24.2 15.1 5.2 4.1 17.1 11.4 2.6 1.4 30.6Advantech 2395 TT 123 2,373 Hold 110 31-Dec 19.6 16.6 4.2 3.7 14.6 12.1 4.1 3.1 23.9Source: Bloomberg, Daiwa forecasts
(60)(50)(40)(30)(20)(10)
0102030
Jan-1
1Fe
b-11
Mar-1
1Ap
r-11
May-1
1Ju
n-11
Jul-1
1Au
g-11
Sep-1
1Oc
t-11
Nov-1
1De
c-11
Jan-1
2Fe
b-12
Mar-1
2Ap
r-12
May-1
2Ju
n-12
Jul-1
2Au
g-12
Sep-1
2Oc
t-12
THK orders MoM Japan machine tool orders MoM
(% )
02468101214
020406080
100120140160
Sep-0
7
Mar-0
8
Sep-0
8
Mar-0
9
Sep-0
9
Mar-1
0
Sep-1
0
Mar-1
1
Sep-1
1
Mar-1
2
Sep-1
2
Mar-1
3
Sep-1
3
Mar-1
4
Sep-1
4
Share price (LHS) Operating margin (RHS)
(% )(TWD)

2013 Outlook for Asia 4 January 2013
- 116 -
Taiwan Financials – Positive Jerry Yang (852) 2773 8842 ([email protected])
Top-3 share-price drivers
• Rate normalisation cycle could begin in 2013. The general view in the market is that net interest income is set to grow more slowly in 2013 than in 2012, when Taiwan banks benefited from US Dollar lending, on which spreads are higher than for Taiwan Dollar lending. We note that the Taiwan Banking Index (TWSEBKI) rose by 47% over the course of the rate normalisation cycle of 2Q10-2Q11.
Benchmark interest rates: Taiwan vs. US
Source: TEJ; Data as of December 2012
• NIM improvements. We expect NIMs to widen as a result of two factors: 1) US Dollar lending — while margins could be volatile due to credit conditions in China, US Dollar loans continue to offer higher spreads than do Taiwan Dollar loans, and 2) pricing discipline has increased as a result of the new reserve rule.
Corporate loans (including SME) as a proportion of total loans
Source: TEJ; Data as of 30 September 2012
• Supportive political environment in 2013. We expect cross-Strait economic cooperation to accelerate now that China has finalised its leadership transition plans, and believe the financials sector stands to benefit most from this added impetus. We are likely to see an increase in cross-Strait M&A activity involving Taiwan financials players seeking to expand in China. If productive, ongoing discussions to raise limits on China financials companies’ investments in Taiwan could also spur M&A activity.
Sector outlook for 2013
The market consensus view seems to be that the growth matrix among Taiwan financials companies will moderate. For the financials stocks under Daiwa’s coverage, the market-consensus forecasts call for: 1) loan growth of 3-5% YoY in 2013 (vs. 5-10% YoY in 2012), 2) a 3-5bps widening in NIMs (vs. a 5bps improvement in 2012E), and 3) credit costs to remain low, albeit slightly higher than the decade low experienced in 2011-12. However, we continue to believe that Taiwan corporate-centric financial names are well placed for 2013, as: 1) US Dollar lending should be positive for margins, 2) the ongoing increase in Renminbi deposits should spur fee income given the attendant need for currency conversion, and 3) they are less exposed than private banks to a continued contraction in wealth management fee income during the downturn.
0.25
1.875
0
1
2
3
4
5
6
7
4Q00
2Q01
4Q01
2Q02
4Q02
2Q03
4Q03
2Q04
4Q04
2Q05
4Q05
2Q06
4Q06
2Q07
4Q07
2Q08
4Q08
2Q09
4Q09
2Q10
4Q10
2Q11
4Q11
2Q12
(%)
Federal Fund Rate Taiwan Discounted Rate
88%
76%
69% 68% 67% 66%
56%
50%
55%
60%
65%
70%
75%
80%
85%
90%
95%
Mega First Fubon Cathay E.Sun Chinatrust Taishin

2013 Outlook for Asia 4 January 2013
- 117 -
Quarterly NIM trend for Taiwan banks
Source: TEJ; Daiwa; Data are as of 30 September 2012
Key stock call for 2013
Mega Financial (2886 TT, TWD22.6, Buy [1]) Investment thesis Mega Financial is our top pick across our Taiwan financials coverage on account of the company’s: 1)
stable cash dividend payout — it has a stable cash dividend yield of 4-5%, 2) strong capital position — its Tier-1 ratio stood at 9.6% in 3Q12, and implementation of Basel III should have only a limited impact, and 3) unrivalled forex franchise — the company looks well placed in the US Dollar loan segment, as well as for any developments in Renminbi business. Valuation Our six-month target price of TWD26, based on a SOTP valuation, is equivalent to a 1.3x 2013E PBR. We value the Mega Bank subsidiary at a 1.2x PBR, based on our Gordon Growth Model, assuming an ROE of 10% and a terminal growth rate of 3%. Risks to our call The main risks to our Buy call on Mega Financial would be a worse-than-expected deterioration in asset quality and weaker-than-expected global end demand.
Taiwan Financials: valuation summary
Stock Price (LC) Mkt. cap Target Year-end PER (x) PBR (x) Dividend yield (%) ROE (%)Company code 28-Dec-12 (USDm) Rating price (LC) Month FY1E FY2E FY1E FY2E FY1E FY2E FY2EMega Financial 2886 TT 22.6 8,911 Buy 26.0 31-Dec 12.6 11.1 1.2 1.2 5.3 6.4 10.5E.Sun Financial 2884 TT 16.3 2,804 Buy 18.0 31-Dec 11.1 10.1 1.1 1.1 1.5 2.0 11.3First Financial 2892 TT 17.7 4,953 Buy 20.0 31-Dec 12.2 12.3 1.1 1.0 2.4 2.4 8.4Fubon Financial Holding 2881 TT 35.1 11,515 Outperform 35.5 31-Dec 14.3 11.2 1.1 1.1 2.8 3.1 9.8Taishin Financial 2887 TT 11.6 2,741 Hold 11.0 31-Dec 8.0 9.3 0.9 0.9 2.4 2.1 9.6Chinatrust Financial 2891 TT 17.2 7,333 Hold 16.0 31-Dec 10.6 9.7 1.2 1.1 2.2 2.4 11.8Cathay Financial Holdings 2882 TT 31.5 11,786 Sell 25.0 31-Dec 26.0 22.5 1.5 1.5 1.6 1.6 6.7Source: Bloomberg , Daiwa forecasts
1.23 1.25 1.20 1.20 1.26 1.25
144 1.44 1.58
1.55
1.50
1.52
1.54
1.56
1.58
1.60
1.00
1.10
1.20
1.30
1.40
1.50
1Q11 2Q11 3Q11 4Q11 1Q12 2Q12 3Q12
(%)(%)
Mega (RHS) First (RHS) E Sun (RHS)Taishin (RHS) Chinatrust (LHS)

2013 Outlook for Asia 4 January 2013
- 118 -
Taiwan TFT-LCD – Positive Chris Lin (886) 2 8758 6251 ([email protected])
Top-3 share-price drivers
• Lack of major capacity additions has constrained panel output since April 2012 and should continue to do so throughout 2013. The major panel makers globally have not expanded capacity aggressively since 2011. This has limited the panel-capacity additions of regular panels (with amorphous silicon bases), as panel makers have been converting their production lines not only to make other types of products, but to test and conduct pilot runs for these new products and new projects (touch-panel sensors, LTPS, IGZO oxide, and AMOLEDs).
TFT-LCD and OLED companies: capex
(USDbn) 2008 2009 2010 2011 2012EGlobal total 22.0 12.8 22.4 18.7 15.3 YoY growth (%) 18.95 -41.64 74.67 -16.36 -18.44By region
Japan 5.22 2.73 4.39 1.91 2.59 Korea 9.08 4.68 9.10 9.35 8.28 Taiwan 7.41 4.74 5.91 3.85 2.05 China 0.27 0.68 3.01 3.64 2.38 YoY growth (%)
Japan -46.1 -47.8 61.0 -56.4 35.3 Korea 210.4 -48.4 94.3 2.7 -11.5 Taiwan 38.8 -36.1 24.8 -34.9 -46.9 China -48.8 151.9 340.5 20.8 -34.5By major company
Samsung Electronics 3.42 1.11 2.66 1.42 1.38 LG Display 4.27 3.02 3.78 3.65 3.45 AU Optronics 3.03 1.86 2.64 1.95 1.32 Chimei Innolux 3.98 2.70 3.00 1.63 0.59 Sharp 1.98 0.89 1.94 0.93 0.64 Samsung Mobile Display - - 1.37 3.83 3.45 Beijing Optoelectronics 0.15 0.54 2.40 2.27 1.27 Chinastar - - 0.44 1.21 0.95 Source: Companies, Daiwa forecasts
• Big rise in size migration likely to limit panel supply further. We expect the average size of LCD-TV sets to increase substantially in 2013 to 36.5”, from 33.5” at the end of 2011 (ie, by 3”, compared with increases of 0.5-1.0” over the past few years), as the selling prices of large-size TVs have fallen sharply. We believe this will drive demand for large-size TV panels, and thus constrain
the capacity of regular 40-47” TV panels, which in turn is likely to lead to a capacity squeeze for monitor and notebook panels this year. Meanwhile, panel prices have rebounded since April 2012, and we expect them to rise further in 2013, especially the prices of TV and monitor panels.
Average size of LCD-TV sets globally
Source: DisplaySearch, Daiwa forecasts
• Panel-area growth matters more than volume growth. Although we forecast global unit shipment growth for LCD-TV sets of 5% YoY for 2012 and 9% YoY for 2013, we project the total demand area to rise by 13-15% YoY for both years, but the supply area to increase by only about 10% YoY each year. This should lead to a continued supply shortage.
Global TFT-LCD TV set shipment forecasts by region
Region 1Q12 2Q12 3Q12E 4Q12E 2012E YoY (%) 1Q13E 2Q13E 3Q13E 4Q13E 2013E
YoY (%)
Japan 2.1 1.3 1.2 1.6 6.2 (68%) 2.5 1.9 2.7 3.3 10.2 66%North America 7.4 8.4 9.7 16.5 42.0 10% 8.0 8.8 10.2 15.7 42.5 1%Western Europe 7.0 7.1 6.4 10.8 31.3 (9%) 7.4 7.0 7.8 10.2 32.2 3%Eastern Europe 4.2 4.1 4.8 8.0 21.1 24% 5.2 5.0 5.7 8.2 23.9 14%China 9.8 9.6 14.1 20.0 53.4 19% 11.0 11.2 13.2 15.9 51.1 (4%)Asia Pacific 5.3 5.4 6.1 9.0 25.8 26% 7.3 7.3 8.6 9.4 32.4 26%Latin America 4.4 5.2 5.6 7.1 22.3 15% 4.9 5.7 6.5 7.7 24.6 10%Middle East and Africa 3.1 3.2 3.2 4.3 13.8 19% 3.9 4.1 4.7 4.7 17.2 25%
Total 43.2 44.2 51.1 (138.5) 215.8 5% 49.9 50.7 59.1 74.8 234.4 9%Source: DisplaySearch, Daiwa forecasts
Global TFT-LCD supply area vs. demand area Global TFT-LCD Area 2008 2009 2010 2011 2012E 2013E Supply 84,206 99,343 137,746 148,053 163,630 179,770 Growth (YoY %) 34% 18% 39% 7% 10.5% 9.9% Demand 81,260 104,222 137,953 144,666 163,924 188,513 Growth (YoY %) 20% 28% 32% 5% 13.3% 15.0%Over/(under) supply 3.6% (4.7%) (0.2%) 2.3% (0.2%) (4.6%)Source: DisplaySearch, Daiwa forecasts
Sector outlook for 2013
It is not unit shipment growth that matters in this industry, but size migration and technology upgrades, as we expect the latter two trends to lead to a further tightening of global panel capacity in 2013. This should be favourable for pricing and the major panel makers.
30
31
32
33
34
35
36
37
1Q09
2Q09
3Q09
4Q09
1Q10
2Q10
3Q10
4Q10
1Q11
2Q11
3Q11
4Q11
1Q12
2Q12
3Q12
4Q12
E
(Avg. size/unit)
Avg. TV Size
+2.24 inch/unit

2013 Outlook for Asia 4 January 2013
- 119 -
If the turnaround story we expect is sustained after the holiday sales period, we expect panel makers’ share prices to continue rising for two more quarters. We suggest investors sell before the earnings recovery peaks, which we expect to be in 3Q13. History shows that each upcycle tends to last for three quarters and share prices tend to start falling from the peak quarter onwards, even though the panel makers post profits in the following quarters. Global TFT-LCD supply and demand
Source: DisplaySearch; Daiwa forecasts
Key stock call for 2013
Chimei Innolux (3481 TT, TWD15.6, Buy [1]) Investment thesis Chimei Innolux’s (CMI) quarterly net losses should narrow faster than those of AU Optronics (AUO) this year, due to the former’s larger EBITDA margin. CMI’s net loss narrowed QoQ and at a faster pace than AUO’s throughout 2012 as a result of the restructuring at CMI, which involved improving its product mix and reducing the overheads related to pure touch-panel lamination services.
Also, CMI’s EBITDA margin improved to 12.6% for 2Q12, from 9.0% for 1Q12, on the back of an improved product mix (new LCD-TV panel sizes of 39” and 50”) and its greater exposure to the China LCD-TV panel market. As we expected, CMI’s EBITDA margin has been better than AUO’s since 1Q12 and we believe CMI will continue to outperform AUO throughout 1H13
We expect AUO to continue to have a lower EBITDA margin than CMI over the next few quarters due to the following factors: 1. AUO’s photovoltaic business is weak, accounting
for about 20% of its 2Q12 operating loss, and is still likely to be substantially loss-making in 2H12, based on the company’s guidance.
2. We expect continued growth in the shipments of AUO’s low-yielding high-end products in 2013 (such as AMOLED, one-glass solution, OGS2, wide-view tablet displays, high-resolution displays, and slimmer motherglass production), which have lower EBITDA margins than its normal products.
CMI and AUO: EBITDA margin
Source: Companies, Daiwa forecasts
Valuation We have a Buy (1) rating for CMI and we recently raised our target price. We continue to believe the company offers a good turnaround story, as we expect a narrowed net loss QoQ and a turnaround to a net profit in 2013. Our six-month target price of TWD19.10 is based on a PBR of 0.9x on our pro-forma 2013 BVPS forecast of TWD21.24 (assuming GDR issuance of 1.125bn new shares). Our target PBR is towards the high end of the stock’s past-three-year trading range of 0.5-1.5x. Risks to our call The main risk to our rating, forecasts, and target price would be slower-than-expected end demand.
Taiwan TFT-LCD: valuation summary Stock Price (LC) Mkt. cap Target Year-end PER (x) PBR (x) EV/EBITDA (x) Dividend yield (%) ROE (%)Company code 28-Dec-12 (USDm) Rating price (LC) Month FY1E FY2E FY1E FY2E FY1E FY2E FY1E FY2E FY2EChimei Innolux 3481 TT 15.6 4,251 Buy 19.1 31-Dec nm 31.9 0.7 0.7 5.4 2.9 0.0 0.0 2.2Radiant Opto-Electronics 6176 TT 119.5 1,858 Buy 158.0 31-Dec 10.5 8.3 2.1 1.9 6.0 4.5 5.1 5.6 25.2AU Optronics 2409 TT 13.0 3,952 Outperform 16.3 31-Dec nm 29.2 0.7 0.7 6.6 3.0 0.0 0.0 2.5Taiwan Surface Mounting Technology 6278 TT 44.1 390 Outperform 50.0 31-Dec 11.1 8.8 1.2 1.1 3.1 2.8 4.6 2.8 13.3Coretronic Corp 5371 TT 22.5 561 Hold 19.3 31-Dec 18.8 13.0 0.8 0.8 5.9 3.8 5.9 2.7 6.2Source: Bloomberg, Daiwa forecasts
(20)
(15)
(10)
(5)
0
5
10
0
10,000
20,000
30,000
40,000
50,000
60,000
2Q04
4Q04
2Q05
4Q05
2Q06
4Q06
2Q07
4Q07
2Q08
4Q08
2Q09
4Q09
2Q10
4Q10
2Q11
4Q11
2Q12
4Q12
E2Q
13E
4Q13
E
Supply (LHS) Demand (LHS) Over/(under) supply (RHS)
8
10
12
14
16
18
20
22
1Q12 2Q12 3Q12 4Q12E 1Q13E 2Q13E 3Q13E 4Q13E
(% )
CMI AUO

2013 Outlook for Asia 4 January 2013
- 120 -
Taiwan Touch Panels – Positive Chris Lin (886) 8758 6251 ([email protected])
Top-3 share-price drivers
• Overhang from in-cell lifted. Despite the adoption of in-cell technology in Apple’s iPhone 5, we believe TPK will continue to benefit from the rising adoption of one-glass solution (OGS) technology in touch-enabled notebooks (ultra-likes/Ultrabooks/hybrids).
Examples of possible Windows 8-based notebooks and tablets
Source: Daiwa
• Benefiting from increasing demand for full lamination. Full lamination is TPK’s core competence and cash cow. As the average size of a touch display looks set to expand to above 10” for notebook-like products, the full-lamination solution is likely to become the only viable approach due to the following: 1) the air-gap solution tends to weaken the quality of the touch feature as the centre of the sensor is apt to sag towards the display due to gravity, and 2) full lamination enhances readability in sunlight.
• Should benefit in 2013 from rising penetration of touch-enabled notebook-like
products. Rather than buying a 7-inch tablet (without phone functionality) for USD180-350, and then a touch-enabled Ultrabook for USD1,000-1,500, we think that in 2H13, end-consumers will spend only USD400-650 to buy 11.6-inch touch-enabled ultra-like Windows 8 notebooks featuring detachable screens/sliding keyboards, convertible or even foldable form factors. Such devices have screens big enough for use in office computing, and can run applications and open files that are compatible with existing office and home systems. They have many other functions in a tablet form factor running Windows 8, after detaching/sliding/ folding up the keyboard (either a hard-cased one or a soft one like a flip cover for Microsoft’s Surface).
Sample pricing by brand for tablets/ultra-likes/Ultrabooks
Product Size OS Entry level (USD/unit)
Battery capacity (mAh)
7-inch tablets Samsung Galaxy Tab 7 Android 179.99 4000Amazon Kindle Fire HD 7 Android 199.00 4400Google Nexus 7 7 Android 199.00 4325Acer A110 7 Android 229.99 3420Samsung Galaxy Tab Plus 7 Android 349.99 4000Apple iPad mini 7.9 iOS 329.00 4490Amazon Kindle fire HD 8.9 Android 299.00 6000
Average 255.14
11.6-inch touch-enabled ultra-likes Lenovo Idea Tab Lynx 11.6 Win 8 Pro 599.99 6800 / 6800Samsung ATIV Smart PC 500T 11.6 Win 8 Pro 749.99 8200Lenovo IdeaPad Yoga 11.6 Win 8 Pro 799.00 6800 / 6800Asus VivoTab TF810C 11.6 Win 8 Pro 799.00 3950Acer Iconia W700 11.6 Win 8 Pro 799.99 4850
Average 749.59
Touch-enabled Ultrabooks Lenovo Yoga 13 13.3 Win 8 Pro 1,100.00 3860Acer Aspire S7 13.3 Win 8 Pro 1,399.00 4680Dell XPS 12 12.5 Win 8 Pro 1,699.00 4400Asus Taichi 11.6 Win 8 Pro 1,599.00 3200Asus Zenbook 13.3 Win 8 Pro 1,999.00 6520 Average 1,559.20 Source: Daiwa research; companies
Sector outlook for 2013
In his 2012 Computex keynote speech, Tom Kilroy, senior vice-president of sales and marketing for Intel, said Intel is ‘stepping up to lead touch’ and to ‘jump-start’ factories. Mr. Kilroy said Intel’s commitment was an ‘insurance policy’ to motivate touch-panel makers to increase large-size (11.6” and 13.3”) touch-panel production, as Intel expects mainstream demand in 2013 to be for touch-enabled Ultrabooks/ultra-likes. According to our forecasts, the global penetration of touch-enabled notebook-like products in 2013 should reach 20%-plus (from 2% in 2012), or more than 40m units. As such, demand for larger-size lamination should increase, regardless of the type of single-glass solution (SGS) being adopted by the brand makers.

2013 Outlook for Asia 4 January 2013
- 121 -
Key stock call for 2013
TPK (3673 TT, TWD513, Buy [1]) Investment thesis We highlight TPK for its exposure to rising penetration globally of touch-enabled notebook-like devices (notebooks, tablets, Ultrabooks, ultra-likes, etc). In our view, the stock’s appeal rests on TPK’s enhanced product mix, with improved yield rates for all product lines, and rising demand for full lamination (between the touch sensor and TFT-LCD display) as opposed to air-gap lamination for touch displays. 2013E top line to grow 30% YoY and earnings to grow 31% YoY, with a stable operating margin of 10.6%. Our strong growth expectations are based on the following assumptions:
1. Global penetration of touch-enabled notebook-like products in 2013 to reach 20%-plus, from 2% in 2012, or more than 40m units, and
2. TPK should ship close to 1m touch displays per month for notebook-like products, implying a conservative estimate of a circa 25% market share, or 10.75m units, in 2013.
Client and product diversification to sustain growth and profitability in 2013. TPK has essentially a whole new business structure compared with that in 2011, and we forecast its 2013 sales to be TWD220.2bn (2011: TWD143.4bn).
TPK: diversification efforts
Diversification 2011 2013E*
Client Apple 73% 37%Others 27% 63%
Product G/G 90% 10%G/F/F 45% 25%TOL/G1F 0% 30%
Application
Smartphones 60% 24%Tablet/eBook 35% 52%Notebook 0% 14%Others 5% 10%
Source: Company; note: *company guidance
According to management, 50% of the funds raised through GDR and ECB issuances at the end of 3Q12 are for capex for TPK’s SGS, while the other 50% will be to increase working capital due to clients’ demand for full-lamination services (requiring purchases of larger-size TFT-LCD panels for tablets, notebooks, Ultrabooks, and ultra-likes than for smartphones). Our industry survey indicates there are a number of different designs in the offing for tablets/Ultrabooks/ ultra-likes/hybrids in 2013. TPK’s ongoing vertical-integration (including cover glass and sensor glass production, on top of its core business of lamination) efforts should support growth in its SGS (including TOL [touch on lens] and OGS [one-glass solution], GF2 [glass-DITO film] and G1F [glass-one film]) business to grow, since the company aims to offer a one-stop-shop solution at the lowest-possible cost. Mass production of SGS solutions, at a variety of customised specifications, should also enhance TPK’s bargaining power, allowing it to keep its operating margin at around 11% over 2013-14 (based on our forecasts). Touch-on-lens could become an in-cell touch killer in 2 years. We believe that once TPK has expanded its touch-on-lens (TOL) capacity to satisfy demand from Apple, TOL is likely to supersede in-cell touch solutions. Both approaches have similar thickness and border strength, but TOL should offer better performance and touch sensitivity. Valuation Our six-month target price for TPK of TWD626 is based on our fully diluted 2013E EPS and a target PER of 11.0x (compared with TPK’s past-two-year range of 6.0-18.4x). We have a Buy (1) rating on the stock, given our view that the company’s fundamentals should remain solid in 2013. Risks to our call The main risk would be lower-than-expected end-demand for Windows 8 Pro notebooks.
Taiwan Touch Panels: valuation summary
Stock Price (LC) Mkt. cap Target Year-end PER (x) PBR (x) EV/EBITDA (x) Dividend yield (%) ROE (%)Company code 28-Dec-12 (USDm) Rating price (LC) Month FY1E FY2E FY1E FY2E FY1E FY2E FY1E FY2E FY2ETPK 3673 TT 513.0 6,005 Buy 626.0 31-Dec 12.9 9.8 3.4 2.7 7.3 5.7 2.6 2.5 30.4G Tech Optoelectronics 3149 TT 75.9 616 Buy 111.0 31-Dec 22.0 15.1 2.3 2.0 12.7 8.7 0.0 0.2 14.0Wintek 2384 TT 15.4 980 Hold 13.9 31-Dec nm nm 0.8 0.8 6.5 6.2 0.0 0.0 nmSource: Bloomberg, Daiwa forecasts

2013 Outlook for Asia 4 January 2013
- 122 -
ASEAN Banks – Positive Srikanth Vadlamani (65) 6499 6570 ([email protected])
Top-3 share-price drivers
• Increasing funding pressure likely to be the key determinant of NIMs: We expect an increase in funding pressure across the region, driven by a confluence of factors. In Indonesia, where we see potential for the greatest increase in funding pressure within the region, we note that the system loan-to-deposit ratio (LDR) is already high, at around 84%. Even among the big banks, with the exception of Bank Central Asia (BBCA), LDRs have risen meaningfully in 2012. Hence, unlike what we saw in 2012, we expect the banks to start focusing on term deposit growth by offering competitive pricing. On the other hand, we expect lending yields to continue to trend down. This should put downward pressure on NIMs in 2013. In Singapore, we expect the more stringent liquidity requirements on account of the implementation of Basel III to heighten deposit competition, as foreign banks operating in Singapore seek to enhance their local retail funding franchises. This has the potential to present a downside risk to the market’s forecasts of Singapore banks’ NIMs in 2013. In Thailand and Malaysia, on the other hand, we expect the impact of increased funding pressure on NIMs to be relatively muted. In Thailand, while already-high LDRs mean that funding (deposit gathering) will likely be tight, we believe banks have sufficient pricing power on the lending side to compensate for any increase in funding costs. In Malaysia, we believe the NIMs are already very low, and we do not see any material downside from current levels.
• Increasing emphasis on high-yielding segments. With asset-quality conditions remaining benign, we expect the banks to expand the proportion of high-yielding segments in their loan books. Look for this phenomenon to be particularly evident in Indonesia and Thailand. In Indonesia, we expect competition to intensify in the microfinance segment as more players target this high-yielding
segment. While this should be positive for asset yields in the near term, we are cautious on the pace of growth in the microfinance segment as well as other high-yielding segments, such as smaller-sized SMEs. We believe that banks may be underestimating the credit risk. Hence, while analysing NIMs, investors should adjust for banks' changing loan-book composition. In Thailand, on the other hand, we are positive on the banks' push toward high-yielding segments. We believe the Thai banks have been overly conservative. Also, in contrast to Indonesia, we see the banks being much more selective in their push toward high-yielding segments.
• Loan growth may surprise on the upside. In all four countries, we see the potential for loan growth to come in at the upper end of the market’s expectations, even if GDP growth expectations only meet expectations. We believe loan demand, especially on the corporate side for capex spending, is pretty robust and should drive loan growth. In addition, the benign credit cycle has made banks much more disposed to lend, in our view.
Sector outlook for 2013
We expect the sector outlook for the ASEAN banks to remain healthy, characterised by a stable asset quality and robust loan growth outlook. While NIMs in some countries may trend down a little, and currently very low credit costs may trend up, we see neither of these trends as a concern per se. The healthy operating outlook, however, is reflected to an extent in the banks' prevailing valuations, on our reading. For the sector as a whole, we do not see scope for a further valuation rerating and expect stock returns to broadly mimic earnings growth. Loan growth (YoY)
Source: Daiwa forecasts
0%
5%
10%
15%
20%
25%
30%
35%
DBS
UOB
OCBC MA
Y
CIMB PB
K
KBAN
K
BBL
SCB
BAY
BBCA
BMRI
BBRI
BBNI
BDMN
2012E 2013E 2014E

2013 Outlook for Asia 4 January 2013
- 123 -
Key stock call for 2013
Bank of Ayudhya (BAY TB, THB 32.5, Buy[1]) Investment thesis BAY is our key call among the ASEAN banks. First, we believe BAY’s high-yielding personal loans and credit-card businesses are firmly on track, driven by an improvement in customer demand as well as BAY’s market-share gains relative to its peers. As a result, we forecast the bank to record a healthy operating revenue CAGR of 11% for 2012-14. Second, we expect meaningful positive operating-expenditure and credit-cost leverage, with the bank’s revenue growing faster than operating costs and credit costs. We forecast its cost-income ratio to come down from 50% currently to 48% by 2014, and we see scope for credit costs to decline further from 145bps currently, as BAY is now sufficiently provisioned.
Consequently, we forecast BAY's ROE to increase to 16.3% by 2014, from 13.7% in 1H12 and 9.2% in 2011. On our forecasts, this would represent the greatest increase in ROEs across our coverage universe in the next two years. Valuation Our six-month target price for BAY of THB38 is based on the Gordon Growth Model. On both PBR and PER bases, the stock is trading at average levels compared with its past-5-year trading history. Given our expectation of an increase in the bank’s ROE over the next two years, we believe there are grounds for the stock to trade at higher valuations. Risks to our call In our opinion, a larger-than-expected deterioration in asset quality represents the key risk.
ASEAN Banks: valuation summary
Stock Price (LC) Mkt. cap Target Year-end PER (x) PBR (x) Dividend yield (%) ROE (%)Company code 28-Dec-12 (USDm) Rating price (LC) Month FY1E FY2E FY1E FY2E FY1E FY2E FY2EBank of Ayudhya BAY TB 32.5 6,453 Buy 38.0 31-Dec 13.2 10.4 1.8 1.6 3.1 4.0 16.3DBS Group DBS SP 15.0 30,007 Buy 17.0 31-Dec 10.4 10.3 1.2 1.1 4.0 4.3 11.3Bank Negara Indonesia Persero Tbk PT BBNI IJ 3,700 7,159 Outperform 4,300 31-Dec 10.4 9.8 1.6 1.4 1.9 2.0 15.3Bank Central Asia Tbk PT BBCA IJ 9,100 23,006 Hold 8,000 31-Dec 19.9 17.1 4.5 3.8 1.6 1.9 23.9Malayan Banking MAY MK 9.1 22,176 Underperform 8.0 31-Dec 14.2 12.8 2.0 1.8 3.4 3.8 14.3Source: Bloomberg, Daiwa forecasts

2013 Outlook for Asia 4 January 2013
- 124 -
ASEAN Telecoms – Positive Ramakrishna Maruvada (65) 6499 6543 ([email protected]) Jame Osman (65) 63213092 ([email protected])
Top-3 share-price drivers
• Rise of data services likely to lead to share-price divergences. The dual drivers of increased availability of cheap smartphones and growth in online content have fuelled consumer demand for data services within ASEAN and India. Given that data services contributes a small percentage of overall revenues, the potential upside here remains attractive. However, we expect the proliferation of data services usage to cannibalise SMS revenues. This is especially relevant for the Philippines, where operators derive a substantial portion of revenues from SMS services. As such, we expect the rise usage of data services to be a positive catalyst for industry revenue growth across ASEAN countries, excluding the Philippines. Our bearish view on the Philippines telecoms sector runs counter to the market consensus view.
ASEAN-India telcos: mobile revenue breakdown by mode of
communication (2011)
Source: Companies, Daiwa
• Regulatory developments could favour some more than others. We expect the regulatory outlook in ASEAN to remain largely favourable for
the operators under Daiwa’s coverage, while we see prolonged uncertainty over the spectrum renewal fee issue in India. In Thailand, we expect the distribution of 3G licences in 1Q13 to the three successful bidders to result in lower regulatory costs for the operators we cover over the next five years. In the Philippines, the regulator’s recent directive to lower SMS retail tariffs will likely be rendered ineffective, as we expect the country’s operators to challenge the proposal in the courts. In Singapore, Malaysia and Indonesia, the regulators look likely to award new spectrum licences for LTE or 3G services at reasonable prices, with minimal disruption to the status quo.
• Rational competition likely to support stable to improving tariff environments across markets. In Indonesia, operators such as XL Axiata have benefited from the stable competitive environment by raising tariffs, while in Thailand, Malaysia and Singapore, competitive pressures have been limited to specific segments of the market. Price wars have largely been avoided, allowing overall industry revenues to grow.
Sector outlook for 2013
We remain positive on the outlook for the ASEAN telecoms sector in 2013, mainly because many of the stocks we cover offer attractive and relatively low-risk 2013E dividend yields in the range of 3-6%. Indonesian telcos remain our key preference, while we are bearish on the Philippines telecoms sector. We expect a stable pricing environment to drive moderate revenue growth prospects, despite full market mobile penetration, across our coverage universe. In the case of Indonesia, we look for strong revenue generation and sector-wide EBITDA margin expansion over the next three years. ASEAN-India telecoms: revenue growth CAGR versus EBITDA
margin change (2011-14E)
Source: Companies, Daiwa
0
20
40
60
80
100
120
India (Bharti) Thailand (DTAC)
Malaysia (Digi)
Singapore (SingTel)
Indonesia (XL)
Philippines (PLDT)
Voice SMS Data ex-SMS 0.01.02.03.04.05.06.07.08.09.0
10.0
(2.0) (1.5) (1.0) (0.5) 0.0 0.5 1.0 1.5 2.0
Revenue CAGR 2011-14E (%)
Indonesia
Singapore
Thailand
Philippines
India
Malaysia
EBITDA margin change 2011-14E (p.p)

2013 Outlook for Asia 4 January 2013
- 125 -
Key stock call for 2013
Indosat (ISAT, IDR6,450, Buy [1]) Investment thesis Indosat is our top pick within the ASEAN telecoms sector. Several recent events have served as catalysts for a turnaround, in our view: 1) during our visits to Indonesia we learned from industry participants that changes in management, particularly the appointment of Eric Meijer in June 2012 as the head of the consumer division, could help to bridge the gap between the company’s strategy and execution, and 2) the completion of the divestment of 2,500 towers coupled with the securing of regulatory approval to operate Indosat’s 3G network using the 900MHz spectrum should reduce capex outlay and improve
operational efficiency. In 2013, we expect the company to make tangible progress on network-sharing and tower divestment initiatives, which we believe have the potential to enhance shareholder value. Valuation Our six-month target price of IDR7,335 is based on DCF methodology. Risks to our call A continuation of Rupiah depreciation or execution weakness could prevent the stock from reaching our target price. There also exists considerable uncertainty over the company’s future capex requirements. We have assumed that its 2014 capex-to-sales ratio will stabilise at 23%.
ASEAN Telecoms: valuation summary
Stock Price (LC) Mkt. cap Target Year-end PER (x) PBR (x) EV/EBITDA (x) Dividend yield (%) ROE (%)Company code 28-Dec-12 (USDm) Rating price (LC) Month FY1E FY2E FY1E FY2E FY1E FY2E FY1E FY2E FY2EIndosat Tbk PT ISAT IJ 6,450 3,637 Buy 7,335 31-Dec 92.0 28.9 1.9 1.8 5.5 4.9 1.2 0.5 6.4Telekomunikasi Indonesia TLKM IJ 9,050 18,074 Outperform 10,938 31-Dec 13.1 11.4 3.2 2.9 4.7 4.2 5.0 5.7 26.9Advanced Info Service ADVANC TB 209 20,306 Outperform 221 31-Dec 17.4 15.2 13.7 13.0 9.8 9.1 5.8 6.6 87.7Singapore Telecom ST SP 3.33 43,780 Hold 3.12 31-Mar 14.4 13.7 2.2 2.0 8.4 7.9 4.5 4.7 15.3Bharti Airtel BHARTI IN 318 22,806 Underperform 244 31-Mar 36.3 24.5 2.3 2.1 7.8 6.8 0.3 0.3 8.8Philippine Long Distance Telephone TEL PM 2,530 13,312 Underperform 2,293 31-Dec 14.8 15.2 3.6 3.7 8.0 7.4 6.8 6.6 24.0Maxis Bhd MAXIS MK 6.7 16,313 Sell 5.4 31-Dec 22.3 21.2 6.8 7.5 12.4 12.1 6.0 6.0 33.7Source: Bloomberg, Daiwa forecasts

2013 Outlook for Asia 4 January 2013
- 126 -

2013 Outlook for Asia 4 January 2013
- 127 -
Disclaimer
All statements in this report attributable to Gartner represent [Bank’s/Issuer’s/Client’s] interpretation of data, research opinion or viewpoints published as part of a syndicated subscription service by Gartner, Inc., and have not been reviewed by Gartner. Each Gartner publication speaks as of its original publication date (and not as of the date of this [presentation/report]). The opinions expressed in Gartner publications are not representations of fact, and are subject to change without notice.
The MSCI sourced information is the exclusive property of MSCI Inc. (MSCI). Without prior written permission of MSCI, this information andany other MSCI intellectual property may not be reproduced, redisseminated or used to create any financial products, including any indices.This information is provided on an “as is” basis. The user assumes the entire risk of any use made of this information. MSCI, its affiliates andany third party involved in, or related to, computing or compiling the information hereby expressly disclaim all warranties of originality,accuracy, completeness, merchantability or fitness for a particular purpose with respect to any of this information. Without limiting any of theforegoing, in no event shall MSCI, any of its affiliates or any third party involved in, or related to, computing or compiling the information haveany liability for any damages of any kind. MSCI and the MSCI indexes are services marks of MSCI and its affiliates.

2013 Outlook for Asia 4 January 2013
- 128 -
Samsung Electronics: share price and Daiwa recommendation trend
Source: Daiwa
Amorepacific: share price and Daiwa recommendation trend
Source: Daiwa
Date Target price Rating Date Target price Rating Date Target price Rating07/04/10 1,040,000 Outperform 07/07/11 1,100,000 Outperform 21/03/12 1,600,000 Buy30/04/10 1,080,000 Outperform 27/09/11 1,000,000 Outperform 10/04/12 1,700,000 Buy06/10/10 970,000 Outperform 28/10/11 1,100,000 Outperform 27/04/12 1,800,000 Buy22/12/10 1,100,000 Outperform 06/12/11 1,200,000 Outperform28/01/11 1,200,000 Outperform 27/01/12 1,300,000 Outperform
920,000970,000
1,040,0001,080,000
970,000
1,100,0001,200,000
1,100,0001,000,000
1,100,0001,200,000
1,300,000
1,600,0001,700,000
1,800,000
600,000
800,000
1,000,000
1,200,000
1,400,000
1,600,000
1,800,000
Jan-1
0
Feb-1
0
Mar-1
0
Apr-1
0
May-1
0
Jun-1
0
Jul-1
0
Aug-1
0
Sep-1
0
Oct-1
0
Nov-1
0
Dec-1
0
Jan-1
1
Feb-1
1
Mar-1
1
Apr-1
1
May-1
1
Jun-1
1
Jul-1
1
Aug-1
1
Sep-1
1
Oct-1
1
Nov-1
1
Dec-1
1
Jan-1
2
Feb-1
2
Mar-1
2
Apr-1
2
May-1
2
Jun-1
2
Jul-1
2
Aug-1
2
Sep-1
2
Oct-1
2
Nov-1
2
Dec-1
2
Target price (KRW) Closing Price (KRW)
Date Target price Rating Date Target price Rating Date Target price Rating07/09/10 1,240,000 Buy 07/02/12 1,220,000 Buy 08/11/12 1,360,000 Outperform13/05/11 1,260,000 Buy 27/03/12 1,220,000 Outperform21/07/11 1,420,000 Buy 09/05/12 1,250,000 Outperform
1,000,000
1,120,000
1,240,000 1,260,000
1,420,000
1,220,0001,250,000
1,360,000
700,000
800,000
900,000
1,000,000
1,100,000
1,200,000
1,300,000
1,400,000
1,500,000
Jan-1
0
Feb-1
0
Mar-1
0
Apr-1
0
May-1
0
Jun-1
0
Jul-1
0
Aug-1
0
Sep-1
0
Oct-1
0
Nov-1
0
Dec-1
0
Jan-1
1
Feb-1
1
Mar-1
1
Apr-1
1
May-1
1
Jun-1
1
Jul-1
1
Aug-1
1
Sep-1
1
Oct-1
1
Nov-1
1
Dec-1
1
Jan-1
2
Feb-1
2
Mar-1
2
Apr-1
2
May-1
2
Jun-1
2
Jul-1
2
Aug-1
2
Sep-1
2
Oct-1
2
Nov-1
2
Dec-1
2
Target price (KRW) Closing Price (KRW)
Share price and Daiwa recommendation trend

2013 Outlook for Asia 4 January 2013
- 129 -
Hyundai Motor: share price and Daiwa recommendation trend
Source: Daiwa
Hana Financial Group: share price and Daiwa recommendation trend
Source: Daiwa
Date Target price Rating Date Target price Rating Date Target price Rating19/04/10 150,000 Outperform 15/11/10 230,000 Outperform 09/04/12 330,000 Buy22/04/10 160,000 Outperform 27/04/11 300,000 Buy 08/10/12 310,000 Buy14/05/10 180,000 Outperform 28/07/11 330,000 Buy20/10/10 200,000 Outperform 05/01/12 300,000 Buy
142,000145,000 150,000160,000
180,000200,000
230,000
300,000
330,000
300,000
330,000310,000
100,000
150,000
200,000
250,000
300,000
350,000
Jan-1
0
Feb-1
0
Mar-1
0
Apr-1
0
May-1
0
Jun-1
0
Jul-1
0
Aug-1
0
Sep-1
0
Oct-1
0
Nov-1
0
Dec-1
0
Jan-1
1
Feb-1
1
Mar-1
1
Apr-1
1
May-1
1
Jun-1
1
Jul-1
1
Aug-1
1
Sep-1
1
Oct-1
1
Nov-1
1
Dec-1
1
Jan-1
2
Feb-1
2
Mar-1
2
Apr-1
2
May-1
2
Jun-1
2
Jul-1
2
Aug-1
2
Sep-1
2
Oct-1
2
Nov-1
2
Dec-1
2
Target price (KRW) Closing Price (KRW)
Date Target price Rating Date Target price Rating Date Target price Rating01/04/10 42,900 Outperform 18/10/10 45,500 Outperform 17/06/11 42,700 Outperform16/04/10 45,800 Outperform 20/10/10 40,500 Outperform 13/10/11 54,300 Buy15/07/10 46,800 Outperform 13/12/10 47,000 Outperform27/08/10 39,100 Outperform 07/02/11 57,300 Buy
41,20043,400 42,900
45,800 46,800
39,100
45,500
40,500
47,000
57,300
42,700
54,300
25,000
30,000
35,000
40,000
45,000
50,000
55,000
60,000
Jan-1
0
Feb-1
0
Mar-1
0
Apr-1
0
May-1
0
Jun-1
0
Jul-1
0
Aug-1
0
Sep-1
0
Oct-1
0
Nov-1
0
Dec-1
0
Jan-1
1
Feb-1
1
Mar-1
1
Apr-1
1
May-1
1
Jun-1
1
Jul-1
1
Aug-1
1
Sep-1
1
Oct-1
1
Nov-1
1
Dec-1
1
Jan-1
2
Feb-1
2
Mar-1
2
Apr-1
2
May-1
2
Jun-1
2
Jul-1
2
Aug-1
2
Sep-1
2
Oct-1
2
Nov-1
2
Dec-1
2
Target price (KRW) Closing Price (KRW)

2013 Outlook for Asia 4 January 2013
- 130 -
Paradise: share price and Daiwa recommendation trend
Source: Daiwa
Samsung C&T: share price and Daiwa recommendation trend
Source: Daiwa
Date Target price Rating Date Target price Rating Date Target price Rating21/09/12 21,500 Buy 02/11/12 24,000 Buy 08/12/12 22,000 Buy
21,500
24,00022,000
0
5,000
10,000
15,000
20,000
25,000
Jan-1
0
Feb-1
0
Mar-1
0
Apr-1
0
May-1
0
Jun-1
0
Jul-1
0
Aug-1
0
Sep-1
0
Oct-1
0
Nov-1
0
Dec-1
0
Jan-1
1
Feb-1
1
Mar-1
1
Apr-1
1
May-1
1
Jun-1
1
Jul-1
1
Aug-1
1
Sep-1
1
Oct-1
1
Nov-1
1
Dec-1
1
Jan-1
2
Feb-1
2
Mar-1
2
Apr-1
2
May-1
2
Jun-1
2
Jul-1
2
Aug-1
2
Sep-1
2
Oct-1
2
Nov-1
2
Dec-1
2
Target price (KRW) Closing Price (KRW)
Date Target price Rating Date Target price Rating Date Target price Rating08/07/10 65,000 Outperform 18/02/11 80,000 Outperform 25/10/11 80,000 Outperform28/10/10 77,000 Outperform 29/04/11 90,000 Outperform 12/03/12 85,000 Outperform25/01/11 90,000 Outperform 14/07/11 100,000 Outperform 12/06/12 73,000 Outperform
51,000
75,000
65,000
77,000
90,000
80,000
90,000
100,000
80,00085,000
73,000
40,000
50,000
60,000
70,000
80,000
90,000
100,000
Jan-1
0
Feb-1
0
Mar-1
0
Apr-1
0
May-1
0
Jun-1
0
Jul-1
0
Aug-1
0
Sep-1
0
Oct-1
0
Nov-1
0
Dec-1
0
Jan-1
1
Feb-1
1
Mar-1
1
Apr-1
1
May-1
1
Jun-1
1
Jul-1
1
Aug-1
1
Sep-1
1
Oct-1
1
Nov-1
1
Dec-1
1
Jan-1
2
Feb-1
2
Mar-1
2
Apr-1
2
May-1
2
Jun-1
2
Jul-1
2
Aug-1
2
Sep-1
2
Oct-1
2
Nov-1
2
Dec-1
2
Target price (KRW) Closing Price (KRW)

2013 Outlook for Asia 4 January 2013
- 131 -
Daum Communications: share price and Daiwa recommendation trend
Source: Daiwa
Doosan Corp: share price and Daiwa recommendation trend
Source: Daiwa
Date Target price Rating Date Target price Rating Date Target price Rating11/02/10 91,000 Outperform 20/05/11 123,000 Outperform 10/04/12 131,000 Outperform03/05/10 94,000 Outperform 09/06/11 133,000 Outperform 30/05/12 131,000 Buy04/08/10 98,000 Outperform 12/08/11 144,000 Outperform 09/11/12 125,000 Buy15/02/11 107,000 Outperform 01/11/11 154,000 Outperform 11/12/12 120,000 Buy11/04/11 121,000 Outperform 14/02/12 141,000 Outperform
62,000
89,50091,000 94,00098,000
107,000
121,000123,000
133,000
144,000
154,000
141,000
131,000125,000120,000
60,000
70,000
80,000
90,000
100,000
110,000
120,000
130,000
140,000
150,000
160,000
Jan-1
0
Feb-1
0
Mar-1
0
Apr-1
0
May-1
0
Jun-1
0
Jul-1
0
Aug-1
0
Sep-1
0
Oct-1
0
Nov-1
0
Dec-1
0
Jan-1
1
Feb-1
1
Mar-1
1
Apr-1
1
May-1
1
Jun-1
1
Jul-1
1
Aug-1
1
Sep-1
1
Oct-1
1
Nov-1
1
Dec-1
1
Jan-1
2
Feb-1
2
Mar-1
2
Apr-1
2
May-1
2
Jun-1
2
Jul-1
2
Aug-1
2
Sep-1
2
Oct-1
2
Nov-1
2
Dec-1
2
Target price (KRW) Closing Price (KRW)
Date Target price Rating Date Target price Rating Date Target price Rating13/04/10 170,000 Buy 06/01/11 197,000 Buy 08/03/12 220,000 Buy03/05/10 150,000 Buy 15/09/11 172,000 Buy 27/07/12 180,000 Buy29/09/10 179,000 Buy 16/02/12 200,000 Buy 26/10/12 150,000 Buy
95,000
120,000
170,000
150,000
179,000
197,000
172,000
200,000
220,000
180,000
150,000
80,000
100,000
120,000
140,000
160,000
180,000
200,000
220,000
Jan-1
0
Feb-1
0
Mar-1
0
Apr-1
0
May-1
0
Jun-1
0
Jul-1
0
Aug-1
0
Sep-1
0
Oct-1
0
Nov-1
0
Dec-1
0
Jan-1
1
Feb-1
1
Mar-1
1
Apr-1
1
May-1
1
Jun-1
1
Jul-1
1
Aug-1
1
Sep-1
1
Oct-1
1
Nov-1
1
Dec-1
1
Jan-1
2
Feb-1
2
Mar-1
2
Apr-1
2
May-1
2
Jun-1
2
Jul-1
2
Aug-1
2
Sep-1
2
Oct-1
2
Nov-1
2
Dec-1
2
Target price (KRW) Closing Price (KRW)

2013 Outlook for Asia 4 January 2013
- 132 -
Samsung Heavy Industries: share price and Daiwa recommendation trend
Source: Daiwa
SK Telecom: share price and Daiwa recommendation trend
Source: Daiwa
Date Target price Rating Date Target price Rating Date Target price Rating14/04/10 24,000 Hold 25/01/11 50,000 Outperform 02/02/12 42,000 Outperform29/09/10 34,000 Outperform 07/07/11 55,000 Outperform 14/03/12 48,000 Outperform03/11/10 38,000 Outperform 25/08/11 40,000 Outperform 13/08/12 45,000 Outperform20/12/10 45,000 Outperform 01/11/11 36,000 Outperform 01/11/12 45,000 Buy
27,000
21,00024,000
34,000
38,000
45,000
50,000
55,000
40,000
36,000
42,000
48,00045,000
20,000
25,000
30,000
35,000
40,000
45,000
50,000
55,000
Jan-1
0
Feb-1
0
Mar-1
0
Apr-1
0
May-1
0
Jun-1
0
Jul-1
0
Aug-1
0
Sep-1
0
Oct-1
0
Nov-1
0
Dec-1
0
Jan-1
1
Feb-1
1
Mar-1
1
Apr-1
1
May-1
1
Jun-1
1
Jul-1
1
Aug-1
1
Sep-1
1
Oct-1
1
Nov-1
1
Dec-1
1
Jan-1
2
Feb-1
2
Mar-1
2
Apr-1
2
May-1
2
Jun-1
2
Jul-1
2
Aug-1
2
Sep-1
2
Oct-1
2
Nov-1
2
Dec-1
2
Target price (KRW) Closing Price (KRW)
Date Target price Rating Date Target price Rating Date Target price Rating01/04/10 176,000 Hold 08/06/11 173,000 Hold 02/05/12 145,000 Hold14/03/11 171,000 Hold 08/07/11 162,500 Hold 02/08/12 160,000 Outperform04/05/11 175,000 Hold 02/02/12 150,000 Hold 06/11/12 180,000 Outperform
160,167162,877
176,000171,000
175,000173,000
162,500
150,000145,000
160,000
180,000
120,000
130,000
140,000
150,000
160,000
170,000
180,000
Jan-1
0
Feb-1
0
Mar-1
0
Apr-1
0
May-1
0
Jun-1
0
Jul-1
0
Aug-1
0
Sep-1
0
Oct-1
0
Nov-1
0
Dec-1
0
Jan-1
1
Feb-1
1
Mar-1
1
Apr-1
1
May-1
1
Jun-1
1
Jul-1
1
Aug-1
1
Sep-1
1
Oct-1
1
Nov-1
1
Dec-1
1
Jan-1
2
Feb-1
2
Mar-1
2
Apr-1
2
May-1
2
Jun-1
2
Jul-1
2
Aug-1
2
Sep-1
2
Oct-1
2
Nov-1
2
Dec-1
2
Target price (KRW) Closing Price (KRW)

2013 Outlook for Asia 4 January 2013
- 133 -
KEPCO: share price and Daiwa recommendation trend
Source: Daiwa
Date Target price Rating Date Target price Rating Date Target price Rating20/04/12 20,000 Underperform 10/08/12 26,000 Outperform 17/12/12 34,000 Outperform27/06/12 30,000 Outperform 05/10/12 31,000 Outperform
20,000
30,000
26,000
31,000
34,000
15,000
20,000
25,000
30,000
35,000
40,000
45,000
Jan-1
0
Feb-1
0
Mar-1
0
Apr-1
0
May-1
0
Jun-1
0
Jul-1
0
Aug-1
0
Sep-1
0
Oct-1
0
Nov-1
0
Dec-1
0
Jan-1
1
Feb-1
1
Mar-1
1
Apr-1
1
May-1
1
Jun-1
1
Jul-1
1
Aug-1
1
Sep-1
1
Oct-1
1
Nov-1
1
Dec-1
1
Jan-1
2
Feb-1
2
Mar-1
2
Apr-1
2
May-1
2
Jun-1
2
Jul-1
2
Aug-1
2
Sep-1
2
Oct-1
2
Nov-1
2
Dec-1
2
Target price (KRW) Closing Price (KRW)

2013 Outlook for Asia 4 January 2013
- 134 -
Daiwa’s Asia Pacific Research Directory
HONG KONG Nagahisa MIYABE (852) 2848 4971 [email protected] Regional Research Head
Hiroaki KATO (852) 2532 4121 [email protected] Regional Research Co-head
John HETHERINGTON (852) 2773 8787 [email protected] Regional Deputy Head of Asia Pacific Research; Regional Head of Product Management
Pranab Kumar SARMAH (852) 2848 4441 [email protected] Regional Head of Research Promotion
Mingchun SUN (852) 2773 8751 [email protected] Head of China Research; Chief Economist (Regional)
Dave DAI (852) 2848 4068 [email protected] Deputy Head of Hong Kong and China Research; Pan-Asia/Regional Head of Clean Energy and Utilities; Utilities; Power Equipment; Renewables (Hong Kong, China)
Kevin LAI (852) 2848 4926 [email protected] Deputy Head of Regional Economics; Macro Economics (Regional)
Chi SUN (852) 2848 4427 [email protected] Macro Economics (China)
Jonas KAN (852) 2848 4439 [email protected] Head of Hong Kong Research; Head of Hong Kong and China Property; Regional Property Coordinator; Property Developers (Hong Kong)
Jeff CHUNG (852) 2773 8783 [email protected] Automobiles and Components (China)
Grace WU (852) 2532 4383 [email protected] Head of Greater China FIG; Banking (Hong Kong, China)
Jerry YANG (852) 2773 8842 [email protected] Banking/Diversified Financials (Taiwan)
Leon QI (852) 2532 4381 [email protected] Banking (Hong Kong, China)
Joseph HO (852) 2848 4443 [email protected] Head of Industrials and Machineries (Hong Kong, China); Capital Goods –Electronics Equipments and Machinery (Hong Kong, China)
Bing ZHOU (852) 2773 8782 [email protected] Consumer/Retail (Hong Kong, China); Hotels, Restaurants and Leisure - Casinos and Gaming (Hong Kong, Macau)
Eric CHEN (852) 2773 8702 [email protected] Pan-Asia/Regional Head of IT/Electronics; Semiconductor/IC Design (Regional)
Felix LAM (852) 2532 4341 [email protected] Head of Materials (Hong Kong, China); Cement and Building Materials (China, Taiwan); Property (China)
John CHOI (852) 2773 8730 [email protected] Head of Multi-Industries (Hong Kong, China); Small/Mid Cap (Regional); Internet (China)
Kelvin LAU (852) 2848 4467 [email protected] Head of Transportation (Hong Kong, China); Hong Kong and China Research Coordinator; Transportation (Regional)
Jibo MA (852) 2848 4489 [email protected] Head of Custom Products Group; Custom Products Group
Thomas HO (852) 2773 8716 [email protected] Custom Products Group
PHILIPPINES Rommel RODRIGO (63) 2 813 7344
ext 302 [email protected]
Head of Philippines Research; Strategy; Capital Goods; Materials
Danielo PICACHE (63) 2 813 7344 ext 293
Property; Banking; Transportation – Port
SOUTH KOREA Chang H LEE (82) 2 787 9177 [email protected] Head of Korea Research; Strategy; Banking/Finance
Sung Yop CHUNG (82) 2 787 9157 [email protected] Pan-Asia Co-head/Regional Head of Automobiles and Components; Automobiles; Shipbuilding; Steel
Anderson CHA (82) 2 787 9185 [email protected] Banking/Finance
Mike OH (82) 2 787 9179 [email protected] Capital Goods (Construction and Machinery)
Sang Hee PARK (82) 2 787 9165 [email protected] Consumer/Retail
Jae H LEE (82) 2 787 9173 [email protected] IT/Electronics (Tech Hardware and Memory Chips)
Thomas Y KWON (82) 2 787 9181 [email protected] Pan-Asia Head of Internet & Telecommunications; Software (Korea) – Internet/On-line Game
TAIWAN
Mark CHANG (886) 2 8758 6245 [email protected] Head of Research; Regional Head of Small/Medium Cap; Small/Medium Cap (Regional)
Birdy LU (886) 2 8758 6248 [email protected] IT/Technology Hardware (Handsets and Components)
Christine WANG (886) 2 8758 6249 [email protected] IT/Technology Hardware (PC Hardware)
Chris LIN (886) 2 8758 6251 [email protected] IT/Technology Hardware (Panels)
INDIA
Punit SRIVASTAVA (91) 22 6622 1013 [email protected] Head of Research; Strategy; Banking/Finance
Navin MATTA (91) 22 6622 8411 [email protected] Automobiles and Components
Saurabh MEHTA (91) 22 6622 1009 [email protected] Capital Goods; Utilities
Mihir SHAH (91) 22 6622 1020 [email protected] FMCG/Consumer
Deepak PODDAR (91) 22 6622 1016 [email protected]
Materials
Nirmal RAGHAVAN (91) 22 6622 1018 [email protected] Oil and Gas; Utilities
SINGAPORE Adrian LOH (65) 6499 6548 [email protected] Head of Singapore Research, Regional Head of Oil and Gas; Oil and Gas (ASEAN and China); Capital Goods (Singapore)
Srikanth VADLAMANI (65) 6499 6570 [email protected] Banking (ASEAN)
David LUM (65) 6329 2102 [email protected] Property and REITs
Ramakrishna MARUVADA (65) 6499 6543 [email protected] Head of ASEAN & India Telecommunications; Telecommunications (ASEAN & India)

2013 Outlook for Asia 4 January 2013
- 135 -
Daiwa’s Offices
Office / Branch / Affiliate Address Tel Fax
DAIWA SECURITIES GROUP INC
HEAD OFFICE Gran Tokyo North Tower, 1-9-1, Marunouchi, Chiyoda-ku, Tokyo, 100-6753 (81) 3 5555 3111 (81) 3 5555 0661
Daiwa Securities Trust Company One Evertrust Plaza, Jersey City, NJ 07302, U.S.A. (1) 201 333 7300 (1) 201 333 7726
Daiwa Securities Trust and Banking (Europe) PLC (Head Office) 5 King William Street, London EC4N 7JB, United Kingdom (44) 207 320 8000 (44) 207 410 0129
Daiwa Europe Trustees (Ireland) Ltd Level 3, Block 5, Harcourt Centre, Harcourt Road, Dublin 2, Ireland (353) 1 603 9900 (353) 1 478 3469
Daiwa Capital Markets America Inc Financial Square, 32 Old Slip, New York, NY10005, U.S.A. (1) 212 612 7000 (1) 212 612 7100
Daiwa Capital Markets America Inc. San Francisco Branch 555 California Street, Suite 3360, San Francisco, CA 94104, U.S.A. (1) 415 955 8100 (1) 415 956 1935
Daiwa Capital Markets Europe Limited 5 King William Street, London EC4N 7AX, United Kingdom (44) 20 7597 8000 (44) 20 7597 8600
Daiwa Capital Markets Europe Limited, Frankfurt Branch Trianon Building, Mainzer Landstrasse 16, 60325 Frankfurt am Main, Federal Republic of Germany
(49) 69 717 080 (49) 69 723 340
Daiwa Capital Markets Europe Limited, Paris Representative Office 36, rue de Naples, 75008 Paris, France (33) 1 56 262 200 (33) 1 47 550 808
Daiwa Capital Markets Europe Limited, London, Geneva Branch 50 rue du Rhône, P.O.Box 3198, 1211 Geneva 3, Switzerland (41) 22 818 7400 (41) 22 818 7441
Daiwa Capital Markets Europe Limited, Moscow Representative Office
Midland Plaza 7th Floor, 10 Arbat Street, Moscow 119002, Russian Federation
(7) 495 641 3416 (7) 495 775 6238
Daiwa Capital Markets Europe Limited, Bahrain Branch 7th Floor, The Tower, Bahrain Commercial Complex, P.O. Box 30069, Manama, Bahrain
(973) 17 534 452 (973) 17 535 113
Daiwa Capital Markets Hong Kong Limited Level 28, One Pacific Place, 88 Queensway, Hong Kong (852) 2525 0121 (852) 2845 1621
Daiwa Capital Markets Singapore Limited 6 Shenton Way #26-08, DBS Building Tower Two, Singapore 068809, Republic of Singapore
(65) 6220 3666 (65) 6223 6198
Daiwa Capital Markets Australia Limited Level 34, Rialto North Tower, 525 Collins Street, Melbourne, Victoria 3000, Australia
(61) 3 9916 1300 (61) 3 9916 1330
DBP-Daiwa Capital Markets Philippines, Inc 18th Floor, Citibank Tower, 8741 Paseo de Roxas, Salcedo Village, Makati City, Republic of the Philippines
(632) 813 7344 (632) 848 0105
Daiwa-Cathay Capital Markets Co Ltd 14/F, 200, Keelung Road, Sec 1, Taipei, Taiwan, R.O.C. (886) 2 2723 9698 (886) 2 2345 3638
Daiwa Securities Capital Markets Korea Co., Ltd. One IFC, 10 Gukjegeumyung-Ro, Yeouido-dong, Yeongdeungpo-gu, Seoul, 150-876, Korea
(82) 2 787 9100 (82) 2 787 9191
Daiwa Securities Capital Markets Co Ltd, Beijing Representative Office
Room 3503/3504, SK Tower, No.6 Jia Jianguomen Wai Avenue, Chaoyang District, Beijing 100022, People’s Republic of China
(86) 10 6500 6688 (86) 10 6500 3594
Daiwa SSC Securities Co Ltd 45/F, Hang Seng Tower, 1000 Lujiazui Ring Road, Pudong, Shanghai 200120, People’s Republic of China
(86) 21 3858 2000 (86) 21 3858 2111
Daiwa Securities Capital Markets Co. Ltd, Bangkok Representative Office
18th Floor, M Thai Tower, All Seasons Place, 87 Wireless Road, Lumpini, Pathumwan, Bangkok 10330, Thailand
(66) 2 252 5650 (66) 2 252 5665
Daiwa Capital Markets India Private Ltd 10th Floor, 3 North Avenue, Maker Maxity, Bandra Kurla Complex, Bandra East, Mumbai – 400051, India
(91) 22 6622 1000 (91) 22 6622 1019
Daiwa Securities Capital Markets Co. Ltd, Hanoi Representative Office
Suite 405, Pacific Palace Building, 83B, Ly Thuong Kiet Street, Hoan Kiem Dist. Hanoi, Vietnam
(84) 4 3946 0460 (84) 4 3946 0461
DAIWA INSTITUTE OF RESEARCH LTD
HEAD OFFICE 15-6, Fuyuki, Koto-ku, Tokyo, 135-8460, Japan (81) 3 5620 5100 (81) 3 5620 5603
MARUNOUCHI OFFICE Gran Tokyo North Tower, 1-9-1, Marunouchi, Chiyoda-ku, Tokyo, 100-6756 (81) 3 5555 7011 (81) 3 5202 2021
New York Research Center 11th Floor, Financial Square, 32 Old Slip, NY, NY 10005-3504, U.S.A. (1) 212 612 6100 (1) 212 612 8417
London Research Centre 3/F, 5 King William Street, London, EC4N 7AX, United Kingdom (44) 207 597 8000 (44) 207 597 8550

2013 Outlook for Asia 4 January 2013
- 136 -
Disclaimer This publication is produced by Daiwa Securities Group Inc. and/or its non-U.S. affiliates, and distributed by Daiwa Securities Group Inc. and/or its non-U.S. affiliates, except to the extent expressly provided herein. This publication and the contents hereof are intended for information purposes only, and may be subject to change without further notice. Any use, disclosure, distribution, dissemination, copying, printing or reliance on this publication for any other purpose without our prior consent or approval is strictly prohibited. Neither Daiwa Securities Group Inc. nor any of its respective parent, holding, subsidiaries or affiliates, nor any of its respective directors, officers, servants and employees, represent nor warrant the accuracy or completeness of the information contained herein or as to the existence of other facts which might be significant, and will not accept any responsibility or liability whatsoever for any use of or reliance upon this publication or any of the contents hereof. Neither this publication, nor any content hereof, constitute, or are to be construed as, an offer or solicitation of an offer to buy or sell any of the securities or investments mentioned herein in any country or jurisdiction nor, unless expressly provided, any recommendation or investment opinion or advice. Any view, recommendation, opinion or advice expressed in this publication may not necessarily reflect those of Daiwa Securities Capital Markets Co. Ltd., and/or its affiliates nor any of its respective directors, officers, servants and employees except where the publication states otherwise. This research report is not to be relied upon by any person in making any investment decision or otherwise advising with respect to, or dealing in, the securities mentioned, as it does not take into account the specific investment objectives, financial situation and particular needs of any person.
Daiwa Securities Group Inc., its subsidiaries or affiliates, or its or their respective directors, officers and employees from time to time have trades as principals, or have positions in, or have other interests in the securities of the company under research including derivatives in respect of such securities or may have also performed investment banking and other services for the issuer of such securities. The following are additional disclosures.
Japan
Daiwa Securities Co. Ltd. and Daiwa Securities Group Inc. Daiwa Securities Co. Ltd. is a subsidiary of Daiwa Securities Group Inc. Investment Banking Relationship
Within the preceding 12 months, The subsidiaries and/or affiliates of Daiwa Securities Group Inc. * has lead-managed public offerings and/or secondary offerings (excluding straight bonds) of the securities of the following companies: Rexlot Holdings Limited (555 HK); China Outfitters Holdings Limited (1146 HK); Beijing Jingneng Clean Energy Co. Limited (579 HK); Infraware Inc. (041020 KS); Jiangnan Group Limited (1366 HK); Huadian Fuxin Energy Corporation Limited (816 HK).
*Subsidiaries of Daiwa Securities Group Inc. for the purposes of this section shall mean any one or more of: Daiwa Capital Markets Hong Kong Limited, Daiwa Capital Markets Singapore Limited, Daiwa Capital Markets Australia Limited, Daiwa Capital Markets India Private Limited, Daiwa-Cathay Capital Markets Co., Ltd., Daiwa Securities Capital Markets Korea Co., Ltd.
Hong Kong
This research is distributed in Hong Kong by Daiwa Capital Markets Hong Kong Limited (“DHK”) which is regulated by the Hong Kong Securities and Futures Commission. Recipients of this research in Hong Kong may contact DHK in respect of any matter arising from or in connection with this research. Ownership of Securities For “Ownership of Securities” information, please visit BlueMatrix disclosure Link at https://daiwa3.bluematrix.com/sellside/Disclosures.action. Investment Banking Relationship For “Investment Banking Relationship”, please visit BlueMatrix disclosure Link at https://daiwa3.bluematrix.com/sellside/Disclosures.action. Relevant Relationship (DHK) DHK may from time to time have an individual employed by or associated with it serves as an officer of any of the companies under its research coverage. DHK market making DHK may from time to time make a market in securities covered by this research.
Korea
The developing analyst of this research and analysis material hereby states and confirms that the contents of this material correctly reflect the analyst’s views and opinions and that the analyst has not been placed under inappropriate pressure or interruption by an external party. Name of Analyst : Chang H Lee; Sung Yop Chung; Anderson Cha; Mike Oh; Sang Hee Park; Jae H Lee; Thomas Y Kwon; Francis Kim Disclosure of Analysts’ Interests If an analyst engaging in or a person who exercises influences on the preparation or publication of a Research Report containing recommendations for general investors to trade financial investment instruments with regard to which the analyst or the influential person has personal interests and if the recommendations contained in the Report may have impacts on the personal interests, Daiwa Securities Capital Markets Korea Co., Ltd.(“Daiwa Securities Korea”)shall ensure that the Analyst or the influential person notifies that he/she has personal interests with regard to: 1. The equity, the equity-linked bonds and the instruments with the subscription right to the equity issued by the legal entity covered in the Research Report (or the legal entity subject to the
investment recommendations); 2. The stock option granted by the legal entity covered in the Research Report (or the legal entity subject to the investment recommendations); or 3. The equity futures, the equity options and the equity-linked warrants backed by the equity prescribed in the preceding Paragraph 1 as the underlying assets. Legal Entities subject to Research Report Coverage Restrictions Daiwa Securities Korea hereby states and confirms that Daiwa Securities Korea has no conflicts of interests with the legal entity covered in this Research Report: 1. In that Daiwa Securities Korea does NOT offer direct or indirect payment guarantee for the legal entity by means of, for instance, guarantee, endorsement, provision of collaterals or the
acquisition of debts; 2. In that Daiwa Securities Korea does NOT own one-hundredth (or 1/100) or more of the total number of outstanding equities issued by the legal entity; 3. In that The legal entity is NOT an affiliated company of Daiwa Securities Korea pursuant to Sub-paragraph 3, Article 2 of the Monopoly Regulation and Fair Trade Act of Korea; 4. In that, although Daiwa Securities Korea offers advisory services for the legal entity with regard to an M&A deal, the size of the M&A deal does NOT exceed five-hundredths (or 5/100) of
the total asset size or the total number of equities issued and outstanding of the legal entity; 5. In that, although Daiwa Securities Korea acted in the capacity of a Lead Underwriter for the initial public offering of the legal entity, more than one-year has passed since the IPO date; 6. In that Daiwa Securities Korea is NOT designated by the legal entity as the ‘tender offer agent’ pursuant to the Paragraph 2, Article 133 of the Financial Services and Capital Market Act or
the legal entity is NOT the issuer of the equity subject to the proposed tender offer; this requirement, however applies until the maturity of the tender offer period; or 7. In that Daiwa Securities Korea does NOT have significant or material interests with regard to the legal entity. Disclosure of Prior Distribution to Third Party This report has not been distributed to the third party in advance prior to public release. The following explains the rating system in the report as compared to KOSPI, based on the beliefs of the author(s) of this report. "1": the security could outperform the KOSPI by more than 15% over the next six months. "2": the security is expected to outperform the KOSPI by 5-15% over the next six months. "3": the security is expected to perform within 5% of the KOSPI (better or worse) over the next six months. "4": the security is expected to underperform the KOSPI by 5-15% over the next six months. "5": the security could underperform the KOSPI by more than 15% over the next six months. “Positive” means that the analyst expects the sector to outperform the KOSPI over the next six months. “Neutral” means that the analyst expects the sector to be in-line with the KOSPI over the next six months “Negative” means that the analyst expects the sector to underperform the KOSPI over the next six months Additional information may be available upon request.
Singapore
This research is distributed in Singapore by Daiwa Capital Markets Singapore Limited and it may only be distributed in Singapore to accredited investors, expert investors and institutional investors as defined in the Financial Advisers Regulations and the Securities and Futures Act (Chapter 289), as amended from time to time. By virtue of distribution to these category of investors, Daiwa Capital Markets Singapore Limited and its representatives are not required to comply with Section 36 of the Financial Advisers Act (Chapter 110) (Section 36 relates to disclosure of Daiwa Capital Markets Singapore Limited’s interest and/or its representative’s interest in securities). Recipients of this research in Singapore may contact Daiwa Capital Markets Singapore Limited in respect of any matter arising from or in connection with the research.

2013 Outlook for Asia 4 January 2013
- 137 -
Australia
This research is distributed in Australia by Daiwa Capital Markets Stockbroking Limited and it may only be distributed in Australia to wholesale investors within the meaning of the Corporations Act. Recipients of this research in Australia may contact Daiwa Capital Markets Stockbroking Limited in respect of any matter arising from or in connection with the research. Ownership of Securities For “Ownership of Securities” information, please visit BlueMatrix disclosure Link at https://daiwa3.bluematrix.com/sellside/Disclosures.action.
India
This research is distributed by Daiwa Capital Markets India Private Limited (DAIWA) which is an intermediary registered with Securities & Exchange Board of India. This report is not to be considered as an offer or solicitation for any dealings in securities. While the information in this report has been compiled by DAIWA in good faith from sources believed to be reliable, no representation or warranty, express of implied, is made or given as to its accuracy, completeness or correctness. DAIWA its officers, employees, representatives and agents accept no liability whatsoever for any loss or damage whether direct, indirect, consequential or otherwise howsoever arising (whether in negligence or otherwise) out of or in connection with or from any use of or reliance on the contents of and/or omissions from this document. Consequently DAIWA expressly disclaims any and all liability for, or based on or relating to any such information contained in or errors in or omissions in this report. Accordingly, you are recommended to seek your own legal, tax or other advice and should rely solely on your own judgment, review and analysis, in evaluating the information in this document. The data contained in this document is subject to change without any prior notice DAIWA reserves its right to modify this report as maybe required from time to time. DAIWA is committed to providing independent recommendations to its Clients and would be happy to provide any information in response to any query from its Clients. This report is strictly confidential and is being furnished to you solely for your information. The information contained in this document should not be reproduced (in whole or in part) or redistributed in any form to any other person. We and our group companies, affiliates, officers, directors and employees may from time to time, have long or short positions, in and buy sell the securities thereof, of company(ies) mentioned herein or be engaged in any other transactions involving such securities and earn brokerage or other compensation or act as advisor or have the potential conflict of interest with respect to any recommendation and related information or opinion. DAIWA prohibits its analyst and their family members from maintaining a financial interest in the securities or derivatives of any companies that the analyst cover. This report is not intended or directed for distribution to, or use by any person, citizen or entity which is resident or located in any state or country or jurisdiction where such publication, distribution or use would be contrary to any statutory legislation, or regulation which would require DAIWA and its affiliates/ group companies to any registration or licensing requirements. The views expressed in the report accurately reflect the analyst’s personal views about the securities and issuers that are subject of the Report, and that no part of the analyst’s compensation was, is or will be directly or indirectly, related to the recommendations or views expressed in the Report. This report does not recommend to US recipients the use of Daiwa Capital Markets India Private Limited or any of its non – US affiliates to effect trades in any securities and is not supplied with any understanding that US recipients will direct commission business to Daiwa Capital Markets India Private Limited.
Taiwan
This research is distributed in Taiwan by Daiwa-Cathay Capital Markets Co., Ltd and it may only be distributed in Taiwan to institutional investors or specific investors who have signed recommendation contracts with Daiwa-Cathay Capital Markets Co., Ltd in accordance with the Operational Regulations Governing Securities Firms Recommending Trades in Securities to Customers. Recipients of this research in Taiwan may contact Daiwa-Cathay Capital Markets Co., Ltd in respect of any matter arising from or in connection with the research.
Philippines
This research is distributed in the Philippines by DBP-Daiwa Capital Markets Philippines, Inc. which is regulated by the Philippines Securities and Exchange Commission and the Philippines Stock Exchange, Inc. Recipients of this research in the Philippines may contact DBP-Daiwa Capital Markets Philippines, Inc. in respect of any matter arising from or in connection with the research. DBP-Daiwa Capital Markets Philippines, Inc. recommends that investors independently assess, with a professional advisor, the specific financial risks as well as the legal, regulatory, tax, accounting, and other consequences of a proposed transaction. DBP-Daiwa Capital Markets Philippines, Inc. may have positions or may be materially interested in the securities in any of the markets mentioned in the publication or may have performed other services for the issuers of such securities.
For relevant securities and trading rules please visit SEC and PSE Link at http://www.sec.gov.ph/irr/AmendedIRRfinalversion.pdf and http://www.pse.com.ph/ respectively.
United Kingdom
This research report is produced by Daiwa Securities Capital Markets Co., Ltd and/or its affiliates and is distributed by Daiwa Capital Markets Europe Limited in the European Union, Iceland, Liechtenstein, Norway and Switzerland. Daiwa Capital Markets Europe Limited is authorised and regulated by The Financial Services Authority (“FSA”) and is a member of the London Stock Exchange, Chi-X, Eurex and NYSE Liffe. Daiwa Capital Markets Europe Limited and its affiliates may, from time to time, to the extent permitted by law, participate or invest in other financing transactions with the issuers of the securities referred to herein (the “Securities”), perform services for or solicit business from such issuers, and/or have a position or effect transactions in the Securities or options thereof and/or may have acted as an underwriter during the past twelve months for the issuer of such securities. In addition, employees of Daiwa Capital Markets Europe Limited and its affiliates may have positions and effect transactions in such securities or options and may serve as Directors of such issuers. Daiwa Capital Markets Europe Limited may, to the extent permitted by applicable UK law and other applicable law or regulation, effect transactions in the Securities before this material is published to recipients.
This publication is intended for investors who are not Retail Clients in the United Kingdom within the meaning of the Rules of the FSA and should not therefore be distributed to such Retail Clients in the United Kingdom. Should you enter into investment business with Daiwa Capital Markets Europe’s affiliates outside the United Kingdom, we are obliged to advise that the protection afforded by the United Kingdom regulatory system may not apply; in particular, the benefits of the Financial Services Compensation Scheme may not be available.
Daiwa Capital Markets Europe Limited has in place organisational arrangements for the prevention and avoidance of conflicts of interest. Our conflict management policy is available at http://www.uk.daiwacm.com/about-us/corporate-governance-and-regulatory. Regulatory disclosures of investment banking relationships are available at https://daiwa3.bluematrix.com/sellside/Disclosures.action.
Germany
This document has been approved by Daiwa Capital Markets Europe Limited and is distributed in Germany by Daiwa Capital Markets Europe Limited, Niederlassung Frankfurt which is regulated by BaFin (Bundesanstalt fuer Finanzdienstleistungsaufsicht) for the conduct of business in Germany.
Bahrain
This research material is issued/compiled by Daiwa Capital Markets Europe Limited, Bahrain Branch, regulated by The Central Bank of Bahrain and holds Investment Business Firm – Category 2 license and having its official place of business at the Bahrain World Trade Centre, South Tower, 7th floor, P.O. Box 30069, Manama, Kingdom of Bahrain. Tel No. +973 17534452 Fax No. +973 535113
This material is provided as a reference for making investment decisions and is not intended to be a solicitation for investment. Investment decisions should be made at your own discretion and risk. Accordingly, no representation or warranty, express or implied, is made as to and no reliance should be placed on the fairness, accuracy, completeness or correctness of the information and opinions contained in this document, Content herein is based on information available at the time the research material was prepared and may be amended or otherwise changed in the future without notice. All information is intended for the private use of the person to whom it is provided without any liability whatsoever on the part of Daiwa Capital Markets Europe Limited, Bahrain Branch, any associated company or the employees thereof. If you are in doubt about the suitability of the product or the research material itself, please consult your own financial adviser. Daiwa Capital Markets Europe Limited, Bahrain Branch retains all rights related to the content of this material, which may not be redistributed or otherwise transmitted without prior consent.
United States
This report is distributed in the U.S. by Daiwa Capital Markets America Inc. (DCMA). It may not be accurate or complete and should not be relied upon as such. It reflects the preparer’s views at the time of its preparation, but may not reflect events occurring after its preparation; nor does it reflect DCMA’s views at any time. Neither DCMA nor the preparer has any obligation to update this report or to continue to prepare research on this subject. This report is not an offer to sell or the solicitation of any offer to buy securities. Unless this report says otherwise, any recommendation it makes is risky and appropriate only for sophisticated speculative investors able to incur significant losses. Readers should consult their financial advisors to determine whether any such recommendation is consistent with their own investment objectives, financial situation and needs. This report does not recommend to U.S. recipients the use of any of DCMA’s non-U.S. affiliates to effect trades in any security and is not supplied with any understanding that U.S. recipients of this report will direct commission business to such non-U.S. entities. Unless applicable law permits otherwise, non-U.S. customers wishing to effect a transaction in any securities referenced in this material should contact a Daiwa entity in their local jurisdiction. Most countries throughout the world have their own laws regulating the types of securities and other investment products which may be offered to their residents, as well as a process for doing so. As a result, the securities discussed in this report may not be eligible for sales in some jurisdictions. Customers wishing to obtain further information about this report should contact DCMA: Daiwa Capital Markets America Inc., Financial Square, 32 Old Slip, New York, New York 10005 (telephone 212-612-7000). Ownership of Securities For “Ownership of Securities” information please visit BlueMatrix disclosure Link at https://daiwa3.bluematrix.com/sellside/Disclosures.action. Investment Banking Relationships For “Investment Banking Relationships” please visit BlueMatrix disclosure link at https://daiwa3.bluematrix.com/sellside/Disclosures.action. DCMA Market Making For “DCMA Market Making” please visit BlueMatrix disclosure link at https://daiwa3.bluematrix.com/sellside/Disclosures.action.

2013 Outlook for Asia 4 January 2013
Research Analyst Conflicts For updates on “Research Analyst Conflicts” please visit BlueMatrix disclosure link at https://daiwa3.bluematrix.com/sellside/Disclosures.action. The principal research analysts who prepared this report have no financial interest in securities of the issuers covered in the report, are not (nor are any members of their household) an officer, director or advisory board member of the issuer(s) covered in the report, and are not aware of any material relevant conflict of interest involving the analyst or DCMA, and did not receive any compensation from the issuer during the past 12 months except as noted: no exceptions. Research Analyst Certification For updates on “Research Analyst Certification” and “Rating System” please visit BlueMatrix disclosure link at https://daiwa3.bluematrix.com/sellside/Disclosures.action. The views about any and all of the subject securities and issuers expressed in this Research Report accurately reflect the personal views of the research analyst(s) primarily responsible for this report (or the views of the firm producing the report if no individual analysts[s] is named on the report); and no part of the compensation of such analyst(s) (or no part of the compensation of the firm if no individual analyst[s)] is named on the report) was, is, or will be directly or indirectly related to the specific recommendations or views contained in this Research Report.
The following explains the rating system in the report as compared to relevant local indices, based on the beliefs of the author of the report. "1": the security could outperform the local index by more than 15% over the next six months. "2": the security is expected to outperform the local index by 5-15% over the next six months. "3": the security is expected to perform within 5% of the local index (better or worse) over the next six months. "4": the security is expected to underperform the local index by 5-15% over the next six months. "5": the security could underperform the local index by more than 15% over the next six months.
Additional information may be available upon request.
Japan - additional notification items pursuant to Article 37 of the Financial Instruments and Exchange Law (This Notification is only applicable where report is distributed by Daiwa Securities Co. Ltd.) If you decide to enter into a business arrangement with us based on the information described in materials presented along with this document, we ask you to pay close attention to the following items. • In addition to the purchase price of a financial instrument, we will collect a trading commission* for each transaction as agreed beforehand with you. Since commissions may be included in
the purchase price or may not be charged for certain transactions, we recommend that you confirm the commission for each transaction. • In some cases, we may also charge a maximum of ¥ 2 million (including tax) per year as a standing proxy fee for our deposit of your securities, if you are a non-resident of Japan. • For derivative and margin transactions etc., we may require collateral or margin requirements in accordance with an agreement made beforehand with you. Ordinarily in such cases, the
amount of the transaction will be in excess of the required collateral or margin requirements. • There is a risk that you will incur losses on your transactions due to changes in the market price of financial instruments based on fluctuations in interest rates, exchange rates, stock prices,
real estate prices, commodity prices, and others. In addition, depending on the content of the transaction, the loss could exceed the amount of the collateral or margin requirements. • There may be a difference between bid price etc. and ask price etc. of OTC derivatives handled by us. • Before engaging in any trading, please thoroughly confirm accounting and tax treatments regarding your trading in financial instruments with such experts as certified public accountants.
*The amount of the trading commission cannot be stated here in advance because it will be determined between our company and you based on current market conditions and the content of each transaction etc.
When making an actual transaction, please be sure to carefully read the materials presented to you prior to the execution of agreement, and to take responsibility for your own decisions regarding the signing of the agreement with us. Corporate Name: Daiwa Securities Co. Ltd. Financial instruments firm: chief of Kanto Local Finance Bureau (Kin-sho) No.108 Memberships: Japan Securities Dealers Association, The Financial Futures Association of Japan Japan Investment Advisers Association Type II Financial Instruments Firms Association