2012 Concurrency Management Report - Port Orange
41
2012 CONCURRENCY MANAGEMENT REPORT Prepared by the Department of Community Development November 2012
-
Upload
khangminh22 -
Category
Documents
-
view
0 -
download
0
Transcript of 2012 Concurrency Management Report - Port Orange

2012 CONCURRENCY MANAGEMENT
REPORT
Prepared by the Department of Community Development
November 2012

CONTENTS
I. EXECUTIVE SUMMARY 1 II. OVERVIEW OF CONCURRENCY MANAGEMENT 3 A. Public Facilities and Services Subject to Concurrency Review 3 B. Concurrency Administration 4 C. Exemptions from Concurrency 4 D. Vested Development 5 E. Adopted Level-of-Service Standards (LOS) 6 F. Capacity Reservations 6 G. Development Deferrals/Moratoria 7 III. CURRENT CAPACITIES AND LEVEL OF SERVICE 8 A. Roads/Traffic Circulation 8 B. Sanitary Sewer 19 C. Potable Water 23 D. Stormwater Drainage 28 E. Solid Waste Disposal 31 F. Recreation and Open Space 33 G. Schools 36 IV. SUMMARY AND CONCLUSIONS 38
This 2012 Concurrency Management Report was prepared by the Department of Community Development, with assistance from the Finance, Parks & Recreation, Public Utilities, and Public Works Departments and Volusia County Schools.

2012 Concurrency Management Report Page 1
I. EXECUTIVE SUMMARY Concurrency is the finding that public facilities and services necessary to support new development are available, or will be made available, by the time the impacts of development are expected to occur. As mandated by State law, all municipalities must conduct concurrency reviews on development proposals and make a finding of concurrency before any development orders or permits can be issued. Concurrency reviews evaluate a project's impact on the following seven public facilities and services:
Transportation Sanitary Sewer Potable Water
Stormwater Drainage Solid Waste Recreation
Public Schools
The concurrency management system for the City of Port Orange is established by policy in the City's Comprehensive Plan, and administered through regulations contained within the City's Land Development Code. The Department of Community Development is responsible for regularly monitoring the cumulative effect of all approved Development Orders and Development Permits on the capacity of public facilities. In addition to the individual concurrency reviews for current development proposals, this report, prepared annually, is intended to meet this obligation. From October 1, 2011 through September 30, 2012 the Community Development Department issued Development Orders that secured capacity reservations for 212,536 square feet of new non-residential space, and 0 residential units1.
In review of the City's position with respect to concurrency, the public facilities and services subject to concurrency review are at sufficient levels for FY 2012/2013.
Traffic: There are no roadways operating below the adopted Level-of-Service. Traffic volumes within the City have increased on some segments and decreased on other segments over the past year. Roads on the west side of I-95 will likely experience the most traffic growth in the future. Road improvements recently completed have increased capacities in the City. Some of the programmed improvements recently completed include: Dunlawton Ave./Village Tr. turn lane; Dunlawton Ave./I-95 Interchange turn lane; Dunlawton Ave./Spruce Creek Rd. turn lane; and the Clyde Morris Blvd./Willow Run Blvd. turn lane.
Sanitary Sewer and Potable Water: These systems continue to have capacity to support additional growth within the City. LOS for potable water will be monitored to ensure that permitted ground water withdrawal capacity per the Consumptive Use Permit, issued to the City by St. Johns River Water Management District, is not exceeded.
1 Residential units were constructed during FY 11/12; however, they were constructed in existing platted
lots. The residential concurrency review is conducted when new lots are proposed.

2012 Concurrency Management Report Page 2
Stormwater Drainage: The City continues to implement and design drainage improvements to improve the overall stormwater drainage system.
Solid Waste: Generation rates are within the adopted LOS standard. Solid waste generation rates have begun to slightly increase since 2011, but still below the peak in 2005.
Recreation and Open Space: The LOS is being met for all recreational facilities.
Public Schools: LOS is being met for all but one of the public schools located in the Port Orange area. Since 2011, Port Orange Elementary has exceeded the LOS standards; however, this is due to the gifted program offered at this school that draws students from outside the attendance boundary and not unplanned development. The school district will continue to monitor the capacity at this school.

2012 Concurrency Management Report Page 3
II. OVERVIEW OF CONCURRENCY MANAGEMENT Concurrency is the finding that public facilities and services necessary to support a proposed development are available, or will be made available concurrently with the impacts of a development. All Florida municipalities are required to adopt and implement concurrency management systems in accordance with State law. The concurrency management system for the City of Port Orange is established by policy in the City's Comprehensive Plan, and administered through regulations contained within the City's Land Development Code. Local level-of-service standards (LOS) for seven types of public facilities and services have been adopted as part of the Comprehensive Plan. During the subdivision or site plan review process, the City evaluates each proposed development for its anticipated impact on these facilities and services, and makes a finding of whether approval of the project would cause these facilities or services to drop below their adopted LOS. In general, no final Development Orders or permits may be issued for development until there is a finding that all public facilities and services included in the City's Concurrency Management System have sufficient capacity to accommodate the impacts of the development, or that improvements necessary to bring facilities up to their adopted LOS will be in place at the same time the impacts occur. Development Orders and permits include subdivision approval, site development plan approval, and the issuance of building permits.
Public Facilities and Services Subject to Concurrency Review
Concurrency review evaluates impacts on seven types of public facilities and services:
Transportation Sanitary Sewer Potable Water Solid Waste
Stormwater Drainage Recreation
Public Schools If the City's concurrency review reveals a proposed development will generate impacts that exceed available capacity, the City must secure a financial or other legally binding commitment to ensure that improvements necessary to correct the anticipated deficiency will be in place concurrent with the impacts of the proposed development. Should the City and/or the developer be unable to provide such assurances, the project must be denied. Projects denied due to a failure to meet concurrency requirements, but for which all other Land Development Code requirements have been met, can be placed on a prioritized list for approval of Development Orders once facility improvements have been made.

2012 Concurrency Management Report Page 4
Concurrency Administration
The Community Development (CD) Department is responsible for coordinating all concurrency reviews by City departments. Concurrency reviews are conducted as part of the development review process for site plans and residential subdivisions. The CD Department may also conduct non-binding concurrency reviews for developments in the pre-application or conceptual plan stage.
The CD Department is also responsible for monitoring the cumulative effect of all approved Development Orders and development permits on the capacity of public facilities. The annual Concurrency Management Report is intended to meet this obligation.
From October 1, 2011 through September 30, 2012, the CD Department conducted concurrency reviews for 9 non-residential projects. No residential projects were reviewed during this period. During this period, Development Orders were issued and capacity reservations were secured for a total of 212,536 square feet of new non-residential space and 0 residential units. As of September 30, 2012, there are 489,448 square feet of non-residential space and 986 residential units that remain vested but un-built from previous years (see Exhibit 1).
Exhibit 1: Active Development Orders through September 30, 2012:
Non-Residential square feet
New Reserved S.F., FY 11/12
Vested S.F., FY 10/11
Total Reserved and Vested S.F., FY’s 10-12
S.F. Constructed or Expired DO,
FY 11/12
Net Total Reserved and Vested S.F.,
FY 11/12
102,158 521,503 623,661 134,213 489,448
Residential number of units
New Reserved units, FY 11/12
Vested units, FY 10/11
Total Reserved and Vested units, FY’s 10-12
Units Constructed, FY
11/12
Net Total Reserved and Vested units,
FY 11/12
0 1,114 1,114 128 986
Exemptions from Concurrency
Three types of development are exempt from concurrency review. 1. Vested projects with valid development orders or permits prior to November 1, 1990. 2. Public facilities (see below). 3. For school concurrency, developments that do not increase the number of school-age
residents beyond de minimus levels.
Development Orders for projects which meet these criteria may be issued without a finding of concurrency. However, if the proposed development will impact a public facility for which a deferral or moratorium on development has been placed, then no development orders may be issued until the deficiency is corrected. Public facilities necessary to ensure the protection of the health, safety and general welfare of the citizens of Port Orange are exempt from concurrency review. This includes all public facility construction projects in the City’s Capital Improvements Program required to maintain adopted LOS standards. This means that new public facilities, such as fire stations, are not reviewed to determine whether they will generate impacts that may negatively affect the City’s level of service standards.

2012 Concurrency Management Report Page 5
In addition, developments in the Port Orange Town Center Transportation Concurrency Exception Area (TCEA) are exempt from the standard vehicular transportation concurrency review requirements of the LDC. The TCEA is intended to support the redevelopment objectives of the City by providing a multi-faceted strategy for maintaining acceptable overall mobility, while minimizing the need for major road improvements that would potentially alter the desired character of the Town Center. Development within the TCEA is required to comply with the mobility strategies identified by the City to ensure continued safety and efficiency of the transportation system and to mitigate the impacts of the proposed development. Little development has occurred in the area since the TCEA was adopted, and although the exemption exists, there are no transportation concurrency issues in the area.
Vested Development Development projects which had valid development orders or permits prior to the commencement of the City's concurrency regulations on November 1, 1990 are considered vested. This also includes all vacant single-family and two-family residential lots in subdivisions platted before that time. Lots and parcels which are vested for concurrency but have not yet been constructed or built out are considered reserved, meaning that the capacity has been reserved in the concurrency system to support their eventual construction. When completed and occupied, the vested and reserved residential development will add approximately 2,219 new citizens to Port Orange2. The current list of remaining vested development, as of September 30, 2012, is listed in Exhibit 2, along with the developments that have current Development Orders and capacity reservations.
2 Average household size is 2.25, per the 2010 Census. Previous census provided average household
size by housing unit type (i.e. single-family, multi-family, mobile home). As of the 2010 Census, this data is no longer provided.

2012 Concurrency Management Report Page 6
EXHIBIT 2: VESTED & RESERVED DEVELOPMENT (September 30, 2012) SINGLE FAMILY SUBDIVISION LOTSSUBDIVISION NUMBER LOTS Cambridge Acres 2 Carter Woods 2 Coquina Cove I 39 Countryside I-XII 2 Cross Creek I-II 1 Cypress Head I-II 1 Devonwood 1 Golden Pond Estates 1 Hidden Oaks at Spruce Creek 2 Ken Bern 1 Kingswood I-III 2 Northern Lites 4 Oakland Park I-III 1 Palms Del Mar 1 Pheasant Run West 1 Pinnacle I-II 68 Port Orange Landings II (Oakbrook) 137 Port Orange Plantation I-V 90 Reedy Creek Acres 1 Riverwood VIII 3 Rolling Hills Estates I-II 2 Royal Palm I-III 78 The Sanctuary on Spruce Creek I-III 9 Sawgrass Bluff 1 Sawgrass Point I-III 2 Skylake II-III 3 Sleepy Hollow II 1 Spruce Creek Woods 1 Spruce Estates 4 Sugar Forest III 1
SUBDIVISION NUMBER LOTS Sunset Cove I-III 3 Sweetwater Estates 9 Sweetwater Hills I-III 1 Syford Acres 3 Viking I-II 1 Water's Edge I-VIII, IX-A & B, X-XI 97 Woodlake 3
TOTAL 582 MOBILE HOME LOTS / SPACES Bayview 5 Halifax Estates 8 Laurelwood I-V 4 Pickwick Village 1 Spruce Creek Village 5 Twin Gates 3
TOTAL 26 MULTI-FAMILY/TOWNHOUSE/DUPLEX UNITS Canalview Place 20 Crystal Lake Apartments 290 Hidden Village 1 Nova Bella Piazza 20 Nova Oaks 32 Potato Patch 1 Southern Oaks 6 Trailwood I 8
TOTAL 378
Summertrees South I-III 3

2012 Concurrency Management Report Page 6
EXHIBIT 2: VESTED & RESERVED DEVELOPMENT (Continued) (September 30, 2012)
NON-RESIDENTIAL DEVELOPMENT
DEVELOPMENT SQUARE FEET
ABC Liquor Store - Bank outparcel 4,800
Altamira, Lot 2 7,700
BJ’s Wholesale Club 88,177
Crystal Lake Business Park 103,280
Dimucci Office Bldg. & Coffee Shop 2,581
Dunlawton Square, outparcel 3,700
Eastport Business Park, Lot 4 9,800
FPL Magnolia Station 1,400
Huntley Multi-tenant Blg. 14,250
Unitan Office Bldg. 8,300
Nova Bella Piazza 38,500
Oak Heights, Lot 1 15,500
Pavilion at Port Orange 124,903
Raydon, Phase II 66,557
TOTAL 489,448
Source: Department of Community Development, November 2012
Adopted Level-of-Service Standards (LOS) The adopted level-of-service standards (LOS) for public facilities subject to concurrency are established in the City of Port Orange’s Comprehensive Plan and the Land Development Code. The standards for each facility and service are indicated in Part II of this report.
Capacity Reservations
If a concurrency review for a proposed development reveals that there is sufficient capacity to support it, a Development Order will be issued and capacity is reserved. Capacity reservations are made based on the date of project approval by the Department or the City Council. Capacity reservations are made in conjunction with the issuance of a final Development Order. They are valid only for the specific land use(s), densities, intensities and construction and improvement schedules as contained on the Development Order and any applicable development agreements for the property. The issuance of a Development Order generally reserves public facility capacity for the project for one year. For Planned Unit Developments (PUD) and Planned Commercial Developments (PCD), capacity may be reserved for the first phase of the project for up to one year from the issuance of the approval. Capacity reservations for concurrency expire when the underlying Development Order or development agreement expires or is revoked.

2012 Concurrency Management Report Page 7
The City Council may also reserve public facility capacity for a particular land area or specific land use, provided it is done in accord with a specific development or redevelopment strategy identified in the Comprehensive Plan. This would include such community development objectives as providing affordable housing or diversification of the tax base.
Development Deferrals/Moratoria
If, at any time, the City's inventory of public facilities capacities indicates that a facility has dropped below its adopted LOS, then the City will cease to issue any development orders which would impact that facility. Such a deferral will continue until the adopted LOS is reestablished through facility improvements or other methods, or the adopted LOS as established in the Port Orange Comprehensive Plan is amended to reflect a lower, acceptable community standard. If improvements to a facility are not anticipated to keep pace with the demand brought about by new development, then the City may declare a development deferral or moratorium of specified duration and/or location.

2012 Concurrency Management Report Page 8
III. CURRENT CAPACITIES AND LEVEL OF SERVICE This section of the report will look at each facility subject to concurrency. First, the facility's adopted level-of-service (LOS) will be identified. Next, the current status of the facility relative to its adopted LOS will be evaluated. Lastly, the City's ability to meet the demands of new development at adopted levels-of-service during the upcoming year will be considered and a description of projected long-term improvements is provided.
ROADS/TRAFFIC CIRCULATION
Level of Service Measures The City evaluates LOS for concurrency review purposes based on peak-hour trips for city roads and on peak-hour and daily trips for County and State roads. The City also maintains a detailed database to evaluate all peak-hour conditions at all signalized intersections within the City. This allows the City to evaluate the existing and projected LOS on roadway segments and intersections so that the City can target specific improvements to maintain the intersection LOS or to make improvements for specific turning movements, if necessary. Adopted Level-of-Service Standards Exhibit 3 lists the currently adopted level-of-service standards for roads in the City. Exhibit 3: Adopted Roadway Level-of-Service Standards
Administrative Facility Type LOS Standard
Strategic Intermodal System (SIS) C
State Arterials and non-SIS roads D
County E
City E
Florida Strategic Intermodal System (SIS) Roadways - LOS “C” In Port Orange, the sole Florida Strategic Intermodal System (SIS) roadway facility is I-95. The state mandates these roads be maintained at LOS “C” or better. State Arterials (Non-SIS Facility) & Designated Hurricane Evacuation Routes - LOS “D” State-maintained principal arterials and hurricane evacuation routes are designated at LOS “D”. Only US 1, SR 421, SR A1A and SR 5A (Nova Road) are designated with LOS “D”.
All City Roads and County Arterial and Collector Facilities - LOS "E" The City’s LOS standard for city roads and the County’s LOS standard for county roads is “E”.
Design Capacity and Existing Level-of-Service Exhibit 4, “Roadway Counts, Functional Classification and LOS" indicates the design capacity and adopted levels of service of various arterial and collector roadways in the City of Port Orange, existing traffic volumes, existing level-of-service, and the percentage

2012 Concurrency Management Report Page 9
change in traffic volumes between October 1, 2010 and 2011 for state and county roads and the percentage change in traffic volumes between October 2011 and September 2012 for city roads. The volumes indicated in Exhibit 4 are presented as average daily trips. The most recent daily traffic counts available were taken in 2011 for FDOT and County roads and in the Spring of 2012 for city streets. FDOT and County counts are measured only on a daily basis. However, recent traffic studies submitted with private development applications as part of the development review process on file with the city provide two-way peak hour and peak-hour directional trips at select intersections and specific roadway segments. Traffic Counts and Trends During 2011 and 2012, traffic counts taken throughout the city indicated decreases on some routes and moderate increases on others (see Exhibit 4). Traffic volumes on the state network continued the recent trends and decreased slightly at most count stations between 2010 and 2011 and increased slightly on the county roadway network within the City. No state or county count data for 2012 was available at the time of this report. Counts on some city streets showed increases from 2011 to 2012 as part of a continued trend of trips becoming more localized (possibly more people staying in Port Orange to shop and dine related to greater choices at the Pavilion and along Dunlawton). Of the 24 City count stations included in this analysis period, 16 showed increases and 8 showed traffic volume decreases. Of the 30 County count stations, 18 showed increases and 12 showed decreases, and of the 15 state count stations, only 3 showed increases and 12 showed decreases. A significant drop in trips in the last analysis year occurred on the two segments of I-95 in city. Within the City, there was a 4.2% decrease in total trips on the state network and an increase of 1.15% on the county network (from 2010-2011). There was an increase of 4.43% on the city roadway network (from 2011-2012; see Exhibit 4). Although traffic volumes within the City have increased on some segments (and decreased on other segments) over the past year, there are no roadways operating below the adopted Level-of-Service. Vehicle miles traveled (VMT) decreased 3.8% from 2010 to 2011 or from 1,193,497 VMT per day to 1,148,122 VMT per day on the common monitored network. Overall VMT on the state system within the City, including I-95, decreased by 5.84% from 2010 to 2011. Vehicle miles traveled on the two segments of I-95 in the City decreased by 7.9% from 2010 to 2011.

2012 Concurrency Management Report Page 10
Exhibit 4: 2009 – 2012 Roadway Counts, Functional Classification and LOS
ROAD LOCATION COUNT
STATION
NO. OF
LANES FUNCT.CLASS
A
ADOPTED LOS
STANDARD
ADOPTED LOS
CAPACITY 2009
VOLUME 2010
VOLUME 2011
VOLUME 2012
VOLUME EXISTING
LOS
%Change 10-11 or 11-12
Airport Road Pioneer Trail-Cypress Springs Pkwy 64 2 CO E 17,077 5410 5440 6000 B 10.29%
Airport Road Williamson-Cypress Springs Pkwy 64 4 CO E 33,030 5410 5440 6000 B 10.29%
Canal View Blvd. Nova Rd. to Spruce Creek Rd. 201 2 CO
E 10,725 2346 2183 2214 1681 B -24.10%
Central Park Blvd. Hensel Rd. to Spruce Creek Rd. 2201 2 local
E 10,725 2482 2377 2527 2657 B 5.14%
Charles St. Ridgewood Ave. to FEC Railroad 301 2 local E 10,725 1533 1812 1933 1914 B -0.10%
Charles St. FEC Railroad to McDonald Rd. 302 2 local E 10,725 2326 2263 2321 2139 B -7.80%
City Center Pkwy. Dunlawton Ave. to City Center Cir. 2401 2 local
E 10,725 5707 5627 6390 6064 B -5.38%
City Center Blvd. Clyde Morris to City Center Cir. 2402 2 local E 10,725
4709 4289 5014 4739 B -5.48%
City Center Dr. Herbert St. to City Center Cir. 2403 2 local E 10,725
2197 2399 2494 2517 B 0.92%
Clyde Morris Blvd. N. City Limits to Madeline Ave. 335 4 UPA
E 33,030 21,970 23010 24200 B 5.17%
Clyde Morris Blvd. Madeline Ave. to Willow Run 333 4 UPA
E 33,030 21,200 22130 22750 B 2.80%
Clyde Morris Blvd.
Willow Run Blvd. to Dunlawton Ave. 332 4 UPA
E 33,030 19,810 19890 21310 B 7.14%
Clyde Morris Blvd. Dunlawton Ave. to Taylor Rd. 330 2 UMA
E 14,850 10,300 10530 10060 C -4.46%
Commonwealth Spruce Creek Rd. to FEC Railroad 360 2 MA E 11,880
5210 5380 5250 B -2.42%
Commonwealth FEC Railroad to Ridgewood Ave. 361 2 MA E 11,880
3460 5390 3670 B 31.92%
Country Ln. Village Trail to Smokerise Blvd. 601 2 local E 10,725 6355 6096 5949 7016 B 17.94%
Country Ln. Smokerise Blvd. to Taylor Rd. 602 2 local E 10,725 4681 4134 3925 2381 B -39.33%
Dunlawton Ave. Peninsula Dr. to Ridgewood Ave. 427 4 PA D 64,300 27,000 24500 27000 B 10.20%
Dunlawton Ave. Ridgewood to Spruce Creek Rd. 5181 4 PA D 36,700
26,500 27,500 25,000 B -9.10%
Dunlawton Ave. Spruce Creek Rd. to Nova Rd. 1015 4 PA D 36,700 29,500 30,500 27,000 C -11.48%
Dunlawton Ave. Nova Rd. to Clyde Morris Blvd. 1014 6 PA D 55,300
31,000 31,500 28,500 B -9.52%
Dunlawton Ave. Clyde Morris Blvd. to I-95 517 6 PA D 50,300 38,000 36,500 39,500 C 8.22%
Hensel Rd. Taylor Rd. to Central Park Blvd. 1001 2 local E 14,850 6759 4743 7637 8433 B 10.42%
Herbert St. Ridgewood Ave. to McDonald Rd. 902 2 CO E 11,880 3069 4884 3930 6000 B 52.67%
Herbert St. Sixth Street to Nova Rd. 903 2 CO E 11,880 7398 7223 7026 7626 C 3.42%
Herbert St. Nova Rd. to City Center Dr. 904 2 CO E 11,880 6931 8427 8996 9230 C 2.60%
Herbert St. City Center Dr. to Clyde Morris 905 2 CO E 11,880 7620 3476 7467 7279 C -2.52%
McDonald Rd. Charles St. to Madeline Ave. 1201 2 local E 10,725 2853 2588 2750 2913 B 5.92%
Madeline Ave. Sauls Rd. to Nova Rd. 1164 2 MA E 12,024 4210 4760 4510 B -5.25%
Madeline Ave. Nova Rd. to Clyde Morris Blvd. 1163 2 MA E 14,850 6460 6560 6370 B -2.90%

2012 Concurrency Management Report Page 11
ROAD LOCATION COUNT
STATION
NO. OF
LANES FUNCT.CLASS
A
ADOPTED LOS
STANDARD
ADOPTED LOS
CAPACITY 2009
VOLUME 2010
VOLUME 2011
VOLUME 2012
VOLUME EXISTING
LOS
%Change 10-11 or 11-12
Madeline Ave. Clyde Morris Blvd. to Long Grove Ln 1161 2 MA
E 33,030 8910 9600 9930 B 3.44%
Madeline Ave. Long Grove Ln. to Williamson Blvd. 1161 2 MA
E 17,931 8910 9600 9930 B 3.44%
Nova Rd. Madeline Ave. to Herbert St. 1017 6 UPA D 55,300 26,500 27,000 26,500 B D
-1.85%
Nova Rd. Herbert St. to Dunlawton Ave. 1017 4 UPA D 36,700 26,500 27,000 26,500 B D
-1.85%
Nova Rd. Dunlawton to Spruce Creek Rd. 1016 4 UPA D 36,700 25,000 25,500 23,500 B D -7.84%
Nova Rd. Spruce Creek Rd. to Ridgewood Av. 458 4 UPA D 36,700 16,700 16,900 16,800 B
D -0.59%
Pioneer Trail Airport-Turnbull Bay Rd. 1465 2 UC E 22,700 D
2860 2710 2720 B 0.34%
Reed Canal Rd. Nova Rd-Clyde Morris Rd. 1561 2 UC E 14,850 5850 5890 5810 B -1.36%
Ridgewood Ave. N. City Limits to Dunlawton Ave. 213 4 UPA D 36,700 26,000 25,500 24,500 B -3.92%
Ridgewood Ave. Dunlawton Ave. to Oak St. 5057 4 UPA D 36,700 20,500 20,100 20,500 B 2.00%
Ridgewood Ave. Oak St. to Nova Rd. 152 4 UPA D 36,700 15,200 15,800 14,100 B -10.76%
Ridgewood Ave. Nova Rd. to S. City Limits 13 4 UPA D 36,700 20,900 20,100 19,400 B -3.48%
Spruce Creek Rd. Central Park Blvd. to Merrimac Dr. 1701 2 CO
E 15,593 7552 7463 6057 6843 B 12.98%
Spruce Creek Rd. Merrimac Dr. to Taylor Rd. 1702 2 CO
E 14,850 12317 5828 10932 11296 C 3.33%
Spruce Creek Rd. Taylor Rd. to Nova Rd. 1751 4 UMA
E 33,030 17650 16760 16350 B -2.45%
Spruce Creek Rd. Commonwealth to Dunlawton Ave. 1755 2 MA
E 14,850 7250 7290 6950 B -4.66%
Spruce Creek Rd. Dunlawton to Canal View Blvd. 1708 2 CO
E 14,850 5989 5152 5069 3826 B -24.52%
Taylor Rd. Hensel Rd. to Spruce Creek Road 1826 4 MA E 33,030
15,720 15,270 15600 B 2.16%
Taylor Rd. Hensel Rd. to Clyde Morris Blvd. 1824 4 MA E 33,030 19,620 18,590 19530 B 5.10%
Taylor Rd. Clyde Morris Blvd. to Dunlawton Av. 1823 2 MA
E 14,850 12,880 12,860 12980 C 5.10%
Taylor Rd. I-95-Williamson Blvd. 1814 5 UPA E 46,000 33,660 36,960 36170 D -2.14%
Taylor Rd. Williamson Bvd. - Summer Trees Rd. 1813 4 UPA
E 34,682 16,340 14,630 15190 B 3.83%
Taylor Rd. Summer Trees Rd.- Fern Park Dr. 1812 2 UPA E 24,100 D
13,880 14,280 14570 C 2.03%
Town West Blvd. Williamson Blvd. - Coraci Blvd. 100 2 CO E 19,923 NC 3174 3497 3790 B 8.38%
Town West Blvd. Coraci Blvd. to Tomoka Farms Rd. 110 2 CO E 19,923 NC 1792 1741 1832 B 5.23%
Victoria Gardens S. of Dunlawton Ave. 2501 2 local E 17,077 2659 2737 4987 6117 B 32.68%
Victoria Gardens E. of Clyde Morris Blvd. 2502 2 local E 17,077 1260 2387 2505 2564 B 4.94%
Village Trail Dunlawton Ave. to Country Ln. 1901 2 local E 17,077 7220 7647 6804 7959 B 2.36%
Village Trail Country Ln. to Nova Rd. 1902 2 local E 17,077 7895 7865 7652 8304 B 8.52%
Willow Run Clyde Morris Blvd. to Hidden Lakes 2013 3 CO
E 27,531 8200 8140 8230 B 1.10%

2012 Concurrency Management Report Page 12
ROAD LOCATION COUNT
STATION
NO. OF
LANES FUNCT.CLASS
A
ADOPTED LOS
STANDARD
ADOPTED LOS
CAPACITY 2009
VOLUME 2010
VOLUME 2011
VOLUME 2012
VOLUME EXISTING
LOS
%Change 10-11 or 11-12
Willow Run Hidden Lakes Dr. to Williamson Blvd. 2010 2 CO
E 17,077 4810 5160 5110 B -0.97%
Williamson Blvd. N. City Limits to Madeline Ave. 1993 2 UPA E
20,300 D
12,100 14,350 14,280 C -0.49%
Williamson Blvd. Madeline Ave. to Willow Run Blvd. 1992 2 UPA E
19,500 D
12,340 14,340 13,220 C -7.81%
Williamson Blvd. Willow Run Blvd. to Town West 1991 2 UPA E 16,700 D
11,540 12,800 13,790 C 7.73%
Williamson Blvd. Town West Blvd. to Taylor Rd. 1990 2 UPA E 18,000 D
10,770 14,380 14,340 C -0.28%
Williamson Blvd. Taylor Rd. to Spruce Creek Bridge 66 4 UPA E 33,030 D
18,790 19,390 20,180 B 4.07%
Williamson Blvd. Spruce Creek Bridge to Airport Rd. 65 4 UPA
D 33,030
D 15,760 15,180 16,410 B 8.10%
Yorktowne Blvd. North of Dunlawton Ave. 2080 2 CO E 17,077 7,640 7,250 6,920 B -4.55%
I-95 Beville Rd. -Dunlawton Ave. 492 4 SIS C 59,800 52,500 51,000 44,500 C -12.75%
I-95 Dunlawton Ave. - SR 44 133 4 SIS C 59,800 37,400 38,000 36,600 B -3.69%
Total City Counts * 111,858 106,566 119,817 125,120 4.43%
Total County Counts* 354,920 383,900 388,330 1.15%
Total State Counts* 419,200 417,400 399,900 -4.20%
Total of All Roadways 899,978 907,921 908,047 0.01%
Notes to Table 2: A UPA = Urban Principal Arterial, MA = Minor Arterial, CO/UCO = Collector/Urban Collector (MPO and/or City Sources) B Percent volume change is from Spring 2010 to Spring 2011 unless otherwise noted for State & County Roads and Spring 2011-Spring 2012 for City streets. C Data derived from Volusia County Traffic Engineering for 2011 D Based upon capacities and volumes noted in FDOT LOS Table 1, 9/4/09 or ARTPLAN analysis Blue text=State Facility & Counts, Green Text= County Facility or Counts, Black Text =City Facility& Counts * Segments with no counts were excluded for comparison purposes Sources: FDOT 2009 Quality/Level of Service Handbook; Department of Public Works, 2012; FDOT, 2011; and Volusia County Traffic Engineering, 2011.

2012 Concurrency Management Report Page 13
Roadways Currently Not Operating Within Adopted Level-of-Service: At this time there are no roadways operating below the adopted Level-of-Service.
Public or Private Improvements to the System during the Past Fiscal Year and Its Impact on Capacity and LOS: Roadway improvements completed this past year are listed below and indicated on Exhibit 5 (see pg. 18). Willow Run Boulevard eastbound right turn lane at Clyde Morris Boulevard This project added an eastbound right turn lane to the intersection and improved movement through the intersection, specifically for vehicles turning southbound onto Clyde Morris Boulevard. Previously vehicles had to use a shared through/right turn lane turning right onto Clyde Morris Boulevard. Dunlawton Avenue eastbound right run lane at Village Trail This project added an eastbound right turn lane to the intersection and improved movement through the intersection, specifically for vehicles turning southbound onto Village Trail. Previously vehicles had to use a shared through/right turn lane turning right onto Village Trail. Dunlawton Avenue/Spruce Creek Road intersection improvements This project added an eastbound right turn lane on Dunlawton Avenue and a northbound right turn lane on Spruce Creek Road. This improved movement through the intersection, specifically for eastbound vehicles turning southbound onto Spruce Creek Road and for northbound vehicles turning eastbound onto Dunlawton Avenue. Previously vehicles had to use shared through/right turn lanes. The improvement also increased the turning radius for trucks using Spruce Creek Road to access the industrial uses located south of the intersection. Taylor Road (SR 421) at the I-95 Interchange As part of the site improvements for the Pavilion at Port Orange DRI, the westbound left turn lane on Taylor Road approaching the southbound ramp to I-95 was extended and a sidewalk was constructed in the interchange area. This improved traffic flow and eliminated westbound left turning queues from blocking westbound through lanes. An eight foot wide sidewalk was constructed to connect the east and west side of I-95 to provide a safer alternative travel route in the interchange area. Proportionate Fair-Share Ordinance In 2006, the City Council adopted a Proportionate Fair-Share Ordinance as required by State Law. The City has entered into Concurrency and Fair-Share Agreements with several developers. Projects funded through the fair-share process and the status of each of these projects is listed below. As of October 2012, the City has collected $4,593,651 in
2012 Concurrency Management Report Page 14
proportionate fair-share funds. This represents the reconciled final cost for four of the fair-share projects which have been completed and closed out.
Interstate 95/SR 421 interchange area (phase 1) – Project Completed
Town West Boulevard/Williamson Boulevard signal – Redesign Underway
Clyde Morris Blvd/Dunlawton Avenue intersection - Project Completed
Summer Trees Road extension- Project Completed
Devon Street/Taylor Road Intersection –Project Completed
Only the Clyde Morris Boulevard/Dunlawton Avenue intersection project is completed and fully paid for with fair-share funds.
Public or Private Improvements to the System during the Current Fiscal Year (FY 2012/2013) and its Impact on Capacity and LOS: Roadway improvements programmed in the current fiscal year are listed below and are indicated on the map in Exhibit 5. Herbert Street sidewalk extension As part of improvements to the City’s pedestrian network, an eight foot wide sidewalk will be constructed on the south side of Herbert Street, between Silver Sands Middle School and Nova Road. The sidewalk will improve pedestrian safety along this busy school walking route. Yorktowne Boulevard Extension (South) As part of the developing Altamira commercial development, Yorktowne Boulevard is being extended from its current terminus at Dunlawton Avenue south to Taylor Road. The property owners will be dedicating the entire 90’ wide right-of-way for the extension to accommodate a four-lane roadway. This improvement will provide an alternate route from Dunlawton Avenue to Taylor Road. As part of this project, the signal at Dunlawton Avenue and Taylor Branch Road will be removed, increasing the efficiency of the east-west through movements on Dunlawton Avenue.
Capacities Reserved for Approved but Un-built Development: Based on the latest traffic count data no roadway segments are operating below the adopted LOS standard. According to Exhibit 2, there are 986 vested but un-built residential units, which will generate an average of 8,177 cumulative daily trips.3 Residential trips such as these are reserved on the City’s roadway system upon being approved or obtaining vesting. A net total of 489,448 square feet of non-residential construction is also vested but un-built.
3 9.52 trips per day for each single family residential unit, 4.99 per mobile home, 5.81 per duplex or
townhouse and 6.65 per multi-family unit. Source: ITE Trip Generation Manual, 9th Edition.

2012 Concurrency Management Report Page 15
Future Public or Private Improvements to the System and the Impact on Capacity and LOS: The following improvements will be made to the road network in the future and will improve capacity and LOS. Roadway improvements proposed for future years are listed below and are indicated on the map in Exhibit 5. Collector Road Connections Additional traffic volume is anticipated to be placed on Taylor Road and Williamson Boulevard (north of Taylor Road) by future developments. The City has planned a network of collector roads west of I-95 that will be constructed in phases as development occurs within the Planned Community Westside. These roads will be dedicated to the City as public roads.
Coraci Boulevard will connect Town West Boulevard and the Madeline Avenue extension.
Coraci Boulevard will extend south along the west side of Crane Lakes PUD and extend further south, providing an eventual connection to Taylor Road.
McGinnis Avenue will link Williamson Boulevard and the Madeline Avenue extension near the Town Center area of the Planned Community Westside.
Proposed collector Road “D” will run from east to west and connect McGinnis Avenue with Coraci Boulevard between Town West Boulevard and Madeline Avenue.
I-95/SR 421 (Dunlawton Avenue/Taylor Road) Interchange In late 2008 the city completed a study of the I-95/SR 421 (Dunlawton Avenue/Taylor Road) interchange to determine the necessary improvements to maintain long-term concurrency. The study identifies a $15.7 million proposed improvement to the interchange and area roadways. The study includes evaluating alternatives to reconstructing the interchange that could divert traffic away from the interchange, such as a potential interchange at I-95 and Pioneer Trail, and a fly-over I-95 with the proposed Madeline Avenue extension. A separate study completed in 2009 evaluated the effectiveness of constructing the Yorktowne Boulevard extension to serve as a by-pass around this interchange for local traffic. The goal of the by-pass is to provide an option to travelers who want to avoid interchange traffic. Ridgewood Avenue Improvements to the Dunlawton Avenue and Herbert Street intersections are under design by FDOT. The project will add capacity to the intersections and improve the LOS. South Williamson Boulevard Extension The City’s Comprehensive Plan anticipates the extension of South Williamson Boulevard as a four-lane, divided roadway running generally parallel with and west of Interstate 95 from the Airport Road intersection southward to Pioneer Trail. The road is planned to continue through New Smyrna Beach to State Route 44. As part of the future Woodhaven development, the developer will be responsible for constructing the segment that ends at Pioneer Trail. The construction of this roadway is anticipated to reduce traffic on Airport

2012 Concurrency Management Report Page 16
Road and improve the overall LOS on this roadway segment. The extension project is expected to begin in 2014. This project is included in the TPO’s 2035 Long Range Transportation Plan. South Williamson Boulevard/Town West Boulevard Intersection A signal warrant study performed by the City’s traffic consultant in 2000 showed that a signal will be warranted at this intersection upon build-out of the Port Orange Plantation subdivision (Phases I-V). In 2011, Volusia County conducted a signal warrant study for the intersection and at this time an emergency preemption activated signal is warranted. The City has collected the fair-share payments to construct the signal and the signal will need to be redesigned to account for the future four-laning of Williamson Boulevard. The City is working with Volusia County to have the signal installed. The City will work with Volusia County toward developing and maintaining a coordinated signal system along Williamson Boulevard, north of Taylor Road, as a way to maximize road capacity. Volusia County has conducted a corridor-specific ARTPLAN4 analysis for Williamson Boulevard between Beville Road (SR 400) and Taylor Road which indicates capacity throughout the corridor is greater than indicated in the FDOT LOS tables. Taylor Road west of Summer Trees Road The County completed an alignment study of this segment that recommended widening from Summer Trees Road to Spruce Creek Boulevard (Spruce Creek Fly-in entrance). The County has completed the 90% design plans for the widening from Summer Trees Road to Forest Preserve Boulevard; however, construction has not been scheduled due to lack of funding. The City will be coordinating with the County to secure right-of-way along this segment as development occurs. This project is included in the TPO’s 2035 Long Range Transportation Plan.
Taylor Road (Dunlawton Avenue to Clyde Morris Boulevard) Taylor Road is not scheduled for widening with the exception of turn lane improvements associated with the Altamira commercial development. However, as future development and redevelopment occurs in this area, staff will continue the City’s policy of obtaining additional right-of-way from developers to facilitate future expansion of this road and/or of a parallel facility or pursuing other operational improvements to ensure this roadway operates at an acceptable LOS. Additionally, once the Yorktowne Boulevard extension is completed between Taylor Road and Dunlawton Avenue, the signal at Taylor Road/Dunlawton Avenue will be removed which will increase through-capacity at Dunlawton Ave. and in the interchange area. Traffic now using this intersection to access Dunlawton Avenue and Taylor Road to the west will use the new Yorktowne Boulevard extension.
4 ARTPLAN is a program developed by FDOT to more accurately measure the level-of-service on specific
roadways based on specific roadway design and operating characteristics and can be used in lieu of the generalized level-of-service tables.

2012 Concurrency Management Report Page 17
Williamson Boulevard (Town West Boulevard to north City Limits) Long-term improvements will need to be programmed for the northerly segments of Williamson Boulevard north of the Pavilion at Port Orange Shopping Center upon further development of the Planned Community Westside. By widening this segment, the capacity at the adopted LOS will increase from between 16,700 and 20,300 daily trips to 33,030 daily trips. This project is included in the TPO’s 2035 Long Range Transportation Plan. Yorktowne Boulevard Extension (North) The developer for a multi-family zoned property on the south side Willow Run Boulevard, east of Williamson Boulevard is responsible for constructing a segment of the northern Yorktowne Boulevard extension as part of the site improvements for that development. The extension will be a four-lane road extending from Willow Run Boulevard to the southern property line of the project. Development of this multi-family project has not progressed due to legal and economic issues, so the timing of the roadway construction is currently unknown. The design has also been completed for the central segment of the northern Yorktowne Boulevard extension, located southeast of the B-19 canal crossing to Hidden Lake Drive. The City funded the design of this segment and is making arrangements with the adjacent property owners to fund construction. Bikeway/Pedestrian Improvements The City is proceeding with several improvements to the bikeway/pedestrian network. Many of these improvements were identified in recent Safe-Routes-to-Schools studies developed in conjunction with the Volusia Transportation Planning Organization. Projects being considered for immediate funding include:
Spruce Creek Road Sidewalk from Taylor Road to Central Park Boulevard;
Herbert Street sidewalk and bike lanes from Nova Road to Jackson Street;
Community Development Block Grant (CDBG) area sidewalk gaps in the older portions of Port Orange located west of US 1, east of the FEC Railway and south of Dunlawton Avenue; and
Walk light improvements along Dunlawton Avenue.
These projects will improve the bicycle and pedestrian levels of service in areas in close proximity to schools, parks, and mobile home parks. Project Feasibility Studies are being conducted in FY 12/13 for the following pedestrian improvement projects:
Victoria Gardens Boulevard sidewalk from Appleview Way to Clyde Morris Boulevard;
McDonald Road sidewalk from 6th Street to Sugar House Drive; and
Spruce Creek Road sidewalk from Nova Road to Angelina Court.
Also, project feasibility studies are proposed for the following pedestrian improvement projects:
Herbert Street from Jackson Street to the FEC Railway; and
South side of Willow Run Boulevard from Clyde Morris Boulevard to Chardonnay Drive.

2012 Concurrency Management Report Page 18

2012 Concurrency Management Report Page 19
SANITARY SEWER
The Port Orange Sanitary Sewer System serves the City of Port Orange, Daytona Beach Shores, Ponce Inlet (wholesale), and other unincorporated areas of East Volusia County. The Port Orange collection system contains 110 standard public and 44 private pump stations and 26 “grinder” stations and an estimated 340 miles of pipeline. The collectors range in size from 8” to 30” and transmit flow back to the City’s treatment plant through a series of force mains and relatively shallow interceptors.
Adopted Level-of-Service Standard: Residential consumption is 160 gallons per day per Equivalent Living Unit (ELU) and Commercial Consumption is 1/10 gallon per sq. ft. per day of commercial, industrial, or institutional development.
Design Capacity of the Wastewater Treatment Plant and Existing LOS: The Florida Department of Environmental Protection (FDEP) has permitted the Wastewater Treatment Plant with a maximum capacity of 12.0 million gallons per day (MGD). The present total number of sewer connections is 24,386, and the number of permitted ELU’s connected to the system is 44,519. The Wastewater Treatment Plant currently has a committed capacity of 7.123 MGD, based on FDEP permits for development. Using the City’s LOS figure of 160 gallons per ELU, the Wastewater Treatment Plant is capable of providing service to 75,000 ELU’s. Therefore, the sanitary sewer system is operating below maximum capacity (see Exhibit 6).
Exhibit 6: Capacity of the Wastewater Treatment Plant
MGD* ELU**
Maximum Capacity 12.0 75,000
Committed Capacity 7.123 44,519
Remaining Capacity +4.877 +30,481 *MGD - Million Gallons per Day **ELU - The water usage equivalent to one single-family dwelling. Source: Port Orange Public Utilities Department, October 2012 and DEP Waste Treatment Plant Permit Application. As indicated in Exhibit 7 and 8 (see next page), the wastewater generation rates have generally decreased over the past decade (with a slight increase in 2012) while the City’s population increases. The decrease can be attributed to water conservation programs and the relining of major wastewater collection pipes and manholes to reduce infiltration of stormwater or ground water into the collection pipes. Allowing only wastewater in the collection pipes reduces the amount of water being treated at the plants and allows the plant to run more efficiently. Exhibit 7 presents a summary of the actual wastewater generation throughout the entire service area since 2000 and the projections through 2025. The projections are based on population projections in the Comprehensive Plan that were developed in 2006, prior to

2012 Concurrency Management Report Page 20
the recession that began in 2008. Based on the current economic conditions, the City is not anticipating to actually achieve growth at this rate, especially in the short-term.
Exhibit 7: Wastewater Generation
YEAR AVERAGE DAILY FLOW
2000 (actual) 7.76 MGD 2001 (actual) 6.70 MGD 2002 (actual) 6.95 MGD 2003 (actual) 6.16 MGD 2004 (actual) 5.72 MGD 2005 (actual) 5.40 MGD 2006 (actual) 5.35 MGD 2007 (actual) 5.40 MGD 2008 (actual) 5.40 MGD 2009 (actual) 5.54 MGD 2010 (actual) 5.53 MGD 2011 (actual) 5.46 MGD 2012 (actual) 5.70 MGD 2015 (projected) 7.00 MGD 2020 (projected) 7.50 MGD 2025 (projected) 8.00 MGD Source: Port Orange Public Utilities Department, October 2012 and DEP Waste Treatment Plant Permit Application.
Exhibit 8 presents a comparison between the average daily flow and the City’s population since 2000.
Exhibit 8: Average Daily Flow Compared to Population Growth
0.00
1.00
2.00
3.00
4.00
5.00
6.00
7.00
8.00
9.00
0
10,000
20,000
30,000
40,000
50,000
60,000
70,000A
vg.
Da
ile
y F
low
Po
pu
lati
on
Population Avg. Daily Flow
Source: Port Orange Public Utilities Department, October 2012. DEP Waste Treatment Plant Permit Application.

2012 Concurrency Management Report Page 21
Capacities Reserved for Approved but Unbuilt Development and its Impact on Capacity and LOS: It is possible to determine the per capita demand for potable water generated by reserved and vested development, given the future consumption rate, the future population, and the non-residential building square footage involved. According to Exhibit 1, the vested and reserved capacity includes the volume needed for 986 residential units and 489,448 SF of gross leasable non-residential space. Given a per capita consumption rate of 160 gallons per day per ELU for residential and 1/10 gallon per square foot of gross building area for non-residential development, the vested and reserved development could increase the total demand by 206,705 gallons per day (0.21 MGD). Therefore, sufficient capacity exists for the vested development indicated in Exhibit 1. In addition, further demand may also be generated by growth within the service area outside of the City limits. Reclaimed Water: Reclaimed water is derived from wastewater that has been collected and treated and is safe to be placed back into the environment. Previously, reclaimed water was discharged into the Halifax River; however, in the early 1990’s the City began to distribute reclaimed water to residents and business for irrigation. Therefore, the use of reclaimed water for irrigation reduces the amount of treated wastewater discharged into the Halifax River and reduces the amount of potable water used for irrigation.
The City continues to work toward increasing the amount of reclaimed water produced to eventually equal 100% of wastewater volume. The number of metered reclaimed water accounts within the City has continued to increase over the years with the present total number of reclaimed water accounts at 7,024 (see Exhibit 9). Exhibit 9: Number of Reclaimed Accounts
0
1,000
2,000
3,000
4,000
5,000
6,000
7,000
8,000
Acounts
Source: City of Port Orange Finance Department, September 2012

2012 Concurrency Management Report Page 22
The continued increase in reclaimed demand is due to the following factors:
The City requirement that developers install service connections and connect to reclaimed water lines, where available.
Potable water irrigation meters are no longer issued. Proposed Public or Private Improvements to the System in the Current Fiscal Year and its Impact on Capacity and LOS: The City currently has beneficial use of and continues to construct a 175-acre retention system, located on the Central Recharge Wellfield property (see Exhibit 14), which consists of two lakes. The lakes are used to store excess reclaimed water during the wetter parts of the year and then helps to supplement the system during dry periods of the year. Phase 1 of this project (100-acres) was completed in 2006 and work on Phase 2 is on-going. An expansion for additional overflow storage is in design and will be constructed in FY 12/13, which will add approximately 90 million gallons of storage volume by allowing water to be stored to a higher elevation.
Exhibit 10: 175-acre Retention System at the Central Recharge Wellfield

2012 Concurrency Management Report Page 23
Potable Water
The Port Orange water utility currently serves the following areas: City of Port Orange City of Daytona Beach Shores (south of Thames Avenue) Town of Ponce Inlet (wholesale account) Wilbur-By-The-Sea (unincorporated area) Other non-designated unincorporated areas
Adopted Level-of-Service Standard: (1) Consumption :
Residential is 180 gallons per day per ELU
Commercial, industrial, or institutional development is 1/10 gallon per sq. ft. per day
(2) System Minimum Pressure : 20 pounds per square inch during fire flow
(3) Storage Provided: 50% of peak daily flow
(4) Well Capacity : Peak day flow with two wells out of service
(5) Norm. Operating Pressure: 60-70 pounds per square inch (psi)
(6) Water Plant Capacity: Adequate for peak daily; three-year lead-time for planned expansion
(7) High Service Pumping: Peak hour with largest pump out of service
(8) Water Quality : Meet State/Federal drinking water standards
Design Capacity of Potable Water Treatment Facilities, Consumptive Use Permit, and Existing LOS: The Garnsey Water Treatment Plant provides the City with a water quality supply that meets all applicable State and Federal standards. The plant was constructed in 1981 and has undergone two upgrades since that time. The plant currently has a capacity of 15.0 MGD and consists of four high-service fixed-speed pumps and two variable-speed pumps that provide adequate water supply to all portions of the service area through approximately 400 miles of pipe.
There are two concurrency measures related to potable water: plant capacity and water supply capacity. Regarding plant capacity, there are presently 27,769 billed potable water connections, equivalent to 38,713 ELUs (Equivalent Living Unit). Based on an LOS standard of 180 gallons per ELU, the capacity currently needed is 6.97 MGD. Therefore, the Water Treatment Plant capacity is sufficient (15.0 MGD) to serve the current number of ELUs at current peak flow rates (see Exhibit 11).

2012 Concurrency Management Report Page 24
Exhibit 11: Remaining Capacity at the Garnsey Water Treatment Plant
MGD* ELU**
Maximum Plant Capacity 15.00 83,333
Committed Capacity 6.97 38,713
Remaining Capacity 8.03 44,620
*MGD- Million Gallons Per Day **ELU - The water usage equivalent to one single-family dwelling.
Source: Port Orange Public Utilities Department, October 2012
The second measure is water supply capacity. While the City has the technical capability to pump up to 15 million gallons per day from its wells, the Consumptive Use Permit (CUP) issued by the St. John’s River Water Management District limits how much water the city can actually pump out of the ground. The CUP is a 20-year permit that was issued in 2002 and will expire in 2022. The 2013 permitted average daily groundwater withdrawal is 8.13 MGD and the maximum permitted peak day withdrawal is 12.20 MGD. The maximum groundwater withdrawal permitted by the CUP in years 2021 and 2022 is 13.46 MGD.
Exhibit 12 shows the actual average and peak daily flow in 2012 and the permitted average and peak daily flow allowed by the CUP in 2013. Based upon this measure, the City is below the maximum water withdrawal allowed by the CUP.
Exhibit 12: Permitted and Actual Average Daily Flow and Peak Flow 2012 2013
Permitted Average Daily Flow 8.01 MGD 8.13 MGD
Actual Average Daily Flow 6.32 MGD N/A
Permitted Peak Daily Flow 12.02 MGD 12.20 MGD
Actual Peak Daily Flow 9.49 MGD N/A
MGD- Million Gallons per Day
Source: Port Orange Public Utilities Department, October 2012
As indicated in the graph in Exhibit 13, the increase in average daily flow has correlated with population growth. From 2008 to 2010 and then again from 2011 to 2012, the average daily flow increased slightly while the City’s population has generally been constant.

2012 Concurrency Management Report Page 25
Exhibit 13: Average Daily Flow Compared to Population Growth
0.00
0.50
1.00
1.50
2.00
2.50
3.00
3.50
4.00
4.50
5.00
5.50
6.00
6.50
7.00
0
10,000
20,000
30,000
40,000
50,000
60,000
70,000
2000 2001 2002 2003 2004 2005 2006 2007 2008 2009 2010 2011 2012
M
G
D
P
o
p
u
l
a
t
i
o
n
Population Avg. Daily Flow
Source: Port Orange Public Utilities Department, October 2012
Existing Potable Water Storage Capabilities: During times of peak flow, portions of the service area, primarily on the barrier island, are subject to greatly increased water demands. Demand requirements are met by ground storage tanks located at the north and south ends of Peninsula Avenue. When demand subsides, water is no longer pumped from the storage tanks and they are refilled to normal operating levels. This allows the peak flow requirements to be met efficiently, so that demand at the treatment plant remains fairly constant. The adopted LOS standard for water storage is 50% of average daily flow. With an average daily flow of 6.32 MGD in 2012, the LOS standard water storage volume would be 3.16 MGD. Present potable water storage facilities for the Port Orange system can accommodate 4.50 MG. Therefore, the City has sufficient surplus storage capacity to support new development.
Existing Minimum Water Pressure: The existing water pressure fluctuates from an absolute low of 40 psi (non-fire flow) to a high of 70 psi with the normal operating pressure being between 60 and 70 psi. The system’s minimum pressure during fire flow5 is presently 20 psi, which also meets the City’s adopted LOS standards. Therefore, the water pressure meets the adopted LOS.
5 Fire flow is the quantity of water measured in gallons per minute (gpm) that is needed to extinguish a fire
involving a particular building, block, area or material.

2012 Concurrency Management Report Page 26
Existing Well Capacities: The City has two well fields; The Central Recharge Well Field and the Eastern Well Field, with a cumulative water production capacity of approximately 11.5 MGD (see Exhibit 14):
The Central Recharge Well Field (Western Well field) is located west of the City, south of I-4 and is the primary source of the City’s potable water supply. This well field contains 27 wells.
The Eastern City Well Field is located off Clyde Morris Boulevard and contains 13 secondary wells. These wells supply approximately 30% of the total flow.
Exhibit 14: Location Map of the City’s Well Field Sites
2012 Concurrency Management Report Page 27
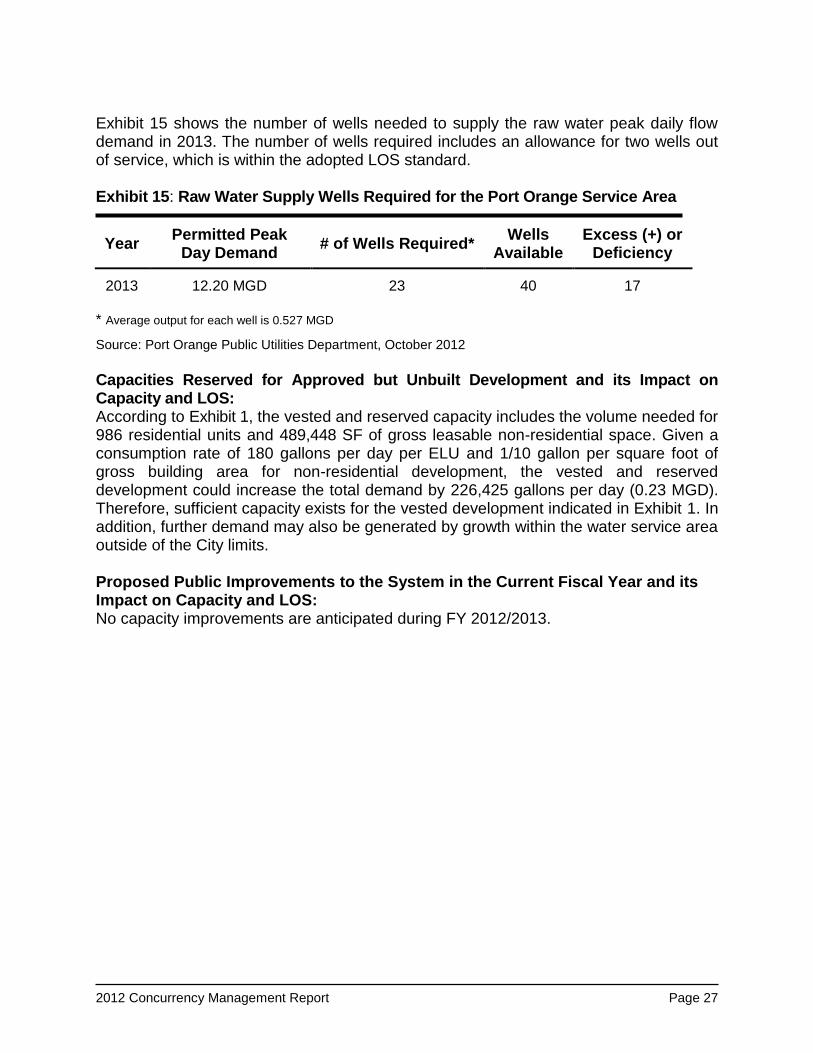
Exhibit 15 shows the number of wells needed to supply the raw water peak daily flow demand in 2013. The number of wells required includes an allowance for two wells out of service, which is within the adopted LOS standard. Exhibit 15: Raw Water Supply Wells Required for the Port Orange Service Area
Year Permitted Peak
Day Demand # of Wells Required*
Wells Available
Excess (+) or Deficiency
2013 12.20 MGD 23 40 17 * Average output for each well is 0.527 MGD
Source: Port Orange Public Utilities Department, October 2012
Capacities Reserved for Approved but Unbuilt Development and its Impact on Capacity and LOS: According to Exhibit 1, the vested and reserved capacity includes the volume needed for 986 residential units and 489,448 SF of gross leasable non-residential space. Given a consumption rate of 180 gallons per day per ELU and 1/10 gallon per square foot of gross building area for non-residential development, the vested and reserved development could increase the total demand by 226,425 gallons per day (0.23 MGD). Therefore, sufficient capacity exists for the vested development indicated in Exhibit 1. In addition, further demand may also be generated by growth within the water service area outside of the City limits. Proposed Public Improvements to the System in the Current Fiscal Year and its Impact on Capacity and LOS: No capacity improvements are anticipated during FY 2012/2013.

2012 Concurrency Management Report Page 28
STORMWATER DRAINAGE
For the purpose of stormwater management, the City is divided into 13 drainage basins, with each basin divided into a number of sub-basins. The City has utilized both structural and non-structural elements to accomplish the objective of controlling the volume, rate of flow, and pollutant load of post-development runoff. Retention and detention basins are structural elements designed to remove pollutants, attenuate post-development discharge in well-drained areas, and encourage percolation and retention of discharge volume. The City is also implementing non-structural methods of flood-damage mitigation, such as restricting development in flood-prone areas through participation in the National Flood Insurance Program and purchasing flood-prone areas for use as green space. Adopted Level-of-Service Standard: The City’s adopted level-of-service (LOS) standard for stormwater management is the 25-year, 24-hour storm event. More specifically, drainage facilities must be able to treat the runoff from the 25-year, 24-hour storm without causing flooding or polluting the receiving water bodies. Additionally, the City requires that the post-development 100-yr, 24-hour storm event peak discharge from a given piece of property does not exceed the 100-yr, 24-hour pre-development peak flow.
Existing Level-of-Service: Drainage facilities constructed after the LOS for stormwater management was adopted (in the late 1970’s) are operating at the adopted LOS standard. The City maintains the existing LOS by regulating the effects of future development, maintaining the existing system, and creating capital improvement projects targeting older areas of the City built prior to LOS requirements.
The City’s Land Development Code provides minimum standards for stormwater management to control runoff, reduce water-borne pollution, preserve critical water resources, facilitate recharge of the aquifer, and prevent erosion, sedimentation and flooding. This is accomplished by requiring stormwater management permits for new developments to ensure they meet or exceed the minimum LOS standard, responding to citizen complaints, and coordinating with other jurisdictions to identify areas in need of improvements within the Port Orange system.
Public or Private Improvements to the System during the Past Fiscal Year and Impacts on Capacity and LOS: Staff continued to perform ongoing maintenance of the drainage system including street sweeping, removal of sediment from inlets and pipes, ditch maintenance, and erosion repairs. Proposed Public Improvements to the System in the Current Fiscal Year and Impacts on Capacity and LOS: In various sections of the City, existing storm drain pipes will be evaluated and, if needed, the pipes will be lined to prevent failure and to extend the life of the pipe. Other ongoing

2012 Concurrency Management Report Page 29
maintenance of the drainage system will include street sweeping, removal of sediment from inlets and pipes, ditch maintenance, and erosion repairs. SR 421 (Dunlawton) Drainage Improvements: These improvements are intended to reduce the likelihood of Dunlawton Avenue, a primary hurricane evacuation route, from being flooded and impassable during a significant rainfall event. The improvements involve the addition of a weir structure in the Halifax Canal, additional retention and a pump station. Design and permitting are complete. Construction grants were obtained from the Florida Department of Transportation (FDOT) and the Florida Department of Environmental Protection (FDEP). Construction is tentatively scheduled to commence in January 2013 and with a target completion timeframe of December 2013. Drainage Pipe Rehabilitation: Multiple city-wide locations were identified in the Capital Improvements Program (CIP) to slip-line aging clay and metal pipes, thus extending the useful life of these pipes. This is an ongoing multi-year project. Bid documents for an annual contract were drafted in FY12. Bidding is targeted for Fall 2013, with work to commence and be completed within FY13, based upon available funding. Cambridge Canal Improvements: Located in the southeast quadrant of the Volusia County, Florida, the Cambridge Canal conveys drainage from over 1,400 acres within the City of Port Orange. Residential neighborhoods encompass nearly the entire basin, and the area has a history of severe flooding. The September 2004 hurricanes dropped more than 15 inches of rainfall on the Cambridge Canal Basin. As a result, over 200 homes were reported to have had water above the finished floor elevation.
After a thorough analysis, the City implemented conveyance upgrades to address drainage issues and the tidal influences of the Halifax River. Following construction of the improvements, Port Orange experienced an extreme storm event in May 2009 when the City received over 30 inches of rainfall over a five day period. The Cambridge improvements performed well with the exception of a section of the canal which could not keep up with the flow coming to the canal. Several homes were flooded in the area upstream due to the canal’s limited conveyance capacity.
The City intends to correct this conveyance deficiency by widening and hardening the Cambridge Canal’s banks for a 5,000 feet length to alleviate flooding upstream due to the narrow canal. The improvements span the distance from the Spruce Creek Road culvert to the Trailwood Drive bridge where it enters the retention pond area. In FY12, City commenced seeking a Federal Emergency Management Agency (FEMA) grant to assist with this improvement. If the grant is secured, then design will commence with construction to follow.
In addition to the canal widening project, the City wishes to improve the pump station by installing an automatic debris rake that can be set up to operate and remove storm debris from the inlet of the pump station. During storm events, City crews were hand clearing the debris that had blocked the screen at the inlet of the pump station during dangerous high wind periods. The City would like to reduce the probability of an

2012 Concurrency Management Report Page 30
accident and upstream flooding due to a blocked pump station by installing the automatic rake. Other Stormwater Programs: National Pollutant Discharge Elimination System (NPDES): The City completed its fourth year of the National Pollutant Discharge Elimination System (NPDES) five year permit cycle in April, is currently in the final year of the second five year permit cycle, and has applied for the third five year cycle permit. The Total Maximum Daily Loads (TMDL) program is part of the statewide Watershed Management Program (WMP) administered by the Florida Department of Environmental Protection (FDEP). The program is based on a five-phase cycle that rotates through Florida’s basins. The five phases are: Initial Base Assessment, Coordinated Monitoring, Data Analysis and TMDL Development, Basin Management Plan Development, and Implementation of Basin Management Plan. Port Orange, as part of the Northern Coastal Basin (NCB), is now in the Initial Basin Assessment phase and is coordinating its efforts with the other stakeholders of the NCB. This is similar to the coordination procedures used in the development of the NPDES Program. The five-phase cycle will rotate through the NCB until the impaired waters of the basin meet the required standard every five years. FEMA Community Rating System (CRS): The City is an active participant in the Federal Emergency Management Agency (FEMA) Community Rating System (CRS) program. Through participation with FEMA in administering the CRS, the City maintains and supervises an overall floodplain management program that is intended to preserve the function of the floodplain within Port Orange. Participation in the program provides property owners with enhanced flood protection and information in compliance with FEMA guidelines. The community’s designation is a ‘Class 7’, which means all residents within the City that currently carry FEMA flood insurance for their properties in the Special Flood Hazard Area (SFHA) qualify to receive a 15% discount on their annual FEMA flood insurance policy premium. In addition, the City participates in the Volusia County Local Mitigation Strategy (LMS) for flood control. The LMS provides a mitigation action plan which identifies areas within the city that have drainage issues that would benefit from engineered improvements. GIS Mapping: In FY12, staff initiated solicitation of an engineering services mapping proposal to generate digital maps and create a GIS database of its existing infrastructure. Depending upon funding availability, staff hopes to secure City Council approval and commence the work by January 2013 and complete the project by December 2013. This will provide a digital inventory of the City’s existing drainage system infrastructure, and provide an essential tool for prioritizing future drainage system rehabilitation projects. It will also provide a tool for mapping of potential pollutant loading and drainage-basin specific discharges, a regulatory requirement of the NPDES program.

2012 Concurrency Management Report Page 31
SOLID WASTE DISPOSAL Adopted Level-of-Service (LOS) Standard: The City's collection standard is 1,350 residential units per curbside collection crew, per day, and a weight standard of 3.21 lbs. per capita, per day for residential; and 10 lbs. per 1,000 square feet of non-residential development per day. Design Capacity of Solid Waste Disposal Facilities and Existing LOS: The City of Port Orange is currently in a five-year contract (2011 to 2016) with Waste Pro to provide solid waste collection services to residents. The contract provides residents with four weekly pick-ups: two for garbage, one for recyclables, and one for yard waste. The residential and commercial solid waste collected is transported to the Volusia County Tomoka Farms Road Landfill. The capacity at the landfill is projected to be sufficient to accommodate waste from Volusia County until the year 2050. The waste collection numbers for residential and commercial customers are shown in Exhibit 16. Exhibit 16: Residential and Commercial Waste Generation Figures (2011- 2012)
Residential Commercial6 Residential and Commercial
Solid Waste 1.94 lb. per capita, per day 1.01 lb. per capita, per day 2.95 lb. per capita, per day
Recycled Items 0.29 lb. per capita, per day 0.15 lb. per capita, per day 0.44 lb. per capita, per day
Yard Waste 086 lb. per capita, per day 0.45 lb. per capita, per day 1.31 lb. per capita, per day
Total 3.09 lb. per capita, per day 1.61 lb. per capita, per day 4.70 lb. per capita, per day
Source: Public Works Department, City of Port Orange, October 2012
Based on the waste collection numbers for residential and commercial customers (estimated population 56,386) from October 1, 2011 through September 30, 2012, each person in Port Orange generated on average 2.95 pounds of solid waste, 0.44 pounds of recycled items, and 1.31 pounds of yard waste every day. The 2.95 pounds per capita of solid waste generated daily is slightly more than the previous year's figure of 2.90, but still below the LOS standard of 3.21 pounds. As indicated in Exhibit 17, the amount of solid waste generated was decreasing from 2005 to 2010, but has begun to slightly increase since 2011 back to the amount seen in the early 2000’s. Over this time period, the City’s population has been generally constant. The peak in solid waste generated during 2004 and 2005 was due to the additional waste created from the three hurricanes that affected the City. The ultimate goal of decreased solid waste generation will depend on active participation in recycling programs and the development of new packaging formats that utilize less raw material, function optimally, and are easily processed using eco-friendly production.
6 The amount of commercial recyclable items and yard waste was determined by interpolating the
proportion of residential recyclable items and yard waste to the total amount of residential waste disposed.

2012 Concurrency Management Report Page 32
Exhibit 17: Solid Waste Collected Compared to Population Growth
0
5,000
10,000
15,000
20,000
25,000
30,000
35,000
40,000
0
10,000
20,000
30,000
40,000
50,000
60,000
70,000
T
o
n
s
P
o
p
u
l
a
t
i
o
n
Year
Population
Solid Waste Total
Source: Public Works Department, City of Port Orange, October 2012
The amount of waste generated by individuals is not something that the City can directly control; however, the City can promote recycling programs to inform residents about the benefits of reducing the amount of waste generated. There is no concurrency review for trash collection; however, the City’s ability to collect and dispose of this waste is subject to concurrency review. As long as the City has sufficient financial resources to pay for private waste collection and room is available at the landfill, the City will have fulfilled its obligation to ensure that its waste is collected and disposed, regardless of the LOS standard.
Capacities Reserved for Approved but Unbuilt Development and its Impact on Capacity and LOS: The capacity reservations for vested and approved development identified in Exhibit 1 represent approximately 2,219 additional residential customers and 14 commercial customers. When all residential and commercial projects noted in Exhibits 2 and 3 are built, the amount of waste is estimated to increase by approximately 2,193 tons per year.
Proposed Public Improvements to the System in the Current Fiscal Year and its Impact on Capacity and LOS: No significant changes in solid waste collection are anticipated during FY 2012/2013.

2012 Concurrency Management Report Page 33
RECREATION AND OPEN SPACE During the 2011/2012 fiscal year, renovations were completed for the Airport Road Park tennis courts and the docks at Causeway Park. The Russell Park canoe/kayak launch was built, which includes a boat dock, six canoe docks ADA access and an overlook of Spruce Creek.
Exhibit 28: Russell Park canoe/kayak launch and Airport Road Park Tennis Courts
Adopted Level-of-Service Standards: FACILITY UNIT OF MEASURE Parkland 7 acres per 1,000 persons Ball Field 1 field per 5,000 persons Basketball Court 1 court per 4,000 persons Multipurpose Fields 1 field per 3,500 persons Tennis Court 1 court per 4,000 persons Neighborhood Center 1 facility per 15,000 persons Existing Recreational Facilities and Levels of Service: The existing acreage of parkland and the number of recreational facilities within the City are identified in the inventory in Exhibit 18 and the status of the recreational facility levels-of-service capacities are outlined in Exhibit 19.

2012 Concurrency Management Report Page 34
Exhibit 18: Recreational Facility Table Facility Name Location Acreage Ten. Bask. Soft. Multi.* Neigh C.
Regional Facilities
Causeway Park Dunlawton at P.O. Bridge 30
Cypress Head Golf Course Airport Rd. 160 1
Sugar Mill Ruins Herbert St. / Sugar Mill Rd. 10.3
Community Facilities
Adult Center Annex 3783 Halifax Dr. 0.3 1
Airport Road Park 6731 Airport Road 25 6 2 1
Allen Green Civic Center Clyde Morris Blvd. 10 1
*City Center Complex/YMCA Dunlawton/Clyde Morris Blvd. 49 4 5 5 3
*Coraci Park 5200 Coraci Blvd. 36 4 4
Lakeside Comm. Center 1999 City Center Circle 2 1
Riverside Pavilion Park Ridgewood / Park Ln. 3.5 1
Russel Property 6060 Deer Feed Trail 17
*Spruce Creek Rec. Area Spruce Creek Rd./Central Park 40 6 1 2 2
White Pl. Park /Senior Center 210 White Pl. (Ridgewood) 5.1 2 1 1
Neighborhood Facilities
Buschman Park North of Commonwealth 20
Creekside Middle School Airport Road 15 2 4 5
Fredricks St. Park Fredricks Street 5
Harbor Oaks Riverside Drive 10 1
Ken Bern Park Canal View Blvd. 5
Memorial Park Jackson & Oak Streets 12.6
Silver Sands Middle School Herbert St. 22.9 4 4 3 2
Southwinds Park Richel Drive 10 2
Willow Run Park 1351 Schoolhouse Dr. 10 2 6 2 2
TOTALS 498.7 22 22 17 23 9
Ten. – Tennis Court Bask. – Basketball Court Soft. – Baseball/Softball Field Multi. – Multipurpose Field (soccer, play, etc.) Neigh C. – Neighborhood Center
* Baseball/softball fields also function as multipurpose fields and are counted under both categories.
Source: Park & Recreation Department, City of Port Orange, October 2012

2012 Concurrency Management Report Page 35
Exhibit 19: Public Recreational Facilities Capacities and Level of Service (LOS) AMOUNT EXCESS (+) OR REQUIRED FOR CURRENT DEFICIENT (-) FACILITY ADOPTED LOS* SUPPLY** CAPACITY Parkland 410 acres 498.7 +88.7 acres Baseball/Softball Fields 12 fields 17 +5 fields Basketball Court 15 courts 22 +7 courts Multipurpose Fields 17 fields 23 +6 fields Tennis Court 15 courts 22 +7 courts Neighborhood Center 4 centers 9 +5 centers Notes: * Estimated City Population = 56,386 based on University of Florida Bureau of Economic and Business Research,
and anticipated population increases (2,219) from vested and reserved development. Total population to be served = 58,605
** Refer to Exhibit 18, Recreation Facilities Inventory, for individual facility listings.
Sources: Parks and Recreation Department and Community Development Department, October 2012
Capacities Reserved for Approved but Unbuilt Development and Its Impact on Capacity and LOS: According to the University of Florida Bureau of Economic and Business Research (BEBR), the 2012 estimated City population is 56,386. Anticipated population increases from vested and reserved development is approximately 2,219, which equals a total population to be served of 58,605. As indicated in Exhibit 19, the City is not deficient in any of the recreational facilities categories for the current population or additional population from vested and reserved development. Proposed Public and Private Improvements to Recreation Facilities in the Current Fiscal Year and its Impact on Capacity and LOS: The following improvements are planned for FY 2012/2013:
Multi-purpose field at Coraci Park - A multi-purpose field with a perimeter fence. The field will be used as a support field for the existing Coraci ball fields. (Construction scheduled to begin in November 2012.)
Fence Replacement - Replace fence, dugout and backstops for three fields at the City Center campus to meet current ADA requirements. (Construction scheduled to begin in November 2012.)
All Children’s Park Phase II - Expand the playground to include all inclusive equipment and play equipment for children 2-5 years old
Skate Park renovations - Renovate Skate Park to include new concrete and other features. The renovations will repair the unsafe conditions of the existing park.

2012 Concurrency Management Report Page 36
SCHOOLS Adopted Level-of-Service Standard: The uniform, district-wide LOS standards are as follows:
Elementary: 115% of permanent FISH7 capacity for the concurrency service area
K-8: 115% of permanent FISH capacity for the concurrency service area
Middle: 115% of permanent FISH capacity for the concurrency service area
High: 120% of permanent FISH capacity for the concurrency service area
Special Purpose Schools: 100% of permanent FISH capacity for each school
Public or Private Improvements to the System during the Past Fiscal Year and Its Impact on Capacity and LOS: The school district did not have any capital (capacity) projects scheduled in their five-year work plan. This is a result of significant decreases in capital funding. Existing Facilities: Exhibit 20 details existing public school facilities operated by the Volusia County School Board within the City’s municipal boundaries. For elementary and middle schools, the Concurrency Service Areas (CSAs) are the respective school attendance boundaries. High schools are grouped into five larger CSAs that reflect student movement between schools at this level. The high schools located in Port Orange are part of the Halifax Planning Area CSA. All of the high schools in this CSA are shown since the LOS standard is applied to the entire CSA.
As shown in Exhibit 20, one elementary school within Port Orange currently exceeds the LOS standards (Port Orange Elementary). School District analysis shows this to be the result of the gifted program that draws students from outside the attendance boundary and not unplanned development. The school district has begun an evaluation of the situation to try and resolve the issue, including potential programs shifts. Additionally, the student enrollment projections indicate that Port Orange Elementary will meet LOS standards by school year 2015/16.
Student Enrollment Trends The school district has experienced changes over the years to the student population. There has been a reduction in student enrollment since 2007. The trend of decreasing enrollment is consistent with the overall reduction in population projections being seen throughout the State.
Proposed Public and Private Improvements to School Facilities in the Current Fiscal Year and its Impact on Capacity and LOS: The school district does not have any capital (capacity) projects scheduled in their current five-year work plan. This is a result of significant decreases in capital funding.
7 FISH – Florida Inventory of School Houses. An official inventory report of all district-owned facilities.

2012 Concurrency Management Report Page 37
Exhibit 20: PORT ORANGE PUBLIC SCHOOL ENROLLEMENT & CAPACITY SUMMARY REPORT Projections
Prior Year Current Year
2011/2012 2012/2013 2013/2014 2014/2015 2015/2016
School Enroll Cap Util Enroll Cap Util Enroll Cap Util Enroll Cap Util Enroll Cap Util
Elementary
Cypress Creek 757 754 100% 762 754 102% 785 754 104% 787 754 104% 792 754 105%
Horizon 592 725 82% 615 725 85% 590 725 81% 587 725 81% 599 725 83%
Longstreet 399 492 81% 402 492 85% 444 492 90% 431 492 88% 437 492 89%
Port Orange 408 344 119% 415 344 121% 415 344 121% 408 344 119% 381 344 111%
Spruce Creek 723 823 88% 659 805 82% 727 805 90% 724 805 90% 720 805 89%
Sugar Mill 625 623 100% 610 623 98% 628 623 101% 625 623 100% 620 623 100%
Sweetwater 658 725 91% 602 725 83% 655 725 90% 656 725 90% 649 725 90%
Total 4162 4486
4065 4468
4244 4468
4218 4468
4198 4468
Middle
Creekside 1160 1132 102% 1146 1132 101% 1160 1132 102% 1182 1132 104% 1143 1132 101%
Silver Sands 1173 1161 101% 1197 1161 103% 1161 1161 100% 1157 1161 100% 1151 1161 99%
Total 2333 2293
2343 2293
2321 2293 2339 2293 2294 2293
High
Atlantic 1120 1445 78% 1034 1432 72% 1124 1432 78% 1110 1432 78% 1120 1432 78%
Mainland 1761 2375 74% 1832 2375 77% 1787 2375 75% 1798 2375 76% 1782 2375 75%
Seabreeze 1707 1747 98% 1660 1747 95% 1738 1747 99% 1747 1747 100% 1737 1747 99%
Spruce Creek 2874 2011 143% 2846 2079 137% 2825 2079 136% 2797 2079 135% 2748 2079 132%
Total 7462 7578 98% 7372 7633 97% 7474 7633 98% 7452 7633 98% 7387 7633 97% Notes: Red – over LOS standard; Blue – capacity addition * Student enrollment ** Permanent FISH capacity (does not include portables) *** Utilization - Percentage of student enrollment to permanent student capacity Source: DRAFT Volusia County School Board School Capacity Report, October 2012

2012 Concurrency Management Report Page 38
IV. SUMMARY AND CONCLUSIONS Staff finds all public facilities and services subject to concurrency review are at sufficient levels for FY 2012/2013. As new development and redevelopment occurs, the level of service will to be addressed along with the monitoring of all City facilities and services to ensure capacity is available. There are no roadways operating below the adopted Level-of-Service. Traffic volumes within the City have increased on some segments and decreased on other segments over the past year. Roads on the west side of I-95 will likely experience the most traffic growth in the future. Road improvements recently completed have increased capacities in the City. Some of the programmed improvements recently completed include: Dunlawton Ave./Village Tr. turn lane; Dunlawton Ave./I-95 Interchange turn lane; Dunlawton Ave./Spruce Creek Rd. turn lane; and the Clyde Morris Blvd./Willow Run Blvd. turn lane. Further improvements are anticipated over the next several years to keep pace with anticipated development. Sanitary sewer and potable water system capacity exist to support additional growth within the City. The City’s Consumptive Use Permit (CUP) limits how much water can actually be withdrawn from the aquifer. As new development and redevelopment occurs, the level of service for potable water will be monitored to ensure that permitted capacity as provided for in the City’s CUP is not surpassed. The stormwater LOS requirement continues to be met. The City will continue to identify long-term solutions to improve the overall performance of the drainage system. Solid waste generation rates do not exceed the LOS standard. LOS is being met for all but one of the public schools located in the Port Orange area. At this time, Port Orange Elementary exceeds the LOS standards; however, this is due to the gifted program offered at this school that draws students from outside the attendance boundary and not unplanned development. The school district will continue to monitor the capacity at this school.