Información importante de las escuelas - Antioch Unified ...
Upload
khangminh22Category
view
2download
0
City of Antioch, City of Concord, City of Pittsburg, City of Richmond,City of Walnut Creek, Contra Costa County
2010-2015Consolidated Plan
April 28, 2010
Contra Costa Consortium


CONTRA COSTA CONSORTIUM 2010–2015
Consolidated Plan
CONTRA COSTA COUNTY DEPARTMENT OF CONSERVATION AND DEVELOPMENT
2530 ARNOLD DRIVE, SUITE 190 MARTINEZ, CA 94553
CITY OF ANTIOCH COMMUNITY DEVELOPMENT DEPARTMENT
3RD AND “H” STREETS, 2ND FLOOR P.O. BOX 5007
ANTIOCH, CA 94531-5007
CITY OF CONCORD COMMUNITY AND RECREATION SERVICES DEPARTMENT
1950 PARKSIDE DRIVE, MS/10 CONCORD, CA 94519
CITY OF PITTSBURG COMMUNITY ACCESS DEPARTMENT
916 CUMBERLAND STREET PITTSBURG, CA 94565
CITY OF WALNUT CREEK COMMUNITY DEVELOPMENT DEPARTMENT 1666 NORTH MAIN STREET, 2ND FLOOR
WALNUT CREEK, CA 94596
CITY OF RICHMOND COMMUNITY & ECONOMIC DEVELOPMENT P.O. BOX 4046
440 CIVIC CENTER PLAZA RICHMOND, CA 94806
April 28, 2010


TABLE OF CONTENTS
Contra Costa Consortium 2010–2015 Consolidated Plan April 28, 2010
i
Consolidated Plan Appendices ...........................................................................................................iii
List of Tables .......................................................................................................................................... iv
Executive Summary .................................................................................................................................. 1
Introduction............................................................................................................................................. 1
Plan Organization ................................................................................................................................... 1
The Planning Process ............................................................................................................................. 1
Housing and Population Data .......................................................................................................... 1 Public Meetings ................................................................................................................................... 2 Online Survey ...................................................................................................................................... 2 Consultations ....................................................................................................................................... 2 Public Review ...................................................................................................................................... 2
Summary of Priority Needs, Objectives and Strategies .................................................................... 2
Housing Strategy ................................................................................................................................ 3 Non‐Housing Community Development Strategy ........................................................................ 4
Introduction ............................................................................................................................................... 7
Plan Organization ................................................................................................................................... 8
Geographic Terms .................................................................................................................................. 8
Community Needs .................................................................................................................................... 9
Demographic Profile .............................................................................................................................. 9
Population ............................................................................................................................................... 9
Population by Age ................................................................................................................................ 12
Race/Ethnicity ....................................................................................................................................... 13
Areas of Minority Concentration .................................................................................................... 13 Income .................................................................................................................................................... 16
Areas of Low‐ and Very Low‐Income Concentration ................................................................. 18 Poverty ................................................................................................................................................... 19
Education ............................................................................................................................................... 21
Employment .......................................................................................................................................... 22
Households ............................................................................................................................................ 25
Special Needs Populations – Non‐Homeless ................................................................................... 27
Elderly and Frail Elderly.................................................................................................................. 27 Persons with Disabilities .................................................................................................................. 29 Large Households ............................................................................................................................. 33

TABLE OF CONTENTS
2010–2015 Consolidated Plan Contra Costa Consortium April 28, 2010
ii
Single‐Parent Households ............................................................................................................... 35 Alcohol/Other Drug Abuse ............................................................................................................. 35 Persons with HIV/AIDS ................................................................................................................... 36 Victims of Domestic Violence ......................................................................................................... 37
Homeless ............................................................................................................................................... 39
Housing Market Profile ....................................................................................................................... 41
Housing Growth ............................................................................................................................... 41 Tenure ................................................................................................................................................. 41 Housing Type .................................................................................................................................... 44 Vacancy Rate ..................................................................................................................................... 46 Age of Housing Stock ....................................................................................................................... 48
Housing Conditions ............................................................................................................................. 50
Contra Costa County (Unincorporated County) .......................................................................... 50 Antioch ............................................................................................................................................... 50 Concord .............................................................................................................................................. 51 Pittsburg ............................................................................................................................................. 51 Richmond ........................................................................................................................................... 52 Walnut Creek ..................................................................................................................................... 52
Housing Cost ......................................................................................................................................... 53
Housing Affordability by Tenure and Household Type ................................................................ 55
Renter Households ........................................................................................................................... 56 Owner Households ........................................................................................................................... 57
Overcrowding ....................................................................................................................................... 60
Foreclosures ........................................................................................................................................... 60
Lead‐Based Paint .................................................................................................................................. 61
Public Housing and Public Housing Authorities ............................................................................ 62
Housing Authority of Contra Costa County ................................................................................ 62 Pittsburg Housing Authority .......................................................................................................... 63 Richmond Housing Authority ........................................................................................................ 64
Strategic Plan ........................................................................................................................................... 67
Purpose and Organization of the Strategic Plan .............................................................................. 67
Housing Strategy .................................................................................................................................. 68
Affordable Housing .......................................................................................................................... 68 Special Needs Housing .................................................................................................................... 70

TABLE OF CONTENTS
Contra Costa Consortium 2010–2015 Consolidated Plan April 28, 2010
iii
Homeless Strategy ............................................................................................................................ 72 Non‐Housing Community Development Strategy ......................................................................... 75
Public Services ................................................................................................................................... 75 Economic Development ................................................................................................................... 77 Infrastructure/Public Facilities ........................................................................................................ 77 Administration .................................................................................................................................. 78
Targeting of Estimated Resources ...................................................................................................... 79
Federal Funds .................................................................................................................................... 79 Local Funds ........................................................................................................................................ 79 Geographic Targeting and Neighborhood Revitalization .......................................................... 79
Public Housing Strategy ...................................................................................................................... 80
Contra Costa County Housing Authorities .................................................................................. 80 Strategies to Address the Needs of Public Housing .................................................................... 85
Barriers to Affordable Housing .......................................................................................................... 85
Implementation Strategies .................................................................................................................. 86
Obstacles to Meeting Underserved Needs .................................................................................... 86 Lead Hazard Reduction ................................................................................................................... 88 Anti‐Poverty ...................................................................................................................................... 89 Institutional Structure ...................................................................................................................... 90 Affirmatively Furthering Fair Housing ......................................................................................... 91 Monitoring ......................................................................................................................................... 91 Limited English Proficiency ............................................................................................................ 93
CONSOLIDATED PLAN APPENDICES 1. Areas of Minority Concentration 2. Areas of Hispanic Concentration 3. Areas of Low‐Income and Very Low‐Income Concentration 4. “CHAS” Tables 5. Lead Hazard Estimate Tables 6. Priority Need Tables (1B, 2A, 2B) 7. Citizen Participation and Public Comment

TABLE OF CONTENTS
2010–2015 Consolidated Plan Contra Costa Consortium April 28, 2010
iv
LIST OF TABLES Table 1 Current and Projected Population ......................................................................................... 10
Table 2 Rate of Change in Current and Projected Population ....................................................... 11
Table 3 Population by Age .................................................................................................................... 12
Table 4 Race as a Percentage of Total Population ............................................................................. 14
Table 5 Hispanic Origin as a Percentage of Total Population ........................................................ 15
Table 6 Income Categories .................................................................................................................... 16
Table 7 Income Characteristics for Incorporated Jurisdictions ...................................................... 17
Table 8 Income Characteristics for Unincorporated Areas ............................................................. 18
Table 9 Share of Population Below Poverty ...................................................................................... 20
Table 10 Educational Attainment for Persons Aged 25 Years and Older ..................................... 21
Table 11 Employment Statistics ........................................................................................................... 23
Table 12 Occupation as a Percentage of the Workforce ................................................................... 24
Table 13 Household Composition, 2009 ............................................................................................. 25
Table 14 Family Household Composition .......................................................................................... 26
Table 15 Senior Households ................................................................................................................. 28
Table 16 Disability Status and Types ................................................................................................. 30
Table 17 Licensed Care Facilities by Jurisdiction and Type ........................................................... 32
Table 18 Large Households ................................................................................................................... 34
Table 19 Single‐Parent Households .................................................................................................... 35
Table 20 Unsheltered Individuals ....................................................................................................... 40
Table 21 Sheltered Individuals ............................................................................................................ 40
Table 22 Housing Units, 2000–2009 ..................................................................................................... 42
Table 23 Housing Tenure ...................................................................................................................... 43
Table 24 Tenure by Units in Structure ................................................................................................ 45
Table 25 Vacancy Status, 2009............................................................................................................... 47
Table 26 Vacancy Status, 2000............................................................................................................... 48
Table 27 Age of Housing by Tenure .................................................................................................... 49
Table 28 Median Home Sale Listings ................................................................................................. 54
Table 29 Median Rental Listings ......................................................................................................... 55
Table 30 Fair Market Rents, 2009 ......................................................................................................... 55
Table 31 Cost Burden Summary, Renters ........................................................................................... 59

TABLE OF CONTENTS
Contra Costa Consortium 2010–2015 Consolidated Plan April 28, 2010
v
Table 32 Cost Burden Summary, Owners .......................................................................................... 59
Table 33 Persons per Room ................................................................................................................... 60
Table 34 Foreclosure Activity ............................................................................................................... 61
Table 35 Needs of Families on the Public Housing Authority Waiting List, Pittsburg ............ 64
Table 36 Needs of Families on the Public Housing Authority Waiting List, Richmond .......... 65


Contra Costa Consortium 2010–2015 Consolidated Plan April 28, 2010
1
EXECUTIVE SUMMARY
INTRODUCTION The Consolidated Plan fulfills the requirement that recipients of certain funds administered by the federal Department of Housing and Urban Development (HUD) create a plan describing how these funds will be expended over a five‐year period. These funds are Community Development Block Grant (CDBG), Home Investment Partnerships Program (HOME), Emergency Shelter Grant (ESG), and Housing for Persons With AIDS (HOPWA). This Consolidated Plan is for the period of July 1, 2010, to June 30, 2015.
The cities of Antioch, Concord, Pittsburg, Richmond, and Walnut Creek and the County of Contra Costa have formed the Contra Costa Consortium to cooperatively plan for the housing and community development needs of the County. This Consolidated Plan was created by the Consortium to assess the needs of all Consortium member communities and to guide the use of funds within each individual member community.
The County of Contra Costa is responsible for planning for the use of funds in the unincorporated areas of the County and the communities of Brentwood, Clayton, Danville, El Cerrito, Hercules, Lafayette, Martinez, Moraga, Oakley, Orinda, Pinole, Pleasant Hill, San Pablo, and San Ramon.
PLAN ORGANIZATION The Consolidated Plan has four major components: the Executive Summary, the introduction, the assessment of Community Needs, and the Strategic Plan. The Consolidated Plan also has several appendices including maps, tables and supplemental information regarding community needs and the planning process.
THE PLANNING PROCESS The planning process involved the assessment of current housing and population needs through the analysis of available data, public meetings, an online survey, and consultations with service providers and key stakeholders.
HOUSING AND POPULATION DATA Available data utilized includes the 2000 U.S. Decennial Census, the 2007 American Community Survey, housing and population reports from the California Department of Finance, reports from the California Department of Employment Development, the Association of Bay Area Governments, and the U.S. Department of Housing and Urban Development.

EXECUTIVE SUMMARY
2010–2015 Consolidated Plan Contra Costa Consortium April 28, 2010
2
PUBLIC MEETINGS Public meetings requested those attending to comment on the level of housing and community development needs in the County and the relative priority of those needs. The meetings made use of live polling technology (Turning Point) to document audience responses. All public meetings were advertised in the Contra Costa Times. The Consortium held five public meetings:
• August 26, 2009 (evening) – Pinole, Public Library • September 8, 2009 (evening) – Oakley, Community Annex • September 15, 2009 (day) – Walnut Creek, St. Paul’s • September 29, 2009 (evening) – Concord, Meadow Homes School
The Consortium also discussed priority needs with the County’s housing and social services providers at its annual CDBG and HOME application workshop on October 8, 2009.
ONLINE SURVEY Recognizing that not all can attend public meetings and that the scope of a one‐hour meeting is limited, the Consortium provided an online survey. The survey was mentioned in all meeting advertisements and mentioned at all public meetings.
CONSULTATIONS The Consortium consulted with a wide range of service providers and stakeholders. These involved both the public sector and private non‐profit sector. These personal contacts asked those who help to meet the housing and social services needs of the residents of Contra Costa County to describe level of needs in the community, the relative priority of needs and what they believe can be done to better meet the needs of the County’s residents.
PUBLIC REVIEW A draft of the Consolidated Plan was made available for public review and comment from March 27, 2010, to April 26, 2010.
SUMMARY OF PRIORITY NEEDS, OBJECTIVES AND STRATEGIES The Consolidated Plan sets forth the priority needs, objectives and strategies for the five‐year planning period. Priority needs have been determined as the result of the needs assessment process. The Community Needs section of the Consolidated Plan provides a detailed discussion of needs.
The Strategic Plan section establishes the priority of needs, objectives and strategies. The objectives are intended to meet the identified priority needs. The strategies are programs or polices intended to implement the objectives. Each strategy is identified with one or more objectives that it advances.

EXECUTIVE SUMMARY
Contra Costa Consortium 2010–2015 Consolidated Plan April 28, 2010
3
A priority need is one that has a demonstrated level of need and will have a preference for funding. A higher level of priority can be established as the result of a high absolute level of need or a high level of need in relation to resources available to meet that need.
A detailed discussion of the priority needs, objectives and strategies are included in the Strategic Plan section.
HOUSING STRATEGY
Affordable Housing
Objectives
AH‐1: Expand housing opportunities for extremely low‐income, very low‐income, low‐income, and moderate‐income households through an increase in the supply of decent, safe, and affordable rental housing and rental assistance.
AH‐2: Increase homeownership opportunities.
AH‐3: Maintain and preserve the existing affordable housing stock.
AH‐4: Reduce the number and impact of home foreclosures.
Strategies
• Land Acquisition for New Construction (AH‐1, 2) • Construction and Development of New Affordable Housing (AH‐1, 2) • Acquisition and Rehabilitation (AH‐1, 2, 3, 4) • Owner‐Occupied Single‐Family Rehabilitation (AH‐3) • Rental Rehabilitation (AH‐1, 3) • First‐Time Homebuyer (AH‐2) • Homebuyer Foreclosure Counseling (AH‐4)
Special Needs Housing
Objectives
AH‐5: Increase the supply of appropriate and supportive housing for special needs populations.
AH‐6: Preserve existing special needs housing.
AH‐7: Adapt or modify existing housing to meet the needs of special needs populations.
AH‐8: Improve access to services for those in special needs housing.
Strategies
All affordable housing programs will target special needs populations as appropriate.

EXECUTIVE SUMMARY
2010–2015 Consolidated Plan Contra Costa Consortium April 28, 2010
4
• Supportive and Special Needs Housing Production (AH‐5) • Supportive and Special Needs Housing Preservation (AH‐6) • Housing Accessibility Modifications (AH‐7) • Housing and Supportive Services Coordination (AH‐8)
Homeless Strategy
Objectives
H‐1: Assist the homeless and those at risk of becoming homeless by providing emergency, transitional, and permanent affordable housing with appropriate supportive services.
H‐2: Reduce the incidence of homelessness and assist in alleviating the needs of the homeless.
In addition to these objectives, the affordable housing and human services objectives of the Plan also address the needs of the homeless and the problem of homelessness.
Strategies
• Affordable Housing Production (H‐1) • Emergency Shelter Programs (H‐1) • Crisis Intervention (H‐2) • Family Shelter and Homeless Housing (H‐1) • Services to the Homeless (H‐2)
NON-HOUSING COMMUNITY DEVELOPMENT STRATEGY
Public Services
Objectives
CD‐1 General Public Services: Ensure that opportunities and services are provided to improve the quality of life and independence for lower‐income persons, and ensure access to programs that promote prevention and early intervention related to a variety of social concerns such as substance abuse, hunger, and other issues.
CD‐2 Seniors: Enhance the quality of life of senior citizens and frail elderly, and enable them to maintain independence.
CD‐3 Youth: Increase opportunities for children/youth to be healthy, succeed in school, and prepare for productive adulthood.
CD‐4 Non‐Homeless Special Needs: Ensure that opportunities and services are provided to improve the quality of life and independence for persons with special needs, such as disabled persons, battered spouses, abused children, persons with HIV/AIDS, illiterate adults, and migrant farmworkers.

EXECUTIVE SUMMARY
Contra Costa Consortium 2010–2015 Consolidated Plan April 28, 2010
5
CD‐5 Fair Housing: Continue to promote fair housing activities and affirmatively further fair housing.
Strategies
• Social Services Programs – General (CD‐1, 2, 3, 5) • Emergency Shelter – Non‐Homeless (CD‐4) • Crisis Intervention (CD‐1, 2, 3, 4) • Information and Referral, and Outreach (CD‐1)
Economic Development
Objectives
CD‐6 Economic Development: Reduce the number of persons with incomes below the poverty level, expand economic opportunities for very low‐ and low‐income residents, and increase the viability of neighborhood commercial areas.
Strategies
• Job Training (CD‐6) • Small Business Assistance (CD‐6)
Infrastructure/Public Facilities
Objectives
CD‐7 Infrastructure and Accessibility: Maintain quality public facilities and adequate infrastructure, and ensure access for the mobility‐impaired by addressing physical access barriers to public facilities.
Strategies
• Construct or Improve Public Facilities (CD‐7) • Removal of Barriers (CD‐7) • Right‐of‐Way Improvements (CD‐7)
Administration
Objective
CD‐8 Administration: Support development of viable urban communities through extending and strengthening partnerships among all levels of government and the private sector, and administer federal grant programs in a fiscally prudent manner.
Strategies
• Collaboration and Standardization (CD‐8) • Support of Inter‐Jurisdictional Efforts (CD‐8)

EXECUTIVE SUMMARY
2010–2015 Consolidated Plan Contra Costa Consortium April 28, 2010
6

Contra Costa Consortium 2010–2015 Consolidated Plan April 28, 2010
7
INTRODUCTION
This Consolidated Plan fulfills the requirement that recipients of certain funds administered by the federal Department of Housing and Urban Development (HUD) create a plan describing how these funds will be expended over a five‐year period. These funds are Community Development Block Grant (CDBG), Home Investment Partnerships Program (HOME), Emergency Shelter Grant (ESG), and Housing for Persons With AIDS (HOPWA). This Consolidated Plan is for the period of July 1, 2010, to June 30, 2015.
The cities of Antioch, Concord, Pittsburg, Richmond, and Walnut Creek and the County of Contra Costa have formed the Contra Costa Consortium to cooperatively plan for the housing and community development needs of the County. This Consolidated Plan was created by the Consortium to assess the needs of all Consortium member communities and to guide the use of funds within each individual member community.
The County of Contra Costa is responsible for planning for the use of funds in the unincorporated areas of the County and the communities of Brentwood, Clayton, Danville, El Cerrito, Hercules, Lafayette, Martinez, Moraga, Oakley, Orinda, Pinole, Pleasant Hill, San Pablo, and San Ramon.
Principal cities of metropolitan areas and other metropolitan cities with populations of at least 50,000 persons and urban counties with populations of at least 200,000 persons are eligible to receive an annual allocation of funds through the federal Community Development Block Grant (CDBG) program. These cities and counties are known as “entitlement communities.” The jurisdiction of an Urban County entitlement community includes the unincorporated area of the county and the non‐entitlement municipalities within the county.
Cities and counties who are eligible to receive at least $500,000 in funding under the HOME Investment Partnerships Program (HOME) may receive a direct allocation of HOME Program funding from HUD. These municipalities are known as “Participating Jurisdictions.” Cities and counties may join together to form a HOME Consortium to meet the HOME funding threshold and thereby receive a joint allocation of HOME funding.
The Urban County and the cities of Antioch, Concord, Pittsburg, and Walnut Creek receive HOME funds as a formal HOME Consortium. The City of Richmond receives HOME funds as a Participating Jurisdiction.
The Urban County receives Emergency Shelter Grant (ESG) and Housing Opportunities for People With AIDS (HOPWA) funds that it administers for the benefit of the Urban County.

INTRODUCTION
2010–2015 Consolidated Plan Contra Costa Consortium April 28, 2010
8
PLAN ORGANIZATION The Consolidated Plan has four major components: the Executive Summary, this introduction, the assessment of Community Needs, and the Strategic Plan. The Consolidated Plan also has several appendices including maps, tables and supplemental information regarding community needs and the planning process.
GEOGRAPHIC TERMS Throughout this document the following geographic terms will be used. To assist the reader, below is an explanation of each.
• Contra Costa County “County” (countywide): Includes all 19 jurisdictions within the County as well as the unincorporated area of the County (Antioch, Brentwood, Clayton, Concord, Danville, El Cerrito, Hercules, Lafayette, Martinez, Moraga, Oakley, Orinda, Pinole, Pleasant Hill, Pittsburg, Richmond, San Pablo, San Ramon, the unincorporated area of the County, and Walnut Creek).
• Urban County: Includes all jurisdictions which are not entitlement jurisdictions (Brentwood, Clayton, Danville, El Cerrito, Hercules, Lafayette, Martinez, Moraga, Oakley, Orinda, Pinole, Pleasant Hill, San Pablo, San Ramon, and the unincorporated area of the County).
• Unincorporated County: Includes unincorporated area of the County (this area is not a part of any municipality).
• Entitlement Cities: The CDBG entitlement cities in the County are Antioch, Concord, Pittsburg, Richmond and Walnut Creek.
• HOME Consortium: The members of the HOME Consortium are Antioch, Concord, Pittsburg, and Walnut Creek.

Contra Costa Consortium 2010–2015 Consolidated Plan April 28, 2010
9
COMMUNITY NEEDS
The community needs section of the Consolidated Plan provides a community profile that describes the housing and population characteristics of the County and cities in the County. This section serves as the basis for determining the housing and community development needs in Contra Costa County.
The data sources used to compile this section include the U.S. Census, the Association of Bay Area Governments (ABAG) Projections, and the California Department of Finance, supplemented with current market data and secondary sources of information such as local Housing Elements, reports from service providers, and reports produced by local government agencies. As the 2000 U.S. Census data is 10 years old, information from the Census was only used when more recent data was unavailable.
DEMOGRAPHIC PROFILE The following information provides a profile of the residents of Contra Costa County, the Urban County, and specifically the cities of Antioch, Concord, Pittsburg, Richmond, and Walnut Creek, including age and racial/ethnic composition. The section focuses on anticipated changes, which are significant when planning for the Consortium’s needs over the next five years.
POPULATION Tables 1 and 2 demonstrate a few notable growth trends in the Bay Area and in Contra Costa County and its cities. The estimated annual percentage growth rate from 2000 to 2010 decreased with respect to the actual annual growth percentage rate from 1990 to 2000 for the County and cities.
From 1990 to 2000, the actual growth percentage rate in the County (18.1 percent), Antioch (46.0 percent), Pittsburg (19.5 percent), and Richmond (14.1 percent) exceeds the percentage growth for the Bay Area (12.6 percent) as a whole.
According to the Association of Bay Area Governments (ABAG) Projections 2007, the population in Contra Costa County is expected to reach 1,061,900 in 2010 and grow to 1,105,600 by 2015. Between 2010 and 2015 the County’s population is estimated to grow by 4.3 percent.

COMMUNITY NEEDS
2010–2015 Consolidated Plan Contra Costa Consortium April 28, 2010
10
TABLE 1 CURRENT AND PROJECTED POPULATION
Jurisdiction 1990 1 2000 1 2010 2 2015 2 2020 2
Bay Area 6,023,577 6,783,760 7,412,500 7,730,000 8,069,700
Urban County
Brentwood 7,563 23,284 51,300 56,900 67,400
Clayton 7,317 10,792 11,300 11,700 12,000
Danville 31,306 42,127 44,000 44,400 45,000
El Cerrito 22,869 23,179 23,600 23,900 24,500
Hercules 16,829 19,299 23,900 25,200 26,400
Lafayette 23,501 23,463 24,500 24,700 25,300
Martinez 32,038 36,167 37,600 38,600 39,600
Moraga 15,852 16,642 16,700 16,900 17,500
Oakley 3 18,225 25,465 31,950 34,050 35,850
Orinda 16,642 17,446 18,000 18,200 18,500
Pinole 17,460 19,394 20,100 20,300 20,700
Pleasant Hill 31,585 32,847 33,900 34,400 34,900
San Pablo 25,158 30,121 31,400 31,700 32,100
San Ramon 35,303 44,477 58,200 64,400 70,300
Unincorporated County 151,690 159,650 165,550 173,050 179,050
Urban County Subtotal 377,247 427,978 592,000 618,400 649,100
Entitlement Jurisdictions
Antioch 62,195 90,814 106,000 111,400 115,000
Concord 111,348 121,710 125,800 129,400 135,400
Pittsburg 47,564 56,820 65,900 67,900 71,000
Richmond 87,425 99,716 104,700 109,800 115,600
Walnut Creek 60,569 64,583 67,500 68,700 70,900
Contra Costa County (countywide) Total 746,348 861,621 1,061,900 1,105,600 1,157,000
Source: 1990 and 2000 U.S. Census, Summary File 3, Table P1; Association of Bay Area Governments, Projections 2007 Note: Due to rounding errors, total percentage of persons under 18 and over 18 for individual jurisdictions may not equal 100. 1 Data provided by the 1990 and 2000 Census. 2 Data provided by ABAG. 3 Oakley was incorporated as a city July 1, 1999; therefore, the data under 1990 is from the Oakley Census Designated Place (CDP).

COMMUNITY NEEDS
Contra Costa Consortium 2010–2015 Consolidated Plan April 28, 2010
11
TABLE 2 RATE OF CHANGE IN CURRENT AND PROJECTED POPULATION
Jurisdiction 1990 to 2000 2000 to 2010 2010 to 2015
Annual Growth
Total Growth
Annual Growth
Total Growth
Annual Growth
Total Growth
Urban County
Brentwood 20.8% 207.9% 12.0% 120.2% 3.2% 16.2%
Clayton 4.7% 47.5% 0.5% 5.0% 0.7% 3.5%
Danville 3.5% 34.6% 0.6% 5.5% 0.2% 0.9%
El Cerrito 0.1% 1.4% 0.2% 1.8% 0.3% 1.3%
Hercules 1.5% 14.7% 2.3% 22.7% 1.1% 5.4%
Lafayette 0.0% -0.2% 0.3% 2.5% 0.1% 0.8%
Martinez 1.3% 12.9% 0.4% 4.8% 0.5% 2.7%
Moraga 0.5% 5.0% 0.3% 2.5% 0.2% 1.2%
Oakley 3.9% 39.5% 2.5% 24.7% 1.3% 6.6%
Orinda 0.5% 4.8% 0.2% 2.3% 0.2% 1.1%
Pinole 1.1% 11.1% 0.6% 5.6% 0.2% 1.0%
Pleasant Hill 0.4% 4.0% 0.3% 3.2% 0.3% 1.5%
San Pablo 2.0% 19.7% 0.4% 3.9% 0.2% 1.0%
San Ramon 2.6% 26.0% 3.0% 30.1% 2.1% 10.7%
Unincorporated County 0.5% 5.2% 0.9% 9.1% 0.9% 4.5%
Urban County Total 1.4% 13.6% 1.5% 14.9% 0.4% 4.46%
Entitlement Jurisdictions
Antioch 4.6% 46.0% 1.7% 17.1% 0.8% 4.2%
Concord 0.9% 9.3% 0.3% 3.3% 0.6% 2.9%
Pittsburg 1.9% 19.5% 1.6% 16.1% 0.6% 3.0%
Richmond 1.4% 14.1% 0.6% 5.5% 1.0% 4.9%
Walnut Creek 0.7% 6.6% 0.5% 5.0% 0.4% 1.8%
Contra Costa County (countywide) Total 1.8% 18.1% 1.2% 11.9% 0.9% 4.3%
Source: 1990 and 2000 U.S. Census, Summary File 3, Table P1; Association of Bay Area Governments, Projections 2007

COMMUNITY NEEDS
2010–2015 Consolidated Plan Contra Costa Consortium April 28, 2010
12
POPULATION BY AGE Table 3 shows population by age group. Of the jurisdictions in Contra Costa County, Walnut Creek had the largest share of persons over 65 (25.0 percent), followed by El Cerrito (20.7 percent) and Orinda (18.4 percent). Oakley had the largest percentage of persons under the age of 18 (34.7 percent), followed by Brentwood (33.8 percent) and Antioch (33.7 percent). Contra Costa County had a total of 27.7 percent of persons under 18 and 11.3 percent of persons over 65.
TABLE 3 POPULATION BY AGE
Jurisdiction Percentage of Persons Under 18
Percentage of Persons Over 18
Percentage of Persons Age 19–64
Percentage of Persons Over 65
Urban County
Brentwood 33.8% 66.1% 56.5% 9.6%
Clayton 26.9% 72.5% 63.4% 9.1%
Danville 29.5% 70.5% 60.2% 10.3%
El Cerrito 16.6% 83.4% 62.7% 20.7%
Hercules 28.7% 71.3% 64.5% 6.8%
Lafayette 26.4% 73.6% 59.6% 14.0%
Martinez 24.0% 76.0% 65.8% 10.2%
Moraga 25.6% 74.4% 59.2% 15.2%
Oakley 34.7% 64.6% 58.8% 5.8%
Orinda 26.4% 73.6% 55.2% 18.4%
Pinole 26.6% 73.5% 59.4% 14.1%
Pleasant Hill 22.6% 77.4% 64.3% 13.1%
San Pablo 33.0% 67.0% 58.1% 8.9%
San Ramon 27.4% 72.6% 66.4% 6.2%
Unincorporated County 27.2% 72.8% 61.9% 10.9%
Urban County Total 27.4% 72.6% 60.1% 11.1%
Entitlement Jurisdictions
Antioch 33.7% 66.3% 59.0% 7.3%
Concord 26.5% 72.4% 61.6% 10.8%
Pittsburg 31.3% 67.9% 59.7% 8.2%
Richmond 28.7% 71.2% 61.6% 9.6%
Walnut Creek 18.0% 81.6% 56.6% 25.0%
Contra Costa County (countywide) Total 27.7% 72.3% 61.0% 11.3%
Source: 2000 U.S. Census, Summary File 3, Table P8 Note: Due to rounding errors, total percentage of persons under 18 and over 18 for individual jurisdictions may not equal 100.

COMMUNITY NEEDS
Contra Costa Consortium 2010–2015 Consolidated Plan April 28, 2010
13
RACE/ETHNICITY Although Contra Costa County is generally diverse, the particular racial and ethnic composition varies by community. Please see Tables 4 and 5.1 Of the nineteen cities in the County, there are eight with a White population of over 80 percent (Clayton, Danville, Lafayette, Martinez, Moraga, Orinda, Pleasant Hill, Walnut Creek), and six with a minority population near or greater than 50 percent (El Cerrito, Hercules, Pinole, San Pablo, Pittsburg, and Richmond).
In a similar fashion, four communities have an Hispanic or Latino population over 25 percent (Brentwood, Oakley, San Pablo, Richmond), and six have an Hispanic or Latino population of less than 6 percent (Clayton, Danville, Lafayette, Moraga, Orinda, Walnut Creek).
The communities that are predominantly White tend to be those located in the central portion of the County, in the Interstate Highway 680 corridor. The predominantly minority and Hispanic or Latino communities tend to be in the industrial and agricultural eastern and western regions of the County.
AREAS OF MINORITY CONCENTRATION Data on race and ethnicity were examined at the block group level to determine areas of minority and ethnic concentration (2000 U.S. Decennial Census, Summary File 3). Minority population is defined as the total population less those who responded “White alone” to the U.S. Census. Block group areas where the percentage of total minority population exceeds the group’s countywide total percentage by at least one percentage point are considered to be areas of “minority concentration.” Areas that have a minority population at least 1.5 times the countywide total percentage are considered to be areas of “high minority concentration.” Note that of all the entitlement jurisdictions, Walnut Creek does not have any areas of minority concentration, therefore a map was not included. Please see Maps 1 through 5 in Appendix 1. (Please note that although Census tract boundaries are contiguous with County boundaries, block group area boundaries within tracts may not be contiguous with current city boundaries.)
It should be noted that in all areas which show an overall minority concentration, the predominant minority group is Black/African American.
Since the U.S. Census enumerates Hispanic as a distinct ethnic category, this characteristic was examined separately. Block group areas where the percentage of total Hispanic population exceeds the countywide percentage by at least one percentage point are considered to be areas of Hispanic concentration. The average countywide percentage of Hispanic population is 17.6 percent. Areas that have a Hispanic population at least 1.5 times the countywide percentage are considered to be areas of high Hispanic concentration. Of all the entitlement jurisdictions,
1 Race is shown for persons who reported being of that race alone. Persons reporting more than one race are included in “two or more races.” Persons who indicated they were of only one race but did not report a race in one of the five categories shown are included in “some other race.”

COMMUNITY NEEDS
2010–2015 Consolidated Plan Contra Costa Consortium April 28, 2010
14
Walnut Creek does not have any areas of Hispanic concentration therefore a map was not included. Please see Maps 6 through 10 in Appendix 2.
TABLE 4 RACE AS A PERCENTAGE OF TOTAL POPULATION
Jurisdiction White Black or African
American
American Indian or Alaskan Native
Asian
Native Hawaiian and Other
Pacific Islander
Some other race
Two or more races
Urban County
Brentwood 74.0% 1.5% 0.5% 3.3% 0.2% 14.0% 6.6%
Clayton 87.7% 1.2% 0.1% 5.5% 0.4% 1.3% 3.8%
Danville 86.3% 1.0% 0.2% 8.5% 0.0% 0.9% 3.0%
El Cerrito 57.0% 8.1% 0.6% 24.3% 0.5% 3.4% 6.2%
Hercules 28.0% 18.8% 0.6% 43.0% 0.2% 5.1% 4.6%
Lafayette 88.0% 0.5% 0.2% 7.0% 0.1% 0.9% 3.3%
Martinez 81.0% 3.3% 0.8% 6.4% 0.1% 3.4% 5.0%
Moraga 80.0% 1.3% 0.4% 13.0% 0.1% 1.6% 4.1%
Oakley 76.0% 3.0% 0.7% 3.0% 0.0% 11.1% 6.6%
Orinda 87.0% 0.3% 0.2% 8.7% 0.2% 0.8% 3.0%
Pinole 55.0% 10.9% 0.5% 21.1% 0.9% 5.8% 6.0%
Pleasant Hill 82.0% 1.1% 0.5% 10.0% 0.3% 1.9% 4.3%
San Pablo 31.0% 18.3% 1.1% 16.3% 0.2% 26.0% 7.0%
San Ramon 76.0% 2.1% 0.4% 15.3% 0.2% 2.2% 3.8%
Unincorporated County 66.1% 9.9% 0.8% 10.9% 0.6% 5.9% 5.7%
Urban County Total 65.3% 9.2% 0.6% 10.9% 0.4% 8.2% 5.5%
Entitlement Jurisdictions
Antioch 65.2% 9.5% 0.8% 7.3% 0.4% 9.2% 7.5%
Concord 70.7% 3.0% 0.8% 9.4% 0.5% 9.7% 5.9%
Pittsburg 43.5% 18.9% 0.8% 12.7% 0.9% 16.1% 7.2%
Richmond 31.4% 36.1% 0.7% 12.3% 0.5% 13.9% 5.3%
Walnut Creek 83.9% 1.1% 0.3% 9.4% 0.2% 2.0% 3.3%
Contra Costa County (countywide) Total 65.5% 9.4% 0.6% 11.0% 0.4% 8.1% 5.1%
Source: 2000 U.S. Census, Summary File 3, Table P6 Note: Rounding may lead to row totals slightly more or less than 100%.

COMMUNITY NEEDS
Contra Costa Consortium 2010–2015 Consolidated Plan April 28, 2010
15
TABLE 5 HISPANIC ORIGIN AS A PERCENTAGE OF TOTAL POPULATION
Jurisdiction Hispanic or Latino (all races) Not Hispanic or Latino (all races)
Urban County
Brentwood 28.9% 71.1%
Clayton 5.7% 94.3%
Danville 4.9% 95.1%
El Cerrito 7.9% 92.1%
Hercules 10.8% 89.2%
Lafayette 4.3% 95.7%
Martinez 10.6% 89.4%
Moraga 4.6% 95.4%
Oakley 24.6% 75.4%
Orinda 3.5% 96.5%
Pinole 14.4% 85.6%
Pleasant Hill 8.2% 91.8%
San Pablo 44.5% 55.5%
San Ramon 7.2% 92.8%
Unincorporated County 20.6% 79.4%
Urban County Total 17.7% 82.3%
Entitlement Jurisdictions
Antioch 22.0% 78.0%
Concord 21.9% 78.1%
Pittsburg 32.0% 68.0%
Richmond 26.8% 73.2%
Walnut Creek 5.8% 94.2%
Contra Costa County (countywide) Total 17.7% 82.3%
Source: 2000 U.S. Census, Summary File 3, Table P7

COMMUNITY NEEDS
2010–2015 Consolidated Plan Contra Costa Consortium April 28, 2010
16
INCOME In this plan, income will be discussed using the terms as defined in Table 6 below. These terms correspond to the income limits published annually by HUD. HUD bases these income categories on the Decennial Census with adjustment factors applied using the annual American Community Survey. Income categories take into consideration family size. The income limit for a family of four is shown for illustration.
TABLE 6 INCOME CATEGORIES
Term Percentage AMI1 2009 Income Limit, Family of 42
Extremely low income 30% $26,790
Very low income 50% $44,650
Low income 80% $66,250
Moderate income3 120% $107,160
1 AMI = area median family income 2 Oakland‐Fremont HMFA (HUD Metropolitan FMR Area) including Contra Costa County. 3 HUD does not publish a “moderate income” limit. It is calculated as 2.4 times the published very low‐income limit.
Table 7 provides a summary of income statistics as reported by the 2000 Census for all jurisdictions within Contra Costa County except the unincorporated area of the County. The 2000 Census does not provide information for the unincorporated area but does include data for a Census‐designated place (CDP). A CDP comprises a densely settled concentration of population that is not within an incorporated place but is locally identified by a name. Contra Costa County has 22 different CDPs. To get a better idea of the incomes for the unincorporated area, Table 8 provides data for each CDP in the unincorporated County.
The communities of Contra Costa County have a significant disparity of household income between them. Four cities and three CDPs have annual median household incomes above $100,000 (Clayton, Danville, Lafayette, Orinda, Alamo, Blackhawk‐Camino/Tassajara, and Diablo). None of these communities are CDBG entitlement jurisdictions.
Three cities and eight CDPs have annual median household incomes near or below $50,000 (San Pablo, Pittsburg, Richmond, Bay Point, Bethel Island, Byron, Crockett, El Sobrante, Pacheco, Rollingwood, and Vine Hill). Two of these communities are CDBG entitlement jurisdictions, eight are un‐incorporated CDPs.
Higher income communities in the County tend to be in the central region, lower income communities are more likely to be in the industrial and agricultural communities of the eastern and western regions.

COMMUNITY NEEDS
Contra Costa Consortium 2010–2015 Consolidated Plan April 28, 2010
17
TABLE 7 INCOME CHARACTERISTICS FOR INCORPORATED JURISDICTIONS
Jurisdiction Median Household Income Per Capita Income
Urban County
Brentwood $69,198 $24,909
Clayton $101,651 $42,048
Danville $114,064 $50,773
El Cerrito $57,253 $32,593
Hercules $75,196 $27,699
Lafayette $102,107 $54,319
Martinez $63,010 $29,701
Moraga $98,080 $45,437
Oakley $65,589 $21,895
Orinda $117,637 $65,428
Pinole $62,256 $25,170
Pleasant Hill $67,489 $33,076
San Pablo $37,184 $14,303
San Ramon $95,856 $42,336
Unincorporated County See Table 8
Urban County Total n/a n/a
Entitlement Jurisdictions
Antioch $60,359 $22,152
Concord $55,597 $24,727
Pittsburg $50,557 $18,241
Richmond $44,210 $19,788
Walnut Creek $63,238 $39,875
Contra Costa County (countywide) Total $63,675 $30,615
Source: 2000 U.S. Census, Summary File 3, Table P53 and P82

COMMUNITY NEEDS
2010–2015 Consolidated Plan Contra Costa Consortium April 28, 2010
18
TABLE 8 INCOME CHARACTERISTICS FOR UNINCORPORATED AREAS
Census Designated Place Median Household Income Per Capita Income
Alamo CDP $137,105 $65,705
Bay Point CDP $44,951 $16,743
Bayview-Montalvin CDP $50,750 $16,056
Bethel Island CDP $44,569 $26,739
Blackhawk-Camino Tassajara CDP $154,598 $66,972
Byron CDP $35,938 $21,231
Clyde CDP $66,875 $30,822
Crockett CDP $48,574 $27,469
Diablo CDP $197,904 $95,419
Discovery Bay CDP $89,915 $41,313
East Richmond Heights CDP $57,500 $27,873
El Sobrante CDP $48,272 $24,525
Kensington CDP $93,247 $55,275
Knightsen CDP $58,929 $22,191
Mountain View CDP $51,986 $26,071
Pacheco CDP $45,851 $26,064
Port Costa CDP $61,429 $33,563
Rodeo CDP $60,522 $21,432
Rollingwood CDP $48,229 $13,428
Tara Hills CDP $56,380 $22,946
Vine Hill CDP $48,125 $17,985
Walden CDP $58,552 $41,093
Source: 2000 U.S. Census, Summary File 3, Table P53 and P82
AREAS OF LOW- AND VERY LOW-INCOME CONCENTRATION Data on income was examined at the block group level to determine areas of low‐ and very low‐income concentration (2009 HUD Low and Moderate Income Summary Data).
Low‐income areas are those that have 51 percent or more low‐income persons.2 The exception is the Urban County and entitlement communities within the County which have been designated by HUD as “exception grantees.” In those communities, the HUD exception
2 Using the LOWMODPCT variable which is defined as “the percentage of persons who are of low/moderate income; calculated by LOWMOD/LOWMODUNIV times 100.”

COMMUNITY NEEDS
Contra Costa Consortium 2010–2015 Consolidated Plan April 28, 2010
19
threshold was used to determine low‐income areas.3 Please see Maps 11 through 16 in Appendix 3. Very low‐income areas are those that have 51 percent or more very low‐income persons or a percentage of very low‐income persons that exceeds the applicable exception threshold. 4 Please see Maps 17 through 18 in Appendix 3.
POVERTY In addition to reporting income, the 2000 Census reports the number of persons and families that have incomes that fall below the federal poverty level.5 The poverty level is adjusted for family size and composition making it a more relative measure than household income. Persons and families that are below the poverty level are in general very poor. Please see Table 9 for persons and families who fall below the poverty line. The table also shows children who are below the poverty line.
The cities of San Pablo and Richmond are notable for the level of poverty as is the un‐incorporated area of the County. The un‐incorporated area of the County has a notably high level of children in poverty.
3 Defined by HUD as an area “within the highest quartile of all areas within the jurisdiction . . . in terms of the degree of concentration of persons of low and moderate income.” This threshold is 42.60% for the Urban County; 47.9% for Concord; 32.5% for Walnut Creek.
4 Calculated as “PVLOW/LOWMODUNIV times 100.” PVLOW = “The total number of persons below the very low‐income threshold. LOMODUNIV = “Persons with the potential for being deemed Low Mod.”
5 The “poverty level” is a measure of poverty used by the U.S. Census Bureau based on a set of money income thresholds that vary by family size and composition. If the total income for a family or unrelated individual falls below the applicable poverty threshold, that family or person is classified as being below the “poverty level.”

COMMUNITY NEEDS
2010–2015 Consolidated Plan Contra Costa Consortium April 28, 2010
20
TABLE 9 SHARE OF POPULATION BELOW POVERTY
Jurisdiction Persons Persons Under 18 Years of Age Families
Urban County
Brentwood 5.8% 2.5% 5.1%
Clayton 2.6% 1.0% 1.9%
Danville 2.2% 0.5% 1.2%
El Cerrito 6.7% 1.3% 3.8%
Hercules 3.2% 1.0% 2.4%
Lafayette 2.9% 0.6% 2.0%
Martinez 5.2% 1.0% 3.0%
Moraga 2.9% 0.9% 2.0%
Oakley 5.0% 1.8% 3.7%
Orinda 1.9% 0.3% 1.1%
Pinole 5.0% 1.4% 3.3%
Pleasant Hill 5.0% 0.8% 2.3%
San Pablo 18.1% 7.5% 15.5%
San Ramon 2.0% 0.4% 1.4%
Unincorporated County 47.8% 16.8% 36.7%
Urban County Total 17.6% 6.0% 13.3%
Entitlement Jurisdictions
Antioch 8.5% 3.8% 7.2%
Concord 7.6% 2.4% 5.6%
Pittsburg 11.5% 4.3% 9.6%
Richmond 16.2% 6.4% 13.5%
Walnut Creek 3.7% 0.6% 1.6%
Contra Costa County (countywide) Total 7.6% 10.3% 5.8%
Source: 2000 U.S. Census, Summary File 3 (persons and families for whom poverty status is determined), Table P87 and P89

COMMUNITY NEEDS
Contra Costa Consortium 2010–2015 Consolidated Plan April 28, 2010
21
EDUCATION Education level plays a critical role in determining the income level of a household. Table 10 provides a summary of educational attainment for persons aged 25 years and older for the share of the population in the state and in each jurisdiction. Both Clayton and Orinda had zero persons who reported no schooling, with Moraga and Danville following close behind (0.1 percent). San Pablo (6.6 percent) and Richmond (3.4 percent) had the greatest number of persons who reported no schooling. For the share of persons having a college degree, only 6 of the 19 jurisdictions in Contra Costa County were below the state percentage (33.7 percent).
TABLE 10 EDUCATIONAL ATTAINMENT FOR PERSONS AGED 25 YEARS AND OLDER
Jurisdiction % No Schooling
% Some Schooling (nursery–11th grade)
% High School
(without diploma)
% High School
Graduate and
Equivalent
% Some College (no
degree)
% College Degree
State of California 3.2% 15.3% 4.7% 20.1% 22.9% 33.7%
Urban County
Brentwood 1.9% 11.4% 3.9% 25.4% 28.7% 28.8%
Clayton 0.0% 1.3% 1.2% 15.1% 22.9% 59.5%
Danville 0.1% 2.1% 1.3% 11.2% 19.0% 66.4%
El Cerrito 1.0% 4.5% 1.9% 13.0% 17.6% 62.0%
Hercules 1.4% 4.8% 3.2% 16.8% 27.2% 46.5%
Lafayette 0.2% 1.2% 0.9% 8.7% 15.8% 73.1%
Martinez 0.4% 5.3% 3.3% 20.3% 28.8% 42.0%
Moraga 0.1% 1.7% 1.2% 8.3% 16.3% 72.4%
Oakley 0.8% 10.3% 4.1% 30.4% 32.4% 22.0%
Orinda 0.0% 1.0% 1.2% 5.5% 12.7% 79.6%
Pinole 1.1% 7.7% 3.0% 24.1% 28.1% 36.1%
Pleasant Hill 0.4% 4.4% 2.1% 17.5% 24.1% 51.5%
San Pablo 6.6% 24.2% 6.8% 26.1% 21.2% 15.1%
San Ramon 0.3% 1.7% 1.5% 11.8% 23.8% 60.9%
Unincorporated County 1.5% 8.8% 3.5% 20.4% 24.7% 41.1%
Urban County Total 1.3% 7.9% 3.2% 19.3% 24.2% 44.2%
Entitlement Jurisdictions
Antioch 1.1% 9.2% 4.1% 28.6% 29.9% 27.1%
Concord 1.7% 10.0% 3.6% 23.2% 26.9% 34.6%
Pittsburg 2.6% 16.2% 5.5% 25.9% 27.8% 22.1%
Richmond 3.4% 15.4% 5.8% 21.8% 24.4% 29.2%
Walnut Creek 0.3% 3.3% 1.4% 12.6% 21.1% 61.3%
Contra Costa County (countywide) Total 1.4% 8.4% 3.4% 19.8% 24.4% 42.7%
Source: 2000 U.S. Census, Summary File 3, Table P37 Note: Due to rounding, the total percentage for each jurisdiction may not equal 100.
COMMUNITY NEEDS
2010–2015 Consolidated Plan Contra Costa Consortium April 28, 2010
22
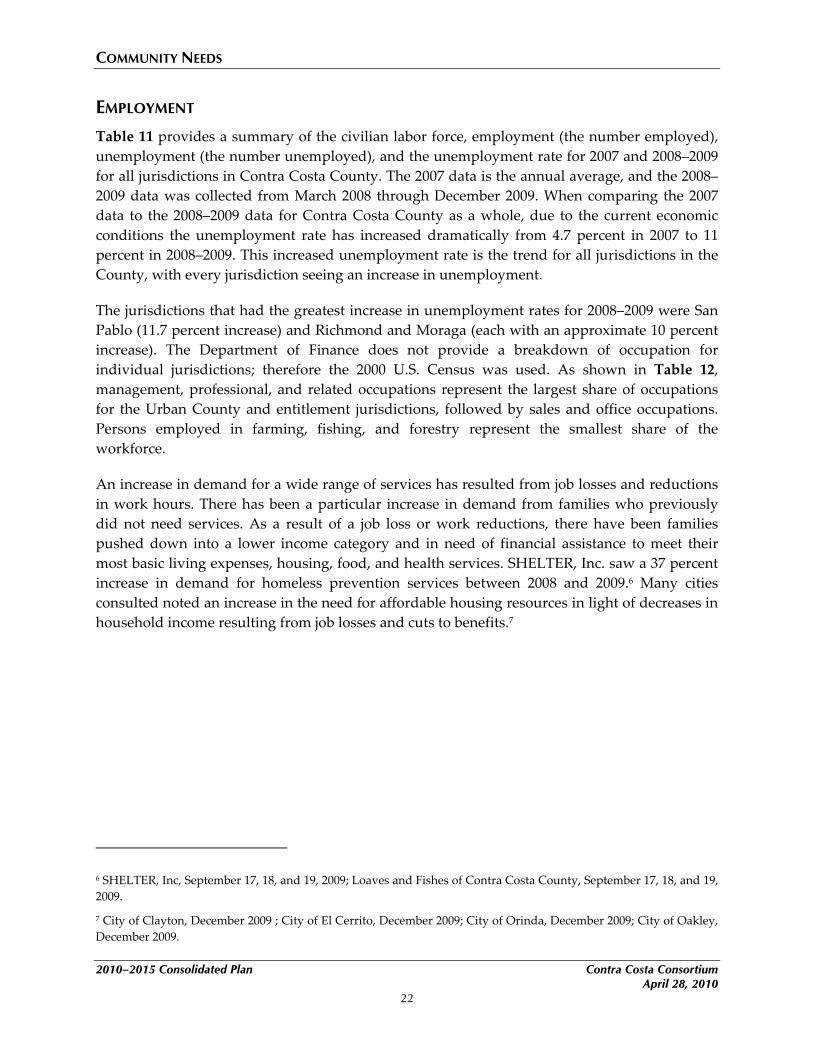
EMPLOYMENT Table 11 provides a summary of the civilian labor force, employment (the number employed), unemployment (the number unemployed), and the unemployment rate for 2007 and 2008–2009 for all jurisdictions in Contra Costa County. The 2007 data is the annual average, and the 2008–2009 data was collected from March 2008 through December 2009. When comparing the 2007 data to the 2008–2009 data for Contra Costa County as a whole, due to the current economic conditions the unemployment rate has increased dramatically from 4.7 percent in 2007 to 11 percent in 2008–2009. This increased unemployment rate is the trend for all jurisdictions in the County, with every jurisdiction seeing an increase in unemployment.
The jurisdictions that had the greatest increase in unemployment rates for 2008–2009 were San Pablo (11.7 percent increase) and Richmond and Moraga (each with an approximate 10 percent increase). The Department of Finance does not provide a breakdown of occupation for individual jurisdictions; therefore the 2000 U.S. Census was used. As shown in Table 12, management, professional, and related occupations represent the largest share of occupations for the Urban County and entitlement jurisdictions, followed by sales and office occupations. Persons employed in farming, fishing, and forestry represent the smallest share of the workforce.
An increase in demand for a wide range of services has resulted from job losses and reductions in work hours. There has been a particular increase in demand from families who previously did not need services. As a result of a job loss or work reductions, there have been families pushed down into a lower income category and in need of financial assistance to meet their most basic living expenses, housing, food, and health services. SHELTER, Inc. saw a 37 percent increase in demand for homeless prevention services between 2008 and 2009.6 Many cities consulted noted an increase in the need for affordable housing resources in light of decreases in household income resulting from job losses and cuts to benefits.7
6 SHELTER, Inc, September 17, 18, and 19, 2009; Loaves and Fishes of Contra Costa County, September 17, 18, and 19, 2009.
7 City of Clayton, December 2009 ; City of El Cerrito, December 2009; City of Orinda, December 2009; City of Oakley, December 2009.

COMMUNITY NEEDS
Contra Costa Consortium 2010–2015 Consolidated Plan April 28, 2010
23
TABLE 11 EMPLOYMENT STATISTICS
Jurisdiction
2008–2009 2007
Labor Force Employment Unemployed
Labor Force Employment Unemployed
Number Percentage Number Percentage
Urban County
Brentwood 10,900 9,900 1,100 9.8% 10,900 10,400 400 4.1%
Clayton 6,200 6,000 100 2.3% 6,400 6,400 100 0.9%
Danville 23,100 21,700 1,300 5.8% 23,500 23,000 600 2.4%
El Cerrito 14,000 12,600 1,400 9.8% 13,900 13,300 600 4.1%
Hercules 11,300 10,400 800 7.4% 11,400 11,000 400 3.1%
Lafayette 12,600 12,100 500 4.0% 12,900 12,700 200 1.6%
Martinez 21,900 20,000 1,900 8.8% 21,900 21,100 800 3.7%
Moraga 9,400 7,800 1,600 16.5% 8,900 8,300 700 7.3%
Oakley 13,700 12,600 1,100 8.0% 13,800 13,300 500 3.3%
Orinda 8,600 8,300 300 3.9% 8,900 8,700 100 1.6%
Pinole 10,500 9,800 700 7.1% 10,600 10,300 300 3.0%
Pleasant Hill 20,300 18,500 1,800 9.0% 20,300 19,600 800 3.8%
San Pablo 14,400 11,300 3,100 21.5% 13,200 11,900 1,300 9.8%
San Ramon 28,100 26,800 1,300 4.6% 28,900 28,300 500 1.9%
Entitlement Jurisdictions
Antioch 49,500 43,400 6,200 12.4% 48,400 45,800 2,600 5.3%
Concord 70,500 62,100 8,400 11.9% 69,100 65,600 3,500 5.1%
Pittsburg 31,000 25,700 5,300 17.2% 29,300 27,100 2,200 7.6%
Richmond 54,000 44,500 9,500 17.6% 51,000 47,000 4,000 7.8%
Walnut Creek 34,200 31,600 2,600 7.5% 34,500 33,400 1,100 3.1%
Contra Costa County (countywide) Total 527,100 469,100 58,000 11.0% 519,700 495,400 24,300 4.7%
Source: Economic Development Department, Labor Force and Unemployment Data, 2007 and 2008–2009. Note: The data is not seasonally adjusted; therefore the employment and unemployment numbers may not be the total labor force.

COMMUNITY NEEDS
2010–2015 Consolidated Plan Contra Costa Consortium April 28, 2010
24
TABLE 12 OCCUPATION AS A PERCENTAGE OF THE WORKFORCE
Jurisdiction Management, professional, and related
Service Sales and
office
Farming, fishing,
and forestry
Construction, extraction, and maintenance
Production, transportation, and material
moving
Urban County
Brentwood 35.9% 15.0% 25.6% 1.2% 14.1% 8.1%
Clayton 54.5% 9.3% 27.0% 0.0% 4.6% 4.6%
Danville 58.1% 5.7% 28.5% 0.1% 4.0% 3.6%
El Cerrito 58.2% 8.6% 24.2% 0.1% 4.0% 4.9%
Hercules 39.6% 9.6% 35.1% 0.0% 6.0% 9.7%
Lafayette 64.3% 7.8% 20.1% 0.1% 4.2% 3.6%
Martinez 41.3% 10.1% 31.0% 0.1% 10.6% 7.0%
Moraga 61.2% 7.8% 24.7% 0.1% 2.3% 3.9%
Oakley 25.2% 15.9% 29.9% 0.4% 15.7% 12.9%
Orinda 66.4% 6.3% 22.2% 0.3% 2.0% 2.8%
Pinole 34.3% 16.1% 29.6% 0.0% 9.7% 10.2%
Pleasant Hill 48.9% 10.7% 26.9% 0.1% 8.2% 5.2%
San Pablo 20.2% 23.4% 25.8% 0.7% 13.8% 16.2%
San Ramon 54.8% 6.0% 30.6% 0.0% 4.5% 4.0%
Unincorporated County 41.2% 13.5% 26.9% 0.5% 9.3% 8.7%
Urban County Total 47.8% 10.3% 27.8% 0.2% 7.4% 6.6%
Entitlement Jurisdictions
Antioch 29.1% 15.1% 31.2% 0.2% 13.2% 11.3%
Concord 34.0% 17.8% 27.9% 0.1% 10.9% 9.3%
Pittsburg 24.0% 19.1% 29.8% 0.1% 13.2% 13.7%
Richmond 32.9% 18.1% 26.4% 0.2% 9.0% 13.3%
Walnut Creek 55.5% 9.0% 27.6% 0.1% 4.1% 3.6%
Contra Costa County (countywide) Total 41.0% 13.4% 28.0% 0.2% 8.9% 8.5%
Source: 2000 U.S. Census, Summary File 3, Table P50 Note: Due to rounding errors, total employment shares for each jurisdiction may not total 100.

COMMUNITY NEEDS
Contra Costa Consortium 2010–2015 Consolidated Plan April 28, 2010
25
HOUSEHOLDS The type, size, and composition of a household can affect the type of housing and services that are needed. The following section provides an analysis of the household profiles for all jurisdictions in Contra Costa County, as well as in the unincorporated County.
Table 13 presents household size, percentage of persons living alone, and percentage of persons over age 65. San Pablo had the largest average household size (3.25 persons) of all the jurisdictions, with the second largest household size (3.23 persons) reported in Oakley. Based on the 2000 U.S. Census, Walnut Creek had the largest share of persons living alone (38.4 percent) and householders over the age of 65 (35.8 percent).
TABLE 13 HOUSEHOLD COMPOSITION, 2009
Jurisdiction Average Household Size (persons)1
% of Single Persons Living Alone2
% Headed by Person 65 and Older2
Urban County
Brentwood 3.04 14.5% 18.2%
Clayton 2.73 14.5% 15.9%
Danville 2.75 15.7% 16.7%
El Cerrito 2.23 30.9% 30.8%
Hercules 2.99 17.8% 8.6%
Lafayette 2.57 18.9% 21.6%
Martinez 2.39 27.3% 16.0%
Moraga 2.56 19.9% 26.2%
Oakley 3.23 12.9% 11.5%
Orinda 2.63 16.4% 30.4%
Pinole 2.76 20.0% 23.2%
Pleasant Hill 2.33 28.9% 20.1%
San Pablo 3.25 22.4% 16.3%
San Ramon 2.60 21.1% 9.8%
Unincorporated County 2.69 21.7% 18.9%
Urban County Total -- 21.3% 18.5%
Entitlement Jurisdictions
Antioch 3.04 15.8% 13.3%
Concord 2.71 23.2% 17.8%
Pittsburg 3.13 18.3% 15.2%
Richmond 2.79 25.9% 17.7%
Walnut Creek 2.07 38.4% 35.8%
Contra Costa County (countywide) Total 2.75 22.9% 19.3%
Source: 1 2000 U.S. Census, Summary File 3, P10 and H1; 2 Department of Finance 2009, E‐5 Report
Table 14 presents the number of family households and the share of family households that are married, single parents, and have children under 18 years of age for all jurisdictions in Contra

COMMUNITY NEEDS
2010–2015 Consolidated Plan Contra Costa Consortium April 28, 2010
26
Costa County. Of the 344,129 households in the County, 243,971 (70.9 percent) were family households.8 Of the family households, 123,948 (50.8 percent) had children under 18. When looking closer at the jurisdictions in the County: Oakley (63.4 percent), San Pablo (61.1 percent), and Antioch (59.8 percent) had the largest share of families with children under 18; Orinda (91.5 percent), Clayton (90.5 percent), and Lafayette (90.1 percent) had the largest share of married couples; and San Pablo (21.7 percent) and Richmond (18.9 percent) had the largest share of single parents. These percentages exceed that of the County for each category: families with children under 18, married couples, and single parents.
TABLE 14 FAMILY HOUSEHOLD COMPOSITION
Jurisdiction Family Households % Married % With Children Under 18 % Single Parent
Urban County
Brentwood 6,231 87.0% 58.7% 9.3%
Clayton 3,212 90.5% 48.1% 5.4%
Danville 12,054 89.0% 52.1% 6.1%
El Cerrito 6,047 78.5% 34.5% 7.7%
Hercules 4,993 78.9% 55.2% 11.4%
Lafayette 6,805 90.1% 49.1% 6.3%
Martinez 9,279 78.6% 48.0% 11.6%
Moraga 4,361 88.6% 47.1% 5.7%
Oakley 6,483 86.4% 63.4% 8.8%
Orinda 5,231 91.5% 46.1% 4.2%
Pinole 5,148 77.3% 46.3% 9.6%
Pleasant Hill 8,435 80.6% 46.9% 10.3%
San Pablo 6,672 63.1% 61.1% 21.7%
San Ramon 12,077 86.1% 53.3% 8.4%
Unincorporated County 39,370 79.1% -- 11.1%
Urban County Total 136,398 82.1% 42.1% 9.7%
Entitlement Jurisdictions
Antioch 23,307 77.5% 59.8% 14.8%
Concord 30,637 75.6% 51.4% 12.8%
Pittsburg 13,509 72.9% 55.1% 14.7%
Richmond 23,403 63.4% 51.0% 18.9%
Walnut Creek 16,717 85.0% 39.1% 7.4%
Contra Costa County (countywide) Total 243,971 78.7% 50.8% 11.6%
Source: 2000 U.S. Census, Summary File 3, P10
8 Comprising related individuals.

COMMUNITY NEEDS
Contra Costa Consortium 2010–2015 Consolidated Plan April 28, 2010
27
SPECIAL NEEDS POPULATIONS – NON-HOMELESS Certain groups may have more difficulty finding housing and may require specialized services or assistance. Owing to their special circumstances, they are more likely to have extremely low, very low, low, or moderate incomes. These groups include the elderly, frail elderly, persons with disabilities (mental, physical, developmental), persons with alcohol or other drug addiction, victims of domestic violence, large households, and single parent‐headed (female and male) households. HUD also requires an analysis of the needs of persons with HIV/AIDS and their families. HUD does not require an analysis on large households or single parent‐headed households, but the Consortium believes both of these groups fall into the special needs group.
ELDERLY AND FRAIL ELDERLY The three jurisdictions with the largest share of senior households were Walnut Creek (36.1 percent), Orinda (31.9 percent), and El Cerrito (31.4 percent). Please see Table 15.
Of all jurisdictions in the County, both San Pablo (52.6 percent) and Pittsburg (50.7 percent) had over half of their senior population reporting a disability, compared to the total County with 39.6 percent of the senior population reporting a disability.
Seniors are among several groups especially adversely impacted by the increase in evictions in 2008 and 2009 that resulted from property owners being foreclosed upon. There is little legal recourse for tenants who are evicted during foreclosure. Seniors are more likely to be on fixed incomes and fall into a low‐income category, making it more difficult to find new housing that they can afford.9
Seniors are also among those who have experienced an increase in domestic abuse — both physical and financial — in 2008 and 2009. Contra Costa Senior Legal Services, based in Richmond, reported significant increases in requests for elder abuse services, both physical and financial. Contra Costa Senior Legal Services has experienced a sharp increase in calls from seniors who have relatives who are trying to force them to sign their homes over to their relatives. Many of these seniors are victims of both physical and financial abuse.10
Seniors were also among the groups of people most likely to use food services offered by Loaves and Fishes of Contra Costa County in 2009.11
Frail elderly persons are especially adversely impacted by decreases in public benefits, retirement income, and health services. In 2009, medical costs continued to increase for seniors
9 Bay Area Legal Aid, Contra Costa County, September 17, 2009; Contra Costa Senior Legal Services, September 18, 2009; Loaves and Fishes of Contra Costa County, September 17, 2009.
10 Contra Costa Senior Legal Services, September 17 and 18, 2009.
11 Loaves and Fishes of Contra Costa County, September 17, 2009.

COMMUNITY NEEDS
2010–2015 Consolidated Plan Contra Costa Consortium April 28, 2010
28
and the disabled, while their SSI and Medicare benefits were the same or less. In addition, funding and provision of health services, such as in‐home support services, were cut substantially in 2009. Due to state budget cuts and constrained local resources, Contra Costa County has had to significantly reduce funding for in‐home support services, HIV prevention, and meal delivery services, among others. These reductions increase the need among the frail elderly for financial assistance, food banks, nursing home care, emergency room visits, and paratransit services.12
TABLE 15 SENIOR HOUSEHOLDS
Jurisdiction % Senior Population
% Senior Households
% Renter Households
% Owner Households
% With a Disability*
Urban County
Brentwood 9.6% 19.4% 9.2% 90.8% 34.9%
Clayton 9.1% 16.2 % 1.6% 98.4% 34.1%
Danville 10.3% 17.6% 11.5% 88.5% 37.8%
El Cerrito 20.7% 31.4% 16.5% 83.5% 38.0%
Hercules 6.8% 8.8% 18.0% 82.0% 39.3%
Lafayette 14.0% 21.5% 11.8% 88.2% 25.4%
Martinez 10.2% 16.3% 23.9% 76.1% 42.0%
Moraga 15.2% 27.8% 8.2% 91.8% 28.4%
Oakley 5.8% 12.0% 18.8% 81.2% 45.8%
Orinda 18.4% 31.9% 8.7% 91.3% 22.3%
Pinole 14.1% 22.6% 20.7% 79.3% 44.1%
Pleasant Hill 13.1% 20.3% 31.3% 68.7% 42.7%
San Pablo 8.9% 16.8% 36.3% 63.7% 52.6%
San Ramon 6.2% 9.3% 22.0% 78.0% 35.0%
Unincorporated County 10.9% 19.1% 16.8% 83.2% 37.5%
Urban County Total 11.1% 21.2% 19.5% 80.5% 37.2%
Entitlement Jurisdictions
Antioch 7.3% 13.8% 26.0% 74.0% 44.0%
Concord 10.8% 17.6% 21.5% 78.5% 41.9%
Pittsburg 8.3% 15.9% 25.5% 74.5% 50.7%
Richmond 9.6% 18.0% 22.6% 77.4% 47.2%
Walnut Creek 25.0% 36.1% 15.1% 84.9% 37.0%
Contra Costa County (countywide) Total 11.3% 19.5% 18.9% 81.1% 39.6%
Source: 2000 U.S. Census, Summary File 3, Table P8, P11, P41 and H14
12 Bay Area Legal Aid, Contra Costa County, September 17, 18, and 19, 2009; Rainbow Community, September 17, 18, and 19, 2009.

COMMUNITY NEEDS
Contra Costa Consortium 2010–2015 Consolidated Plan April 28, 2010
29
PERSONS WITH DISABILITIES Table 16 presents data from the 2000 Census for persons with disabilities in the state, Urban County (all non‐entitlement jurisdictions), and entitlement jurisdictions. Of the jurisdictions in Contra Costa County, San Pablo (25.5 percent) had the greatest share of the persons with a disability for all persons over 5 years of age, followed by Richmond (21.6 percent). Moraga (9.7 percent) had the smallest share of persons with a disability, followed by Lafayette (9.8 percent).
Of the disabled persons in the County, 24.1 percent reported an employment disability and 23.5 percent reported a physical disability. These percentages were consistent with the state and most jurisdictions in the County.
Disabled persons are among several groups especially adversely impacted by the increase in evictions during 2008 and 2009 that resulted from property owners being foreclosed upon. There is little legal recourse for tenants who are evicted as a result of foreclosure. Disabled persons find it more difficult to find housing that can accommodate their needs than nondisabled persons and are more likely to fall into a low‐income category, making it more difficult to find new housing that meets their needs and that they can afford.13
Disabled persons were also adversely impacted by decreases in public benefits, retirement income, and health services in 2008 and 2009. Reductions in funding for in‐home support services and meal delivery services, among others, have increased the need among disabled persons for financial assistance, food banks, disabled home care, emergency room visits, and paratransit services.14
SHELTER, Inc. reported that 19 percent of their homeless service clients self‐reported having mental health needs.15 The actual number of homeless service clients with mental health needs is anticipated to be much higher as this is an underreported number, particularly for parents who are scared they might lose custody of their children if they self‐report having mental health needs.
13 Bay Area Legal Aid, Contra Costa County, September 18, 2009; Contra Costa Senior Legal Services, September 18, 2009; Loaves and Fishes of Contra Costa County, September 18, 2009.
14 Bay Area Legal Aid, Contra Costa County, September 17 and 18, 2009; Rainbow Community, September 17 and 18, 2009.
15 SHELTER, Inc., September 17, 2009.

COMMUNITY NEEDS
2010–2015 Consolidated Plan Contra Costa Consortium April 28, 2010
Page 30
TABLE 16 DISABILITY STATUS AND TYPES
Jurisdiction Number of Disabled Persons
% of Persons Disabled
% of Disabled Population –
Sensory*
% of Disabled Population –
Physical*
% of Disabled Population –
Mental*
% of Disabled Population –
Self-care*
% of Disabled Population –Go-outside-home*
% of Disabled Population –Employment Disability*
State of California 5,923,361 19.2% 9.3% 21.0% 13.3% 7.2% 23.0% 26.2%
Urban County
Brentwood 3,232 15.4% 9.5% 24.6% 13.6% 6.5% 21.1% 24.6%
Clayton 1,128 11.2% 10.7% 21.4% 13.0% 4.7% 23.8% 26.5%
Danville 4,330 11.1% 10.7% 22.6% 16.5% 8.7% 19.5% 22.1%
El Cerrito 3,746 16.9% 12.3% 25.0% 14.7% 9.8% 21.7% 16.4%
Hercules 2,595 14.3% 9.0% 20.5% 11.9% 6.7% 20.4% 31.5%
Lafayette 2,167 9.8% 15.0% 25.2% 16.0% 6.3% 15.8% 21.7%
Martinez 5,322 16.2% 10.1% 28.1% 15.8% 6.6% 16.1% 23.2%
Moraga 1,540 9.7% 12.3% 26.9% 14.5% 7.7% 21.1% 17.5%
Oakley 3,604 15.4% 8.5% 25.7% 16.2% 7.8% 18.4% 23.4%
Orinda 1,881 11.4% 11.9% 23.4% 15.1% 7.3% 21.1% 21.2%
Pinole 3,255 17.7% 11.7% 26.6% 14.7% 8.1% 21.5% 17.4%
Pleasant Hill 4,486 14.7% 11.5% 25.2% 13.7% 7.5% 20.0% 22.1%
San Pablo 6,915 25.5% 8.5% 17.6% 12.3% 7.0% 26.2% 28.4%
San Ramon 4,135 10.0% 9.9% 23.0% 13.0% 7.2% 20.3% 26.6%
Unincorporated County 23,268 16.6% 10.2% 23.1% 14.2% 7.4% 21.0% 24.1%
Urban County Total 71,604 15.0% 10.4% 23.5% 14.3% 7.4% 20.8% 23.6%
Entitlement Jurisdictions
Antioch 13,488 16.3% 9.2% 24.6% 15.7% 6.8% 18.7% 25.0%
Concord 21,184 18.9% 9.6% 23.2% 13.1% 7.2% 20.5% 26.4%
Pittsburg 10,981 21.1% 7.5% 21.3% 12.5% 8.1% 22.6% 28.0%
Richmond 19,666 21.6% 8.8% 22.0% 14.0% 7.9% 21.9% 25.4%
Walnut Creek 10,649 17.4% 14.6% 27.3% 15.2% 8.5% 19.9% 14.5%
Contra Costa County (countywide) Total 147,572 16.8% 10.0% 23.5% 14.1% 7.5% 20.8% 24.1%
Source: 2000 U.S. Census, Summary File 3, Table P41 and P42 *People may have reported more than one disability, resulting in numbers over 100 percent in this column.

COMMUNITY NEEDS
Contra Costa Consortium 2010–2015 Consolidated Plan April 28, 2010
Page 31
Licensed Community Care Facilities
Certain groups may have more difficulty finding housing and may require specialized services or assistance. Due to their special circumstances, these groups are more likely to have low or moderate incomes. These groups include the elderly, frail elderly, persons with disabilities, large households, female‐headed households, persons with substance abuse problems, the homeless, victims of domestic violence, and persons with HIV/AIDS.
There are many different types of licensed care facilities in Antioch, Concord, Contra Costa County, Pittsburg, Richmond, and Walnut Creek. Below is a description of the different types of care facilities within these jurisdictions.
• Adult Day Care Facilities (ADCF) provide programs for frail elderly and developmentally disabled and/or mentally disabled adults in a day care setting.
• Adult Residential Facilities (ARF) are facilities of any capacity that provide 24‐hour nonmedical care for adults ages 18 through 59 who are unable to provide for their own daily needs. Adults may be physically handicapped, developmentally disabled, and/or mentally disabled.
• Group homes are facilities of any capacity and provide 24‐hour nonmedical care and supervision to children in a structured environment.
• Residential Care Facilities for the Elderly (RCFE) provide care, supervision, and assistance with daily living activities to persons 60 years of age and over and persons under 60 with compatible needs.
• Small Family Homes (SFH) provide 24‐hour‐a‐day care in the licensee’s family residence for six or fewer children who are mentally disabled, developmentally disabled, or physically handicapped and who require special care and supervision as a result of such disabilities.
• A Social Rehabilitation Facility is any facility that provides 24‐hour‐a‐day nonmedical care and supervision in a group setting to adults recovering from mental illnesses who temporarily need assistance, guidance, or counseling.
• The Transitional Housing Placement Program provides care and supervision for children at least 17 years of age participating in an independent living arrangement.
Table 17 provides a summary of the number of licensed care facilities by type and their capacity in the jurisdictions of Antioch, Concord, Contra Costa County (countywide), Pittsburg, Richmond, and Walnut Creek.

COMMUNITY NEEDS
2010–2015 Consolidated Plan Contra Costa Consortium April 28, 2010
32
TABLE 17 LICENSED CARE FACILITIES BY JURISDICTION AND TYPE
Jurisdiction Adult Day Care Facility
Adult Residential
Facility
Group Home
Residential Care Facility
Small Family Home
Social Rehabilitation
Facility
Transitional Housing
Placement Total
Antioch
Number of Facilities 9 28 12 42 4 0 1 96
Capacity 354 166 74 550 19 0 12 1,175
Concord
Number of Facilities 4 27 7 92 1 0 1 132
Capacity 221 178 56 928 6 0 15 1,404
Contra Costa County (balance of County)
Number of Facilities 14 57 24 194 7 2 0 298
Capacity 485 408 180 3,399 42 32 0 4,546
Pittsburg
Number of Facilities 1 18 5 15 1 0 0 40
Capacity 72 105 30 101 2 0 0 310
Richmond
Number of Facilities 6 21 6 18 1 1 0 53
Capacity 306 118 36 216 5 16 0 697
Walnut Creek
Number of Facilities 2 6 0 79 0 0 0 87
Capacity 84 36 0 1,290 0 0 0 1,410
Total
Number of Facilities 36 157 54 440 14 3 2 706
Capacity 1,522 1,011 376 6,484 74 48 27 9,542
Source: State of California Community Care Licensing Division, September 2009

COMMUNITY NEEDS
Contra Costa Consortium 2010–2015 Consolidated Plan April 28, 2010
33
LARGE HOUSEHOLDS Large family households are defined as households of five or more persons who are related. Large family households are considered a special needs group because there is a limited supply of adequately sized housing to accommodate their needs.
Table 18 provides data for large households for all jurisdictions in Contra Costa County. The jurisdictions with the greatest share of large households (households with five or more persons) were San Pablo (24.7 percent), Pittsburg (19.9 percent), and Oakley (19.2 percent). Walnut Creek had the smallest share of large households (4.4 percent). Of all the jurisdictions in Contra Costa County, the majority of large households own their homes, with the exception of San Pablo and Richmond. As shown in Table 18, of all the housing units countywide with three or more bedrooms, 77.3 percent were owner‐occupied housing units and 24.4 percent were renter‐occupied housing units.
The supply of housing units with three or more bedrooms available for ownership and rental is in excess of the number of large owner and rental households (please see table below). This suggests that there is not a numerical shortage of available housing units to meet the needs of large households. However, lower‐income large households may be priced out of the larger housing units.
Some service providers noted that there has been growth in large households as households have been adversely financially impacted by job loss and reduction in work hours. Increasingly, multigenerational family members are living together as large households to reduce housing costs.16
Large households are also among several groups impacted by the increase in evictions during 2008 and 2009 that resulted from property owners being foreclosed upon. There is little legal recourse for tenants who are evicted as a result of foreclosure. Large households find it more difficult to find housing that can accommodate their household size and are more likely to fall into a low‐income category, making it more difficult to find new housing that meets their needs and that they can afford.17
16 SHELTER, Inc., September 17, 2009.
17 Bay Area Legal Aid, Contra Costa County, September 17 and 18, 2009; Contra Costa Senior Legal Services, September 17 and 18, 2009; Loaves and Fishes of Contra Costa County, September 17 and 18, 2009.

COMMUNITY NEEDS
2010–2015 Consolidated Plan Contra Costa Consortium April 28, 2010
34
TABLE 18 LARGE HOUSEHOLDS
Jurisdiction Large Households
% Large Households
% of Total Owner-
Occupied Households
%of Total Renter-
Occupied Households
% of Total Owner
Housing Units w/3+ Bedrooms
% of Total Renter
Housing Units w/3+ Bedrooms
Urban County
Brentwood 1,368 17.1% 13.4% 3.7% 72.6% 34.0%
Clayton 403 9.7% 9.3% 0.4% 90.2% 72.4%
Danville 1,567 10.3% 9.3% 1.0% 91.1% 48.4%
El Cerrito 553 5.5% 4.2% 1.3% 69.1% 16.4%
Hercules 1,117 16.9% 14.0% 2.8% 70.5% 44.0%
Lafayette 729 7.9% 7.3% 0.6% 91.4% 22.4%
Martinez 1,123 7.1% 5.6% 1.5% 81.1% 21.6%
Moraga 465 8.5% 7.7% 0.8% 85.3% 33.5%
Oakley 1,552 19.2% 15.6% 3.6% 87.0% 51.5%
Orinda 522 8.4% 7.4% 1.0% 91.0% 43.0%
Pinole 868 12.2% 8.9% 3.3% 85.7% 28.2%
Pleasant Hill 851 6.3% 4.9% 1.4% 82.5% 21.3%
San Pablo 2,259 24.7% 12.4% 12.3% 42.4% 13.6%
San Ramon 1,480 8.6% 7.0% 1.7% 87.6% 22.8%
Unincorporated 6,725 12.3% 8.7% 3.5% 75.4% 26.7%
Urban County Total 43,359 11.3% 8.5% 2.8% 80.3% 25.5%
Entitlement Jurisdictions
Antioch 5,173 17.6% 13.0% 4.6% 88.0% 30.8%
Concord 5,580 12.7% 6.8% 5.9% 78.0% 26.4%
Pittsburg 3,533 19.9% 12.5% 7.4% 79.7% 27.7%
Richmond 5,488 15.8% 7.8% 8.0% 60.9% 19.8%
Walnut Creek 1,330 4.4% 3.3% 1.1% 58.3% 15.5%
Contra Costa County (countywide) Total 42,355 12.3% 8.4% 3.9% 77.3% 24.4%
Source: 2000 U.S. Census, Summary File 3, Table H16 and H42 * Numbers in this table do not include persons in group quarters.

COMMUNITY NEEDS
Contra Costa Consortium 2010–2015 Consolidated Plan April 28, 2010
35
SINGLE-PARENT HOUSEHOLDS Nearly three‐quarters of single‐parent households in the state are headed by a female. As shown in Table 19, the share of female‐headed households is much larger than the share of male‐headed single‐parent households for all jurisdictions in the County.
The share of female‐headed households at or below the poverty level is also much greater than male‐headed households at or below the poverty level.18 The share of single‐parent households at or below the poverty level in the state (29.0 percent) is much higher than in the jurisdictions in the Urban County and the entitlement jurisdictions.
TABLE 19 SINGLE-PARENT HOUSEHOLDS
Jurisdiction Total Percentage in Poverty
Female-headed
% Female- headed in Poverty
Male-headed
% Male-headed in Poverty
Antioch 5,250 17.7% 3,712 20.9% 1,538 9.9%
Concord 7,476 11.4% 5,305 13.9% 2,171 5.3%
Pittsburg 3,656 18.6% 2,626 21.3% 1,030 11.7%
Richmond 8,575 23.0% 6,674 24.8% 1,901 16.6%
Walnut Creek 2,508 6.8% 1,942 7.7% 566 2.9%
Urban County 51,891 14.8% 37,740 16.8% 14,151 9.5%
Contra Costa County (countywide) Total 43,682 14.5% 32,054 16.6% 11,628 8.8%
Source: 2000 U.S. Census, Summary File 3, Table P12, P89
ALCOHOL/OTHER DRUG ABUSE The Contra Costa County Department of Health Services Alcohol and Other Drugs Services Division (AOD) reported in its 2007–2013 Strategic Plan19 that 41 percent of Contra Costa County 11th grade students reported drinking alcohol in the past 30 days and 18 percent reported using marijuana in the past 30 days. The National Center for Health Statistics indicated that 6.0 percent of persons 12 years of age and over who were surveyed said that they had used marijuana within the past month, one‐third the rate of 11th graders in Contra Costa County who had used marijuana.
18 The “poverty level” is a measure of poverty used by the U.S. Census Bureau based on a set of money income thresholds that vary by family size and composition. If the total income for a family or unrelated individual falls below the applicable poverty threshold, that family or person is classified as being below the “poverty level.”
19 Strategic Plan for Contra Costa County Alcohol and Other Drugs Prevention, 2007–2013, Contra Health Services, Alcohol and Other Drugs Services Division (2007)

COMMUNITY NEEDS
2010–2015 Consolidated Plan Contra Costa Consortium April 28, 2010
36
Higher percentages of Contra Costa County 7th, 9th, and 11th grade students reported using alcohol in the past 30 days than did students statewide in the same grades (15 percent, 31 percent, and 41 percent in Contra Costa County vs. 10 percent, 25 percent, and 37 percent respectively statewide).
AOD reported that the number of adults between the ages of 19 and 54 in treatment decreased dramatically between 2001 and 2005 in Contra Costa County. In 2001 a total of 8,436 clients in this age range were admitted to publicly funded treatment in the County. By 2005, that total had fallen to 5,595, a 33.6 percent decrease.
The percentage of adults over the age of 54 entering publicly funded treatment is increasing. A total of 256 people 55 years of age or older entered treatment in 2001. In 2005, the number rose to 291, an increase of 13.7 percent.20
SHELTER, Inc. reported 52 percent of their homeless service clients suffered from alcohol or substance abuse and 63 percent were addicted to drugs in 2008–2009.21
The National Center for Health Statistics indicated that 8.1 percent of persons 12 years of age and over who were surveyed said that they had used illegal drugs within the past month, 6.0 percent used marijuana and 2.6 percent used psychotherapeutic drugs.
PERSONS WITH HIV/AIDS The Contra Costa Public Health Division22 reported that as of December 31, 2008:
• 1,119 Contra Costa County residents were living with a diagnosis of AIDS o 224 females o 895 males
• 775 Contra Costa County residents were living with a positive HIV test o 138 females o 637 males
Broken down by jurisdiction, the following persons were living with HIV/AIDS as of December 31, 2008:
• Alamo: 10 persons • Antioch: 153 persons • Bay Point: 43 persons • Brentwood: 35 persons • Clayton: 14 persons
• Moraga: 9 persons • North Richmond: 16 persons • Oakley: 38 persons • Orinda: 16 persons • Pacheco: 6 persons
20 Ibid.
21 SHELTER, Inc., September 17, 2009.
22 2009 HIV/AIDS Epidemiology Report, Contra Costa Health Services, August 2009

COMMUNITY NEEDS
Contra Costa Consortium 2010–2015 Consolidated Plan April 28, 2010
37
• Concord: 256 persons • Crocket: 8 persons • Danville: 38 persons • El Cerrito: 45 persons • El Sobrante: 43 persons • Hercules: 34 persons • Kensington: 12 persons • Lafayette: 40 persons • Martinez: 103 persons
• Pinole: 28 persons • Pittsburg: 158 persons • Pleasant Hill: 66 persons • Richmond: 358 persons • Rodeo: 19 persons • San Pablo: 120 persons • San Ramon: 32 persons • Walnut Creek: 168 persons • Other: 26 persons
Persons with HIV/AIDS are another group especially adversely impacted by decreases in public benefits and public health services in 2008 and 2009. Reductions in funding for in‐home support services, meal delivery services, and bill paying assistance services, among others, have increased the need among persons with HIV/AIDS for financial assistance, food banks, nursing home care, emergency room visits, and paratransit services.23
VICTIMS OF DOMESTIC VIOLENCE In February 2000, the Contra Costa County Board of Supervisors declared a policy of “zero tolerance for domestic violence.” This policy was established because the Board found that, although the law enforcement and service provider communities had identified reducing domestic/family violence and elder abuse as priorities and had devoted significant resources and effort to reducing these crimes, domestic violence and elder abuse were on the rise.24
Established in 2000, the “Zero Tolerance for Domestic Violence” initiative is a multi‐jurisdictional partnership, created to help eliminate domestic and family violence and elder abuse in Contra Costa County. County staff, local law enforcement, the courts, and community service providers have banded together under the leadership of the Board of Supervisors to offer a comprehensive, coordinated, community‐wide response to break the progressive cycle of domestic and family violence.25
All domestic service providers interviewed in September 2009 indicated that they are experiencing significant increases in demand for their domestic violence related services, which they attribute to increased stress among people resulting from financial hardship. One organization providing domestic violence related services, STAND! Against Domestic Violence based in Concord, experienced a 65 percent increase in the number of phone calls to their crisis line between 2008 and 2009 and a 25 percent increase in use of their domestic violence housing
23 Rainbow Community , September 17 and 18, 2009.
24 Contra Costa County Zero Tolerance for Domestic Violence Initiative, September 18, 2009.
25 Ibid.

COMMUNITY NEEDS
2010–2015 Consolidated Plan Contra Costa Consortium April 28, 2010
38
shelter.26 Between 2004 and 2008, STAND! received the greatest number of calls to their crisis line from residents of Antioch, Concord, Richmond, unincorporated County areas, and Pittsburg.
Bay Area Legal Aid in Contra Costa County also has seen a significant increase in demand for domestic violence related services.27 Contra Costa Senior Legal Services, based in Richmond, reported significant increases in requests for elder abuse services, both physical and financial.28 Bay Area Legal Aid assisted over 750 low‐income Contra Costa County domestic violence survivors in 2008.29 There were 18 deaths in Contra Costa County resulting from domestic violence in 2009 as of September, while there were a total of 3 such deaths in 2008.30 Domestic violence related service providers reported that it was increasingly difficult to meet service demands.31
In 2007 (the most recent year for which statistics are available), there were 3,950 domestic violence calls for assistance to law enforcement in Contra Costa County (countywide), and 547 of those involved weapons.32 Between January and June 2009 (the most recent time period for which statistics are available), there were 1,276 court protection orders requested in Contra Costa County and 52 percent of these requests were granted by the court. In 2005, there were 3,241 domestic violence arrests reported via the Contra Costa Domestic Violence Tracking System, and 3,585 in 2006.
Half of men who abuse their spouses also abuse their children. There were 5,290 reports of suspected child abuse/neglect affecting 9,823 children in Contra Costa County during 2007.33
The statistics only tell part of the story: domestic violence is the most underreported crime in the country and it is estimated that one in three adult women will experience at least one physical assault in her lifetime by an intimate partner or family member.34 Abuse in relationships exists among all classes, races, and cultural groups, although women between ages 16 and 24 are nearly three times more vulnerable to intimate partner violence. Every year, almost 6 percent of California’s women suffer physical injuries from domestic violence. Nearly
26 STAND! Against Domestic Violence, September 18, 2009.
27 Bay Area Legal Aid, Contra Costa County, September 18, 2009.
28 Contra Costa Senior Legal Services, September 18, 2009.
29 Bay Area Legal Aid, Contra Costa County, September 18, 2009.
30 Contra Costa County Zero Tolerance for Domestic Violence Initiative, September 2009.
31 STAND! Against Domestic Violence, September 18, 2009; Bay Area Legal Aid, Contra Costa County, September 18, 2009; Contra Costa Senior Legal Services, September 18, 2009; Contra Costa County Zero Tolerance for Domestic Violence Initiative, September 18, 2009.
32 California Department of Justice, 2007.
33 Child Abuse Prevention Council of Contra Costa County, September 18, 2009.
34 Bay Area Legal Aid, Contra Costa County, September 2009; American Psychological Association, September 2009.

COMMUNITY NEEDS
Contra Costa Consortium 2010–2015 Consolidated Plan April 28, 2010
39
20 percent of women who went hungry because they couldnʹt afford to buy food were also a victim of intimate partner violence.35
National statistics show that one in four girls and one in eight boys will be maltreated before the age of 18. Child abuse/neglect affect children of all ages, races, and incomes. Children under the age of 2 are at the greatest risk of abuse. Child abuse is the most common cause of brain injury in children under 1 year of age. Children with disabilities are three to seven times more likely to suffer from child maltreatment than children without disabilities. Parents abusing drugs or alcohol are at a higher risk of neglecting/abusing their children. Circumstances that place parents under substantial stress, for example, mental and physical illness, economic stress, drug abuse, and isolation, are likely to increase the risk of child abuse. Overall, domestic violence greatly impacts children in the home.36
HOMELESS The Contra Costa Homeless Program conducted a count of sheltered and unsheltered homeless persons in the County in January 2009. Table 20 (unsheltered) and Table 21 (sheltered) provide a summary of the count. Please note, because of recent anecdotal reports of changes in the characteristics of the homeless population thought largely to be driven by the high level of home foreclosures and job loss, and the limitations of the count methodology, certain groups and/or persons may have been undercounted.
According to the count, Richmond had the largest share of unsheltered homeless persons in the entire County (23.1 percent). Concord (15.7 percent) and Antioch (7.8 percent) had the second and third largest share of unsheltered homeless individuals in the County. The five entitlement cities of the Consortium accounted for the majority (56.6 percent) of all homeless individuals identified in the count. The remaining jurisdictions in the County accounted for the remaining 43.4 percent.
The homeless count identified 1,958 sheltered homeless persons in the County. Table 21 provides a summary of the variety of services sheltered homeless persons were using at the time of the count. According to the count, emergency and transitional housing were the most widely used type of service throughout the County, especially for families and the unaccompanied youth population.
In addition to the findings presented in Tables 20 and 21, the Contra Costa Homeless Program reports the following findings from the 2009 count:
• 8 percent decrease from 2007 of homeless persons in the County. • 57 percent of unsheltered homeless persons live in encampments.
35 STAND! Against Domestic Violence website, September 18, 2009.
36 Child Abuse Prevention Council of Contra Costa County, September 18, 2009.

COMMUNITY NEEDS
2010–2015 Consolidated Plan Contra Costa Consortium April 28, 2010
40
• Single adults accessing services increased 20 percent over 2007. • The number of homeless persons in alcohol or drug treatment centers doubled from
2007. • Homeless persons accessing food programs increased over 2007.
TABLE 20 UNSHELTERED INDIVIDUALS
Jurisdiction Unsheltered Individuals % of Unsheltered Individuals
Contra Costa County (countywide) 1,872 100.0%
Antioch 146 7.8%
Concord 294 15.7%
Pittsburg 109 5.8%
Richmond 433 23.1%
Walnut Creek 78 4.2%
Source: Contra Costa Homeless Program, 2009 Homeless Count
TABLE 21 SHELTERED INDIVIDUALS
Couples Families
with Children
Individuals in Families
Children in Families
Individuals without Children
Unaccom-panied Youth
Alcohol/Drug Treatment 0 0 0 0 189 0
Employment/Job Training 0 0 0 0 128 0
Emergency Housing 2 62 203 118 282 24
Food Programs/Soup Kitchen 0 4 14 10 220 5
Medical Providers (including hospitals) 0 0 0 0 42 0
Mental Health Treatment 0 0 0 0 10 0
Multiservice Center 0 5 16 9 396 0
Outreach/ Engagement 0 0 0 0 45 0
Transitional Housing* 1 54 181 112 161 36
Total 3 125 414 249 1,473 65
Source: Contra Costa Homeless Program, 2009 Homeless Count * Permanent supportive housing not reported.

COMMUNITY NEEDS
Contra Costa Consortium 2010–2015 Consolidated Plan April 28, 2010
41
HOUSING MARKET PROFILE Like most other jurisdictions throughout the state, the most significant trend in the Contra Costa County housing market has been the decrease in single‐family home sales prices and the corresponding decrease in the value of single‐family housing. Combined with an environment of historically low interest rates, this has reduced the gap between the cost to buy a home and the price which households at the lower end of the range of incomes can afford. Although this “affordability gap” has been reduced when it comes to home purchase, the combination of instability in the job market, stagnating real wages, and the general tightening of credit has not necessarily made a home purchase easier for lower income households.
The rental market has seen continued low vacancy rates and rents have been stable and trending upward.
The following discussion identifies housing characteristics, trends, and needs for County jurisdictions.
HOUSING GROWTH Between 2000 and 2009 the number of housing units in the state increased 10.78 percent. Table 22 displays housing growth in all jurisdictions in Contra Costa County. Of all the jurisdictions in Contra Costa County, Brentwood had the largest increase in housing units (126.9 percent). Second to that was San Ramon with an increase of 43.1 percent. Of the entitlement cities, Pittsburg had the largest increase with 13.9 percent.
TENURE Housing tenure refers to whether a unit is owner‐occupied or renter‐occupied. Table 23 provides a summary of housing tenure for all jurisdictions in Contra Costa County. As shown, Clayton had the greatest share of owner‐occupied households and San Pablo had the greatest share of renter‐occupied housing units. It is important to note that the level of single‐family foreclosures may have significantly shifted the owner/renter distribution.

COMMUNITY NEEDS
2010–2015 Consolidated Plan Contra Costa Consortium April 28, 2010
42
TABLE 22 HOUSING UNITS, 2000–2009
Jurisdiction 2000 Housing Units 2009 Housing Units Percentage Change 2000–2009
Urban County
Brentwood 7,788 17,671 126.9%
Clayton 3,924 4,006 2.1%
Danville 15,130 15,795 4.4%
El Cerrito 10,462 10,705 2.3%
Hercules 6,546 8,319 27.1%
Lafayette 9,334 9,511 1.9%
Martinez 14,597 14,972 2.6%
Moraga 5,760 5,791 0.5%
Oakley 7,946 10,987 38.3%
Orinda 6,744 6,849 1.6%
Pinole 6,828 7,032 3.0%
Pleasant Hill 14,034 14,505 3.4%
San Pablo 9,354 9,953 6.4%
San Ramon 17,552 25,113 43.1%
Unincorporated County 57,609 65,604 13.9%
Urban County Total 193,608 226,813 17.2%
Entitlement Jurisdictions
Antioch 30,116 33,982 12.8%
Concord 45,084 46,638 3.4%
Pittsburg 18,300 20,848 13.9%
Richmond 36,044 38,433 6.6%
Walnut Creek 31,425 32,473 3.3%
Contra Costa County (countywide) Total 354,577 399,187 12.6%
Source: Department of Finance, 2000 and 2009 E‐5 Report

COMMUNITY NEEDS
Contra Costa Consortium 2010–2015 Consolidated Plan April 28, 2010
43
TABLE 23 HOUSING TENURE
Jurisdiction Owner-Occupied Renter-Occupied
Urban County
Brentwood 80.7% 19.3%
Clayton 94.1% 5.9%
Danville 89.4% 10.6%
El Cerrito 60.9% 39.1%
Hercules 84.2% 15.8%
Lafayette 75.8% 24.2%
Martinez 69.0% 31.0%
Moraga 84.5% 15.5%
Oakley 85.0% 15.0%
Orinda 91.6% 8.4%
Pinole 74.5% 25.5%
Pleasant Hill 63.7% 36.3%
San Pablo 49.8% 50.2%
San Ramon 71.1% 28.9%
Unincorporated County 73.5% 26.5%
Urban County Total 70.4% 29.6%
Entitlement Jurisdictions
Antioch 70.9% 29.1%
Concord 62.6% 37.4%
Pittsburg 62.8% 37.2%
Richmond 53.4% 46.6%
Walnut Creek 68.1% 31.9%
Contra Costa County (countywide) Total 69.3% 30.7%
Source: 2000 U.S. Census, Summary File 3, Table H7

COMMUNITY NEEDS
2010–2015 Consolidated Plan Contra Costa Consortium April 28, 2010
44
HOUSING TYPE Table 24 exhibits the percentage of housing units as a share of total housing units by the number of units in the structure and tenure for all jurisdictions in Contra Costa County, separating out the Urban County jurisdictions and entitlement jurisdictions. Demand for owner‐occupied housing is primarily met through the supply of single‐family housing, while renter‐occupied housing demand is primarily met through a combination of single‐family housing and multi‐family units.

COMMUNITY NEEDS
Contra Costa Consortium 2010–2015 Consolidated Plan April 28, 2010
Page 45
TABLE 24 TENURE BY UNITS IN STRUCTURE
Jurisdiction Owner-Occupied Renter-Occupied
Single-family Units
Multi-family (2–4 units)
Multi-family (>5 units)
Mobile Homes
Boat, RV, Van, etc.
Single-family Units
Multi-family (2–4 units)
Multi-family (>5 units)
Mobile Homes
Boat, RV, Van, etc.
Urban County
Brentwood 96.8% 0.4% 0.2% 2.7% 0.0% 52.4% 14.7% 29.6% 3.0% 0.4%
Clayton 99.7% 0.1% 0.0% 0.1% 0.0% 91.5% 2.7% 5.8% 0.0% 0.0%
Danville 98.6% 0.6% 0.9% 0.0% 0.0% 71.8% 6.5% 21.7% 0.0% 0.0%
El Cerrito 97.7% 1.4% 0.6% 0.3% 0.1% 38.7% 29.4% 31.9% 0.0% 0.0%
Hercules 94.2% 1.9% 3.9% 0.0% 0.0% 71.1% 13.5% 15.4% 0.0% 0.0%
Lafayette 99.3% 0.6% 0.1% 0.0% 0.0% 42.5% 12.8% 44.7% 0.0% 0.0%
Martinez 97.8% 1.0% 1.0% 0.2% 0.0% 47.6% 17.0% 35.4% 0.0% 0.0%
Moraga 97.2% 1.2% 1.5% 0.2% 0.0% 40.3% 15.6% 44.2% 0.0% 0.0%
Oakley 98.4% 0.0% 0.0% 1.5% 0.0% 84.4% 6.7% 2.7% 5.9% 0.2%
Orinda 99.3% 0.5% 0.3% 0.0% 0.0% 68.3% 9.0% 21.3% 1.5% 0.0%
Pinole 98.2% 0.5% 1.2% 0.2% 0.0% 43.6% 18.5% 37.7% 0.0% 0.2%
Pleasant Hill 97.3% 0.4% 2.0% 0.3% 0.0% 34.6% 12.6% 52.5% 0.2% 0.0%
San Pablo 83.6% 5.4% 4.7% 6.0% 0.2% 41.6% 22.3% 33.9% 2.1% 0.1%
San Ramon 96.6% 0.9% 2.3% 0.2% 0.0% 36.6% 13.1% 50.3% 0.0% 0.0%
Unincorporated County 93.7% 0.8% 0.9% 4.5% 0.2% 56.5% 11.3% 28.6% 3.4% 0.2%
Urban County Total 96.1% 0.9% 1.2% 1.8% 0.1% 49.7% 14.9% 33.6% 1.7% 0.1%
Entitlement Jurisdictions
Antioch 98.0% 0.6% 0.7% 0.7% 0.0% 50.0% 17.0% 32.8% 0.1% 0.0%
Concord 91.0% 2.3% 3.8% 2.9% 0.1% 35.5% 12.8% 51.0% 0.7% 0.1%
Pittsburg 96.1% 0.6% 0.3% 3.0% 0.0% 48.8% 17.8% 32.6% 0.8% 0.0%
Richmond 95.2% 3.0% 1.5% 0.3% 0.1% 40.5% 27.6% 31.7% 0.0% 0.0%
Walnut Creek 79.9% 7.0% 12.9% 0.1% 0.0% 29.6% 16.2% 54.1% 0.1% 0.0%
Contra Costa County (countywide) Total 94.5% 1.6% 2.2% 1.6% 0.1% 44.3% 17.2% 37.5% 0.9% 0.1%
Source: 2000 U.S. Census, Summary File 3, Table H33 Due to rounding, total percentages of renter and owner housing types for each jurisdiction may not total 100.

COMMUNITY NEEDS
2010–2015 Consolidated Plan Contra Costa Consortium April 28, 2010
46
VACANCY RATE Vacancy trends in housing are analyzed using a “vacancy rate” which establishes the relationship between housing supply and demand. For example, if the demand for housing is greater than the available supply, then the vacancy rate is low and the price of housing will most likely increase. Additionally, the vacancy rate indicates whether or not the community has an adequate housing supply to provide choice and mobility. HUD standards indicate that a vacancy rate of 5 percent is sufficient to provide choice and mobility.
Table 25 provides the total number of vacant housing units as well as the percentage of vacant housing units in 2009 for all of the jurisdictions in Contra Costa County, separating out the Urban County jurisdictions and the entitlement jurisdictions. Please note the state Department of Finance (DOF) estimate is for all housing unit types and does not exclude seasonal, recreational, or occasional use and all other vacant units. The DOF also does not provide vacancy by tenure. To provide vacancy by reason for vacancy, 2000 Census data was used (see Table 26).
Overall, the 2009 data (Table 25) indicate that the County has a very low vacancy rate. Several communities in the Urban County have vacancy rates below 5 percent, which is extremely low. Historical data from the 2000 Census (Table 26) indicate that in several communities (Brentwood, Clayton, and Moraga) the share of vacant units that are for rent is well below the overall County share (30.5 percent). These communities also have a very low share of renter‐occupied units. The data would suggest that renters might be challenged to find affordable housing in these communities.

COMMUNITY NEEDS
Contra Costa Consortium 2010–2015 Consolidated Plan April 28, 2010
47
TABLE 25 VACANCY STATUS, 2009
Jurisdiction Total Vacant Housing Units % of Total Housing Units Vacant
Urban County
Brentwood 649 3.67%
Clayton 41 1.02%
Danville 328 2.08%
El Cerrito 259 2.42%
Hercules 156 1.88%
Lafayette 185 1.95%
Martinez 304 2.03%
Moraga 98 1.69%
Oakley 322 2.93%
Orinda 149 2.18%
Pinole 86 1.22%
Pleasant Hill 291 2.01%
San Pablo 308 3.09%
San Ramon 868 3.46%
Unincorporated County 2,711 4.13%
Urban County Total 6,755 2.98%
Entitlement Jurisdictions
Antioch 878 2.58%
Concord 1,098 2.35%
Pittsburg 634 3.04%
Richmond 1,514 3.94%
Walnut Creek 1,161 3.58%
Contra Costa County (countywide) Total 12,040 3.02%
Source: Department of Finance, 2009 E‐5 Report

COMMUNITY NEEDS
2010–2015 Consolidated Plan Contra Costa Consortium April 28, 2010
48
TABLE 26 VACANCY STATUS, 2000
Jurisdiction
Total Vacant Housing
Units
% of Total Housing
Units Vacant
% of Total Vacant
Units that Are for
Rent
% of Total Vacant
Units that Are for
Sale
% of Total Vacant
Units that Are
Rented/ Sold, Not Occupied
% of Total Vacant
Units that Are Vacant for Other Reasons
Urban County
Brentwood 239 3.2% 4.2% 30.5% 31.8% 33.5%
Clayton 46 1.2% 2.3% 26.1% 56.5% 13.0%
Danville 309 2.1% 15.9% 29.4% 23.6% 31.1%
El Cerrito 260 2.5% 23.1% 35.8% 28.8% 12.3%
Hercules 124 1.9% 14.5% 77.4% 0.8% 7.3%
Lafayette 183 2.0% 29.5% 35.0% 12.0% 23.5%
Martinez 278 1.9% 34.5% 30.2% 8.3% 27.0%
Moraga 105 1.8% 4.8% 21.0% 31.4% 42.9%
Oakley 128 1.6% 15.6% 62.5% 0.0% 21.9%
Orinda 155 2.3% 11.0% 20.6% 18.7% 49.7%
Pinole 78 1.1% 38.5% 48.7% 3.8% 9.0%
Pleasant Hill 274 2.0% 29.9% 17.2% 13.1% 39.8%
San Pablo 282 3.1% 29.4% 20.6% 14.2% 35.8%
San Ramon 620 3.7% 38.2% 9.5% 20.8% 31.5%
Unincorporated County 2,376 4.3% 17.5% 18.0% 15.7% 48.8%
Urban County Total 5,457 1.3% 21.6% 23.4% 17.2% 37.8%
Entitlement Jurisdictions
Antioch 800 2.7% 41.6% 38.8% 3.5% 16.1%
Concord 1,018 2.3% 44.2% 21.7% 8.2% 25.9%
Pittsburg 587 3.2% 46.5% 21.0% 17.4% 15.2%
Richmond 1,446 4.0% 43.8% 23.8% 11.6% 20.8%
Walnut Creek 1,140 3.6% 27.5% 23.3% 15.7% 33.5%
Contra Costa County (countywide) Total 10,448 3.0% 30.5% 24.3% 14.4% 30.9%
Source: 2000 U.S. Census, Summary File 3, Table H8
AGE OF HOUSING STOCK Table 27 displays the share of housing units constructed by age and tenure for the state and for all jurisdictions in Contra Costa County. With the exception of El Cerrito, Lafayette and Orinda most housing in each jurisdiction was built after 1960.

COMMUNITY NEEDS
Contra Costa Consortium 2010–2015 Consolidated Plan April 28, 2010
49
TABLE 27 AGE OF HOUSING BY TENURE
Jurisdiction 1939 or earlier 1940 to 1959 1960 to 1979 1980 to 1994 1995 to March 2000
Total Renter Owner Total Renter Owner Total Renter Owner Total Renter Owner Total Renter Owner
State of California 9.5% 4.6% 4.9% 23.5% 9.6% 13.9% 37.2% 17.5% 19.7% 24.1% 9.7% 14.4% 5.7% 1.6% 4.1%
Urban County
Brentwood 1.8% 1.0% 0.8% 6.9% 2.9% 4.0% 15.2% 4.7% 10.4% 29.2% 4.7% 24.5% 47.0% 6.0% 41.0%
Clayton 1.6% 0.8% 0.8% 3.2% 0.0% 3.2% 42.7% 2.0% 40.7% 29.7% 2.4% 27.3% 22.8% 0.7% 22.1%
Danville 0.4% 0.1% 0.3% 10.0% 0.9% 9.1% 44.4% 4.5% 39.9% 32.3% 4.0% 28.3% 12.9% 1.1% 11.8%
El Cerrito 12.9% 3.4% 9.5% 52.6% 15.3% 37.3% 25.4% 15.2% 10.3% 7.9% 4.7% 3.2% 1.2% 0.5% 0.6%
Hercules 0.4% 0.2% 0.3% 0.9% 0.4% 0.5% 24.6% 4.1% 20.6% 70.2% 9.6% 60.6% 3.8% 1.6% 2.2%
Lafayette 4.7% 1.2% 3.5% 47.6% 8.7% 38.8% 37.6% 11.9% 25.7% 8.4% 1.9% 6.5% 1.7% 0.5% 1.2%
Martinez 10.5% 5.3% 5.2% 16.7% 6.0% 10.7% 38.1% 10.4% 27.6% 31.5% 9.0% 22.5% 3.3% 0.3% 3.0%
Moraga 0.5% 0.2% 0.4% 8.0% 1.7% 6.3% 74.7% 12.1% 62.6% 16.3% 1.5% 14.9% 0.5% 0.2% 0.3%
Oakley 2.6% 0.8% 1.7% 6.1% 1.9% 4.3% 15.7% 4.2% 11.4% 60.6% 5.8% 54.8% 15.0% 2.2% 12.8%
Orinda 7.9% 0.6% 7.3% 48.0% 2.3% 45.7% 31.5% 2.4% 29.1% 10.0% 2.1% 7.9% 2.5% 0.9% 1.6%
Pinole 3.8% 1.4% 2.4% 18.8% 3.5% 15.3% 48.9% 12.6% 36.3% 27.0% 7.9% 19.1% 1.6% 0.1% 1.4%
Pleasant Hill 1.3% 0.9% 0.5% 32.8% 5.3% 27.5% 34.6% 17.4% 17.2% 28.1% 11.3% 16.8% 3.1% 1.4% 1.7%
San Pablo 4.8% 1.8% 2.9% 33.5% 14.3% 19.2% 36.3% 23.3% 13.0% 22.2% 8.6% 13.6% 3.3% 2.2% 1.1%
San Ramon 0.2% 0.1% 0.1% 0.8% 0.4% 0.4% 37.0% 6.2% 30.8% 47.2% 18.6% 28.6% 14.8% 3.7% 11.1%
Unincorporated County 7.7% 2.6% 5.1% 27.5% 6.5% 21.0% 29.8% 8.3% 21.5% 29.1% 7.8% 21.3% 5.8% 1.3% 4.5%
Urban County 3.9% 1.4% 2.5% 20.6% 4.7% 15.8% 35.8% 9.8% 26.0% 30.6% 7.7% 22.9% 9.1% 1.6% 7.4%
Entitlement Jurisdictions
Antioch 2.9% 1.4% 1.5% 14.3% 5.6% 8.7% 30.9% 11.1% 19.8% 38.0% 9.8% 28.2% 13.9% 1.3% 12.6%
Concord 1.6% 0.8% 0.8% 25.7% 7.3% 18.3% 54.9% 21.1% 33.8% 16.3% 7.9% 8.5% 1.6% 0.4% 1.2%
Pittsburg 3.6% 1.6% 2.0% 17.7% 7.2% 10.4% 37.6% 11.2% 26.3% 34.0% 14.3% 19.6% 7.2% 2.8% 4.5%
Richmond 10.7% 3.8% 7.0% 37.8% 14.7% 23.1% 28.6% 16.3% 12.3% 20.0% 10.7% 9.3% 2.9% 1.2% 1.7%
Walnut Creek 1.7% 0.8% 0.9% 15.0% 4.9% 10.1% 62.1% 18.9% 43.2% 19.1% 6.9% 12.2% 2.1% 0.5% 1.6%
Contra Costa County (countywide) 4.6% 1.7% 2.9% 22.9% 6.6% 16.3% 38.6% 12.7% 25.9% 27.3% 8.5% 18.8% 6.7% 1.3% 5.4%
Source: 2000 U.S. Census, Summary File 3, Table H36

COMMUNITY NEEDS
2010–2015 Consolidated Plan Contra Costa Consortium April 28, 2010
50
HOUSING CONDITIONS Housing age is an important indicator of housing condition in a community because housing is subject to gradual physical deterioration over time. If not properly and regularly maintained, housing can deteriorate and discourage reinvestment, depress neighboring property values, and eventually impact the quality of life in a neighborhood. Thus, maintaining and improving housing quality is an important goal for a community. Structures older than 30 years typically begin to show signs of deterioration and require reinvestment to maintain their quality. Unless properly maintained, homes older than 50 years require major renovations to remain in good working order.
Housing condition data was gathered from each jurisdiction’s Housing Element, and where housing condition survey information was not available, housing conditions were determined by age (structural deficiencies and standards) and the lack of infrastructure and utilities.
CONTRA COSTA COUNTY (UNINCORPORATED COUNTY) According to the 2000 U.S. Census, 65 percent of the unincorporated County’s housing stock is older than 30 years. This percentage means it is safe to assume that more than half of the homes in the unincorporated County are beginning to show signs of deterioration and will require reinvestment to maintain their quality.
Based on the fact that 65 percent of the housing stock is older than 30 years, there is a strong likelihood that many homes will require reinvestment or renovations to ensure the housing stock is maintained in good working order. Both the County Redevelopment Agency and the Building Inspection Division have identified areas of the County that may be in need of rehabilitation assistance, including Bay Point, Bethel Island, Byron, Clyde, Crockett, El Sobrante, Montalvin Manor, North Richmond, Rodeo, and Vine Hill (near Martinez).
ANTIOCH According to the 2000 U.S. Census, 42.4 percent of owner‐occupied housing units in Antioch were built before 1980 and 14.4 percent were built before 1960. Of the renter‐occupied units, 61.9 percent were built before 1980 and 23.9 percent were built before 1960. Overall, 48.1 percent of housing units were built before 1980 and 17.2 percent were built before 1960.
Of the total occupied units in Antioch, 101 units lacked complete plumbing facilities. Fifty‐four of the units were owner‐occupied and 47 of the units were renter‐occupied. A total of 189 of the occupied units lacked complete kitchen facilities, of which 36 were owner‐occupied and 153 were renter‐occupied units. It should be noted that there may be some overlap in the number of substandard housing units, as some units may lack both complete plumbing and kitchen facilities.

COMMUNITY NEEDS
Contra Costa Consortium 2010–2015 Consolidated Plan April 28, 2010
51
CONCORD According to the 2000 U.S. Census, 82.1 percent (36,097 units) of the city’s housing stock was built over 30 years ago (prior to 1980). Of the 36,097 units built, 64.5 percent were owner‐occupied units and 35.5 percent were renter‐occupied units. In 2007, more than half of the existing homes in Concord were more than 38 years old and 25.2 percent were more than 48 years old, with the majority of the older units being owner‐occupied units.
City staff regularly conducts windshield surveys (which is a visual assessment based on predetermined criteria) to assess the age and condition of Concord’s housing stock. Housing in the Monument Corridor is an area of particular concern, especially with respect to the condition of multi‐family units. Rehabilitation efforts in the last few years included staff visits through the City’s Neighborhood Code Enforcement and Multifamily Housing Inspection Program (MFHIP) and loans through the Multifamily Rehabilitation Loan Program. According to the City’s Building & Neighborhood Services annual reports, Monument Corridor Partnership Housing Task Force Projects have included quarterly tenant rental education and certification workshops called “How to Be a Good Tenant” to highlight the importance of maintenance. The City also promotes rehabilitation through its Housing Rehabilitation Loan and Grant Program geared toward providing necessary funds for repairs to single‐family owner‐occupied units to avert deterioration and extend the life and quality of existing homes and neighborhoods. Monument Community Partnership and Housing Rights assists the City in outreach to residents and stakeholders to promote the City’s various programs. For example, Housing Rights hosts a Tenants’ Rights Clinic at the Mt. Diablo Housing Opportunity Center once per month. The City also has funds for a Multi‐Family Rehabilitation Program to provide low interest loans to assist property owners with major repair work, targeted at residential properties of 2 to 6 units.
PITTSBURG In August 2008 a housing conditions survey was conducted to better understand the city’s housing rehabilitation and replacement needs. Housing Element project staff surveyed approximately 5 percent of the total housing stock (487 addresses; 1,023 units) within selected U.S. Census block groups containing a concentration of 50 percent or more of housing units built prior to 1970. Census block groups having a preponderance of units built before 1970 are likely to have higher concentrations of units in need of rehabilitation or replacement.
The windshield survey analyzed the exterior condition of existing housing units, reviewing each unit’s (1) foundation; (2) roof and chimney; (3) electrical; (4) windows; (5) siding, stucco, and other exterior surfaces; and (6) overall site drainage and external conditions. Residential structures scored into the following housing condition categories: “sound,” “minor,” “moderate,” “substantial,” or “dilapidated.” Units defined as sound are in generally good condition and do not require rehabilitation. Units defined as in minor condition require nonstructural repairs but are otherwise in sound condition. Units defined as in moderate condition require some structural improvements as well as major façade improvements. Units

COMMUNITY NEEDS
2010–2015 Consolidated Plan Contra Costa Consortium April 28, 2010
52
defined as substantial would require significant structural and façade improvements at a cost nearing the improved value of the home. Finally, units defined as dilapidated are homes where the cost to rehabilitate the home is more than the cost to demolish and rebuild a comparable unit on the same site.
Overall Housing Conditions Findings
In total, the survey evaluated 362 single‐family addresses, 4 live‐work addresses, 76 duplex addresses, 43 multi‐family (3–50+ units per structure) addresses, and two mobile home parks. Approximately 84 percent of addresses were in sound condition, 9 percent in minor condition, and 7 percent in moderate condition. Although no dilapidated units or units requiring substantial rehabilitation were recorded in the windshield survey, it should be noted that some units classified as moderate could possibly be categorized as needing substantial rehabilitation if continued inattention to the property or structure ensues.
Areas in Need of Housing Rehabilitation
Four of the selected census tract block groups contained 26 percent or more units that were in minor or moderate condition. Among those, three had units where 10 percent or more were in moderate condition. The specific neighborhoods in question are Tenth Street (on both sides of Railroad Avenue), Central Addition (west of Harbor Street), Heights/West Boulevard, and the southern half of Willow Cove. High School Village had more than 10 percent of units in moderate condition and should equally be an area of concern.
RICHMOND The largest percentage of Richmond’s housing stock, 25.1 percent (7,135 units), was built between 1950 and 1959, while approximately 25.0 percent was built since 1980. The majority of housing was built before 1970 and three‐quarters of the city’s housing stock was constructed prior to 1980. According to the 2000 Census, the median year built for the housing stock in the city was 1961, which indicates an older housing stock, possibly in need of rehabilitation.
Another measure of housing condition is the number of housing units lacking complete plumbing and kitchen facilities. The 2000 Census reported 264 occupied housing units lacking complete plumbing facilities and 161 housing units lacking complete kitchen facilities in the city. In both areas (lacking complete plumbing and kitchen facilities), a slightly higher percentage of rental units lacked these facilities than did owner‐occupied units.
WALNUT CREEK As of 2008, 76 percent of the total housing units (30,700) in Walnut Creek were over 38 years old and approximately 14 percent were over 50 years old. Most of the housing stock (62 percent) was built between 1960 and 1980.
In January 2009 the City completed a windshield survey as part of the Housing Needs Assessment of the 2009 Housing Element Update. The survey consisted of an assessment of six

COMMUNITY NEEDS
Contra Costa Consortium 2010–2015 Consolidated Plan April 28, 2010
53
areas in the city that have a high occurrence of multi‐family housing identified by code enforcement as having maintenance issues. The survey found the need to be the highest in the following areas: Creekside Drive Area, Mt Pisgah Road, Sierra Drive, Ygnacio Valley Road, Sunnyvale Avenue, and Second and Third Avenues.
HOUSING COST Table 28 provides a summary of home sales prices for all jurisdictions. The County has experienced a sharp decrease in the median sales price for homes with the exception of Hercules, Martinez, and Pleasant Hill, which have all seen a year‐to‐year increase in median sales price. It is important to note that as a measure of central tendency median sales price is sensitive to sales volume in market sub‐sectors as much as it is to overall price trends. An increase in the volume of sales of higher priced homes relative to overall sales volume can lead to an increase in median sales price even though overall prices remain low.
As shown, as of February 2010, San Pablo had the lowest median sales price ($152,344) and Orinda the highest ($829,500). San Ramon, San Pablo, and Brentwood experienced the sharpest declines in the median sales price of homes from November 2008 to November 2009.
In December 2009, a survey of local Contra Costa newspapers and online rental listings was conducted for both single‐family homes and multi‐family units for all jurisdictions in the County. The results are presented in Table 29. According to the results of the survey, average rental rates in San Ramon are the most expensive at $1,662, followed by Lafayette at $1,533 and Walnut Creek at $1,518. These cities are the most expensive for all unit sizes and housing types. The most expensive rents occur in the central portion of Contra Costa County, with the least expensive in the east. The west has considerably lower rents than the central part of the County.
The U.S. Department of Housing and Urban Development publishes annual Fair Market Rents (FMR), which include an estimated utility cost, and the annual income required to afford them. Table 30 shows the Fair Market Rents for 2009 for Contra Costa County.

COMMUNITY NEEDS
2010–2015 Consolidated Plan Contra Costa Consortium April 28, 2010
54
TABLE 28 MEDIAN HOME SALE LISTINGS
Jurisdiction Three Month Median Sales
Price (Sep – Nov 2009)
Year-to-Year Change (Nov 2008 – Nov 2009) Number of Homes
for Sale (Jan 2010) Dollars Percentage
Urban County
Brentwood $290,000 $-50,000 -14.7% 189
Clayton 525,000 -72,500 -12.1% 26
Danville 807,500 -30,000 -3.6% 195
El Cerrito 539,500 -28,500 -5.0% 21
Hercules 325,000 -25,000 8.3% 54
Lafayette 805,000 -55,000 -6.4% 76
Martinez 333,000 5,750 1.8% 90
Moraga 810,000 -40,000 -4.7% 34
Oakley 232,850 -17,100 -6.8% 119
Orinda 829,500 -109,500 -11.7% 49
Pinole 267,354 -27,646 -9.4% 32
Pleasant Hill 439,500 -30,500 7.5% 54
San Pablo 152,344 -27,360 -15.2% 45
San Ramon 559,500 -155,500 -21.7% 169
Entitlement Jurisdictions
Antioch 199,000 -18,150 -8.4% 208
Concord 246,000 -9,000 -3.5% 173
Pittsburg 180,000 -15,000 -7.7% 112
Richmond 157,000 -17,500 -10.0% 177
Walnut Creek 447,500 -64,500 -12.6% 202
Source: Trulia.com, February 2010

COMMUNITY NEEDS
Contra Costa Consortium 2010–2015 Consolidated Plan April 28, 2010
55
TABLE 29 MEDIAN RENTAL LISTINGS
Place/Community Type: Bedroom (BR)/Bath (BA) Overall
Average Rent Studio 1BR/1 BA 2 BR/1 BA 2 BR/1+ BA 3 BR/1+ BA
East
Antioch $762 $750 $1,178 $1,167 $1,512 $1,074
Bay Point $595 $650 $1,183 $1,391 $1,400 $1,045
Pittsburg $762 $750 $941 $1,039 $1,512 $1,001
Central
Concord none $875 $1,073 $1,369 $1,725 $1,261
Lafayette $950 $1,359 $1,303 $2,034 $2,020 $1,533
Martinez $723 $1,137 $1,204 $1,512 $1,860 $1,287
Pleasant Hill $989 $1,202 $1,236 $1,478 $2,004 $1,382
San Ramon $1,448 $1,908 $1,307 $1,728 $1,921 $1,662
Walnut Creek $1,122 $1,075 $1090 $1,578 $2,725 $1,518
West
El Cerrito $756 $1,217 $1,260 $1,515 $1,387 $1,227
El Sobrante $1,256 $1,247 $1,264 $1,639 $1,406 $1,362
Pinole $800 $944 $1,082 $1,793 $1,610 $1,246
Richmond $985 $888 $1,026 $1,510 $2,450 $1,372
San Pablo $870 $899 $1,247 $1,908 $1,751 $1,335
Countywide Average $952 $1,096 $1,170 $1,559 $1,837 $1,323
Source: PMC Rental Survey, December 2009
TABLE 30 FAIR MARKET RENTS, 2009
Unit Size FMR Annual Income to Afford
Studio $905 $36,200
1-bedroom $1,093 $43,720
2-bedroom $1,295 $51,800
3-bedroom $1,756 $70,240
4-bedroom $2,174 $86,960
Source: U.S. Dept. Housing and Urban Development, 2009 FMR; 2009 “Out of Reach” Report
HOUSING AFFORDABILITY BY TENURE AND HOUSEHOLD TYPE The assessment of Contra Costa County’s housing needs relies on custom tabulations of U.S. Decennial Census data provided by HUD. These tabulations are referred to as the “CHAS” tables obtained using HUD’s “State of the Cities Data System” (SOCDS). These data are

COMMUNITY NEEDS
2010–2015 Consolidated Plan Contra Costa Consortium April 28, 2010
56
presented in two main tables, one presenting “housing problems” by households and the other presenting “affordability mismatch” by housing units. Tables 31 and 32 provide a summary, and the full tables can be found in Appendix 4. The needs of renter and owner households are examined separately.
(Tables are provided for the State of California, Contra Costa County, the Urban County area, and the five entitlement communities. Because of the nature of the Consortium, data tables were acquired according to the CDBG geography. Although this best approximates the jurisdictional boundaries within the Consortium, it does introduce a significant level of rounding in the data.37)
The CHAS housing problems table presents the number of households paying more than 30 percent and 50 percent of gross income for housing by tenure, household type, and income category. This cost of housing as a percentage of gross income is referred to as the housing “cost burden.” According to HUD, a household which has a housing cost burden over 30 percent has a “high” housing cost burden. Those with a cost burden over 50 percent have a “severe” cost burden.
Overpayment is a concern for low‐income households since they may be forced to live in overcrowded situations or cut other necessary expenditures, such as health care, in order to afford housing. The HUD definition of housing cost includes not only monthly rent and mortgage payments but an estimate of utilities.
RENTER HOUSEHOLDS
Household Type
Overall, approximately 40 percent of renter households in the County have a high cost burden. Less than 18 percent have a severe cost burden. This is roughly consistent in all jurisdictions with the exception of Walnut Creek which has 34 percent of renter households with high cost burdens.
Elderly one‐ and two‐person renter households tend to experience a higher degree of high cost burden (58 percent) and severe cost burden (32 percent) countywide. Antioch is alone with a significantly higher number experiencing severe cost burden (41 percent). Both Pittsburg and Richmond have a lower number experiencing severe cost burden (21 percent and 24 percent, respectively).
Large renter households (five or more persons) experience cost burdens at roughly the same rate as all renter households as do small related (two to four persons) and the balance of renter households.
37 Please see http://socds.huduser.org/chas/Frequently%20Asked%20Questions.htm

COMMUNITY NEEDS
Contra Costa Consortium 2010–2015 Consolidated Plan April 28, 2010
57
Income Groups
The rate of high cost burden for renter households with incomes above low income (>80 percent AMI) is 9 percent. Low‐income renter households (>50 to ≤80 percent area median income [AMI]) experience a high cost burden at close to the same rate (44 percent) as do all renter households countywide. The severe cost burden is significantly lower (6 percent). Very low‐income (>30 percent to ≤50 percent AMI) and extremely low‐income renter households (≤30 percent AMI) experience cost burdens much higher than all renters (71 percent and 76 percent, respectively). The rate of severe cost burden for the very low‐income population (25 percent) is slightly higher than all renters. The extremely low‐income population has a rate of severe cost burden (58 percent) more than three times that of all renters.
The Urban County and Concord have cost burden rates among the income groups very similar to the County as a whole. Notable exceptions are a higher rate of severe cost burden for low‐income households in the Urban County (9 percent); a lower rate of severe cost burden for low‐income households in Concord (3 percent); and a higher rate of high cost burden for very low‐income households in Concord (78 percent).
Antioch is similar to the County as a whole with the exception of a lower rate of high cost burden for low‐income (32 percent) and lower rates of severe cost burden for very low‐income households (17 percent). Antioch also has a generally lower cost burden for households with incomes above low income (4.6 percent).
Much like its neighbor Antioch, Pittsburg is more affordable for lower‐income households than the County as a whole, with 2.8 percent of low‐income households experiencing a severe cost burden (43 percent high cost burden) and virtually no above low‐income renter households experiencing a significant cost burden.
Richmond has much lower rates of cost burden for lower‐income renter households across all income categories: 54 percent high and 13 percent severe for very low‐income; 33 percent high and 2 percent severe for low‐income. Cost burden rates for the extremely low‐income are comparable to the County as a whole.
Although the cost burden for extremely low‐income households is consistently high across the County as a whole, Walnut Creek stands out with a rate of 68 percent. It is similarly higher for cost burden rates of very low‐income (85 percent high, 53 percent severe), low‐income (60 percent and 10 percent), and above low‐income (12 percent high) households.
OWNER HOUSEHOLDS
Household Type
Approximately one‐third (29 percent) of owner households in the County have a high cost burden. Approximately 10 percent have a severe cost burden. This is consistent across all jurisdictions.

COMMUNITY NEEDS
2010–2015 Consolidated Plan Contra Costa Consortium April 28, 2010
58
Elderly one‐ and two‐person owner households tend to experience a slightly higher degree of severe cost burden (12 percent) countywide, although this rate is the same as the rate of all households. The rate of high cost burden is 26 percent.
Large owner households (five or more persons) experience a cost burden at roughly the same rate as all owner households as do small related (two to four persons). Antioch, and Walnut Creek have lower rates of severe cost burden for large owner households (5.5 and 3.5 percent, respectively) than other jurisdictions. Pittsburg is notable for its higher rate of severe cost burden for owner households (12.9 percent).
Income Groups
Low‐income owner households (>50 to ≤80 percent AMI) experience a high cost burden at a higher rate (52 percent) than do all households countywide (29 percent). The severe cost burden is nearly twice as high for low‐income owners (19 percent) as for all owners (10 percent). Very low‐income owners (>30 percent to ≤50 percent AMI) experience high and severe cost burdens much higher than the general population (59 percent and 36 percent). Extremely low‐income households (≤30 percent AMI) are even more cost burdened (72 percent high, 56 percent severe). The rate of cost burden for owner households with incomes above low income (>80 percent AMI) is lower than the overall population (20 percent high, 3 percent severe).
The Urban County area has cost burden rates by income roughly the same as the County as a whole.
Antioch has among the highest overall cost burden rates for lower‐income owner households, with 58 percent of low‐income homeowners experiencing a high cost burden and 14 percent severe. Very low‐income homeowners in Antioch have a 66 percent high cost burden rate and a 43 percent severe rate. Extremely low‐income owner households in Antioch have rates similar to the County as a whole.
Concord has a pattern similar to the County as a whole with the exception of low‐income households having a lower rate of severe cost burden (15 percent).
Pittsburg has a pattern similar to Concord. It also has a lower rate of cost burden for above low‐income households (16 percent high, 1 percent severe).
Richmond has a generally lower rate of cost burden for low‐income owner households (46 percent high, 12 percent severe). It is otherwise similar to the County as a whole.
Walnut Creek is also similar to the County as a whole with the exception of a lower rate of high cost burden for low‐income owners (39 percent).

COMMUNITY NEEDS
Contra Costa Consortium 2010–2015 Consolidated Plan April 28, 2010
59
TABLE 31 COST BURDEN SUMMARY, RENTERS
Jurisdiction All Renters Elderly Large Above low-
income Low-income Very low-income Extremely low-income
High Severe High Severe High Severe High Severe High Severe High Severe High Severe
Antioch 43.8% 20.4% 58.6% 40.6% 41.9% 19.0% 4.6% 0.4% 31.5% 5.5% 72.8% 17.0% 77.4% 58.0%
Concord 39.8% 16.4% 61.2% 30.8% 33.4% 14.7% 5.6% 0.1% 43.6% 3.0% 78.2% 22.2% 78.0% 62.4%
Pittsburg 41.5% 18.5% 53.2% 21.4% 32.2% 15.3% 3.2% 0.0% 42.8% 2.8% 73.4% 22.2% 72.3% 54.6%
Richmond 40.6% 19.3% 52.3% 24.2% 40.3% 18.0% 6.2% 0.2% 33.2% 1.9% 53.8% 13.0% 77.4% 55.2%
Walnut Creek 33.8% 16.4% 56.2% 35.3% 34.5% 12.0% 11.8% 2.2% 59.8% 10.1% 85.2% 53.3% 76.9% 67.7%
Urban County 36.0% 16.3% 58.5% 32.9% 32.9% 13.0% 10.7% 1.4% 46.6% 9.4% 72.7% 29.0% 74.1% 56.7%
Countywide 38.4% 17.4% 57.5% 32.1% 35.6% 15.3% 9.1% 1.0% 43.5% 6.4% 70.9% 24.48% 75.7% 57.6%
Source: 2000 CHAS data
TABLE 32 COST BURDEN SUMMARY, OWNERS
Jurisdiction All Owners Elderly Large Above low-
income Low-income Very low-income Extremely low-income
High Severe High Severe High Severe High Severe High Severe High Severe High Severe
Antioch 29.3% 8.0% 28.3% 14.4% 28.5% 5.5% 19.7% 1.5% 57.8% 13.9% 65.6% 42.8% 67.3% 54.5%
Concord 27.9% 8.8% 28.6% 13.9% 26.9% 6.1% 17.9% 1.6% 50.4% 15.2% 56.9% 35.0% 76.6% 57.4%
Pittsburg 29.4% 11.0% 28.6% 12.6% 32.7% 12.9% 15.7% 1.0% 51.2% 14.7% 60.9% 36.8% 70.7% 60.9%
Richmond 30.7% 11.3% 25.1% 13.6% 28.5% 7.0% 17.2% 2.2% 45.7% 11.2% 56.3% 27.9% 67.6% 51.4%
Walnut Creek 26.2% 9.8% 26.5% 11.2% 26.6% 3.5% 17.0% 3.4% 38.7% 18.6% 63.9% 32.2% 76.3% 60.9%
Urban County 28.1% 9.4% 23.9% 11.0% 30.0% 8.5% 21.0% 3.4% 54.7% 23.7% 57.1% 37.9% 71.7% 55.9%
Countywide 28.6% 9.7% 25.9% 12.0% 29.7% 8.2% 19.8% 2.8% 51.9% 19.3% 58.8% 35.7% 71.7% 56.0%
Source: 2000 CHAS data

COMMUNITY NEEDS
2010–2015 Consolidated Plan Contra Costa Consortium April 28, 2010
60
OVERCROWDING Table 33 illustrates the share of households by person per room for owners and renters in the state and entitlement cities. Households with more than 1 person per room are considered overcrowded. Households with more than 1.5 persons per room are considered severely overcrowded. As shown in Table 33, renter‐occupied households have a higher incidence of overcrowding than owner‐occupied households. In both categories (owner and renter), Walnut Creek has the smallest share of overcrowded households.
TABLE 33 PERSONS PER ROOM
Jurisdiction Owner Occupied Renter Occupied
<1.0 persons
1.01 to 1.5 persons
>1.5 persons
<1.0 persons
1.01 to 1.5 persons
>1.5 persons
State of California 91.4% 4.3% 4.3% 76.1% 8.5% 15.4%
Contra Costa County (countywide) 95.8% 2.5% 1.7% 85.3% 6.7% 8.0%
Antioch 96.1% 2.2% 1.8% 85.0% 9.3% 5.7%
Concord 96.0% 2.3% 1.7% 81.9% 7.6% 10.8%
Pittsburg 89.9% 6.2% 3.9% 77.3% 9.8% 12.9%
Richmond 90.0% 5.6% 4.4% 78.7% 9.1% 12.1%
Walnut Creek 99.2% 0.4% 0.4% 92.5% 3.7% 3.8%
Source: 2000 U.S. Census, Summary File 3, Table H20 Note: Due to rounding errors, the total percentage for owner or renter occupied may not total 100.
FORECLOSURES A foreclosure is a term used to describe the procedure followed in enforcing a creditor’s rights when a debt secured by any lien on property is in default. According to DataQuick, in Contra Costa County (countywide) there were 5,017 households with a notice of default (first stage in the foreclosure process) in the second quarter of 2009, a decrease of 0.6 percent over the same quarter in 2008. In the second quarter of 2009 there were 2,048 homes lost to foreclosure, representing a decrease of 30.9 percent from the same quarter in 2008.
The Contra Costa County Recorder keeps an inventory of notices of defaults, notices of trustee sales, and trustee’s deed upon sale (see definitions of each below). Table 34 provides the number of homes with each status for the entire year. Please note that one housing unit may be counted more than once per year.
• Notice of Default: A written document that gives constructive notice of a trustor’s failure to perform his/her obligation under a deed of trust. This document must be recorded.
• Notice of Trustee’s Sale: A written document that sets forth the day, date, and time of the trustee’s sale and describes the property to be sold. This document is prepared by

COMMUNITY NEEDS
Contra Costa Consortium 2010–2015 Consolidated Plan April 28, 2010
61
the trustee and must be recorded with the county recorder in the county in which the property is located at least 14 days prior to the scheduled sale date.
• Trustee’s Deed Upon Sale: A written document which is prepared and signed by the trustee when the secured property is sold at a trustee’s sale. This document transfers ownership to the successful bidder at the sale and must be recorded with the county recorder in the county in which the property is located.
TABLE 34 FORECLOSURE ACTIVITY
Year Total Notices of Defaults
Total Notices of Trustee Sales
Total Trustee’s Deed Upon Sale
2009 18,323 14,623 8,360
2008 17,714 14,932 11,679
2007 11,837 6,666 4,189
2006 4,380 1,479 502
2005 2,519 777 131
2004 2,413 864 163
2003 2,713 1,020 205
2002 2,815 1,076 190
2001 2,351 881 209
2000 2,207 1,034 398
Source: Contra Costa County Recorder, 2009
One of the most significant increases in demand for a range of services has come as a result of low‐income tenants being evicted from their homes because the property owner has been foreclosed upon. Most often the tenants are unaware that the foreclosure is under way and find themselves without housing. Due to the costs of moving, security deposit requirements, and the rent qualification process, they find it difficult or impossible to find new housing, particularly if they have experienced a job loss and have little or no income to qualify for a new rental and little in the way of savings. Seniors, disabled persons, and large families are especially adversely impacted when evicted. There is little legal recourse for tenants who are evicted as a result of foreclosures.38
LEAD-BASED PAINT Lead‐based paint in residential units can pose severe health risks for children. California requires public health agencies to identify children at risk of lead poisoning and requires that all children up to 6 years of age be evaluated.
38 Bay Area Legal Aid, Contra Costa County, September 17 and 18, 2009; Contra Costa Senior Legal Services, September 17 and 18, 2009; Loaves and Fishes of Contra Costa County, September 17 and 18, 2009.

COMMUNITY NEEDS
2010–2015 Consolidated Plan Contra Costa Consortium April 28, 2010
62
HUD provides a standard method to estimate the community‐wide risk of lead poisoning resulting from lead‐based paint in residential structures. The method assumes that a certain percentage of homes built before the sale of lead‐based paint was banned in 1979 constitute a lead poisoning hazard. The older the home, the more likely it is to constitute a lead poisoning hazard. The method also assumes that low‐income households are more likely to be at risk of lead poisoning. Applying the percentage of low‐income households by tenure to the age of homes by tenure and multiplying by the presumed lead hazard percentage results in the estimated number of households at risk of lead poisoning. The Lead Hazard Assessment tables in Appendix 5 provide estimates for the County and for each entitlement city.
As shown in the Lead Hazard Assessment tables, renter‐occupied households have a higher risk of lead poisoning than owner‐occupied households. Nearly 8 percent of renter‐occupied households in the County are at risk of lead poisoning and roughly 7 percent of owner‐occupied households are at risk.
PUBLIC HOUSING AND PUBLIC HOUSING AUTHORITIES There are three housing authorities in the County that provide affordability assistance: the Housing Authority of Contra Costa County, the Pittsburg Housing Authority, and the Richmond Housing Authority. The County Housing Authority has jurisdiction throughout the County with the exception of the cities of Pittsburg and Richmond, while the Pittsburg and Richmond authorities provide assistance to residents within those cities.
HOUSING AUTHORITY OF CONTRA COSTA COUNTY The Housing Authority of Contra Costa County (HACCC) provides housing assistance to low‐income County residents through three programs:
• Housing Choice Voucher Program (HCV) – HACCC has authority to lease 6,781 Housing Choice Vouchers. It currently only has enough funding to lease 6,200.
• Public Housing – HACCC administers 1,174 public housing units in 16 projects located in nine cities: Antioch, Brentwood, Oakley, Richmond, San Pablo, Bay Point, Martinez, Pittsburg, and Rodeo.
• Family Self‐Sufficiency – Voluntary program for Section 8 participants interested in becoming independent of public assistance.
Extremely low‐income households whose combined income is at or below 30 percent of the area median income comprise approximately 95 percent of the HCV program and over 90 percent of the families residing in HACCC’s public housing developments.
Special Programs
HACCC administers several special programs including Family Self‐Sufficiency, ShelterPlus Care, the Disaster Housing Assistance Program, and Project Coming Home.

COMMUNITY NEEDS
Contra Costa Consortium 2010–2015 Consolidated Plan April 28, 2010
63
• The Family Self‐Sufficiency (FSS) program helps families with Housing Choice Vouchers to obtain employment that will lead to economic independence and self‐sufficiency. Services are provided cooperatively through welfare agencies, schools, businesses, and other local partners. The focus of FSS is to develop the skills and experience to obtain employment that pays a living wage.
• The Shelter Plus Care program provides rental assistance for hard‐to‐serve homeless persons with disabilities in connection with supportive services.
• The Disaster Housing Assistance Program (currently DHAP “Ike”) provides temporary housing assistance to families displaced by natural disaster.
• HACCC is one of 10 Public Housing Authorities nationwide to receive Project Coming Home funding to meet the needs of homeless persons who suffer from chronic alcoholism.
Housing Choice Voucher (HCV) Waiting List
In November of 2008, HACC opened the HCV waiting list for the first time since 2001. The list closed five days later after receiving 38,000 applications. The overwhelming majority of applications were electronic submissions. The list was reduced to 6,000 families by using a lottery.
In 2009 HACC experienced a shortfall in funding for its HCV program as the result of budgeting errors at HUD. It has since taken actions to limit the cost of the HCV program.
The waiting list created in 2008 has not been analyzed by income or family type because there are no current prospects for new vouchers being made available.
PITTSBURG HOUSING AUTHORITY The Pittsburg Housing Authority manages the Section 8 voucher program for the City. The authority provides voucher assistance to 948 households. Table 35 provides a summary of the needs of families on the City’s Section 8 waiting list.

COMMUNITY NEEDS
2010–2015 Consolidated Plan Contra Costa Consortium April 28, 2010
64
TABLE 35 NEEDS OF FAMILIES ON THE PUBLIC HOUSING AUTHORITY WAITING LIST, PITTSBURG
Families Percentage of Total
Total 1,526 100.0%
By Family Income
Extremely low income 1,109 72.6%
Very low income 298 19.5%
Low income 119 7.8%
By Family Type
Families with children 1,045 68.5%
Elderly 47 3.1%
Families with disabilities 260 17.0%
Source: 2009 PHA Annual Plan, Housing Authority of the City of Pittsburg.
RICHMOND HOUSING AUTHORITY The Richmond Housing Authority uses HUD funding to provide rental assistance to lower‐income households through the following programs:
• Public Housing – Available to lower‐income residents that are either elderly, disabled, or a family. According to the City’s 2008–2009 PHA plan, the Housing Authority manages 678 public housing units. In addition, the plan identifies that there are 713 families on the public housing waiting list, of which 99 percent are extremely low‐income households.
• Housing Choice Vouchers (Section 8) – The Housing Authority manages the City’s Section 8 program. According to the PHA plan, there are 1,375 Section 8 units in the City. Table 36 provides a summary of the needs of families on the City’s Section 8 waiting list.

COMMUNITY NEEDS
Contra Costa Consortium 2010–2015 Consolidated Plan April 28, 2010
65
TABLE 36 NEEDS OF FAMILIES ON THE PUBLIC HOUSING AUTHORITY WAITING LIST, RICHMOND
Families Percentage of Total
Total 2,241 100%
By Family Income
Extremely low income 2,197 98%
Very low income 33 1.5%
Low income 11 0.5%
By Family Type
Families with children 962 42.9%
Elderly 1,096 48.9%
Families with disabilities 183 8.2%
Source: 2009 PHA Annual Plan, Housing Authority of the City of Richmond

COMMUNITY NEEDS
2010–2015 Consolidated Plan Contra Costa Consortium April 28, 2010
66

Contra Costa Consortium 2010–2015 Consolidated Plan April 28, 2010
67
STRATEGIC PLAN
PURPOSE AND ORGANIZATION OF THE STRATEGIC PLAN The Strategic Plan discusses the priority housing and community development needs of Contra Costa County as a whole and establishes objectives intended to meet those needs as well as strategies to implement the objectives.
Priority needs have been determined as the result of the needs assessment process. Assessment consisted of an analysis of the community setting including housing and population characteristics, consultations, public workshops, and an online survey.
A priority need is one that has a demonstrated level of need and will have a preference for funding. A higher level of priority can be established as the result of a high absolute level of need or a high level of need in relation to resources available to meet that need.
The discussion of priority needs is grouped into three major categories: housing, homeless and non‐housing community development. Housing needs are further divided into affordable housing and special needs housing. Non‐housing community development is divided into public services, economic development, infrastructure/public facilities, and administration.
Each category begins with a summary of priority needs. Following the summary are one or more short objective statements intended to meet the identified priority needs. Finally there are summaries of strategies that are intended to implement the objectives. Each strategy is identified with one or more objectives that it advances.
Following the discussion of strategies is a description of how the resources estimated to be available over the planning period will be targeted by priority need, by income category, and by geography.
A section is devoted to a description of the public housing strategies within the County and another briefly describes barriers to affordable housing and actions Consortium members will take to reduce them.
There is also a final category of implementation strategies that address the general implementation requirements of the Consortium’s housing and community development programs covered by this Strategic Plan. These strategies include:
• Meeting underserved needs, • Reducing lead poisoning hazards, • Reducing the level of poverty, • Assuring adequate institutional structure to implement the plan, • Affirmatively furthering fair housing,

STRATEGIC PLAN
2010–2015 Consolidated Plan Contra Costa Consortium April 28, 2010
68
• Monitoring, and • Meeting the needs of persons with limited English proficiency.
The strategies are intended to guide the implementation of the Consolidated Plan. They serve as a framework for individual projects, programs, and activities undertaken over the five‐year planning period. The annual Action Plan for each program year will identify the objective(s) which the undertaking is meeting and the strategy(ies) being pursued for each undertaking.
Strategies may be revised or additional strategies may be adopted during the term of this Strategic Plan provided they are consistent with the priority needs identified in this Plan and fulfill Plan objectives.
The discussion of funding sources and lead agencies follows this section. The association of the following strategies with the U.S. Department of Housing and Urban Development’s Community Planning and Development (CPD) Performance Measurement System outcome/objective categories, specific objectives, and performance indicators is shown in the tables appended to this Plan.
HOUSING STRATEGY
AFFORDABLE HOUSING
Priority Needs
The generally high cost of housing in the County relative to household income continues to indicate a high priority need for affordable housing. The cost and availability of housing varies significantly across the County; however low‐income households (<80 percent area median income [AMI]) continue to be challenged finding affordable housing in any part of the County. Very low‐income households (<50 percent AMI) have an even more significant challenge. Providing affordable housing to those income groups is a high priority need.
There is also a priority need for an increase in housing types that are more affordable, such as mixed use and higher‐density housing.
Energy costs have a significant impact on housing affordability. New housing construction and housing rehabilitation should have energy efficiency as a goal.
Housing conditions are also varied across the County. In general there is a significant amount of housing in need of repair. Preservation of existing rental housing is seen as key to preserving housing affordability for renters, either by preserving rent‐restricted housing or rehabilitating housing that is currently occupied by lower‐income households.
Ownership is expensive for low‐income and prohibitively expensive for very low‐income and extremely low‐income households. The level of subsidy required to construct or rehabilitate ownership housing for these income groups is also prohibitive. In order to create the greatest

STRATEGIC PLAN
Contra Costa Consortium 2010–2015 Consolidated Plan April 28, 2010
69
number of homes with the limited resources available, efforts to improve housing for these income groups is focused on rental housing.
The recent collapse of home values in combination with the high level of foreclosures has led to a shift in housing needs. These new needs include preventing foreclosures through homeowner counseling, providing incentives for the purchase and “re‐occupancy” of foreclosed homes, and an increase in the need for affordable rental housing. The need for blight prevention has also increased as the high number of foreclosures results in a high number of vacant properties.
Objectives
AH‐1: Expand housing opportunities for extremely low‐income, very low‐income, low‐income, and moderate‐income households through an increase in the supply of decent, safe, and affordable rental housing and rental assistance.
AH‐2: Increase homeownership opportunities.
AH‐3: Maintain and preserve the existing affordable housing stock.
AH‐4: Reduce the number and impact of home foreclosures.
Strategies
Please note that housing activities that benefit households with incomes above low income will be assisted using funds other than CDBG or HOME. These funds may include local redevelopment area tax increment funds.
Land Acquisition for New Construction (AH-1, 2)
Land acquisition for the purpose of constructing new affordable housing units. Housing constructed on the land may be rental or ownership. Ownership housing to target very low‐income, low‐income, and moderate‐income households; rental housing to target extremely low‐income and very low‐income households.
Construction and Development of New Affordable Housing (AH-1, 2)
New affordable housing production. Housing may be rental or ownership. Ownership housing to target very low‐income, low‐income, and moderate‐income households; rental housing to target extremely low‐income and very low‐income households.
Acquisition and Rehabilitation (AH-1, 2, 3, 4)
Acquisition and rehabilitation of existing housing. Housing may be used for rental or ownership and may include foreclosed housing. Dilapidated properties and/or properties that have a blighting influence on the surrounding area will be targeted for acquisition. Ownership housing to target very low‐income, low‐income, and moderate‐income households; rental housing to target extremely low‐income and very low‐income households.

STRATEGIC PLAN
2010–2015 Consolidated Plan Contra Costa Consortium April 28, 2010
70
Owner-Occupied Single-Family Rehabilitation (AH-3)
Assistance to extremely low‐income to moderate‐income owner‐occupant households to make repairs to their homes. Repairs will be to correct health and safety deficiencies, to repair or replace major building systems that are beyond their useful life, and to improve energy efficiency.
Rental Rehabilitation (AH-1, 3)
Assistance to owners of rental properties to improve properties currently occupied by extremely low‐income and very low‐income households. Repairs will be to correct health and safety deficiencies, to repair or replace major building systems that are beyond their useful life, and to improve energy efficiency.
First-Time Homebuyer (AH-2)
Assistance to very low‐income, low‐income, and moderate‐income first‐time homebuyers to subsidize the purchase of a home. Assistance may be targeted to areas harder hit by vacant foreclosed homes and/or targeted to buyers of vacant foreclosed homes.
Homebuyer Foreclosure Counseling (AH-4)
Counseling of homeowners in danger of foreclosure.
SPECIAL NEEDS HOUSING
Priority Needs
There are several groups that have a higher need for affordable housing and have special housing needs. These groups have been identified as:
• The elderly and frail elderly • Persons with disabilities (mental, physical, developmental) • Persons with HIV/AIDS and their families • Victims of domestic violence • Persons with alcohol or other drug addiction • Large households (more than 5 persons) • Youth (in general and aging‐out foster youth) • Persons discharged from institutions (prison, jail, mental hospital)
Note that the U.S. Department of Housing and Urban Development (HUD) does not require an analysis of large households but the Consortium believes this group falls into the special needs category.
Seniors and the disabled are more likely to face housing problems and have difficulty affording housing. Seniors and the disabled also have a need for accessible housing, whether it be new housing, rehabilitated existing housing, or the adaptation of the housing they currently occupy. In addition to general challenges, seniors may have supportive needs resulting from dementia.

STRATEGIC PLAN
Contra Costa Consortium 2010–2015 Consolidated Plan April 28, 2010
71
A specific need was identified for senior housing that allows the elderly to care for school‐aged children, presumably grandchildren.
A need for housing with supportive services was identified for seniors, the disabled, mentally ill persons, those with developmental disabilities, persons with HIV/AIDS, victims of domestic violence, persons with alcohol and other drug addiction, aging‐out foster youth, and persons discharged from institutions.
Objectives
AH‐5: Increase the supply of appropriate and supportive housing for special needs populations.
AH‐6: Preserve existing special needs housing.
AH‐7: Adapt or modify existing housing to meet the needs of special needs populations.
AH‐8: Improve access to services for those in special needs housing.
Strategies
All affordable housing programs will target special needs populations as appropriate.
Supportive and Special Needs Housing Production (AH-5)
The development and construction of special needs and supportive housing. May include the purchase of land for the construction of housing. Services should be integral to the housing.
Supportive and Special Needs Housing Preservation (AH-6)
Preserve supportive and special needs housing through subsidy of operations, services, and rehabilitation. Assistance must result in the creation of new special needs housing units or the extension of present restrictions on existing special needs units.
Housing Accessibility Modifications (AH-7)
Modifications and improvements to homes occupied by the frail elderly and persons with permanent physical disabilities. These modifications and improvements will be focused on improving the safety and accessibility of the home.
Housing and Supportive Services Coordination (AH-8)
Where possible, housing intended for special needs groups will be located in proximity to public transportation and services required by the special needs group occupying the housing. Supportive services will be provided as a resident service on site if they are not readily accessible to residents. This strategy would apply to site acquisition, new construction, and rehabilitation.

STRATEGIC PLAN
2010–2015 Consolidated Plan Contra Costa Consortium April 28, 2010
72
HOMELESS STRATEGY
Priority Needs
Homeless persons and families have both housing and services needs. The immediate housing need is for shelter. Medium and long‐term housing needs are for transitional housing and permanent supportive housing. Homeless results from a combination of factors related to the persons and families who are homeless and the socioeconomic systems that support them. Personal factors include generational poverty, weak or absent family and social networks, inadequate education or job skills, family break‐up resulting from violence or divorce, catastrophic illness, mental illness, and substance abuse/addiction. Socioeconomic factors include an inadequate supply of affordable housing, reduction in health and human services, the high cost of child care and transportation, and the lack of jobs that pay living wages. The affordable housing strategies address this need.
The homeless population is very diverse in nature and need. It varies by type of homelessness and family type. There are three types of homelessness: the chronically homeless, those discharged into homelessness, and the transitionally homeless.39
The chronically homeless, most often individuals, have been homeless for a year or longer and have experienced at least four episodes of homelessness in the last three years.40 They typically have significant untreated or undertreated mental illness or social disorders in addition to substance abuse issues and physical health problems. The chronically homeless are the most visible and have the most service demands.
Those discharged into homelessness are released from public institutions such as prisons, jails, and hospitals; from time‐limited treatment programs for mental illness and substance abuse; and from custodial care such as the foster care system. Without appropriate planning for permanent housing, these homeless can become part of the chronic homeless population.
The transitional homeless are those who experience homelessness perhaps once or twice in a lifetime and for periods of less than a year. They are often families, including families with children, and are often homeless because of a particular crisis such as loss of income, eviction, foreclosure, illness, disaster, or calamity (fire, flood, condemnation of unsafe housing). The greatest challenge for this segment is finding affordable housing.
The homeless may be single persons or families. Families may or may not have school‐aged children.
39 Ending Homelessness in Ten Years: A County‐Wide Plan for the Communities of Contra Costa County, Spring 2004. 40 Defining Chronic Homelessness: A Technical Guide for HUD Programs, September 2007

STRATEGIC PLAN
Contra Costa Consortium 2010–2015 Consolidated Plan April 28, 2010
73
A moderate level of need was indicated for new shelter and housing for the homeless, including transitional and permanent supportive housing. Shelter and housing that serves homeless families with children under 18 years of age was indicated as a high priority need, as was shelter and housing for aging‐out and emancipated foster youth.
Priority need services for the homeless are those services that are in highest need and lowest availability. Priority need services include mental health services and services for homeless children including day care. Homeless housing should include services.
The homeless also have a priority need for services on discharge from an institution. Many have recently been incarcerated or committed in a mental institution.
Prevention of homelessness is also a high need. Specific priority needs were for housing crisis intervention/housing placement, foreclosure prevention, tenants’ rights/counseling, and short‐term assistance with rent and utilities.
Contra Costa County’s ten‐year plan to end homelessness lays out a set of priorities and an action plan to end homelessness in the County, including within individual jurisdictions.41 The plan establishes the following five priorities to address homelessness:
• Help homeless people (re)gain housing as soon as possible. • Provide integrated, wraparound services to facilitate long‐term residential stability. • Help people to access employment that pays a “housing wage.” • Conduct outreach to link chronically homeless people with housing, treatment, and
services. • Prevent homelessness from occurring in the first place.
The ten‐year plan further establishes an action plan to help achieve these specific priorities. This Strategic Plan adopts those five priorities as objectives and the proposed actions as strategies.
Objectives
H‐1: Homeless and Housing Support Services: Assist the homeless and those at risk of becoming homeless by providing emergency, transitional, and permanent affordable housing with appropriate supportive services.
H‐2: Homeless and Housing Support Services: Reduce the incidence of homelessness and assist in alleviating the needs of the homeless.
In addition to these objectives, the affordable housing and human services objectives of this Plan also address the needs of the homeless and the problem of homelessness.
41 Ending Homelessness in Ten Years: A County‐Wide Plan for the Communities of Contra Costa County, 2004.

STRATEGIC PLAN
2010–2015 Consolidated Plan Contra Costa Consortium April 28, 2010
74
Strategies
Affordable Housing Production (H-1)
Use the following strategies described under affordable housing to produce new transitional or permanent supportive housing units. These units can be stand‐alone developments dedicated to housing the homeless or units dedicated to the homeless integrated into larger developments.
• Land acquisition • Construction and development • Acquisition and rehabilitation
Emergency Shelter Programs (H-1)
Provide operational support for existing emergency shelters. Assist existing emergency shelters with the capital costs of repair, maintenance, or expansion of capacity.
Crisis Intervention (H-2)
Support housing crisis intervention services which prevent homelessness.
Family Shelter and Homeless Housing (H-1)
Support the increase of shelter beds and housing for homeless families with children.
Where new housing for the homeless is being created, assure that beds or units are created that meet the needs of homeless families with children.
Services to the Homeless (H-2)
Services will be provided to the homeless in three ways:
• In coordination with shelter and housing. • Directly to the homeless. • By facilitating access to existing programs.
Services to the homeless will meet the following objectives.
• Help homeless people (re)gain housing as soon as possible. • Provide integrated, wraparound services to facilitate long‐term residential stability. • Help people to access employment that pays a “housing wage.” • Conduct outreach to link chronically homeless people with housing, treatment, and
services. • Prevent homelessness from occurring in the first place. • Increase permanent supportive housing opportunities for the homeless.
Homeless services provided will be comprehensive. Priority will be given to those services identified in this Strategic Plan as priority needs.

STRATEGIC PLAN
Contra Costa Consortium 2010–2015 Consolidated Plan April 28, 2010
75
Coordinated Services: Support services provided where the homeless are sheltered and/or housed. Where new shelter or housing is created for the homeless, services will be provided. The focus will be on the transition to permanent housing.
Direct Services: Support services that are provided directly to homeless persons. These programs would serve sheltered and unsheltered homeless, and the chronically homeless.
Homeless Access to Services: Human services programs will be open to homeless persons and families that are sheltered or unsheltered. Programs that meet the needs of a special needs population targeted under this Plan will be made available to homeless persons with special needs.
NON-HOUSING COMMUNITY DEVELOPMENT STRATEGY
PUBLIC SERVICES
Priority Needs
High priority services needs are for nutrition (home delivery and food bank), health care, mental health care, transportation, in‐home support, crisis intervention, violence prevention, child care, recreation/social programs, and fair housing. Moderate priority needs are for substance abuse treatment, employment, case management, and emergency shelter (non‐homeless).
Priority need populations identified were youth, seniors, children, emancipated youth, victims of domestic violence, the lesbian/gay/bisexual/transgender (LGBT) community, and persons recently released from jail or on parole.
Seniors have priority needs for food, in‐home support, transportation, protective services (physical and financial), dementia care, and assistance with access to existing services. Services targeted to the elderly homeless are needed as are services that support family caregivers to the elderly. Elderly who care for school‐age youth (grandchildren) also have special needs, including child care. Services to the elderly should focus on independent living.
Persons with disabilities have priority needs for transportation, food, in‐home support, and assistance with access to existing services. In general, all services should be made accessible to the blind.
The mentally ill have priority needs for mental health treatment and treatment of substance abuse.
Persons with HIV/AIDS need in‐home support, transportation, food, and interim financial assistance.

STRATEGIC PLAN
2010–2015 Consolidated Plan Contra Costa Consortium April 28, 2010
76
Children and families with children have priority needs for child care, health care, and after‐school programs.
A specific need exists for programs that serve teens. These programs include enrichment programs, prenatal care, parenting, basic life skills, and preparation for higher education and employment.
The coordination of existing services is important to overall efficacy. Services should be equally available and accessible to all residents of the County without regard to where they reside. The current concentration of services in large population centers is a barrier to serving all those in need. Services should also be made available in languages other than English as appropriate to the population being served.
Objectives
CD‐1 General Public Services: Ensure that opportunities and services are provided to improve the quality of life and independence for lower‐income persons, and ensure access to programs that promote prevention and early intervention related to a variety of social concerns such as substance abuse, hunger, and other issues.
CD‐2 Seniors: Enhance the quality of life of senior citizens and frail elderly, and enable them to maintain independence.
CD‐3 Youth: Increase opportunities for children/youth to be healthy, succeed in school, and prepare for productive adulthood.
CD‐4 Non‐Homeless Special Needs: Ensure that opportunities and services are provided to improve the quality of life and independence for persons with special needs, such as disabled persons, battered spouses, abused children, persons with HIV/AIDS, illiterate adults, and migrant farmworkers.
CD‐5 Fair Housing: Continue to promote fair housing activities and affirmatively further fair housing.
Strategies
Social Services Programs – General (CD-1, 2, 3, 5)
Support social services programs that meet the basic human needs of low‐income persons with an emphasis on serving priority needs populations and meeting priority needs. (“Low income” includes those presumed to be low income under CDBG regulations.)
Emergency Shelter – Non-Homeless (CD-4)
Support the operation of emergency shelters that serve non‐homeless populations such as victims of domestic violence and aging‐out foster youth. Funding may also be provided for capital improvements to increase capacity.
STRATEGIC PLAN
Contra Costa Consortium 2010–2015 Consolidated Plan April 28, 2010
77
Crisis Intervention (CD-1, 2, 3, 4)
Support crisis intervention services including those that serve victims of domestic violence, the elderly, and youth.
Information and Referral, and Outreach (CD-1)
Support efforts to provide information on existing services to those in need of services and to refer individuals in need of services. Encourage subrecipients to have an information, referral, and outreach plan.
ECONOMIC DEVELOPMENT
Priority Needs
Given the rates of unemployment in most of the Consortium jurisdictions, the downturn in the economy and other equally important factors, economic development (specifically training and re‐training), job development/creation, and small business lending is considered of moderate priority. The target population for economic development programs are the unemployed, under‐employed, disabled and homeless.
Objectives
CD‐6 Economic Development: Reduce the number of persons with incomes below the poverty level, expand economic opportunities for very low‐ and low‐income residents, and increase the viability of neighborhood commercial areas.
Strategies
Job Training (CD-6)
Support job training, retraining, and employment search services for low‐income persons.
Small Business Assistance (CD-6)
Provide technical assistance and capital (loan or grant) to small businesses/micro‐enterprises to develop and/or expand capacity and produce jobs for low‐income persons.
INFRASTRUCTURE/PUBLIC FACILITIES
Priority Needs
Improvements to infrastructure range from a low to high priority need. Identified needs were accessibility improvements in the right‐of‐way, street lighting, and general improvements to the right‐of‐way to improve its appearance.
Improvements to infrastructure which enhance accessibility (including right‐of‐way and street lighting) are a high priority need. Such improvements ensure that disabled members of the public have full and complete access to public facilities, sidewalks and thoroughfares.

STRATEGIC PLAN
2010–2015 Consolidated Plan Contra Costa Consortium April 28, 2010
78
Priority need public facilities are those that serve youth, meet recreation and social needs, provide child care and after‐school programs, are specific to a neighborhood (small scale), and serve as a source of information on available services. Public facility needs represent both physical improvements and structures that meet the needs of the identified populations, as well as programming and services available at those facilities.
Types of facilities include centers, gymnasiums, sports facilities, and playfields. Both new facilities and improvements to existing facilities such as lighting are priority needs. Improvements were cited as needed to enhance safety and to increase utilization.
Public facilities were identified as having an underutilized but potentially significant role in facilitating the provision of information and services to those in need. There is a need for multilingual/multicultural services and access to new technologies.
Public facilities can be owned and operated by a public entity or a private nonprofit entity that primarily serves the residents of the County.
Objectives
CD‐7 Infrastructure, Public Facilities and Accessibility: Maintain quality public facilities and adequate infrastructure and ensure access to public facilities for the disabled.
Strategies
Construct or Improve Public Facilities (CD-7)
Construct or improve public facilities including, but not limited to, providing and improving access to facilities for disabled persons. This may include directly improving or constructing facilities or providing assistance to nonprofit agencies that serve low‐income populations.
Removal of Barriers (CD-7)
Remove barriers to the safe travel of persons with disabilities that exist in the public right‐of‐way.
Right-of-Way Improvements (CD-7)
Make improvements to the public right‐of‐way to enhance public safety and accessibility, and to improve public health, and to promote the provision of a “complete streets program.” Improvements will be targeted to areas where the current level of improvements is less than the current standard.
ADMINISTRATION
Objective
CD‐8 Administration: Support development of viable urban communities through extending and strengthening partnerships among all levels of government and the private sector, and administer federal grant programs in a fiscally prudent manner.

STRATEGIC PLAN
Contra Costa Consortium 2010–2015 Consolidated Plan April 28, 2010
79
Strategies
Collaboration and Standardization (CD-8)
Consortium member jurisdictions will continue the collaborative administration of the County’s housing and community development programs undertaken under this Strategic Plan. This effort will include common policies and procedures for requests for the use of funds, subrecipient reporting, record‐keeping, and monitoring.
Support of Inter-Jurisdictional Efforts (CD-8)
Consortium member jurisdictions will support the efforts of the housing authorities of the City of Pittsburg, City of Richmond, and Contra Costa County. Members will also cooperatively further the efforts of the Contra Costa Inter‐jurisdictional Council on Homelessness (formerly known as the Continuum of Care Board).
TARGETING OF ESTIMATED RESOURCES The resources available under this Strategic Plan are limited. By necessity, they are targeted according to the priority of need within each jurisdiction. Needs also vary by income group and geography. Resources are targeted appropriately.
The following total resources are estimated to be available over the five‐year planning period:
FEDERAL FUNDS Community Development Block Grant $37,612,290
HOME Investment Partnerships Program $20,366,895
Emergency Shelter Grants $761,980
LOCAL FUNDS Redevelopment Housing Set‐Aside $34,200,000
These estimates are based on the current (FY 2009) allocations.
Please see the tables located in Appendix 6 for estimated resources by priority need and income group.
GEOGRAPHIC TARGETING AND NEIGHBORHOOD REVITALIZATION Depending on the type of need being addressed, resources may or may not be geographically targeted.
Affordable housing, including special needs housing, will be dispersed throughout the County to avoid concentrating low‐income populations. However, affordable housing and housing for the homeless will be located so services will be accessible to residents.

STRATEGIC PLAN
2010–2015 Consolidated Plan Contra Costa Consortium April 28, 2010
80
Assistance to improve or construct public facilities or infrastructure will generally be targeted to low‐income areas. Low‐income areas are indicated on the maps in Appendix 3. Assistance to improve public facilities may also be provided outside of low‐income areas if they primarily benefit low‐income households or persons or those groups presumed to be low‐income.
Services are not geographically targeted. Services will be provided in such a manner as to provide the greatest level of availability to the widest area possible.
There are several targeted efforts described below.
Iron Triangle NRSA (City of Richmond)
The City of Richmond has a Neighborhood Revitalization Strategy Area (NRSA) in the Iron Triangle and Woods neighborhoods. This area has been an officially designated NRSA since 1996. The majority of work in this neighborhood will continue to be steered by two major plans, the Macdonald Avenue Economic Revitalization Plan and the Central Richmond Revitalization Initiative. This NRSA comprises (year 2000) Census Tracts 3750, 3760 and 3770.
City of Richmond Target Neighborhoods
The City of Richmond will target assistance to the following neighborhoods based on historically high levels of poverty and unemployment, high housing density, and the poor condition of the housing stock.
• Easter Hill – Census Tract 3800 • Santa Fe – Census Tract 3790 • Pullman Plaza – Census Tract 3810 • Parchester – Block Group 1 of Census Tract 3650.01
North Richmond (City of Richmond/ Contra Costa County)
The City of Richmond and Contra Costa County will continue to participate in partnerships and collaboratives with the County and other agencies to better coordinate improvements in North Richmond. This target area comprises (year 2000) Census Tract 3650.02.
PUBLIC HOUSING STRATEGY
CONTRA COSTA COUNTY HOUSING AUTHORITIES There are three housing authorities that serve Contra Costa County. The Pittsburg Housing Authority serves the City of Pittsburg. The Richmond Housing Authority serves the City of Richmond. The Housing Authority of Contra Costa County serves the balance of the County.
The summaries of public housing strategies that follow are taken from each individual housing authority’s current five‐year Public Housing Agency (PHA) Plan and most recent annual PHA Plan.

STRATEGIC PLAN
Contra Costa Consortium 2010–2015 Consolidated Plan April 28, 2010
81
City of Pittsburg Housing Authority
Meeting Needs by Income
The City of Pittsburg Housing Authority (PHA) only administers the Housing Choice Voucher (HCV) Program. HUD has awarded the PHA with 948 vouchers and the PHA is currently 102 percent leased‐up.
Families served by the PHA are 71 percent extremely low‐income and 29 percent very low‐income.
The City of Pittsburg Housing Authority is a High Performing Housing Authority and as a result of its performance HUD awarded it with 35 rental vouchers to administer the Veterans Affairs Supportive Housing (VASH) Program. The PHA works closely with the Department of Veterans Affairs to serve homeless veterans with special needs. Presently the PHA has housed 30 veterans with the assistance of the Department of Veterans Affairs.
The PHA’s waiting list has been closed since December 2006. The PHA currently has 1,526 applicants on the waiting list. The waiting list consists of applicants with extremely low income (72.63 percent), very low income (19.52 percent), and low income (7.85 percent). Families with children are 68.43 percent, elderly families are 3.21 percent, and single families are 11.33 percent.
The PHA has a First Time Homeownership Program. To date two Section 8 participants have purchased homes and two are in escrow and due to close in the next 30 days. They continue to work with families to determine eligibility.
The PHA has also acquired three single‐family homes which are being rented to low‐income families.
Physical Needs of Public Housing
The Pittsburg Housing Authority does not own or operate any public housing.
Management and Operation of Public Housing
The Pittsburg Housing Authority does not own or operate any public housing.
Improving Living Environment of Public Housing Residents
The Pittsburg Housing Authority does not own or operate any public housing.
City of Richmond Housing Authority
Meeting Needs by Income
The Richmond Housing Authority has adopted the following strategies by income group.
• Target available assistance to families at or below 30 percent of AMI.

STRATEGIC PLAN
2010–2015 Consolidated Plan Contra Costa Consortium April 28, 2010
82
o Exceed HUD federal targeting requirements for families at or below 30 percent AMI in public housing.
o Adopt rent policies to support and encourage work. • Target available assistance to families at or below 50 percent of AMI.
o Employ admissions preferences aimed at families who are working. o Adopt rent policies to support and encourage work.
Physical Needs of Public Housing
The Richmond Housing Authority has a significant capital improvement program to meet the physical needs of public housing. The details of those efforts and the amount of funding for specific efforts are included in the annual PHA Plan. Capital needs exceed three million dollars.
The Richmond Housing Authority has adopted the following strategies to meet the physical needs of public housing.
• Renovate or modernize public housing units (see capital improvement plan). • Demolish or dispose of obsolete public housing units. (Nystrom Village and Hacienda). • Provide replacement public housing. (Nystrom Village and Hacienda). • Provide replacement vouchers. • Continue to find facilities able to accommodate expansion.
Management and Operation of Public Housing
The Richmond Housing Authority has adopted the following strategies to improve the management and operation of public housing.
• Expand the supply of assisted housing. o Reduce public housing vacancies: develop management and maintenance
policies minimizing turnaround time. • Improve the quality of assisted housing.
o Improve public housing management. o Improve voucher management. o Increase customer satisfaction. RHA has processes and procedures in place to
better serve the housing community. o Concentrate on efforts to improve specific management functions. RHA has
adopted asset management policies and procedures including budgeting and accounting requirements.
• Other o RHA will maintain at least three months operating reserve. o RHA will establish revenue generating policies. o RHA will continue to find facilities to accommodate expansion.
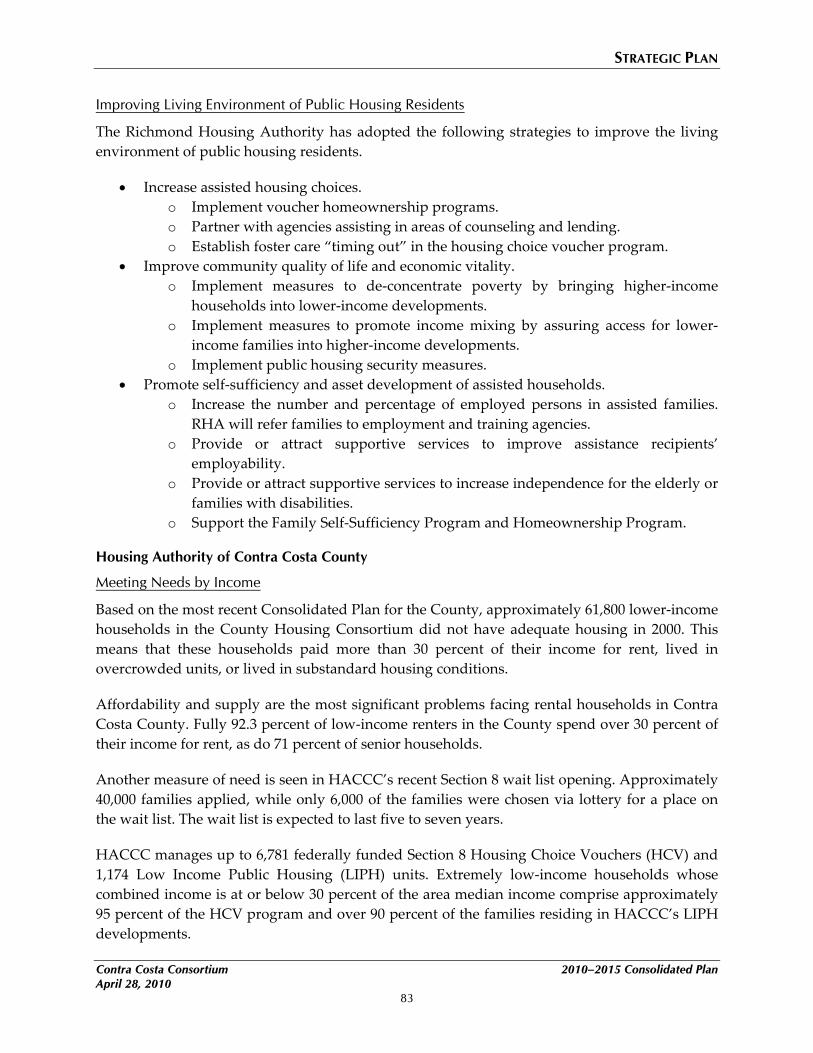
STRATEGIC PLAN
Contra Costa Consortium 2010–2015 Consolidated Plan April 28, 2010
83
Improving Living Environment of Public Housing Residents
The Richmond Housing Authority has adopted the following strategies to improve the living environment of public housing residents.
• Increase assisted housing choices. o Implement voucher homeownership programs. o Partner with agencies assisting in areas of counseling and lending. o Establish foster care “timing out” in the housing choice voucher program.
• Improve community quality of life and economic vitality. o Implement measures to de‐concentrate poverty by bringing higher‐income
households into lower‐income developments. o Implement measures to promote income mixing by assuring access for lower‐
income families into higher‐income developments. o Implement public housing security measures.
• Promote self‐sufficiency and asset development of assisted households. o Increase the number and percentage of employed persons in assisted families.
RHA will refer families to employment and training agencies. o Provide or attract supportive services to improve assistance recipients’
employability. o Provide or attract supportive services to increase independence for the elderly or
families with disabilities. o Support the Family Self‐Sufficiency Program and Homeownership Program.
Housing Authority of Contra Costa County
Meeting Needs by Income
Based on the most recent Consolidated Plan for the County, approximately 61,800 lower‐income households in the County Housing Consortium did not have adequate housing in 2000. This means that these households paid more than 30 percent of their income for rent, lived in overcrowded units, or lived in substandard housing conditions.
Affordability and supply are the most significant problems facing rental households in Contra Costa County. Fully 92.3 percent of low‐income renters in the County spend over 30 percent of their income for rent, as do 71 percent of senior households.
Another measure of need is seen in HACCC’s recent Section 8 wait list opening. Approximately 40,000 families applied, while only 6,000 of the families were chosen via lottery for a place on the wait list. The wait list is expected to last five to seven years.
HACCC manages up to 6,781 federally funded Section 8 Housing Choice Vouchers (HCV) and 1,174 Low Income Public Housing (LIPH) units. Extremely low‐income households whose combined income is at or below 30 percent of the area median income comprise approximately 95 percent of the HCV program and over 90 percent of the families residing in HACCC’s LIPH developments.

STRATEGIC PLAN
2010–2015 Consolidated Plan Contra Costa Consortium April 28, 2010
84
HACCC has employed the following strategies to address housing needs.
• Issue vouchers to extremely low‐income and very low‐income families on the recently opened HCV wait list.
• Award project‐based vouchers to developers creating or preserving affordable housing. • Partner with the County to the extent permitted by HUD regulations and as funding is
available to award project‐based vouchers to developers receiving affordable housing funding from the County.
• Attempt to increase the number of affordable housing units controlled by HACCC as the Authority repositions its public housing stock.
• Continue to contract with the County and the City of Antioch to manage their rental rehabilitation programs, which preserves and expands the supply of affordable housing.
• Continue to expand the Authority’s self‐sufficiency programs in an effort to stabilize and solidify the financial positions of families currently in the program while freeing existing housing subsidies for new families.
• HACCC plans to contract with financial and development consultants to develop an approach to the demolition, redevelopment, and/or disposition of its El Pueblo (176 units) and Las Deltas (246 units) public housing developments.
• HACCC‘s goal is to increase the number of housing units affordable to public housing eligible families and to provide adequate funding for these units over the long term.
• HACCC’s goal is to preserve those public housing developments with projected long‐term financial stability for eligible families.
Physical Needs of Public Housing
HACCC has an existing capital improvement program to address the physical needs of public housing developments. The 2009 budget of $2,093,969 funded by HUD’s Capital Fund Program (CFP) was enhanced by a one‐time grant of federal stimulus funds of $2,877,246 through the American Recovery and Reinvestment Act (ARRA).
The funding for the CFP program will address interior modernization, exterior modernization, landscaping, security lighting, and rehabilitation of parking at selected public housing developments. The ARRA funding is targeted for rehabilitating vacant units, exterior modernization, weatherization of windows, and increased security measures at HACCC’s two largest public housing developments.
While these funds assist HACCC to address public housing’s physical needs, the backlog of need for these developments greatly exceeds available funding. HACCC is preparing to contract for a new physical needs assessment of its public housing portfolio. This information will be used to direct available funding to the greatest needs and to plot a clearer course for the future of these developments.

STRATEGIC PLAN
Contra Costa Consortium 2010–2015 Consolidated Plan April 28, 2010
85
Management and Operation of Public Housing
HACCC is shifting its public housing management structure to a property‐based model in compliance with HUD’s Asset Management requirements.
Improving Living Environment of Public Housing Residents
HACCC strives to continually improve the living environment for its public housing residents. In the three largest public housing developments located within socioeconomically distressed areas, the Housing Authority has renewed its contracts with local law enforcement agencies to fund additional police officers and sheriffs deputies, which will increase law enforcement presence in those areas.
In the two largest public housing developments, HACCC has contracted to provide after‐school services for elementary‐school‐age children throughout the community and has contracted with the County to operate Head Start facilities at four public housing developments. HACCC operates, in collaboration with the County, the Young Adult Empowerment Center (YAEC), which assists young men and women with job readiness and skills development.
In addition to the foregoing, HACCC has implemented PG&E’s energy savings program at the Las Deltas, Bayo Vista, and Bridgemont developments; completed over 15,000 work orders this past year; provided for the interior and exterior modernization of its public housing developments using over $2.5 million in HUD funding; and plans to spend an additional $2.8 million in ARRA funding for rehabilitating vacant units, exterior modernization, weatherization of windows, and increased security measures at the two largest public housing developments.
STRATEGIES TO ADDRESS THE NEEDS OF PUBLIC HOUSING The member jurisdictions of the Consortium will meet the needs of public housing by coordinating the production and rehabilitation of affordable housing with the County’s housing authorities. Member jurisdictions will also coordinate housing programs such as homeownership with the housing authorities.
BARRIERS TO AFFORDABLE HOUSING As defined by the Consolidated Plan regulations, a barrier to affordable housing is a public policy such as land use controls, property taxes, zoning ordinances, building codes, fees and charges, growth limits, and other policies.
The State of California requires each city and county to prepare a Housing Element to its General Plan every five years. The Housing Element includes an analysis of constraints to housing and strategies to reduce or remove those constraints. Constraints that must be addressed include public policies and regulations that limit the availability of housing, particularly affordable housing.

STRATEGIC PLAN
2010–2015 Consolidated Plan Contra Costa Consortium April 28, 2010
86
The member jurisdictions’ Housing Elements have identified the following barriers to affordable housing and actions to address those barriers.
• Infrastructure constraints – Affordable housing developments are located in infill locations in areas already served by existing infrastructure. Such infill sites are beneficial in that they provide housing near public transit and jobs, encourage economic growth in urban areas, and don’t require the extension of services, thereby promoting “smart growth” development principles.
• Fees and exactions – To facilitate affordable housing development, member jurisdictions may defer, reduce, or waive a portion of the planning fees for nonprofit housing developers.
• Potential constraints for persons with disabilities – In order to facilitate the development of appropriate housing for persons with special needs, member jurisdictions may remove development constraints and provide reasonable accommodations in the development of such housing as requests are made.
IMPLEMENTATION STRATEGIES
OBSTACLES TO MEETING UNDERSERVED NEEDS Phone interviews with a wide range of social, health, and housing service providers in the Consortium jurisdictions consistently indicated that the current economic conditions has had a disproportionate impact on low‐income persons. The demand for these services increased substantially in 2009 while at the same time funding decreased substantially, resulting in the decrease or elimination of some services. Service providers are struggling to meet the demand for increased services with smaller budgets. They sometimes have to turn away clients or refer them to other service providers. The challenge of making services accessible to those who need them remains. Those in need of services most often do not own a car and are low‐income, disabled, or seniors. Poor public transportation options make it difficult for people in need of services to physically get to the service providers in many of the Consortium jurisdictions.
Increase in demand was linked to four factors:
1) Tenants being evicted as a result of foreclosures.
2) Job losses and reductions in work hours.
3) Reduction in supportive services and public benefits for seniors, disabled persons, and persons with HIV/AIDS.
4) Family stressors leading to an increase in domestic violence.
Several obstacles were identified to meeting underserved needs. In no particular order, they were:

STRATEGIC PLAN
Contra Costa Consortium 2010–2015 Consolidated Plan April 28, 2010
87
• Accessibility of services • Awareness of services • Coordination of services • Resources appropriate to the level of need • Language barriers
Accessibility
Lack of accessibility to services can be the result of lack of transportation for those in need, services that are not delivered in a culturally appropriate manner or in the appropriate language, burdensome prerequisites to accessing services (“red tape”), and services that are not provided in proximity to those in need.
Lack of transportation is a particular challenge for those who do not drive, do not have a car, or are elderly and for persons with disabilities. Transportation to services must be appropriate for the population in need, such as “door‐to‐door” transit for the elderly and persons with disabilities.
Services should be made available in the many languages and in a manner that is sensitive to the cultural context of all those being served. Several comments were made that some services appear to only be available to certain language or cultural groups.
Services should be offered in a manner that minimizes the burden of providing information prior to accessing services. Interactions with different agencies and different persons within those agencies should be minimized. The process involved to access services should be made as clear as possible to those being served.
In smaller County communities, in the unincorporated areas, and in the eastern region of the County, local access to a full range of services is limited. An effort will be made to encourage the provision of services countywide, with an emphasis on outreach to smaller communities and the use of local facilities to provide services. Services should be provided in safe and accessible facilities.
Awareness of Services
The lack of awareness of the availability of services by those in need and a lack of knowledge about how to access services are significant obstacles to the provision of services. Outreach to those in need should be significant and culturally appropriate.
Coordination of Services
Those in need must often access services from several points; similar services may also be provided by more than one agency. Those being served by one agency may have needs that are not being addressed by the particular agency currently serving that person or family. Services should be coordinated to avoid duplication. Collaboration among agencies is encouraged.

STRATEGIC PLAN
2010–2015 Consolidated Plan Contra Costa Consortium April 28, 2010
88
Efforts should be made to reduce the number of contacts a person or family must make to receive a full range of services. Every agency providing services should assess the complete needs of those being served and make referrals as needed.
Resources
Resources are generally less than required to meet the level of need and include funding, staff, staff with the appropriate skills and knowledge, facilities, and leadership. Those funds that are available will be prioritized to the highest priority needs. Funding will also be prioritized to those undertakings that represent the most efficient use of funds, are delivered by the most qualified persons, and serve the broadest geography.
LEAD HAZARD REDUCTION Each jurisdiction under this Strategic Plan is responsible for complying with the Residential Lead‐Based Paint Hazard Reduction Act of 1992 as implemented in 24 CFR 35 Subpart B. Compliance includes the following strategies.
Housing Rehabilitation
All housing rehabilitation activities funded under this Plan will assess lead hazard risk before proceeding. This applies to any work on structures constructed prior to January 1, 1978. The work will comply with the appropriate level of protection indicated in 24 CFR 35.100.
All work on homes constructed prior to January 1, 1978, will have a lead hazard risk assessment conducted as described at 24 CFR 35.110.
At the completion of any prescribed lead hazard reduction activities, a clearance examination is required as described at 24 CFR 35.110.
Each jurisdiction undertaking housing rehabilitation activities will be required to have a lead hazard reduction plan.
Information and Education
Households that participate in housing activities under this Plan, including home purchase, rental assistance, or rehabilitation, will be given educational material regarding the hazards of lead‐based paint, signs of lead poisoning, and strategies to reduce exposure. Materials will include the use of HUD/EPA publications such as “Protect Your Family from Lead in Your Home.” Information will be provided in multiple languages.
Testing
Blood testing of children occupying housing constructed prior to January 1, 1978. Testing can be in conjunction with housing programs, public health programs, or other programs conducted under this Plan.

STRATEGIC PLAN
Contra Costa Consortium 2010–2015 Consolidated Plan April 28, 2010
89
Monitoring
Annual monitoring of reporting of cases of child lead poisoning by the County Health Department. The results may be used to modify the current strategies and/or develop new programs.
ANTI-POVERTY
Reduction of Number of Families in Poverty
The objectives and strategies of this Strategic Plan are generally focused on reducing the number of families in poverty, improving the quality of life for the poorest of families, and lessening the impacts of poverty. Strategies include those addressing affordable housing, special needs housing, homelessness, public facilities, public improvements, and economic development.
The movement of people above the poverty line involves a variety of policies and programs that extend beyond providing opportunities for employment at a living wage. Access to education, transportation, childcare, and housing are key components that can assist persons to secure and retain economically self‐sustaining employment. The Consortium will employ a variety of strategies to help alleviate poverty in the County, including efforts to stimulate economic growth and job opportunities, and to provide Urban County residents with the skills and abilities required to take advantage of those opportunities.
Cal WORKS, California’s response to the Workforce Development Act of 1998, has altered the structure and function of the public social service delivery system. The new system emphasizes outcomes, the value of work and the duty of government to support its citizens in their self‐sufficiency efforts.
The County’s implementation of Cal WORKS has been constructed with the purpose of going beyond “welfare reform” to building models that integrate services, leverage funding and share expertise across agencies. Contra Costa County, in partnership with the Workforce Investment Boards from the City of Richmond, Alameda, and Oakland has formed a collaborative known as “Eastbay Works”. Presently there are 14 East Bay One Stop and Career Centers, more commonly known as One Stops; six of which specifically serve the needs of Contra Costa residents. One Stops are located in Richmond, Hilltop Mall (also in the City of Richmond), Concord, Pittsburg, Brentwood and San Pablo. The North Richmond Employment Collaborative opened in November of 1998 and provides employment services primarily to residents of North Richmond and surrounding communities, and is electronically linked to the One Stop facilities. In addition, Bay Point Works Community Career Center provides employment services to residents of Bay Point.
The East Bay One Stop and Career Centers offer services to the universal population that include targeted services for those who are presently receiving Temporary Assistance for Needy Families (TANF) funds. In addition to Job Training Partnership Act funds, the Workforce

STRATEGIC PLAN
2010–2015 Consolidated Plan Contra Costa Consortium April 28, 2010
90
Investment Board receive Welfare to Work formula grants and have secured competitive grants to provide enhanced services and expanded training options for this population. Services are available for eligible individuals and include in‐depth assessment, team case management, training, job placement assistance, and development of skills leading to higher wage earnings.
Opportunities for microenterprise and small business development are facilitated through a Small Business and Microenterprise Loan Program sponsored by the County’s CDBG Program. The purpose of the program is to stimulate local economic growth by providing loans and technical assistance to microenterprises and small businesses.
Childcare training programs assist low‐income persons in establishing themselves as in‐home childcare providers to achieve economic self‐sufficiency through self‐employment.
To the greatest extent possible, residents of housing rehabilitated or constructed under this Plan will have access to anti‐poverty programs. Owners and operators of such housing will be required to have a plan for resident services. Providers of services under this Strategic Plan will be required to inform and educate the residents of affordable housing and to facilitate access to services to the extent possible.
A significant number of affordable housing units produced under this Plan will be affordable to extremely low‐ and very low‐income households as well as to low‐income households. Units will also be made available to low‐ and very low‐income special needs households including seniors, persons with disabilities, homeless individuals and families, and persons with mental illness.
INSTITUTIONAL STRUCTURE The Consortium members coordinate Consolidated Planning efforts. Each entitlement jurisdiction in the Consortium completes its own annual planning and allocation process, including preparation and completion of its annual Action Plan, as well as its Consolidated Annual Performance Evaluation Report (CAPER). The annual Action Plan and CAPERs are subsidiary documents to the Consolidated Plan. These planning efforts have a high degree of coordination. Where appropriate, countywide services and efforts that have a countywide impact are coordinated.
The Contra Costa County Department of Conservation and Development (DCD) is responsible for the administration and management of the CDBG, HOME, ESG and Housing Opportunities for Persons with AIDS (HOPWA). The Department is responsible for the County’s lead administrative duties as well as for the Urban County programs and projects. The County is also the lead agency for the Contra Costa HOME Consortium. The County’s Redevelopment Agency also provides support, as do various County departments and divisions including Building Inspection Division, Department Employment and Human Services, and Department of Health Services. The County is served by the Housing Authority of Contra Costa County.

STRATEGIC PLAN
Contra Costa Consortium 2010–2015 Consolidated Plan April 28, 2010
91
Antioch’s Community Development Department has responsibility for activities carried out under this Strategic Plan. The City also has a redevelopment agency with several active project areas.
The Community and Recreation Services Department of the City of Concord implements the CDBG program.
In Pittsburg, programs are implemented by the Community Access Department. Pittsburg also has active redevelopment project areas. Pittsburg has one of two stand‐alone housing authorities in the County.
In Richmond, the programs are overseen by the Housing and Community Development division of the Development Services Department. Like Pittsburg, Richmond also has its own autonomous public housing authority.
Walnut Creek’s Community Development Department implements its programs, primarily through the Housing division.
The Contra Costa Inter‐jurisdictional Council on Homelessness (formerly known as the Continuum of Care Board) implements the County’s Ten‐Year Plan to End Homelessness.
AFFIRMATIVELY FURTHERING FAIR HOUSING Please see the Contra Costa Consortium 2010 Analysis of Impediments to Fair Housing Choice.
MONITORING Each member jurisdiction is responsible for monitoring the use of funds it awards.
Prior to funding consideration, all applications are reviewed for consistency with federal regulation, Consolidated Plan and local policy. Following funding approval, new subrecipients are required to attend a mandatory meeting to become familiar with program standards, County requirements, and federal regulations. Project sponsors are also required to enter into agreements that specify objectives, scope of work, applicable timelines and performance targets, budget, federal, state, and local regulatory requirements, and monitoring and reporting requirements.
During project implementation, project sponsors are required to submit periodic progress reports detailing project progress toward objectives, problems and/or resolution to meeting goals, and quantitative participation data by ethnicity, income, and household status. In addition, project sponsors are also required to provide updated sources and uses budgets subsequent to the completion of the second quarter. Projects are also subject to an on‐site performance and financial audit review on a selective basis. Priority is given to high‐risk programs for on‐site performance and/or audit review.

STRATEGIC PLAN
2010–2015 Consolidated Plan Contra Costa Consortium April 28, 2010
92
Periodic reports and payment requests are reviewed for compliance with the project agreement, budget consistency, and documentation of expenditures. Project sponsors are advised of any procedural errors and/or ineligible activities, and provided with technical assistance as needed.
Upon project completion, project sponsors are required to submit completion reports identifying program/project accomplishments, quantitative data, including number of persons or households served, ethnicity, and income level, and a final sources and uses budget.
In the Public Services category, the County seeks to coordinate activities for the efficient provision of services in the following ways:
Where applicable, the County and other Consortium members have developed standardized forms, including reporting forms and applications, in order to streamline and minimize paperwork.
The County follows a strategy of supporting programs that provide a variety of complementary and integrated services to targeted areas, and ensures that service providers are aware of other organizations that may augment their program.
The County also participates with other County departments and nonprofit organizations efforts to collaborate on the provision of services.
Affordable housing development projects must also submit annual compliance reports throughout the period of required affordability. These reports are designed to ensure continued compliance with federal regulations, affordability and use restrictions, and other requirements as specified in project loan documents. In addition, all HOME and CDBG‐assisted projects will be subject to periodic on‐site inspections to ensure continued compliance with federal housing quality standards.
Concurrent with on‐site inspections, DCD staff inspects tenant files to ensure the management company complies with HOME program and County requirements. The review includes confirming proper income certifications, correct rent and utility allowance calculations, and appropriate tenant lease provisions. The County has a licensing agreement with U.S. Communities for their FOCUS program. HUD’s income and rent limits are embedded in the program. The program allows for immediate feedback to asset managers on whether or not the unit is in compliance.
The County and the other entitlement jurisdictions within the County work together to refine and implement the Performance Outcome Measurement System framework. The effort is in response to HUD’s consolidated planning guidelines for the measurement of outcomes for HUD’s four major community development formula grant programs. The system includes objectives, outcomes, and indicators for each type of activity undertaken with funds made available from these programs.

STRATEGIC PLAN
Contra Costa Consortium 2010–2015 Consolidated Plan April 28, 2010
93
LIMITED ENGLISH PROFICIENCY In order to better serve Contra Costa County’s limited‐English‐proficient (LEP) residents, Contra Costa County (County) has developed a Language Assistance Plan (LAP). The implementation of the LAP is consistent with the U.S. Department of Housing and Urban Development’s Final Guidance (Federal Register/Vol. 72, No. 13, January 22, 2007) and Executive Order 13166 (August 11, 2000) to ensure that programs receiving federal financial assistance provide meaningful access to LEP persons. Failure to ensure that LEP persons can effectively participate in or benefit from federally assisted programs may violate Title VI of the Civil Rights Act of 1964 that prohibits discrimination based on national origin.
Implementation of the LAP will enable the County to better serve its beneficiaries by ensuring access to language assistance for its various housing and community development programs funded with federal funds. Although the County may have limited resources at a given time, the LAP ensures that access to language assistance for LEP residents will be provided in some form.
Goals of the LAP
The three major goals of the Contra Costa County Language Assistance Plan are as follows:
1) To provide meaningful access for the County’s LEP residents through the provision of free language assistance for the CDBG, HOME, ESG, and HOPWA programs;
2) To provide an appropriate means to ensure the involvement of LEP residents that are most likely to be affected by the programs and to ensure the continuity of their involvement;
3) To ensure that the County’s CDBG, HOME, ESG, and HOPWA staff will assist the County’s LEP population in obtaining the necessary services and/or assistance requested.
Each jurisdiction has adopted its own individual version of the LAP that implements these goals.
Monitoring and Updating the LAP
Given that the demographics and the needs of Contra Costa County residents are in constant flux, the County will periodically monitor and update the Language Assistance Plan. In order to consider changes to demographics, types of services, or other needs, the evaluation of the LAP shall be conducted annually in conjunction with the development of the County’s Consolidated Annual Performance and Evaluation Report (CAPER) of the CDBG, HOME, ESG, and HOPWA programs. In addition, the LAP shall be reevaluated in conjunction with the development of the County’s 5‐year Consolidated Plan for the CDBG, HOME, ESG, and HOPWA programs.

STRATEGIC PLAN
2010–2015 Consolidated Plan Contra Costa Consortium April 28, 2010
94
Areas that shall be considered during the evaluation and assessment of the LAP shall include the following:
• Current LEP populations in the jurisdiction’s geographic area or population affected or encountered;
• Frequency of encounters with LEP language groups; • The nature and importance of activities/services/programs to LEP persons; • The availability of resources, including technological advances and sources of additional
resources, and the costs imposed; • Whether existing assistance is meeting the needs of LEP persons; • Whether staff knows and understands the LAP and how to implement it; and • Whether identified sources for assistance are still available and viable.

APPENDIX 1.
AREAS OF MINORITY CONCENTRATION


355104
304000
301000
356002
355106
355303
315000
345201
303100303200
355200
347000
302002
352102
313202
346102
309000
302003
345110
378000
320001
346201
356001
346202
361000
354002
313103
352202
318000
354001
353001
357000314200
365001
302004
352101
345107
345109
355304
359202
360100
348000
305000
306002
358000
355301
350000
351200
346101
351100
320002
327000
355302
345108
314103
355101
359101
352201
345202
340002338302
380000
343003
365002
314102
321102
342000
321103
353002
363000321101
322000
337300
338202
308002
333100
341000
345105
308001
338201
324000
313101
349000
306001
339000 343002
345103
359203313201
337200
319000
307205332000
316000
325000
359204
331000
338100
337100
355305
334004
340001
343001
385100
333200
314104
360200
345101
307101
359102
364002313102
338301
381000
323000
367100
335000
379000
311000
369001
384000
372000
307204
307201
334003
377000
329000
326000
321200330000
310000
336200
382000
345102
364001
317000
307102
369002
312000
368000
391000383000
362000371000
334001367200
376000
328000
344000
366002
386000
366001
390100
370000374000
392000
373000
387000
307202
336101
389100
388000
336102
375000
385200
390200
334005
389200
Map 1Source: Bing Maps, 2009; Contra Costa County, 2009
T:\_G
IS\CO
NTRA
_COS
TA_C
OUNT
Y\MX
DS\C
DBG\
COUN
TYWI
DE_N
ON-W
HITE_
CONC
ENTR
ATIO
N.MX
D - 3
/10/20
10 @
12:23
:28 PM
2 0 2
MILES Minority Concentration - Contra Costa County
LegendCensus Tract
Minority ConcentrationConcentratedHighly Concentrated
A concentration is defined as a census block group with agreater percentage than that group's overall percentagein Contra Costa County (42.10%). A high concentration isdefined as a census block group with 1.5x the group'soverall percentage representation in the County (63.15%).


355106 303100
301000
303200
302002
313202
302003
355303
309000
313103
302004
304000
355304
305000
306002
304000
355101
314102
314103
308002
308001
313101 306001
313201
307205
355305
307101
313102
310000
311000
307102
307204
307201
314104
312000
355200
355200
307202
355301
355104
333100
Map 2Source: Bing Maps, 2009; Contra Costa County, 2009
T:\_G
IS\CO
NTRA
_COS
TA_C
OUNT
Y\MX
DS\C
DBG\
ANTIO
CH_N
ON_W
HITE_
CONC
ENTR
ATIO
N.MX
D - 3
/10/
2010
@ 12
:21:30
PM
2,600 0 2,600
FEET Minority Concentration - Antioch
LegendCensus TractCity Limit
Minority ConcentrationConcentratedHighly Concentrated
A concentration is defined as a census block group with agreater percentage than that group's overall percentagein Contra Costa County (42.10%). A high concentration isdefined as a census block group with 1.5x the group'soverall percentage representation in the County (63.15%).


355200
313202
355106
315000
355304
355301
347000
320002
320001
327000
355303
321102
355302
322000
337300
313103
333100
338201
321101
324000
338202
313201
337200
332000
321103
325000
331000
329000
338100
337100
355305
334004
326000
340001
333200
321200
314104
330000
340002
336200
323000
313101
335000
338301
311000314102
334003
334001
328000
336101336102
319000
310000
334005
338302339000
314200
Map 3Source: Bing Maps, 2009; Contra Costa County, 2009
T:\_G
IS\CO
NTRA
_COS
TA_C
OUNT
Y\MX
DS\C
DBG\
CONC
ORD_
NON_
WHITE
_CON
CENT
RATIO
N.MX
D - 3
/10/
2010
@ 12
:22:31
PM
2,000 0 2,000
FEET Minority Concentration - Concord
LegendCensus TractCity Limit
Minority ConcentrationConcentratedHighly Concentrated
A concentration is defined as a census block group with agreater percentage than that group's overall percentagein Contra Costa County (42.10%). A high concentration isdefined as a census block group with 1.5x the group'soverall percentage representation in the County (63.15%).


355200
313202
309000
313103
305000
314103
314200
314102
355106
313101
313201
307205
314104
315000
313102
310000
307101
311000
307204
307201
312000
307102
355106
307202
333200
332000
355304333100
308001
Map 4Source: Bing Maps, 2009; Contra Costa County, 2009
T:\_G
IS\CO
NTRA
_COS
TA_C
OUNT
Y\MX
DS\C
DBG\
PITTSB
URG_
NON_
WHITE
_CON
CENT
RATIO
N.MX
D - 3
/10/
2010
@ 12
:25:19
PM
1,500 0 1,500
FEET Minority Concentration - Pittsburg
LegendCensus TractCity Limit
Minority ConcentrationConcentratedHighly Concentrated
A concentration is defined as a census block group with agreater percentage than that group's overall percentagein Contra Costa County (42.10%). A high concentration isdefined as a census block group with 1.5x the group'soverall percentage representation in the County (63.15%).


356002378000
361000
365001
356001
359202
360100
354001
359101
380000
365002
363000
359203
359204
385100
360200
359102
364002
381000
382000
367100
379000
364001
369001
384000
372000
369002368000
391000383000
362000
371000
367200
377000
376000
366002
386000
366001
390100
370000374000
392000
373000
387000
358000
354002389100
388000
375000
385200
390200
389200
357000
Map 5Source: Bing Maps, 2009; Contra Costa County, 2009
T:\_G
IS\CO
NTRA
_COS
TA_C
OUNT
Y\MX
DS\C
DBG\
RICHM
OND_
NON-
WHITE
_CON
CENT
RATIO
N.MX
D - 3
/10/20
10 @
12:26
:32 PM
2,900 0 2,900
FEET Minority Concentration - Richmond
LegendCensus TractCity Limit
Minority ConcentrationConcentratedHighly Concentrated
A concentration is defined as a census block group with agreater percentage than that group's overall percentagein Contra Costa County (42.10%). A high concentration isdefined as a census block group with 1.5x the group'soverall percentage representation in the County (63.15%).


APPENDIX 2.
AREAS OF HISPANIC CONCENTRATION


355104
304000
301000
356002
355106
355303
315000
345201
303100303200
355200
347000
302002
352102
313202
346102
309000
302003
345110
378000
320001
346201
356001
346202
361000
354002
313103
352202
318000
354001
353001
357000314200
365001
302004
352101
345107
345109
355304
359202
360100
348000
305000
306002
358000
355301
350000
351200
346101
351100
320002
327000
355302
345108
314103
355101
359101
352201
345202
340002338302
380000
343003
365002
314102
321102
342000
321103
353002
363000321101
322000
337300
338202
308002
333100
341000
345105
308001
338201
324000
313101
349000
306001
339000 343002
345103
359203313201
337200
319000
307205332000
316000
325000
359204
331000
338100
337100
355305
334004
340001
343001
385100
333200
314104
360200
345101
307101
359102
364002313102
338301
381000
323000
367100
335000
379000
311000
369001
384000
372000
307204
307201
334003
377000
329000
326000
321200330000
310000
336200
382000
345102
364001
317000
307102
369002
312000
368000
391000383000
362000371000
334001367200
376000
328000
344000
366002
386000
366001
390100
370000374000
392000
373000
387000
307202
336101
389100
388000
336102
375000
385200
390200
334005
389200
Map 6Source: Bing Maps, 2009; Contra Costa County, 2009
T:\_G
IS\CO
NTRA
_COS
TA_C
OUNT
Y\MX
DS\C
DBG\
COUN
TYWI
DE_H
ISPAN
IC_C
ONCE
NTRA
TION.
MXD
- 3/9/
2010
@ 10
:01:19
AM
2 0 2
MILES Hispanic Concentration - Contra Costa County
LegendCensus Tract
Hispanic ConcentrationConcentratedHighly Concentrated
A concentration is defined as a census block group with agreater percentage than that group's overall percentagein Contra Costa County (17.68%). A high concentration isdefined as a census block group with 1.5x the group'soverall percentage representation in the County (26.52%).


355106 303100
301000
303200
302002
313202
302003
355303
309000
313103
302004
304000
355304
305000
306002
304000
355101
314102
314103
308002
308001
313101 306001
313201
307205
355305
307101
313102
310000
311000
307102
307204
307201
314104
312000
355200
355200
307202
355301
355104
333100
Map 7Source: Bing Maps, 2009; Contra Costa County, 2009
T:\_G
IS\CO
NTRA
_COS
TA_C
OUNT
Y\MX
DS\C
DBG\
ANTIO
CH_H
ISPAN
IC_C
ONCE
NTRA
TION.
MXD
- 3/9
/201
0 @ 9:
58:20
AM
2,700 0 2,700
FEET Hispanic Concentration - Antioch
LegendCensus TractCity Limit
Hispanic ConcentrationConcentratedHighly Concentrated
A concentration is defined as a census block group with agreater percentage than that group's overall percentagein Contra Costa County (17.68%). A high concentration isdefined as a census block group with 1.5x the group'soverall percentage representation in the County (26.52%).


355200
313202
355106
315000
355304
355301
347000
320002
320001
327000
355303
321102
355302
322000
337300
313103
333100
338201
321101
324000
338202
313201
337200
332000
321103
325000
331000
329000
338100
337100
355305
334004
326000
340001
333200
321200
314104
330000
340002
336200
323000
313101
335000
338301
311000314102
334003
334001
328000
336101336102
319000
310000
334005
338302339000
314200
Map 8Source: Bing Maps, 2009; Contra Costa County, 2009
T:\_G
IS\CO
NTRA
_COS
TA_C
OUNT
Y\MX
DS\C
DBG\
CONC
ORD_
HISPA
NIC_
CONC
ENTR
ATIO
N.MX
D - 3
/9/2
010 @
10:00
:14 A
M
2,000 0 2,000
FEET Hispanic Concentration - Concord
LegendCensus TractCity Limit
Hispanic ConcentrationConcentratedHighly Concentrated
A concentration is defined as a census block group with agreater percentage than that group's overall percentagein Contra Costa County (17.68%). A high concentration isdefined as a census block group with 1.5x the group'soverall percentage representation in the County (26.52%).


355200
313202
309000
313103
305000
314103
314200
314102
355106
313101
313201
307205
314104
315000
313102
310000
307101
311000
307204
307201
312000
307102
355106
307202
333200
332000
355304333100
308001
Map 9Source: Bing Maps, 2009; Contra Costa County, 2009
T:\_G
IS\CO
NTRA
_COS
TA_C
OUNT
Y\MX
DS\C
DBG\
PITTSB
URG_
HISPA
NIC_C
ONCE
NTRA
TION.
MXD
- 3/9
/2010
@ 10
:03:37
AM
1,500 0 1,500
FEET Hispanic Concentration - Pittsburg
LegendCensus TractCity Limit
Hispanic ConcentrationConcentratedHighly Concentrated
A concentration is defined as a census block group with agreater percentage than that group's overall percentagein Contra Costa County (17.68%). A high concentration isdefined as a census block group with 1.5x the group'soverall percentage representation in the County (26.52%).


356002378000
361000
365001
356001
359202
360100
354001
359101
380000
365002
363000
359203
359204
385100
360200
359102
364002
381000
382000
367100
379000
364001
369001
384000
372000
369002368000
391000383000
362000
371000
367200
377000
376000
366002
386000
366001
390100
370000374000
392000
373000
387000
358000
354002389100
388000
375000
385200
390200
389200
357000
Map 10Source: Bing Maps, 2009; Contra Costa County, 2009
T:\_G
IS\CO
NTRA
_COS
TA_C
OUNT
Y\MX
DS\C
DBG\
RICHM
OND_
HISPA
NIC_C
ONCE
NTRA
TION.
MXD
- 3/9
/2010
@ 10
:05:06
AM
2,900 0 2,900
FEET Hispanic Concentration - Richmond
LegendCensus TractCity Limit
Hispanic ConcentrationConcentratedHighly Concentrated
A concentration is defined as a census block group with agreater percentage than that group's overall percentagein Contra Costa County (17.68%). A high concentration isdefined as a census block group with 1.5x the group'soverall percentage representation in the County (26.52%).


APPENDIX 3.
AREAS OF LOW-INCOME AND VERY LOW-INCOME CONCENTRATION


355104
304000
301000
356002
355106
355303
315000
345201
303100303200
355200
347000
302002
352102
313202
346102
309000
302003
345110
378000
320001
346201
356001
346202
361000
354002
313103
352202
318000
354001
353001
357000314200
365001
302004
352101
345107
345109
355304
359202
360100
348000
305000
306002
358000
355301
350000
351200
346101
351100
320002
327000
355302
345108
314103
355101
359101
352201
345202
340002338302
380000
343003
365002
314102
321102
342000
321103
353002
363000321101
322000
337300
338202
308002
333100
341000
345105
308001
338201
324000
313101
349000
306001
339000 343002
345103
359203313201
337200
319000
307205332000
316000
325000
359204
331000
338100
337100
355305
334004
340001
343001
385100
333200
314104
360200
345101
307101
359102
364002313102
338301
381000
323000
367100
335000
379000
311000
369001
384000
372000
307204
307201
334003
377000
329000
326000
321200330000
310000
336200
382000
345102
364001
317000
307102
369002
312000
368000
391000383000
362000371000
334001367200
376000
328000
344000
366002
386000
366001
390100
370000374000
392000
373000
387000
307202
336101
389100
388000
336102
375000
385200
390200
334005
389200
Map 11Source: Bing Maps, 2009; Contra Costa County, 2009
T:\_G
IS\CO
NTRA
_COS
TA_C
OUNT
Y\MX
DS\C
DBG\
COUN
TYWI
DE_C
DBG_
TARG
ET_AR
EA.M
XD - 3
/10/
2010
@ 12
:15:02
PM
2 0 2
MILES Low Income Areas - Contra Costa County
LegendCensus TractLow Income Area
CDBG law authorizes an exception for grantees with no or veryfew areas in which 51 percent of residents are low and moderateincome. Contra Costa County is an exception grantee and itslow/moderate income threshold is 42.60%


355106 303100
301000
303200
302002
313202
302003
355303
309000
313103
302004
304000
355304
305000
306002
304000
355101
314102
314103
308002
308001
313101 306001
313201
307205
355305
307101
313102
310000
311000
307102
307204
307201
314104
312000
355200
355200
307202
355301
355104
333100
Map 12Source: Bing Maps, 2009; Contra Costa County, 2009
T:\_G
IS\CO
NTRA
_COS
TA_C
OUNT
Y\MX
DS\C
DBG\
ANTIO
CH_TA
RGET_
AREA
S.MXD
- 3/10
/201
0 @ 12
:12:22
PM
2,600 0 2,600
FEET Low Income Areas - Antioch
LegendCensus TractCity LimitLow Income Area
Low income areas are defined as census block groups thathave a concentration of 51 percent or more low/mod incomepopulation.


355200
313202
355106
315000
355304
355301
347000
320002
320001
327000
355303
321102
355302
322000
337300
313103
333100
338201
321101
324000
338202
313201
337200
332000
321103
325000
331000
329000
338100
337100
355305
334004
326000
340001
333200
321200
314104
330000
340002
336200
323000
313101
335000
338301
311000314102
334003
334001
328000
336101336102
319000
310000
334005
338302339000
314200
Map 13Source: Bing Maps, 2009; Contra Costa County, 2009
T:\_G
IS\CO
NTRA
_COS
TA_C
OUNT
Y\MX
DS\C
DBG\
CONC
ORD_
TARG
ET_AR
EAS.M
XD - 3
/10/20
10 @
12:14
:03 PM
2,000 0 2,000
FEET Low Income Areas - Concord
LegendCensus TractCity LimitLow Income Area
CDBG law authorizes an exception for grantees with no or veryfew areas in which 51 percent of residents are low and moderateincome. Concord is an exception grantee and itslow/moderate income threshold is 47.90%.


355200
313202
309000
313103
305000
314103
314200
314102
355106
313101
313201
307205
314104
315000
313102
310000
307101
311000
307204
307201
312000
307102
355106
307202
333200
332000
355304333100
308001
Map 14Source: Bing Maps, 2009; Contra Costa County, 2009
T:\_G
IS\CO
NTRA
_COS
TA_C
OUNT
Y\MX
DS\C
DBG\
PITTSB
URG_
CDBG
_TARG
ET_AR
EAS.M
XD - 3
/10/
2010
@ 12
:16:05
PM
1,500 0 1,500
FEET Low Income Areas - Pittsburg
LegendCensus TractCity LimitLow Income Area
Low income areas are defined as census block groups thathave a concentration of 51 percent or more low/mod incomepopulation.


356002378000
361000
365001
356001
359202
360100
354001
359101
380000
365002
363000
359203
359204
385100
360200
359102
364002
381000
382000
367100
379000
364001
369001
384000
372000
369002368000
391000383000
362000
371000
367200
377000
376000
366002
386000
366001
390100
370000374000
392000
373000
387000
358000
354002389100
388000
375000
385200
390200
389200
357000
Map 15Source: Bing Maps, 2009; Contra Costa County, 2009
T:\_G
IS\CO
NTRA
_COS
TA_C
OUNT
Y\MX
DS\C
DBG\
RICHM
OND_
LOW_
MOD.
MXD
- 3/1
0/201
0 @ 12
:17:05
PM
2,750 0 2,750
FEET Low Income Areas - Richmond
LegendCensus TractCity LimitLow Income Area Low income areas are defined as census block groups that have
a concentration of 51 percent or more low/mod income population.


355303
347000
346102
346201352101
355301
351200
348000
346101
351100
350000
355302
340002
352201
338302
343003
342000
345201
338202
337300
341000
338201
355304
349000
339000343002
356002
325000
355305
340001
343001
324000338100
326000
338301
337200
344000
352202
323000334003 334004
355104352102 352102
337100
353001
354002
353001
354002
355104
336200
353002
Map 16Source: Bing Maps, 2009; Contra Costa County, 2009
T:\_G
IS\CO
NTRA
_COS
TA_C
OUNT
Y\MX
DS\C
DBG\
WALN
UT_C
REEK
_TARG
ET_AR
EA_C
ONCE
NTRA
TION.
MXD
- 3/1
0/20
10 @
12:19
:44 PM
2,100 0 2,100
FEET Low Income Areas - Walnut Creek
LegendCensus TractCity LimitLow Income Area
CDBG law authorizes an exception for grantees with no or veryfew areas in which 51 percent of residents are low and moderateincome. Walnut Creek is an exception grantee and itslow/moderate income threshold is 32.50%.

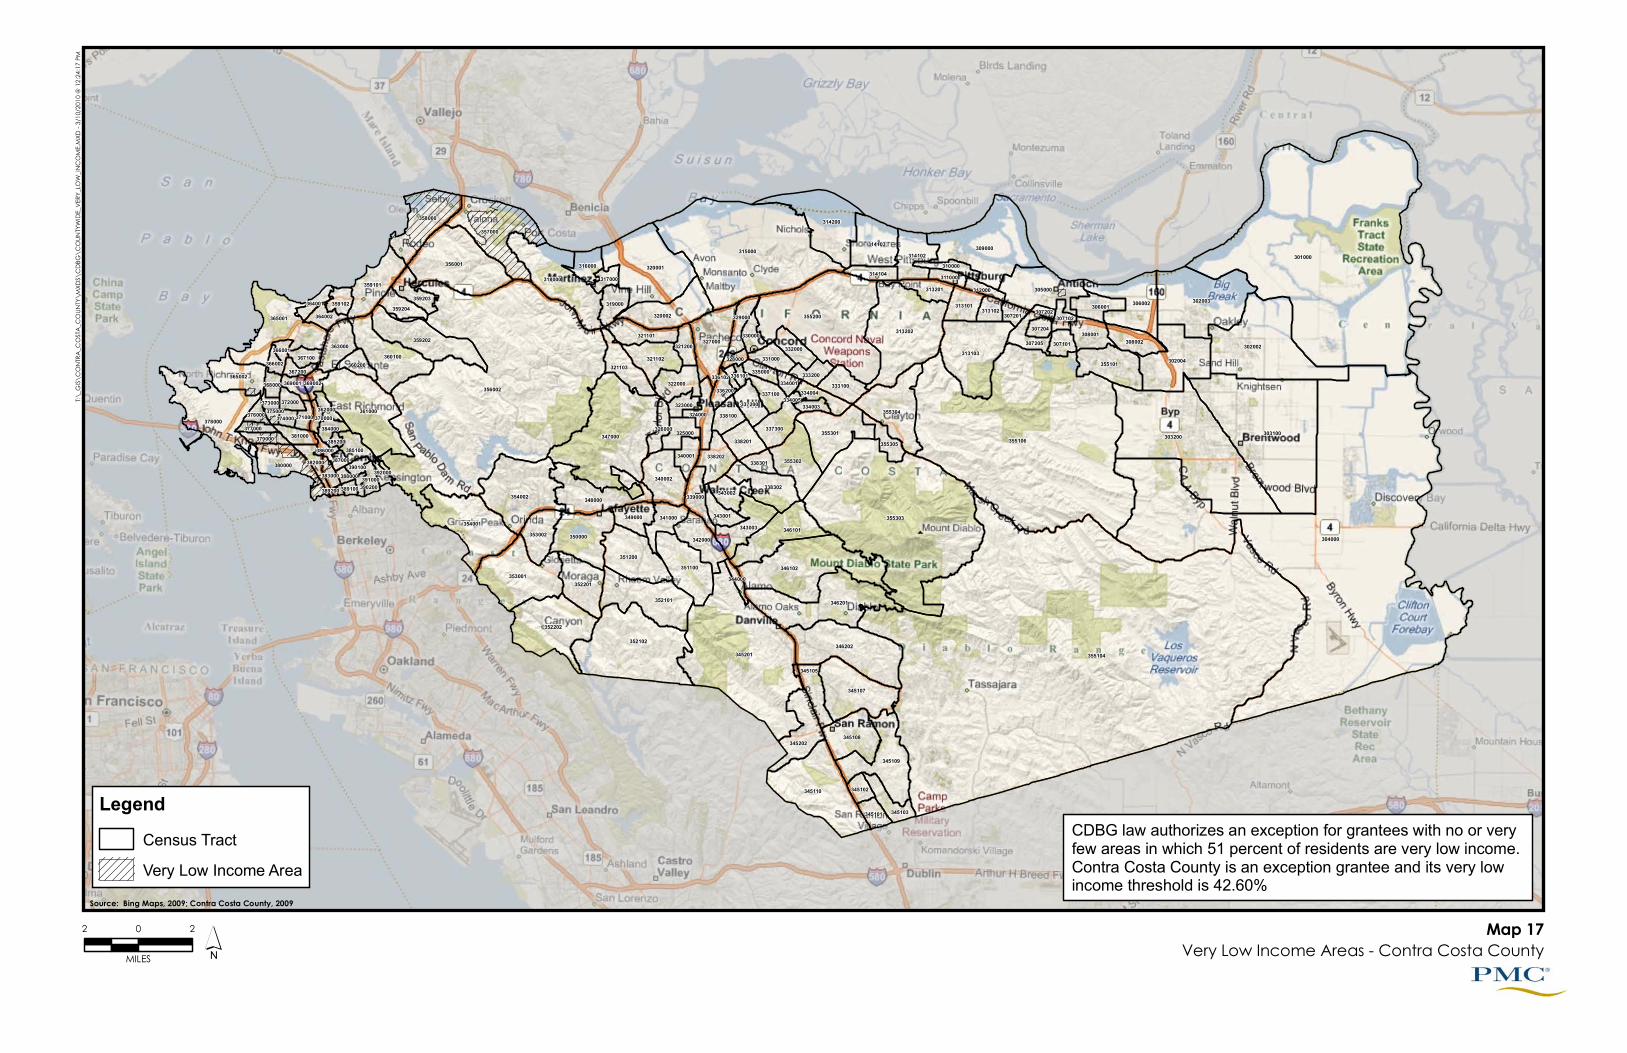
355104
304000
301000
356002
355106
355303
315000
345201
303100303200
355200
347000
302002
352102
313202
346102
309000
302003
345110
378000
320001
346201
356001
346202
361000
354002
313103
352202
318000
354001
353001
357000314200
365001
302004
352101
345107
345109
355304
359202
360100
348000
305000
306002
358000
355301
350000
351200
346101
351100
320002
327000
355302
345108
314103
355101
359101
352201
345202
340002338302
380000
343003
365002
314102
321102
342000
321103
353002
363000321101
322000
337300
338202
308002
333100
341000
345105
308001
338201
324000
313101
349000
306001
339000 343002
345103
359203313201
337200
319000
307205332000
316000
325000
359204
331000
338100
337100
355305
334004
340001
343001
385100
333200
314104
360200
345101
307101
359102
364002313102
338301
381000
323000
367100
335000
379000
311000
369001
384000
372000
307204
307201
334003
377000
329000
326000
321200330000
310000
336200
382000
345102
364001
317000
307102
369002
312000
368000
391000383000
362000371000
334001367200
376000
328000
344000
366002
386000
366001
390100
370000374000
392000
373000
387000
307202
336101
389100
388000
336102
375000
385200
390200
334005
389200
Map 17Source: Bing Maps, 2009; Contra Costa County, 2009
T:\_G
IS\CO
NTRA
_COS
TA_C
OUNT
Y\MX
DS\C
DBG\
COUN
TYWI
DE_V
ERY_
LOW_
INCOM
E.MXD
- 3/1
0/201
0 @ 12
:24:17
PM
2 0 2
MILES Very Low Income Areas - Contra Costa County
LegendCensus TractVery Low Income Area
CDBG law authorizes an exception for grantees with no or veryfew areas in which 51 percent of residents are very low income. Contra Costa County is an exception grantee and its very lowincome threshold is 42.60%


356002378000
361000
365001
356001
359202
360100
354001
359101
380000
365002
363000
359203
359204
385100
360200
359102
364002
381000
382000
367100
379000
364001
369001
384000
372000
369002368000
391000383000
362000
371000
367200
377000
376000
366002
386000
366001
390100
370000374000
392000
373000
387000
358000
354002389100
388000
375000
385200
390200
389200
357000
Map 18Source: Bing Maps, 2009; Contra Costa County, 2009
T:\_G
IS\CO
NTRA
_COS
TA_C
OUNT
Y\MX
DS\C
DBG\
RICHM
OND_
VERY
_LOW_
MOD.
MXD
- 3/1
0/20
10 @
1:07
:05 PM
2,800 0 2,800
FEET Very Low Income Areas - Richmond
LegendCensus TractCity LimitVery Low Income Area Very Low income areas are defined as census block groups that have
a concentration of 51 percent or more very low income population.

APPENDIX 4.
“CHAS” TABLES


Page | 1
Appendix 4 - CHAS Housing Problems Tables
The assessment of Contra Costa County’s housing needs relies on custom tabulations of
U.S. Decennial Census data provided by HUD. These tabulations are referred to as the
“CHAS” tables. They are obtained using HUD’s “State of the Cities Data System”
(SOCDS). These data are presented in two main tables, one presenting “housing
problems” by households and the other presenting “affordability mismatch” by housing
units. The needs of renter and owner households are examined separately.
The following are the housing problems tables for the State of California, Contra Costa
County, the Urban County area, and the five entitlement communities. Because of the
nature of the Consortium, data tables were acquired according to the CDBG geography.
Although this best approximates the jurisdictional boundaries within the Consortium, it
does introduce a significant level of rounding in the data.1
The CHAS housing problems tables present the number of households paying more
than 30 percent and 50 percent of gross income for housing by tenure, household type,
and income category. This cost of housing as a percentage of gross income is referred to
as the housing “cost burden.” According to HUD, a household which has a housing cost
burden over 30 percent has a “high” housing cost burden. Those with a cost burden over
50 percent have a “severe” cost burden.
1 Please see http://socds.huduser.org/chas/Frequently%20Asked%20Questions.htm


Elderly Small Related Large Related All Total Elderly Small Related Large Related All Total Total
1 & 2 (2 to 4) (5 or more) Other Renters 1 & 2 (2 to 4) (5 or more) Other Owners Households
member Households member Households
households households
(A) (B) (C) (D) (E) (F) (G) (H) (I) (J) (L)
1. Household Income <=50% MFI 344,660 646,560 335,000 486,800 1,813,020 411,249 210,095 114,040 120,730 856,114 2,669,134
2. Household Income <=30% MFI 209,065 332,745 161,320 297,120 1,000,250 180,589 92,950 40,400 70,075 384,014 1,384,264
3. % with any housing problems 70.9 87.8 97 74.9 81.9 68.1 79.1 92.6 70.1 73.7 79.6
4. % Cost Burden >30% 68.6 81.5 85.6 72.2 76.7 67.6 75.9 80.9 68.8 71.3 75.2
5. % Cost Burden >50% 51.7 69.7 65.1 64.7 63.7 48.9 68.1 72.1 59.8 58 62.1
6. Household Income >30% to <=50% MFI 135,595 313,815 173,680 189,680 812,770 230,660 117,145 73,640 50,655 472,100 1,284,870
7. % with any housing problems 74.8 87.2 95.3 87.5 86.9 46.3 78.7 93.1 73.6 64.6 78.7
8. % Cost Burden >30% 71.7 77.3 63.2 84.7 75.1 46 74.7 77.9 72.6 60.9 69.9
9. % Cost Burden >50% 37.6 27.3 13.8 43.9 30 25.3 55 47.1 54.5 39.2 33.4
10. Household Income >50 to <=80% MFI 102,155 410,305 200,510 288,425 1,001,395 314,849 271,170 163,865 91,565 841,449 1,842,844
11. % with any housing problems 58.5 63.2 87.2 59.9 66.6 30.9 70.4 86.2 67.5 58.4 62.8
12.% Cost Burden >30% 54.8 41.3 22.2 54.8 42.8 30.6 65.8 59.2 66.4 51.4 46.7
13. % Cost Burden >50% 15.6 4.9 1.7 9.6 6.7 14.1 29.7 16.9 34.9 22 13.7
14. Household Income >80% MFI 146,954 908,040 259,900 822,215 2,137,109 932,389 2,556,075 736,380 623,820 4,848,664 6,985,773
15. % with any housing problems 22.1 24.1 66.3 14.6 25.4 14.1 23.7 46.3 29.8 26.1 25.9
16.% Cost Burden >30% 18.6 7.3 3.7 10.3 8.8 13.9 20.8 18.4 28.9 20.1 16.7
17. % Cost Burden >50% 4.4 0.5 0.2 0.8 0.8 3.5 3.3 2.4 5.7 3.5 2.7
18. Total Households 593,769 1,964,905 795,410 1,597,440 4,951,524 1,658,487 3,037,340 1,014,285 836,115 6,546,227 11,497,751
19. % with any housing problems 57.6 53.1 84.1 42.7 55.3 27.7 31.7 58 40 35.8 44.2
20. % Cost Burden >30 54.6 38.2 38 38.7 40.3 27.4 28.6 31.8 39 30.1 34.5
21. % Cost Burden >50 30.6 17.4 16.7 19.4 19.5 13.5 9.7 10.8 16.4 11.7 15
Renters Owners
Household by Type, Income, & Housing Problem
Housing Problems Output for -All Households
Name of Jurisdiction:
California
Source of Data:
CHAS Data Book
Data Current as of:
2000

Elderly Small Related Large Related All Total Elderly Small Related Large Related All Total Total
1 & 2 (2 to 4) (5 or more) Other Renters 1 & 2 (2 to 4) (5 or more) Other Owners Households
member Households member Households
households households
(A) (B) (C) (D) (E) (F) (G) (H) (I) (J) (L)
1. Household Income <=50% MFI 8,060 14,650 6,045 9,715 38,470 15,035 7,060 2,779 4,470 29,344 67,814
2. Household Income <=30% MFI 5,333 7,845 2,945 5,770 21,893 6,897 3,015 989 2,480 13,381 35,274
3. % with any housing problems 70.7 81.3 94.6 75.5 79 63.8 85.2 93.9 75.6 73.1 76.7
4. % Cost Burden >30% 69 77.9 84.6 74.3 75.7 63.2 83.7 86.9 74.6 71.7 74.2
5. % Cost Burden >50% 48.9 60.7 55.9 62.4 57.6 43 74.5 76.8 61.3 56 57
6. Household Income >30% to <=50% MFI 2,727 6,805 3,100 3,945 16,577 8,138 4,045 1,790 1,990 15,963 32,540
7. % with any housing problems 76 79.5 88.9 85.7 82.1 43 78.4 89.9 71.6 60.8 71.7
8. % Cost Burden >30% 75.7 72.4 46.3 84.3 70.9 42.9 75.4 79.1 71.6 58.8 64.9
9. % Cost Burden >50% 39.2 19 10.3 36.1 24.8 22.7 50.4 41.3 54 35.7 30.1
10. Household Income >50 to <=80% MFI 1,918 7,413 2,445 5,879 17,655 8,968 8,785 3,520 3,108 24,381 42,036
11. % with any housing problems 57.5 51.4 80.8 54.8 57.3 29.9 71 80.3 66.1 56.6 56.9
12.% Cost Burden >30% 56.5 38.9 26 52.3 43.5 29.8 67.8 55.7 66.1 51.9 48.3
13. % Cost Burden >50% 17.9 4.3 2.5 7 6.4 12.3 26.2 11.6 28.4 19.3 13.9
14. Household Income >80% MFI 3,399 22,535 4,749 18,760 49,443 32,594 105,105 22,354 24,614 184,667 234,110
15. % with any housing problems 29.1 17.9 53.3 11.4 19.6 12.9 21.7 35 28.8 22.7 22
16.% Cost Burden >30% 25.6 8.2 3.3 8.6 9.1 12.7 20.1 19.2 28.4 19.8 17.5
17. % Cost Burden >50% 7.9 0.4 0 0.8 1 2.8 2.8 1.9 3.9 2.8 2.4
18. Total Households 13,377 44,598 13,239 34,354 105,568 56,597 120,950 28,653 32,192 238,392 343,960
19. % with any housing problems 59.3 44 75.9 38.1 48 26.1 28.8 46 38.6 31.5 36.6
20. % Cost Burden >30 57.5 35.4 35.6 35.8 38.4 25.9 27 29.7 38.2 28.6 31.6
21. % Cost Burden >50 32.1 14.5 15.3 16.2 17.4 12 7.9 8.2 13.8 9.7 12.1
Renters Owners
Household by Type, Income, & Housing Problem
Housing Problems Output for -All Households
Name of Jurisdiction:
Contra Costa County, California
Source of Data:
CHAS Data Book
Data Current as of:
2000

Elderly Small Related Large Related All Total Elderly Small Related Large Related All Total Total
1 & 2 (2 to 4) (5 or more) Other Renters 1 & 2 (2 to 4) (5 or more) Other Owners Households
member Households member Households
households households
(A) (B) (C) (D) (E) (F) (G) (H) (I) (J) (L)
1. Household Income <=50% MFI 768 1,831 668 789 4,056 1,013 658 299 237 2,207 6,263
2. Household Income <=30% MFI 542 934 350 433 2,259 507 309 125 122 1,063 3,322
3. % with any housing problems 65.3 81.5 97.1 76.2 79 55.6 78.3 100 77 69.9 76.1
4. % Cost Burden >30% 64.6 78.9 94.9 76.2 77.4 54.8 78.3 80.8 77 67.3 74.2
5. % Cost Burden >50% 48.9 61.6 60.9 59.6 58 38.7 72.5 80.8 47.5 54.5 56.9
6. Household Income >30% to <=50% MFI 226 897 318 356 1,797 506 349 174 115 1,144 2,941
7. % with any housing problems 65.5 89.4 88.7 86 85.6 40.9 90.5 86.2 79.1 66.8 78.3
8. % Cost Burden >30% 65.5 83.2 41.8 78.9 72.8 40.9 90.5 78.2 79.1 65.6 70
9. % Cost Burden >50% 37.6 13.3 8.8 20.5 17 30 59.6 35.1 60 42.8 27
10. Household Income >50 to <=80% MFI 120 851 206 342 1,519 620 1,178 528 163 2,489 4,008
11. % with any housing problems 52.5 41.8 77.7 32.2 45.4 30 70.5 78.8 60.7 61.5 55.4
12.% Cost Burden >30% 52.5 30.9 25.2 29.2 31.5 30 69.3 63.8 60.7 57.8 47.8
13. % Cost Burden >50% 45.8 1.6 0 4.1 5.5 4.5 20.6 5.9 26.4 13.9 10.7
14. Household Income >80% MFI 135 1,565 392 698 2,790 1,245 9,862 2,938 1,803 15,848 18,638
15. % with any housing problems 28.1 10 50 6.3 15.6 11.5 21.6 27.8 25 22.4 21.3
16.% Cost Burden >30% 28.1 3.6 3.6 2.9 4.6 11.5 20.5 17 25 19.7 17.4
17. % Cost Burden >50% 7.4 0 0 0 0.4 3.1 1.5 0.5 1.8 1.5 1.3
18. Total Households 1,023 4,247 1,266 1,829 8,365 2,878 11,698 3,765 2,203 20,544 28,909
19. % with any housing problems 58.9 48.9 77.3 43.2 53.2 28.4 30.1 40.1 33.4 32 38.2
20. % Cost Burden >30 58.6 42.5 41.9 40 43.8 28.3 29 28.5 33.4 29.3 33.5
21. % Cost Burden >50 40.6 16.7 19 18.9 20.4 14.4 7 5.5 9.2 8 11.6
Renters Owners
Household by Type, Income, & Housing Problem
Housing Problems Output for -All Households
Name of Jurisdiction:
Antioch(CDBG), California
Source of Data:
CHAS Data Book
Data Current as of:
2000

Elderly Small Related Large Related All Total Elderly Small Related Large Related All Total Total
1 & 2 (2 to 4) (5 or more) Other Renters 1 & 2 (2 to 4) (5 or more) Other Owners Households
member Households member Households
households households
(A) (B) (C) (D) (E) (F) (G) (H) (I) (J) (L)
1. Household Income <=50% MFI 1,159 2,302 991 1,480 5,932 1,823 719 244 716 3,502 9,434
2. Household Income <=30% MFI 773 1,011 380 897 3,061 888 313 51 421 1,673 4,734
3. % with any housing problems 68.4 85.1 98.9 80.9 81.4 76.4 86.9 92.2 68.4 76.8 79.8
4. % Cost Burden >30% 65.2 79.2 97.9 79.3 78 76.4 85.6 92.2 68.4 76.6 77.5
5. % Cost Burden >50% 48.1 63.1 78.7 67.1 62.4 51.4 74.8 84.3 53.9 57.4 60.6
6. Household Income >30% to <=50% MFI 386 1,291 611 583 2,871 935 406 193 295 1,829 4,700
7. % with any housing problems 77.2 89.1 97.1 94.2 90.2 41.1 75.1 91.7 63.7 57.6 77.5
8. % Cost Burden >30% 77.2 85.3 49.4 93.5 78.2 41.1 75.1 84.5 63.7 56.9 69.9
9. % Cost Burden >50% 30.1 21.8 8.2 32.2 22.2 22.7 50 48.7 44.4 35 27.1
10. Household Income >50 to <=80% MFI 251 1,381 545 1,078 3,255 1,127 1,056 360 591 3,134 6,389
11. % with any housing problems 59 51.4 86.2 61.5 61.2 30.2 67.3 86.9 58.7 54.6 57.9
12.% Cost Burden >30% 57.4 37.2 27.3 56.9 43.6 30.2 66 54.2 58.7 50.4 46.9
13. % Cost Burden >50% 4 1.6 3.5 4.3 3 12.3 19.5 5.6 18.6 15.2 9
14. Household Income >80% MFI 207 3,417 961 2,403 6,988 3,347 11,666 2,357 3,235 20,605 27,593
15. % with any housing problems 21.3 18 48.3 10.2 19.6 12.1 18.3 34.7 28.5 20.8 20.5
16.% Cost Burden >30% 21.3 4.8 1.2 7 5.6 12 17 16.6 28.2 17.9 14.8
17. % Cost Burden >50% 0 0 0 0.2 0.1 2 1.6 1.1 1.3 1.6 1.2
18. Total Households 1,617 7,100 2,497 4,961 16,175 6,297 13,441 2,961 4,542 27,241 43,416
19. % with any housing problems 63 47 76.2 44 52.2 28.7 25.5 45.7 38.4 30.6 38.6
20. % Cost Burden >30 61.2 36.3 33.4 41.1 39.8 28.6 24.2 26.9 38.2 27.9 32.3
21. % Cost Burden >50 30.8 13.3 14.7 16.9 16.4 13.9 6.2 6.1 11.3 8.8 11.6
Renters Owners
Household by Type, Income, & Housing Problem
Housing Problems Output for -All Households
Name of Jurisdiction:
Concord(CDBG), California
Source of Data:
CHAS Data Book
Data Current as of:
2000

Elderly Small Related Large Related All Total Elderly Small Related Large Related All Total Total
1 & 2 (2 to 4) (5 or more) Other Renters 1 & 2 (2 to 4) (5 or more) Other Owners Households
member Households member Households
households households
(A) (B) (C) (D) (E) (F) (G) (H) (I) (J) (L)
1. Household Income <=50% MFI 510 1,229 542 563 2,844 803 532 327 244 1,906 4,750
2. Household Income <=30% MFI 379 643 272 328 1,622 352 210 127 104 793 2,415
3. % with any housing problems 68.6 84.4 97.1 70.1 80 53.1 89 93.7 78.8 72.5 77.5
4. % Cost Burden >30% 59.6 74.7 90.4 67.1 72.3 50.3 89 90.6 78.8 70.7 71.8
5. % Cost Burden >50% 31.4 64.7 66.9 51.5 54.6 32.7 83.3 90.6 75 60.9 56.7
6. Household Income >30% to <=50% MFI 131 586 270 235 1,222 451 322 200 140 1,113 2,335
7. % with any housing problems 70.2 84 96.3 92.3 86.8 39.7 73.3 100 60.7 62.9 75.4
8. % Cost Burden >30% 70.2 79.4 45.6 92.3 73.4 39.7 70.2 94 60.7 60.9 67.5
9. % Cost Burden >50% 26 25.6 1.5 35.3 22.2 20.4 40.7 55 55 36.8 29.2
10. Household Income >50 to <=80% MFI 102 569 178 387 1,236 292 760 439 105 1,596 2,832
11. % with any housing problems 51 56.9 79.8 55 59.1 25.3 62.5 71.8 82.9 59.6 59.4
12.% Cost Burden >30% 51 43.8 10.7 54 42.8 25.3 56.8 51 82.9 51.2 47.5
13. % Cost Burden >50% 0 0.7 0 7.8 2.8 7.5 16.4 7.5 51.4 14.7 9.5
14. Household Income >80% MFI 102 1,042 498 721 2,363 749 4,349 1,390 958 7,446 9,809
15. % with any housing problems 9.8 10.3 52.4 8.5 18.6 13 17.8 41.8 30.5 23.4 22.3
16.% Cost Burden >30% 9.8 2.6 0.8 4.7 3.2 13 14.1 12.9 29 15.7 12.7
17. % Cost Burden >50% 0 0 0 0 0 0.5 0.3 1.4 4.1 1 0.8
18. Total Households 714 2,840 1,218 1,671 6,443 1,844 5,641 2,156 1,307 10,948 17,391
19. % with any housing problems 58 51.6 76.1 43.1 54.8 29.1 29.7 56.4 41.8 36.3 43.1
20. % Cost Burden >30 53.2 43 32.2 40.7 41.5 28.6 25.8 32.7 40.7 29.4 33.9
21. % Cost Burden >50 21.4 20.1 15.3 16.9 18.5 12.6 7.9 12.9 19 11 13.8
Renters Owners
Household by Type, Income, & Housing Problem
Housing Problems Output for -All Households
Name of Jurisdiction:
Pittsburg(CDBG), California
Source of Data:
CHAS Data Book
Data Current as of:
2000

Elderly Small Related Large Related All Total Elderly Small Related Large Related All Total Total
1 & 2 (2 to 4) (5 or more) Other Renters 1 & 2 (2 to 4) (5 or more) Other Owners Households
member Households member Households
households households
(A) (B) (C) (D) (E) (F) (G) (H) (I) (J) (L)
1. Household Income <=50% MFI 953 3,246 1,648 1,822 7,669 1,686 1,054 486 556 3,782 11,451
2. Household Income <=30% MFI 726 1,974 877 1,218 4,795 868 495 182 344 1,889 6,684
3. % with any housing problems 72.7 82 92 78.2 81.5 57.6 78.4 100 76.7 70.6 78.4
4. % Cost Burden >30% 72.7 78.2 79.4 77.3 77.4 57.6 74.7 78.6 76.7 67.6 74.6
5. % Cost Burden >50% 41 56 50.2 65.8 55.2 35.7 67.1 51.6 68.3 51.4 54.1
6. Household Income >30% to <=50% MFI 227 1,272 771 604 2,874 818 559 304 212 1,893 4,767
7. % with any housing problems 63 62.7 83.7 70.7 70 30.3 75.8 92.1 81.1 59.4 65.8
8. % Cost Burden >30% 61.2 55.4 37.6 68.4 53.8 30.3 71.6 80.9 81.1 56.3 54.8
9. % Cost Burden >50% 20.3 10.9 6.7 22.5 13 22 29.5 18.1 60.8 27.9 18.9
10. Household Income >50 to <=80% MFI 196 1,056 471 849 2,572 829 1,031 538 320 2,718 5,290
11. % with any housing problems 28.6 44.4 85.8 49.6 52.5 23.6 71.5 81.6 60 57.5 55.1
12.% Cost Burden >30% 28.6 27.7 21.9 47.2 33.2 23.6 64.5 35.1 60 45.7 39.6
13. % Cost Burden >50% 0 1.7 0 3.5 1.9 8.6 15.1 4.5 16.6 11.2 6.7
14. Household Income >80% MFI 311 2,455 607 2,300 5,673 1,909 5,973 1,570 2,260 11,712 17,385
15. % with any housing problems 12.9 18.3 71.2 12.2 21.2 9.9 21.6 43.9 28.5 24 23.1
16.% Cost Burden >30% 12.9 3.8 1.6 9 6.2 8.6 17.5 10.2 28.4 17.2 13.6
17. % Cost Burden >50% 3.2 0 0 0 0.2 2 2.3 0.5 3 2.2 1.5
18. Total Households 1,460 6,757 2,726 4,971 15,914 4,424 8,058 2,594 3,136 18,212 34,126
19. % with any housing problems 52.5 49.3 83.9 41.9 53.2 25.6 35.2 61.3 40.6 37.5 44.9
20. % Cost Burden >30 52.3 39 40.3 39.5 40.6 25.1 30.8 28.5 40.5 30.7 35.3
21. % Cost Burden >50 24.2 18.7 18 19.5 19.3 13.6 9.8 7 15.4 11.3 15
Renters Owners
Household by Type, Income, & Housing Problem
Housing Problems Output for -All Households
Name of Jurisdiction:
Richmond(CDBG), California
Source of Data:
CHAS Data Book
Data Current as of:
2000

Elderly Small Related Large Related All Total Elderly Small Related Large Related All Total Total
1 & 2 (2 to 4) (5 or more) Other Renters 1 & 2 (2 to 4) (5 or more) Other Owners Households
member Households member Households
households households
(A) (B) (C) (D) (E) (F) (G) (H) (I) (J) (L)
1. Household Income <=50% MFI 3,643 5,228 1,926 4,077 14,874 7,093 3,517 1,282 2,150 14,042 28,916
2. Household Income <=30% MFI 2,315 2,860 956 2,425 8,556 3,111 1,416 438 1,170 6,135 14,691
3. % with any housing problems 73.1 78.3 92.9 72.7 76.9 61.8 88.1 90.6 75 72.5 75.1
4. % Cost Burden >30% 71.7 76.6 78.8 71.5 74.1 61 87.3 90.6 74.2 71.7 73.1
5. % Cost Burden >50% 53.3 60 46.5 60.1 56.7 40.6 77.5 80.1 61.2 55.9 56.4
6. Household Income >30% to <=50% MFI 1,328 2,368 970 1,652 6,318 3,982 2,101 844 980 7,907 14,225
7. % with any housing problems 80.4 77.7 86.1 85.8 81.7 40 80.3 88.3 69.8 59.5 69.4
8. % Cost Burden >30% 80.1 68.8 50.5 85.2 72.7 39.9 76.2 75.7 69.8 57.1 64
9. % Cost Burden >50% 38.8 21.6 15.7 39.7 29 21.9 57.1 47.4 53.9 37.9 34
10. Household Income >50 to <=80% MFI 870 3,073 920 2,522 7,385 4,266 4,338 1,485 1,523 11,612 18,997
11. % with any housing problems 59.2 52.2 75.9 54.8 56.8 29.1 74.6 82 69.9 58.2 57.7
12.% Cost Burden >30% 58.7 41.8 32.9 53.3 46.6 29 71.9 62.5 69.9 54.7 51.5
13. % Cost Burden >50% 22.2 6.5 4.8 10.3 9.4 13.3 32.5 17.8 33.6 23.7 18.2
14. Household Income >80% MFI 1,880 11,511 2,078 9,702 25,171 19,134 66,362 12,993 14,283 112,772 137,943
15. % with any housing problems 32.6 17.5 48.7 12.7 19.4 13.6 22.7 34.5 29.6 23.4 22.7
16.% Cost Burden >30% 26.8 9.9 3.6 10 10.7 13.4 21.3 21.3 29.3 21 19.1
17. % Cost Burden >50% 8.7 0.5 0 1.2 1.4 3.4 3.3 2.5 4.6 3.4 3
18. Total Households 6,393 19,812 4,924 16,301 47,430 30,493 74,217 15,760 17,956 138,426 185,856
19. % with any housing problems 60.8 38.8 69.7 35.6 43.9 24.1 28.6 43.4 38.2 30.6 34
20. % Cost Burden >30 58.5 31.5 32.9 33.5 36 23.9 27 30 37.8 28.1 30.1
21. % Cost Burden >50 32.9 12.6 13 15.3 16.3 11 7.9 8.5 13.4 9.4 11.1
Renters Owners
Household by Type, Income, & Housing Problem
Housing Problems Output for -All Households
Name of Jurisdiction:
Contra Costa County(CDBG), California
Source of Data:
CHAS Data Book
Data Current as of:
2000

Elderly Small Related Large Related All Total Elderly Small Related Large Related All Total Total
1 & 2 (2 to 4) (5 or more) Other Renters 1 & 2 (2 to 4) (5 or more) Other Owners Households
member Households member Households
households households
(A) (B) (C) (D) (E) (F) (G) (H) (I) (J) (L)
1. Household Income <=50% MFI 840 451 91 774 2,156 2,182 219 18 331 2,750 4,906
2. Household Income <=30% MFI 461 242 34 358 1,095 885 74 18 197 1,174 2,269
3. % with any housing problems 66.6 92.6 100 78.5 77.3 73.6 100 100 82.7 77.2 77.2
4. % Cost Burden >30% 66.6 92.6 88.2 78.5 76.9 73.6 100 100 77.7 76.3 76.6
5. % Cost Burden >50% 52.1 82.6 58.8 78.5 67.7 56.9 86.5 77.8 67.5 60.9 64.2
6. Household Income >30% to <=50% MFI 379 209 57 416 1,061 1,297 145 0 134 1,576 2,637
7. % with any housing problems 77 88.5 82.5 95.7 86.9 60.7 82.8 N/A 82.1 64.5 73.5
8. % Cost Burden >30% 77 83.7 68.4 95.7 85.2 59.9 82.8 N/A 82.1 63.9 72.5
9. % Cost Burden >50% 58.8 37.3 26.3 60.1 53.3 24.3 69 N/A 68.7 32.2 40.7
10. Household Income >50 to <=80% MFI 300 316 72 603 1,291 1,599 257 34 265 2,155 3,446
11. % with any housing problems 71 68 100 63 68.2 30.6 66.1 58.8 66.4 39.7 50.3
12.% Cost Burden >30% 67.7 63.6 11.1 59.7 59.8 30.6 62.3 29.4 66.4 38.7 46.6
13. % Cost Burden >50% 26 8.9 5.6 3.3 10.1 12.3 47.5 29.4 27.2 18.6 15.4
14. Household Income >80% MFI 674 2,399 162 2,907 6,142 6,006 6,702 914 1,997 15,619 21,761
15. % with any housing problems 34.4 22.8 75.3 7.7 18.3 11.3 19.3 30.9 26.1 17.8 17.9
16.% Cost Burden >30% 32.3 12 21.6 6.2 11.8 11.3 18.3 25.1 25.6 17 15.5
17. % Cost Burden >50% 14.7 1 0 0.4 2.2 1.3 2.9 1.1 5.1 2.5 2.4
18. Total Households 1,814 3,166 325 4,284 9,589 9,787 7,178 966 2,593 20,524 30,113
19. % with any housing problems 57.6 37 84.6 29.9 39.3 26.6 23.1 33.1 37.4 27.1 31
20. % Cost Burden >30 56.2 28.1 34.5 28.5 33.8 26.5 22 26.6 36.6 26.2 28.7
21. % Cost Burden >50 35.3 10.5 12 13.1 16.4 11.2 6.7 3.5 15.4 9.8 11.9
Renters Owners
Household by Type, Income, & Housing Problem
Housing Problems Output for -All Households
Name of Jurisdiction:
Walnut Creek(CDBG), California
Source of Data:
CHAS Data Book
Data Current as of:
2000

APPENDIX 5.
LEAD HAZARD ESTIMATE TABLES


APPENDIX 5. LEAD HAZARD ESTIMATE TABLES
Contra Costa Consortium 2010–2015 Consolidated Plan A5-1
ESTIMATE OF UNITS WITH LEAD-BASED PAINT, CONTRA COSTA COUNTY
Year Built Presumed Percentage with Lead-Based Paint (LBP)
Total Occupied Housing Units
Presumed Number with Lead-Based Paint
Owner occupied
1980 to March 2000 0% 83,104 0
1960 to 1979 62% 89,185 55,295
1940 to 1959 80% 56,158 44,926
1939 or earlier 90% 9,966 8,969
Total owner-occupied units 238,413
Total owner-occupied presumed LBP = “A” 109,191
Percentage owner-occupied households at or below 80% of the area median income = “B”
15.62%
Total at-risk owner-occupied households = “A * B” 17,055
Renter occupied
1980 to March 2000 0% 33,699 0
1960 to 1979 62% 43,578 27,018
1940 to 1959 80% 22,584 18,067
1939 or earlier 90% 5,855 5,270
Total renter-occupied units 105,716
Total renter-occupied presumed LBP = “ C” 50,355
Percentage renter-occupied households at or below 80% AMI = “D” 16.32%
Total at-risk renter-occupied households = “C*D” 8,217
Total at-risk households 25,272
Source: 2000 U.S. Census, Summary File 3 and 2000 CHAS Housing Problems

APPENDIX 5. LEAD HAZARD ESTIMATE TABLES
2010–2015 Consolidated Plan Contra Costa Consortium A5-2
ESTIMATE OF UNITS WITH LEAD-BASED PAINT, CITY OF ANTIOCH
Year Built Presumed Percentage with Lead-Based Paint (LBP)
Total Occupied Housing Units
Presumed Number with Lead-Based Paint
Owner occupied
1980 to March 2000 0% 11,975 0
1960 to 1979 62% 5,824 3,611
1940 to 1959 80% 2,565 2,052
1939 or earlier 90% 444 400
Total owner-occupied units 20,808
Total owner-occupied presumed LBP = “A” 6,062
Percentage owner-occupied households at or below 80% of the area median income = “B”
16.54%
Total at-risk owner-occupied households = “A * B” 1,003
Renter occupied
1980 to March 2000 0% 3,260 0
1960 to 1979 62% 3,249 2,014
1940 to 1959 80% 1,633 1,306
1939 or earlier 90% 416 374
Total renter-occupied units 8,558
Total renter-occupied presumed LBP = “ C” 3,695
Percentage renter-occupied households at or below 80% AMI = “D” 19.46%
Total at-risk renter-occupied households = “C*D” 719
Total at-risk households 1,722
Source: 2000 U.S. Census, Summary File 3 and 2000 CHAS Housing Problems

APPENDIX 5. LEAD HAZARD ESTIMATE TABLES
Contra Costa Consortium 2010–2015 Consolidated Plan A5-3
ESTIMATE OF UNITS WITH LEAD-BASED PAINT, CITY OF CONCORD
Year Built Presumed Percentage with Lead-Based Paint (LBP)
Total Occupied Housing Units
Presumed Number with Lead-Based Paint
Owner occupied
1980 to March 2000 0% 4,226 0
1960 to 1979 62% 14,871 9,220
1940 to1959 80% 8,058 6,446
1939 or earlier 90% 363 327
Total owner-occupied units 27,518
Total owner-occupied presumed LBP = “A” 15,993
Percentage owner-occupied households at or below 80% of the area median income = “B”
15.61%
Total at-risk owner-occupied households = “A * B” 2,497
Renter-occupied
1980 to March 2000 0% 3,626 0
1960 to 1979 62% 9,259 5,741
1940 to 1959 80% 3,214 2,571
1939 or earlier 90% 332 299
Total renter-occupied units 16,431
Total renter-occupied presumed LBP = “ C” 8,611
Percentage renter-occupied households at or below 80% AMI = “D” 21.39%
Total at-risk renter-occupied households = “C*D” 1,842
Total at-risk households 4,338
Source: 2000 U.S. Census, Summary File 3 and 2000 CHAS Housing Problems

APPENDIX 5. LEAD HAZARD ESTIMATE TABLES
2010–2015 Consolidated Plan Contra Costa Consortium A5-4
ESTIMATE OF UNITS WITH LEAD-BASED PAINT, CITY OF PITTSBURG
Year Built Presumed Percentage with Lead-Based Paint (LBP)
Total Occupied Housing Units
Presumed Number with Lead-Based Paint
Owner occupied
1980 to March 2000 0% 4,287 0
1960 to 1979 62% 4,686 2,905
1940 to 1959 80% 1858 1,486
1939 or earlier 90% 350 315
Total owner-occupied units 11,181
Total owner-occupied presumed LBP = “A” 4,707
Percentage owner-occupied households at or below 80% of the area median income = “B”
20.64%
Total at-risk owner-occupied households = “A * B” 971
Renter occupied
1980 to March 2000 0% 3,041 0
1960 to 1979 62% 1,997 1,238
1940 to 1959 80% 1,287 1,030
1939 or earlier 90% 286 257
Total renter-occupied units 6,611
Total renter-occupied presumed LBP = “ C” 2,525
Percentage renter-occupied households at or below 80% AMI = “D” 23.64%
Total at-risk renter-occupied households = “C*D” 597
Total at-risk households 1,568
Source: 2000 U.S. Census, Summary File 3 and 2000 CHAS Housing Problems

APPENDIX 5. LEAD HAZARD ESTIMATE TABLES
Contra Costa Consortium 2010–2015 Consolidated Plan A5-5
ESTIMATE OF UNITS WITH LEAD-BASED PAINT, CITY OF RICHMOND
Year Built Presumed Percentage with Lead-Based Paint (LBP)
Total Occupied Housing Units
Presumed Number with Lead-Based Paint
Owner occupied
1980 to March 2000 0% 3,812 0
1960 to 1979 62% 4,274 2,650
1940 to 1959 80% 8,024 6,419
1939 or earlier 90% 2,418 2,176
Total owner-occupied units 18,528
Total owner-occupied presumed LBP = “A” 11,245
Percentage owner-occupied households at or below 80% of the area median income = “B”
19.45%
Total at-risk owner-occupied households = “A * B” 2,187
Renter occupied
1980 to March 2000 0% 4,125 0
1960 to 1979 62% 5,658 3,508
1940 to 1959 80% 5,084 4,067
1939 or earlier 90% 1,310 1,179
Total renter-occupied units 16,177
Total renter-occupied presumed LBP (c) 8,754
Percentage renter-occupied households at or below 80% AMI (d) 30.12%
Total at-risk renter-occupied households (c*d) 2,636
Total at-risk households 4,823
Source: 2000 U.S. Census, Summary File 3 and 2000 CHAS Housing Problems

APPENDIX 5. LEAD HAZARD ESTIMATE TABLES
2010–2015 Consolidated Plan Contra Costa Consortium A5-6
ESTIMATE OF UNITS WITH LEAD-BASED PAINT, CITY OF WALNUT CREEK
Year Built Presumed Percentage with Lead-Based Paint (LBP)
Total Occupied Housing Units
Presumed Number with Lead-Based Paint
Owner occupied
1980 to March 2000 0% 4,203 0
1960 to 1979 62% 13,111 8,129
1940 to 1959 80% 3071 2,457
1939 or earlier 90% 269 242
Total owner-occupied units 20,654
Total owner-occupied presumed LBP = “A” 10,828
Percentage owner-occupied households at or below 80% of the area median income = “B”
16.62%
Total at-risk owner-occupied households = “A * B” 1,800
Renter occupied
1980 to March 2000 0% 2,218 0
1960 to 1979 62% 5,742 3,560
1940 to 1959 80% 1,491 1,193
1939 or earlier 90% 235 212
Total renter-occupied units 9,686
Total renter-occupied presumed LBP (c) 4,964
Percentage renter-occupied households at or below 80% AMI (d) 11.53%
Total at-risk renter-occupied households (c*d) 572
Total at-risk households 2,372
Source: 2000 U.S. Census, Summary File 3 and 2000 CHAS Housing Problems

APPENDIX 6.
PRIORITY NEED TABLES (1A, 1B, 2A, 2B)


U.S. Department of Housing OMB Approval No. 2506-0117 and Urban Development (Exp. 4/30/2011)
Table 1A
Homeless and Special Needs Populations
Continuum of Care: Housing Gap Analysis Chart Current
Inventory Under
Development Unmet Need/
Gap
Individuals Example
Emergency Shelter
100
40
26
Emergency Shelter 251 24 281 Beds Transitional Housing 210 0 0 Permanent Supportive Housing 518 0 1945 Total 979 24 2226
Persons in Families With Children
Emergency Shelter 279 0 55 Beds Transitional Housing 173 36 0 Permanent Supportive Housing 30 0 325 Total 482 36 380
Continuum of Care: Homeless Population and Subpopulations Chart
Sheltered Part 1: Homeless Population
Emergency Transitional Unsheltered Total
Number of Families with Children (Family Households):
62 59 5 126
1. Number of Persons in Families with Children
203 197 10 410
2. Number of Single Individuals and Persons in Households without children
282 788 1862 2932
(Add Lines Numbered 1 & 2 Total Persons)
485 985 1872 3342
Part 2: Homeless Subpopulations
Sheltered
Unsheltered
Total
a. Chronically Homeless 89 851 940 b. Seriously Mentally Ill 94 c. Chronic Substance Abuse 159 d. Veterans 215 e. Persons with HIV/AIDS 18 f. Victims of Domestic Violence 48 g. Unaccompanied Youth (Under 18) 37

Priority Needs Tables
Special Needs (Non Homeless) Populations (Table "1B")
SPECIAL NEEDS SUBPOPULATIONS
Priority
Need
Level Unmet Need
Dollars to
Address
Unmet Need
Multi Year
Goals Annual Goals
City of Antioch
Elderly H 1,300 31,000$ 1,300 260
Frail Elderly H 300 15,000 300 60
Severe Mental Illness M
Developmentally Disabled M
Physically Disabled M 1,740 5,000 1,740 348
Persons w/ Alcohol/Other Drug Addictions M 500 10,000 500 100
Persons w/HIV/AIDS L 100 5,000 100 20
Victims of Domestic Violence H 50 15,000 50 10
Other
Total 3,990 81,000$ 3,990 798
City of Concord
Elderly (Housing) H 743 6,262,600$ 743 129
Elderly (Services) H 1,500 150,000 1,500 300
Frail Elderly (Services) H 4,000 50,000 4,000 800
Severe Mental Illness M
Developmentally Disabled M
Physically Disabled (Housing) H 56 871,613 56 11
Physically Disabled (Services) H 60 25,000 60 12
Persons w/ Alcohol/Other Drug Addictions (Services) H 200 50,000 200 40
Persons w/HIV/AIDS M
Victims of Domestic Violence H 50 50,000 50 10
Other M
Total 6,609 7,459,213$ 6,609 1,302
City of Pittsburg
Elderly H 1,250 100,000$ 1,250 250
Frail Elderly M 10 2,000 10 2
Severe Mental Illness L
Developmentally Disabled L
Physically Disabled H 130 13,000 130 26
Persons w/ Alcohol/Other Drug Addictions M 985 147,750 985 197
Persons w/HIV/AIDS H 200 50,000 200 40
Victims of Domestic Violence H 100 25,000 100 20
Other
Total 2,675 337,750$ 2,675 535
City of Richmond
Elderly M 1,500 1,500$ 1,500 300
Frail Elderly M 1,500 1,500 1,500 300
Severe Mental Illness M 750 750 750 150
Developmentally Disabled M 500 500 500 100
Physically Disabled M 1,500 1,500 1,500 300
Persons w/ Alcohol/Other Drug Addictions M 1,500 1,500 1,500 300
Persons w/HIV/AIDS M 52 52 52 10
Victims of Domestic Violence M 52 52 52 10
Other
Total 7,354 7,354$ 7,354 1,470
Contra Costa Consortium 1 2010-05-10

Priority Needs Tables
SPECIAL NEEDS SUBPOPULATIONS
Priority
Need
Level Unmet Need
Dollars to
Address
Unmet Need
Multi Year
Goals Annual Goals
City of Walnut Creek
Elderly H 9,070 6,500$ 420 84
Frail Elderly H 8,606 40,000 6,035 1,207
Severe Mental Illness M 1,741
Developmentally Disabled H 1,673 12,000 20 4
Physically Disabled H 1,535 35,000 50 10
Persons w/ Alcohol/Other Drug Addictions H 2,692 40,000 200 40
Persons w/HIV/AIDS H 154 25,000 100 20
Victims of Domestic Violence H 250 40,000 250 50
Other
Total 25,721 198,500$ 7,075 1,415
Urban County
Elderly H 4,500 375,000$ 4,500 900
Frail Elderly H 1,575 130,000 1,575 315
Severe Mental Illness H 670 70,000 670 134
Developmentally Disabled H 262 21,000 262 52
Physically Disabled H 750 77,000 750 150
Persons w/ Alcohol/Other Drug Addictions H 700 130,000 700 140
Persons w/HIV/AIDS H 350 100,000 350 70
Victims of Domestic Violence H 205 155,000 205 41
Other
Total 9,012 1,058,000$ 9,012 1,802
Contra Costa Consortium 2 2010-05-10

Priority Needs Tables
Priority Housing Needs/Investment Plan Goals (Table "2A")
Housing Goals by Sub-population
Priority Need
Priority
Need
Level
Dollars to
Address
5-Yr. Goal
Plan/Act
Yr. 1 Goal
Plan/Act
Yr. 2 Goal
Plan/Act
Yr. 3 Goal
Plan/Act
Yr. 4 Goal
Plan/Act
Yr. 5 Goal
Plan/Act
City of Antioch
Renters
0 - 30 of MFI H 250,000$ 25 5 5 5 5 5
31 - 50% of MFI H 600,000 150 80 70
51 - 80% of MFI H 100,000 5 1 1 1 1 1
Owners
0 - 30 of MFI M
31 - 50 of MFI H 250,000 30 6 6 6 6 6
51 - 80% of MFI H 550,000 80 16 16 16 16 16
Homeless*
Individuals H 44,000 250 50 50 50 50 50
Families H
Non-Homeless Special Needs
Elderly H 450,000 75 75
Frail Elderly H 400,000 75 75
Severe Mental Illness M 50,000 3 3
Physical Disability M 150,000 10 5 5
Developmental Disability M
Alcohol/Drug Abuse M
HIV/AIDS L
Victims of Domestic Violence L Total Special Needs 1,050,000$ 163 80 83 - - -
Total Section 215
215 Renter 950,000$ 180 86 76 6 6 6
215 Owner 800,000$ 110 22 22 22 22 22
City of Concord
Renters
0 - 30 of MFI H 224,000$ 8 8
31 - 50% of MFI H 4,248,000 146 40 26 80
51 - 80% of MFI H 2,043,000 526 96 96 96 122 116
Owners
0 - 30 of MFI H 2,700,200 174 37 35 34 34 34
31 - 50 of MFI H 2,352,800 153 36 30 29 29 29
51 - 80% of MFI H 1,737,000 110 22 22 22 22 22
Homeless*
Individuals M
Families M
Non-Homeless Special Needs
Elderly H 6,262,600 743 131 128 128 128 228
Frail Elderly M
Severe Mental Illness M
Physical Disability H 871,613 56 12 11 11 11 11
Developmental Disability M
Alcohol/Drug Abuse M
HIV/AIDS M
Victims of Domestic Violence MTotal Special Needs 7,134,213$ 799 143 139 139 139 239
Total Section 215 6,515,000$ 680 96 96 144 148 196
215 Renter 6,515,000$ 680 96 96 144 148 196
215 Owner
Contra Costa Consortium 3 2010-05-10

Priority Needs Tables
Priority Housing Needs/Investment Plan Goals (Table "2A")
Housing Goals by Sub-population
Priority Need
Priority
Need
Level
Dollars to
Address
5-Yr. Goal
Plan/Act
Yr. 1 Goal
Plan/Act
Yr. 2 Goal
Plan/Act
Yr. 3 Goal
Plan/Act
Yr. 4 Goal
Plan/Act
Yr. 5 Goal
Plan/Act
City of Pittsburg
Renters
0 - 30 of MFI N/A
31 - 50% of MFI N/A
51 - 80% of MFI N/A
Owners
0 - 30 of MFI H 500,000$ 25 5 5 5 5 5
31 - 50 of MFI H 500,000 25 5 5 5 5 5
51 - 80% of MFI H 500,000 25 5 5 5 5 5
Homeless*
Individuals H 75,000 150 30 30 30 30 30
Families H 25,000 25 5 5 5 5 5
Non-Homeless Special Needs
Elderly H 5,000 1,250 250 250 250 250 250
Frail Elderly M 2,000 10 2 2 2 2 2
Severe Mental Illness L
Physical Disability H 62,500 125 25 25 25 25 25
Developmental Disability H 2,400 80 16 16 16 16 16
Alcohol/Drug Abuse L
HIV/AIDS H 2,000 200 40 40 40 40 40
Victims of Domestic Violence H 1,200 40 8 8 8 8 8 Total Special Needs 75,100$ 1,705 341 341 341 341 341
Total Section 215 - 25 5 5 5 5 5
215 Renter
215 Owner 25 5 5 5 5 5
City of Richmond
Renters
0 - 30 of MFI H 1,750$ 1,500 300 300 300 300 300
31 - 50% of MFI M 1,000 1,000 200 200 200 200 200
51 - 80% of MFI M 500,000 800 160 160 160 160 160
Owners
0 - 30 of MFI H 800,000 1,500 300 300 300 300 300
31 - 50 of MFI M 500,000 1,000 200 200 200 200 200
51 - 80% of MFI M 250,000 800 160 160 160 160 160
Homeless*
Individuals M 50,000 500 100 100 100 100 100
Families M 50,000 50 10 10 10 10 10
Non-Homeless Special Needs
Elderly M 50,000 1,500 300 300 300 300 300
Frail Elderly M 10,000 1,500 300 300 300 300 300
Severe Mental Illness M 5,000 750 150 150 150 150 150
Physical Disability M 10,000 1,500 300 300 300 300 300
Developmental Disability M 2,000 500 100 100 100 100 100
Alcohol/Drug Abuse M 5,000 1,500 300 300 300 300 300
HIV/AIDS M 1,000 52 12 10 10 10 10
Victims of Domestic Violence M 1,000 52 12 10 10 10 10 Total Special Needs 84,000$ 7,354 1,474 1,470 1,470 1,470 1,470
Total Section 215 40 8 8 8 8 8
215 Renter 20 4 4 4 4 4
215 Owner 20 4 4 4 4 4
Contra Costa Consortium 4 2010-05-10

Priority Needs Tables
Priority Housing Needs/Investment Plan Goals (Table "2A")
Housing Goals by Sub-population
Priority Need
Priority
Need
Level
Dollars to
Address
5-Yr. Goal
Plan/Act
Yr. 1 Goal
Plan/Act
Yr. 2 Goal
Plan/Act
Yr. 3 Goal
Plan/Act
Yr. 4 Goal
Plan/Act
Yr. 5 Goal
Plan/Act
City of Walnut Creek
Renters
0 - 30 of MFI H 700,000$ 20 4 4 4 4 4
31 - 50% of MFI M 700,000 18 4 3 4 3 4
51 - 80% of MFI M TBD 60 12 12 12 12 12
Owners
0 - 30 of MFI M
31 - 50 of MFI H 829,300 10 2 2 2 2 2
51 - 80% of MFI H TBD 15 3 3 3 3 3
Homeless*
Individuals M
Families M
Non-Homeless Special Needs
Elderly M 325,000 7 1 1 2 1 2
Frail Elderly M 325,000 7 1 1 2 1 2
Severe Mental Illness M
Physical Disability M
Developmental Disability H 350,000 10 2 2 2 2 2
Alcohol/Drug Abuse M
HIV/AIDS M
Victims of Domestic Violence M Total Special Needs 1,000,000$ 24 4 4 6 4 6
Total Section 215
215 Renter
215 Owner
Note: Funds "TBD" are anticipated impact fees.
Urban County
Renters
0 - 30 of MFI H 1,450,000$ 90 18 18 18 18 18
31 - 50% of MFI H 5,690,000 355 71 71 71 71 71
51 - 80% of MFI M 208,400,000 380 76 76 76 76 76
Owners
0 - 30 of MFI L 960,000 35 7 7 7 7 7
31 - 50 of MFI H 5,630,000 120 24 24 24 24 24
51 - 80% of MFI H 15,714,000 135 27 27 27 27 27
Homeless*
Individuals M 100 20 20 20 20 20
Families M 150 30 30 30 30 30
Non-Homeless Special Needs
Elderly H 43,000,000 210 42 42 42 42 42
Frail Elderly M 21,000,000 100 20 20 20 20 20
Severe Mental Illness M 3,750,000 25 5 5 5 5 5
Physical Disability M 20 4 4 4 4 4
Developmental Disability M 5 1 1 1 1 1
Alcohol/Drug Abuse L
HIV/AIDS M 1,550,000 25 5 5 5 5 5
Victims of Domestic Violence L Total Special Needs 69,300,000$ 385 77 77 77 77 77
Total Section 215 675 135 135 135 135 135
215 Renter 625 125 125 125 125 125
215 Owner 50 10 10 10 10 10
Contra Costa Consortium 5 2010-05-10

Priority Needs
Priority Housing Activities (Table "2A")
Housing Goals by Funding Source and Activity Type
Priority Need
Dollars to
Address
5-Yr.
Goal
Plan/Act
Yr. 1 Goal
Plan/Act
Yr. 2 Goal
Plan/Act
Yr. 3 Goal
Plan/Act
Yr. 4 Goal
Plan/Act
Yr. 5 Goal
Plan/Act
City of Antioch
CDBG
Acquisition of existing rental units
Production of new rental units
Rehabilitation of existing rental units
Rental assistance
Acquisition of existing owner units
Production of new owner units
Rehabilitation of existing owner units
Homeownership assistance
HOME
Acquisition of existing rental units
Production of new rental units
Rehabilitation of existing rental units
Rental assistance
Acquisition of existing owner units
Production of new owner units
Rehabilitation of existing owner units
Homeownership assistance
HOPWA
Rental assistance
Short term rent/mortgage utility payments
Facility based housing development
Facility based housing operations
Supportive services
RDA Set-Aside
Rehabilitation of existing owner units 800,000$ 110 22 22 22 22 22
Rehabilitation of existing rental units 950,000 315 150 150 5 5 5
Contra Costa Consortium 6 2010-05-10

Priority Needs
Priority Housing Activities (Table "2A")
Housing Goals by Funding Source and Activity Type
Priority Need
Dollars to
Address
5-Yr.
Goal
Plan/Act
Yr. 1 Goal
Plan/Act
Yr. 2 Goal
Plan/Act
Yr. 3 Goal
Plan/Act
Yr. 4 Goal
Plan/Act
Yr. 5 Goal
Plan/Act
City of Concord
CDBG
Acquisition of existing rental units
Production of new rental units
Rehabilitation of existing rental units
Rental assistance
Acquisition of existing owner units
Production of new owner units
Rehabilitation of existing owner units $1,000,000 64 14 14 12 12 12
Homeownership assistance
HOME
Acquisition of existing rental units
Production of new rental units
Rehabilitation of existing rental units
Rental assistance
Acquisition of existing owner units
Production of new owner units
Rehabilitation of existing owner units
Homeownership assistance
HOPWA
Rental assistance
Short term rent/mortgage utility payments
Facility based housing development
Facility based housing operations
Supportive services
RDA Set-Aside
Acquisition of existing rental units
Production of new rental units $3,000,000 100 100
Rehabilitation of existing rental units 2,800,000 100 48 52
Rental assistance 715,000 480 96 96 96 96 96
Acquisition of existing owner units
Production of new owner units
Rehabilitation of existing owner units 5,040,000 348 76 68 68 68 68
Homeownership assistance 750,000 25 5 5 5 5 5
Inclusionary Funds
Production of New owner units (up to 120%) 635,760 4 2 2
Contra Costa Consortium 7 2010-05-10

Priority Needs
Priority Housing Activities (Table "2A")
Housing Goals by Funding Source and Activity Type
Priority Need
Dollars to
Address
5-Yr.
Goal
Plan/Act
Yr. 1 Goal
Plan/Act
Yr. 2 Goal
Plan/Act
Yr. 3 Goal
Plan/Act
Yr. 4 Goal
Plan/Act
Yr. 5 Goal
Plan/Act
City of Pittsburg
CDBG
Acquisition of existing rental units
Production of new rental units
Rehabilitation of existing rental units
Rental assistance
Acquisition of existing owner units
Production of new owner units
Rehabilitation of existing owner units
Homeownership assistance $500,000 25 5 5 5 5 5
HOME
Acquisition of existing rental units
Production of new rental units
Rehabilitation of existing rental units
Rental assistance
Acquisition of existing owner units
Production of new owner units
Rehabilitation of existing owner units
Homeownership assistance
HOPWA
Rental assistance
Short term rent/mortgage utility payments
Facility based housing development
Facility based housing operations
Supportive services
Other
Contra Costa Consortium 8 2010-05-10

Priority Needs
Priority Housing Activities (Table "2A")
Housing Goals by Funding Source and Activity Type
Priority Need
Dollars to
Address
5-Yr.
Goal
Plan/Act
Yr. 1 Goal
Plan/Act
Yr. 2 Goal
Plan/Act
Yr. 3 Goal
Plan/Act
Yr. 4 Goal
Plan/Act
Yr. 5 Goal
Plan/Act
City of Richmond
CDBG
Acquisition of existing rental units $100,000 50 10 10 10 10 10
Production of new rental units 100,000 50 10 10 10 10 10
Rehabilitation of existing rental units 100,000 50 10 10 10 10 10
Rental assistance 25,000 10 2 2 2 2 2
Acquisition of existing owner units 25,000 10 2 2 2 2 2
Production of new owner units 100,000 50 10 10 10 10 10
Rehabilitation of existing owner units 100,000 50 10 10 10 10 10
Homeownership assistance 25,000 10 2 2 2 2 2
HOME
Acquisition of existing rental units 100,000 50 10 10 10 10 10
Production of new rental units 100,000 50 10 10 10 10 10
Rehabilitation of existing rental units 100,000 50 10 10 10 10 10
Rental assistance 25,000 10 2 2 2 2 2
Acquisition of existing owner units 25,000 10 2 2 2 2 2
Production of new owner units 100,000 5 1 1 1 1 1
Rehabilitation of existing owner units 100,000 10 2 2 2 2 2
Homeownership assistance 25,000 10 2 2 2 2 2
HOPWA
Rental assistance
Short term rent/mortgage utility payments
Facility based housing development
Facility based housing operations
Supportive services
Other
Contra Costa Consortium 9 2010-05-10

Priority Needs
Priority Housing Activities (Table "2A")
Housing Goals by Funding Source and Activity Type
Priority Need
Dollars to
Address
5-Yr.
Goal
Plan/Act
Yr. 1 Goal
Plan/Act
Yr. 2 Goal
Plan/Act
Yr. 3 Goal
Plan/Act
Yr. 4 Goal
Plan/Act
Yr. 5 Goal
Plan/Act
City of Walnut Creek
CDBG
Acquisition of existing rental units
Production of new rental units (acq) $1,750,000 68 13.6 13.6 13.6 13.6 13.6
Rehabilitation of existing rental units
Rental assistance
Acquisition of existing owner units
Production of new owner units
Rehabilitation of existing owner units
Homeownership assistance 750,000 15 3 3 3 3 3
HOME
Acquisition of existing rental units
Production of new rental units
Rehabilitation of existing rental units
Rental assistance
Acquisition of existing owner units
Production of new owner units
Rehabilitation of existing owner units
Homeownership assistance
HOPWA
Rental assistance
Short term rent/mortgage utility payments
Facility based housing development
Facility based housing operations
Supportive services
Other
Contra Costa Consortium 10 2010-05-10

Priority Needs
Priority Housing Activities (Table "2A")
Housing Goals by Funding Source and Activity Type
Priority Need
Dollars to
Address
5-Yr.
Goal
Plan/Act
Yr. 1 Goal
Plan/Act
Yr. 2 Goal
Plan/Act
Yr. 3 Goal
Plan/Act
Yr. 4 Goal
Plan/Act
Yr. 5 Goal
Plan/Act
Urban County
CDBG
Acquisition of existing rental units $1,550,000 200 40 40 40 40 40
Production of new rental units
Rehabilitation of existing rental units 2,000,000 250 50 50 50 50 50
Rental assistance
Acquisition of existing owner units 750,000 100 20 20 20 20 20
Production of new owner units
Rehabilitation of existing owner units 3,000,000 125 25 25 25 25 25
Homeownership assistance 200,000 25 5 5 5 5 5
HOME
Acquisition of existing rental units 3,840,000 200 40 40 40 40 40
Production of new rental units 7,130,000 375 75 75 75 75 75
Rehabilitation of existing rental units 1,125,000 250 50 50 50 50 50
Rental assistance
Acquisition of existing owner units
Production of new owner units 200,000 25 5 5 5 5 5
Rehabilitation of existing owner units
Homeownership assistance 200,000 25 5 5 5 5 5
HOPWA
Rental assistance
Short term rent/mortgage utility payments 100,000
Facility based housing development 1,550,000 25 5 5 5 5 5
Facility based housing operations
Supportive services 450,000 625 125 125 125 125 125
Other
Mortgage Credit Certificates 8,750,000 150 30 30 30 30 30
Tax Exempt Bonds 265,000,000 475 95 95 95 95 95
MHSA 3,750,000 25 5 5 5 5 5
Redevelopment Agency funds 20,900,000 215 43 43 43 43 43
*These numbers/goals are not additive. We frequently use multiple sources of funds for a single project. A single project my fit under
multiple categories. For example, a single project may receive for CDBG acquisition of the land, and HOME and HOPWA for the new
construction.
Contra Costa Consortium 11 2010-05-10

Priority Needs Tables
Priority Community Development Needs (Table "2B")
Priority Need
Priority
Need
Level Unmet Need
Dollars to Address
Unmet Need
Multi-Year
Goals
Annual
Goals
City of Antioch
Acquisition of Real Property L
Disposition L
Clearance and Demolition L
Clearance of Contaminated Sites L
Code Enforcement H 5 240,000$ 5 1
Public Facility (General) M
Senior Centers L
Handicapped Centers L
Homeless Facilities M
Youth Centers L
Neighborhood Facilities L
Child Care Centers L
Health Facilities L
Mental Health Facilities L
Parks and/or Recreation Facilities L
Parking Facilities L
Tree Planting L
Fire Stations/Equipment L
Abused/Neglected Children Facilities L
Asbestos Removal L
Non-Residential Historic Preservation L
Other Public Facility Needs L
Infrastructure (General) M
Water/Sewer Improvements L
Street Improvements M
Sidewalks M
Solid Waste Disposal Improvements L
Flood Drainage Improvements L
Other Infrastructure M
Public Services (General) H 10,000 600,000 10,000 2,000
Senior Services H 5,000 205,000 5,000 1,000
Handicapped Services M
Legal Services H 600 15,000 600 120
Youth Services H 705 75,000 705 141
Child Care Services M
Transportation Services L
Substance Abuse Services M
Employment/Training Services M
Health Services M
Lead Hazard Screening L
Crime Awareness L
Fair Housing Activities H 90 50,000 90 18
Tenant Landlord Counseling H 900 100,000 900 180
Other Services M
Economic Development (General) M
C/I Land Acquisition/Disposition L
C/I Infrastructure Development M
C/I Building Acq/Const/Rehab M
Other C/I L
ED Assistance to For-Profit L
ED Technical Assistance M
Micro-enterprise Assistance M
Other
Contra Costa Consortium 12 2010-05-10

Priority Needs Tables
Priority Community Development Needs (Table "2B")
Priority Need
Priority
Need
Level Unmet Need
Dollars to Address
Unmet Need
Multi-Year
Goals
Annual
Goals
City of Concord
Acquisition of Real Property L
Disposition L
Clearance and Demolition L
Clearance of Contaminated Sites L
Code Enforcement H 5,000 $520,000 5,000 1000
Public Facility (General) L
Senior Centers L
Handicapped Centers L
Homeless Facilities L
Youth Centers L
Neighborhood Facilities L
Child Care Centers M
Health Facilities L
Mental Health Facilities L
Parks and/or Recreation Facilities M
Parking Facilities L
Tree Planting L
Fire Stations/Equipment L
Abused/Neglected Children Facilities L
Asbestos Removal L
Non-Residential Historic Preservation L
Other Public Facility Needs L
Infrastructure (General) M
Water/Sewer Improvements L
Street Improvements M
Sidewalks H 50,000 1,232,000 50,000 10000
Solid Waste Disposal Improvements L
Flood Drainage Improvements M
Other Infrastructure M
Public Services (General) H 3,000 315,000 3,000 600
Senior Services H 600 200,000 600 120
Handicapped Services H 60 50,000 60 12
Legal Services M
Youth Services M
Child Care Services H 2,500 150,000 2,500 500
Transportation Services L
Substance Abuse Services M 250 50,000 250 50
Employment/Training Services L
Health Services L
Lead Hazard Screening L
Crime Awareness L
Fair Housing Activities H 120 375,000 120 24
Tenant Landlord Counseling H 900 300,000 900 180
Other Services H 2,050 250,000 2,050 410
Economic Development (General) L
C/I Land Acquisition/Disposition L
C/I Infrastructure Development L
C/I Building Acq/Const/Rehab L
Other C/I L
ED Assistance to For-Profit L
ED Technical Assistance M
Micro-enterprise Assistance M
Other
Contra Costa Consortium 13 2010-05-10

Priority Needs Tables
Priority Community Development Needs (Table "2B")
Priority Need
Priority
Need
Level Unmet Need
Dollars to Address
Unmet Need
Multi-Year
Goals
Annual
Goals
City of Pittsburg
Acquisition of Real Property L
Disposition L
Clearance and Demolition L
Clearance of Contaminated Sites L
Code Enforcement H 20,000 $692,740 20,000 4,000
Public Facility (General)
Senior Centers M
Handicapped Centers M
Homeless Facilities M
Youth Centers M
Neighborhood Facilities M
Child Care Centers M
Health Facilities M
Mental Health Facilities M
Parks and/or Recreation Facilities L
Parking Facilities M
Tree Planting L
Fire Stations/Equipment L
Abused/Neglected Children Facilities M
Asbestos Removal M
Non-Residential Historic Preservation M
Other Public Facility NeedsInfrastructure (General)
Water/Sewer Improvements H
Street Improvements H
Sidewalks H 5 625,000 5 1
Solid Waste Disposal Improvements M
Flood Drainage Improvements M
Other Infrastructure -- Accesibility M
Public Services (General)
Senior Services H 1,350 50,000 1,350 270
Handicapped Services M
Legal Services H 625 10,000 625 125
Youth Services H 6,760 30,000 6,760 1,352
Child Care Services M
Transportation Services M
Substance Abuse Services H 500 5,000 500 100
Employment/Training Services M
Health Services M
Lead Hazard Screening M
Crime Awareness M
Fair Housing Activities M
Tenant Landlord Counseling M
Other Services M
Economic Development (General)
C/I Land Acquisition/Disposition C/I Infrastructure Development C/I Building Acq/Const/Rehab Other C/I ED Assistance to For-Profit M
ED Technical Assistance M
Micro-enterprise Assistance H 50 300,000 50 10
Job Training & Placement Program M 25 150,000 25 5
Contra Costa Consortium 14 2010-05-10

Priority Needs Tables
Priority Community Development Needs (Table "2B")
Priority Need
Priority
Need
Level Unmet Need
Dollars to Address
Unmet Need
Multi-Year
Goals
Annual
Goals
City of Richmond
Acquisition of Real Property M 500,000 100,000$ 500,000 100,000
Disposition M 50,000 10,000 50,000 10,000
Clearance and Demolition M 50,000 10,000 50,000 10,000
Clearance of Contaminated Sites M 50,000 10,000 50,000 10,000
Code Enforcement M 50,000 10,000 50,000 10,000
Public Facility (General) M
Senior Centers M
Handicapped Centers M
Homeless Facilities M
Youth Centers M
Neighborhood Facilities M 50,000 10,000 50,000 10,000
Child Care Centers M
Health Facilities M
Mental Health Facilities M
Parks and/or Recreation Facilities M 50,000 10,000 50,000 10,000
Parking Facilities M
Tree Planting M
Fire Stations/Equipment M
Abused/Neglected Children Facilities M 50,000 10,000 50,000 10,000
Asbestos Removal M
Non-Residential Historic Preservation M
Other Public Facility Needs M 50,000 10,000 50,000 10,000
Infrastructure (General) M
Water/Sewer Improvements M
Street Improvements M 50,000 10,000 50,000 10,000
Sidewalks M
Solid Waste Disposal Improvements M
Flood Drainage Improvements M
Other Infrastructure M
Public Services (General) M
Senior Services M 50,000 10,000 50,000 10,000
Handicapped Services M 50,000 10,000 50,000 10,000
Legal Services M 50,000 10,000 50,000 10,000
Youth Services M 50,000 10,000 50,000 10,000
Child Care Services M 50,000 10,000 50,000 10,000
Transportation Services M
Substance Abuse Services M 50,000 10,000 50,000 10,000
Employment/Training Services H 50,000 10,000 50,000 10,000
Health Services M 50,000 10,000 50,000 10,000
Lead Hazard Screening M
Crime Awareness H 50,000 10,000 50,000 10,000
Fair Housing Activities H 50,000 10,000 50,000 10,000
Tenant Landlord Counseling M 50,000 10,000 50,000 10,000
Other Services M 50,000 10,000 50,000 10,000
Economic Development (General) M
C/I Land Acquisition/Disposition M
C/I Infrastructure Development M
C/I Building Acq/Const/Rehab M
Other C/I M
ED Assistance to For-Profit M
ED Technical Assistance M
Micro-enterprise Assistance M
Other
Contra Costa Consortium 15 2010-05-10

Priority Needs Tables
Priority Community Development Needs (Table "2B")
Priority Need
Priority
Need
Level Unmet Need
Dollars to Address
Unmet Need
Multi-Year
Goals
Annual
Goals
City of Walnut Creek
Acquisition of Real Property L
Disposition L
Clearance and Demolition M
Clearance of Contaminated Sites M
Code Enforcement L
Public Facility (General) H 10 90,000$ 3 1
Senior Centers M
Handicapped Centers M
Homeless Facilities M
Youth Centers M
Neighborhood Facilities M
Child Care Centers M
Health Facilities M
Mental Health Facilities M
Parks and/or Recreation Facilities M
Parking Facilities L
Tree Planting M
Fire Stations/Equipment L
Abused/Neglected Children Facilities M
Asbestos Removal M
Non-Residential Historic Preservation M
Other Public Facility NeedsInfrastructure (General) H 10 450,000 1 0
Water/Sewer Improvements M
Street Improvements H
Sidewalks H
Solid Waste Disposal Improvements M
Flood Drainage Improvements M
Other InfrastructurePublic Services (General) 631,500
Senior Services H 17,676 6,455 1,291
Handicapped Services M
Legal Services H 500 495 99
Youth Services H 125 125 25
Child Care Services M
Transportation Services M
Substance Abuse Services H 2,692 225 45
Employment/Training Services H
Health Services M
Lead Hazard Screening M
Crime Awareness M
Fair Housing Activities H 150 125 25
Tenant Landlord Counseling H 350 300 60
Other ServicesEconomic Development (General)
C/I Land Acquisition/Disposition C/I Infrastructure Development C/I Building Acq/Const/Rehab Other C/I ED Assistance to For-Profit M
ED Technical Assistance M
Micro-enterprise Assistance H 100 150,000 75 15
Other
Contra Costa Consortium 16 2010-05-10

Priority Needs Tables
Priority Community Development Needs (Table "2B")
Priority Need
Priority
Need
Level Unmet Need
Dollars to Address
Unmet Need
Multi-Year
Goals
Annual
Goals
Urban County
Acquisition of Real Property L
Disposition L
Clearance and Demolition L
Clearance of Contaminated Sites L
Code Enforcement L
Public Facility (General) H 10 417,500$ 10 2
Senior Centers M 2 83,500 2 1
Handicapped Centers H 1 41,750 1 1
Homeless Facilities H 1 41,750 1 1
Youth Centers M
Neighborhood Facilities H 4 167,000 4 1
Child Care Centers M
Health Facilities M
Mental Health Facilities M
Parks and/or Recreation Facilities H 2 83,500 1
Parking Facilities L
Tree Planting L
Fire Stations/Equipment L
Abused/Neglected Children Facilities M
Asbestos Removal L
Non-Residential Historic Preservation L
Other Public Facility Needs L
Infrastructure (General) H 5 250,000 5 1
Water/Sewer Improvements L
Street Improvements H 2 100,000 2 1
Sidewalks H 3 150,000 3 1
Solid Waste Disposal Improvements L
Flood Drainage Improvements L
Other Infrastructure M
Public Services (General) H 25,000 2,567,000 25,000 5,000
Senior Services H 4,500 462,000 4,500 900
Handicapped Services H 750 77,000 750 150
Legal Services M
Youth Services H 12,200 1,250,000 12,200 2,440
Child Care Services L
Transportation Services L
Substance Abuse Services H 700 77,000 700 140
Employment/Training Services H 300 1,200,000 300 60
Health Services M
Lead Hazard Screening L
Crime Awareness L
Fair Housing Activities H 1,000 513,400 1,000 200
Tenant Landlord Counseling H 2,500 256,700 2,500 500
Other Services H 670 70,000 670 134
Economic Development (General) H 1,145 2,395,000 1,145 229
C/I Land Acquisition/Disposition L
C/I Infrastructure Development L 1,195,000
C/I Building Acq/Const/Rehab L
Other C/I L
ED Assistance to For-Profit H 20 195,000 20 4
ED Technical Assistance H 700 600,000 700 140
Micro-enterprise Assistance H 425 400,000 425 85
Other
Contra Costa Consortium 17 2010-05-10


APPENDIX 7.
CITIZEN PARTICIPATION AND PUBLIC COMMENT


APPENDIX 7 CITIZEN PARTICIPATION AND PUBLIC COMMENT
CITIZEN PARTICIPATION Five public workshops were conducted in preparation of the Consolidated Plan. They were conducted at the following dates and places.
• City of Pinole, Public Library, 08/26/09 (evening) • City of Oakley, Community Annex 09/08/09 (evening) • City of Walnut Creek, St. Paul’s Church,, 09/15/10 (day) • City of Concord, Meadow Homes School, 09/29/09 (evening) • City of Concord, Senior Center, 10/08/09 (day)
All public workshops were publically noticed in a newspaper of general circulation (Contra Costa Times) and open to the public (proof of notice publication included in this appendix). The one exception being the meeting of 10/08/09. It was by invitation to area service providers and it was open to the public. In addition to the public notice for the workshops, an invitation was sent via e‐mail to the Contra Costa County Consortium’s CDBG Interested Parties list, which is a list of over 800 persons representing various public and private agencies that provide various services (i.e. housing services, fair housing, homeless services, senior services, youth services, job training, business assistance, etc.) within Contra Costa County. The CDBG Interested Parties list is included in this appendix.
Workshop notes, sign‐in sheets and workshop polling results are in this appendix.
An online survey was also conducted to determine priority needs. Survey results are in this appendix. The online survey link was included in the published notice for the workshops, in the invitation sent to the CDBG Interested Parties list, and on the County’s website (www.ccreach.org).
Each Consortium jurisdiction had its own public hearing for the Consolidated Plan. The Consolidated Plan public hearings were publically noticed by each Consortium jurisdiction in the Contra Costa Times (the proofs of publication for each jurisdiction are included in this appendix). The County’s notice was also posted on the main page of the County’s website (www.ccreach.org). Hard copies of the Draft Consolidated Plan were available for review in each Consortium jurisdiction office. The web link to the County’s website with the Draft Consolidated Plan was e‐mailed on March 26, 2010 to the CDBG Interested Parties list and to any individual that attended and signed in at a public workshop.
Contra Costa Consortium 2010–2015 Consolidated Plan April 28, 2010
1

STRATEGIC PLAN
PUBLIC COMMENT RECEIVED The Consortium received one public comment from Urban Financial Services Group, LLC (UFSG) during the public comment period. The following is the comment from the letter and Consortium response.
Comment: UFSG strongly encourages re‐evaluation of the low priority placed on “Job Creation” in the current “Draft”. This topic is a major concern to the present Administration and it would appear appropriate that those federal funds accessed by local communities through the CDBG Program reflect the priorities that are of major national concern as enunciated by both the President and Congress.
Response: Job development creation and small business lending is considered a moderate priority in general. See Appendix 6/Table 2B for each Consortium jurisdiction’s priority level for economic development.
2010–2015 Draft Consolidated Plan Contra Costa Consortium April 15, 2010
2


Contra Costa Consortium 2010-2015 Consolidated Plan
West County Priority Needs Workshop
August 26, 2009 Pinole Library
Workshop Notes
Slide: What needs does your community have? The following specific items were listed for each need. 1. Streets and sidewalks • Curb improvements • Gutter improvements • Infrastructure improvements 2. Public facilities and parks • Gyms • Community centers/rooms • Recreation centers • Youth programs (also under Low and No Cost Programs) • Safe parks • Lighting at parks 3. Public Transit • More routes – creating routes in high traffic areas, shopping plazas, and schools • Increasing frequency of traffic flow 4. Low and no cost programs • Youth programs for families facing foreclosure • After-school programs • Enrichment programs • Technical adult education/employment • Business development 5. Assistance to small business • Business development 6. Help for the homeless
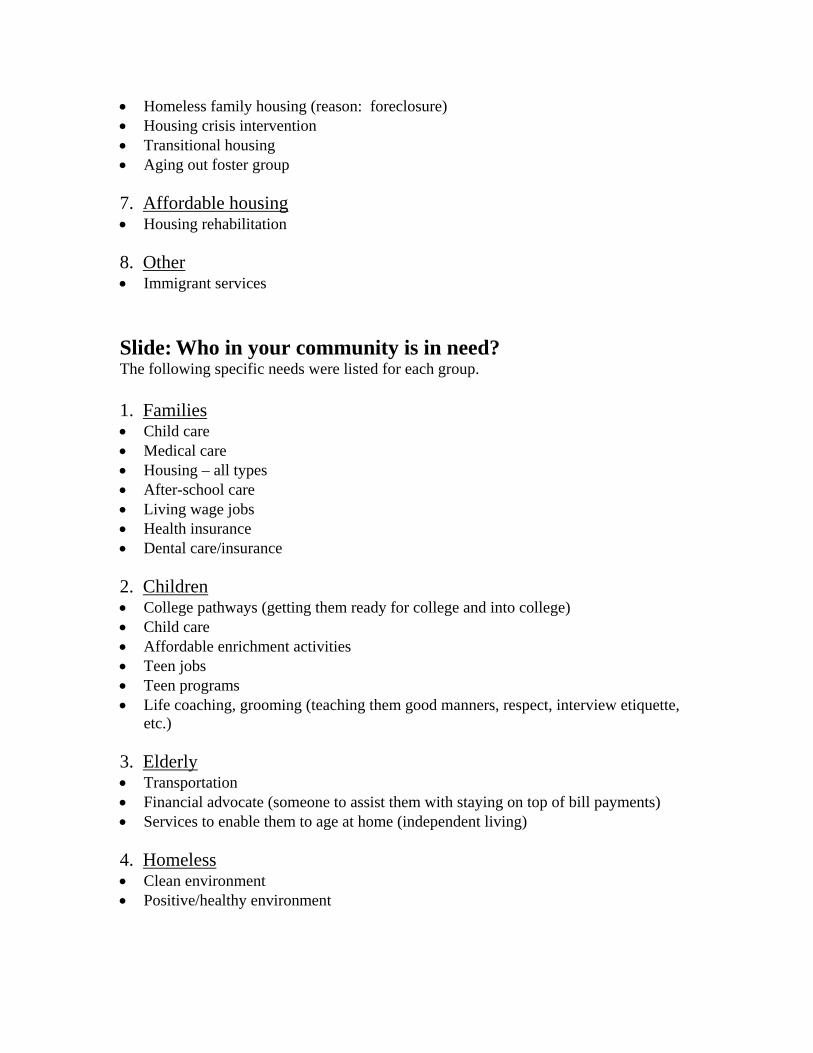
• Homeless family housing (reason: foreclosure) • Housing crisis intervention • Transitional housing • Aging out foster group 7. Affordable housing • Housing rehabilitation 8. Other • Immigrant services Slide: Who in your community is in need? The following specific needs were listed for each group. 1. Families • Child care • Medical care • Housing – all types • After-school care • Living wage jobs • Health insurance • Dental care/insurance 2. Children • College pathways (getting them ready for college and into college) • Child care • Affordable enrichment activities • Teen jobs • Teen programs • Life coaching, grooming (teaching them good manners, respect, interview etiquette,
etc.) 3. Elderly • Transportation • Financial advocate (someone to assist them with staying on top of bill payments) • Services to enable them to age at home (independent living) 4. Homeless • Clean environment • Positive/healthy environment

5. Veterans • Same types of needs as above 6. Disabled • Same types of needs as above 7. Mentally ill • Same types of needs as above 8. Other • Immigrant services • Healthcare • Sexual offender re-entry housing (mentioned that sex offenders who’ve gotten out of
jail and who cannot go near their homes are sleeping in their cars and at the parks) Slide: Who in your community is most in need? Top 3
1. Families – 92% 2. Children – 75% 3. Homeless – 67%
Slide: Most important un-met needs? 1. Housing • Transitional housing for children (18 yr olds) exiting the foster care system 2. Food and clothing • 3. Information • 4. Recreation • 5. Education/job training •

6. Medical care/counseling • Health care • Health services • Dental care/services • Medical care for vulnerable populations • Mental health
o Psychiatric h o Suicide hotline o Teen suicide hotline o Outpatient services
7. Other • Immigrant services

(percent) (count)42.86% 342.86% 314.29% 1
Totals 100% 7
(percent) (count)0% 0
25% 237.50% 312.50% 1
25% 2Totals 100% 8
(percent) (count)85.71% 614.29% 1
Totals 100% 7
(percent) (count)100% 8
0% 0Totals 100% 8
(percent) (count)100% 8
0% 0Totals 100% 8
Responses
YesNo
Responses
YesNo
5.) Think you can help decide how these funds are spent?
Responses
YesNo
4.) Think these funds can help your community?
Email� Word of mouth� Other�
3.) Heard of CDBG, HOME or ESG before?
2.) How did you hear about this workshop? (one or more)Responses
Newspaper� Website�
Responses
RodRobBob
Turning Results by Question
Session Name: New Session 2009-08-26 7-28 PMCreated: 2009-09-04 4:28 PM
1.) Test : my name is …
Page 1 of 4

(percent) (count)0% 00% 00% 00% 0
28.57% 228.57% 214.29% 128.57% 2
Totals 100% 7
(percent) (count)0% 00% 00% 0
25% 237.50% 312.50% 112.50% 112.50% 1
Totals 100% 8
(percent) (count)0% 0
25% 20% 0
25% 212.50% 1
0% 037.50% 3
0% 0Totals 100% 8
(percent) (count)28.57% 214.29% 157.14% 4
0% 00% 00% 0
Totals 100% 7Other
CoupleFamily with young childrenSeniorUn-related adults
East County
9.) Which type of household are you?Responses
Single person
RichmondEl CerritoOther West CountyCentral County
Responses
HerculesPinoleSan Pablo
Public OfficialAffordable Housing ProviderI’m an interested citizen
8.) Where do you live?
Real Estate/Property MgtAdvocateService ProviderMunicipal Agency or Dept
I’m an interested citizen
7.) Who do you represent?Responses
Business
Service ProviderMunicipal Agency or DeptPublic OfficialAffordable Housing Provider
Responses
BusinessReal Estate/Property MgtAdvocate
6.) Who do you represent?
Page 2 of 4

(percent) (count)0% 0
33.33% 344.44% 422.22% 2
0% 0Totals 100% 9
(percent) (count)10% 518% 912% 610% 512% 616% 818% 94% 2
Totals 100% 50
(percent) (count)18.18% 418.18% 49.09% 29.09% 29.09% 29.09% 2
27.27% 60% 0
Totals 100% 22
(percent) (count)17.19% 1114.06% 915.62% 1014.06% 96.25% 4
14.06% 914.06% 94.69% 3
Totals 100% 64
Mentally illOther
ElderlyHomelessVeteransDisabled
13.) Who in your community is in need? (more than one)Responses
FamiliesChildren
Assistance to small businessHelp for the homelessAffordable housingOther
Streets and sidewalksPublic Facilities and ParksPublic TransitLow and no cost programs
Affordable housingOther
12.) Top three needs in your community? (pick 3)Responses
Public TransitLow and no cost programsAssistance to small businessHelp for the homeless
11.) What needs does your community have? (multiple)Responses
Streets and sidewalksPublic Facilities and Parks
25 – 4041 to 6061 – 80Over 80
10.) Which age group are you?Responses
Under 25
Page 3 of 4

(percent) (count)30.56% 11
25% 911.11% 422.22% 8
0% 00% 0
2.78% 18.33% 3
Totals 100% 36
(percent) (count)18% 912% 610% 520% 1020% 1020% 100% 0
Totals 100% 50
(percent) (count)32.35% 115.88% 22.94% 15.88% 2
29.41% 1023.53% 8
0% 0Totals 100% 34
(percent) (count)100% 8
0% 0Totals 100% 8
YesNo
Medical care/counseling� Other
17.) Think these funds can help your community?Responses
Food and clothing� Information� Recreation� Education/job training�
Other
16.) Most important un-met needs? (pick 3)Responses
Housing�
Information� Recreation� Education/job training� Medical care/counseling�
15.) What type of needs to people have? (multiple)Responses
Housing� Food and clothing�
VeteransDisabledMentally illOther
FamiliesChildrenElderlyHomeless
14.) Who in your community is most in need? (pick top 3)Responses
Page 4 of 4


Contra Costa Consortium 2010-2015 Consolidated Plan
East County Priority Needs Workshop
September 8, 2009 Community Annex
Workshop Notes
Slide: Where do you live? 2 out of 11 people live in Brentwood and results were not reflecting this. Slide: What needs does your community have? The following specific items were listed for each need. 4. Low and no cost programs • Activities • Childcare • After-school programs • Nutrition Programs for Seniors • Special needs programs for children and adults • Business development 5. Assistance to small businesses • Forgivable loans • Capital improvements 6. Help for the homeless • Shelter for families • Transitional housing for families • Shelter for run-aways 7. Affordable housing • Mixed use housing • Senior housing • Housing for the Disabled

8. Other (2/11 people voted for Other and their vote was not reflected on the results) • Job creation • Children services Slide: What type of public facility needs? 1. In Brentwood: On Village Drive, there is a great need for a recreational facility or youth center. 2. In Antioch: Youth Centers, Recreational Facilities. 3. New technology at facilities. Example: the library 4. Re-use of existing vacant buildings Slide: Top 3 public facility needs 1. Youth Centers 2. Childcare/After-school 3. Senior Centers Slide: Top 3 Populations with Housing Problems? 1. Seniors • Insufficient housing • Long waiting lists • Need utility assistance 2. Disabled • Insufficient housing • Long waiting lists • Need utility assistance • Need housing with accessibility 3. Large Families • 4. Homeless • Families • Transitional housing • Immediate assistance is needed • Housing location assistance • Services plus housing


(percent) (count)16.67% 166.67% 416.67% 1
Totals 100% 6
(percent) (count)0% 0
10% 160% 610% 120% 2
Totals 100% 10
(percent) (count)70% 730% 3
Totals 100% 10
(percent) (count)90% 910% 1
Totals 100% 10
(percent) (count)100% 8
0% 0Totals 100% 8
Responses
YesNo
Responses
YesNo
5.) Think you can help decide how these funds are spent?
Responses
YesNo
4.) Think these funds can help your community?
Email� Word of mouth� Other�
3.) Heard of CDBG, HOME or ESG before?
2.) How did you hear about this workshop? (one or more)Responses
Newspaper� Website�
Responses
RodRobBob
Turning Results by Question
Session Name: New Session 2009-09-08 8-10 PMCreated: 2009-09-09 5:03 PM
1.) Test : my name is …
Page 1 of 4

(percent) (count)0% 00% 00% 0
70% 730% 30% 00% 00% 0
Totals 100% 10
(percent) (count)30% 340% 410% 10% 00% 0
20% 20% 0
Totals 100% 10
(percent) (count)7.32% 37.32% 34.88% 2
29.27% 1217.07% 712.20% 521.95% 9
0% 0Totals 100% 41
(percent) (count)0% 0
3.45% 13.45% 1
24.14% 713.79% 417.24% 537.93% 11
0% 0Totals 100% 29
Affordable housingOther
Public TransitLow and no cost programsAssistance to small businessHelp for the homeless
9.) Top three needs in your community? (pick 3)Responses
Streets and sidewalksPublic Facilities and Parks
Assistance to small businessHelp for the homelessAffordable housingOther
Streets and sidewalksPublic Facilities and ParksPublic TransitLow and no cost programs
Central CountyWest County
8.) What needs does your community have? (multiple)Responses
AntiochOakleyBrentwoodOther East County
I’m an interested citizen
7.) Where do you live?Responses
Pittsburg
Service ProviderMunicipal Agency or DeptPublic OfficialAffordable Housing Provider
Responses
BusinessReal Estate/Property MgtAdvocate
6.) Who do you represent?
Page 2 of 4

(percent) (count)16.67% 1016.67% 1013.33% 818.33% 116.67% 4
10% 615% 9
3.33% 2Totals 100% 60
(percent) (count)30% 9
16.67% 523.33% 713.33% 43.33% 16.67% 26.67% 2
0% 0Totals 100% 30
(percent) (count)10.81% 435.14% 13
0% 021.62% 829.73% 112.70% 1
Totals 100% 37
(percent) (count)15.15% 536.36% 123.03% 1
18.18% 627.27% 9
0% 0Totals 100% 33
Childcare/Afterschool CentersOther
Senior centers.Youth Centers.Parks. Neighborhood Centers.
Childcare/Afterschool CentersOther
13.) Top 3 public facility needs? (multiple)Responses
Senior centers.Youth Centers.Parks. Neighborhood Centers.
Mentally illOther
12.) What type of public facility needs? (multiple)Responses
ElderlyHomelessVeteransDisabled
11.) Who in your community is most in need? (pick top 3)Responses
FamiliesChildren
VeteransDisabledMentally illOther
FamiliesChildrenElderlyHomeless
10.) Who in your community is in need? (more than one)Responses
Page 3 of 4

(percent) (count)18.18% 827.27% 1215.91% 720.45% 918.18% 8
0% 0Totals 100% 44
(percent) (count)20.83% 529.17% 716.67% 429.17% 74.17% 1
0% 0Totals 100% 24
(percent) (count)18.18% 236.36% 49.09% 19.09% 19.09% 1
18.18% 20% 00% 0
Totals 100% 11
(percent) (count)8.33% 1
16.67% 20% 0
33.33% 441.67% 5
0% 0Totals 100% 12
Large families.Homeless.Very low income.Other.
17.) Top 3 populations with housing problems.Responses
Seniors.Disabled.
Unsafe neighborhood conditions.Foreclosures/vacancy.Not accessible for the disabled.Other.
Homelessness.Housing affordability.Overcrowding.Unsafe housing.
Affordable for-sale housing.Other.
16.) Top 3 housing problems.Responses
Emergency shelter.Transitional housing for homeless.Permanent housing for special needs.Affordable rental housing.
Affordable for-sale housing.Other.
15.) Top 3 housing needs?Responses
Emergency shelter.Transitional housing for homeless.Permanent housing for special needs.Affordable rental housing.
14.) What are the housing needs?Responses
Page 4 of 4

Contra Costa Consortium 2010-2015 Consolidated Plan
Central County Priority Needs Workshop
September 15, 2009 St. Paul’s Episcopal Church
Workshop Notes
Slide: What needs does your community have? The following specific items were listed for each need. 8. Other • Mental health • Emergency services for seniors Slide: Who in your community is in need? The following specific needs were listed for each group. 8. Other • Emancipated youth • Dementia/Alzheimer’s • AIDS/HIV • Immigrants • Teens • Ex-offenders newly released from the prison system • Low income adults • Single adults Slide: Who in your community is most in need? Top 3
1. Families – 58% 2. Children – 54%

3. Elderly – 54% 8. Other - Teens
Slide: What type of public facility needs?
6. Other • Dementia • Skilled elderly care • Homeless centers • Inter-generational centers • Bilingual learning annex • Family resource center – with services and providers onsite, and with educational
activities. Slide: What are the housing needs? 6. Other • Emancipated foster youth • Pregnant teens • Group homes for special needs • Adapted housing, accessible for the handicapped (with ramps, grab bars, etc.) • Safe places for outside homeless • Ex-offenders, persons exiting the prison • Affordable, assisted living for all age groups Slide: Top 3 housing problems 8. Other • Elderly that live in foreclosed upon houses • Low income residential care • Medium-term rental/mortgage assistance to assist them to get back on their feet • Tenant rights counseling Slide: Top 3 populations with housing problems 6. Other • Single parents • Youth

• Domestic violence victims • Chronically ill persons • Undocumented persons • Emancipated youth • The working poor • Veterans • Ex-offenders


(percent) (count)0% 0
83.33% 2016.67% 4
Totals 100% 24
(percent) (count)4% 14% 1
60% 1520% 512% 3
Totals 100% 25
(percent) (count)91.30% 218.70% 2
Totals 100% 23
(percent) (count)95.65% 22
0% 04.35% 1
Totals 100% 23
(percent) (count)86.36% 19
0% 013.64% 3
Totals 100% 22Don’t know
5.) Think you can help decide how these funds are spent?Responses
YesNo
Responses
YesNoDon’t know
Responses
YesNo
4.) Think these funds can help your community?
Email� Word of mouth� Other�
3.) Heard of CDBG, HOME or ESG before?
Newspaper� Website�
Responses
RodRobBob
Turning Results by Question
Session Name: New Session 2009-09-15 11-23 AMCreated: 2009-09-15 1:54 PM
1.) Test : my name is …
2.) How did you hear about this workshop? (one or more)Responses
Page 1 of 5

(percent) (count)0% 00% 0
26.09% 647.83% 1113.04% 3
0% 08.70% 24.35% 1
Totals 100% 23
(percent) (count)3.85% 1
0% 023.08% 6
50% 1311.54% 3
0% 07.69% 23.85% 1
Totals 100% 26
(percent) (count)3.85% 1
0% 038.46% 1026.92% 715.38% 43.85% 17.69% 23.85% 1
Totals 100% 26
(percent) (count)4.95% 5
10.89% 116.93% 7
21.78% 228.91% 9
18.81% 1920.79% 216.93% 7
Totals 100% 101Other
Low and no cost programsAssistance to small businessHelp for the homelessAffordable housing
Responses
Streets and sidewalksPublic Facilities and ParksPublic Transit
Other Central CountyEast CountyWest County
9.) What needs does your community have? (multiple)
ClaytonConcordWalnut CreekPleasant Hill
I’m an interested citizen
8.) Where do you live?Responses
Martinez
Service ProviderMunicipal Agency or DeptPublic OfficialAffordable Housing Provider
Responses
BusinessReal Estate/Property MgtAdvocate
Public OfficialAffordable Housing ProviderI’m an interested citizen
7.) Who do you represent?
Real Estate/Property MgtAdvocateService ProviderMunicipal Agency or Dept
6.) Who do you represent?Responses
Business
Page 2 of 5

(percent) (count)1.41% 17.04% 59.86% 7
26.76% 194.23% 3
21.13% 1526.76% 192.82% 2
Totals 100% 71
(percent) (count)14.53% 1713.68% 1616.24% 1912.82% 156.84% 8
12.82% 1515.38% 187.69% 9
Totals 100% 117
(percent) (count)20.55% 1519.18% 1419.18% 148.22% 61.37% 1
10.96% 810.96% 89.59% 7
Totals 100% 73
(percent) (count)11.69% 922.08% 175.19% 4
19.48% 1525.97% 2015.58% 12
Totals 100% 77
Neighborhood Centers.Childcare/Afterschool CentersOther
Responses
Senior centers.Youth Centers.Parks.
DisabledMentally illOther
13.) What type of public facility needs? (multiple)
ChildrenElderlyHomelessVeterans
Other
12.) Who in your community is most in need? (pick top 3)Responses
Families
HomelessVeteransDisabledMentally ill
Responses
FamiliesChildrenElderly
Help for the homelessAffordable housingOther
11.) Who in your community is in need? (more than one)
Public Facilities and ParksPublic TransitLow and no cost programsAssistance to small business
10.) Top three needs in your community? (pick 3)Responses
Streets and sidewalks
Page 3 of 5

(percent) (count)13.16% 1022.37% 173.95% 3
22.37% 1723.68% 1814.47% 11
Totals 100% 76
(percent) (count)17.59% 1919.44% 2117.59% 1917.59% 1917.59% 1910.19% 11
Totals 100% 108
(percent) (count)13.04% 918.84% 1320.29% 1428.99% 207.25% 5
11.59% 8Totals 100% 69
(percent) (count)15.38% 1027.69% 186.15% 4
10.77% 716.92% 1113.85% 96.15% 43.08% 2
Totals 100% 65Other.
Unsafe housing.Unsafe neighborhood conditions.Foreclosures/vacancy.Not accessible for the disabled.
Responses
Homelessness.Housing affordability.Overcrowding.
Affordable rental housing.Affordable for-sale housing.Other.
17.) Top 3 housing problems.
Responses
Emergency shelter.Transitional housing for homeless.Permanent housing for special needs.
Affordable rental housing.Affordable for-sale housing.Other.
16.) Top 3 housing needs?
Responses
Emergency shelter.Transitional housing for homeless.Permanent housing for special needs.
Neighborhood Centers.Childcare/Afterschool CentersOther
15.) What are the housing needs?
Responses
Senior centers.Youth Centers.Parks.
14.) Top 3 public facility needs? (multiple)
Page 4 of 5

(percent) (count)16.22% 1212.16% 910.81% 813.51% 1035.14% 2612.16% 9
Totals 100% 74Other.
Disabled.Large families.Homeless.Very low income.
18.) Top 3 populations with housing problems.Responses
Seniors.
Page 5 of 5

Contra Costa Consolidated Plan Workshop in Concord
September 29, 2009 Attendee comments not captured by Turning Point Software: Question 2: If you selected “other” in the survey, how did you hear about this workshop? - Flyer- ESL class Why did you come tonight to the workshop?
- To learn more about the programs - Don’t know - Like public meetings and am interested - To get more information - To learn how the money is spent
Question 8: If you selected “other” in the survey, what are other important community needs?
- Safe streets - Health - Scholarships for low-income and undocumented students - More street lighting at crosswalks - Community center - Multicultural center - Child care - School funding - Joint use of schools and public facilities (joint use agreements)
Question 11: If you selected “other” in the survey, who are among those most in need?
- Pregnant women - College students - Unemployed - Immigrants
Question 12: If you selected “other” in the survey, what are other public facility needs?
- Shelters - Professional services- legal and immigration services
Question 14: If you selected “other” in the survey, what are other important housing needs not specifically listed in the presentation?
- Parking Question 15: If you selected “other” in the survey, what are among the top 3 housing needs?
- Remodeling homes

- Multifamily units need to be improved. - Mixed-use is needed with housing and business/retail.
Question 17: If you selected “other” in the survey, what other populations not specifically listed in the presentation are among the top 3 with housing problems?
- People with good income but poor credit - Immigrants


(percent) (count)6.67% 1
66.67% 1026.67% 4
Totals 100% 15
(percent) (count)0% 0
5.56% 133.33% 638.89% 722.22% 4
Totals 100% 18
(percent) (count)28.57% 471.43% 10
Totals 100% 14
(percent) (count)75% 120% 0
25% 4Totals 100% 16
(percent) (count)64.71% 1117.65% 317.65% 3
Totals 100% 17Don’t know
5.) Think you can help decide how these funds are spent?Responses
YesNo
Responses
YesNoDon’t know
Responses
YesNo
4.) Think these funds can help your community?
Email� Word of mouth� Other�
3.) Heard of CDBG, HOME or ESG before?
Newspaper� Website�
Responses
RocioRobRoberta
Turning Results by Question
Session Name: New Session 2009-09-29 7-45 PMCreated: 2009-09-30 11:47 AM
1.) Test : my name is …
2.) How did you hear about this workshop? (one or more)Responses
Page 1 of 4
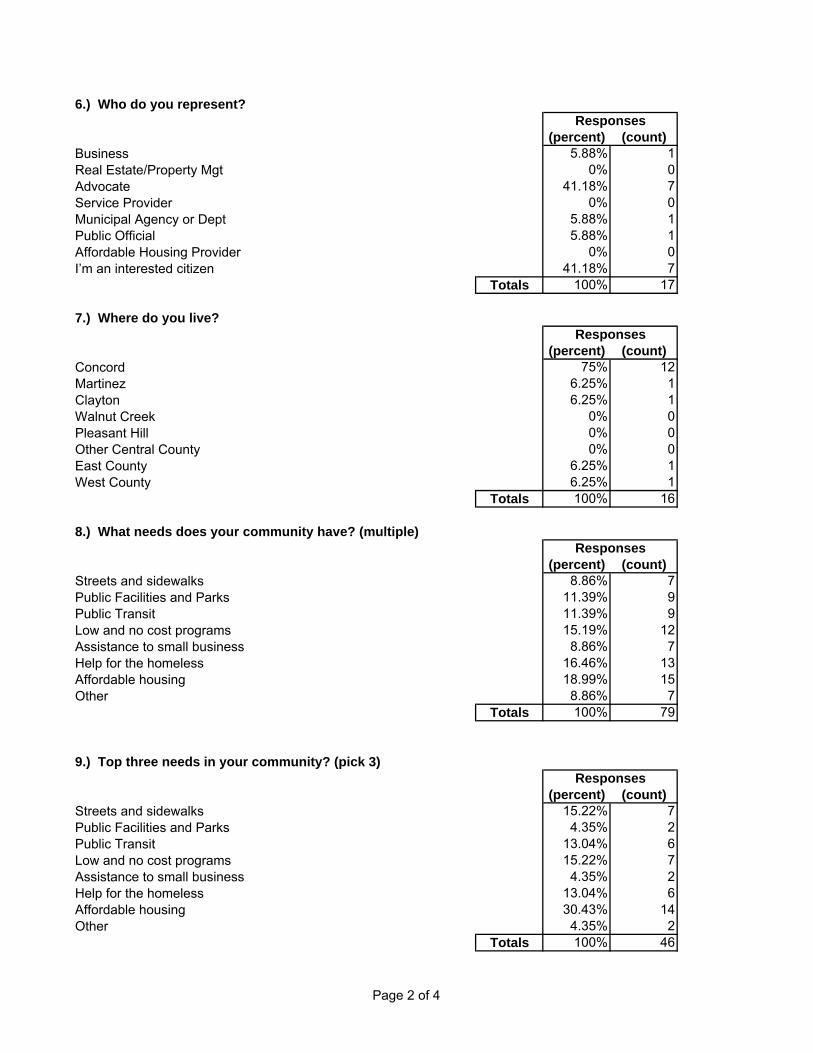
(percent) (count)5.88% 1
0% 041.18% 7
0% 05.88% 15.88% 1
0% 041.18% 7
Totals 100% 17
(percent) (count)75% 12
6.25% 16.25% 1
0% 00% 00% 0
6.25% 16.25% 1
Totals 100% 16
(percent) (count)8.86% 7
11.39% 911.39% 915.19% 128.86% 7
16.46% 1318.99% 158.86% 7
Totals 100% 79
(percent) (count)15.22% 74.35% 2
13.04% 615.22% 74.35% 2
13.04% 630.43% 144.35% 2
Totals 100% 46Other
Low and no cost programsAssistance to small businessHelp for the homelessAffordable housing
Responses
Streets and sidewalksPublic Facilities and ParksPublic Transit
Help for the homelessAffordable housingOther
9.) Top three needs in your community? (pick 3)
Public Facilities and ParksPublic TransitLow and no cost programsAssistance to small business
West County
8.) What needs does your community have? (multiple)Responses
Streets and sidewalks
Walnut CreekPleasant HillOther Central CountyEast County
Responses
Concord MartinezClayton
Public OfficialAffordable Housing ProviderI’m an interested citizen
7.) Where do you live?
Real Estate/Property MgtAdvocateService ProviderMunicipal Agency or Dept
6.) Who do you represent?Responses
Business
Page 2 of 4

(percent) (count)24.24% 1621.21% 147.58% 5
13.64% 97.58% 59.09% 6
10.61% 76.06% 4
Totals 100% 66
(percent) (count)28.57% 1420.41% 1012.24% 612.24% 66.12% 36.12% 3
10.20% 54.08% 2
Totals 100% 49
(percent) (count)12.50% 620.83% 1012.50% 627.08% 1318.75% 98.33% 4
Totals 100% 48
(percent) (count)2.08% 1
25% 126.25% 3
27.08% 1327.08% 1312.50% 6
Totals 100% 48Other
Youth Centers.Parks. Neighborhood Centers.Childcare/Afterschool Centers
Other
13.) Top 3 public facility needs? (multiple)Responses
Senior centers.
Youth Centers.Parks. Neighborhood Centers.Childcare/Afterschool Centers
Other
12.) What type of public facility needs? (multiple)Responses
Senior centers.
HomelessVeteransDisabledMentally ill
Responses
FamiliesChildrenElderly
DisabledMentally illOther
11.) Who in your community is most in need? (pick top 3)
ChildrenElderlyHomelessVeterans
10.) Who in your community is in need? (more than one)Responses
Families
Page 3 of 4

(percent) (count)19.30% 1115.79% 919.30% 1124.56% 1419.30% 111.75% 1
Totals 100% 57
(percent) (count)23.91% 1115.22% 715.22% 728.26% 1315.22% 72.17% 1
Totals 100% 46
(percent) (count)8% 4
18% 92% 1
16% 828% 1424% 122% 12% 1
Totals 100% 50
(percent) (count)12% 66% 3
24% 1216% 834% 178% 4
Totals 100% 50
Homeless.Very low income.Other.
Responses
Seniors.Disabled.Large families.
Foreclosures/vacancy.Not accessible for the disabled.Other.
17.) Top 3 populations with housing problems.
Housing affordability.Overcrowding.Unsafe housing.Unsafe neighborhood conditions.
Other.
16.) Top 3 housing problems.Responses
Homelessness.
Transitional housing for homeless.Permanent housing for special needs.Affordable rental housing.Affordable for-sale housing.
Other.
15.) Top 3 housing needs?Responses
Emergency shelter.
Transitional housing for homeless.Permanent housing for special needs.Affordable rental housing.Affordable for-sale housing.
14.) What are the housing needs?Responses
Emergency shelter.
Page 4 of 4
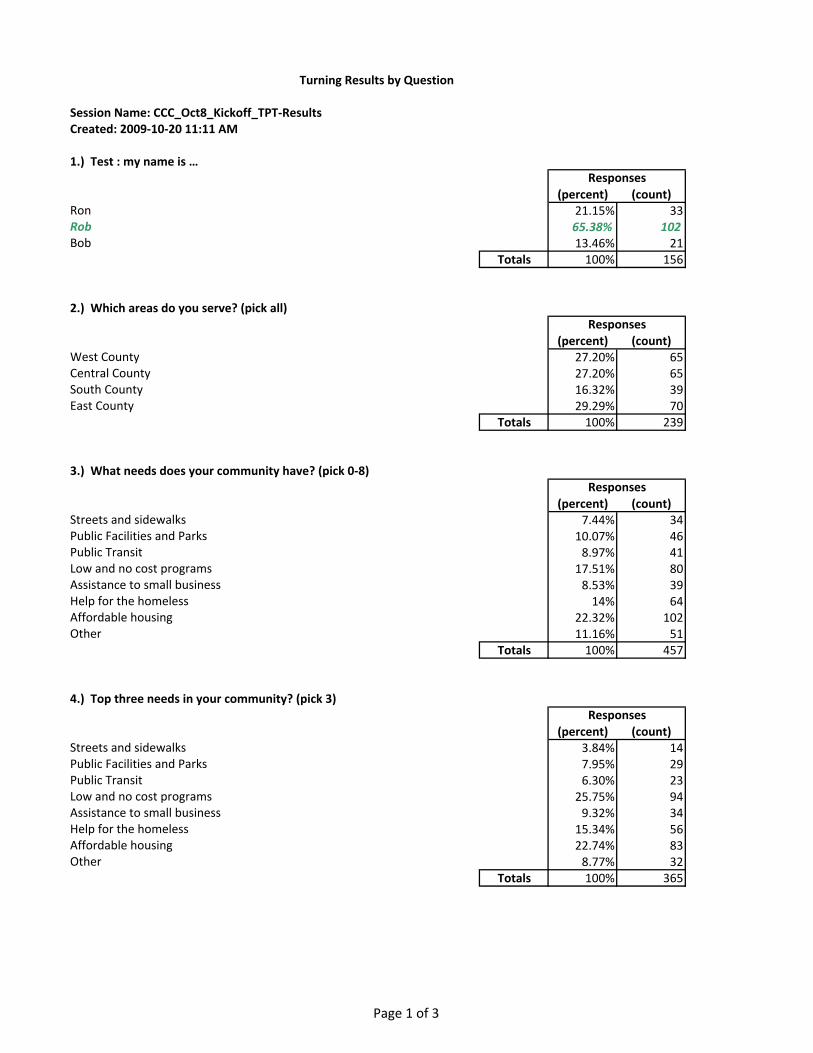
(percent) (count)21.15% 3365.38% 10213.46% 21
Totals 100% 156
(percent) (count)27.20% 6527.20% 6516.32% 3929.29% 70
Totals 100% 239
(percent) (count)7.44% 3410.07% 468.97% 4117.51% 808.53% 3914% 64
22.32% 10211.16% 51
Totals 100% 457
(percent) (count)3.84% 147.95% 296.30% 2325.75% 949.32% 3415.34% 5622.74% 838.77% 32
Totals 100% 365
Assistance to small businessHelp for the homelessAffordable housingOther
Low and no cost programs
Public TransitLow and no cost programsAssistance to small businessHelp for the homelessAffordable housingOther
4.) Top three needs in your community? (pick 3)Responses
Streets and sidewalksPublic Facilities and ParksPublic Transit
Public Facilities and Parks
RobBob
2.) Which areas do you serve? (pick all)Responses
West CountyCentral CountySouth CountyEast County
3.) What needs does your community have? (pick 0‐8)Responses
Streets and sidewalks
Ron
Turning Results by Question
Session Name: CCC_Oct8_Kickoff_TPT‐ResultsCreated: 2009‐10‐20 11:11 AM
1.) Test : my name is …Responses
Page 1 of 3

(percent) (count)19.11% 9520.52% 10211.87% 5910.26% 518.25% 4111.07% 5513.08% 655.84% 29
Totals 100% 497
(percent) (count)23.97% 7628.71% 9113.25% 4211.04% 353.79% 125.99% 197.89% 255.36% 17
Totals 100% 317
(percent) (count)11.34% 3924.71% 859.59% 3318.60% 6428.78% 996.98% 24
Totals 100% 344
(percent) (count)12.58% 4120.25% 6615.03% 4934.36% 11216.26% 531.53% 5
Totals 100% 326
Permanent housing for special needs.Affordable rental housing.Affordable for‐sale housing.Other.
Transitional housing for homeless.
7.) Top 3 public facility needs? (pick 0‐6)Responses
Senior centers.Youth Centers.Parks. Neighborhood Centers.Childcare/Afterschool CentersOther
8.) Top 3 housing needs?Responses
Emergency shelter.
Other
Mentally illOther
6.) Who in your community is most in need? (pick 0‐3)Responses
FamiliesChildrenElderlyHomelessVeteransDisabledMentally ill
Disabled
5.) Who in your community is in need? (pick 0‐8)Responses
FamiliesChildrenElderlyHomelessVeterans
Page 2 of 3

(percent) (count)16.31% 5414.20% 4712.99% 4319.64% 6531.42% 1045.44% 18
Totals 100% 331Other.
9.) Top 3 populations with housing problems.Responses
Seniors.Disabled.Large families.Homeless.Very low income.
Page 3 of 3

Number SubjectNumber of Answered Responses
Number of Skipped
Responses
No Need (1)
Low Need (2)
Moderate Need (3)
High Need (4)
Critical Need (5)
10 Street Improvements 97 40 2.91 6.19% 28.87% 38.14% 21.65% 5.15%11 Street Lighting 99 38 2.75 13.13% 24.24% 40.40% 19.19% 3.03%12 Sidewalk Improvements 95 42 2.73 8.42% 35.79% 34.74% 16.84% 4.21%13 Beautification/Enhanced Public Space 97 40 2.89 9.28% 25.77% 36.08% 24.74% 4.12%14 Historic Preservation 94 43 2.52 13.83% 37.23% 34.04% 12.77% 2.13%15 Green Development 96 41 3.25 7.29% 16.67% 28.13% 39.58% 8.33%16 Attractive Business District 96 41 3.27 5.21% 15.63% 34.38% 36.46% 8.33%17 Accessibility / Safety for Disabled 96 41 3.34 4.17% 15.63% 35.42% 31.25% 13.54%
18/19 Other Public Improvements 66 71 3.21 9.09% 21.21% 27.27% 24.24% 18.18%
20 Senior Centers 95 42 3.11 7.37% 17.89% 37.89% 30.53% 6.32%21 Youth Centers 97 40 3.73 2.06% 9.28% 25.77% 39.18% 23.71%22 Neighborhood/Community Facilities 95 42 3.34 2.11% 12.63% 46.32% 27.37% 11.58%23 Parks and Recreation Facilities 96 41 3.20 6.25% 15.63% 39.58% 29.17% 9.38%24 Accessibility of Public Facilities 94 43 3.27 3.19% 15.96% 41.49% 29.79% 9.57%25 Child Care Centers 93 44 3.41 1.08% 10.75% 46.24% 30.11% 11.83%
26/27 Other Public Facility Improvements 50 87 3.34 6.00% 10.00% 48.00% 16.00% 20.00%
28 Public Transportation Improvements 92 45 3.40 1.09% 15.22% 38.04% 33.70% 11.96%29 Public Transportation Facilities (stops, transit hubs) 92 45 3.29 1.09% 17.39% 42.39% 29.35% 9.78%30 Increase in Routes 91 46 3.30 3.30% 13.19% 40.66% 36.26% 6.59%31 Increase in Frequency of Stops 89 48 3.07 4.49% 15.73% 52.81% 22.47% 4.49%32 Decrease in fares or fare subsidy/discount 91 46 3.20 2.20% 19.78% 43.96% 24.18% 9.89%33 Accessibility of Public Transportation 92 45 3.36 2.17% 14.13% 42.39% 28.26% 13.04%
34/35 Other Public Transportation Improvements 55 82 3.31 5.45% 10.91% 41.82% 30.91% 10.91%
36 Youth Services 88 49 3.81 2.27% 6.82% 27.27% 35.23% 28.41%37 Child Care Services 86 51 3.44 1.16% 9.30% 45.35% 32.56% 11.63%38 After School Programs 85 52 3.87 1.18% 2.35% 28.24% 44.71% 23.53%39 Senior Services 84 53 3.52 1.19% 10.71% 35.71% 39.29% 13.10%40 Services for Persons with Disabilities 86 51 3.61 1.16% 8.14% 34.88% 39.53% 16.28%41 Health Services 85 52 3.79 2.35% 7.06% 22.35% 45.88% 22.35%42 Mental Health Services 88 49 3.75 2.27% 9.09% 26.14% 36.36% 26.14%43 Employment Training 87 50 3.93 2.30% 2.30% 25.29% 40.23% 29.89%44 Crime Prevention 88 49 3.95 0.00% 5.68% 27.27% 32.95% 34.09%45 Fair Housing 87 50 3.66 3.45% 11.49% 29.89% 26.44% 28.74%46 Credit Counseling / Foreclosure 86 51 3.71 0.00% 5.81% 38.37% 34.88% 20.93%
Public Facilities
Average Rank of Need by Answered Responses
Question Respondent Percentage by Priority NeedsRespondents
Public Improvements
Public Transportation
Public Services
Page 1 of 3

Number SubjectNumber of Answered Responses
Number of Skipped
Responses
No Need (1)
Low Need (2)
Moderate Need (3)
High Need (4)
Critical Need (5)
Average Rank of Need by Answered Responses
Question Respondent Percentage by Priority NeedsRespondents
47 Emergency Assistance (Not Shelter) 86 51 3.72 0.00% 9.30% 29.07% 41.86% 19.77%48 Crisis Intervention 82 55 3.56 0.00% 10.98% 39.02% 32.93% 17.07%49 Emergency Shelter (Not Homeless) 87 50 3.44 0.00% 20.69% 32.18% 29.89% 17.24%50 Information and Referral 86 51 3.37 0.00% 16.28% 40.70% 32.56% 10.47%51 Transportation 84 53 3.36 1.19% 11.90% 46.43% 30.95% 9.52%52 Access to Services 83 54 3.46 1.20% 14.46% 36.14% 33.73% 14.46%53 Substance Abuse Services 84 53 3.51 1.19% 15.48% 34.52% 28.57% 20.24%
54/55 Other Public Service Needs 47 90 3.43 8.51% 10.64% 29.79% 31.91% 19.15%
56 Job Development/Creation 86 51 4.06 0.00% 6.98% 17.44% 38.37% 37.21%57 Retail Development 84 53 2.96 9.52% 21.43% 40.48% 20.24% 8.33%58 Small Business Loans 81 56 3.43 2.47% 17.28% 33.33% 28.40% 18.52%59 Storefront Improvements 80 57 3.18 3.75% 22.50% 36.25% 27.50% 10.00%60 Pollution/Property Cleanup 83 54 3.37 1.20% 19.28% 34.94% 30.12% 14.46%61 Technical Assistance to Small Businesses 80 57 3.09 3.75% 21.25% 45.00% 22.50% 7.50%62 Banking/Lending for Commercial Redevelopment 78 59 3.27 3.85% 15.38% 47.44% 16.67% 16.67%
63/64 Other Economic Development Needs 44 93 3.43 6.82% 11.36% 34.09% 27.27% 20.45%
65 Emergency Shelters for Families 84 53 3.63 1.19% 15.48% 30.95% 23.81% 28.57%66 Emergency Shelters for Men 81 56 3.40 1.23% 19.75% 33.33% 29.63% 16.05%67 Emergency Shelters for Women 81 56 3.59 1.23% 14.81% 29.63% 32.10% 22.22%68 Transitional Housing for Families 82 55 3.72 1.22% 13.41% 29.27% 24.39% 31.71%69 Transitional Housing for Men 81 56 3.27 1.23% 20.99% 43.21% 18.52% 16.05%70 Transitional Housing for Women 81 56 3.51 1.23% 16.05% 34.57% 27.16% 20.99%71 Supportive Housing for Families 81 56 3.64 1.23% 14.81% 28.40% 29.63% 25.93%72 Supportive Housing for Men 77 60 3.32 1.30% 20.78% 38.96% 22.08% 16.88%73 Supportive Housing for Women 80 57 3.53 1.25% 15.00% 32.50% 32.50% 18.75%74 Operations and Maintenance of Existing Facilities 80 57 3.48 3.75% 11.25% 33.75% 36.25% 15.00%75 Job Training for the Homeless 79 58 3.63 1.27% 8.86% 31.65% 41.77% 16.46%76 Case Management 80 57 3.81 1.25% 11.25% 17.50% 45.00% 25.00%77 Substance Abuse Treatment/Detox Facilities 78 59 3.62 1.28% 16.67% 26.92% 29.49% 25.64%78 Mental Health Care for the Homeless 79 58 3.80 1.27% 11.39% 26.58% 27.85% 32.91%79 Physical Health Care for the Homeless 80 57 3.71 1.25% 11.25% 27.50% 35.00% 25.00%80 Housing Placement for the Homeless 79 58 3.58 1.27% 16.46% 27.85% 31.65% 22.78%81 Life Skills Training for the Homeless 80 57 3.58 2.50% 13.75% 26.25% 38.75% 18.75%
82/83 Other Homeless Population Needs 40 97 3.85 2.50% 10.00% 25.00% 25.00% 37.50%
84 Housing for Seniors 80 57 3.64 1.25% 7.50% 40.00% 28.75% 22.50%
Economic Development
Homeless Needs
Housing for Persons with Special Needs
Page 2 of 3

Number SubjectNumber of Answered Responses
Number of Skipped
Responses
No Need (1)
Low Need (2)
Moderate Need (3)
High Need (4)
Critical Need (5)
Average Rank of Need by Answered Responses
Question Respondent Percentage by Priority NeedsRespondents
85 Housing for Chronically Homeless 79 58 3.33 3.80% 18.99% 35.44% 24.05% 17.72%86 Housing for Persons with HIV/AIDS 78 59 3.04 6.41% 24.36% 41.03% 15.38% 12.82%87 Housing for Persons with Alcohol/Drug Addictions 77 60 3.23 3.90% 24.68% 31.17% 24.68% 15.58%88 Housing for Persons with Developmental Disabilities 75 62 3.37 1.33% 16.00% 41.33% 26.67% 14.67%89 Housing for Persons with Mental Illness 78 59 3.51 1.28% 17.95% 29.49% 30.77% 20.51%90 Housing for Persons with Profound Physical Disabilities 76 61 3.45 2.63% 19.74% 28.95% 27.63% 21.05%
91/92 Other Special Needs Population Housing Needs 40 97 3.45 5.00% 12.50% 32.50% 32.50% 17.50%
93 Minor Rehabilitation Assistance 76 61 3.03 2.63% 22.37% 50.00% 19.74% 5.26%94 Major Rehabilitation Assistance 75 62 3.16 2.67% 18.67% 45.33% 26.67% 6.67%95 Affordable New Construction 77 60 3.42 3.90% 14.29% 37.66% 24.68% 19.48%96 Rental Assistance 79 58 3.67 2.53% 10.13% 31.65% 29.11% 26.58%97 Preservation of Existing Affordable Rental Housing 76 61 3.78 2.63% 10.53% 23.68% 32.89% 30.26%98 Energy Efficiency Improvements 77 60 3.69 0.00% 3.90% 38.96% 41.56% 15.58%99 Lead‐Based Paint Screening/Abatement 77 60 3.12 2.60% 27.27% 37.66% 20.78% 11.69%100 Rental Housing for the Elderly 76 61 3.82 0.00% 7.89% 30.26% 34.21% 27.63%101 Rental Housing for the Disabled 76 61 3.66 1.32% 9.21% 38.16% 25.00% 26.32%102 Rental Housing for Single Persons 76 61 3.32 1.32% 23.68% 38.16% 15.79% 21.05%103 Rental Housing for Small Families (2‐4 persons) 77 60 3.51 1.30% 9.09% 45.45% 25.97% 18.18%104 Rental Housing for Large Families (5 or more persons) 77 60 3.47 2.60% 10.39% 46.75% 18.18% 22.08%
105/106 Other Affordable Rental Housing Needs 41 96 3.83 4.88% 4.88% 26.83% 29.27% 34.15%
107 Housing Counseling 79 58 3.17 2.53% 22.78% 39.24% 26.58% 8.86%108 Foreclosure Counseling 78 59 3.51 1.28% 12.82% 39.74% 25.64% 20.51%109 Home Purchase Assistance 78 59 3.19 5.13% 19.23% 39.74% 23.08% 12.82%110 Emergency Repair 79 58 3.16 3.80% 22.78% 37.97% 24.05% 11.39%111 Minor Rehabilitation Assistance 74 63 3.05 5.41% 17.57% 47.30% 25.68% 4.05%112 Major Rehabilitation Assistance 76 61 3.04 5.26% 23.68% 40.79% 22.37% 7.89%113 Affordable New Construction 76 61 3.24 6.58% 17.11% 40.79% 17.11% 18.42%114 Energy Efficiency Improvements 75 62 3.53 1.33% 13.33% 33.33% 34.67% 17.33%115 Modifications for Persons with Disabilities 76 61 3.39 0.00% 22.37% 32.89% 27.63% 17.11%116 Lead‐Based Paint Screening/Abatement 77 60 2.88 5.19% 31.17% 41.56% 14.29% 7.79%
117/118 Other Homeownership Needs 39 98 3.41 5.13% 10.26% 43.59% 20.51% 20.51%
Homeownership Needs
Affordable Rental Housing
Page 3 of 3


CDBG Interested Parties List(Consortium Wide)
First Name Last Name Company Email Address
Clearnise Bullard A Peace of Mind Women Battered CenterJames Wagner A Place of Learning [email protected] Paulson A.F. Evans Company [email protected] Romero ABHOW [email protected] Negri Acalanes Union High School District [email protected] Luis Trevino ACORN Housing Corporation [email protected] Friedland Affordable Housing Associates [email protected] Jordan Against All OddsRoger Smith Alamo Improvement Association [email protected] Mirkovich Alhambra High School [email protected] Olson Alhambra Valley Improvement Association [email protected] Sanford ALIVE n/a
Williams All Nations Family (All Nations Church of G-d)Kristen Pursley Alvarado School, ESL Department [email protected] Strickland A-maze-ing Solutions [email protected] Schwartz Amber Foundation for Missing Children [email protected] Smith Ambrose Recreation and Park District [email protected] Massaro Anka Behavioral Health, Inc. [email protected] Barrington Anka Behavioral Health, Inc. [email protected] Rimbault Antioch Historical Society No EmailDale Davis Aptos Mortgage [email protected] Luong Area Agency on Aging [email protected] Muell Ark III [email protected] Wong Asian Community Mental Health Services [email protected] J. Suzuki Asian Pacific Islander Legal Outreach (formerly Nihonmachi Legal Outreach) [email protected] Suzuki Asian Pacific Psychological ServicesChris Noble Assistance League of Diablo Valley [email protected] Schnurr Assistance League of Diablo Valley [email protected] Mercer Assistance League of Diablo Valley [email protected] Eddleman Associated Right of Way Svcs [email protected] Cammer Barcelon Associates Management Corporation [email protected] Pheis Barcelon Associates Management CorporationCheryl Adams Basic Central [email protected] Jackson Bay Area Addiction Research and Treatment, Inc. (BAART) - Site No EmailCarol Weinstein Bay Area Community Resources - Site [email protected] Hochman Bay Area Community Resources - Site [email protected] Espinoza Bay Area Community Resources - Site [email protected] Shepard Bay Area Community Resources - Site [email protected] Weltz Bay Area Crisis Nursery [email protected] Moxley Bay Area Legal Aid [email protected] Kim Bay Area Legal Aid - Central Support Office [email protected] Burns Bay Area Legal Aid - Central Support Office [email protected] Peck Bay Area Partnership for Children and Youth [email protected] Breckenridge Bay Area Partnership for Children and Youth [email protected] Michaehelles Bay Area Psychotherapy Services [email protected] Kachurka Bay Area Rescue Mission [email protected]. John Anderson Bay Area Rescue Mission [email protected] Harris Bay Area Rescue Mission [email protected] & Ruth Lesinski Bay Park Retirement Residence [email protected] Trevino James Bay Point Family Health Center [email protected] Hoagland Bay Point Municipal Advisory Council [email protected] Garcia Bay Point Works [email protected] Peach Punsalang Bay Point Works [email protected]. Cavanasia Bay View SchoolDoris Walker Beacon Light Seventh Day Adventist Church [email protected] Marshall Bethel Island Chamber of Commerce [email protected] Stockley Bethel Island MACSheila Goodson Bethel Island MAC [email protected] Cinelli Bi-Bett Alcohol & Drug ProgramMadlin King Black Families Association [email protected] Crockett Boys & Girls Club of Martinez [email protected] Mason Boys and Girls Clubs of America [email protected] Reed Boys and Girls Clubs of America [email protected] Clark Brackenhoff Management Group, Inc. noneBonnie Lucchese Brentwood Chamber of Commerce [email protected] Davis Broadcasters Anti-Narcotics Network [email protected] Jamieson Brookside Community Health Center [email protected] Johnson Brookside Community Health Center [email protected] Vanderpan Buena Vista School noneIlene Ayala Building Blocks Children Center noneBetty Burrus-Wright Burrus-Wright Holistic Counseling Center noneSandy Frederickson Byron Chamber of Commerce noneRick Kendrick Byron Municipal Advisory Committee (MAC) noneDan Sturdivant Byron United Methodist Church [email protected] Martin CA State Department of Corrections and Rehabilitation [email protected] Martinez California Assoc. of County Veterans Service Officers noneLaura Briggin California Autism Foundation [email protected]
Page 1

CDBG Interested Parties List(Consortium Wide)
First Name Last Name Company Email Address
Matt Schwartz California Housing Partnership CorporationTerri Waller California State Assembly email via websiteJennifer Cabrejas California State University, East Bay [email protected] Jones California State University, Hayward Foundation [email protected] Bergman [email protected] Lafferty Cambridge Community Center [email protected] Shores Cameron School [email protected] Groobin Caring Hands [email protected] Steensrud Carquinez Middle School [email protected] M. Enyant Casa Linda Senior Housing [email protected] Murphy Castro School [email protected] Ho Catholic Charities of the East Bay [email protected] Leahy Catholic Charities of the East Bay [email protected] Ta Catholic Charities of the East Bay [email protected] New CELSEBAngela Moore Center for Human Development [email protected] Langlois Center for Human Development (CHD) [email protected] Avalos César E. Chávez Elementary School [email protected] Joseph Chaya Centers, Inc. [email protected] Goerke Cherub Child Care [email protected] Carrillo Child Abuse Prevention Council [email protected] Dove Child Abuse Prevention Council [email protected] Chang Chinese American Political Association (CAPA) [email protected] Sanders Christian Church Homes of Northern California noneDon Stump Christian Church Homes of Northern California [email protected] Buckley Citizens Housing Corporation [email protected] Freitas City of Antioch [email protected] Landeros City of Brentwood [email protected] Napper City of Clayton [email protected] Forsberg City of Concord [email protected] McVey City of Concord [email protected] Loza City of Concord, Community Services Dept. [email protected] Hernandez City of Concord, Neighborhood Preservation Division [email protected] Hanin City of El Cerrito [email protected] Oliva City of Hercules [email protected] Falk City of Lafayette [email protected] Vince City of Martinez [email protected] Montgomery City of Oakley [email protected] Keeter City of Orinda [email protected] Espinosa City of Pinole [email protected] Bilbas City of Pinole [email protected] Grisham City of Pittsburg [email protected] Catalano City of Pleasant Hill [email protected] Luke City of Pleasant Hill, Park & Recreation District [email protected] Seville City of Richmond Library & Cultural Services Dept. [email protected] Babb City of Richmond Recreation Department noneDean Digil City of Richmond Recreation Department noneVincent Seymore City of Richmond Recreation Department [email protected] Nikolai City of Richmond Recreation Department [email protected] Kassendorf City of Richmond Recreation Department noneDan Hughey City of Richmond Recreation DepartmentBrock Arner City of San Pablo [email protected] Sambajon City of San Pablo [email protected] Moniz City of San Ramon [email protected] Pokorny City of Walnut Creek [email protected] Fossan Clayton Business and Community AssociationNya Flores Collins Elementary SchoolTeresa Armstrong Coming Anew Reunification ProgramTanir Ami Community Clinic Consortium [email protected] Gilmore Community Housing Development Corp. of North Richmond [email protected] Silva Community Housing Development Corp. of North RichmondMaria Benjamin Community Housing Development Corp. of North Richmond [email protected] Benjamin Community Housing Development Corp. of North Richmond [email protected] Aguilar Community Housing Development Corp. of North Richmond [email protected] Williams Community Housing Development Corporation of North Richmond [email protected] Silva Community Housing Opportunities Corporation [email protected] Huckabay Community Violence Solutions (CVS) [email protected] Peterson Community Violence Solutions (CVS) [email protected] James Community Violence Solutions (CVS) [email protected] Audo Community Violence Solutions of Marin/CC Counties [email protected] Latimer Concerted Services Project noneKeith McMahon Concord Chamber of Commerce [email protected] Waggoner Concord Child Care Center [email protected] Schressler Concord Church of Nazarene [email protected] Higgins Concord Historical SocietyMaureen Kilmurray Concord Library [email protected] Pitman Concord Park Neighborhood Assn. [email protected]
Page 2

CDBG Interested Parties List(Consortium Wide)
First Name Last Name Company Email Address
Dennis Costanza Concord Youth Center [email protected] Wagner Consumer Credit Counseling ServicesBetty Jo DuBois Contra Costa ARC [email protected] Duart Contra Costa ARC [email protected] Rodriquez Victory Outreach Pittsburg [email protected] Reveles Victory Outreach Pittsburg [email protected] Shepson Villa San Ramon noneRoger Goodwin Vine Hill Improvement Association noneMatt Yarwood Vintage Estates, Inc. noneKarla McCormick Volunteer Center of Contra Costa [email protected] R. Spann WR Spann, LLC [email protected] Parsons WW Ministries, Inc. [email protected] Fornengo Walnut Creek School District [email protected] Trautwein Wardrobe for Opportunity [email protected] Jones We Care Services for Children [email protected] Langsdale We Care Services for Children [email protected] Jones We Care Treatment Center [email protected] Walsh Welcome Home Baby [email protected] Katz West Coast Children's Center [email protected] Gomez West Contra Costa Business Development Center [email protected] Stewart West Contra Costa Healthcare District [email protected] Hyman West Contra Costa Healthcare District noneJim Beaver West Contra Costa Healthcare District noneKathie Shores West Contra Costa Unified School District [email protected] Price West Contra Costa Unified School District [email protected] Harter West Contra Costa Unified School District [email protected] Loggins West Contra Costa Youth Service Bureau noneDeborah Price-Janke West County Adult Day Care Center [email protected] Rosario West County Housing Corporation [email protected] Hunter West County Housing Corporation [email protected] Morris West Pittsburg Youth Football Assoc. [email protected] Thompson Western Contra Costa Transit Authority [email protected] Tawfall Western Contra Costa Transit Authority [email protected] Gates Westwind Foster Family Agency [email protected] Jackson Westwind Programs, Inc.Susan Aguilar WeTip, Inc. [email protected] Rourke Willow High School [email protected] Bradford Women's Therapy Center [email protected] Waltz Woodbridge Children's Center noneLinda Chandler CCC Workforce Development Board [email protected] Cook YMCA of the East Bay noneDon Lau YMCA of the East Bay [email protected] Hanson YMCA of the East Bay [email protected] Anne McCrary Contra Costa ARC [email protected] Langford Contra Costa ARC [email protected] Gelbman Contra Costa ARC [email protected] Coman Contra Costa ARC [email protected] Whipple Contra Costa Braille Transcribers [email protected] Fathi Contra Costa Child Care Council [email protected] Williams Contra Costa College [email protected] Hernandez Contra Costa College [email protected] Christensen Contra Costa College [email protected] Best Contra Costa Council [email protected] Howell CCC Animal Services Department [email protected] Gioia CCC Board of Supervisors [email protected] Uilkema CCC Board of Supervisors [email protected] Piepho CCC Board of Supervisors [email protected] Bonilla CCC Board of Supervisors [email protected] Glover CCC Board of Supervisors [email protected] Corum CCC Building Inspection Department [email protected] Angelo Silva CCC Building Inspection Department [email protected] Ertz-Berger Contra Costa Child Care Council [email protected] Garcia Contra Costa Child Care Council [email protected] Kutsuris CCC Department of Conservation & Development [email protected] Greitzer CCC Department of Conservation & Development [email protected] Roche CCC Department of Conservation & Development [email protected] Prince CCC Employment & Human Services [email protected] Dowell CCC District Attorney [email protected] Van CCC Employment & Human Services [email protected] Valentine CCC Employment & Human Services [email protected] Bell CCC Employment & Human Services [email protected] Giometti CCC Employment & Human Services [email protected] Harris CCC Employment & Human Services [email protected] Polk CCC Family Services CenterLindsey Johnson CCC Food Bank [email protected] Lim CCC General Services Department [email protected] Belon CCC Health Services, Public Health [email protected]
Page 3

CDBG Interested Parties List(Consortium Wide)
First Name Last Name Company Email Address
Wendel Brunner, MD CCC Health Services [email protected] Jennings CCC Health Services [email protected] Matal Sol CCC Health Services, Alcohol & Other Drug Services [email protected] Martin CCC Health Services, Public Health [email protected] Villarreal CCC Housing Authority [email protected] Uy CCC Housing Authority [email protected] Watts CCC LibraryLaura Martinengo CCC Library [email protected] Aaronian CCC LibraryAmy Collen CCC LibraryHeidi Dalamor CCC Library [email protected] Tucker-Watt CCC Library [email protected] Martinengo CCC Library [email protected] M. Wigand CCC Health Services [email protected] Giacalone CCC Office of Education (CCCOE) [email protected] Dhaliwal CCC Office of Supervisor John Gioia [email protected] Nunley CCC Probation Department [email protected] Coleman CCC Public Defender's Office [email protected] Kowalewski CCC Public Works [email protected] Bueren CCC Public Works [email protected] Tavenier CCC Public Works [email protected] Kennedy CCC Redevelopment Agency [email protected] Spencer CCC Service Integration Program [email protected] Garcia CCC Service Integration Program [email protected] Bateson Contra Costa Crisis Center [email protected] Middleton Contra Costa Crisis Center [email protected] Hampshire Contra Costa Crisis Center [email protected] Blaine Contra Costa Crisis Center [email protected] Hatcher CCC Health Services noneDesi Selva CCC Health Services [email protected] Bewley CCC Health Services [email protected] Sain CCC Health Services [email protected] Lovingood CCC Health Services noneB. Sheehy CCC Health Services noneCarol Anne McCrary CCC Health Services [email protected] Burgett CCC Health Services noneMarsha Flakoll, PHN CCC Health Services [email protected] Aloo CCC Health Services [email protected] Malone CCC Health Services noneGenoveva Calloway, LCSW CCC Health Services [email protected] Neuman, MFT CCC Health Services noneBeverly Clark CCC Health Services [email protected] Mello CCC Health Services noneTom Joiner CCC Health Services noneDorothy Haynes CCC Health ServicesAdam Kreuger Contra Costa Interfaith Sponsoring Committee (CCISCO) noneThomas Conrad Contra Costa Interfaith Transitional Housing & Mercy Housing [email protected] Hyams Contra Costa Jewish Community Center [email protected] Lawrence Contra Costa Senior Legal Services [email protected] Buddenhagen Contra Costa Service Integration Program [email protected] Hamile Contra Costa Small Business Development Center [email protected] Sheilds Contra Costa Youth Council [email protected] Murdock Cooperative Extension, University of California [email protected] Cohen Coronado Elementary School [email protected] Chavaria Court Appointed Special Advocates (CASA) [email protected] Archuleta Court Appointed Special Advocates (CASA)Donna Santana Crisis Resolution Services Inc. (CRS) [email protected] Gunkelman Crockett Improvement Association [email protected] Bohlig Crockett Recreation Association [email protected] Neudecker Crossroads High School [email protected] Elrod D.R. Elrod & Associates [email protected] Hernandez Dance UnlimitedMelony Newman Danville Area Chamber of CommerceAnita MacKusick Delta 2000 [email protected] Roche Delta Community Church of God noneRudeen Monte Delta Memorial Foundation, Save a Life Sister [email protected] Hyland Department of Rehabilitation [email protected] Svoboda Department of Rehabilitation [email protected] Tamura Diablo Japanese American Club [email protected] Levy Diablo Regional Arts Association (DRAA)Marsha Golangco Diablo Valley Chinese Cultural AssociationJudy Walters Diablo Valley College (DVC) Foundation noneCindy Goga Diablo Valley College (DVC) Foundation [email protected] Kain Diablo Valley Foundation for the Aging [email protected] Ramirez Diablo Valley YMCA noneVicki Laganowsky Discovery Bay Property Owner's Association [email protected] Martin Discovery Counseling Center of San Ramon Valley [email protected]
Page 4

CDBG Interested Parties List(Consortium Wide)
First Name Last Name Company Email Address
Ellen Tauscher United States Congress Email via websiteMaribel Lopez Dover Elementary School noneGraciela Uribes Downer Elementary SchoolAngela Noble EAH, Inc. [email protected] Kahalekulu EAH, Inc. noneArlette Merritt Early Childhood Mental Health Program [email protected] Frank Early Childhood Mental Health Program [email protected] Buck, Ph.D. Early Childhood Mental Health Program [email protected] Schwartz, L.C.S.W. Early Childhood Mental Health Program [email protected] Maria Rullier Early Childhood Mental Health ProgramBarbara Grotjahn, M.F.T. Early Childhood Mental Health ProgramJeremy Liu East Bay Asian Local Development Corporation [email protected] Engdahl East Bay Center for the Performing Arts [email protected] Simmons East Bay Center for the Performing Arts [email protected] Hatton East Bay Integrated Care, Inc. (Hospice) [email protected] Grace Puchac East Bay Services to the Developmentally Disabled noneRaymond Smith East Bay Youth ConsortiumEdward Schroth East County Boys & Girls Club [email protected] Cleveland East County Boys & Girls Club [email protected] Price East County Midnight Basketball League [email protected] Lyons EASTBAY Works, Inc noneAl Bonnett EAH, Inc. [email protected] Kwong EAH, Inc. [email protected] Murtagh EAH, Inc. [email protected] Rocha Eden Council for Hope an Opportunity [email protected] Hertado Eden Housing Inc.Mary Louise Green-King Eden Housing Inc.Linda Mandolini Eden Housing, Inc. [email protected] Bernstein Eden I&R (Information & Referral) Inc. [email protected] Glinternick El Cerrito Chamber of Commerce [email protected] Kehoe City of El Cerrito Recreation Department noneCallie Major City of El Cerrito Recreation Department noneMonica Kortz City of El Cerrito Recreation Department [email protected] Paasch City of El Cerrito Recreation Department noneYoko Fitzpatrick City of El Cerrito Recreation Department noneJan Duckart City of El Cerrito Recreation Department noneJennifer Rader El Cerrito High School Community Project [email protected] Lim El Portal Gardens - Senior Housing noneJim Cowen El Sobrante Chamber of CommerceTerry Christophel El Sobrante Elementary School [email protected] Pendergrass El Sobrante Municipal Advisory Council (MAC) [email protected] Loynd El Sobrante Valley Planning and Zoning Advisory Committee (P&Z)Grethe Holton Ellerhorst Elementary School [email protected] Vaca City of Richmond Employment and Training [email protected] Spicer Ephesians Community Development Center [email protected] James Eskaton Hazel Shirley Manor [email protected] Smith Fairfield Properties [email protected] Surgers Fairmont Elementary School [email protected] Saquing Family Worship CenterAlexis Adorador Familias Unidas [email protected] Huerta Familias Unidas [email protected] Rubin Family Institute of Pinole [email protected] Bysiek Family Stress Center [email protected] Galedo Filipinos for Affirmative Action, Inc. [email protected] Perkins First Baptist Church [email protected] Oberdorfer First Community Housing [email protected] Clipson First Presbyterian Church [email protected] Gonzalez First Presbyterian Church of Concord [email protected] Jones Food Bank of Contra Costa & Solano Counties [email protected] Sly Food Bank of Contra Costa & Solano Counties [email protected] Penny James Ford Elementary School noneApril Charles Foundation for Change [email protected] Prather Fresh Start Program [email protected] Koroslev Friends of Rogers Ranch [email protected] Schumacher Friends Outside in Contra CostaLori K. Beath Friends Outside in Contra Costa [email protected] Elliott Genard AIDS Foundation [email protected] Genard Genard AIDS Foundation [email protected] Gimsburg Genard AIDS Foundation [email protected] Sorrell George Miller CenterGayla Edgerly Girls, Inc. [email protected] Huston Global Outreach [email protected] Berrington Grant Elementary School [email protected] Hatchett Greater Richmond Interfaith Program - GRIP [email protected] Baird-Dicks Greater Richmond Interfaith Program - GRIP [email protected] Green Greater Richmond Interfaith Program - GRIP [email protected] Hutson Greater Richmond Interfaith Program - GRIP [email protected]
Page 5
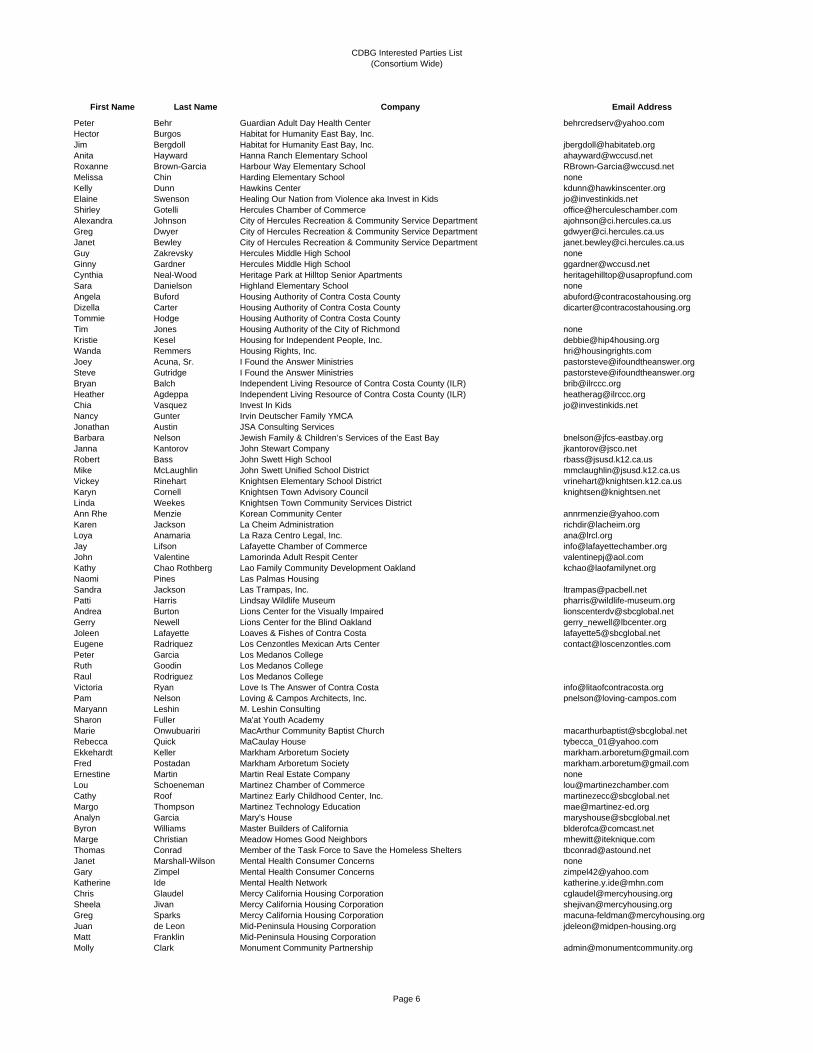
CDBG Interested Parties List(Consortium Wide)
First Name Last Name Company Email Address
Peter Behr Guardian Adult Day Health Center [email protected] Burgos Habitat for Humanity East Bay, Inc.Jim Bergdoll Habitat for Humanity East Bay, Inc. [email protected] Hayward Hanna Ranch Elementary School [email protected] Brown-Garcia Harbour Way Elementary School [email protected] Chin Harding Elementary School noneKelly Dunn Hawkins Center [email protected] Swenson Healing Our Nation from Violence aka Invest in Kids [email protected] Gotelli Hercules Chamber of Commerce [email protected] Johnson City of Hercules Recreation & Community Service Department [email protected] Dwyer City of Hercules Recreation & Community Service Department [email protected] Bewley City of Hercules Recreation & Community Service Department [email protected] Zakrevsky Hercules Middle High School noneGinny Gardner Hercules Middle High School [email protected] Neal-Wood Heritage Park at Hilltop Senior Apartments [email protected] Danielson Highland Elementary School noneAngela Buford Housing Authority of Contra Costa County [email protected] Carter Housing Authority of Contra Costa County [email protected] Hodge Housing Authority of Contra Costa CountyTim Jones Housing Authority of the City of Richmond noneKristie Kesel Housing for Independent People, Inc. [email protected] Remmers Housing Rights, Inc. [email protected] Acuna, Sr. I Found the Answer Ministries [email protected] Gutridge I Found the Answer Ministries [email protected] Balch Independent Living Resource of Contra Costa County (ILR) [email protected] Agdeppa Independent Living Resource of Contra Costa County (ILR) [email protected] Vasquez Invest In Kids [email protected] Gunter Irvin Deutscher Family YMCAJonathan Austin JSA Consulting ServicesBarbara Nelson Jewish Family & Children’s Services of the East Bay [email protected] Kantorov John Stewart Company [email protected] Bass John Swett High School [email protected] McLaughlin John Swett Unified School District [email protected] Rinehart Knightsen Elementary School District [email protected] Cornell Knightsen Town Advisory Council [email protected] Weekes Knightsen Town Community Services DistrictAnn Rhe Menzie Korean Community Center [email protected] Jackson La Cheim Administration [email protected] Anamaria La Raza Centro Legal, Inc. [email protected] Lifson Lafayette Chamber of Commerce [email protected] Valentine Lamorinda Adult Respit Center [email protected] Chao Rothberg Lao Family Community Development Oakland [email protected] Pines Las Palmas HousingSandra Jackson Las Trampas, Inc. [email protected] Harris Lindsay Wildlife Museum [email protected] Burton Lions Center for the Visually Impaired [email protected] Newell Lions Center for the Blind Oakland [email protected] Lafayette Loaves & Fishes of Contra Costa [email protected] Radriquez Los Cenzontles Mexican Arts Center [email protected] Garcia Los Medanos CollegeRuth Goodin Los Medanos CollegeRaul Rodriguez Los Medanos CollegeVictoria Ryan Love Is The Answer of Contra Costa [email protected] Nelson Loving & Campos Architects, Inc. [email protected] Leshin M. Leshin ConsultingSharon Fuller Ma'at Youth AcademyMarie Onwubuariri MacArthur Community Baptist Church [email protected] Quick MaCaulay House [email protected] Keller Markham Arboretum Society [email protected] Postadan Markham Arboretum Society [email protected] Martin Martin Real Estate Company noneLou Schoeneman Martinez Chamber of Commerce [email protected] Roof Martinez Early Childhood Center, Inc. [email protected] Thompson Martinez Technology Education [email protected] Garcia Mary's House [email protected] Williams Master Builders of California [email protected] Christian Meadow Homes Good Neighbors [email protected] Conrad Member of the Task Force to Save the Homeless Shelters [email protected] Marshall-Wilson Mental Health Consumer Concerns noneGary Zimpel Mental Health Consumer Concerns [email protected] Ide Mental Health Network [email protected] Glaudel Mercy California Housing Corporation [email protected] Jivan Mercy California Housing Corporation [email protected] Sparks Mercy California Housing Corporation [email protected] de Leon Mid-Peninsula Housing Corporation [email protected] Franklin Mid-Peninsula Housing CorporationMolly Clark Monument Community Partnership [email protected]
Page 6

CDBG Interested Parties List(Consortium Wide)
First Name Last Name Company Email Address
Vernon Brown Moss Beach Homes [email protected] Endo Mt. Diablo Adult Education [email protected] Irene Chan Mt. Diablo Community Child Care [email protected] Erwin Mt. Diablo Regional YMCA Association Office [email protected] Roberts Mt. Diablo Unified School District [email protected] Bonnewit Natalie Bonnewit Development Services [email protected] Coleman National Institute of Art and Disabilities [email protected] Becnel Neighborhood House of North Richmond [email protected] Sain Neighborhood House of North Richmond [email protected] Winston Neighborhood House of North Richmond [email protected] Zenn Neighborhood House of North Richmond noneCynthia A. Scheinberg, Ph.D New Connections [email protected] Billings New Connections [email protected] Jones New Directions Counseling Ctr.
Bateman New Gethsemane COGICLuz Gomez North Richmond Municipal Advisory Council (MAC) [email protected] Holland North Richmond Youthbuild [email protected] Blasdell Northbay Family Homes (NEH) [email protected] Fulton Northern California Family Center [email protected] Winters Northern California Land Trust [email protected] Seeto Oakland Community HousingMercrey Lafayette Oakley Chamber of Commerce [email protected] Scherzi Ocadian Care Centers, Inc. noneKate McClatchy Olympic High School, MDUSD [email protected] Maitland Ombudsman Services of Contra Costa [email protected] Marchiano CCC Employment & Human Services [email protected] Kjeldgaard Opportunity Builders [email protected] Friedman Opportunity Junction, formerly OPTIC [email protected] Golden Opportunity Junction, formerly OPTIC [email protected] Maier Opportunity West [email protected] Warner Opportunity West [email protected] Glentzer Pacheco Town Council [email protected] LaFleur Pacific Community Services, Inc. (PCSI) [email protected] Singleton Pinnacle Project, Inc. [email protected] Ricco Pinole Chamber of Commerce [email protected] Bilbas Pinole Senior Center [email protected] Blomquist Pinole United Methodist Church [email protected] Greene Pittsburg Pre-School and Community Council, Inc. (PPSCC) [email protected] Bonnett Pittsburg Unified School District noneGaby Hellier Pittsburg Unified School District noneGeri Quilici Pixie Play School [email protected] Lee Gardner Planned Parenthood [email protected] Duran Planned Parenthood: Shasta-Diablo [email protected] Thomson Planned Parenthood: Hilltop [email protected] Tuck Playland Not At The Beach [email protected] Daly Pleasant Hill Chamber of Commerce [email protected] Luke Pleasant Hill Recreation & Parks District [email protected] Krider Pleasant Hill Recreation & Parks District [email protected] Stewart Port Costa Conservation Society [email protected] Johnson Positive Edge/WW Ministries [email protected] Cain Professional Healthcare at Home [email protected] Lavan Progressive Computer Learning Center [email protected] Smiler Project Seed [email protected] Bremner RES [email protected] Sach Rainbow Community Center [email protected] Wasserfall Rebuilding Together Diablo Valley [email protected] Allio Recovery Management Services [email protected] Regan Regan Management ServicesDebbie Toth Mt. Diablo Center for Adult Day Health Care [email protected] Dutton Rehab Services of N. CA/Mt. Diablo Rehab. Center [email protected] Sawislak Resources for Community Development (RCD) [email protected] Myers Richmond Annex Senior Center [email protected] Brown Richmond Art CenterRochelle Monk City of Richmond Business Services [email protected] Shaw City of Richmond Community ServicesTina Harrison City of Richmond Community Services [email protected] Waldroup City of Richmond Community ServicesStanley Anderson City of Richmond Community Services [email protected] Leonhardy City of Richmond Community Services [email protected] Norris City of Richmond Parks and Landscaping [email protected] Smith, Sr. Richmond Emergency Food PantryLynette Mc Elhaney Richmond Neighborhood Housing Services [email protected] Ellis Rodeo Chamber of Commerce [email protected] Steele Rodeo Senior CenterGary Boyles Rodeo/Hercules Fire District [email protected] Lawrence Rome InvestmentsSteve Grolnic-McClurg Rubicon Programs, Inc.
Page 7

CDBG Interested Parties List(Consortium Wide)
First Name Last Name Company Email Address
Kelly Dunn Rubicon Programs, Inc.Richard Aubry Rubicon Programs, Inc.Lisa Harrison Salvation ArmyMaxine Erwin San Pablo Chamber of CommerceLupe Monterrosa City of San Pablo ServicesMike Heller City of San Pablo Services [email protected] Monterrosa City of San Pablo Services [email protected] Degnan San Ramon Chamber of CommerceRyan Chao Satellite Housing, Inc. [email protected] Kojima Satellite Housing, Inc. [email protected] Kirkham Seneca Center for Children and FamiliesPaul Kraintz Senior Nutrition Program [email protected] Zamora Senior Outreach Services of Contra Costa [email protected] Warren Senior Outreach Services of Contra Costa [email protected] Breed Sentinel Fair Housing [email protected] Claborn Shadelands Ranch Historical Museum [email protected] O'Keefe SHELTER, Inc. [email protected] Dial SHELTER, Inc. [email protected]
Baha SHELTER, Inc. [email protected] Whitted Shield's Nursing Center [email protected] Lai SilvercrestByron Berhel Solutions for at Risk Youth noneChris Holmes Spectrum Center [email protected] Bohrer, Ph.D Spectrum Center [email protected] Bolt St. Callistus Catholic Church noneJoe O'meara St. Joan of Arc Parish [email protected] Lynch St. Joseph Center for Deaf [email protected] Weston St. Vincent De Paul, Contra Costa Council [email protected] Verdugo St. Vincent De Paul Society [email protected] Baird STAND! Against Domestic Violence [email protected] Gertstenblatt STAND! Against Domestic ViolenceMichelle Davis STAND! Against Domestic Violence [email protected] Bodiford Stoneman Village noneAmity Pierce Buxton, Ph.D. Straight Spouse Network (SSN) [email protected] Hathaway The Stride CenterKate Culbertson Superior Court of Contra Costa County noneLaura Bogardus Superior Court of Contra Costa County [email protected] Long The Active Reading Clinic [email protected] Newell The Bedford Center [email protected] Gunkel The Co-Housing Company [email protected] Ami The Community Clinic Consortium of Contra Costa [email protected] Sikand The Hume Center noneGloria Alvarez The Latina Center [email protected] Wong The Latina Center [email protected] Garner The Perinatal Council [email protected] Wagner The Private Sector noneMaureen Wright The Respite Inn [email protected] Stauffer The Wellness Community of San Francisco East Bay [email protected] Bouquin The Wellness Community of San Francisco East Bay [email protected] Thomas Thomas Properties [email protected] Scott Tides Center/Verde Partnership Garden [email protected] Figueroa Total Remedy, Inc. [email protected] Erokan Town Hall Theatre Company of Lafayette [email protected] Calabrigo Town of Danville [email protected] Salamack Town of Moraga [email protected] O'Kane Tranquilium [email protected] Raibaldi Turn On To AmericaTerry Hatcher Ujima Family Recovery Services [email protected] Thomas Ujima Family Recovery Services [email protected] Schank Ujima Family Recovery Services [email protected] Rigelhaupt Ujima Family Recovery Services noneChristine Carter-Dean Ujima Family Recovery Services [email protected] Glatze United Cerebral Palsy [email protected]. L. Poole Vale Healthcare Center [email protected] Spencer Valley Children's Museum [email protected] Tam Veronica Tam and Associates, LLC [email protected] Ramirez Victory Outreach [email protected] Rodriquez Victory Outreach Pittsburg [email protected] Gillooly YMCA of the East Bay [email protected] McCullough Youth Homes, Inc. [email protected] Murillo Youth Together [email protected] Jimenez YWCA of Contra Costa County [email protected] Atkinson YWCA of Contra Costa County [email protected] Bailey [email protected] BisiarElizabeth Campbell noneValerie Fraga
Page 8

CDBG Interested Parties List(Consortium Wide)
First Name Last Name Company Email Address
Martha Ann Harris noneGeorgia HoffmeisterJonathan Livingston noneRose LubbeGinger Marsh noneKathy McCartyRegina Scott noneRaymond Smith noneDee Steward noneSteve Weir noneRobert Calkins CCC Department of Conservation & Development [email protected] Cohen City of Antioch [email protected] Kennedy City of Antioch [email protected] House City of Concord [email protected] Landry City of Pittsburg [email protected] Hodgett City of Walnut Creek [email protected] Ernst City of Walnut Creek [email protected] Wilkerson City of Richmond [email protected] Cortez City of Richmond [email protected] Jakel City of Antioch [email protected] Keen City of Concord [email protected] Lindsay City of Richmond [email protected] Twa CCC Administrator's Office [email protected] Meyer CCC Department of Agriculture, Weights and Measures [email protected] Guise CCC Department of Agriculture, Weights and Measures [email protected] Howell CCC Animal Services Department [email protected] Kramer CCC Assesor's Office [email protected] Ybarra CCC Auditor-Controller's Office [email protected] Crapo CCC Building Inspection Department [email protected] Weir CCC Clerk-Recorder's Office [email protected] Murdock CCC Cooperative ExtensionMichael Lango CCC General Services Department [email protected] Walker CCC Health Services [email protected] Tysell CCC Health ServicesLori Gentles CCC Human Resources DepartmentJoyce Strain CCC Public Administrator [email protected] Bueren CCC Public Works [email protected] Rupf CCC Sheriff - Coroner's OfficeWilliam Pollacek CCC Treasurer - Tax Collector [email protected] Villalba CCC Veterans Service OfficeBob Lanter CCC Workforce Development Board [email protected] Marchesi CCC County CounselSandra Scherer Monument Crisis Center [email protected] Louisell John Muir Health Foundation [email protected] Friedman Verde Partnership Garden [email protected] Gioia The RYSE Center [email protected] Droher Kline Lutheran Social Services of Northern California [email protected] Lawrence Lutheran Social Services of Northern California [email protected] Bunn McCullough Brighter Beginnings [email protected] Woodbury Brighter Beginnings [email protected] Van Hoswegen Concord Community Economic Development Organization [email protected] Castro Abrams Women's Initiative for Self Employment [email protected] LoValvo Women's Initiative for Self Employment [email protected] Hamile CCC Workforce Development Board [email protected] Hastings The Anchor Program [email protected] Feinstein United States Senate email via websiteBarbara Boxer United States Senate email via websiteGeorge Miller United States Congress [email protected] Torlakson State SenateArnold Schwarzenegger State of CaliforniaMark DeSaulnier California State Assembly [email protected] Hancock California State Assembly email via websiteDavid Boatwright City of Pleasant Hill [email protected] Lorono City of Oakley [email protected] Reed City of Brentwood, Housing Division [email protected] Lynch City of Richmond, Housing Development [email protected] Blount City of Martinez, Planning Division [email protected] Starbuck City of Pittsburg [email protected] Littman City of San Ramon [email protected] Trevino City of El Cerrito [email protected] Douglas CCC Department of Conservation & Development [email protected] Leivermann CCC Health Services, Public Health [email protected] Ordaz CCC Health Services, Public Health [email protected] Montoya CCC Health Services, Mental Health [email protected] Toms CCC Redevelopment Agency [email protected]'Andre Wells CCC Redevelopment Agency [email protected] Manuel CCC Redevelopment Agency [email protected]
Page 9

CDBG Interested Parties List(Consortium Wide)
First Name Last Name Company Email Address
Gabriel Lemus CCC Redevelopment Agency [email protected] Kain CCC Redevelopment Agency [email protected] Nurre CCC Redevelopment Agency [email protected] Brockbank CCC Redevelopment Agency [email protected] Aguilar CCC Redevelopment Agency [email protected] Kelly CCC Redevelopment Agency [email protected] Ancheta CCC Housing Authority [email protected] Karp Eden Housing, Inc. [email protected] Motoyama Resources for Community Development (RCD) [email protected] Smith CCC Department of Conservation & Development [email protected] Mejia CCC Administrator's Office [email protected] Cremer HUD [email protected] Sullivan HUD [email protected] Robie Affordable Housing Finance Committee [email protected] Alonzo-Perez Affordable Housing Finance CommitteeWillie Robinson Affordable Housing Finance Committee [email protected] Bundy Affordable Housing Finance Committee [email protected] Tolda Affordable Housing Finance Committee [email protected] Ferguson ABHOW [email protected] Sword City of BrentwoodDavid Woldering City of Clayton [email protected] Gailey Town of Danville [email protected] Oshinsky City of El Cerrito [email protected] Lawton City of Hercules [email protected] Maurer City of Brentwood [email protected] Merideth City of Lafayette [email protected] Srivatsa City of Lafayette [email protected] Majors City of Martinez [email protected] Willis City of Oakley [email protected] Mason City of Oakley [email protected] Nail City of Pittsburg [email protected] Ayres City of Pittsburg [email protected] Duran City of Richmond [email protected] Gangapuram City of San PabloJerry Bradshaw City of El Cerrito [email protected] Carman City of El Cerrito [email protected] Fontes City of San Ramon [email protected] Wong City of San Ramon [email protected] Barone City of Walnut CreekJoe Brandt City of Antioch [email protected] Wehrmeister City of Antioch [email protected] Bjerke City of Antioch [email protected] Ursu City of Orinda [email protected] Montagh City of Concord [email protected] Pickle West Bay Housing Corp. [email protected] Kutsuris CCC Department of Conservation & Development [email protected] Therrian CCC Employment & Human Services [email protected] Baiter CCC Employment & Human Services [email protected] Ricci CCC Public Works [email protected] Heard CCC Public Works [email protected] McGill CCC Redevelopment Agency [email protected] Fischberg Rubicon Programs, Inc. [email protected] Taylor City of Brentwood [email protected] Manning City of ClaytonWilliam Shinn City of Concord [email protected] Bergman Town of Danville [email protected] Andersen Town of Danville [email protected] Jones III City of El Cerrito [email protected] Ward City of Hercules [email protected] Anderson City of Lafayette [email protected] Schroder City of Martinez [email protected] Cellini City of Marinez [email protected] Deschambault Town of Moraga [email protected] Romick City of Oakley [email protected] Glazer City of Orinda [email protected] Murray City of Pinole [email protected] Durant City of Pleasant Hill [email protected] McLaughlin City of Richmond [email protected] Brown City of San Pablo [email protected] Ho City of San Pablo [email protected] Worthy City of San Pablo [email protected]. Abram Wilson City of San RamonGwen Regalia City of Walnut Creek [email protected] Wolken City of Richmond [email protected] McNerney United States Congress email via websiteBob Clayton Urban Financial Services [email protected] Jones LANDIS [email protected]
Page 10

CDBG Interested Parties List(Consortium Wide)
First Name Last Name Company Email Address
Roy Schweyer Bay Area Homebuyer AgencyWalter Zhovreboff First Home, Inc. [email protected]
HomebricksJacqueline Rickman Tri-Valley Housing Opportunity Center [email protected] Rozenski City of Brentwood [email protected] Myall City of El Cerrito [email protected] Wallace City of Pleasant Hill [email protected] Segrest Town of Moraga [email protected] McKinney Harmony Home [email protected] Casey First 5 Contra Costa [email protected] Truong East Bay Asian Local Development Corp. [email protected] Metcalf Domus Management CompanyAnalisa Anthony Satellite Housing, Inc. [email protected] Cox Pacific Community Services, Inc. (PCSI)Eve Stewart Affordable Housing Associates [email protected] Etheredge Mid-Peninsula Housing Corporation [email protected] Tuning Pacific CompaniesEric Knecht Resources for Community Development [email protected] Johnson BRIDGE Housing Corporation [email protected] Yong BRIDGE Housing Corporation [email protected] Peters Eden Housing, Inc. [email protected] Parris Eden Housing, Inc. [email protected] Gilbert SHELTER, Inc. [email protected] Knight WNC Management Inc.Esther Stowell Mid-Peninsula Housing Corporation [email protected] Brekke Adult Day Services Network of Contra Costa [email protected] White EAH, Inc.Ivan Chow Affordable Housing Finance Committee [email protected] Brown Affordable Housing Finance Committee [email protected] Le Beau The Watershed ProjectRicardo Pacheco John Stewart Company [email protected] Kuykendall City of Pinole [email protected] Amos Silver Oak Apartment [email protected] Bernhus SHELTER, Inc. [email protected] Scott Verde Partnership Garden [email protected] Henri U.S. Communities Compliance Services [email protected] Dutton EAH Housing [email protected] Paradise-Au The First Tee of Contra Costa [email protected] Mandel Meta HousingEd Schroth Lions Center for the Visually Impaired [email protected] Dellafosse Dellafosse Enterprise [email protected] Russell People Who Care [email protected] Gillen Congresswoman Tauscher's Office [email protected] Trevino Affordable Housing Finance Committee [email protected] Fitzgerald Contra Costa Clubhouses, Inc. [email protected] Hamaker Contra Costa Clubhouses, Inc. [email protected] MorleyMichael Gonzales [email protected] Cheung Supervisor John Gioia's OfficeKate Rauch Supervisor John Gioia's OfficeFrank Silva Supervisor Gayle Uilkema's OfficeLea Castleberry Supervisor Mary Nejedly Piepho's OfficeLauren Hole Supervisor Susan Bonilla's OfficeLynn Reichard Supervisor Federal Glover's OfficeGeorge Martinez [email protected] Piepho Discovery Bay MACAl Simas Knightsen MACReyes M. Barraza KMACRichard Karlsson KMACMarina Ramos Rodeo MACRick Kendrick Byron MAC
El Sobrante MACLee Jones North Richmond MACLynette Busby Contra Costa Centre MACPatrick Tahara KMACPamela Brown KMACLyndon P. Valerro Rodeo MACNorma Siegfried Bay Point MACRay Brandt Diablo MACOliver Fontana Pacheco MACCatherine M. Reed KMACGordon Becker KMACDeborah Drake Rodeo MACDavid Cooper [email protected] Sutton [email protected] E. Hester [email protected] L. Batkin [email protected]
Page 11

CDBG Interested Parties List(Consortium Wide)
First Name Last Name Company Email Address
Leslie Stewart Rainbow Community CenterAudrey Lee American Indian Culture CD01 & Education Program [email protected] Stewart Affordable Housing Associates [email protected] Osage Satellite Housing, Inc. [email protected] Flott The Child Abuse Prevention Council [email protected] Feldman Hendricks & Partners [email protected] Belleci California Network [email protected] Vander Contra Costa Clubhouses [email protected] Toney The Federal Technology Center [email protected] Angles Mercy Tree International FoundationStanley Uchegbu Mercy Tree International FoundationLilias Pettit-Scott Earth Island InstituteAnthony Oshinowo Health Care and Services [email protected] Melloni [email protected] Finnie Bay Area Quality Childcare [email protected]
Delta Community Services [email protected] Bladl Delta First Five [email protected] Lohn Find A Way [email protected] Burgis Friends of Marsh Creek [email protected]
Greater Grace [email protected] Gursky Harvest Time [email protected] Singrin Liberty Union School District [email protected] Ann Smith Soroptomist [email protected] Lomel Village Resource Center [email protected]
One Day At A TimeMike Baroman-Coggins Loaves & Fishes of Contra Costa [email protected] Green Green Design [email protected] Huey Delta Bay Athletic Association [email protected]
Amador Institute [email protected] Honaker Boys and Girls Club of El Sobrante [email protected] Mason Boys and Girls Club of El Sobrante [email protected] Hammack Boys and Girls Club of El Sobrante [email protected] Harris EMQ Families First [email protected] Smith Antioch Chamber of Commerce [email protected] Antioch Chamber of Commerce [email protected] Lucas EAH Housing [email protected] Maggiore SHELTER, Inc. [email protected] Gauche Contra Costa Crisis Center [email protected] Chao Lao Family Community Development Oakland [email protected] Mitchum Independent Living Resource Center [email protected] Shallat Brighter Beginnings jshallat@brighter_beginnings.orgWilliam Spann Pacific West Communities, Inc. [email protected] Mason Monument Community Partnership [email protected] Lusty BRIDGE Housing Corporation [email protected] Thomas EMQ Families First [email protected] Brown Further The Work [email protected] White Youth Together [email protected] Mandel Meta Housing [email protected] Parker BRIDGE Housing Corporation [email protected] Rappa Foundation Research, Inc.Jim Brune Deaf Counseling Advocacy and Referral Agency [email protected] Malcolm Community Energy Services Corporation [email protected] Lever Community Energy Services Corporation [email protected] Peterson Crockett Improvement Association [email protected] Rock Crockett Improvement Association [email protected] Harwood Community Clinic Consortium [email protected] Hope Rubicon Programs, Inc. [email protected] Gibson-Gray Arts & Cultural Foundation of Antioch [email protected] Peterson Crockett Community Foundation [email protected] Ashford [email protected] Lui SL Realty Ventures [email protected]
Page 12

APPENDIX 8.
HOMELESS PROGRAMS AND FACILITIES


Homeless Programs and Facilities
The County Health Services Department (HSD) develops plans and programs to assist the homeless throughout Contra Costa County. In 2004, the County adopted the “Ending Homelessness in Ten Years: A County‐Wide Plan for the Communities of Contra Costa County” (Ten Year Plan). Through the Ten Year Plan, the County has adopted a “housing first” strategy, which works to immediately house a homeless individual or family rather than force them through a sequence of temporary shelter solutions. The Ten Year Plan further deemphasizes emergency shelters by supporting “interim housing” as a preferred housing type. Interim housing is very short‐term and focuses on helping people access permanent housing as quickly as possible. Services provided in interim housing include housing search assistance and case management to help address immediate needs and identify longer‐term issues to be dealt with once in permanent housing.
The Contra Costa Inter‐jurisdictional Council on Homelessness (CCICH) is charged with providing a forum for communication about the implementation of the Ten Year Plan and providing advice and input on the operations of homeless services, program operations, and program development efforts in Contra Costa County.
The Ten Year Plan estimated 15,000 people in Contra Costa County experience an episode of homelessness annually. It further estimated that on any given night, 4,800 people are homeless, i.e., living on the streets or in temporary accommodations, such as an emergency shelter. More than three‐quarters of them are members of a family, including nearly 7,000 children. Additionally, many others are at risk of becoming homeless, especially very low‐income households who are overpaying for housing and struggling to make ends meet.
Consistent with the Ten Year Plan, the County will prioritize the use of its limited housing development resources to support permanent housing affordable to those with extremely‐low, very‐low and low incomes. The table below is a listing of the major housing facilities for the homeless in Contra Costa County. These facilities serve a variety of homeless persons, including battered women and children, mentally and/or physically disabled persons, individuals recovering from substance abuse, and needy families.

Appendix 8 Table
Contra Costa Homeless Facility Inventory
Facility Name Region Target Population Total Year‐Round Beds
Interim Housing (Emergency Shelters)
Bay Area Crisis Nursery Richmond Single men & women 20
Calli House Youth Shelter Richmond Transition‐age youth 6
Concord & Brookside Adult Interim Housing
Concord and Richmond Single men & women 175
East County Shelter Antioch Single men & women 20
Emergency Shelter Richmond Families with children 75
Family Emergency Shelter Concord Families with children 30
Rescue Mission Richmond Families with children 150
Rollie Mullen Center Confidential Domestic Violence 24
Shepherd’s Gate Mixed 30
Winter Nights Shelter Various Mixed 0
Transitional Housing
Appian House: Youth Richmond Transition‐age youth 6
Deliverance House Families with children 12
East County Transitiional Housing Antioch Families with children 70
MOVE Confidential Domestic Violence 28
Next Step Central County Mixed 7
Pittsburg Family Center Pittsburg Families with children 32

Appendix 8 Table
Contra Costa Homeless Facility Inventory
Facility Name Region Target Population Total Year‐Round Beds
Pride and Purpose House Richmond Children 6
Project Independence Richmond Mixed 25
Prop 36 Housing Scattered Site Single men and women
REACH Plus Scattered Site Mixed 128
San Joaquin II Richmond Families with children 20
Transitional Housing Richmond Mixed 44
Transitional Housing Children 5
Permanent Housing
ACCESS Scattered Site Single men and women 30
Aspen Court Central County HIV/AIDS 2
Casa Barrett West County Single men and women 6
Casa Lago Antioch Single men and women 13
Casa Verde Single men and women 11
Garden Parks Apartments Pleasant Hill HIV/AIDs, Small families 28
Idaho Apartments Richmond Single men and women 28
Maple House Concord Single men and women 5
Mary McGovern House Concord Single men and women 6
Project Coming Home Scattered Site Single men and women 40
Shelter Plus Care Scattered Site Mixed 318
Sunset House Pittsburg Single men and women 8
Transitional Housing Partnership Scattered Site Mixed 37
Walter’s Way House Concord Single men and women 12
West Richmond Apartments Richmond Single men and women 4
Source: Contra Costa County Interagency Council on Homelessness, 2008.

Under the County’s Zoning Code, emergency shelters and transitional housing designed to meet the needs of those who are homeless or formerly homeless are permitted in all residential zones subject to a land use permit. In addition, these facilities are allowed in most commercial and industrial districts with a land use permit. (See the discussion on potential changes to the zoning code to accommodate emergency shelters and transitional housing ‘by‐right’ in Section 6.3, Housing Constraints).
As a means to help meet the special needs of the homeless, the Contra Costa Crisis Center operates a 24‐hour homeless hotline that connects homeless individuals and families to resources available in the County. Through the Center, homeless persons are given emergency motel vouchers, provided free voice mail boxes, and referred to local programs that offer housing, job training, substance abuse treatment, mental health counseling, emergency food, health care, and other services.
HSD provides emergency and transitional shelter as well as supportive services designed to enable homeless persons to achieve greater economic independence and a stable living environment. HSD coordinates the activities of and provides staff support to CCICH, which consists of representatives from local jurisdictions, homeless service providers, advocacy and volunteer groups, the business and faith communities, residents at large, and previously or currently homeless persons.
Emergency Shelters and Permanent Supportive Housing: Emergency shelters and permanent supportive housing designed to meet the needs of those who are homeless or formerly homeless are permitted in all residential zones subject to a land use permit. In addition, these facilities are permitted in most commercial and industrial districts with a land use permit. The purpose of the land use permit is to ensure compatibility with surrounding land uses, and not to constrain their development. The land use permit for an emergency shelter and a transitional housing facility requires only an administrative review unless the decision is appealed. If the administrative decision is appealed, a hearing on the permit may be held before the Zoning Administrator or the County Planning Commission, as necessary.
In 2010, the County will consider revisions to the text in the zoning code to allow homeless shelters and transitional housing ‘by‐right’ in at least one zoning district. The M‐29: Multi‐Family District and the C: General Commercial District will be the zoning districts to be considered, and this review process will be completed in 2010. Any text amendment will likely include specific requirements in order to provide certainty to the applicant and maintain compatibility with the surrounding neighborhood. Following is an example of the requirements that may be incorporated:
o The maximum number of beds or persons permitted to be served nightly by the facility;
o Off‐street parking based on demonstrated need, but not to exceed parking requirements for other residential or commercial uses in the same zone;
o The size and location of exterior and interior onsite waiting and client intake areas; o The provision of onsite management;

o The proximity of other emergency shelters, provided that emergency shelters are not required to be more than 300 feet apart;
o The length of stay; o Lighting; o Security during hours that the emergency shelter is in operation.
In general, emergency shelters and permanent supportive housing should be accessible to the population in need and near public transit, employment and job training opportunities, community facilities, and services. Concentrations of CalWORKS participants may be used as an indicator of where emergency and permanent supportive housing may be most needed. Typically, people on public assistance are most vulnerable to becoming homeless in the case of an economic recession or cuts in public assistance. Areas with concentrations of CalWORKS participants and good access to transit, employment, and services would be appropriate for the siting of emergency and permanent supportive housing. In siting such facilities, the County will pay special attention to issues of neighborhood impaction.
Several emergency shelters and transitional housing facilities for the homeless are located in Contra Costa County. The Appendix 8 table (above) identifies the major temporary, transitional, and permanent housing facilities for the homeless and formerly homeless in the County.
Copyright © 2022 FDOKUMEN